Marshfield, WI Map & Demographics
Marshfield Map

Marshfield Overview
$39,212
PER CAPITA INCOME
$72,270
AVG FAMILY INCOME
$58,474
AVG HOUSEHOLD INCOME
21.4%
WAGE / INCOME GAP [ % ]
78.6¢/ $1
WAGE / INCOME GAP [ $ ]
$10,037
FAMILY INCOME DEFICIT
0.49
INEQUALITY / GINI INDEX
18,795
TOTAL POPULATION
9,105
MALE POPULATION
9,690
FEMALE POPULATION
93.96
MALES / 100 FEMALES
106.43
FEMALES / 100 MALES
43.7
MEDIAN AGE
2.7
AVG FAMILY SIZE
2.1
AVG HOUSEHOLD SIZE
9,374
LABOR FORCE [ PEOPLE ]
60.3%
PERCENT IN LABOR FORCE
3.0%
UNEMPLOYMENT RATE
Marshfield Zip Codes
Marshfield Area Codes
Income in Marshfield
Income Overview in Marshfield
Per Capita Income in Marshfield is $39,212, while median incomes of families and households are $72,270 and $58,474 respectively.
| Characteristic | Number | Measure |
| Per Capita Income | 18,795 | $39,212 |
| Median Family Income | 4,888 | $72,270 |
| Mean Family Income | 4,888 | $98,678 |
| Median Household Income | 8,807 | $58,474 |
| Mean Household Income | 8,807 | $81,777 |
| Income Deficit | 4,888 | $10,037 |
| Wage / Income Gap (%) | 18,795 | 21.41% |
| Wage / Income Gap ($) | 18,795 | 78.59¢ per $1 |
| Gini / Inequality Index | 18,795 | 0.49 |
Earnings by Sex in Marshfield
Average Earnings in Marshfield are $40,752, $45,769 for men and $35,970 for women, a difference of 21.4%.
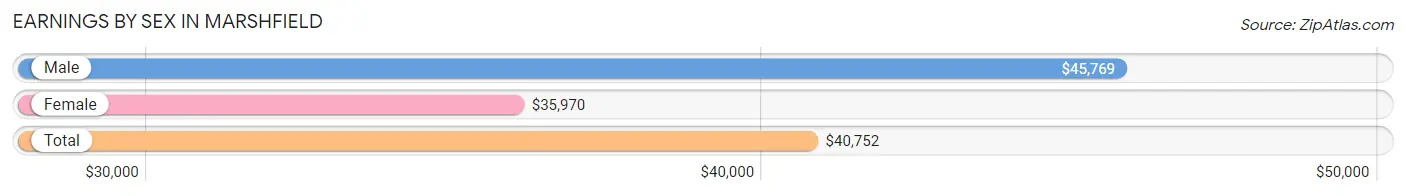
| Sex | Number | Average Earnings |
| Male | 5,226 (52.9%) | $45,769 |
| Female | 4,656 (47.1%) | $35,970 |
| Total | 9,882 (100.0%) | $40,752 |
Earnings by Sex by Income Bracket in Marshfield
The most common earnings brackets in Marshfield are $55,000 to $64,999 for men (622 | 11.9%) and $35,000 to $39,999 for women (415 | 8.9%).
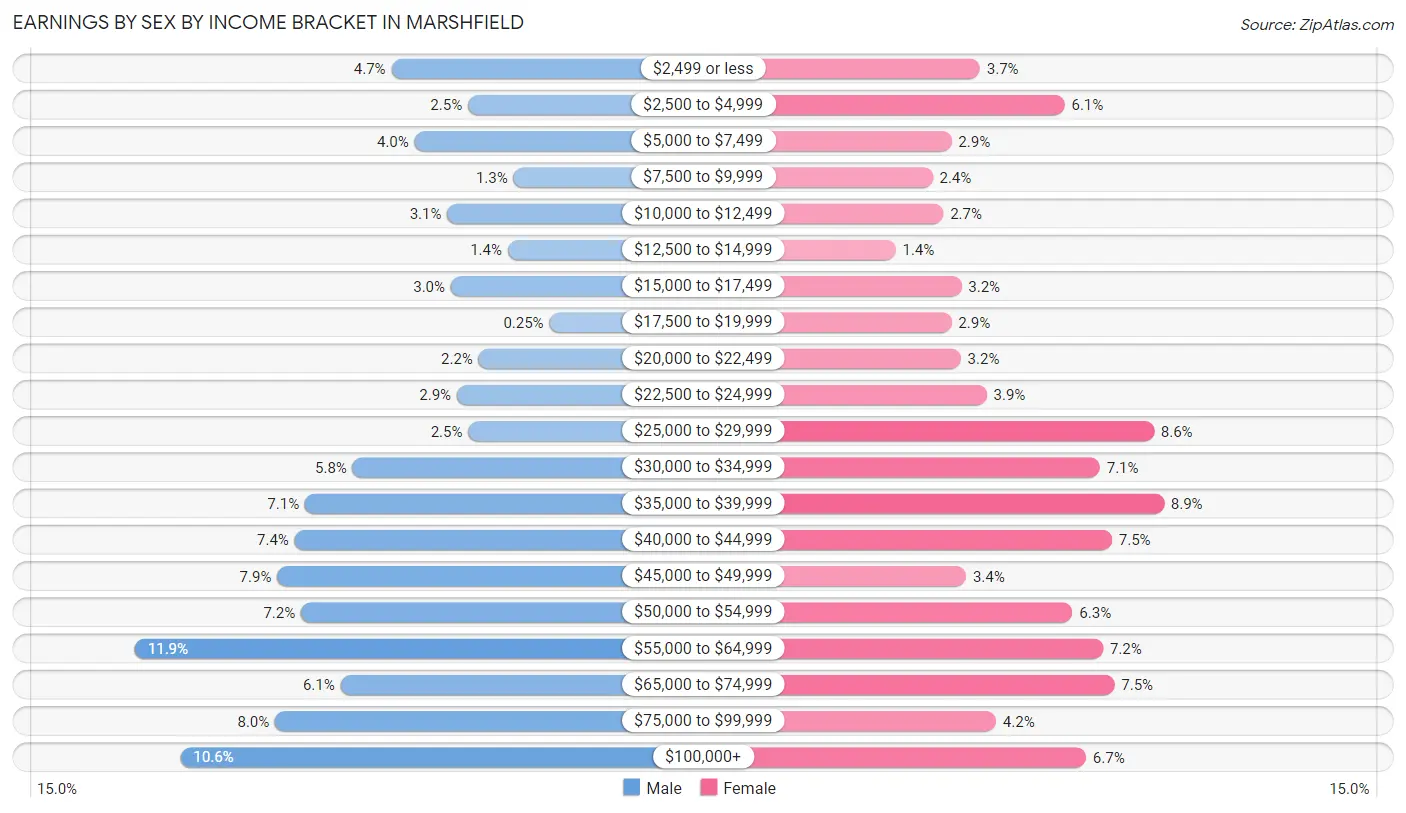
| Income | Male | Female |
| $2,499 or less | 245 (4.7%) | 174 (3.7%) |
| $2,500 to $4,999 | 133 (2.5%) | 285 (6.1%) |
| $5,000 to $7,499 | 211 (4.0%) | 137 (2.9%) |
| $7,500 to $9,999 | 66 (1.3%) | 112 (2.4%) |
| $10,000 to $12,499 | 163 (3.1%) | 126 (2.7%) |
| $12,500 to $14,999 | 74 (1.4%) | 64 (1.4%) |
| $15,000 to $17,499 | 158 (3.0%) | 150 (3.2%) |
| $17,500 to $19,999 | 13 (0.3%) | 137 (2.9%) |
| $20,000 to $22,499 | 117 (2.2%) | 149 (3.2%) |
| $22,500 to $24,999 | 149 (2.9%) | 183 (3.9%) |
| $25,000 to $29,999 | 132 (2.5%) | 402 (8.6%) |
| $30,000 to $34,999 | 302 (5.8%) | 331 (7.1%) |
| $35,000 to $39,999 | 372 (7.1%) | 415 (8.9%) |
| $40,000 to $44,999 | 387 (7.4%) | 347 (7.4%) |
| $45,000 to $49,999 | 413 (7.9%) | 156 (3.4%) |
| $50,000 to $54,999 | 378 (7.2%) | 295 (6.3%) |
| $55,000 to $64,999 | 622 (11.9%) | 335 (7.2%) |
| $65,000 to $74,999 | 320 (6.1%) | 350 (7.5%) |
| $75,000 to $99,999 | 416 (8.0%) | 195 (4.2%) |
| $100,000+ | 555 (10.6%) | 313 (6.7%) |
| Total | 5,226 (100.0%) | 4,656 (100.0%) |
Earnings by Sex by Educational Attainment in Marshfield
Average earnings in Marshfield are $48,248 for men and $38,769 for women, a difference of 19.7%. Men with an educational attainment of graduate degree enjoy the highest average annual earnings of $96,688, while those with high school diploma education earn the least with $40,000. Women with an educational attainment of graduate degree earn the most with the average annual earnings of $71,905, while those with less than high school education have the smallest earnings of $22,266.
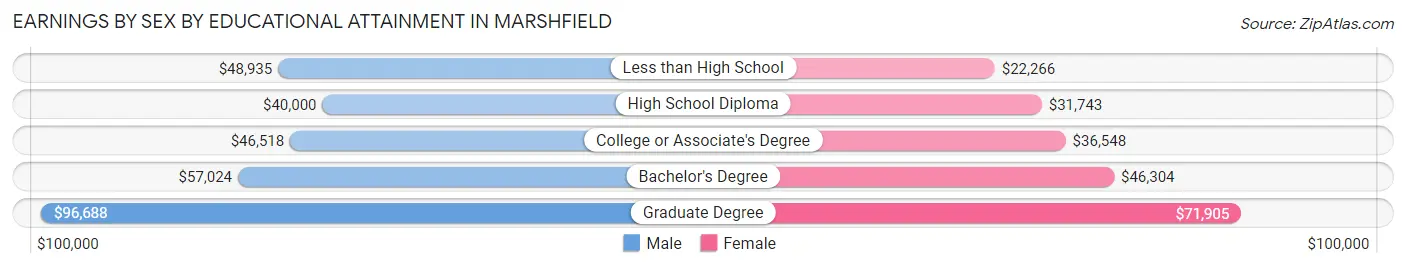
| Educational Attainment | Male Income | Female Income |
| Less than High School | $48,935 | $22,266 |
| High School Diploma | $40,000 | $31,743 |
| College or Associate's Degree | $46,518 | $36,548 |
| Bachelor's Degree | $57,024 | $46,304 |
| Graduate Degree | $96,688 | $71,905 |
| Total | $48,248 | $38,769 |
Family Income in Marshfield
Family Income Brackets in Marshfield
According to the Marshfield family income data, there are 1,129 families falling into the $50,000 to $74,999 income range, which is the most common income bracket and makes up 23.1% of all families. Conversely, the $10,000 to $14,999 income bracket is the least frequent group with only 93 families (1.9%) belonging to this category.

| Income Bracket | # Families | % Families |
| Less than $10,000 | 210 | 4.3% |
| $10,000 to $14,999 | 93 | 1.9% |
| $15,000 to $24,999 | 127 | 2.6% |
| $25,000 to $34,999 | 327 | 6.7% |
| $35,000 to $49,999 | 689 | 14.1% |
| $50,000 to $74,999 | 1,129 | 23.1% |
| $75,000 to $99,999 | 772 | 15.8% |
| $100,000 to $149,999 | 802 | 16.4% |
| $150,000 to $199,999 | 347 | 7.1% |
| $200,000+ | 386 | 7.9% |
Family Income by Famaliy Size in Marshfield
6-person families (67 | 1.4%) account for the highest median family income in Marshfield with $106,397 per family, while 3-person families (966 | 19.8%) have the highest median income of $34,667 per family member.
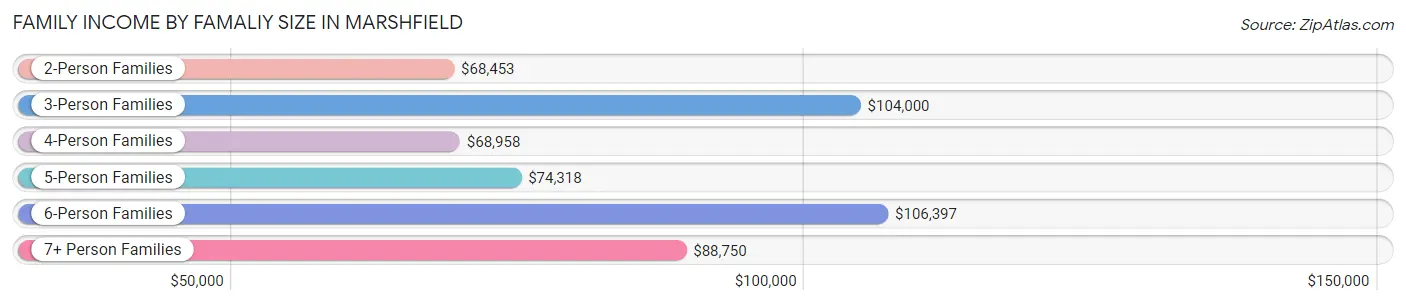
| Income Bracket | # Families | Median Income |
| 2-Person Families | 2,997 (61.3%) | $68,453 |
| 3-Person Families | 966 (19.8%) | $104,000 |
| 4-Person Families | 525 (10.7%) | $68,958 |
| 5-Person Families | 288 (5.9%) | $74,318 |
| 6-Person Families | 67 (1.4%) | $106,397 |
| 7+ Person Families | 45 (0.9%) | $88,750 |
| Total | 4,888 (100.0%) | $72,270 |
Family Income by Number of Earners in Marshfield
The median family income in Marshfield is $72,270, with families comprising 3+ earners (345) having the highest median family income of $108,854, while families with no earners (1,089) have the lowest median family income of $39,451, accounting for 7.1% and 22.3% of families, respectively.
| Number of Earners | # Families | Median Income |
| No Earners | 1,089 (22.3%) | $39,451 |
| 1 Earner | 1,431 (29.3%) | $56,194 |
| 2 Earners | 2,023 (41.4%) | $93,385 |
| 3+ Earners | 345 (7.1%) | $108,854 |
| Total | 4,888 (100.0%) | $72,270 |
Household Income in Marshfield
Household Income Brackets in Marshfield
With 2,052 households falling in the category, the $50,000 to $74,999 income range is the most frequent in Marshfield, accounting for 23.3% of all households. In contrast, only 440 households (5.0%) fall into the $10,000 to $14,999 income bracket, making it the least populous group.
| Income Bracket | # Households | % Households |
| Less than $10,000 | 511 | 5.8% |
| $10,000 to $14,999 | 440 | 5.0% |
| $15,000 to $24,999 | 784 | 8.9% |
| $25,000 to $34,999 | 872 | 9.9% |
| $35,000 to $49,999 | 1,110 | 12.6% |
| $50,000 to $74,999 | 2,052 | 23.3% |
| $75,000 to $99,999 | 969 | 11.0% |
| $100,000 to $149,999 | 1,127 | 12.8% |
| $150,000 to $199,999 | 449 | 5.1% |
| $200,000+ | 493 | 5.6% |
Household Income by Householder Age in Marshfield
The median household income in Marshfield is $58,474, with the highest median household income of $64,781 found in the 45 to 64 years age bracket for the primary householder. A total of 2,890 households (32.8%) fall into this category. Meanwhile, the 65+ years age bracket for the primary householder has the lowest median household income of $47,014, with 2,775 households (31.5%) in this group.
| Income Bracket | # Households | Median Income |
| 15 to 24 Years | 465 (5.3%) | $57,039 |
| 25 to 44 Years | 2,677 (30.4%) | $63,992 |
| 45 to 64 Years | 2,890 (32.8%) | $64,781 |
| 65+ Years | 2,775 (31.5%) | $47,014 |
| Total | 8,807 (100.0%) | $58,474 |
Poverty in Marshfield
Income Below Poverty by Sex and Age in Marshfield
With 10.4% poverty level for males and 13.9% for females among the residents of Marshfield, 15 year old males and 16 and 17 year old females are the most vulnerable to poverty, with 36 males (17.1%) and 55 females (28.1%) in their respective age groups living below the poverty level.
| Age Bracket | Male | Female |
| Under 5 Years | 23 (5.0%) | 51 (11.6%) |
| 5 Years | 9 (14.7%) | 0 (0.0%) |
| 6 to 11 Years | 81 (16.4%) | 53 (9.8%) |
| 12 to 14 Years | 36 (9.2%) | 64 (17.2%) |
| 15 Years | 36 (17.1%) | 30 (19.4%) |
| 16 and 17 Years | 0 (0.0%) | 55 (28.1%) |
| 18 to 24 Years | 62 (7.3%) | 91 (14.9%) |
| 25 to 34 Years | 163 (12.8%) | 180 (15.6%) |
| 35 to 44 Years | 113 (11.7%) | 230 (18.1%) |
| 45 to 54 Years | 88 (7.2%) | 134 (12.6%) |
| 55 to 64 Years | 153 (13.1%) | 160 (12.1%) |
| 65 to 74 Years | 84 (7.5%) | 84 (8.0%) |
| 75 Years and over | 91 (13.9%) | 196 (15.0%) |
| Total | 939 (10.4%) | 1,328 (13.9%) |
Income Above Poverty by Sex and Age in Marshfield
According to the poverty statistics in Marshfield, males aged 16 and 17 years and females aged 5 years are the age groups that are most secure financially, with 100.0% of males and 100.0% of females in these age groups living above the poverty line.
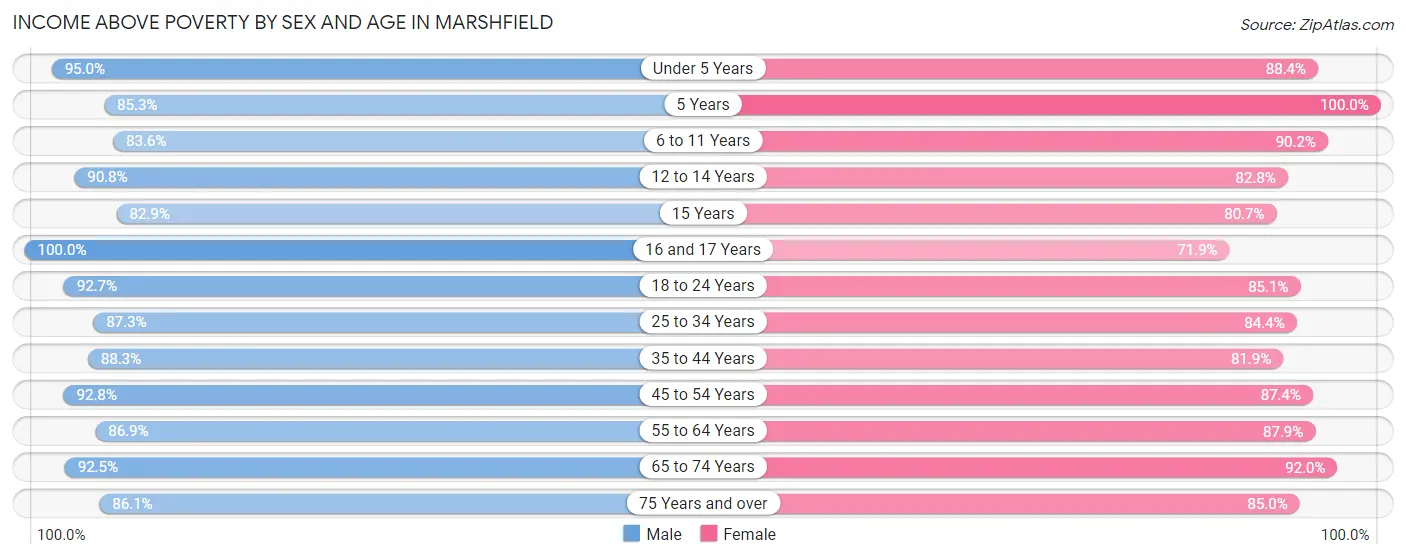
| Age Bracket | Male | Female |
| Under 5 Years | 433 (95.0%) | 387 (88.4%) |
| 5 Years | 52 (85.3%) | 58 (100.0%) |
| 6 to 11 Years | 412 (83.6%) | 487 (90.2%) |
| 12 to 14 Years | 354 (90.8%) | 307 (82.8%) |
| 15 Years | 175 (82.9%) | 125 (80.6%) |
| 16 and 17 Years | 123 (100.0%) | 141 (71.9%) |
| 18 to 24 Years | 790 (92.7%) | 519 (85.1%) |
| 25 to 34 Years | 1,115 (87.3%) | 973 (84.4%) |
| 35 to 44 Years | 849 (88.2%) | 1,040 (81.9%) |
| 45 to 54 Years | 1,125 (92.7%) | 931 (87.4%) |
| 55 to 64 Years | 1,013 (86.9%) | 1,157 (87.8%) |
| 65 to 74 Years | 1,040 (92.5%) | 964 (92.0%) |
| 75 Years and over | 564 (86.1%) | 1,107 (85.0%) |
| Total | 8,045 (89.5%) | 8,196 (86.1%) |
Income Below Poverty Among Married-Couple Families in Marshfield
The poverty statistics for married-couple families in Marshfield show that 3.9% or 136 of the total 3,488 families live below the poverty line. Families with no children have the highest poverty rate of 4.7%, comprising of 115 families. On the other hand, families with 5 or more children have the lowest poverty rate of 0.0%, which includes 0 families.
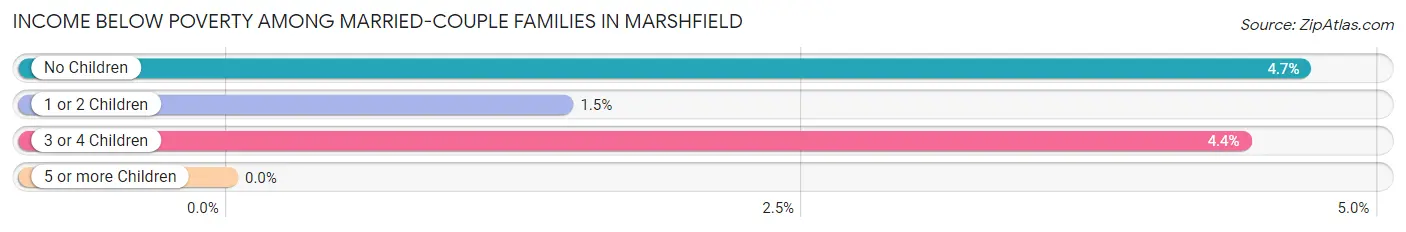
| Children | Above Poverty | Below Poverty |
| No Children | 2,349 (95.3%) | 115 (4.7%) |
| 1 or 2 Children | 741 (98.5%) | 11 (1.5%) |
| 3 or 4 Children | 217 (95.6%) | 10 (4.4%) |
| 5 or more Children | 45 (100.0%) | 0 (0.0%) |
| Total | 3,352 (96.1%) | 136 (3.9%) |
Income Below Poverty Among Single-Parent Households in Marshfield
According to the poverty data in Marshfield, 4.7% or 20 single-father households and 29.4% or 286 single-mother households are living below the poverty line. Among single-father households, those with 1 or 2 children have the highest poverty rate, with 20 households (10.4%) experiencing poverty. Likewise, among single-mother households, those with 3 or 4 children have the highest poverty rate, with 38 households (100.0%) falling below the poverty line.
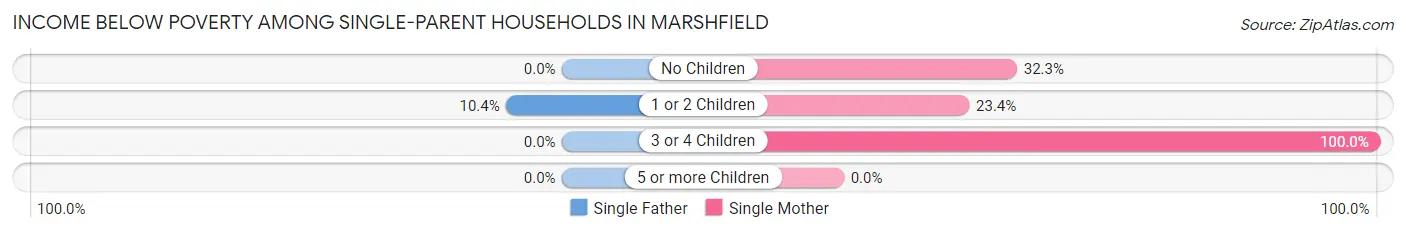
| Children | Single Father | Single Mother |
| No Children | 0 (0.0%) | 109 (32.3%) |
| 1 or 2 Children | 20 (10.4%) | 139 (23.4%) |
| 3 or 4 Children | 0 (0.0%) | 38 (100.0%) |
| 5 or more Children | 0 (0.0%) | 0 (0.0%) |
| Total | 20 (4.7%) | 286 (29.4%) |
Income Below Poverty Among Married-Couple vs Single-Parent Households in Marshfield
The poverty data for Marshfield shows that 136 of the married-couple family households (3.9%) and 306 of the single-parent households (21.9%) are living below the poverty level. Within the married-couple family households, those with no children have the highest poverty rate, with 115 households (4.7%) falling below the poverty line. Among the single-parent households, those with 3 or 4 children have the highest poverty rate, with 38 household (50.0%) living below poverty.
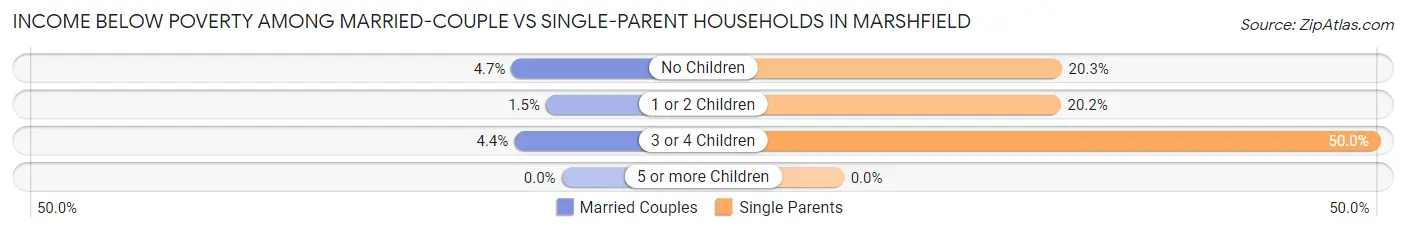
| Children | Married-Couple Families | Single-Parent Households |
| No Children | 115 (4.7%) | 109 (20.3%) |
| 1 or 2 Children | 11 (1.5%) | 159 (20.2%) |
| 3 or 4 Children | 10 (4.4%) | 38 (50.0%) |
| 5 or more Children | 0 (0.0%) | 0 (0.0%) |
| Total | 136 (3.9%) | 306 (21.9%) |
Race in Marshfield
The most populous races in Marshfield are White / Caucasian (17,365 | 92.4%), Two or more Races (673 | 3.6%), and Asian (473 | 2.5%).
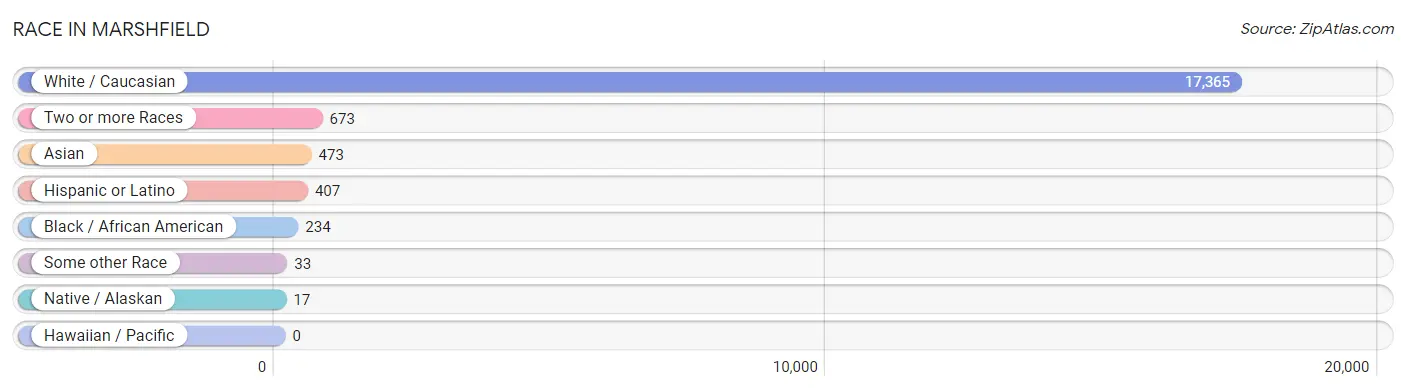
| Race | # Population | % Population |
| Asian | 473 | 2.5% |
| Black / African American | 234 | 1.3% |
| Hawaiian / Pacific | 0 | 0.0% |
| Hispanic or Latino | 407 | 2.2% |
| Native / Alaskan | 17 | 0.1% |
| White / Caucasian | 17,365 | 92.4% |
| Two or more Races | 673 | 3.6% |
| Some other Race | 33 | 0.2% |
| Total | 18,795 | 100.0% |
Ancestry in Marshfield
The most populous ancestries reported in Marshfield are German (9,080 | 48.3%), Polish (1,867 | 9.9%), Irish (1,597 | 8.5%), English (1,177 | 6.3%), and Norwegian (1,040 | 5.5%), together accounting for 78.5% of all Marshfield residents.
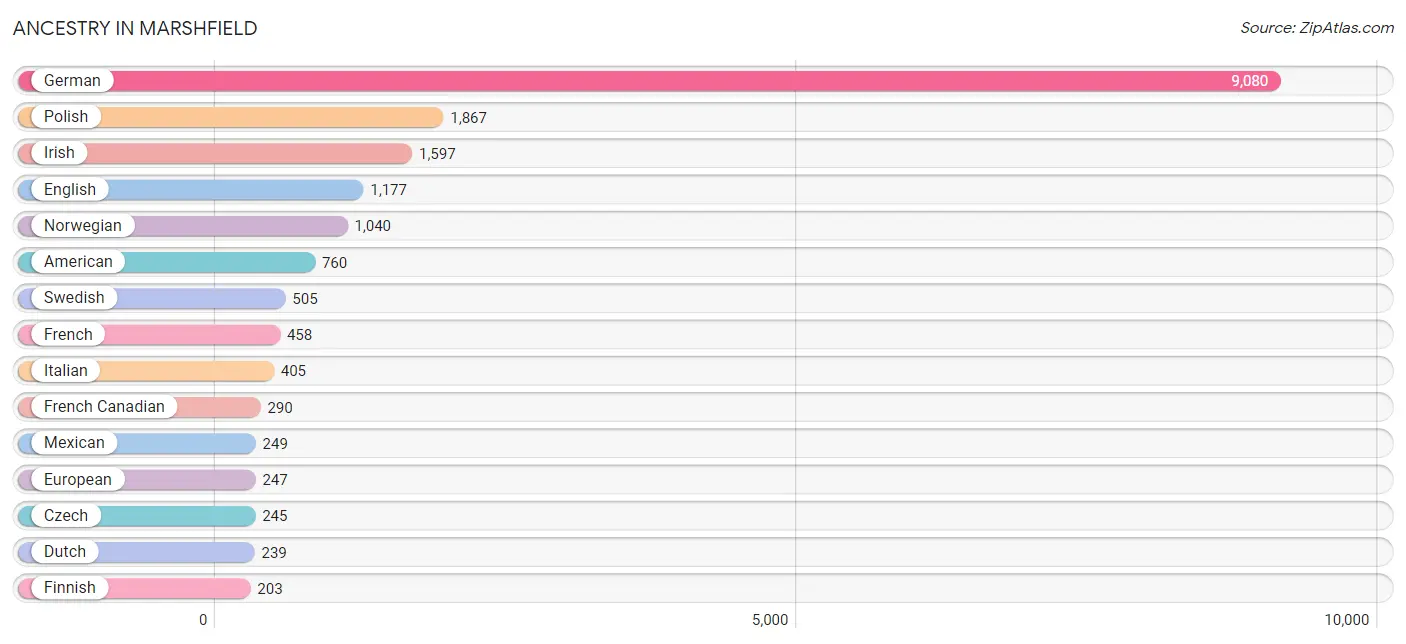
| Ancestry | # Population | % Population |
| African | 11 | 0.1% |
| American | 760 | 4.0% |
| Argentinean | 32 | 0.2% |
| Armenian | 30 | 0.2% |
| Austrian | 83 | 0.4% |
| Belgian | 107 | 0.6% |
| Bhutanese | 150 | 0.8% |
| Blackfeet | 11 | 0.1% |
| British | 66 | 0.4% |
| Burmese | 40 | 0.2% |
| Central American | 7 | 0.0% |
| Central American Indian | 7 | 0.0% |
| Cherokee | 27 | 0.1% |
| Creek | 12 | 0.1% |
| Croatian | 45 | 0.2% |
| Cuban | 7 | 0.0% |
| Czech | 245 | 1.3% |
| Czechoslovakian | 42 | 0.2% |
| Danish | 118 | 0.6% |
| Dutch | 239 | 1.3% |
| Eastern European | 27 | 0.1% |
| English | 1,177 | 6.3% |
| European | 247 | 1.3% |
| Finnish | 203 | 1.1% |
| French | 458 | 2.4% |
| French American Indian | 23 | 0.1% |
| French Canadian | 290 | 1.5% |
| German | 9,080 | 48.3% |
| Greek | 37 | 0.2% |
| Guatemalan | 7 | 0.0% |
| Hungarian | 8 | 0.0% |
| Icelander | 32 | 0.2% |
| Indian (Asian) | 155 | 0.8% |
| Irish | 1,597 | 8.5% |
| Italian | 405 | 2.1% |
| Japanese | 42 | 0.2% |
| Korean | 24 | 0.1% |
| Latvian | 12 | 0.1% |
| Luxembourger | 15 | 0.1% |
| Menominee | 18 | 0.1% |
| Mexican | 249 | 1.3% |
| Northern European | 79 | 0.4% |
| Norwegian | 1,040 | 5.5% |
| Polish | 1,867 | 9.9% |
| Portuguese | 12 | 0.1% |
| Puerto Rican | 3 | 0.0% |
| Russian | 108 | 0.6% |
| Scandinavian | 58 | 0.3% |
| Scotch-Irish | 119 | 0.6% |
| Scottish | 193 | 1.0% |
| Sioux | 30 | 0.2% |
| Slovak | 53 | 0.3% |
| Slovene | 35 | 0.2% |
| South American | 32 | 0.2% |
| Spaniard | 16 | 0.1% |
| Spanish | 77 | 0.4% |
| Sri Lankan | 16 | 0.1% |
| Subsaharan African | 37 | 0.2% |
| Sudanese | 26 | 0.1% |
| Swedish | 505 | 2.7% |
| Swiss | 120 | 0.6% |
| Thai | 155 | 0.8% |
| Ukrainian | 52 | 0.3% |
| Welsh | 49 | 0.3% | View All 64 Rows |
Immigrants in Marshfield
The most numerous immigrant groups reported in Marshfield came from Asia (304 | 1.6%), Eastern Asia (168 | 0.9%), India (104 | 0.5%), South Central Asia (104 | 0.5%), and China (71 | 0.4%), together accounting for 4.0% of all Marshfield residents.
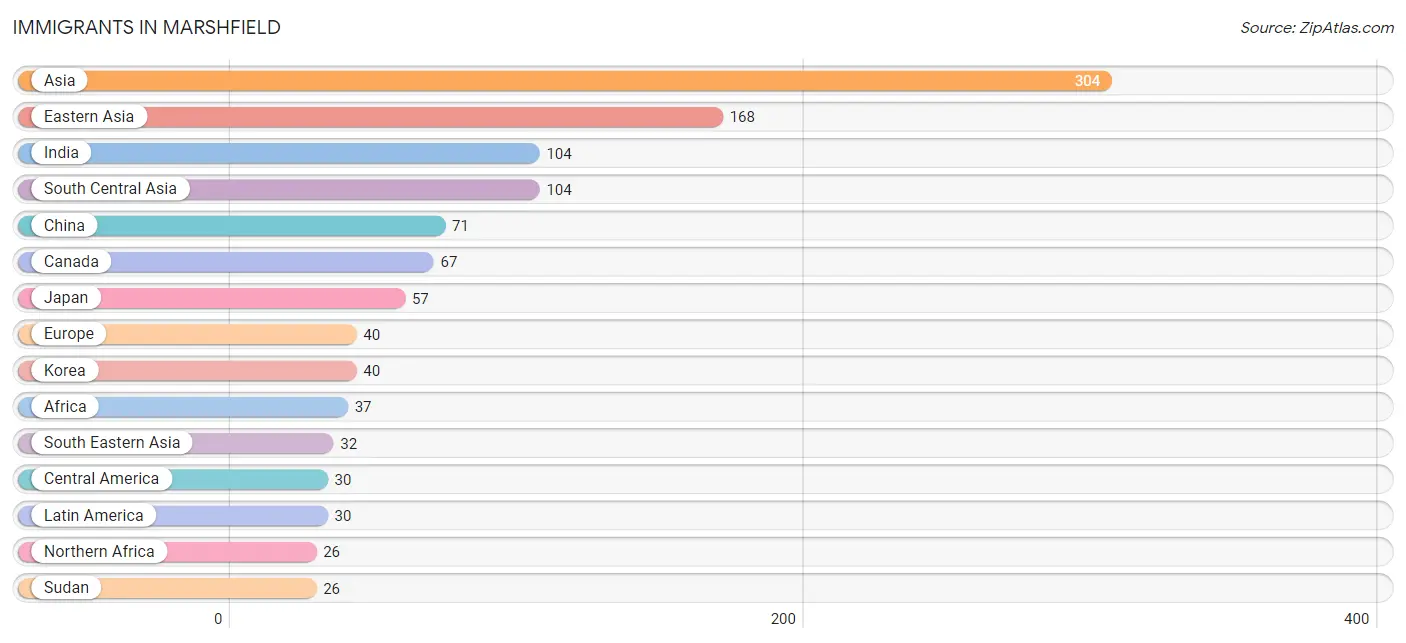
| Immigration Origin | # Population | % Population |
| Africa | 37 | 0.2% |
| Asia | 304 | 1.6% |
| Canada | 67 | 0.4% |
| Central America | 30 | 0.2% |
| China | 71 | 0.4% |
| Eastern Asia | 168 | 0.9% |
| Eastern Europe | 6 | 0.0% |
| Europe | 40 | 0.2% |
| Germany | 15 | 0.1% |
| Guatemala | 7 | 0.0% |
| India | 104 | 0.5% |
| Japan | 57 | 0.3% |
| Korea | 40 | 0.2% |
| Latin America | 30 | 0.2% |
| Latvia | 6 | 0.0% |
| Mexico | 23 | 0.1% |
| Nigeria | 11 | 0.1% |
| Northern Africa | 26 | 0.1% |
| Northern Europe | 19 | 0.1% |
| Philippines | 16 | 0.1% |
| South Central Asia | 104 | 0.5% |
| South Eastern Asia | 32 | 0.2% |
| Sudan | 26 | 0.1% |
| Sweden | 19 | 0.1% |
| Vietnam | 16 | 0.1% |
| Western Africa | 11 | 0.1% |
| Western Europe | 15 | 0.1% | View All 27 Rows |
Sex and Age in Marshfield
Sex and Age in Marshfield
The most populous age groups in Marshfield are 30 to 34 Years (733 | 8.1%) for men and 60 to 64 Years (712 | 7.3%) for women.
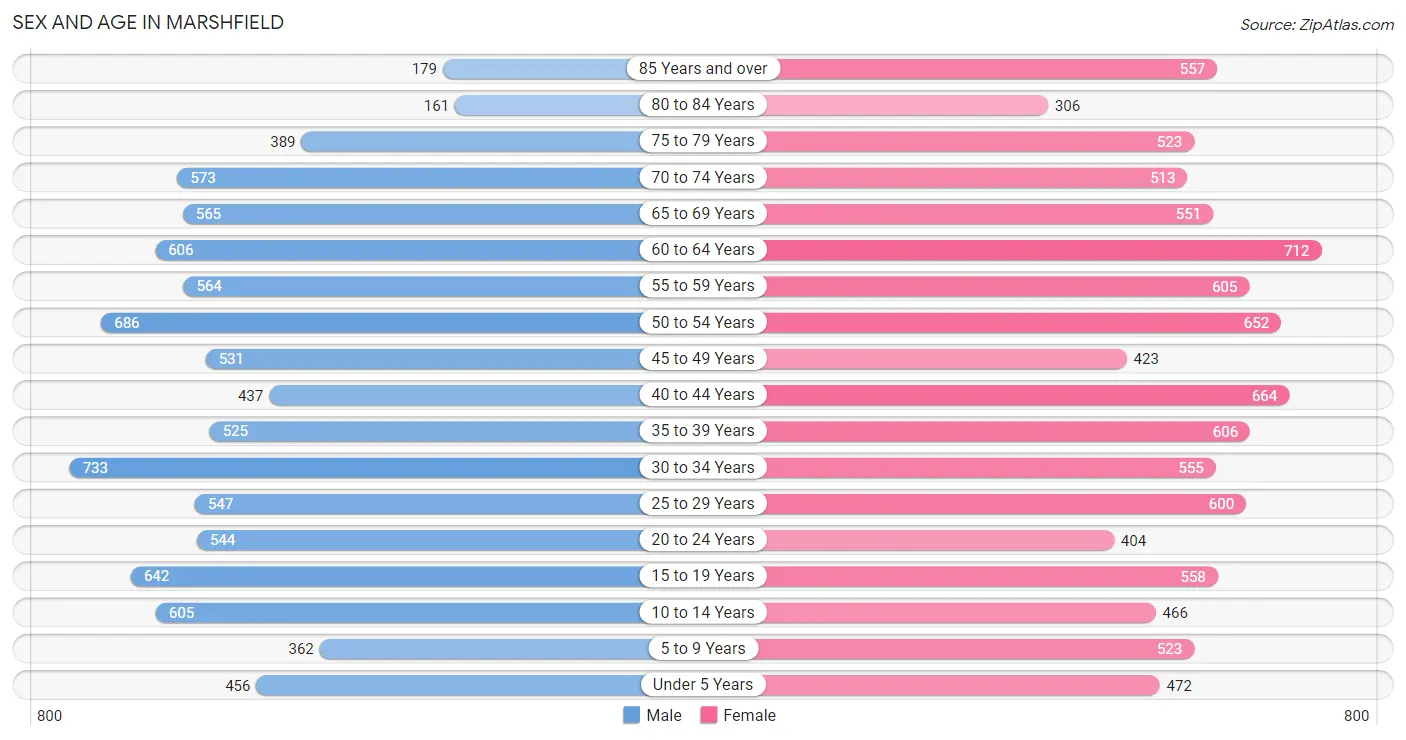
| Age Bracket | Male | Female |
| Under 5 Years | 456 (5.0%) | 472 (4.9%) |
| 5 to 9 Years | 362 (4.0%) | 523 (5.4%) |
| 10 to 14 Years | 605 (6.6%) | 466 (4.8%) |
| 15 to 19 Years | 642 (7.0%) | 558 (5.8%) |
| 20 to 24 Years | 544 (6.0%) | 404 (4.2%) |
| 25 to 29 Years | 547 (6.0%) | 600 (6.2%) |
| 30 to 34 Years | 733 (8.1%) | 555 (5.7%) |
| 35 to 39 Years | 525 (5.8%) | 606 (6.2%) |
| 40 to 44 Years | 437 (4.8%) | 664 (6.9%) |
| 45 to 49 Years | 531 (5.8%) | 423 (4.4%) |
| 50 to 54 Years | 686 (7.5%) | 652 (6.7%) |
| 55 to 59 Years | 564 (6.2%) | 605 (6.2%) |
| 60 to 64 Years | 606 (6.7%) | 712 (7.3%) |
| 65 to 69 Years | 565 (6.2%) | 551 (5.7%) |
| 70 to 74 Years | 573 (6.3%) | 513 (5.3%) |
| 75 to 79 Years | 389 (4.3%) | 523 (5.4%) |
| 80 to 84 Years | 161 (1.8%) | 306 (3.2%) |
| 85 Years and over | 179 (2.0%) | 557 (5.8%) |
| Total | 9,105 (100.0%) | 9,690 (100.0%) |
Families and Households in Marshfield
Median Family Size in Marshfield
The median family size in Marshfield is 2.72 persons per family, with married-couple families (3,488 | 71.4%) accounting for the largest median family size of 2.78 persons per family. On the other hand, single female/mother families (971 | 19.9%) represent the smallest median family size with 2.50 persons per family.
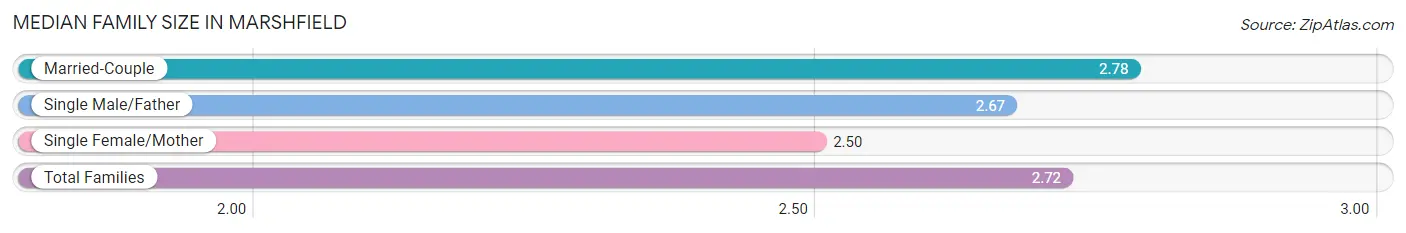
| Family Type | # Families | Family Size |
| Married-Couple | 3,488 (71.4%) | 2.78 |
| Single Male/Father | 429 (8.8%) | 2.67 |
| Single Female/Mother | 971 (19.9%) | 2.50 |
| Total Families | 4,888 (100.0%) | 2.72 |
Median Household Size in Marshfield
The median household size in Marshfield is 2.09 persons per household, with single male/father households (429 | 4.9%) accounting for the largest median household size of 3.05 persons per household. non-family households (3,919 | 44.5%) represent the smallest median household size with 1.15 persons per household.
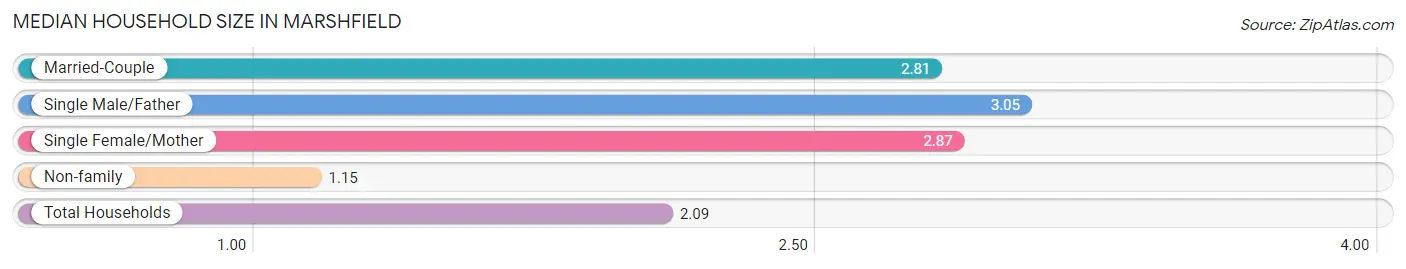
| Household Type | # Households | Household Size |
| Married-Couple | 3,488 (39.6%) | 2.81 |
| Single Male/Father | 429 (4.9%) | 3.05 |
| Single Female/Mother | 971 (11.0%) | 2.87 |
| Non-family | 3,919 (44.5%) | 1.15 |
| Total Households | 8,807 (100.0%) | 2.09 |
Household Size by Marriage Status in Marshfield
Out of a total of 8,807 households in Marshfield, 4,888 (55.5%) are family households, while 3,919 (44.5%) are nonfamily households. The most numerous type of family households are 2-person households, comprising 2,661, and the most common type of nonfamily households are 1-person households, comprising 3,439.
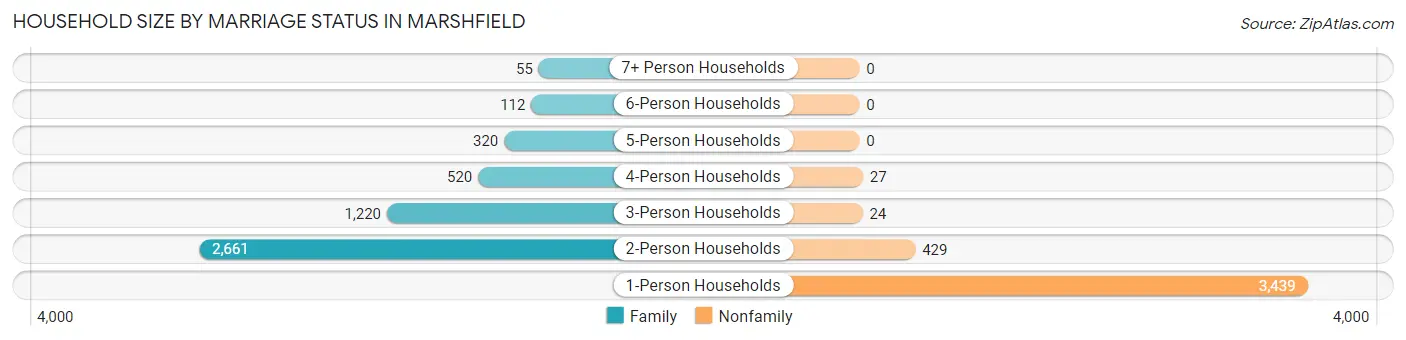
| Household Size | Family Households | Nonfamily Households |
| 1-Person Households | - | 3,439 (39.1%) |
| 2-Person Households | 2,661 (30.2%) | 429 (4.9%) |
| 3-Person Households | 1,220 (13.9%) | 24 (0.3%) |
| 4-Person Households | 520 (5.9%) | 27 (0.3%) |
| 5-Person Households | 320 (3.6%) | 0 (0.0%) |
| 6-Person Households | 112 (1.3%) | 0 (0.0%) |
| 7+ Person Households | 55 (0.6%) | 0 (0.0%) |
| Total | 4,888 (55.5%) | 3,919 (44.5%) |
Female Fertility in Marshfield
Fertility by Age in Marshfield
Average fertility rate in Marshfield is 54.0 births per 1,000 women. Women in the age bracket of 20 to 34 years have the highest fertility rate with 111.0 births per 1,000 women. Women in the age bracket of 20 to 34 years acount for 82.8% of all women with births.
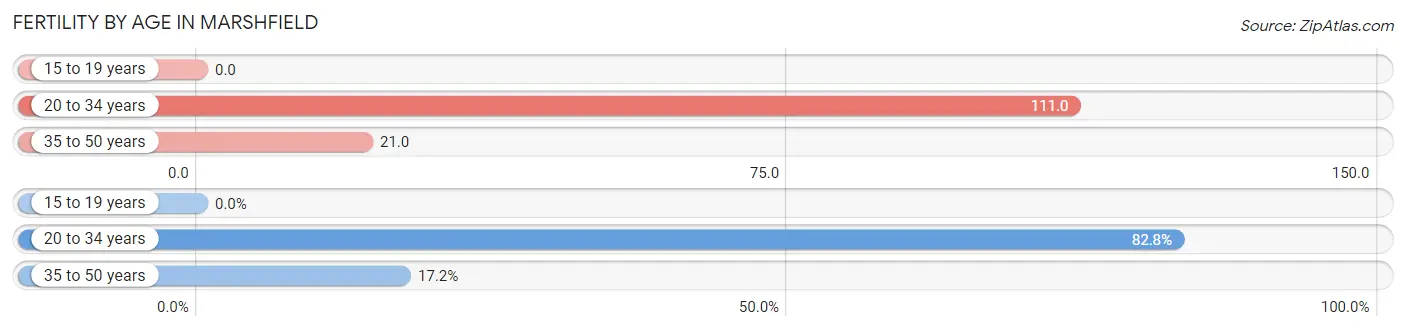
| Age Bracket | Women with Births | Births / 1,000 Women |
| 15 to 19 years | 0 (0.0%) | 0.0 |
| 20 to 34 years | 173 (82.8%) | 111.0 |
| 35 to 50 years | 36 (17.2%) | 21.0 |
| Total | 209 (100.0%) | 54.0 |
Fertility by Age by Marriage Status in Marshfield
76.6% of women with births (209) in Marshfield are married. The highest percentage of unmarried women with births falls into 20 to 34 years age bracket with 28.3% of them unmarried at the time of birth, while the lowest percentage of unmarried women with births belong to 35 to 50 years age bracket with 0.0% of them unmarried.
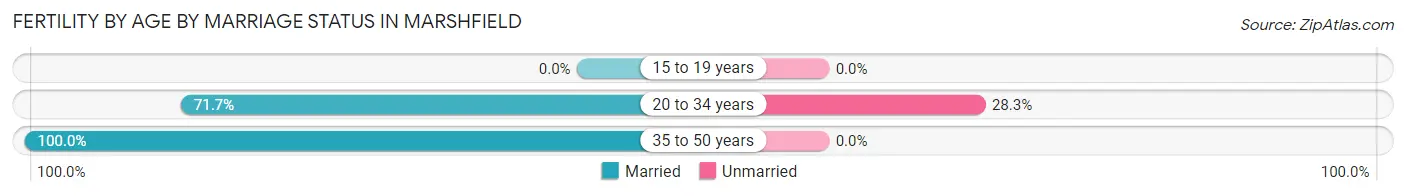
| Age Bracket | Married | Unmarried |
| 15 to 19 years | 0 (0.0%) | 0 (0.0%) |
| 20 to 34 years | 124 (71.7%) | 49 (28.3%) |
| 35 to 50 years | 36 (100.0%) | 0 (0.0%) |
| Total | 160 (76.6%) | 49 (23.4%) |
Fertility by Education in Marshfield
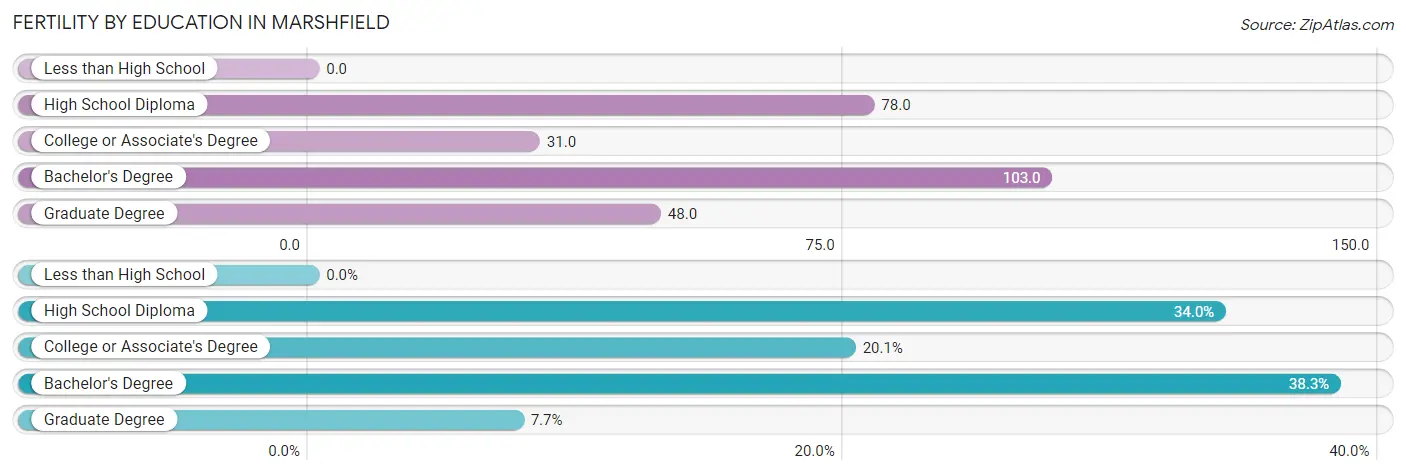
| Educational Attainment | Women with Births | Births / 1,000 Women |
| Less than High School | 0 (0.0%) | 0.0 |
| High School Diploma | 71 (34.0%) | 78.0 |
| College or Associate's Degree | 42 (20.1%) | 31.0 |
| Bachelor's Degree | 80 (38.3%) | 103.0 |
| Graduate Degree | 16 (7.7%) | 48.0 |
| Total | 209 (100.0%) | 54.0 |
Fertility by Education by Marriage Status in Marshfield
23.4% of women with births in Marshfield are unmarried. Women with the educational attainment of graduate degree are most likely to be married with 100.0% of them married at childbirth, while women with the educational attainment of college or associate's degree are least likely to be married with 78.6% of them unmarried at childbirth.
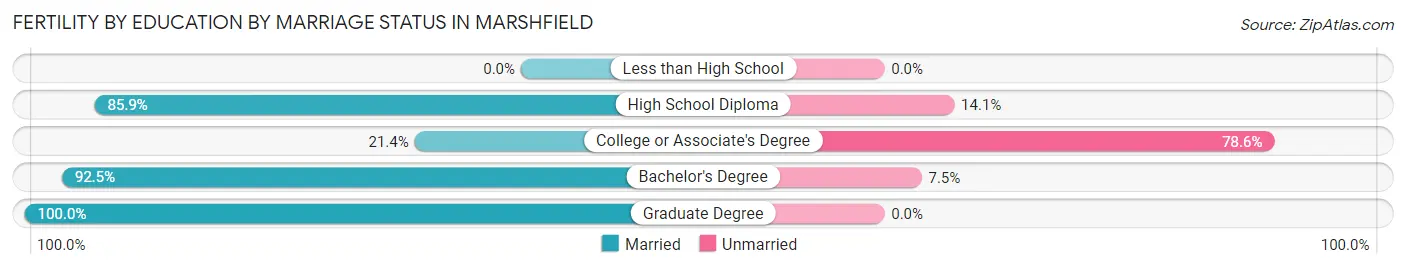
| Educational Attainment | Married | Unmarried |
| Less than High School | 0 (0.0%) | 0 (0.0%) |
| High School Diploma | 61 (85.9%) | 10 (14.1%) |
| College or Associate's Degree | 9 (21.4%) | 33 (78.6%) |
| Bachelor's Degree | 74 (92.5%) | 6 (7.5%) |
| Graduate Degree | 16 (100.0%) | 0 (0.0%) |
| Total | 160 (76.6%) | 49 (23.4%) |
Employment Characteristics in Marshfield
Employment by Class of Employer in Marshfield
Among the 8,939 employed individuals in Marshfield, private company employees (6,095 | 68.2%), not-for-profit organizations (1,518 | 17.0%), and local government employees (580 | 6.5%) make up the most common classes of employment.
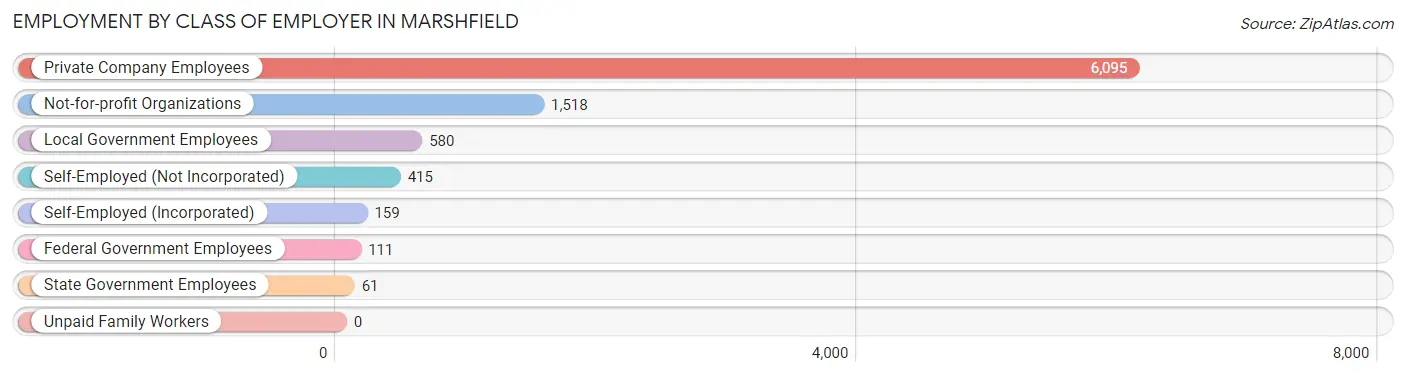
| Employer Class | # Employees | % Employees |
| Private Company Employees | 6,095 | 68.2% |
| Self-Employed (Incorporated) | 159 | 1.8% |
| Self-Employed (Not Incorporated) | 415 | 4.6% |
| Not-for-profit Organizations | 1,518 | 17.0% |
| Local Government Employees | 580 | 6.5% |
| State Government Employees | 61 | 0.7% |
| Federal Government Employees | 111 | 1.2% |
| Unpaid Family Workers | 0 | 0.0% |
| Total | 8,939 | 100.0% |
Employment Status by Age in Marshfield
According to the labor force statistics for Marshfield, out of the total population over 16 years of age (15,545), 60.3% or 9,374 individuals are in the labor force, with 3.0% or 281 of them unemployed. The age group with the highest labor force participation rate is 20 to 24 years, with 93.9% or 890 individuals in the labor force. Within the labor force, the 35 to 44 years age range has the highest percentage of unemployed individuals, with 6.5% or 119 of them being unemployed.
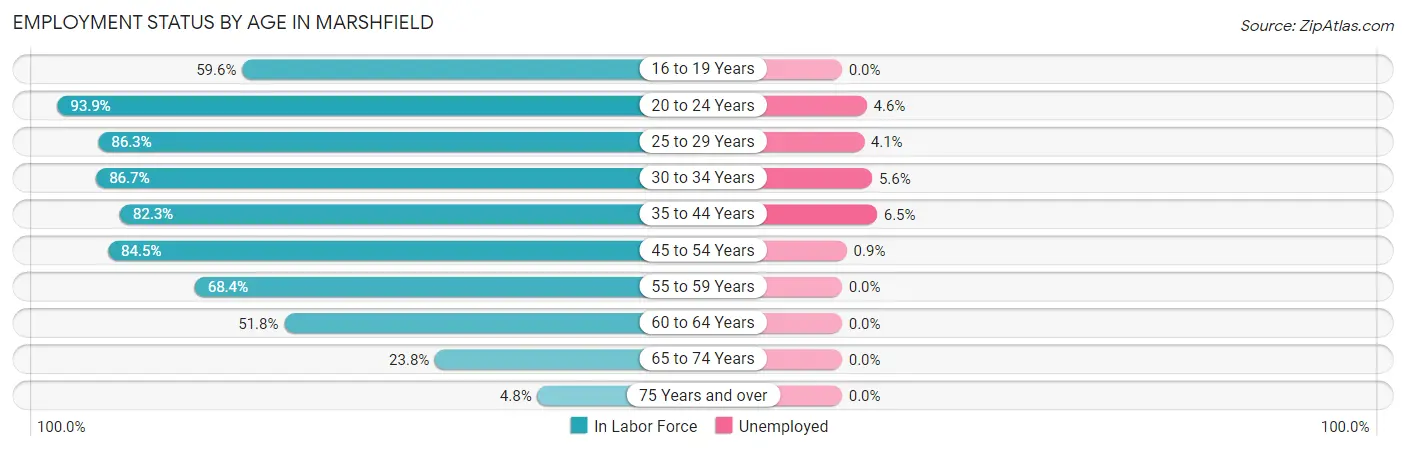
| Age Bracket | In Labor Force | Unemployed |
| 16 to 19 Years | 497 (59.6%) | 0 (0.0%) |
| 20 to 24 Years | 890 (93.9%) | 41 (4.6%) |
| 25 to 29 Years | 990 (86.3%) | 41 (4.1%) |
| 30 to 34 Years | 1,117 (86.7%) | 63 (5.6%) |
| 35 to 44 Years | 1,837 (82.3%) | 119 (6.5%) |
| 45 to 54 Years | 1,937 (84.5%) | 17 (0.9%) |
| 55 to 59 Years | 800 (68.4%) | 0 (0.0%) |
| 60 to 64 Years | 683 (51.8%) | 0 (0.0%) |
| 65 to 74 Years | 524 (23.8%) | 0 (0.0%) |
| 75 Years and over | 102 (4.8%) | 0 (0.0%) |
| Total | 9,374 (60.3%) | 281 (3.0%) |
Employment Status by Educational Attainment in Marshfield
According to labor force statistics for Marshfield, 78.0% of individuals (7,368) out of the total population between 25 and 64 years of age (9,446) are in the labor force, with 3.3% or 243 of them being unemployed. The group with the highest labor force participation rate are those with the educational attainment of bachelor's degree or higher, with 85.5% or 2,429 individuals in the labor force. Within the labor force, individuals with high school diploma education have the highest percentage of unemployment, with 7.8% or 157 of them being unemployed.
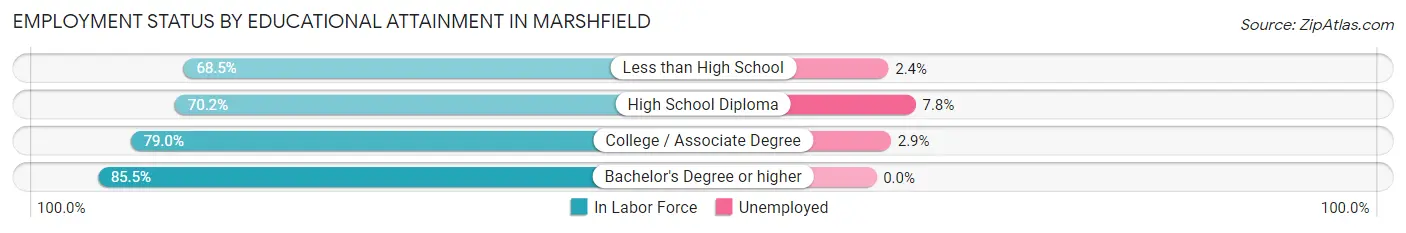
| Educational Attainment | In Labor Force | Unemployed |
| Less than High School | 207 (68.5%) | 7 (2.4%) |
| High School Diploma | 2,011 (70.2%) | 223 (7.8%) |
| College / Associate Degree | 2,717 (79.0%) | 100 (2.9%) |
| Bachelor's Degree or higher | 2,429 (85.5%) | 0 (0.0%) |
| Total | 7,368 (78.0%) | 312 (3.3%) |
Employment Occupations by Sex in Marshfield
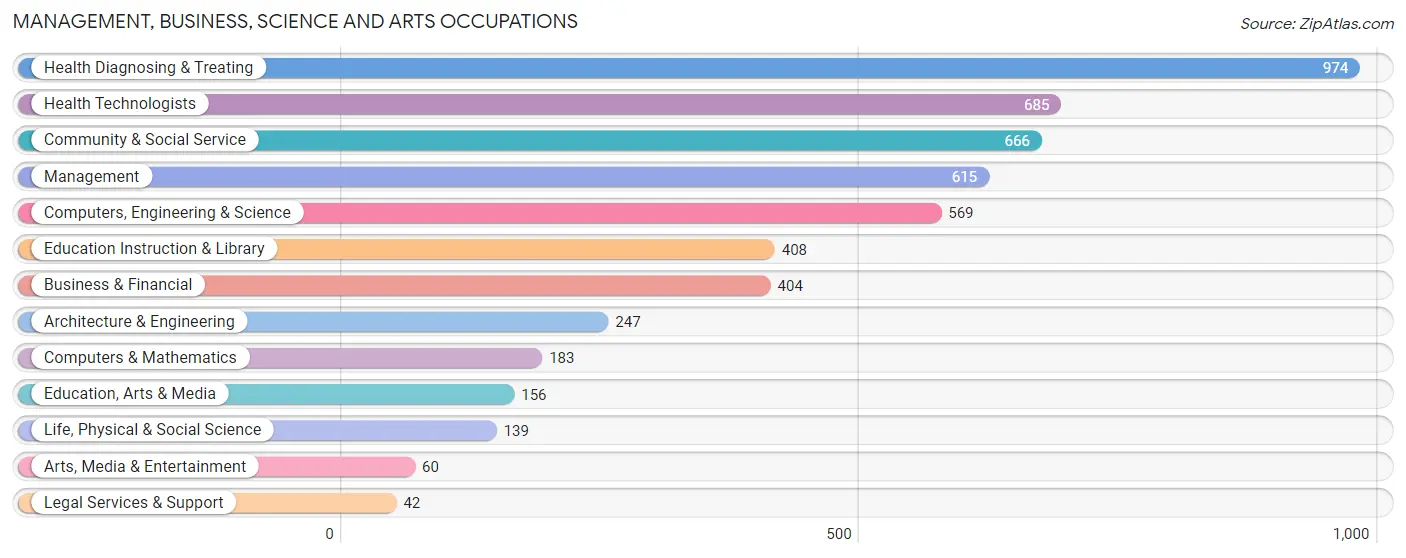
Management, Business, Science and Arts Occupations
The most common Management, Business, Science and Arts occupations in Marshfield are Health Diagnosing & Treating (974 | 10.7%), Health Technologists (685 | 7.5%), Community & Social Service (666 | 7.3%), Management (615 | 6.8%), and Computers, Engineering & Science (569 | 6.3%).
Management, Business, Science and Arts Occupations by Sex
Within the Management, Business, Science and Arts occupations in Marshfield, the most male-oriented occupations are Computers & Mathematics (77.6%), Architecture & Engineering (72.1%), and Computers, Engineering & Science (67.3%), while the most female-oriented occupations are Education Instruction & Library (80.6%), Health Diagnosing & Treating (63.4%), and Health Technologists (62.9%).
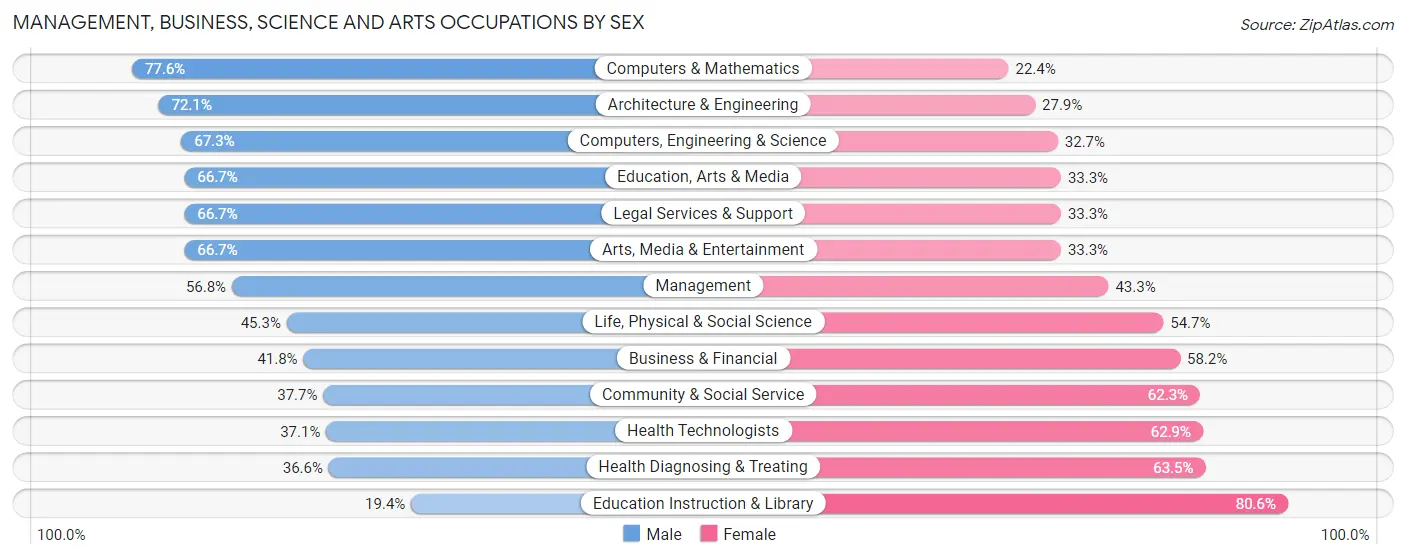
| Occupation | Male | Female |
| Management | 349 (56.8%) | 266 (43.2%) |
| Business & Financial | 169 (41.8%) | 235 (58.2%) |
| Computers, Engineering & Science | 383 (67.3%) | 186 (32.7%) |
| Computers & Mathematics | 142 (77.6%) | 41 (22.4%) |
| Architecture & Engineering | 178 (72.1%) | 69 (27.9%) |
| Life, Physical & Social Science | 63 (45.3%) | 76 (54.7%) |
| Community & Social Service | 251 (37.7%) | 415 (62.3%) |
| Education, Arts & Media | 104 (66.7%) | 52 (33.3%) |
| Legal Services & Support | 28 (66.7%) | 14 (33.3%) |
| Education Instruction & Library | 79 (19.4%) | 329 (80.6%) |
| Arts, Media & Entertainment | 40 (66.7%) | 20 (33.3%) |
| Health Diagnosing & Treating | 356 (36.5%) | 618 (63.4%) |
| Health Technologists | 254 (37.1%) | 431 (62.9%) |
| Total (Category) | 1,508 (46.7%) | 1,720 (53.3%) |
| Total (Overall) | 4,705 (51.8%) | 4,383 (48.2%) |
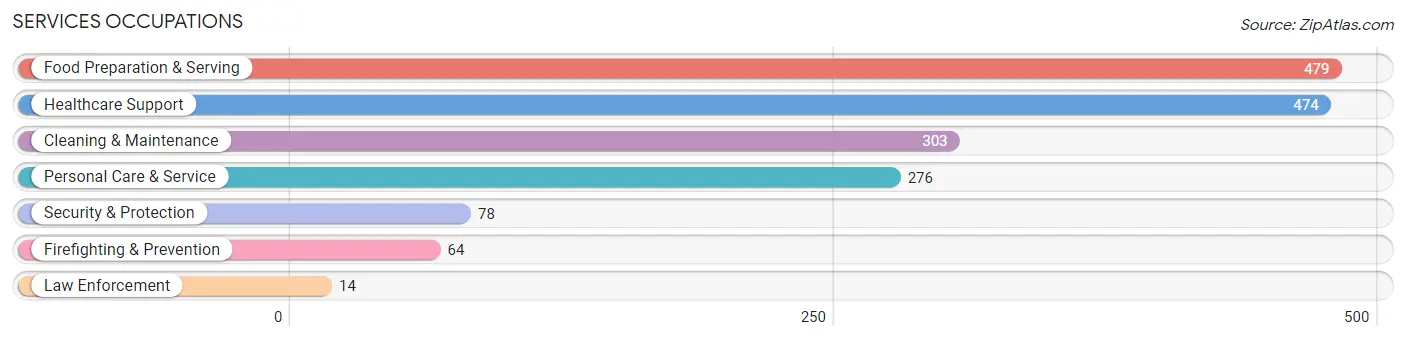
Services Occupations
The most common Services occupations in Marshfield are Food Preparation & Serving (479 | 5.3%), Healthcare Support (474 | 5.2%), Cleaning & Maintenance (303 | 3.3%), Personal Care & Service (276 | 3.0%), and Security & Protection (78 | 0.9%).
Services Occupations by Sex
Within the Services occupations in Marshfield, the most male-oriented occupations are Law Enforcement (100.0%), Cleaning & Maintenance (83.5%), and Security & Protection (64.1%), while the most female-oriented occupations are Personal Care & Service (100.0%), Healthcare Support (89.4%), and Food Preparation & Serving (67.6%).
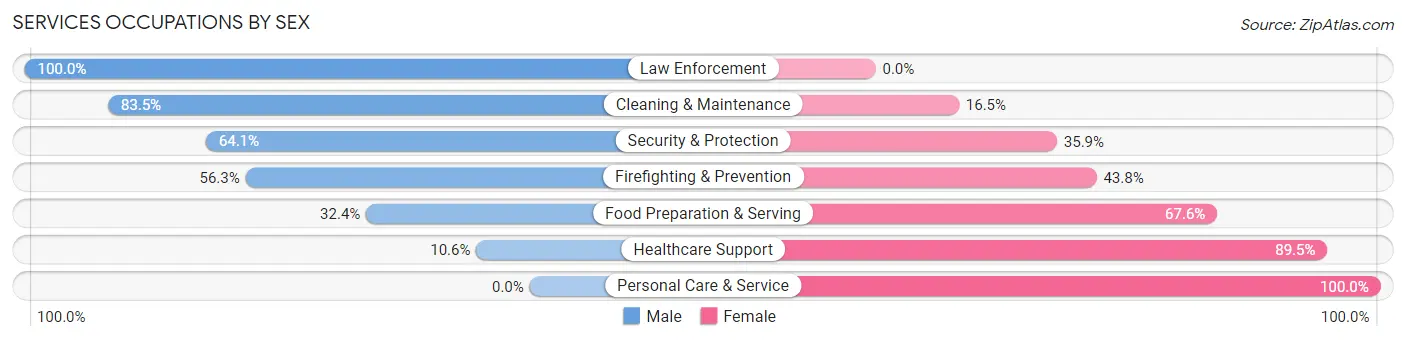
| Occupation | Male | Female |
| Healthcare Support | 50 (10.5%) | 424 (89.4%) |
| Security & Protection | 50 (64.1%) | 28 (35.9%) |
| Firefighting & Prevention | 36 (56.2%) | 28 (43.8%) |
| Law Enforcement | 14 (100.0%) | 0 (0.0%) |
| Food Preparation & Serving | 155 (32.4%) | 324 (67.6%) |
| Cleaning & Maintenance | 253 (83.5%) | 50 (16.5%) |
| Personal Care & Service | 0 (0.0%) | 276 (100.0%) |
| Total (Category) | 508 (31.6%) | 1,102 (68.4%) |
| Total (Overall) | 4,705 (51.8%) | 4,383 (48.2%) |
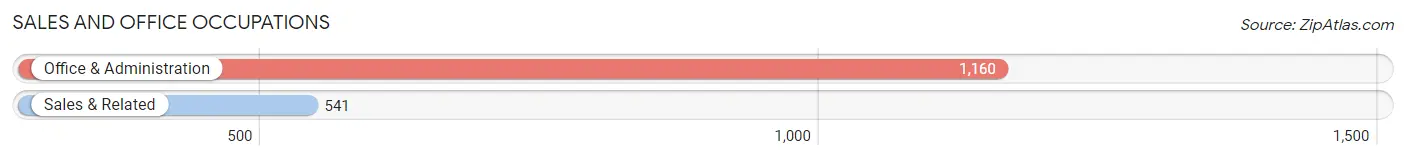
Sales and Office Occupations
The most common Sales and Office occupations in Marshfield are Office & Administration (1,160 | 12.8%), and Sales & Related (541 | 5.9%).
Sales and Office Occupations by Sex
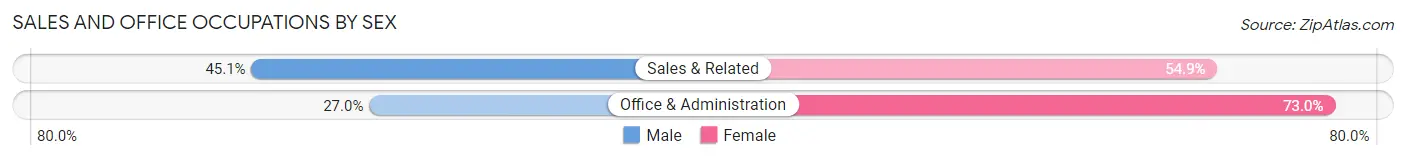
| Occupation | Male | Female |
| Sales & Related | 244 (45.1%) | 297 (54.9%) |
| Office & Administration | 313 (27.0%) | 847 (73.0%) |
| Total (Category) | 557 (32.8%) | 1,144 (67.2%) |
| Total (Overall) | 4,705 (51.8%) | 4,383 (48.2%) |
Natural Resources, Construction and Maintenance Occupations
The most common Natural Resources, Construction and Maintenance occupations in Marshfield are Construction & Extraction (349 | 3.8%), Installation, Maintenance & Repair (328 | 3.6%), and Farming, Fishing & Forestry (48 | 0.5%).
Natural Resources, Construction and Maintenance Occupations by Sex
| Occupation | Male | Female |
| Farming, Fishing & Forestry | 24 (50.0%) | 24 (50.0%) |
| Construction & Extraction | 341 (97.7%) | 8 (2.3%) |
| Installation, Maintenance & Repair | 328 (100.0%) | 0 (0.0%) |
| Total (Category) | 693 (95.6%) | 32 (4.4%) |
| Total (Overall) | 4,705 (51.8%) | 4,383 (48.2%) |
Production, Transportation and Moving Occupations
The most common Production, Transportation and Moving occupations in Marshfield are Production (896 | 9.9%), Material Moving (555 | 6.1%), and Transportation (373 | 4.1%).
Production, Transportation and Moving Occupations by Sex
| Occupation | Male | Female |
| Production | 632 (70.5%) | 264 (29.5%) |
| Transportation | 311 (83.4%) | 62 (16.6%) |
| Material Moving | 496 (89.4%) | 59 (10.6%) |
| Total (Category) | 1,439 (78.9%) | 385 (21.1%) |
| Total (Overall) | 4,705 (51.8%) | 4,383 (48.2%) |
Employment Industries by Sex in Marshfield
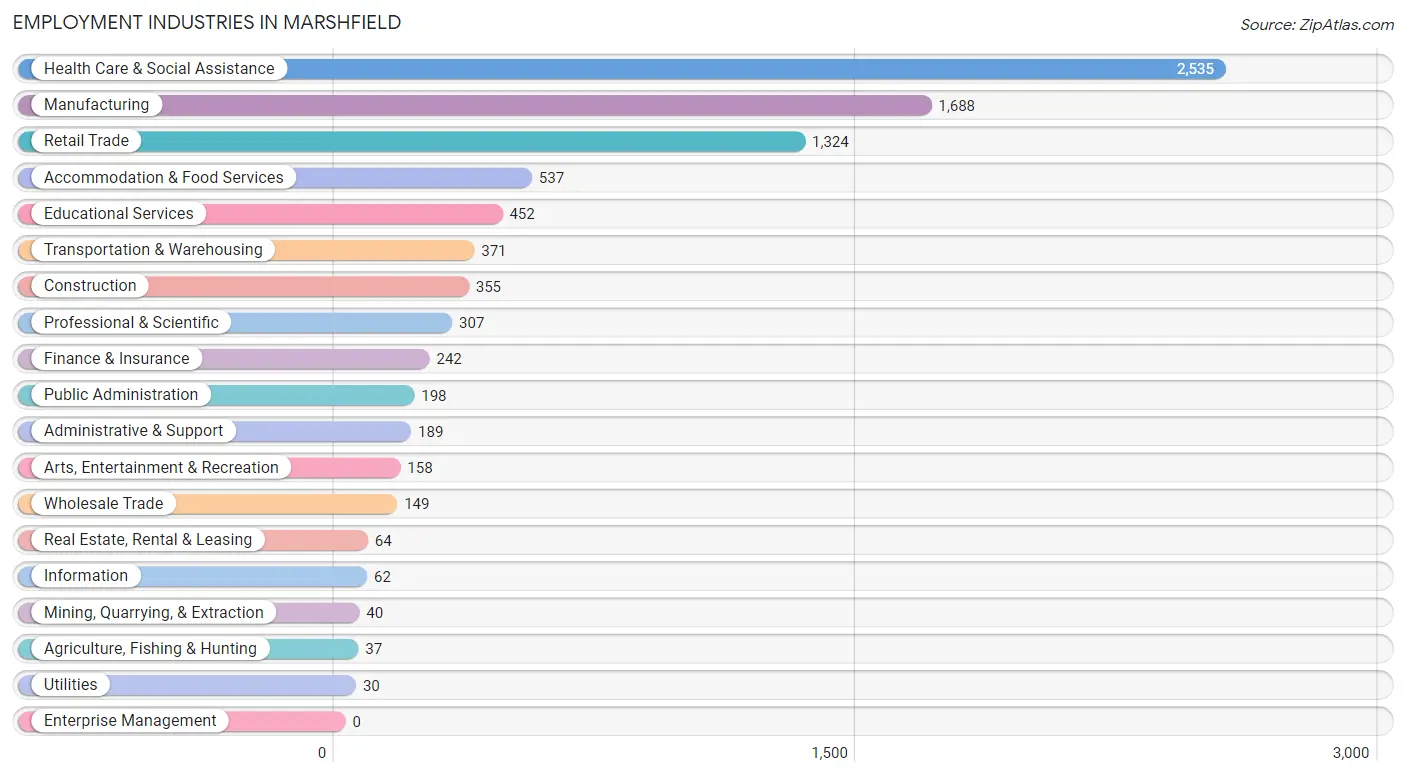
Employment Industries in Marshfield
The major employment industries in Marshfield include Health Care & Social Assistance (2,535 | 27.9%), Manufacturing (1,688 | 18.6%), Retail Trade (1,324 | 14.6%), Accommodation & Food Services (537 | 5.9%), and Educational Services (452 | 5.0%).
Employment Industries by Sex in Marshfield
The Marshfield industries that see more men than women are Agriculture, Fishing & Hunting (100.0%), Construction (97.8%), and Utilities (93.3%), whereas the industries that tend to have a higher number of women are Arts, Entertainment & Recreation (75.9%), Educational Services (73.9%), and Health Care & Social Assistance (66.5%).
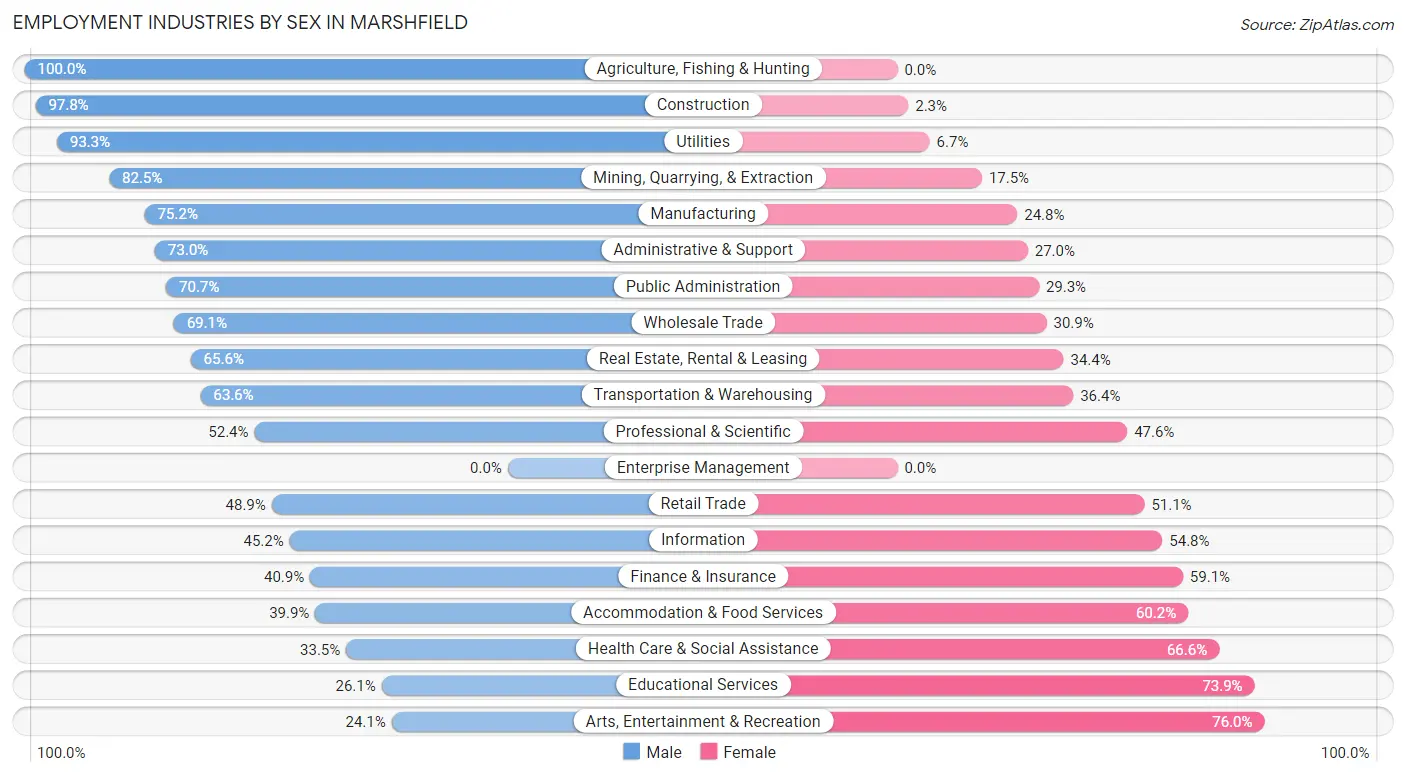
| Industry | Male | Female |
| Agriculture, Fishing & Hunting | 37 (100.0%) | 0 (0.0%) |
| Mining, Quarrying, & Extraction | 33 (82.5%) | 7 (17.5%) |
| Construction | 347 (97.8%) | 8 (2.2%) |
| Manufacturing | 1,269 (75.2%) | 419 (24.8%) |
| Wholesale Trade | 103 (69.1%) | 46 (30.9%) |
| Retail Trade | 647 (48.9%) | 677 (51.1%) |
| Transportation & Warehousing | 236 (63.6%) | 135 (36.4%) |
| Utilities | 28 (93.3%) | 2 (6.7%) |
| Information | 28 (45.2%) | 34 (54.8%) |
| Finance & Insurance | 99 (40.9%) | 143 (59.1%) |
| Real Estate, Rental & Leasing | 42 (65.6%) | 22 (34.4%) |
| Professional & Scientific | 161 (52.4%) | 146 (47.6%) |
| Enterprise Management | 0 (0.0%) | 0 (0.0%) |
| Administrative & Support | 138 (73.0%) | 51 (27.0%) |
| Educational Services | 118 (26.1%) | 334 (73.9%) |
| Health Care & Social Assistance | 848 (33.5%) | 1,687 (66.5%) |
| Arts, Entertainment & Recreation | 38 (24.0%) | 120 (75.9%) |
| Accommodation & Food Services | 214 (39.9%) | 323 (60.2%) |
| Public Administration | 140 (70.7%) | 58 (29.3%) |
| Total | 4,705 (51.8%) | 4,383 (48.2%) |
Education in Marshfield
School Enrollment in Marshfield
The most common levels of schooling among the 3,791 students in Marshfield are high school (1,022 | 27.0%), middle school (862 | 22.7%), and college / undergraduate (674 | 17.8%).
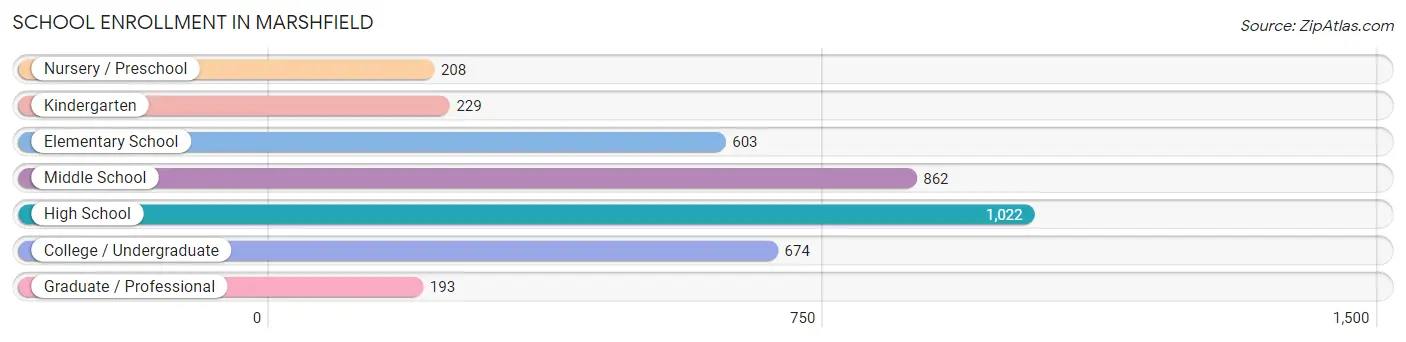
| School Level | # Students | % Students |
| Nursery / Preschool | 208 | 5.5% |
| Kindergarten | 229 | 6.0% |
| Elementary School | 603 | 15.9% |
| Middle School | 862 | 22.7% |
| High School | 1,022 | 27.0% |
| College / Undergraduate | 674 | 17.8% |
| Graduate / Professional | 193 | 5.1% |
| Total | 3,791 | 100.0% |
School Enrollment by Age by Funding Source in Marshfield
Out of a total of 3,791 students who are enrolled in schools in Marshfield, 508 (13.4%) attend a private institution, while the remaining 3,283 (86.6%) are enrolled in public schools. The age group of 35 years and over has the highest likelihood of being enrolled in private schools, with 64 (22.5% in the age bracket) enrolled. Conversely, the age group of 18 to 19 year olds has the lowest likelihood of being enrolled in a private school, with 371 (95.9% in the age bracket) attending a public institution.
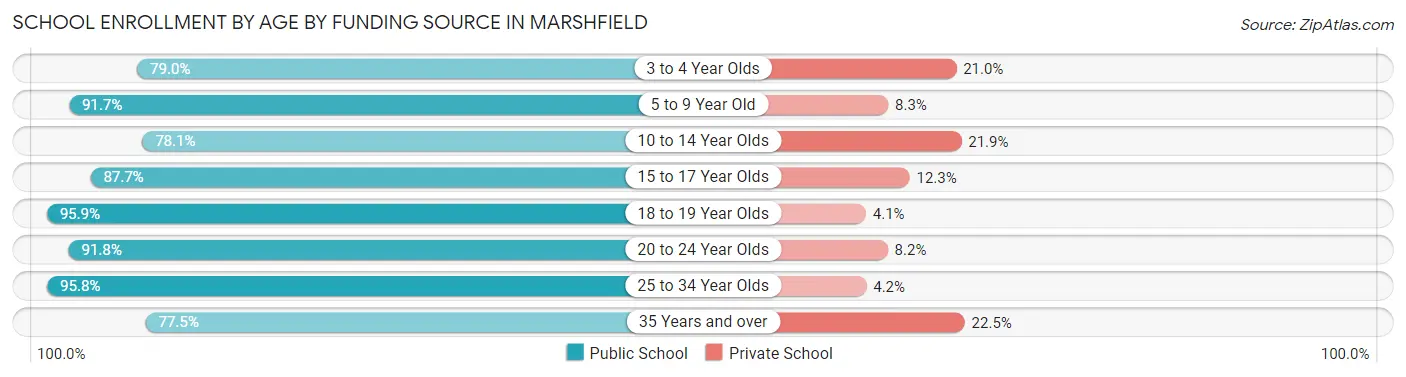
| Age Bracket | Public School | Private School |
| 3 to 4 Year Olds | 132 (79.0%) | 35 (21.0%) |
| 5 to 9 Year Old | 754 (91.7%) | 68 (8.3%) |
| 10 to 14 Year Olds | 770 (78.1%) | 216 (21.9%) |
| 15 to 17 Year Olds | 572 (87.7%) | 80 (12.3%) |
| 18 to 19 Year Olds | 371 (95.9%) | 16 (4.1%) |
| 20 to 24 Year Olds | 213 (91.8%) | 19 (8.2%) |
| 25 to 34 Year Olds | 250 (95.8%) | 11 (4.2%) |
| 35 Years and over | 220 (77.5%) | 64 (22.5%) |
| Total | 3,283 (86.6%) | 508 (13.4%) |
Educational Attainment by Field of Study in Marshfield
Business (741 | 18.0%), science & technology (671 | 16.3%), education (668 | 16.2%), bio, nature & agricultural (503 | 12.2%), and engineering (256 | 6.2%) are the most common fields of study among 4,122 individuals in Marshfield who have obtained a bachelor's degree or higher.
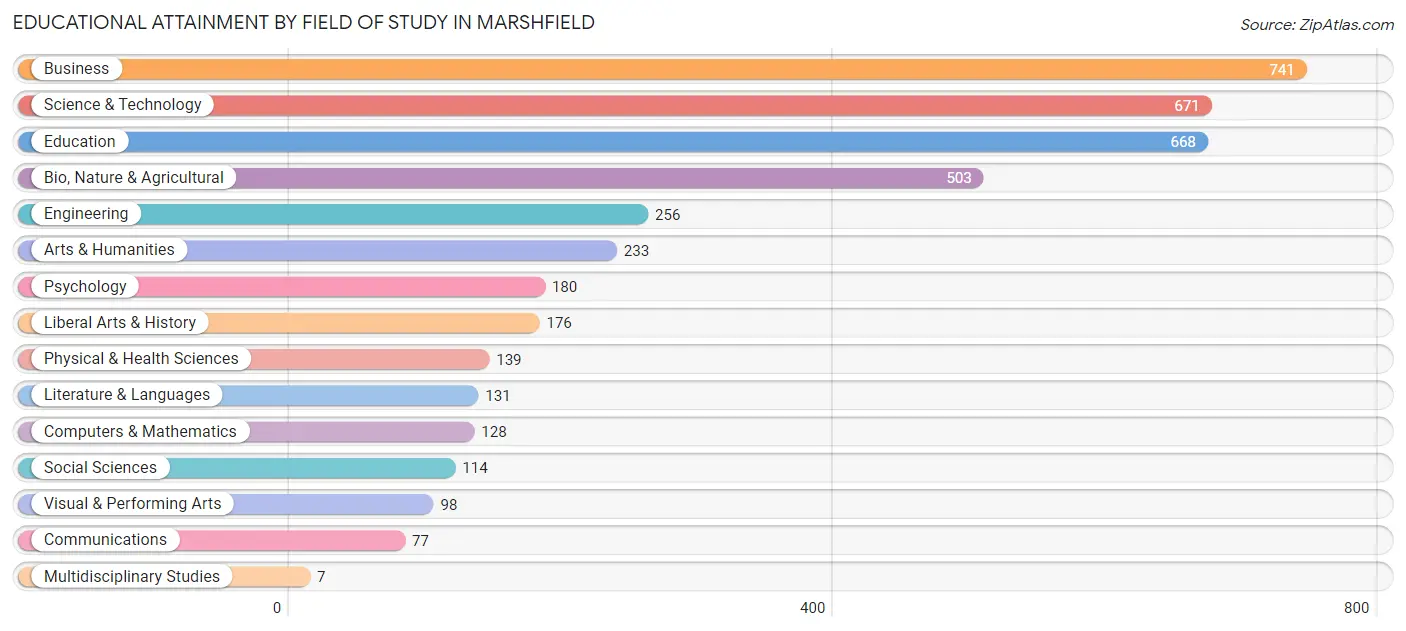
| Field of Study | # Graduates | % Graduates |
| Computers & Mathematics | 128 | 3.1% |
| Bio, Nature & Agricultural | 503 | 12.2% |
| Physical & Health Sciences | 139 | 3.4% |
| Psychology | 180 | 4.4% |
| Social Sciences | 114 | 2.8% |
| Engineering | 256 | 6.2% |
| Multidisciplinary Studies | 7 | 0.2% |
| Science & Technology | 671 | 16.3% |
| Business | 741 | 18.0% |
| Education | 668 | 16.2% |
| Literature & Languages | 131 | 3.2% |
| Liberal Arts & History | 176 | 4.3% |
| Visual & Performing Arts | 98 | 2.4% |
| Communications | 77 | 1.9% |
| Arts & Humanities | 233 | 5.7% |
| Total | 4,122 | 100.0% |
Transportation & Commute in Marshfield
Vehicle Availability by Sex in Marshfield
The most prevalent vehicle ownership categories in Marshfield are males with 2 vehicles (2,411, accounting for 52.3%) and females with 2 vehicles (2,227, making up 56.4%).
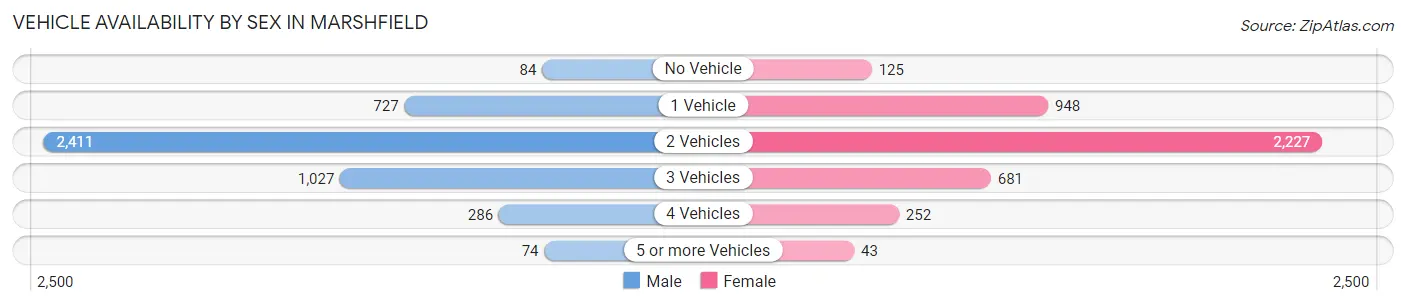
| Vehicles Available | Male | Female |
| No Vehicle | 84 (1.8%) | 125 (2.9%) |
| 1 Vehicle | 727 (15.8%) | 948 (22.2%) |
| 2 Vehicles | 2,411 (52.3%) | 2,227 (52.1%) |
| 3 Vehicles | 1,027 (22.3%) | 681 (15.9%) |
| 4 Vehicles | 286 (6.2%) | 252 (5.9%) |
| 5 or more Vehicles | 74 (1.6%) | 43 (1.0%) |
| Total | 4,609 (100.0%) | 4,276 (100.0%) |
Commute Time in Marshfield
The most frequently occuring commute durations in Marshfield are 5 to 9 minutes (3,110 commuters, 37.1%), 10 to 14 minutes (2,248 commuters, 26.9%), and 15 to 19 minutes (821 commuters, 9.8%).
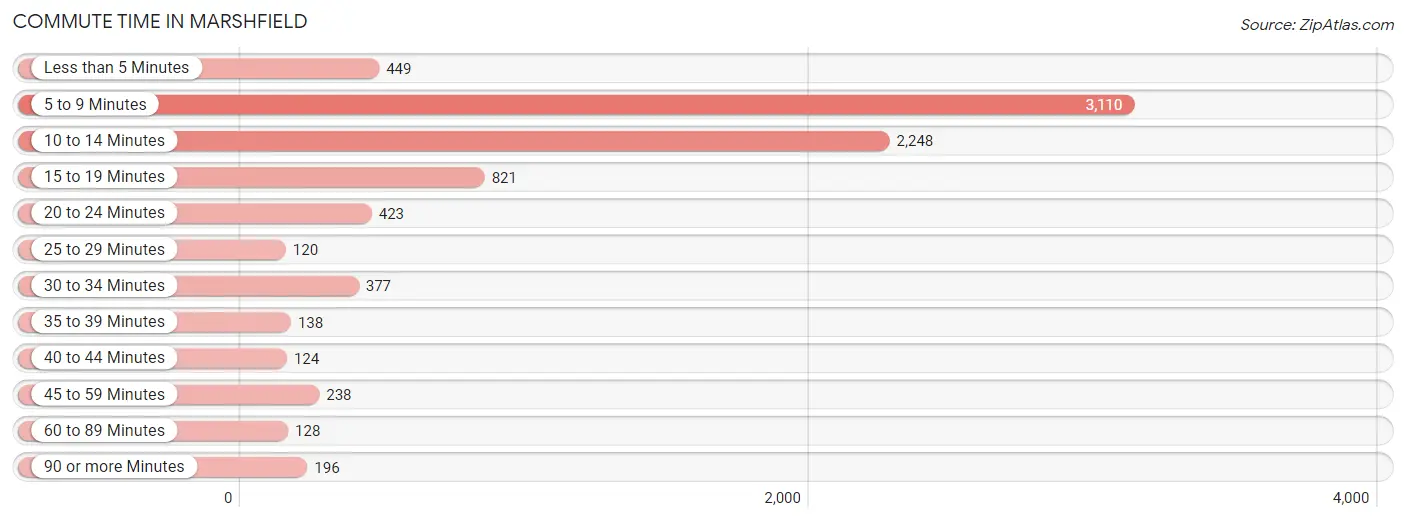
| Commute Time | # Commuters | % Commuters |
| Less than 5 Minutes | 449 | 5.4% |
| 5 to 9 Minutes | 3,110 | 37.1% |
| 10 to 14 Minutes | 2,248 | 26.9% |
| 15 to 19 Minutes | 821 | 9.8% |
| 20 to 24 Minutes | 423 | 5.1% |
| 25 to 29 Minutes | 120 | 1.4% |
| 30 to 34 Minutes | 377 | 4.5% |
| 35 to 39 Minutes | 138 | 1.7% |
| 40 to 44 Minutes | 124 | 1.5% |
| 45 to 59 Minutes | 238 | 2.8% |
| 60 to 89 Minutes | 128 | 1.5% |
| 90 or more Minutes | 196 | 2.3% |
Commute Time by Sex in Marshfield
The most common commute times in Marshfield are 5 to 9 minutes (1,552 commuters, 35.6%) for males and 5 to 9 minutes (1,558 commuters, 38.8%) for females.
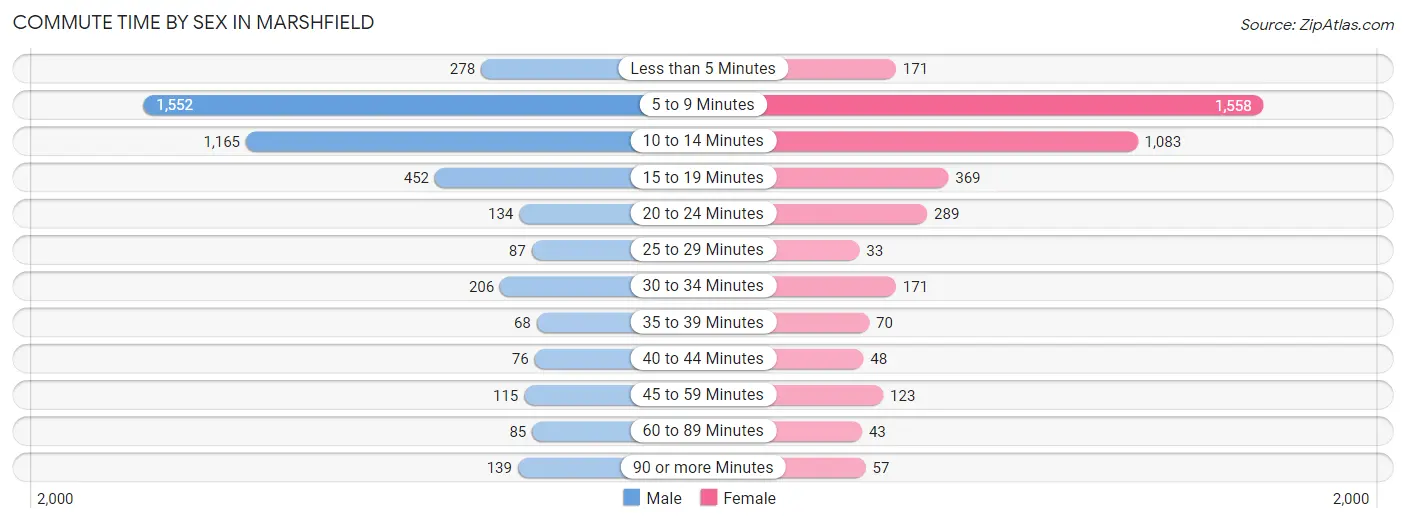
| Commute Time | Male | Female |
| Less than 5 Minutes | 278 (6.4%) | 171 (4.3%) |
| 5 to 9 Minutes | 1,552 (35.6%) | 1,558 (38.8%) |
| 10 to 14 Minutes | 1,165 (26.7%) | 1,083 (27.0%) |
| 15 to 19 Minutes | 452 (10.4%) | 369 (9.2%) |
| 20 to 24 Minutes | 134 (3.1%) | 289 (7.2%) |
| 25 to 29 Minutes | 87 (2.0%) | 33 (0.8%) |
| 30 to 34 Minutes | 206 (4.7%) | 171 (4.3%) |
| 35 to 39 Minutes | 68 (1.6%) | 70 (1.7%) |
| 40 to 44 Minutes | 76 (1.7%) | 48 (1.2%) |
| 45 to 59 Minutes | 115 (2.6%) | 123 (3.1%) |
| 60 to 89 Minutes | 85 (1.9%) | 43 (1.1%) |
| 90 or more Minutes | 139 (3.2%) | 57 (1.4%) |
Time of Departure to Work by Sex in Marshfield
The most frequent times of departure to work in Marshfield are 7:30 AM to 7:59 AM (674, 15.5%) for males and 7:30 AM to 7:59 AM (665, 16.6%) for females.
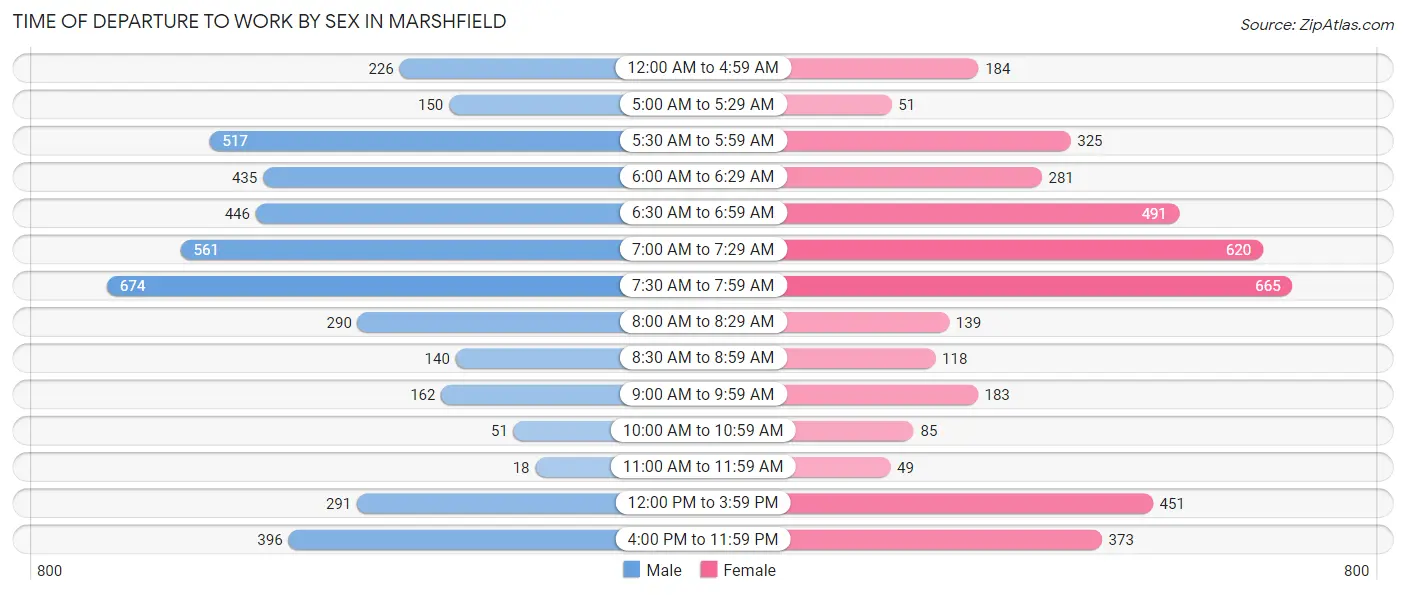
| Time of Departure | Male | Female |
| 12:00 AM to 4:59 AM | 226 (5.2%) | 184 (4.6%) |
| 5:00 AM to 5:29 AM | 150 (3.4%) | 51 (1.3%) |
| 5:30 AM to 5:59 AM | 517 (11.9%) | 325 (8.1%) |
| 6:00 AM to 6:29 AM | 435 (10.0%) | 281 (7.0%) |
| 6:30 AM to 6:59 AM | 446 (10.2%) | 491 (12.2%) |
| 7:00 AM to 7:29 AM | 561 (12.9%) | 620 (15.4%) |
| 7:30 AM to 7:59 AM | 674 (15.5%) | 665 (16.6%) |
| 8:00 AM to 8:29 AM | 290 (6.7%) | 139 (3.5%) |
| 8:30 AM to 8:59 AM | 140 (3.2%) | 118 (2.9%) |
| 9:00 AM to 9:59 AM | 162 (3.7%) | 183 (4.6%) |
| 10:00 AM to 10:59 AM | 51 (1.2%) | 85 (2.1%) |
| 11:00 AM to 11:59 AM | 18 (0.4%) | 49 (1.2%) |
| 12:00 PM to 3:59 PM | 291 (6.7%) | 451 (11.2%) |
| 4:00 PM to 11:59 PM | 396 (9.1%) | 373 (9.3%) |
| Total | 4,357 (100.0%) | 4,015 (100.0%) |
Housing Occupancy in Marshfield
Occupancy by Ownership in Marshfield
Of the total 8,807 dwellings in Marshfield, owner-occupied units account for 5,611 (63.7%), while renter-occupied units make up 3,196 (36.3%).
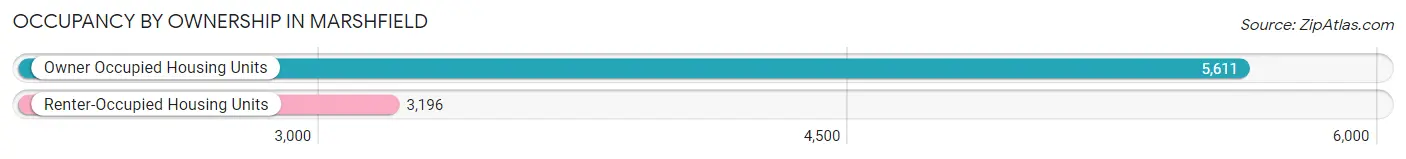
| Occupancy | # Housing Units | % Housing Units |
| Owner Occupied Housing Units | 5,611 | 63.7% |
| Renter-Occupied Housing Units | 3,196 | 36.3% |
| Total Occupied Housing Units | 8,807 | 100.0% |
Occupancy by Household Size in Marshfield
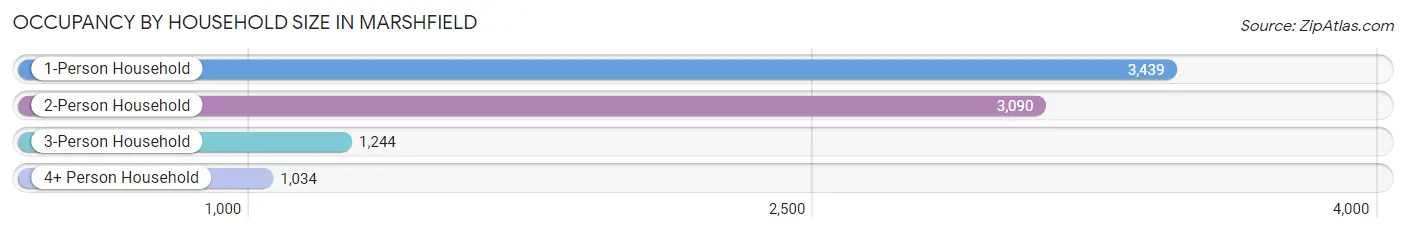
| Household Size | # Housing Units | % Housing Units |
| 1-Person Household | 3,439 | 39.1% |
| 2-Person Household | 3,090 | 35.1% |
| 3-Person Household | 1,244 | 14.1% |
| 4+ Person Household | 1,034 | 11.7% |
| Total Housing Units | 8,807 | 100.0% |
Occupancy by Ownership by Household Size in Marshfield
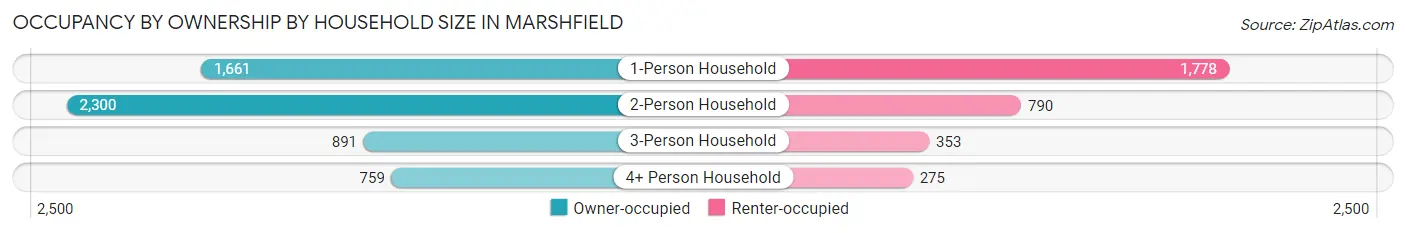
| Household Size | Owner-occupied | Renter-occupied |
| 1-Person Household | 1,661 (48.3%) | 1,778 (51.7%) |
| 2-Person Household | 2,300 (74.4%) | 790 (25.6%) |
| 3-Person Household | 891 (71.6%) | 353 (28.4%) |
| 4+ Person Household | 759 (73.4%) | 275 (26.6%) |
| Total Housing Units | 5,611 (63.7%) | 3,196 (36.3%) |
Occupancy by Educational Attainment in Marshfield
| Household Size | Owner-occupied | Renter-occupied |
| Less than High School | 203 (51.1%) | 194 (48.9%) |
| High School Diploma | 1,809 (60.3%) | 1,190 (39.7%) |
| College/Associate Degree | 1,799 (61.8%) | 1,110 (38.2%) |
| Bachelor's Degree or higher | 1,800 (71.9%) | 702 (28.1%) |
Occupancy by Age of Householder in Marshfield
| Age Bracket | # Households | % Households |
| Under 35 Years | 1,816 | 20.6% |
| 35 to 44 Years | 1,326 | 15.1% |
| 45 to 54 Years | 1,365 | 15.5% |
| 55 to 64 Years | 1,525 | 17.3% |
| 65 to 74 Years | 1,399 | 15.9% |
| 75 to 84 Years | 810 | 9.2% |
| 85 Years and Over | 566 | 6.4% |
| Total | 8,807 | 100.0% |
Housing Finances in Marshfield
Median Income by Occupancy in Marshfield
| Occupancy Type | # Households | Median Income |
| Owner-Occupied | 5,611 (63.7%) | $67,626 |
| Renter-Occupied | 3,196 (36.3%) | $40,117 |
| Average | 8,807 (100.0%) | $58,474 |
Occupancy by Householder Income Bracket in Marshfield
| Income Bracket | Owner-occupied | Renter-occupied |
| Less than $5,000 | 200 (3.6%) | 192 (6.0%) |
| $5,000 to $9,999 | 47 (0.8%) | 76 (2.4%) |
| $10,000 to $14,999 | 235 (4.2%) | 203 (6.4%) |
| $15,000 to $19,999 | 140 (2.5%) | 200 (6.3%) |
| $20,000 to $24,999 | 191 (3.4%) | 255 (8.0%) |
| $25,000 to $34,999 | 375 (6.7%) | 497 (15.5%) |
| $35,000 to $49,999 | 718 (12.8%) | 389 (12.2%) |
| $50,000 to $74,999 | 1,342 (23.9%) | 708 (22.2%) |
| $75,000 to $99,999 | 627 (11.2%) | 339 (10.6%) |
| $100,000 to $149,999 | 957 (17.1%) | 174 (5.4%) |
| $150,000 or more | 779 (13.9%) | 163 (5.1%) |
| Total | 5,611 (100.0%) | 3,196 (100.0%) |
Monthly Housing Cost Tiers in Marshfield
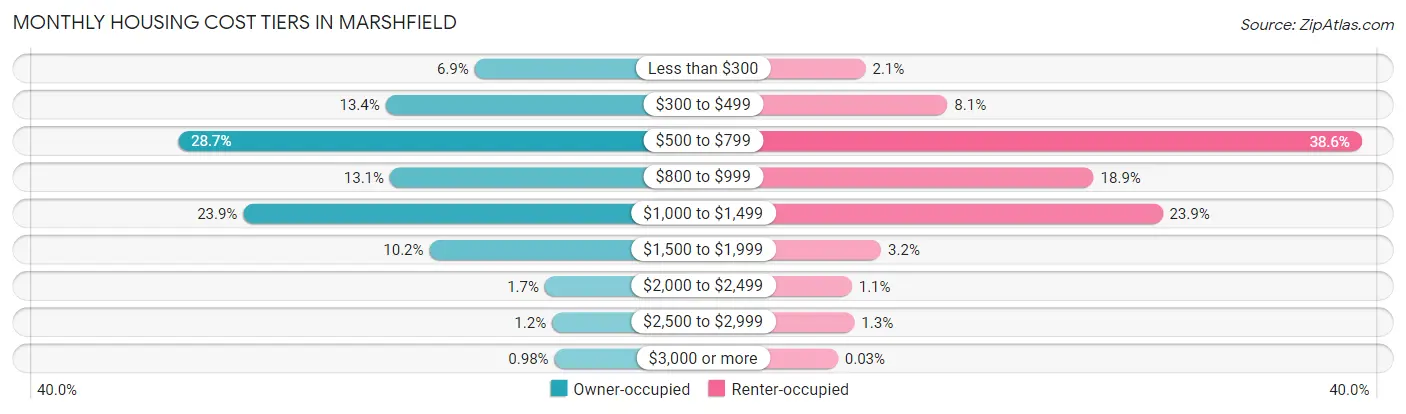
| Monthly Cost | Owner-occupied | Renter-occupied |
| Less than $300 | 385 (6.9%) | 66 (2.1%) |
| $300 to $499 | 753 (13.4%) | 259 (8.1%) |
| $500 to $799 | 1,610 (28.7%) | 1,234 (38.6%) |
| $800 to $999 | 735 (13.1%) | 603 (18.9%) |
| $1,000 to $1,499 | 1,341 (23.9%) | 765 (23.9%) |
| $1,500 to $1,999 | 572 (10.2%) | 103 (3.2%) |
| $2,000 to $2,499 | 95 (1.7%) | 34 (1.1%) |
| $2,500 to $2,999 | 65 (1.2%) | 40 (1.3%) |
| $3,000 or more | 55 (1.0%) | 1 (0.0%) |
| Total | 5,611 (100.0%) | 3,196 (100.0%) |
Physical Housing Characteristics in Marshfield
Housing Structures in Marshfield
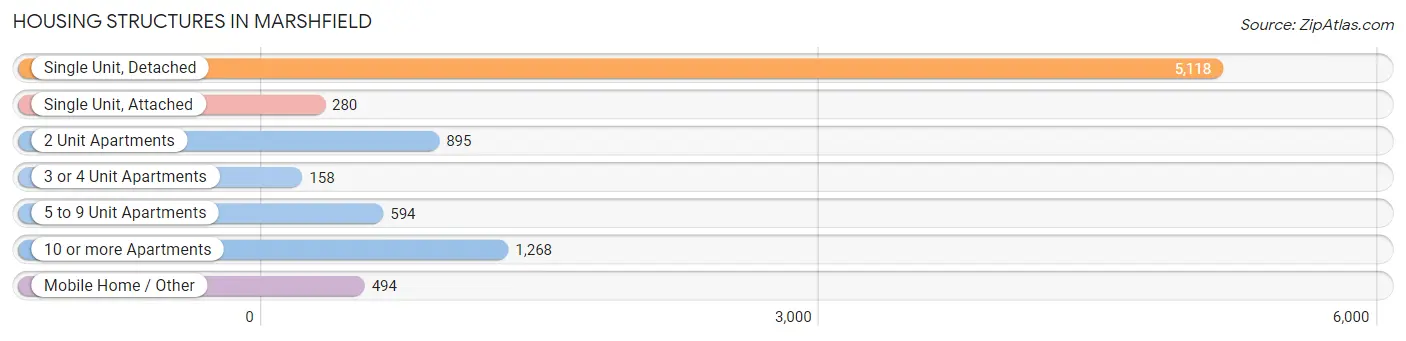
| Structure Type | # Housing Units | % Housing Units |
| Single Unit, Detached | 5,118 | 58.1% |
| Single Unit, Attached | 280 | 3.2% |
| 2 Unit Apartments | 895 | 10.2% |
| 3 or 4 Unit Apartments | 158 | 1.8% |
| 5 to 9 Unit Apartments | 594 | 6.7% |
| 10 or more Apartments | 1,268 | 14.4% |
| Mobile Home / Other | 494 | 5.6% |
| Total | 8,807 | 100.0% |
Housing Structures by Occupancy in Marshfield
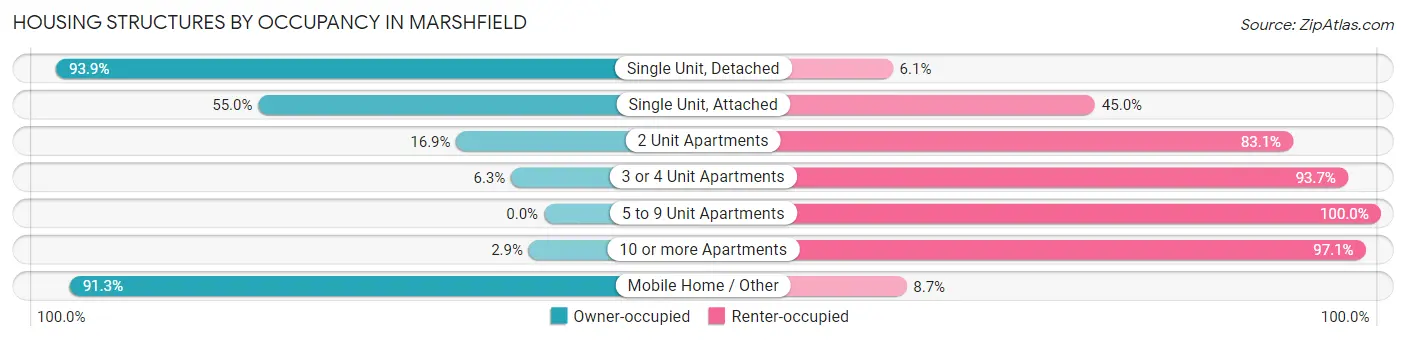
| Structure Type | Owner-occupied | Renter-occupied |
| Single Unit, Detached | 4,808 (93.9%) | 310 (6.1%) |
| Single Unit, Attached | 154 (55.0%) | 126 (45.0%) |
| 2 Unit Apartments | 151 (16.9%) | 744 (83.1%) |
| 3 or 4 Unit Apartments | 10 (6.3%) | 148 (93.7%) |
| 5 to 9 Unit Apartments | 0 (0.0%) | 594 (100.0%) |
| 10 or more Apartments | 37 (2.9%) | 1,231 (97.1%) |
| Mobile Home / Other | 451 (91.3%) | 43 (8.7%) |
| Total | 5,611 (63.7%) | 3,196 (36.3%) |
Housing Structures by Number of Rooms in Marshfield
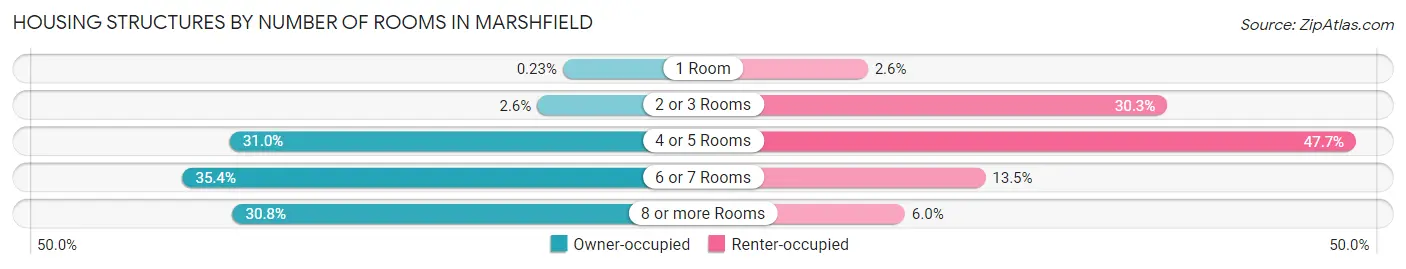
| Number of Rooms | Owner-occupied | Renter-occupied |
| 1 Room | 13 (0.2%) | 82 (2.6%) |
| 2 or 3 Rooms | 146 (2.6%) | 967 (30.3%) |
| 4 or 5 Rooms | 1,740 (31.0%) | 1,525 (47.7%) |
| 6 or 7 Rooms | 1,986 (35.4%) | 430 (13.5%) |
| 8 or more Rooms | 1,726 (30.8%) | 192 (6.0%) |
| Total | 5,611 (100.0%) | 3,196 (100.0%) |
Housing Structure by Heating Type in Marshfield
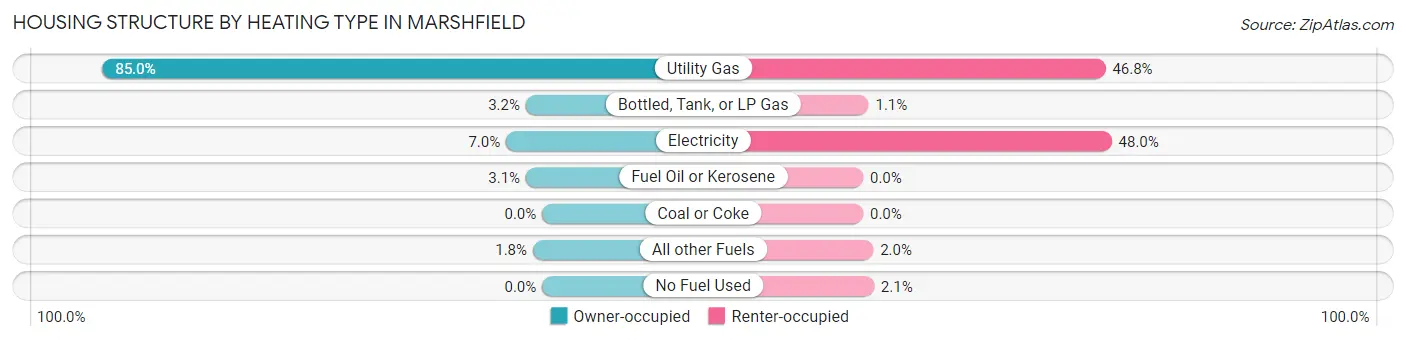
| Heating Type | Owner-occupied | Renter-occupied |
| Utility Gas | 4,768 (85.0%) | 1,497 (46.8%) |
| Bottled, Tank, or LP Gas | 177 (3.2%) | 34 (1.1%) |
| Electricity | 391 (7.0%) | 1,535 (48.0%) |
| Fuel Oil or Kerosene | 175 (3.1%) | 0 (0.0%) |
| Coal or Coke | 0 (0.0%) | 0 (0.0%) |
| All other Fuels | 100 (1.8%) | 63 (2.0%) |
| No Fuel Used | 0 (0.0%) | 67 (2.1%) |
| Total | 5,611 (100.0%) | 3,196 (100.0%) |
Household Vehicle Usage in Marshfield
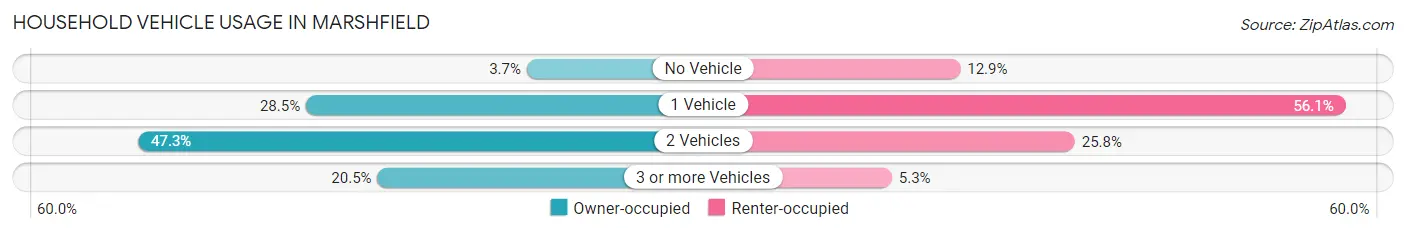
| Vehicles per Household | Owner-occupied | Renter-occupied |
| No Vehicle | 210 (3.7%) | 413 (12.9%) |
| 1 Vehicle | 1,598 (28.5%) | 1,792 (56.1%) |
| 2 Vehicles | 2,654 (47.3%) | 823 (25.8%) |
| 3 or more Vehicles | 1,149 (20.5%) | 168 (5.3%) |
| Total | 5,611 (100.0%) | 3,196 (100.0%) |
Real Estate & Mortgages in Marshfield
Real Estate and Mortgage Overview in Marshfield
| Characteristic | Without Mortgage | With Mortgage |
| Housing Units | 2,673 | 2,938 |
| Median Property Value | $152,100 | $155,800 |
| Median Household Income | $54,885 | $395 |
| Monthly Housing Costs | $538 | $45 |
| Real Estate Taxes | $3,061 | $36 |
Property Value by Mortgage Status in Marshfield
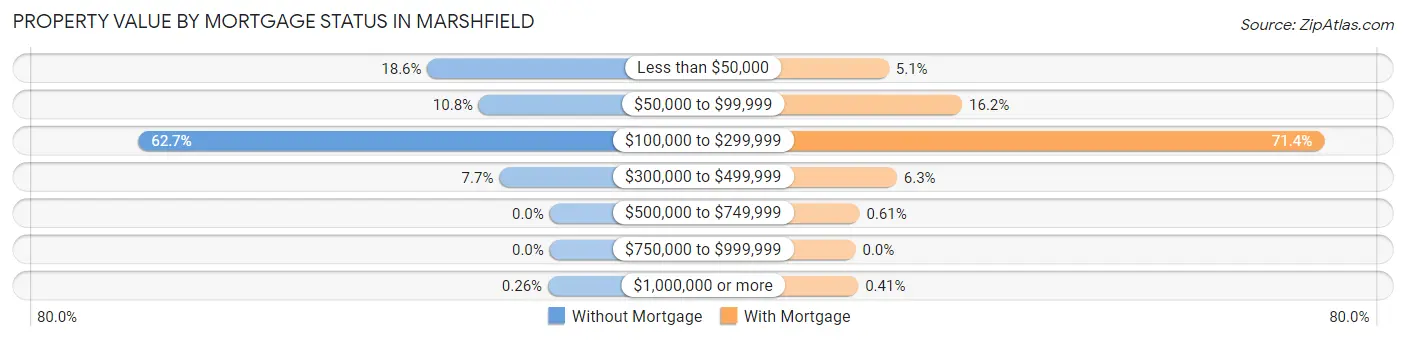
| Property Value | Without Mortgage | With Mortgage |
| Less than $50,000 | 498 (18.6%) | 149 (5.1%) |
| $50,000 to $99,999 | 288 (10.8%) | 477 (16.2%) |
| $100,000 to $299,999 | 1,675 (62.7%) | 2,097 (71.4%) |
| $300,000 to $499,999 | 205 (7.7%) | 185 (6.3%) |
| $500,000 to $749,999 | 0 (0.0%) | 18 (0.6%) |
| $750,000 to $999,999 | 0 (0.0%) | 0 (0.0%) |
| $1,000,000 or more | 7 (0.3%) | 12 (0.4%) |
| Total | 2,673 (100.0%) | 2,938 (100.0%) |
Household Income by Mortgage Status in Marshfield
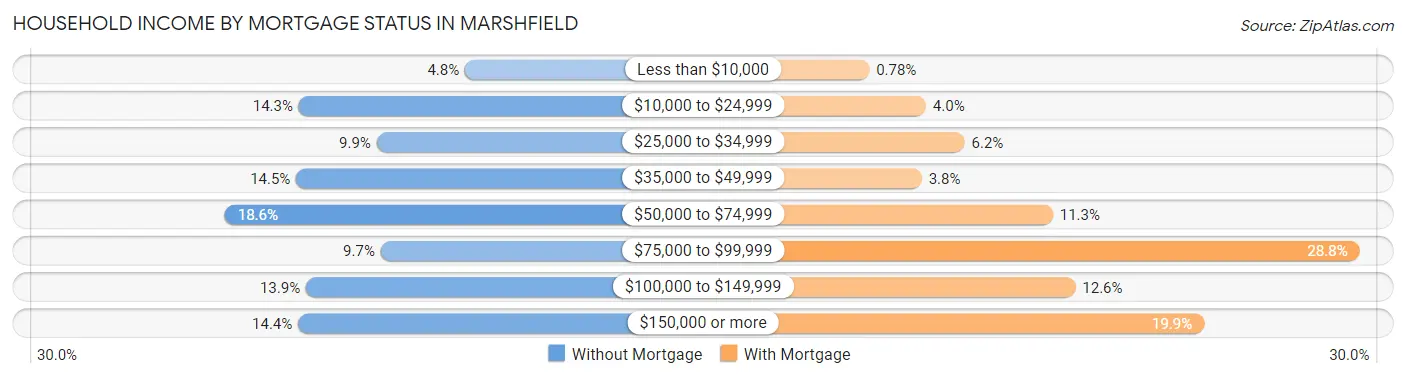
| Household Income | Without Mortgage | With Mortgage |
| Less than $10,000 | 129 (4.8%) | 23 (0.8%) |
| $10,000 to $24,999 | 383 (14.3%) | 118 (4.0%) |
| $25,000 to $34,999 | 264 (9.9%) | 183 (6.2%) |
| $35,000 to $49,999 | 387 (14.5%) | 111 (3.8%) |
| $50,000 to $74,999 | 496 (18.6%) | 331 (11.3%) |
| $75,000 to $99,999 | 258 (9.7%) | 846 (28.8%) |
| $100,000 to $149,999 | 372 (13.9%) | 369 (12.6%) |
| $150,000 or more | 384 (14.4%) | 585 (19.9%) |
| Total | 2,673 (100.0%) | 2,938 (100.0%) |
Property Value to Household Income Ratio in Marshfield
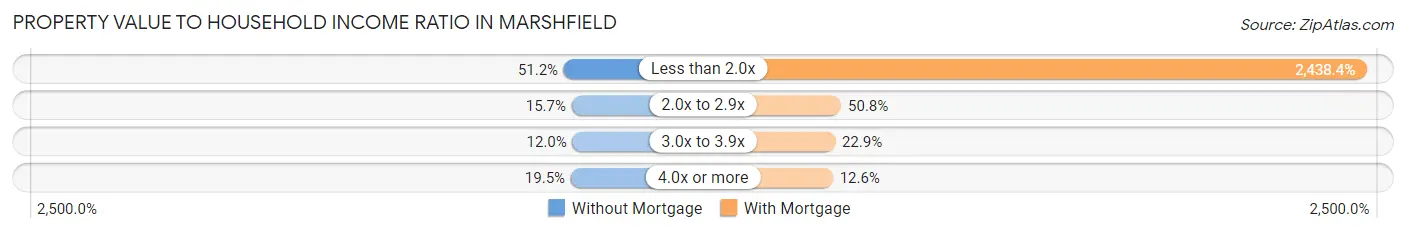
| Value-to-Income Ratio | Without Mortgage | With Mortgage |
| Less than 2.0x | 1,368 (51.2%) | 71,639 (2,438.4%) |
| 2.0x to 2.9x | 420 (15.7%) | 1,492 (50.8%) |
| 3.0x to 3.9x | 320 (12.0%) | 674 (22.9%) |
| 4.0x or more | 522 (19.5%) | 371 (12.6%) |
| Total | 2,673 (100.0%) | 2,938 (100.0%) |
Real Estate Taxes by Mortgage Status in Marshfield
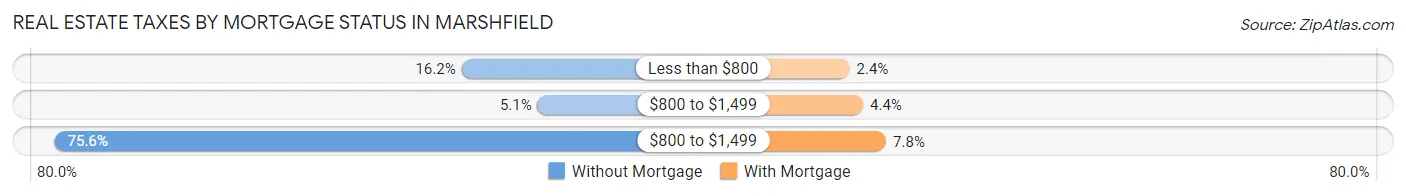
| Property Taxes | Without Mortgage | With Mortgage |
| Less than $800 | 432 (16.2%) | 71 (2.4%) |
| $800 to $1,499 | 135 (5.1%) | 129 (4.4%) |
| $800 to $1,499 | 2,021 (75.6%) | 228 (7.8%) |
| Total | 2,673 (100.0%) | 2,938 (100.0%) |
Health & Disability in Marshfield
Health Insurance Coverage by Age in Marshfield
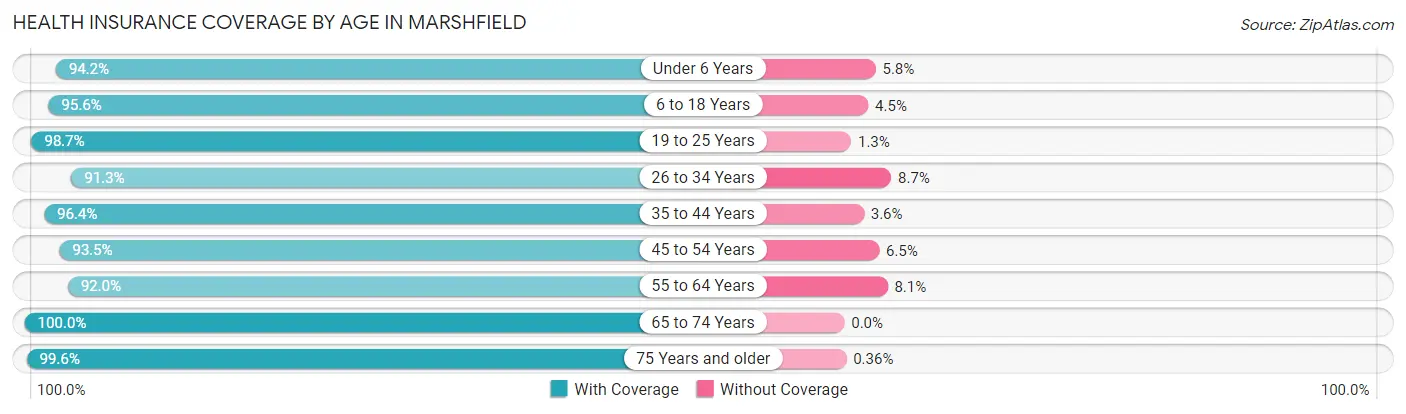
| Age Bracket | With Coverage | Without Coverage |
| Under 6 Years | 986 (94.2%) | 61 (5.8%) |
| 6 to 18 Years | 2,769 (95.6%) | 129 (4.4%) |
| 19 to 25 Years | 1,332 (98.7%) | 17 (1.3%) |
| 26 to 34 Years | 1,979 (91.3%) | 189 (8.7%) |
| 35 to 44 Years | 2,151 (96.4%) | 81 (3.6%) |
| 45 to 54 Years | 2,123 (93.5%) | 147 (6.5%) |
| 55 to 64 Years | 2,283 (91.9%) | 200 (8.1%) |
| 65 to 74 Years | 2,172 (100.0%) | 0 (0.0%) |
| 75 Years and older | 1,951 (99.6%) | 7 (0.4%) |
| Total | 17,746 (95.5%) | 831 (4.5%) |
Health Insurance Coverage by Citizenship Status in Marshfield
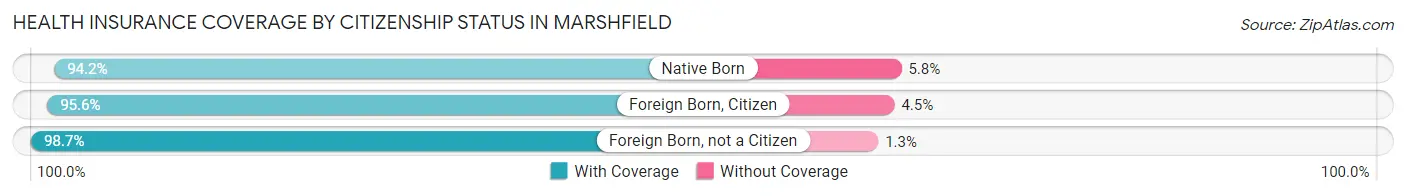
| Citizenship Status | With Coverage | Without Coverage |
| Native Born | 986 (94.2%) | 61 (5.8%) |
| Foreign Born, Citizen | 2,769 (95.6%) | 129 (4.4%) |
| Foreign Born, not a Citizen | 1,332 (98.7%) | 17 (1.3%) |
Health Insurance Coverage by Household Income in Marshfield
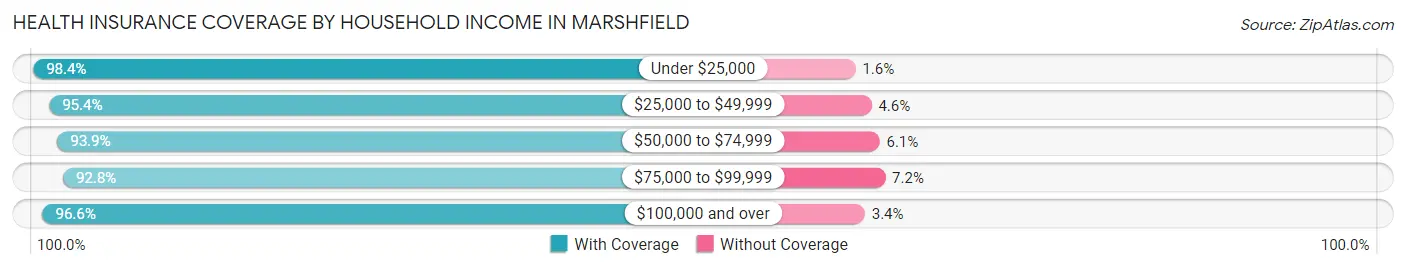
| Household Income | With Coverage | Without Coverage |
| Under $25,000 | 2,246 (98.4%) | 37 (1.6%) |
| $25,000 to $49,999 | 3,348 (95.4%) | 162 (4.6%) |
| $50,000 to $74,999 | 3,858 (93.9%) | 252 (6.1%) |
| $75,000 to $99,999 | 2,296 (92.8%) | 178 (7.2%) |
| $100,000 and over | 5,793 (96.6%) | 202 (3.4%) |
Public vs Private Health Insurance Coverage by Age in Marshfield
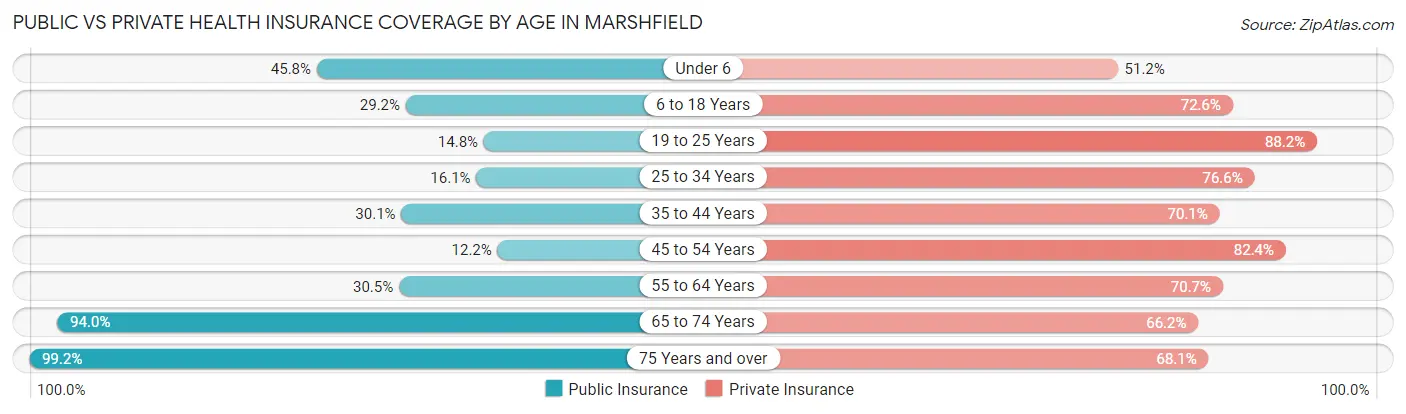
| Age Bracket | Public Insurance | Private Insurance |
| Under 6 | 479 (45.8%) | 536 (51.2%) |
| 6 to 18 Years | 847 (29.2%) | 2,103 (72.6%) |
| 19 to 25 Years | 199 (14.7%) | 1,190 (88.2%) |
| 25 to 34 Years | 350 (16.1%) | 1,661 (76.6%) |
| 35 to 44 Years | 671 (30.1%) | 1,565 (70.1%) |
| 45 to 54 Years | 277 (12.2%) | 1,871 (82.4%) |
| 55 to 64 Years | 757 (30.5%) | 1,756 (70.7%) |
| 65 to 74 Years | 2,041 (94.0%) | 1,437 (66.2%) |
| 75 Years and over | 1,942 (99.2%) | 1,333 (68.1%) |
| Total | 7,563 (40.7%) | 13,452 (72.4%) |
Disability Status by Sex by Age in Marshfield
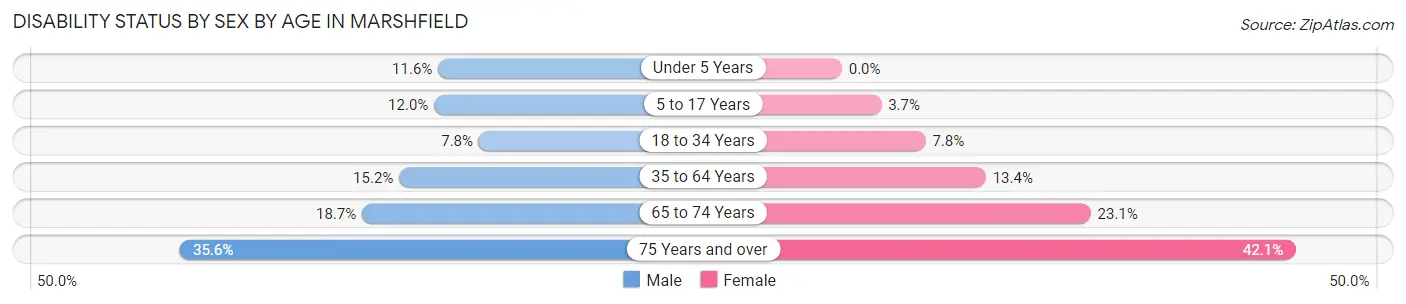
| Age Bracket | Male | Female |
| Under 5 Years | 53 (11.6%) | 0 (0.0%) |
| 5 to 17 Years | 156 (12.0%) | 49 (3.7%) |
| 18 to 34 Years | 167 (7.8%) | 137 (7.8%) |
| 35 to 64 Years | 508 (15.2%) | 488 (13.4%) |
| 65 to 74 Years | 210 (18.7%) | 242 (23.1%) |
| 75 Years and over | 233 (35.6%) | 548 (42.1%) |
Disability Class by Sex by Age in Marshfield
Disability Class: Hearing Difficulty
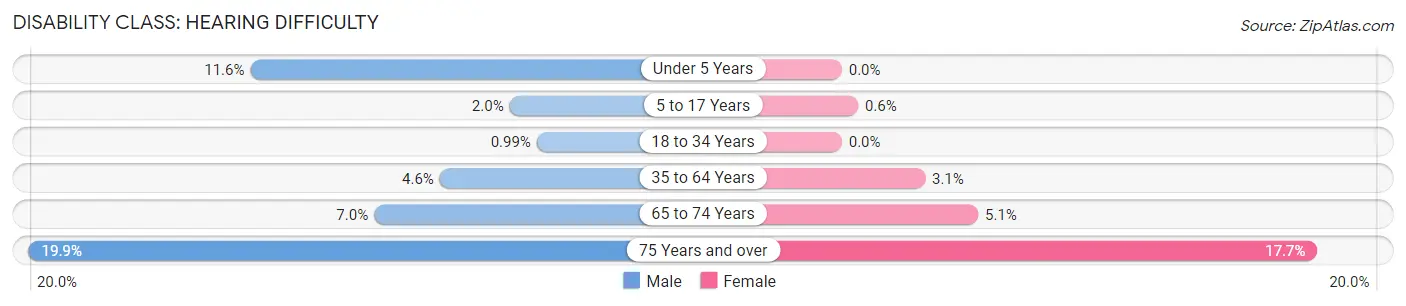
| Age Bracket | Male | Female |
| Under 5 Years | 53 (11.6%) | 0 (0.0%) |
| 5 to 17 Years | 26 (2.0%) | 8 (0.6%) |
| 18 to 34 Years | 21 (1.0%) | 0 (0.0%) |
| 35 to 64 Years | 153 (4.6%) | 113 (3.1%) |
| 65 to 74 Years | 79 (7.0%) | 53 (5.1%) |
| 75 Years and over | 130 (19.9%) | 230 (17.6%) |
Disability Class: Vision Difficulty
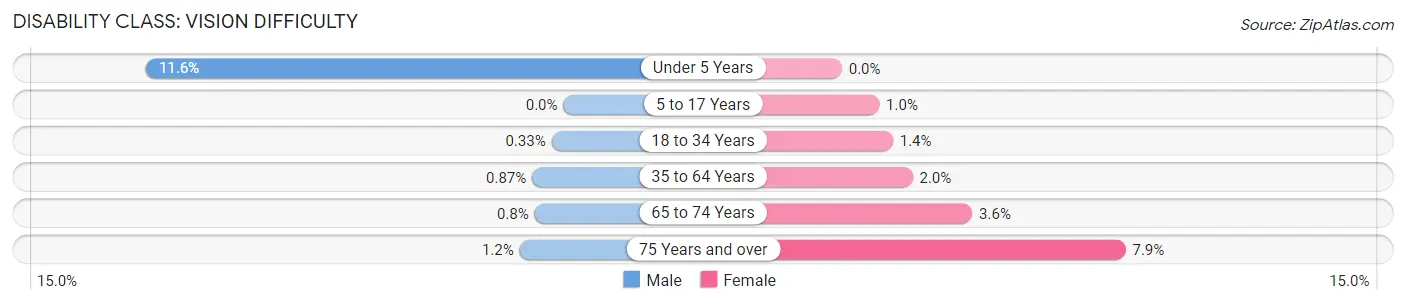
| Age Bracket | Male | Female |
| Under 5 Years | 53 (11.6%) | 0 (0.0%) |
| 5 to 17 Years | 0 (0.0%) | 14 (1.0%) |
| 18 to 34 Years | 7 (0.3%) | 25 (1.4%) |
| 35 to 64 Years | 29 (0.9%) | 72 (2.0%) |
| 65 to 74 Years | 9 (0.8%) | 38 (3.6%) |
| 75 Years and over | 8 (1.2%) | 103 (7.9%) |
Disability Class: Cognitive Difficulty
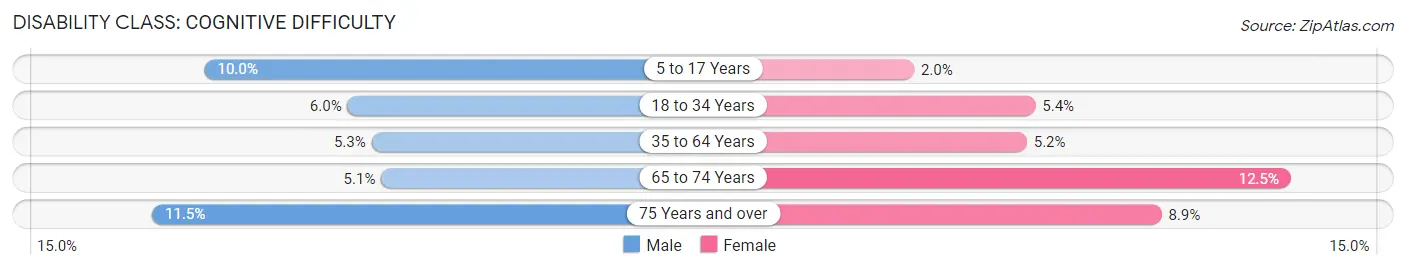
| Age Bracket | Male | Female |
| 5 to 17 Years | 130 (10.0%) | 27 (2.0%) |
| 18 to 34 Years | 128 (6.0%) | 95 (5.4%) |
| 35 to 64 Years | 178 (5.3%) | 188 (5.1%) |
| 65 to 74 Years | 57 (5.1%) | 131 (12.5%) |
| 75 Years and over | 75 (11.5%) | 116 (8.9%) |
Disability Class: Ambulatory Difficulty
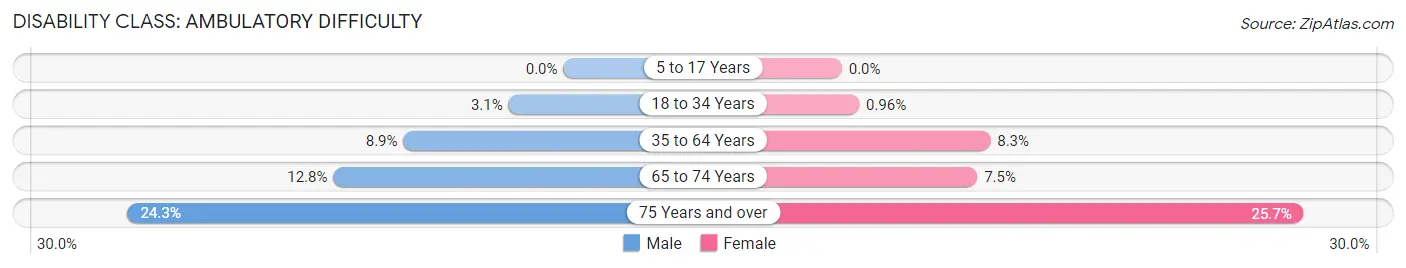
| Age Bracket | Male | Female |
| 5 to 17 Years | 0 (0.0%) | 0 (0.0%) |
| 18 to 34 Years | 65 (3.0%) | 17 (1.0%) |
| 35 to 64 Years | 297 (8.9%) | 302 (8.3%) |
| 65 to 74 Years | 144 (12.8%) | 79 (7.5%) |
| 75 Years and over | 159 (24.3%) | 335 (25.7%) |
Disability Class: Self-Care Difficulty
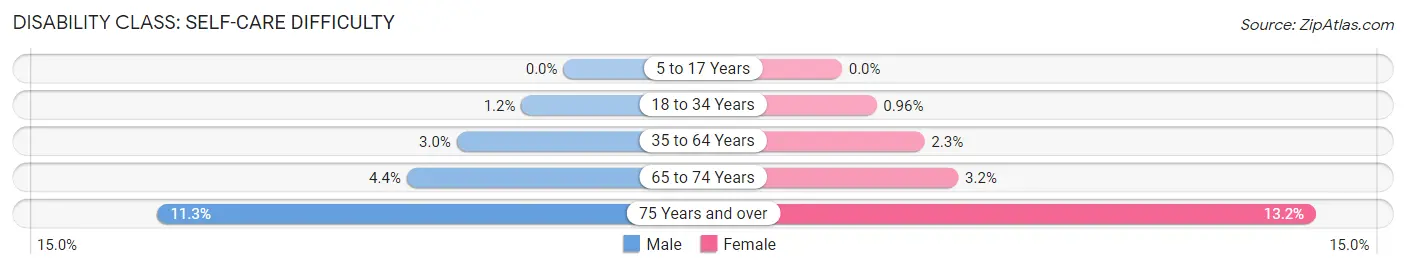
| Age Bracket | Male | Female |
| 5 to 17 Years | 0 (0.0%) | 0 (0.0%) |
| 18 to 34 Years | 25 (1.2%) | 17 (1.0%) |
| 35 to 64 Years | 99 (3.0%) | 84 (2.3%) |
| 65 to 74 Years | 49 (4.4%) | 34 (3.2%) |
| 75 Years and over | 74 (11.3%) | 172 (13.2%) |
Technology Access in Marshfield
Computing Device Access in Marshfield
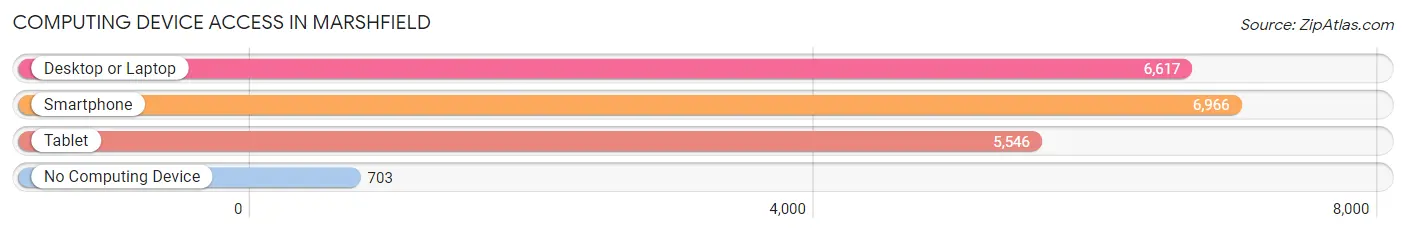
| Device Type | # Households | % Households |
| Desktop or Laptop | 6,617 | 75.1% |
| Smartphone | 6,966 | 79.1% |
| Tablet | 5,546 | 63.0% |
| No Computing Device | 703 | 8.0% |
| Total | 8,807 | 100.0% |
Internet Access in Marshfield
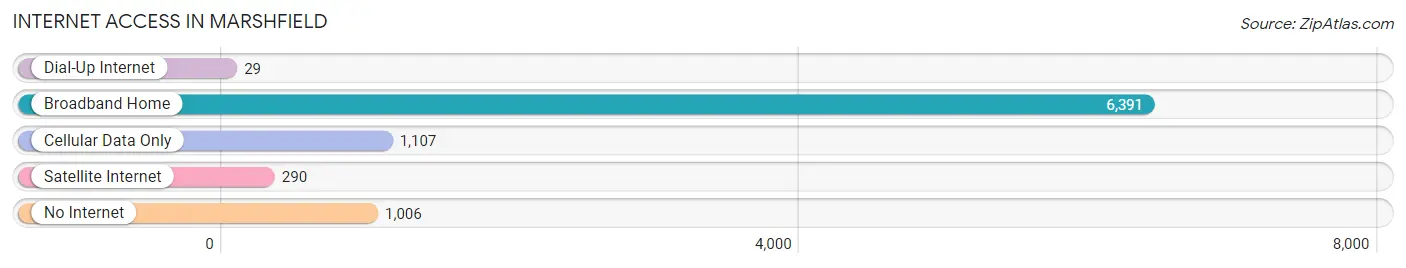
| Internet Type | # Households | % Households |
| Dial-Up Internet | 29 | 0.3% |
| Broadband Home | 6,391 | 72.6% |
| Cellular Data Only | 1,107 | 12.6% |
| Satellite Internet | 290 | 3.3% |
| No Internet | 1,006 | 11.4% |
| Total | 8,807 | 100.0% |
Marshfield Summary
Marshfield, Wisconsin is a city located in Wood County, Wisconsin, United States. It is the county seat of Wood County and is located in the central part of the state. The city is situated on the Wisconsin River and is home to a population of 19,118 people as of the 2010 census.
History
Marshfield was first settled in 1856 by a group of settlers from Marshfield, Massachusetts. The city was named after the Massachusetts town, and was incorporated in 1872. The city was originally a lumber town, and the lumber industry was the main source of income for the city until the early 20th century. The city was also home to a number of other industries, including a brickyard, a tannery, and a furniture factory.
In the early 20th century, Marshfield began to transition away from its industrial roots and become a more modern city. The city was home to a number of educational institutions, including the Marshfield Normal School, which was established in 1906 and later became the University of Wisconsin-Marshfield/Wood County. The city also became a center for health care, with the Marshfield Clinic being established in 1916.
Geography
Marshfield is located in central Wisconsin, in Wood County. The city is situated on the Wisconsin River, and is surrounded by a number of small lakes and rivers. The city is located approximately 80 miles north of Madison, Wisconsin, and is about 40 miles south of Wausau, Wisconsin.
The city has a total area of 8.7 square miles, of which 8.3 square miles is land and 0.4 square miles is water. The city is located in a hilly region, and the highest point in the city is located at an elevation of 1,092 feet.
Economy
Marshfield’s economy is largely based on the health care industry, with the Marshfield Clinic being the largest employer in the city. The city is also home to a number of other industries, including manufacturing, retail, and tourism.
The city is home to a number of educational institutions, including the University of Wisconsin-Marshfield/Wood County, which offers a variety of degree programs. The city is also home to a number of other educational institutions, including a technical college and a number of private schools.
Demographics
As of the 2010 census, Marshfield had a population of 19,118 people. The racial makeup of the city was 95.2% White, 0.7% African American, 0.4% Native American, 1.2% Asian, 0.1% Pacific Islander, 1.2% from other races, and 1.2% from two or more races. Hispanic or Latino of any race were 3.2% of the population.
The median household income in Marshfield was $45,945, and the median family income was $54,945. The per capita income for the city was $22,845. About 8.2% of families and 11.2% of the population were below the poverty line, including 15.2% of those under age 18 and 8.2% of those age 65 or over.
Common Questions
What is Per Capita Income in Marshfield?
Per Capita income in Marshfield is $39,212.
What is the Median Family Income in Marshfield?
Median Family Income in Marshfield is $72,270.
What is the Median Household income in Marshfield?
Median Household Income in Marshfield is $58,474.
What is Income or Wage Gap in Marshfield?
Income or Wage Gap in Marshfield is 21.4%.
Women in Marshfield earn 78.6 cents for every dollar earned by a man.
What is Family Income Deficit in Marshfield?
Family Income Deficit in Marshfield is $10,037.
Families that are below poverty line in Marshfield earn $10,037 less on average than the poverty threshold level.
What is Inequality or Gini Index in Marshfield?
Inequality or Gini Index in Marshfield is 0.49.
What is the Total Population of Marshfield?
Total Population of Marshfield is 18,795.
What is the Total Male Population of Marshfield?
Total Male Population of Marshfield is 9,105.
What is the Total Female Population of Marshfield?
Total Female Population of Marshfield is 9,690.
What is the Ratio of Males per 100 Females in Marshfield?
There are 93.96 Males per 100 Females in Marshfield.
What is the Ratio of Females per 100 Males in Marshfield?
There are 106.43 Females per 100 Males in Marshfield.
What is the Median Population Age in Marshfield?
Median Population Age in Marshfield is 43.7 Years.
What is the Average Family Size in Marshfield
Average Family Size in Marshfield is 2.7 People.
What is the Average Household Size in Marshfield
Average Household Size in Marshfield is 2.1 People.
How Large is the Labor Force in Marshfield?
There are 9,374 People in the Labor Forcein in Marshfield.
What is the Percentage of People in the Labor Force in Marshfield?
60.3% of People are in the Labor Force in Marshfield.
What is the Unemployment Rate in Marshfield?
Unemployment Rate in Marshfield is 3.0%.