Marinette, WI Map & Demographics
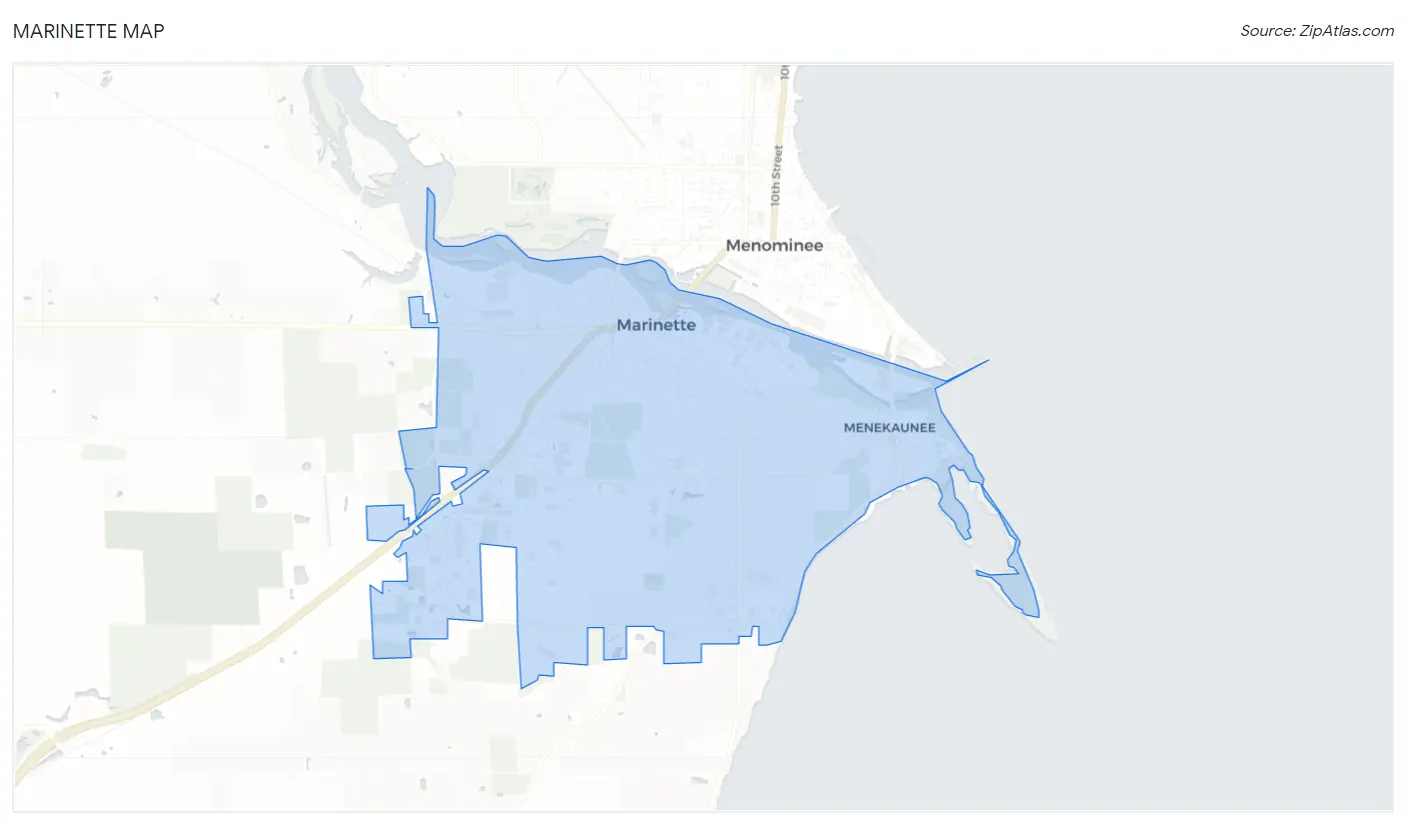
Marinette Map
Marinette Overview
$32,510
PER CAPITA INCOME
$71,957
AVG FAMILY INCOME
$54,969
AVG HOUSEHOLD INCOME
42.9%
WAGE / INCOME GAP [ % ]
57.1¢/ $1
WAGE / INCOME GAP [ $ ]
0.42
INEQUALITY / GINI INDEX
11,065
TOTAL POPULATION
5,820
MALE POPULATION
5,245
FEMALE POPULATION
110.96
MALES / 100 FEMALES
90.12
FEMALES / 100 MALES
41.1
MEDIAN AGE
2.8
AVG FAMILY SIZE
2.1
AVG HOUSEHOLD SIZE
5,618
LABOR FORCE [ PEOPLE ]
62.2%
PERCENT IN LABOR FORCE
3.4%
UNEMPLOYMENT RATE
Marinette Zip Codes
Marinette Area Codes
Income in Marinette
Income Overview in Marinette
Per Capita Income in Marinette is $32,510, while median incomes of families and households are $71,957 and $54,969 respectively.
| Characteristic | Number | Measure |
| Per Capita Income | 11,065 | $32,510 |
| Median Family Income | 2,730 | $71,957 |
| Mean Family Income | 2,730 | $87,302 |
| Median Household Income | 5,087 | $54,969 |
| Mean Household Income | 5,087 | $69,338 |
| Income Deficit | 2,730 | $0 |
| Wage / Income Gap (%) | 11,065 | 42.91% |
| Wage / Income Gap ($) | 11,065 | 57.09¢ per $1 |
| Gini / Inequality Index | 11,065 | 0.42 |
Earnings by Sex in Marinette
Average Earnings in Marinette are $40,357, $51,512 for men and $29,406 for women, a difference of 42.9%.
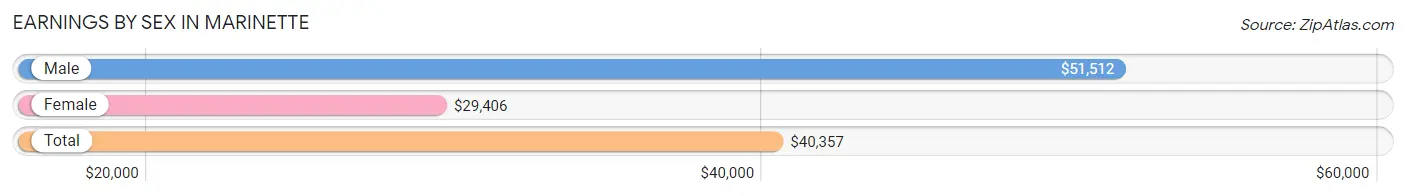
| Sex | Number | Average Earnings |
| Male | 3,416 (58.5%) | $51,512 |
| Female | 2,426 (41.5%) | $29,406 |
| Total | 5,842 (100.0%) | $40,357 |
Earnings by Sex by Income Bracket in Marinette
The most common earnings brackets in Marinette are $65,000 to $74,999 for men (467 | 13.7%) and $2,499 or less for women (285 | 11.7%).
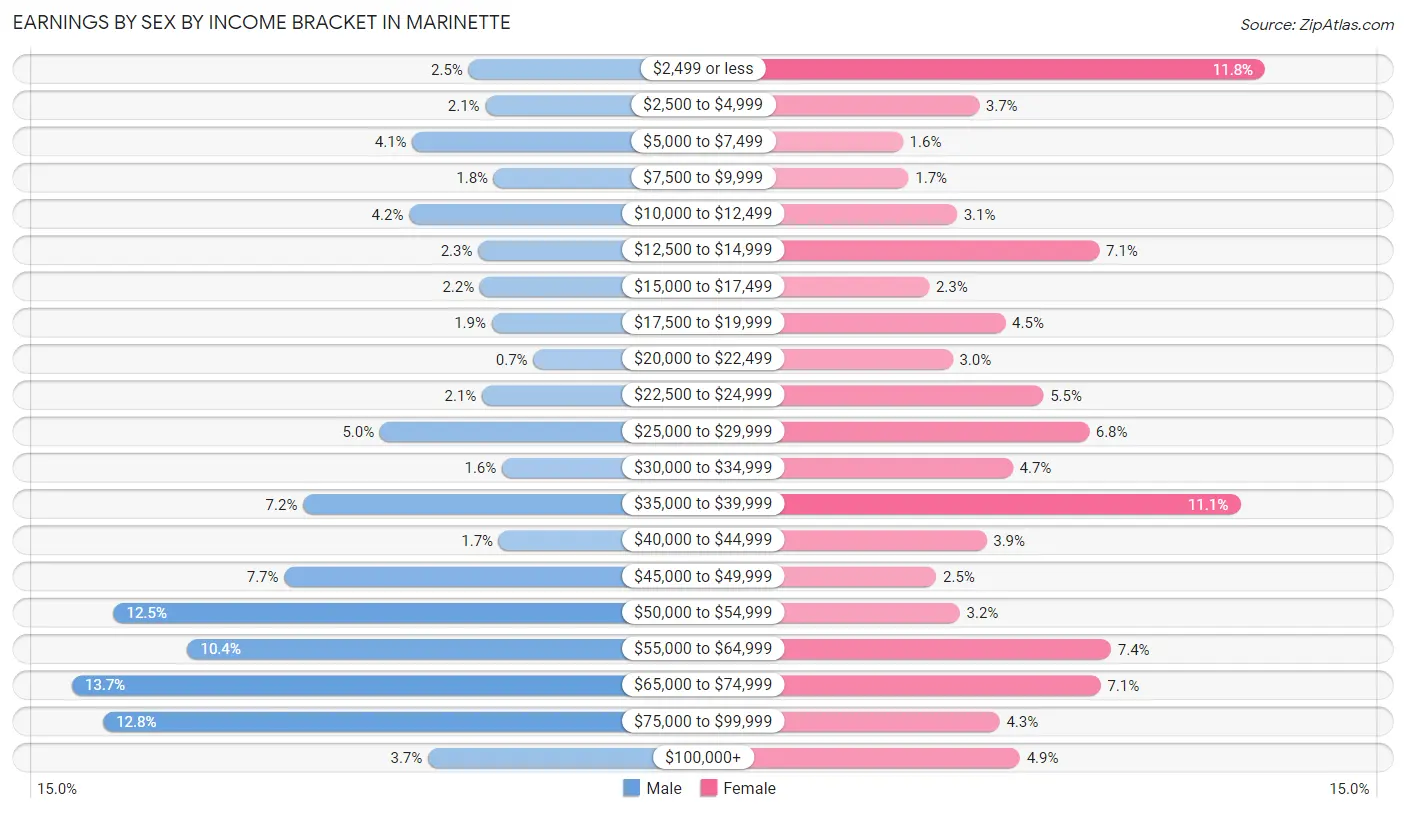
| Income | Male | Female |
| $2,499 or less | 86 (2.5%) | 285 (11.7%) |
| $2,500 to $4,999 | 70 (2.1%) | 90 (3.7%) |
| $5,000 to $7,499 | 140 (4.1%) | 38 (1.6%) |
| $7,500 to $9,999 | 62 (1.8%) | 42 (1.7%) |
| $10,000 to $12,499 | 143 (4.2%) | 75 (3.1%) |
| $12,500 to $14,999 | 77 (2.2%) | 172 (7.1%) |
| $15,000 to $17,499 | 75 (2.2%) | 56 (2.3%) |
| $17,500 to $19,999 | 64 (1.9%) | 108 (4.4%) |
| $20,000 to $22,499 | 24 (0.7%) | 72 (3.0%) |
| $22,500 to $24,999 | 73 (2.1%) | 134 (5.5%) |
| $25,000 to $29,999 | 171 (5.0%) | 165 (6.8%) |
| $30,000 to $34,999 | 54 (1.6%) | 113 (4.7%) |
| $35,000 to $39,999 | 245 (7.2%) | 268 (11.1%) |
| $40,000 to $44,999 | 57 (1.7%) | 95 (3.9%) |
| $45,000 to $49,999 | 263 (7.7%) | 61 (2.5%) |
| $50,000 to $54,999 | 427 (12.5%) | 77 (3.2%) |
| $55,000 to $64,999 | 356 (10.4%) | 180 (7.4%) |
| $65,000 to $74,999 | 467 (13.7%) | 173 (7.1%) |
| $75,000 to $99,999 | 437 (12.8%) | 104 (4.3%) |
| $100,000+ | 125 (3.7%) | 118 (4.9%) |
| Total | 3,416 (100.0%) | 2,426 (100.0%) |
Earnings by Sex by Educational Attainment in Marinette
Average earnings in Marinette are $53,788 for men and $34,321 for women, a difference of 36.2%. Men with an educational attainment of graduate degree enjoy the highest average annual earnings of $72,083, while those with less than high school education earn the least with $38,594. Women with an educational attainment of graduate degree earn the most with the average annual earnings of $70,625, while those with high school diploma education have the smallest earnings of $14,796.
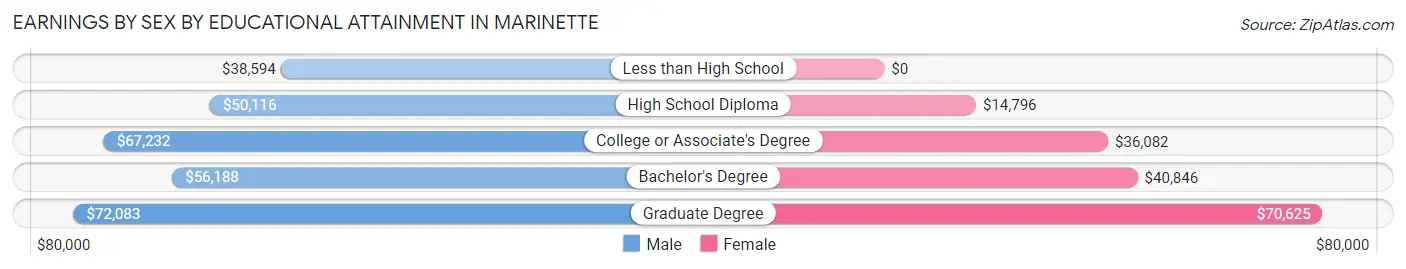
| Educational Attainment | Male Income | Female Income |
| Less than High School | $38,594 | $0 |
| High School Diploma | $50,116 | $14,796 |
| College or Associate's Degree | $67,232 | $36,082 |
| Bachelor's Degree | $56,188 | $40,846 |
| Graduate Degree | $72,083 | $70,625 |
| Total | $53,788 | $34,321 |
Family Income in Marinette
Family Income Brackets in Marinette
According to the Marinette family income data, there are 576 families falling into the $50,000 to $74,999 income range, which is the most common income bracket and makes up 21.1% of all families.
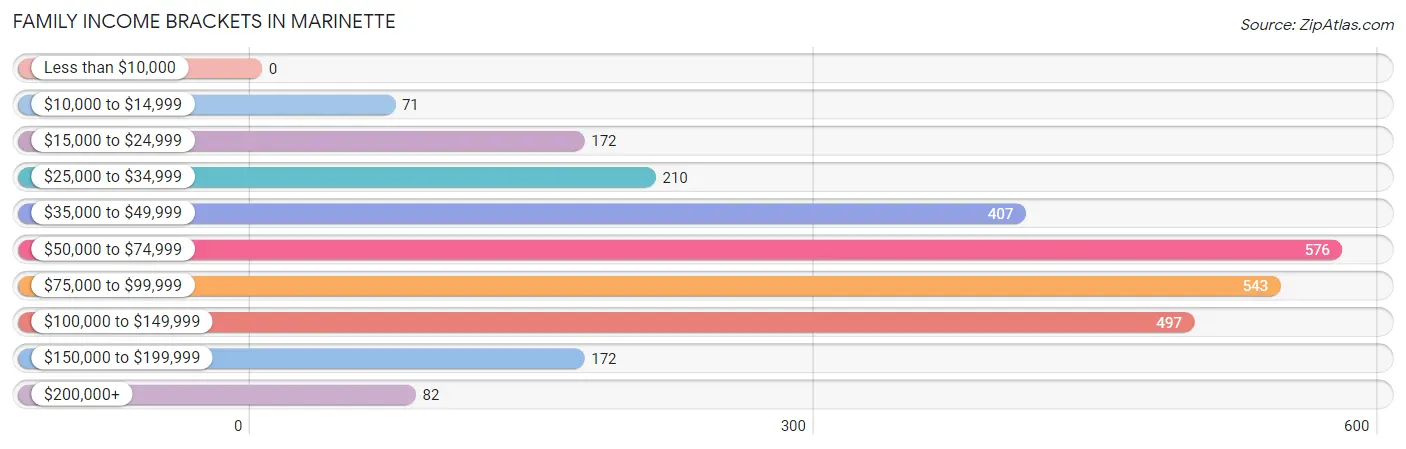
| Income Bracket | # Families | % Families |
| Less than $10,000 | 0 | 0.0% |
| $10,000 to $14,999 | 71 | 2.6% |
| $15,000 to $24,999 | 172 | 6.3% |
| $25,000 to $34,999 | 210 | 7.7% |
| $35,000 to $49,999 | 407 | 14.9% |
| $50,000 to $74,999 | 576 | 21.1% |
| $75,000 to $99,999 | 543 | 19.9% |
| $100,000 to $149,999 | 497 | 18.2% |
| $150,000 to $199,999 | 172 | 6.3% |
| $200,000+ | 82 | 3.0% |
Family Income by Famaliy Size in Marinette
6-person families (34 | 1.3%) account for the highest median family income in Marinette with $92,763 per family, while 2-person families (1,582 | 58.0%) have the highest median income of $35,614 per family member.
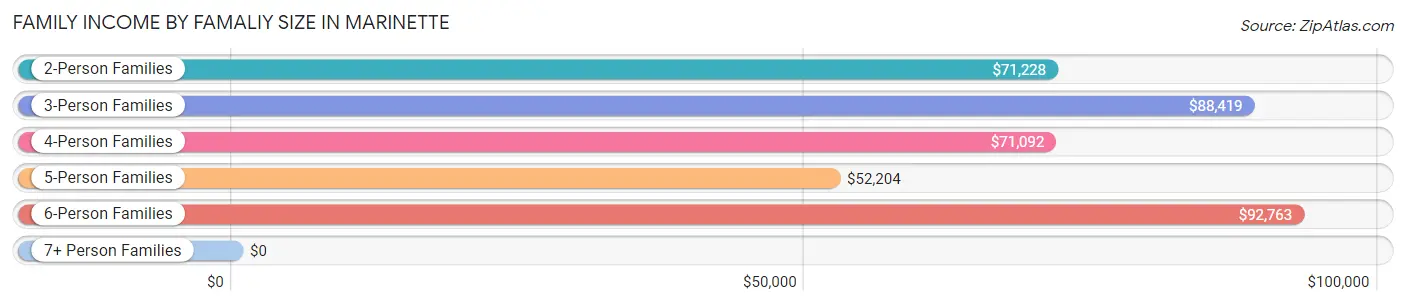
| Income Bracket | # Families | Median Income |
| 2-Person Families | 1,582 (58.0%) | $71,228 |
| 3-Person Families | 464 (17.0%) | $88,419 |
| 4-Person Families | 473 (17.3%) | $71,092 |
| 5-Person Families | 93 (3.4%) | $52,204 |
| 6-Person Families | 34 (1.3%) | $92,763 |
| 7+ Person Families | 84 (3.1%) | $0 |
| Total | 2,730 (100.0%) | $71,957 |
Family Income by Number of Earners in Marinette
The median family income in Marinette is $71,957, with families comprising 3+ earners (331) having the highest median family income of $125,139, while families with no earners (593) have the lowest median family income of $37,352, accounting for 12.1% and 21.7% of families, respectively.
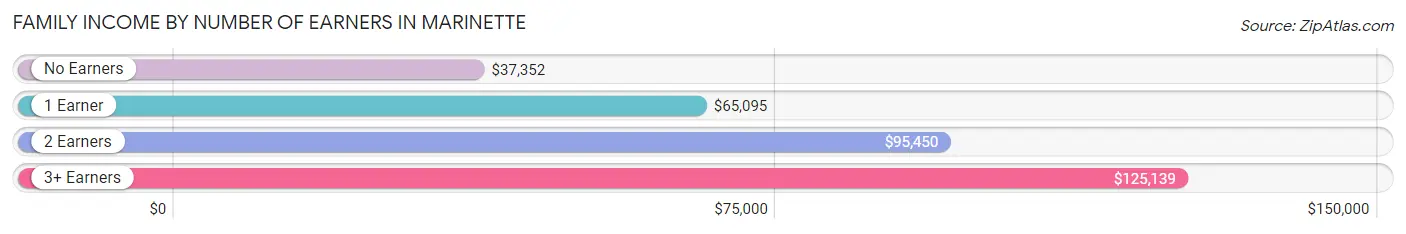
| Number of Earners | # Families | Median Income |
| No Earners | 593 (21.7%) | $37,352 |
| 1 Earner | 895 (32.8%) | $65,095 |
| 2 Earners | 911 (33.4%) | $95,450 |
| 3+ Earners | 331 (12.1%) | $125,139 |
| Total | 2,730 (100.0%) | $71,957 |
Household Income in Marinette
Household Income Brackets in Marinette
With 1,134 households falling in the category, the $50,000 to $74,999 income range is the most frequent in Marinette, accounting for 22.3% of all households. In contrast, only 81 households (1.6%) fall into the $200,000+ income bracket, making it the least populous group.
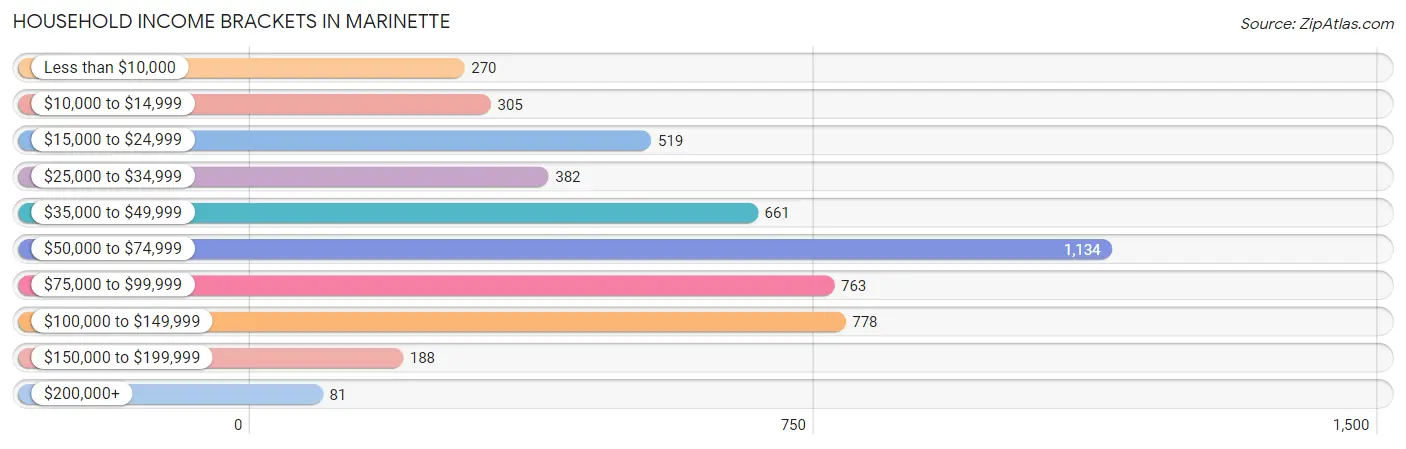
| Income Bracket | # Households | % Households |
| Less than $10,000 | 270 | 5.3% |
| $10,000 to $14,999 | 305 | 6.0% |
| $15,000 to $24,999 | 519 | 10.2% |
| $25,000 to $34,999 | 382 | 7.5% |
| $35,000 to $49,999 | 661 | 13.0% |
| $50,000 to $74,999 | 1,134 | 22.3% |
| $75,000 to $99,999 | 763 | 15.0% |
| $100,000 to $149,999 | 778 | 15.3% |
| $150,000 to $199,999 | 188 | 3.7% |
| $200,000+ | 81 | 1.6% |
Household Income by Householder Age in Marinette
The median household income in Marinette is $54,969, with the highest median household income of $66,855 found in the 25 to 44 years age bracket for the primary householder. A total of 1,604 households (31.5%) fall into this category. Meanwhile, the 15 to 24 years age bracket for the primary householder has the lowest median household income of $0, with 267 households (5.2%) in this group.
| Income Bracket | # Households | Median Income |
| 15 to 24 Years | 267 (5.2%) | $0 |
| 25 to 44 Years | 1,604 (31.5%) | $66,855 |
| 45 to 64 Years | 1,947 (38.3%) | $56,523 |
| 65+ Years | 1,269 (24.9%) | $46,827 |
| Total | 5,087 (100.0%) | $54,969 |
Poverty in Marinette
Income Below Poverty by Sex and Age in Marinette
With 10.5% poverty level for males and 15.1% for females among the residents of Marinette, 6 to 11 year old males and 5 year old females are the most vulnerable to poverty, with 102 males (37.4%) and 52 females (78.8%) in their respective age groups living below the poverty level.
| Age Bracket | Male | Female |
| Under 5 Years | 53 (18.2%) | 83 (23.3%) |
| 5 Years | 0 (0.0%) | 52 (78.8%) |
| 6 to 11 Years | 102 (37.4%) | 13 (6.3%) |
| 12 to 14 Years | 10 (4.0%) | 8 (5.0%) |
| 15 Years | 8 (8.4%) | 0 (0.0%) |
| 16 and 17 Years | 0 (0.0%) | 0 (0.0%) |
| 18 to 24 Years | 26 (5.9%) | 138 (35.1%) |
| 25 to 34 Years | 43 (4.7%) | 49 (7.4%) |
| 35 to 44 Years | 133 (18.6%) | 122 (17.7%) |
| 45 to 54 Years | 53 (8.5%) | 123 (20.5%) |
| 55 to 64 Years | 55 (6.2%) | 122 (15.2%) |
| 65 to 74 Years | 43 (8.7%) | 41 (6.9%) |
| 75 Years and over | 65 (17.2%) | 18 (4.2%) |
| Total | 591 (10.5%) | 769 (15.1%) |
Income Above Poverty by Sex and Age in Marinette
According to the poverty statistics in Marinette, males aged 5 years and females aged 15 years are the age groups that are most secure financially, with 100.0% of males and 100.0% of females in these age groups living above the poverty line.
| Age Bracket | Male | Female |
| Under 5 Years | 238 (81.8%) | 274 (76.7%) |
| 5 Years | 184 (100.0%) | 14 (21.2%) |
| 6 to 11 Years | 171 (62.6%) | 192 (93.7%) |
| 12 to 14 Years | 239 (96.0%) | 151 (95.0%) |
| 15 Years | 87 (91.6%) | 18 (100.0%) |
| 16 and 17 Years | 54 (100.0%) | 107 (100.0%) |
| 18 to 24 Years | 417 (94.1%) | 255 (64.9%) |
| 25 to 34 Years | 874 (95.3%) | 617 (92.6%) |
| 35 to 44 Years | 583 (81.4%) | 569 (82.3%) |
| 45 to 54 Years | 568 (91.5%) | 477 (79.5%) |
| 55 to 64 Years | 835 (93.8%) | 681 (84.8%) |
| 65 to 74 Years | 453 (91.3%) | 554 (93.1%) |
| 75 Years and over | 313 (82.8%) | 414 (95.8%) |
| Total | 5,016 (89.5%) | 4,323 (84.9%) |
Income Below Poverty Among Married-Couple Families in Marinette
The poverty statistics for married-couple families in Marinette show that 2.0% or 38 of the total 1,910 families live below the poverty line. Families with 3 or 4 children have the highest poverty rate of 16.8%, comprising of 20 families. On the other hand, families with 1 or 2 children have the lowest poverty rate of 0.0%, which includes 0 families.
| Children | Above Poverty | Below Poverty |
| No Children | 1,322 (98.7%) | 18 (1.3%) |
| 1 or 2 Children | 387 (100.0%) | 0 (0.0%) |
| 3 or 4 Children | 99 (83.2%) | 20 (16.8%) |
| 5 or more Children | 64 (100.0%) | 0 (0.0%) |
| Total | 1,872 (98.0%) | 38 (2.0%) |
Income Below Poverty Among Single-Parent Households in Marinette
According to the poverty data in Marinette, 3.2% or 11 single-father households and 24.5% or 116 single-mother households are living below the poverty line. Among single-father households, those with 3 or 4 children have the highest poverty rate, with 11 households (24.4%) experiencing poverty. Likewise, among single-mother households, those with 3 or 4 children have the highest poverty rate, with 53 households (84.1%) falling below the poverty line.
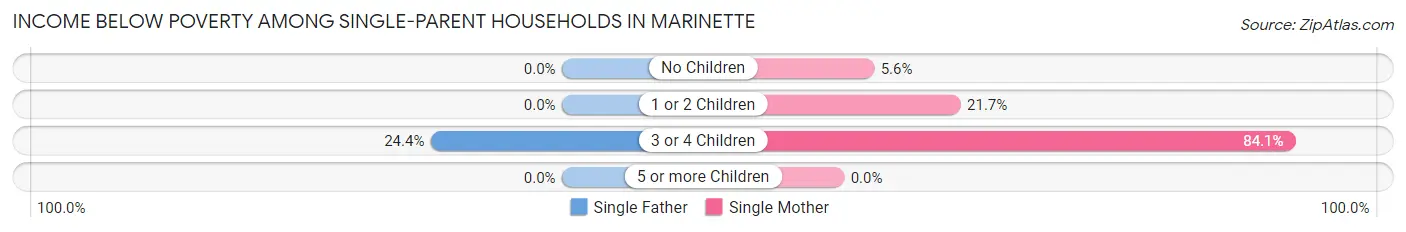
| Children | Single Father | Single Mother |
| No Children | 0 (0.0%) | 9 (5.6%) |
| 1 or 2 Children | 0 (0.0%) | 54 (21.7%) |
| 3 or 4 Children | 11 (24.4%) | 53 (84.1%) |
| 5 or more Children | 0 (0.0%) | 0 (0.0%) |
| Total | 11 (3.2%) | 116 (24.5%) |
Income Below Poverty Among Married-Couple vs Single-Parent Households in Marinette
The poverty data for Marinette shows that 38 of the married-couple family households (2.0%) and 127 of the single-parent households (15.5%) are living below the poverty level. Within the married-couple family households, those with 3 or 4 children have the highest poverty rate, with 20 households (16.8%) falling below the poverty line. Among the single-parent households, those with 3 or 4 children have the highest poverty rate, with 64 household (59.3%) living below poverty.
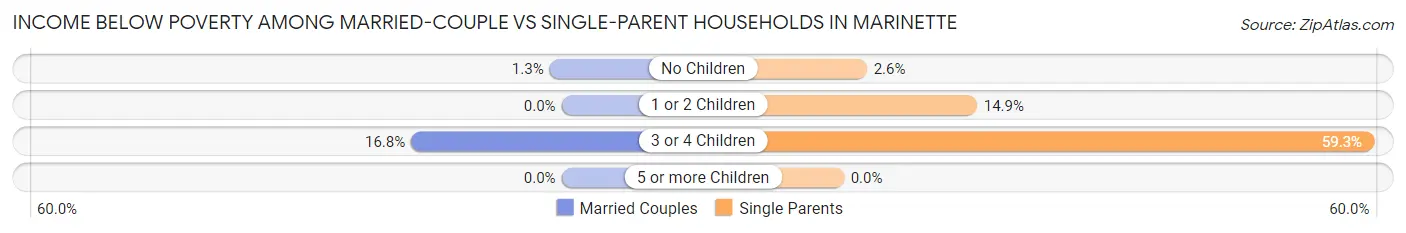
| Children | Married-Couple Families | Single-Parent Households |
| No Children | 18 (1.3%) | 9 (2.6%) |
| 1 or 2 Children | 0 (0.0%) | 54 (14.9%) |
| 3 or 4 Children | 20 (16.8%) | 64 (59.3%) |
| 5 or more Children | 0 (0.0%) | 0 (0.0%) |
| Total | 38 (2.0%) | 127 (15.5%) |
Race in Marinette
The most populous races in Marinette are White / Caucasian (10,518 | 95.1%), Two or more Races (376 | 3.4%), and Hispanic or Latino (300 | 2.7%).
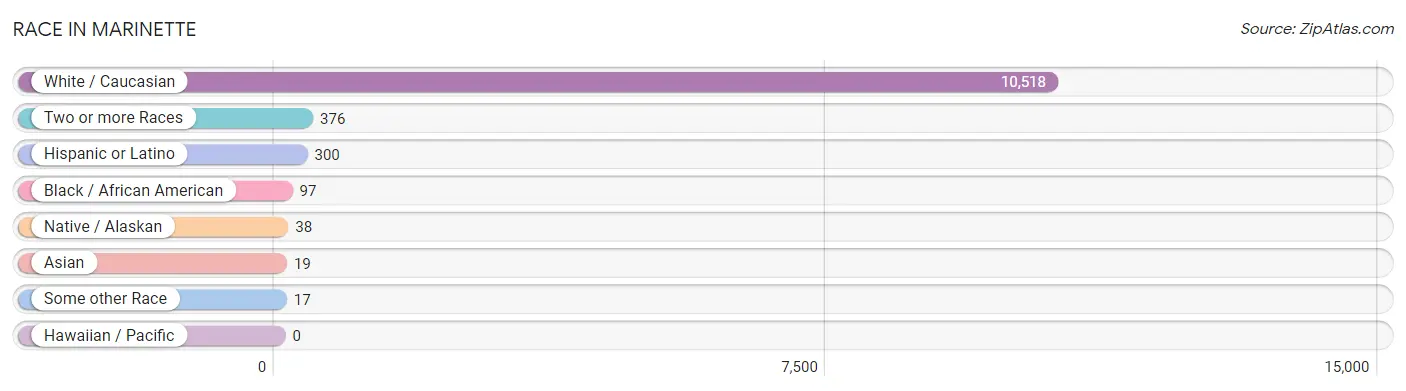
| Race | # Population | % Population |
| Asian | 19 | 0.2% |
| Black / African American | 97 | 0.9% |
| Hawaiian / Pacific | 0 | 0.0% |
| Hispanic or Latino | 300 | 2.7% |
| Native / Alaskan | 38 | 0.3% |
| White / Caucasian | 10,518 | 95.1% |
| Two or more Races | 376 | 3.4% |
| Some other Race | 17 | 0.2% |
| Total | 11,065 | 100.0% |
Ancestry in Marinette
The most populous ancestries reported in Marinette are German (3,621 | 32.7%), Polish (1,269 | 11.5%), Irish (865 | 7.8%), Swedish (742 | 6.7%), and American (735 | 6.6%), together accounting for 65.4% of all Marinette residents.
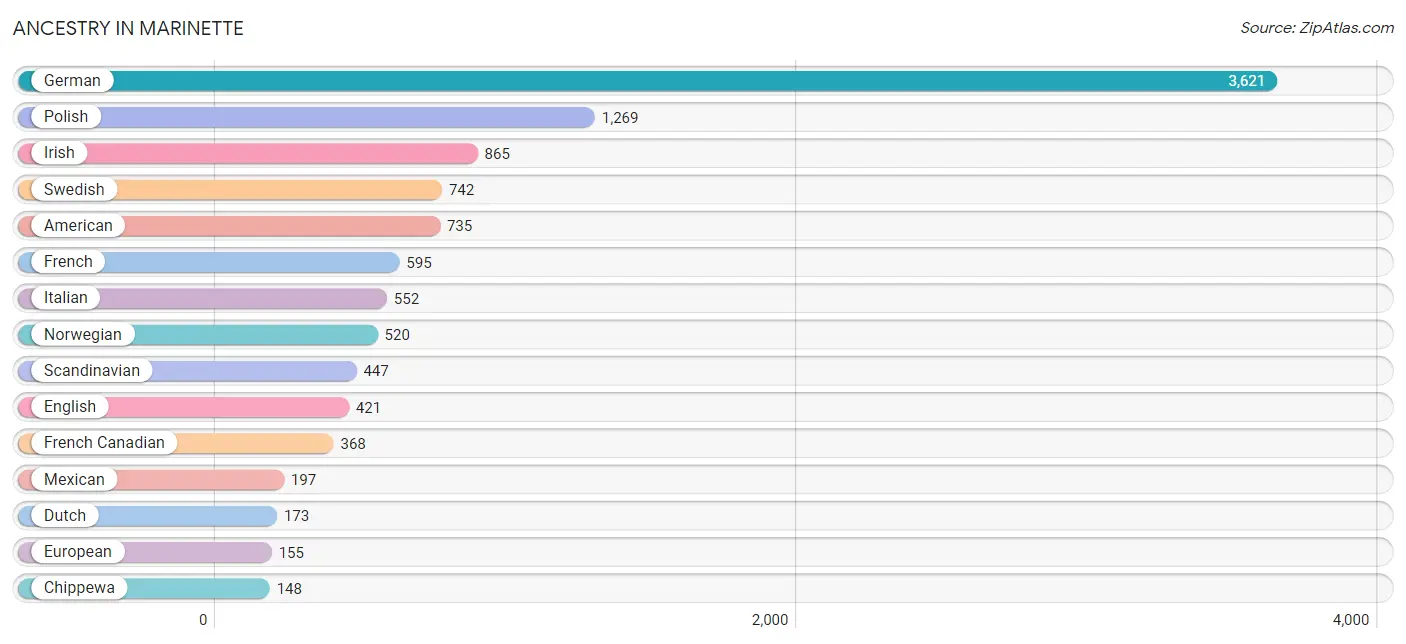
| Ancestry | # Population | % Population |
| American | 735 | 6.6% |
| Arab | 85 | 0.8% |
| Austrian | 83 | 0.7% |
| Belgian | 23 | 0.2% |
| Bhutanese | 10 | 0.1% |
| British | 18 | 0.2% |
| Canadian | 16 | 0.1% |
| Chippewa | 148 | 1.3% |
| Czech | 134 | 1.2% |
| Czechoslovakian | 23 | 0.2% |
| Danish | 85 | 0.8% |
| Dutch | 173 | 1.6% |
| Egyptian | 74 | 0.7% |
| English | 421 | 3.8% |
| European | 155 | 1.4% |
| Finnish | 86 | 0.8% |
| French | 595 | 5.4% |
| French Canadian | 368 | 3.3% |
| German | 3,621 | 32.7% |
| Hungarian | 25 | 0.2% |
| Icelander | 1 | 0.0% |
| Iranian | 12 | 0.1% |
| Irish | 865 | 7.8% |
| Iroquois | 13 | 0.1% |
| Italian | 552 | 5.0% |
| Korean | 19 | 0.2% |
| Lithuanian | 26 | 0.2% |
| Menominee | 7 | 0.1% |
| Mexican | 197 | 1.8% |
| Navajo | 30 | 0.3% |
| Nigerian | 38 | 0.3% |
| Norwegian | 520 | 4.7% |
| Palestinian | 11 | 0.1% |
| Polish | 1,269 | 11.5% |
| Portuguese | 18 | 0.2% |
| Puerto Rican | 50 | 0.4% |
| Russian | 96 | 0.9% |
| Scandinavian | 447 | 4.0% |
| Scotch-Irish | 8 | 0.1% |
| Scottish | 76 | 0.7% |
| Slavic | 26 | 0.2% |
| Slovene | 30 | 0.3% |
| Spaniard | 53 | 0.5% |
| Subsaharan African | 38 | 0.3% |
| Swedish | 742 | 6.7% |
| Swiss | 39 | 0.4% |
| Welsh | 24 | 0.2% | View All 47 Rows |
Immigrants in Marinette
The most numerous immigrant groups reported in Marinette came from Central America (69 | 0.6%), Latin America (69 | 0.6%), Mexico (69 | 0.6%), Europe (53 | 0.5%), and Asia (44 | 0.4%), together accounting for 2.7% of all Marinette residents.
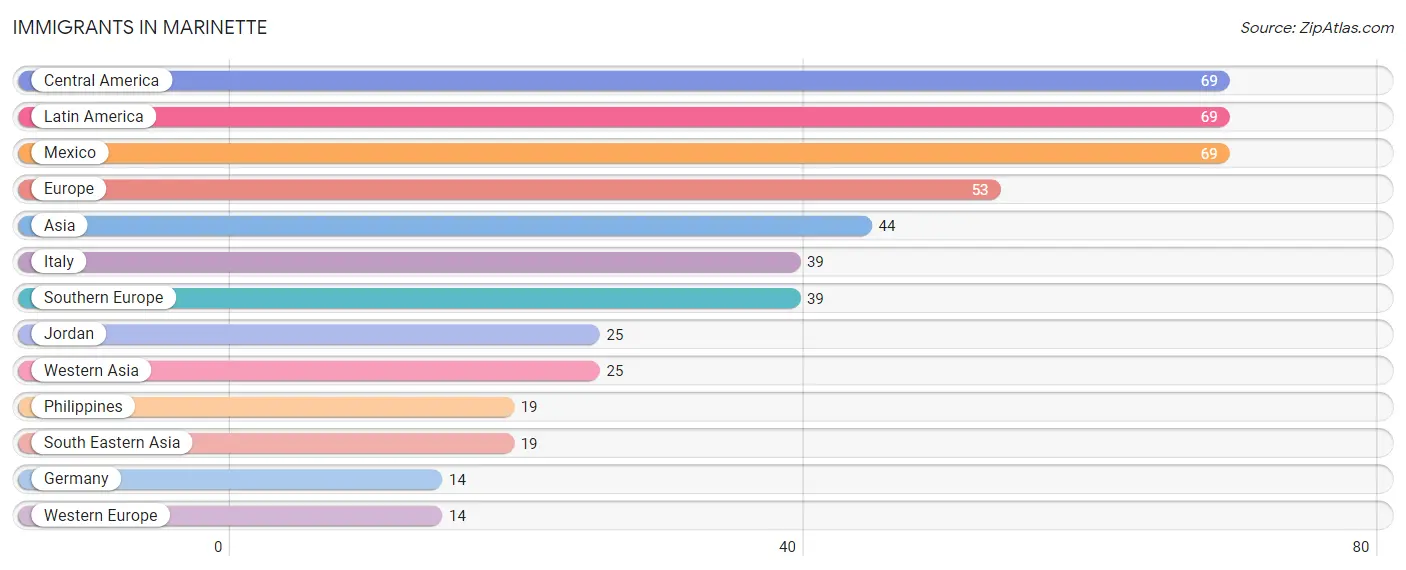
| Immigration Origin | # Population | % Population |
| Asia | 44 | 0.4% |
| Central America | 69 | 0.6% |
| Europe | 53 | 0.5% |
| Germany | 14 | 0.1% |
| Italy | 39 | 0.4% |
| Jordan | 25 | 0.2% |
| Latin America | 69 | 0.6% |
| Mexico | 69 | 0.6% |
| Philippines | 19 | 0.2% |
| South Eastern Asia | 19 | 0.2% |
| Southern Europe | 39 | 0.4% |
| Western Asia | 25 | 0.2% |
| Western Europe | 14 | 0.1% | View All 13 Rows |
Sex and Age in Marinette
Sex and Age in Marinette
The most populous age groups in Marinette are 55 to 59 Years (553 | 9.5%) for men and 25 to 29 Years (463 | 8.8%) for women.
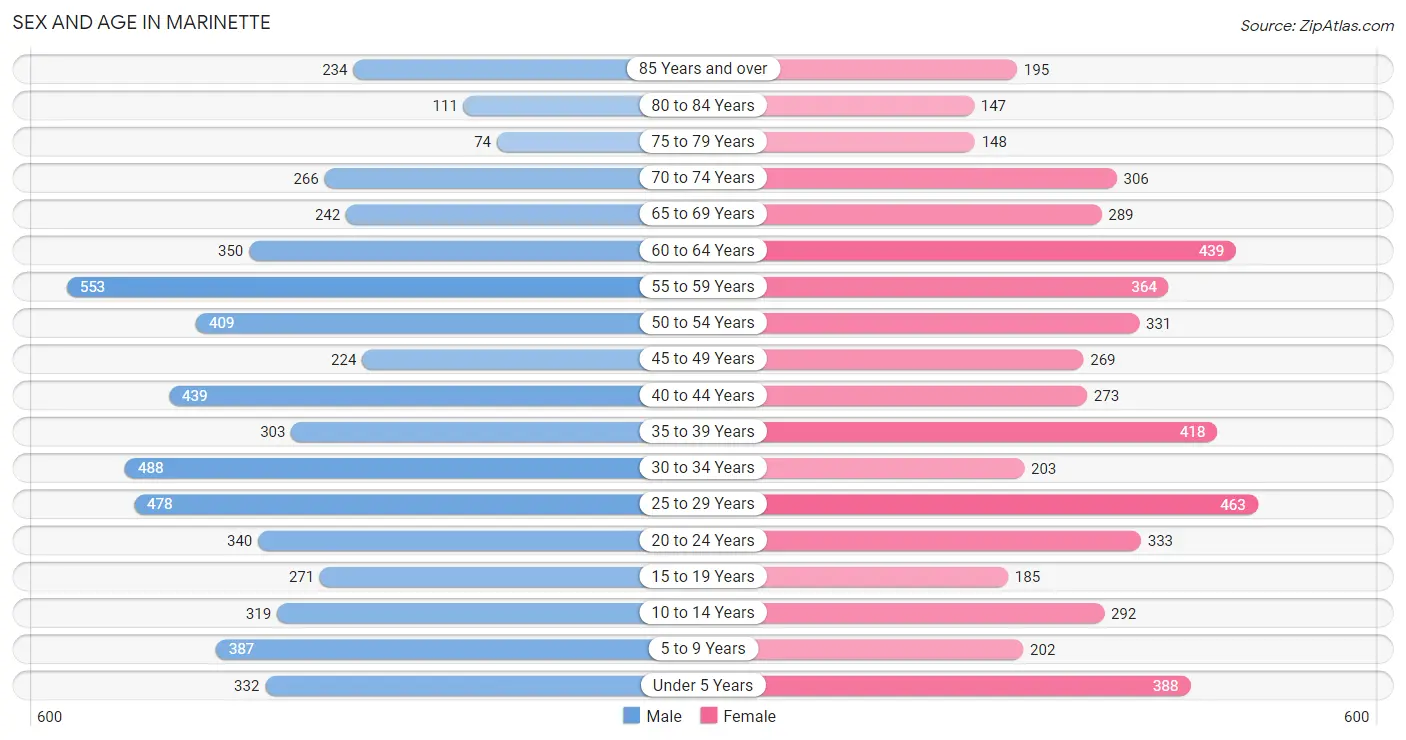
| Age Bracket | Male | Female |
| Under 5 Years | 332 (5.7%) | 388 (7.4%) |
| 5 to 9 Years | 387 (6.7%) | 202 (3.8%) |
| 10 to 14 Years | 319 (5.5%) | 292 (5.6%) |
| 15 to 19 Years | 271 (4.7%) | 185 (3.5%) |
| 20 to 24 Years | 340 (5.8%) | 333 (6.4%) |
| 25 to 29 Years | 478 (8.2%) | 463 (8.8%) |
| 30 to 34 Years | 488 (8.4%) | 203 (3.9%) |
| 35 to 39 Years | 303 (5.2%) | 418 (8.0%) |
| 40 to 44 Years | 439 (7.5%) | 273 (5.2%) |
| 45 to 49 Years | 224 (3.8%) | 269 (5.1%) |
| 50 to 54 Years | 409 (7.0%) | 331 (6.3%) |
| 55 to 59 Years | 553 (9.5%) | 364 (6.9%) |
| 60 to 64 Years | 350 (6.0%) | 439 (8.4%) |
| 65 to 69 Years | 242 (4.2%) | 289 (5.5%) |
| 70 to 74 Years | 266 (4.6%) | 306 (5.8%) |
| 75 to 79 Years | 74 (1.3%) | 148 (2.8%) |
| 80 to 84 Years | 111 (1.9%) | 147 (2.8%) |
| 85 Years and over | 234 (4.0%) | 195 (3.7%) |
| Total | 5,820 (100.0%) | 5,245 (100.0%) |
Families and Households in Marinette
Median Family Size in Marinette
The median family size in Marinette is 2.81 persons per family, with married-couple families (1,910 | 70.0%) accounting for the largest median family size of 2.88 persons per family. On the other hand, single male/father families (347 | 12.7%) represent the smallest median family size with 2.45 persons per family.
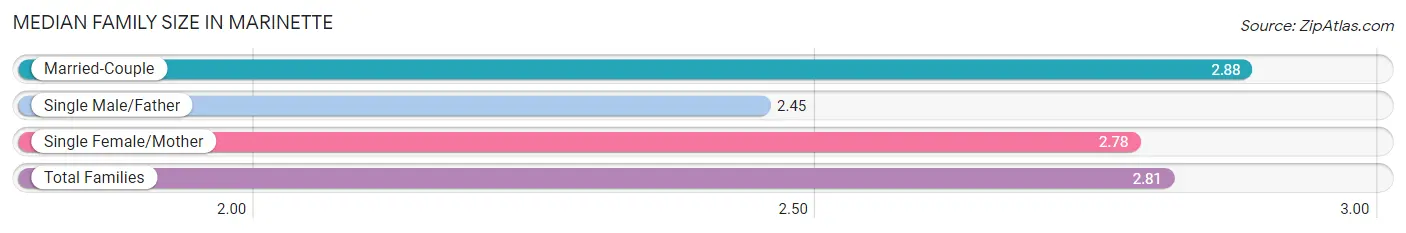
| Family Type | # Families | Family Size |
| Married-Couple | 1,910 (70.0%) | 2.88 |
| Single Male/Father | 347 (12.7%) | 2.45 |
| Single Female/Mother | 473 (17.3%) | 2.78 |
| Total Families | 2,730 (100.0%) | 2.81 |
Median Household Size in Marinette
The median household size in Marinette is 2.12 persons per household, with single female/mother households (473 | 9.3%) accounting for the largest median household size of 3.1 persons per household. non-family households (2,357 | 46.3%) represent the smallest median household size with 1.15 persons per household.
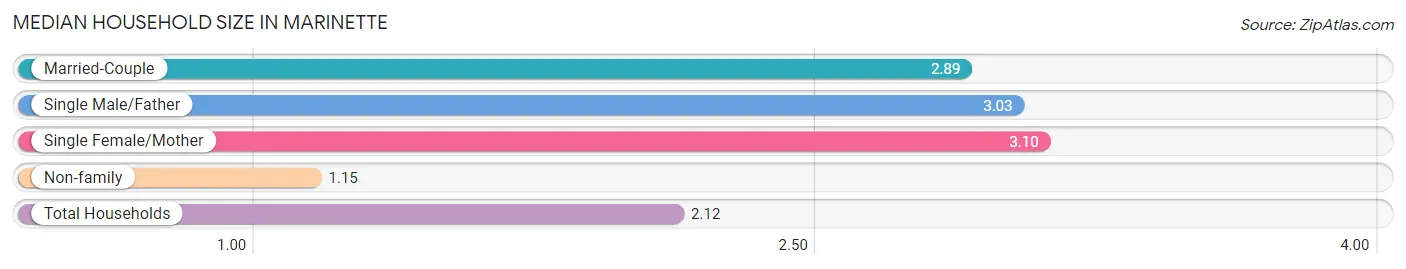
| Household Type | # Households | Household Size |
| Married-Couple | 1,910 (37.6%) | 2.89 |
| Single Male/Father | 347 (6.8%) | 3.03 |
| Single Female/Mother | 473 (9.3%) | 3.10 |
| Non-family | 2,357 (46.3%) | 1.15 |
| Total Households | 5,087 (100.0%) | 2.12 |
Household Size by Marriage Status in Marinette
Out of a total of 5,087 households in Marinette, 2,730 (53.7%) are family households, while 2,357 (46.3%) are nonfamily households. The most numerous type of family households are 2-person households, comprising 1,386, and the most common type of nonfamily households are 1-person households, comprising 2,041.
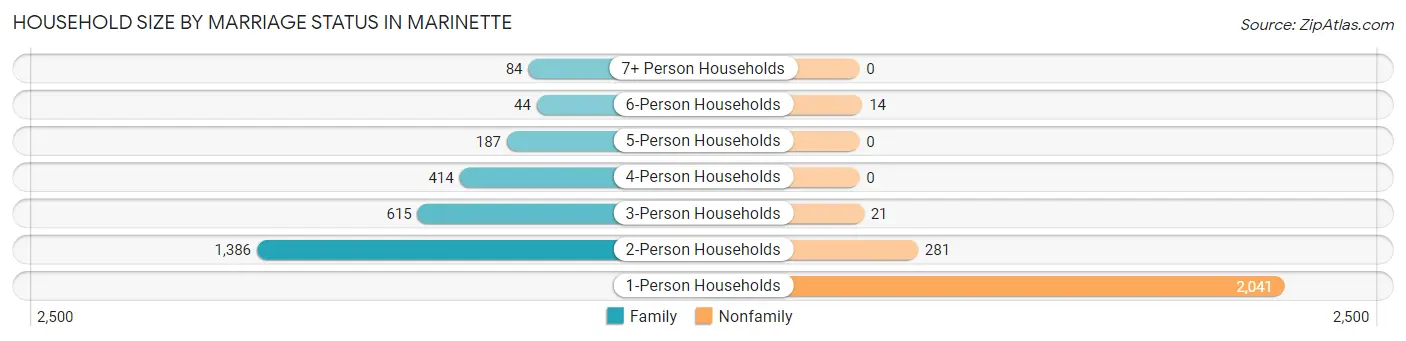
| Household Size | Family Households | Nonfamily Households |
| 1-Person Households | - | 2,041 (40.1%) |
| 2-Person Households | 1,386 (27.3%) | 281 (5.5%) |
| 3-Person Households | 615 (12.1%) | 21 (0.4%) |
| 4-Person Households | 414 (8.1%) | 0 (0.0%) |
| 5-Person Households | 187 (3.7%) | 0 (0.0%) |
| 6-Person Households | 44 (0.9%) | 14 (0.3%) |
| 7+ Person Households | 84 (1.7%) | 0 (0.0%) |
| Total | 2,730 (53.7%) | 2,357 (46.3%) |
Female Fertility in Marinette
Fertility by Age in Marinette
Average fertility rate in Marinette is 90.0 births per 1,000 women. Women in the age bracket of 20 to 34 years have the highest fertility rate with 165.0 births per 1,000 women. Women in the age bracket of 20 to 34 years acount for 83.3% of all women with births.
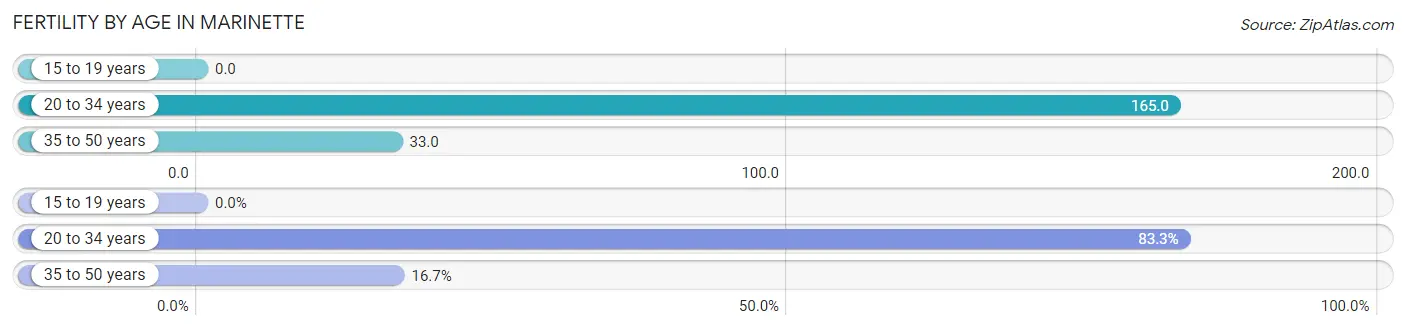
| Age Bracket | Women with Births | Births / 1,000 Women |
| 15 to 19 years | 0 (0.0%) | 0.0 |
| 20 to 34 years | 165 (83.3%) | 165.0 |
| 35 to 50 years | 33 (16.7%) | 33.0 |
| Total | 198 (100.0%) | 90.0 |
Fertility by Age by Marriage Status in Marinette
14.1% of women with births (198) in Marinette are married. The highest percentage of unmarried women with births falls into 20 to 34 years age bracket with 94.6% of them unmarried at the time of birth, while the lowest percentage of unmarried women with births belong to 35 to 50 years age bracket with 42.4% of them unmarried.
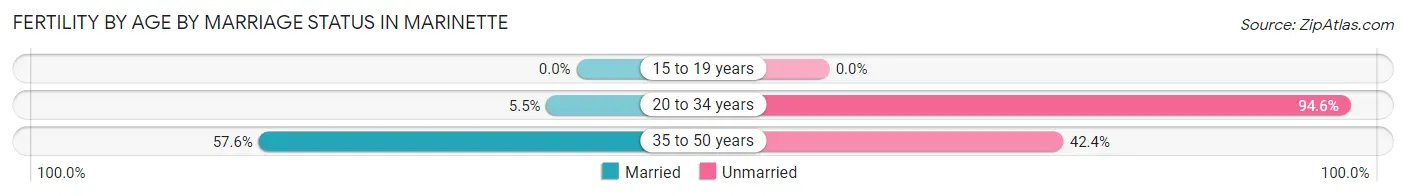
| Age Bracket | Married | Unmarried |
| 15 to 19 years | 0 (0.0%) | 0 (0.0%) |
| 20 to 34 years | 9 (5.4%) | 156 (94.6%) |
| 35 to 50 years | 19 (57.6%) | 14 (42.4%) |
| Total | 28 (14.1%) | 170 (85.9%) |
Fertility by Education in Marinette
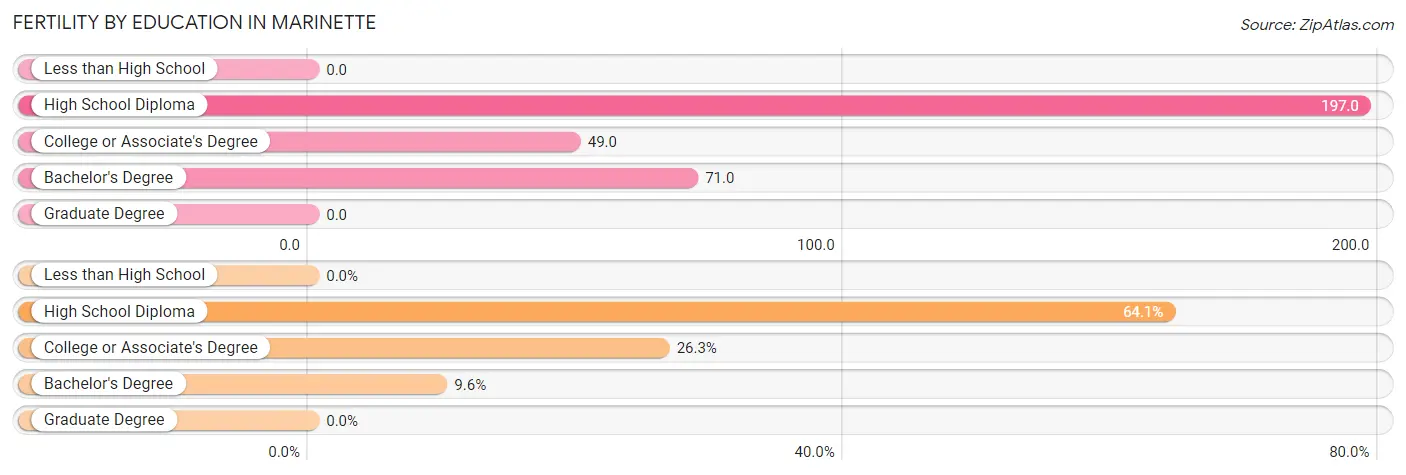
| Educational Attainment | Women with Births | Births / 1,000 Women |
| Less than High School | 0 (0.0%) | 0.0 |
| High School Diploma | 127 (64.1%) | 197.0 |
| College or Associate's Degree | 52 (26.3%) | 49.0 |
| Bachelor's Degree | 19 (9.6%) | 71.0 |
| Graduate Degree | 0 (0.0%) | 0.0 |
| Total | 198 (100.0%) | 90.0 |
Fertility by Education by Marriage Status in Marinette
85.9% of women with births in Marinette are unmarried. Women with the educational attainment of bachelor's degree are most likely to be married with 100.0% of them married at childbirth, while women with the educational attainment of high school diploma are least likely to be married with 100.0% of them unmarried at childbirth.
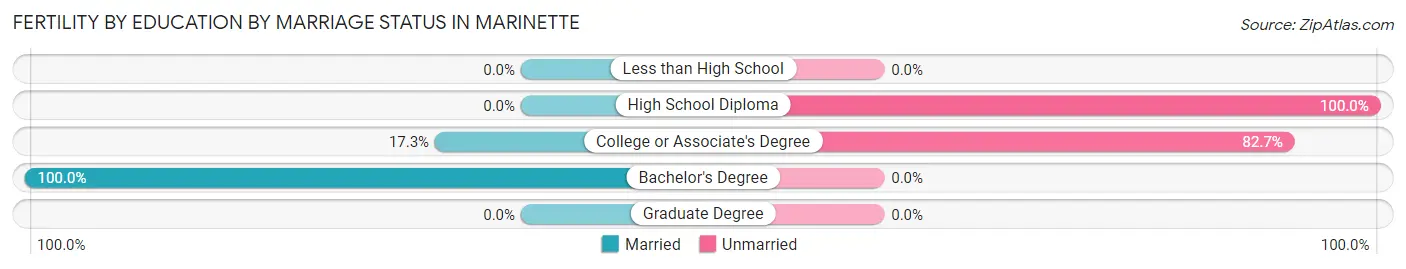
| Educational Attainment | Married | Unmarried |
| Less than High School | 0 (0.0%) | 0 (0.0%) |
| High School Diploma | 0 (0.0%) | 127 (100.0%) |
| College or Associate's Degree | 9 (17.3%) | 43 (82.7%) |
| Bachelor's Degree | 19 (100.0%) | 0 (0.0%) |
| Graduate Degree | 0 (0.0%) | 0 (0.0%) |
| Total | 28 (14.1%) | 170 (85.9%) |
Employment Characteristics in Marinette
Employment by Class of Employer in Marinette
Among the 5,369 employed individuals in Marinette, private company employees (4,339 | 80.8%), local government employees (377 | 7.0%), and not-for-profit organizations (297 | 5.5%) make up the most common classes of employment.
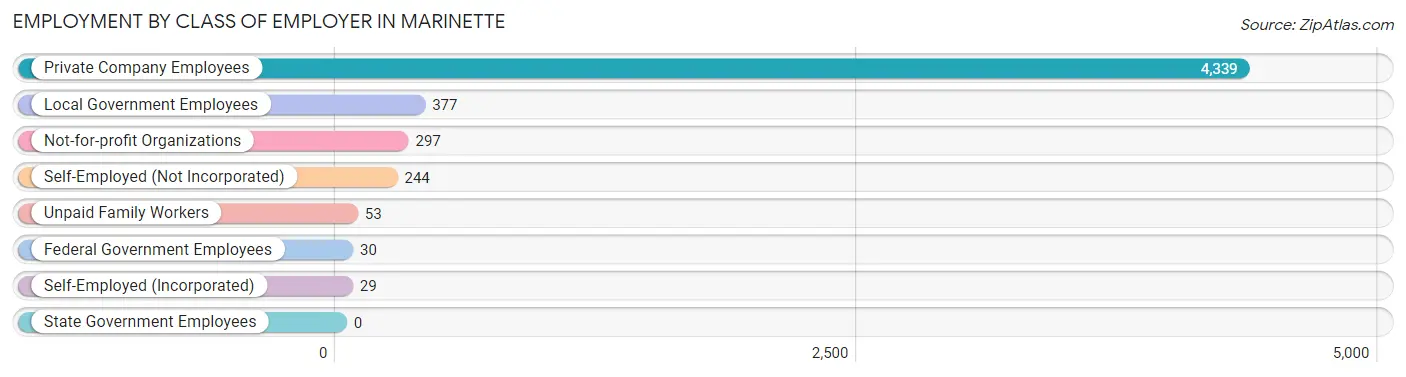
| Employer Class | # Employees | % Employees |
| Private Company Employees | 4,339 | 80.8% |
| Self-Employed (Incorporated) | 29 | 0.5% |
| Self-Employed (Not Incorporated) | 244 | 4.5% |
| Not-for-profit Organizations | 297 | 5.5% |
| Local Government Employees | 377 | 7.0% |
| State Government Employees | 0 | 0.0% |
| Federal Government Employees | 30 | 0.6% |
| Unpaid Family Workers | 53 | 1.0% |
| Total | 5,369 | 100.0% |
Employment Status by Age in Marinette
According to the labor force statistics for Marinette, out of the total population over 16 years of age (9,032), 62.2% or 5,618 individuals are in the labor force, with 3.4% or 191 of them unemployed. The age group with the highest labor force participation rate is 30 to 34 years, with 92.0% or 636 individuals in the labor force. Within the labor force, the 16 to 19 years age range has the highest percentage of unemployed individuals, with 29.1% or 74 of them being unemployed.
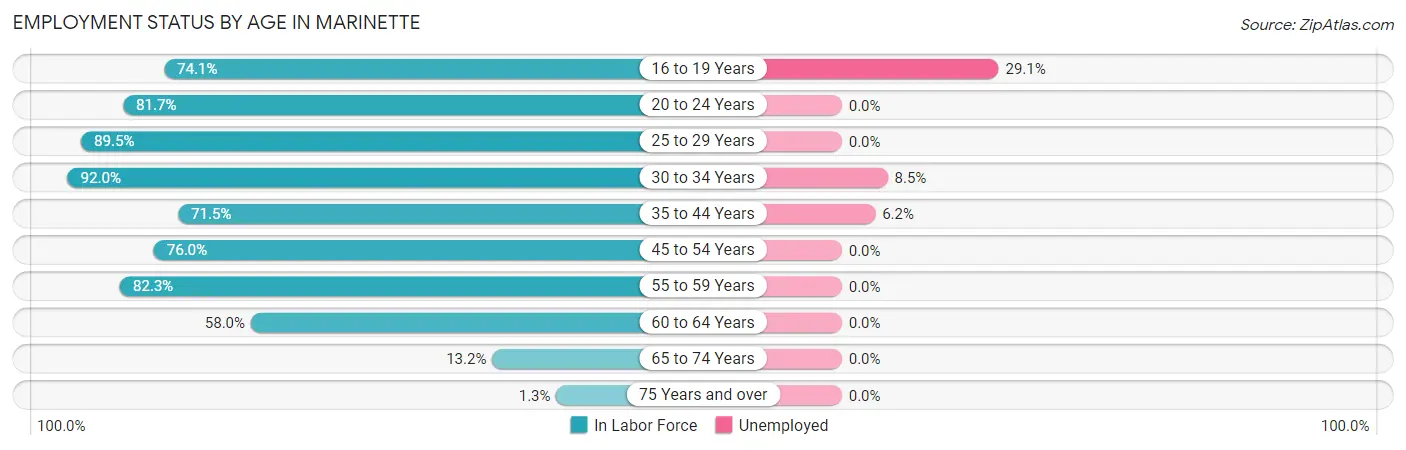
| Age Bracket | In Labor Force | Unemployed |
| 16 to 19 Years | 254 (74.1%) | 74 (29.1%) |
| 20 to 24 Years | 550 (81.7%) | 0 (0.0%) |
| 25 to 29 Years | 842 (89.5%) | 0 (0.0%) |
| 30 to 34 Years | 636 (92.0%) | 54 (8.5%) |
| 35 to 44 Years | 1,025 (71.5%) | 64 (6.2%) |
| 45 to 54 Years | 937 (76.0%) | 0 (0.0%) |
| 55 to 59 Years | 755 (82.3%) | 0 (0.0%) |
| 60 to 64 Years | 458 (58.0%) | 0 (0.0%) |
| 65 to 74 Years | 146 (13.2%) | 0 (0.0%) |
| 75 Years and over | 12 (1.3%) | 0 (0.0%) |
| Total | 5,618 (62.2%) | 191 (3.4%) |
Employment Status by Educational Attainment in Marinette
According to labor force statistics for Marinette, 77.5% of individuals (4,653) out of the total population between 25 and 64 years of age (6,004) are in the labor force, with 2.5% or 116 of them being unemployed. The group with the highest labor force participation rate are those with the educational attainment of bachelor's degree or higher, with 87.3% or 1,007 individuals in the labor force. Within the labor force, individuals with less than high school education have the highest percentage of unemployment, with 14.7% or 34 of them being unemployed.
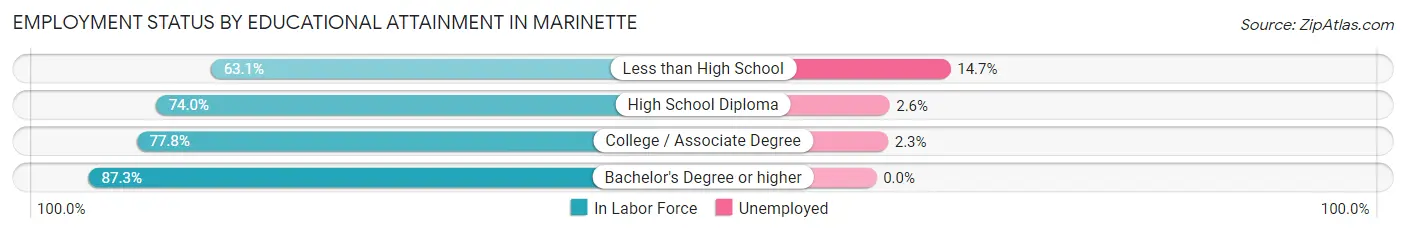
| Educational Attainment | In Labor Force | Unemployed |
| Less than High School | 231 (63.1%) | 54 (14.7%) |
| High School Diploma | 1,472 (74.0%) | 52 (2.6%) |
| College / Associate Degree | 1,941 (77.8%) | 57 (2.3%) |
| Bachelor's Degree or higher | 1,007 (87.3%) | 0 (0.0%) |
| Total | 4,653 (77.5%) | 150 (2.5%) |
Employment Occupations by Sex in Marinette
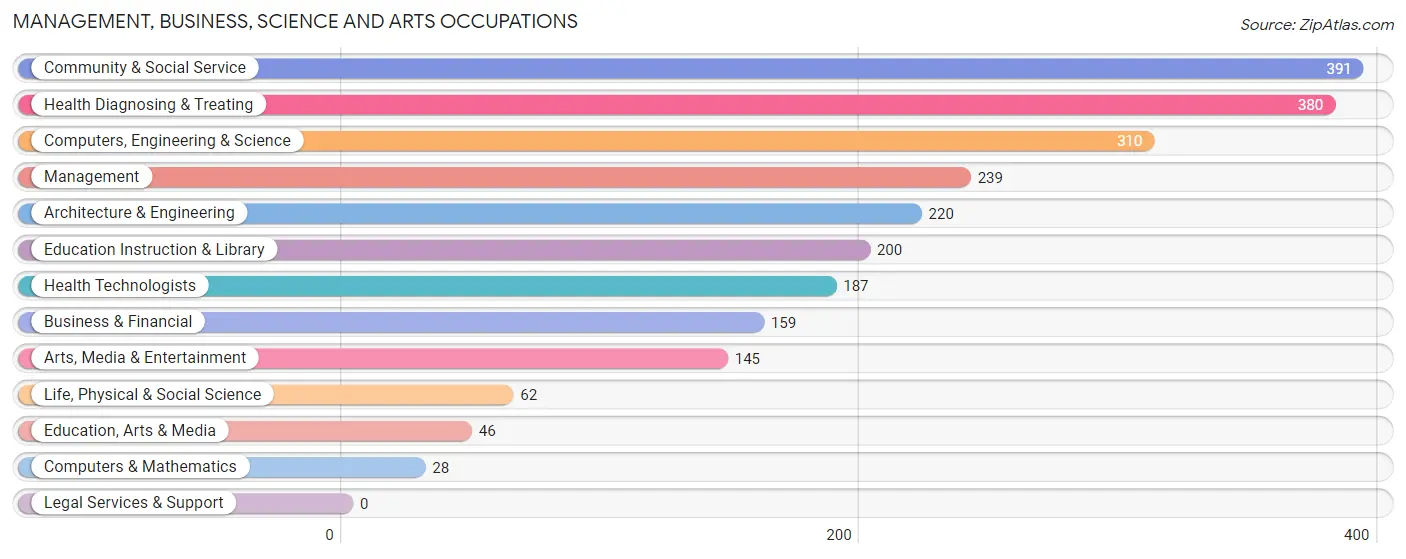
Management, Business, Science and Arts Occupations
The most common Management, Business, Science and Arts occupations in Marinette are Community & Social Service (391 | 7.2%), Health Diagnosing & Treating (380 | 7.0%), Computers, Engineering & Science (310 | 5.7%), Management (239 | 4.4%), and Architecture & Engineering (220 | 4.1%).
Management, Business, Science and Arts Occupations by Sex
Within the Management, Business, Science and Arts occupations in Marinette, the most male-oriented occupations are Arts, Media & Entertainment (84.8%), Architecture & Engineering (82.3%), and Life, Physical & Social Science (82.3%), while the most female-oriented occupations are Education, Arts & Media (100.0%), Education Instruction & Library (90.0%), and Health Diagnosing & Treating (81.0%).
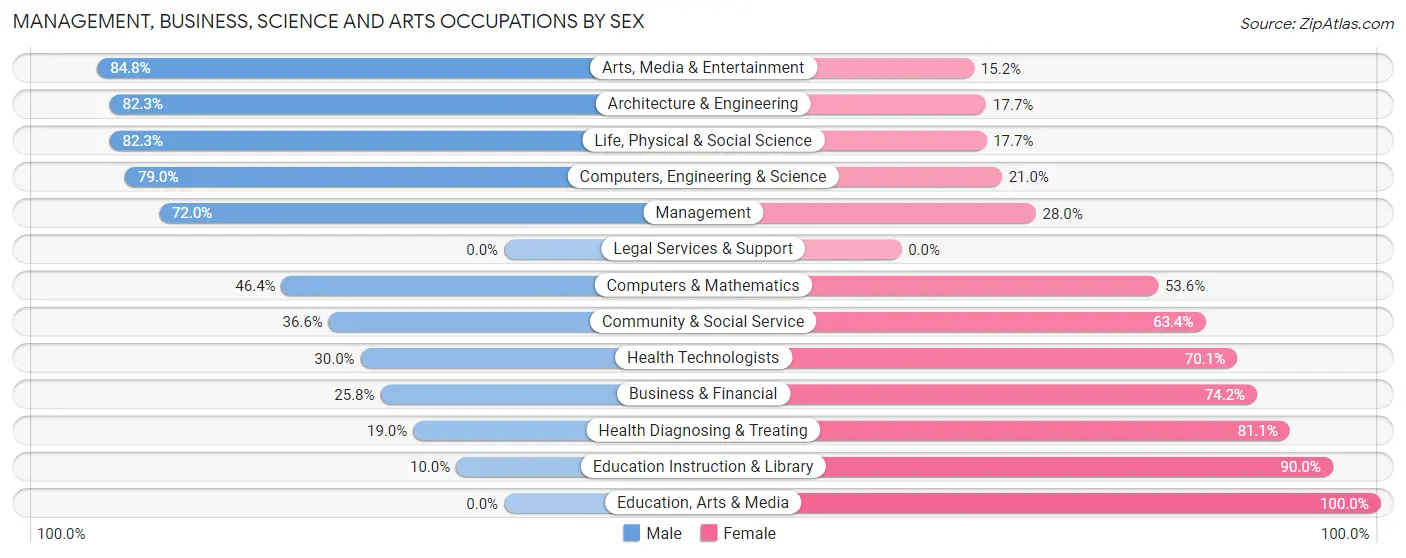
| Occupation | Male | Female |
| Management | 172 (72.0%) | 67 (28.0%) |
| Business & Financial | 41 (25.8%) | 118 (74.2%) |
| Computers, Engineering & Science | 245 (79.0%) | 65 (21.0%) |
| Computers & Mathematics | 13 (46.4%) | 15 (53.6%) |
| Architecture & Engineering | 181 (82.3%) | 39 (17.7%) |
| Life, Physical & Social Science | 51 (82.3%) | 11 (17.7%) |
| Community & Social Service | 143 (36.6%) | 248 (63.4%) |
| Education, Arts & Media | 0 (0.0%) | 46 (100.0%) |
| Legal Services & Support | 0 (0.0%) | 0 (0.0%) |
| Education Instruction & Library | 20 (10.0%) | 180 (90.0%) |
| Arts, Media & Entertainment | 123 (84.8%) | 22 (15.2%) |
| Health Diagnosing & Treating | 72 (19.0%) | 308 (81.0%) |
| Health Technologists | 56 (29.9%) | 131 (70.1%) |
| Total (Category) | 673 (45.5%) | 806 (54.5%) |
| Total (Overall) | 3,191 (58.8%) | 2,232 (41.2%) |
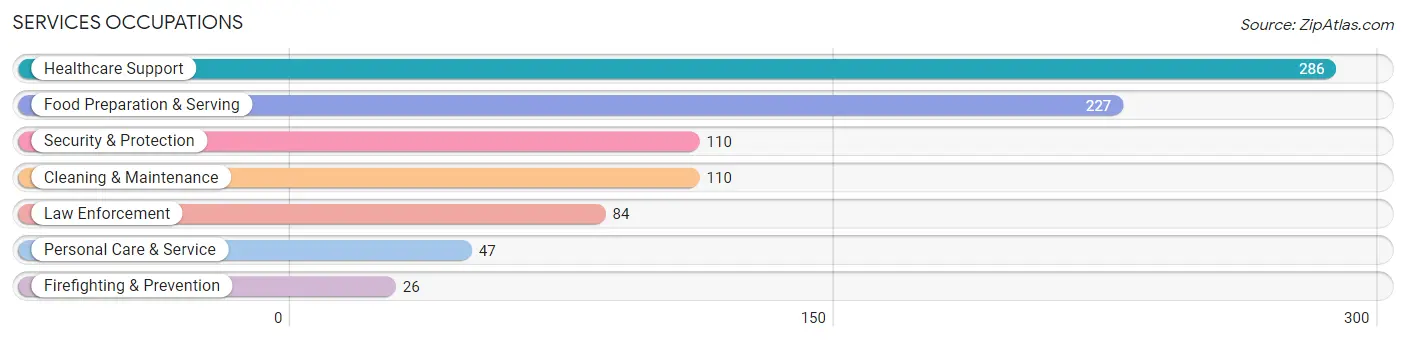
Services Occupations
The most common Services occupations in Marinette are Healthcare Support (286 | 5.3%), Food Preparation & Serving (227 | 4.2%), Security & Protection (110 | 2.0%), Cleaning & Maintenance (110 | 2.0%), and Law Enforcement (84 | 1.5%).
Services Occupations by Sex
Within the Services occupations in Marinette, the most male-oriented occupations are Security & Protection (100.0%), Firefighting & Prevention (100.0%), and Law Enforcement (100.0%), while the most female-oriented occupations are Personal Care & Service (100.0%), Healthcare Support (94.1%), and Food Preparation & Serving (54.6%).
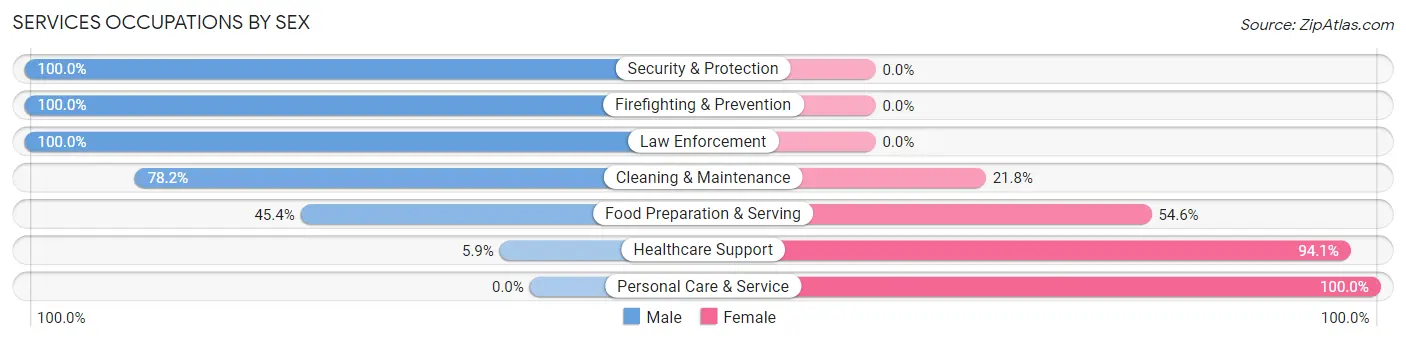
| Occupation | Male | Female |
| Healthcare Support | 17 (5.9%) | 269 (94.1%) |
| Security & Protection | 110 (100.0%) | 0 (0.0%) |
| Firefighting & Prevention | 26 (100.0%) | 0 (0.0%) |
| Law Enforcement | 84 (100.0%) | 0 (0.0%) |
| Food Preparation & Serving | 103 (45.4%) | 124 (54.6%) |
| Cleaning & Maintenance | 86 (78.2%) | 24 (21.8%) |
| Personal Care & Service | 0 (0.0%) | 47 (100.0%) |
| Total (Category) | 316 (40.5%) | 464 (59.5%) |
| Total (Overall) | 3,191 (58.8%) | 2,232 (41.2%) |
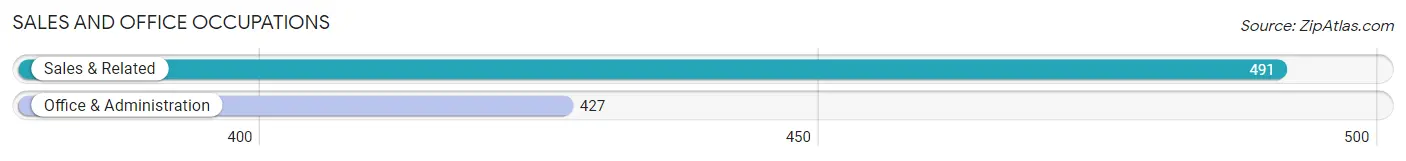
Sales and Office Occupations
The most common Sales and Office occupations in Marinette are Sales & Related (491 | 9.0%), and Office & Administration (427 | 7.9%).
Sales and Office Occupations by Sex
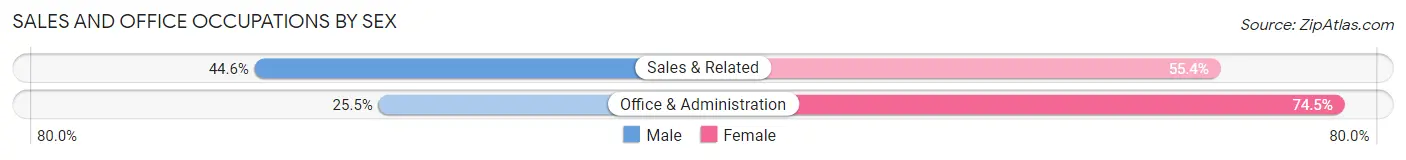
| Occupation | Male | Female |
| Sales & Related | 219 (44.6%) | 272 (55.4%) |
| Office & Administration | 109 (25.5%) | 318 (74.5%) |
| Total (Category) | 328 (35.7%) | 590 (64.3%) |
| Total (Overall) | 3,191 (58.8%) | 2,232 (41.2%) |
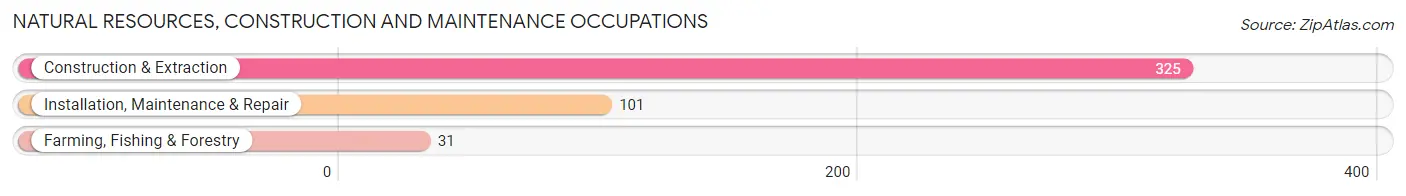
Natural Resources, Construction and Maintenance Occupations
The most common Natural Resources, Construction and Maintenance occupations in Marinette are Construction & Extraction (325 | 6.0%), Installation, Maintenance & Repair (101 | 1.9%), and Farming, Fishing & Forestry (31 | 0.6%).
Natural Resources, Construction and Maintenance Occupations by Sex
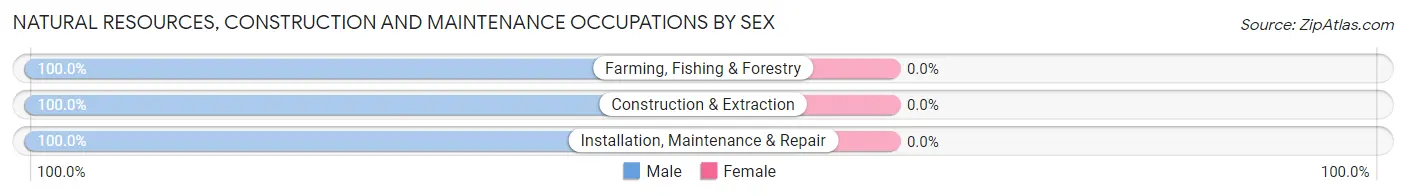
| Occupation | Male | Female |
| Farming, Fishing & Forestry | 31 (100.0%) | 0 (0.0%) |
| Construction & Extraction | 325 (100.0%) | 0 (0.0%) |
| Installation, Maintenance & Repair | 101 (100.0%) | 0 (0.0%) |
| Total (Category) | 457 (100.0%) | 0 (0.0%) |
| Total (Overall) | 3,191 (58.8%) | 2,232 (41.2%) |
Production, Transportation and Moving Occupations
The most common Production, Transportation and Moving occupations in Marinette are Production (1,195 | 22.0%), Transportation (360 | 6.6%), and Material Moving (234 | 4.3%).
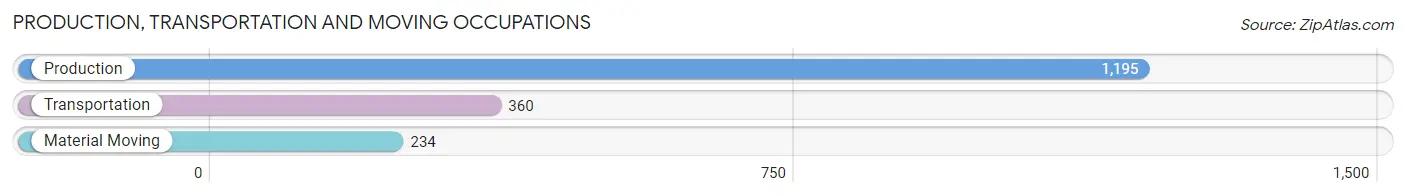
Production, Transportation and Moving Occupations by Sex
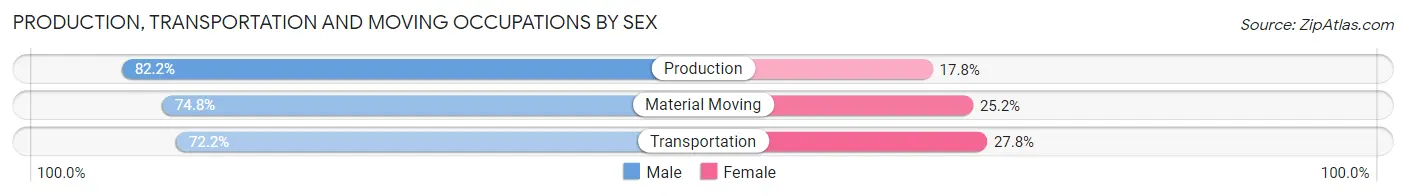
| Occupation | Male | Female |
| Production | 982 (82.2%) | 213 (17.8%) |
| Transportation | 260 (72.2%) | 100 (27.8%) |
| Material Moving | 175 (74.8%) | 59 (25.2%) |
| Total (Category) | 1,417 (79.2%) | 372 (20.8%) |
| Total (Overall) | 3,191 (58.8%) | 2,232 (41.2%) |
Employment Industries by Sex in Marinette
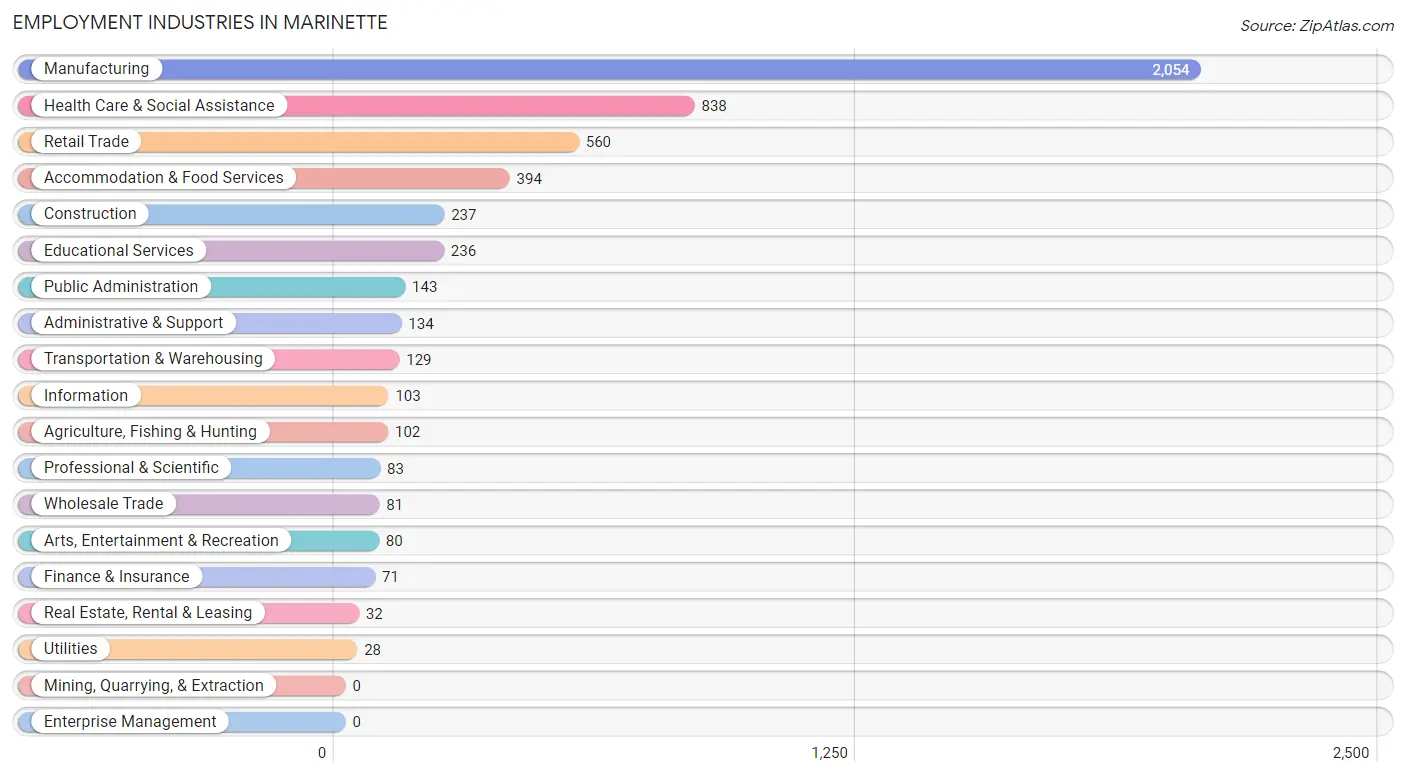
Employment Industries in Marinette
The major employment industries in Marinette include Manufacturing (2,054 | 37.9%), Health Care & Social Assistance (838 | 15.4%), Retail Trade (560 | 10.3%), Accommodation & Food Services (394 | 7.3%), and Construction (237 | 4.4%).
Employment Industries by Sex in Marinette
The Marinette industries that see more men than women are Agriculture, Fishing & Hunting (100.0%), Wholesale Trade (100.0%), and Transportation & Warehousing (100.0%), whereas the industries that tend to have a higher number of women are Educational Services (88.1%), Health Care & Social Assistance (81.6%), and Professional & Scientific (71.1%).
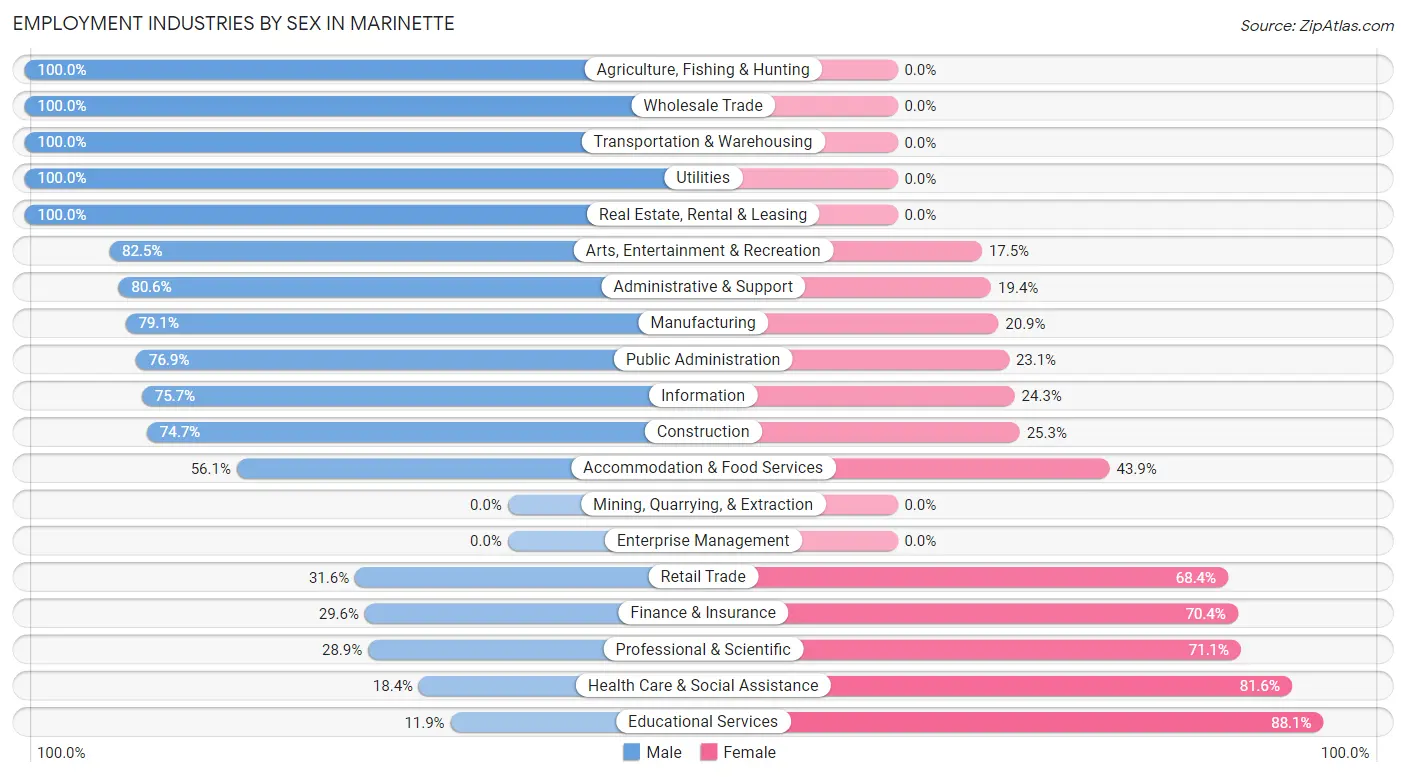
| Industry | Male | Female |
| Agriculture, Fishing & Hunting | 102 (100.0%) | 0 (0.0%) |
| Mining, Quarrying, & Extraction | 0 (0.0%) | 0 (0.0%) |
| Construction | 177 (74.7%) | 60 (25.3%) |
| Manufacturing | 1,625 (79.1%) | 429 (20.9%) |
| Wholesale Trade | 81 (100.0%) | 0 (0.0%) |
| Retail Trade | 177 (31.6%) | 383 (68.4%) |
| Transportation & Warehousing | 129 (100.0%) | 0 (0.0%) |
| Utilities | 28 (100.0%) | 0 (0.0%) |
| Information | 78 (75.7%) | 25 (24.3%) |
| Finance & Insurance | 21 (29.6%) | 50 (70.4%) |
| Real Estate, Rental & Leasing | 32 (100.0%) | 0 (0.0%) |
| Professional & Scientific | 24 (28.9%) | 59 (71.1%) |
| Enterprise Management | 0 (0.0%) | 0 (0.0%) |
| Administrative & Support | 108 (80.6%) | 26 (19.4%) |
| Educational Services | 28 (11.9%) | 208 (88.1%) |
| Health Care & Social Assistance | 154 (18.4%) | 684 (81.6%) |
| Arts, Entertainment & Recreation | 66 (82.5%) | 14 (17.5%) |
| Accommodation & Food Services | 221 (56.1%) | 173 (43.9%) |
| Public Administration | 110 (76.9%) | 33 (23.1%) |
| Total | 3,191 (58.8%) | 2,232 (41.2%) |
Education in Marinette
School Enrollment in Marinette
The most common levels of schooling among the 2,088 students in Marinette are middle school (433 | 20.7%), college / undergraduate (416 | 19.9%), and nursery / preschool (396 | 19.0%).
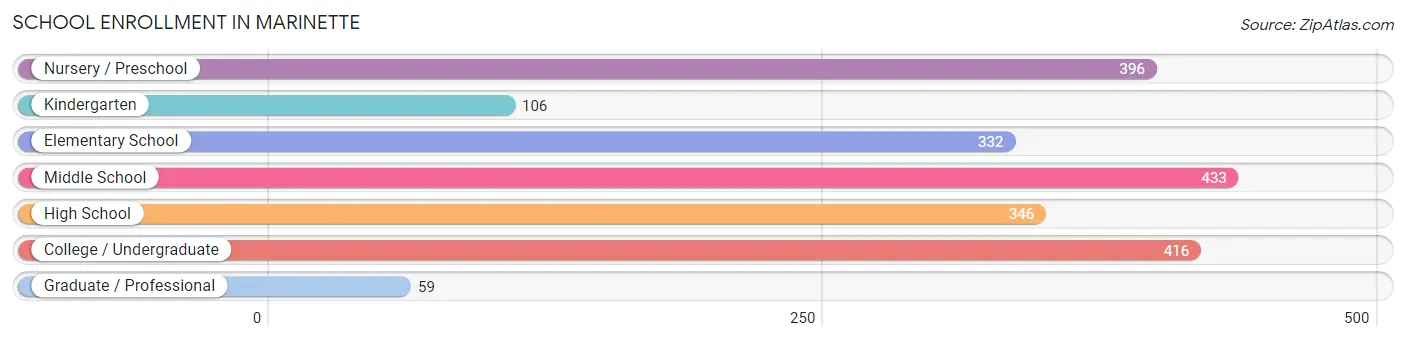
| School Level | # Students | % Students |
| Nursery / Preschool | 396 | 19.0% |
| Kindergarten | 106 | 5.1% |
| Elementary School | 332 | 15.9% |
| Middle School | 433 | 20.7% |
| High School | 346 | 16.6% |
| College / Undergraduate | 416 | 19.9% |
| Graduate / Professional | 59 | 2.8% |
| Total | 2,088 | 100.0% |
School Enrollment by Age by Funding Source in Marinette
Out of a total of 2,088 students who are enrolled in schools in Marinette, 221 (10.6%) attend a private institution, while the remaining 1,867 (89.4%) are enrolled in public schools. The age group of 3 to 4 year olds has the highest likelihood of being enrolled in private schools, with 62 (33.0% in the age bracket) enrolled. Conversely, the age group of 18 to 19 year olds has the lowest likelihood of being enrolled in a private school, with 76 (100.0% in the age bracket) attending a public institution.
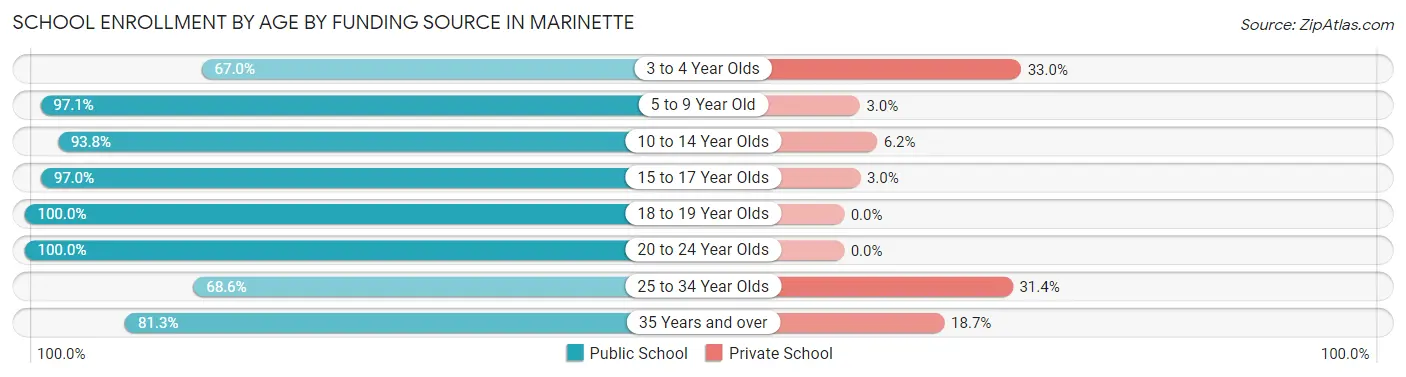
| Age Bracket | Public School | Private School |
| 3 to 4 Year Olds | 126 (67.0%) | 62 (33.0%) |
| 5 to 9 Year Old | 559 (97.1%) | 17 (2.9%) |
| 10 to 14 Year Olds | 502 (93.8%) | 33 (6.2%) |
| 15 to 17 Year Olds | 256 (97.0%) | 8 (3.0%) |
| 18 to 19 Year Olds | 76 (100.0%) | 0 (0.0%) |
| 20 to 24 Year Olds | 36 (100.0%) | 0 (0.0%) |
| 25 to 34 Year Olds | 133 (68.6%) | 61 (31.4%) |
| 35 Years and over | 178 (81.3%) | 41 (18.7%) |
| Total | 1,867 (89.4%) | 221 (10.6%) |
Educational Attainment by Field of Study in Marinette
Education (508 | 27.3%), business (298 | 16.0%), science & technology (180 | 9.7%), bio, nature & agricultural (146 | 7.8%), and arts & humanities (143 | 7.7%) are the most common fields of study among 1,862 individuals in Marinette who have obtained a bachelor's degree or higher.
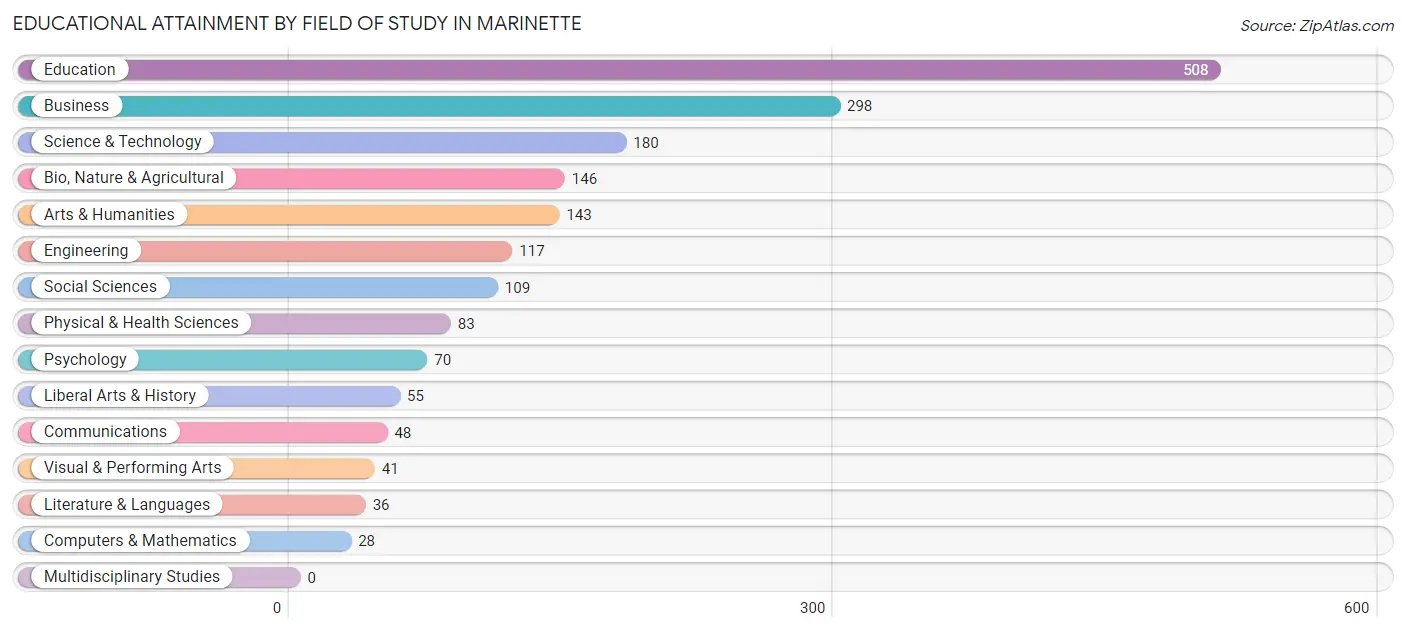
| Field of Study | # Graduates | % Graduates |
| Computers & Mathematics | 28 | 1.5% |
| Bio, Nature & Agricultural | 146 | 7.8% |
| Physical & Health Sciences | 83 | 4.5% |
| Psychology | 70 | 3.8% |
| Social Sciences | 109 | 5.9% |
| Engineering | 117 | 6.3% |
| Multidisciplinary Studies | 0 | 0.0% |
| Science & Technology | 180 | 9.7% |
| Business | 298 | 16.0% |
| Education | 508 | 27.3% |
| Literature & Languages | 36 | 1.9% |
| Liberal Arts & History | 55 | 2.9% |
| Visual & Performing Arts | 41 | 2.2% |
| Communications | 48 | 2.6% |
| Arts & Humanities | 143 | 7.7% |
| Total | 1,862 | 100.0% |
Transportation & Commute in Marinette
Vehicle Availability by Sex in Marinette
The most prevalent vehicle ownership categories in Marinette are males with 2 vehicles (1,708, accounting for 54.4%) and females with 2 vehicles (1,020, making up 78.4%).
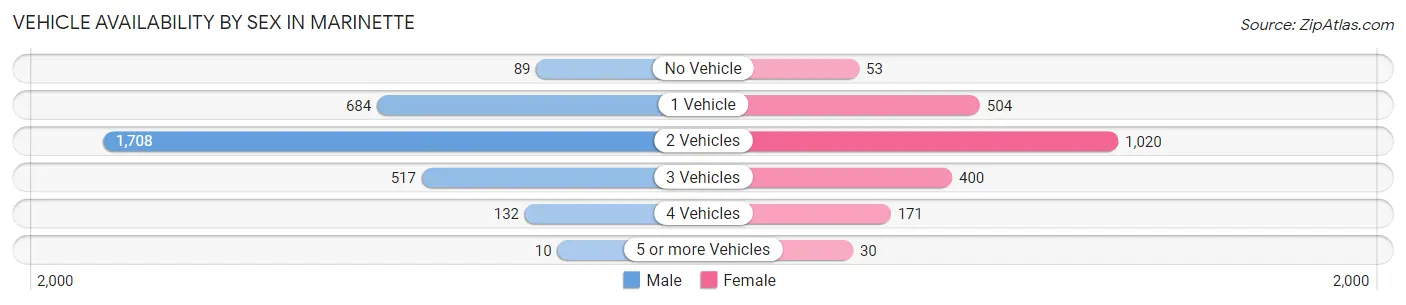
| Vehicles Available | Male | Female |
| No Vehicle | 89 (2.8%) | 53 (2.4%) |
| 1 Vehicle | 684 (21.8%) | 504 (23.1%) |
| 2 Vehicles | 1,708 (54.4%) | 1,020 (46.8%) |
| 3 Vehicles | 517 (16.5%) | 400 (18.4%) |
| 4 Vehicles | 132 (4.2%) | 171 (7.9%) |
| 5 or more Vehicles | 10 (0.3%) | 30 (1.4%) |
| Total | 3,140 (100.0%) | 2,178 (100.0%) |
Commute Time in Marinette
The most frequently occuring commute durations in Marinette are 5 to 9 minutes (2,176 commuters, 41.2%), 10 to 14 minutes (1,521 commuters, 28.8%), and 15 to 19 minutes (622 commuters, 11.8%).
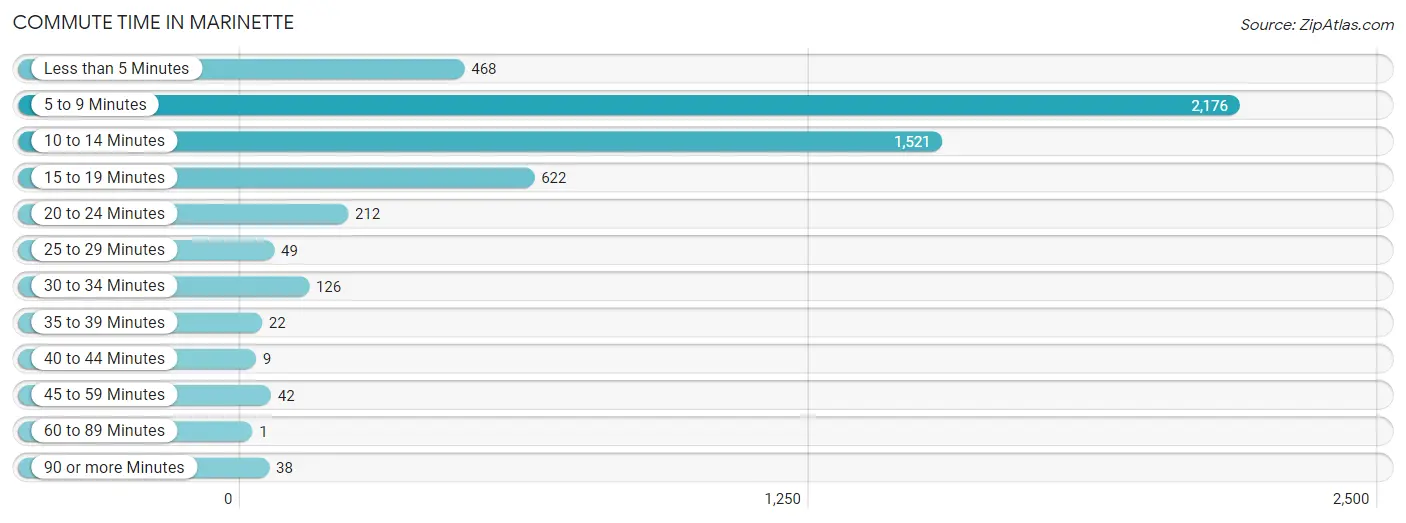
| Commute Time | # Commuters | % Commuters |
| Less than 5 Minutes | 468 | 8.8% |
| 5 to 9 Minutes | 2,176 | 41.2% |
| 10 to 14 Minutes | 1,521 | 28.8% |
| 15 to 19 Minutes | 622 | 11.8% |
| 20 to 24 Minutes | 212 | 4.0% |
| 25 to 29 Minutes | 49 | 0.9% |
| 30 to 34 Minutes | 126 | 2.4% |
| 35 to 39 Minutes | 22 | 0.4% |
| 40 to 44 Minutes | 9 | 0.2% |
| 45 to 59 Minutes | 42 | 0.8% |
| 60 to 89 Minutes | 1 | 0.0% |
| 90 or more Minutes | 38 | 0.7% |
Commute Time by Sex in Marinette
The most common commute times in Marinette are 5 to 9 minutes (1,293 commuters, 41.4%) for males and 5 to 9 minutes (883 commuters, 40.9%) for females.
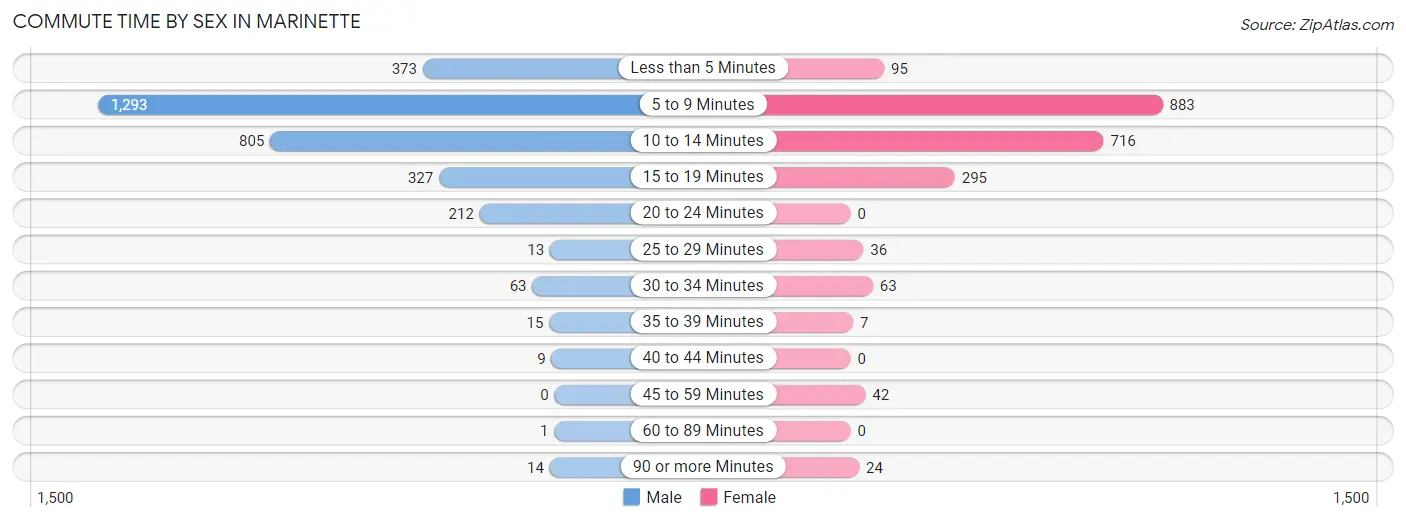
| Commute Time | Male | Female |
| Less than 5 Minutes | 373 (11.9%) | 95 (4.4%) |
| 5 to 9 Minutes | 1,293 (41.4%) | 883 (40.9%) |
| 10 to 14 Minutes | 805 (25.8%) | 716 (33.1%) |
| 15 to 19 Minutes | 327 (10.5%) | 295 (13.7%) |
| 20 to 24 Minutes | 212 (6.8%) | 0 (0.0%) |
| 25 to 29 Minutes | 13 (0.4%) | 36 (1.7%) |
| 30 to 34 Minutes | 63 (2.0%) | 63 (2.9%) |
| 35 to 39 Minutes | 15 (0.5%) | 7 (0.3%) |
| 40 to 44 Minutes | 9 (0.3%) | 0 (0.0%) |
| 45 to 59 Minutes | 0 (0.0%) | 42 (1.9%) |
| 60 to 89 Minutes | 1 (0.0%) | 0 (0.0%) |
| 90 or more Minutes | 14 (0.4%) | 24 (1.1%) |
Time of Departure to Work by Sex in Marinette
The most frequent times of departure to work in Marinette are 5:30 AM to 5:59 AM (494, 15.8%) for males and 7:30 AM to 7:59 AM (356, 16.5%) for females.
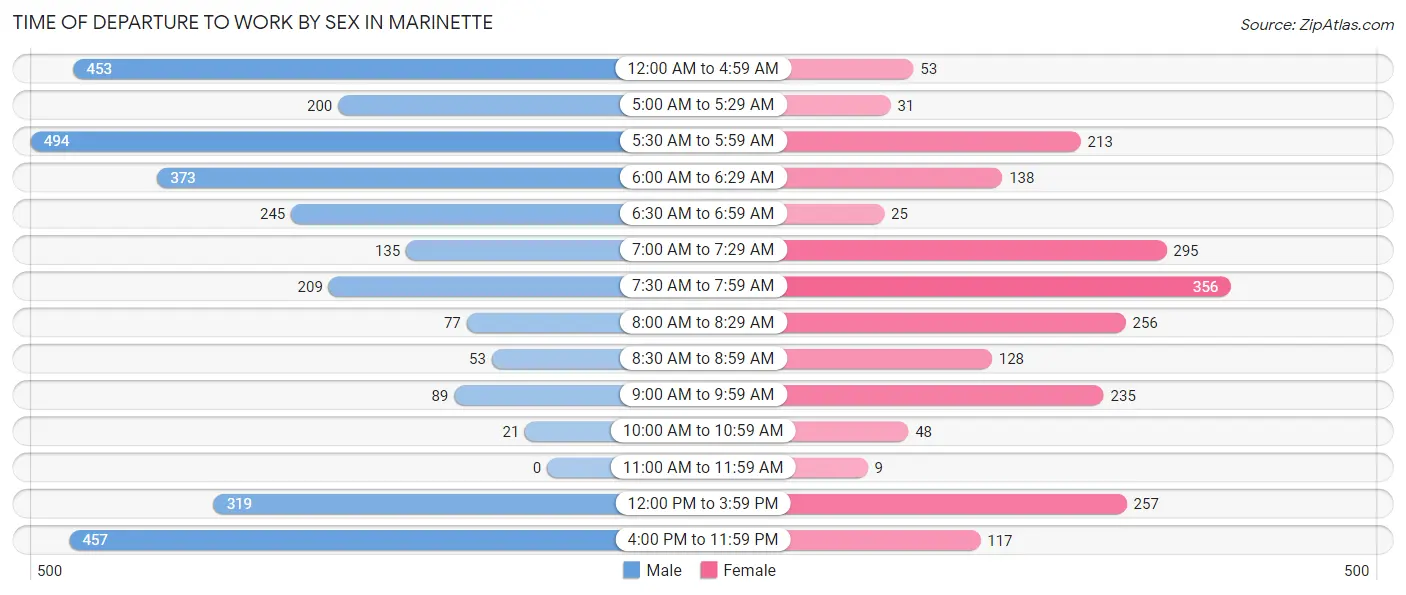
| Time of Departure | Male | Female |
| 12:00 AM to 4:59 AM | 453 (14.5%) | 53 (2.5%) |
| 5:00 AM to 5:29 AM | 200 (6.4%) | 31 (1.4%) |
| 5:30 AM to 5:59 AM | 494 (15.8%) | 213 (9.9%) |
| 6:00 AM to 6:29 AM | 373 (11.9%) | 138 (6.4%) |
| 6:30 AM to 6:59 AM | 245 (7.8%) | 25 (1.2%) |
| 7:00 AM to 7:29 AM | 135 (4.3%) | 295 (13.7%) |
| 7:30 AM to 7:59 AM | 209 (6.7%) | 356 (16.5%) |
| 8:00 AM to 8:29 AM | 77 (2.5%) | 256 (11.8%) |
| 8:30 AM to 8:59 AM | 53 (1.7%) | 128 (5.9%) |
| 9:00 AM to 9:59 AM | 89 (2.9%) | 235 (10.9%) |
| 10:00 AM to 10:59 AM | 21 (0.7%) | 48 (2.2%) |
| 11:00 AM to 11:59 AM | 0 (0.0%) | 9 (0.4%) |
| 12:00 PM to 3:59 PM | 319 (10.2%) | 257 (11.9%) |
| 4:00 PM to 11:59 PM | 457 (14.6%) | 117 (5.4%) |
| Total | 3,125 (100.0%) | 2,161 (100.0%) |
Housing Occupancy in Marinette
Occupancy by Ownership in Marinette
Of the total 5,087 dwellings in Marinette, owner-occupied units account for 3,547 (69.7%), while renter-occupied units make up 1,540 (30.3%).
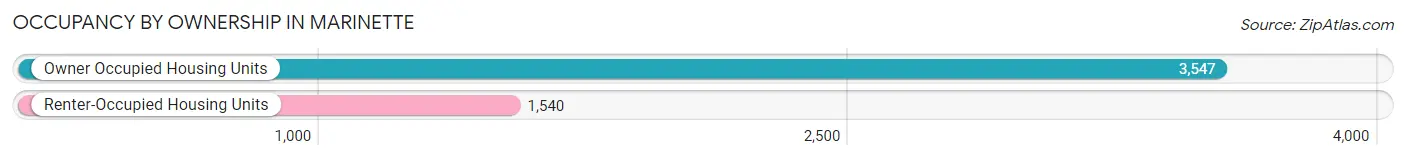
| Occupancy | # Housing Units | % Housing Units |
| Owner Occupied Housing Units | 3,547 | 69.7% |
| Renter-Occupied Housing Units | 1,540 | 30.3% |
| Total Occupied Housing Units | 5,087 | 100.0% |
Occupancy by Household Size in Marinette
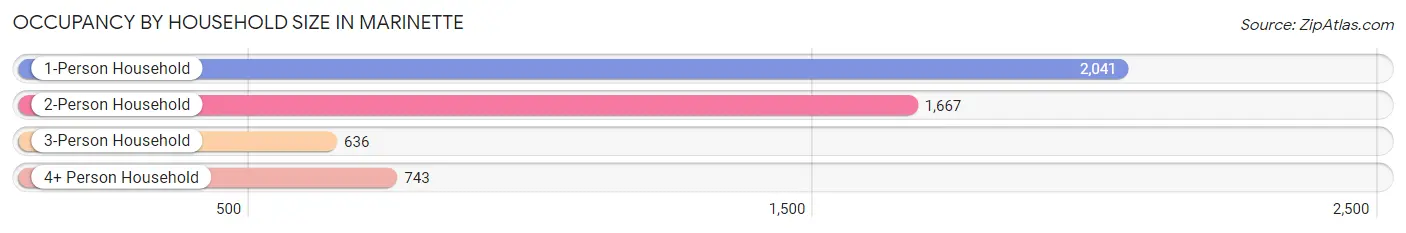
| Household Size | # Housing Units | % Housing Units |
| 1-Person Household | 2,041 | 40.1% |
| 2-Person Household | 1,667 | 32.8% |
| 3-Person Household | 636 | 12.5% |
| 4+ Person Household | 743 | 14.6% |
| Total Housing Units | 5,087 | 100.0% |
Occupancy by Ownership by Household Size in Marinette
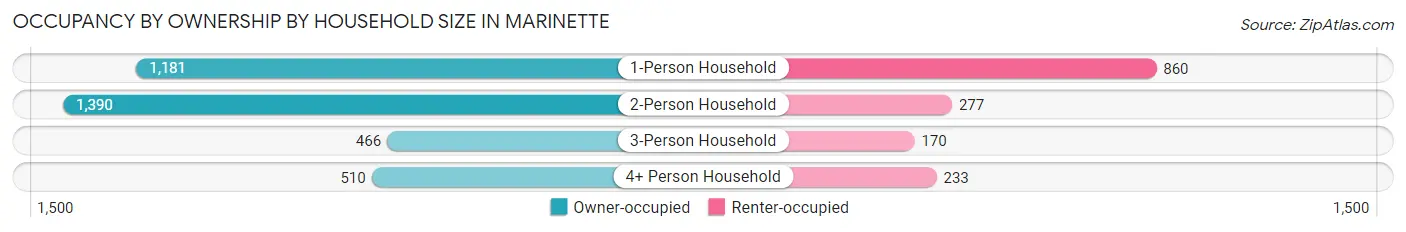
| Household Size | Owner-occupied | Renter-occupied |
| 1-Person Household | 1,181 (57.9%) | 860 (42.1%) |
| 2-Person Household | 1,390 (83.4%) | 277 (16.6%) |
| 3-Person Household | 466 (73.3%) | 170 (26.7%) |
| 4+ Person Household | 510 (68.6%) | 233 (31.4%) |
| Total Housing Units | 3,547 (69.7%) | 1,540 (30.3%) |
Occupancy by Educational Attainment in Marinette
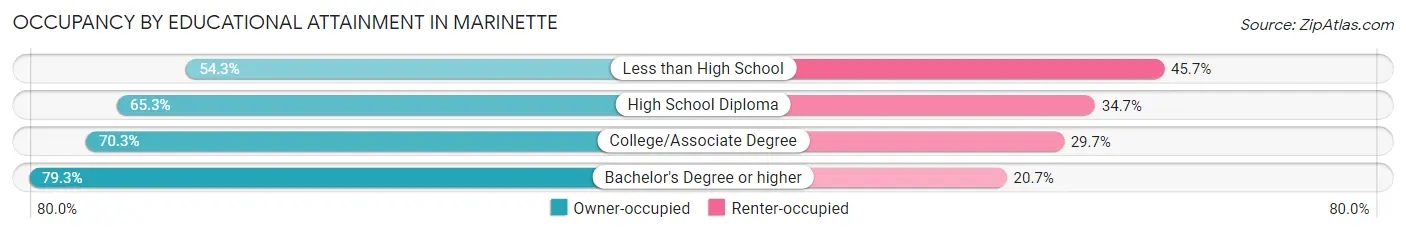
| Household Size | Owner-occupied | Renter-occupied |
| Less than High School | 169 (54.3%) | 142 (45.7%) |
| High School Diploma | 1,077 (65.3%) | 572 (34.7%) |
| College/Associate Degree | 1,389 (70.3%) | 588 (29.7%) |
| Bachelor's Degree or higher | 912 (79.3%) | 238 (20.7%) |
Occupancy by Age of Householder in Marinette
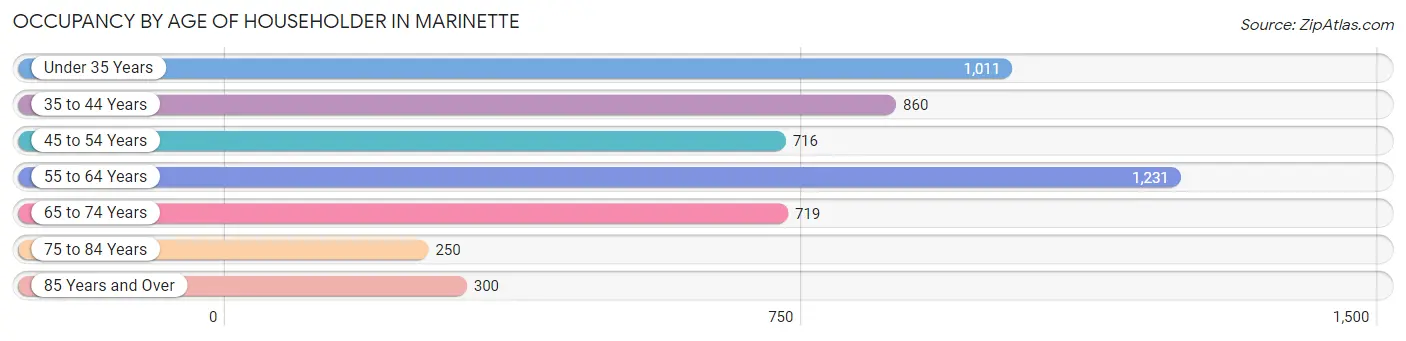
| Age Bracket | # Households | % Households |
| Under 35 Years | 1,011 | 19.9% |
| 35 to 44 Years | 860 | 16.9% |
| 45 to 54 Years | 716 | 14.1% |
| 55 to 64 Years | 1,231 | 24.2% |
| 65 to 74 Years | 719 | 14.1% |
| 75 to 84 Years | 250 | 4.9% |
| 85 Years and Over | 300 | 5.9% |
| Total | 5,087 | 100.0% |
Housing Finances in Marinette
Median Income by Occupancy in Marinette
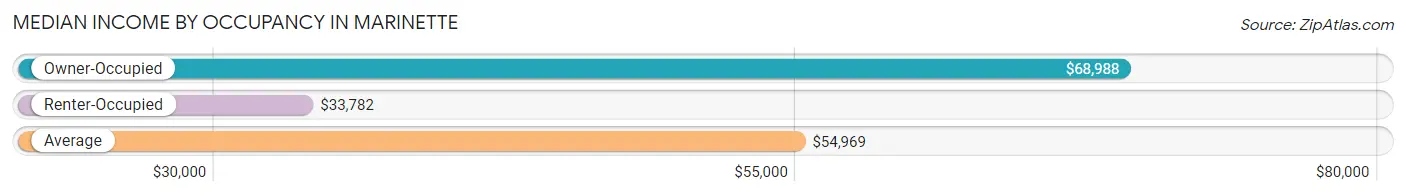
| Occupancy Type | # Households | Median Income |
| Owner-Occupied | 3,547 (69.7%) | $68,988 |
| Renter-Occupied | 1,540 (30.3%) | $33,782 |
| Average | 5,087 (100.0%) | $54,969 |
Occupancy by Householder Income Bracket in Marinette
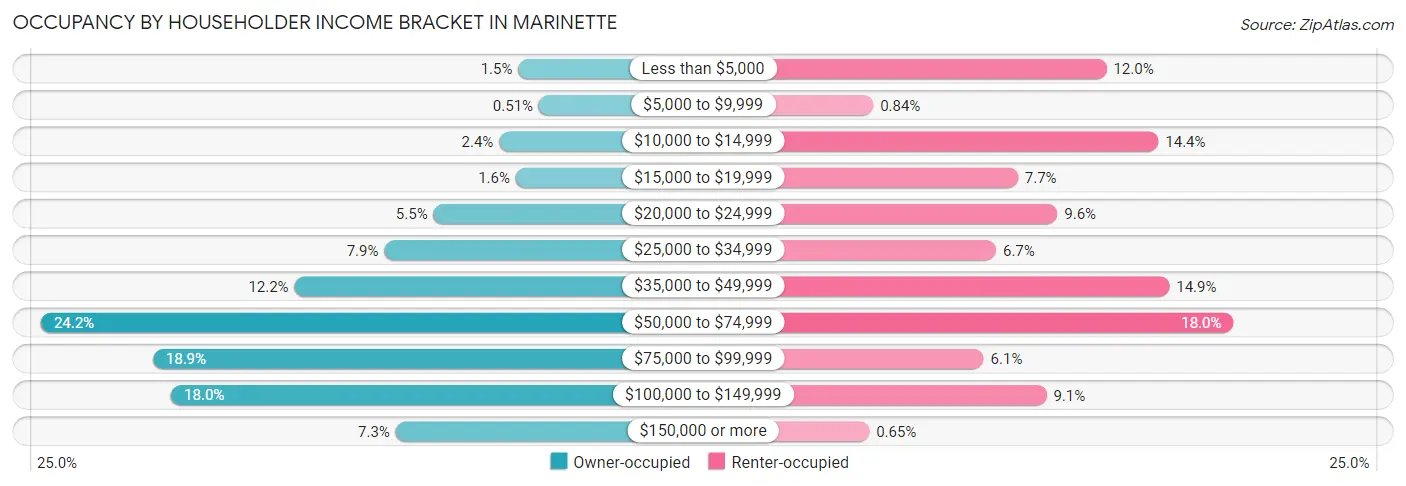
| Income Bracket | Owner-occupied | Renter-occupied |
| Less than $5,000 | 53 (1.5%) | 184 (11.9%) |
| $5,000 to $9,999 | 18 (0.5%) | 13 (0.8%) |
| $10,000 to $14,999 | 85 (2.4%) | 222 (14.4%) |
| $15,000 to $19,999 | 57 (1.6%) | 119 (7.7%) |
| $20,000 to $24,999 | 196 (5.5%) | 148 (9.6%) |
| $25,000 to $34,999 | 279 (7.9%) | 103 (6.7%) |
| $35,000 to $49,999 | 431 (12.1%) | 230 (14.9%) |
| $50,000 to $74,999 | 859 (24.2%) | 277 (18.0%) |
| $75,000 to $99,999 | 670 (18.9%) | 94 (6.1%) |
| $100,000 to $149,999 | 639 (18.0%) | 140 (9.1%) |
| $150,000 or more | 260 (7.3%) | 10 (0.6%) |
| Total | 3,547 (100.0%) | 1,540 (100.0%) |
Monthly Housing Cost Tiers in Marinette
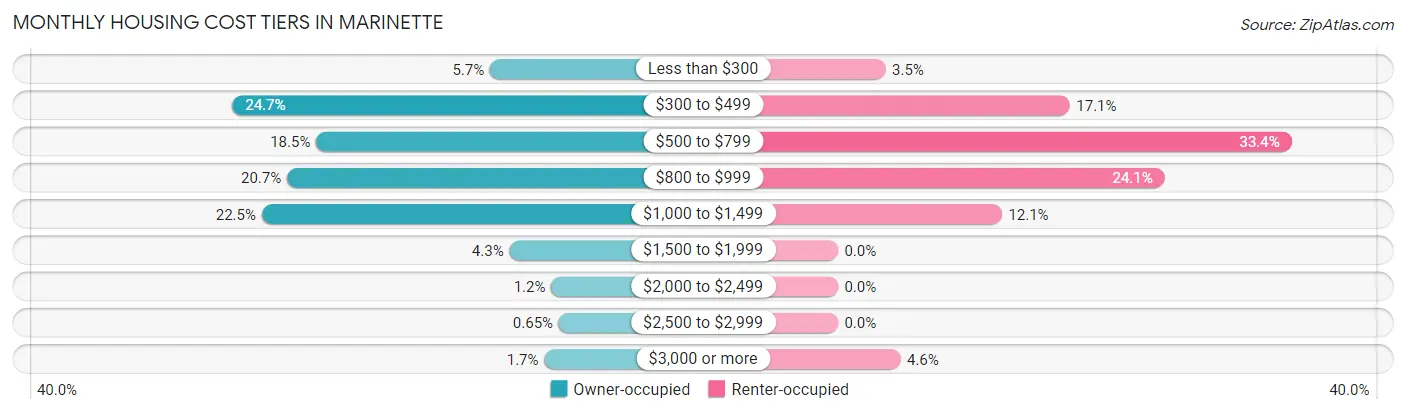
| Monthly Cost | Owner-occupied | Renter-occupied |
| Less than $300 | 203 (5.7%) | 54 (3.5%) |
| $300 to $499 | 876 (24.7%) | 263 (17.1%) |
| $500 to $799 | 657 (18.5%) | 515 (33.4%) |
| $800 to $999 | 733 (20.7%) | 371 (24.1%) |
| $1,000 to $1,499 | 799 (22.5%) | 186 (12.1%) |
| $1,500 to $1,999 | 152 (4.3%) | 0 (0.0%) |
| $2,000 to $2,499 | 43 (1.2%) | 0 (0.0%) |
| $2,500 to $2,999 | 23 (0.6%) | 0 (0.0%) |
| $3,000 or more | 61 (1.7%) | 71 (4.6%) |
| Total | 3,547 (100.0%) | 1,540 (100.0%) |
Physical Housing Characteristics in Marinette
Housing Structures in Marinette
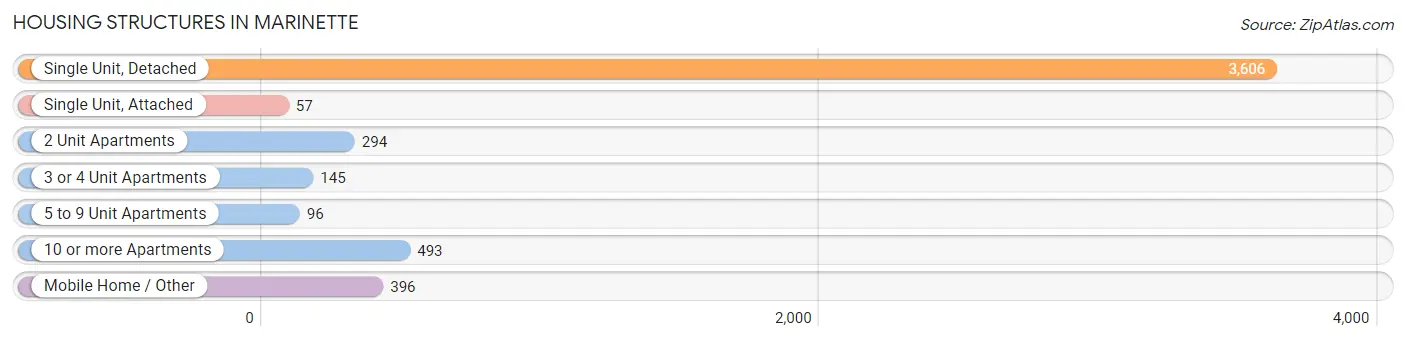
| Structure Type | # Housing Units | % Housing Units |
| Single Unit, Detached | 3,606 | 70.9% |
| Single Unit, Attached | 57 | 1.1% |
| 2 Unit Apartments | 294 | 5.8% |
| 3 or 4 Unit Apartments | 145 | 2.9% |
| 5 to 9 Unit Apartments | 96 | 1.9% |
| 10 or more Apartments | 493 | 9.7% |
| Mobile Home / Other | 396 | 7.8% |
| Total | 5,087 | 100.0% |
Housing Structures by Occupancy in Marinette
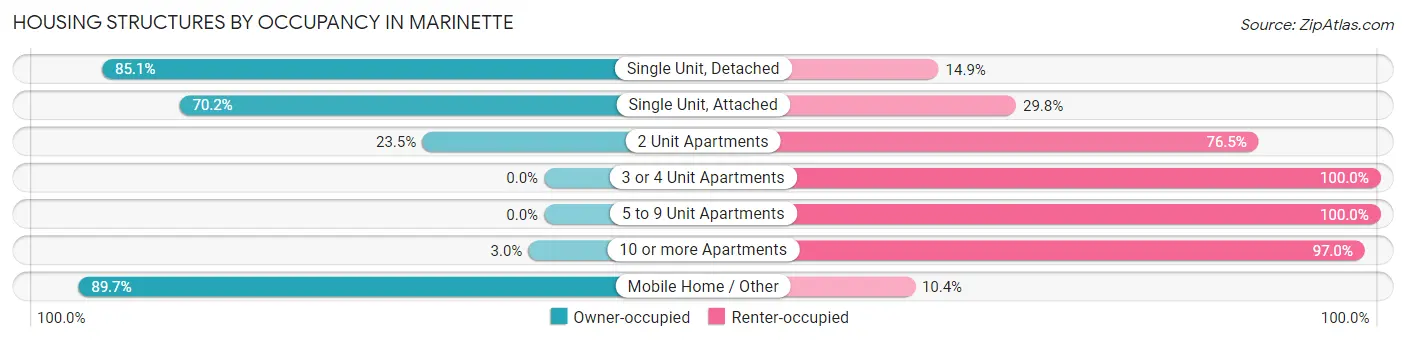
| Structure Type | Owner-occupied | Renter-occupied |
| Single Unit, Detached | 3,068 (85.1%) | 538 (14.9%) |
| Single Unit, Attached | 40 (70.2%) | 17 (29.8%) |
| 2 Unit Apartments | 69 (23.5%) | 225 (76.5%) |
| 3 or 4 Unit Apartments | 0 (0.0%) | 145 (100.0%) |
| 5 to 9 Unit Apartments | 0 (0.0%) | 96 (100.0%) |
| 10 or more Apartments | 15 (3.0%) | 478 (97.0%) |
| Mobile Home / Other | 355 (89.6%) | 41 (10.3%) |
| Total | 3,547 (69.7%) | 1,540 (30.3%) |
Housing Structures by Number of Rooms in Marinette
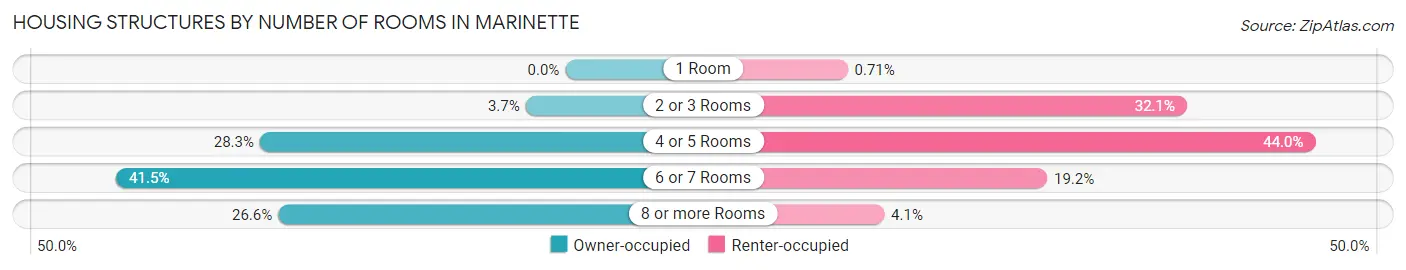
| Number of Rooms | Owner-occupied | Renter-occupied |
| 1 Room | 0 (0.0%) | 11 (0.7%) |
| 2 or 3 Rooms | 130 (3.7%) | 494 (32.1%) |
| 4 or 5 Rooms | 1,002 (28.2%) | 677 (44.0%) |
| 6 or 7 Rooms | 1,473 (41.5%) | 295 (19.2%) |
| 8 or more Rooms | 942 (26.6%) | 63 (4.1%) |
| Total | 3,547 (100.0%) | 1,540 (100.0%) |
Housing Structure by Heating Type in Marinette
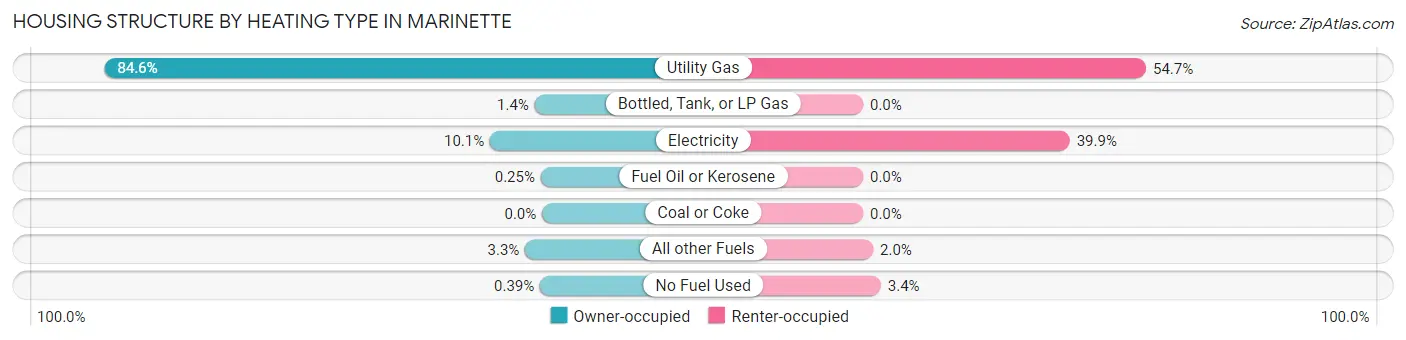
| Heating Type | Owner-occupied | Renter-occupied |
| Utility Gas | 3,000 (84.6%) | 842 (54.7%) |
| Bottled, Tank, or LP Gas | 51 (1.4%) | 0 (0.0%) |
| Electricity | 357 (10.1%) | 615 (39.9%) |
| Fuel Oil or Kerosene | 9 (0.3%) | 0 (0.0%) |
| Coal or Coke | 0 (0.0%) | 0 (0.0%) |
| All other Fuels | 116 (3.3%) | 30 (1.9%) |
| No Fuel Used | 14 (0.4%) | 53 (3.4%) |
| Total | 3,547 (100.0%) | 1,540 (100.0%) |
Household Vehicle Usage in Marinette
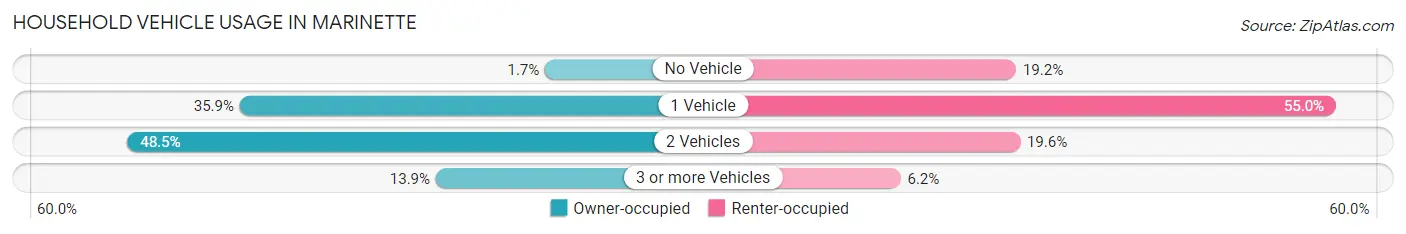
| Vehicles per Household | Owner-occupied | Renter-occupied |
| No Vehicle | 60 (1.7%) | 295 (19.2%) |
| 1 Vehicle | 1,273 (35.9%) | 847 (55.0%) |
| 2 Vehicles | 1,720 (48.5%) | 302 (19.6%) |
| 3 or more Vehicles | 494 (13.9%) | 96 (6.2%) |
| Total | 3,547 (100.0%) | 1,540 (100.0%) |
Real Estate & Mortgages in Marinette
Real Estate and Mortgage Overview in Marinette
| Characteristic | Without Mortgage | With Mortgage |
| Housing Units | 1,376 | 2,171 |
| Median Property Value | $84,000 | $110,000 |
| Median Household Income | $51,738 | $141 |
| Monthly Housing Costs | $439 | $61 |
| Real Estate Taxes | $1,714 | $36 |
Property Value by Mortgage Status in Marinette
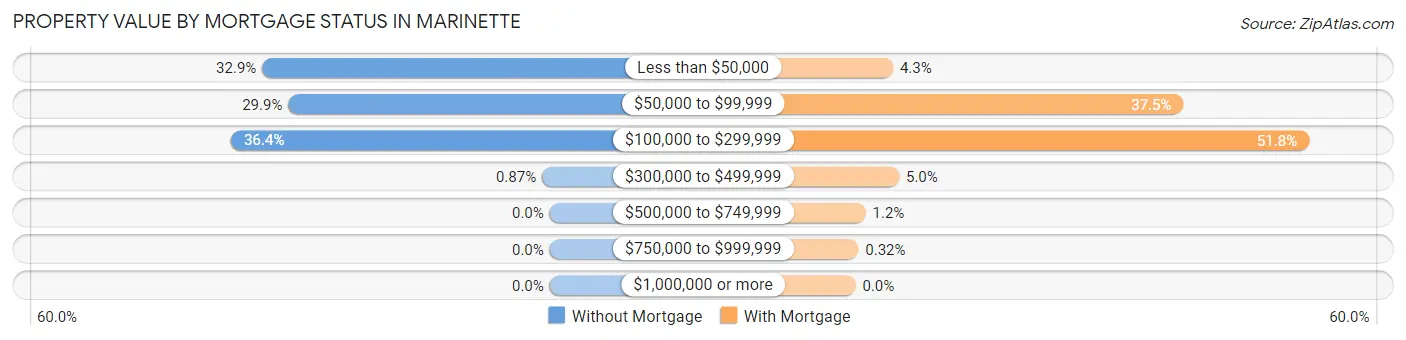
| Property Value | Without Mortgage | With Mortgage |
| Less than $50,000 | 452 (32.9%) | 93 (4.3%) |
| $50,000 to $99,999 | 411 (29.9%) | 813 (37.4%) |
| $100,000 to $299,999 | 501 (36.4%) | 1,125 (51.8%) |
| $300,000 to $499,999 | 12 (0.9%) | 108 (5.0%) |
| $500,000 to $749,999 | 0 (0.0%) | 25 (1.1%) |
| $750,000 to $999,999 | 0 (0.0%) | 7 (0.3%) |
| $1,000,000 or more | 0 (0.0%) | 0 (0.0%) |
| Total | 1,376 (100.0%) | 2,171 (100.0%) |
Household Income by Mortgage Status in Marinette
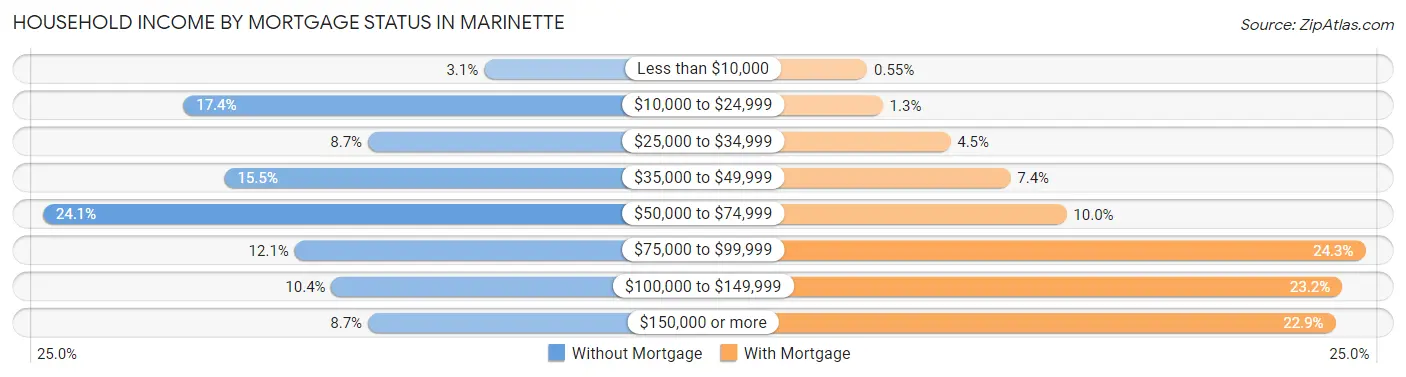
| Household Income | Without Mortgage | With Mortgage |
| Less than $10,000 | 43 (3.1%) | 12 (0.5%) |
| $10,000 to $24,999 | 240 (17.4%) | 28 (1.3%) |
| $25,000 to $34,999 | 119 (8.6%) | 98 (4.5%) |
| $35,000 to $49,999 | 213 (15.5%) | 160 (7.4%) |
| $50,000 to $74,999 | 332 (24.1%) | 218 (10.0%) |
| $75,000 to $99,999 | 167 (12.1%) | 527 (24.3%) |
| $100,000 to $149,999 | 143 (10.4%) | 503 (23.2%) |
| $150,000 or more | 119 (8.6%) | 496 (22.9%) |
| Total | 1,376 (100.0%) | 2,171 (100.0%) |
Property Value to Household Income Ratio in Marinette
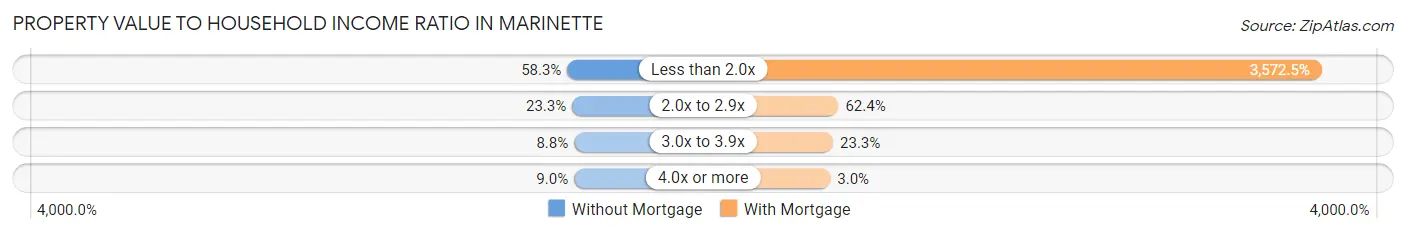
| Value-to-Income Ratio | Without Mortgage | With Mortgage |
| Less than 2.0x | 802 (58.3%) | 77,558 (3,572.5%) |
| 2.0x to 2.9x | 320 (23.3%) | 1,355 (62.4%) |
| 3.0x to 3.9x | 121 (8.8%) | 506 (23.3%) |
| 4.0x or more | 124 (9.0%) | 65 (3.0%) |
| Total | 1,376 (100.0%) | 2,171 (100.0%) |
Real Estate Taxes by Mortgage Status in Marinette
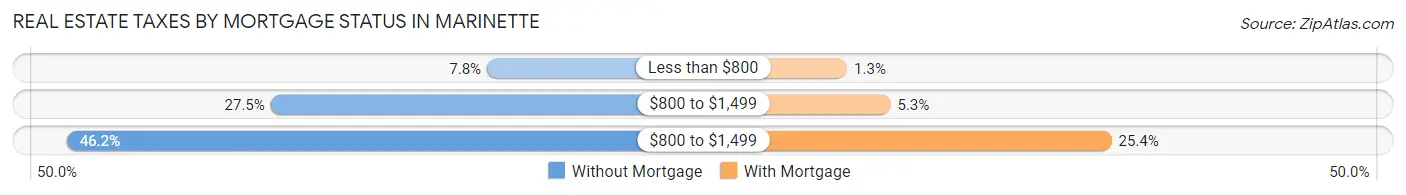
| Property Taxes | Without Mortgage | With Mortgage |
| Less than $800 | 107 (7.8%) | 28 (1.3%) |
| $800 to $1,499 | 379 (27.5%) | 114 (5.2%) |
| $800 to $1,499 | 635 (46.2%) | 552 (25.4%) |
| Total | 1,376 (100.0%) | 2,171 (100.0%) |
Health & Disability in Marinette
Health Insurance Coverage by Age in Marinette
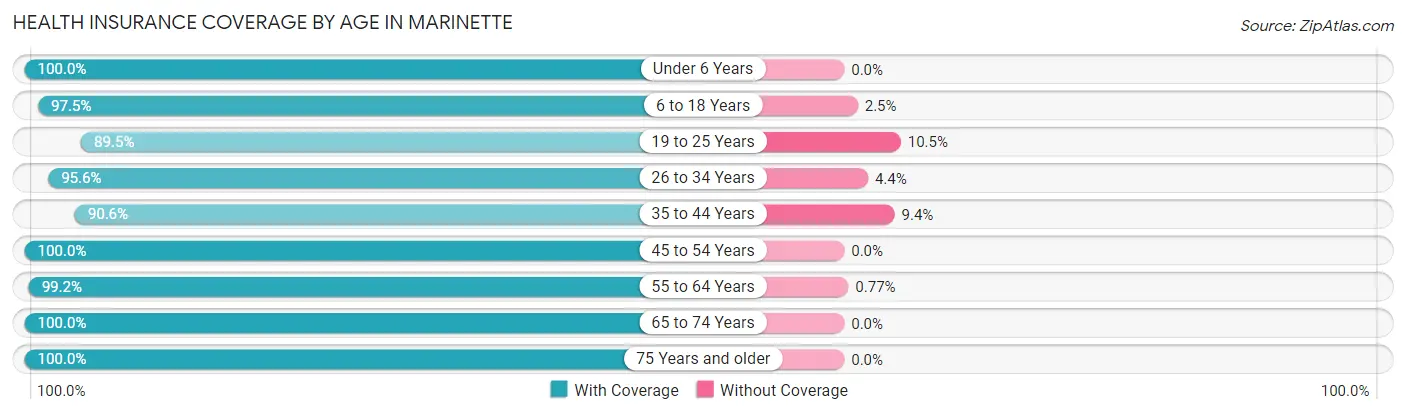
| Age Bracket | With Coverage | Without Coverage |
| Under 6 Years | 997 (100.0%) | 0 (0.0%) |
| 6 to 18 Years | 1,278 (97.5%) | 33 (2.5%) |
| 19 to 25 Years | 789 (89.5%) | 93 (10.5%) |
| 26 to 34 Years | 1,366 (95.6%) | 63 (4.4%) |
| 35 to 44 Years | 1,275 (90.6%) | 132 (9.4%) |
| 45 to 54 Years | 1,221 (100.0%) | 0 (0.0%) |
| 55 to 64 Years | 1,680 (99.2%) | 13 (0.8%) |
| 65 to 74 Years | 1,091 (100.0%) | 0 (0.0%) |
| 75 Years and older | 810 (100.0%) | 0 (0.0%) |
| Total | 10,507 (96.9%) | 334 (3.1%) |
Health Insurance Coverage by Citizenship Status in Marinette
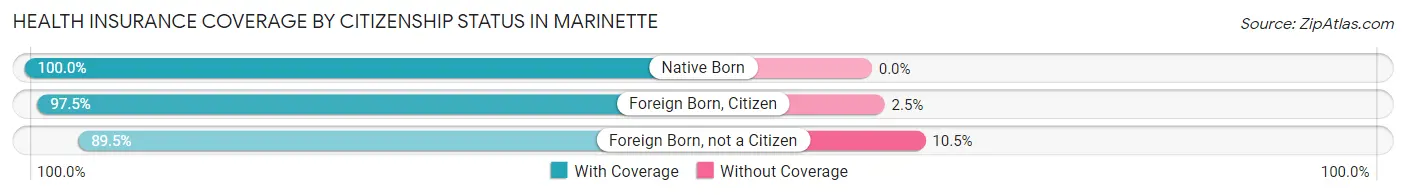
| Citizenship Status | With Coverage | Without Coverage |
| Native Born | 997 (100.0%) | 0 (0.0%) |
| Foreign Born, Citizen | 1,278 (97.5%) | 33 (2.5%) |
| Foreign Born, not a Citizen | 789 (89.5%) | 93 (10.5%) |
Health Insurance Coverage by Household Income in Marinette
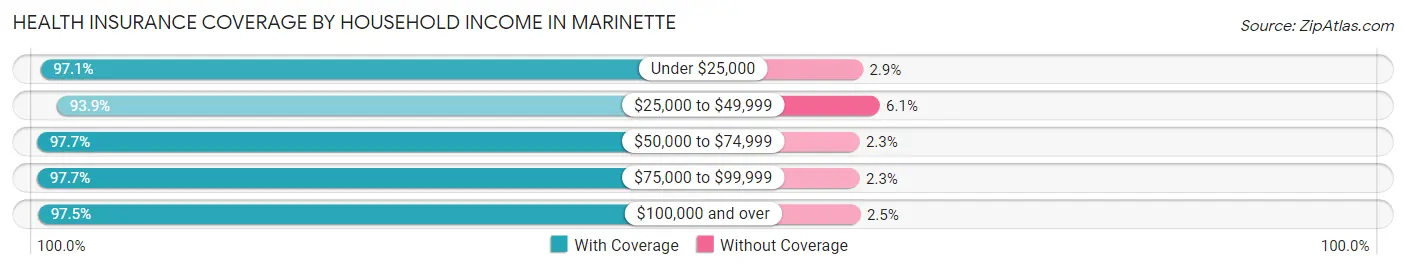
| Household Income | With Coverage | Without Coverage |
| Under $25,000 | 1,522 (97.1%) | 46 (2.9%) |
| $25,000 to $49,999 | 1,799 (93.9%) | 116 (6.1%) |
| $50,000 to $74,999 | 2,360 (97.7%) | 55 (2.3%) |
| $75,000 to $99,999 | 1,912 (97.7%) | 45 (2.3%) |
| $100,000 and over | 2,841 (97.5%) | 72 (2.5%) |
Public vs Private Health Insurance Coverage by Age in Marinette
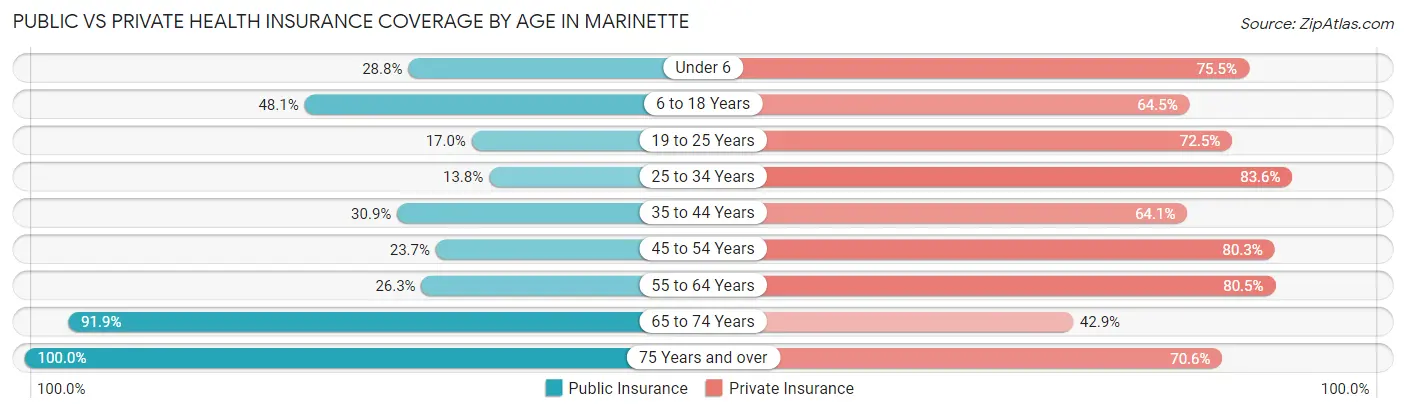
| Age Bracket | Public Insurance | Private Insurance |
| Under 6 | 287 (28.8%) | 753 (75.5%) |
| 6 to 18 Years | 630 (48.0%) | 846 (64.5%) |
| 19 to 25 Years | 150 (17.0%) | 639 (72.5%) |
| 25 to 34 Years | 197 (13.8%) | 1,195 (83.6%) |
| 35 to 44 Years | 434 (30.8%) | 902 (64.1%) |
| 45 to 54 Years | 289 (23.7%) | 981 (80.3%) |
| 55 to 64 Years | 446 (26.3%) | 1,362 (80.4%) |
| 65 to 74 Years | 1,003 (91.9%) | 468 (42.9%) |
| 75 Years and over | 810 (100.0%) | 572 (70.6%) |
| Total | 4,246 (39.2%) | 7,718 (71.2%) |
Disability Status by Sex by Age in Marinette
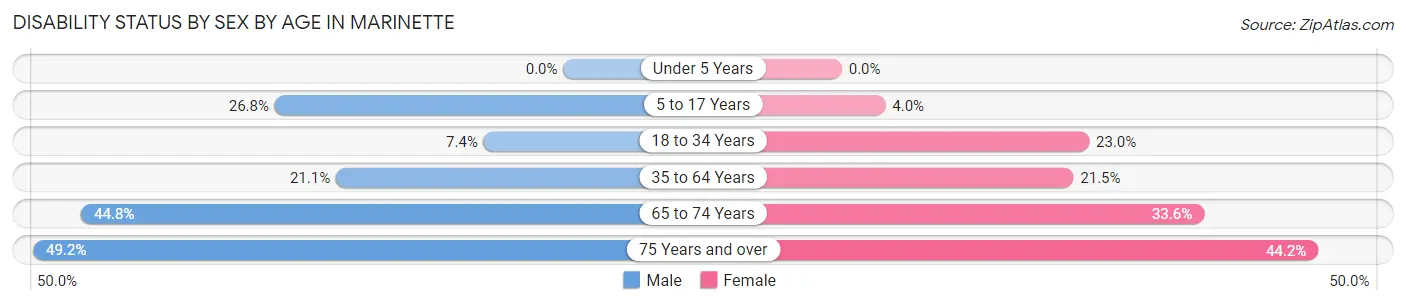
| Age Bracket | Male | Female |
| Under 5 Years | 0 (0.0%) | 0 (0.0%) |
| 5 to 17 Years | 229 (26.8%) | 25 (4.0%) |
| 18 to 34 Years | 101 (7.4%) | 243 (23.0%) |
| 35 to 64 Years | 470 (21.1%) | 450 (21.5%) |
| 65 to 74 Years | 222 (44.8%) | 200 (33.6%) |
| 75 Years and over | 186 (49.2%) | 191 (44.2%) |
Disability Class by Sex by Age in Marinette
Disability Class: Hearing Difficulty
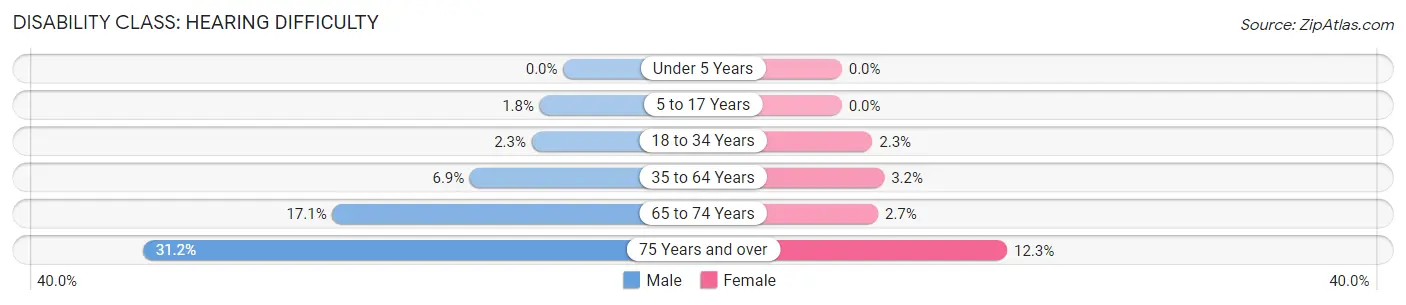
| Age Bracket | Male | Female |
| Under 5 Years | 0 (0.0%) | 0 (0.0%) |
| 5 to 17 Years | 15 (1.8%) | 0 (0.0%) |
| 18 to 34 Years | 32 (2.3%) | 24 (2.3%) |
| 35 to 64 Years | 154 (6.9%) | 66 (3.2%) |
| 65 to 74 Years | 85 (17.1%) | 16 (2.7%) |
| 75 Years and over | 118 (31.2%) | 53 (12.3%) |
Disability Class: Vision Difficulty
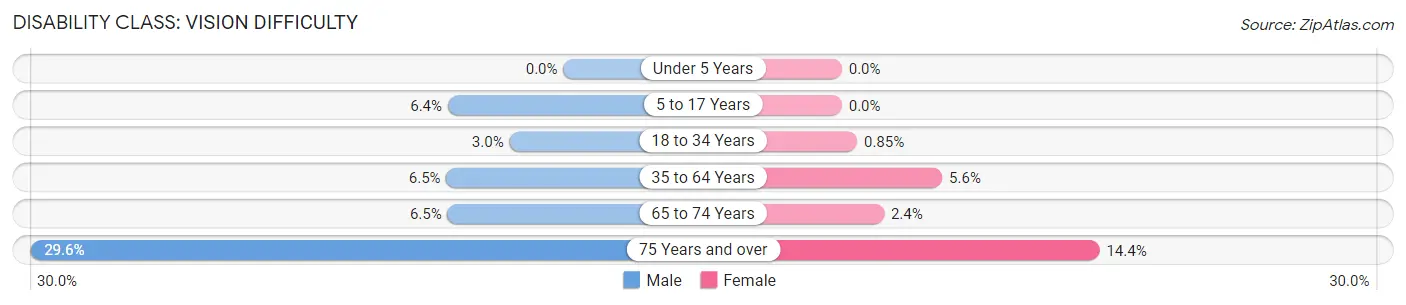
| Age Bracket | Male | Female |
| Under 5 Years | 0 (0.0%) | 0 (0.0%) |
| 5 to 17 Years | 55 (6.4%) | 0 (0.0%) |
| 18 to 34 Years | 41 (3.0%) | 9 (0.9%) |
| 35 to 64 Years | 145 (6.5%) | 117 (5.6%) |
| 65 to 74 Years | 32 (6.5%) | 14 (2.4%) |
| 75 Years and over | 112 (29.6%) | 62 (14.3%) |
Disability Class: Cognitive Difficulty
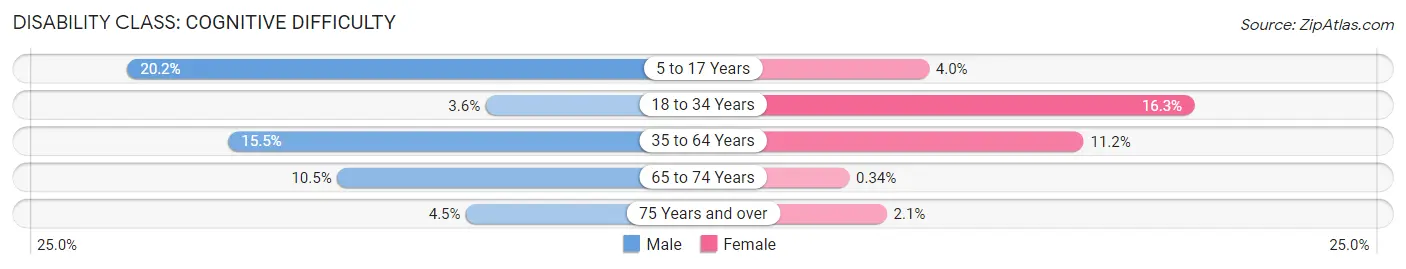
| Age Bracket | Male | Female |
| 5 to 17 Years | 173 (20.2%) | 25 (4.0%) |
| 18 to 34 Years | 49 (3.6%) | 173 (16.3%) |
| 35 to 64 Years | 346 (15.5%) | 235 (11.2%) |
| 65 to 74 Years | 52 (10.5%) | 2 (0.3%) |
| 75 Years and over | 17 (4.5%) | 9 (2.1%) |
Disability Class: Ambulatory Difficulty
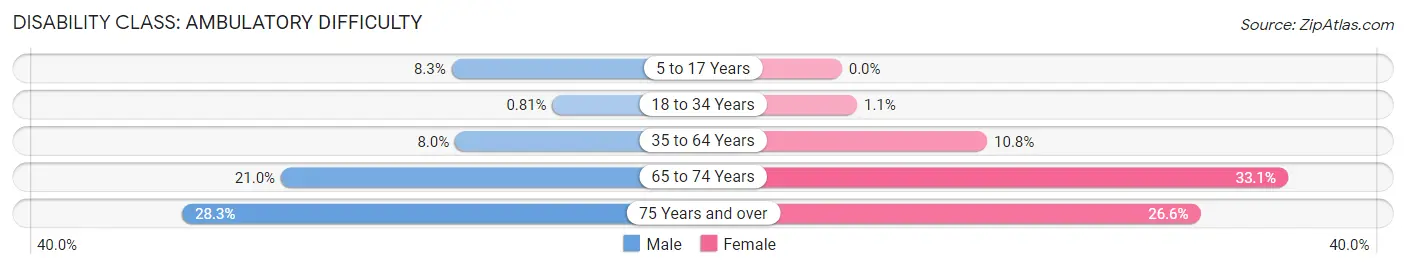
| Age Bracket | Male | Female |
| 5 to 17 Years | 71 (8.3%) | 0 (0.0%) |
| 18 to 34 Years | 11 (0.8%) | 12 (1.1%) |
| 35 to 64 Years | 179 (8.0%) | 226 (10.8%) |
| 65 to 74 Years | 104 (21.0%) | 197 (33.1%) |
| 75 Years and over | 107 (28.3%) | 115 (26.6%) |
Disability Class: Self-Care Difficulty
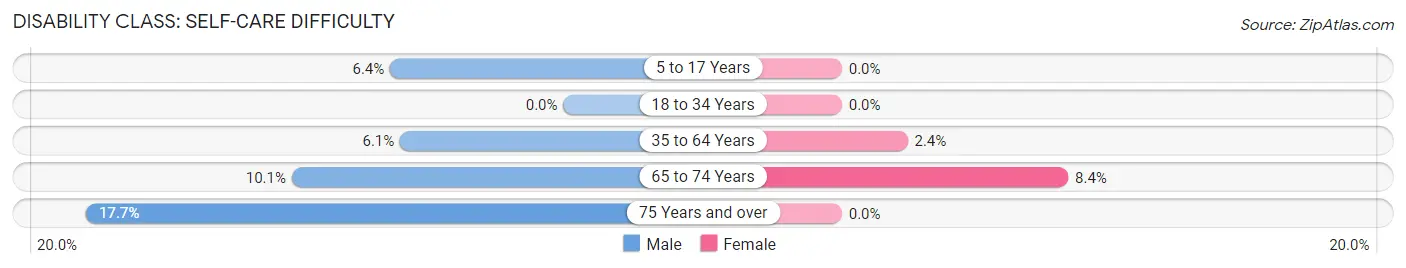
| Age Bracket | Male | Female |
| 5 to 17 Years | 55 (6.4%) | 0 (0.0%) |
| 18 to 34 Years | 0 (0.0%) | 0 (0.0%) |
| 35 to 64 Years | 135 (6.1%) | 51 (2.4%) |
| 65 to 74 Years | 50 (10.1%) | 50 (8.4%) |
| 75 Years and over | 67 (17.7%) | 0 (0.0%) |
Technology Access in Marinette
Computing Device Access in Marinette
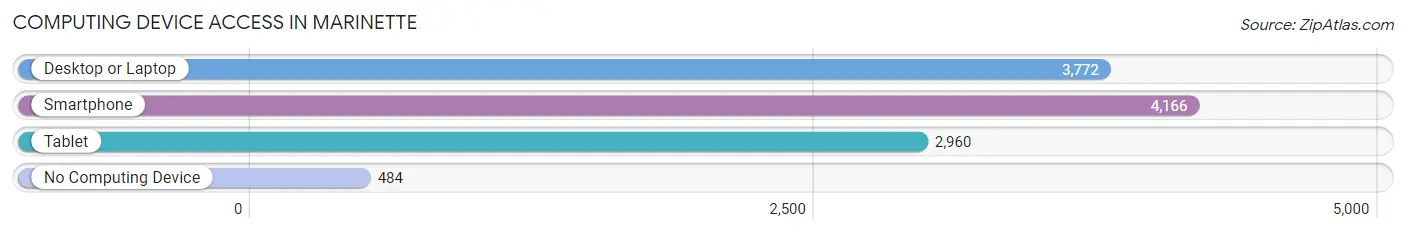
| Device Type | # Households | % Households |
| Desktop or Laptop | 3,772 | 74.2% |
| Smartphone | 4,166 | 81.9% |
| Tablet | 2,960 | 58.2% |
| No Computing Device | 484 | 9.5% |
| Total | 5,087 | 100.0% |
Internet Access in Marinette
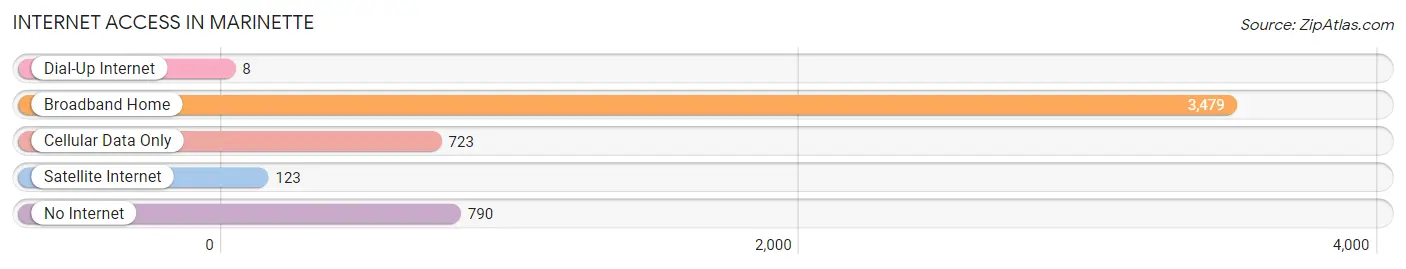
| Internet Type | # Households | % Households |
| Dial-Up Internet | 8 | 0.2% |
| Broadband Home | 3,479 | 68.4% |
| Cellular Data Only | 723 | 14.2% |
| Satellite Internet | 123 | 2.4% |
| No Internet | 790 | 15.5% |
| Total | 5,087 | 100.0% |
Marinette Summary
Marinette, Wisconsin is a city located in the northeastern corner of the state, along the Menominee River. It is the county seat of Marinette County and is part of the Green Bay Metropolitan Statistical Area. The city has a population of 10,919 as of the 2010 census.
Geography
Marinette is located at the confluence of the Menominee and Peshtigo Rivers, which form the border between Wisconsin and Michigan. The city is situated on the western shore of Green Bay, an arm of Lake Michigan. The city is surrounded by forests and lakes, and is located about 30 miles north of Green Bay and about 90 miles north of Milwaukee.
The city has a total area of 8.3 square miles, of which 8.2 square miles is land and 0.1 square miles is water. The terrain is generally flat, with some rolling hills in the northern part of the city.
History
Marinette was first settled in 1835 by French-Canadian fur traders. The city was incorporated in 1856 and was named after the Menominee Indian chief, Marinette. The city grew rapidly in the late 19th century due to the lumber industry, and by the early 20th century, it was the largest city in Marinette County.
The city was the site of a major shipbuilding industry during World War II, and the economy continued to be based on manufacturing and shipping until the late 20th century. In recent years, the city has seen a resurgence in tourism, with the opening of a casino and a number of other attractions.
Economy
Marinette’s economy is largely based on manufacturing and shipping. The city is home to several large manufacturing companies, including Marinette Marine, which builds ships for the U.S. Navy, and the Marinette Foundry and Machine Company, which produces industrial machinery. The city is also home to a number of smaller businesses, including a number of restaurants, retail stores, and service providers.
The city is also home to a number of tourist attractions, including the Menominee River Museum, the Marinette County Historical Society, and the Marinette County Park. The city is also home to a number of festivals and events throughout the year, including the Marinette County Fair and the Marinette County Music Festival.
Demographics
As of the 2010 census, the population of Marinette was 10,919. The racial makeup of the city was 94.2% White, 0.7% African American, 0.7% Native American, 0.7% Asian, 0.1% Pacific Islander, 1.7% from other races, and 2.0% from two or more races. Hispanic or Latino of any race were 4.2% of the population.
The median household income in Marinette was $37,917, and the median family income was $45,917. The per capita income for the city was $20,845. About 14.2% of families and 17.2% of the population were below the poverty line, including 25.2% of those under age 18 and 8.2% of those age 65 or over.
Marinette is served by the Marinette School District, which includes four elementary schools, one middle school, and one high school. The city is also home to the University of Wisconsin-Marinette, which offers a variety of undergraduate and graduate degree programs.
Common Questions
What is Per Capita Income in Marinette?
Per Capita income in Marinette is $32,510.
What is the Median Family Income in Marinette?
Median Family Income in Marinette is $71,957.
What is the Median Household income in Marinette?
Median Household Income in Marinette is $54,969.
What is Income or Wage Gap in Marinette?
Income or Wage Gap in Marinette is 42.9%.
Women in Marinette earn 57.1 cents for every dollar earned by a man.
What is Inequality or Gini Index in Marinette?
Inequality or Gini Index in Marinette is 0.42.
What is the Total Population of Marinette?
Total Population of Marinette is 11,065.
What is the Total Male Population of Marinette?
Total Male Population of Marinette is 5,820.
What is the Total Female Population of Marinette?
Total Female Population of Marinette is 5,245.
What is the Ratio of Males per 100 Females in Marinette?
There are 110.96 Males per 100 Females in Marinette.
What is the Ratio of Females per 100 Males in Marinette?
There are 90.12 Females per 100 Males in Marinette.
What is the Median Population Age in Marinette?
Median Population Age in Marinette is 41.1 Years.
What is the Average Family Size in Marinette
Average Family Size in Marinette is 2.8 People.
What is the Average Household Size in Marinette
Average Household Size in Marinette is 2.1 People.
How Large is the Labor Force in Marinette?
There are 5,618 People in the Labor Forcein in Marinette.
What is the Percentage of People in the Labor Force in Marinette?
62.2% of People are in the Labor Force in Marinette.
What is the Unemployment Rate in Marinette?
Unemployment Rate in Marinette is 3.4%.