Loyal, WI Map & Demographics
Loyal Map
Loyal Overview
$33,629
PER CAPITA INCOME
$77,083
AVG FAMILY INCOME
$59,938
AVG HOUSEHOLD INCOME
44.8%
WAGE / INCOME GAP [ % ]
55.2¢/ $1
WAGE / INCOME GAP [ $ ]
0.38
INEQUALITY / GINI INDEX
1,328
TOTAL POPULATION
605
MALE POPULATION
723
FEMALE POPULATION
83.68
MALES / 100 FEMALES
119.50
FEMALES / 100 MALES
41.2
MEDIAN AGE
2.9
AVG FAMILY SIZE
2.3
AVG HOUSEHOLD SIZE
686
LABOR FORCE [ PEOPLE ]
64.8%
PERCENT IN LABOR FORCE
0.4%
UNEMPLOYMENT RATE
Loyal Zip Codes
Loyal Area Codes
Income in Loyal
Income Overview in Loyal
Per Capita Income in Loyal is $33,629, while median incomes of families and households are $77,083 and $59,938 respectively.
| Characteristic | Number | Measure |
| Per Capita Income | 1,328 | $33,629 |
| Median Family Income | 343 | $77,083 |
| Mean Family Income | 343 | $88,029 |
| Median Household Income | 579 | $59,938 |
| Mean Household Income | 579 | $71,954 |
| Income Deficit | 343 | $0 |
| Wage / Income Gap (%) | 1,328 | 44.76% |
| Wage / Income Gap ($) | 1,328 | 55.24¢ per $1 |
| Gini / Inequality Index | 1,328 | 0.38 |
Earnings by Sex in Loyal
Average Earnings in Loyal are $37,150, $48,594 for men and $26,845 for women, a difference of 44.8%.
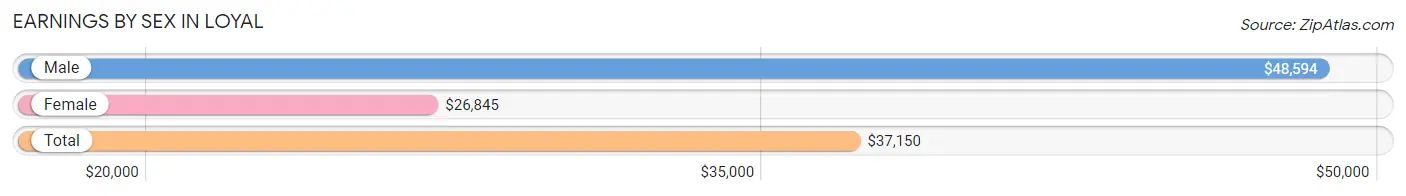
| Sex | Number | Average Earnings |
| Male | 338 (44.8%) | $48,594 |
| Female | 417 (55.2%) | $26,845 |
| Total | 755 (100.0%) | $37,150 |
Earnings by Sex by Income Bracket in Loyal
The most common earnings brackets in Loyal are $55,000 to $64,999 for men (77 | 22.8%) and $40,000 to $44,999 for women (63 | 15.1%).
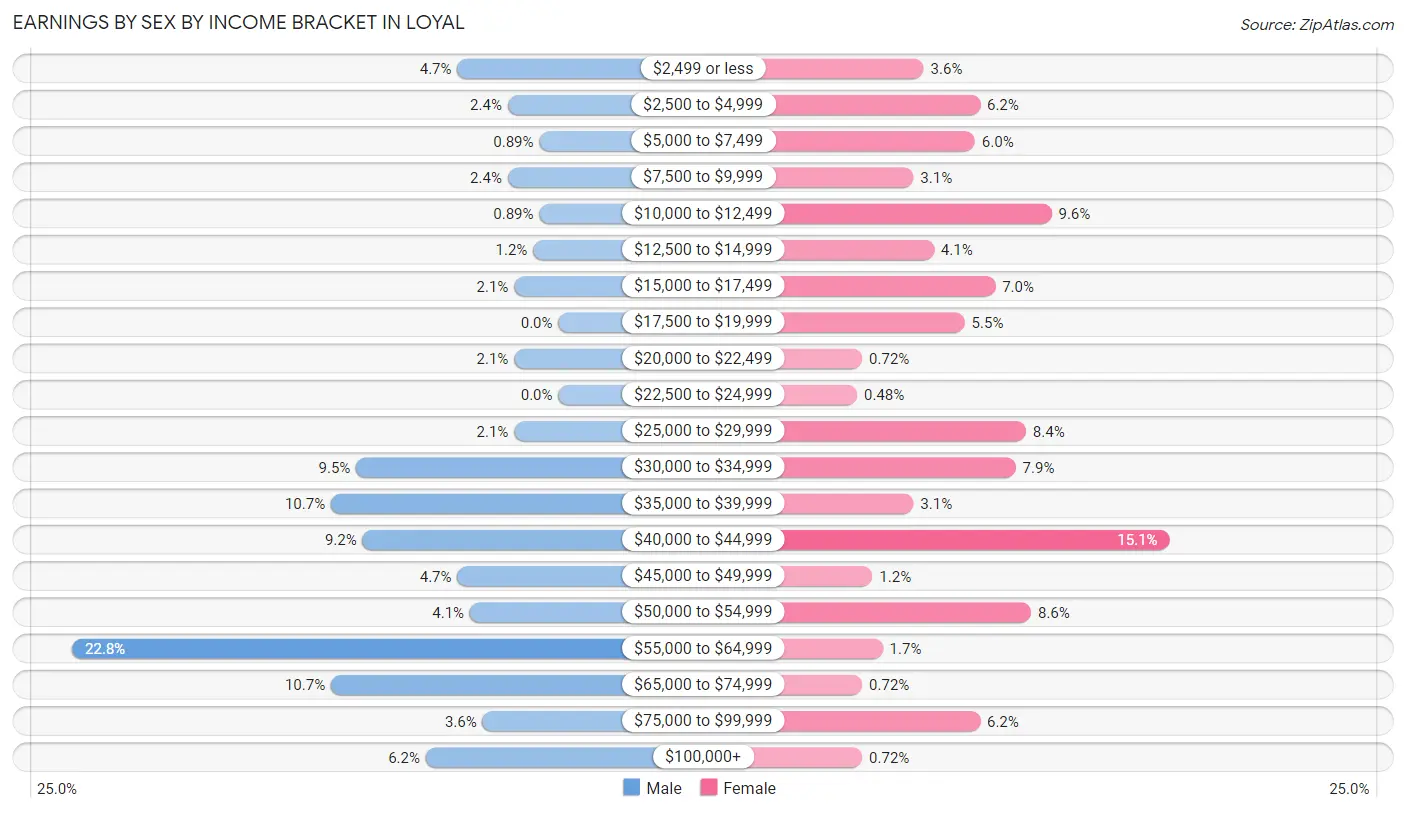
| Income | Male | Female |
| $2,499 or less | 16 (4.7%) | 15 (3.6%) |
| $2,500 to $4,999 | 8 (2.4%) | 26 (6.2%) |
| $5,000 to $7,499 | 3 (0.9%) | 25 (6.0%) |
| $7,500 to $9,999 | 8 (2.4%) | 13 (3.1%) |
| $10,000 to $12,499 | 3 (0.9%) | 40 (9.6%) |
| $12,500 to $14,999 | 4 (1.2%) | 17 (4.1%) |
| $15,000 to $17,499 | 7 (2.1%) | 29 (7.0%) |
| $17,500 to $19,999 | 0 (0.0%) | 23 (5.5%) |
| $20,000 to $22,499 | 7 (2.1%) | 3 (0.7%) |
| $22,500 to $24,999 | 0 (0.0%) | 2 (0.5%) |
| $25,000 to $29,999 | 7 (2.1%) | 35 (8.4%) |
| $30,000 to $34,999 | 32 (9.5%) | 33 (7.9%) |
| $35,000 to $39,999 | 36 (10.6%) | 13 (3.1%) |
| $40,000 to $44,999 | 31 (9.2%) | 63 (15.1%) |
| $45,000 to $49,999 | 16 (4.7%) | 5 (1.2%) |
| $50,000 to $54,999 | 14 (4.1%) | 36 (8.6%) |
| $55,000 to $64,999 | 77 (22.8%) | 7 (1.7%) |
| $65,000 to $74,999 | 36 (10.6%) | 3 (0.7%) |
| $75,000 to $99,999 | 12 (3.5%) | 26 (6.2%) |
| $100,000+ | 21 (6.2%) | 3 (0.7%) |
| Total | 338 (100.0%) | 417 (100.0%) |
Earnings by Sex by Educational Attainment in Loyal
Average earnings in Loyal are $54,643 for men and $25,893 for women, a difference of 52.6%. Men with an educational attainment of bachelor's degree enjoy the highest average annual earnings of $73,750, while those with college or associate's degree education earn the least with $39,931. Women with an educational attainment of high school diploma earn the most with the average annual earnings of $40,368, while those with college or associate's degree education have the smallest earnings of $13,523.
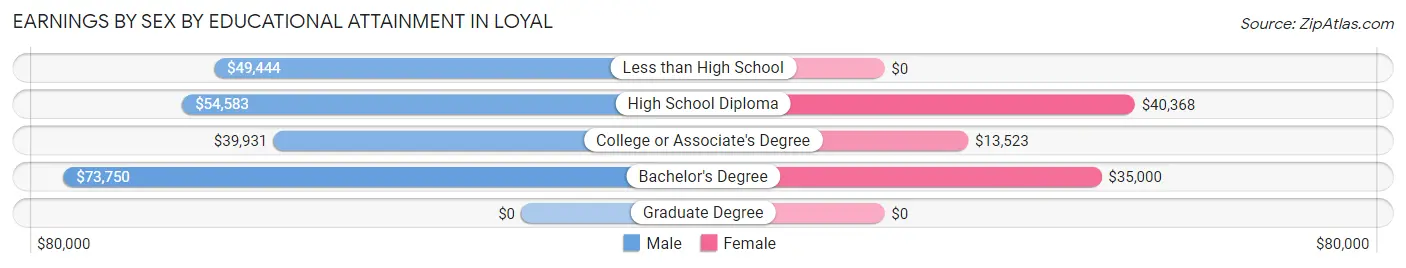
| Educational Attainment | Male Income | Female Income |
| Less than High School | $49,444 | $0 |
| High School Diploma | $54,583 | $40,368 |
| College or Associate's Degree | $39,931 | $13,523 |
| Bachelor's Degree | $73,750 | $35,000 |
| Graduate Degree | - | - |
| Total | $54,643 | $25,893 |
Family Income in Loyal
Family Income Brackets in Loyal
According to the Loyal family income data, there are 76 families falling into the $50,000 to $74,999 income range, which is the most common income bracket and makes up 22.2% of all families. Conversely, the $200,000+ income bracket is the least frequent group with only 3 families (0.9%) belonging to this category.
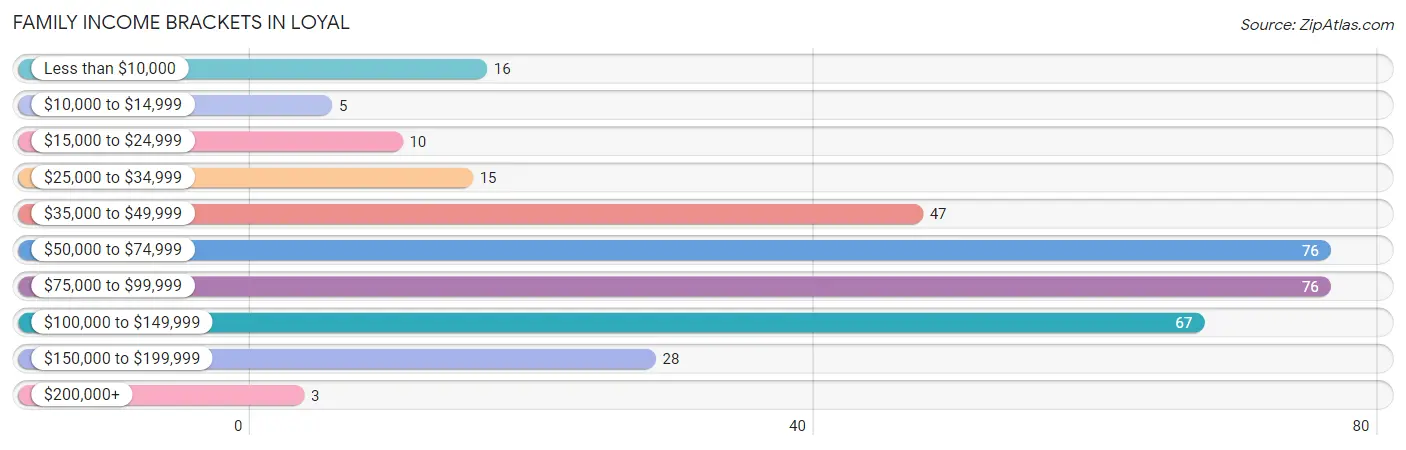
| Income Bracket | # Families | % Families |
| Less than $10,000 | 16 | 4.7% |
| $10,000 to $14,999 | 5 | 1.5% |
| $15,000 to $24,999 | 10 | 2.9% |
| $25,000 to $34,999 | 15 | 4.4% |
| $35,000 to $49,999 | 47 | 13.7% |
| $50,000 to $74,999 | 76 | 22.2% |
| $75,000 to $99,999 | 76 | 22.2% |
| $100,000 to $149,999 | 67 | 19.5% |
| $150,000 to $199,999 | 28 | 8.2% |
| $200,000+ | 3 | 0.9% |
Family Income by Famaliy Size in Loyal
4-person families (38 | 11.1%) account for the highest median family income in Loyal with $116,667 per family, while 2-person families (180 | 52.5%) have the highest median income of $36,666 per family member.
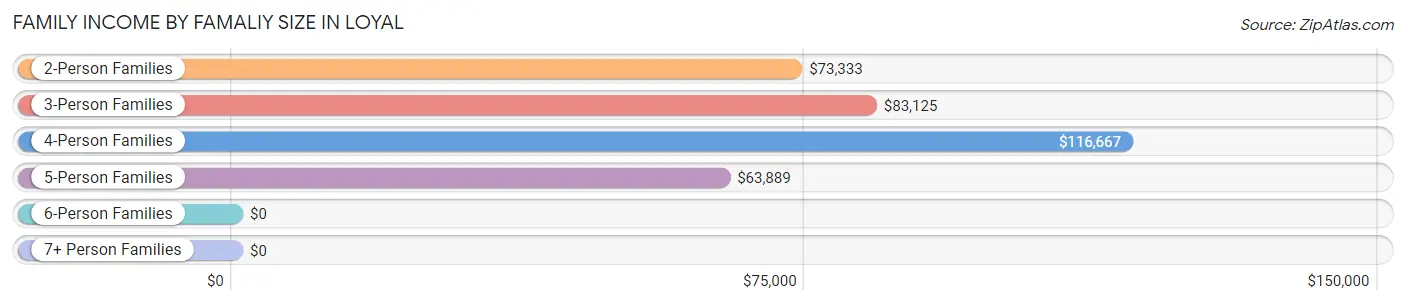
| Income Bracket | # Families | Median Income |
| 2-Person Families | 180 (52.5%) | $73,333 |
| 3-Person Families | 81 (23.6%) | $83,125 |
| 4-Person Families | 38 (11.1%) | $116,667 |
| 5-Person Families | 38 (11.1%) | $63,889 |
| 6-Person Families | 6 (1.8%) | $0 |
| 7+ Person Families | 0 (0.0%) | $0 |
| Total | 343 (100.0%) | $77,083 |
Family Income by Number of Earners in Loyal
The median family income in Loyal is $77,083, with families comprising 3+ earners (30) having the highest median family income of $114,167, while families with no earners (33) have the lowest median family income of $55,625, accounting for 8.7% and 9.6% of families, respectively.
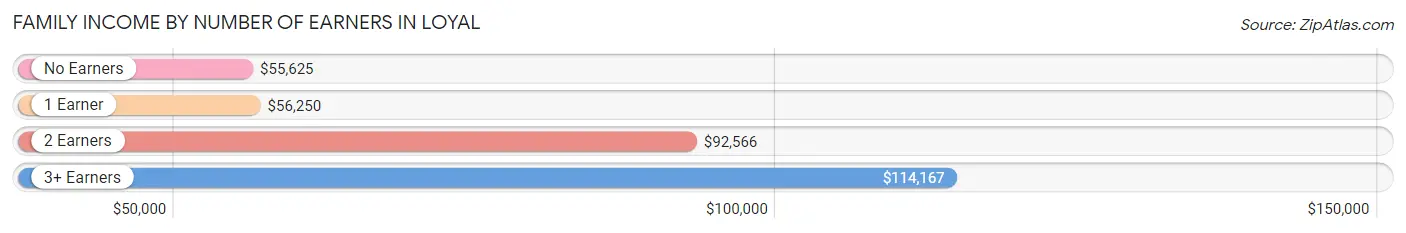
| Number of Earners | # Families | Median Income |
| No Earners | 33 (9.6%) | $55,625 |
| 1 Earner | 129 (37.6%) | $56,250 |
| 2 Earners | 151 (44.0%) | $92,566 |
| 3+ Earners | 30 (8.7%) | $114,167 |
| Total | 343 (100.0%) | $77,083 |
Household Income in Loyal
Household Income Brackets in Loyal
With 158 households falling in the category, the $50,000 to $74,999 income range is the most frequent in Loyal, accounting for 27.3% of all households. In contrast, only 3 households (0.5%) fall into the $200,000+ income bracket, making it the least populous group.
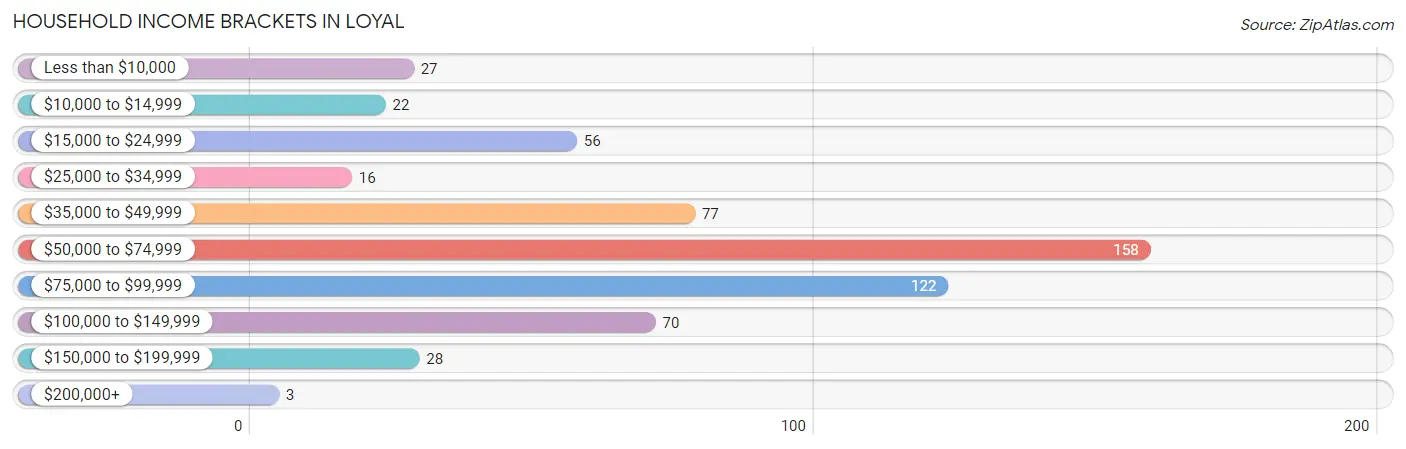
| Income Bracket | # Households | % Households |
| Less than $10,000 | 27 | 4.7% |
| $10,000 to $14,999 | 22 | 3.8% |
| $15,000 to $24,999 | 56 | 9.7% |
| $25,000 to $34,999 | 16 | 2.8% |
| $35,000 to $49,999 | 77 | 13.3% |
| $50,000 to $74,999 | 158 | 27.3% |
| $75,000 to $99,999 | 122 | 21.1% |
| $100,000 to $149,999 | 70 | 12.1% |
| $150,000 to $199,999 | 28 | 4.8% |
| $200,000+ | 3 | 0.5% |
Household Income by Householder Age in Loyal
The median household income in Loyal is $59,938, with the highest median household income of $66,250 found in the 45 to 64 years age bracket for the primary householder. A total of 170 households (29.4%) fall into this category. Meanwhile, the 15 to 24 years age bracket for the primary householder has the lowest median household income of $53,750, with 34 households (5.9%) in this group.
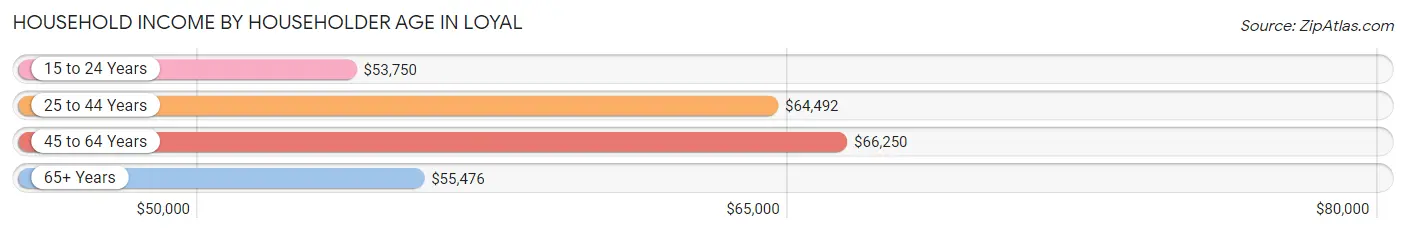
| Income Bracket | # Households | Median Income |
| 15 to 24 Years | 34 (5.9%) | $53,750 |
| 25 to 44 Years | 159 (27.5%) | $64,492 |
| 45 to 64 Years | 170 (29.4%) | $66,250 |
| 65+ Years | 216 (37.3%) | $55,476 |
| Total | 579 (100.0%) | $59,938 |
Poverty in Loyal
Income Below Poverty by Sex and Age in Loyal
With 13.6% poverty level for males and 9.7% for females among the residents of Loyal, 5 year old males and under 5 year old females are the most vulnerable to poverty, with 7 males (46.7%) and 11 females (30.6%) in their respective age groups living below the poverty level.
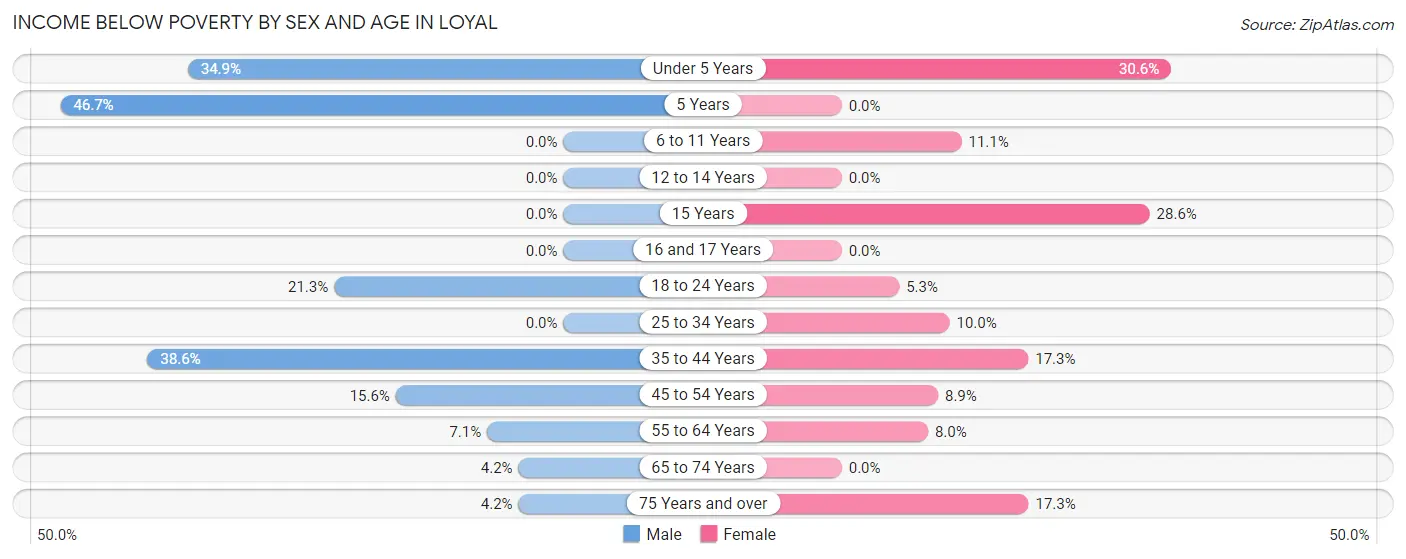
| Age Bracket | Male | Female |
| Under 5 Years | 23 (34.8%) | 11 (30.6%) |
| 5 Years | 7 (46.7%) | 0 (0.0%) |
| 6 to 11 Years | 0 (0.0%) | 7 (11.1%) |
| 12 to 14 Years | 0 (0.0%) | 0 (0.0%) |
| 15 Years | 0 (0.0%) | 4 (28.6%) |
| 16 and 17 Years | 0 (0.0%) | 0 (0.0%) |
| 18 to 24 Years | 10 (21.3%) | 4 (5.3%) |
| 25 to 34 Years | 0 (0.0%) | 9 (10.0%) |
| 35 to 44 Years | 22 (38.6%) | 9 (17.3%) |
| 45 to 54 Years | 7 (15.6%) | 5 (8.9%) |
| 55 to 64 Years | 8 (7.1%) | 8 (8.0%) |
| 65 to 74 Years | 3 (4.2%) | 0 (0.0%) |
| 75 Years and over | 2 (4.2%) | 13 (17.3%) |
| Total | 82 (13.6%) | 70 (9.7%) |
Income Above Poverty by Sex and Age in Loyal
According to the poverty statistics in Loyal, males aged 6 to 11 years and females aged 5 years are the age groups that are most secure financially, with 100.0% of males and 100.0% of females in these age groups living above the poverty line.
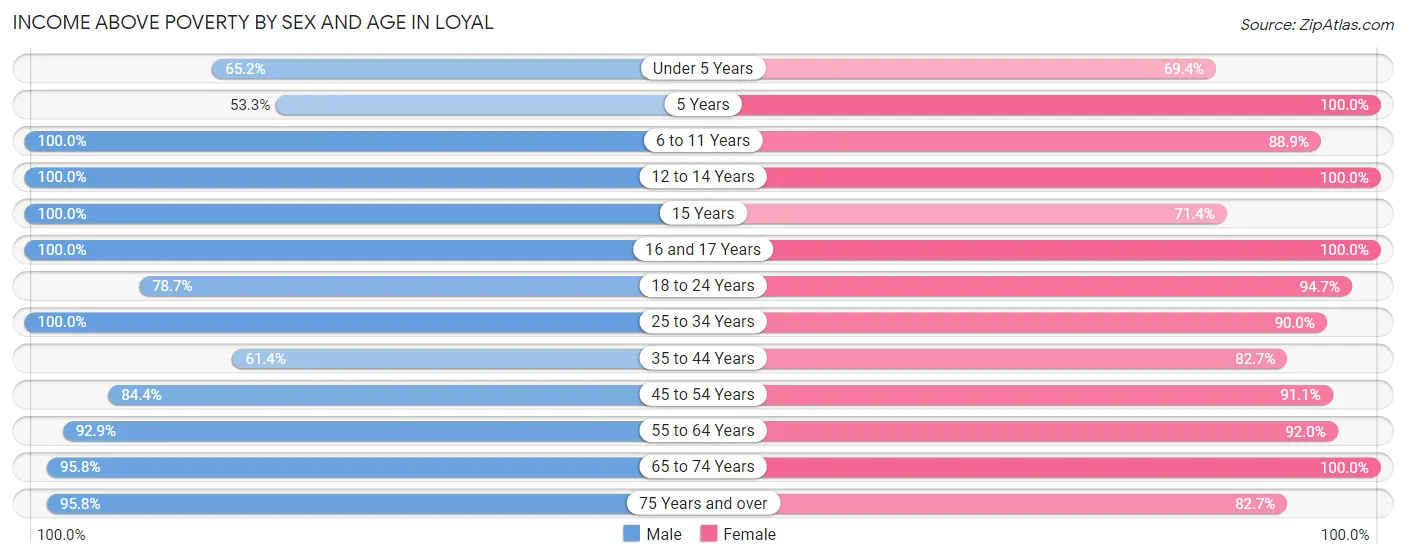
| Age Bracket | Male | Female |
| Under 5 Years | 43 (65.1%) | 25 (69.4%) |
| 5 Years | 8 (53.3%) | 8 (100.0%) |
| 6 to 11 Years | 31 (100.0%) | 56 (88.9%) |
| 12 to 14 Years | 5 (100.0%) | 24 (100.0%) |
| 15 Years | 2 (100.0%) | 10 (71.4%) |
| 16 and 17 Years | 3 (100.0%) | 17 (100.0%) |
| 18 to 24 Years | 37 (78.7%) | 71 (94.7%) |
| 25 to 34 Years | 99 (100.0%) | 81 (90.0%) |
| 35 to 44 Years | 35 (61.4%) | 43 (82.7%) |
| 45 to 54 Years | 38 (84.4%) | 51 (91.1%) |
| 55 to 64 Years | 105 (92.9%) | 92 (92.0%) |
| 65 to 74 Years | 69 (95.8%) | 110 (100.0%) |
| 75 Years and over | 46 (95.8%) | 62 (82.7%) |
| Total | 521 (86.4%) | 650 (90.3%) |
Income Below Poverty Among Married-Couple Families in Loyal
The poverty statistics for married-couple families in Loyal show that 3.6% or 10 of the total 279 families live below the poverty line. Families with 1 or 2 children have the highest poverty rate of 8.9%, comprising of 7 families. On the other hand, families with 3 or 4 children have the lowest poverty rate of 0.0%, which includes 0 families.
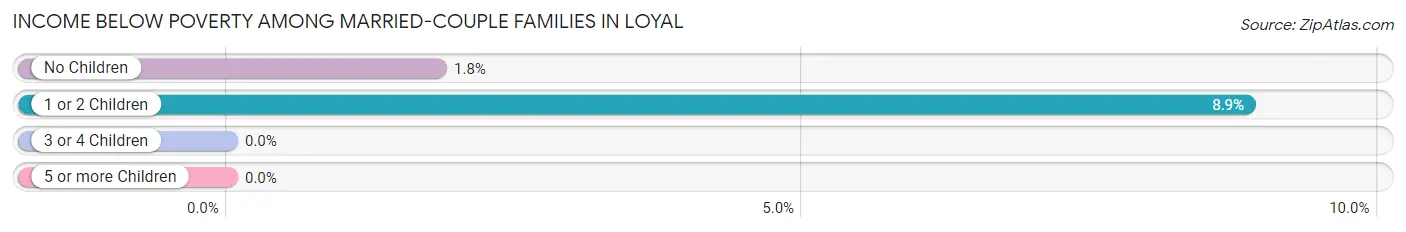
| Children | Above Poverty | Below Poverty |
| No Children | 162 (98.2%) | 3 (1.8%) |
| 1 or 2 Children | 72 (91.1%) | 7 (8.9%) |
| 3 or 4 Children | 35 (100.0%) | 0 (0.0%) |
| 5 or more Children | 0 (0.0%) | 0 (0.0%) |
| Total | 269 (96.4%) | 10 (3.6%) |
Income Below Poverty Among Single-Parent Households in Loyal
According to the poverty data in Loyal, 21.0% or 4 single-father households and 31.1% or 14 single-mother households are living below the poverty line. Among single-father households, those with 1 or 2 children have the highest poverty rate, with 4 households (33.3%) experiencing poverty. Likewise, among single-mother households, those with 3 or 4 children have the highest poverty rate, with 9 households (100.0%) falling below the poverty line.
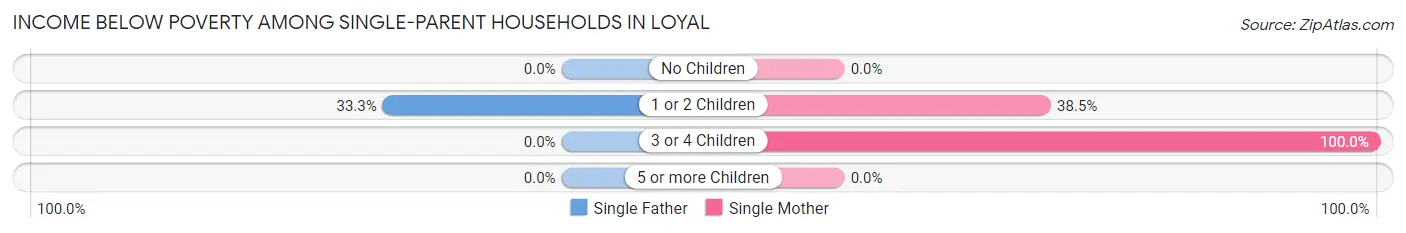
| Children | Single Father | Single Mother |
| No Children | 0 (0.0%) | 0 (0.0%) |
| 1 or 2 Children | 4 (33.3%) | 5 (38.5%) |
| 3 or 4 Children | 0 (0.0%) | 9 (100.0%) |
| 5 or more Children | 0 (0.0%) | 0 (0.0%) |
| Total | 4 (21.0%) | 14 (31.1%) |
Income Below Poverty Among Married-Couple vs Single-Parent Households in Loyal
The poverty data for Loyal shows that 10 of the married-couple family households (3.6%) and 18 of the single-parent households (28.1%) are living below the poverty level. Within the married-couple family households, those with 1 or 2 children have the highest poverty rate, with 7 households (8.9%) falling below the poverty line. Among the single-parent households, those with 3 or 4 children have the highest poverty rate, with 9 household (100.0%) living below poverty.
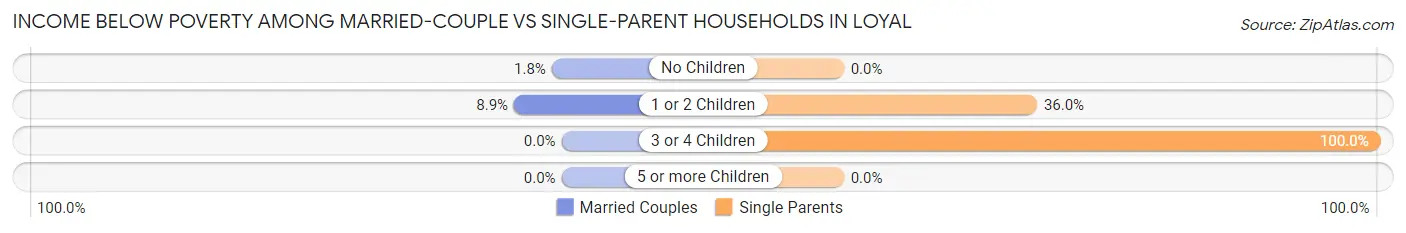
| Children | Married-Couple Families | Single-Parent Households |
| No Children | 3 (1.8%) | 0 (0.0%) |
| 1 or 2 Children | 7 (8.9%) | 9 (36.0%) |
| 3 or 4 Children | 0 (0.0%) | 9 (100.0%) |
| 5 or more Children | 0 (0.0%) | 0 (0.0%) |
| Total | 10 (3.6%) | 18 (28.1%) |
Race in Loyal
The most populous races in Loyal are White / Caucasian (1,252 | 94.3%), Two or more Races (63 | 4.7%), and Hispanic or Latino (38 | 2.9%).
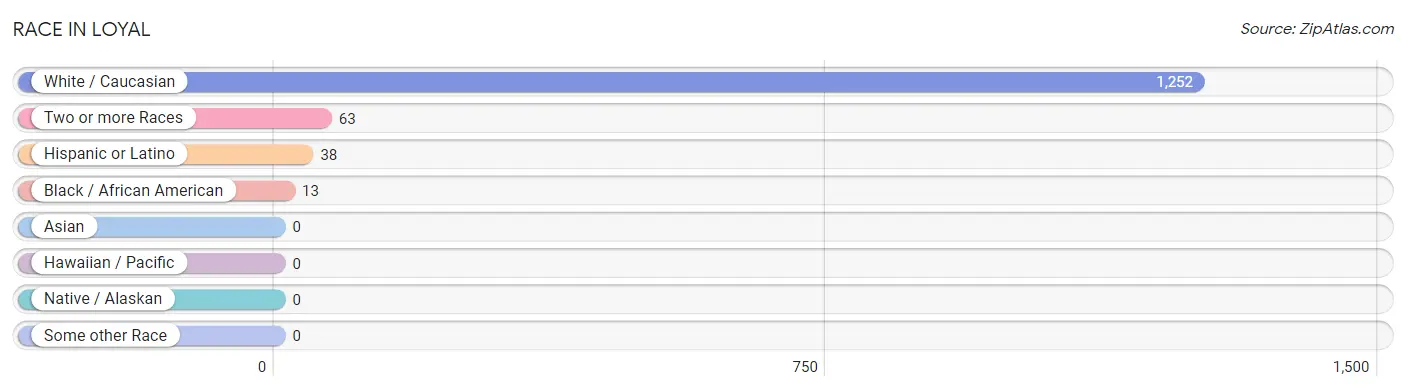
| Race | # Population | % Population |
| Asian | 0 | 0.0% |
| Black / African American | 13 | 1.0% |
| Hawaiian / Pacific | 0 | 0.0% |
| Hispanic or Latino | 38 | 2.9% |
| Native / Alaskan | 0 | 0.0% |
| White / Caucasian | 1,252 | 94.3% |
| Two or more Races | 63 | 4.7% |
| Some other Race | 0 | 0.0% |
| Total | 1,328 | 100.0% |
Ancestry in Loyal
The most populous ancestries reported in Loyal are German (643 | 48.4%), American (89 | 6.7%), Irish (77 | 5.8%), Norwegian (66 | 5.0%), and English (65 | 4.9%), together accounting for 70.8% of all Loyal residents.
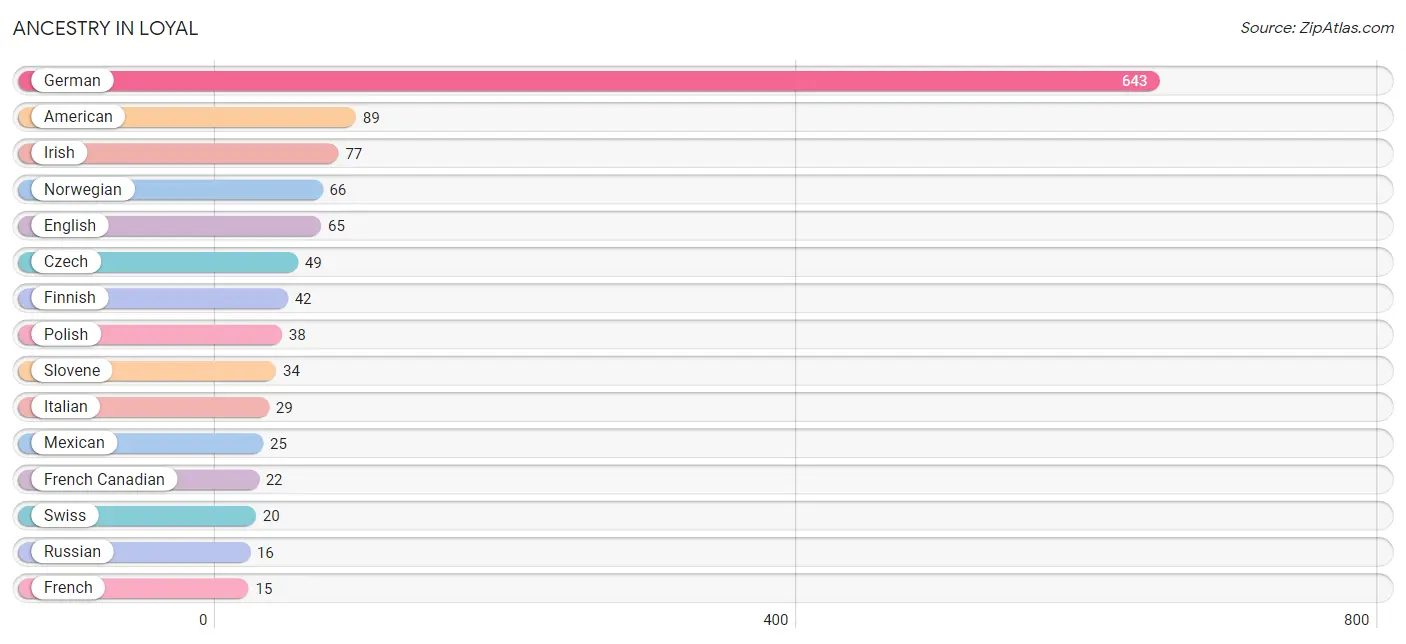
| Ancestry | # Population | % Population |
| American | 89 | 6.7% |
| Canadian | 6 | 0.4% |
| Croatian | 3 | 0.2% |
| Czech | 49 | 3.7% |
| Danish | 6 | 0.4% |
| Dutch | 13 | 1.0% |
| English | 65 | 4.9% |
| European | 3 | 0.2% |
| Finnish | 42 | 3.2% |
| French | 15 | 1.1% |
| French Canadian | 22 | 1.7% |
| German | 643 | 48.4% |
| Irish | 77 | 5.8% |
| Italian | 29 | 2.2% |
| Mexican | 25 | 1.9% |
| Norwegian | 66 | 5.0% |
| Polish | 38 | 2.9% |
| Puerto Rican | 13 | 1.0% |
| Russian | 16 | 1.2% |
| Scotch-Irish | 7 | 0.5% |
| Scottish | 3 | 0.2% |
| Slovak | 4 | 0.3% |
| Slovene | 34 | 2.6% |
| Swedish | 9 | 0.7% |
| Swiss | 20 | 1.5% | View All 25 Rows |
Immigrants in Loyal
The most numerous immigrant groups reported in Loyal came from Europe (6 | 0.4%), Northern Europe (6 | 0.4%), Central America (5 | 0.4%), Latin America (5 | 0.4%), and Mexico (5 | 0.4%), together accounting for 2.0% of all Loyal residents.
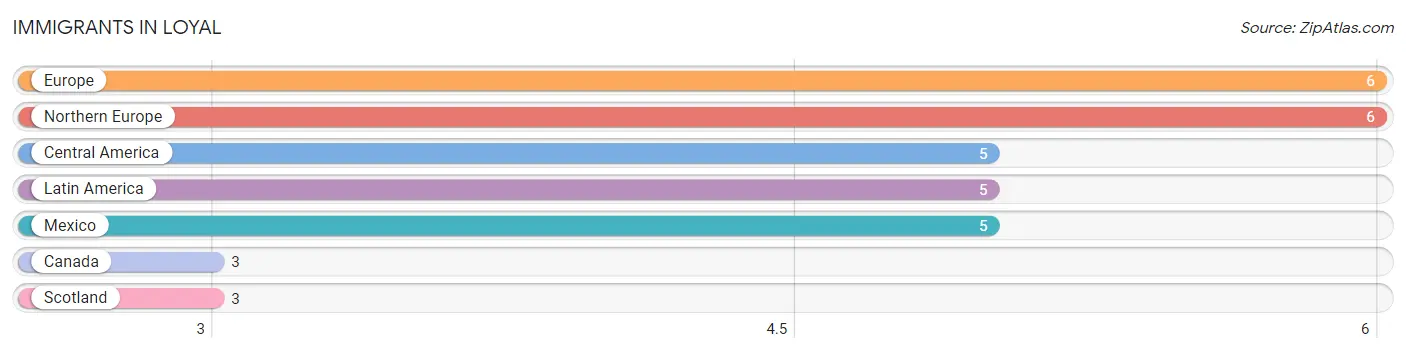
| Immigration Origin | # Population | % Population |
| Canada | 3 | 0.2% |
| Central America | 5 | 0.4% |
| Europe | 6 | 0.4% |
| Latin America | 5 | 0.4% |
| Mexico | 5 | 0.4% |
| Northern Europe | 6 | 0.4% |
| Scotland | 3 | 0.2% | View All 7 Rows |
Sex and Age in Loyal
Sex and Age in Loyal
The most populous age groups in Loyal are Under 5 Years (68 | 11.2%) for men and 20 to 24 Years (72 | 10.0%) for women.
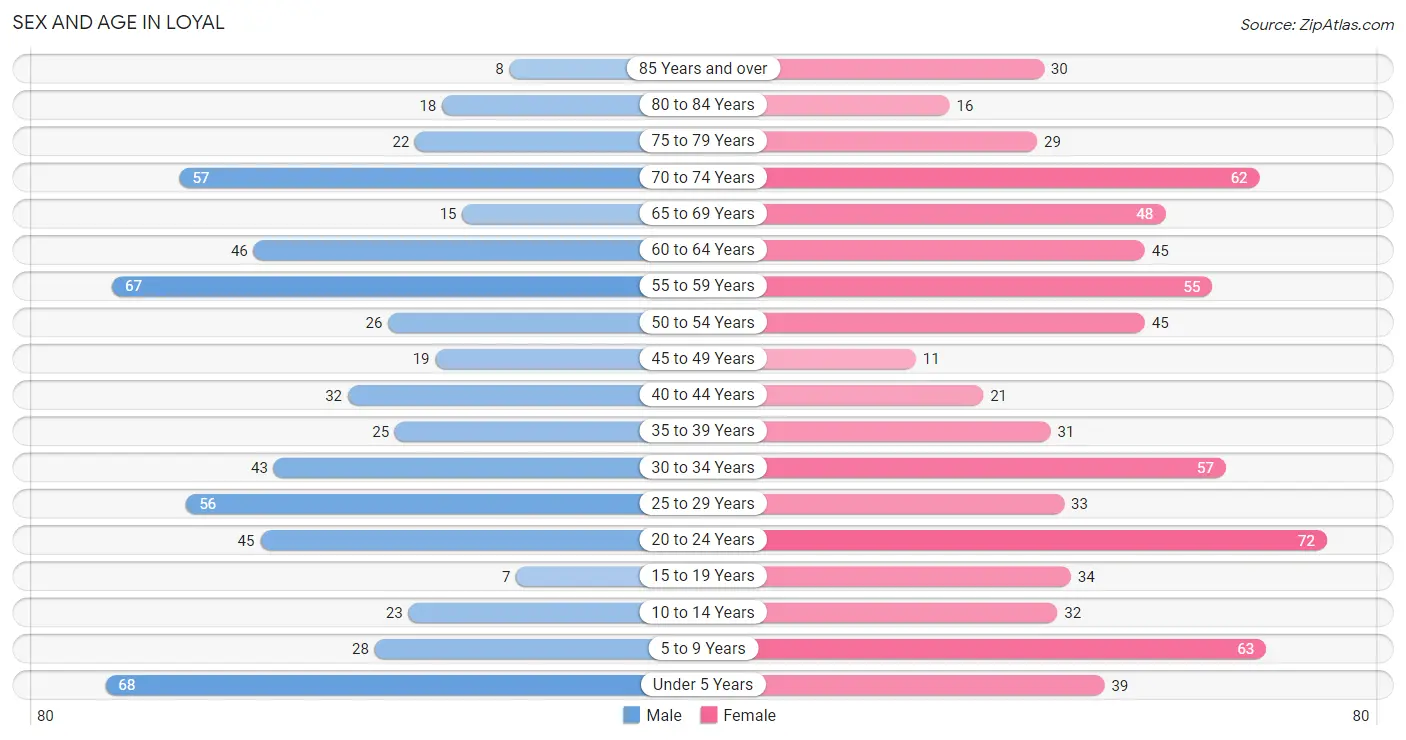
| Age Bracket | Male | Female |
| Under 5 Years | 68 (11.2%) | 39 (5.4%) |
| 5 to 9 Years | 28 (4.6%) | 63 (8.7%) |
| 10 to 14 Years | 23 (3.8%) | 32 (4.4%) |
| 15 to 19 Years | 7 (1.2%) | 34 (4.7%) |
| 20 to 24 Years | 45 (7.4%) | 72 (10.0%) |
| 25 to 29 Years | 56 (9.3%) | 33 (4.6%) |
| 30 to 34 Years | 43 (7.1%) | 57 (7.9%) |
| 35 to 39 Years | 25 (4.1%) | 31 (4.3%) |
| 40 to 44 Years | 32 (5.3%) | 21 (2.9%) |
| 45 to 49 Years | 19 (3.1%) | 11 (1.5%) |
| 50 to 54 Years | 26 (4.3%) | 45 (6.2%) |
| 55 to 59 Years | 67 (11.1%) | 55 (7.6%) |
| 60 to 64 Years | 46 (7.6%) | 45 (6.2%) |
| 65 to 69 Years | 15 (2.5%) | 48 (6.6%) |
| 70 to 74 Years | 57 (9.4%) | 62 (8.6%) |
| 75 to 79 Years | 22 (3.6%) | 29 (4.0%) |
| 80 to 84 Years | 18 (3.0%) | 16 (2.2%) |
| 85 Years and over | 8 (1.3%) | 30 (4.2%) |
| Total | 605 (100.0%) | 723 (100.0%) |
Families and Households in Loyal
Median Family Size in Loyal
The median family size in Loyal is 2.94 persons per family, with married-couple families (279 | 81.3%) accounting for the largest median family size of 3.02 persons per family. On the other hand, single male/father families (19 | 5.5%) represent the smallest median family size with 2.32 persons per family.
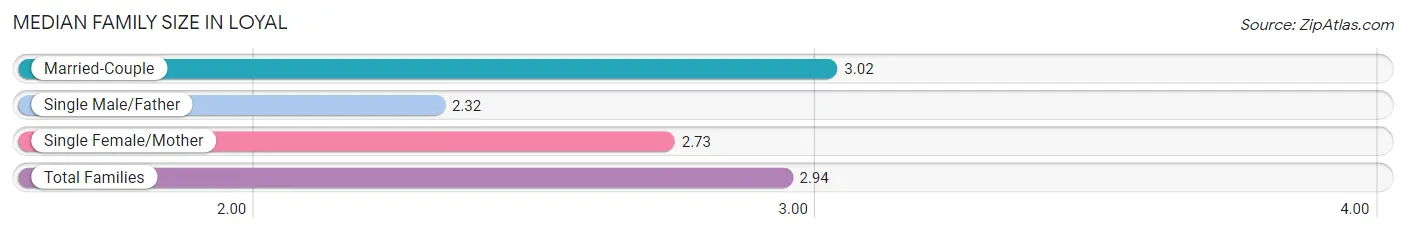
| Family Type | # Families | Family Size |
| Married-Couple | 279 (81.3%) | 3.02 |
| Single Male/Father | 19 (5.5%) | 2.32 |
| Single Female/Mother | 45 (13.1%) | 2.73 |
| Total Families | 343 (100.0%) | 2.94 |
Median Household Size in Loyal
The median household size in Loyal is 2.29 persons per household, with single male/father households (19 | 3.3%) accounting for the largest median household size of 3.53 persons per household. non-family households (236 | 40.8%) represent the smallest median household size with 1.14 persons per household.
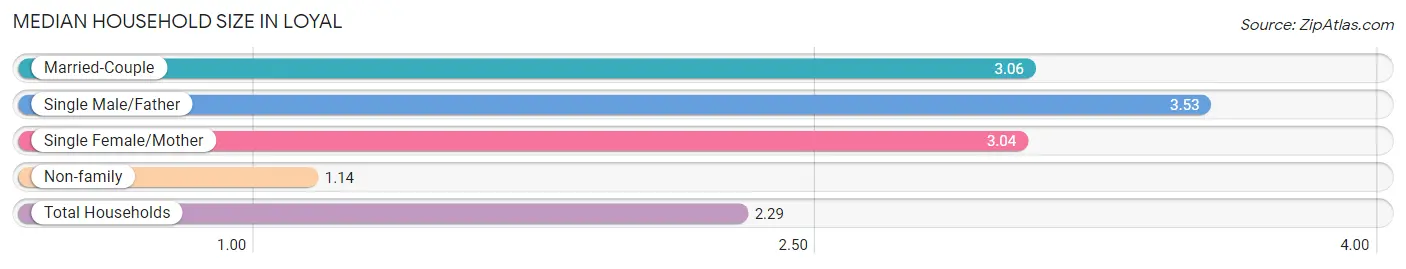
| Household Type | # Households | Household Size |
| Married-Couple | 279 (48.2%) | 3.06 |
| Single Male/Father | 19 (3.3%) | 3.53 |
| Single Female/Mother | 45 (7.8%) | 3.04 |
| Non-family | 236 (40.8%) | 1.14 |
| Total Households | 579 (100.0%) | 2.29 |
Household Size by Marriage Status in Loyal
Out of a total of 579 households in Loyal, 343 (59.2%) are family households, while 236 (40.8%) are nonfamily households. The most numerous type of family households are 2-person households, comprising 163, and the most common type of nonfamily households are 1-person households, comprising 201.
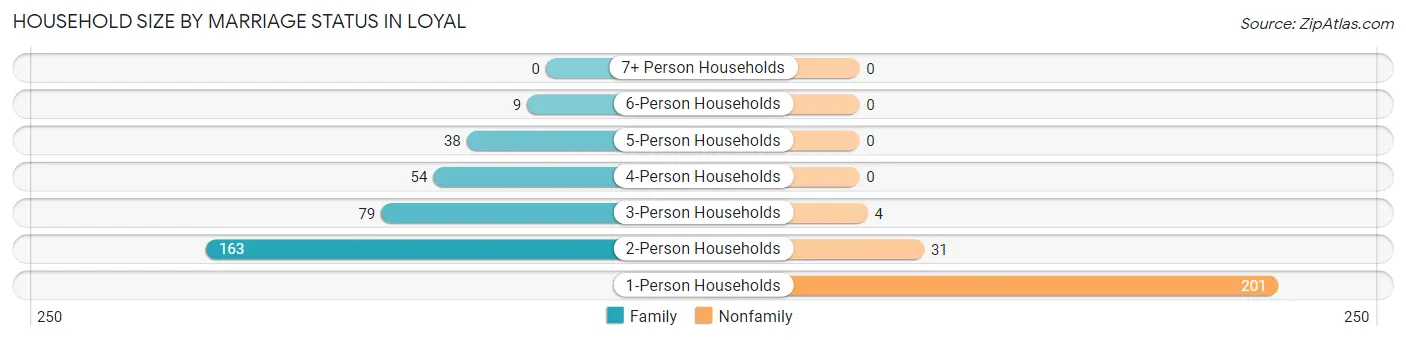
| Household Size | Family Households | Nonfamily Households |
| 1-Person Households | - | 201 (34.7%) |
| 2-Person Households | 163 (28.1%) | 31 (5.3%) |
| 3-Person Households | 79 (13.6%) | 4 (0.7%) |
| 4-Person Households | 54 (9.3%) | 0 (0.0%) |
| 5-Person Households | 38 (6.6%) | 0 (0.0%) |
| 6-Person Households | 9 (1.5%) | 0 (0.0%) |
| 7+ Person Households | 0 (0.0%) | 0 (0.0%) |
| Total | 343 (59.2%) | 236 (40.8%) |
Female Fertility in Loyal
Fertility by Age in Loyal
Average fertility rate in Loyal is 30.0 births per 1,000 women. Women in the age bracket of 20 to 34 years have the highest fertility rate with 49.0 births per 1,000 women. Women in the age bracket of 20 to 34 years acount for 100.0% of all women with births.
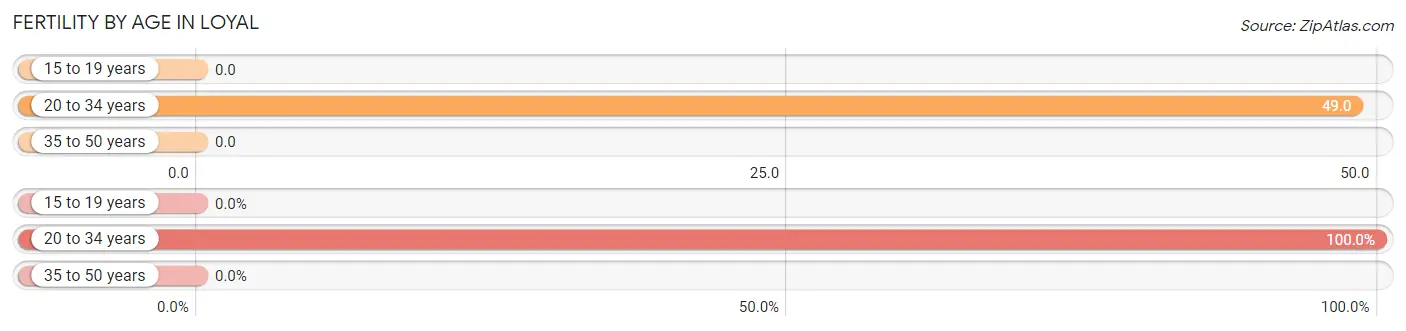
| Age Bracket | Women with Births | Births / 1,000 Women |
| 15 to 19 years | 0 (0.0%) | 0.0 |
| 20 to 34 years | 8 (100.0%) | 49.0 |
| 35 to 50 years | 0 (0.0%) | 0.0 |
| Total | 8 (100.0%) | 30.0 |
Fertility by Age by Marriage Status in Loyal
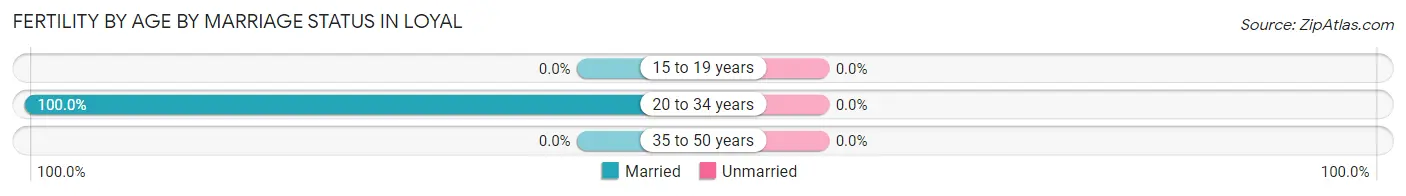
| Age Bracket | Married | Unmarried |
| 15 to 19 years | 0 (0.0%) | 0 (0.0%) |
| 20 to 34 years | 8 (100.0%) | 0 (0.0%) |
| 35 to 50 years | 0 (0.0%) | 0 (0.0%) |
| Total | 8 (100.0%) | 0 (0.0%) |
Fertility by Education in Loyal
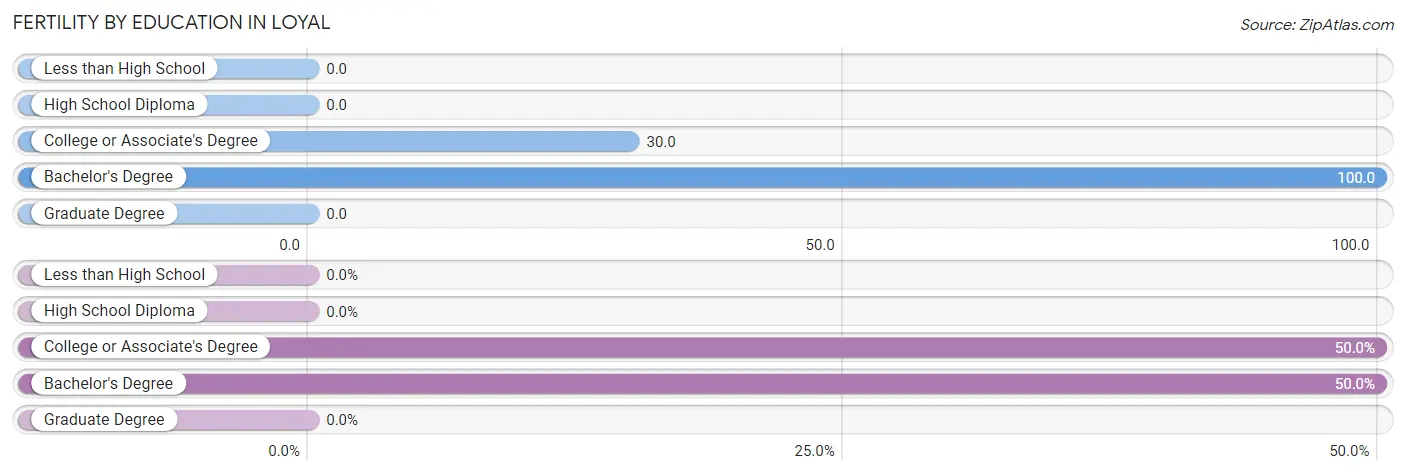
| Educational Attainment | Women with Births | Births / 1,000 Women |
| Less than High School | 0 (0.0%) | 0.0 |
| High School Diploma | 0 (0.0%) | 0.0 |
| College or Associate's Degree | 4 (50.0%) | 30.0 |
| Bachelor's Degree | 4 (50.0%) | 100.0 |
| Graduate Degree | 0 (0.0%) | 0.0 |
| Total | 8 (100.0%) | 30.0 |
Fertility by Education by Marriage Status in Loyal
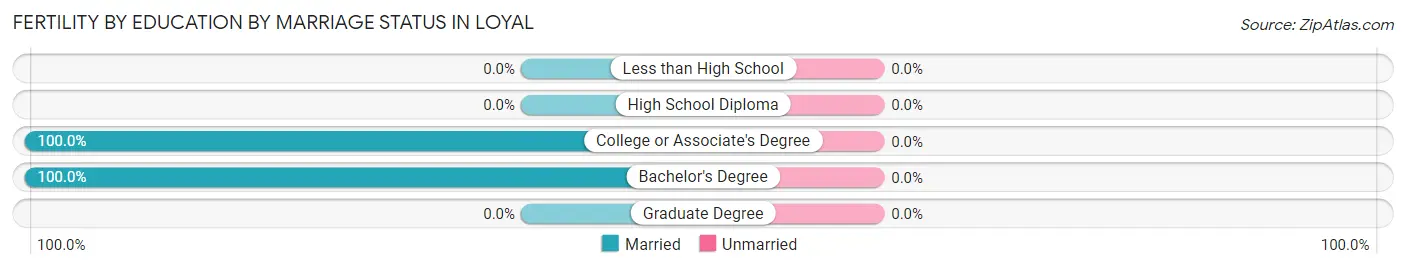
| Educational Attainment | Married | Unmarried |
| Less than High School | 0 (0.0%) | 0 (0.0%) |
| High School Diploma | 0 (0.0%) | 0 (0.0%) |
| College or Associate's Degree | 4 (100.0%) | 0 (0.0%) |
| Bachelor's Degree | 4 (100.0%) | 0 (0.0%) |
| Graduate Degree | 0 (0.0%) | 0 (0.0%) |
| Total | 8 (100.0%) | 0 (0.0%) |
Employment Characteristics in Loyal
Employment by Class of Employer in Loyal
Among the 676 employed individuals in Loyal, private company employees (490 | 72.5%), local government employees (63 | 9.3%), and not-for-profit organizations (56 | 8.3%) make up the most common classes of employment.
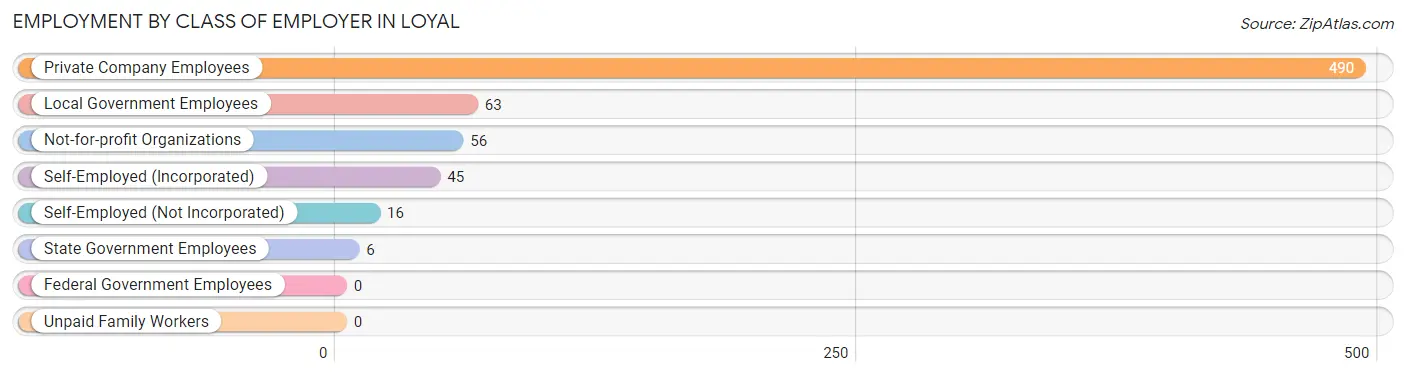
| Employer Class | # Employees | % Employees |
| Private Company Employees | 490 | 72.5% |
| Self-Employed (Incorporated) | 45 | 6.7% |
| Self-Employed (Not Incorporated) | 16 | 2.4% |
| Not-for-profit Organizations | 56 | 8.3% |
| Local Government Employees | 63 | 9.3% |
| State Government Employees | 6 | 0.9% |
| Federal Government Employees | 0 | 0.0% |
| Unpaid Family Workers | 0 | 0.0% |
| Total | 676 | 100.0% |
Employment Status by Age in Loyal
According to the labor force statistics for Loyal, out of the total population over 16 years of age (1,059), 64.8% or 686 individuals are in the labor force, with 0.4% or 3 of them unemployed. The age group with the highest labor force participation rate is 20 to 24 years, with 97.4% or 114 individuals in the labor force. Within the labor force, the 30 to 34 years age range has the highest percentage of unemployed individuals, with 3.9% or 3 of them being unemployed.
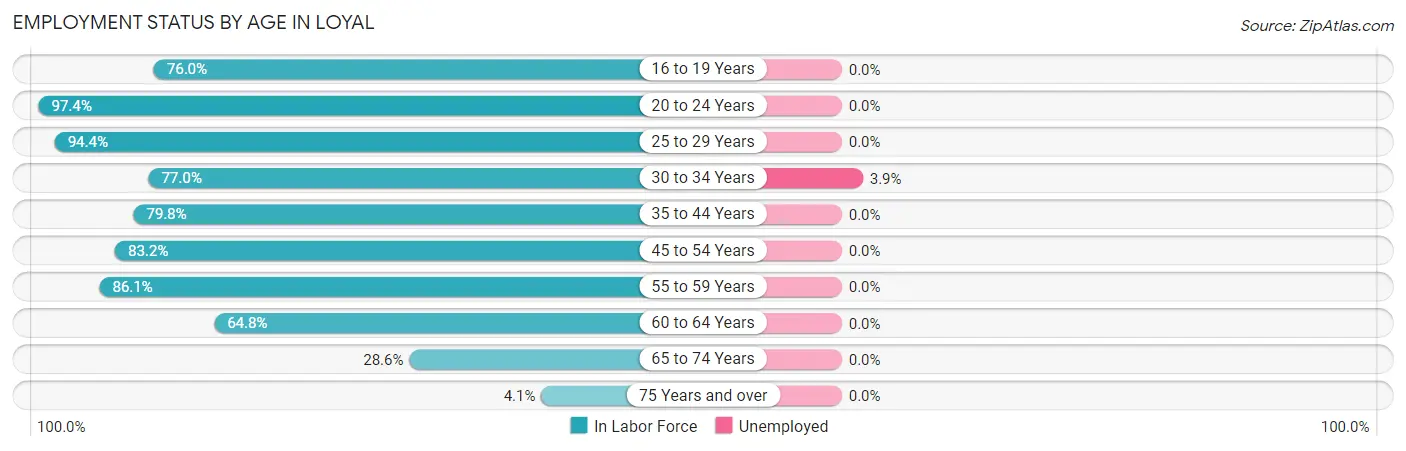
| Age Bracket | In Labor Force | Unemployed |
| 16 to 19 Years | 19 (76.0%) | 0 (0.0%) |
| 20 to 24 Years | 114 (97.4%) | 0 (0.0%) |
| 25 to 29 Years | 84 (94.4%) | 0 (0.0%) |
| 30 to 34 Years | 77 (77.0%) | 3 (3.9%) |
| 35 to 44 Years | 87 (79.8%) | 0 (0.0%) |
| 45 to 54 Years | 84 (83.2%) | 0 (0.0%) |
| 55 to 59 Years | 105 (86.1%) | 0 (0.0%) |
| 60 to 64 Years | 59 (64.8%) | 0 (0.0%) |
| 65 to 74 Years | 52 (28.6%) | 0 (0.0%) |
| 75 Years and over | 5 (4.1%) | 0 (0.0%) |
| Total | 686 (64.8%) | 3 (0.4%) |
Employment Status by Educational Attainment in Loyal
According to labor force statistics for Loyal, 81.0% of individuals (496) out of the total population between 25 and 64 years of age (612) are in the labor force, with 0.6% or 3 of them being unemployed. The group with the highest labor force participation rate are those with the educational attainment of bachelor's degree or higher, with 95.2% or 99 individuals in the labor force. Within the labor force, individuals with high school diploma education have the highest percentage of unemployment, with 1.6% or 3 of them being unemployed.
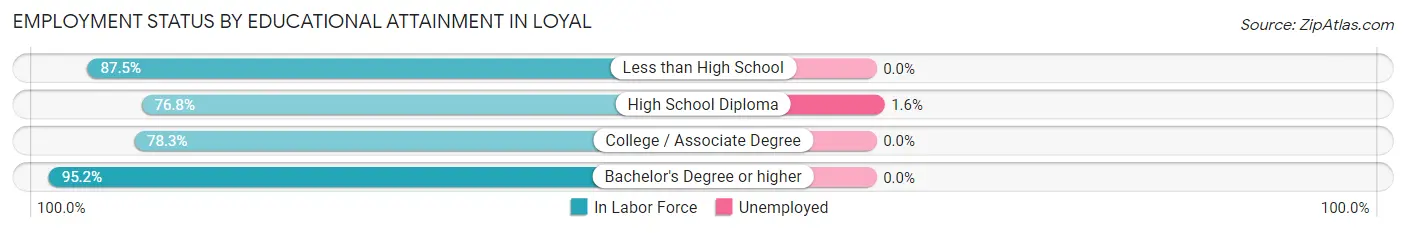
| Educational Attainment | In Labor Force | Unemployed |
| Less than High School | 28 (87.5%) | 0 (0.0%) |
| High School Diploma | 192 (76.8%) | 4 (1.6%) |
| College / Associate Degree | 177 (78.3%) | 0 (0.0%) |
| Bachelor's Degree or higher | 99 (95.2%) | 0 (0.0%) |
| Total | 496 (81.0%) | 4 (0.6%) |
Employment Occupations by Sex in Loyal
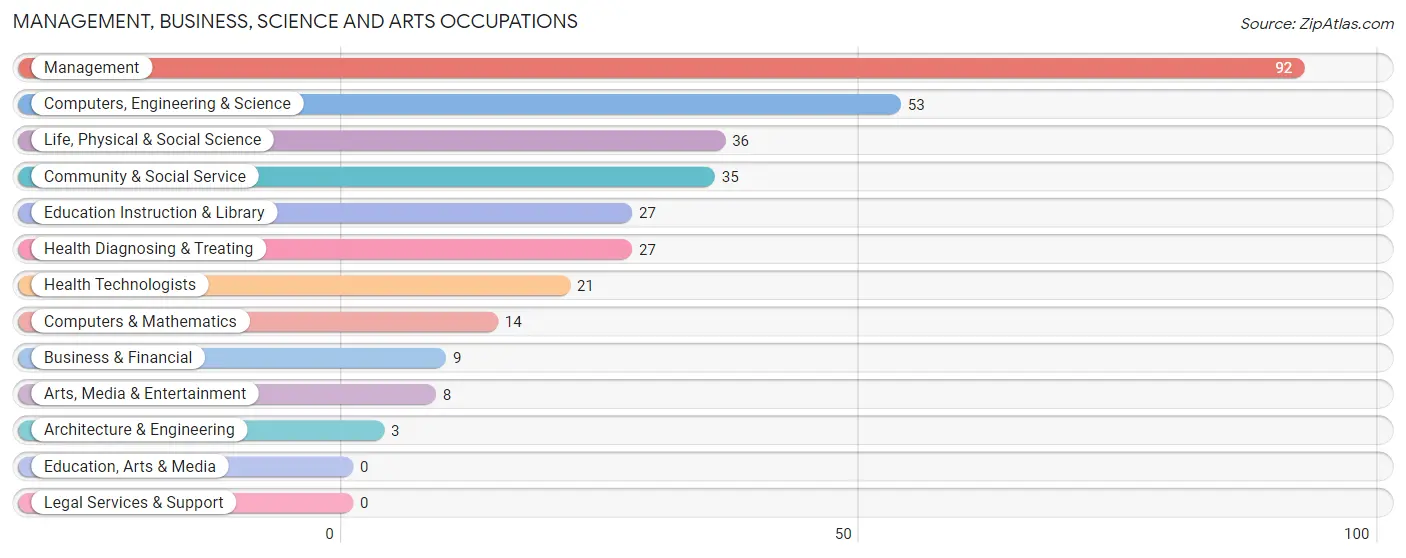
Management, Business, Science and Arts Occupations
The most common Management, Business, Science and Arts occupations in Loyal are Management (92 | 13.5%), Computers, Engineering & Science (53 | 7.8%), Life, Physical & Social Science (36 | 5.3%), Community & Social Service (35 | 5.1%), and Education Instruction & Library (27 | 4.0%).
Management, Business, Science and Arts Occupations by Sex
Within the Management, Business, Science and Arts occupations in Loyal, the most male-oriented occupations are Architecture & Engineering (100.0%), Computers & Mathematics (71.4%), and Management (67.4%), while the most female-oriented occupations are Arts, Media & Entertainment (100.0%), Health Diagnosing & Treating (100.0%), and Health Technologists (100.0%).
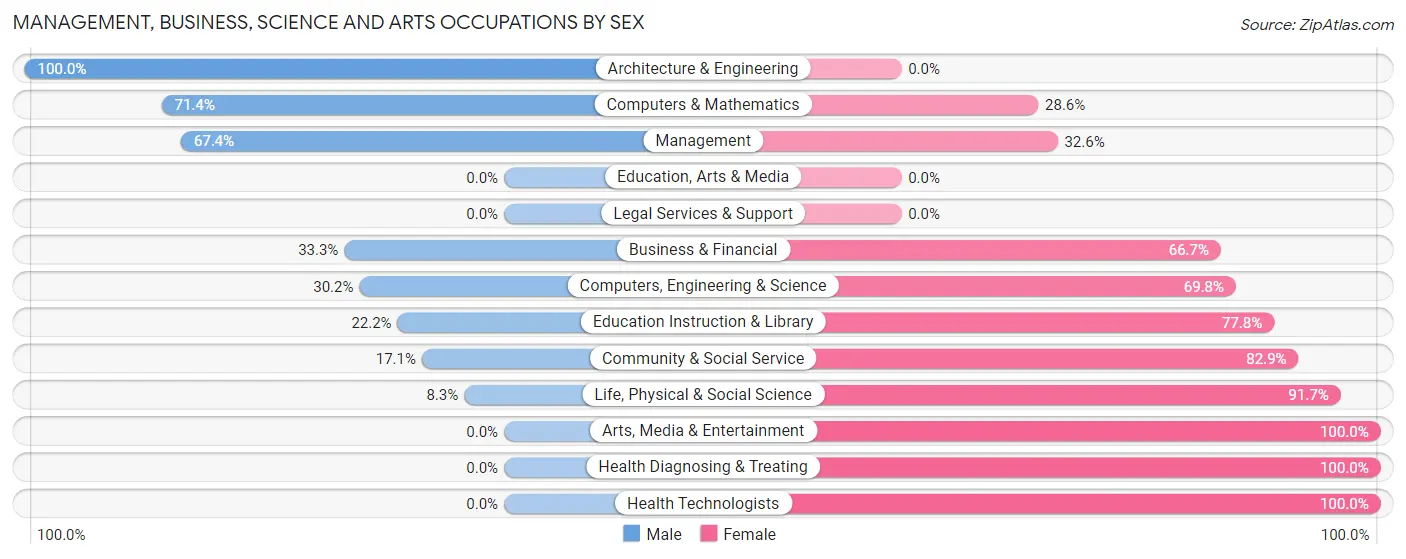
| Occupation | Male | Female |
| Management | 62 (67.4%) | 30 (32.6%) |
| Business & Financial | 3 (33.3%) | 6 (66.7%) |
| Computers, Engineering & Science | 16 (30.2%) | 37 (69.8%) |
| Computers & Mathematics | 10 (71.4%) | 4 (28.6%) |
| Architecture & Engineering | 3 (100.0%) | 0 (0.0%) |
| Life, Physical & Social Science | 3 (8.3%) | 33 (91.7%) |
| Community & Social Service | 6 (17.1%) | 29 (82.9%) |
| Education, Arts & Media | 0 (0.0%) | 0 (0.0%) |
| Legal Services & Support | 0 (0.0%) | 0 (0.0%) |
| Education Instruction & Library | 6 (22.2%) | 21 (77.8%) |
| Arts, Media & Entertainment | 0 (0.0%) | 8 (100.0%) |
| Health Diagnosing & Treating | 0 (0.0%) | 27 (100.0%) |
| Health Technologists | 0 (0.0%) | 21 (100.0%) |
| Total (Category) | 87 (40.3%) | 129 (59.7%) |
| Total (Overall) | 326 (47.7%) | 357 (52.3%) |
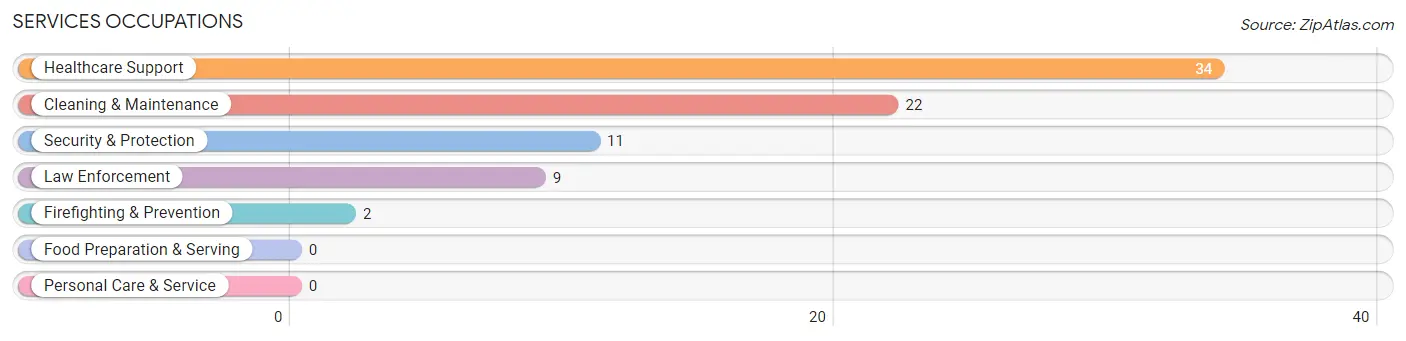
Services Occupations
The most common Services occupations in Loyal are Healthcare Support (34 | 5.0%), Cleaning & Maintenance (22 | 3.2%), Security & Protection (11 | 1.6%), Law Enforcement (9 | 1.3%), and Firefighting & Prevention (2 | 0.3%).
Services Occupations by Sex
Within the Services occupations in Loyal, the most male-oriented occupations are Security & Protection (100.0%), Firefighting & Prevention (100.0%), and Law Enforcement (100.0%), while the most female-oriented occupations are Cleaning & Maintenance (77.3%), and Healthcare Support (58.8%).
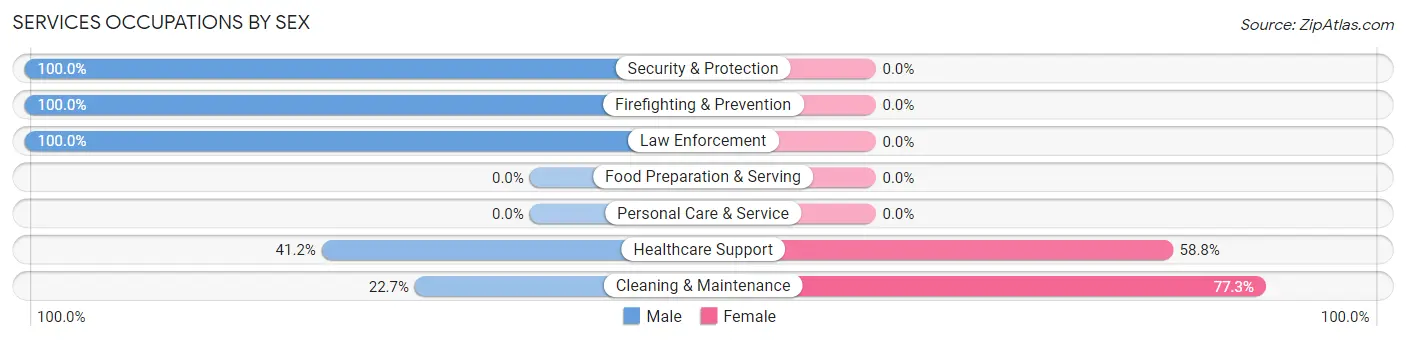
| Occupation | Male | Female |
| Healthcare Support | 14 (41.2%) | 20 (58.8%) |
| Security & Protection | 11 (100.0%) | 0 (0.0%) |
| Firefighting & Prevention | 2 (100.0%) | 0 (0.0%) |
| Law Enforcement | 9 (100.0%) | 0 (0.0%) |
| Food Preparation & Serving | 0 (0.0%) | 0 (0.0%) |
| Cleaning & Maintenance | 5 (22.7%) | 17 (77.3%) |
| Personal Care & Service | 0 (0.0%) | 0 (0.0%) |
| Total (Category) | 30 (44.8%) | 37 (55.2%) |
| Total (Overall) | 326 (47.7%) | 357 (52.3%) |
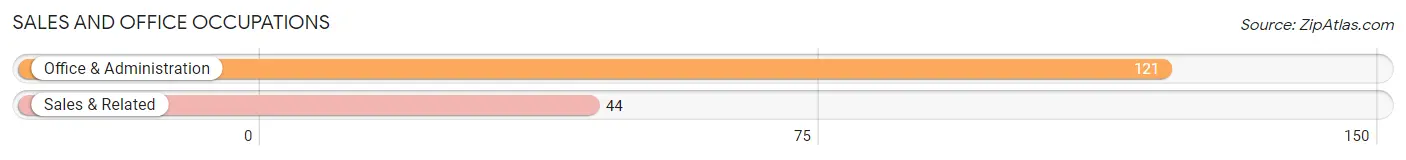
Sales and Office Occupations
The most common Sales and Office occupations in Loyal are Office & Administration (121 | 17.7%), and Sales & Related (44 | 6.4%).
Sales and Office Occupations by Sex
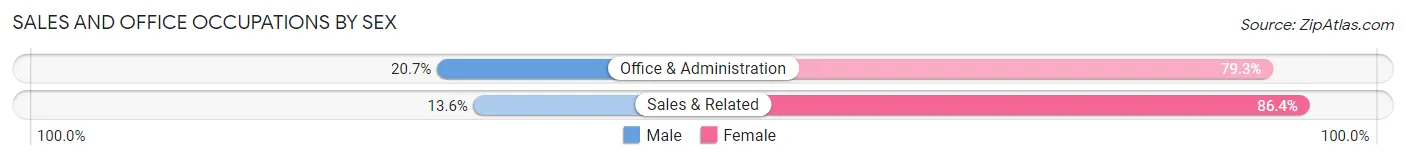
| Occupation | Male | Female |
| Sales & Related | 6 (13.6%) | 38 (86.4%) |
| Office & Administration | 25 (20.7%) | 96 (79.3%) |
| Total (Category) | 31 (18.8%) | 134 (81.2%) |
| Total (Overall) | 326 (47.7%) | 357 (52.3%) |
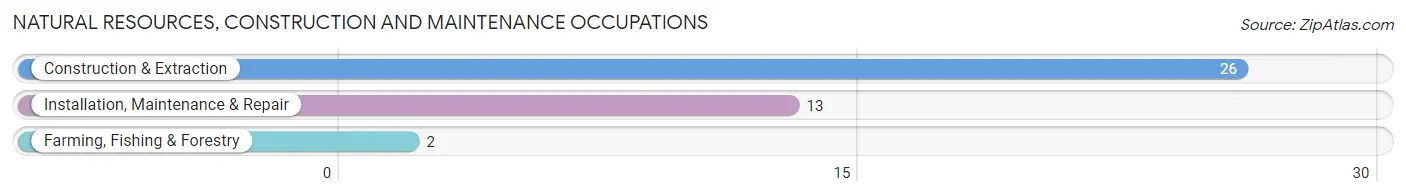
Natural Resources, Construction and Maintenance Occupations
The most common Natural Resources, Construction and Maintenance occupations in Loyal are Construction & Extraction (26 | 3.8%), Installation, Maintenance & Repair (13 | 1.9%), and Farming, Fishing & Forestry (2 | 0.3%).
Natural Resources, Construction and Maintenance Occupations by Sex
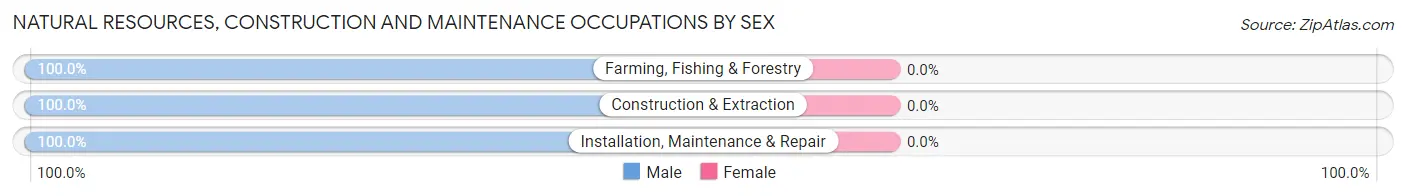
| Occupation | Male | Female |
| Farming, Fishing & Forestry | 2 (100.0%) | 0 (0.0%) |
| Construction & Extraction | 26 (100.0%) | 0 (0.0%) |
| Installation, Maintenance & Repair | 13 (100.0%) | 0 (0.0%) |
| Total (Category) | 41 (100.0%) | 0 (0.0%) |
| Total (Overall) | 326 (47.7%) | 357 (52.3%) |
Production, Transportation and Moving Occupations
The most common Production, Transportation and Moving occupations in Loyal are Production (125 | 18.3%), Transportation (35 | 5.1%), and Material Moving (34 | 5.0%).
Production, Transportation and Moving Occupations by Sex
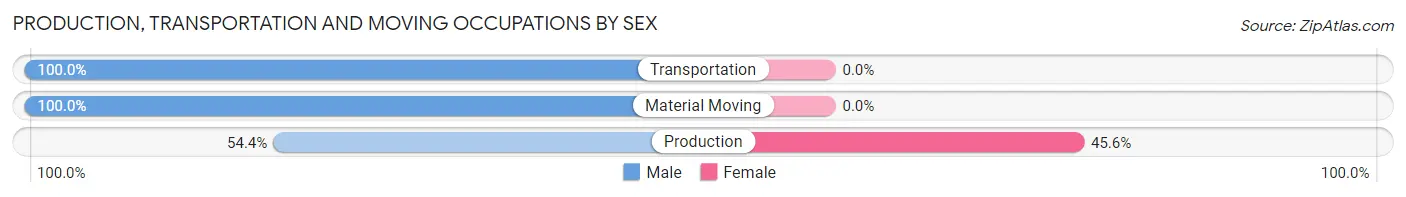
| Occupation | Male | Female |
| Production | 68 (54.4%) | 57 (45.6%) |
| Transportation | 35 (100.0%) | 0 (0.0%) |
| Material Moving | 34 (100.0%) | 0 (0.0%) |
| Total (Category) | 137 (70.6%) | 57 (29.4%) |
| Total (Overall) | 326 (47.7%) | 357 (52.3%) |
Employment Industries by Sex in Loyal
Employment Industries in Loyal
The major employment industries in Loyal include Manufacturing (244 | 35.7%), Health Care & Social Assistance (112 | 16.4%), Retail Trade (85 | 12.4%), Transportation & Warehousing (37 | 5.4%), and Educational Services (31 | 4.5%).
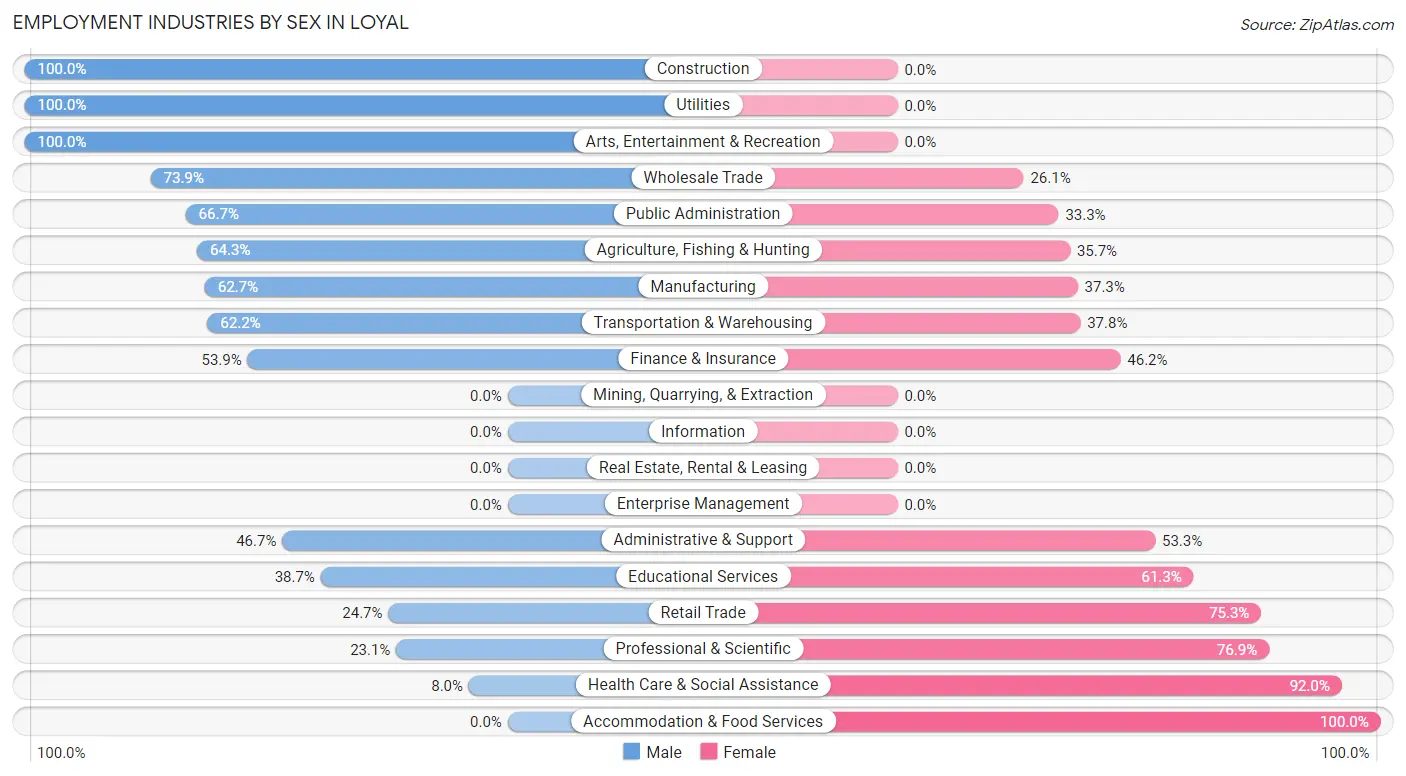
Employment Industries by Sex in Loyal
The Loyal industries that see more men than women are Construction (100.0%), Utilities (100.0%), and Arts, Entertainment & Recreation (100.0%), whereas the industries that tend to have a higher number of women are Accommodation & Food Services (100.0%), Health Care & Social Assistance (92.0%), and Professional & Scientific (76.9%).
| Industry | Male | Female |
| Agriculture, Fishing & Hunting | 9 (64.3%) | 5 (35.7%) |
| Mining, Quarrying, & Extraction | 0 (0.0%) | 0 (0.0%) |
| Construction | 20 (100.0%) | 0 (0.0%) |
| Manufacturing | 153 (62.7%) | 91 (37.3%) |
| Wholesale Trade | 17 (73.9%) | 6 (26.1%) |
| Retail Trade | 21 (24.7%) | 64 (75.3%) |
| Transportation & Warehousing | 23 (62.2%) | 14 (37.8%) |
| Utilities | 12 (100.0%) | 0 (0.0%) |
| Information | 0 (0.0%) | 0 (0.0%) |
| Finance & Insurance | 14 (53.8%) | 12 (46.2%) |
| Real Estate, Rental & Leasing | 0 (0.0%) | 0 (0.0%) |
| Professional & Scientific | 3 (23.1%) | 10 (76.9%) |
| Enterprise Management | 0 (0.0%) | 0 (0.0%) |
| Administrative & Support | 7 (46.7%) | 8 (53.3%) |
| Educational Services | 12 (38.7%) | 19 (61.3%) |
| Health Care & Social Assistance | 9 (8.0%) | 103 (92.0%) |
| Arts, Entertainment & Recreation | 3 (100.0%) | 0 (0.0%) |
| Accommodation & Food Services | 0 (0.0%) | 13 (100.0%) |
| Public Administration | 12 (66.7%) | 6 (33.3%) |
| Total | 326 (47.7%) | 357 (52.3%) |
Education in Loyal
School Enrollment in Loyal
The most common levels of schooling among the 209 students in Loyal are elementary school (76 | 36.4%), middle school (47 | 22.5%), and high school (29 | 13.9%).
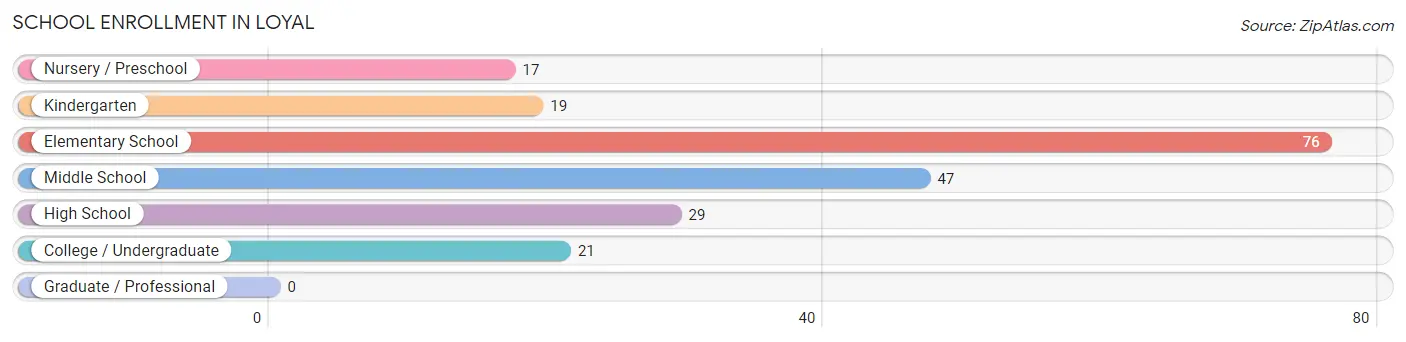
| School Level | # Students | % Students |
| Nursery / Preschool | 17 | 8.1% |
| Kindergarten | 19 | 9.1% |
| Elementary School | 76 | 36.4% |
| Middle School | 47 | 22.5% |
| High School | 29 | 13.9% |
| College / Undergraduate | 21 | 10.1% |
| Graduate / Professional | 0 | 0.0% |
| Total | 209 | 100.0% |
School Enrollment by Age by Funding Source in Loyal
Out of a total of 209 students who are enrolled in schools in Loyal, 16 (7.7%) attend a private institution, while the remaining 193 (92.3%) are enrolled in public schools. The age group of 15 to 17 year olds has the highest likelihood of being enrolled in private schools, with 4 (15.4% in the age bracket) enrolled. Conversely, the age group of 3 to 4 year olds has the lowest likelihood of being enrolled in a private school, with 16 (100.0% in the age bracket) attending a public institution.
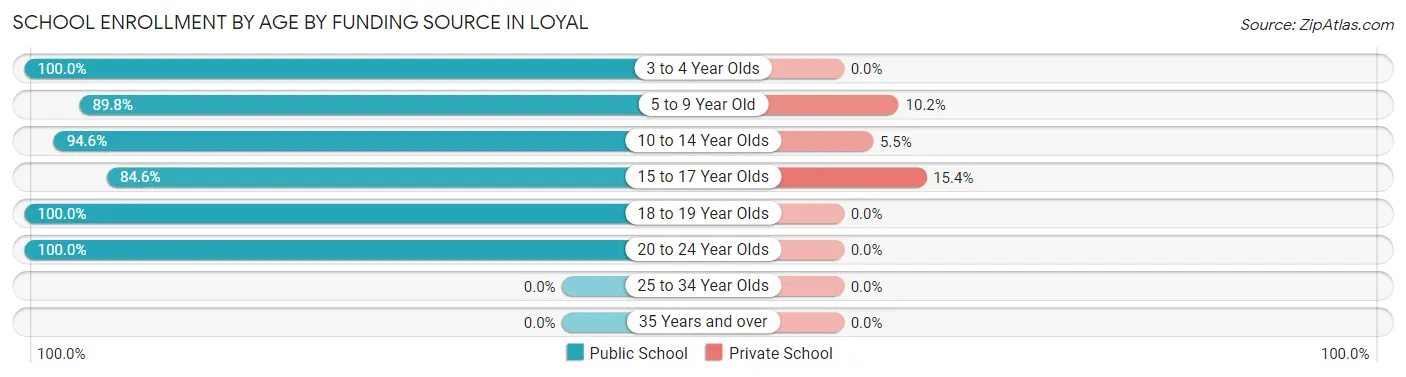
| Age Bracket | Public School | Private School |
| 3 to 4 Year Olds | 16 (100.0%) | 0 (0.0%) |
| 5 to 9 Year Old | 79 (89.8%) | 9 (10.2%) |
| 10 to 14 Year Olds | 52 (94.6%) | 3 (5.4%) |
| 15 to 17 Year Olds | 22 (84.6%) | 4 (15.4%) |
| 18 to 19 Year Olds | 5 (100.0%) | 0 (0.0%) |
| 20 to 24 Year Olds | 19 (100.0%) | 0 (0.0%) |
| 25 to 34 Year Olds | 0 (0.0%) | 0 (0.0%) |
| 35 Years and over | 0 (0.0%) | 0 (0.0%) |
| Total | 193 (92.3%) | 16 (7.7%) |
Educational Attainment by Field of Study in Loyal
Business (49 | 34.3%), science & technology (38 | 26.6%), education (15 | 10.5%), arts & humanities (10 | 7.0%), and computers & mathematics (9 | 6.3%) are the most common fields of study among 143 individuals in Loyal who have obtained a bachelor's degree or higher.
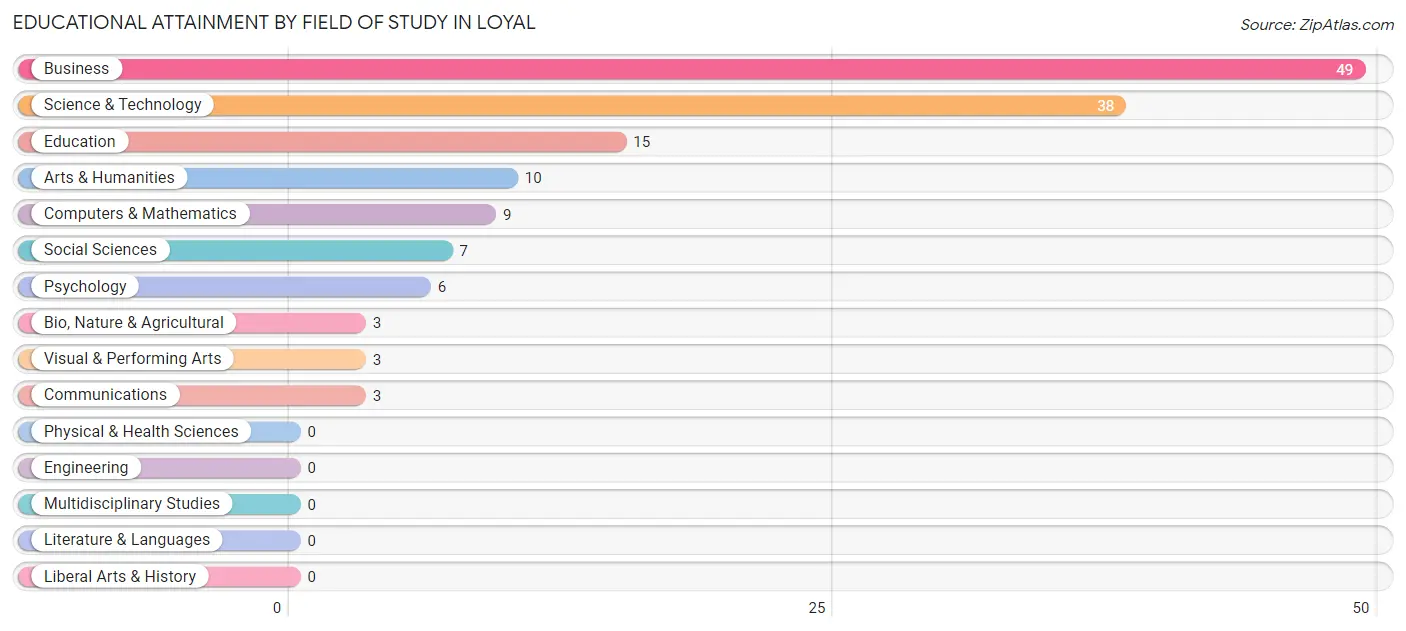
| Field of Study | # Graduates | % Graduates |
| Computers & Mathematics | 9 | 6.3% |
| Bio, Nature & Agricultural | 3 | 2.1% |
| Physical & Health Sciences | 0 | 0.0% |
| Psychology | 6 | 4.2% |
| Social Sciences | 7 | 4.9% |
| Engineering | 0 | 0.0% |
| Multidisciplinary Studies | 0 | 0.0% |
| Science & Technology | 38 | 26.6% |
| Business | 49 | 34.3% |
| Education | 15 | 10.5% |
| Literature & Languages | 0 | 0.0% |
| Liberal Arts & History | 0 | 0.0% |
| Visual & Performing Arts | 3 | 2.1% |
| Communications | 3 | 2.1% |
| Arts & Humanities | 10 | 7.0% |
| Total | 143 | 100.0% |
Transportation & Commute in Loyal
Vehicle Availability by Sex in Loyal
The most prevalent vehicle ownership categories in Loyal are males with 2 vehicles (153, accounting for 47.4%) and females with 2 vehicles (190, making up 43.3%).
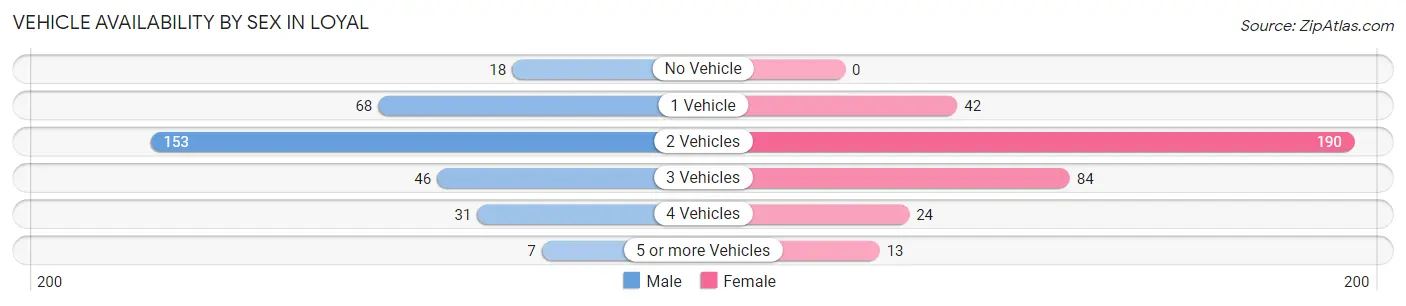
| Vehicles Available | Male | Female |
| No Vehicle | 18 (5.6%) | 0 (0.0%) |
| 1 Vehicle | 68 (21.0%) | 42 (11.9%) |
| 2 Vehicles | 153 (47.4%) | 190 (53.8%) |
| 3 Vehicles | 46 (14.2%) | 84 (23.8%) |
| 4 Vehicles | 31 (9.6%) | 24 (6.8%) |
| 5 or more Vehicles | 7 (2.2%) | 13 (3.7%) |
| Total | 323 (100.0%) | 353 (100.0%) |
Commute Time in Loyal
The most frequently occuring commute durations in Loyal are 5 to 9 minutes (163 commuters, 25.5%), 30 to 34 minutes (127 commuters, 19.8%), and 25 to 29 minutes (93 commuters, 14.5%).
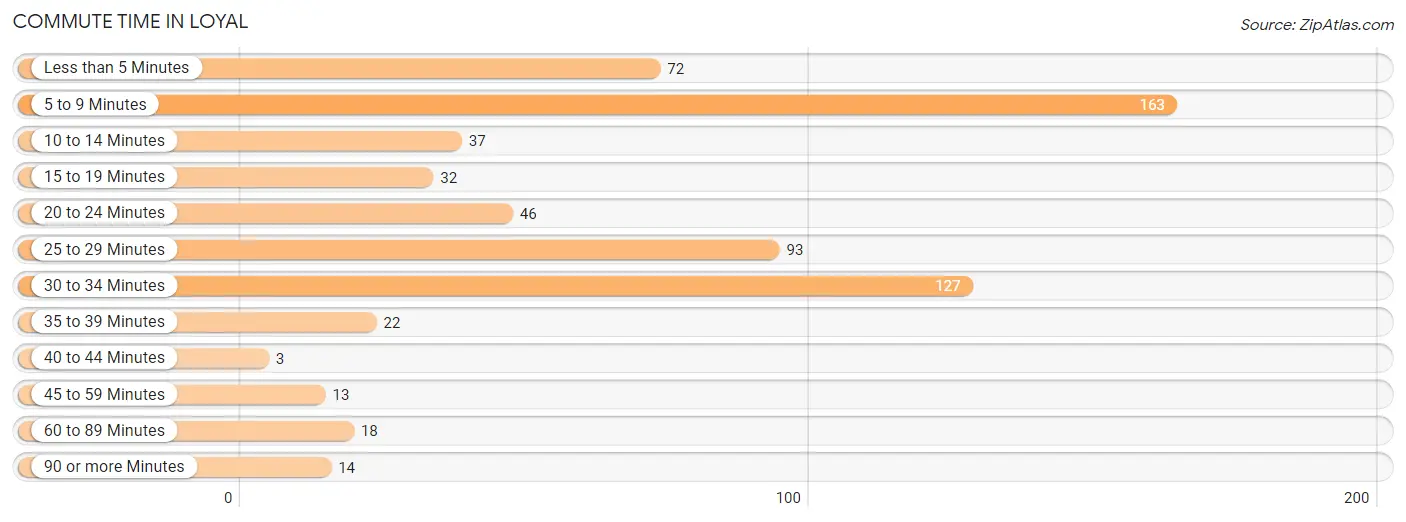
| Commute Time | # Commuters | % Commuters |
| Less than 5 Minutes | 72 | 11.3% |
| 5 to 9 Minutes | 163 | 25.5% |
| 10 to 14 Minutes | 37 | 5.8% |
| 15 to 19 Minutes | 32 | 5.0% |
| 20 to 24 Minutes | 46 | 7.2% |
| 25 to 29 Minutes | 93 | 14.5% |
| 30 to 34 Minutes | 127 | 19.8% |
| 35 to 39 Minutes | 22 | 3.4% |
| 40 to 44 Minutes | 3 | 0.5% |
| 45 to 59 Minutes | 13 | 2.0% |
| 60 to 89 Minutes | 18 | 2.8% |
| 90 or more Minutes | 14 | 2.2% |
Commute Time by Sex in Loyal
The most common commute times in Loyal are 5 to 9 minutes (75 commuters, 24.7%) for males and 5 to 9 minutes (88 commuters, 26.1%) for females.
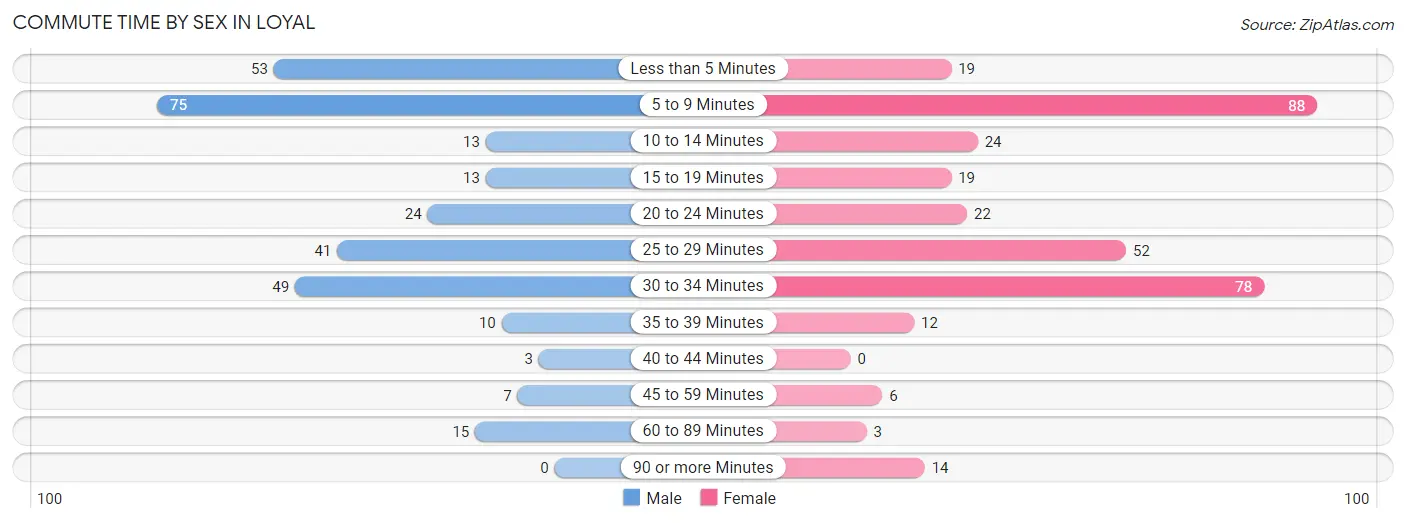
| Commute Time | Male | Female |
| Less than 5 Minutes | 53 (17.5%) | 19 (5.6%) |
| 5 to 9 Minutes | 75 (24.7%) | 88 (26.1%) |
| 10 to 14 Minutes | 13 (4.3%) | 24 (7.1%) |
| 15 to 19 Minutes | 13 (4.3%) | 19 (5.6%) |
| 20 to 24 Minutes | 24 (7.9%) | 22 (6.5%) |
| 25 to 29 Minutes | 41 (13.5%) | 52 (15.4%) |
| 30 to 34 Minutes | 49 (16.2%) | 78 (23.2%) |
| 35 to 39 Minutes | 10 (3.3%) | 12 (3.6%) |
| 40 to 44 Minutes | 3 (1.0%) | 0 (0.0%) |
| 45 to 59 Minutes | 7 (2.3%) | 6 (1.8%) |
| 60 to 89 Minutes | 15 (5.0%) | 3 (0.9%) |
| 90 or more Minutes | 0 (0.0%) | 14 (4.2%) |
Time of Departure to Work by Sex in Loyal
The most frequent times of departure to work in Loyal are 6:30 AM to 6:59 AM (71, 23.4%) for males and 7:00 AM to 7:29 AM (90, 26.7%) for females.
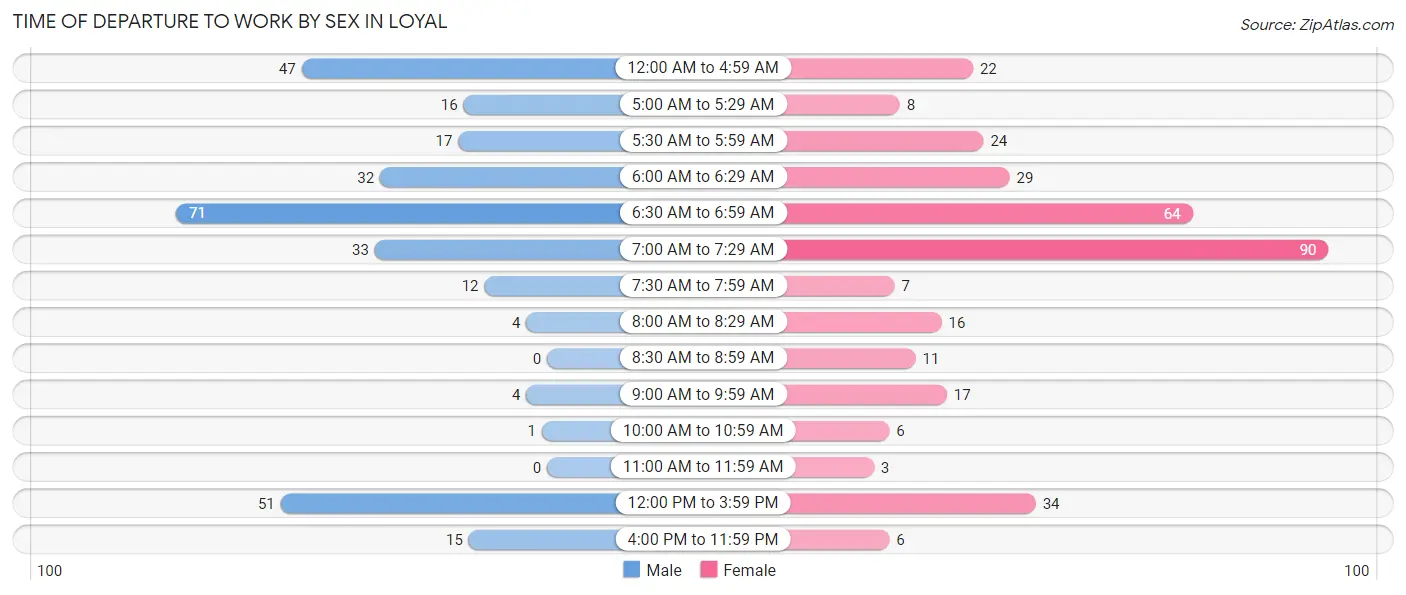
| Time of Departure | Male | Female |
| 12:00 AM to 4:59 AM | 47 (15.5%) | 22 (6.5%) |
| 5:00 AM to 5:29 AM | 16 (5.3%) | 8 (2.4%) |
| 5:30 AM to 5:59 AM | 17 (5.6%) | 24 (7.1%) |
| 6:00 AM to 6:29 AM | 32 (10.6%) | 29 (8.6%) |
| 6:30 AM to 6:59 AM | 71 (23.4%) | 64 (19.0%) |
| 7:00 AM to 7:29 AM | 33 (10.9%) | 90 (26.7%) |
| 7:30 AM to 7:59 AM | 12 (4.0%) | 7 (2.1%) |
| 8:00 AM to 8:29 AM | 4 (1.3%) | 16 (4.8%) |
| 8:30 AM to 8:59 AM | 0 (0.0%) | 11 (3.3%) |
| 9:00 AM to 9:59 AM | 4 (1.3%) | 17 (5.0%) |
| 10:00 AM to 10:59 AM | 1 (0.3%) | 6 (1.8%) |
| 11:00 AM to 11:59 AM | 0 (0.0%) | 3 (0.9%) |
| 12:00 PM to 3:59 PM | 51 (16.8%) | 34 (10.1%) |
| 4:00 PM to 11:59 PM | 15 (5.0%) | 6 (1.8%) |
| Total | 303 (100.0%) | 337 (100.0%) |
Housing Occupancy in Loyal
Occupancy by Ownership in Loyal
Of the total 579 dwellings in Loyal, owner-occupied units account for 454 (78.4%), while renter-occupied units make up 125 (21.6%).
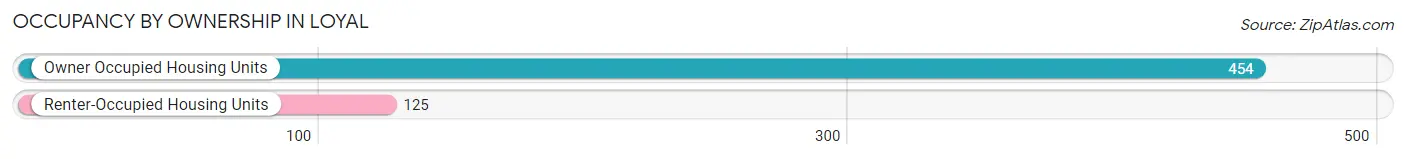
| Occupancy | # Housing Units | % Housing Units |
| Owner Occupied Housing Units | 454 | 78.4% |
| Renter-Occupied Housing Units | 125 | 21.6% |
| Total Occupied Housing Units | 579 | 100.0% |
Occupancy by Household Size in Loyal
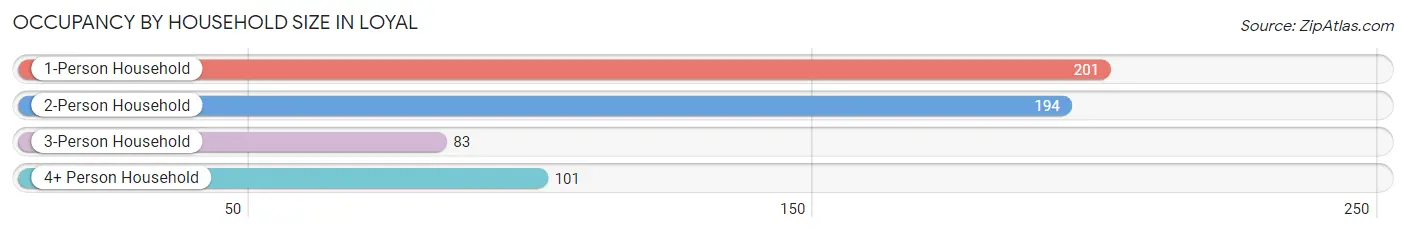
| Household Size | # Housing Units | % Housing Units |
| 1-Person Household | 201 | 34.7% |
| 2-Person Household | 194 | 33.5% |
| 3-Person Household | 83 | 14.3% |
| 4+ Person Household | 101 | 17.4% |
| Total Housing Units | 579 | 100.0% |
Occupancy by Ownership by Household Size in Loyal
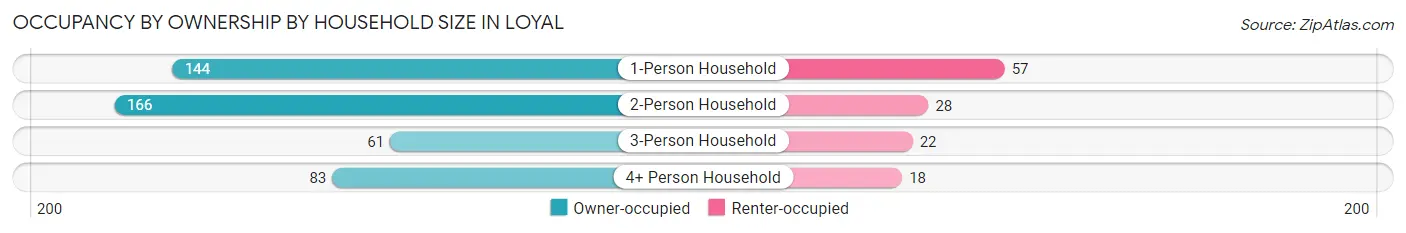
| Household Size | Owner-occupied | Renter-occupied |
| 1-Person Household | 144 (71.6%) | 57 (28.4%) |
| 2-Person Household | 166 (85.6%) | 28 (14.4%) |
| 3-Person Household | 61 (73.5%) | 22 (26.5%) |
| 4+ Person Household | 83 (82.2%) | 18 (17.8%) |
| Total Housing Units | 454 (78.4%) | 125 (21.6%) |
Occupancy by Educational Attainment in Loyal
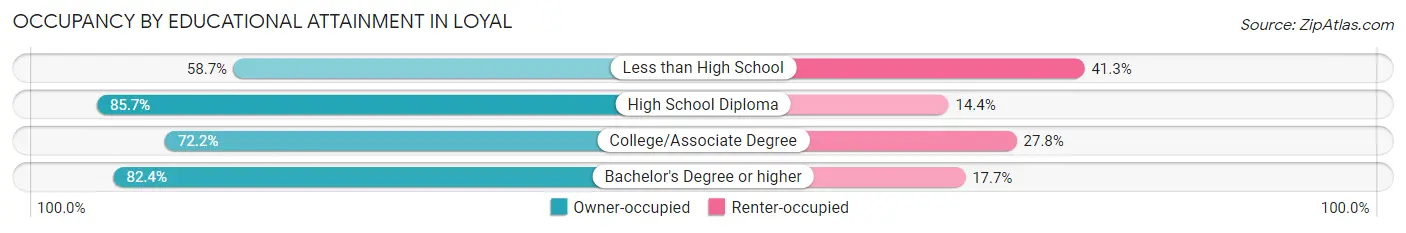
| Household Size | Owner-occupied | Renter-occupied |
| Less than High School | 27 (58.7%) | 19 (41.3%) |
| High School Diploma | 203 (85.7%) | 34 (14.3%) |
| College/Associate Degree | 140 (72.2%) | 54 (27.8%) |
| Bachelor's Degree or higher | 84 (82.4%) | 18 (17.6%) |
Occupancy by Age of Householder in Loyal
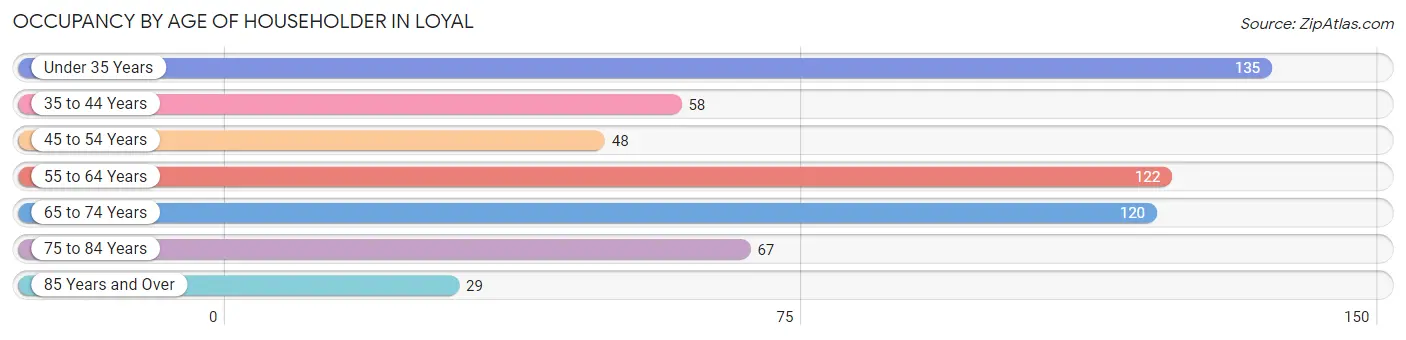
| Age Bracket | # Households | % Households |
| Under 35 Years | 135 | 23.3% |
| 35 to 44 Years | 58 | 10.0% |
| 45 to 54 Years | 48 | 8.3% |
| 55 to 64 Years | 122 | 21.1% |
| 65 to 74 Years | 120 | 20.7% |
| 75 to 84 Years | 67 | 11.6% |
| 85 Years and Over | 29 | 5.0% |
| Total | 579 | 100.0% |
Housing Finances in Loyal
Median Income by Occupancy in Loyal
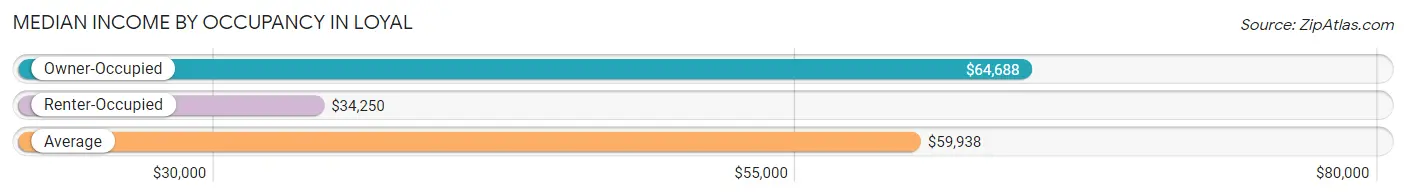
| Occupancy Type | # Households | Median Income |
| Owner-Occupied | 454 (78.4%) | $64,688 |
| Renter-Occupied | 125 (21.6%) | $34,250 |
| Average | 579 (100.0%) | $59,938 |
Occupancy by Householder Income Bracket in Loyal
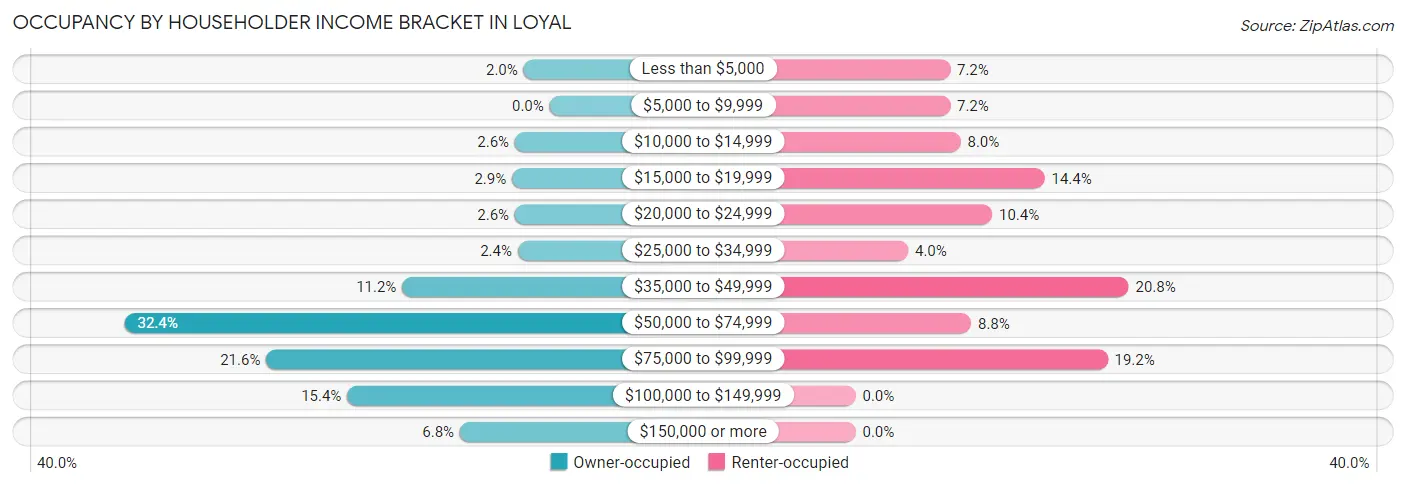
| Income Bracket | Owner-occupied | Renter-occupied |
| Less than $5,000 | 9 (2.0%) | 9 (7.2%) |
| $5,000 to $9,999 | 0 (0.0%) | 9 (7.2%) |
| $10,000 to $14,999 | 12 (2.6%) | 10 (8.0%) |
| $15,000 to $19,999 | 13 (2.9%) | 18 (14.4%) |
| $20,000 to $24,999 | 12 (2.6%) | 13 (10.4%) |
| $25,000 to $34,999 | 11 (2.4%) | 5 (4.0%) |
| $35,000 to $49,999 | 51 (11.2%) | 26 (20.8%) |
| $50,000 to $74,999 | 147 (32.4%) | 11 (8.8%) |
| $75,000 to $99,999 | 98 (21.6%) | 24 (19.2%) |
| $100,000 to $149,999 | 70 (15.4%) | 0 (0.0%) |
| $150,000 or more | 31 (6.8%) | 0 (0.0%) |
| Total | 454 (100.0%) | 125 (100.0%) |
Monthly Housing Cost Tiers in Loyal
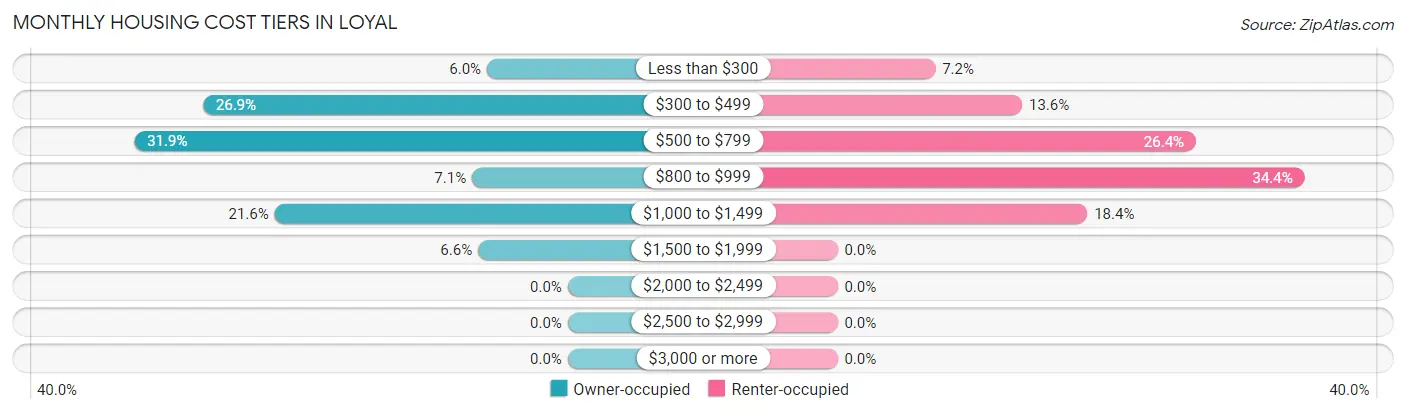
| Monthly Cost | Owner-occupied | Renter-occupied |
| Less than $300 | 27 (5.9%) | 9 (7.2%) |
| $300 to $499 | 122 (26.9%) | 17 (13.6%) |
| $500 to $799 | 145 (31.9%) | 33 (26.4%) |
| $800 to $999 | 32 (7.0%) | 43 (34.4%) |
| $1,000 to $1,499 | 98 (21.6%) | 23 (18.4%) |
| $1,500 to $1,999 | 30 (6.6%) | 0 (0.0%) |
| $2,000 to $2,499 | 0 (0.0%) | 0 (0.0%) |
| $2,500 to $2,999 | 0 (0.0%) | 0 (0.0%) |
| $3,000 or more | 0 (0.0%) | 0 (0.0%) |
| Total | 454 (100.0%) | 125 (100.0%) |
Physical Housing Characteristics in Loyal
Housing Structures in Loyal
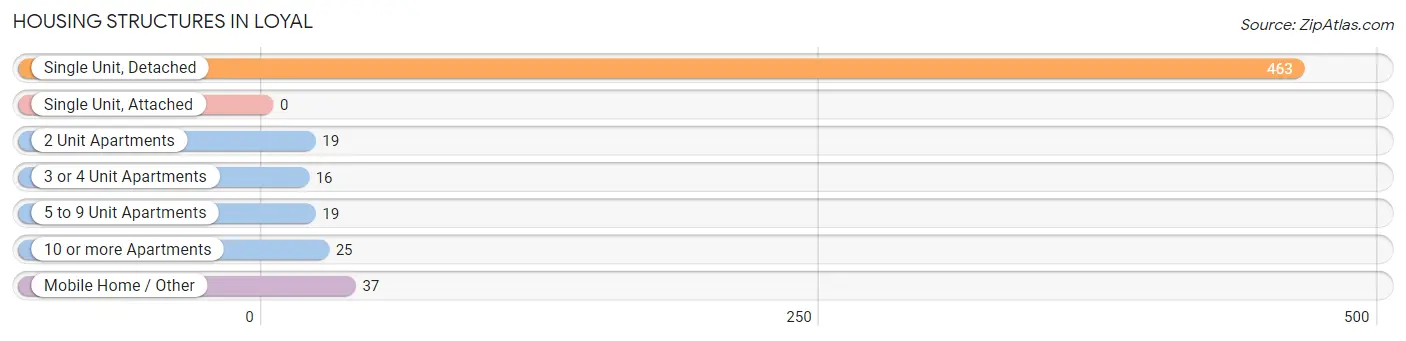
| Structure Type | # Housing Units | % Housing Units |
| Single Unit, Detached | 463 | 80.0% |
| Single Unit, Attached | 0 | 0.0% |
| 2 Unit Apartments | 19 | 3.3% |
| 3 or 4 Unit Apartments | 16 | 2.8% |
| 5 to 9 Unit Apartments | 19 | 3.3% |
| 10 or more Apartments | 25 | 4.3% |
| Mobile Home / Other | 37 | 6.4% |
| Total | 579 | 100.0% |
Housing Structures by Occupancy in Loyal
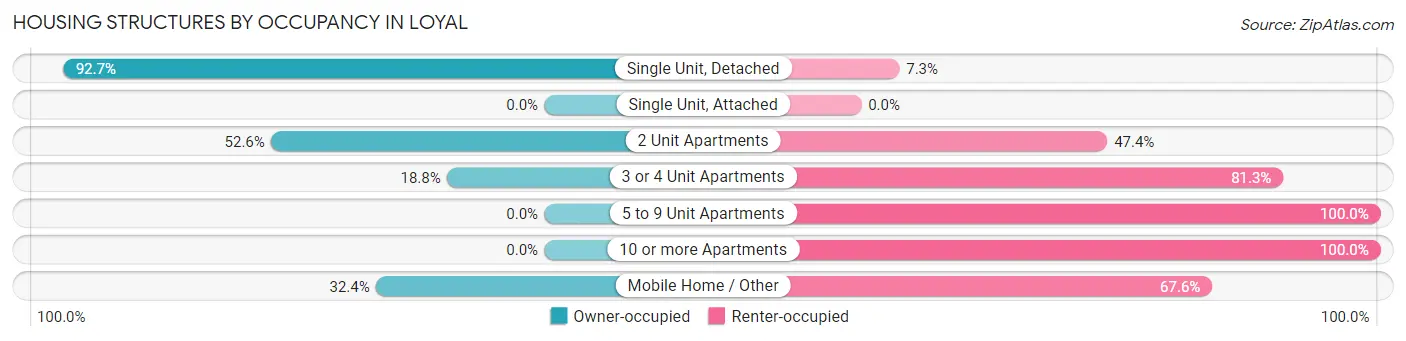
| Structure Type | Owner-occupied | Renter-occupied |
| Single Unit, Detached | 429 (92.7%) | 34 (7.3%) |
| Single Unit, Attached | 0 (0.0%) | 0 (0.0%) |
| 2 Unit Apartments | 10 (52.6%) | 9 (47.4%) |
| 3 or 4 Unit Apartments | 3 (18.8%) | 13 (81.2%) |
| 5 to 9 Unit Apartments | 0 (0.0%) | 19 (100.0%) |
| 10 or more Apartments | 0 (0.0%) | 25 (100.0%) |
| Mobile Home / Other | 12 (32.4%) | 25 (67.6%) |
| Total | 454 (78.4%) | 125 (21.6%) |
Housing Structures by Number of Rooms in Loyal
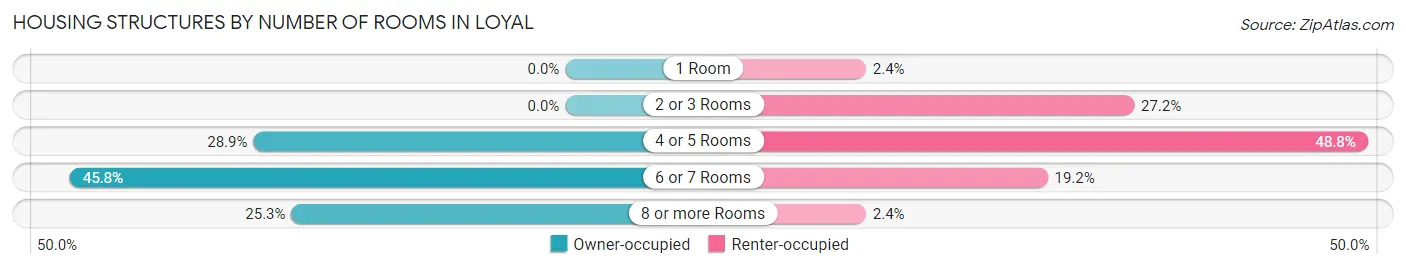
| Number of Rooms | Owner-occupied | Renter-occupied |
| 1 Room | 0 (0.0%) | 3 (2.4%) |
| 2 or 3 Rooms | 0 (0.0%) | 34 (27.2%) |
| 4 or 5 Rooms | 131 (28.8%) | 61 (48.8%) |
| 6 or 7 Rooms | 208 (45.8%) | 24 (19.2%) |
| 8 or more Rooms | 115 (25.3%) | 3 (2.4%) |
| Total | 454 (100.0%) | 125 (100.0%) |
Housing Structure by Heating Type in Loyal
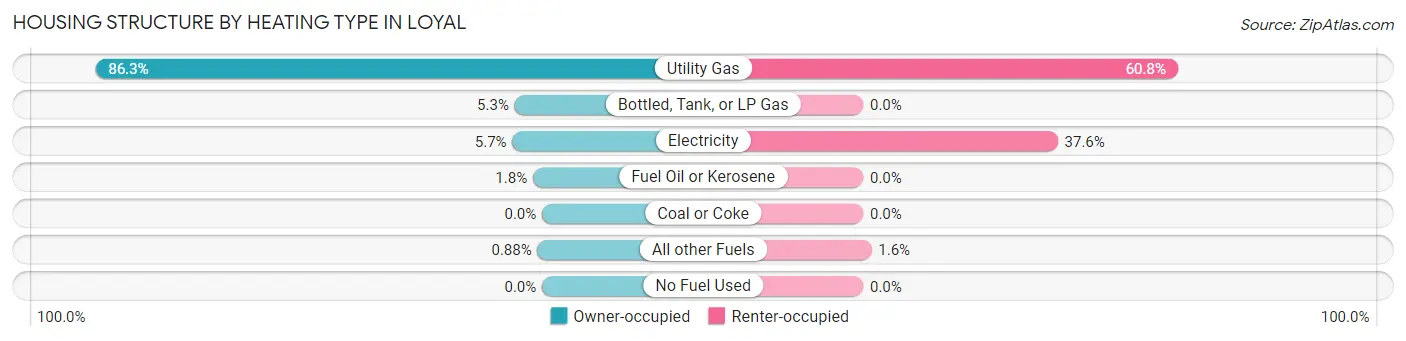
| Heating Type | Owner-occupied | Renter-occupied |
| Utility Gas | 392 (86.3%) | 76 (60.8%) |
| Bottled, Tank, or LP Gas | 24 (5.3%) | 0 (0.0%) |
| Electricity | 26 (5.7%) | 47 (37.6%) |
| Fuel Oil or Kerosene | 8 (1.8%) | 0 (0.0%) |
| Coal or Coke | 0 (0.0%) | 0 (0.0%) |
| All other Fuels | 4 (0.9%) | 2 (1.6%) |
| No Fuel Used | 0 (0.0%) | 0 (0.0%) |
| Total | 454 (100.0%) | 125 (100.0%) |
Household Vehicle Usage in Loyal
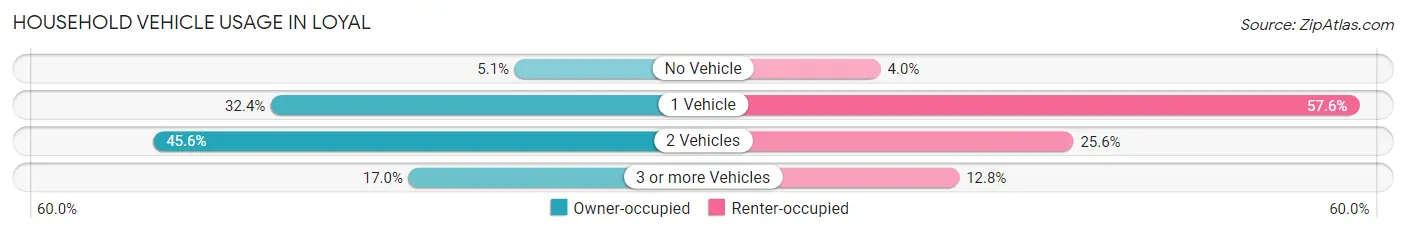
| Vehicles per Household | Owner-occupied | Renter-occupied |
| No Vehicle | 23 (5.1%) | 5 (4.0%) |
| 1 Vehicle | 147 (32.4%) | 72 (57.6%) |
| 2 Vehicles | 207 (45.6%) | 32 (25.6%) |
| 3 or more Vehicles | 77 (17.0%) | 16 (12.8%) |
| Total | 454 (100.0%) | 125 (100.0%) |
Real Estate & Mortgages in Loyal
Real Estate and Mortgage Overview in Loyal
| Characteristic | Without Mortgage | With Mortgage |
| Housing Units | 255 | 199 |
| Median Property Value | $115,300 | $95,500 |
| Median Household Income | $57,409 | $17 |
| Monthly Housing Costs | $482 | $0 |
| Real Estate Taxes | $2,459 | $0 |
Property Value by Mortgage Status in Loyal
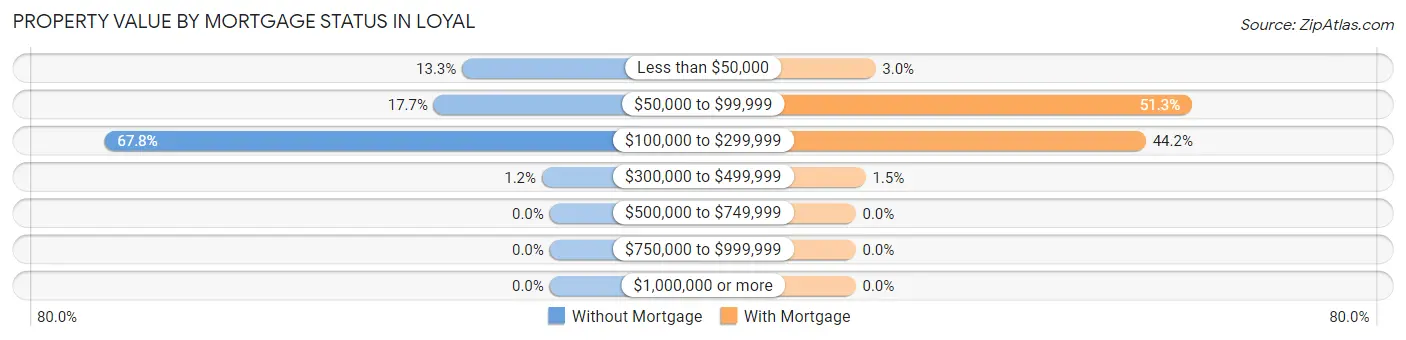
| Property Value | Without Mortgage | With Mortgage |
| Less than $50,000 | 34 (13.3%) | 6 (3.0%) |
| $50,000 to $99,999 | 45 (17.6%) | 102 (51.3%) |
| $100,000 to $299,999 | 173 (67.8%) | 88 (44.2%) |
| $300,000 to $499,999 | 3 (1.2%) | 3 (1.5%) |
| $500,000 to $749,999 | 0 (0.0%) | 0 (0.0%) |
| $750,000 to $999,999 | 0 (0.0%) | 0 (0.0%) |
| $1,000,000 or more | 0 (0.0%) | 0 (0.0%) |
| Total | 255 (100.0%) | 199 (100.0%) |
Household Income by Mortgage Status in Loyal
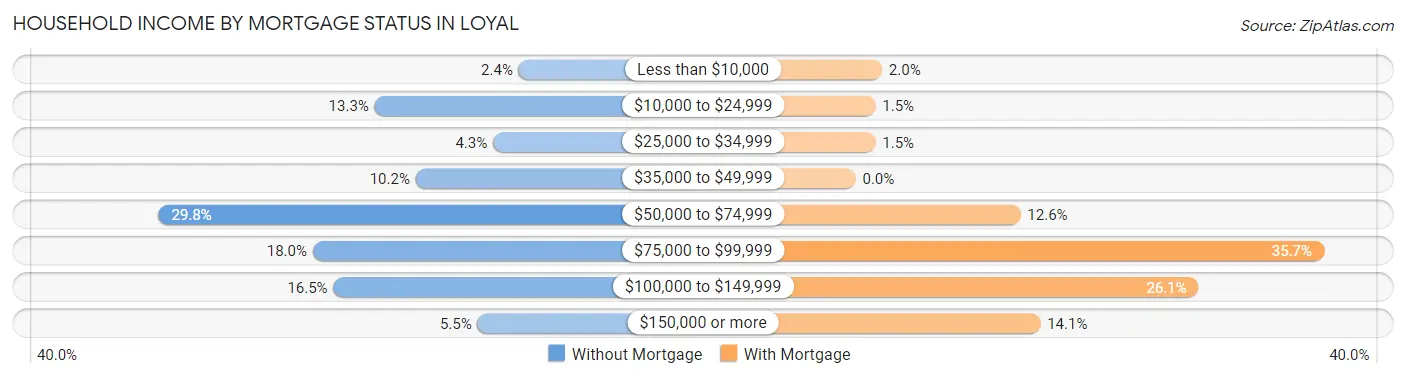
| Household Income | Without Mortgage | With Mortgage |
| Less than $10,000 | 6 (2.4%) | 4 (2.0%) |
| $10,000 to $24,999 | 34 (13.3%) | 3 (1.5%) |
| $25,000 to $34,999 | 11 (4.3%) | 3 (1.5%) |
| $35,000 to $49,999 | 26 (10.2%) | 0 (0.0%) |
| $50,000 to $74,999 | 76 (29.8%) | 25 (12.6%) |
| $75,000 to $99,999 | 46 (18.0%) | 71 (35.7%) |
| $100,000 to $149,999 | 42 (16.5%) | 52 (26.1%) |
| $150,000 or more | 14 (5.5%) | 28 (14.1%) |
| Total | 255 (100.0%) | 199 (100.0%) |
Property Value to Household Income Ratio in Loyal
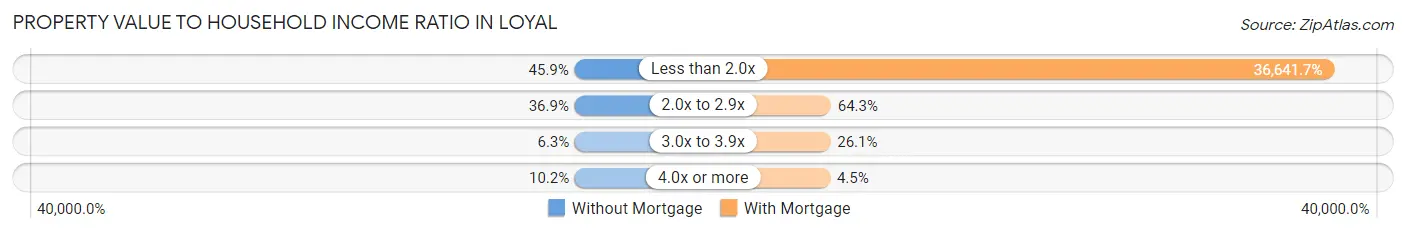
| Value-to-Income Ratio | Without Mortgage | With Mortgage |
| Less than 2.0x | 117 (45.9%) | 72,917 (36,641.7%) |
| 2.0x to 2.9x | 94 (36.9%) | 128 (64.3%) |
| 3.0x to 3.9x | 16 (6.3%) | 52 (26.1%) |
| 4.0x or more | 26 (10.2%) | 9 (4.5%) |
| Total | 255 (100.0%) | 199 (100.0%) |
Real Estate Taxes by Mortgage Status in Loyal
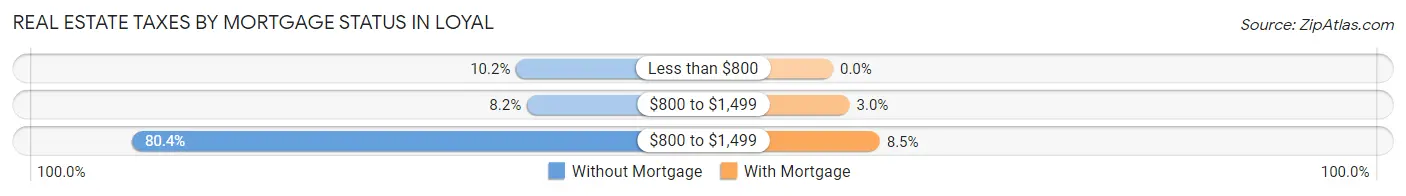
| Property Taxes | Without Mortgage | With Mortgage |
| Less than $800 | 26 (10.2%) | 0 (0.0%) |
| $800 to $1,499 | 21 (8.2%) | 6 (3.0%) |
| $800 to $1,499 | 205 (80.4%) | 17 (8.5%) |
| Total | 255 (100.0%) | 199 (100.0%) |
Health & Disability in Loyal
Health Insurance Coverage by Age in Loyal
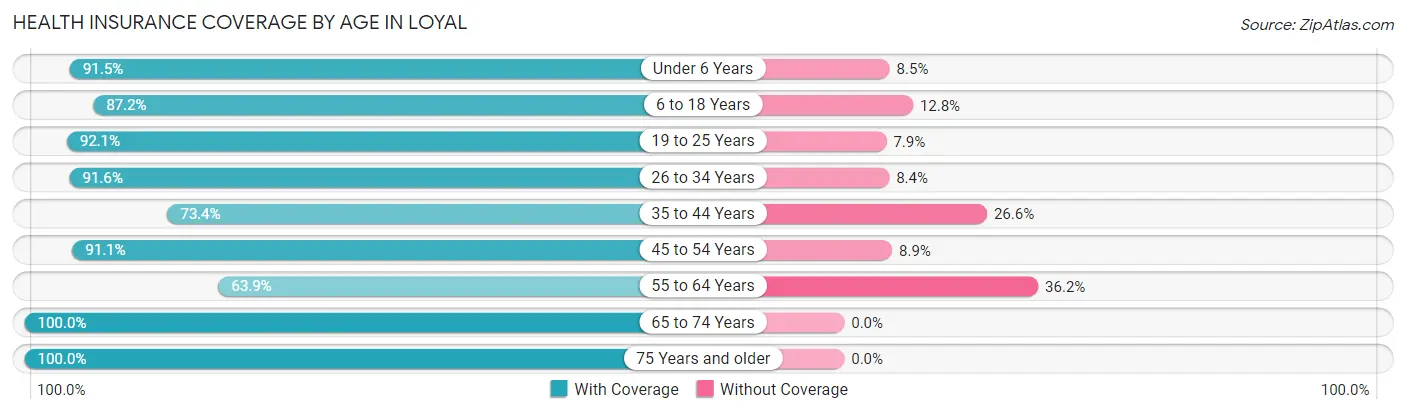
| Age Bracket | With Coverage | Without Coverage |
| Under 6 Years | 119 (91.5%) | 11 (8.5%) |
| 6 to 18 Years | 143 (87.2%) | 21 (12.8%) |
| 19 to 25 Years | 117 (92.1%) | 10 (7.9%) |
| 26 to 34 Years | 164 (91.6%) | 15 (8.4%) |
| 35 to 44 Years | 80 (73.4%) | 29 (26.6%) |
| 45 to 54 Years | 92 (91.1%) | 9 (8.9%) |
| 55 to 64 Years | 136 (63.8%) | 77 (36.1%) |
| 65 to 74 Years | 182 (100.0%) | 0 (0.0%) |
| 75 Years and older | 123 (100.0%) | 0 (0.0%) |
| Total | 1,156 (87.1%) | 172 (13.0%) |
Health Insurance Coverage by Citizenship Status in Loyal
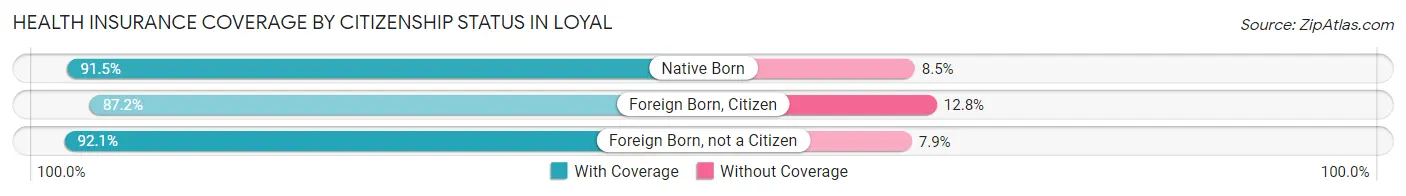
| Citizenship Status | With Coverage | Without Coverage |
| Native Born | 119 (91.5%) | 11 (8.5%) |
| Foreign Born, Citizen | 143 (87.2%) | 21 (12.8%) |
| Foreign Born, not a Citizen | 117 (92.1%) | 10 (7.9%) |
Health Insurance Coverage by Household Income in Loyal
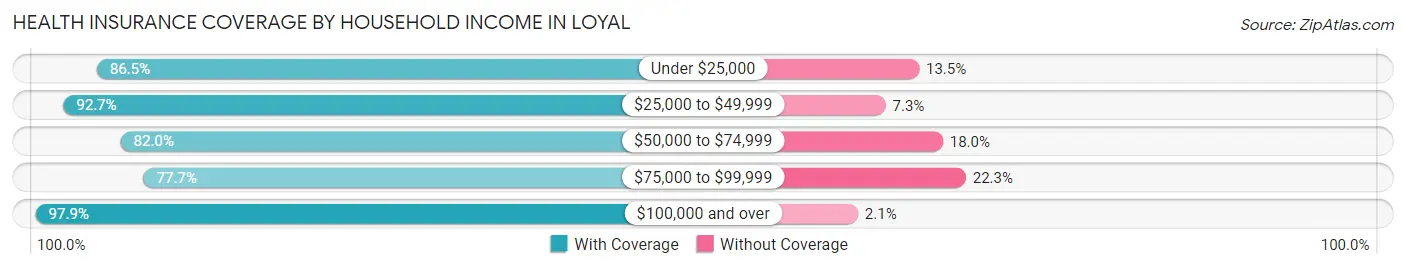
| Household Income | With Coverage | Without Coverage |
| Under $25,000 | 147 (86.5%) | 23 (13.5%) |
| $25,000 to $49,999 | 153 (92.7%) | 12 (7.3%) |
| $50,000 to $74,999 | 310 (82.0%) | 68 (18.0%) |
| $75,000 to $99,999 | 216 (77.7%) | 62 (22.3%) |
| $100,000 and over | 330 (97.9%) | 7 (2.1%) |
Public vs Private Health Insurance Coverage by Age in Loyal
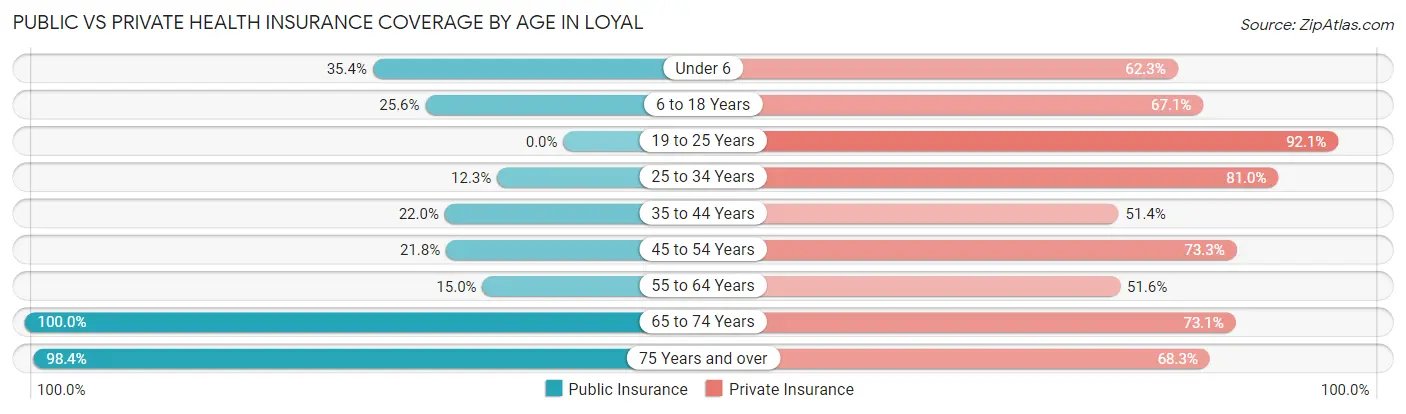
| Age Bracket | Public Insurance | Private Insurance |
| Under 6 | 46 (35.4%) | 81 (62.3%) |
| 6 to 18 Years | 42 (25.6%) | 110 (67.1%) |
| 19 to 25 Years | 0 (0.0%) | 117 (92.1%) |
| 25 to 34 Years | 22 (12.3%) | 145 (81.0%) |
| 35 to 44 Years | 24 (22.0%) | 56 (51.4%) |
| 45 to 54 Years | 22 (21.8%) | 74 (73.3%) |
| 55 to 64 Years | 32 (15.0%) | 110 (51.6%) |
| 65 to 74 Years | 182 (100.0%) | 133 (73.1%) |
| 75 Years and over | 121 (98.4%) | 84 (68.3%) |
| Total | 491 (37.0%) | 910 (68.5%) |
Disability Status by Sex by Age in Loyal
| Age Bracket | Male | Female |
| Under 5 Years | 0 (0.0%) | 0 (0.0%) |
| 5 to 17 Years | 0 (0.0%) | 13 (10.3%) |
| 18 to 34 Years | 0 (0.0%) | 18 (10.9%) |
| 35 to 64 Years | 27 (12.6%) | 19 (9.1%) |
| 65 to 74 Years | 4 (5.6%) | 39 (35.4%) |
| 75 Years and over | 25 (52.1%) | 25 (33.3%) |
Disability Class by Sex by Age in Loyal
Disability Class: Hearing Difficulty
| Age Bracket | Male | Female |
| Under 5 Years | 0 (0.0%) | 0 (0.0%) |
| 5 to 17 Years | 0 (0.0%) | 0 (0.0%) |
| 18 to 34 Years | 0 (0.0%) | 0 (0.0%) |
| 35 to 64 Years | 0 (0.0%) | 5 (2.4%) |
| 65 to 74 Years | 0 (0.0%) | 34 (30.9%) |
| 75 Years and over | 23 (47.9%) | 16 (21.3%) |
Disability Class: Vision Difficulty
| Age Bracket | Male | Female |
| Under 5 Years | 0 (0.0%) | 0 (0.0%) |
| 5 to 17 Years | 0 (0.0%) | 0 (0.0%) |
| 18 to 34 Years | 0 (0.0%) | 9 (5.4%) |
| 35 to 64 Years | 2 (0.9%) | 2 (1.0%) |
| 65 to 74 Years | 0 (0.0%) | 0 (0.0%) |
| 75 Years and over | 6 (12.5%) | 0 (0.0%) |
Disability Class: Cognitive Difficulty
| Age Bracket | Male | Female |
| 5 to 17 Years | 0 (0.0%) | 13 (10.3%) |
| 18 to 34 Years | 0 (0.0%) | 1 (0.6%) |
| 35 to 64 Years | 18 (8.4%) | 13 (6.2%) |
| 65 to 74 Years | 3 (4.2%) | 3 (2.7%) |
| 75 Years and over | 8 (16.7%) | 9 (12.0%) |
Disability Class: Ambulatory Difficulty
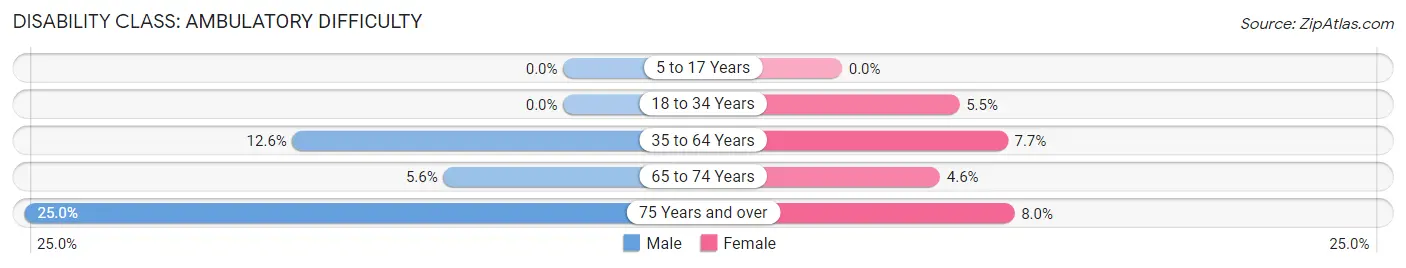
| Age Bracket | Male | Female |
| 5 to 17 Years | 0 (0.0%) | 0 (0.0%) |
| 18 to 34 Years | 0 (0.0%) | 9 (5.4%) |
| 35 to 64 Years | 27 (12.6%) | 16 (7.7%) |
| 65 to 74 Years | 4 (5.6%) | 5 (4.5%) |
| 75 Years and over | 12 (25.0%) | 6 (8.0%) |
Disability Class: Self-Care Difficulty
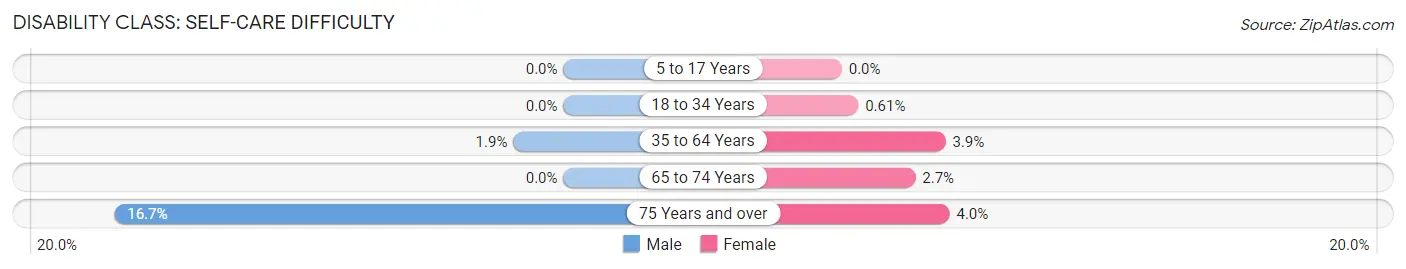
| Age Bracket | Male | Female |
| 5 to 17 Years | 0 (0.0%) | 0 (0.0%) |
| 18 to 34 Years | 0 (0.0%) | 1 (0.6%) |
| 35 to 64 Years | 4 (1.9%) | 8 (3.8%) |
| 65 to 74 Years | 0 (0.0%) | 3 (2.7%) |
| 75 Years and over | 8 (16.7%) | 3 (4.0%) |
Technology Access in Loyal
Computing Device Access in Loyal
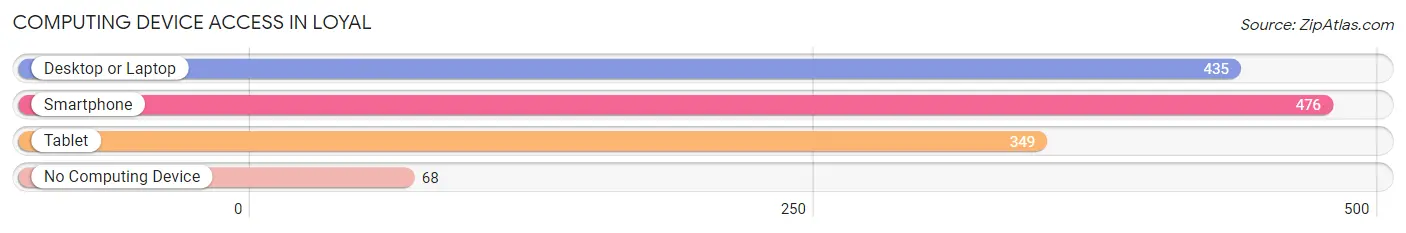
| Device Type | # Households | % Households |
| Desktop or Laptop | 435 | 75.1% |
| Smartphone | 476 | 82.2% |
| Tablet | 349 | 60.3% |
| No Computing Device | 68 | 11.7% |
| Total | 579 | 100.0% |
Internet Access in Loyal
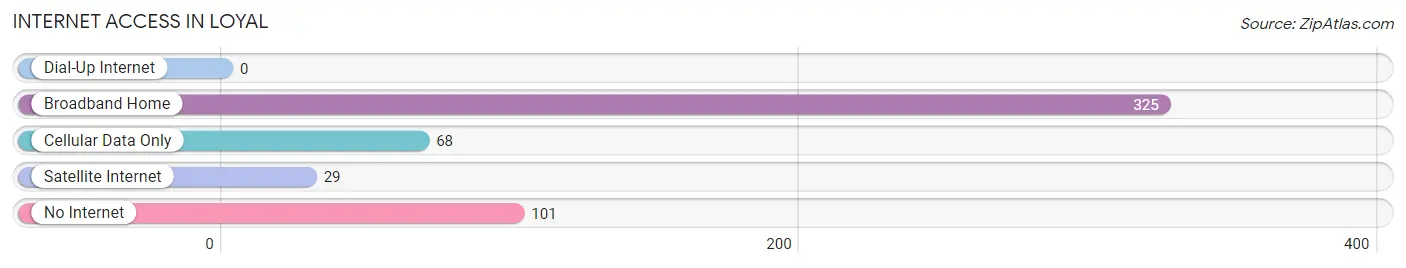
| Internet Type | # Households | % Households |
| Dial-Up Internet | 0 | 0.0% |
| Broadband Home | 325 | 56.1% |
| Cellular Data Only | 68 | 11.7% |
| Satellite Internet | 29 | 5.0% |
| No Internet | 101 | 17.4% |
| Total | 579 | 100.0% |
Loyal Summary
Loyal, Wisconsin is a small village located in Clark County, Wisconsin. It is situated on the banks of the Black River, and is home to a population of approximately 1,000 people. The village is located in the heart of Wisconsin’s dairy country, and is surrounded by rolling hills and lush farmland.
History
The area that is now Loyal was first settled in the late 1800s by German immigrants. The village was originally known as “Loyal Corners”, and was named after the Loyal family who were among the first settlers. The village was officially incorporated in 1891, and the first post office was established in 1892.
In the early 1900s, Loyal was a thriving agricultural community. The village was home to several cheese factories, a creamery, and a number of other businesses. The village also had a railroad station, which allowed for the transport of goods and people.
In the 1950s, Loyal began to experience a decline in population as many of its residents moved away in search of better economic opportunities. The village was also affected by the closure of the railroad station in the 1960s.
Geography
Loyal is located in the central part of Clark County, Wisconsin. The village is situated on the banks of the Black River, and is surrounded by rolling hills and lush farmland. The village is located approximately 25 miles north of Marshfield, and is about an hour’s drive from Eau Claire.
The village has a total area of 0.8 square miles, all of which is land. The village is located at an elevation of 890 feet above sea level.
Economy
Loyal’s economy is largely based on agriculture. The village is home to several dairy farms, as well as a number of other agricultural businesses. The village also has a number of small businesses, including a grocery store, a hardware store, and a few restaurants.
Demographics
As of the 2010 census, Loyal had a population of 1,000 people. The village has a median household income of $41,250, and a median family income of $50,000. The village has a poverty rate of 11.7%, and a median age of 43.7 years.
The village is predominantly white, with 95.2% of the population identifying as such. The village also has a small Hispanic population, with 4.8% of the population identifying as Hispanic or Latino.
Conclusion
Loyal, Wisconsin is a small village located in Clark County, Wisconsin. It is situated on the banks of the Black River, and is home to a population of approximately 1,000 people. The village is located in the heart of Wisconsin’s dairy country, and is surrounded by rolling hills and lush farmland. The village’s economy is largely based on agriculture, and the village has a median household income of $41,250. The village is predominantly white, with 95.2% of the population identifying as such.
Common Questions
What is Per Capita Income in Loyal?
Per Capita income in Loyal is $33,629.
What is the Median Family Income in Loyal?
Median Family Income in Loyal is $77,083.
What is the Median Household income in Loyal?
Median Household Income in Loyal is $59,938.
What is Income or Wage Gap in Loyal?
Income or Wage Gap in Loyal is 44.8%.
Women in Loyal earn 55.2 cents for every dollar earned by a man.
What is Inequality or Gini Index in Loyal?
Inequality or Gini Index in Loyal is 0.38.
What is the Total Population of Loyal?
Total Population of Loyal is 1,328.
What is the Total Male Population of Loyal?
Total Male Population of Loyal is 605.
What is the Total Female Population of Loyal?
Total Female Population of Loyal is 723.
What is the Ratio of Males per 100 Females in Loyal?
There are 83.68 Males per 100 Females in Loyal.
What is the Ratio of Females per 100 Males in Loyal?
There are 119.50 Females per 100 Males in Loyal.
What is the Median Population Age in Loyal?
Median Population Age in Loyal is 41.2 Years.
What is the Average Family Size in Loyal
Average Family Size in Loyal is 2.9 People.
What is the Average Household Size in Loyal
Average Household Size in Loyal is 2.3 People.
How Large is the Labor Force in Loyal?
There are 686 People in the Labor Forcein in Loyal.
What is the Percentage of People in the Labor Force in Loyal?
64.8% of People are in the Labor Force in Loyal.
What is the Unemployment Rate in Loyal?
Unemployment Rate in Loyal is 0.4%.