Lodi, WI Map & Demographics
Lodi Map
Lodi Overview
$48,706
PER CAPITA INCOME
$111,385
AVG FAMILY INCOME
$108,168
AVG HOUSEHOLD INCOME
18.6%
WAGE / INCOME GAP [ % ]
81.4¢/ $1
WAGE / INCOME GAP [ $ ]
0.34
INEQUALITY / GINI INDEX
3,196
TOTAL POPULATION
1,651
MALE POPULATION
1,545
FEMALE POPULATION
106.86
MALES / 100 FEMALES
93.58
FEMALES / 100 MALES
41.7
MEDIAN AGE
2.5
AVG FAMILY SIZE
2.2
AVG HOUSEHOLD SIZE
1,876
LABOR FORCE [ PEOPLE ]
73.3%
PERCENT IN LABOR FORCE
4.1%
UNEMPLOYMENT RATE
Lodi Zip Codes
Lodi Area Codes
Income in Lodi
Income Overview in Lodi
Per Capita Income in Lodi is $48,706, while median incomes of families and households are $111,385 and $108,168 respectively.
| Characteristic | Number | Measure |
| Per Capita Income | 3,196 | $48,706 |
| Median Family Income | 997 | $111,385 |
| Mean Family Income | 997 | $122,211 |
| Median Household Income | 1,441 | $108,168 |
| Mean Household Income | 1,441 | $112,514 |
| Income Deficit | 997 | $0 |
| Wage / Income Gap (%) | 3,196 | 18.60% |
| Wage / Income Gap ($) | 3,196 | 81.40¢ per $1 |
| Gini / Inequality Index | 3,196 | 0.34 |
Earnings by Sex in Lodi
Average Earnings in Lodi are $50,573, $56,711 for men and $46,161 for women, a difference of 18.6%.
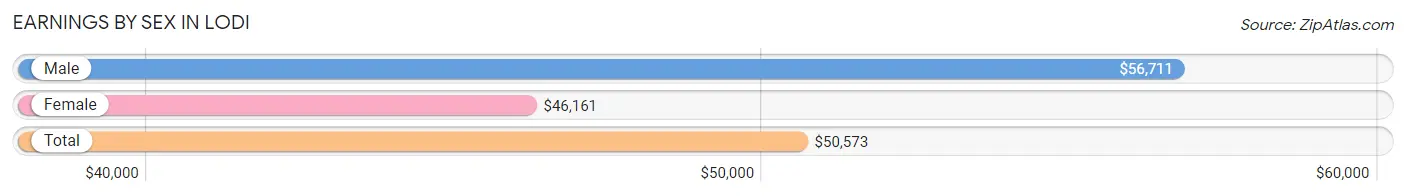
| Sex | Number | Average Earnings |
| Male | 1,026 (53.8%) | $56,711 |
| Female | 882 (46.2%) | $46,161 |
| Total | 1,908 (100.0%) | $50,573 |
Earnings by Sex by Income Bracket in Lodi
The most common earnings brackets in Lodi are $100,000+ for men (285 | 27.8%) and $75,000 to $99,999 for women (144 | 16.3%).
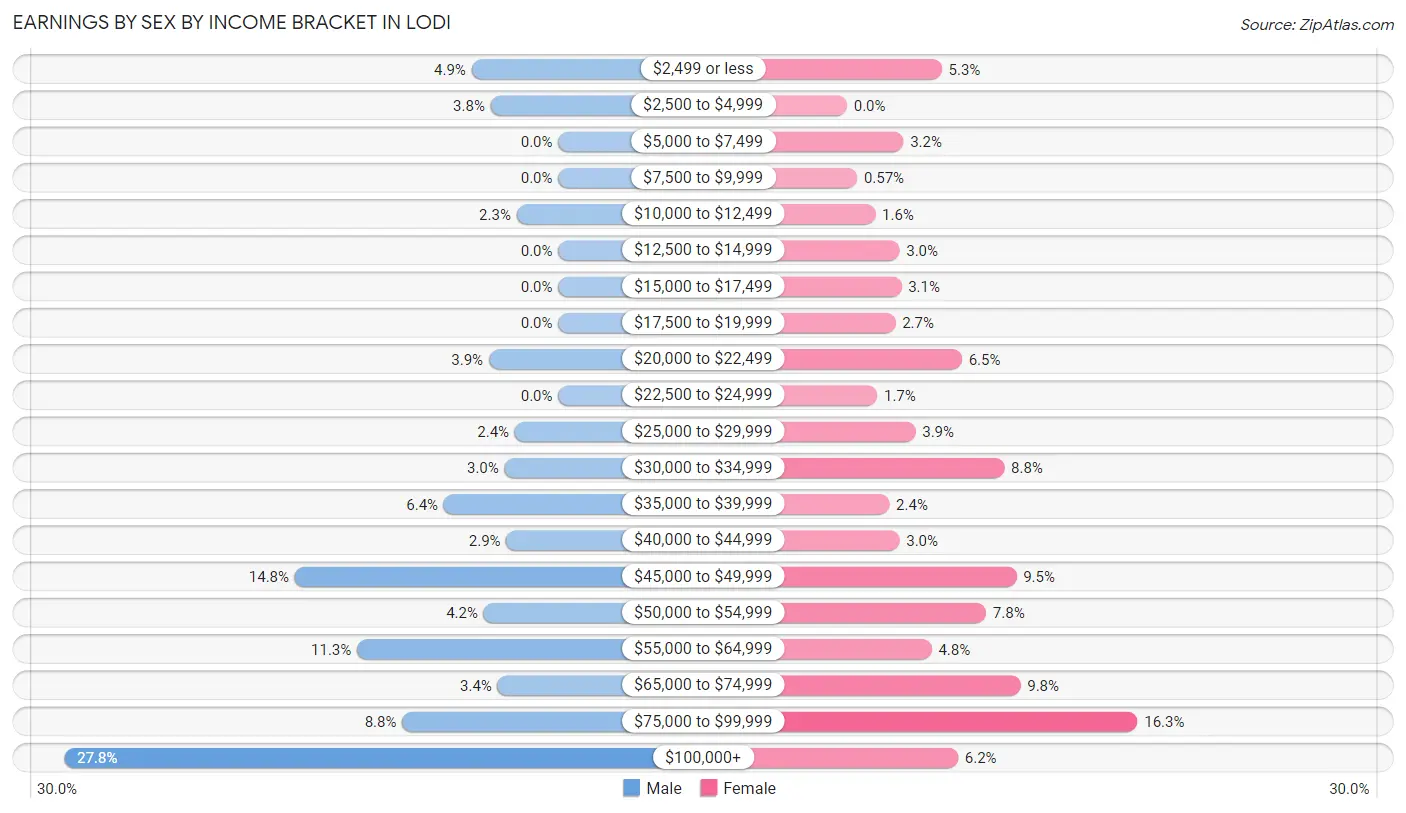
| Income | Male | Female |
| $2,499 or less | 50 (4.9%) | 47 (5.3%) |
| $2,500 to $4,999 | 39 (3.8%) | 0 (0.0%) |
| $5,000 to $7,499 | 0 (0.0%) | 28 (3.2%) |
| $7,500 to $9,999 | 0 (0.0%) | 5 (0.6%) |
| $10,000 to $12,499 | 24 (2.3%) | 14 (1.6%) |
| $12,500 to $14,999 | 0 (0.0%) | 26 (2.9%) |
| $15,000 to $17,499 | 0 (0.0%) | 27 (3.1%) |
| $17,500 to $19,999 | 0 (0.0%) | 24 (2.7%) |
| $20,000 to $22,499 | 40 (3.9%) | 57 (6.5%) |
| $22,500 to $24,999 | 0 (0.0%) | 15 (1.7%) |
| $25,000 to $29,999 | 25 (2.4%) | 34 (3.8%) |
| $30,000 to $34,999 | 31 (3.0%) | 78 (8.8%) |
| $35,000 to $39,999 | 66 (6.4%) | 21 (2.4%) |
| $40,000 to $44,999 | 30 (2.9%) | 26 (2.9%) |
| $45,000 to $49,999 | 152 (14.8%) | 84 (9.5%) |
| $50,000 to $54,999 | 43 (4.2%) | 69 (7.8%) |
| $55,000 to $64,999 | 116 (11.3%) | 42 (4.8%) |
| $65,000 to $74,999 | 35 (3.4%) | 86 (9.8%) |
| $75,000 to $99,999 | 90 (8.8%) | 144 (16.3%) |
| $100,000+ | 285 (27.8%) | 55 (6.2%) |
| Total | 1,026 (100.0%) | 882 (100.0%) |
Earnings by Sex by Educational Attainment in Lodi
Average earnings in Lodi are $59,922 for men and $50,898 for women, a difference of 15.1%. Men with an educational attainment of bachelor's degree enjoy the highest average annual earnings of $118,944, while those with college or associate's degree education earn the least with $53,500. Women with an educational attainment of graduate degree earn the most with the average annual earnings of $67,214, while those with college or associate's degree education have the smallest earnings of $34,257.
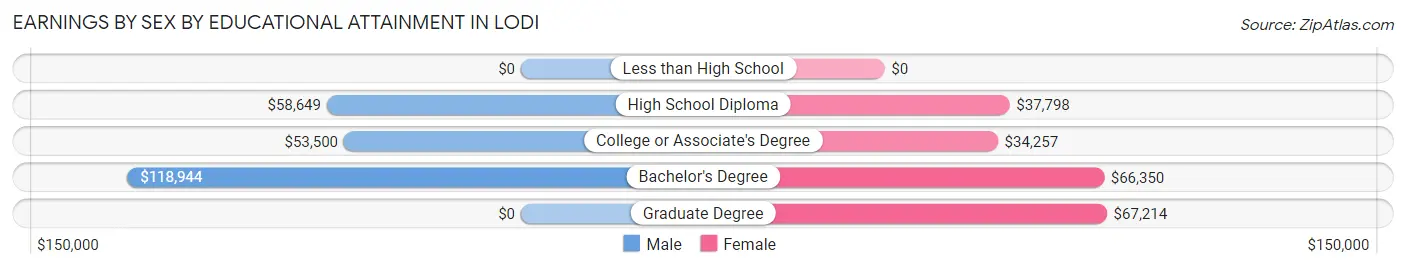
| Educational Attainment | Male Income | Female Income |
| Less than High School | - | - |
| High School Diploma | $58,649 | $37,798 |
| College or Associate's Degree | $53,500 | $34,257 |
| Bachelor's Degree | $118,944 | $66,350 |
| Graduate Degree | - | - |
| Total | $59,922 | $50,898 |
Family Income in Lodi
Family Income Brackets in Lodi
According to the Lodi family income data, there are 341 families falling into the $100,000 to $149,999 income range, which is the most common income bracket and makes up 34.2% of all families.
| Income Bracket | # Families | % Families |
| Less than $10,000 | 21 | 2.1% |
| $10,000 to $14,999 | 0 | 0.0% |
| $15,000 to $24,999 | 0 | 0.0% |
| $25,000 to $34,999 | 16 | 1.6% |
| $35,000 to $49,999 | 69 | 6.9% |
| $50,000 to $74,999 | 116 | 11.6% |
| $75,000 to $99,999 | 133 | 13.3% |
| $100,000 to $149,999 | 341 | 34.2% |
| $150,000 to $199,999 | 197 | 19.8% |
| $200,000+ | 104 | 10.4% |
Family Income by Famaliy Size in Lodi
4-person families (212 | 21.3%) account for the highest median family income in Lodi with $160,000 per family, while 2-person families (570 | 57.2%) have the highest median income of $54,676 per family member.
| Income Bracket | # Families | Median Income |
| 2-Person Families | 570 (57.2%) | $109,353 |
| 3-Person Families | 108 (10.8%) | $0 |
| 4-Person Families | 212 (21.3%) | $160,000 |
| 5-Person Families | 24 (2.4%) | $0 |
| 6-Person Families | 13 (1.3%) | $0 |
| 7+ Person Families | 70 (7.0%) | $0 |
| Total | 997 (100.0%) | $111,385 |
Family Income by Number of Earners in Lodi
The median family income in Lodi is $111,385, with families comprising 3+ earners (106) having the highest median family income of $220,769, while families with 1 earner (248) have the lowest median family income of $75,903, accounting for 10.6% and 24.9% of families, respectively.
| Number of Earners | # Families | Median Income |
| No Earners | 234 (23.5%) | $111,127 |
| 1 Earner | 248 (24.9%) | $75,903 |
| 2 Earners | 409 (41.0%) | $123,882 |
| 3+ Earners | 106 (10.6%) | $220,769 |
| Total | 997 (100.0%) | $111,385 |
Household Income in Lodi
Household Income Brackets in Lodi
With 391 households falling in the category, the $100,000 to $149,999 income range is the most frequent in Lodi, accounting for 27.1% of all households. In contrast, only 16 households (1.1%) fall into the $10,000 to $14,999 income bracket, making it the least populous group.
| Income Bracket | # Households | % Households |
| Less than $10,000 | 22 | 1.5% |
| $10,000 to $14,999 | 16 | 1.1% |
| $15,000 to $24,999 | 73 | 5.1% |
| $25,000 to $34,999 | 27 | 1.9% |
| $35,000 to $49,999 | 133 | 9.2% |
| $50,000 to $74,999 | 208 | 14.4% |
| $75,000 to $99,999 | 197 | 13.7% |
| $100,000 to $149,999 | 391 | 27.1% |
| $150,000 to $199,999 | 197 | 13.7% |
| $200,000+ | 179 | 12.4% |
Household Income by Householder Age in Lodi
The median household income in Lodi is $108,168, with the highest median household income of $132,273 found in the 25 to 44 years age bracket for the primary householder. A total of 398 households (27.6%) fall into this category. Meanwhile, the 15 to 24 years age bracket for the primary householder has the lowest median household income of $0, with 54 households (3.7%) in this group.
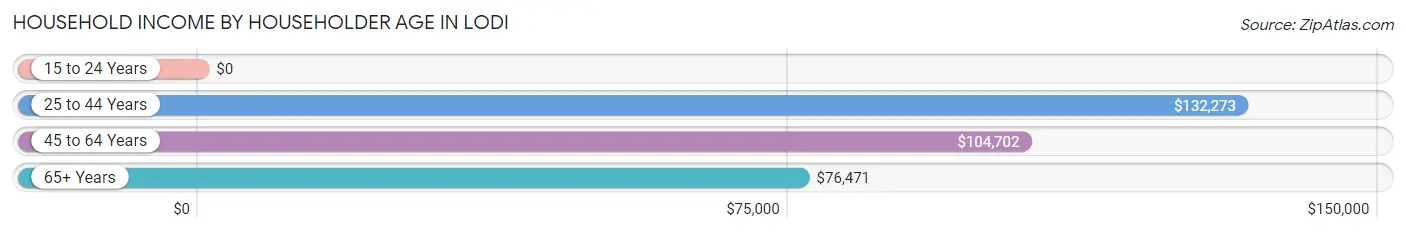
| Income Bracket | # Households | Median Income |
| 15 to 24 Years | 54 (3.7%) | $0 |
| 25 to 44 Years | 398 (27.6%) | $132,273 |
| 45 to 64 Years | 473 (32.8%) | $104,702 |
| 65+ Years | 516 (35.8%) | $76,471 |
| Total | 1,441 (100.0%) | $108,168 |
Poverty in Lodi
Income Below Poverty by Sex and Age in Lodi
With 4.0% poverty level for males and 5.3% for females among the residents of Lodi, 6 to 11 year old males and 18 to 24 year old females are the most vulnerable to poverty, with 13 males (26.0%) and 28 females (42.4%) in their respective age groups living below the poverty level.
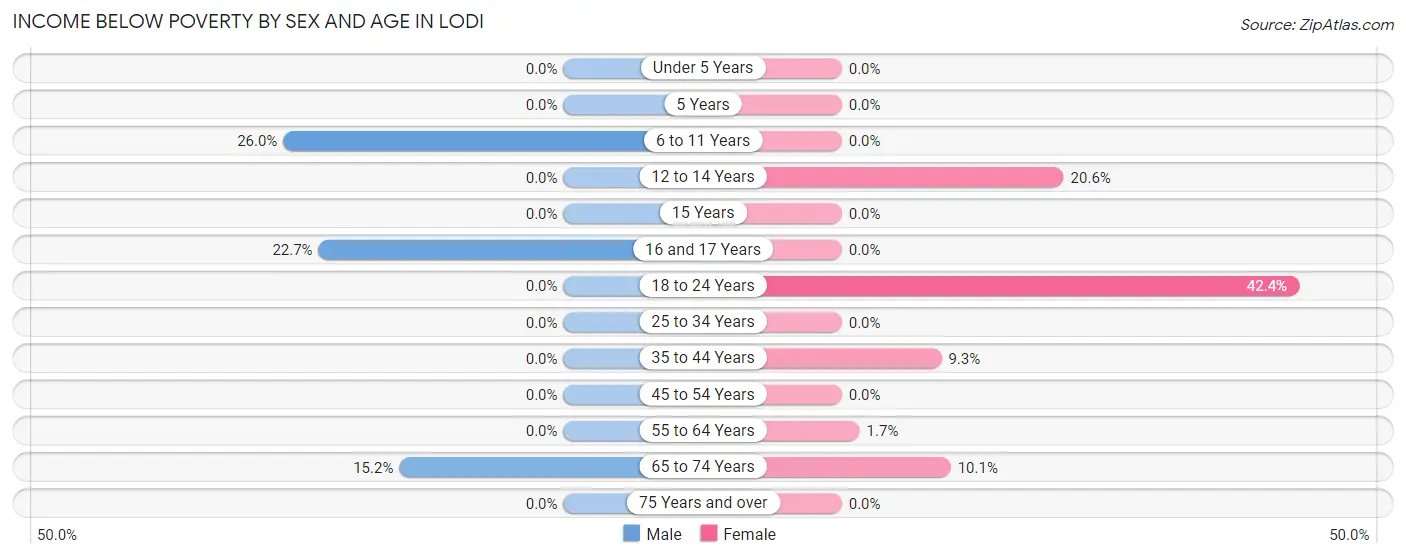
| Age Bracket | Male | Female |
| Under 5 Years | 0 (0.0%) | 0 (0.0%) |
| 5 Years | 0 (0.0%) | 0 (0.0%) |
| 6 to 11 Years | 13 (26.0%) | 0 (0.0%) |
| 12 to 14 Years | 0 (0.0%) | 14 (20.6%) |
| 15 Years | 0 (0.0%) | 0 (0.0%) |
| 16 and 17 Years | 15 (22.7%) | 0 (0.0%) |
| 18 to 24 Years | 0 (0.0%) | 28 (42.4%) |
| 25 to 34 Years | 0 (0.0%) | 0 (0.0%) |
| 35 to 44 Years | 0 (0.0%) | 16 (9.2%) |
| 45 to 54 Years | 0 (0.0%) | 0 (0.0%) |
| 55 to 64 Years | 0 (0.0%) | 3 (1.7%) |
| 65 to 74 Years | 37 (15.2%) | 19 (10.1%) |
| 75 Years and over | 0 (0.0%) | 0 (0.0%) |
| Total | 65 (4.0%) | 80 (5.3%) |
Income Above Poverty by Sex and Age in Lodi
According to the poverty statistics in Lodi, males aged under 5 years and females aged under 5 years are the age groups that are most secure financially, with 100.0% of males and 100.0% of females in these age groups living above the poverty line.
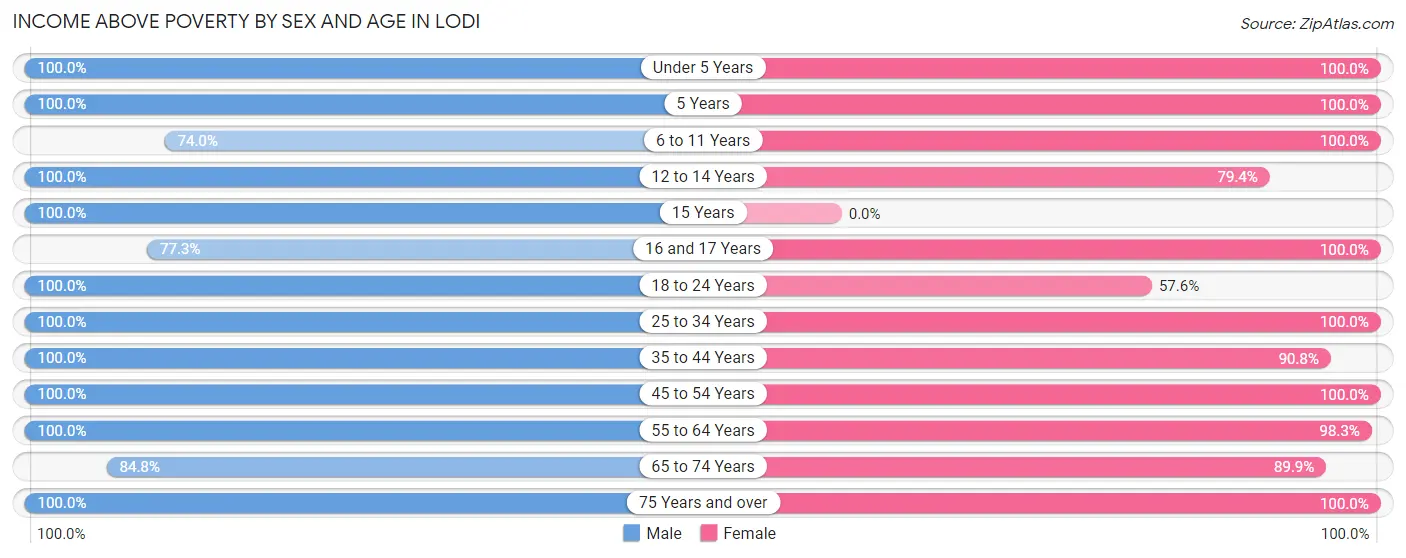
| Age Bracket | Male | Female |
| Under 5 Years | 111 (100.0%) | 76 (100.0%) |
| 5 Years | 16 (100.0%) | 11 (100.0%) |
| 6 to 11 Years | 37 (74.0%) | 159 (100.0%) |
| 12 to 14 Years | 99 (100.0%) | 54 (79.4%) |
| 15 Years | 47 (100.0%) | 0 (0.0%) |
| 16 and 17 Years | 51 (77.3%) | 60 (100.0%) |
| 18 to 24 Years | 82 (100.0%) | 38 (57.6%) |
| 25 to 34 Years | 265 (100.0%) | 207 (100.0%) |
| 35 to 44 Years | 179 (100.0%) | 157 (90.7%) |
| 45 to 54 Years | 157 (100.0%) | 230 (100.0%) |
| 55 to 64 Years | 200 (100.0%) | 178 (98.3%) |
| 65 to 74 Years | 206 (84.8%) | 169 (89.9%) |
| 75 Years and over | 127 (100.0%) | 95 (100.0%) |
| Total | 1,577 (96.0%) | 1,434 (94.7%) |
Income Below Poverty Among Married-Couple Families in Lodi
The poverty statistics for married-couple families in Lodi show that 2.5% or 21 of the total 854 families live below the poverty line. Families with no children have the highest poverty rate of 3.6%, comprising of 21 families. On the other hand, families with 1 or 2 children have the lowest poverty rate of 0.0%, which includes 0 families.
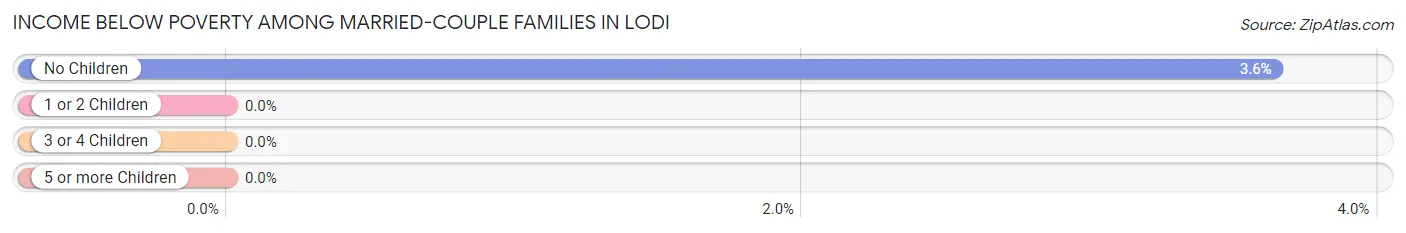
| Children | Above Poverty | Below Poverty |
| No Children | 556 (96.4%) | 21 (3.6%) |
| 1 or 2 Children | 170 (100.0%) | 0 (0.0%) |
| 3 or 4 Children | 107 (100.0%) | 0 (0.0%) |
| 5 or more Children | 0 (0.0%) | 0 (0.0%) |
| Total | 833 (97.5%) | 21 (2.5%) |
Income Below Poverty Among Single-Parent Households in Lodi
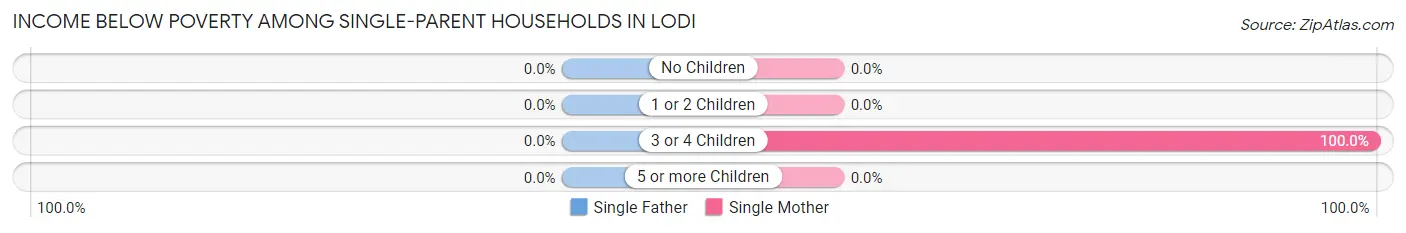
| Children | Single Father | Single Mother |
| No Children | 0 (0.0%) | 0 (0.0%) |
| 1 or 2 Children | 0 (0.0%) | 0 (0.0%) |
| 3 or 4 Children | 0 (0.0%) | 16 (100.0%) |
| 5 or more Children | 0 (0.0%) | 0 (0.0%) |
| Total | 0 (0.0%) | 16 (14.0%) |
Income Below Poverty Among Married-Couple vs Single-Parent Households in Lodi
The poverty data for Lodi shows that 21 of the married-couple family households (2.5%) and 16 of the single-parent households (11.2%) are living below the poverty level. Within the married-couple family households, those with no children have the highest poverty rate, with 21 households (3.6%) falling below the poverty line. Among the single-parent households, those with 3 or 4 children have the highest poverty rate, with 16 household (100.0%) living below poverty.
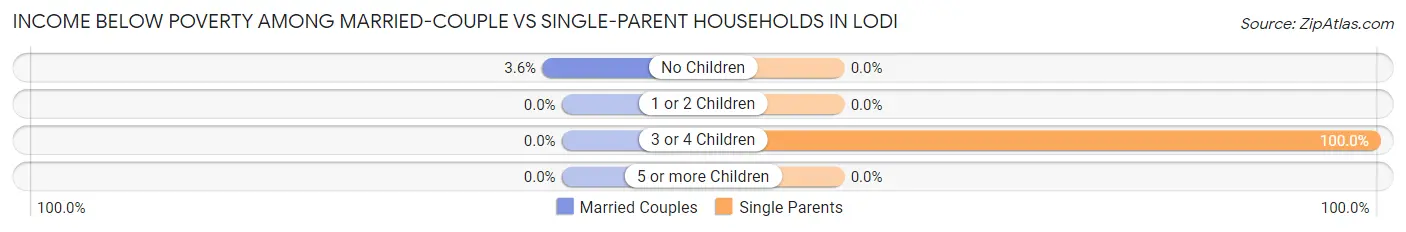
| Children | Married-Couple Families | Single-Parent Households |
| No Children | 21 (3.6%) | 0 (0.0%) |
| 1 or 2 Children | 0 (0.0%) | 0 (0.0%) |
| 3 or 4 Children | 0 (0.0%) | 16 (100.0%) |
| 5 or more Children | 0 (0.0%) | 0 (0.0%) |
| Total | 21 (2.5%) | 16 (11.2%) |
Race in Lodi
The most populous races in Lodi are White / Caucasian (3,142 | 98.3%), Two or more Races (41 | 1.3%), and Hispanic or Latino (27 | 0.8%).
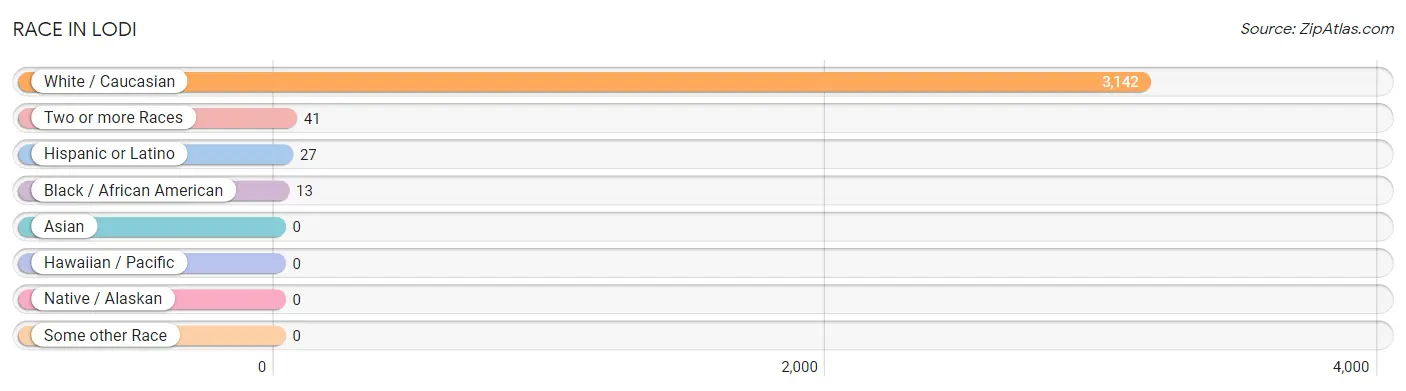
| Race | # Population | % Population |
| Asian | 0 | 0.0% |
| Black / African American | 13 | 0.4% |
| Hawaiian / Pacific | 0 | 0.0% |
| Hispanic or Latino | 27 | 0.8% |
| Native / Alaskan | 0 | 0.0% |
| White / Caucasian | 3,142 | 98.3% |
| Two or more Races | 41 | 1.3% |
| Some other Race | 0 | 0.0% |
| Total | 3,196 | 100.0% |
Ancestry in Lodi
The most populous ancestries reported in Lodi are German (1,123 | 35.1%), Irish (732 | 22.9%), Norwegian (584 | 18.3%), English (573 | 17.9%), and Polish (161 | 5.0%), together accounting for 99.3% of all Lodi residents.
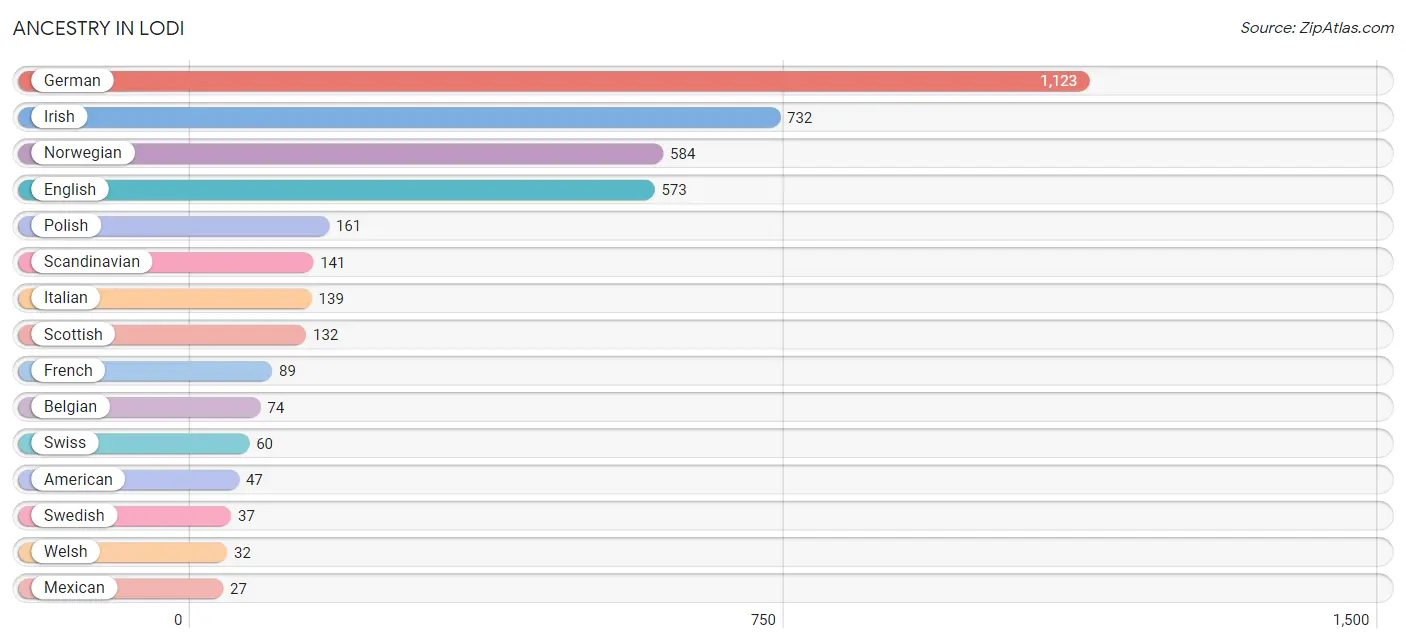
| Ancestry | # Population | % Population |
| American | 47 | 1.5% |
| Armenian | 16 | 0.5% |
| Austrian | 25 | 0.8% |
| Belgian | 74 | 2.3% |
| British | 16 | 0.5% |
| Croatian | 15 | 0.5% |
| Danish | 15 | 0.5% |
| Dutch | 15 | 0.5% |
| English | 573 | 17.9% |
| French | 89 | 2.8% |
| German | 1,123 | 35.1% |
| Irish | 732 | 22.9% |
| Italian | 139 | 4.3% |
| Korean | 11 | 0.3% |
| Mexican | 27 | 0.8% |
| Mexican American Indian | 27 | 0.8% |
| Norwegian | 584 | 18.3% |
| Polish | 161 | 5.0% |
| Portuguese | 16 | 0.5% |
| Scandinavian | 141 | 4.4% |
| Scottish | 132 | 4.1% |
| Slavic | 7 | 0.2% |
| Swedish | 37 | 1.2% |
| Swiss | 60 | 1.9% |
| Welsh | 32 | 1.0% | View All 25 Rows |
Immigrants in Lodi

| Immigration Origin | # Population | % Population | View All 0 Rows |
Sex and Age in Lodi
Sex and Age in Lodi
The most populous age groups in Lodi are 25 to 29 Years (152 | 9.2%) for men and 10 to 14 Years (172 | 11.1%) for women.
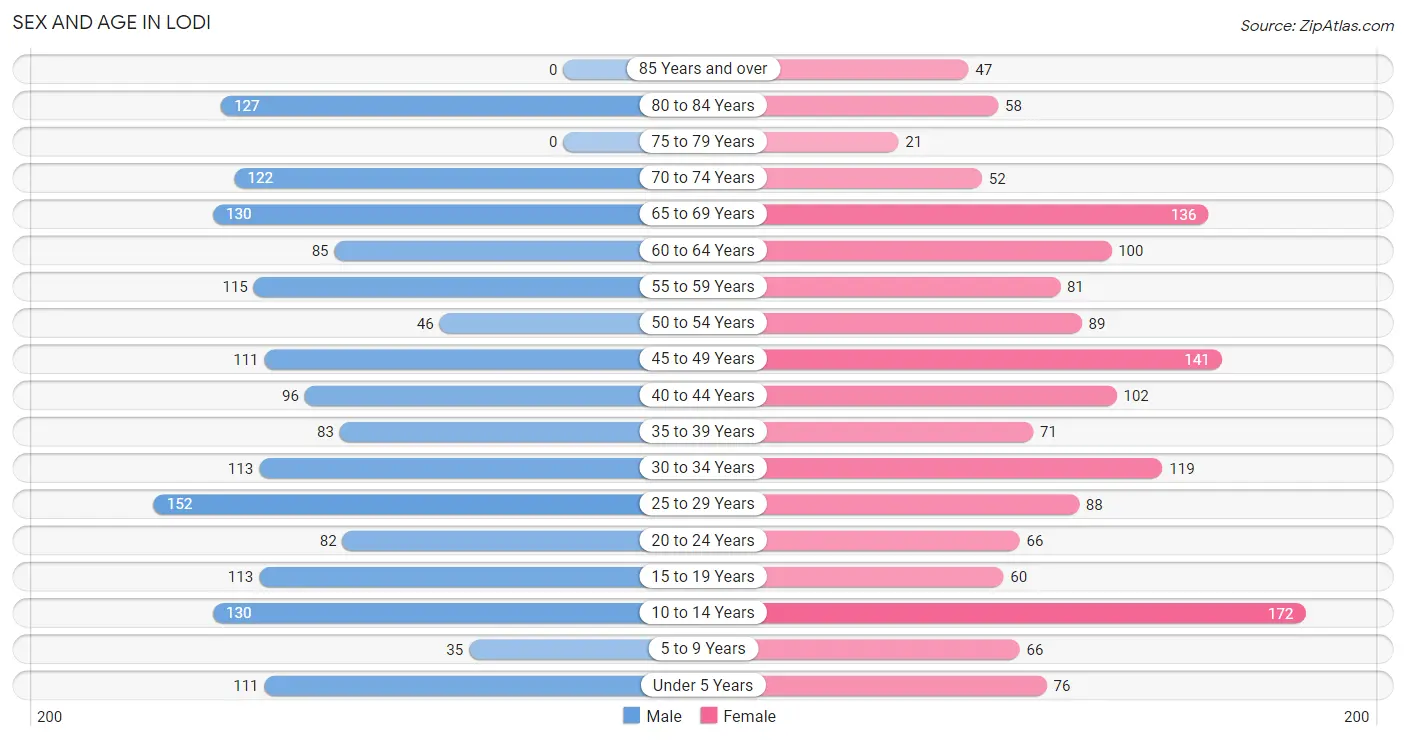
| Age Bracket | Male | Female |
| Under 5 Years | 111 (6.7%) | 76 (4.9%) |
| 5 to 9 Years | 35 (2.1%) | 66 (4.3%) |
| 10 to 14 Years | 130 (7.9%) | 172 (11.1%) |
| 15 to 19 Years | 113 (6.8%) | 60 (3.9%) |
| 20 to 24 Years | 82 (5.0%) | 66 (4.3%) |
| 25 to 29 Years | 152 (9.2%) | 88 (5.7%) |
| 30 to 34 Years | 113 (6.8%) | 119 (7.7%) |
| 35 to 39 Years | 83 (5.0%) | 71 (4.6%) |
| 40 to 44 Years | 96 (5.8%) | 102 (6.6%) |
| 45 to 49 Years | 111 (6.7%) | 141 (9.1%) |
| 50 to 54 Years | 46 (2.8%) | 89 (5.8%) |
| 55 to 59 Years | 115 (7.0%) | 81 (5.2%) |
| 60 to 64 Years | 85 (5.1%) | 100 (6.5%) |
| 65 to 69 Years | 130 (7.9%) | 136 (8.8%) |
| 70 to 74 Years | 122 (7.4%) | 52 (3.4%) |
| 75 to 79 Years | 0 (0.0%) | 21 (1.4%) |
| 80 to 84 Years | 127 (7.7%) | 58 (3.7%) |
| 85 Years and over | 0 (0.0%) | 47 (3.0%) |
| Total | 1,651 (100.0%) | 1,545 (100.0%) |
Families and Households in Lodi
Median Family Size in Lodi
The median family size in Lodi is 2.55 persons per family, with single male/father families (29 | 2.9%) accounting for the largest median family size of 4.24 persons per family. On the other hand, married-couple families (854 | 85.7%) represent the smallest median family size with 2.45 persons per family.
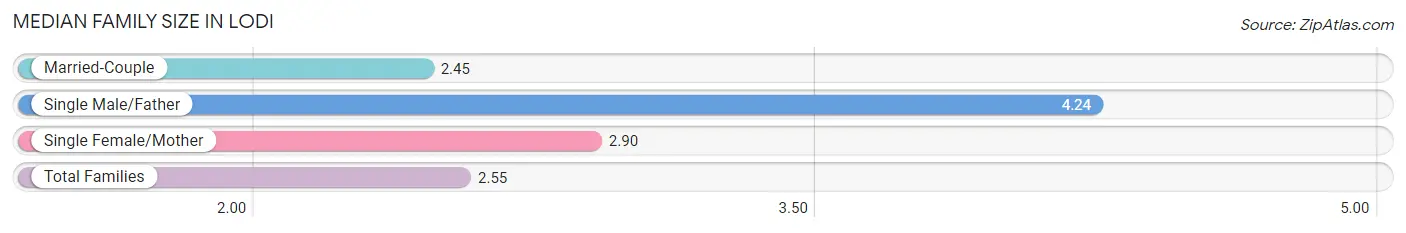
| Family Type | # Families | Family Size |
| Married-Couple | 854 (85.7%) | 2.45 |
| Single Male/Father | 29 (2.9%) | 4.24 |
| Single Female/Mother | 114 (11.4%) | 2.90 |
| Total Families | 997 (100.0%) | 2.55 |
Median Household Size in Lodi
The median household size in Lodi is 2.19 persons per household, with single male/father households (29 | 2.0%) accounting for the largest median household size of 4.24 persons per household. non-family households (444 | 30.8%) represent the smallest median household size with 1.33 persons per household.
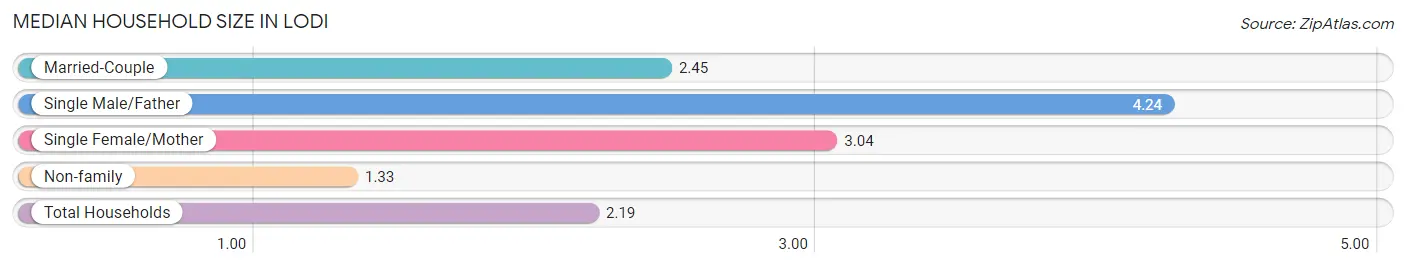
| Household Type | # Households | Household Size |
| Married-Couple | 854 (59.3%) | 2.45 |
| Single Male/Father | 29 (2.0%) | 4.24 |
| Single Female/Mother | 114 (7.9%) | 3.04 |
| Non-family | 444 (30.8%) | 1.33 |
| Total Households | 1,441 (100.0%) | 2.19 |
Household Size by Marriage Status in Lodi
Out of a total of 1,441 households in Lodi, 997 (69.2%) are family households, while 444 (30.8%) are nonfamily households. The most numerous type of family households are 2-person households, comprising 570, and the most common type of nonfamily households are 1-person households, comprising 339.
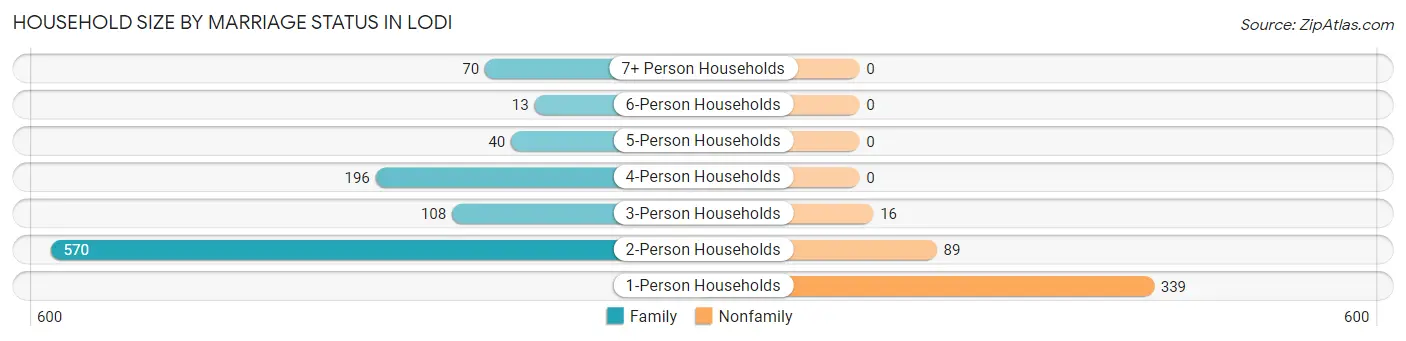
| Household Size | Family Households | Nonfamily Households |
| 1-Person Households | - | 339 (23.5%) |
| 2-Person Households | 570 (39.6%) | 89 (6.2%) |
| 3-Person Households | 108 (7.5%) | 16 (1.1%) |
| 4-Person Households | 196 (13.6%) | 0 (0.0%) |
| 5-Person Households | 40 (2.8%) | 0 (0.0%) |
| 6-Person Households | 13 (0.9%) | 0 (0.0%) |
| 7+ Person Households | 70 (4.9%) | 0 (0.0%) |
| Total | 997 (69.2%) | 444 (30.8%) |
Female Fertility in Lodi
Fertility by Age in Lodi
Average fertility rate in Lodi is 87.0 births per 1,000 women. Women in the age bracket of 20 to 34 years have the highest fertility rate with 168.0 births per 1,000 women. Women in the age bracket of 20 to 34 years acount for 74.2% of all women with births.
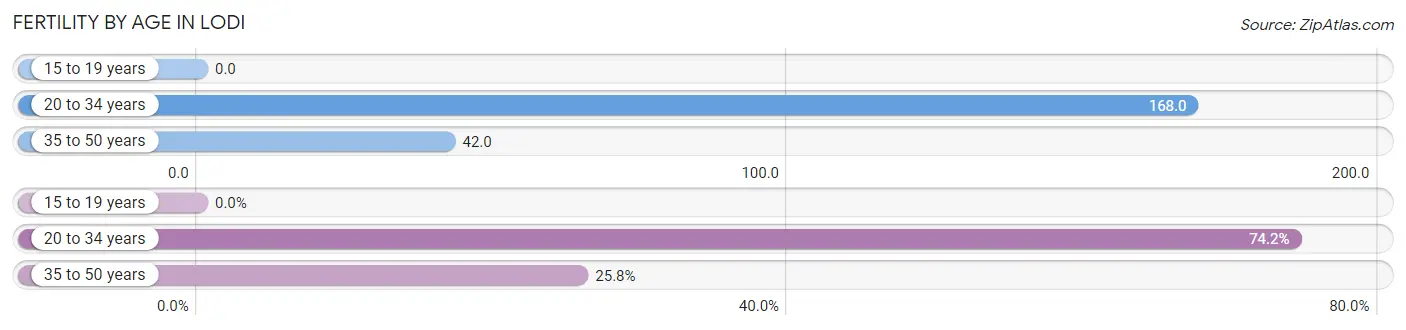
| Age Bracket | Women with Births | Births / 1,000 Women |
| 15 to 19 years | 0 (0.0%) | 0.0 |
| 20 to 34 years | 46 (74.2%) | 168.0 |
| 35 to 50 years | 16 (25.8%) | 42.0 |
| Total | 62 (100.0%) | 87.0 |
Fertility by Age by Marriage Status in Lodi
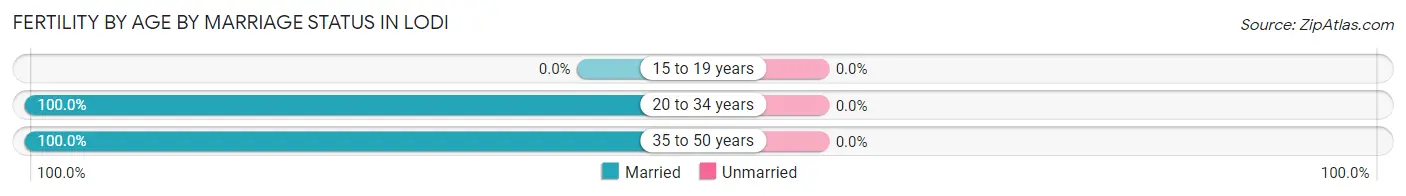
| Age Bracket | Married | Unmarried |
| 15 to 19 years | 0 (0.0%) | 0 (0.0%) |
| 20 to 34 years | 46 (100.0%) | 0 (0.0%) |
| 35 to 50 years | 16 (100.0%) | 0 (0.0%) |
| Total | 62 (100.0%) | 0 (0.0%) |
Fertility by Education in Lodi
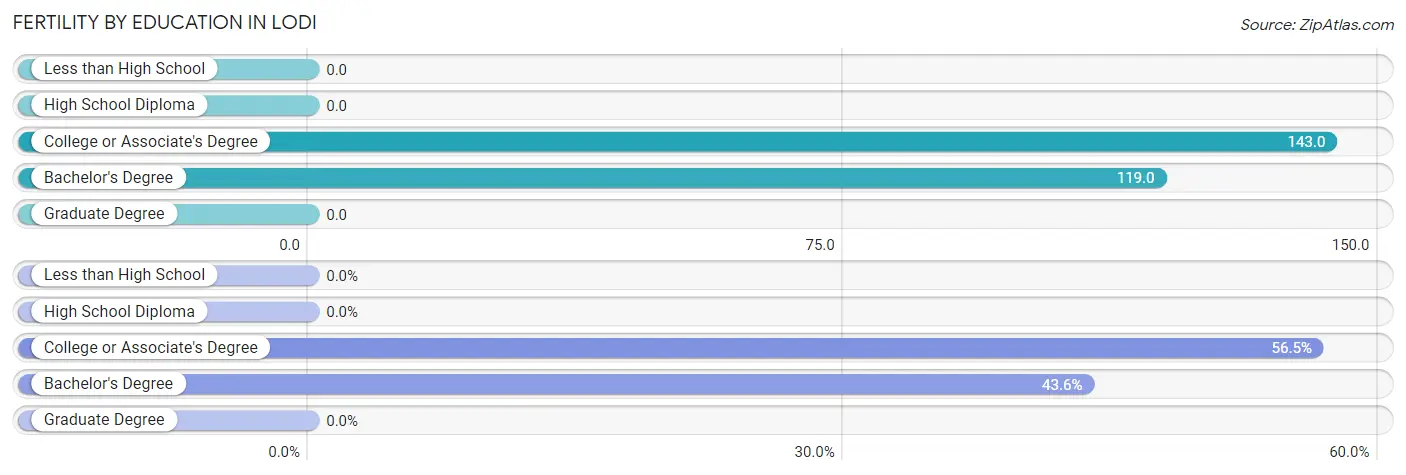
| Educational Attainment | Women with Births | Births / 1,000 Women |
| Less than High School | 0 (0.0%) | 0.0 |
| High School Diploma | 0 (0.0%) | 0.0 |
| College or Associate's Degree | 35 (56.5%) | 143.0 |
| Bachelor's Degree | 27 (43.5%) | 119.0 |
| Graduate Degree | 0 (0.0%) | 0.0 |
| Total | 62 (100.0%) | 87.0 |
Fertility by Education by Marriage Status in Lodi
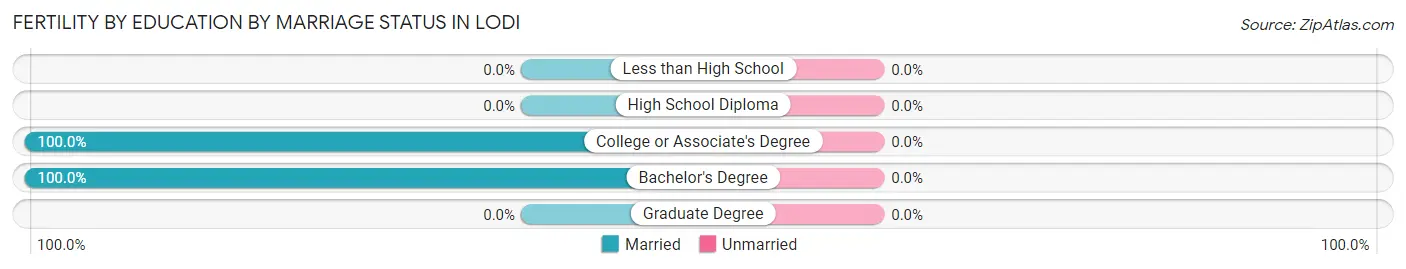
| Educational Attainment | Married | Unmarried |
| Less than High School | 0 (0.0%) | 0 (0.0%) |
| High School Diploma | 0 (0.0%) | 0 (0.0%) |
| College or Associate's Degree | 35 (100.0%) | 0 (0.0%) |
| Bachelor's Degree | 27 (100.0%) | 0 (0.0%) |
| Graduate Degree | 0 (0.0%) | 0 (0.0%) |
| Total | 62 (100.0%) | 0 (0.0%) |
Employment Characteristics in Lodi
Employment by Class of Employer in Lodi
Among the 1,740 employed individuals in Lodi, private company employees (1,027 | 59.0%), self-employed (not incorporated) (157 | 9.0%), and federal government employees (155 | 8.9%) make up the most common classes of employment.
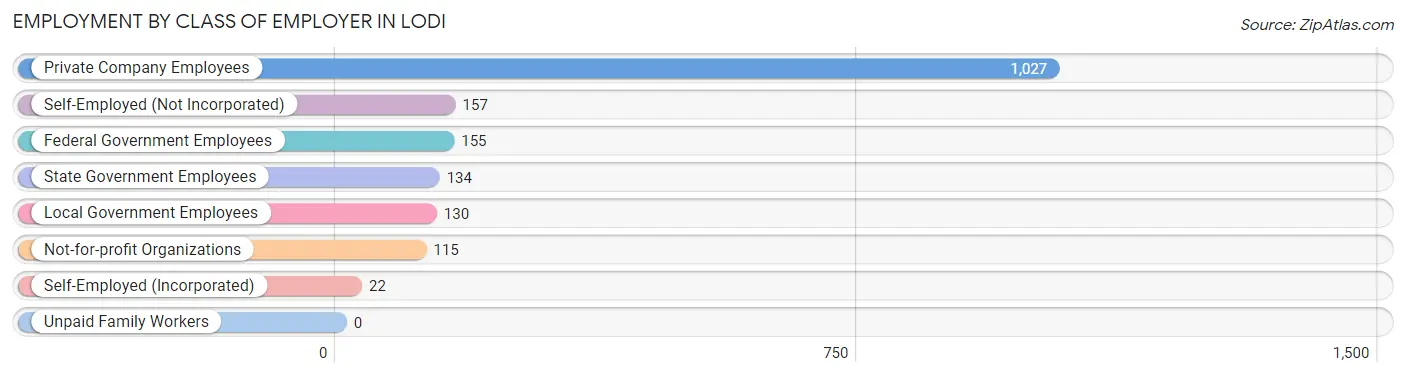
| Employer Class | # Employees | % Employees |
| Private Company Employees | 1,027 | 59.0% |
| Self-Employed (Incorporated) | 22 | 1.3% |
| Self-Employed (Not Incorporated) | 157 | 9.0% |
| Not-for-profit Organizations | 115 | 6.6% |
| Local Government Employees | 130 | 7.5% |
| State Government Employees | 134 | 7.7% |
| Federal Government Employees | 155 | 8.9% |
| Unpaid Family Workers | 0 | 0.0% |
| Total | 1,740 | 100.0% |
Employment Status by Age in Lodi
According to the labor force statistics for Lodi, out of the total population over 16 years of age (2,559), 73.3% or 1,876 individuals are in the labor force, with 4.1% or 77 of them unemployed. The age group with the highest labor force participation rate is 20 to 24 years, with 100.0% or 148 individuals in the labor force. Within the labor force, the 20 to 24 years age range has the highest percentage of unemployed individuals, with 22.3% or 33 of them being unemployed.
| Age Bracket | In Labor Force | Unemployed |
| 16 to 19 Years | 113 (89.7%) | 12 (10.6%) |
| 20 to 24 Years | 148 (100.0%) | 33 (22.3%) |
| 25 to 29 Years | 240 (100.0%) | 0 (0.0%) |
| 30 to 34 Years | 232 (100.0%) | 0 (0.0%) |
| 35 to 44 Years | 334 (94.9%) | 16 (4.8%) |
| 45 to 54 Years | 387 (100.0%) | 0 (0.0%) |
| 55 to 59 Years | 147 (75.0%) | 15 (10.2%) |
| 60 to 64 Years | 182 (98.4%) | 0 (0.0%) |
| 65 to 74 Years | 94 (21.4%) | 0 (0.0%) |
| 75 Years and over | 0 (0.0%) | 0 (0.0%) |
| Total | 1,876 (73.3%) | 77 (4.1%) |
Employment Status by Educational Attainment in Lodi
According to labor force statistics for Lodi, 95.6% of individuals (1,522) out of the total population between 25 and 64 years of age (1,592) are in the labor force, with 2.0% or 30 of them being unemployed. The group with the highest labor force participation rate are those with the educational attainment of bachelor's degree or higher, with 100.0% or 682 individuals in the labor force. Within the labor force, individuals with high school diploma education have the highest percentage of unemployment, with 5.6% or 15 of them being unemployed.
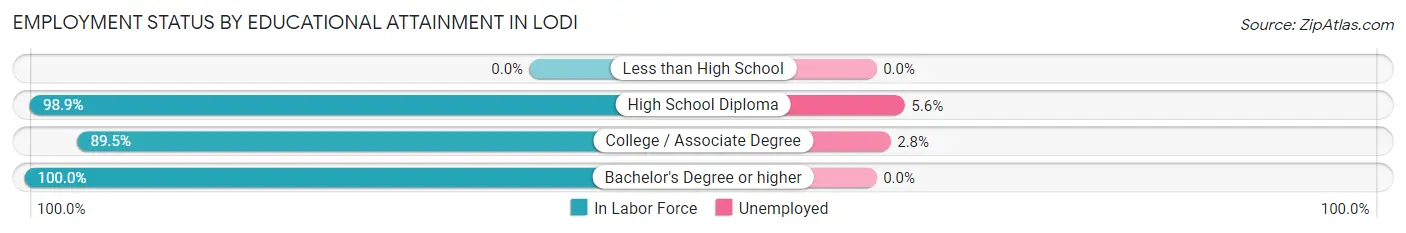
| Educational Attainment | In Labor Force | Unemployed |
| Less than High School | 0 (0.0%) | 0 (0.0%) |
| High School Diploma | 268 (98.9%) | 15 (5.6%) |
| College / Associate Degree | 572 (89.5%) | 18 (2.8%) |
| Bachelor's Degree or higher | 682 (100.0%) | 0 (0.0%) |
| Total | 1,522 (95.6%) | 32 (2.0%) |
Employment Occupations by Sex in Lodi
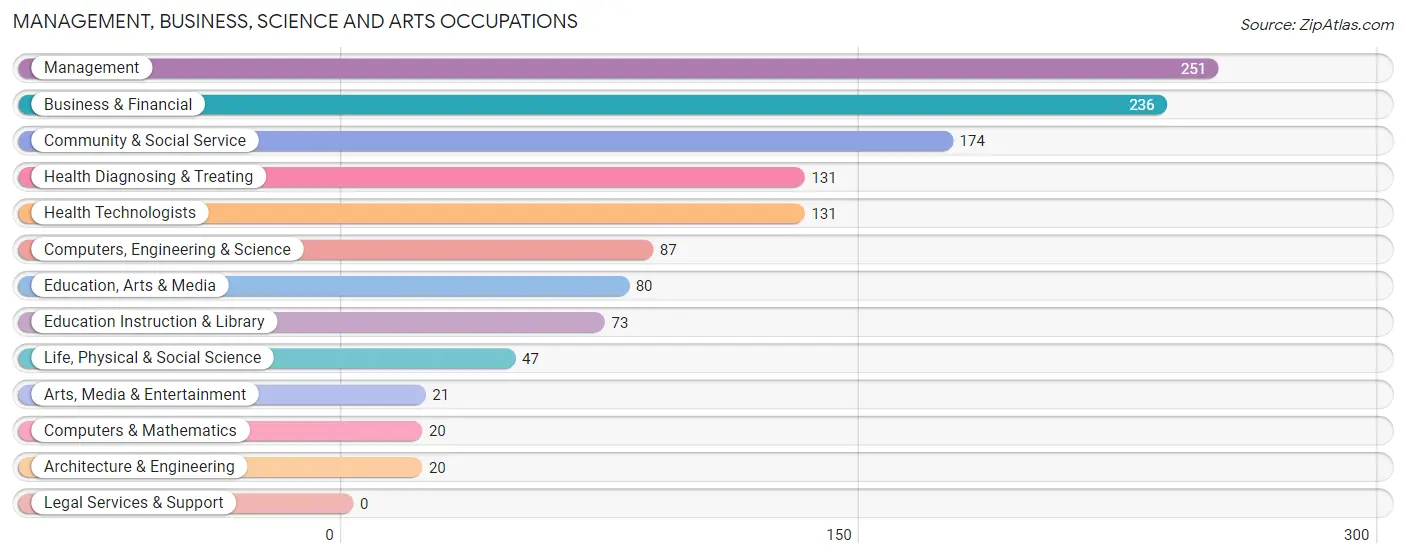
Management, Business, Science and Arts Occupations
The most common Management, Business, Science and Arts occupations in Lodi are Management (251 | 14.0%), Business & Financial (236 | 13.2%), Community & Social Service (174 | 9.7%), Health Diagnosing & Treating (131 | 7.3%), and Health Technologists (131 | 7.3%).
Management, Business, Science and Arts Occupations by Sex
Within the Management, Business, Science and Arts occupations in Lodi, the most male-oriented occupations are Computers & Mathematics (100.0%), Architecture & Engineering (100.0%), and Computers, Engineering & Science (75.9%), while the most female-oriented occupations are Education, Arts & Media (100.0%), Arts, Media & Entertainment (100.0%), and Health Diagnosing & Treating (84.7%).
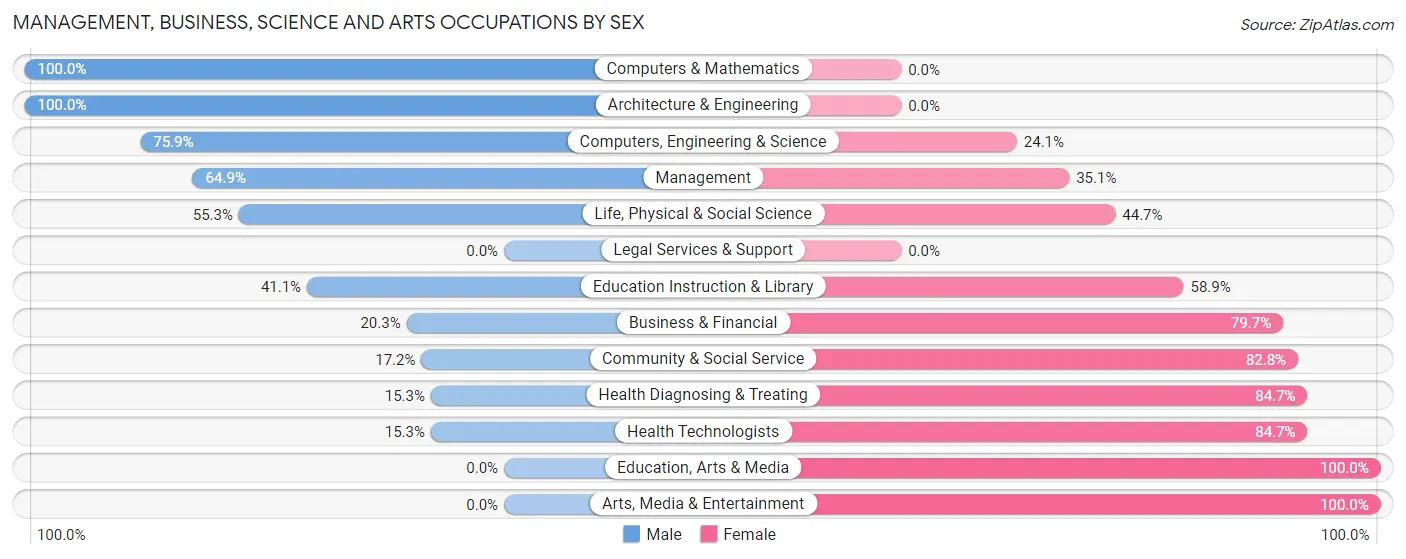
| Occupation | Male | Female |
| Management | 163 (64.9%) | 88 (35.1%) |
| Business & Financial | 48 (20.3%) | 188 (79.7%) |
| Computers, Engineering & Science | 66 (75.9%) | 21 (24.1%) |
| Computers & Mathematics | 20 (100.0%) | 0 (0.0%) |
| Architecture & Engineering | 20 (100.0%) | 0 (0.0%) |
| Life, Physical & Social Science | 26 (55.3%) | 21 (44.7%) |
| Community & Social Service | 30 (17.2%) | 144 (82.8%) |
| Education, Arts & Media | 0 (0.0%) | 80 (100.0%) |
| Legal Services & Support | 0 (0.0%) | 0 (0.0%) |
| Education Instruction & Library | 30 (41.1%) | 43 (58.9%) |
| Arts, Media & Entertainment | 0 (0.0%) | 21 (100.0%) |
| Health Diagnosing & Treating | 20 (15.3%) | 111 (84.7%) |
| Health Technologists | 20 (15.3%) | 111 (84.7%) |
| Total (Category) | 327 (37.2%) | 552 (62.8%) |
| Total (Overall) | 948 (52.8%) | 846 (47.2%) |
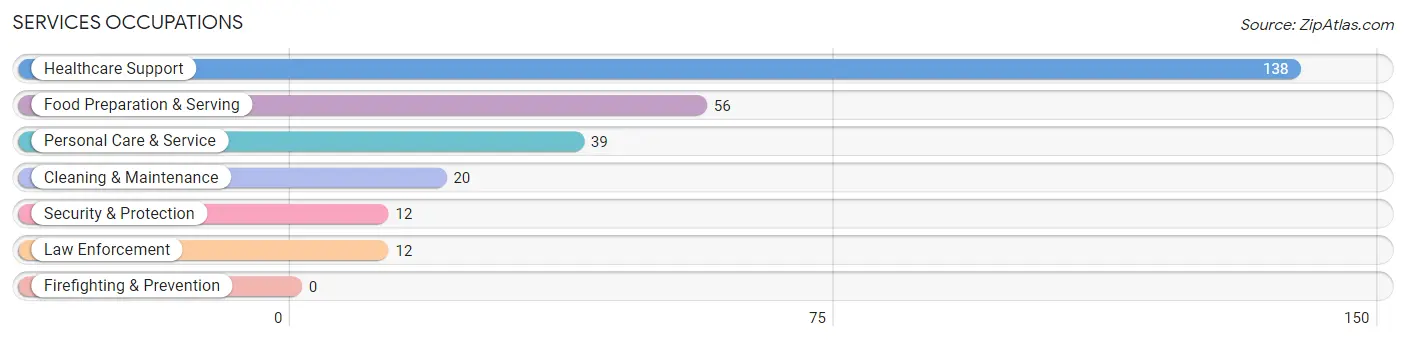
Services Occupations
The most common Services occupations in Lodi are Healthcare Support (138 | 7.7%), Food Preparation & Serving (56 | 3.1%), Personal Care & Service (39 | 2.2%), Cleaning & Maintenance (20 | 1.1%), and Security & Protection (12 | 0.7%).
Services Occupations by Sex
Within the Services occupations in Lodi, the most male-oriented occupations are Security & Protection (100.0%), Law Enforcement (100.0%), and Cleaning & Maintenance (100.0%), while the most female-oriented occupations are Food Preparation & Serving (73.2%), and Healthcare Support (47.8%).
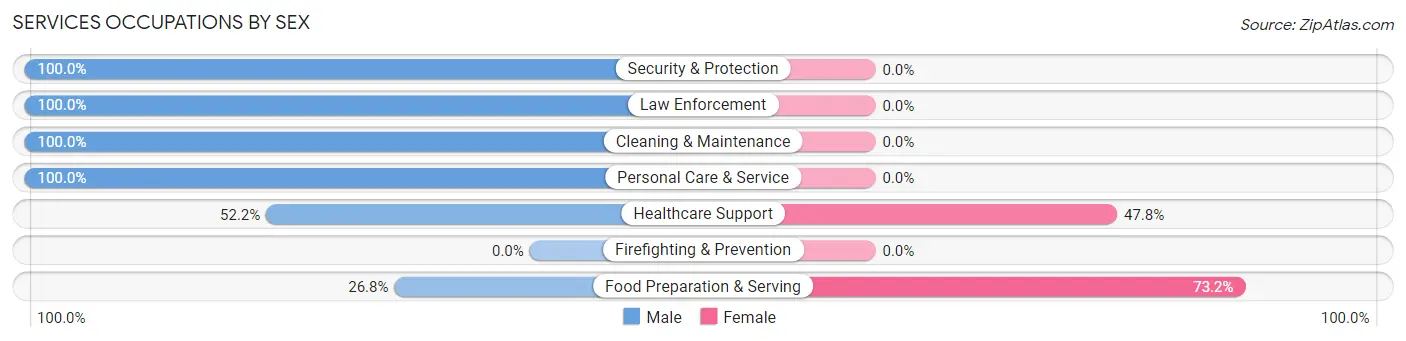
| Occupation | Male | Female |
| Healthcare Support | 72 (52.2%) | 66 (47.8%) |
| Security & Protection | 12 (100.0%) | 0 (0.0%) |
| Firefighting & Prevention | 0 (0.0%) | 0 (0.0%) |
| Law Enforcement | 12 (100.0%) | 0 (0.0%) |
| Food Preparation & Serving | 15 (26.8%) | 41 (73.2%) |
| Cleaning & Maintenance | 20 (100.0%) | 0 (0.0%) |
| Personal Care & Service | 39 (100.0%) | 0 (0.0%) |
| Total (Category) | 158 (59.6%) | 107 (40.4%) |
| Total (Overall) | 948 (52.8%) | 846 (47.2%) |
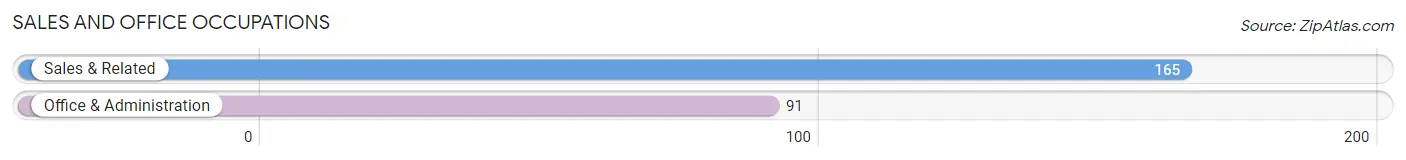
Sales and Office Occupations
The most common Sales and Office occupations in Lodi are Sales & Related (165 | 9.2%), and Office & Administration (91 | 5.1%).
Sales and Office Occupations by Sex
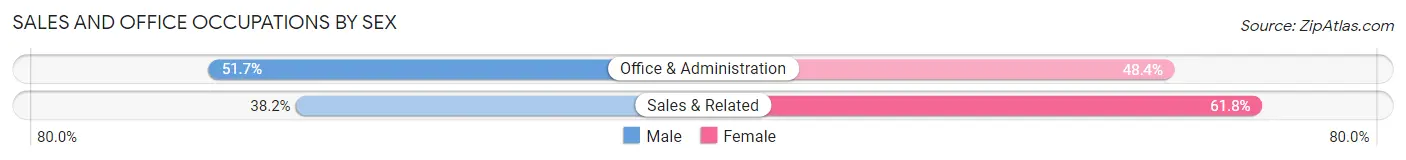
| Occupation | Male | Female |
| Sales & Related | 63 (38.2%) | 102 (61.8%) |
| Office & Administration | 47 (51.6%) | 44 (48.3%) |
| Total (Category) | 110 (43.0%) | 146 (57.0%) |
| Total (Overall) | 948 (52.8%) | 846 (47.2%) |
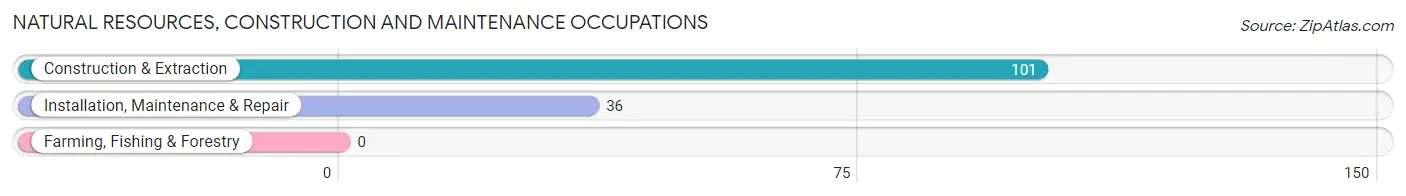
Natural Resources, Construction and Maintenance Occupations
The most common Natural Resources, Construction and Maintenance occupations in Lodi are Construction & Extraction (101 | 5.6%), and Installation, Maintenance & Repair (36 | 2.0%).
Natural Resources, Construction and Maintenance Occupations by Sex
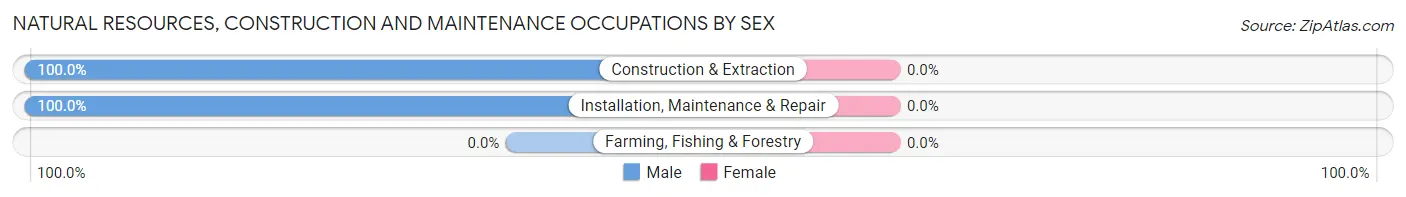
| Occupation | Male | Female |
| Farming, Fishing & Forestry | 0 (0.0%) | 0 (0.0%) |
| Construction & Extraction | 101 (100.0%) | 0 (0.0%) |
| Installation, Maintenance & Repair | 36 (100.0%) | 0 (0.0%) |
| Total (Category) | 137 (100.0%) | 0 (0.0%) |
| Total (Overall) | 948 (52.8%) | 846 (47.2%) |
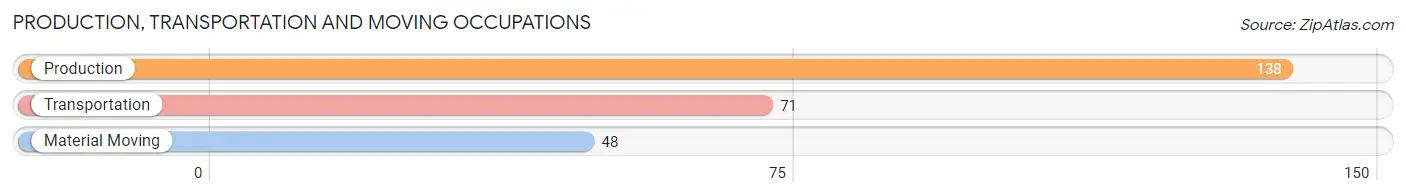
Production, Transportation and Moving Occupations
The most common Production, Transportation and Moving occupations in Lodi are Production (138 | 7.7%), Transportation (71 | 4.0%), and Material Moving (48 | 2.7%).
Production, Transportation and Moving Occupations by Sex
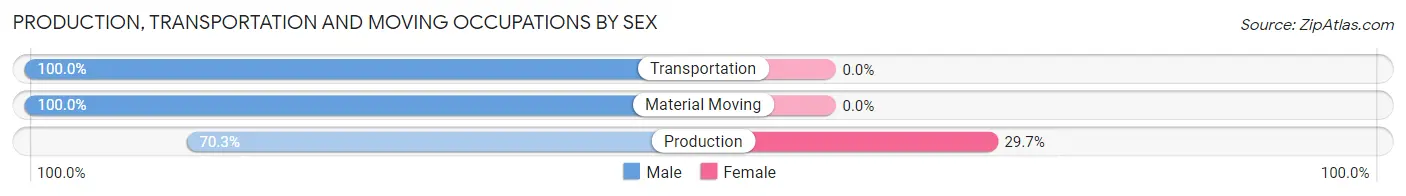
| Occupation | Male | Female |
| Production | 97 (70.3%) | 41 (29.7%) |
| Transportation | 71 (100.0%) | 0 (0.0%) |
| Material Moving | 48 (100.0%) | 0 (0.0%) |
| Total (Category) | 216 (84.1%) | 41 (16.0%) |
| Total (Overall) | 948 (52.8%) | 846 (47.2%) |
Employment Industries by Sex in Lodi
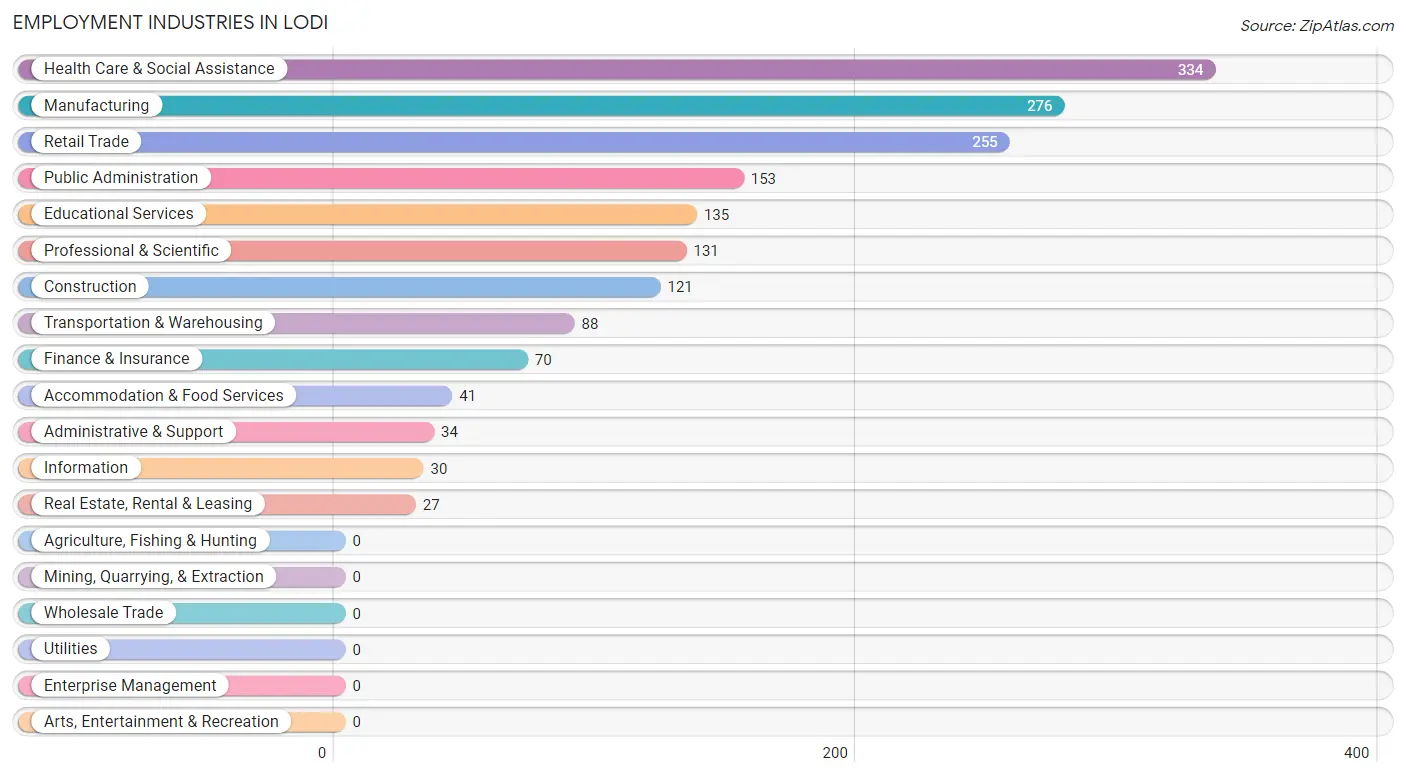
Employment Industries in Lodi
The major employment industries in Lodi include Health Care & Social Assistance (334 | 18.6%), Manufacturing (276 | 15.4%), Retail Trade (255 | 14.2%), Public Administration (153 | 8.5%), and Educational Services (135 | 7.5%).
Employment Industries by Sex in Lodi
The Lodi industries that see more men than women are Construction (100.0%), Transportation & Warehousing (100.0%), and Administrative & Support (100.0%), whereas the industries that tend to have a higher number of women are Information (100.0%), Real Estate, Rental & Leasing (100.0%), and Accommodation & Food Services (100.0%).
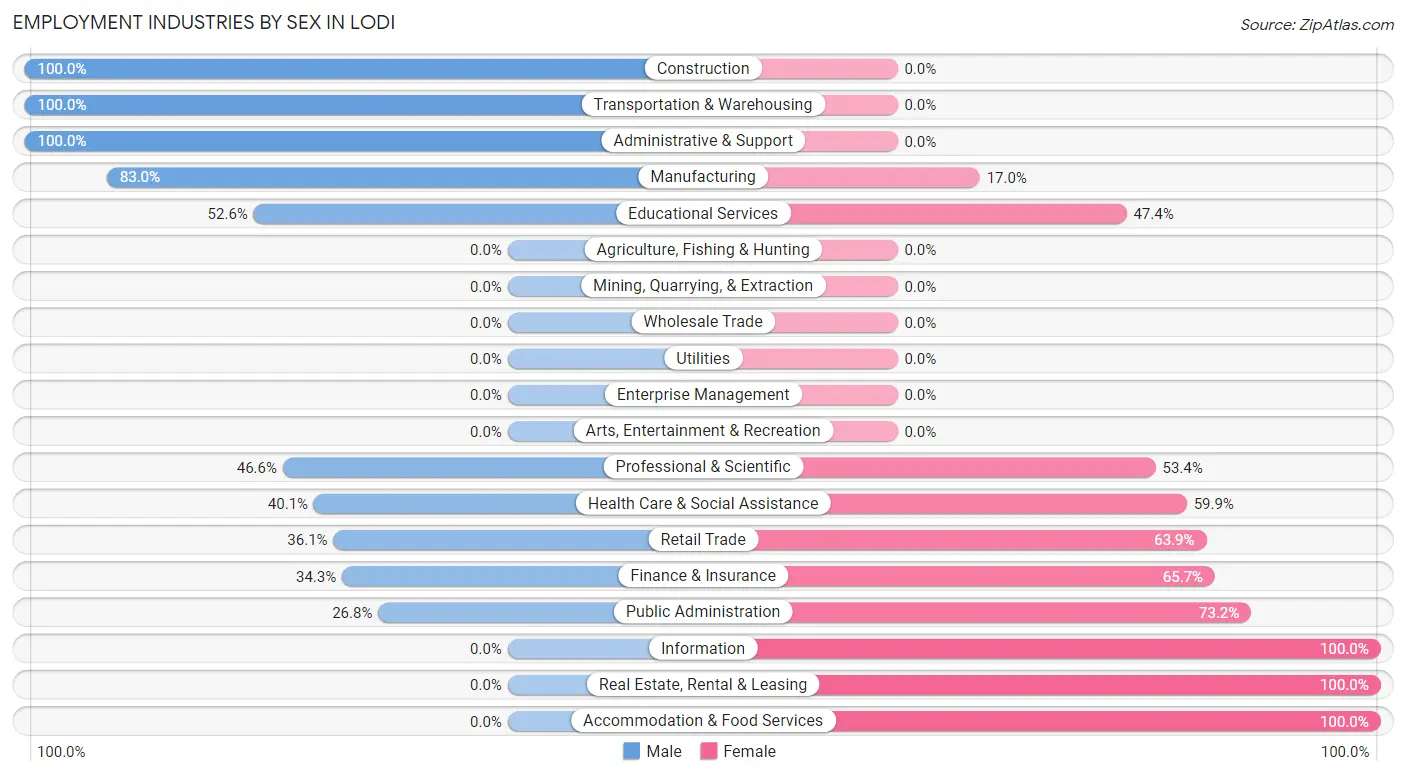
| Industry | Male | Female |
| Agriculture, Fishing & Hunting | 0 (0.0%) | 0 (0.0%) |
| Mining, Quarrying, & Extraction | 0 (0.0%) | 0 (0.0%) |
| Construction | 121 (100.0%) | 0 (0.0%) |
| Manufacturing | 229 (83.0%) | 47 (17.0%) |
| Wholesale Trade | 0 (0.0%) | 0 (0.0%) |
| Retail Trade | 92 (36.1%) | 163 (63.9%) |
| Transportation & Warehousing | 88 (100.0%) | 0 (0.0%) |
| Utilities | 0 (0.0%) | 0 (0.0%) |
| Information | 0 (0.0%) | 30 (100.0%) |
| Finance & Insurance | 24 (34.3%) | 46 (65.7%) |
| Real Estate, Rental & Leasing | 0 (0.0%) | 27 (100.0%) |
| Professional & Scientific | 61 (46.6%) | 70 (53.4%) |
| Enterprise Management | 0 (0.0%) | 0 (0.0%) |
| Administrative & Support | 34 (100.0%) | 0 (0.0%) |
| Educational Services | 71 (52.6%) | 64 (47.4%) |
| Health Care & Social Assistance | 134 (40.1%) | 200 (59.9%) |
| Arts, Entertainment & Recreation | 0 (0.0%) | 0 (0.0%) |
| Accommodation & Food Services | 0 (0.0%) | 41 (100.0%) |
| Public Administration | 41 (26.8%) | 112 (73.2%) |
| Total | 948 (52.8%) | 846 (47.2%) |
Education in Lodi
School Enrollment in Lodi
The most common levels of schooling among the 736 students in Lodi are middle school (236 | 32.1%), high school (173 | 23.5%), and elementary school (140 | 19.0%).
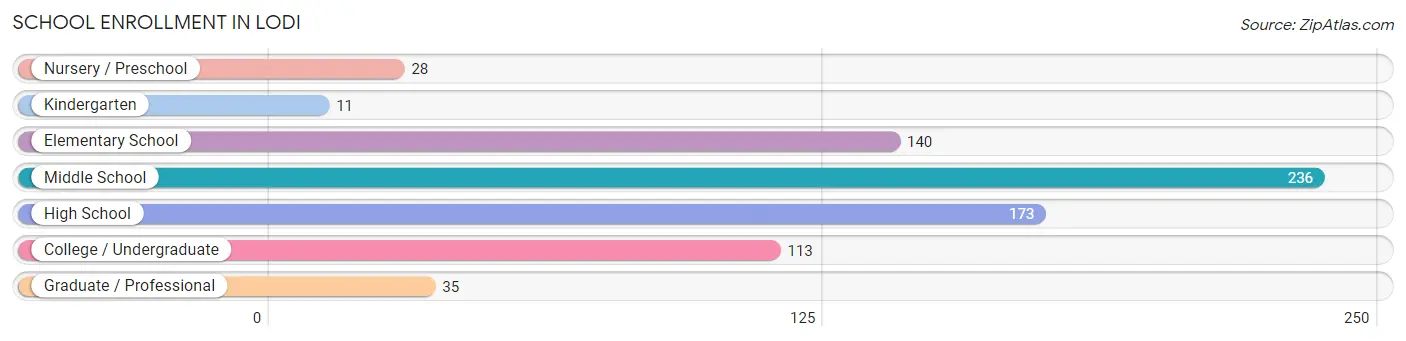
| School Level | # Students | % Students |
| Nursery / Preschool | 28 | 3.8% |
| Kindergarten | 11 | 1.5% |
| Elementary School | 140 | 19.0% |
| Middle School | 236 | 32.1% |
| High School | 173 | 23.5% |
| College / Undergraduate | 113 | 15.3% |
| Graduate / Professional | 35 | 4.8% |
| Total | 736 | 100.0% |
School Enrollment by Age by Funding Source in Lodi
Out of a total of 736 students who are enrolled in schools in Lodi, 37 (5.0%) attend a private institution, while the remaining 699 (95.0%) are enrolled in public schools. The age group of 25 to 34 year olds has the highest likelihood of being enrolled in private schools, with 13 (19.7% in the age bracket) enrolled. Conversely, the age group of 3 to 4 year olds has the lowest likelihood of being enrolled in a private school, with 12 (100.0% in the age bracket) attending a public institution.
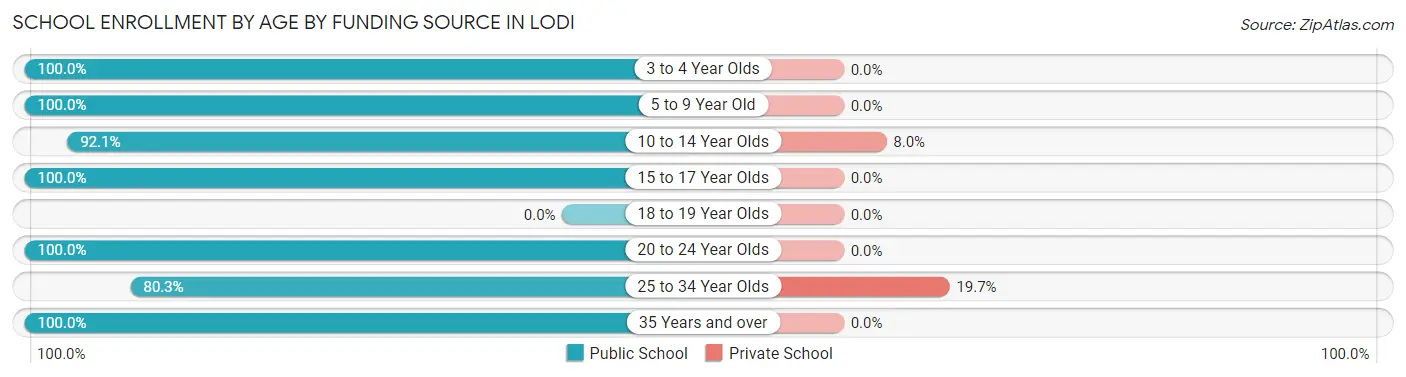
| Age Bracket | Public School | Private School |
| 3 to 4 Year Olds | 12 (100.0%) | 0 (0.0%) |
| 5 to 9 Year Old | 101 (100.0%) | 0 (0.0%) |
| 10 to 14 Year Olds | 278 (92.0%) | 24 (8.0%) |
| 15 to 17 Year Olds | 173 (100.0%) | 0 (0.0%) |
| 18 to 19 Year Olds | 0 (0.0%) | 0 (0.0%) |
| 20 to 24 Year Olds | 44 (100.0%) | 0 (0.0%) |
| 25 to 34 Year Olds | 53 (80.3%) | 13 (19.7%) |
| 35 Years and over | 38 (100.0%) | 0 (0.0%) |
| Total | 699 (95.0%) | 37 (5.0%) |
Educational Attainment by Field of Study in Lodi
Science & technology (220 | 25.9%), business (157 | 18.5%), education (94 | 11.1%), bio, nature & agricultural (90 | 10.6%), and arts & humanities (69 | 8.1%) are the most common fields of study among 850 individuals in Lodi who have obtained a bachelor's degree or higher.
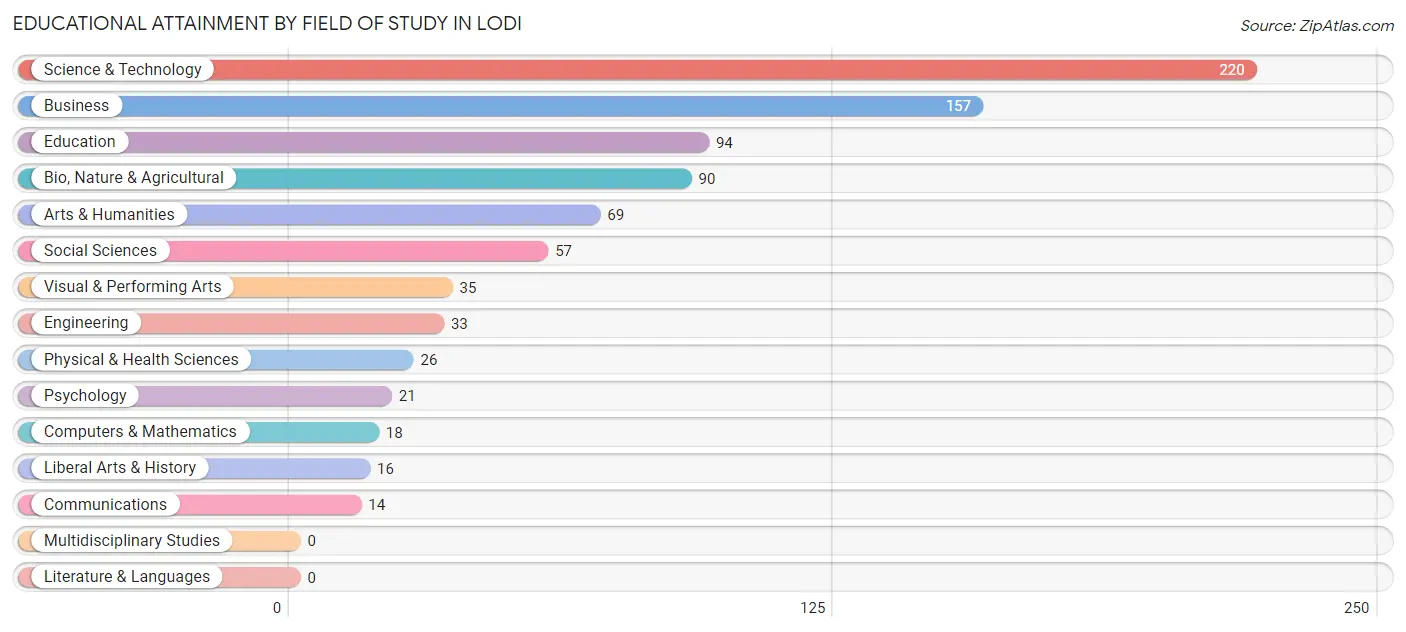
| Field of Study | # Graduates | % Graduates |
| Computers & Mathematics | 18 | 2.1% |
| Bio, Nature & Agricultural | 90 | 10.6% |
| Physical & Health Sciences | 26 | 3.1% |
| Psychology | 21 | 2.5% |
| Social Sciences | 57 | 6.7% |
| Engineering | 33 | 3.9% |
| Multidisciplinary Studies | 0 | 0.0% |
| Science & Technology | 220 | 25.9% |
| Business | 157 | 18.5% |
| Education | 94 | 11.1% |
| Literature & Languages | 0 | 0.0% |
| Liberal Arts & History | 16 | 1.9% |
| Visual & Performing Arts | 35 | 4.1% |
| Communications | 14 | 1.7% |
| Arts & Humanities | 69 | 8.1% |
| Total | 850 | 100.0% |
Transportation & Commute in Lodi
Vehicle Availability by Sex in Lodi
The most prevalent vehicle ownership categories in Lodi are males with 2 vehicles (462, accounting for 48.4%) and females with 2 vehicles (368, making up 58.9%).
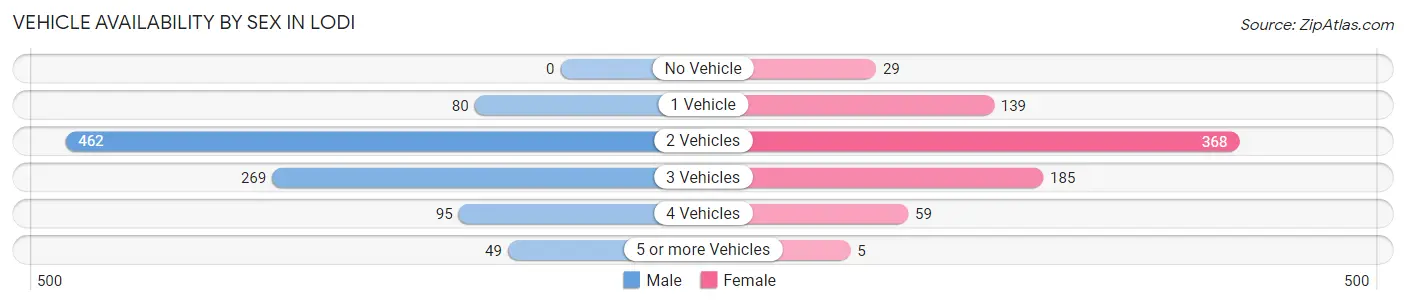
| Vehicles Available | Male | Female |
| No Vehicle | 0 (0.0%) | 29 (3.7%) |
| 1 Vehicle | 80 (8.4%) | 139 (17.7%) |
| 2 Vehicles | 462 (48.4%) | 368 (46.9%) |
| 3 Vehicles | 269 (28.2%) | 185 (23.6%) |
| 4 Vehicles | 95 (10.0%) | 59 (7.5%) |
| 5 or more Vehicles | 49 (5.1%) | 5 (0.6%) |
| Total | 955 (100.0%) | 785 (100.0%) |
Commute Time in Lodi
The most frequently occuring commute durations in Lodi are 20 to 24 minutes (294 commuters, 18.4%), 5 to 9 minutes (194 commuters, 12.1%), and 10 to 14 minutes (184 commuters, 11.5%).
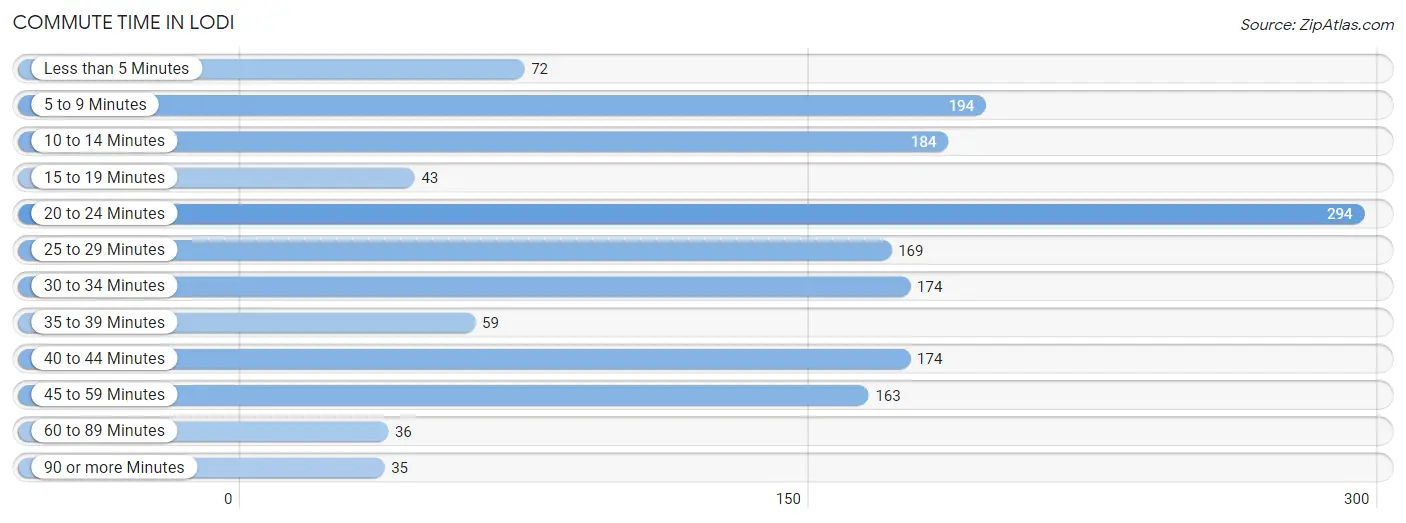
| Commute Time | # Commuters | % Commuters |
| Less than 5 Minutes | 72 | 4.5% |
| 5 to 9 Minutes | 194 | 12.1% |
| 10 to 14 Minutes | 184 | 11.5% |
| 15 to 19 Minutes | 43 | 2.7% |
| 20 to 24 Minutes | 294 | 18.4% |
| 25 to 29 Minutes | 169 | 10.6% |
| 30 to 34 Minutes | 174 | 10.9% |
| 35 to 39 Minutes | 59 | 3.7% |
| 40 to 44 Minutes | 174 | 10.9% |
| 45 to 59 Minutes | 163 | 10.2% |
| 60 to 89 Minutes | 36 | 2.2% |
| 90 or more Minutes | 35 | 2.2% |
Commute Time by Sex in Lodi
The most common commute times in Lodi are 20 to 24 minutes (233 commuters, 25.6%) for males and 45 to 59 minutes (118 commuters, 17.2%) for females.
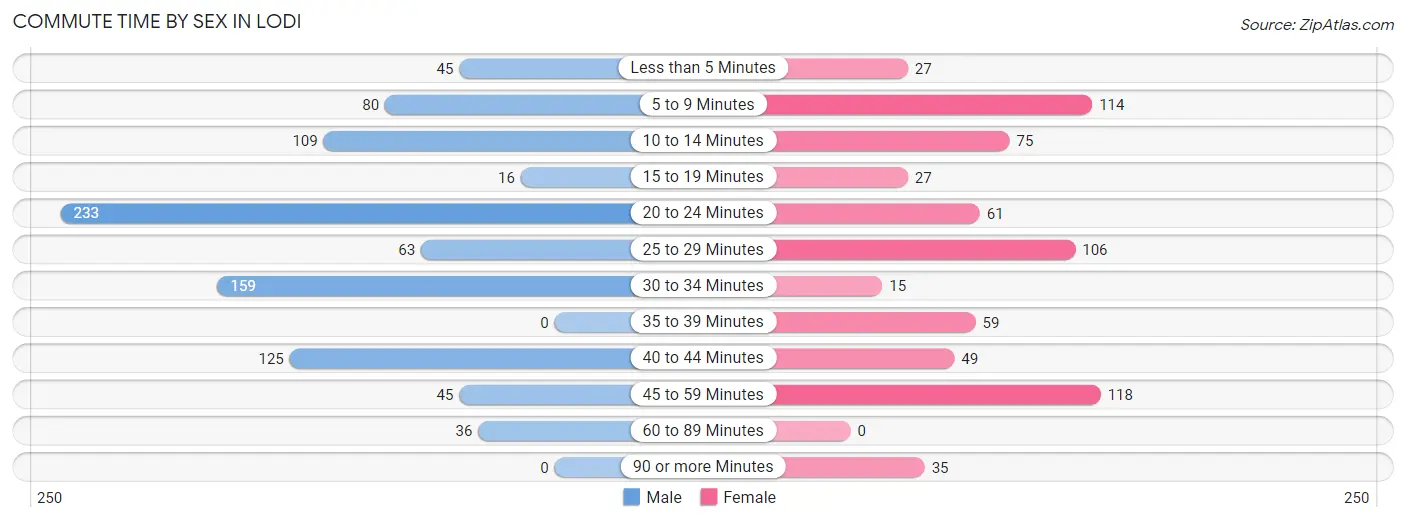
| Commute Time | Male | Female |
| Less than 5 Minutes | 45 (4.9%) | 27 (3.9%) |
| 5 to 9 Minutes | 80 (8.8%) | 114 (16.6%) |
| 10 to 14 Minutes | 109 (12.0%) | 75 (10.9%) |
| 15 to 19 Minutes | 16 (1.8%) | 27 (3.9%) |
| 20 to 24 Minutes | 233 (25.6%) | 61 (8.9%) |
| 25 to 29 Minutes | 63 (6.9%) | 106 (15.4%) |
| 30 to 34 Minutes | 159 (17.4%) | 15 (2.2%) |
| 35 to 39 Minutes | 0 (0.0%) | 59 (8.6%) |
| 40 to 44 Minutes | 125 (13.7%) | 49 (7.1%) |
| 45 to 59 Minutes | 45 (4.9%) | 118 (17.2%) |
| 60 to 89 Minutes | 36 (4.0%) | 0 (0.0%) |
| 90 or more Minutes | 0 (0.0%) | 35 (5.1%) |
Time of Departure to Work by Sex in Lodi
The most frequent times of departure to work in Lodi are 8:00 AM to 8:29 AM (266, 29.2%) for males and 8:00 AM to 8:29 AM (162, 23.6%) for females.
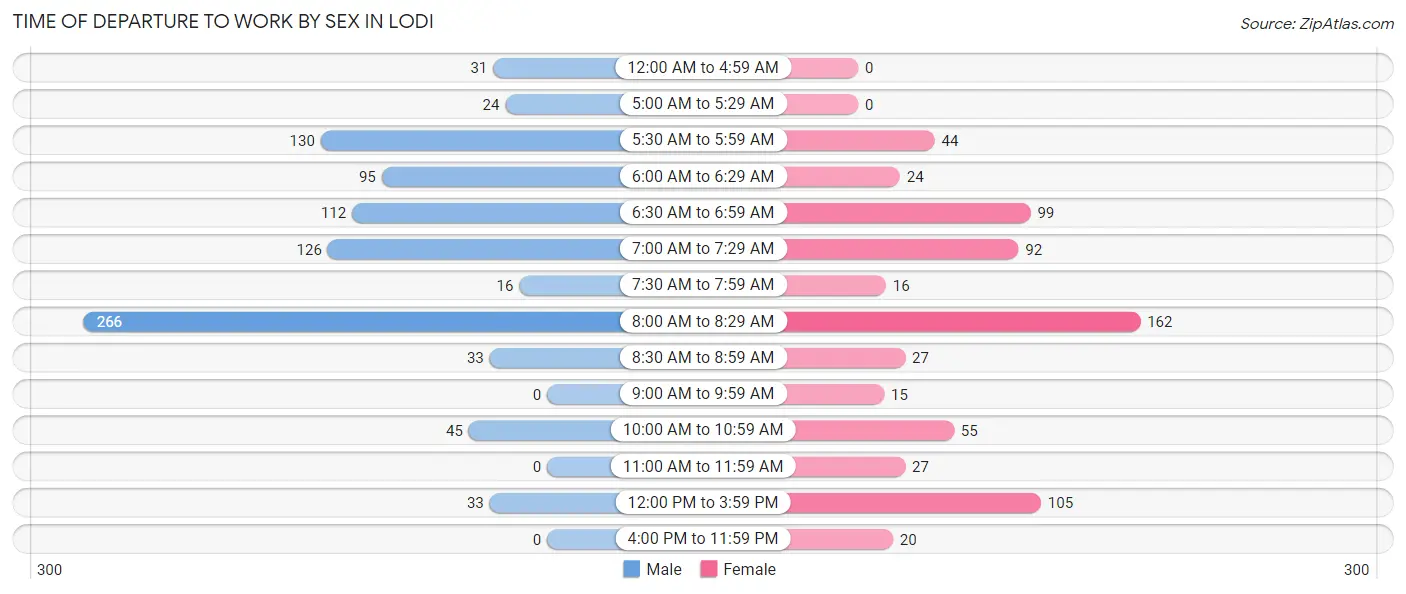
| Time of Departure | Male | Female |
| 12:00 AM to 4:59 AM | 31 (3.4%) | 0 (0.0%) |
| 5:00 AM to 5:29 AM | 24 (2.6%) | 0 (0.0%) |
| 5:30 AM to 5:59 AM | 130 (14.3%) | 44 (6.4%) |
| 6:00 AM to 6:29 AM | 95 (10.4%) | 24 (3.5%) |
| 6:30 AM to 6:59 AM | 112 (12.3%) | 99 (14.4%) |
| 7:00 AM to 7:29 AM | 126 (13.8%) | 92 (13.4%) |
| 7:30 AM to 7:59 AM | 16 (1.8%) | 16 (2.3%) |
| 8:00 AM to 8:29 AM | 266 (29.2%) | 162 (23.6%) |
| 8:30 AM to 8:59 AM | 33 (3.6%) | 27 (3.9%) |
| 9:00 AM to 9:59 AM | 0 (0.0%) | 15 (2.2%) |
| 10:00 AM to 10:59 AM | 45 (4.9%) | 55 (8.0%) |
| 11:00 AM to 11:59 AM | 0 (0.0%) | 27 (3.9%) |
| 12:00 PM to 3:59 PM | 33 (3.6%) | 105 (15.3%) |
| 4:00 PM to 11:59 PM | 0 (0.0%) | 20 (2.9%) |
| Total | 911 (100.0%) | 686 (100.0%) |
Housing Occupancy in Lodi
Occupancy by Ownership in Lodi
Of the total 1,441 dwellings in Lodi, owner-occupied units account for 1,029 (71.4%), while renter-occupied units make up 412 (28.6%).
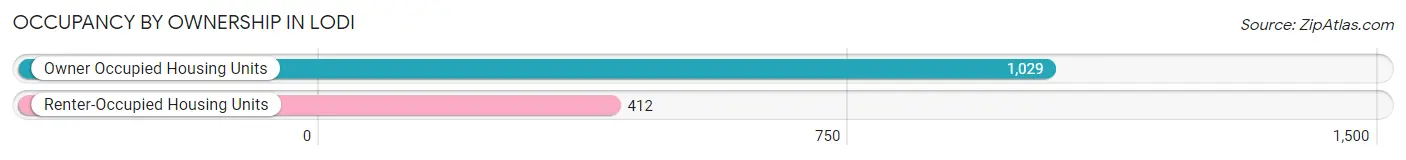
| Occupancy | # Housing Units | % Housing Units |
| Owner Occupied Housing Units | 1,029 | 71.4% |
| Renter-Occupied Housing Units | 412 | 28.6% |
| Total Occupied Housing Units | 1,441 | 100.0% |
Occupancy by Household Size in Lodi
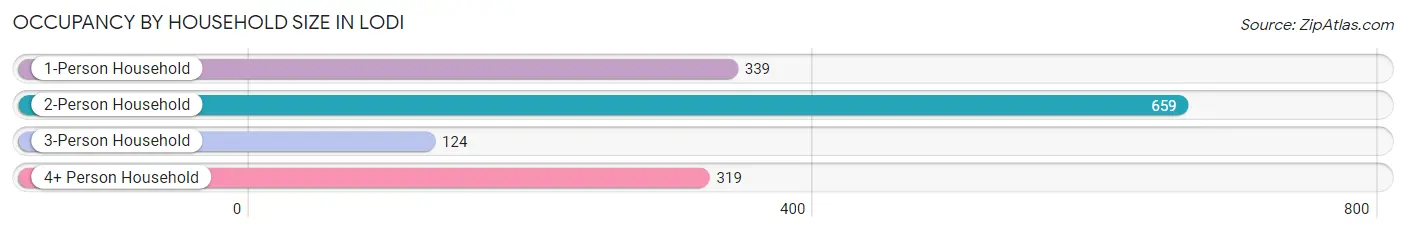
| Household Size | # Housing Units | % Housing Units |
| 1-Person Household | 339 | 23.5% |
| 2-Person Household | 659 | 45.7% |
| 3-Person Household | 124 | 8.6% |
| 4+ Person Household | 319 | 22.1% |
| Total Housing Units | 1,441 | 100.0% |
Occupancy by Ownership by Household Size in Lodi
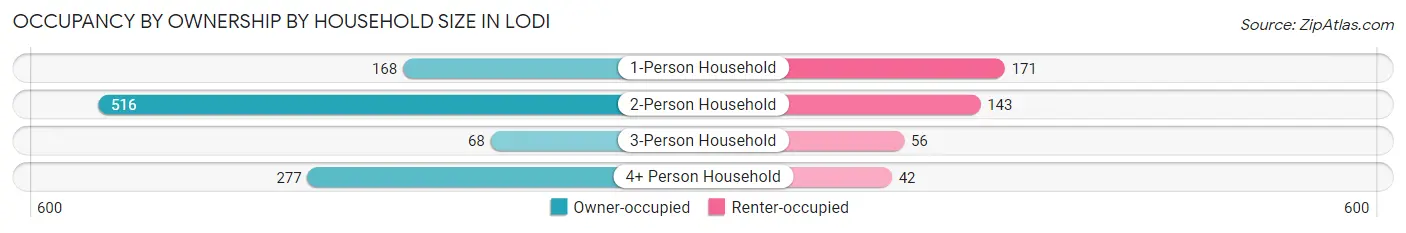
| Household Size | Owner-occupied | Renter-occupied |
| 1-Person Household | 168 (49.6%) | 171 (50.4%) |
| 2-Person Household | 516 (78.3%) | 143 (21.7%) |
| 3-Person Household | 68 (54.8%) | 56 (45.2%) |
| 4+ Person Household | 277 (86.8%) | 42 (13.2%) |
| Total Housing Units | 1,029 (71.4%) | 412 (28.6%) |
Occupancy by Educational Attainment in Lodi
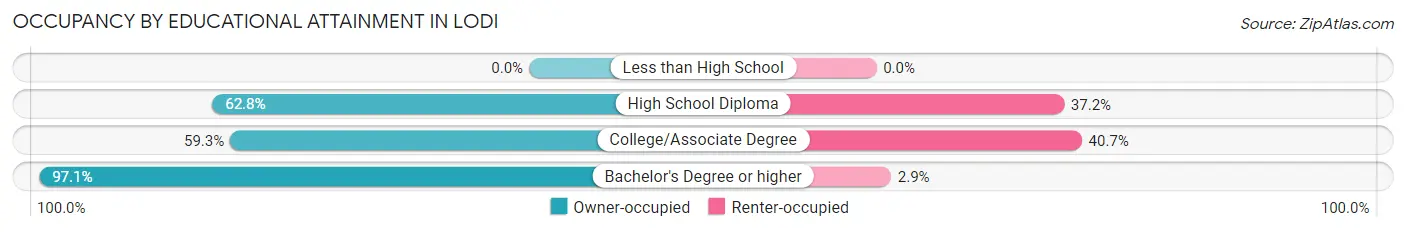
| Household Size | Owner-occupied | Renter-occupied |
| Less than High School | 0 (0.0%) | 0 (0.0%) |
| High School Diploma | 113 (62.8%) | 67 (37.2%) |
| College/Associate Degree | 483 (59.3%) | 332 (40.7%) |
| Bachelor's Degree or higher | 433 (97.1%) | 13 (2.9%) |
Occupancy by Age of Householder in Lodi
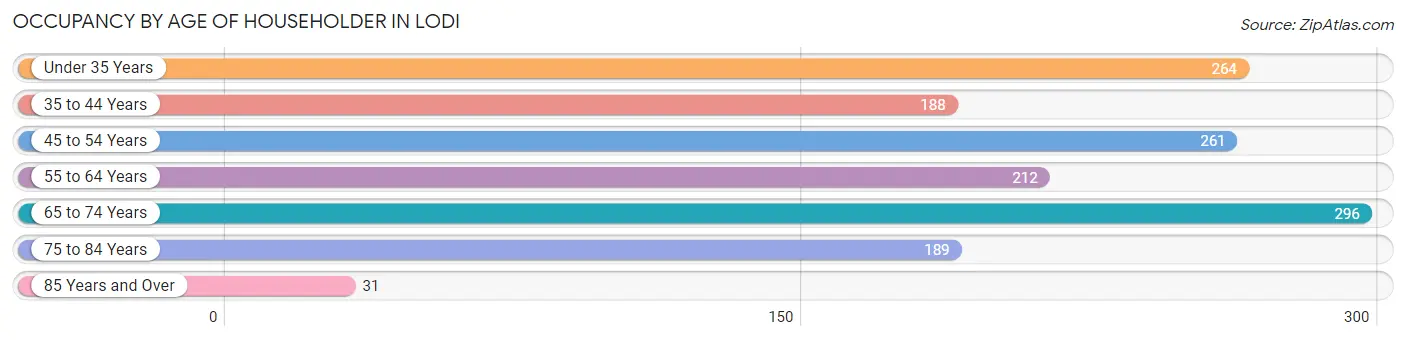
| Age Bracket | # Households | % Households |
| Under 35 Years | 264 | 18.3% |
| 35 to 44 Years | 188 | 13.1% |
| 45 to 54 Years | 261 | 18.1% |
| 55 to 64 Years | 212 | 14.7% |
| 65 to 74 Years | 296 | 20.5% |
| 75 to 84 Years | 189 | 13.1% |
| 85 Years and Over | 31 | 2.1% |
| Total | 1,441 | 100.0% |
Housing Finances in Lodi
Median Income by Occupancy in Lodi
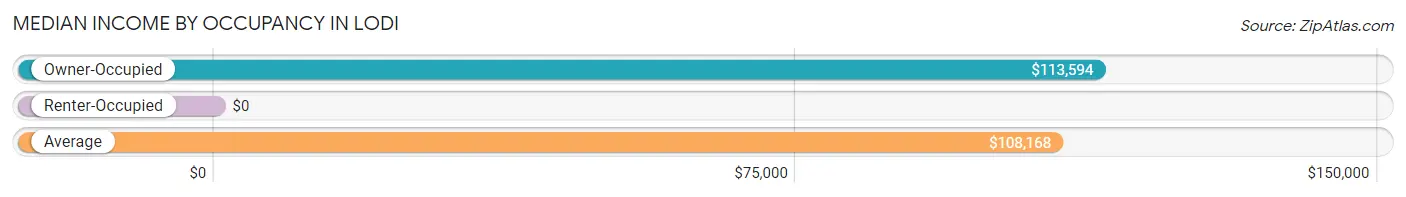
| Occupancy Type | # Households | Median Income |
| Owner-Occupied | 1,029 (71.4%) | $113,594 |
| Renter-Occupied | 412 (28.6%) | $0 |
| Average | 1,441 (100.0%) | $108,168 |
Occupancy by Householder Income Bracket in Lodi
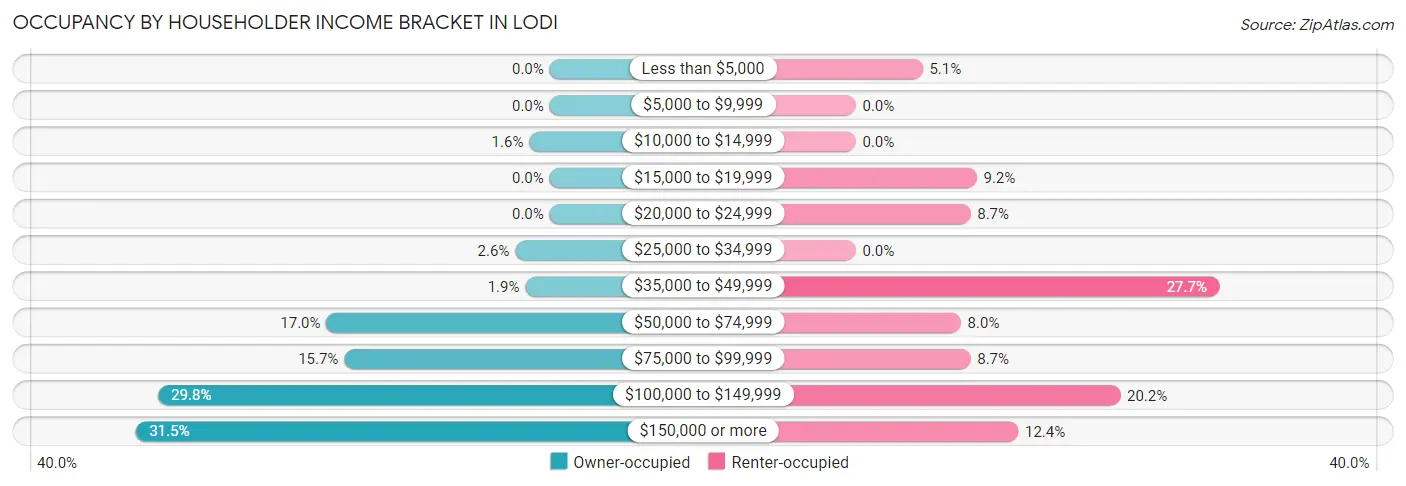
| Income Bracket | Owner-occupied | Renter-occupied |
| Less than $5,000 | 0 (0.0%) | 21 (5.1%) |
| $5,000 to $9,999 | 0 (0.0%) | 0 (0.0%) |
| $10,000 to $14,999 | 16 (1.5%) | 0 (0.0%) |
| $15,000 to $19,999 | 0 (0.0%) | 38 (9.2%) |
| $20,000 to $24,999 | 0 (0.0%) | 36 (8.7%) |
| $25,000 to $34,999 | 27 (2.6%) | 0 (0.0%) |
| $35,000 to $49,999 | 19 (1.8%) | 114 (27.7%) |
| $50,000 to $74,999 | 175 (17.0%) | 33 (8.0%) |
| $75,000 to $99,999 | 161 (15.7%) | 36 (8.7%) |
| $100,000 to $149,999 | 307 (29.8%) | 83 (20.2%) |
| $150,000 or more | 324 (31.5%) | 51 (12.4%) |
| Total | 1,029 (100.0%) | 412 (100.0%) |
Monthly Housing Cost Tiers in Lodi
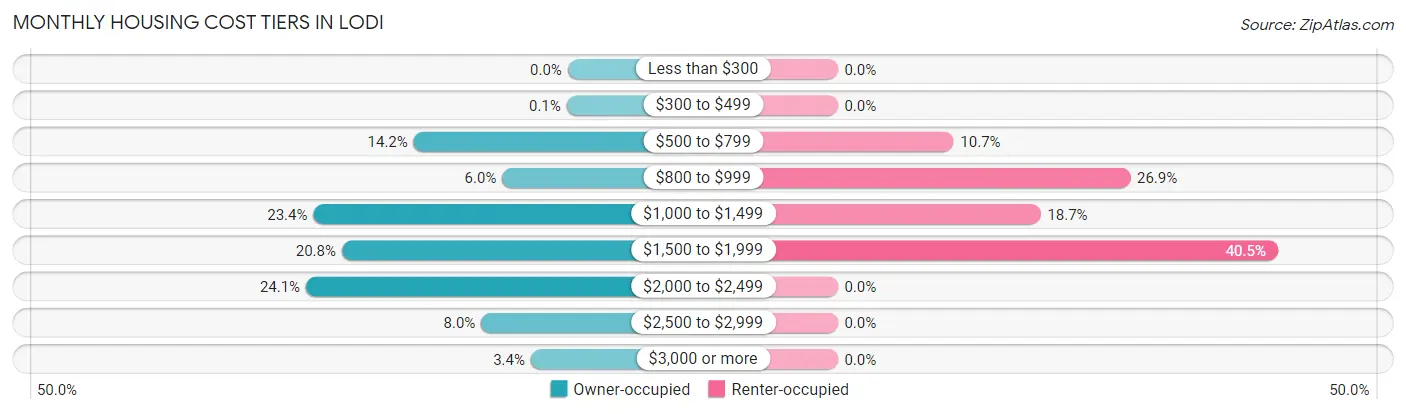
| Monthly Cost | Owner-occupied | Renter-occupied |
| Less than $300 | 0 (0.0%) | 0 (0.0%) |
| $300 to $499 | 1 (0.1%) | 0 (0.0%) |
| $500 to $799 | 146 (14.2%) | 44 (10.7%) |
| $800 to $999 | 62 (6.0%) | 111 (26.9%) |
| $1,000 to $1,499 | 241 (23.4%) | 77 (18.7%) |
| $1,500 to $1,999 | 214 (20.8%) | 167 (40.5%) |
| $2,000 to $2,499 | 248 (24.1%) | 0 (0.0%) |
| $2,500 to $2,999 | 82 (8.0%) | 0 (0.0%) |
| $3,000 or more | 35 (3.4%) | 0 (0.0%) |
| Total | 1,029 (100.0%) | 412 (100.0%) |
Physical Housing Characteristics in Lodi
Housing Structures in Lodi
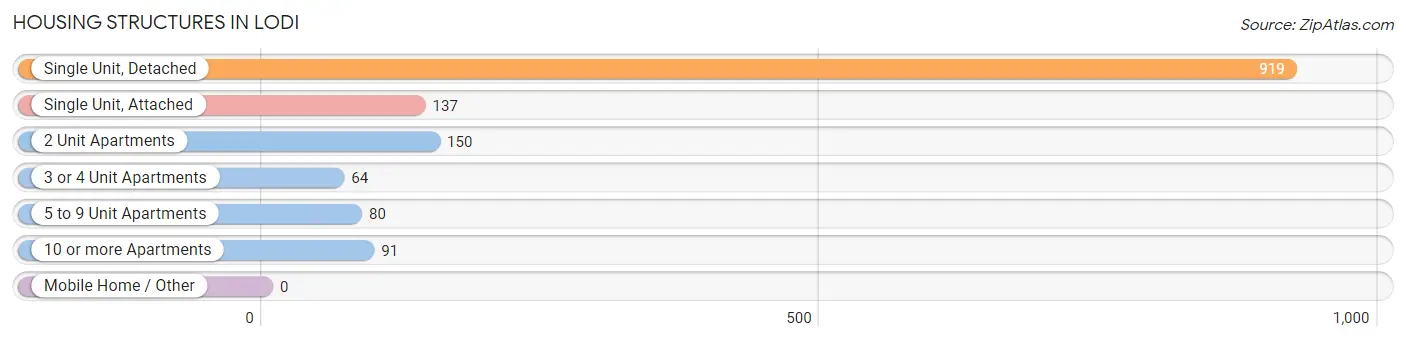
| Structure Type | # Housing Units | % Housing Units |
| Single Unit, Detached | 919 | 63.8% |
| Single Unit, Attached | 137 | 9.5% |
| 2 Unit Apartments | 150 | 10.4% |
| 3 or 4 Unit Apartments | 64 | 4.4% |
| 5 to 9 Unit Apartments | 80 | 5.6% |
| 10 or more Apartments | 91 | 6.3% |
| Mobile Home / Other | 0 | 0.0% |
| Total | 1,441 | 100.0% |
Housing Structures by Occupancy in Lodi
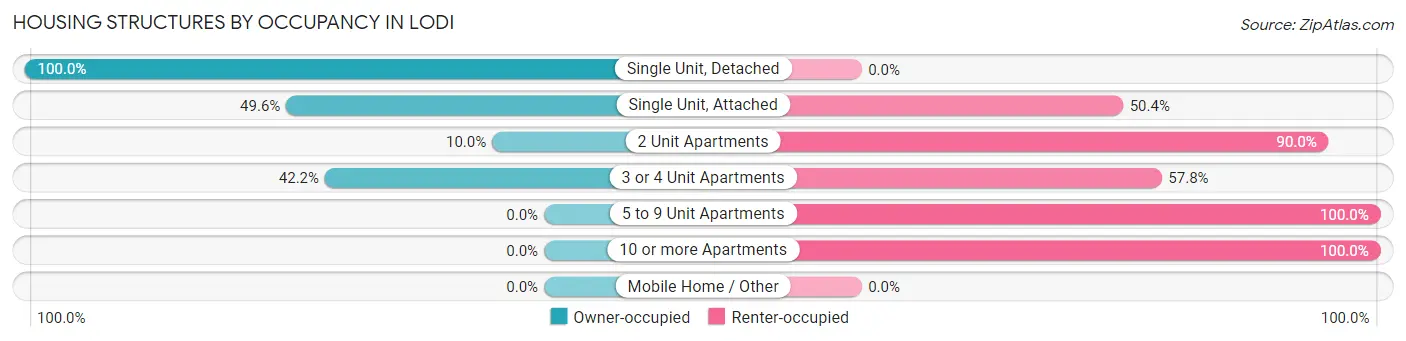
| Structure Type | Owner-occupied | Renter-occupied |
| Single Unit, Detached | 919 (100.0%) | 0 (0.0%) |
| Single Unit, Attached | 68 (49.6%) | 69 (50.4%) |
| 2 Unit Apartments | 15 (10.0%) | 135 (90.0%) |
| 3 or 4 Unit Apartments | 27 (42.2%) | 37 (57.8%) |
| 5 to 9 Unit Apartments | 0 (0.0%) | 80 (100.0%) |
| 10 or more Apartments | 0 (0.0%) | 91 (100.0%) |
| Mobile Home / Other | 0 (0.0%) | 0 (0.0%) |
| Total | 1,029 (71.4%) | 412 (28.6%) |
Housing Structures by Number of Rooms in Lodi
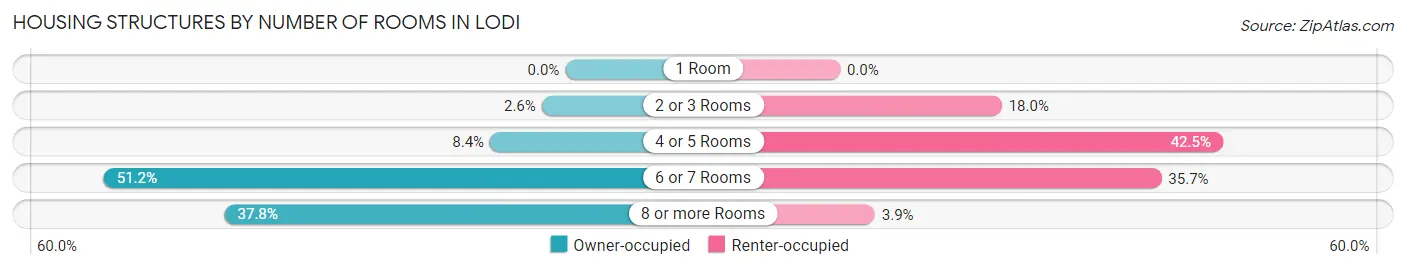
| Number of Rooms | Owner-occupied | Renter-occupied |
| 1 Room | 0 (0.0%) | 0 (0.0%) |
| 2 or 3 Rooms | 27 (2.6%) | 74 (18.0%) |
| 4 or 5 Rooms | 86 (8.4%) | 175 (42.5%) |
| 6 or 7 Rooms | 527 (51.2%) | 147 (35.7%) |
| 8 or more Rooms | 389 (37.8%) | 16 (3.9%) |
| Total | 1,029 (100.0%) | 412 (100.0%) |
Housing Structure by Heating Type in Lodi
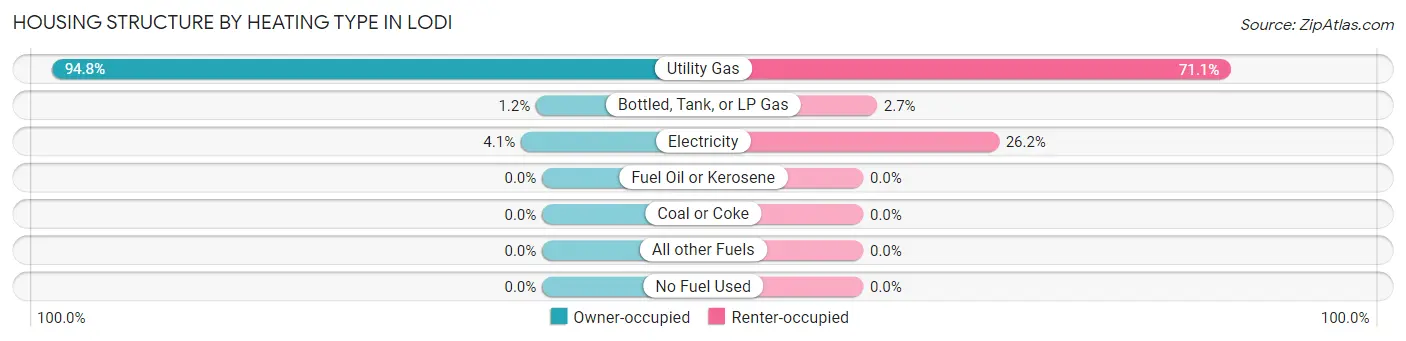
| Heating Type | Owner-occupied | Renter-occupied |
| Utility Gas | 975 (94.8%) | 293 (71.1%) |
| Bottled, Tank, or LP Gas | 12 (1.2%) | 11 (2.7%) |
| Electricity | 42 (4.1%) | 108 (26.2%) |
| Fuel Oil or Kerosene | 0 (0.0%) | 0 (0.0%) |
| Coal or Coke | 0 (0.0%) | 0 (0.0%) |
| All other Fuels | 0 (0.0%) | 0 (0.0%) |
| No Fuel Used | 0 (0.0%) | 0 (0.0%) |
| Total | 1,029 (100.0%) | 412 (100.0%) |
Household Vehicle Usage in Lodi
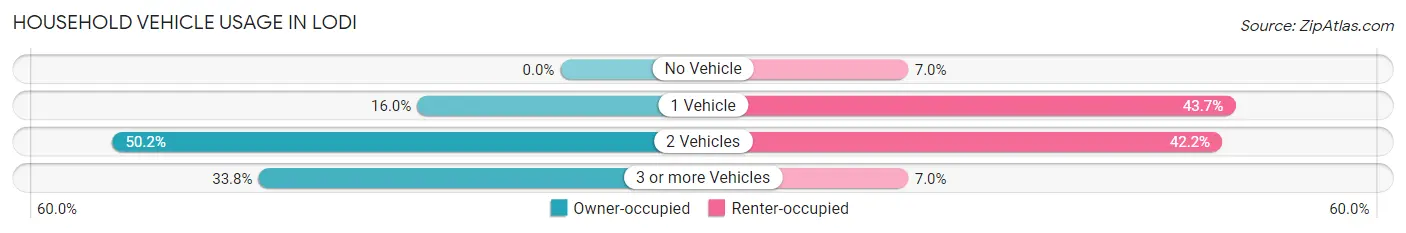
| Vehicles per Household | Owner-occupied | Renter-occupied |
| No Vehicle | 0 (0.0%) | 29 (7.0%) |
| 1 Vehicle | 165 (16.0%) | 180 (43.7%) |
| 2 Vehicles | 516 (50.1%) | 174 (42.2%) |
| 3 or more Vehicles | 348 (33.8%) | 29 (7.0%) |
| Total | 1,029 (100.0%) | 412 (100.0%) |
Real Estate & Mortgages in Lodi
Real Estate and Mortgage Overview in Lodi
| Characteristic | Without Mortgage | With Mortgage |
| Housing Units | 209 | 820 |
| Median Property Value | $283,200 | $281,300 |
| Median Household Income | $76,985 | $281 |
| Monthly Housing Costs | $783 | $35 |
| Real Estate Taxes | $6,022 | $7 |
Property Value by Mortgage Status in Lodi
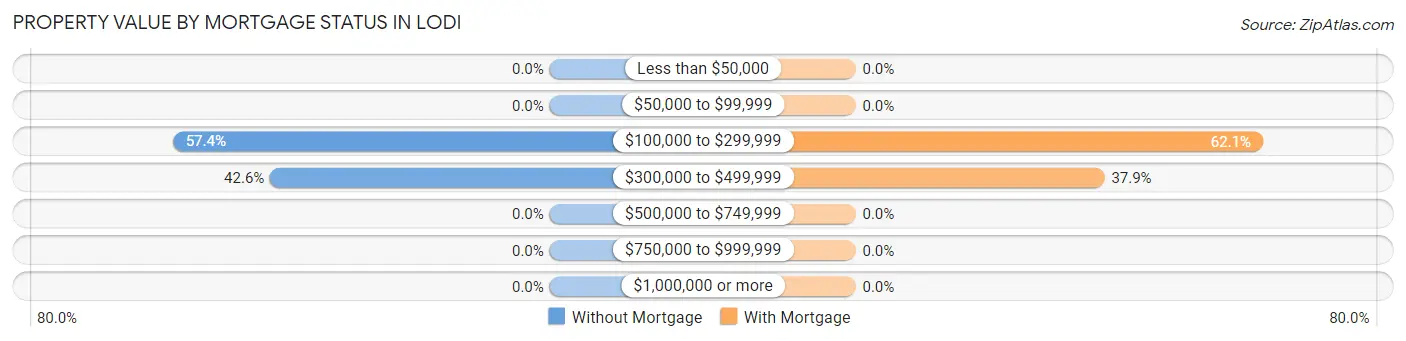
| Property Value | Without Mortgage | With Mortgage |
| Less than $50,000 | 0 (0.0%) | 0 (0.0%) |
| $50,000 to $99,999 | 0 (0.0%) | 0 (0.0%) |
| $100,000 to $299,999 | 120 (57.4%) | 509 (62.1%) |
| $300,000 to $499,999 | 89 (42.6%) | 311 (37.9%) |
| $500,000 to $749,999 | 0 (0.0%) | 0 (0.0%) |
| $750,000 to $999,999 | 0 (0.0%) | 0 (0.0%) |
| $1,000,000 or more | 0 (0.0%) | 0 (0.0%) |
| Total | 209 (100.0%) | 820 (100.0%) |
Household Income by Mortgage Status in Lodi
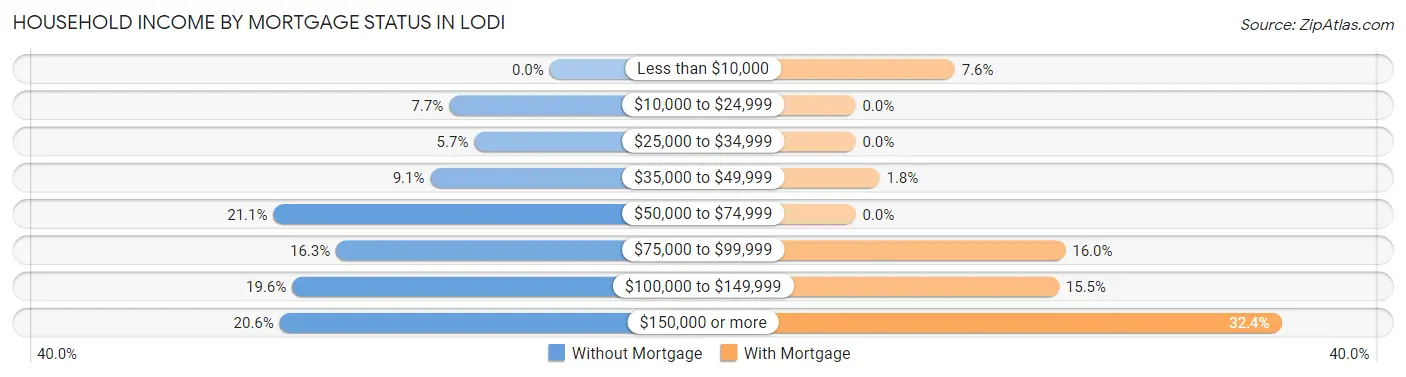
| Household Income | Without Mortgage | With Mortgage |
| Less than $10,000 | 0 (0.0%) | 62 (7.6%) |
| $10,000 to $24,999 | 16 (7.7%) | 0 (0.0%) |
| $25,000 to $34,999 | 12 (5.7%) | 0 (0.0%) |
| $35,000 to $49,999 | 19 (9.1%) | 15 (1.8%) |
| $50,000 to $74,999 | 44 (21.0%) | 0 (0.0%) |
| $75,000 to $99,999 | 34 (16.3%) | 131 (16.0%) |
| $100,000 to $149,999 | 41 (19.6%) | 127 (15.5%) |
| $150,000 or more | 43 (20.6%) | 266 (32.4%) |
| Total | 209 (100.0%) | 820 (100.0%) |
Property Value to Household Income Ratio in Lodi
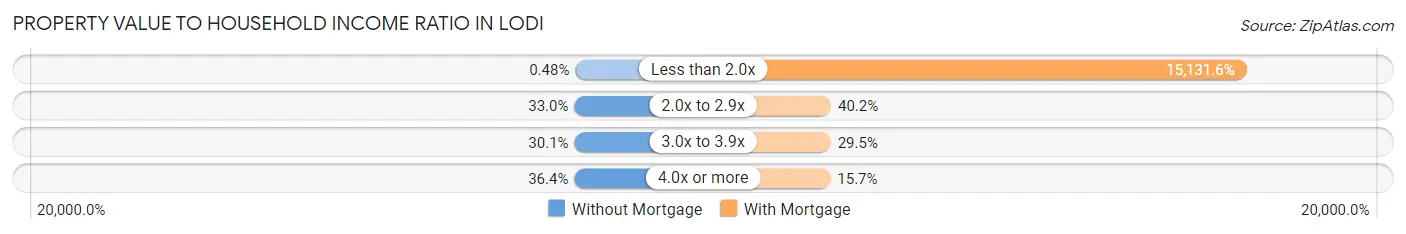
| Value-to-Income Ratio | Without Mortgage | With Mortgage |
| Less than 2.0x | 1 (0.5%) | 124,079 (15,131.6%) |
| 2.0x to 2.9x | 69 (33.0%) | 330 (40.2%) |
| 3.0x to 3.9x | 63 (30.1%) | 242 (29.5%) |
| 4.0x or more | 76 (36.4%) | 129 (15.7%) |
| Total | 209 (100.0%) | 820 (100.0%) |
Real Estate Taxes by Mortgage Status in Lodi
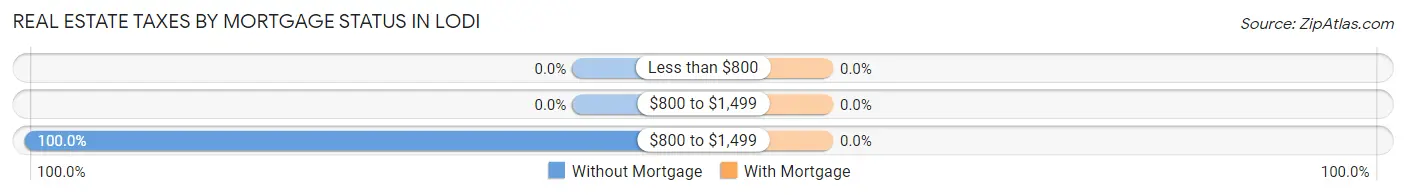
| Property Taxes | Without Mortgage | With Mortgage |
| Less than $800 | 0 (0.0%) | 0 (0.0%) |
| $800 to $1,499 | 0 (0.0%) | 0 (0.0%) |
| $800 to $1,499 | 209 (100.0%) | 0 (0.0%) |
| Total | 209 (100.0%) | 820 (100.0%) |
Health & Disability in Lodi
Health Insurance Coverage by Age in Lodi
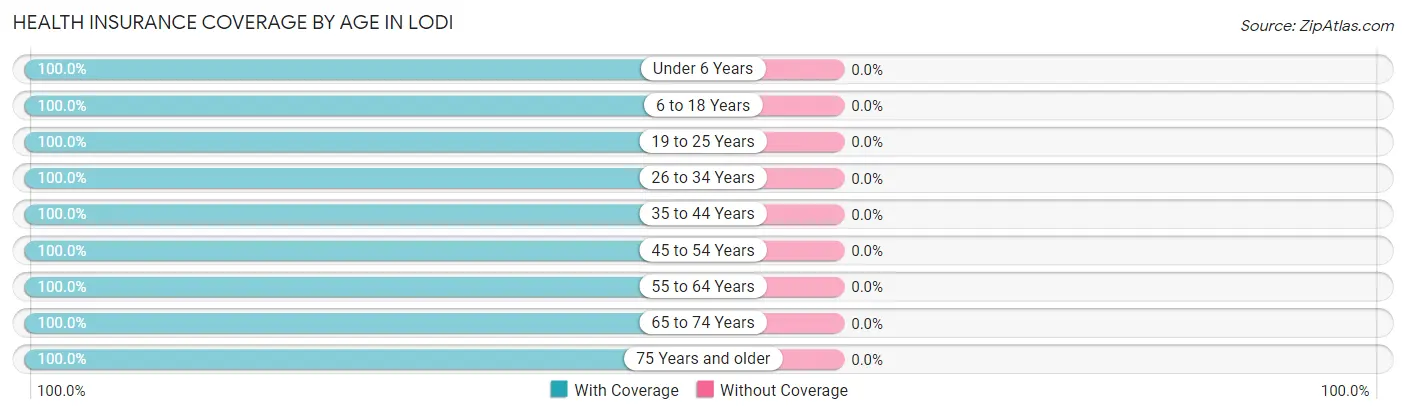
| Age Bracket | With Coverage | Without Coverage |
| Under 6 Years | 214 (100.0%) | 0 (0.0%) |
| 6 to 18 Years | 549 (100.0%) | 0 (0.0%) |
| 19 to 25 Years | 197 (100.0%) | 0 (0.0%) |
| 26 to 34 Years | 416 (100.0%) | 0 (0.0%) |
| 35 to 44 Years | 352 (100.0%) | 0 (0.0%) |
| 45 to 54 Years | 387 (100.0%) | 0 (0.0%) |
| 55 to 64 Years | 381 (100.0%) | 0 (0.0%) |
| 65 to 74 Years | 431 (100.0%) | 0 (0.0%) |
| 75 Years and older | 222 (100.0%) | 0 (0.0%) |
| Total | 3,149 (100.0%) | 0 (0.0%) |
Health Insurance Coverage by Citizenship Status in Lodi
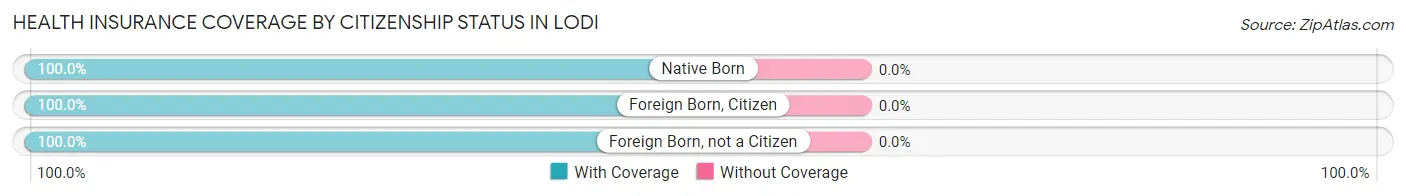
| Citizenship Status | With Coverage | Without Coverage |
| Native Born | 214 (100.0%) | 0 (0.0%) |
| Foreign Born, Citizen | 549 (100.0%) | 0 (0.0%) |
| Foreign Born, not a Citizen | 197 (100.0%) | 0 (0.0%) |
Health Insurance Coverage by Household Income in Lodi
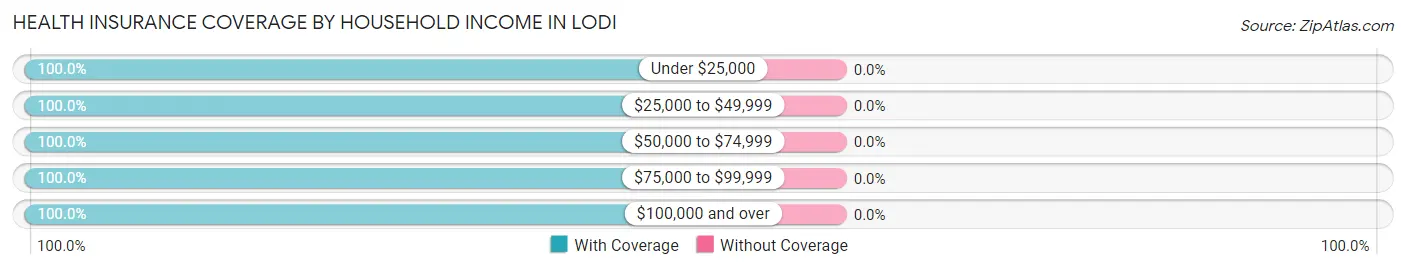
| Household Income | With Coverage | Without Coverage |
| Under $25,000 | 130 (100.0%) | 0 (0.0%) |
| $25,000 to $49,999 | 378 (100.0%) | 0 (0.0%) |
| $50,000 to $74,999 | 271 (100.0%) | 0 (0.0%) |
| $75,000 to $99,999 | 463 (100.0%) | 0 (0.0%) |
| $100,000 and over | 1,900 (100.0%) | 0 (0.0%) |
Public vs Private Health Insurance Coverage by Age in Lodi
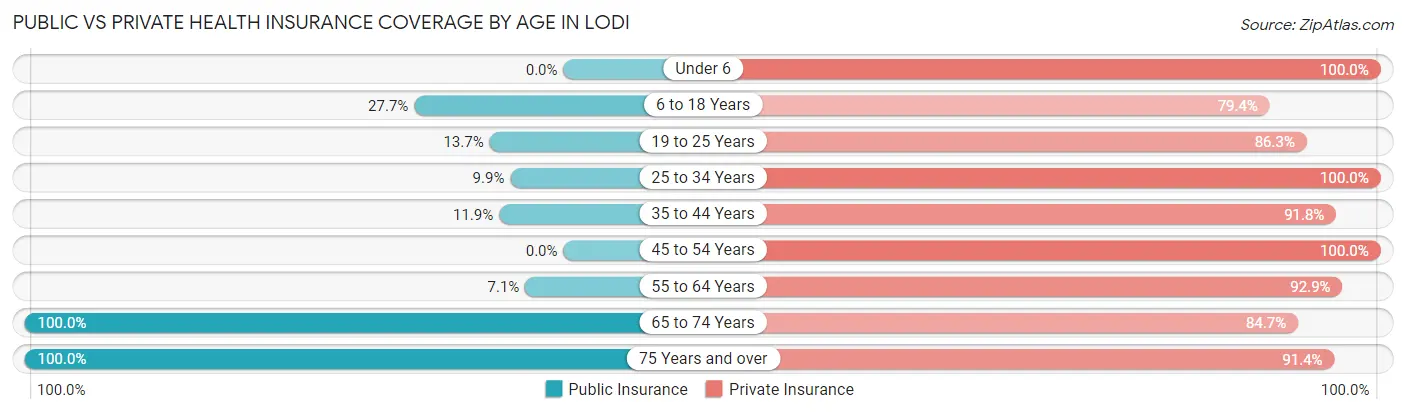
| Age Bracket | Public Insurance | Private Insurance |
| Under 6 | 0 (0.0%) | 214 (100.0%) |
| 6 to 18 Years | 152 (27.7%) | 436 (79.4%) |
| 19 to 25 Years | 27 (13.7%) | 170 (86.3%) |
| 25 to 34 Years | 41 (9.9%) | 416 (100.0%) |
| 35 to 44 Years | 42 (11.9%) | 323 (91.8%) |
| 45 to 54 Years | 0 (0.0%) | 387 (100.0%) |
| 55 to 64 Years | 27 (7.1%) | 354 (92.9%) |
| 65 to 74 Years | 431 (100.0%) | 365 (84.7%) |
| 75 Years and over | 222 (100.0%) | 203 (91.4%) |
| Total | 942 (29.9%) | 2,868 (91.1%) |
Disability Status by Sex by Age in Lodi
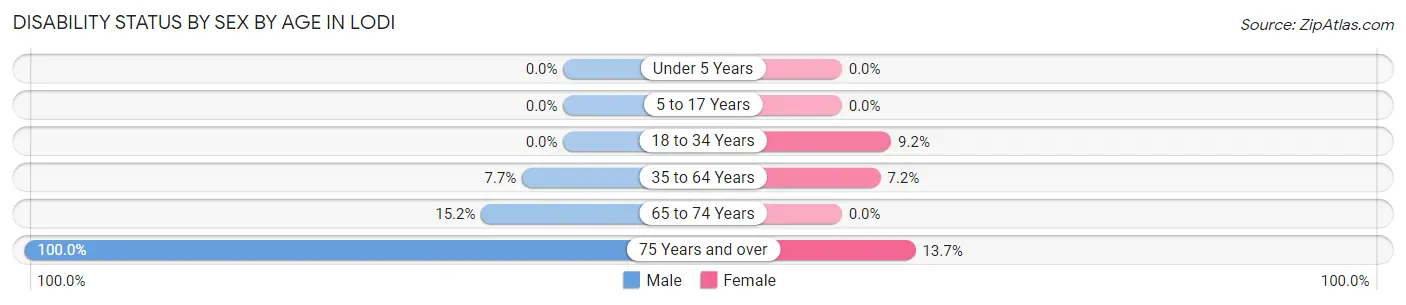
| Age Bracket | Male | Female |
| Under 5 Years | 0 (0.0%) | 0 (0.0%) |
| 5 to 17 Years | 0 (0.0%) | 0 (0.0%) |
| 18 to 34 Years | 0 (0.0%) | 25 (9.2%) |
| 35 to 64 Years | 41 (7.6%) | 42 (7.2%) |
| 65 to 74 Years | 37 (15.2%) | 0 (0.0%) |
| 75 Years and over | 127 (100.0%) | 13 (13.7%) |
Disability Class by Sex by Age in Lodi
Disability Class: Hearing Difficulty
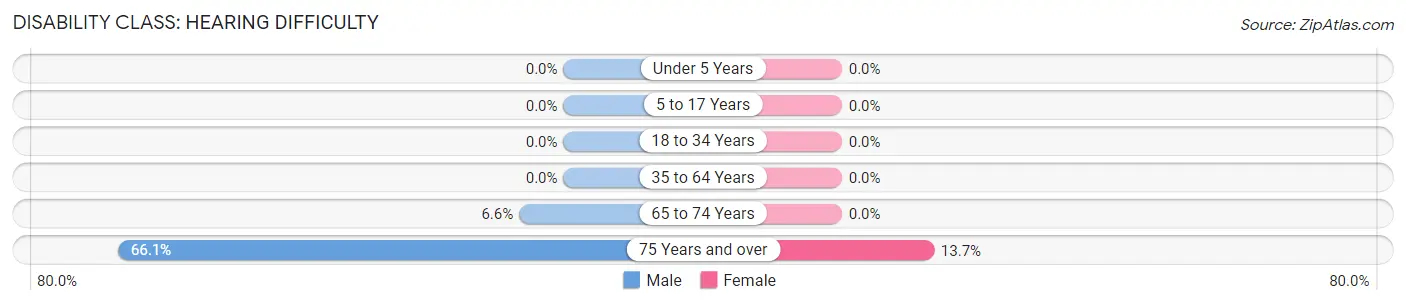
| Age Bracket | Male | Female |
| Under 5 Years | 0 (0.0%) | 0 (0.0%) |
| 5 to 17 Years | 0 (0.0%) | 0 (0.0%) |
| 18 to 34 Years | 0 (0.0%) | 0 (0.0%) |
| 35 to 64 Years | 0 (0.0%) | 0 (0.0%) |
| 65 to 74 Years | 16 (6.6%) | 0 (0.0%) |
| 75 Years and over | 84 (66.1%) | 13 (13.7%) |
Disability Class: Vision Difficulty
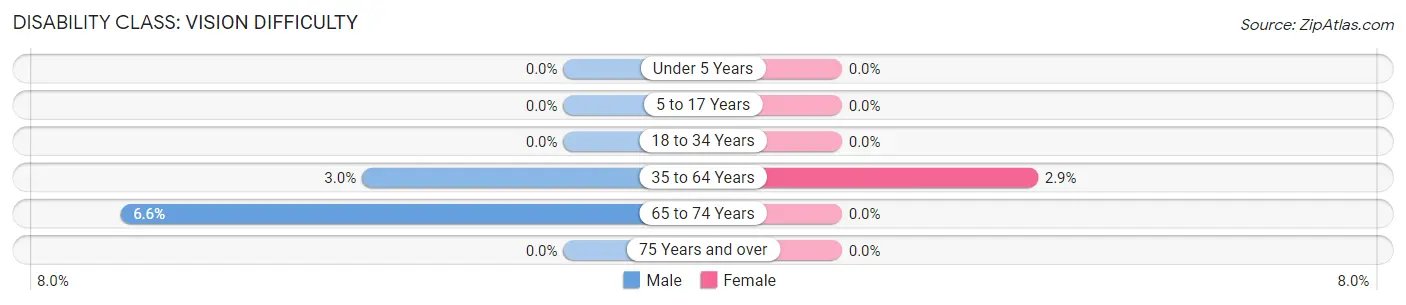
| Age Bracket | Male | Female |
| Under 5 Years | 0 (0.0%) | 0 (0.0%) |
| 5 to 17 Years | 0 (0.0%) | 0 (0.0%) |
| 18 to 34 Years | 0 (0.0%) | 0 (0.0%) |
| 35 to 64 Years | 16 (3.0%) | 17 (2.9%) |
| 65 to 74 Years | 16 (6.6%) | 0 (0.0%) |
| 75 Years and over | 0 (0.0%) | 0 (0.0%) |
Disability Class: Cognitive Difficulty
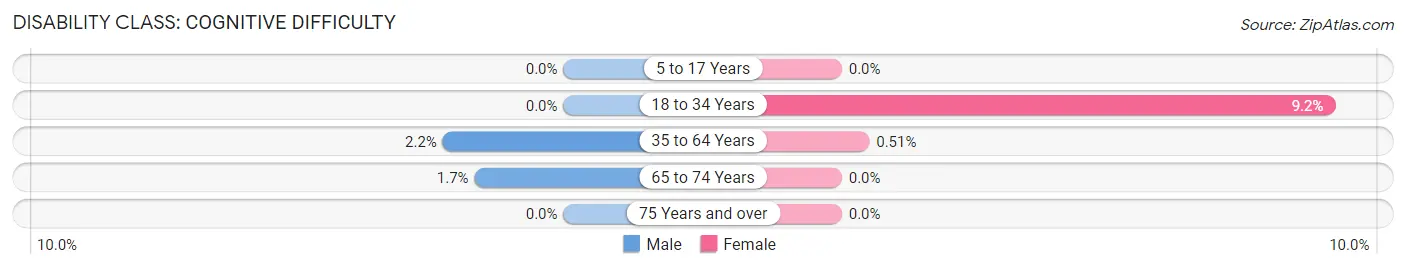
| Age Bracket | Male | Female |
| 5 to 17 Years | 0 (0.0%) | 0 (0.0%) |
| 18 to 34 Years | 0 (0.0%) | 25 (9.2%) |
| 35 to 64 Years | 12 (2.2%) | 3 (0.5%) |
| 65 to 74 Years | 4 (1.7%) | 0 (0.0%) |
| 75 Years and over | 0 (0.0%) | 0 (0.0%) |
Disability Class: Ambulatory Difficulty
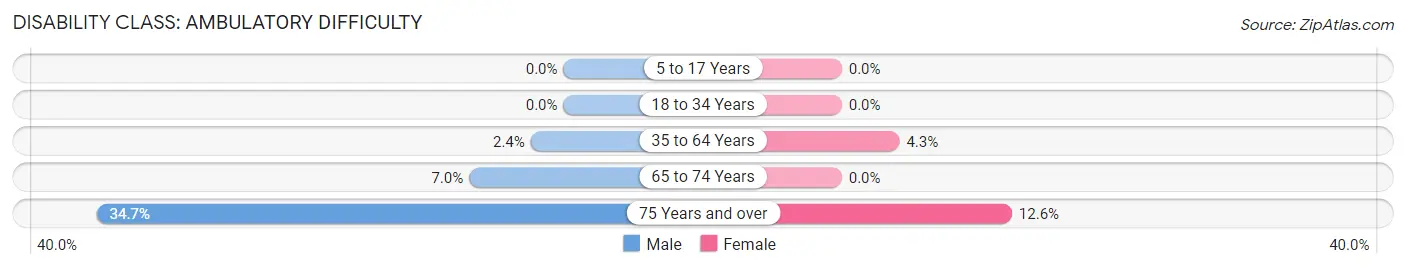
| Age Bracket | Male | Female |
| 5 to 17 Years | 0 (0.0%) | 0 (0.0%) |
| 18 to 34 Years | 0 (0.0%) | 0 (0.0%) |
| 35 to 64 Years | 13 (2.4%) | 25 (4.3%) |
| 65 to 74 Years | 17 (7.0%) | 0 (0.0%) |
| 75 Years and over | 44 (34.6%) | 12 (12.6%) |
Disability Class: Self-Care Difficulty
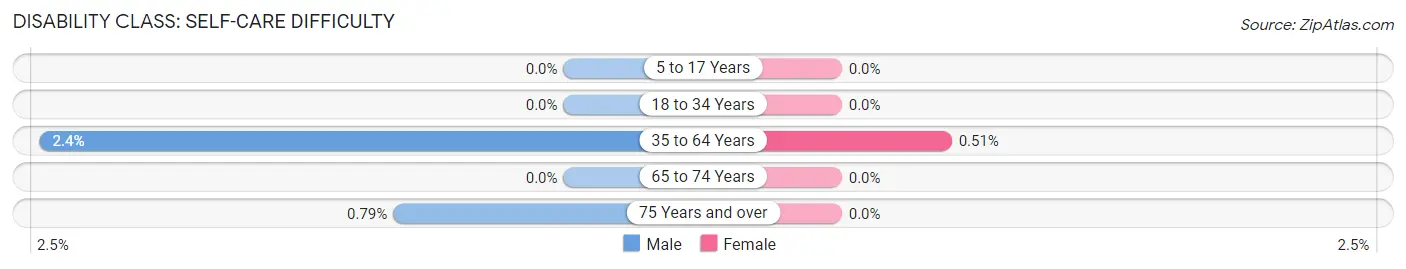
| Age Bracket | Male | Female |
| 5 to 17 Years | 0 (0.0%) | 0 (0.0%) |
| 18 to 34 Years | 0 (0.0%) | 0 (0.0%) |
| 35 to 64 Years | 13 (2.4%) | 3 (0.5%) |
| 65 to 74 Years | 0 (0.0%) | 0 (0.0%) |
| 75 Years and over | 1 (0.8%) | 0 (0.0%) |
Technology Access in Lodi
Computing Device Access in Lodi
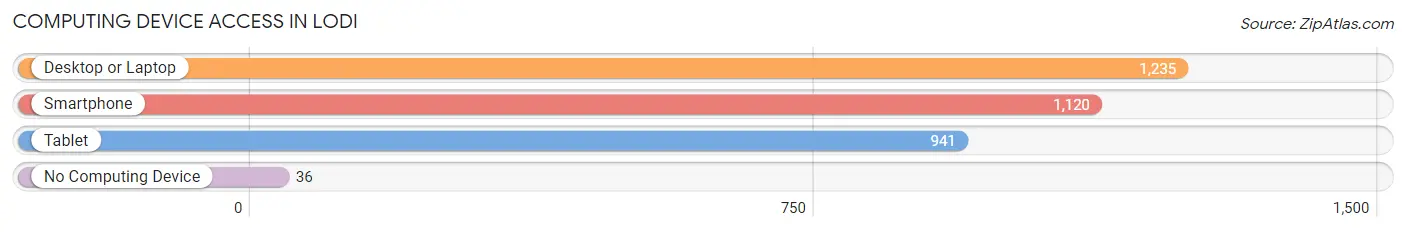
| Device Type | # Households | % Households |
| Desktop or Laptop | 1,235 | 85.7% |
| Smartphone | 1,120 | 77.7% |
| Tablet | 941 | 65.3% |
| No Computing Device | 36 | 2.5% |
| Total | 1,441 | 100.0% |
Internet Access in Lodi
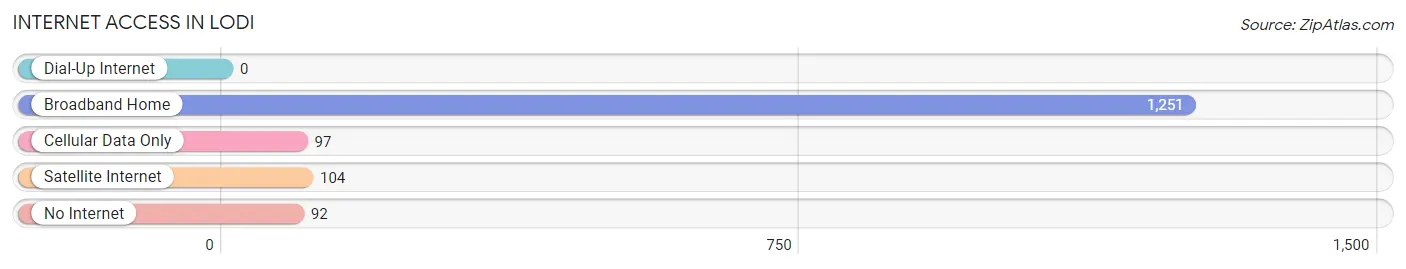
| Internet Type | # Households | % Households |
| Dial-Up Internet | 0 | 0.0% |
| Broadband Home | 1,251 | 86.8% |
| Cellular Data Only | 97 | 6.7% |
| Satellite Internet | 104 | 7.2% |
| No Internet | 92 | 6.4% |
| Total | 1,441 | 100.0% |
Lodi Summary
Lodi, Wisconsin is a small village located in Columbia County, Wisconsin. It is situated on the Wisconsin River, about 25 miles north of Madison. The village has a population of about 2,500 people and is part of the Madison Metropolitan Statistical Area.
History
The area that is now Lodi was first settled in 1845 by a group of settlers from New York. The village was originally known as “Lodi Station” and was named after the Italian city of Lodi. The village was officially incorporated in 1856.
In the late 19th century, Lodi was a thriving agricultural community. The village was home to several grain mills, a cheese factory, and a canning factory. The village also had a number of stores, a hotel, and a post office.
In the early 20th century, the village began to decline as the agricultural industry shifted away from the area. The village was hit hard by the Great Depression and many of the businesses closed.
Geography
Lodi is located in Columbia County, Wisconsin. It is situated on the Wisconsin River, about 25 miles north of Madison. The village is surrounded by rolling hills and farmland. The village is located in the Central Plain region of Wisconsin, which is characterized by flat terrain and fertile soils.
The climate in Lodi is humid continental, with cold winters and warm summers. The average annual temperature is around 45°F (7°C). The average annual precipitation is around 33 inches (84 cm).
Economy
The economy of Lodi is largely based on agriculture. The village is home to several farms, which produce a variety of crops, including corn, soybeans, and wheat. The village also has a number of small businesses, including restaurants, retail stores, and service providers.
The village is also home to a number of manufacturing companies, including a paper mill and a plastics factory. The village is also home to a number of tourist attractions, including a winery, a golf course, and a museum.
Demographics
As of the 2010 census, the population of Lodi was 2,521. The racial makeup of the village was 97.2% White, 0.7% African American, 0.3% Native American, 0.3% Asian, 0.1% Pacific Islander, 0.4% from other races, and 0.9% from two or more races. Hispanic or Latino of any race were 1.3% of the population.
The median household income in Lodi was $45,938, and the median family income was $54,844. The per capita income was $21,945. About 8.2% of families and 10.3% of the population were below the poverty line, including 14.2% of those under age 18 and 5.2% of those age 65 or over.
Common Questions
What is Per Capita Income in Lodi?
Per Capita income in Lodi is $48,706.
What is the Median Family Income in Lodi?
Median Family Income in Lodi is $111,385.
What is the Median Household income in Lodi?
Median Household Income in Lodi is $108,168.
What is Income or Wage Gap in Lodi?
Income or Wage Gap in Lodi is 18.6%.
Women in Lodi earn 81.4 cents for every dollar earned by a man.
What is Inequality or Gini Index in Lodi?
Inequality or Gini Index in Lodi is 0.34.
What is the Total Population of Lodi?
Total Population of Lodi is 3,196.
What is the Total Male Population of Lodi?
Total Male Population of Lodi is 1,651.
What is the Total Female Population of Lodi?
Total Female Population of Lodi is 1,545.
What is the Ratio of Males per 100 Females in Lodi?
There are 106.86 Males per 100 Females in Lodi.
What is the Ratio of Females per 100 Males in Lodi?
There are 93.58 Females per 100 Males in Lodi.
What is the Median Population Age in Lodi?
Median Population Age in Lodi is 41.7 Years.
What is the Average Family Size in Lodi
Average Family Size in Lodi is 2.5 People.
What is the Average Household Size in Lodi
Average Household Size in Lodi is 2.2 People.
How Large is the Labor Force in Lodi?
There are 1,876 People in the Labor Forcein in Lodi.
What is the Percentage of People in the Labor Force in Lodi?
73.3% of People are in the Labor Force in Lodi.
What is the Unemployment Rate in Lodi?
Unemployment Rate in Lodi is 4.1%.