Lebanon, WI Map & Demographics
Lebanon Map
Lebanon Overview
$37,751
PER CAPITA INCOME
$76,758
AVG FAMILY INCOME
$76,445
AVG HOUSEHOLD INCOME
51.2%
WAGE / INCOME GAP [ % ]
48.8¢/ $1
WAGE / INCOME GAP [ $ ]
0.24
INEQUALITY / GINI INDEX
134
TOTAL POPULATION
72
MALE POPULATION
62
FEMALE POPULATION
116.13
MALES / 100 FEMALES
86.11
FEMALES / 100 MALES
91.1
MEDIAN AGE
2.6
AVG FAMILY SIZE
2.3
AVG HOUSEHOLD SIZE
34
LABOR FORCE [ PEOPLE ]
29.6%
PERCENT IN LABOR FORCE
5.9%
UNEMPLOYMENT RATE
Lebanon Zip Codes
Lebanon Area Codes
Income in Lebanon
Income Overview in Lebanon
Per Capita Income in Lebanon is $37,751, while median incomes of families and households are $76,758 and $76,445 respectively.
| Characteristic | Number | Measure |
| Per Capita Income | 134 | $37,751 |
| Median Family Income | 45 | $76,758 |
| Mean Family Income | 45 | $97,600 |
| Median Household Income | 59 | $76,445 |
| Mean Household Income | 59 | $85,647 |
| Income Deficit | 45 | $0 |
| Wage / Income Gap (%) | 134 | 51.17% |
| Wage / Income Gap ($) | 134 | 48.83¢ per $1 |
| Gini / Inequality Index | 134 | 0.24 |
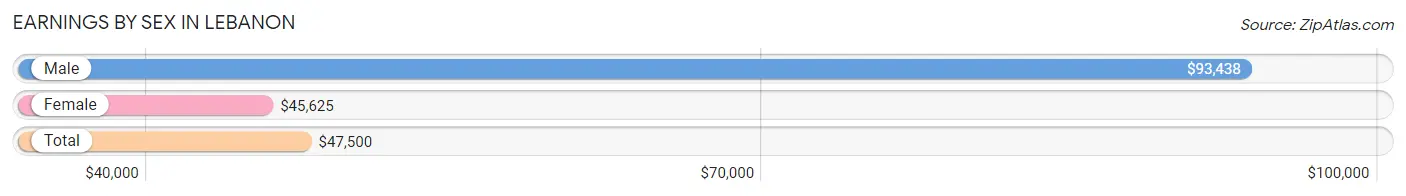
Earnings by Sex in Lebanon
Average Earnings in Lebanon are $47,500, $93,438 for men and $45,625 for women, a difference of 51.2%.
| Sex | Number | Average Earnings |
| Male | 13 (38.2%) | $93,438 |
| Female | 21 (61.8%) | $45,625 |
| Total | 34 (100.0%) | $47,500 |
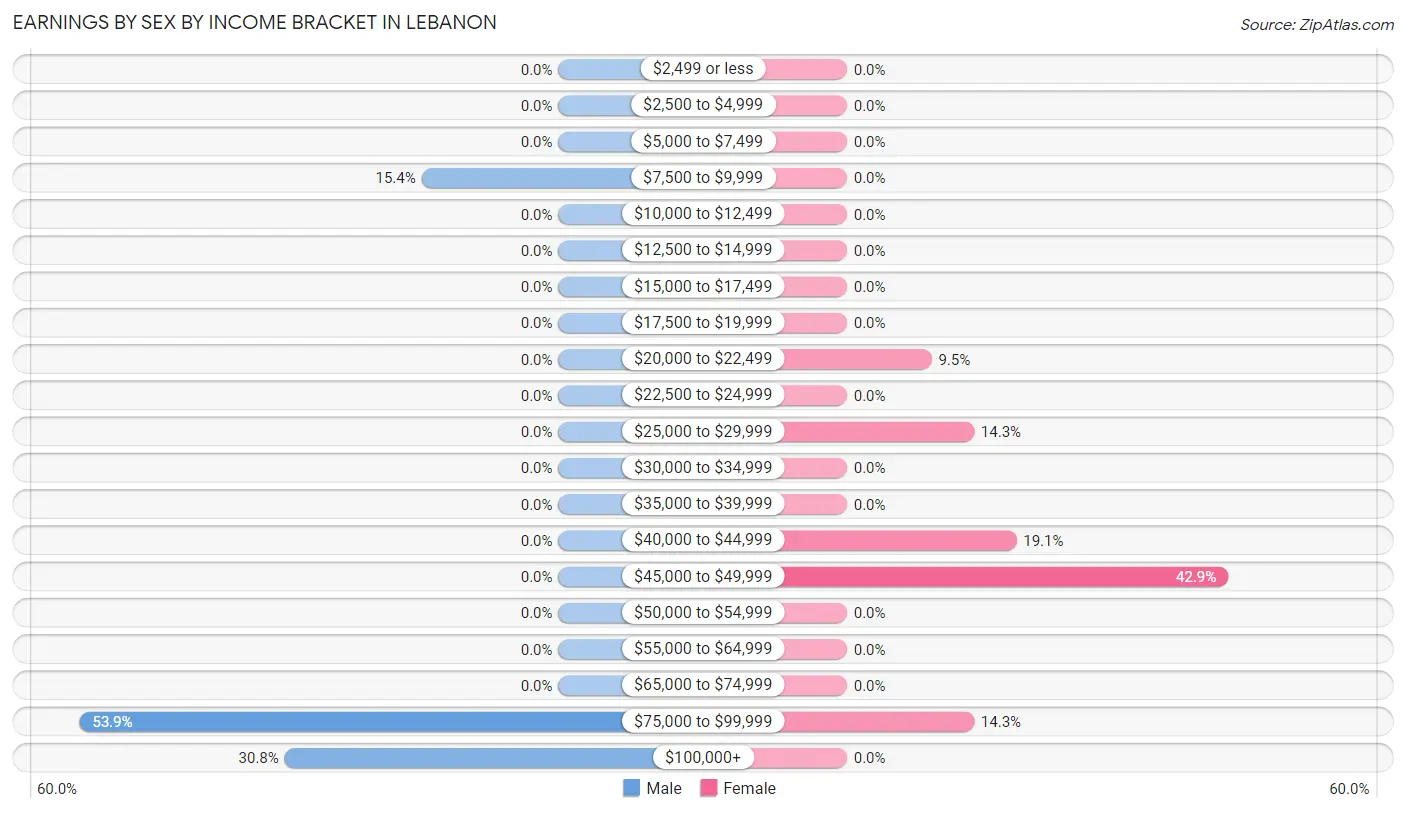
Earnings by Sex by Income Bracket in Lebanon
The most common earnings brackets in Lebanon are $75,000 to $99,999 for men (7 | 53.8%) and $45,000 to $49,999 for women (9 | 42.9%).
| Income | Male | Female |
| $2,499 or less | 0 (0.0%) | 0 (0.0%) |
| $2,500 to $4,999 | 0 (0.0%) | 0 (0.0%) |
| $5,000 to $7,499 | 0 (0.0%) | 0 (0.0%) |
| $7,500 to $9,999 | 2 (15.4%) | 0 (0.0%) |
| $10,000 to $12,499 | 0 (0.0%) | 0 (0.0%) |
| $12,500 to $14,999 | 0 (0.0%) | 0 (0.0%) |
| $15,000 to $17,499 | 0 (0.0%) | 0 (0.0%) |
| $17,500 to $19,999 | 0 (0.0%) | 0 (0.0%) |
| $20,000 to $22,499 | 0 (0.0%) | 2 (9.5%) |
| $22,500 to $24,999 | 0 (0.0%) | 0 (0.0%) |
| $25,000 to $29,999 | 0 (0.0%) | 3 (14.3%) |
| $30,000 to $34,999 | 0 (0.0%) | 0 (0.0%) |
| $35,000 to $39,999 | 0 (0.0%) | 0 (0.0%) |
| $40,000 to $44,999 | 0 (0.0%) | 4 (19.1%) |
| $45,000 to $49,999 | 0 (0.0%) | 9 (42.9%) |
| $50,000 to $54,999 | 0 (0.0%) | 0 (0.0%) |
| $55,000 to $64,999 | 0 (0.0%) | 0 (0.0%) |
| $65,000 to $74,999 | 0 (0.0%) | 0 (0.0%) |
| $75,000 to $99,999 | 7 (53.8%) | 3 (14.3%) |
| $100,000+ | 4 (30.8%) | 0 (0.0%) |
| Total | 13 (100.0%) | 21 (100.0%) |
Earnings by Sex by Educational Attainment in Lebanon
| Educational Attainment | Male Income | Female Income |
| Less than High School | - | - |
| High School Diploma | - | - |
| College or Associate's Degree | - | - |
| Bachelor's Degree | - | - |
| Graduate Degree | - | - |
| Total | $93,438 | $46,458 |
Family Income in Lebanon
Family Income Brackets in Lebanon
According to the Lebanon family income data, there are 32 families falling into the $75,000 to $99,999 income range, which is the most common income bracket and makes up 71.1% of all families.
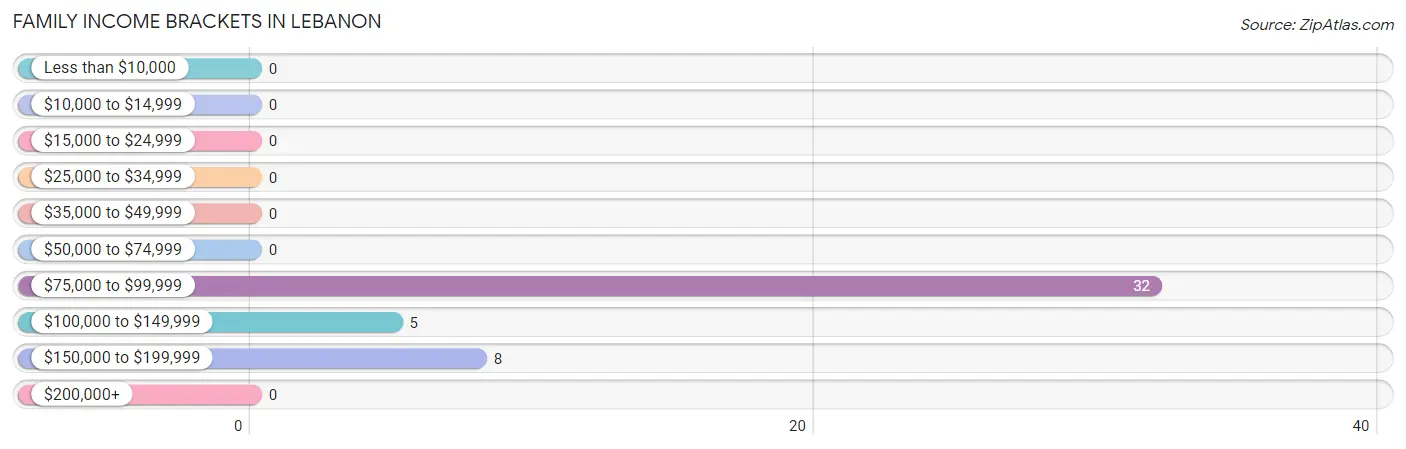
| Income Bracket | # Families | % Families |
| Less than $10,000 | 0 | 0.0% |
| $10,000 to $14,999 | 0 | 0.0% |
| $15,000 to $24,999 | 0 | 0.0% |
| $25,000 to $34,999 | 0 | 0.0% |
| $35,000 to $49,999 | 0 | 0.0% |
| $50,000 to $74,999 | 0 | 0.0% |
| $75,000 to $99,999 | 32 | 71.1% |
| $100,000 to $149,999 | 5 | 11.1% |
| $150,000 to $199,999 | 8 | 17.8% |
| $200,000+ | 0 | 0.0% |
Family Income by Famaliy Size in Lebanon
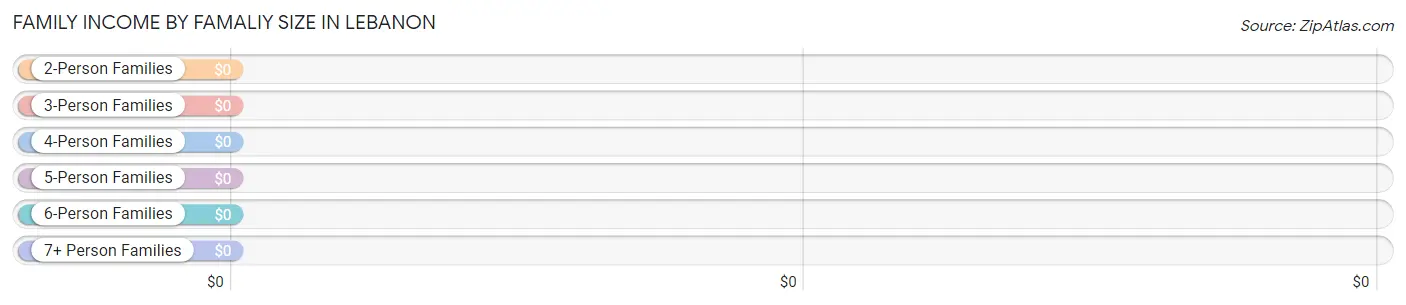
| Income Bracket | # Families | Median Income |
| 2-Person Families | 34 (75.6%) | $0 |
| 3-Person Families | 3 (6.7%) | $0 |
| 4-Person Families | 4 (8.9%) | $0 |
| 5-Person Families | 0 (0.0%) | $0 |
| 6-Person Families | 4 (8.9%) | $0 |
| 7+ Person Families | 0 (0.0%) | $0 |
| Total | 45 (100.0%) | $76,758 |
Family Income by Number of Earners in Lebanon
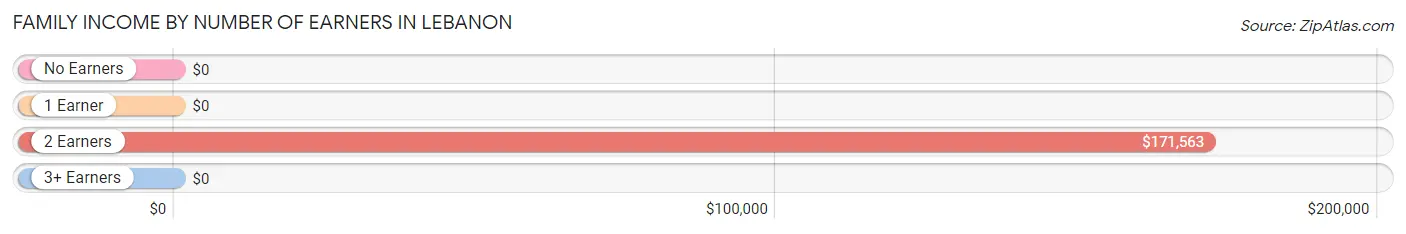
| Number of Earners | # Families | Median Income |
| No Earners | 34 (75.6%) | $0 |
| 1 Earner | 0 (0.0%) | $0 |
| 2 Earners | 11 (24.4%) | $171,563 |
| 3+ Earners | 0 (0.0%) | $0 |
| Total | 45 (100.0%) | $76,758 |
Household Income in Lebanon
Household Income Brackets in Lebanon
With 35 households falling in the category, the $75,000 to $99,999 income range is the most frequent in Lebanon, accounting for 59.3% of all households.
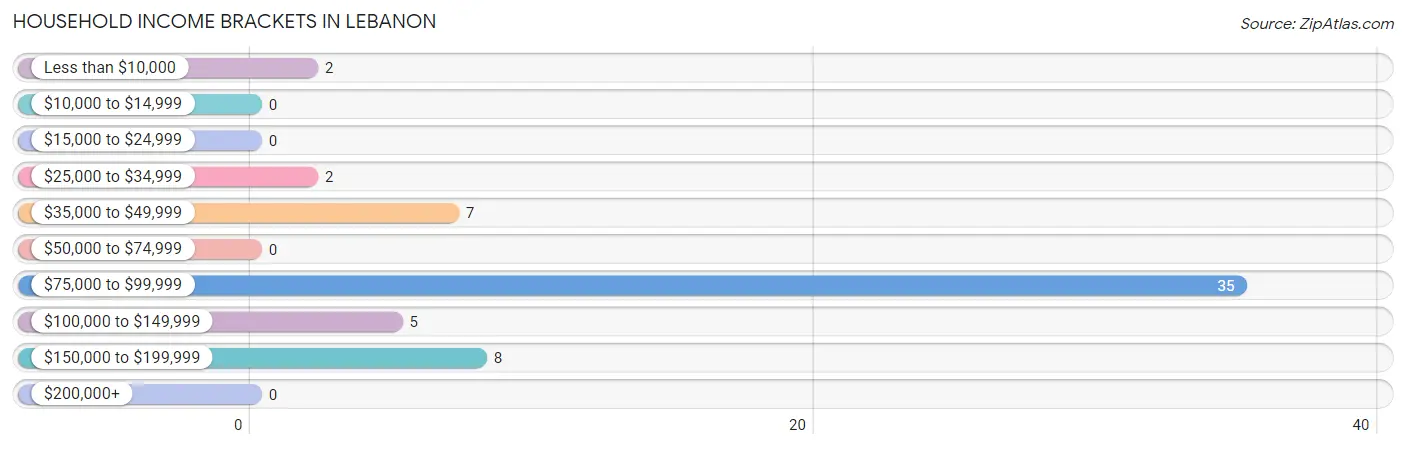
| Income Bracket | # Households | % Households |
| Less than $10,000 | 2 | 3.4% |
| $10,000 to $14,999 | 0 | 0.0% |
| $15,000 to $24,999 | 0 | 0.0% |
| $25,000 to $34,999 | 2 | 3.4% |
| $35,000 to $49,999 | 7 | 11.9% |
| $50,000 to $74,999 | 0 | 0.0% |
| $75,000 to $99,999 | 35 | 59.3% |
| $100,000 to $149,999 | 5 | 8.5% |
| $150,000 to $199,999 | 8 | 13.6% |
| $200,000+ | 0 | 0.0% |
Household Income by Householder Age in Lebanon
The median household income in Lebanon is $76,445, with the highest median household income of $171,563 found in the 25 to 44 years age bracket for the primary householder. A total of 11 households (18.6%) fall into this category. Meanwhile, the 15 to 24 years age bracket for the primary householder has the lowest median household income of $0, with 4 households (6.8%) in this group.
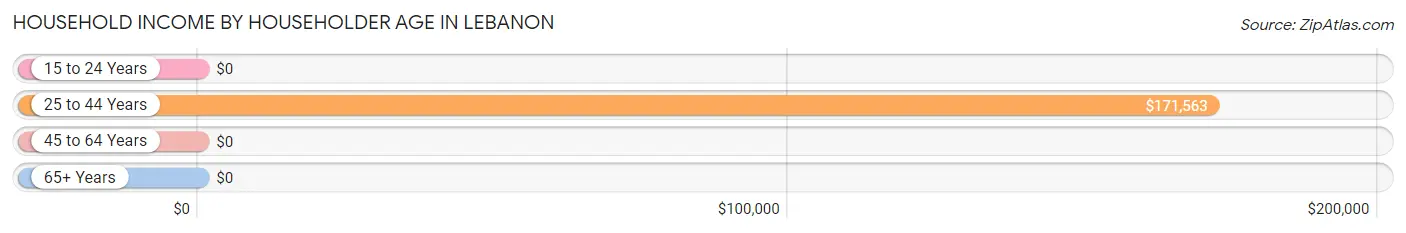
| Income Bracket | # Households | Median Income |
| 15 to 24 Years | 4 (6.8%) | $0 |
| 25 to 44 Years | 11 (18.6%) | $171,563 |
| 45 to 64 Years | 9 (15.2%) | $0 |
| 65+ Years | 35 (59.3%) | $0 |
| Total | 59 (100.0%) | $76,445 |
Poverty in Lebanon
Income Below Poverty by Sex and Age in Lebanon
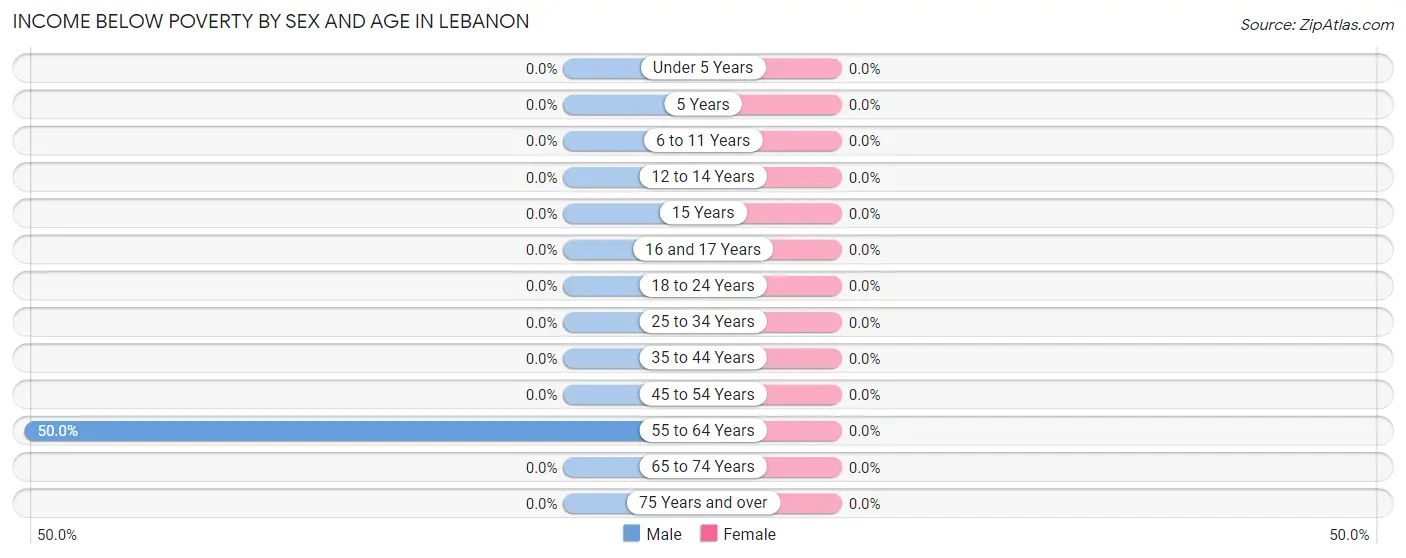
| Age Bracket | Male | Female |
| Under 5 Years | 0 (0.0%) | 0 (0.0%) |
| 5 Years | 0 (0.0%) | 0 (0.0%) |
| 6 to 11 Years | 0 (0.0%) | 0 (0.0%) |
| 12 to 14 Years | 0 (0.0%) | 0 (0.0%) |
| 15 Years | 0 (0.0%) | 0 (0.0%) |
| 16 and 17 Years | 0 (0.0%) | 0 (0.0%) |
| 18 to 24 Years | 0 (0.0%) | 0 (0.0%) |
| 25 to 34 Years | 0 (0.0%) | 0 (0.0%) |
| 35 to 44 Years | 0 (0.0%) | 0 (0.0%) |
| 45 to 54 Years | 0 (0.0%) | 0 (0.0%) |
| 55 to 64 Years | 2 (50.0%) | 0 (0.0%) |
| 65 to 74 Years | 0 (0.0%) | 0 (0.0%) |
| 75 Years and over | 0 (0.0%) | 0 (0.0%) |
| Total | 2 (2.8%) | 0 (0.0%) |
Income Above Poverty by Sex and Age in Lebanon
According to the poverty statistics in Lebanon, males aged under 5 years and females aged 18 to 24 years are the age groups that are most secure financially, with 100.0% of males and 100.0% of females in these age groups living above the poverty line.
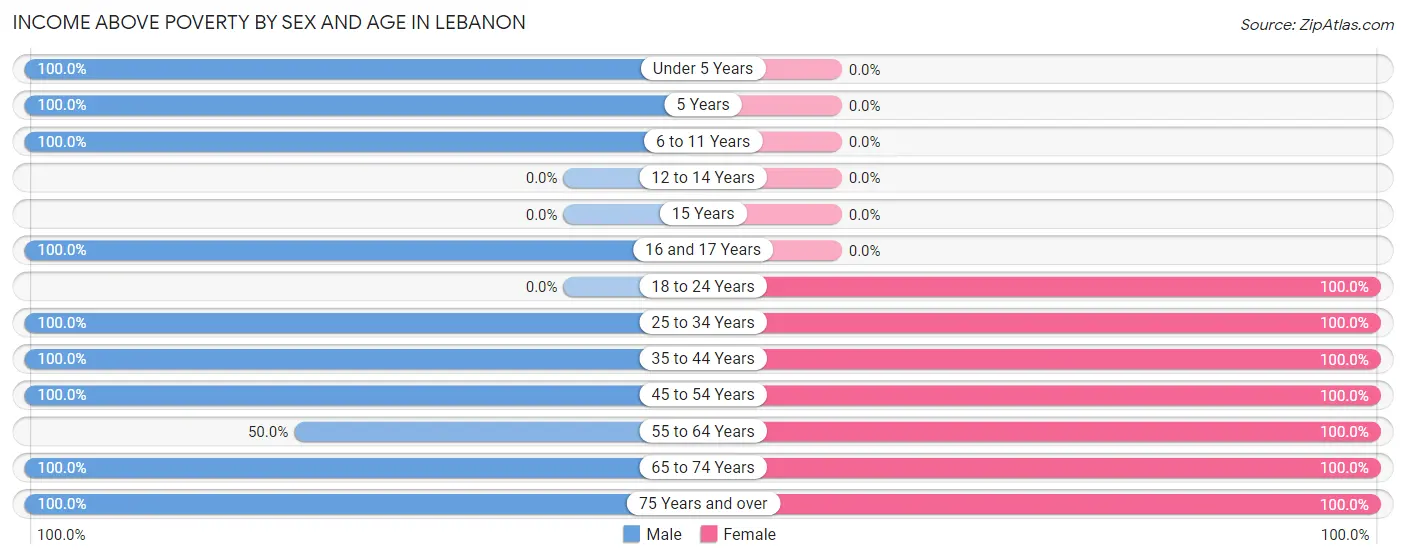
| Age Bracket | Male | Female |
| Under 5 Years | 9 (100.0%) | 0 (0.0%) |
| 5 Years | 3 (100.0%) | 0 (0.0%) |
| 6 to 11 Years | 7 (100.0%) | 0 (0.0%) |
| 12 to 14 Years | 0 (0.0%) | 0 (0.0%) |
| 15 Years | 0 (0.0%) | 0 (0.0%) |
| 16 and 17 Years | 3 (100.0%) | 0 (0.0%) |
| 18 to 24 Years | 0 (0.0%) | 4 (100.0%) |
| 25 to 34 Years | 4 (100.0%) | 3 (100.0%) |
| 35 to 44 Years | 4 (100.0%) | 6 (100.0%) |
| 45 to 54 Years | 3 (100.0%) | 3 (100.0%) |
| 55 to 64 Years | 2 (50.0%) | 4 (100.0%) |
| 65 to 74 Years | 3 (100.0%) | 3 (100.0%) |
| 75 Years and over | 32 (100.0%) | 39 (100.0%) |
| Total | 70 (97.2%) | 62 (100.0%) |
Income Below Poverty Among Married-Couple Families in Lebanon
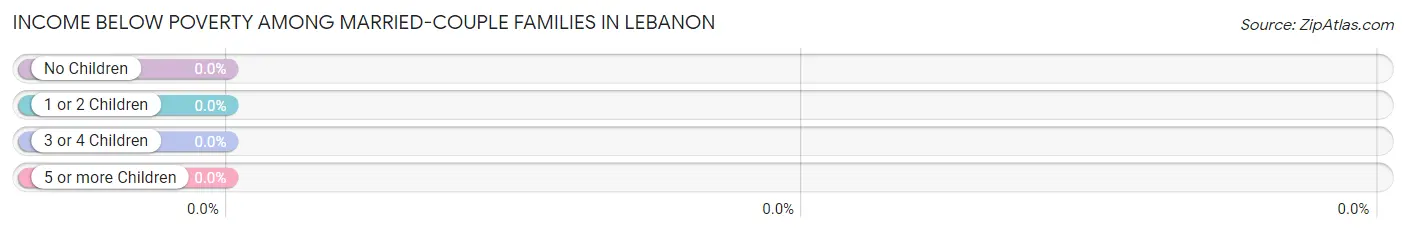
| Children | Above Poverty | Below Poverty |
| No Children | 34 (100.0%) | 0 (0.0%) |
| 1 or 2 Children | 7 (100.0%) | 0 (0.0%) |
| 3 or 4 Children | 4 (100.0%) | 0 (0.0%) |
| 5 or more Children | 0 (0.0%) | 0 (0.0%) |
| Total | 45 (100.0%) | 0 (0.0%) |
Income Below Poverty Among Single-Parent Households in Lebanon
| Children | Single Father | Single Mother |
| No Children | 0 (0.0%) | 0 (0.0%) |
| 1 or 2 Children | 0 (0.0%) | 0 (0.0%) |
| 3 or 4 Children | 0 (0.0%) | 0 (0.0%) |
| 5 or more Children | 0 (0.0%) | 0 (0.0%) |
| Total | 0 (0.0%) | 0 (0.0%) |
Income Below Poverty Among Married-Couple vs Single-Parent Households in Lebanon
| Children | Married-Couple Families | Single-Parent Households |
| No Children | 0 (0.0%) | 0 (0.0%) |
| 1 or 2 Children | 0 (0.0%) | 0 (0.0%) |
| 3 or 4 Children | 0 (0.0%) | 0 (0.0%) |
| 5 or more Children | 0 (0.0%) | 0 (0.0%) |
| Total | 0 (0.0%) | 0 (0.0%) |
Race in Lebanon
The most populous races in Lebanon are White / Caucasian (132 | 98.5%), Hispanic or Latino (2 | 1.5%), and Some other Race (2 | 1.5%).
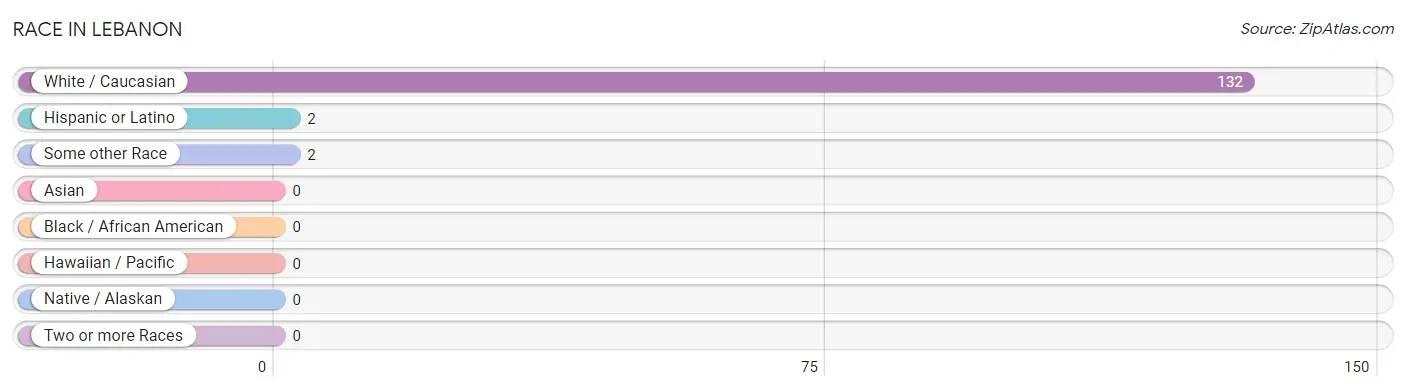
| Race | # Population | % Population |
| Asian | 0 | 0.0% |
| Black / African American | 0 | 0.0% |
| Hawaiian / Pacific | 0 | 0.0% |
| Hispanic or Latino | 2 | 1.5% |
| Native / Alaskan | 0 | 0.0% |
| White / Caucasian | 132 | 98.5% |
| Two or more Races | 0 | 0.0% |
| Some other Race | 2 | 1.5% |
| Total | 134 | 100.0% |
Ancestry in Lebanon
The most populous ancestries reported in Lebanon are German (27 | 20.2%), Polish (10 | 7.5%), and Mexican (2 | 1.5%), together accounting for 29.1% of all Lebanon residents.
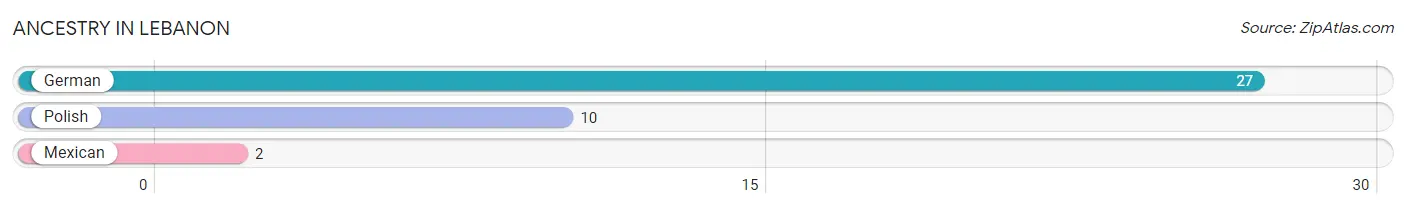
| Ancestry | # Population | % Population |
| German | 27 | 20.2% |
| Mexican | 2 | 1.5% |
| Polish | 10 | 7.5% | View All 3 Rows |
Immigrants in Lebanon

| Immigration Origin | # Population | % Population | View All 0 Rows |
Sex and Age in Lebanon
Sex and Age in Lebanon
The most populous age groups in Lebanon are 85 Years and over (32 | 44.4%) for men and 85 Years and over (39 | 62.9%) for women.
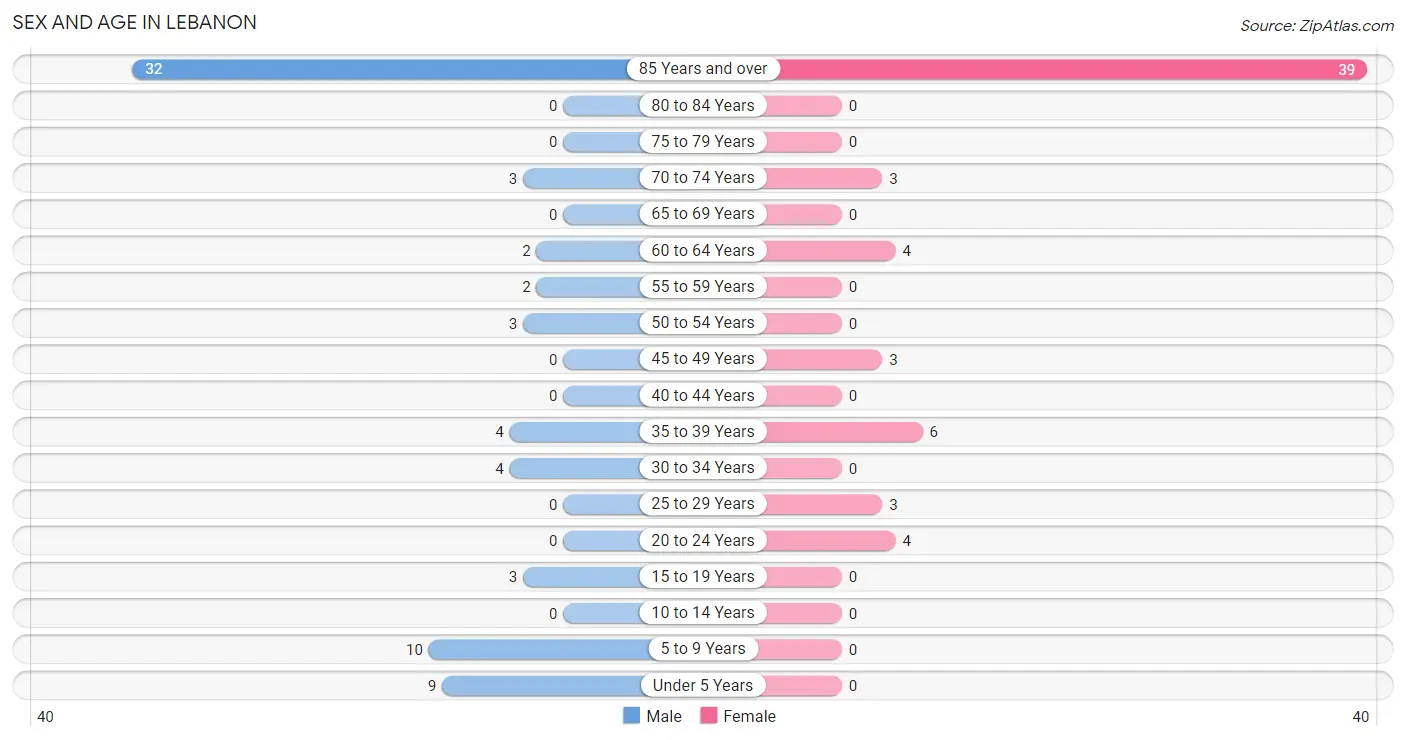
| Age Bracket | Male | Female |
| Under 5 Years | 9 (12.5%) | 0 (0.0%) |
| 5 to 9 Years | 10 (13.9%) | 0 (0.0%) |
| 10 to 14 Years | 0 (0.0%) | 0 (0.0%) |
| 15 to 19 Years | 3 (4.2%) | 0 (0.0%) |
| 20 to 24 Years | 0 (0.0%) | 4 (6.5%) |
| 25 to 29 Years | 0 (0.0%) | 3 (4.8%) |
| 30 to 34 Years | 4 (5.6%) | 0 (0.0%) |
| 35 to 39 Years | 4 (5.6%) | 6 (9.7%) |
| 40 to 44 Years | 0 (0.0%) | 0 (0.0%) |
| 45 to 49 Years | 0 (0.0%) | 3 (4.8%) |
| 50 to 54 Years | 3 (4.2%) | 0 (0.0%) |
| 55 to 59 Years | 2 (2.8%) | 0 (0.0%) |
| 60 to 64 Years | 2 (2.8%) | 4 (6.5%) |
| 65 to 69 Years | 0 (0.0%) | 0 (0.0%) |
| 70 to 74 Years | 3 (4.2%) | 3 (4.8%) |
| 75 to 79 Years | 0 (0.0%) | 0 (0.0%) |
| 80 to 84 Years | 0 (0.0%) | 0 (0.0%) |
| 85 Years and over | 32 (44.4%) | 39 (62.9%) |
| Total | 72 (100.0%) | 62 (100.0%) |
Families and Households in Lebanon
Median Family Size in Lebanon
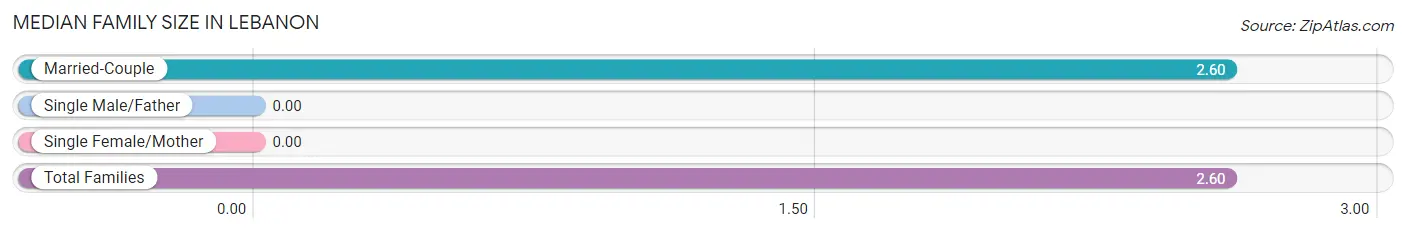
| Family Type | # Families | Family Size |
| Married-Couple | 45 (100.0%) | 2.60 |
| Single Male/Father | 0 (0.0%) | - |
| Single Female/Mother | 0 (0.0%) | - |
| Total Families | 45 (100.0%) | 2.60 |
Median Household Size in Lebanon
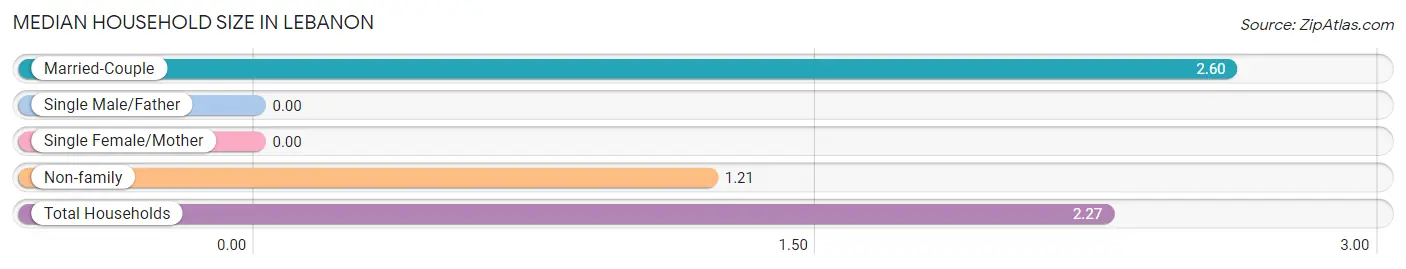
| Household Type | # Households | Household Size |
| Married-Couple | 45 (76.3%) | 2.60 |
| Single Male/Father | 0 (0.0%) | - |
| Single Female/Mother | 0 (0.0%) | - |
| Non-family | 14 (23.7%) | 1.21 |
| Total Households | 59 (100.0%) | 2.27 |
Household Size by Marriage Status in Lebanon
Out of a total of 59 households in Lebanon, 45 (76.3%) are family households, while 14 (23.7%) are nonfamily households. The most numerous type of family households are 2-person households, comprising 34, and the most common type of nonfamily households are 1-person households, comprising 11.
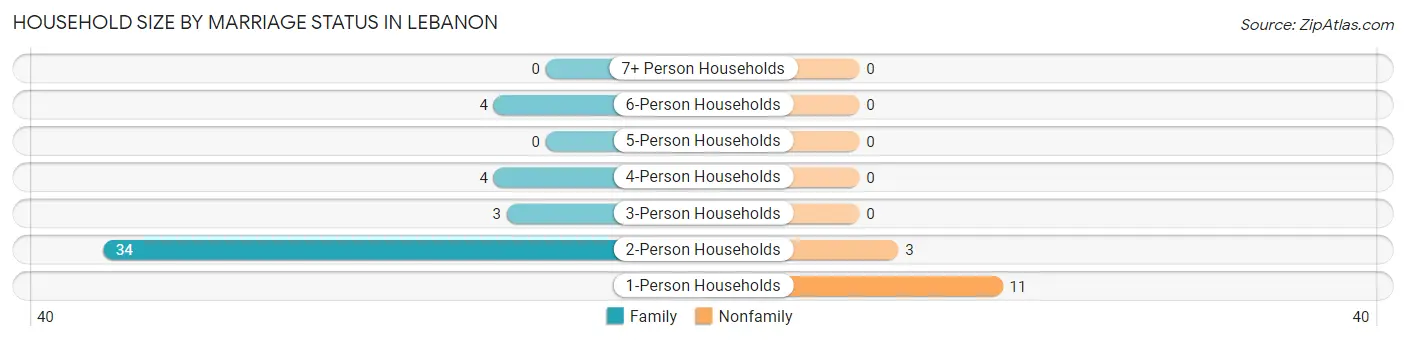
| Household Size | Family Households | Nonfamily Households |
| 1-Person Households | - | 11 (18.6%) |
| 2-Person Households | 34 (57.6%) | 3 (5.1%) |
| 3-Person Households | 3 (5.1%) | 0 (0.0%) |
| 4-Person Households | 4 (6.8%) | 0 (0.0%) |
| 5-Person Households | 0 (0.0%) | 0 (0.0%) |
| 6-Person Households | 4 (6.8%) | 0 (0.0%) |
| 7+ Person Households | 0 (0.0%) | 0 (0.0%) |
| Total | 45 (76.3%) | 14 (23.7%) |
Female Fertility in Lebanon
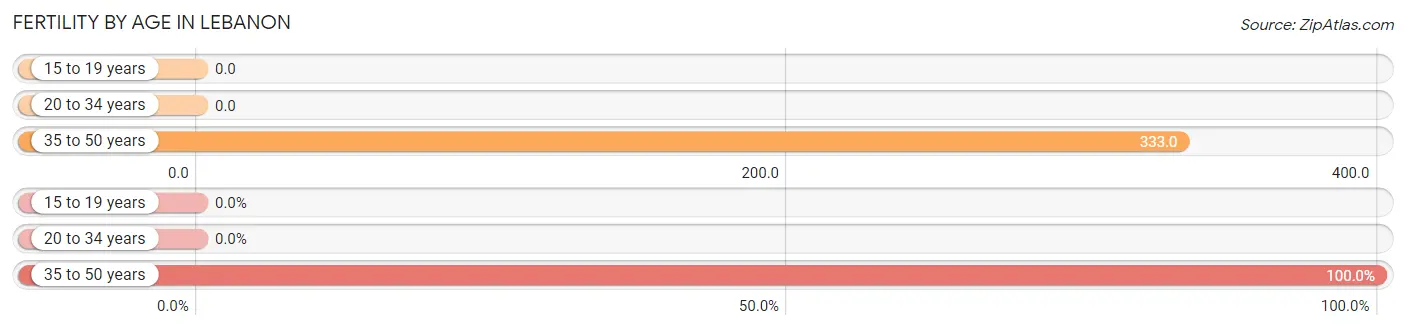
Fertility by Age in Lebanon
Average fertility rate in Lebanon is 188.0 births per 1,000 women. Women in the age bracket of 35 to 50 years have the highest fertility rate with 333.0 births per 1,000 women. Women in the age bracket of 35 to 50 years acount for 100.0% of all women with births.
| Age Bracket | Women with Births | Births / 1,000 Women |
| 15 to 19 years | 0 (0.0%) | 0.0 |
| 20 to 34 years | 0 (0.0%) | 0.0 |
| 35 to 50 years | 3 (100.0%) | 333.0 |
| Total | 3 (100.0%) | 188.0 |
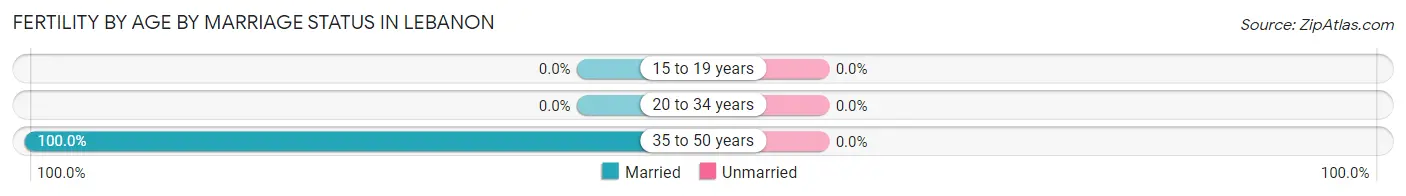
Fertility by Age by Marriage Status in Lebanon
| Age Bracket | Married | Unmarried |
| 15 to 19 years | 0 (0.0%) | 0 (0.0%) |
| 20 to 34 years | 0 (0.0%) | 0 (0.0%) |
| 35 to 50 years | 3 (100.0%) | 0 (0.0%) |
| Total | 3 (100.0%) | 0 (0.0%) |
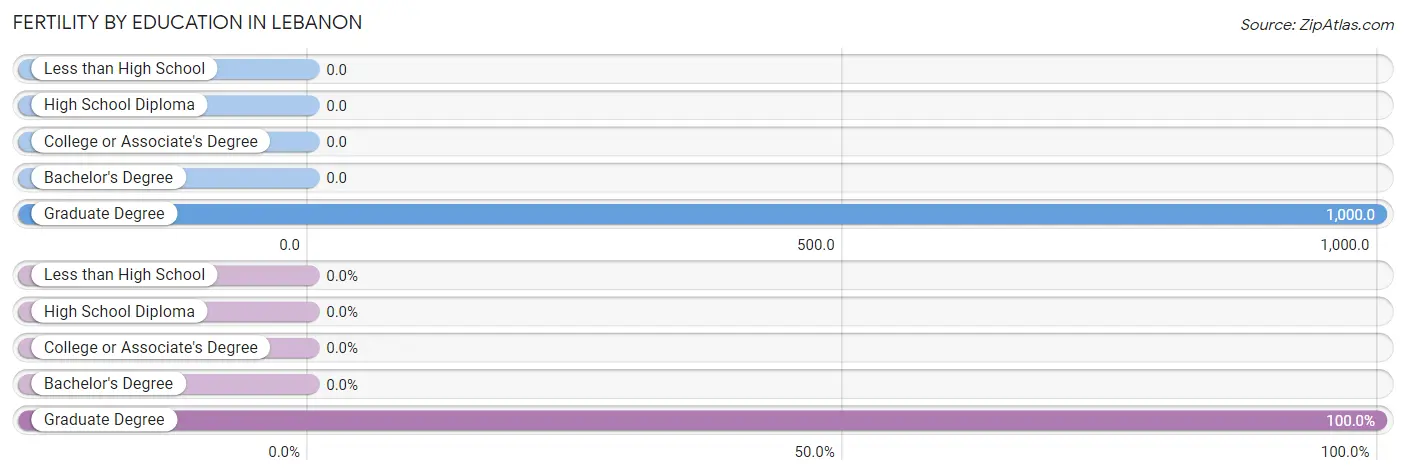
Fertility by Education in Lebanon
| Educational Attainment | Women with Births | Births / 1,000 Women |
| Less than High School | 0 (0.0%) | 0.0 |
| High School Diploma | 0 (0.0%) | 0.0 |
| College or Associate's Degree | 0 (0.0%) | 0.0 |
| Bachelor's Degree | 0 (0.0%) | 0.0 |
| Graduate Degree | 3 (100.0%) | 1,000.0 |
| Total | 3 (100.0%) | 188.0 |
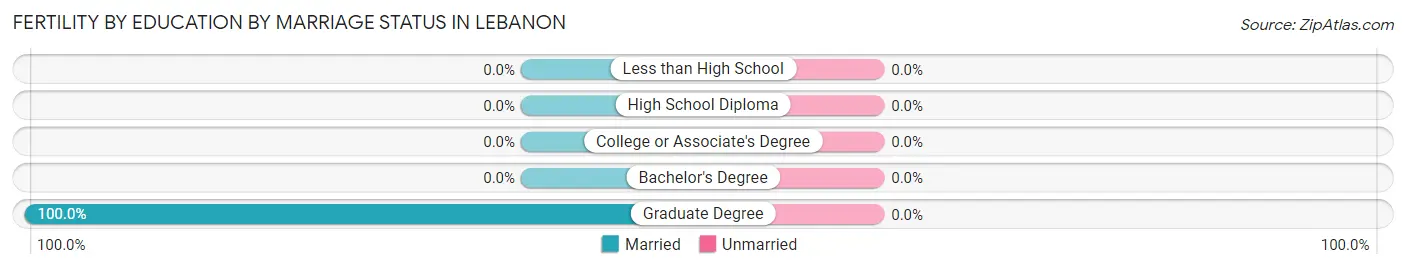
Fertility by Education by Marriage Status in Lebanon
| Educational Attainment | Married | Unmarried |
| Less than High School | 0 (0.0%) | 0 (0.0%) |
| High School Diploma | 0 (0.0%) | 0 (0.0%) |
| College or Associate's Degree | 0 (0.0%) | 0 (0.0%) |
| Bachelor's Degree | 0 (0.0%) | 0 (0.0%) |
| Graduate Degree | 3 (100.0%) | 0 (0.0%) |
| Total | 3 (100.0%) | 0 (0.0%) |
Employment Characteristics in Lebanon
Employment by Class of Employer in Lebanon
Among the 32 employed individuals in Lebanon, private company employees (25 | 78.1%), and local government employees (7 | 21.9%) make up the most common classes of employment.
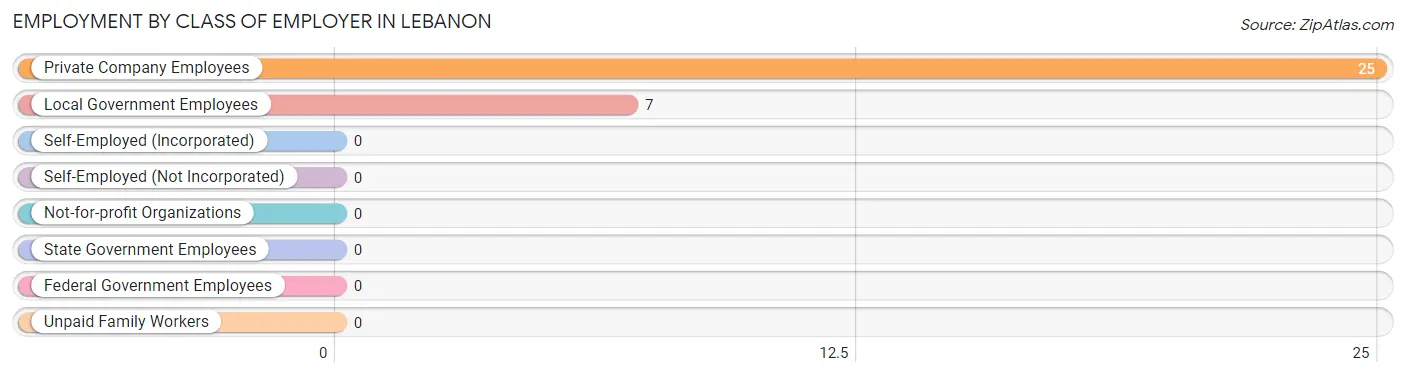
| Employer Class | # Employees | % Employees |
| Private Company Employees | 25 | 78.1% |
| Self-Employed (Incorporated) | 0 | 0.0% |
| Self-Employed (Not Incorporated) | 0 | 0.0% |
| Not-for-profit Organizations | 0 | 0.0% |
| Local Government Employees | 7 | 21.9% |
| State Government Employees | 0 | 0.0% |
| Federal Government Employees | 0 | 0.0% |
| Unpaid Family Workers | 0 | 0.0% |
| Total | 32 | 100.0% |
Employment Status by Age in Lebanon
According to the labor force statistics for Lebanon, out of the total population over 16 years of age (115), 29.6% or 34 individuals are in the labor force, with 5.9% or 2 of them unemployed. The age group with the highest labor force participation rate is 20 to 24 years, with 100.0% or 4 individuals in the labor force. Within the labor force, the 55 to 59 years age range has the highest percentage of unemployed individuals, with 100.0% or 2 of them being unemployed.
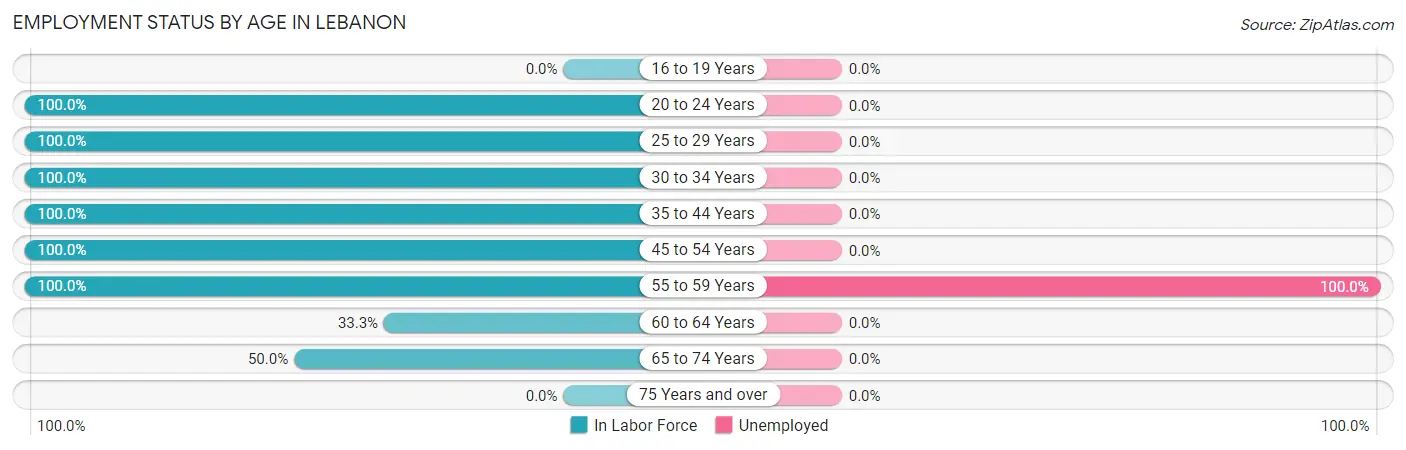
| Age Bracket | In Labor Force | Unemployed |
| 16 to 19 Years | 0 (0.0%) | 0 (0.0%) |
| 20 to 24 Years | 4 (100.0%) | 0 (0.0%) |
| 25 to 29 Years | 3 (100.0%) | 0 (0.0%) |
| 30 to 34 Years | 4 (100.0%) | 0 (0.0%) |
| 35 to 44 Years | 10 (100.0%) | 0 (0.0%) |
| 45 to 54 Years | 6 (100.0%) | 0 (0.0%) |
| 55 to 59 Years | 2 (100.0%) | 2 (100.0%) |
| 60 to 64 Years | 2 (33.3%) | 0 (0.0%) |
| 65 to 74 Years | 3 (50.0%) | 0 (0.0%) |
| 75 Years and over | 0 (0.0%) | 0 (0.0%) |
| Total | 34 (29.6%) | 2 (5.9%) |
Employment Status by Educational Attainment in Lebanon
According to labor force statistics for Lebanon, 87.1% of individuals (27) out of the total population between 25 and 64 years of age (31) are in the labor force, with 7.4% or 2 of them being unemployed. The group with the highest labor force participation rate are those with the educational attainment of bachelor's degree or higher, with 100.0% or 6 individuals in the labor force. Within the labor force, individuals with high school diploma education have the highest percentage of unemployment, with 20.0% or 2 of them being unemployed.
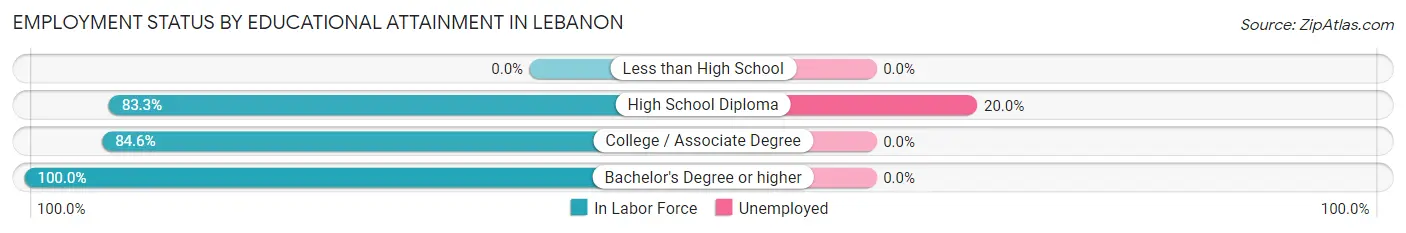
| Educational Attainment | In Labor Force | Unemployed |
| Less than High School | 0 (0.0%) | 0 (0.0%) |
| High School Diploma | 10 (83.3%) | 2 (20.0%) |
| College / Associate Degree | 11 (84.6%) | 0 (0.0%) |
| Bachelor's Degree or higher | 6 (100.0%) | 0 (0.0%) |
| Total | 27 (87.1%) | 2 (7.4%) |
Employment Occupations by Sex in Lebanon
Management, Business, Science and Arts Occupations
The most common Management, Business, Science and Arts occupations in Lebanon are Community & Social Service (3 | 9.4%), and Education Instruction & Library (3 | 9.4%).
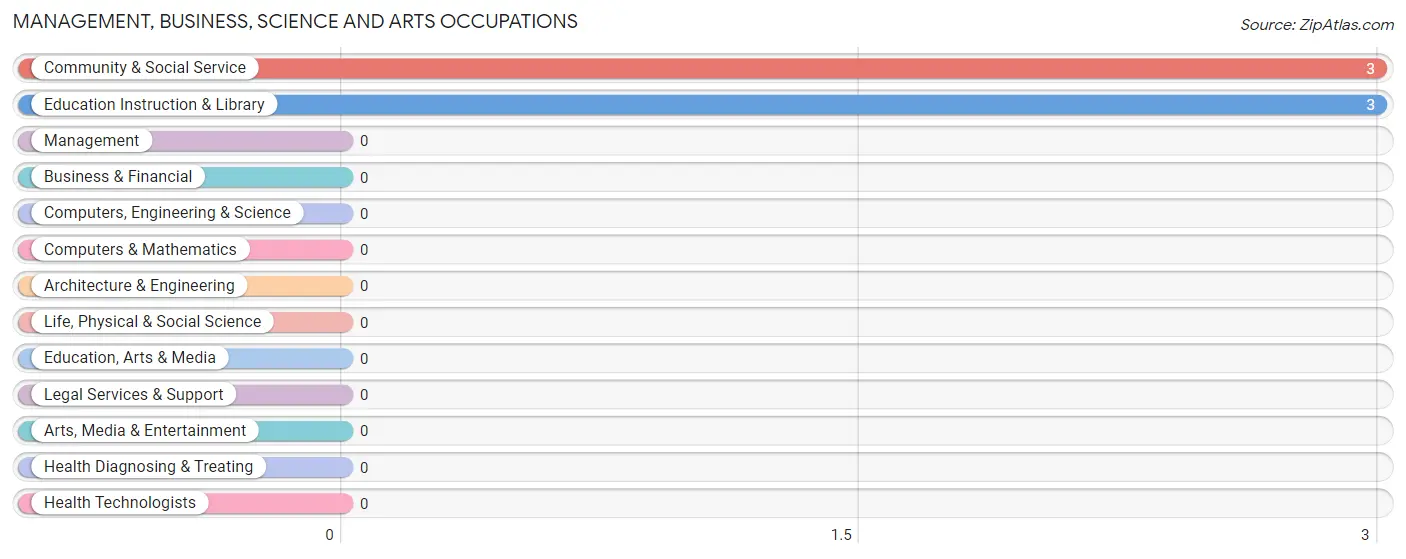
Management, Business, Science and Arts Occupations by Sex
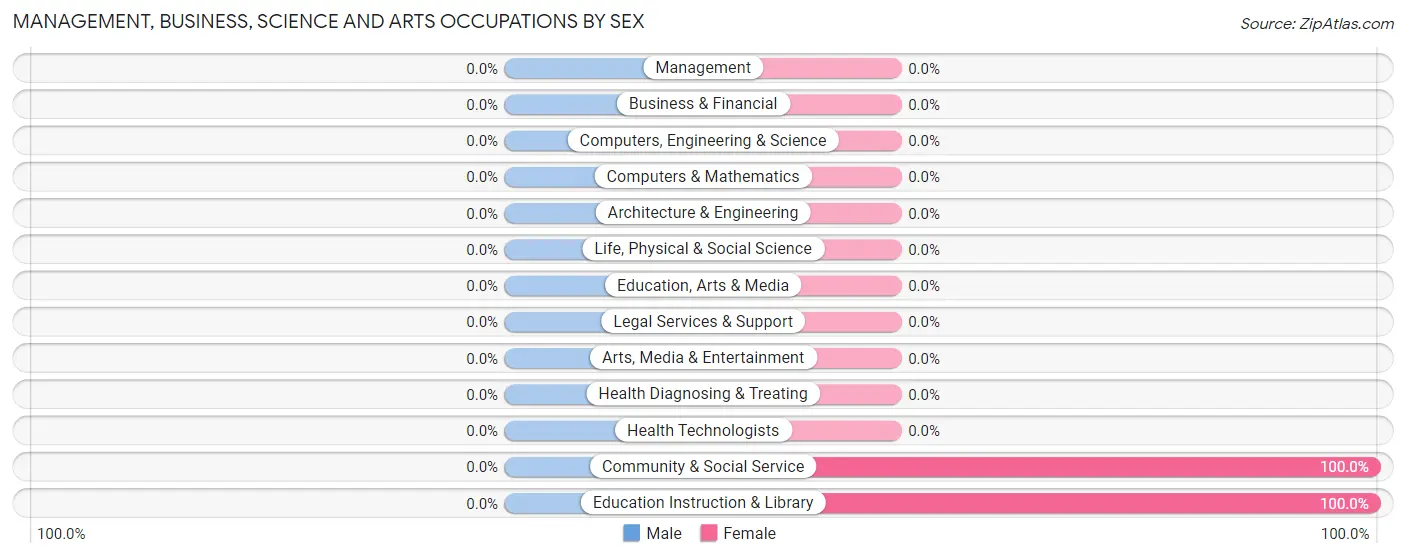
| Occupation | Male | Female |
| Management | 0 (0.0%) | 0 (0.0%) |
| Business & Financial | 0 (0.0%) | 0 (0.0%) |
| Computers, Engineering & Science | 0 (0.0%) | 0 (0.0%) |
| Computers & Mathematics | 0 (0.0%) | 0 (0.0%) |
| Architecture & Engineering | 0 (0.0%) | 0 (0.0%) |
| Life, Physical & Social Science | 0 (0.0%) | 0 (0.0%) |
| Community & Social Service | 0 (0.0%) | 3 (100.0%) |
| Education, Arts & Media | 0 (0.0%) | 0 (0.0%) |
| Legal Services & Support | 0 (0.0%) | 0 (0.0%) |
| Education Instruction & Library | 0 (0.0%) | 3 (100.0%) |
| Arts, Media & Entertainment | 0 (0.0%) | 0 (0.0%) |
| Health Diagnosing & Treating | 0 (0.0%) | 0 (0.0%) |
| Health Technologists | 0 (0.0%) | 0 (0.0%) |
| Total (Category) | 0 (0.0%) | 3 (100.0%) |
| Total (Overall) | 11 (34.4%) | 21 (65.6%) |
Services Occupations
The most common Services occupations in Lebanon are Security & Protection (4 | 12.5%), Firefighting & Prevention (4 | 12.5%), Personal Care & Service (3 | 9.4%), and Healthcare Support (2 | 6.2%).
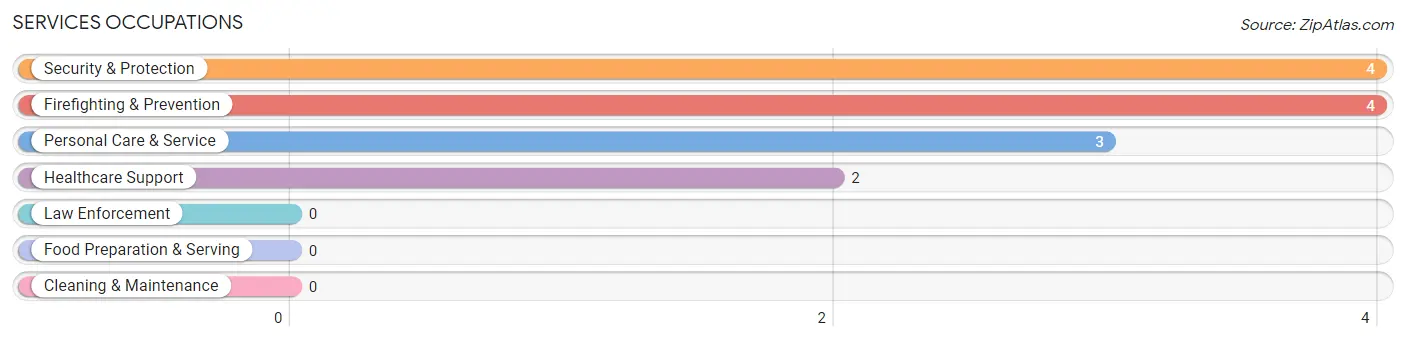
Services Occupations by Sex
Within the Services occupations in Lebanon, the most male-oriented occupations are Security & Protection (100.0%), and Firefighting & Prevention (100.0%), while the most female-oriented occupations are Healthcare Support (100.0%), and Personal Care & Service (100.0%).
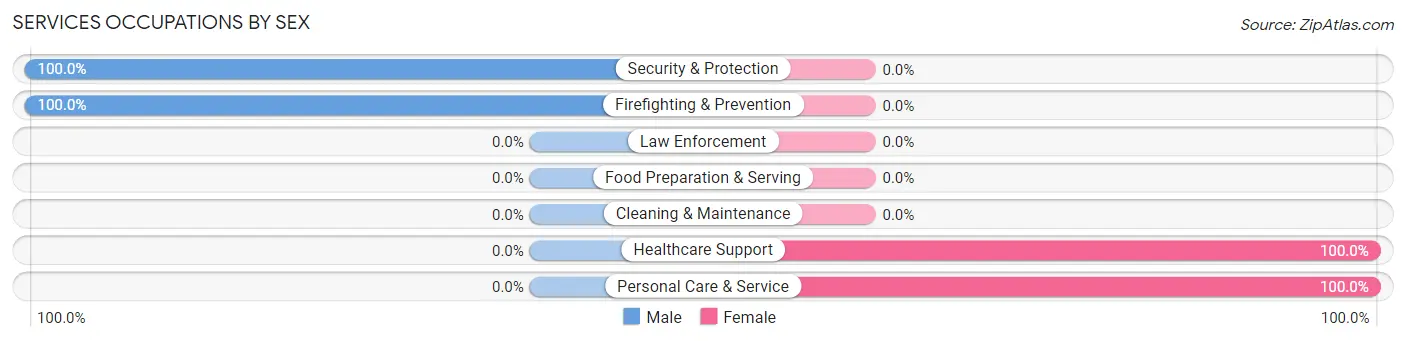
| Occupation | Male | Female |
| Healthcare Support | 0 (0.0%) | 2 (100.0%) |
| Security & Protection | 4 (100.0%) | 0 (0.0%) |
| Firefighting & Prevention | 4 (100.0%) | 0 (0.0%) |
| Law Enforcement | 0 (0.0%) | 0 (0.0%) |
| Food Preparation & Serving | 0 (0.0%) | 0 (0.0%) |
| Cleaning & Maintenance | 0 (0.0%) | 0 (0.0%) |
| Personal Care & Service | 0 (0.0%) | 3 (100.0%) |
| Total (Category) | 4 (44.4%) | 5 (55.6%) |
| Total (Overall) | 11 (34.4%) | 21 (65.6%) |
Sales and Office Occupations
The most common Sales and Office occupations in Lebanon are , and Office & Administration (6 | 18.8%).
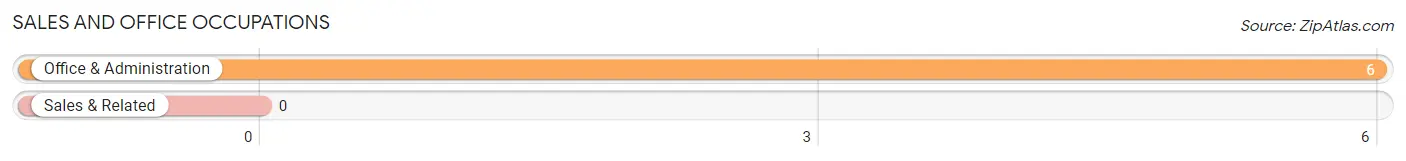
Sales and Office Occupations by Sex
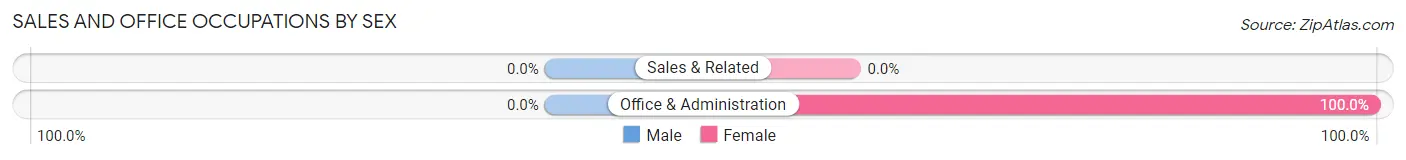
| Occupation | Male | Female |
| Sales & Related | 0 (0.0%) | 0 (0.0%) |
| Office & Administration | 0 (0.0%) | 6 (100.0%) |
| Total (Category) | 0 (0.0%) | 6 (100.0%) |
| Total (Overall) | 11 (34.4%) | 21 (65.6%) |
Natural Resources, Construction and Maintenance Occupations
The most common Natural Resources, Construction and Maintenance occupations in Lebanon are , and Construction & Extraction (4 | 12.5%).
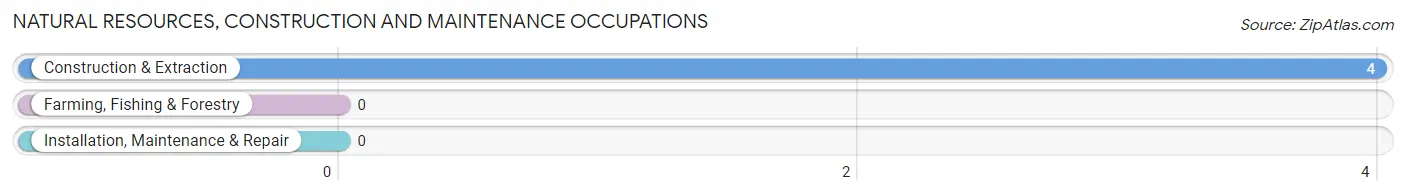
Natural Resources, Construction and Maintenance Occupations by Sex
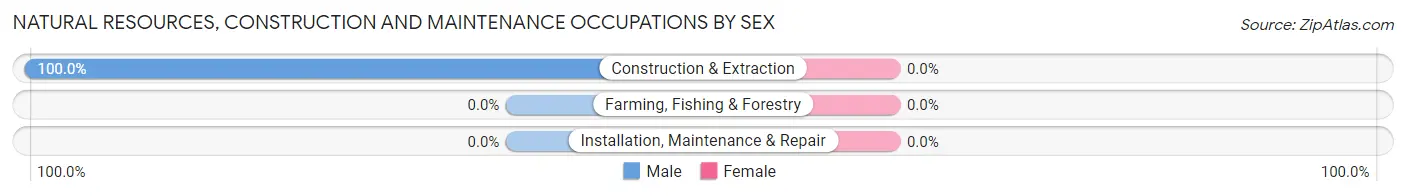
| Occupation | Male | Female |
| Farming, Fishing & Forestry | 0 (0.0%) | 0 (0.0%) |
| Construction & Extraction | 4 (100.0%) | 0 (0.0%) |
| Installation, Maintenance & Repair | 0 (0.0%) | 0 (0.0%) |
| Total (Category) | 4 (100.0%) | 0 (0.0%) |
| Total (Overall) | 11 (34.4%) | 21 (65.6%) |
Production, Transportation and Moving Occupations
The most common Production, Transportation and Moving occupations in Lebanon are Production (7 | 21.9%), and Material Moving (3 | 9.4%).
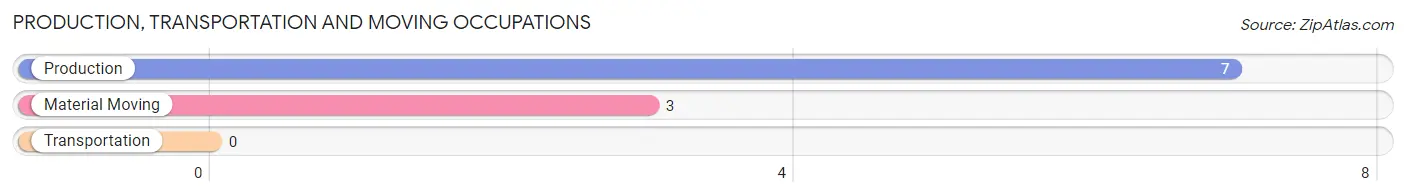
Production, Transportation and Moving Occupations by Sex
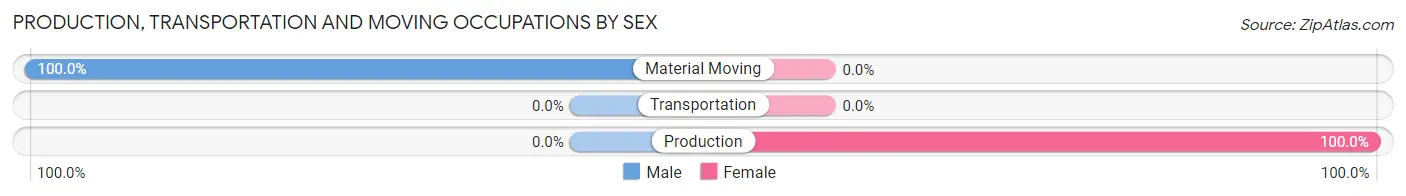
| Occupation | Male | Female |
| Production | 0 (0.0%) | 7 (100.0%) |
| Transportation | 0 (0.0%) | 0 (0.0%) |
| Material Moving | 3 (100.0%) | 0 (0.0%) |
| Total (Category) | 3 (30.0%) | 7 (70.0%) |
| Total (Overall) | 11 (34.4%) | 21 (65.6%) |
Employment Industries by Sex in Lebanon
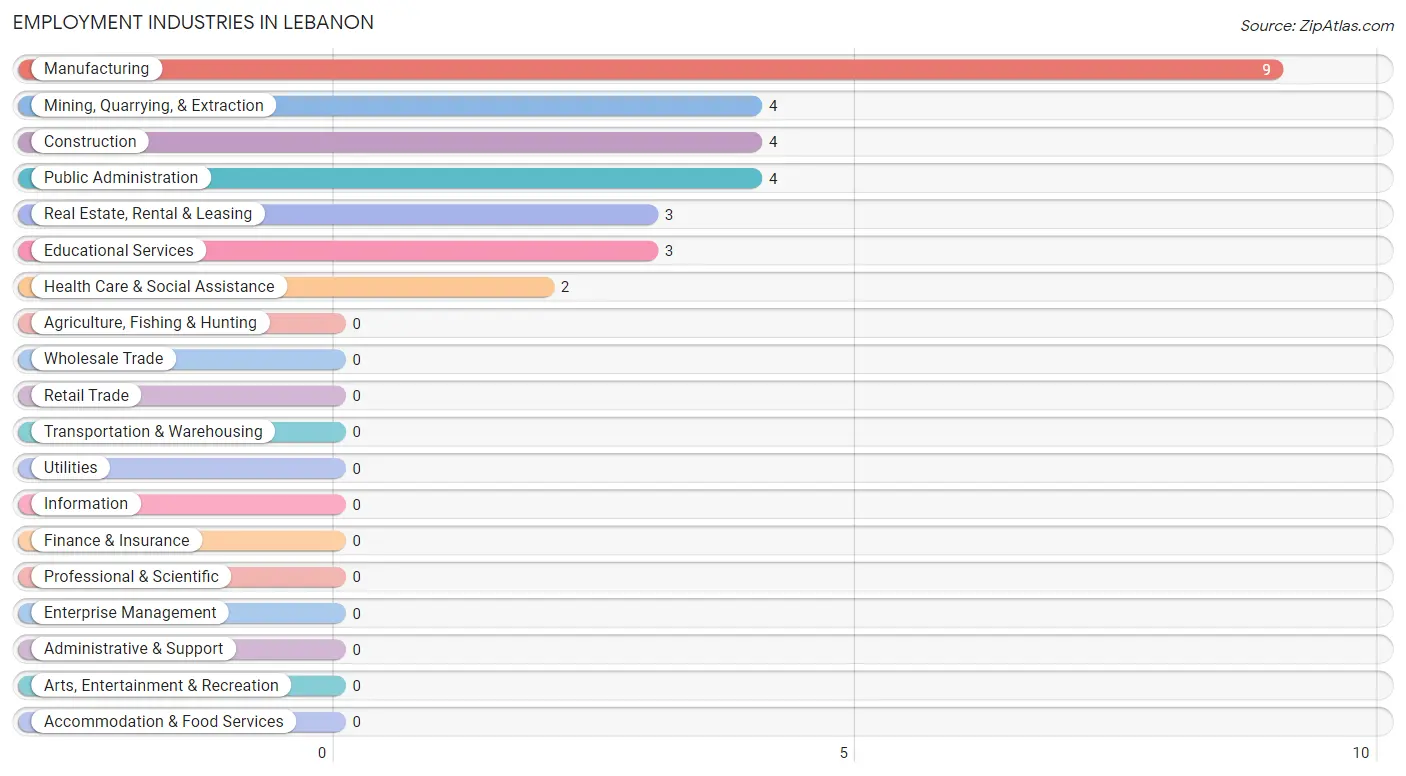
Employment Industries in Lebanon
The major employment industries in Lebanon include Manufacturing (9 | 28.1%), Mining, Quarrying, & Extraction (4 | 12.5%), Construction (4 | 12.5%), Public Administration (4 | 12.5%), and Real Estate, Rental & Leasing (3 | 9.4%).
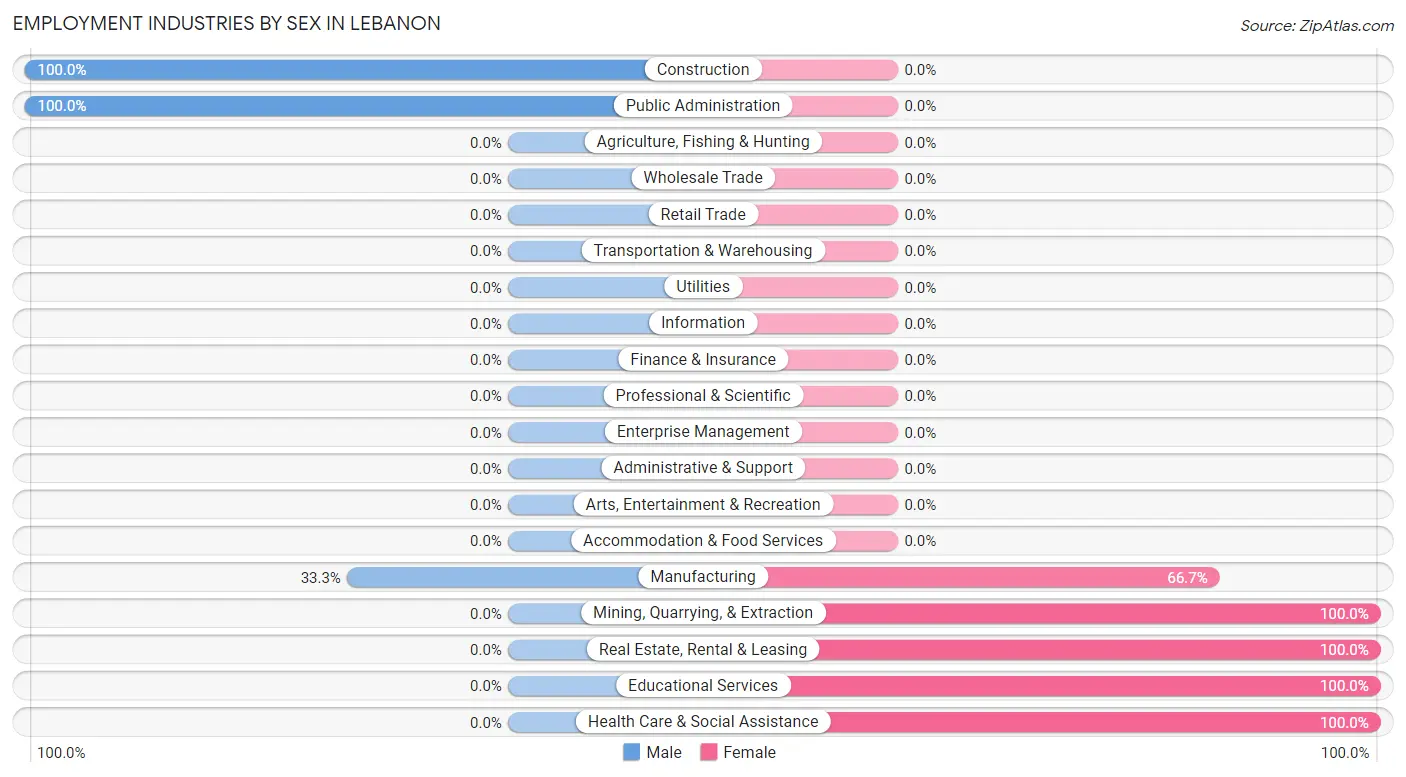
Employment Industries by Sex in Lebanon
The Lebanon industries that see more men than women are Construction (100.0%), Public Administration (100.0%), and Manufacturing (33.3%), whereas the industries that tend to have a higher number of women are Mining, Quarrying, & Extraction (100.0%), Real Estate, Rental & Leasing (100.0%), and Educational Services (100.0%).
| Industry | Male | Female |
| Agriculture, Fishing & Hunting | 0 (0.0%) | 0 (0.0%) |
| Mining, Quarrying, & Extraction | 0 (0.0%) | 4 (100.0%) |
| Construction | 4 (100.0%) | 0 (0.0%) |
| Manufacturing | 3 (33.3%) | 6 (66.7%) |
| Wholesale Trade | 0 (0.0%) | 0 (0.0%) |
| Retail Trade | 0 (0.0%) | 0 (0.0%) |
| Transportation & Warehousing | 0 (0.0%) | 0 (0.0%) |
| Utilities | 0 (0.0%) | 0 (0.0%) |
| Information | 0 (0.0%) | 0 (0.0%) |
| Finance & Insurance | 0 (0.0%) | 0 (0.0%) |
| Real Estate, Rental & Leasing | 0 (0.0%) | 3 (100.0%) |
| Professional & Scientific | 0 (0.0%) | 0 (0.0%) |
| Enterprise Management | 0 (0.0%) | 0 (0.0%) |
| Administrative & Support | 0 (0.0%) | 0 (0.0%) |
| Educational Services | 0 (0.0%) | 3 (100.0%) |
| Health Care & Social Assistance | 0 (0.0%) | 2 (100.0%) |
| Arts, Entertainment & Recreation | 0 (0.0%) | 0 (0.0%) |
| Accommodation & Food Services | 0 (0.0%) | 0 (0.0%) |
| Public Administration | 4 (100.0%) | 0 (0.0%) |
| Total | 11 (34.4%) | 21 (65.6%) |
Education in Lebanon
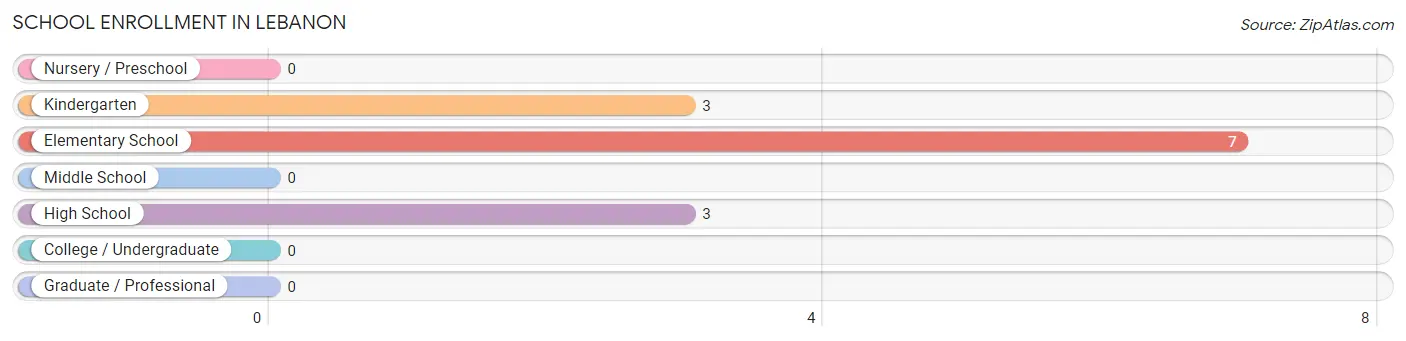
School Enrollment in Lebanon
The most common levels of schooling among the 13 students in Lebanon are elementary school (7 | 53.8%), kindergarten (3 | 23.1%), and high school (3 | 23.1%).
| School Level | # Students | % Students |
| Nursery / Preschool | 0 | 0.0% |
| Kindergarten | 3 | 23.1% |
| Elementary School | 7 | 53.8% |
| Middle School | 0 | 0.0% |
| High School | 3 | 23.1% |
| College / Undergraduate | 0 | 0.0% |
| Graduate / Professional | 0 | 0.0% |
| Total | 13 | 100.0% |
School Enrollment by Age by Funding Source in Lebanon
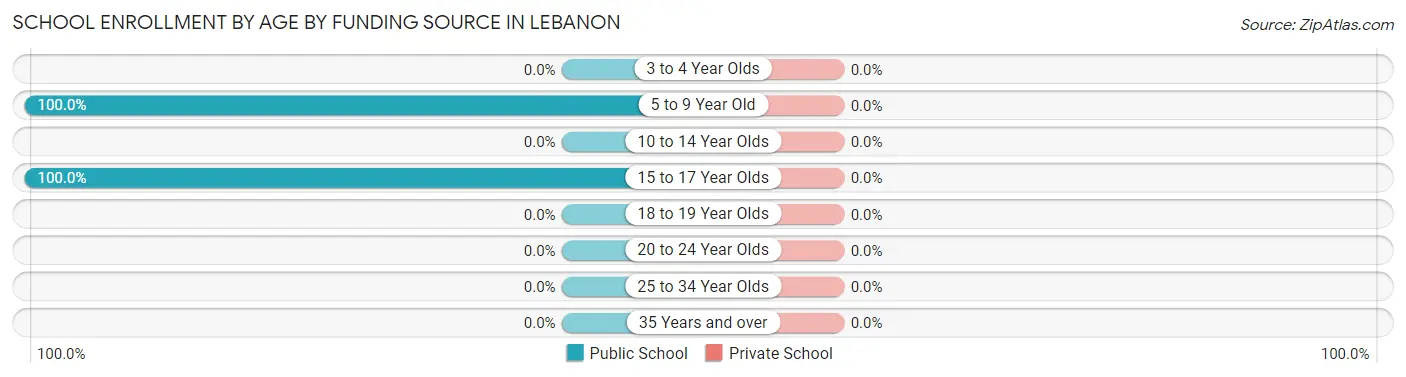
| Age Bracket | Public School | Private School |
| 3 to 4 Year Olds | 0 (0.0%) | 0 (0.0%) |
| 5 to 9 Year Old | 10 (100.0%) | 0 (0.0%) |
| 10 to 14 Year Olds | 0 (0.0%) | 0 (0.0%) |
| 15 to 17 Year Olds | 3 (100.0%) | 0 (0.0%) |
| 18 to 19 Year Olds | 0 (0.0%) | 0 (0.0%) |
| 20 to 24 Year Olds | 0 (0.0%) | 0 (0.0%) |
| 25 to 34 Year Olds | 0 (0.0%) | 0 (0.0%) |
| 35 Years and over | 0 (0.0%) | 0 (0.0%) |
| Total | 13 (100.0%) | 0 (0.0%) |
Educational Attainment by Field of Study in Lebanon
Multidisciplinary studies (3 | 33.3%), education (3 | 33.3%), and literature & languages (3 | 33.3%) are the most common fields of study among 9 individuals in Lebanon who have obtained a bachelor's degree or higher.
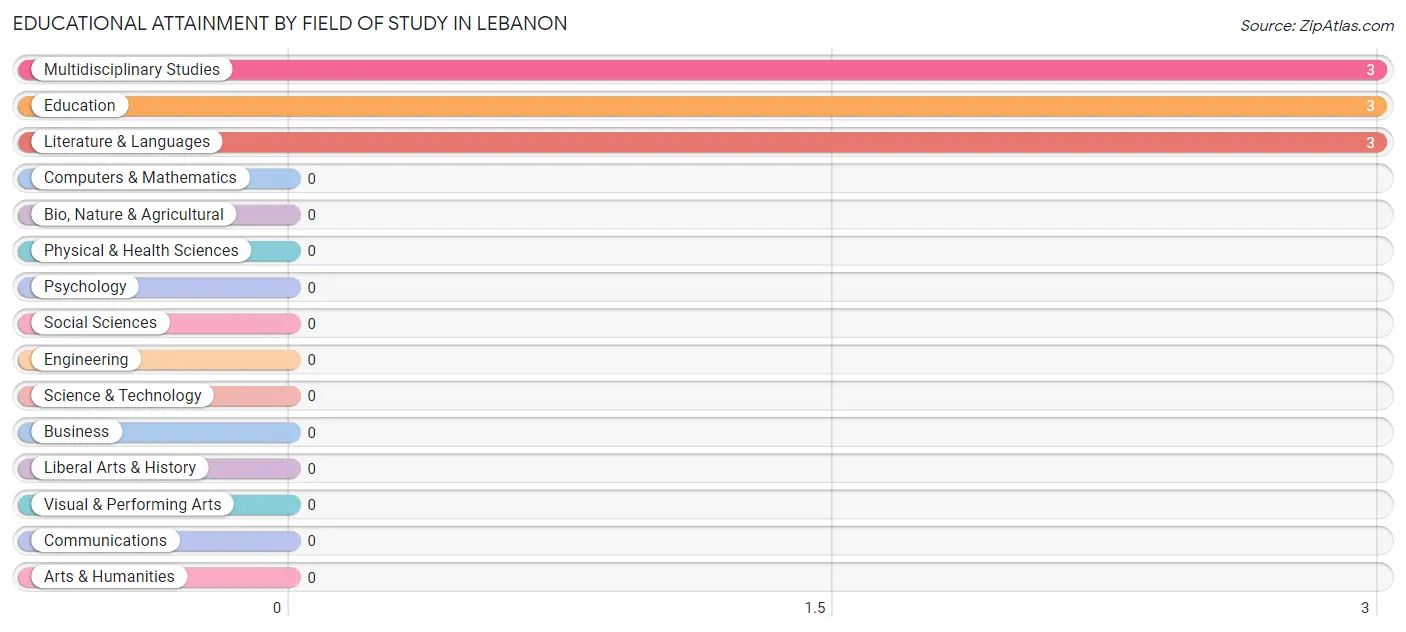
| Field of Study | # Graduates | % Graduates |
| Computers & Mathematics | 0 | 0.0% |
| Bio, Nature & Agricultural | 0 | 0.0% |
| Physical & Health Sciences | 0 | 0.0% |
| Psychology | 0 | 0.0% |
| Social Sciences | 0 | 0.0% |
| Engineering | 0 | 0.0% |
| Multidisciplinary Studies | 3 | 33.3% |
| Science & Technology | 0 | 0.0% |
| Business | 0 | 0.0% |
| Education | 3 | 33.3% |
| Literature & Languages | 3 | 33.3% |
| Liberal Arts & History | 0 | 0.0% |
| Visual & Performing Arts | 0 | 0.0% |
| Communications | 0 | 0.0% |
| Arts & Humanities | 0 | 0.0% |
| Total | 9 | 100.0% |
Transportation & Commute in Lebanon
Vehicle Availability by Sex in Lebanon
The most prevalent vehicle ownership categories in Lebanon are males with 3 vehicles (4, accounting for 36.4%) and females with 3 vehicles (3, making up 19.1%).
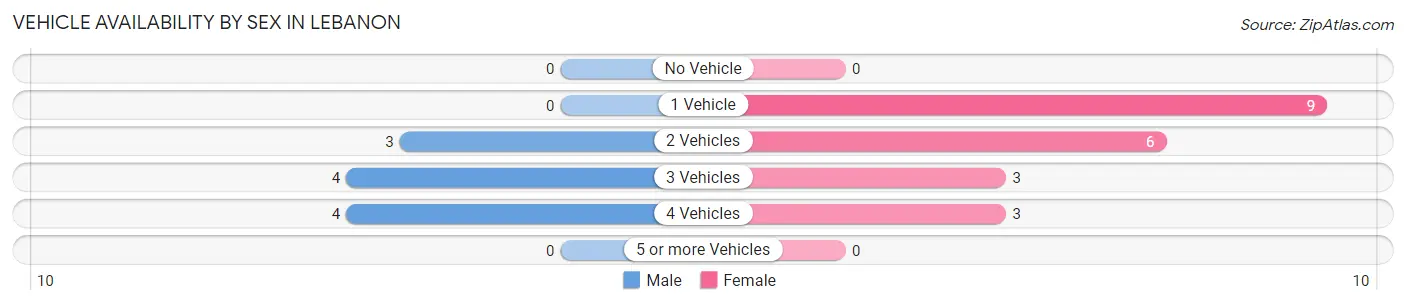
| Vehicles Available | Male | Female |
| No Vehicle | 0 (0.0%) | 0 (0.0%) |
| 1 Vehicle | 0 (0.0%) | 9 (42.9%) |
| 2 Vehicles | 3 (27.3%) | 6 (28.6%) |
| 3 Vehicles | 4 (36.4%) | 3 (14.3%) |
| 4 Vehicles | 4 (36.4%) | 3 (14.3%) |
| 5 or more Vehicles | 0 (0.0%) | 0 (0.0%) |
| Total | 11 (100.0%) | 21 (100.0%) |
Commute Time in Lebanon
The most frequently occuring commute durations in Lebanon are 60 to 89 minutes (8 commuters, 25.0%), 10 to 14 minutes (6 commuters, 18.8%), and 30 to 34 minutes (6 commuters, 18.8%).
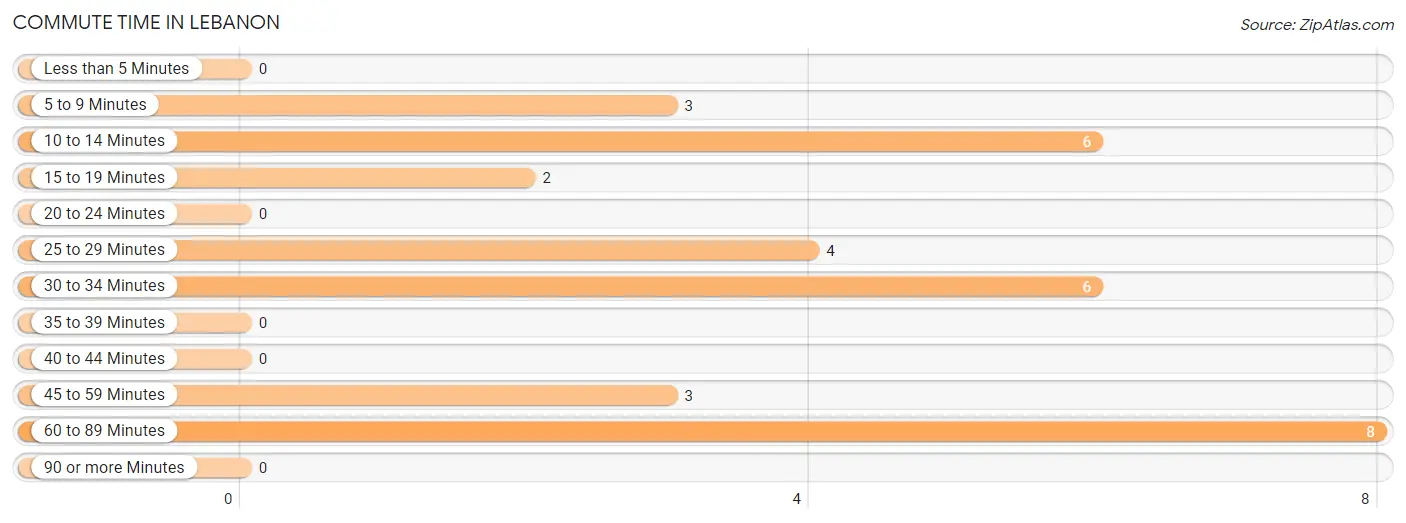
| Commute Time | # Commuters | % Commuters |
| Less than 5 Minutes | 0 | 0.0% |
| 5 to 9 Minutes | 3 | 9.4% |
| 10 to 14 Minutes | 6 | 18.8% |
| 15 to 19 Minutes | 2 | 6.2% |
| 20 to 24 Minutes | 0 | 0.0% |
| 25 to 29 Minutes | 4 | 12.5% |
| 30 to 34 Minutes | 6 | 18.8% |
| 35 to 39 Minutes | 0 | 0.0% |
| 40 to 44 Minutes | 0 | 0.0% |
| 45 to 59 Minutes | 3 | 9.4% |
| 60 to 89 Minutes | 8 | 25.0% |
| 90 or more Minutes | 0 | 0.0% |
Commute Time by Sex in Lebanon
The most common commute times in Lebanon are 60 to 89 minutes (8 commuters, 72.7%) for males and 10 to 14 minutes (6 commuters, 28.6%) for females.
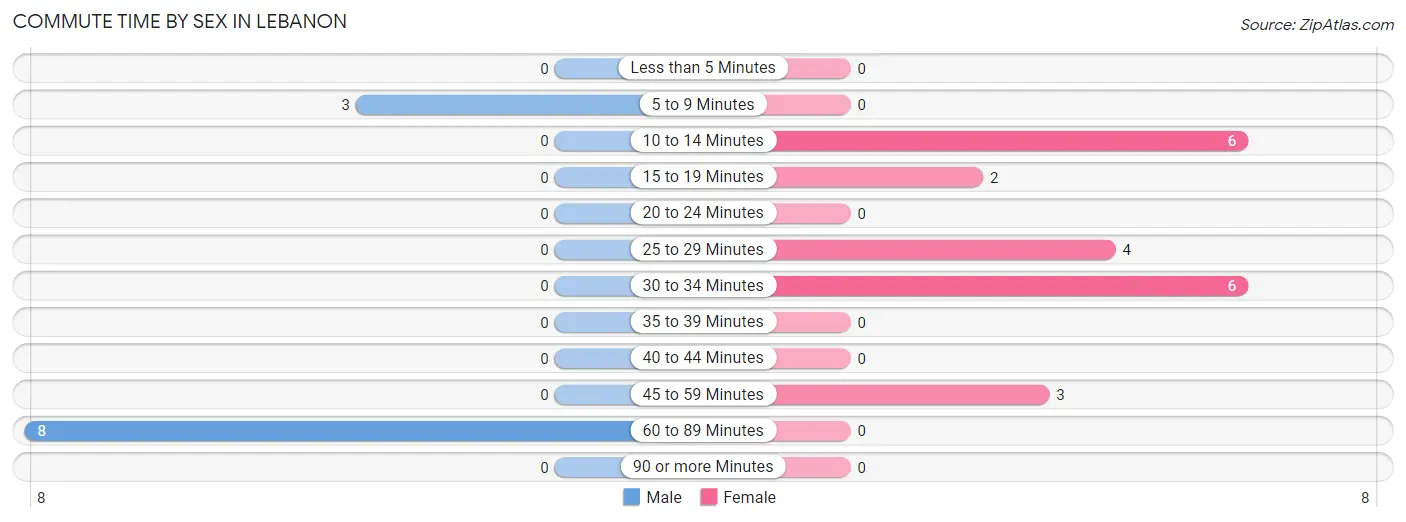
| Commute Time | Male | Female |
| Less than 5 Minutes | 0 (0.0%) | 0 (0.0%) |
| 5 to 9 Minutes | 3 (27.3%) | 0 (0.0%) |
| 10 to 14 Minutes | 0 (0.0%) | 6 (28.6%) |
| 15 to 19 Minutes | 0 (0.0%) | 2 (9.5%) |
| 20 to 24 Minutes | 0 (0.0%) | 0 (0.0%) |
| 25 to 29 Minutes | 0 (0.0%) | 4 (19.1%) |
| 30 to 34 Minutes | 0 (0.0%) | 6 (28.6%) |
| 35 to 39 Minutes | 0 (0.0%) | 0 (0.0%) |
| 40 to 44 Minutes | 0 (0.0%) | 0 (0.0%) |
| 45 to 59 Minutes | 0 (0.0%) | 3 (14.3%) |
| 60 to 89 Minutes | 8 (72.7%) | 0 (0.0%) |
| 90 or more Minutes | 0 (0.0%) | 0 (0.0%) |
Time of Departure to Work by Sex in Lebanon
The most frequent times of departure to work in Lebanon are 6:00 AM to 6:29 AM (8, 72.7%) for males and 6:00 AM to 6:29 AM (6, 28.6%) for females.
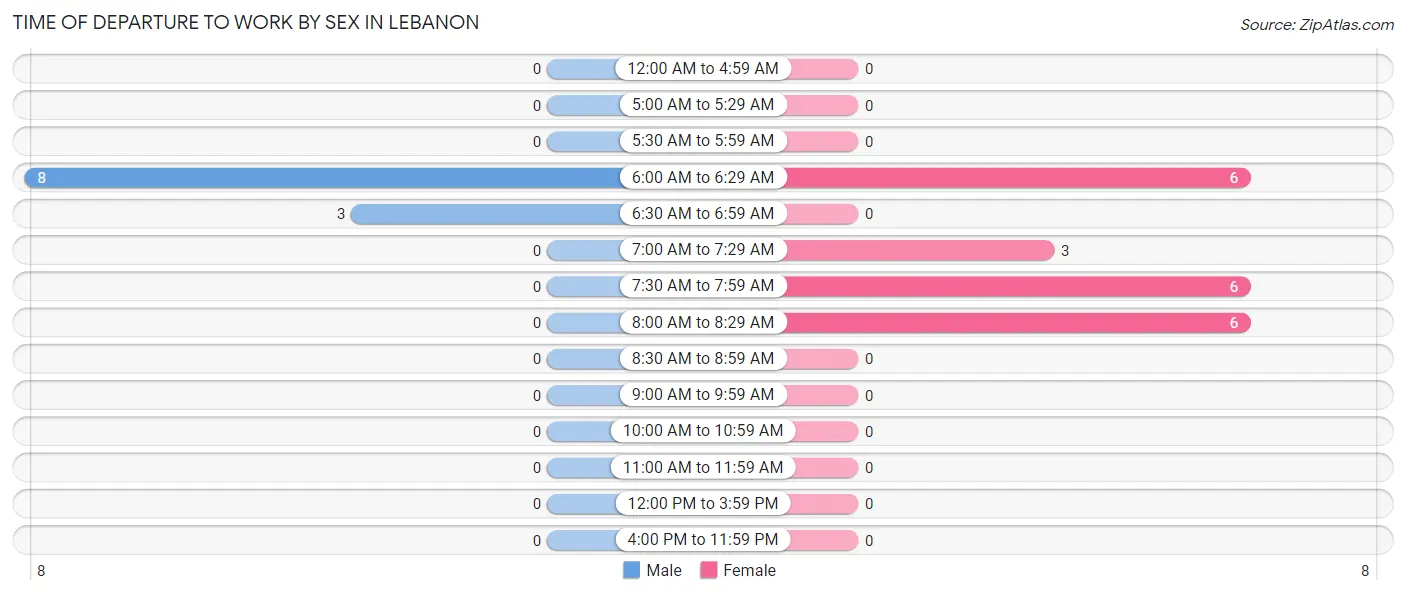
| Time of Departure | Male | Female |
| 12:00 AM to 4:59 AM | 0 (0.0%) | 0 (0.0%) |
| 5:00 AM to 5:29 AM | 0 (0.0%) | 0 (0.0%) |
| 5:30 AM to 5:59 AM | 0 (0.0%) | 0 (0.0%) |
| 6:00 AM to 6:29 AM | 8 (72.7%) | 6 (28.6%) |
| 6:30 AM to 6:59 AM | 3 (27.3%) | 0 (0.0%) |
| 7:00 AM to 7:29 AM | 0 (0.0%) | 3 (14.3%) |
| 7:30 AM to 7:59 AM | 0 (0.0%) | 6 (28.6%) |
| 8:00 AM to 8:29 AM | 0 (0.0%) | 6 (28.6%) |
| 8:30 AM to 8:59 AM | 0 (0.0%) | 0 (0.0%) |
| 9:00 AM to 9:59 AM | 0 (0.0%) | 0 (0.0%) |
| 10:00 AM to 10:59 AM | 0 (0.0%) | 0 (0.0%) |
| 11:00 AM to 11:59 AM | 0 (0.0%) | 0 (0.0%) |
| 12:00 PM to 3:59 PM | 0 (0.0%) | 0 (0.0%) |
| 4:00 PM to 11:59 PM | 0 (0.0%) | 0 (0.0%) |
| Total | 11 (100.0%) | 21 (100.0%) |
Housing Occupancy in Lebanon
Occupancy by Ownership in Lebanon
Of the total 59 dwellings in Lebanon, owner-occupied units account for 50 (84.8%), while renter-occupied units make up 9 (15.2%).
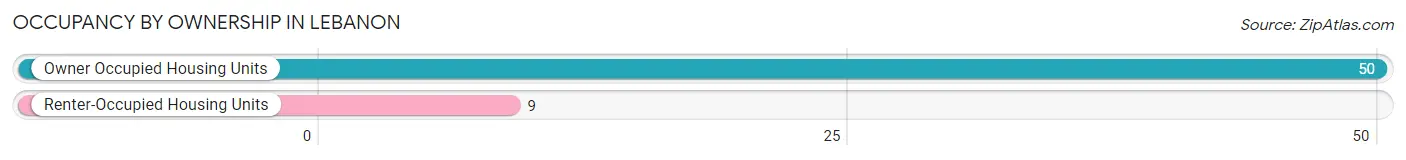
| Occupancy | # Housing Units | % Housing Units |
| Owner Occupied Housing Units | 50 | 84.8% |
| Renter-Occupied Housing Units | 9 | 15.2% |
| Total Occupied Housing Units | 59 | 100.0% |
Occupancy by Household Size in Lebanon
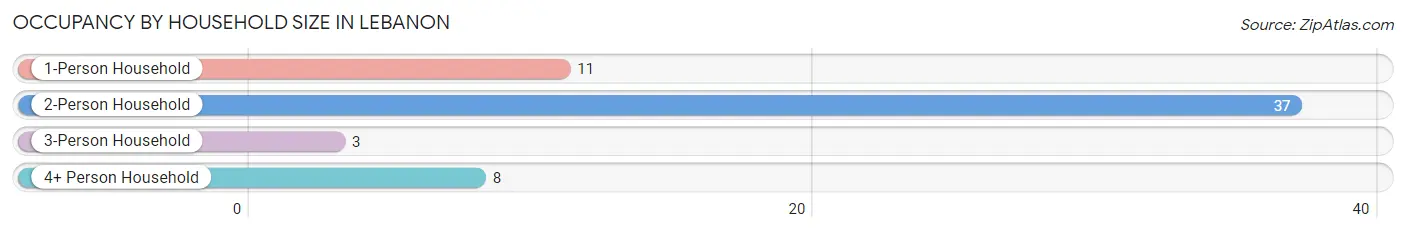
| Household Size | # Housing Units | % Housing Units |
| 1-Person Household | 11 | 18.6% |
| 2-Person Household | 37 | 62.7% |
| 3-Person Household | 3 | 5.1% |
| 4+ Person Household | 8 | 13.6% |
| Total Housing Units | 59 | 100.0% |
Occupancy by Ownership by Household Size in Lebanon
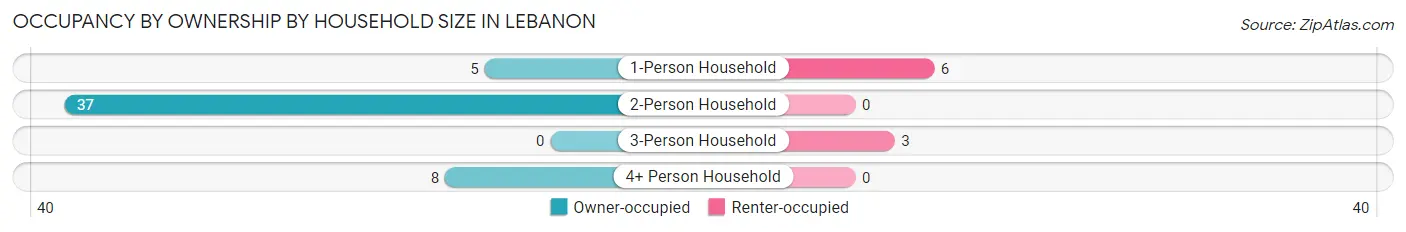
| Household Size | Owner-occupied | Renter-occupied |
| 1-Person Household | 5 (45.5%) | 6 (54.5%) |
| 2-Person Household | 37 (100.0%) | 0 (0.0%) |
| 3-Person Household | 0 (0.0%) | 3 (100.0%) |
| 4+ Person Household | 8 (100.0%) | 0 (0.0%) |
| Total Housing Units | 50 (84.8%) | 9 (15.2%) |
Occupancy by Educational Attainment in Lebanon
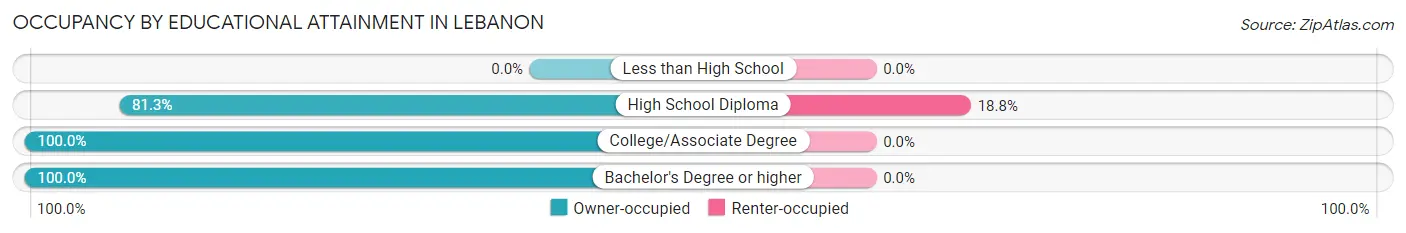
| Household Size | Owner-occupied | Renter-occupied |
| Less than High School | 0 (0.0%) | 0 (0.0%) |
| High School Diploma | 39 (81.2%) | 9 (18.8%) |
| College/Associate Degree | 8 (100.0%) | 0 (0.0%) |
| Bachelor's Degree or higher | 3 (100.0%) | 0 (0.0%) |
Occupancy by Age of Householder in Lebanon
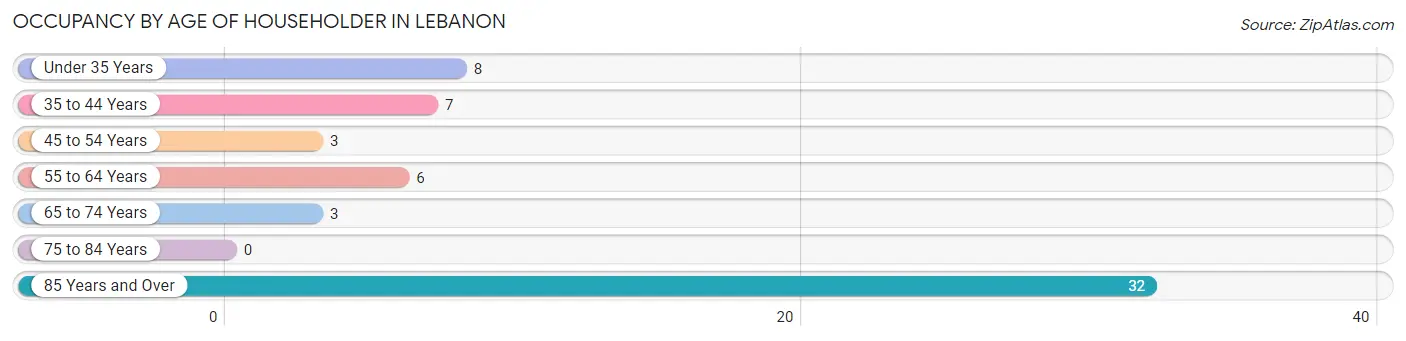
| Age Bracket | # Households | % Households |
| Under 35 Years | 8 | 13.6% |
| 35 to 44 Years | 7 | 11.9% |
| 45 to 54 Years | 3 | 5.1% |
| 55 to 64 Years | 6 | 10.2% |
| 65 to 74 Years | 3 | 5.1% |
| 75 to 84 Years | 0 | 0.0% |
| 85 Years and Over | 32 | 54.2% |
| Total | 59 | 100.0% |
Housing Finances in Lebanon
Median Income by Occupancy in Lebanon
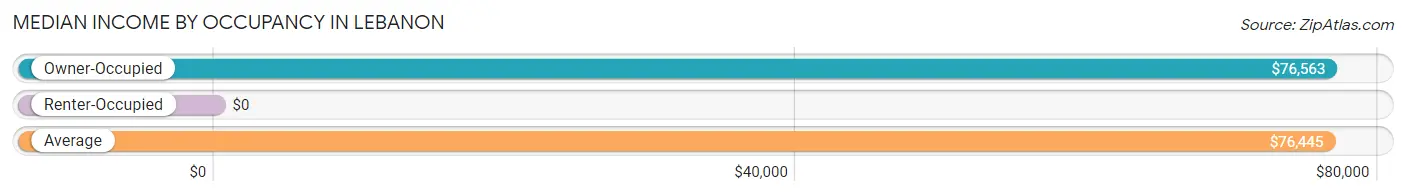
| Occupancy Type | # Households | Median Income |
| Owner-Occupied | 50 (84.8%) | $76,563 |
| Renter-Occupied | 9 (15.2%) | $0 |
| Average | 59 (100.0%) | $76,445 |
Occupancy by Householder Income Bracket in Lebanon
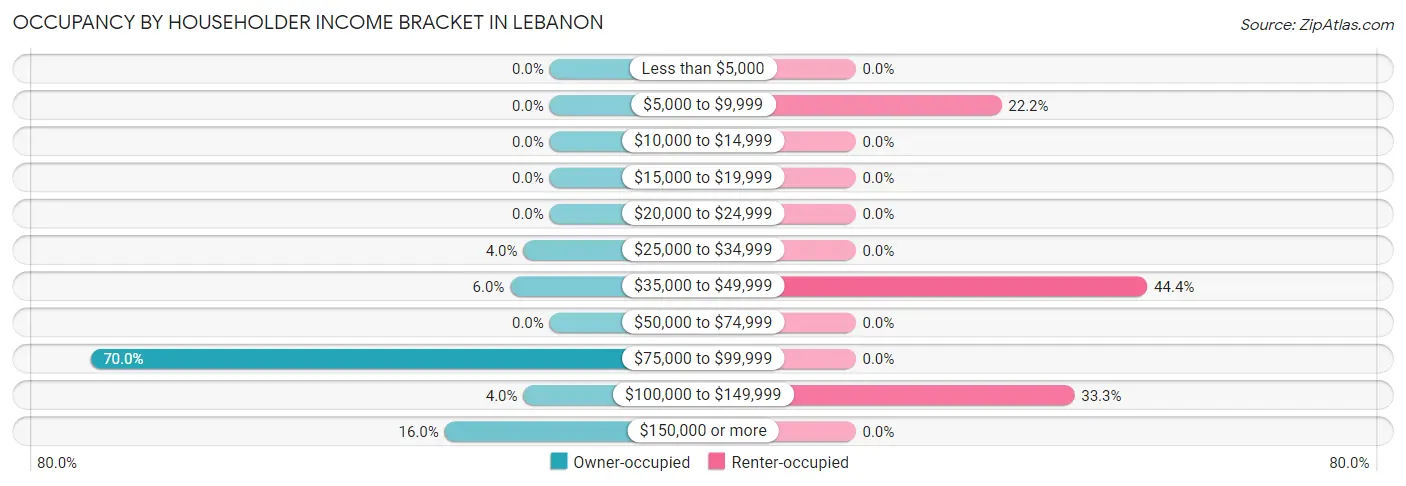
| Income Bracket | Owner-occupied | Renter-occupied |
| Less than $5,000 | 0 (0.0%) | 0 (0.0%) |
| $5,000 to $9,999 | 0 (0.0%) | 2 (22.2%) |
| $10,000 to $14,999 | 0 (0.0%) | 0 (0.0%) |
| $15,000 to $19,999 | 0 (0.0%) | 0 (0.0%) |
| $20,000 to $24,999 | 0 (0.0%) | 0 (0.0%) |
| $25,000 to $34,999 | 2 (4.0%) | 0 (0.0%) |
| $35,000 to $49,999 | 3 (6.0%) | 4 (44.4%) |
| $50,000 to $74,999 | 0 (0.0%) | 0 (0.0%) |
| $75,000 to $99,999 | 35 (70.0%) | 0 (0.0%) |
| $100,000 to $149,999 | 2 (4.0%) | 3 (33.3%) |
| $150,000 or more | 8 (16.0%) | 0 (0.0%) |
| Total | 50 (100.0%) | 9 (100.0%) |
Monthly Housing Cost Tiers in Lebanon
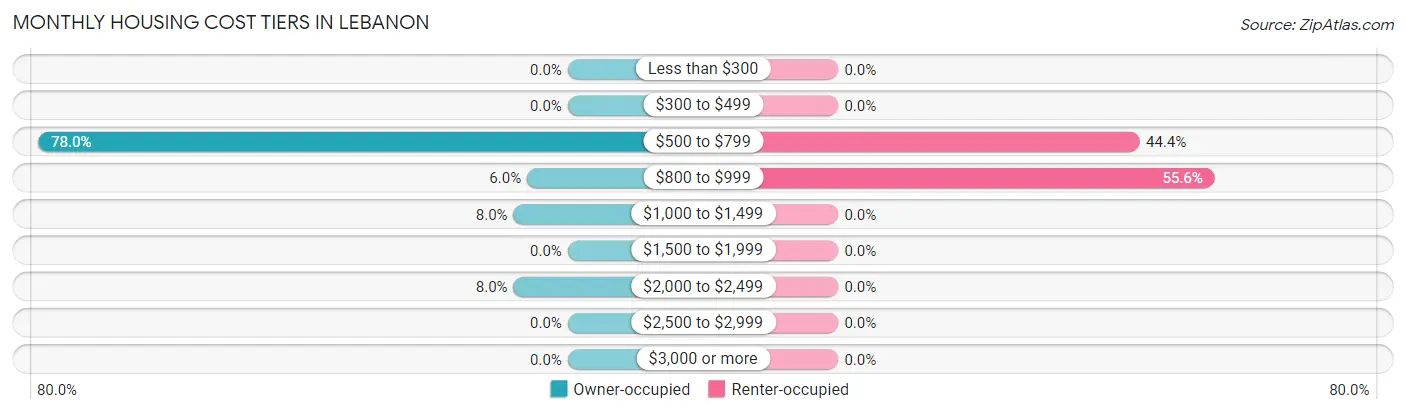
| Monthly Cost | Owner-occupied | Renter-occupied |
| Less than $300 | 0 (0.0%) | 0 (0.0%) |
| $300 to $499 | 0 (0.0%) | 0 (0.0%) |
| $500 to $799 | 39 (78.0%) | 4 (44.4%) |
| $800 to $999 | 3 (6.0%) | 5 (55.6%) |
| $1,000 to $1,499 | 4 (8.0%) | 0 (0.0%) |
| $1,500 to $1,999 | 0 (0.0%) | 0 (0.0%) |
| $2,000 to $2,499 | 4 (8.0%) | 0 (0.0%) |
| $2,500 to $2,999 | 0 (0.0%) | 0 (0.0%) |
| $3,000 or more | 0 (0.0%) | 0 (0.0%) |
| Total | 50 (100.0%) | 9 (100.0%) |
Physical Housing Characteristics in Lebanon
Housing Structures in Lebanon
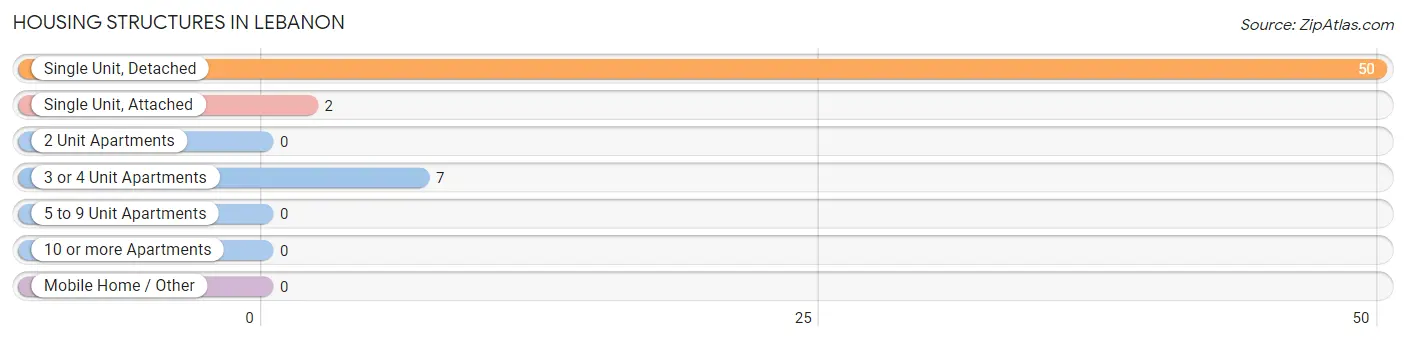
| Structure Type | # Housing Units | % Housing Units |
| Single Unit, Detached | 50 | 84.8% |
| Single Unit, Attached | 2 | 3.4% |
| 2 Unit Apartments | 0 | 0.0% |
| 3 or 4 Unit Apartments | 7 | 11.9% |
| 5 to 9 Unit Apartments | 0 | 0.0% |
| 10 or more Apartments | 0 | 0.0% |
| Mobile Home / Other | 0 | 0.0% |
| Total | 59 | 100.0% |
Housing Structures by Occupancy in Lebanon
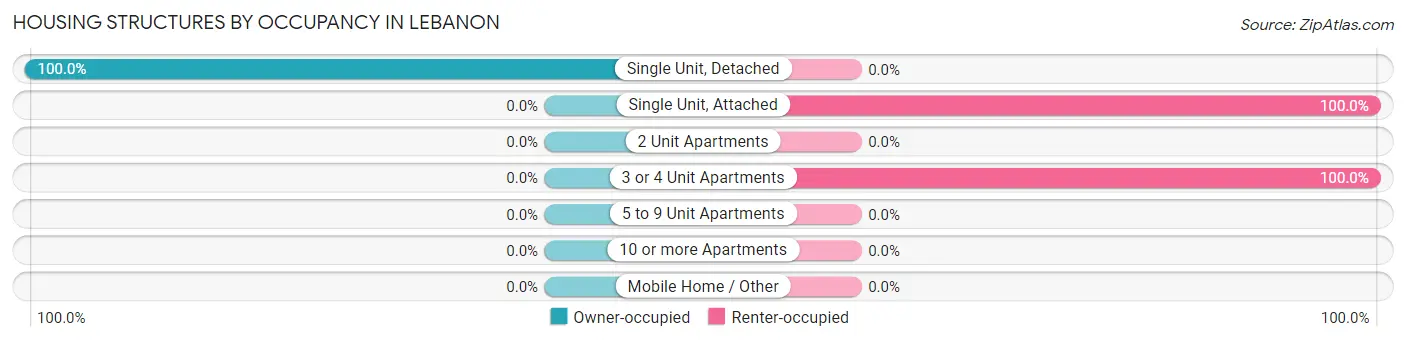
| Structure Type | Owner-occupied | Renter-occupied |
| Single Unit, Detached | 50 (100.0%) | 0 (0.0%) |
| Single Unit, Attached | 0 (0.0%) | 2 (100.0%) |
| 2 Unit Apartments | 0 (0.0%) | 0 (0.0%) |
| 3 or 4 Unit Apartments | 0 (0.0%) | 7 (100.0%) |
| 5 to 9 Unit Apartments | 0 (0.0%) | 0 (0.0%) |
| 10 or more Apartments | 0 (0.0%) | 0 (0.0%) |
| Mobile Home / Other | 0 (0.0%) | 0 (0.0%) |
| Total | 50 (84.8%) | 9 (15.2%) |
Housing Structures by Number of Rooms in Lebanon
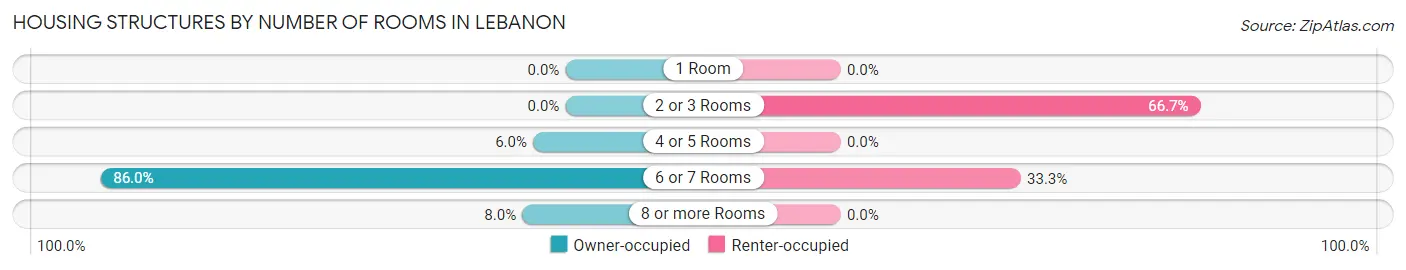
| Number of Rooms | Owner-occupied | Renter-occupied |
| 1 Room | 0 (0.0%) | 0 (0.0%) |
| 2 or 3 Rooms | 0 (0.0%) | 6 (66.7%) |
| 4 or 5 Rooms | 3 (6.0%) | 0 (0.0%) |
| 6 or 7 Rooms | 43 (86.0%) | 3 (33.3%) |
| 8 or more Rooms | 4 (8.0%) | 0 (0.0%) |
| Total | 50 (100.0%) | 9 (100.0%) |
Housing Structure by Heating Type in Lebanon
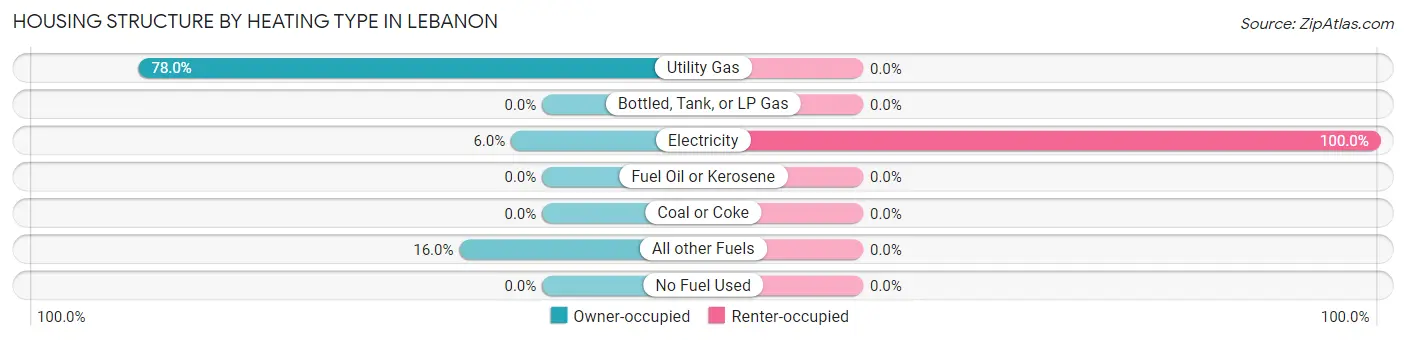
| Heating Type | Owner-occupied | Renter-occupied |
| Utility Gas | 39 (78.0%) | 0 (0.0%) |
| Bottled, Tank, or LP Gas | 0 (0.0%) | 0 (0.0%) |
| Electricity | 3 (6.0%) | 9 (100.0%) |
| Fuel Oil or Kerosene | 0 (0.0%) | 0 (0.0%) |
| Coal or Coke | 0 (0.0%) | 0 (0.0%) |
| All other Fuels | 8 (16.0%) | 0 (0.0%) |
| No Fuel Used | 0 (0.0%) | 0 (0.0%) |
| Total | 50 (100.0%) | 9 (100.0%) |
Household Vehicle Usage in Lebanon
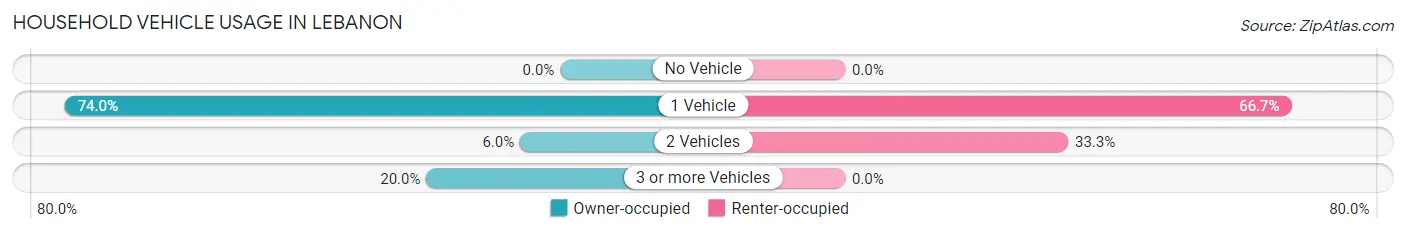
| Vehicles per Household | Owner-occupied | Renter-occupied |
| No Vehicle | 0 (0.0%) | 0 (0.0%) |
| 1 Vehicle | 37 (74.0%) | 6 (66.7%) |
| 2 Vehicles | 3 (6.0%) | 3 (33.3%) |
| 3 or more Vehicles | 10 (20.0%) | 0 (0.0%) |
| Total | 50 (100.0%) | 9 (100.0%) |
Real Estate & Mortgages in Lebanon
Real Estate and Mortgage Overview in Lebanon
| Characteristic | Without Mortgage | With Mortgage |
| Housing Units | 40 | 10 |
| Median Property Value | $224,300 | $275,000 |
| Median Household Income | $76,328 | $8 |
| Monthly Housing Costs | $751 | $0 |
| Real Estate Taxes | $3,541 | $0 |
Property Value by Mortgage Status in Lebanon
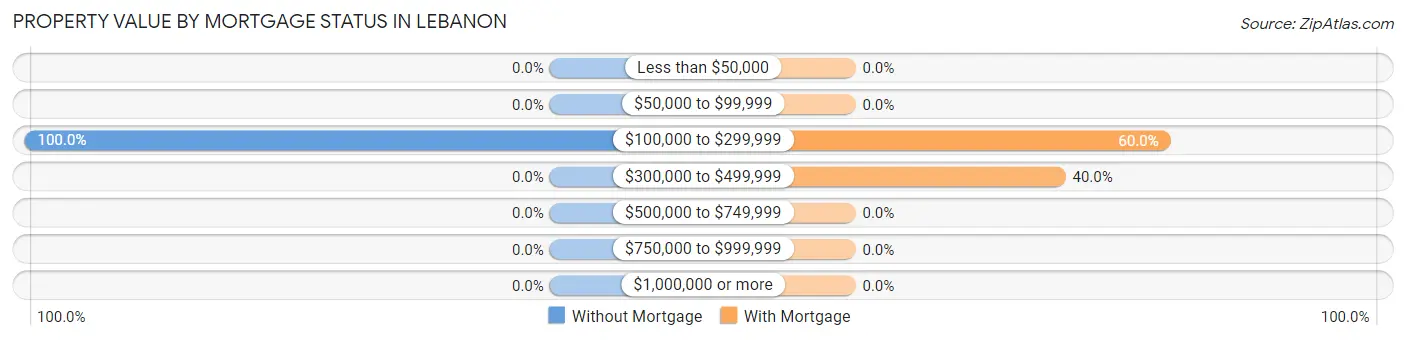
| Property Value | Without Mortgage | With Mortgage |
| Less than $50,000 | 0 (0.0%) | 0 (0.0%) |
| $50,000 to $99,999 | 0 (0.0%) | 0 (0.0%) |
| $100,000 to $299,999 | 40 (100.0%) | 6 (60.0%) |
| $300,000 to $499,999 | 0 (0.0%) | 4 (40.0%) |
| $500,000 to $749,999 | 0 (0.0%) | 0 (0.0%) |
| $750,000 to $999,999 | 0 (0.0%) | 0 (0.0%) |
| $1,000,000 or more | 0 (0.0%) | 0 (0.0%) |
| Total | 40 (100.0%) | 10 (100.0%) |
Household Income by Mortgage Status in Lebanon
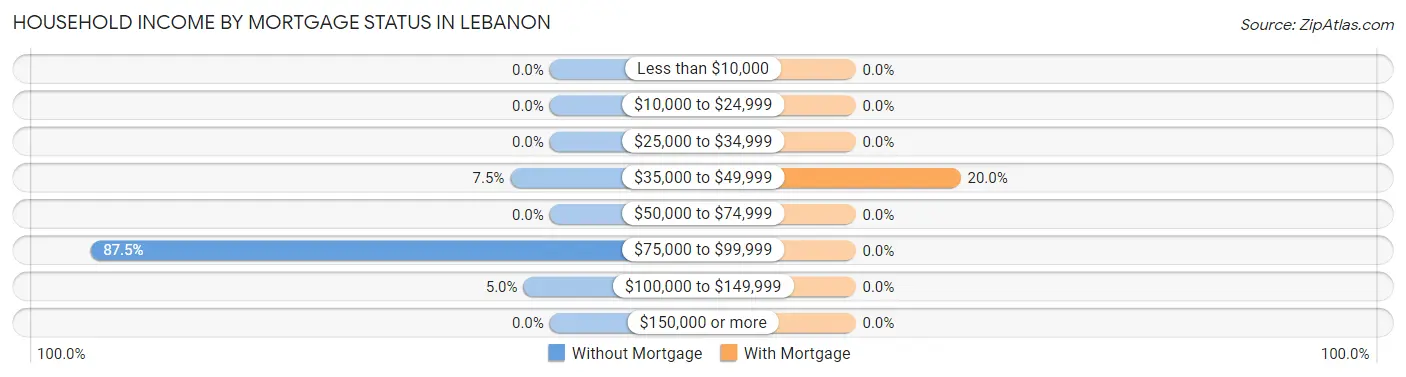
| Household Income | Without Mortgage | With Mortgage |
| Less than $10,000 | 0 (0.0%) | 0 (0.0%) |
| $10,000 to $24,999 | 0 (0.0%) | 0 (0.0%) |
| $25,000 to $34,999 | 0 (0.0%) | 0 (0.0%) |
| $35,000 to $49,999 | 3 (7.5%) | 2 (20.0%) |
| $50,000 to $74,999 | 0 (0.0%) | 0 (0.0%) |
| $75,000 to $99,999 | 35 (87.5%) | 0 (0.0%) |
| $100,000 to $149,999 | 2 (5.0%) | 0 (0.0%) |
| $150,000 or more | 0 (0.0%) | 0 (0.0%) |
| Total | 40 (100.0%) | 10 (100.0%) |
Property Value to Household Income Ratio in Lebanon
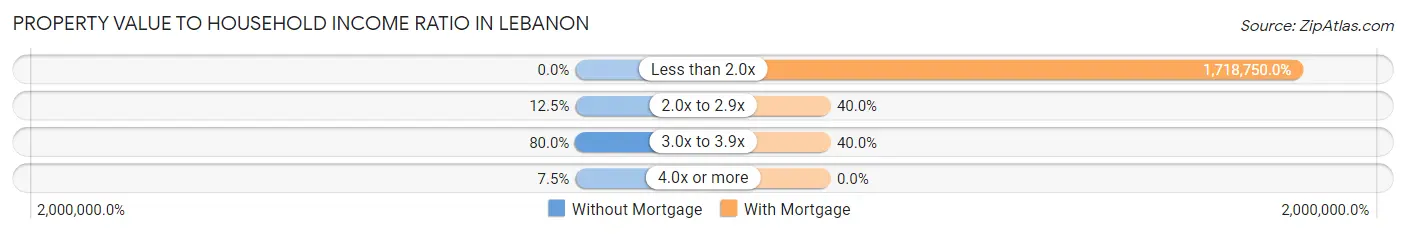
| Value-to-Income Ratio | Without Mortgage | With Mortgage |
| Less than 2.0x | 0 (0.0%) | 171,875 (1,718,750.0%) |
| 2.0x to 2.9x | 5 (12.5%) | 4 (40.0%) |
| 3.0x to 3.9x | 32 (80.0%) | 4 (40.0%) |
| 4.0x or more | 3 (7.5%) | 0 (0.0%) |
| Total | 40 (100.0%) | 10 (100.0%) |
Real Estate Taxes by Mortgage Status in Lebanon
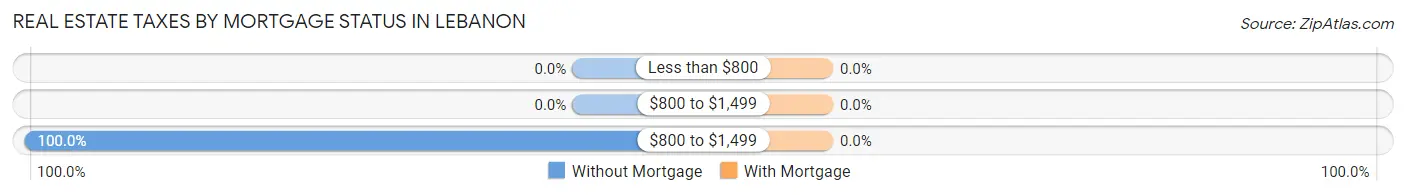
| Property Taxes | Without Mortgage | With Mortgage |
| Less than $800 | 0 (0.0%) | 0 (0.0%) |
| $800 to $1,499 | 0 (0.0%) | 0 (0.0%) |
| $800 to $1,499 | 40 (100.0%) | 0 (0.0%) |
| Total | 40 (100.0%) | 10 (100.0%) |
Health & Disability in Lebanon
Health Insurance Coverage by Age in Lebanon
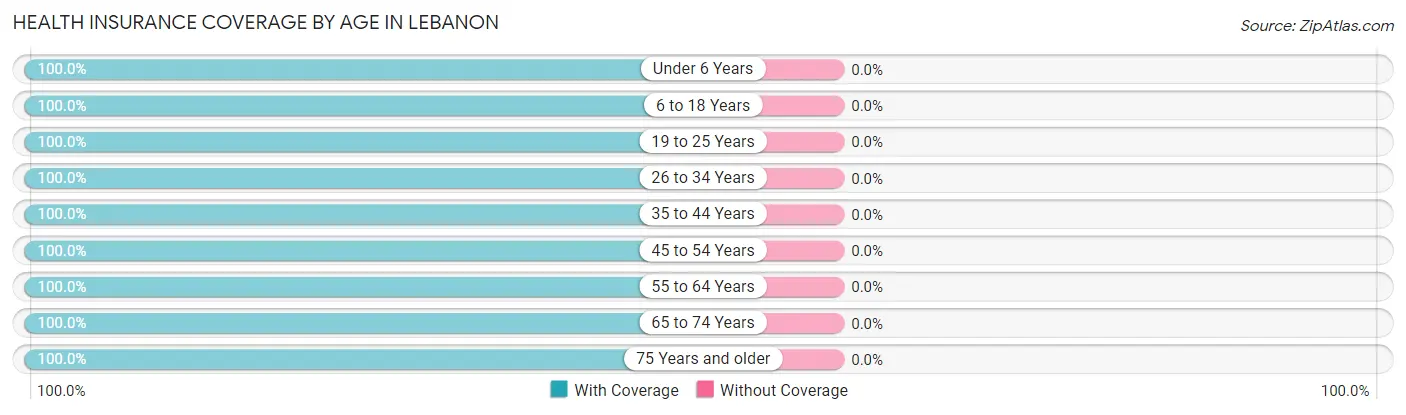
| Age Bracket | With Coverage | Without Coverage |
| Under 6 Years | 12 (100.0%) | 0 (0.0%) |
| 6 to 18 Years | 10 (100.0%) | 0 (0.0%) |
| 19 to 25 Years | 4 (100.0%) | 0 (0.0%) |
| 26 to 34 Years | 7 (100.0%) | 0 (0.0%) |
| 35 to 44 Years | 10 (100.0%) | 0 (0.0%) |
| 45 to 54 Years | 6 (100.0%) | 0 (0.0%) |
| 55 to 64 Years | 8 (100.0%) | 0 (0.0%) |
| 65 to 74 Years | 6 (100.0%) | 0 (0.0%) |
| 75 Years and older | 71 (100.0%) | 0 (0.0%) |
| Total | 134 (100.0%) | 0 (0.0%) |
Health Insurance Coverage by Citizenship Status in Lebanon
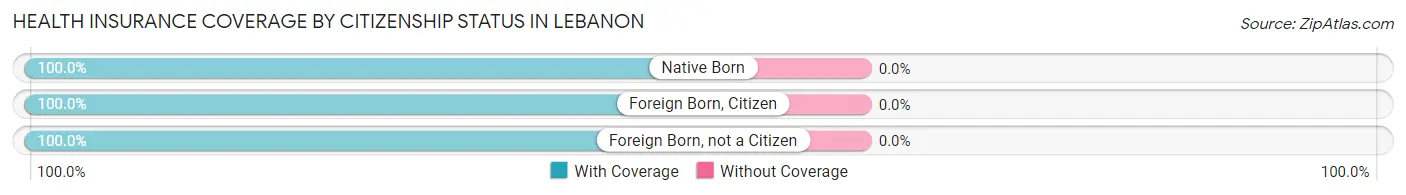
| Citizenship Status | With Coverage | Without Coverage |
| Native Born | 12 (100.0%) | 0 (0.0%) |
| Foreign Born, Citizen | 10 (100.0%) | 0 (0.0%) |
| Foreign Born, not a Citizen | 4 (100.0%) | 0 (0.0%) |
Health Insurance Coverage by Household Income in Lebanon
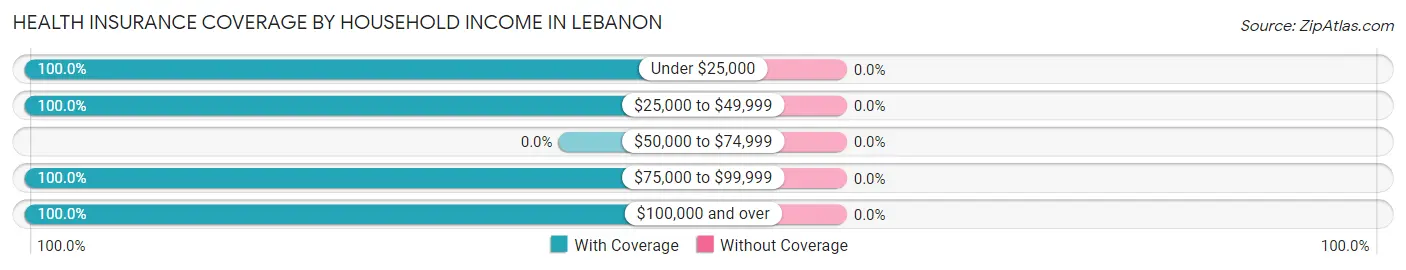
| Household Income | With Coverage | Without Coverage |
| Under $25,000 | 2 (100.0%) | 0 (0.0%) |
| $25,000 to $49,999 | 9 (100.0%) | 0 (0.0%) |
| $50,000 to $74,999 | 0 (0.0%) | 0 (0.0%) |
| $75,000 to $99,999 | 77 (100.0%) | 0 (0.0%) |
| $100,000 and over | 46 (100.0%) | 0 (0.0%) |
Public vs Private Health Insurance Coverage by Age in Lebanon
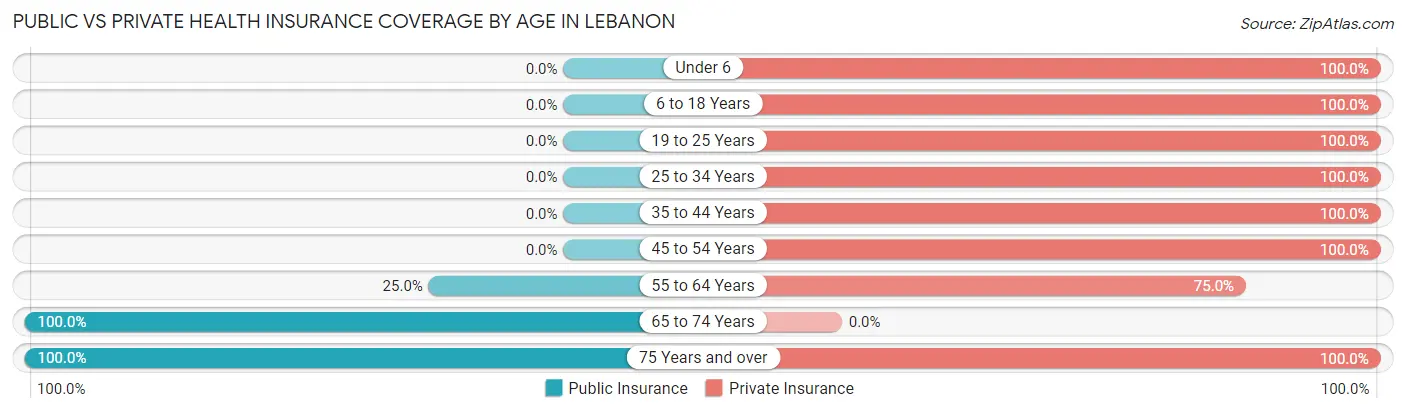
| Age Bracket | Public Insurance | Private Insurance |
| Under 6 | 0 (0.0%) | 12 (100.0%) |
| 6 to 18 Years | 0 (0.0%) | 10 (100.0%) |
| 19 to 25 Years | 0 (0.0%) | 4 (100.0%) |
| 25 to 34 Years | 0 (0.0%) | 7 (100.0%) |
| 35 to 44 Years | 0 (0.0%) | 10 (100.0%) |
| 45 to 54 Years | 0 (0.0%) | 6 (100.0%) |
| 55 to 64 Years | 2 (25.0%) | 6 (75.0%) |
| 65 to 74 Years | 6 (100.0%) | 0 (0.0%) |
| 75 Years and over | 71 (100.0%) | 71 (100.0%) |
| Total | 79 (59.0%) | 126 (94.0%) |
Disability Status by Sex by Age in Lebanon
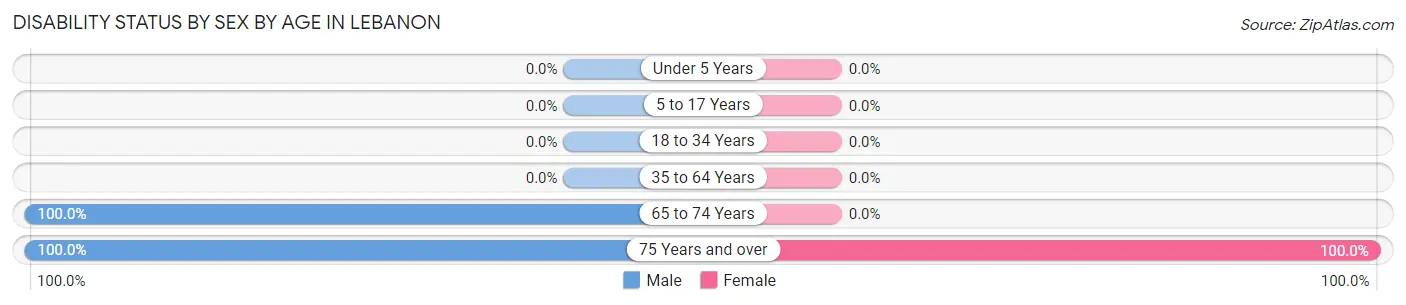
| Age Bracket | Male | Female |
| Under 5 Years | 0 (0.0%) | 0 (0.0%) |
| 5 to 17 Years | 0 (0.0%) | 0 (0.0%) |
| 18 to 34 Years | 0 (0.0%) | 0 (0.0%) |
| 35 to 64 Years | 0 (0.0%) | 0 (0.0%) |
| 65 to 74 Years | 3 (100.0%) | 0 (0.0%) |
| 75 Years and over | 32 (100.0%) | 39 (100.0%) |
Disability Class by Sex by Age in Lebanon
Disability Class: Hearing Difficulty
| Age Bracket | Male | Female |
| Under 5 Years | 0 (0.0%) | 0 (0.0%) |
| 5 to 17 Years | 0 (0.0%) | 0 (0.0%) |
| 18 to 34 Years | 0 (0.0%) | 0 (0.0%) |
| 35 to 64 Years | 0 (0.0%) | 0 (0.0%) |
| 65 to 74 Years | 0 (0.0%) | 0 (0.0%) |
| 75 Years and over | 0 (0.0%) | 0 (0.0%) |
Disability Class: Vision Difficulty
| Age Bracket | Male | Female |
| Under 5 Years | 0 (0.0%) | 0 (0.0%) |
| 5 to 17 Years | 0 (0.0%) | 0 (0.0%) |
| 18 to 34 Years | 0 (0.0%) | 0 (0.0%) |
| 35 to 64 Years | 0 (0.0%) | 0 (0.0%) |
| 65 to 74 Years | 0 (0.0%) | 0 (0.0%) |
| 75 Years and over | 0 (0.0%) | 0 (0.0%) |
Disability Class: Cognitive Difficulty
| Age Bracket | Male | Female |
| 5 to 17 Years | 0 (0.0%) | 0 (0.0%) |
| 18 to 34 Years | 0 (0.0%) | 0 (0.0%) |
| 35 to 64 Years | 0 (0.0%) | 0 (0.0%) |
| 65 to 74 Years | 0 (0.0%) | 0 (0.0%) |
| 75 Years and over | 0 (0.0%) | 0 (0.0%) |
Disability Class: Ambulatory Difficulty
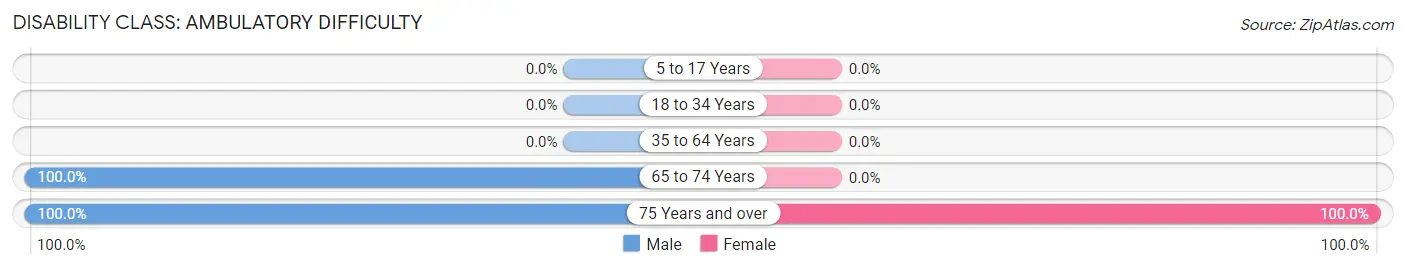
| Age Bracket | Male | Female |
| 5 to 17 Years | 0 (0.0%) | 0 (0.0%) |
| 18 to 34 Years | 0 (0.0%) | 0 (0.0%) |
| 35 to 64 Years | 0 (0.0%) | 0 (0.0%) |
| 65 to 74 Years | 3 (100.0%) | 0 (0.0%) |
| 75 Years and over | 32 (100.0%) | 39 (100.0%) |
Disability Class: Self-Care Difficulty
| Age Bracket | Male | Female |
| 5 to 17 Years | 0 (0.0%) | 0 (0.0%) |
| 18 to 34 Years | 0 (0.0%) | 0 (0.0%) |
| 35 to 64 Years | 0 (0.0%) | 0 (0.0%) |
| 65 to 74 Years | 0 (0.0%) | 0 (0.0%) |
| 75 Years and over | 0 (0.0%) | 0 (0.0%) |
Technology Access in Lebanon
Computing Device Access in Lebanon
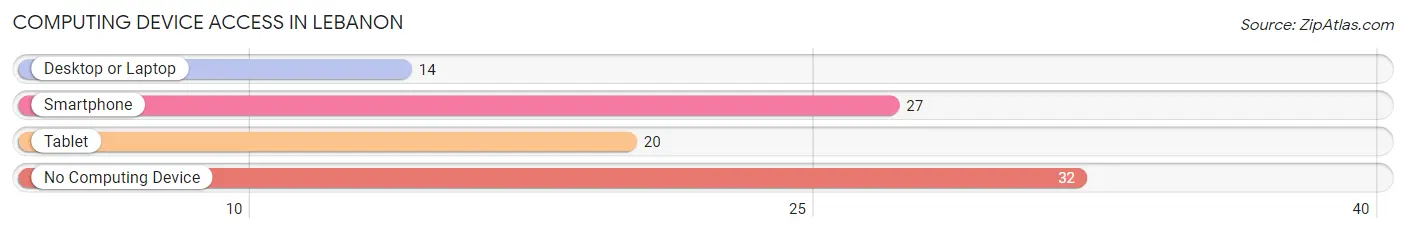
| Device Type | # Households | % Households |
| Desktop or Laptop | 14 | 23.7% |
| Smartphone | 27 | 45.8% |
| Tablet | 20 | 33.9% |
| No Computing Device | 32 | 54.2% |
| Total | 59 | 100.0% |
Internet Access in Lebanon
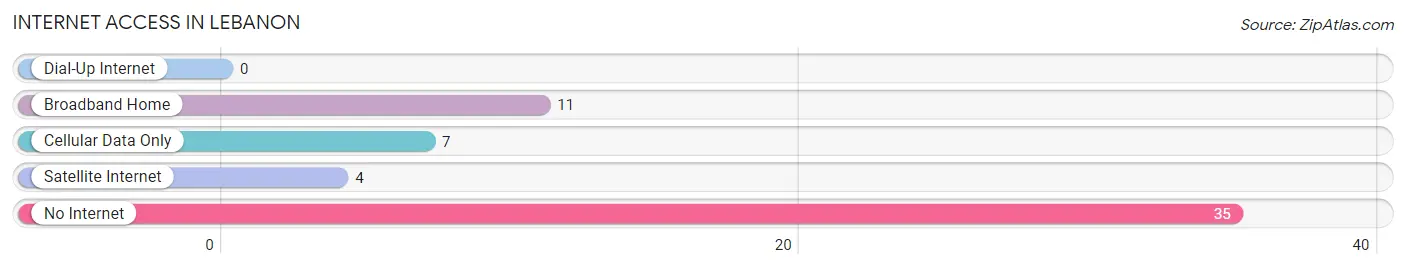
| Internet Type | # Households | % Households |
| Dial-Up Internet | 0 | 0.0% |
| Broadband Home | 11 | 18.6% |
| Cellular Data Only | 7 | 11.9% |
| Satellite Internet | 4 | 6.8% |
| No Internet | 35 | 59.3% |
| Total | 59 | 100.0% |
Lebanon Summary
Lebanon, Wisconsin is a small town located in Sheboygan County, Wisconsin. It is situated on the Sheboygan River, about 25 miles north of Milwaukee. The population of Lebanon was 1,845 in the 2010 census.
History
Lebanon was first settled in 1845 by a group of German immigrants. The town was originally called “New Lebanon” and was later shortened to just “Lebanon”. The town was officially incorporated in 1848.
The town was named after the biblical city of Lebanon, which was located in what is now modern-day Syria. The name was chosen by the town’s first settlers, who were of German descent and had a strong religious background.
The town grew slowly but steadily over the years, and by the early 1900s, it had become a thriving agricultural community. The town was home to several small businesses, including a cheese factory, a creamery, and a flour mill.
In the 1950s, the town began to experience a population boom as people moved to the area from other parts of the state. This growth continued into the 1960s and 1970s, and by the 1980s, the population had reached its peak of 2,000.
Geography
Lebanon is located in the southeastern corner of Sheboygan County, Wisconsin. It is situated on the Sheboygan River, about 25 miles north of Milwaukee. The town is bordered by the towns of Mosel to the north, Sheboygan Falls to the east, and Cascade to the south.
The town covers an area of 2.3 square miles, all of which is land. The terrain is mostly flat, with some rolling hills in the northern part of the town. The town is located in the Central Plain region of Wisconsin, which is characterized by flat, fertile farmland.
Economy
Lebanon’s economy is largely based on agriculture. The town is home to several small farms, which produce a variety of crops, including corn, soybeans, and wheat. The town is also home to several small businesses, including a cheese factory, a creamery, and a flour mill.
The town is also home to several manufacturing companies, including a plastics manufacturer and a metal fabrication company. The town is also home to a number of small retail stores, including a grocery store, a hardware store, and a few restaurants.
Demographics
As of the 2010 census, the population of Lebanon was 1,845. The racial makeup of the town was 97.3% White, 0.7% African American, 0.3% Native American, 0.2% Asian, 0.1% Pacific Islander, 0.3% from other races, and 1.2% from two or more races. Hispanic or Latino of any race were 1.2% of the population.
The median household income in Lebanon was $50,938, and the median family income was $60,000. The per capita income in the town was $22,845. About 5.3% of families and 7.2% of the population were below the poverty line, including 8.3% of those under age 18 and 5.2% of those age 65 or over.
Common Questions
What is Per Capita Income in Lebanon?
Per Capita income in Lebanon is $37,751.
What is the Median Family Income in Lebanon?
Median Family Income in Lebanon is $76,758.
What is the Median Household income in Lebanon?
Median Household Income in Lebanon is $76,445.
What is Income or Wage Gap in Lebanon?
Income or Wage Gap in Lebanon is 51.2%.
Women in Lebanon earn 48.8 cents for every dollar earned by a man.
What is Inequality or Gini Index in Lebanon?
Inequality or Gini Index in Lebanon is 0.24.
What is the Total Population of Lebanon?
Total Population of Lebanon is 134.
What is the Total Male Population of Lebanon?
Total Male Population of Lebanon is 72.
What is the Total Female Population of Lebanon?
Total Female Population of Lebanon is 62.
What is the Ratio of Males per 100 Females in Lebanon?
There are 116.13 Males per 100 Females in Lebanon.
What is the Ratio of Females per 100 Males in Lebanon?
There are 86.11 Females per 100 Males in Lebanon.
What is the Median Population Age in Lebanon?
Median Population Age in Lebanon is 91.1 Years.
What is the Average Family Size in Lebanon
Average Family Size in Lebanon is 2.6 People.
What is the Average Household Size in Lebanon
Average Household Size in Lebanon is 2.3 People.
How Large is the Labor Force in Lebanon?
There are 34 People in the Labor Forcein in Lebanon.
What is the Percentage of People in the Labor Force in Lebanon?
29.6% of People are in the Labor Force in Lebanon.
What is the Unemployment Rate in Lebanon?
Unemployment Rate in Lebanon is 5.9%.