Lancaster, WI Map & Demographics
Lancaster Map
Lancaster Overview
$34,851
PER CAPITA INCOME
$92,986
AVG FAMILY INCOME
$77,328
AVG HOUSEHOLD INCOME
15.6%
WAGE / INCOME GAP [ % ]
84.4¢/ $1
WAGE / INCOME GAP [ $ ]
0.35
INEQUALITY / GINI INDEX
3,917
TOTAL POPULATION
1,912
MALE POPULATION
2,005
FEMALE POPULATION
95.36
MALES / 100 FEMALES
104.86
FEMALES / 100 MALES
40.9
MEDIAN AGE
3.0
AVG FAMILY SIZE
2.5
AVG HOUSEHOLD SIZE
2,341
LABOR FORCE [ PEOPLE ]
70.6%
PERCENT IN LABOR FORCE
1.5%
UNEMPLOYMENT RATE
Lancaster Zip Codes
Lancaster Area Codes
Income in Lancaster
Income Overview in Lancaster
Per Capita Income in Lancaster is $34,851, while median incomes of families and households are $92,986 and $77,328 respectively.
| Characteristic | Number | Measure |
| Per Capita Income | 3,917 | $34,851 |
| Median Family Income | 1,051 | $92,986 |
| Mean Family Income | 1,051 | $101,332 |
| Median Household Income | 1,561 | $77,328 |
| Mean Household Income | 1,561 | $84,847 |
| Income Deficit | 1,051 | $0 |
| Wage / Income Gap (%) | 3,917 | 15.64% |
| Wage / Income Gap ($) | 3,917 | 84.36¢ per $1 |
| Gini / Inequality Index | 3,917 | 0.35 |
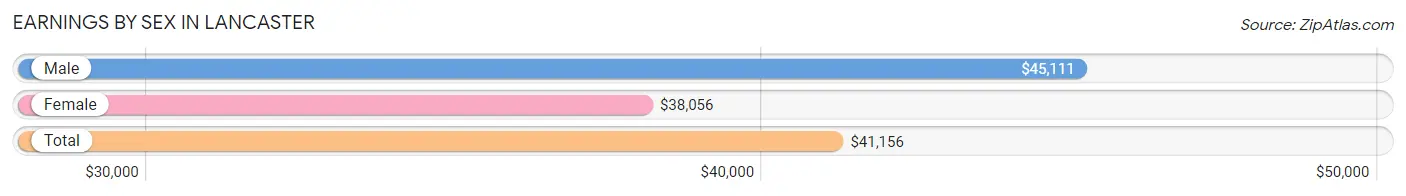
Earnings by Sex in Lancaster
Average Earnings in Lancaster are $41,156, $45,111 for men and $38,056 for women, a difference of 15.6%.
| Sex | Number | Average Earnings |
| Male | 1,268 (51.4%) | $45,111 |
| Female | 1,200 (48.6%) | $38,056 |
| Total | 2,468 (100.0%) | $41,156 |
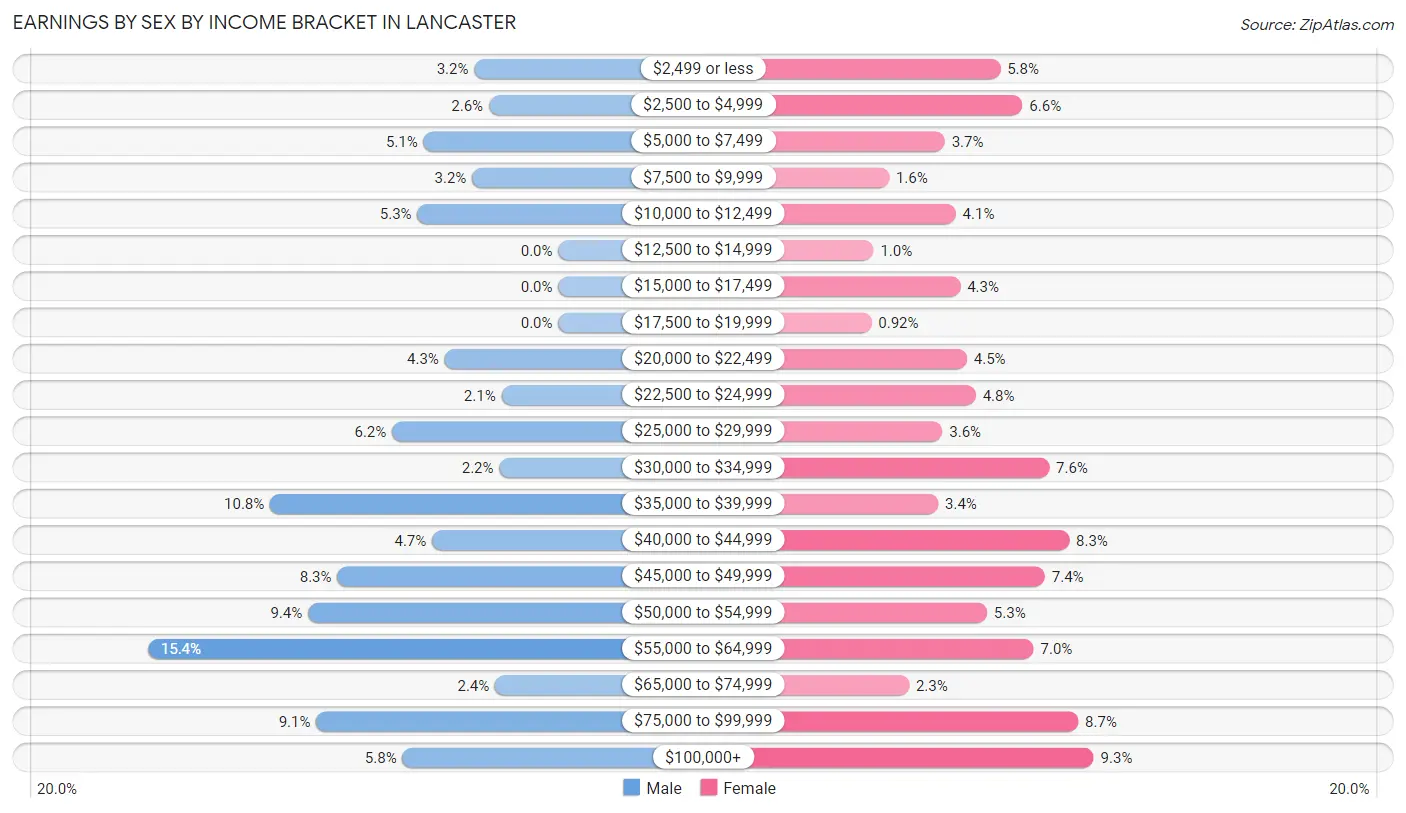
Earnings by Sex by Income Bracket in Lancaster
The most common earnings brackets in Lancaster are $55,000 to $64,999 for men (195 | 15.4%) and $100,000+ for women (111 | 9.2%).
| Income | Male | Female |
| $2,499 or less | 40 (3.2%) | 69 (5.8%) |
| $2,500 to $4,999 | 33 (2.6%) | 79 (6.6%) |
| $5,000 to $7,499 | 64 (5.1%) | 44 (3.7%) |
| $7,500 to $9,999 | 41 (3.2%) | 19 (1.6%) |
| $10,000 to $12,499 | 67 (5.3%) | 49 (4.1%) |
| $12,500 to $14,999 | 0 (0.0%) | 12 (1.0%) |
| $15,000 to $17,499 | 0 (0.0%) | 51 (4.3%) |
| $17,500 to $19,999 | 0 (0.0%) | 11 (0.9%) |
| $20,000 to $22,499 | 54 (4.3%) | 54 (4.5%) |
| $22,500 to $24,999 | 27 (2.1%) | 58 (4.8%) |
| $25,000 to $29,999 | 79 (6.2%) | 43 (3.6%) |
| $30,000 to $34,999 | 28 (2.2%) | 91 (7.6%) |
| $35,000 to $39,999 | 137 (10.8%) | 41 (3.4%) |
| $40,000 to $44,999 | 60 (4.7%) | 100 (8.3%) |
| $45,000 to $49,999 | 105 (8.3%) | 89 (7.4%) |
| $50,000 to $54,999 | 119 (9.4%) | 63 (5.2%) |
| $55,000 to $64,999 | 195 (15.4%) | 84 (7.0%) |
| $65,000 to $74,999 | 30 (2.4%) | 28 (2.3%) |
| $75,000 to $99,999 | 115 (9.1%) | 104 (8.7%) |
| $100,000+ | 74 (5.8%) | 111 (9.2%) |
| Total | 1,268 (100.0%) | 1,200 (100.0%) |
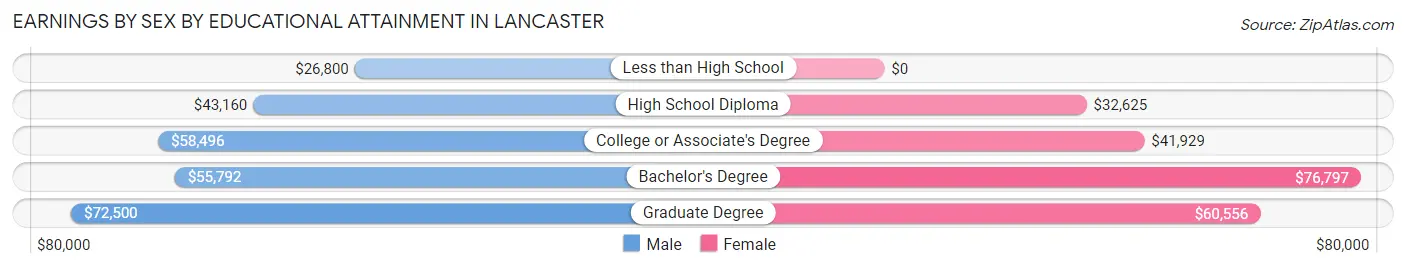
Earnings by Sex by Educational Attainment in Lancaster
Average earnings in Lancaster are $51,173 for men and $46,037 for women, a difference of 10.0%. Men with an educational attainment of graduate degree enjoy the highest average annual earnings of $72,500, while those with less than high school education earn the least with $26,800. Women with an educational attainment of bachelor's degree earn the most with the average annual earnings of $76,797, while those with high school diploma education have the smallest earnings of $32,625.
| Educational Attainment | Male Income | Female Income |
| Less than High School | $26,800 | $0 |
| High School Diploma | $43,160 | $32,625 |
| College or Associate's Degree | $58,496 | $41,929 |
| Bachelor's Degree | $55,792 | $76,797 |
| Graduate Degree | $72,500 | $60,556 |
| Total | $51,173 | $46,037 |
Family Income in Lancaster
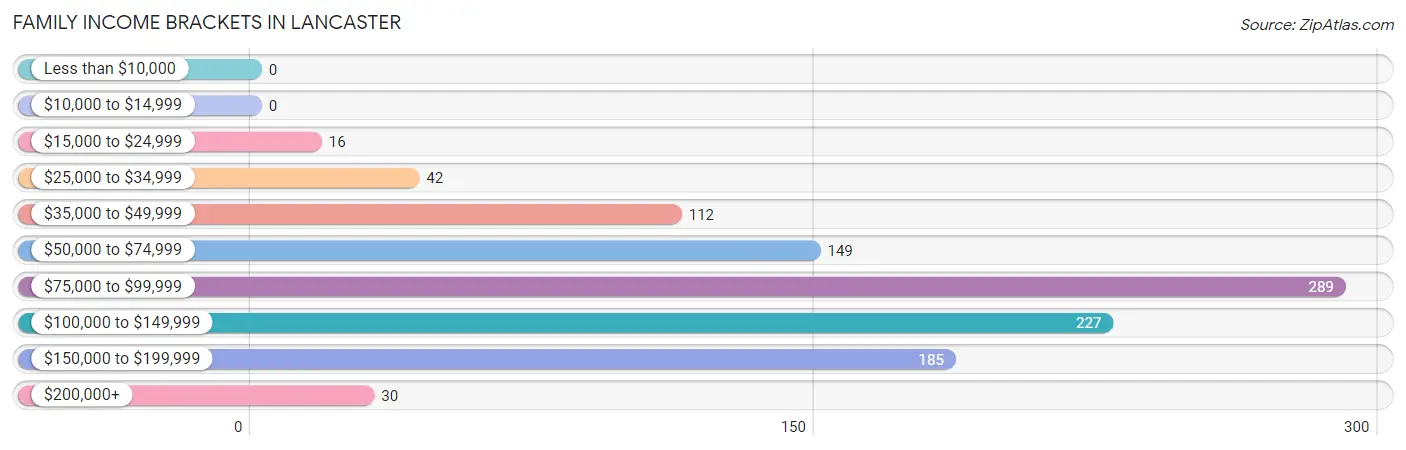
Family Income Brackets in Lancaster
According to the Lancaster family income data, there are 289 families falling into the $75,000 to $99,999 income range, which is the most common income bracket and makes up 27.5% of all families.
| Income Bracket | # Families | % Families |
| Less than $10,000 | 0 | 0.0% |
| $10,000 to $14,999 | 0 | 0.0% |
| $15,000 to $24,999 | 16 | 1.5% |
| $25,000 to $34,999 | 42 | 4.0% |
| $35,000 to $49,999 | 112 | 10.7% |
| $50,000 to $74,999 | 149 | 14.2% |
| $75,000 to $99,999 | 289 | 27.5% |
| $100,000 to $149,999 | 227 | 21.6% |
| $150,000 to $199,999 | 185 | 17.6% |
| $200,000+ | 30 | 2.9% |
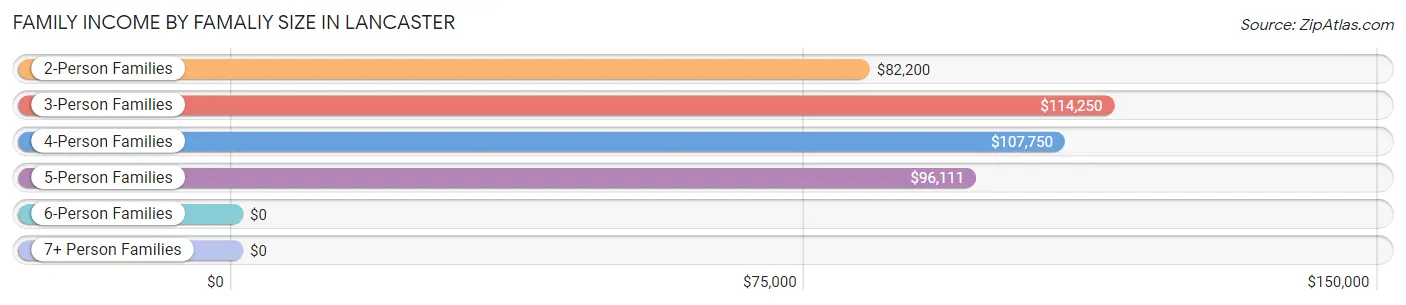
Family Income by Famaliy Size in Lancaster
3-person families (245 | 23.3%) account for the highest median family income in Lancaster with $114,250 per family, while 2-person families (536 | 51.0%) have the highest median income of $41,100 per family member.
| Income Bracket | # Families | Median Income |
| 2-Person Families | 536 (51.0%) | $82,200 |
| 3-Person Families | 245 (23.3%) | $114,250 |
| 4-Person Families | 133 (12.7%) | $107,750 |
| 5-Person Families | 126 (12.0%) | $96,111 |
| 6-Person Families | 0 (0.0%) | $0 |
| 7+ Person Families | 11 (1.1%) | $0 |
| Total | 1,051 (100.0%) | $92,986 |
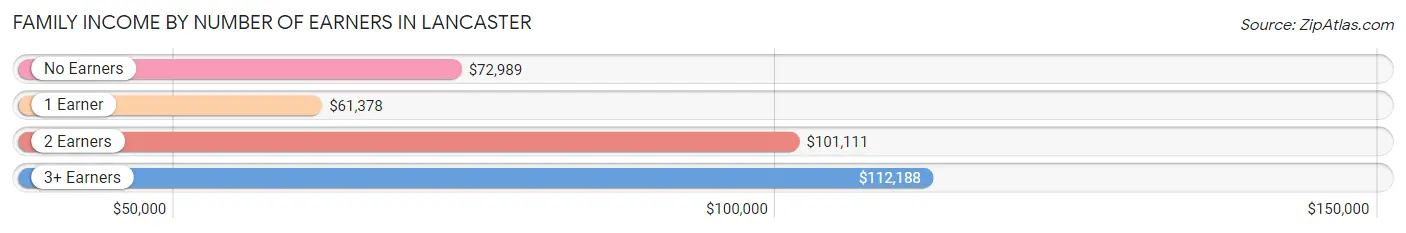
Family Income by Number of Earners in Lancaster
The median family income in Lancaster is $92,986, with families comprising 3+ earners (202) having the highest median family income of $112,188, while families with 1 earner (212) have the lowest median family income of $61,378, accounting for 19.2% and 20.2% of families, respectively.
| Number of Earners | # Families | Median Income |
| No Earners | 133 (12.7%) | $72,989 |
| 1 Earner | 212 (20.2%) | $61,378 |
| 2 Earners | 504 (47.9%) | $101,111 |
| 3+ Earners | 202 (19.2%) | $112,188 |
| Total | 1,051 (100.0%) | $92,986 |
Household Income in Lancaster
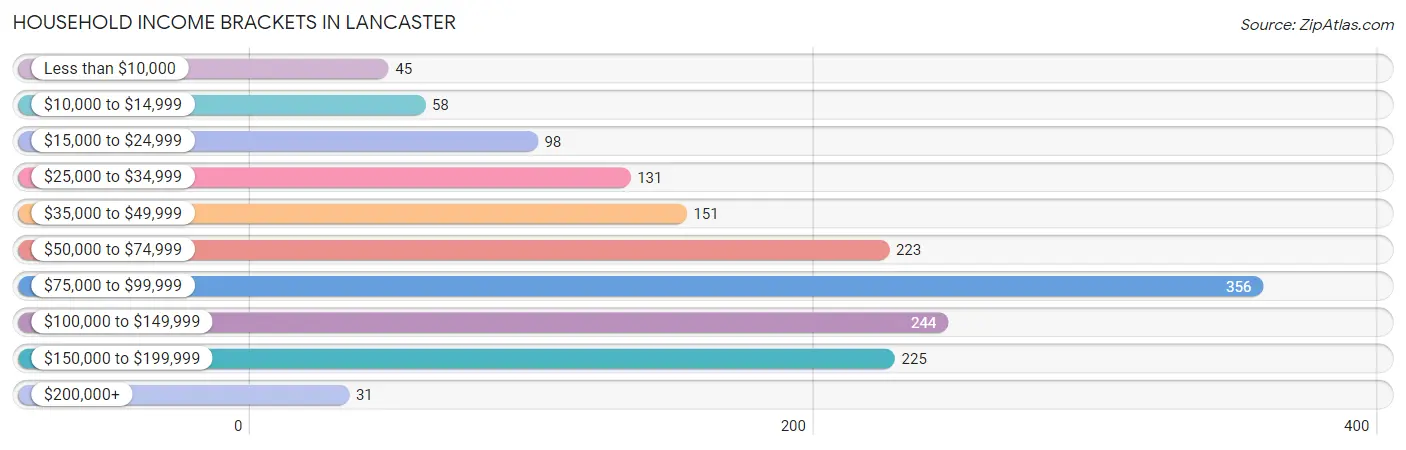
Household Income Brackets in Lancaster
With 356 households falling in the category, the $75,000 to $99,999 income range is the most frequent in Lancaster, accounting for 22.8% of all households. In contrast, only 31 households (2.0%) fall into the $200,000+ income bracket, making it the least populous group.
| Income Bracket | # Households | % Households |
| Less than $10,000 | 45 | 2.9% |
| $10,000 to $14,999 | 58 | 3.7% |
| $15,000 to $24,999 | 98 | 6.3% |
| $25,000 to $34,999 | 131 | 8.4% |
| $35,000 to $49,999 | 151 | 9.7% |
| $50,000 to $74,999 | 223 | 14.3% |
| $75,000 to $99,999 | 356 | 22.8% |
| $100,000 to $149,999 | 244 | 15.6% |
| $150,000 to $199,999 | 225 | 14.4% |
| $200,000+ | 31 | 2.0% |
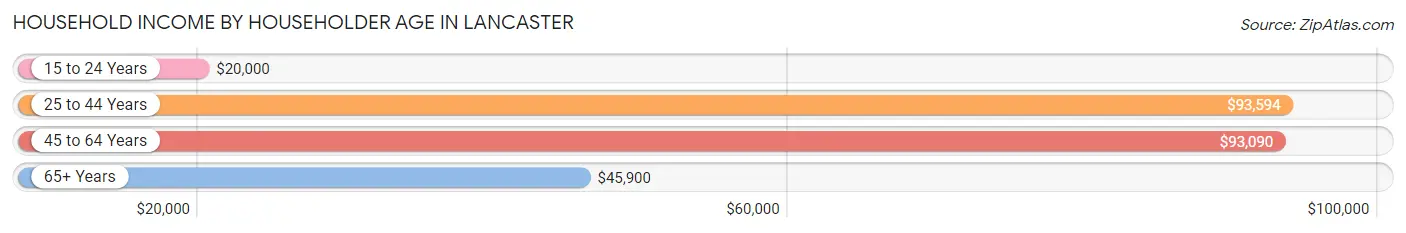
Household Income by Householder Age in Lancaster
The median household income in Lancaster is $77,328, with the highest median household income of $93,594 found in the 25 to 44 years age bracket for the primary householder. A total of 450 households (28.8%) fall into this category. Meanwhile, the 15 to 24 years age bracket for the primary householder has the lowest median household income of $20,000, with 108 households (6.9%) in this group.
| Income Bracket | # Households | Median Income |
| 15 to 24 Years | 108 (6.9%) | $20,000 |
| 25 to 44 Years | 450 (28.8%) | $93,594 |
| 45 to 64 Years | 575 (36.8%) | $93,090 |
| 65+ Years | 428 (27.4%) | $45,900 |
| Total | 1,561 (100.0%) | $77,328 |
Poverty in Lancaster
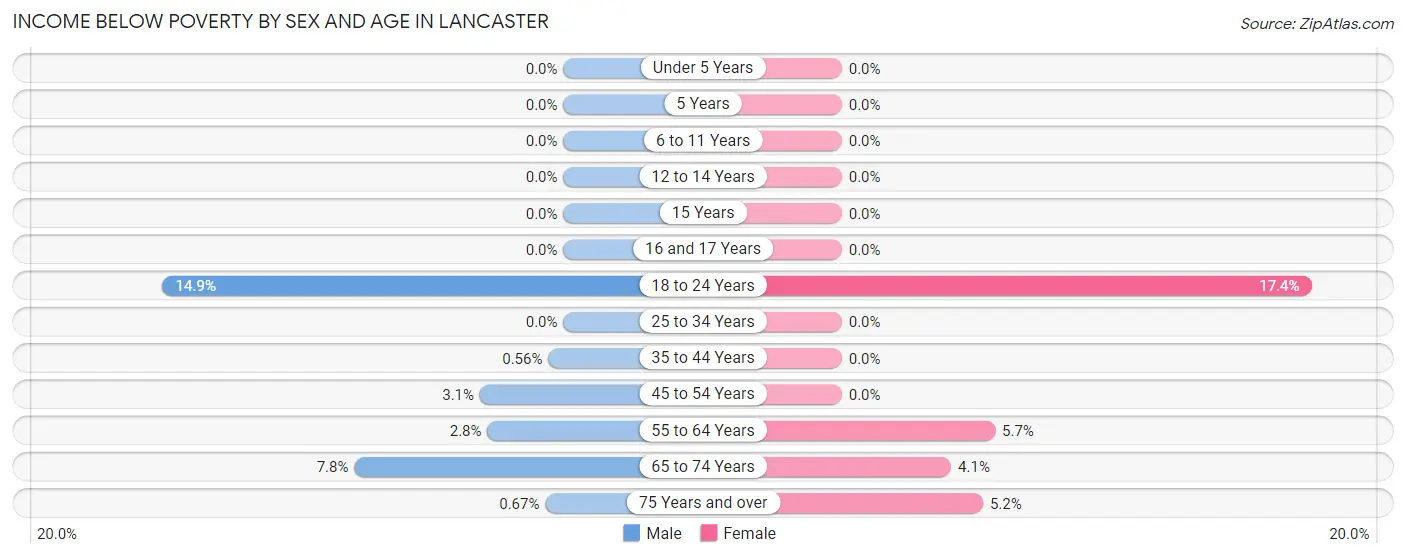
Income Below Poverty by Sex and Age in Lancaster
With 3.4% poverty level for males and 4.8% for females among the residents of Lancaster, 18 to 24 year old males and 18 to 24 year old females are the most vulnerable to poverty, with 36 males (14.9%) and 61 females (17.4%) in their respective age groups living below the poverty level.
| Age Bracket | Male | Female |
| Under 5 Years | 0 (0.0%) | 0 (0.0%) |
| 5 Years | 0 (0.0%) | 0 (0.0%) |
| 6 to 11 Years | 0 (0.0%) | 0 (0.0%) |
| 12 to 14 Years | 0 (0.0%) | 0 (0.0%) |
| 15 Years | 0 (0.0%) | 0 (0.0%) |
| 16 and 17 Years | 0 (0.0%) | 0 (0.0%) |
| 18 to 24 Years | 36 (14.9%) | 61 (17.4%) |
| 25 to 34 Years | 0 (0.0%) | 0 (0.0%) |
| 35 to 44 Years | 1 (0.6%) | 0 (0.0%) |
| 45 to 54 Years | 8 (3.1%) | 0 (0.0%) |
| 55 to 64 Years | 9 (2.8%) | 16 (5.7%) |
| 65 to 74 Years | 9 (7.8%) | 8 (4.1%) |
| 75 Years and over | 1 (0.7%) | 10 (5.2%) |
| Total | 64 (3.4%) | 95 (4.8%) |
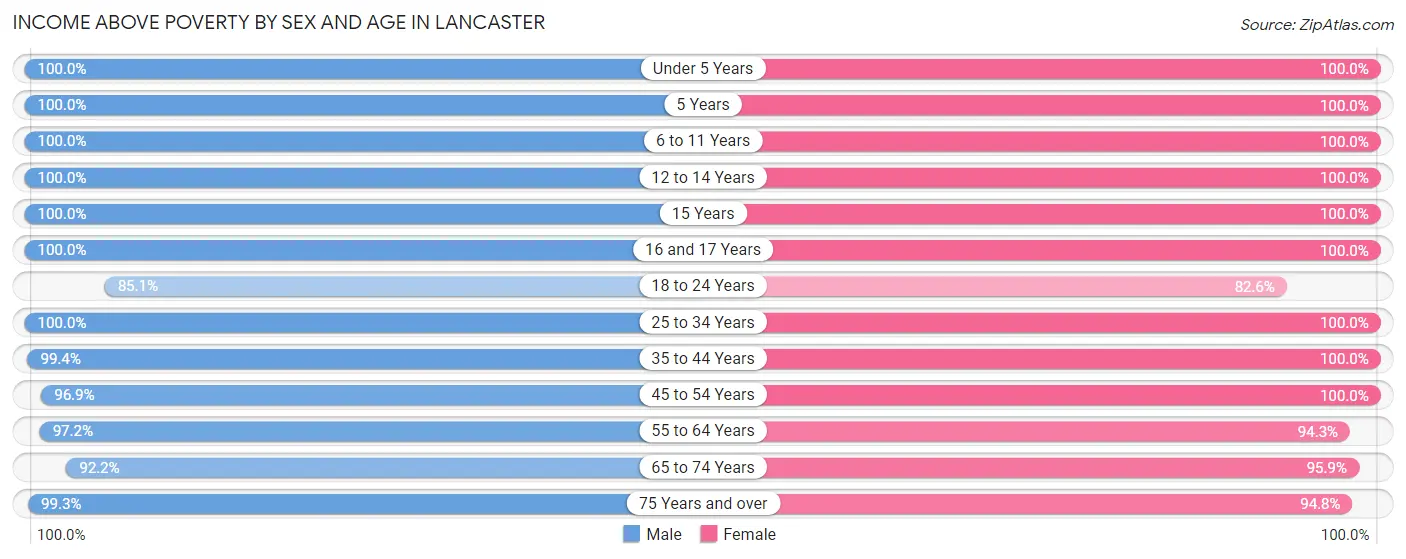
Income Above Poverty by Sex and Age in Lancaster
According to the poverty statistics in Lancaster, males aged under 5 years and females aged under 5 years are the age groups that are most secure financially, with 100.0% of males and 100.0% of females in these age groups living above the poverty line.
| Age Bracket | Male | Female |
| Under 5 Years | 73 (100.0%) | 139 (100.0%) |
| 5 Years | 27 (100.0%) | 17 (100.0%) |
| 6 to 11 Years | 69 (100.0%) | 62 (100.0%) |
| 12 to 14 Years | 54 (100.0%) | 60 (100.0%) |
| 15 Years | 94 (100.0%) | 6 (100.0%) |
| 16 and 17 Years | 61 (100.0%) | 38 (100.0%) |
| 18 to 24 Years | 206 (85.1%) | 289 (82.6%) |
| 25 to 34 Years | 231 (100.0%) | 223 (100.0%) |
| 35 to 44 Years | 177 (99.4%) | 213 (100.0%) |
| 45 to 54 Years | 250 (96.9%) | 189 (100.0%) |
| 55 to 64 Years | 310 (97.2%) | 265 (94.3%) |
| 65 to 74 Years | 107 (92.2%) | 189 (95.9%) |
| 75 Years and over | 149 (99.3%) | 181 (94.8%) |
| Total | 1,808 (96.6%) | 1,871 (95.2%) |
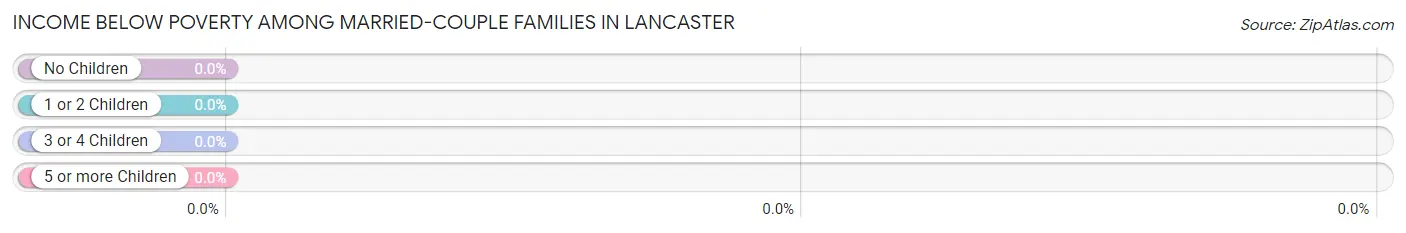
Income Below Poverty Among Married-Couple Families in Lancaster
| Children | Above Poverty | Below Poverty |
| No Children | 547 (100.0%) | 0 (0.0%) |
| 1 or 2 Children | 233 (100.0%) | 0 (0.0%) |
| 3 or 4 Children | 87 (100.0%) | 0 (0.0%) |
| 5 or more Children | 11 (100.0%) | 0 (0.0%) |
| Total | 878 (100.0%) | 0 (0.0%) |
Income Below Poverty Among Single-Parent Households in Lancaster
| Children | Single Father | Single Mother |
| No Children | 0 (0.0%) | 0 (0.0%) |
| 1 or 2 Children | 0 (0.0%) | 0 (0.0%) |
| 3 or 4 Children | 0 (0.0%) | 0 (0.0%) |
| 5 or more Children | 0 (0.0%) | 0 (0.0%) |
| Total | 0 (0.0%) | 0 (0.0%) |
Income Below Poverty Among Married-Couple vs Single-Parent Households in Lancaster
| Children | Married-Couple Families | Single-Parent Households |
| No Children | 0 (0.0%) | 0 (0.0%) |
| 1 or 2 Children | 0 (0.0%) | 0 (0.0%) |
| 3 or 4 Children | 0 (0.0%) | 0 (0.0%) |
| 5 or more Children | 0 (0.0%) | 0 (0.0%) |
| Total | 0 (0.0%) | 0 (0.0%) |
Race in Lancaster
The most populous races in Lancaster are White / Caucasian (3,798 | 97.0%), Two or more Races (65 | 1.7%), and Hispanic or Latino (43 | 1.1%).
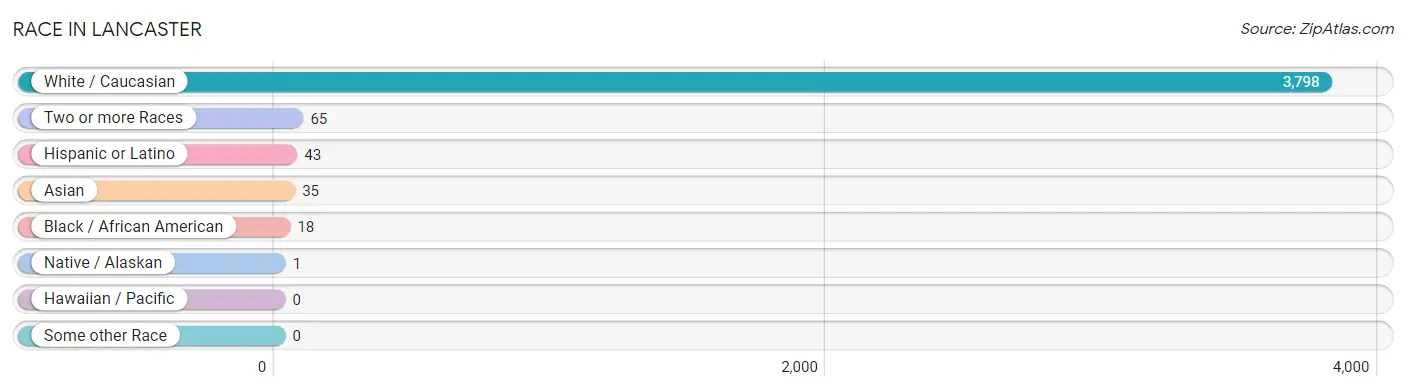
| Race | # Population | % Population |
| Asian | 35 | 0.9% |
| Black / African American | 18 | 0.5% |
| Hawaiian / Pacific | 0 | 0.0% |
| Hispanic or Latino | 43 | 1.1% |
| Native / Alaskan | 1 | 0.0% |
| White / Caucasian | 3,798 | 97.0% |
| Two or more Races | 65 | 1.7% |
| Some other Race | 0 | 0.0% |
| Total | 3,917 | 100.0% |
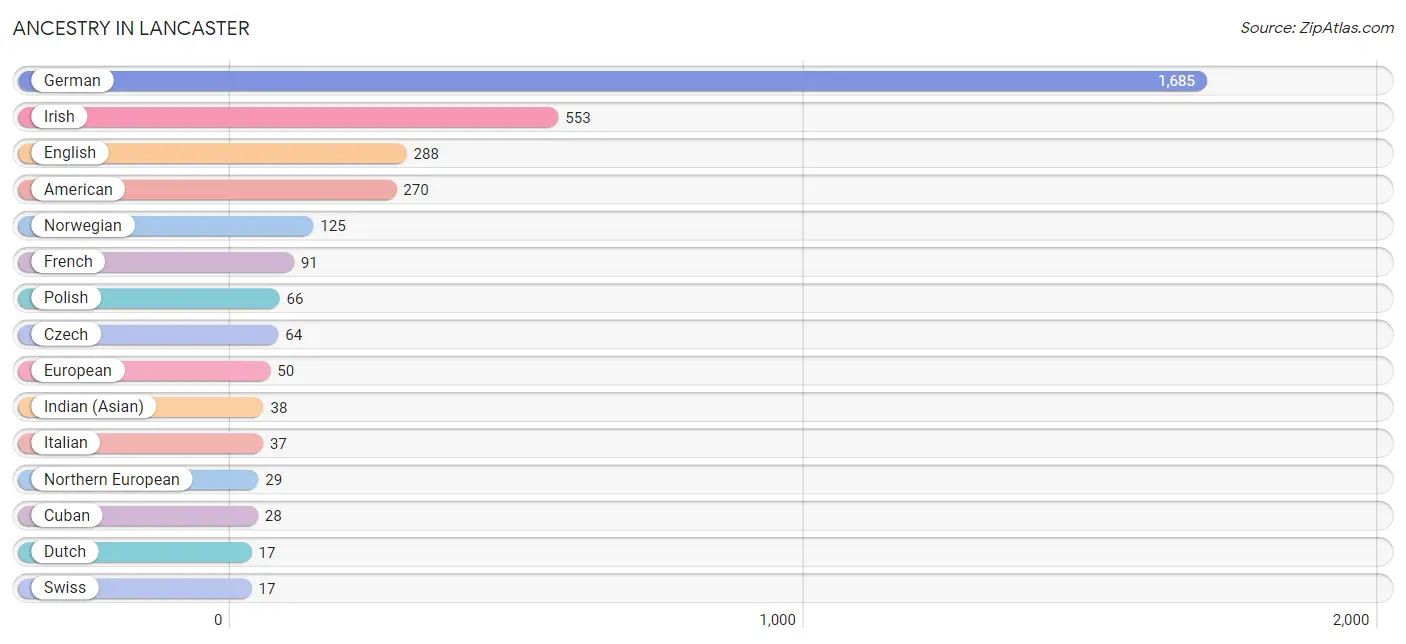
Ancestry in Lancaster
The most populous ancestries reported in Lancaster are German (1,685 | 43.0%), Irish (553 | 14.1%), English (288 | 7.3%), American (270 | 6.9%), and Norwegian (125 | 3.2%), together accounting for 74.6% of all Lancaster residents.
| Ancestry | # Population | % Population |
| American | 270 | 6.9% |
| British | 8 | 0.2% |
| Bulgarian | 8 | 0.2% |
| Burmese | 6 | 0.2% |
| Central American | 6 | 0.2% |
| Chippewa | 11 | 0.3% |
| Cuban | 28 | 0.7% |
| Czech | 64 | 1.6% |
| Danish | 11 | 0.3% |
| Dutch | 17 | 0.4% |
| English | 288 | 7.3% |
| European | 50 | 1.3% |
| French | 91 | 2.3% |
| French Canadian | 12 | 0.3% |
| German | 1,685 | 43.0% |
| Hungarian | 1 | 0.0% |
| Indian (Asian) | 38 | 1.0% |
| Irish | 553 | 14.1% |
| Italian | 37 | 0.9% |
| Korean | 12 | 0.3% |
| Latvian | 9 | 0.2% |
| Lithuanian | 7 | 0.2% |
| Northern European | 29 | 0.7% |
| Norwegian | 125 | 3.2% |
| Panamanian | 6 | 0.2% |
| Polish | 66 | 1.7% |
| Portuguese | 8 | 0.2% |
| Scandinavian | 8 | 0.2% |
| Scottish | 1 | 0.0% |
| Swedish | 10 | 0.3% |
| Swiss | 17 | 0.4% | View All 31 Rows |
Immigrants in Lancaster
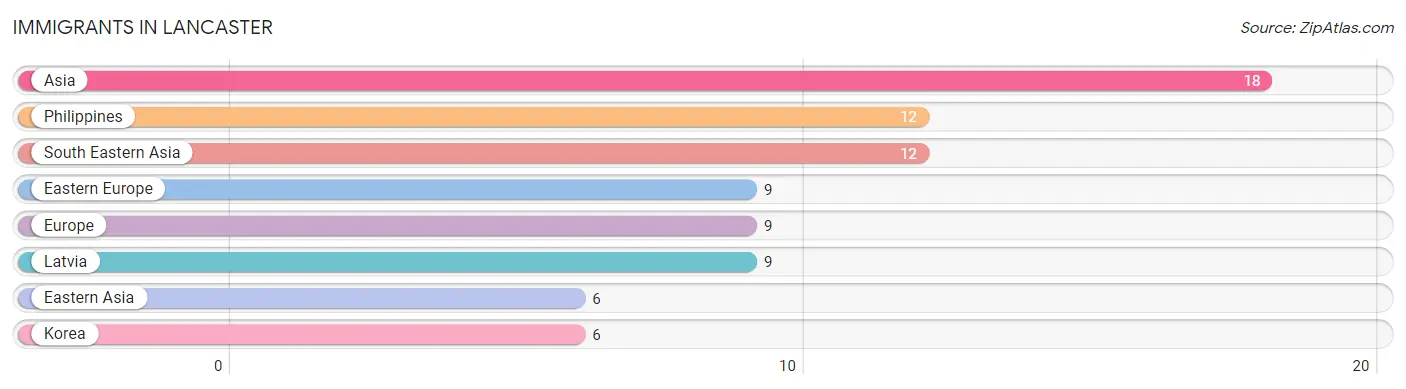
The most numerous immigrant groups reported in Lancaster came from Asia (18 | 0.5%), Philippines (12 | 0.3%), South Eastern Asia (12 | 0.3%), Eastern Europe (9 | 0.2%), and Europe (9 | 0.2%), together accounting for 1.5% of all Lancaster residents.
| Immigration Origin | # Population | % Population |
| Asia | 18 | 0.5% |
| Eastern Asia | 6 | 0.2% |
| Eastern Europe | 9 | 0.2% |
| Europe | 9 | 0.2% |
| Korea | 6 | 0.2% |
| Latvia | 9 | 0.2% |
| Philippines | 12 | 0.3% |
| South Eastern Asia | 12 | 0.3% | View All 8 Rows |
Sex and Age in Lancaster
Sex and Age in Lancaster
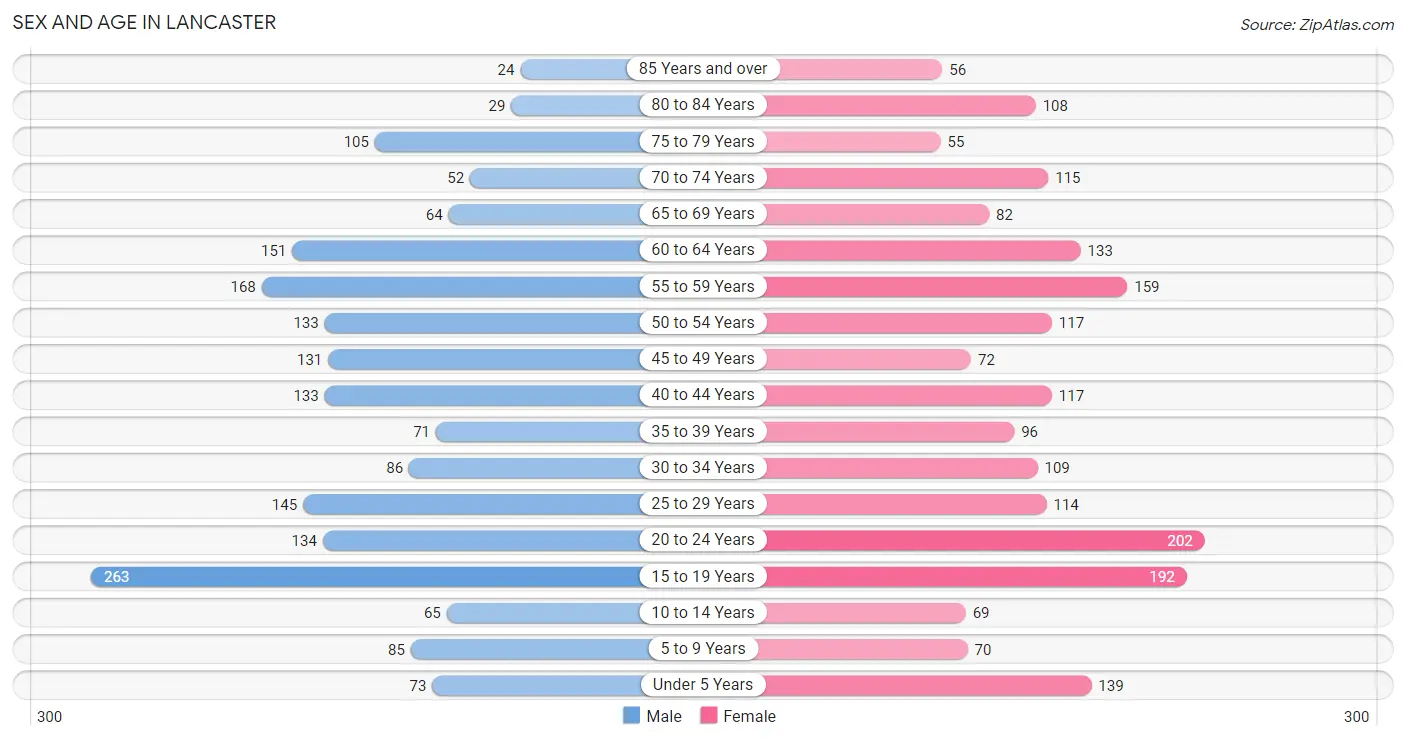
The most populous age groups in Lancaster are 15 to 19 Years (263 | 13.8%) for men and 20 to 24 Years (202 | 10.1%) for women.
| Age Bracket | Male | Female |
| Under 5 Years | 73 (3.8%) | 139 (6.9%) |
| 5 to 9 Years | 85 (4.4%) | 70 (3.5%) |
| 10 to 14 Years | 65 (3.4%) | 69 (3.4%) |
| 15 to 19 Years | 263 (13.8%) | 192 (9.6%) |
| 20 to 24 Years | 134 (7.0%) | 202 (10.1%) |
| 25 to 29 Years | 145 (7.6%) | 114 (5.7%) |
| 30 to 34 Years | 86 (4.5%) | 109 (5.4%) |
| 35 to 39 Years | 71 (3.7%) | 96 (4.8%) |
| 40 to 44 Years | 133 (7.0%) | 117 (5.8%) |
| 45 to 49 Years | 131 (6.9%) | 72 (3.6%) |
| 50 to 54 Years | 133 (7.0%) | 117 (5.8%) |
| 55 to 59 Years | 168 (8.8%) | 159 (7.9%) |
| 60 to 64 Years | 151 (7.9%) | 133 (6.6%) |
| 65 to 69 Years | 64 (3.4%) | 82 (4.1%) |
| 70 to 74 Years | 52 (2.7%) | 115 (5.7%) |
| 75 to 79 Years | 105 (5.5%) | 55 (2.7%) |
| 80 to 84 Years | 29 (1.5%) | 108 (5.4%) |
| 85 Years and over | 24 (1.3%) | 56 (2.8%) |
| Total | 1,912 (100.0%) | 2,005 (100.0%) |
Families and Households in Lancaster
Median Family Size in Lancaster
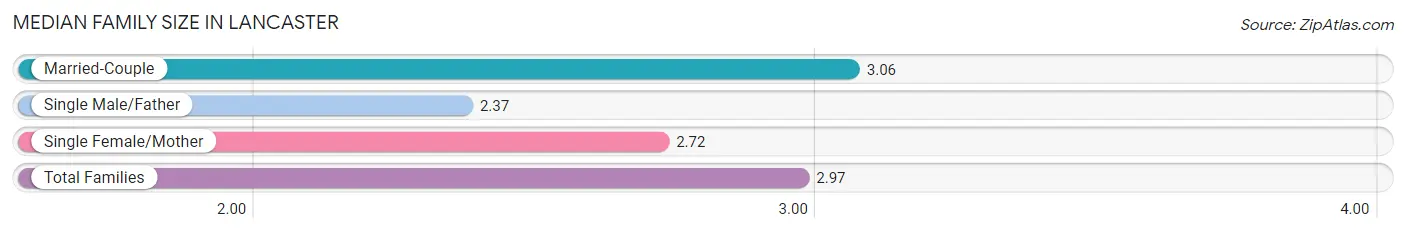
The median family size in Lancaster is 2.97 persons per family, with married-couple families (878 | 83.5%) accounting for the largest median family size of 3.06 persons per family. On the other hand, single male/father families (86 | 8.2%) represent the smallest median family size with 2.37 persons per family.
| Family Type | # Families | Family Size |
| Married-Couple | 878 (83.5%) | 3.06 |
| Single Male/Father | 86 (8.2%) | 2.37 |
| Single Female/Mother | 87 (8.3%) | 2.72 |
| Total Families | 1,051 (100.0%) | 2.97 |
Median Household Size in Lancaster
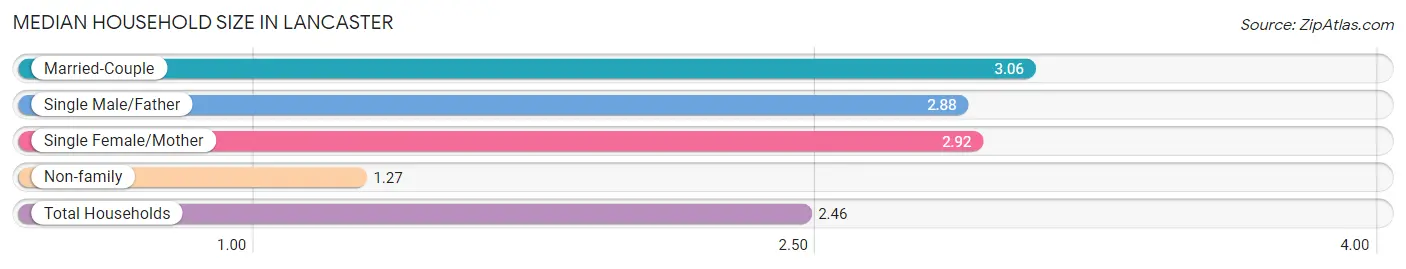
The median household size in Lancaster is 2.46 persons per household, with married-couple households (878 | 56.2%) accounting for the largest median household size of 3.06 persons per household. non-family households (510 | 32.7%) represent the smallest median household size with 1.27 persons per household.
| Household Type | # Households | Household Size |
| Married-Couple | 878 (56.2%) | 3.06 |
| Single Male/Father | 86 (5.5%) | 2.88 |
| Single Female/Mother | 87 (5.6%) | 2.92 |
| Non-family | 510 (32.7%) | 1.27 |
| Total Households | 1,561 (100.0%) | 2.46 |
Household Size by Marriage Status in Lancaster
Out of a total of 1,561 households in Lancaster, 1,051 (67.3%) are family households, while 510 (32.7%) are nonfamily households. The most numerous type of family households are 2-person households, comprising 480, and the most common type of nonfamily households are 1-person households, comprising 414.
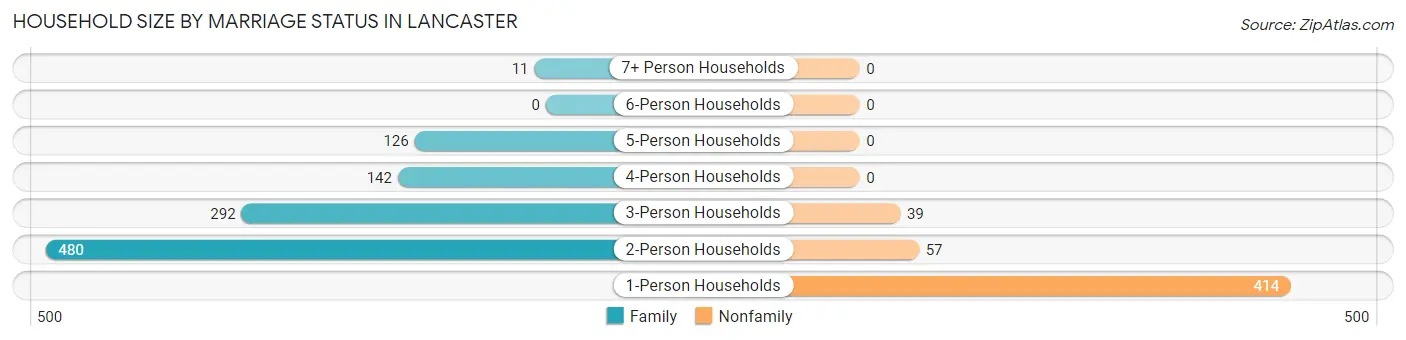
| Household Size | Family Households | Nonfamily Households |
| 1-Person Households | - | 414 (26.5%) |
| 2-Person Households | 480 (30.7%) | 57 (3.6%) |
| 3-Person Households | 292 (18.7%) | 39 (2.5%) |
| 4-Person Households | 142 (9.1%) | 0 (0.0%) |
| 5-Person Households | 126 (8.1%) | 0 (0.0%) |
| 6-Person Households | 0 (0.0%) | 0 (0.0%) |
| 7+ Person Households | 11 (0.7%) | 0 (0.0%) |
| Total | 1,051 (67.3%) | 510 (32.7%) |
Female Fertility in Lancaster
Fertility by Age in Lancaster
Average fertility rate in Lancaster is 41.0 births per 1,000 women. Women in the age bracket of 20 to 34 years have the highest fertility rate with 89.0 births per 1,000 women. Women in the age bracket of 20 to 34 years acount for 100.0% of all women with births.
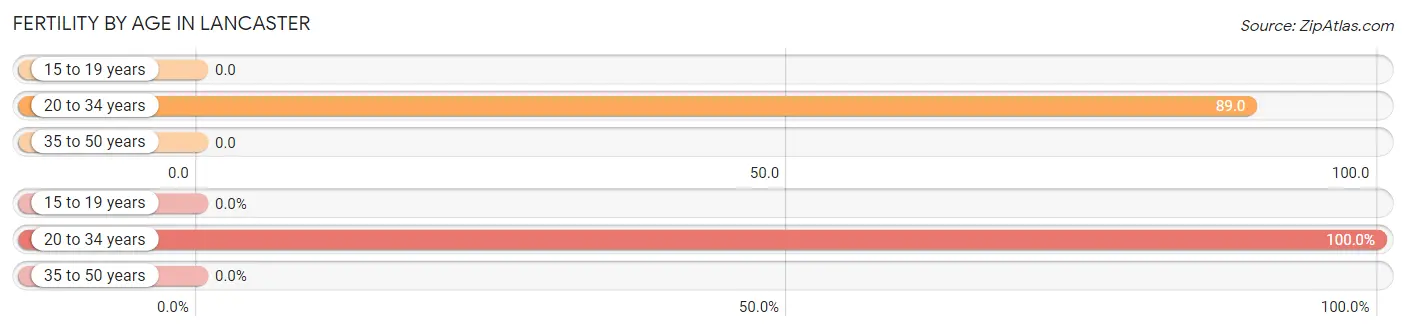
| Age Bracket | Women with Births | Births / 1,000 Women |
| 15 to 19 years | 0 (0.0%) | 0.0 |
| 20 to 34 years | 38 (100.0%) | 89.0 |
| 35 to 50 years | 0 (0.0%) | 0.0 |
| Total | 38 (100.0%) | 41.0 |
Fertility by Age by Marriage Status in Lancaster
23.7% of women with births (38) in Lancaster are married. The highest percentage of unmarried women with births falls into 20 to 34 years age bracket with 76.3% of them unmarried at the time of birth, while the lowest percentage of unmarried women with births belong to 20 to 34 years age bracket with 76.3% of them unmarried.
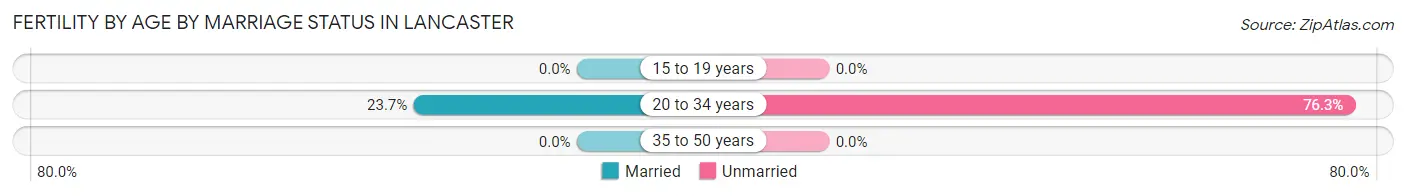
| Age Bracket | Married | Unmarried |
| 15 to 19 years | 0 (0.0%) | 0 (0.0%) |
| 20 to 34 years | 9 (23.7%) | 29 (76.3%) |
| 35 to 50 years | 0 (0.0%) | 0 (0.0%) |
| Total | 9 (23.7%) | 29 (76.3%) |
Fertility by Education in Lancaster
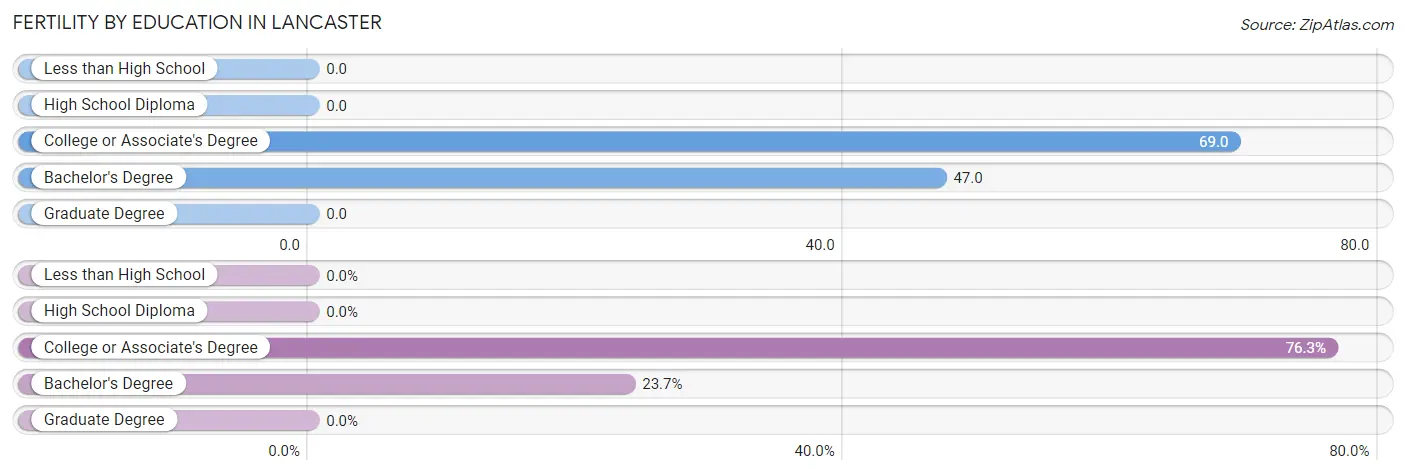
| Educational Attainment | Women with Births | Births / 1,000 Women |
| Less than High School | 0 (0.0%) | 0.0 |
| High School Diploma | 0 (0.0%) | 0.0 |
| College or Associate's Degree | 29 (76.3%) | 69.0 |
| Bachelor's Degree | 9 (23.7%) | 47.0 |
| Graduate Degree | 0 (0.0%) | 0.0 |
| Total | 38 (100.0%) | 41.0 |
Fertility by Education by Marriage Status in Lancaster
76.3% of women with births in Lancaster are unmarried. Women with the educational attainment of bachelor's degree are most likely to be married with 100.0% of them married at childbirth, while women with the educational attainment of college or associate's degree are least likely to be married with 100.0% of them unmarried at childbirth.
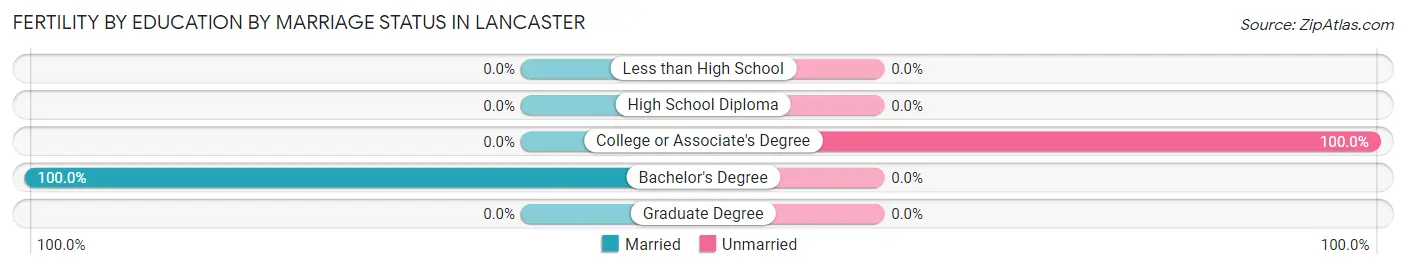
| Educational Attainment | Married | Unmarried |
| Less than High School | 0 (0.0%) | 0 (0.0%) |
| High School Diploma | 0 (0.0%) | 0 (0.0%) |
| College or Associate's Degree | 0 (0.0%) | 29 (100.0%) |
| Bachelor's Degree | 9 (100.0%) | 0 (0.0%) |
| Graduate Degree | 0 (0.0%) | 0 (0.0%) |
| Total | 9 (23.7%) | 29 (76.3%) |
Employment Characteristics in Lancaster
Employment by Class of Employer in Lancaster
Among the 2,271 employed individuals in Lancaster, private company employees (1,553 | 68.4%), local government employees (235 | 10.3%), and state government employees (174 | 7.7%) make up the most common classes of employment.
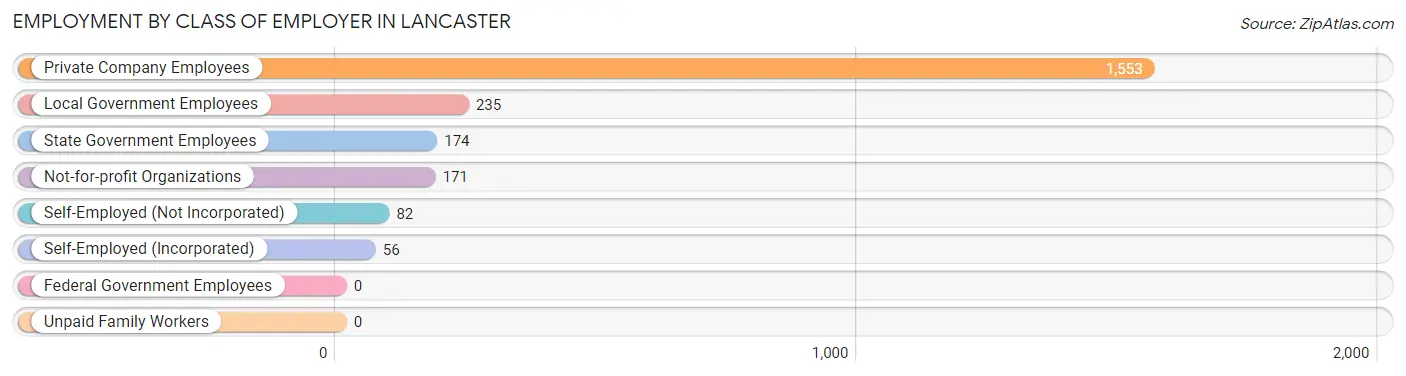
| Employer Class | # Employees | % Employees |
| Private Company Employees | 1,553 | 68.4% |
| Self-Employed (Incorporated) | 56 | 2.5% |
| Self-Employed (Not Incorporated) | 82 | 3.6% |
| Not-for-profit Organizations | 171 | 7.5% |
| Local Government Employees | 235 | 10.3% |
| State Government Employees | 174 | 7.7% |
| Federal Government Employees | 0 | 0.0% |
| Unpaid Family Workers | 0 | 0.0% |
| Total | 2,271 | 100.0% |
Employment Status by Age in Lancaster
According to the labor force statistics for Lancaster, out of the total population over 16 years of age (3,316), 70.6% or 2,341 individuals are in the labor force, with 1.5% or 35 of them unemployed. The age group with the highest labor force participation rate is 30 to 34 years, with 100.0% or 195 individuals in the labor force. Within the labor force, the 65 to 74 years age range has the highest percentage of unemployed individuals, with 14.0% or 8 of them being unemployed.
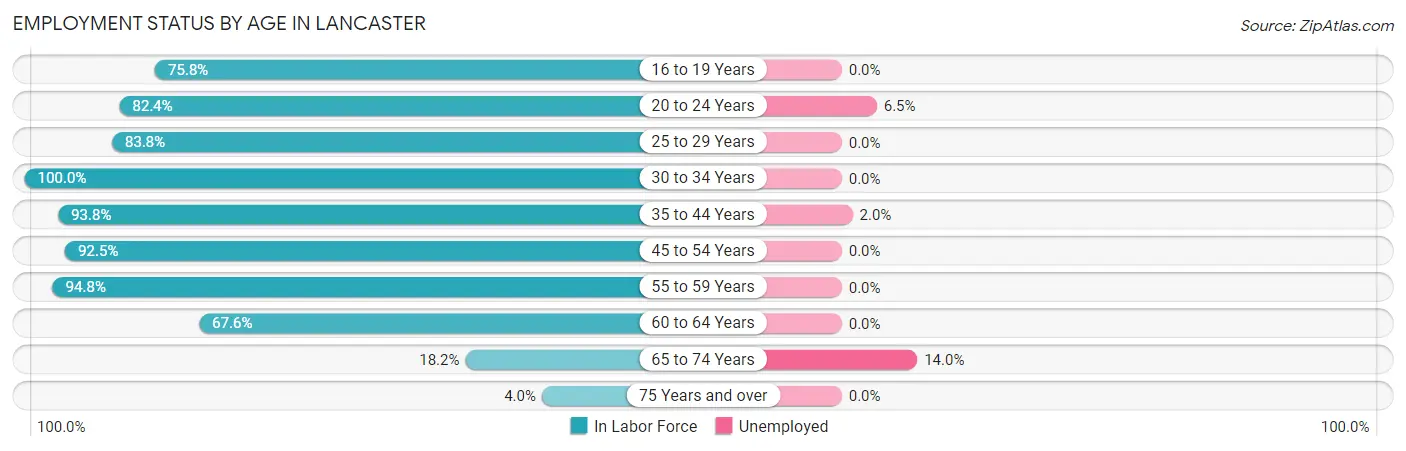
| Age Bracket | In Labor Force | Unemployed |
| 16 to 19 Years | 269 (75.8%) | 0 (0.0%) |
| 20 to 24 Years | 277 (82.4%) | 18 (6.5%) |
| 25 to 29 Years | 217 (83.8%) | 0 (0.0%) |
| 30 to 34 Years | 195 (100.0%) | 0 (0.0%) |
| 35 to 44 Years | 391 (93.8%) | 8 (2.0%) |
| 45 to 54 Years | 419 (92.5%) | 0 (0.0%) |
| 55 to 59 Years | 310 (94.8%) | 0 (0.0%) |
| 60 to 64 Years | 192 (67.6%) | 0 (0.0%) |
| 65 to 74 Years | 57 (18.2%) | 8 (14.0%) |
| 75 Years and over | 15 (4.0%) | 0 (0.0%) |
| Total | 2,341 (70.6%) | 35 (1.5%) |
Employment Status by Educational Attainment in Lancaster
According to labor force statistics for Lancaster, 89.1% of individuals (1,724) out of the total population between 25 and 64 years of age (1,935) are in the labor force, with 0.5% or 9 of them being unemployed. The group with the highest labor force participation rate are those with the educational attainment of college / associate degree, with 95.7% or 787 individuals in the labor force. Within the labor force, individuals with bachelor's degree or higher education have the highest percentage of unemployment, with 1.5% or 7 of them being unemployed.
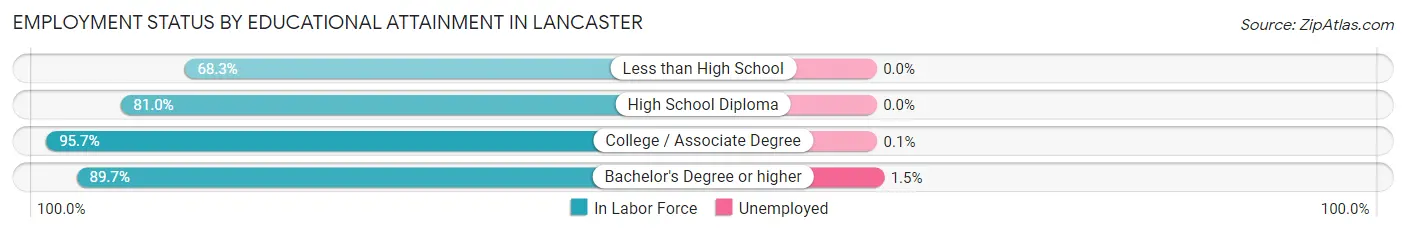
| Educational Attainment | In Labor Force | Unemployed |
| Less than High School | 43 (68.3%) | 0 (0.0%) |
| High School Diploma | 442 (81.0%) | 0 (0.0%) |
| College / Associate Degree | 787 (95.7%) | 1 (0.1%) |
| Bachelor's Degree or higher | 452 (89.7%) | 8 (1.5%) |
| Total | 1,724 (89.1%) | 10 (0.5%) |
Employment Occupations by Sex in Lancaster
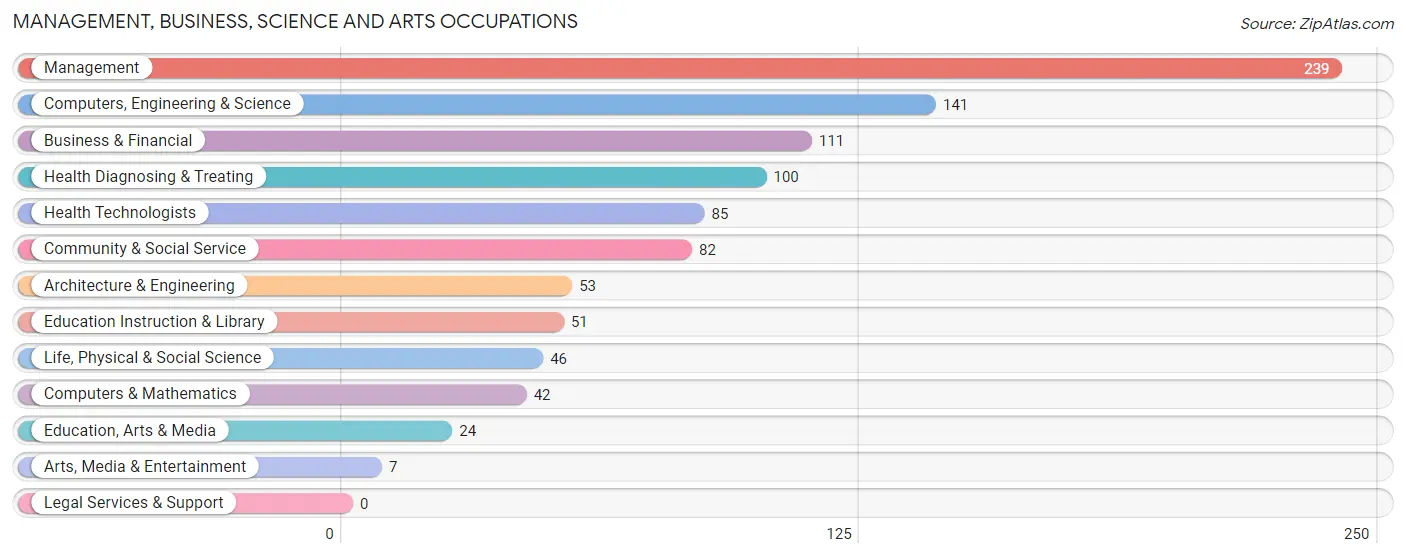
Management, Business, Science and Arts Occupations
The most common Management, Business, Science and Arts occupations in Lancaster are Management (239 | 10.4%), Computers, Engineering & Science (141 | 6.1%), Business & Financial (111 | 4.8%), Health Diagnosing & Treating (100 | 4.3%), and Health Technologists (85 | 3.7%).
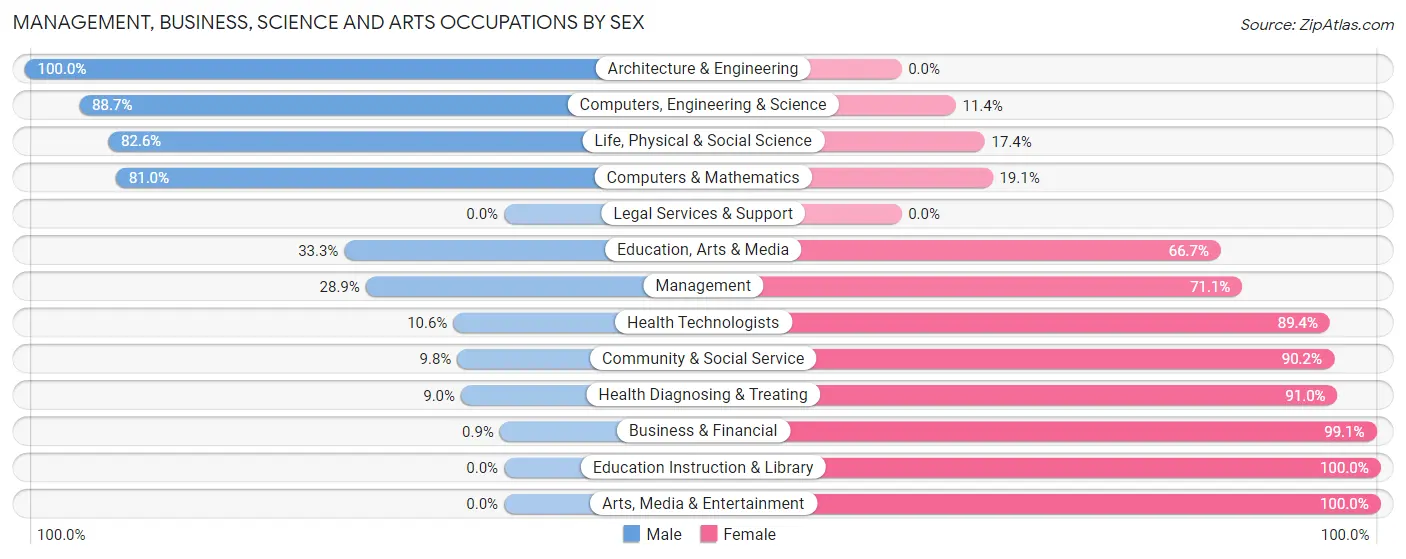
Management, Business, Science and Arts Occupations by Sex
Within the Management, Business, Science and Arts occupations in Lancaster, the most male-oriented occupations are Architecture & Engineering (100.0%), Computers, Engineering & Science (88.6%), and Life, Physical & Social Science (82.6%), while the most female-oriented occupations are Education Instruction & Library (100.0%), Arts, Media & Entertainment (100.0%), and Business & Financial (99.1%).
| Occupation | Male | Female |
| Management | 69 (28.9%) | 170 (71.1%) |
| Business & Financial | 1 (0.9%) | 110 (99.1%) |
| Computers, Engineering & Science | 125 (88.6%) | 16 (11.4%) |
| Computers & Mathematics | 34 (80.9%) | 8 (19.1%) |
| Architecture & Engineering | 53 (100.0%) | 0 (0.0%) |
| Life, Physical & Social Science | 38 (82.6%) | 8 (17.4%) |
| Community & Social Service | 8 (9.8%) | 74 (90.2%) |
| Education, Arts & Media | 8 (33.3%) | 16 (66.7%) |
| Legal Services & Support | 0 (0.0%) | 0 (0.0%) |
| Education Instruction & Library | 0 (0.0%) | 51 (100.0%) |
| Arts, Media & Entertainment | 0 (0.0%) | 7 (100.0%) |
| Health Diagnosing & Treating | 9 (9.0%) | 91 (91.0%) |
| Health Technologists | 9 (10.6%) | 76 (89.4%) |
| Total (Category) | 212 (31.5%) | 461 (68.5%) |
| Total (Overall) | 1,152 (49.9%) | 1,156 (50.1%) |
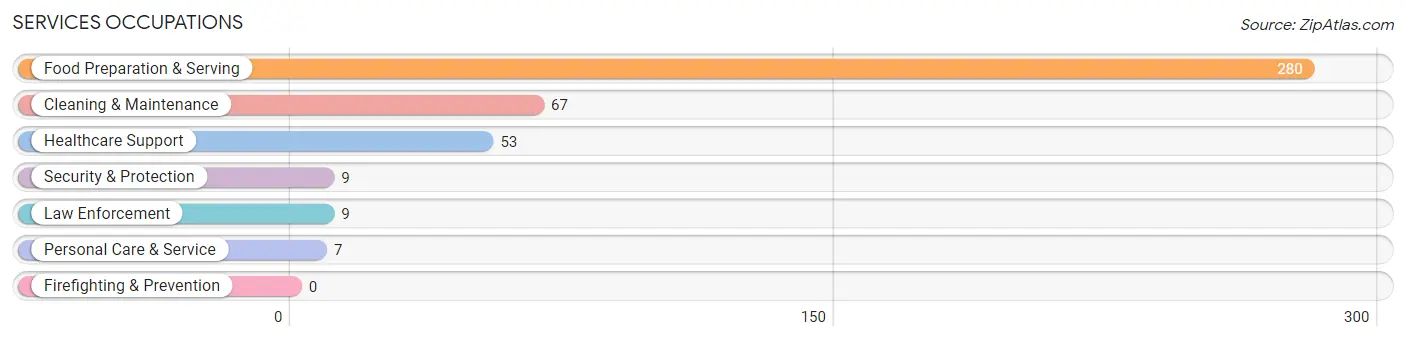
Services Occupations
The most common Services occupations in Lancaster are Food Preparation & Serving (280 | 12.1%), Cleaning & Maintenance (67 | 2.9%), Healthcare Support (53 | 2.3%), Security & Protection (9 | 0.4%), and Law Enforcement (9 | 0.4%).
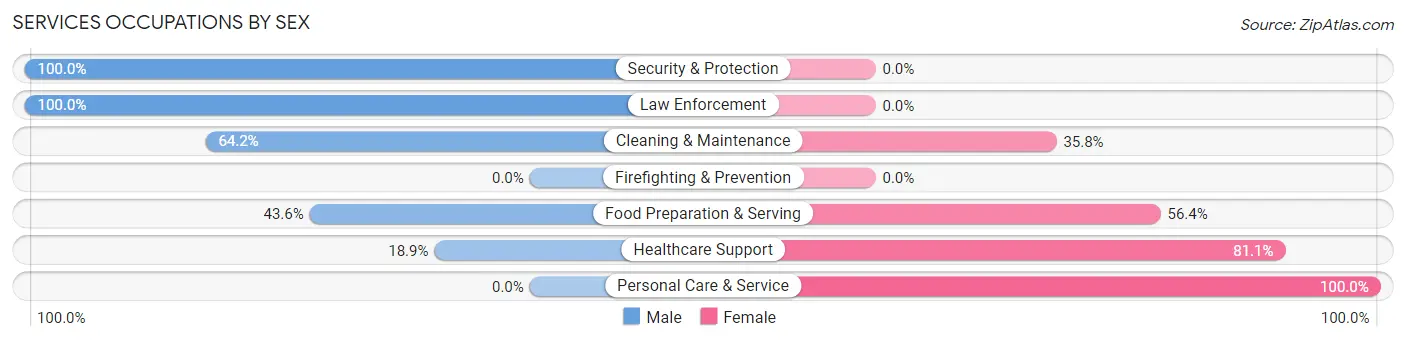
Services Occupations by Sex
Within the Services occupations in Lancaster, the most male-oriented occupations are Security & Protection (100.0%), Law Enforcement (100.0%), and Cleaning & Maintenance (64.2%), while the most female-oriented occupations are Personal Care & Service (100.0%), Healthcare Support (81.1%), and Food Preparation & Serving (56.4%).
| Occupation | Male | Female |
| Healthcare Support | 10 (18.9%) | 43 (81.1%) |
| Security & Protection | 9 (100.0%) | 0 (0.0%) |
| Firefighting & Prevention | 0 (0.0%) | 0 (0.0%) |
| Law Enforcement | 9 (100.0%) | 0 (0.0%) |
| Food Preparation & Serving | 122 (43.6%) | 158 (56.4%) |
| Cleaning & Maintenance | 43 (64.2%) | 24 (35.8%) |
| Personal Care & Service | 0 (0.0%) | 7 (100.0%) |
| Total (Category) | 184 (44.2%) | 232 (55.8%) |
| Total (Overall) | 1,152 (49.9%) | 1,156 (50.1%) |
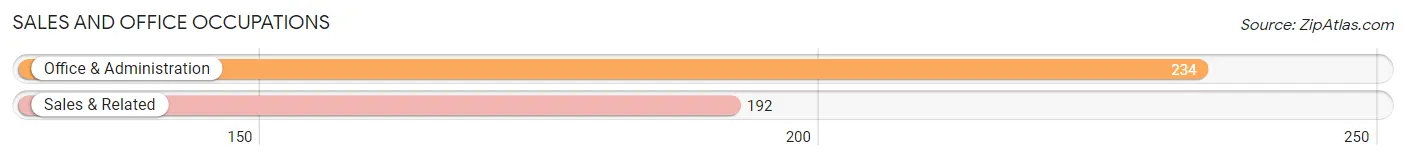
Sales and Office Occupations
The most common Sales and Office occupations in Lancaster are Office & Administration (234 | 10.1%), and Sales & Related (192 | 8.3%).
Sales and Office Occupations by Sex
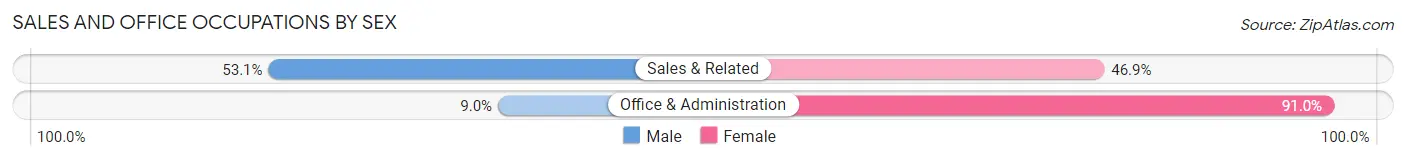
| Occupation | Male | Female |
| Sales & Related | 102 (53.1%) | 90 (46.9%) |
| Office & Administration | 21 (9.0%) | 213 (91.0%) |
| Total (Category) | 123 (28.9%) | 303 (71.1%) |
| Total (Overall) | 1,152 (49.9%) | 1,156 (50.1%) |
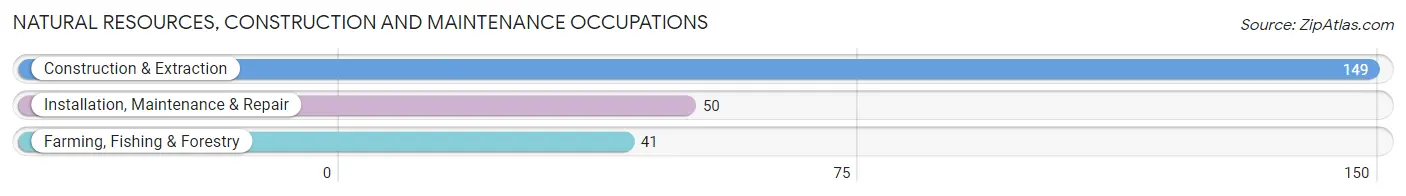
Natural Resources, Construction and Maintenance Occupations
The most common Natural Resources, Construction and Maintenance occupations in Lancaster are Construction & Extraction (149 | 6.5%), Installation, Maintenance & Repair (50 | 2.2%), and Farming, Fishing & Forestry (41 | 1.8%).
Natural Resources, Construction and Maintenance Occupations by Sex
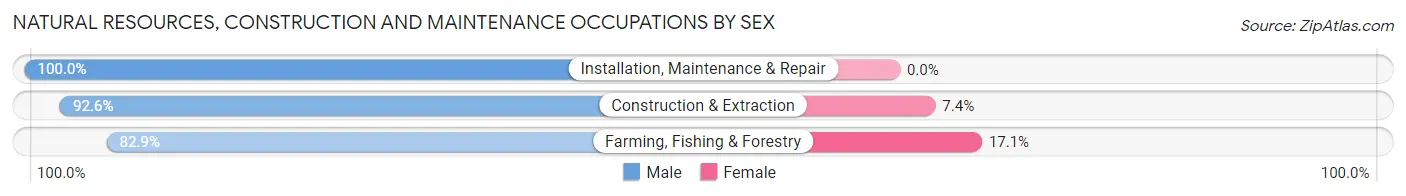
| Occupation | Male | Female |
| Farming, Fishing & Forestry | 34 (82.9%) | 7 (17.1%) |
| Construction & Extraction | 138 (92.6%) | 11 (7.4%) |
| Installation, Maintenance & Repair | 50 (100.0%) | 0 (0.0%) |
| Total (Category) | 222 (92.5%) | 18 (7.5%) |
| Total (Overall) | 1,152 (49.9%) | 1,156 (50.1%) |
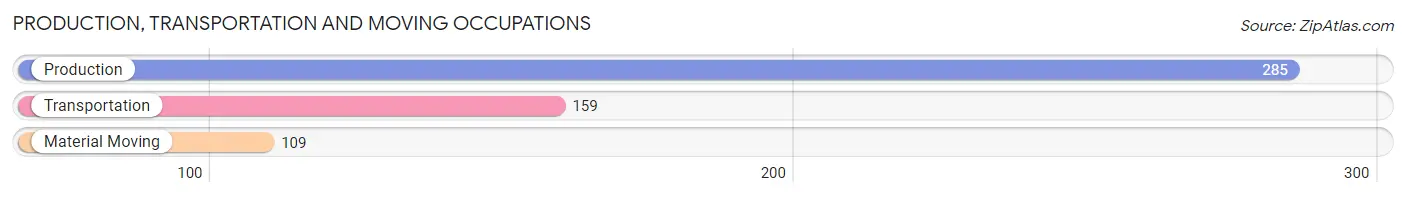
Production, Transportation and Moving Occupations
The most common Production, Transportation and Moving occupations in Lancaster are Production (285 | 12.3%), Transportation (159 | 6.9%), and Material Moving (109 | 4.7%).
Production, Transportation and Moving Occupations by Sex
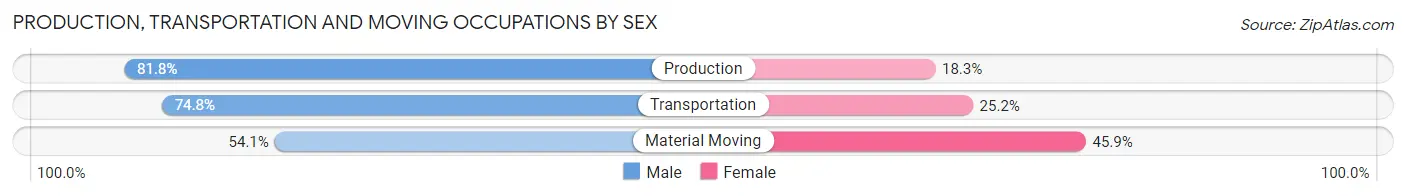
| Occupation | Male | Female |
| Production | 233 (81.8%) | 52 (18.2%) |
| Transportation | 119 (74.8%) | 40 (25.2%) |
| Material Moving | 59 (54.1%) | 50 (45.9%) |
| Total (Category) | 411 (74.3%) | 142 (25.7%) |
| Total (Overall) | 1,152 (49.9%) | 1,156 (50.1%) |
Employment Industries by Sex in Lancaster
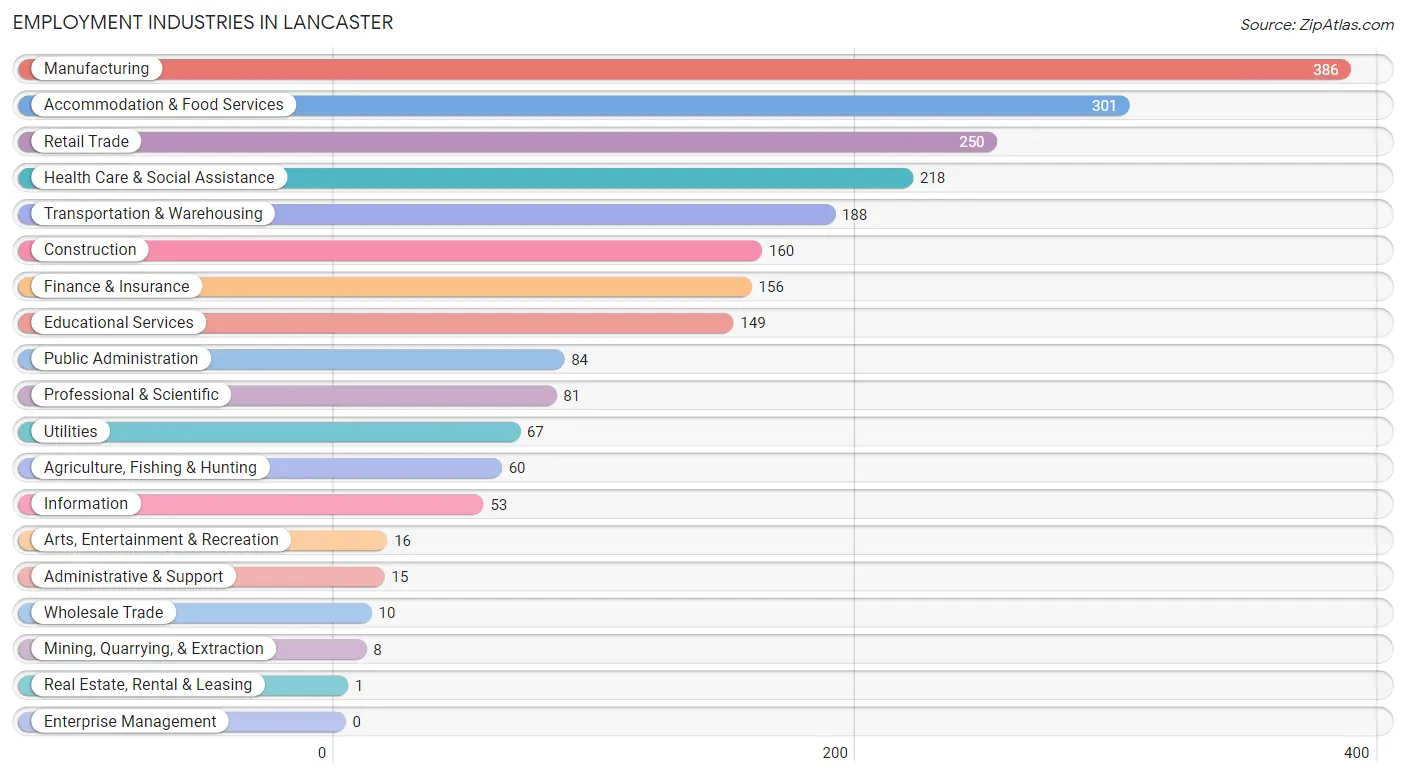
Employment Industries in Lancaster
The major employment industries in Lancaster include Manufacturing (386 | 16.7%), Accommodation & Food Services (301 | 13.0%), Retail Trade (250 | 10.8%), Health Care & Social Assistance (218 | 9.5%), and Transportation & Warehousing (188 | 8.2%).
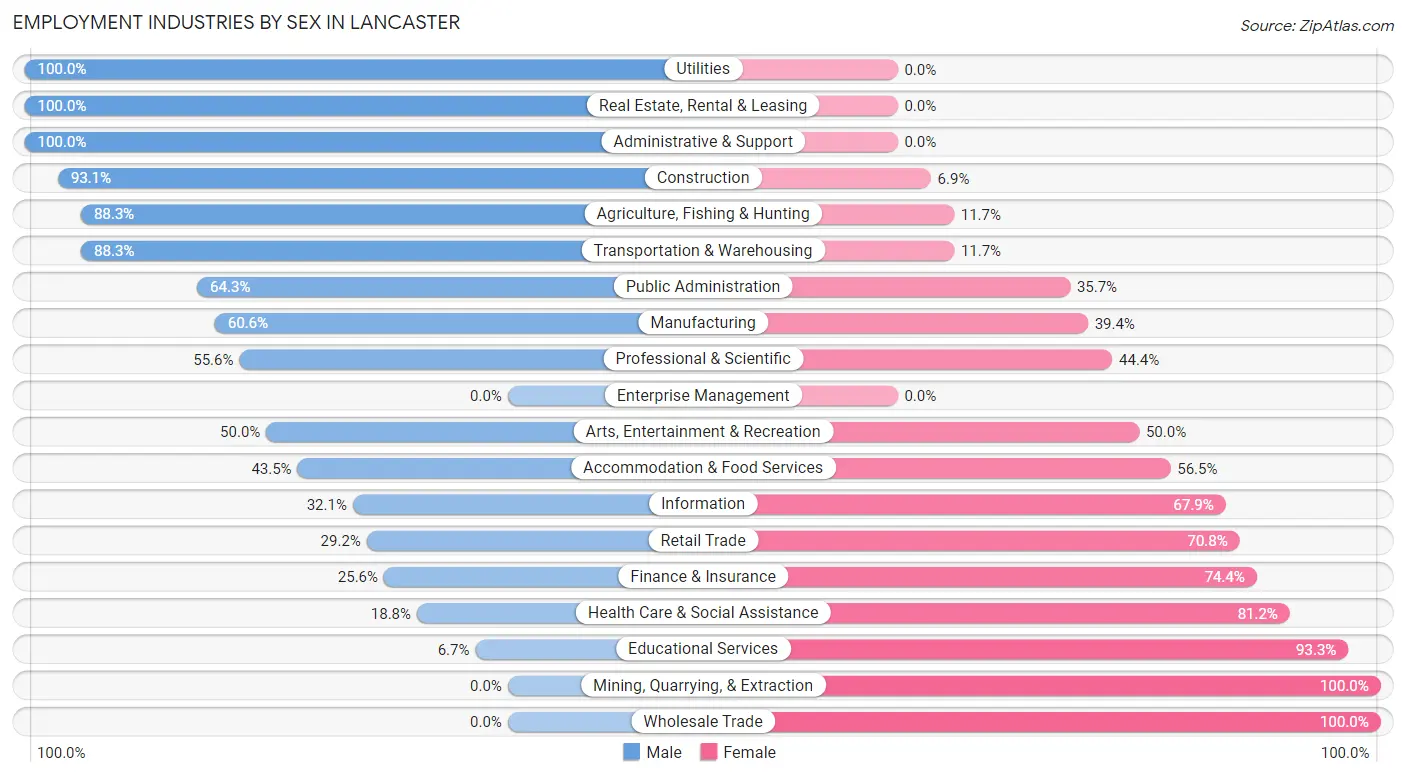
Employment Industries by Sex in Lancaster
The Lancaster industries that see more men than women are Utilities (100.0%), Real Estate, Rental & Leasing (100.0%), and Administrative & Support (100.0%), whereas the industries that tend to have a higher number of women are Mining, Quarrying, & Extraction (100.0%), Wholesale Trade (100.0%), and Educational Services (93.3%).
| Industry | Male | Female |
| Agriculture, Fishing & Hunting | 53 (88.3%) | 7 (11.7%) |
| Mining, Quarrying, & Extraction | 0 (0.0%) | 8 (100.0%) |
| Construction | 149 (93.1%) | 11 (6.9%) |
| Manufacturing | 234 (60.6%) | 152 (39.4%) |
| Wholesale Trade | 0 (0.0%) | 10 (100.0%) |
| Retail Trade | 73 (29.2%) | 177 (70.8%) |
| Transportation & Warehousing | 166 (88.3%) | 22 (11.7%) |
| Utilities | 67 (100.0%) | 0 (0.0%) |
| Information | 17 (32.1%) | 36 (67.9%) |
| Finance & Insurance | 40 (25.6%) | 116 (74.4%) |
| Real Estate, Rental & Leasing | 1 (100.0%) | 0 (0.0%) |
| Professional & Scientific | 45 (55.6%) | 36 (44.4%) |
| Enterprise Management | 0 (0.0%) | 0 (0.0%) |
| Administrative & Support | 15 (100.0%) | 0 (0.0%) |
| Educational Services | 10 (6.7%) | 139 (93.3%) |
| Health Care & Social Assistance | 41 (18.8%) | 177 (81.2%) |
| Arts, Entertainment & Recreation | 8 (50.0%) | 8 (50.0%) |
| Accommodation & Food Services | 131 (43.5%) | 170 (56.5%) |
| Public Administration | 54 (64.3%) | 30 (35.7%) |
| Total | 1,152 (49.9%) | 1,156 (50.1%) |
Education in Lancaster
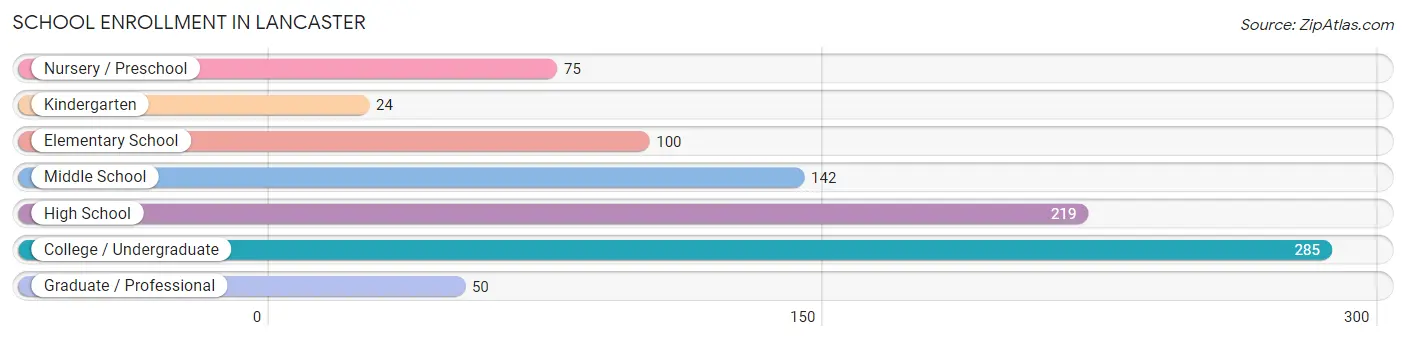
School Enrollment in Lancaster
The most common levels of schooling among the 895 students in Lancaster are college / undergraduate (285 | 31.8%), high school (219 | 24.5%), and middle school (142 | 15.9%).
| School Level | # Students | % Students |
| Nursery / Preschool | 75 | 8.4% |
| Kindergarten | 24 | 2.7% |
| Elementary School | 100 | 11.2% |
| Middle School | 142 | 15.9% |
| High School | 219 | 24.5% |
| College / Undergraduate | 285 | 31.8% |
| Graduate / Professional | 50 | 5.6% |
| Total | 895 | 100.0% |
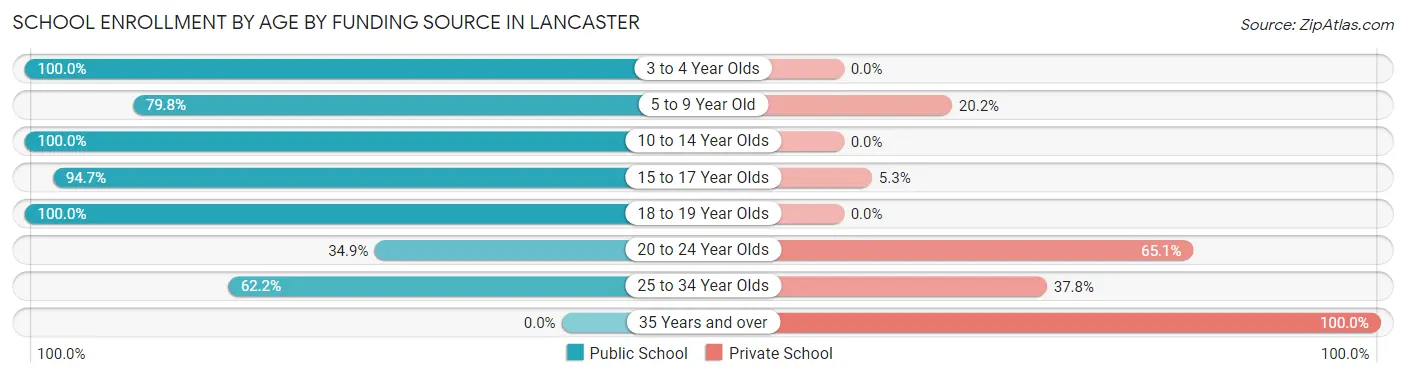
School Enrollment by Age by Funding Source in Lancaster
Out of a total of 895 students who are enrolled in schools in Lancaster, 113 (12.6%) attend a private institution, while the remaining 782 (87.4%) are enrolled in public schools. The age group of 35 years and over has the highest likelihood of being enrolled in private schools, with 8 (100.0% in the age bracket) enrolled. Conversely, the age group of 3 to 4 year olds has the lowest likelihood of being enrolled in a private school, with 75 (100.0% in the age bracket) attending a public institution.
| Age Bracket | Public School | Private School |
| 3 to 4 Year Olds | 75 (100.0%) | 0 (0.0%) |
| 5 to 9 Year Old | 99 (79.8%) | 25 (20.2%) |
| 10 to 14 Year Olds | 127 (100.0%) | 0 (0.0%) |
| 15 to 17 Year Olds | 180 (94.7%) | 10 (5.3%) |
| 18 to 19 Year Olds | 217 (100.0%) | 0 (0.0%) |
| 20 to 24 Year Olds | 15 (34.9%) | 28 (65.1%) |
| 25 to 34 Year Olds | 69 (62.2%) | 42 (37.8%) |
| 35 Years and over | 0 (0.0%) | 8 (100.0%) |
| Total | 782 (87.4%) | 113 (12.6%) |
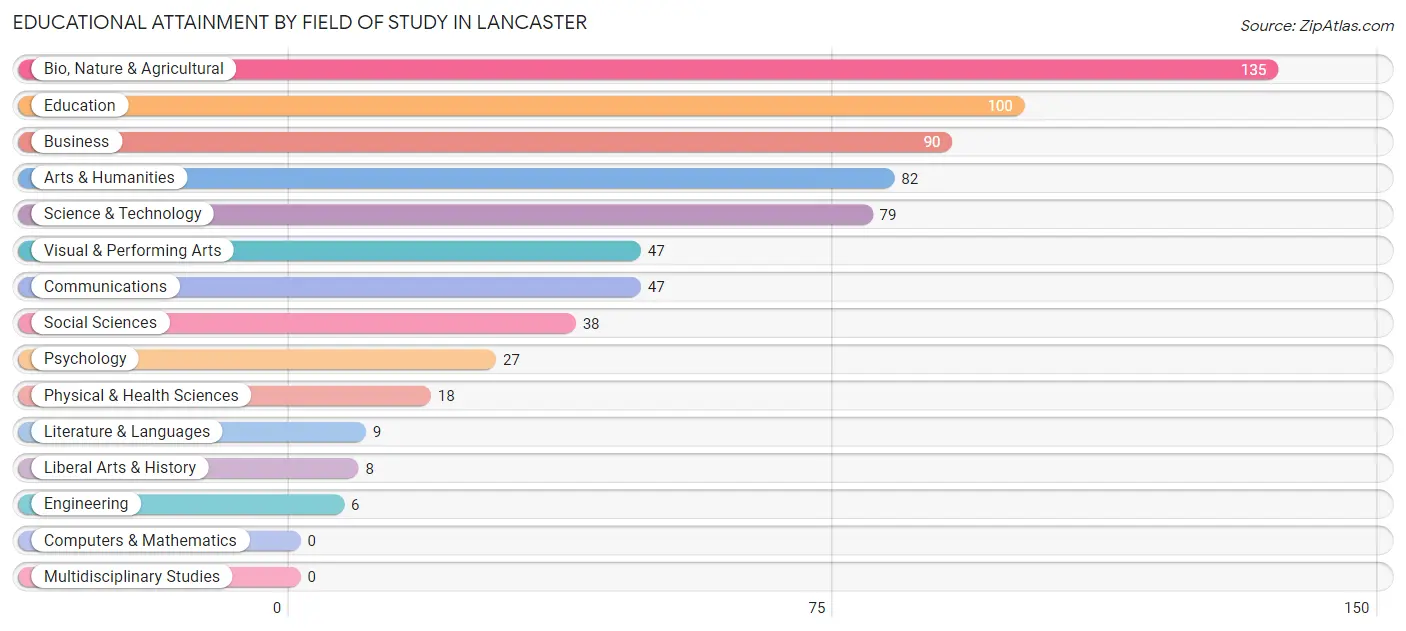
Educational Attainment by Field of Study in Lancaster
Bio, nature & agricultural (135 | 19.7%), education (100 | 14.6%), business (90 | 13.1%), arts & humanities (82 | 11.9%), and science & technology (79 | 11.5%) are the most common fields of study among 686 individuals in Lancaster who have obtained a bachelor's degree or higher.
| Field of Study | # Graduates | % Graduates |
| Computers & Mathematics | 0 | 0.0% |
| Bio, Nature & Agricultural | 135 | 19.7% |
| Physical & Health Sciences | 18 | 2.6% |
| Psychology | 27 | 3.9% |
| Social Sciences | 38 | 5.5% |
| Engineering | 6 | 0.9% |
| Multidisciplinary Studies | 0 | 0.0% |
| Science & Technology | 79 | 11.5% |
| Business | 90 | 13.1% |
| Education | 100 | 14.6% |
| Literature & Languages | 9 | 1.3% |
| Liberal Arts & History | 8 | 1.2% |
| Visual & Performing Arts | 47 | 6.9% |
| Communications | 47 | 6.9% |
| Arts & Humanities | 82 | 11.9% |
| Total | 686 | 100.0% |
Transportation & Commute in Lancaster
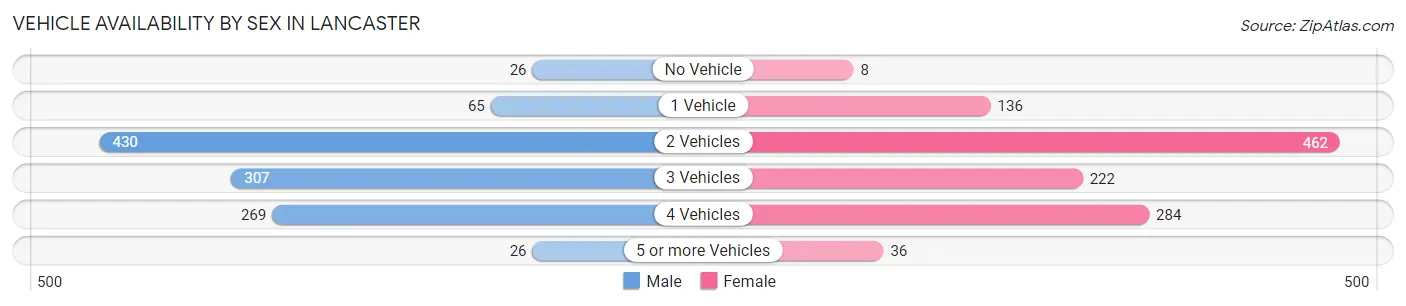
Vehicle Availability by Sex in Lancaster
The most prevalent vehicle ownership categories in Lancaster are males with 2 vehicles (430, accounting for 38.3%) and females with 2 vehicles (462, making up 37.5%).
| Vehicles Available | Male | Female |
| No Vehicle | 26 (2.3%) | 8 (0.7%) |
| 1 Vehicle | 65 (5.8%) | 136 (11.8%) |
| 2 Vehicles | 430 (38.3%) | 462 (40.2%) |
| 3 Vehicles | 307 (27.3%) | 222 (19.3%) |
| 4 Vehicles | 269 (23.9%) | 284 (24.7%) |
| 5 or more Vehicles | 26 (2.3%) | 36 (3.1%) |
| Total | 1,123 (100.0%) | 1,148 (100.0%) |
Commute Time in Lancaster
The most frequently occuring commute durations in Lancaster are 5 to 9 minutes (560 commuters, 26.2%), 20 to 24 minutes (339 commuters, 15.9%), and 10 to 14 minutes (299 commuters, 14.0%).
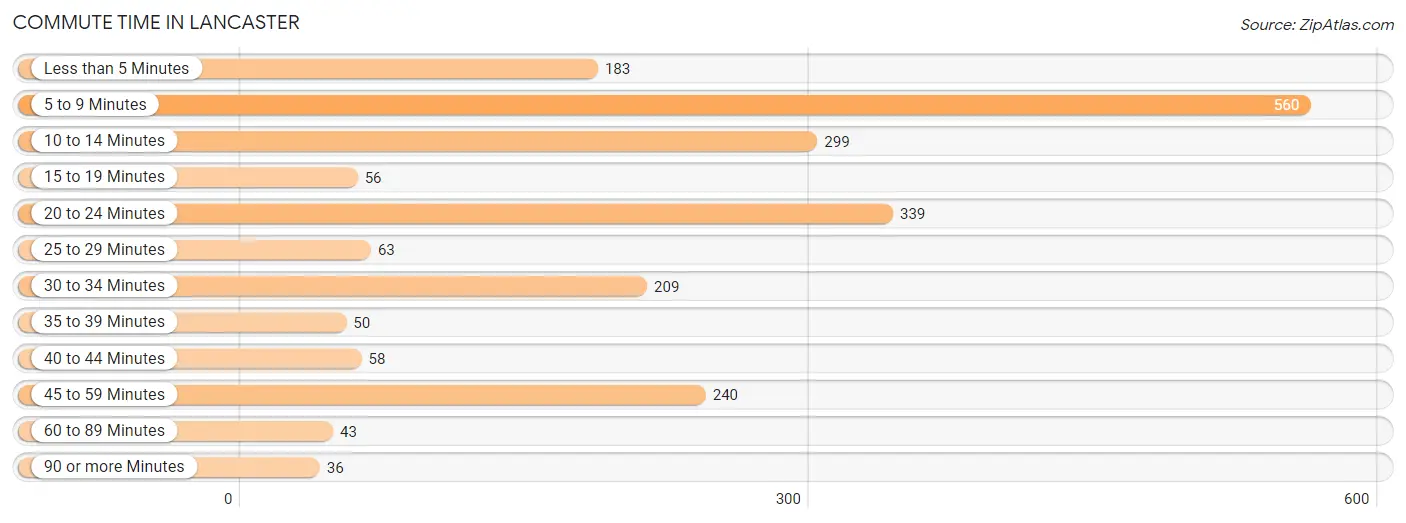
| Commute Time | # Commuters | % Commuters |
| Less than 5 Minutes | 183 | 8.6% |
| 5 to 9 Minutes | 560 | 26.2% |
| 10 to 14 Minutes | 299 | 14.0% |
| 15 to 19 Minutes | 56 | 2.6% |
| 20 to 24 Minutes | 339 | 15.9% |
| 25 to 29 Minutes | 63 | 2.9% |
| 30 to 34 Minutes | 209 | 9.8% |
| 35 to 39 Minutes | 50 | 2.3% |
| 40 to 44 Minutes | 58 | 2.7% |
| 45 to 59 Minutes | 240 | 11.2% |
| 60 to 89 Minutes | 43 | 2.0% |
| 90 or more Minutes | 36 | 1.7% |
Commute Time by Sex in Lancaster
The most common commute times in Lancaster are 5 to 9 minutes (253 commuters, 23.4%) for males and 5 to 9 minutes (307 commuters, 29.1%) for females.
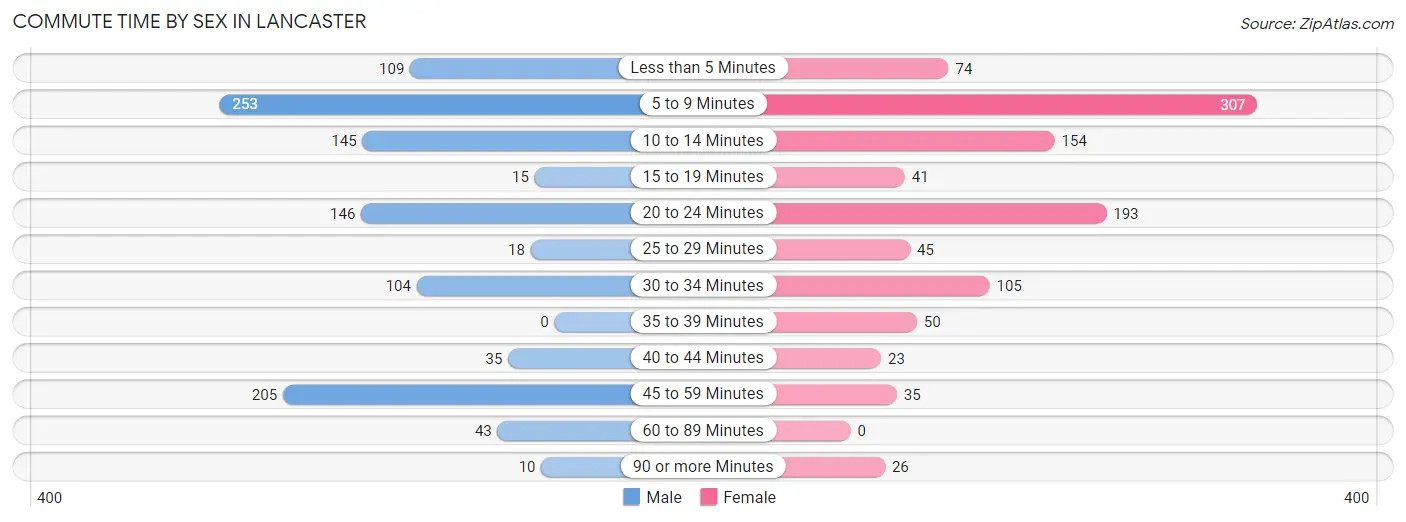
| Commute Time | Male | Female |
| Less than 5 Minutes | 109 (10.1%) | 74 (7.0%) |
| 5 to 9 Minutes | 253 (23.4%) | 307 (29.1%) |
| 10 to 14 Minutes | 145 (13.4%) | 154 (14.6%) |
| 15 to 19 Minutes | 15 (1.4%) | 41 (3.9%) |
| 20 to 24 Minutes | 146 (13.5%) | 193 (18.3%) |
| 25 to 29 Minutes | 18 (1.7%) | 45 (4.3%) |
| 30 to 34 Minutes | 104 (9.6%) | 105 (10.0%) |
| 35 to 39 Minutes | 0 (0.0%) | 50 (4.8%) |
| 40 to 44 Minutes | 35 (3.2%) | 23 (2.2%) |
| 45 to 59 Minutes | 205 (18.9%) | 35 (3.3%) |
| 60 to 89 Minutes | 43 (4.0%) | 0 (0.0%) |
| 90 or more Minutes | 10 (0.9%) | 26 (2.5%) |
Time of Departure to Work by Sex in Lancaster
The most frequent times of departure to work in Lancaster are 7:30 AM to 7:59 AM (193, 17.8%) for males and 7:30 AM to 7:59 AM (298, 28.3%) for females.
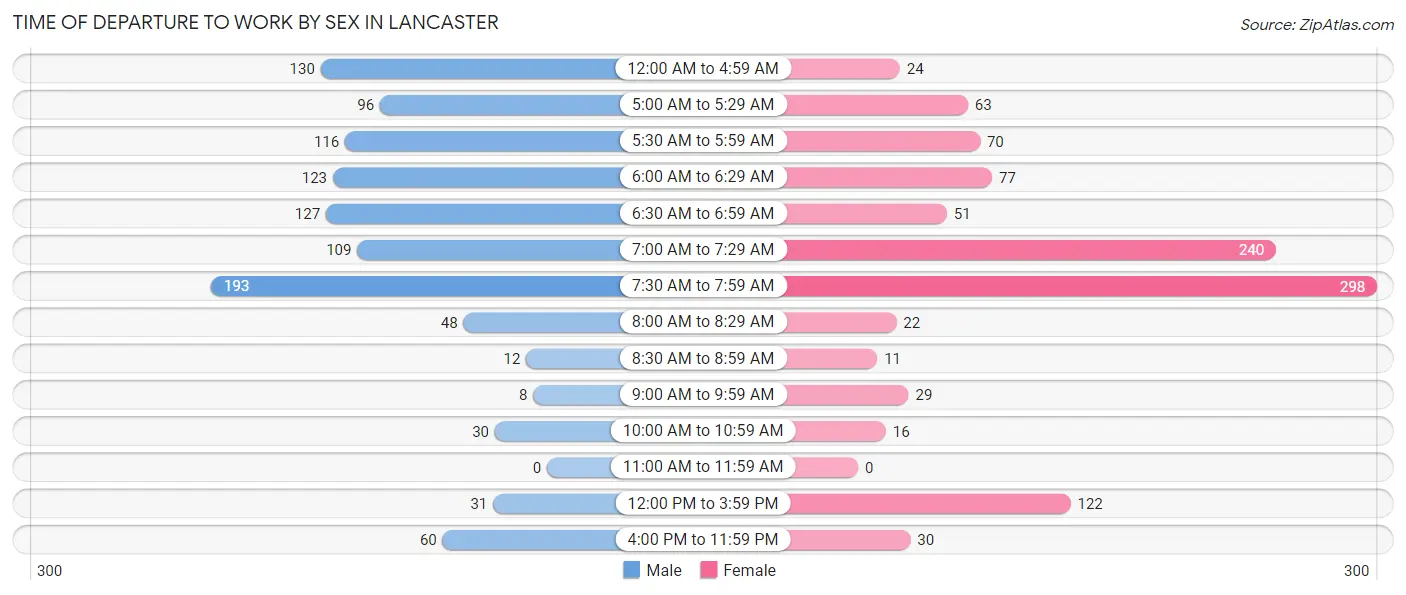
| Time of Departure | Male | Female |
| 12:00 AM to 4:59 AM | 130 (12.0%) | 24 (2.3%) |
| 5:00 AM to 5:29 AM | 96 (8.9%) | 63 (6.0%) |
| 5:30 AM to 5:59 AM | 116 (10.7%) | 70 (6.7%) |
| 6:00 AM to 6:29 AM | 123 (11.4%) | 77 (7.3%) |
| 6:30 AM to 6:59 AM | 127 (11.7%) | 51 (4.8%) |
| 7:00 AM to 7:29 AM | 109 (10.1%) | 240 (22.8%) |
| 7:30 AM to 7:59 AM | 193 (17.8%) | 298 (28.3%) |
| 8:00 AM to 8:29 AM | 48 (4.4%) | 22 (2.1%) |
| 8:30 AM to 8:59 AM | 12 (1.1%) | 11 (1.0%) |
| 9:00 AM to 9:59 AM | 8 (0.7%) | 29 (2.8%) |
| 10:00 AM to 10:59 AM | 30 (2.8%) | 16 (1.5%) |
| 11:00 AM to 11:59 AM | 0 (0.0%) | 0 (0.0%) |
| 12:00 PM to 3:59 PM | 31 (2.9%) | 122 (11.6%) |
| 4:00 PM to 11:59 PM | 60 (5.5%) | 30 (2.9%) |
| Total | 1,083 (100.0%) | 1,053 (100.0%) |
Housing Occupancy in Lancaster
Occupancy by Ownership in Lancaster
Of the total 1,561 dwellings in Lancaster, owner-occupied units account for 1,104 (70.7%), while renter-occupied units make up 457 (29.3%).
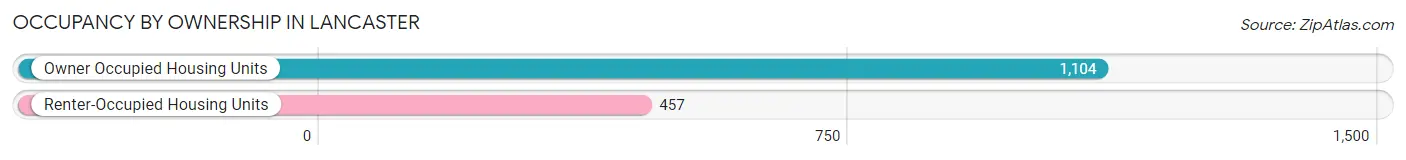
| Occupancy | # Housing Units | % Housing Units |
| Owner Occupied Housing Units | 1,104 | 70.7% |
| Renter-Occupied Housing Units | 457 | 29.3% |
| Total Occupied Housing Units | 1,561 | 100.0% |
Occupancy by Household Size in Lancaster
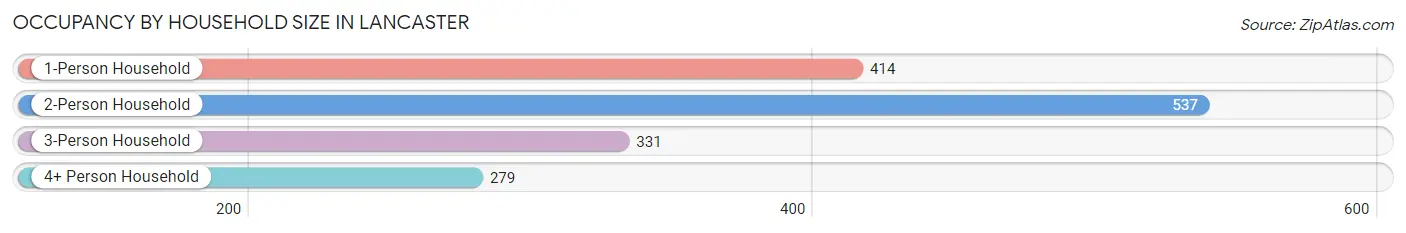
| Household Size | # Housing Units | % Housing Units |
| 1-Person Household | 414 | 26.5% |
| 2-Person Household | 537 | 34.4% |
| 3-Person Household | 331 | 21.2% |
| 4+ Person Household | 279 | 17.9% |
| Total Housing Units | 1,561 | 100.0% |
Occupancy by Ownership by Household Size in Lancaster
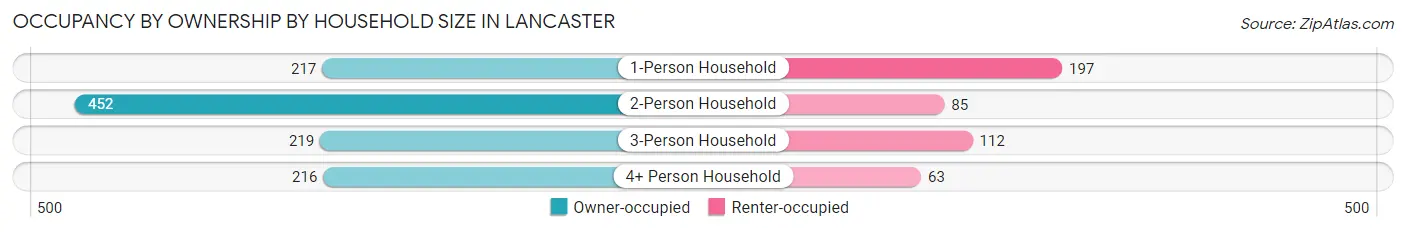
| Household Size | Owner-occupied | Renter-occupied |
| 1-Person Household | 217 (52.4%) | 197 (47.6%) |
| 2-Person Household | 452 (84.2%) | 85 (15.8%) |
| 3-Person Household | 219 (66.2%) | 112 (33.8%) |
| 4+ Person Household | 216 (77.4%) | 63 (22.6%) |
| Total Housing Units | 1,104 (70.7%) | 457 (29.3%) |
Occupancy by Educational Attainment in Lancaster
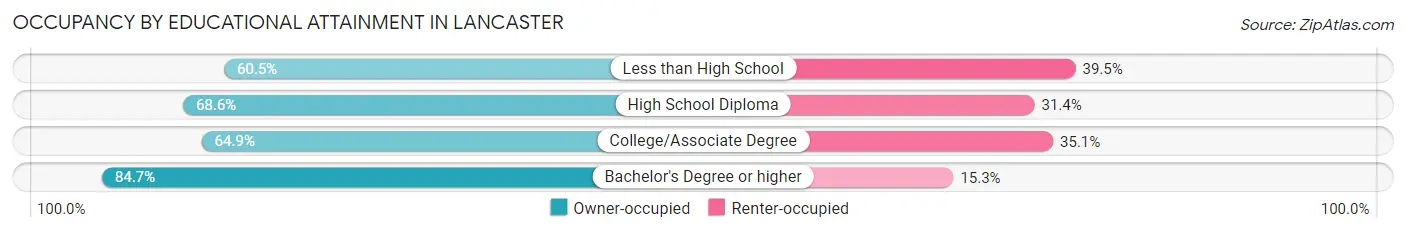
| Household Size | Owner-occupied | Renter-occupied |
| Less than High School | 26 (60.5%) | 17 (39.5%) |
| High School Diploma | 354 (68.6%) | 162 (31.4%) |
| College/Associate Degree | 409 (64.9%) | 221 (35.1%) |
| Bachelor's Degree or higher | 315 (84.7%) | 57 (15.3%) |
Occupancy by Age of Householder in Lancaster
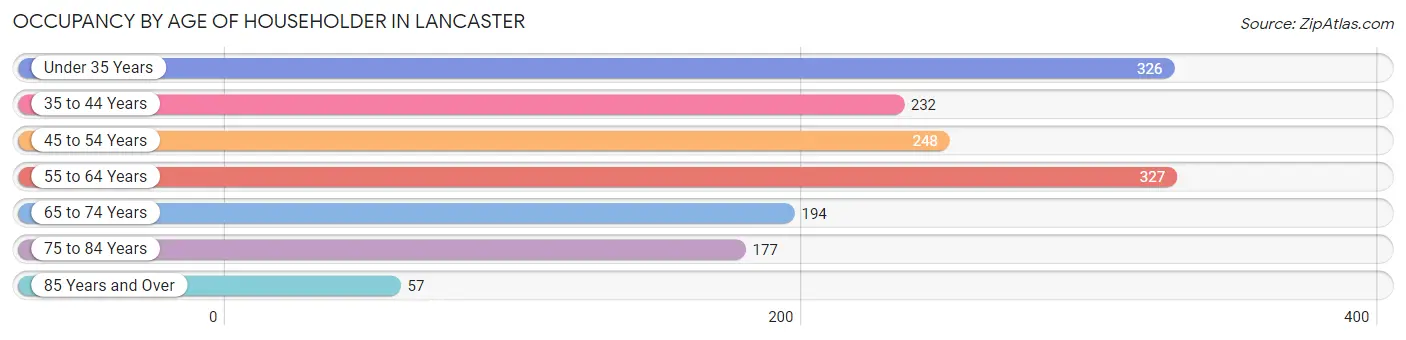
| Age Bracket | # Households | % Households |
| Under 35 Years | 326 | 20.9% |
| 35 to 44 Years | 232 | 14.9% |
| 45 to 54 Years | 248 | 15.9% |
| 55 to 64 Years | 327 | 20.9% |
| 65 to 74 Years | 194 | 12.4% |
| 75 to 84 Years | 177 | 11.3% |
| 85 Years and Over | 57 | 3.6% |
| Total | 1,561 | 100.0% |
Housing Finances in Lancaster
Median Income by Occupancy in Lancaster
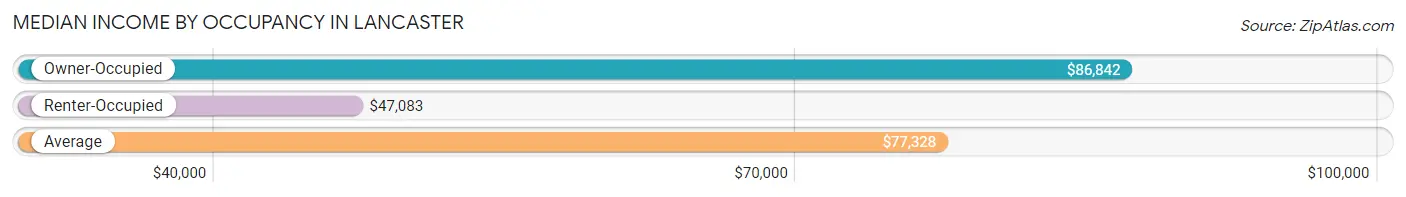
| Occupancy Type | # Households | Median Income |
| Owner-Occupied | 1,104 (70.7%) | $86,842 |
| Renter-Occupied | 457 (29.3%) | $47,083 |
| Average | 1,561 (100.0%) | $77,328 |
Occupancy by Householder Income Bracket in Lancaster
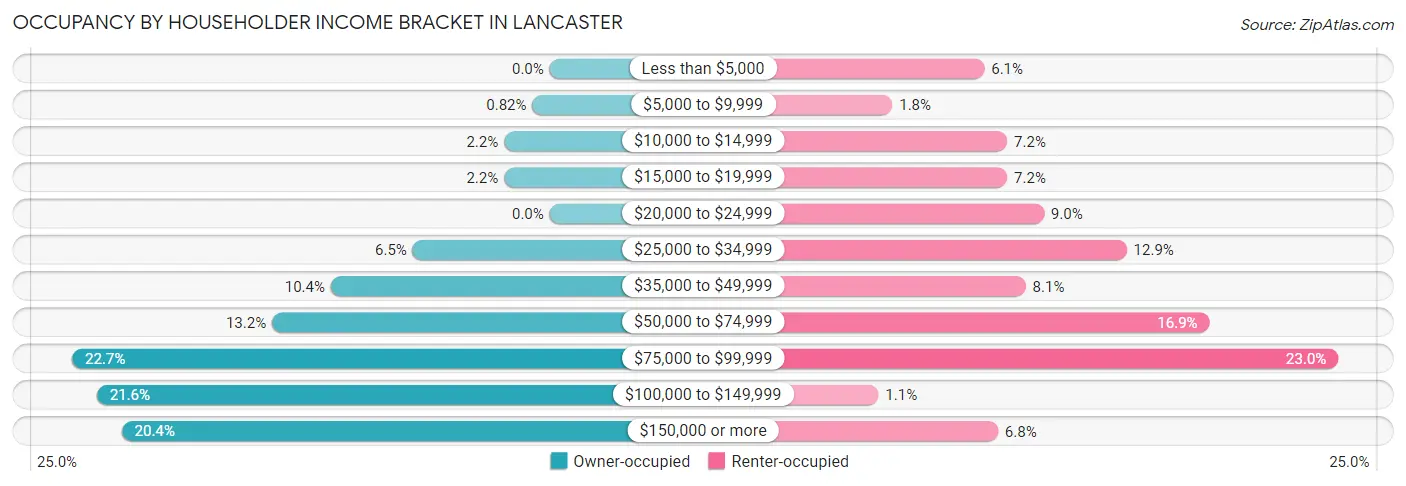
| Income Bracket | Owner-occupied | Renter-occupied |
| Less than $5,000 | 0 (0.0%) | 28 (6.1%) |
| $5,000 to $9,999 | 9 (0.8%) | 8 (1.8%) |
| $10,000 to $14,999 | 24 (2.2%) | 33 (7.2%) |
| $15,000 to $19,999 | 24 (2.2%) | 33 (7.2%) |
| $20,000 to $24,999 | 0 (0.0%) | 41 (9.0%) |
| $25,000 to $34,999 | 72 (6.5%) | 59 (12.9%) |
| $35,000 to $49,999 | 115 (10.4%) | 37 (8.1%) |
| $50,000 to $74,999 | 146 (13.2%) | 77 (16.9%) |
| $75,000 to $99,999 | 251 (22.7%) | 105 (23.0%) |
| $100,000 to $149,999 | 238 (21.6%) | 5 (1.1%) |
| $150,000 or more | 225 (20.4%) | 31 (6.8%) |
| Total | 1,104 (100.0%) | 457 (100.0%) |
Monthly Housing Cost Tiers in Lancaster
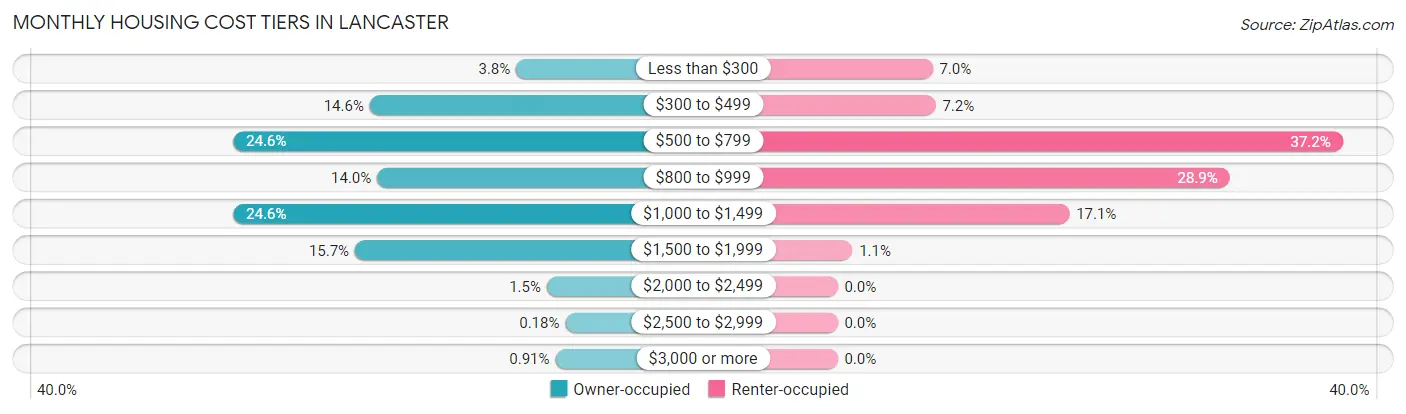
| Monthly Cost | Owner-occupied | Renter-occupied |
| Less than $300 | 42 (3.8%) | 32 (7.0%) |
| $300 to $499 | 161 (14.6%) | 33 (7.2%) |
| $500 to $799 | 272 (24.6%) | 170 (37.2%) |
| $800 to $999 | 155 (14.0%) | 132 (28.9%) |
| $1,000 to $1,499 | 272 (24.6%) | 78 (17.1%) |
| $1,500 to $1,999 | 173 (15.7%) | 5 (1.1%) |
| $2,000 to $2,499 | 17 (1.5%) | 0 (0.0%) |
| $2,500 to $2,999 | 2 (0.2%) | 0 (0.0%) |
| $3,000 or more | 10 (0.9%) | 0 (0.0%) |
| Total | 1,104 (100.0%) | 457 (100.0%) |
Physical Housing Characteristics in Lancaster
Housing Structures in Lancaster
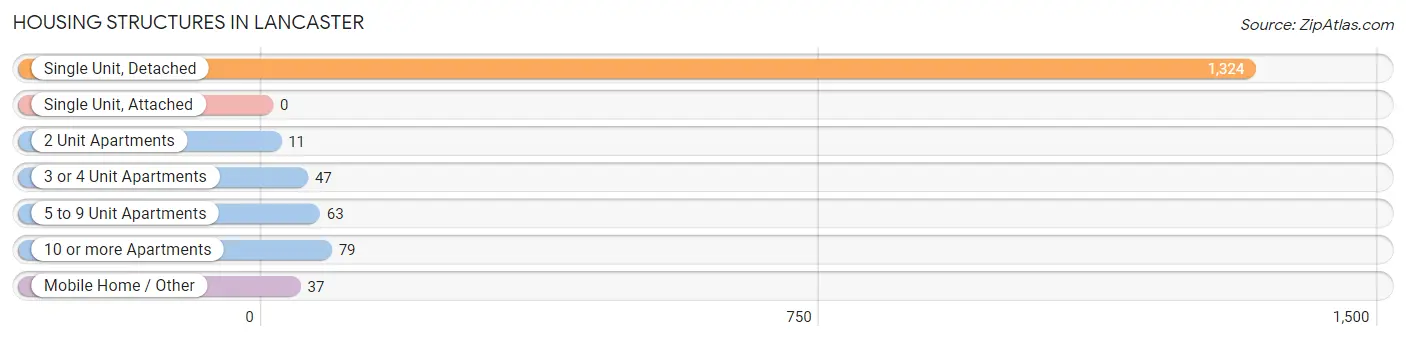
| Structure Type | # Housing Units | % Housing Units |
| Single Unit, Detached | 1,324 | 84.8% |
| Single Unit, Attached | 0 | 0.0% |
| 2 Unit Apartments | 11 | 0.7% |
| 3 or 4 Unit Apartments | 47 | 3.0% |
| 5 to 9 Unit Apartments | 63 | 4.0% |
| 10 or more Apartments | 79 | 5.1% |
| Mobile Home / Other | 37 | 2.4% |
| Total | 1,561 | 100.0% |
Housing Structures by Occupancy in Lancaster
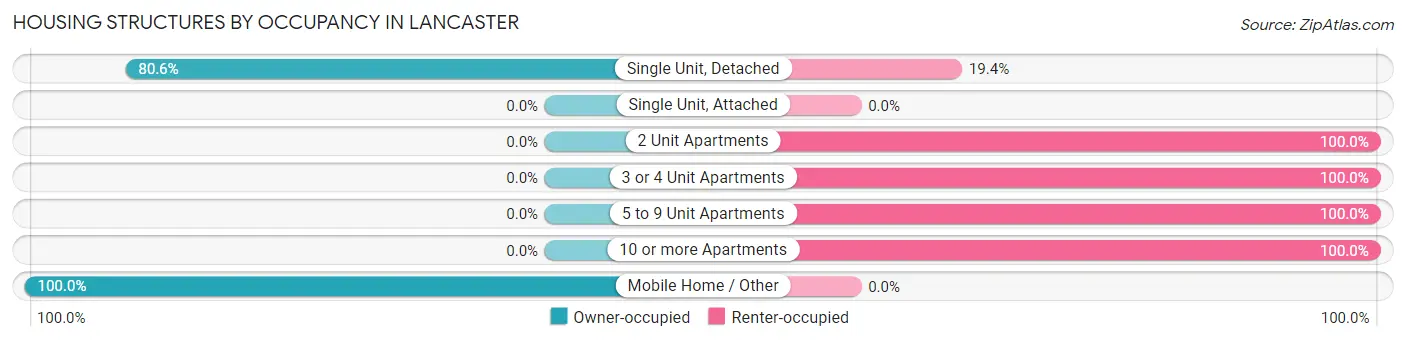
| Structure Type | Owner-occupied | Renter-occupied |
| Single Unit, Detached | 1,067 (80.6%) | 257 (19.4%) |
| Single Unit, Attached | 0 (0.0%) | 0 (0.0%) |
| 2 Unit Apartments | 0 (0.0%) | 11 (100.0%) |
| 3 or 4 Unit Apartments | 0 (0.0%) | 47 (100.0%) |
| 5 to 9 Unit Apartments | 0 (0.0%) | 63 (100.0%) |
| 10 or more Apartments | 0 (0.0%) | 79 (100.0%) |
| Mobile Home / Other | 37 (100.0%) | 0 (0.0%) |
| Total | 1,104 (70.7%) | 457 (29.3%) |
Housing Structures by Number of Rooms in Lancaster
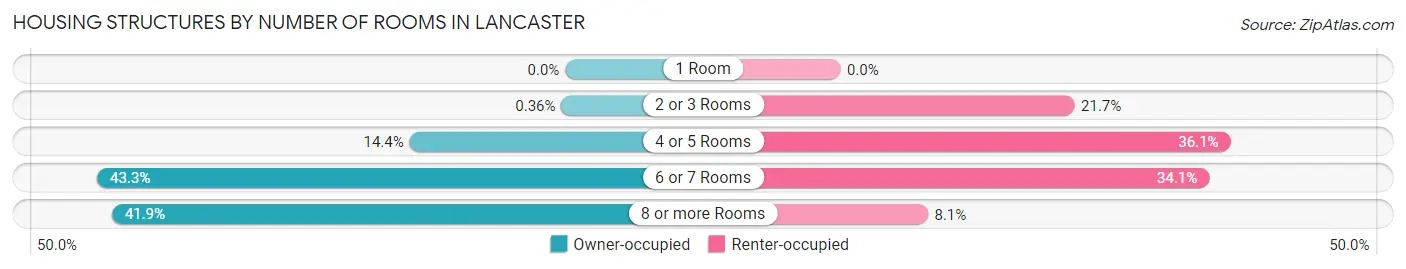
| Number of Rooms | Owner-occupied | Renter-occupied |
| 1 Room | 0 (0.0%) | 0 (0.0%) |
| 2 or 3 Rooms | 4 (0.4%) | 99 (21.7%) |
| 4 or 5 Rooms | 159 (14.4%) | 165 (36.1%) |
| 6 or 7 Rooms | 478 (43.3%) | 156 (34.1%) |
| 8 or more Rooms | 463 (41.9%) | 37 (8.1%) |
| Total | 1,104 (100.0%) | 457 (100.0%) |
Housing Structure by Heating Type in Lancaster
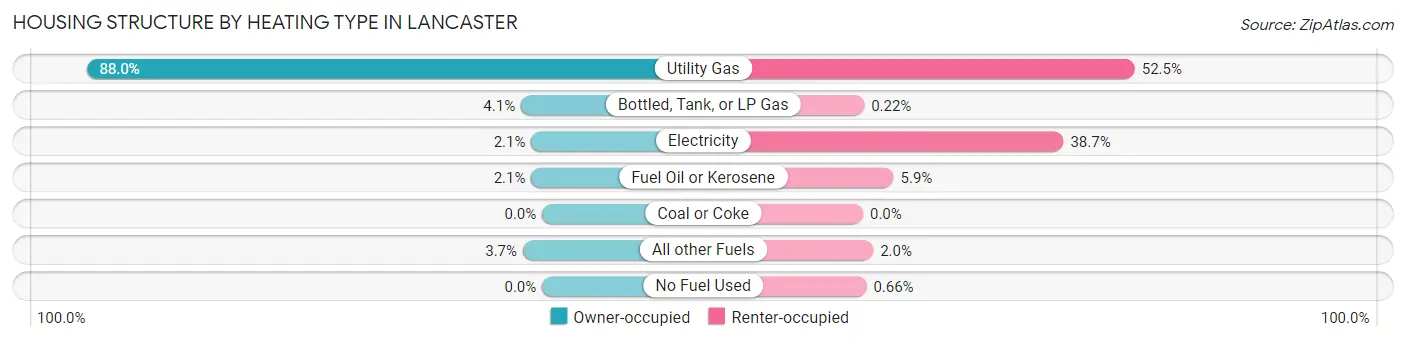
| Heating Type | Owner-occupied | Renter-occupied |
| Utility Gas | 972 (88.0%) | 240 (52.5%) |
| Bottled, Tank, or LP Gas | 45 (4.1%) | 1 (0.2%) |
| Electricity | 23 (2.1%) | 177 (38.7%) |
| Fuel Oil or Kerosene | 23 (2.1%) | 27 (5.9%) |
| Coal or Coke | 0 (0.0%) | 0 (0.0%) |
| All other Fuels | 41 (3.7%) | 9 (2.0%) |
| No Fuel Used | 0 (0.0%) | 3 (0.7%) |
| Total | 1,104 (100.0%) | 457 (100.0%) |
Household Vehicle Usage in Lancaster
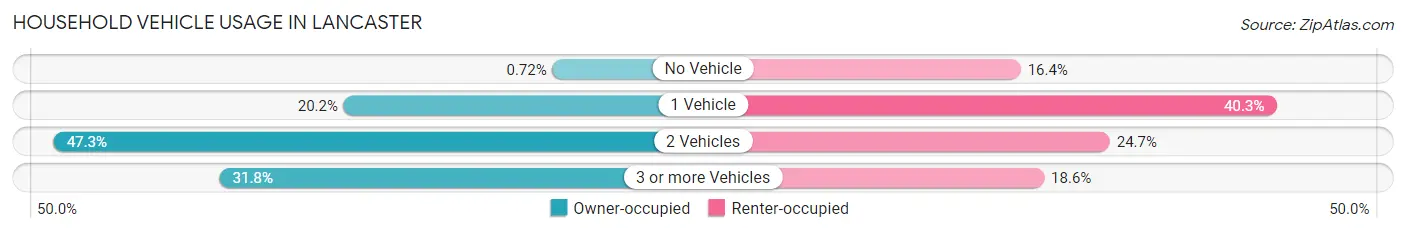
| Vehicles per Household | Owner-occupied | Renter-occupied |
| No Vehicle | 8 (0.7%) | 75 (16.4%) |
| 1 Vehicle | 223 (20.2%) | 184 (40.3%) |
| 2 Vehicles | 522 (47.3%) | 113 (24.7%) |
| 3 or more Vehicles | 351 (31.8%) | 85 (18.6%) |
| Total | 1,104 (100.0%) | 457 (100.0%) |
Real Estate & Mortgages in Lancaster
Real Estate and Mortgage Overview in Lancaster
| Characteristic | Without Mortgage | With Mortgage |
| Housing Units | 444 | 660 |
| Median Property Value | $161,000 | $173,100 |
| Median Household Income | $70,000 | $144 |
| Monthly Housing Costs | $514 | $10 |
| Real Estate Taxes | $2,491 | $0 |
Property Value by Mortgage Status in Lancaster
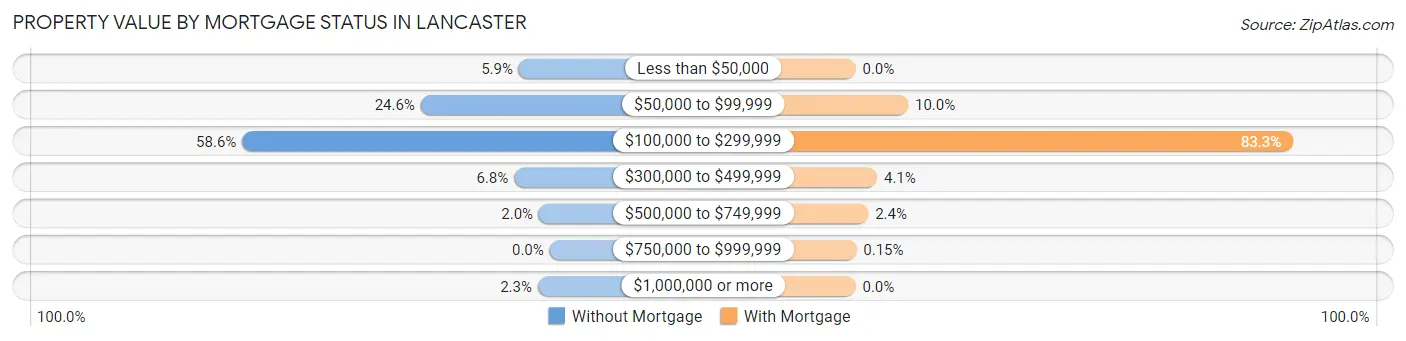
| Property Value | Without Mortgage | With Mortgage |
| Less than $50,000 | 26 (5.9%) | 0 (0.0%) |
| $50,000 to $99,999 | 109 (24.5%) | 66 (10.0%) |
| $100,000 to $299,999 | 260 (58.6%) | 550 (83.3%) |
| $300,000 to $499,999 | 30 (6.8%) | 27 (4.1%) |
| $500,000 to $749,999 | 9 (2.0%) | 16 (2.4%) |
| $750,000 to $999,999 | 0 (0.0%) | 1 (0.2%) |
| $1,000,000 or more | 10 (2.2%) | 0 (0.0%) |
| Total | 444 (100.0%) | 660 (100.0%) |
Household Income by Mortgage Status in Lancaster
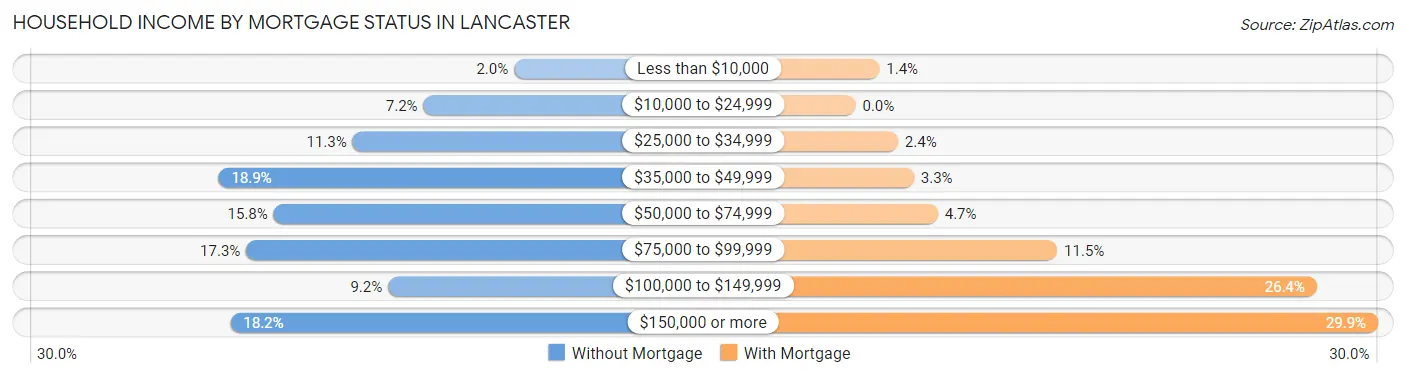
| Household Income | Without Mortgage | With Mortgage |
| Less than $10,000 | 9 (2.0%) | 9 (1.4%) |
| $10,000 to $24,999 | 32 (7.2%) | 0 (0.0%) |
| $25,000 to $34,999 | 50 (11.3%) | 16 (2.4%) |
| $35,000 to $49,999 | 84 (18.9%) | 22 (3.3%) |
| $50,000 to $74,999 | 70 (15.8%) | 31 (4.7%) |
| $75,000 to $99,999 | 77 (17.3%) | 76 (11.5%) |
| $100,000 to $149,999 | 41 (9.2%) | 174 (26.4%) |
| $150,000 or more | 81 (18.2%) | 197 (29.8%) |
| Total | 444 (100.0%) | 660 (100.0%) |
Property Value to Household Income Ratio in Lancaster
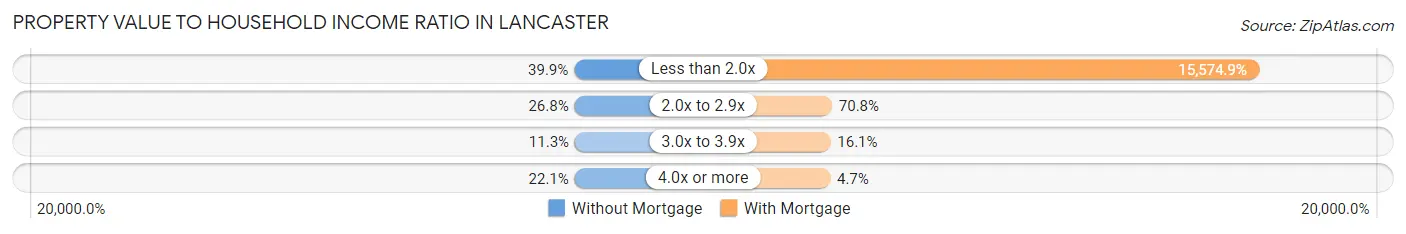
| Value-to-Income Ratio | Without Mortgage | With Mortgage |
| Less than 2.0x | 177 (39.9%) | 102,794 (15,574.9%) |
| 2.0x to 2.9x | 119 (26.8%) | 467 (70.8%) |
| 3.0x to 3.9x | 50 (11.3%) | 106 (16.1%) |
| 4.0x or more | 98 (22.1%) | 31 (4.7%) |
| Total | 444 (100.0%) | 660 (100.0%) |
Real Estate Taxes by Mortgage Status in Lancaster
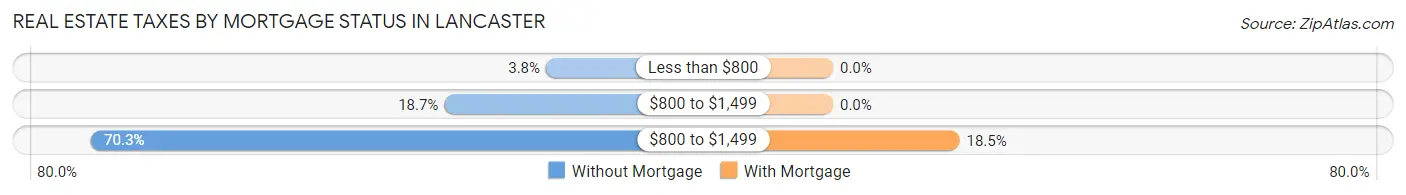
| Property Taxes | Without Mortgage | With Mortgage |
| Less than $800 | 17 (3.8%) | 0 (0.0%) |
| $800 to $1,499 | 83 (18.7%) | 0 (0.0%) |
| $800 to $1,499 | 312 (70.3%) | 122 (18.5%) |
| Total | 444 (100.0%) | 660 (100.0%) |
Health & Disability in Lancaster
Health Insurance Coverage by Age in Lancaster
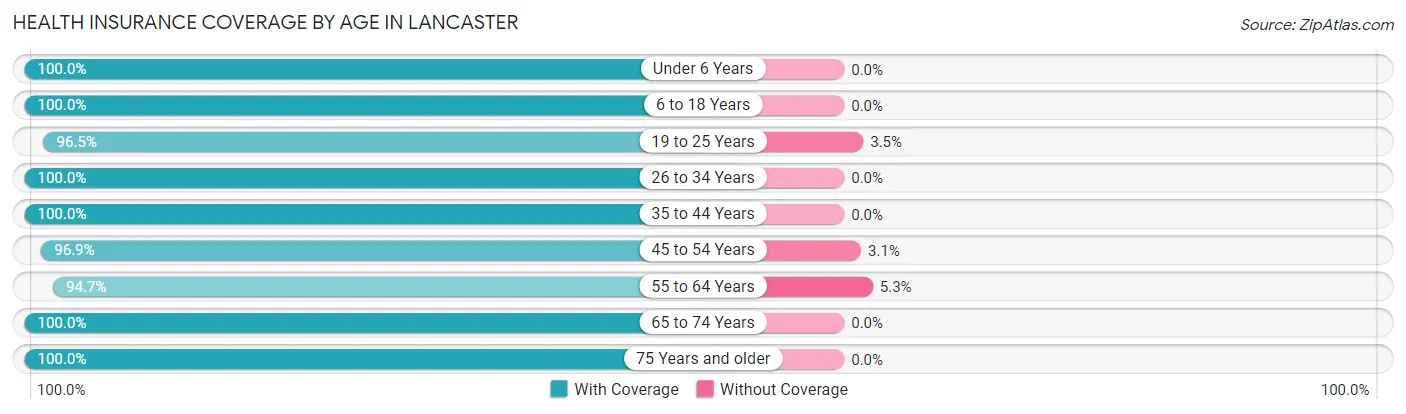
| Age Bracket | With Coverage | Without Coverage |
| Under 6 Years | 256 (100.0%) | 0 (0.0%) |
| 6 to 18 Years | 565 (100.0%) | 0 (0.0%) |
| 19 to 25 Years | 545 (96.5%) | 20 (3.5%) |
| 26 to 34 Years | 360 (100.0%) | 0 (0.0%) |
| 35 to 44 Years | 391 (100.0%) | 0 (0.0%) |
| 45 to 54 Years | 433 (96.9%) | 14 (3.1%) |
| 55 to 64 Years | 568 (94.7%) | 32 (5.3%) |
| 65 to 74 Years | 313 (100.0%) | 0 (0.0%) |
| 75 Years and older | 341 (100.0%) | 0 (0.0%) |
| Total | 3,772 (98.3%) | 66 (1.7%) |
Health Insurance Coverage by Citizenship Status in Lancaster
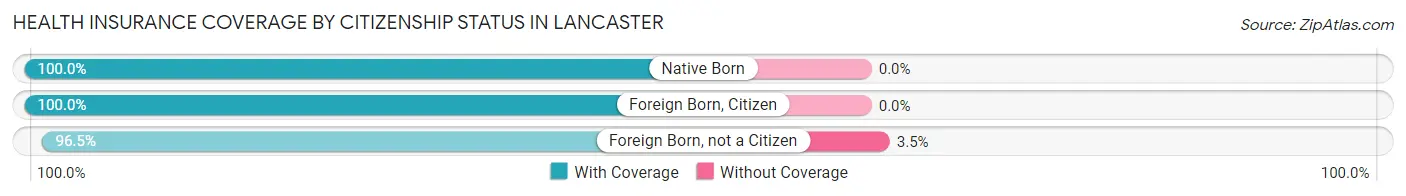
| Citizenship Status | With Coverage | Without Coverage |
| Native Born | 256 (100.0%) | 0 (0.0%) |
| Foreign Born, Citizen | 565 (100.0%) | 0 (0.0%) |
| Foreign Born, not a Citizen | 545 (96.5%) | 20 (3.5%) |
Health Insurance Coverage by Household Income in Lancaster
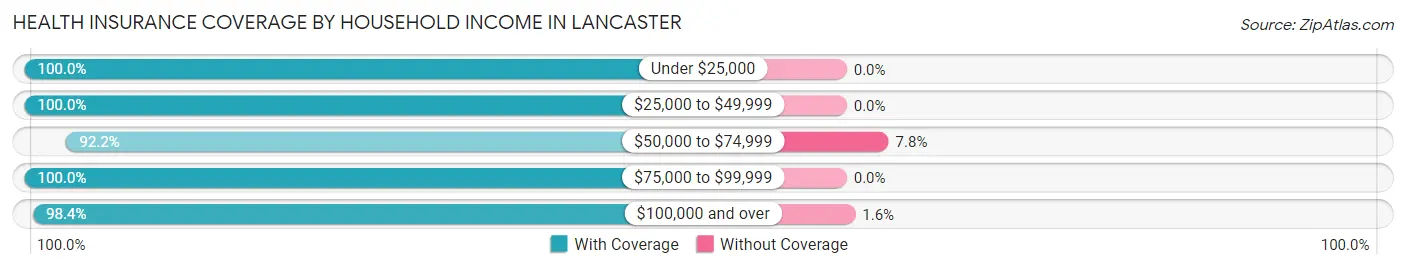
| Household Income | With Coverage | Without Coverage |
| Under $25,000 | 214 (100.0%) | 0 (0.0%) |
| $25,000 to $49,999 | 591 (100.0%) | 0 (0.0%) |
| $50,000 to $74,999 | 482 (92.2%) | 41 (7.8%) |
| $75,000 to $99,999 | 942 (100.0%) | 0 (0.0%) |
| $100,000 and over | 1,540 (98.4%) | 25 (1.6%) |
Public vs Private Health Insurance Coverage by Age in Lancaster
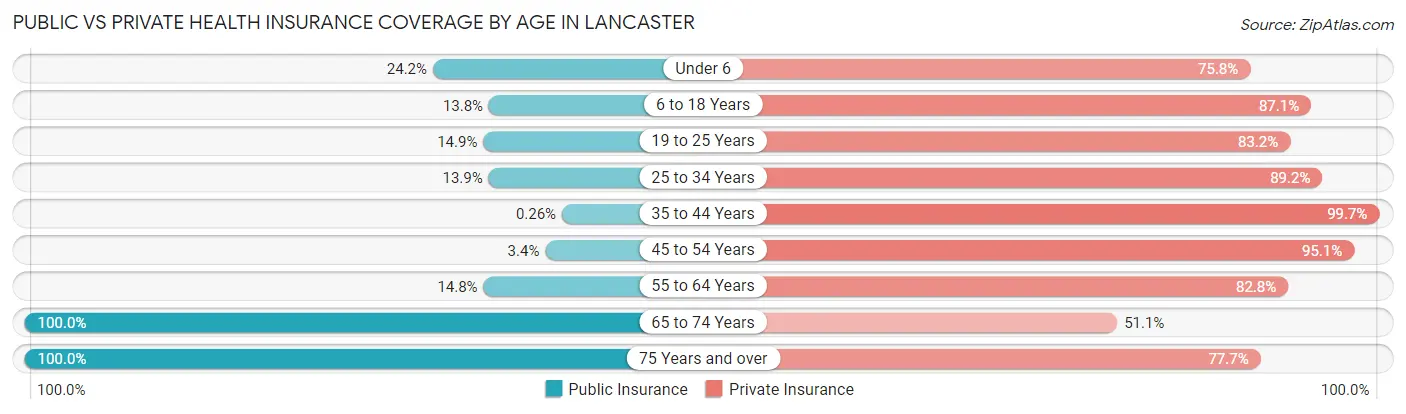
| Age Bracket | Public Insurance | Private Insurance |
| Under 6 | 62 (24.2%) | 194 (75.8%) |
| 6 to 18 Years | 78 (13.8%) | 492 (87.1%) |
| 19 to 25 Years | 84 (14.9%) | 470 (83.2%) |
| 25 to 34 Years | 50 (13.9%) | 321 (89.2%) |
| 35 to 44 Years | 1 (0.3%) | 390 (99.7%) |
| 45 to 54 Years | 15 (3.4%) | 425 (95.1%) |
| 55 to 64 Years | 89 (14.8%) | 497 (82.8%) |
| 65 to 74 Years | 313 (100.0%) | 160 (51.1%) |
| 75 Years and over | 341 (100.0%) | 265 (77.7%) |
| Total | 1,033 (26.9%) | 3,214 (83.7%) |
Disability Status by Sex by Age in Lancaster
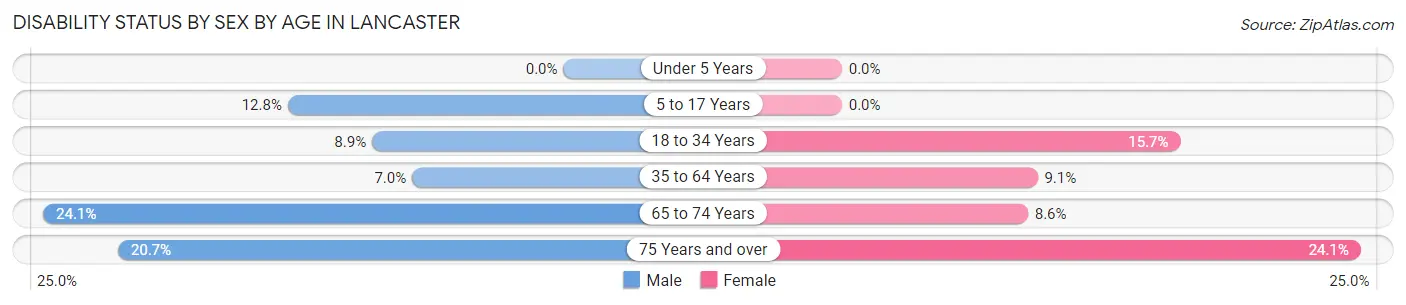
| Age Bracket | Male | Female |
| Under 5 Years | 0 (0.0%) | 0 (0.0%) |
| 5 to 17 Years | 39 (12.8%) | 0 (0.0%) |
| 18 to 34 Years | 42 (8.9%) | 90 (15.7%) |
| 35 to 64 Years | 53 (7.0%) | 62 (9.1%) |
| 65 to 74 Years | 28 (24.1%) | 17 (8.6%) |
| 75 Years and over | 31 (20.7%) | 46 (24.1%) |
Disability Class by Sex by Age in Lancaster
Disability Class: Hearing Difficulty
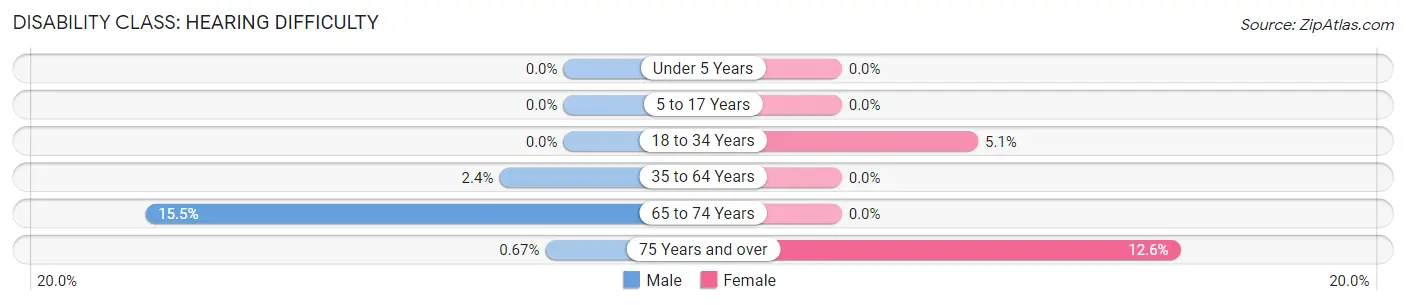
| Age Bracket | Male | Female |
| Under 5 Years | 0 (0.0%) | 0 (0.0%) |
| 5 to 17 Years | 0 (0.0%) | 0 (0.0%) |
| 18 to 34 Years | 0 (0.0%) | 29 (5.1%) |
| 35 to 64 Years | 18 (2.4%) | 0 (0.0%) |
| 65 to 74 Years | 18 (15.5%) | 0 (0.0%) |
| 75 Years and over | 1 (0.7%) | 24 (12.6%) |
Disability Class: Vision Difficulty
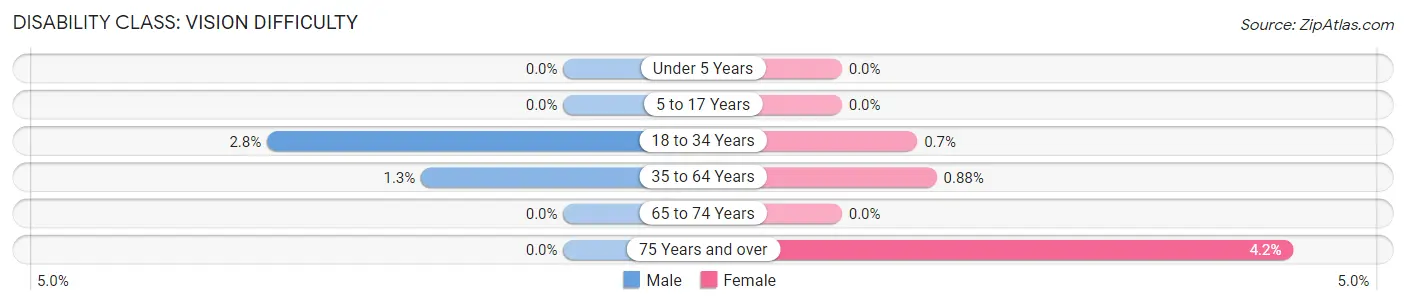
| Age Bracket | Male | Female |
| Under 5 Years | 0 (0.0%) | 0 (0.0%) |
| 5 to 17 Years | 0 (0.0%) | 0 (0.0%) |
| 18 to 34 Years | 13 (2.8%) | 4 (0.7%) |
| 35 to 64 Years | 10 (1.3%) | 6 (0.9%) |
| 65 to 74 Years | 0 (0.0%) | 0 (0.0%) |
| 75 Years and over | 0 (0.0%) | 8 (4.2%) |
Disability Class: Cognitive Difficulty
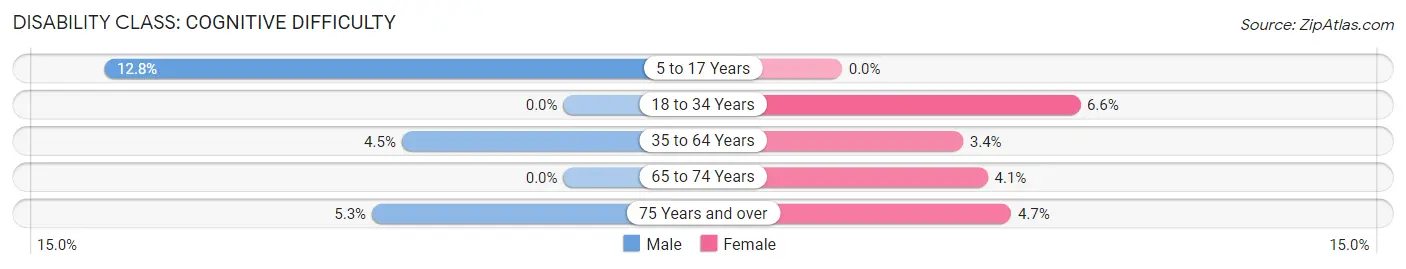
| Age Bracket | Male | Female |
| 5 to 17 Years | 39 (12.8%) | 0 (0.0%) |
| 18 to 34 Years | 0 (0.0%) | 38 (6.6%) |
| 35 to 64 Years | 34 (4.5%) | 23 (3.4%) |
| 65 to 74 Years | 0 (0.0%) | 8 (4.1%) |
| 75 Years and over | 8 (5.3%) | 9 (4.7%) |
Disability Class: Ambulatory Difficulty
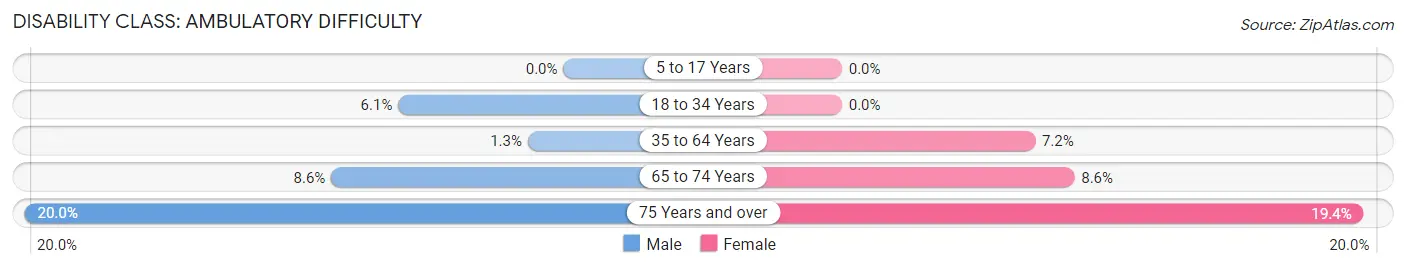
| Age Bracket | Male | Female |
| 5 to 17 Years | 0 (0.0%) | 0 (0.0%) |
| 18 to 34 Years | 29 (6.1%) | 0 (0.0%) |
| 35 to 64 Years | 10 (1.3%) | 49 (7.2%) |
| 65 to 74 Years | 10 (8.6%) | 17 (8.6%) |
| 75 Years and over | 30 (20.0%) | 37 (19.4%) |
Disability Class: Self-Care Difficulty
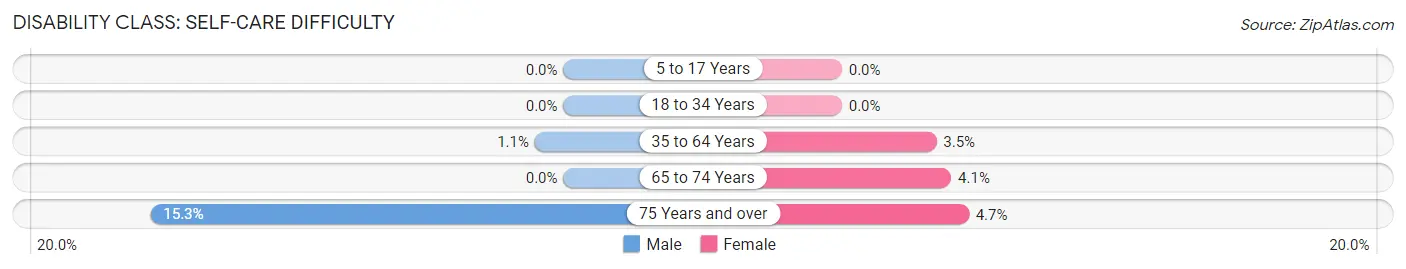
| Age Bracket | Male | Female |
| 5 to 17 Years | 0 (0.0%) | 0 (0.0%) |
| 18 to 34 Years | 0 (0.0%) | 0 (0.0%) |
| 35 to 64 Years | 8 (1.1%) | 24 (3.5%) |
| 65 to 74 Years | 0 (0.0%) | 8 (4.1%) |
| 75 Years and over | 23 (15.3%) | 9 (4.7%) |
Technology Access in Lancaster
Computing Device Access in Lancaster
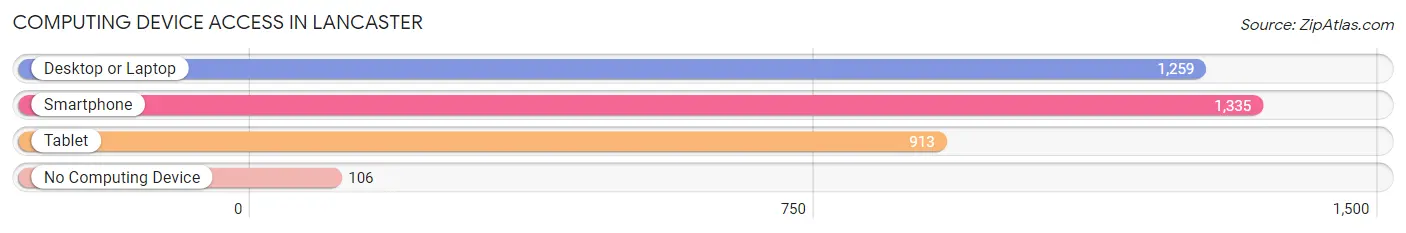
| Device Type | # Households | % Households |
| Desktop or Laptop | 1,259 | 80.6% |
| Smartphone | 1,335 | 85.5% |
| Tablet | 913 | 58.5% |
| No Computing Device | 106 | 6.8% |
| Total | 1,561 | 100.0% |
Internet Access in Lancaster
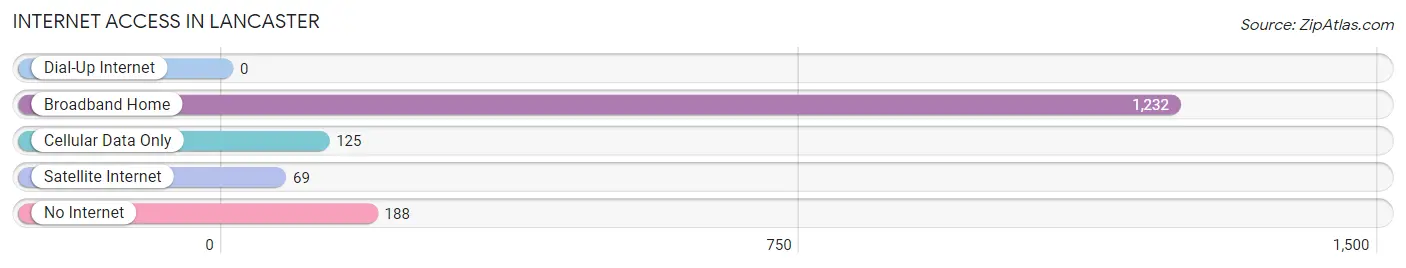
| Internet Type | # Households | % Households |
| Dial-Up Internet | 0 | 0.0% |
| Broadband Home | 1,232 | 78.9% |
| Cellular Data Only | 125 | 8.0% |
| Satellite Internet | 69 | 4.4% |
| No Internet | 188 | 12.0% |
| Total | 1,561 | 100.0% |
Lancaster Summary
Lancaster, Wisconsin is a small city located in Grant County, in the southwestern corner of the state. It is situated on the banks of the Mississippi River, and is the county seat of Grant County. The city has a population of approximately 3,500 people, and is part of the Platteville Micropolitan Statistical Area.
History
Lancaster was founded in 1845 by a group of settlers from Lancaster, Pennsylvania. The city was named after the Pennsylvania city, and was incorporated in 1856. The city was originally a trading post, and was a major stop on the stagecoach route between Dubuque, Iowa and Prairie du Chien, Wisconsin.
In the late 19th century, Lancaster was a major center for the lumber industry, and the city was home to several sawmills. The city also had a thriving brick-making industry, and was home to several brickyards.
In the early 20th century, Lancaster was a major center for the dairy industry, and the city was home to several cheese factories. The city was also home to several manufacturing plants, including a canning factory, a furniture factory, and a shoe factory.
Geography
Lancaster is located in southwestern Wisconsin, in Grant County. The city is situated on the banks of the Mississippi River, and is located about 25 miles south of Dubuque, Iowa. The city is located in the Driftless Area, a region of the Midwest that was not glaciated during the last ice age.
The city has a total area of 2.2 square miles, all of which is land. The city is located in a hilly region, and is surrounded by rolling hills and bluffs. The city is located in the Central Time Zone, and has a humid continental climate, with cold winters and hot, humid summers.
Economy
Lancaster’s economy is largely based on agriculture and manufacturing. The city is home to several dairy farms, and is a major center for the dairy industry. The city is also home to several manufacturing plants, including a canning factory, a furniture factory, and a shoe factory.
The city is also home to several retail stores, restaurants, and other businesses. The city is home to several banks, and is a major center for banking and finance in the region.
Demographics
As of the 2010 census, Lancaster had a population of 3,521 people. The racial makeup of the city was 97.2% White, 0.7% African American, 0.3% Native American, 0.3% Asian, 0.2% from other races, and 1.5% from two or more races. Hispanic or Latino of any race were 1.2% of the population.
The median household income in Lancaster was $41,944, and the median family income was $50,938. The per capita income in the city was $20,845. About 8.2% of families and 10.3% of the population were below the poverty line, including 14.2% of those under age 18 and 8.2% of those age 65 or over.
Common Questions
What is Per Capita Income in Lancaster?
Per Capita income in Lancaster is $34,851.
What is the Median Family Income in Lancaster?
Median Family Income in Lancaster is $92,986.
What is the Median Household income in Lancaster?
Median Household Income in Lancaster is $77,328.
What is Income or Wage Gap in Lancaster?
Income or Wage Gap in Lancaster is 15.6%.
Women in Lancaster earn 84.4 cents for every dollar earned by a man.
What is Inequality or Gini Index in Lancaster?
Inequality or Gini Index in Lancaster is 0.35.
What is the Total Population of Lancaster?
Total Population of Lancaster is 3,917.
What is the Total Male Population of Lancaster?
Total Male Population of Lancaster is 1,912.
What is the Total Female Population of Lancaster?
Total Female Population of Lancaster is 2,005.
What is the Ratio of Males per 100 Females in Lancaster?
There are 95.36 Males per 100 Females in Lancaster.
What is the Ratio of Females per 100 Males in Lancaster?
There are 104.86 Females per 100 Males in Lancaster.
What is the Median Population Age in Lancaster?
Median Population Age in Lancaster is 40.9 Years.
What is the Average Family Size in Lancaster
Average Family Size in Lancaster is 3.0 People.
What is the Average Household Size in Lancaster
Average Household Size in Lancaster is 2.5 People.
How Large is the Labor Force in Lancaster?
There are 2,341 People in the Labor Forcein in Lancaster.
What is the Percentage of People in the Labor Force in Lancaster?
70.6% of People are in the Labor Force in Lancaster.
What is the Unemployment Rate in Lancaster?
Unemployment Rate in Lancaster is 1.5%.