Lake Mills, WI Map & Demographics
Lake Mills Map
Lake Mills Overview
$40,258
PER CAPITA INCOME
$96,657
AVG FAMILY INCOME
$77,449
AVG HOUSEHOLD INCOME
19.3%
WAGE / INCOME GAP [ % ]
80.7¢/ $1
WAGE / INCOME GAP [ $ ]
$12,588
FAMILY INCOME DEFICIT
0.37
INEQUALITY / GINI INDEX
6,280
TOTAL POPULATION
3,171
MALE POPULATION
3,109
FEMALE POPULATION
101.99
MALES / 100 FEMALES
98.04
FEMALES / 100 MALES
40.0
MEDIAN AGE
3.2
AVG FAMILY SIZE
2.5
AVG HOUSEHOLD SIZE
3,676
LABOR FORCE [ PEOPLE ]
74.0%
PERCENT IN LABOR FORCE
0.5%
UNEMPLOYMENT RATE
Lake Mills Zip Codes
Lake Mills Area Codes
Income in Lake Mills
Income Overview in Lake Mills
Per Capita Income in Lake Mills is $40,258, while median incomes of families and households are $96,657 and $77,449 respectively.
| Characteristic | Number | Measure |
| Per Capita Income | 6,280 | $40,258 |
| Median Family Income | 1,567 | $96,657 |
| Mean Family Income | 1,567 | $113,165 |
| Median Household Income | 2,464 | $77,449 |
| Mean Household Income | 2,464 | $93,337 |
| Income Deficit | 1,567 | $12,588 |
| Wage / Income Gap (%) | 6,280 | 19.30% |
| Wage / Income Gap ($) | 6,280 | 80.70¢ per $1 |
| Gini / Inequality Index | 6,280 | 0.37 |
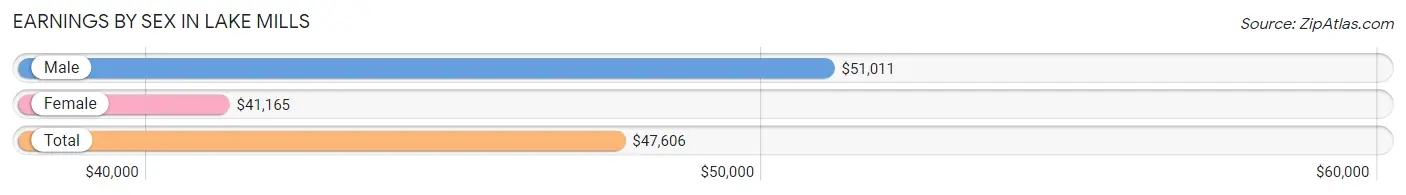
Earnings by Sex in Lake Mills
Average Earnings in Lake Mills are $47,606, $51,011 for men and $41,165 for women, a difference of 19.3%.
| Sex | Number | Average Earnings |
| Male | 1,941 (51.5%) | $51,011 |
| Female | 1,830 (48.5%) | $41,165 |
| Total | 3,771 (100.0%) | $47,606 |
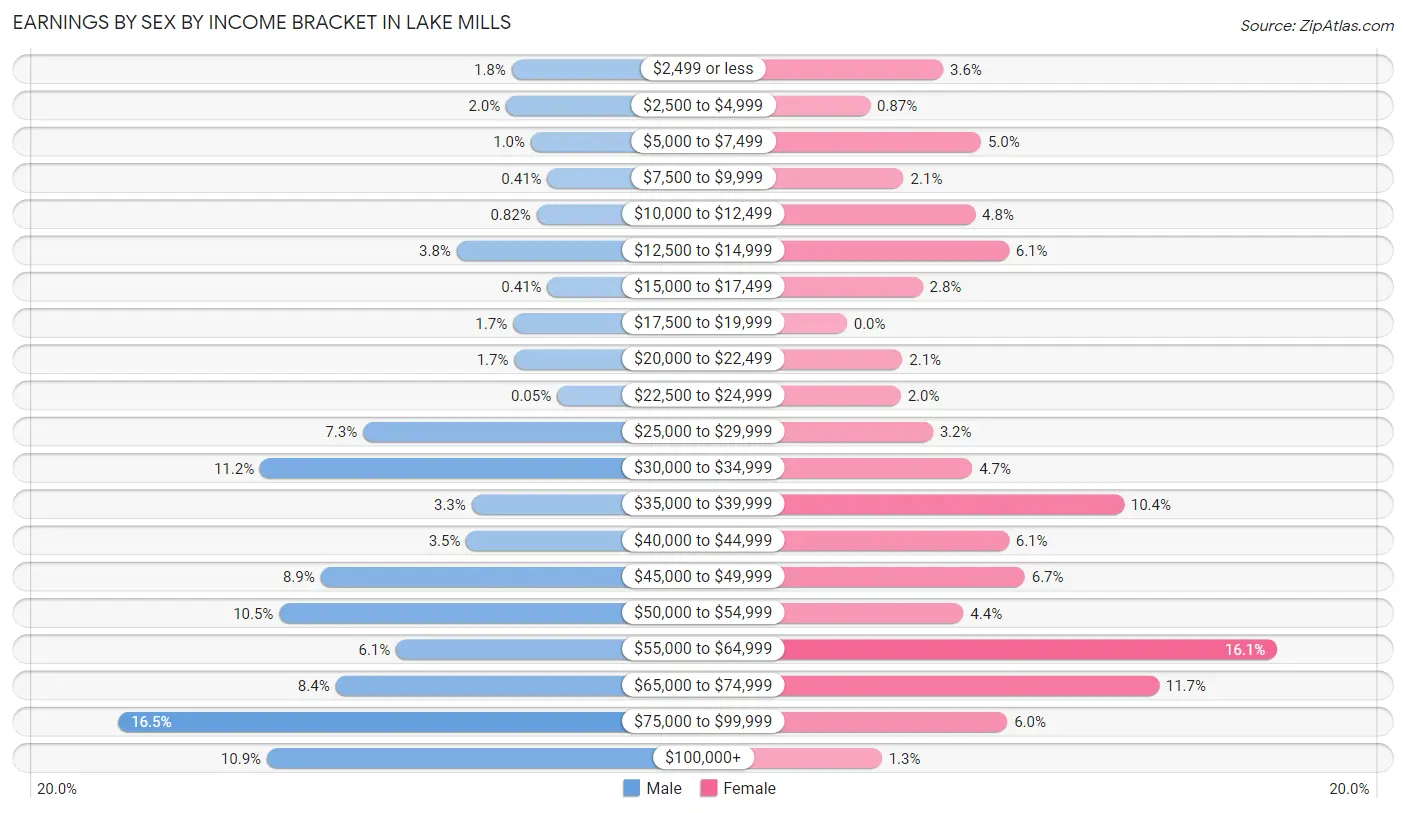
Earnings by Sex by Income Bracket in Lake Mills
The most common earnings brackets in Lake Mills are $75,000 to $99,999 for men (320 | 16.5%) and $55,000 to $64,999 for women (295 | 16.1%).
| Income | Male | Female |
| $2,499 or less | 34 (1.8%) | 66 (3.6%) |
| $2,500 to $4,999 | 38 (2.0%) | 16 (0.9%) |
| $5,000 to $7,499 | 20 (1.0%) | 92 (5.0%) |
| $7,500 to $9,999 | 8 (0.4%) | 39 (2.1%) |
| $10,000 to $12,499 | 16 (0.8%) | 88 (4.8%) |
| $12,500 to $14,999 | 74 (3.8%) | 111 (6.1%) |
| $15,000 to $17,499 | 8 (0.4%) | 52 (2.8%) |
| $17,500 to $19,999 | 33 (1.7%) | 0 (0.0%) |
| $20,000 to $22,499 | 32 (1.7%) | 38 (2.1%) |
| $22,500 to $24,999 | 1 (0.1%) | 37 (2.0%) |
| $25,000 to $29,999 | 142 (7.3%) | 59 (3.2%) |
| $30,000 to $34,999 | 217 (11.2%) | 86 (4.7%) |
| $35,000 to $39,999 | 63 (3.3%) | 190 (10.4%) |
| $40,000 to $44,999 | 67 (3.5%) | 111 (6.1%) |
| $45,000 to $49,999 | 173 (8.9%) | 122 (6.7%) |
| $50,000 to $54,999 | 203 (10.5%) | 80 (4.4%) |
| $55,000 to $64,999 | 118 (6.1%) | 295 (16.1%) |
| $65,000 to $74,999 | 162 (8.4%) | 214 (11.7%) |
| $75,000 to $99,999 | 320 (16.5%) | 110 (6.0%) |
| $100,000+ | 212 (10.9%) | 24 (1.3%) |
| Total | 1,941 (100.0%) | 1,830 (100.0%) |
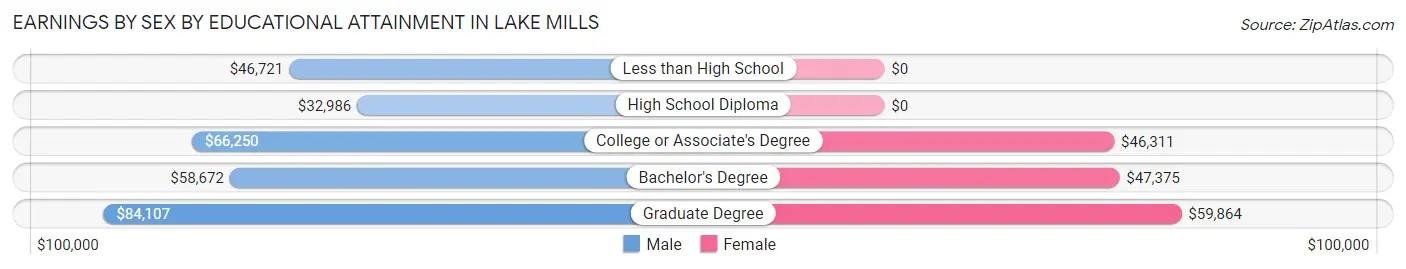
Earnings by Sex by Educational Attainment in Lake Mills
Average earnings in Lake Mills are $53,266 for men and $49,049 for women, a difference of 7.9%. Men with an educational attainment of graduate degree enjoy the highest average annual earnings of $84,107, while those with high school diploma education earn the least with $32,986. Women with an educational attainment of graduate degree earn the most with the average annual earnings of $59,864, while those with college or associate's degree education have the smallest earnings of $46,311.
| Educational Attainment | Male Income | Female Income |
| Less than High School | $46,721 | $0 |
| High School Diploma | $32,986 | $0 |
| College or Associate's Degree | $66,250 | $46,311 |
| Bachelor's Degree | $58,672 | $47,375 |
| Graduate Degree | $84,107 | $59,864 |
| Total | $53,266 | $49,049 |
Family Income in Lake Mills
Family Income Brackets in Lake Mills
According to the Lake Mills family income data, there are 364 families falling into the $150,000 to $199,999 income range, which is the most common income bracket and makes up 23.2% of all families. Conversely, the less than $10,000 income bracket is the least frequent group with only 17 families (1.1%) belonging to this category.
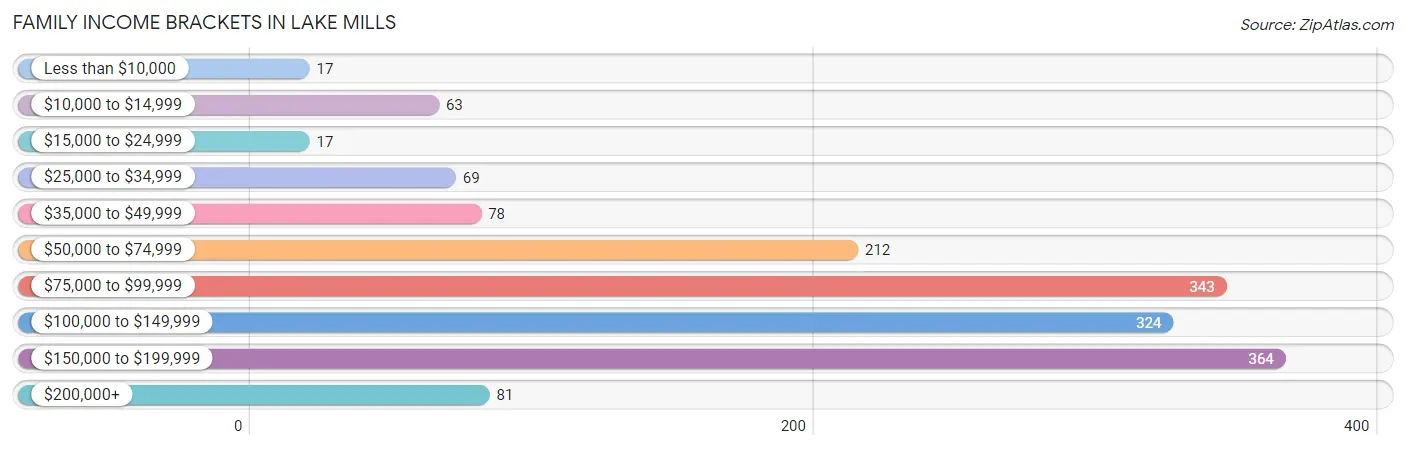
| Income Bracket | # Families | % Families |
| Less than $10,000 | 17 | 1.1% |
| $10,000 to $14,999 | 63 | 4.0% |
| $15,000 to $24,999 | 17 | 1.1% |
| $25,000 to $34,999 | 69 | 4.4% |
| $35,000 to $49,999 | 78 | 5.0% |
| $50,000 to $74,999 | 212 | 13.5% |
| $75,000 to $99,999 | 343 | 21.9% |
| $100,000 to $149,999 | 324 | 20.7% |
| $150,000 to $199,999 | 364 | 23.2% |
| $200,000+ | 81 | 5.2% |
Family Income by Famaliy Size in Lake Mills
5-person families (78 | 5.0%) account for the highest median family income in Lake Mills with $165,476 per family, while 2-person families (775 | 49.5%) have the highest median income of $44,868 per family member.
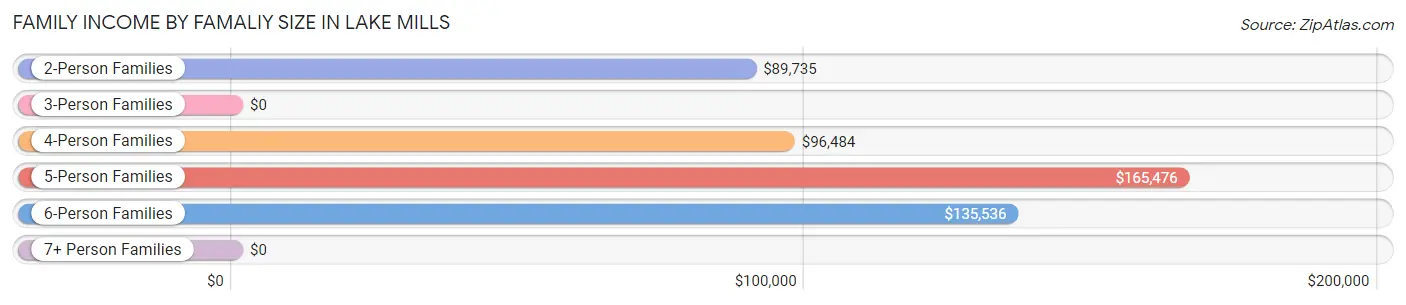
| Income Bracket | # Families | Median Income |
| 2-Person Families | 775 (49.5%) | $89,735 |
| 3-Person Families | 419 (26.7%) | $0 |
| 4-Person Families | 181 (11.6%) | $96,484 |
| 5-Person Families | 78 (5.0%) | $165,476 |
| 6-Person Families | 103 (6.6%) | $135,536 |
| 7+ Person Families | 11 (0.7%) | $0 |
| Total | 1,567 (100.0%) | $96,657 |
Family Income by Number of Earners in Lake Mills
The median family income in Lake Mills is $96,657, with families comprising 3+ earners (225) having the highest median family income of $132,019, while families with 1 earner (338) have the lowest median family income of $66,304, accounting for 14.4% and 21.6% of families, respectively.
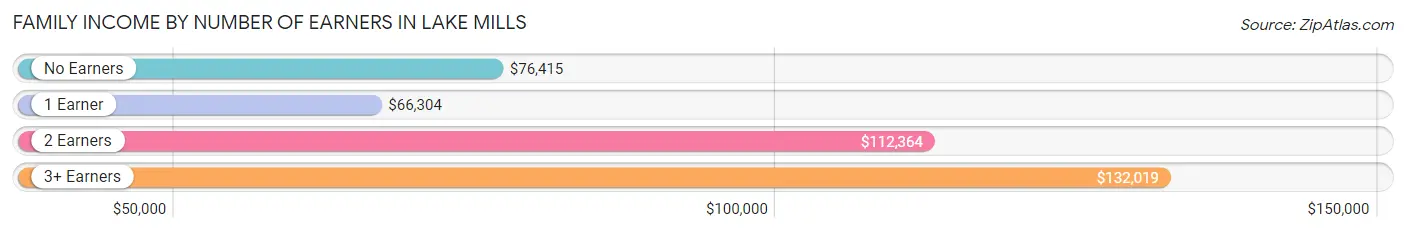
| Number of Earners | # Families | Median Income |
| No Earners | 237 (15.1%) | $76,415 |
| 1 Earner | 338 (21.6%) | $66,304 |
| 2 Earners | 767 (48.9%) | $112,364 |
| 3+ Earners | 225 (14.4%) | $132,019 |
| Total | 1,567 (100.0%) | $96,657 |
Household Income in Lake Mills
Household Income Brackets in Lake Mills
With 500 households falling in the category, the $75,000 to $99,999 income range is the most frequent in Lake Mills, accounting for 20.3% of all households. In contrast, only 76 households (3.1%) fall into the less than $10,000 income bracket, making it the least populous group.
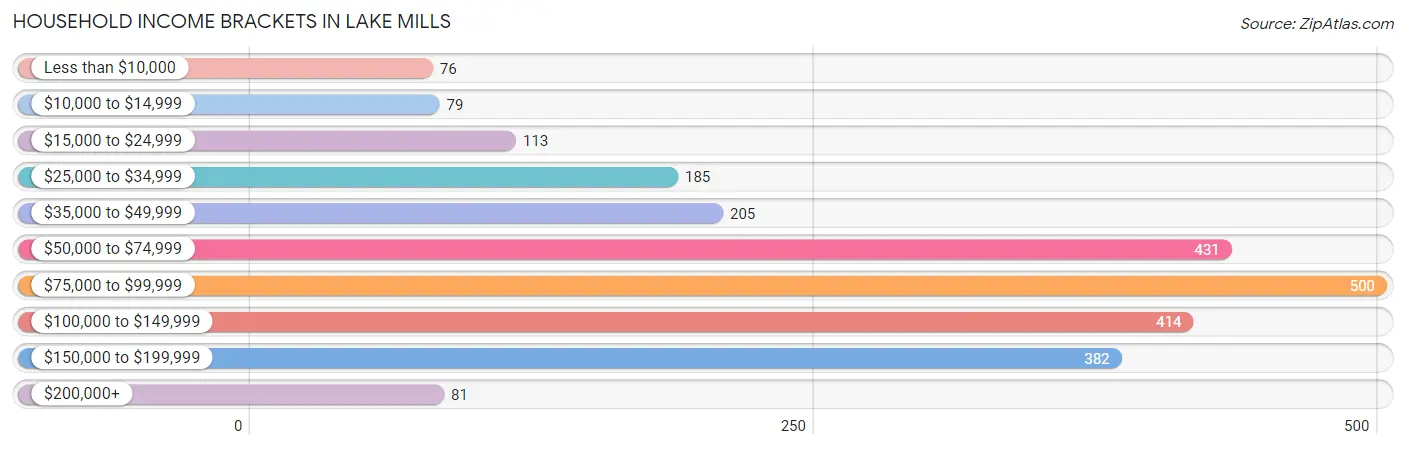
| Income Bracket | # Households | % Households |
| Less than $10,000 | 76 | 3.1% |
| $10,000 to $14,999 | 79 | 3.2% |
| $15,000 to $24,999 | 113 | 4.6% |
| $25,000 to $34,999 | 185 | 7.5% |
| $35,000 to $49,999 | 205 | 8.3% |
| $50,000 to $74,999 | 431 | 17.5% |
| $75,000 to $99,999 | 500 | 20.3% |
| $100,000 to $149,999 | 414 | 16.8% |
| $150,000 to $199,999 | 382 | 15.5% |
| $200,000+ | 81 | 3.3% |
Household Income by Householder Age in Lake Mills
The median household income in Lake Mills is $77,449, with the highest median household income of $96,773 found in the 25 to 44 years age bracket for the primary householder. A total of 965 households (39.2%) fall into this category. Meanwhile, the 15 to 24 years age bracket for the primary householder has the lowest median household income of $34,120, with 107 households (4.3%) in this group.
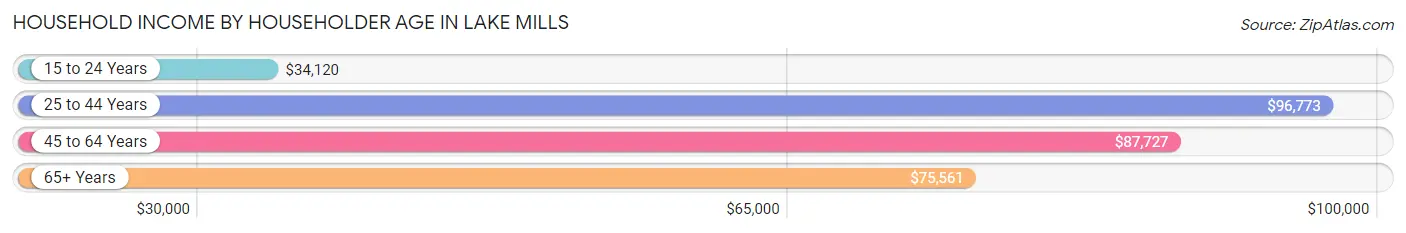
| Income Bracket | # Households | Median Income |
| 15 to 24 Years | 107 (4.3%) | $34,120 |
| 25 to 44 Years | 965 (39.2%) | $96,773 |
| 45 to 64 Years | 736 (29.9%) | $87,727 |
| 65+ Years | 656 (26.6%) | $75,561 |
| Total | 2,464 (100.0%) | $77,449 |
Poverty in Lake Mills
Income Below Poverty by Sex and Age in Lake Mills
With 4.8% poverty level for males and 6.6% for females among the residents of Lake Mills, 45 to 54 year old males and 75 year old and over females are the most vulnerable to poverty, with 51 males (9.1%) and 21 females (28.0%) in their respective age groups living below the poverty level.
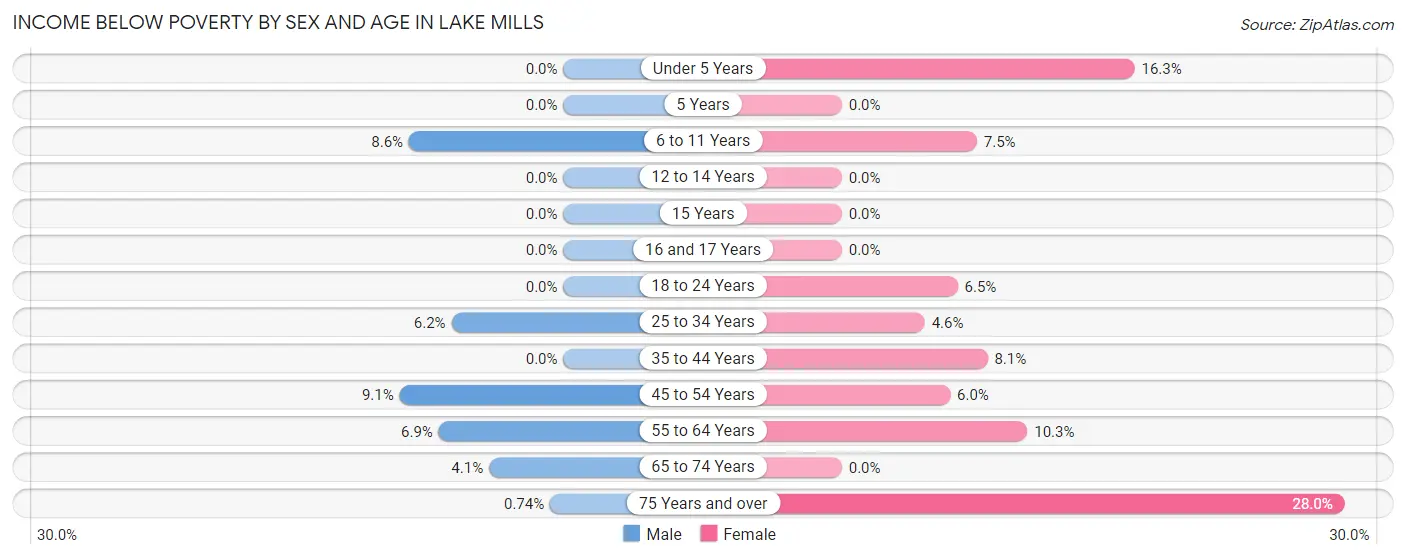
| Age Bracket | Male | Female |
| Under 5 Years | 0 (0.0%) | 22 (16.3%) |
| 5 Years | 0 (0.0%) | 0 (0.0%) |
| 6 to 11 Years | 24 (8.6%) | 23 (7.5%) |
| 12 to 14 Years | 0 (0.0%) | 0 (0.0%) |
| 15 Years | 0 (0.0%) | 0 (0.0%) |
| 16 and 17 Years | 0 (0.0%) | 0 (0.0%) |
| 18 to 24 Years | 0 (0.0%) | 18 (6.5%) |
| 25 to 34 Years | 35 (6.2%) | 19 (4.6%) |
| 35 to 44 Years | 0 (0.0%) | 42 (8.1%) |
| 45 to 54 Years | 51 (9.1%) | 24 (6.0%) |
| 55 to 64 Years | 22 (6.9%) | 31 (10.3%) |
| 65 to 74 Years | 17 (4.1%) | 0 (0.0%) |
| 75 Years and over | 1 (0.7%) | 21 (28.0%) |
| Total | 150 (4.8%) | 200 (6.6%) |
Income Above Poverty by Sex and Age in Lake Mills
According to the poverty statistics in Lake Mills, males aged under 5 years and females aged 5 years are the age groups that are most secure financially, with 100.0% of males and 100.0% of females in these age groups living above the poverty line.
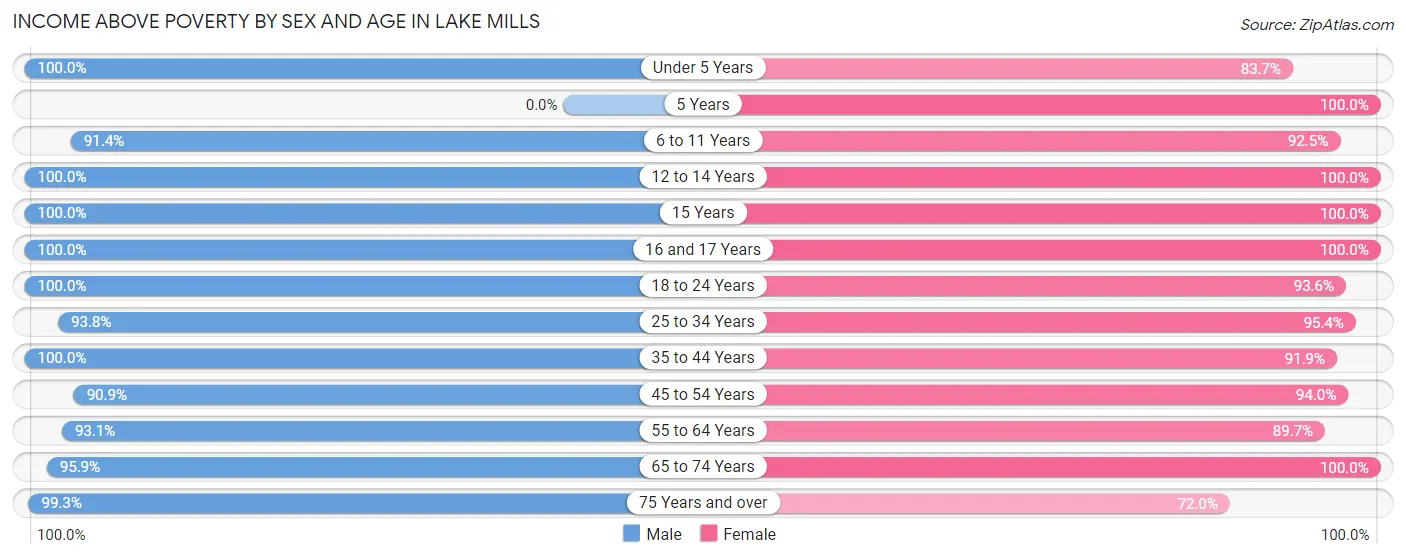
| Age Bracket | Male | Female |
| Under 5 Years | 140 (100.0%) | 113 (83.7%) |
| 5 Years | 0 (0.0%) | 96 (100.0%) |
| 6 to 11 Years | 255 (91.4%) | 283 (92.5%) |
| 12 to 14 Years | 172 (100.0%) | 98 (100.0%) |
| 15 Years | 47 (100.0%) | 24 (100.0%) |
| 16 and 17 Years | 40 (100.0%) | 59 (100.0%) |
| 18 to 24 Years | 148 (100.0%) | 261 (93.5%) |
| 25 to 34 Years | 527 (93.8%) | 392 (95.4%) |
| 35 to 44 Years | 348 (100.0%) | 476 (91.9%) |
| 45 to 54 Years | 508 (90.9%) | 374 (94.0%) |
| 55 to 64 Years | 295 (93.1%) | 269 (89.7%) |
| 65 to 74 Years | 394 (95.9%) | 354 (100.0%) |
| 75 Years and over | 134 (99.3%) | 54 (72.0%) |
| Total | 3,008 (95.3%) | 2,853 (93.4%) |
Income Below Poverty Among Married-Couple Families in Lake Mills
The poverty statistics for married-couple families in Lake Mills show that 6.1% or 80 of the total 1,320 families live below the poverty line. Families with 1 or 2 children have the highest poverty rate of 16.2%, comprising of 62 families. On the other hand, families with 3 or 4 children have the lowest poverty rate of 0.0%, which includes 0 families.
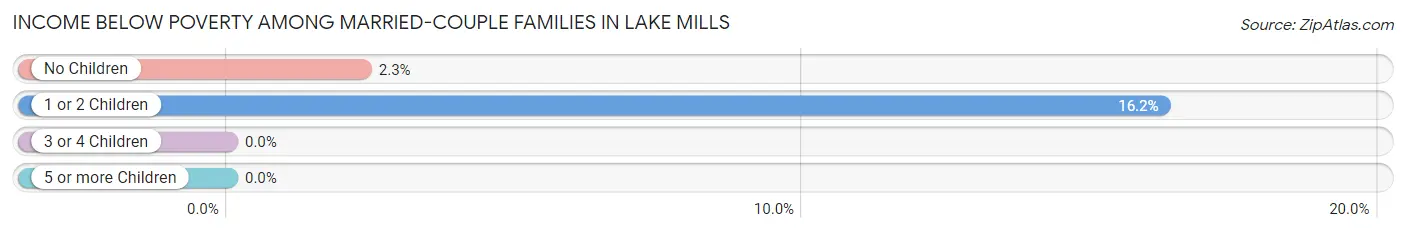
| Children | Above Poverty | Below Poverty |
| No Children | 755 (97.7%) | 18 (2.3%) |
| 1 or 2 Children | 320 (83.8%) | 62 (16.2%) |
| 3 or 4 Children | 154 (100.0%) | 0 (0.0%) |
| 5 or more Children | 11 (100.0%) | 0 (0.0%) |
| Total | 1,240 (93.9%) | 80 (6.1%) |
Income Below Poverty Among Single-Parent Households in Lake Mills
| Children | Single Father | Single Mother |
| No Children | 0 (0.0%) | 0 (0.0%) |
| 1 or 2 Children | 0 (0.0%) | 0 (0.0%) |
| 3 or 4 Children | 0 (0.0%) | 0 (0.0%) |
| 5 or more Children | 0 (0.0%) | 0 (0.0%) |
| Total | 0 (0.0%) | 0 (0.0%) |
Income Below Poverty Among Married-Couple vs Single-Parent Households in Lake Mills
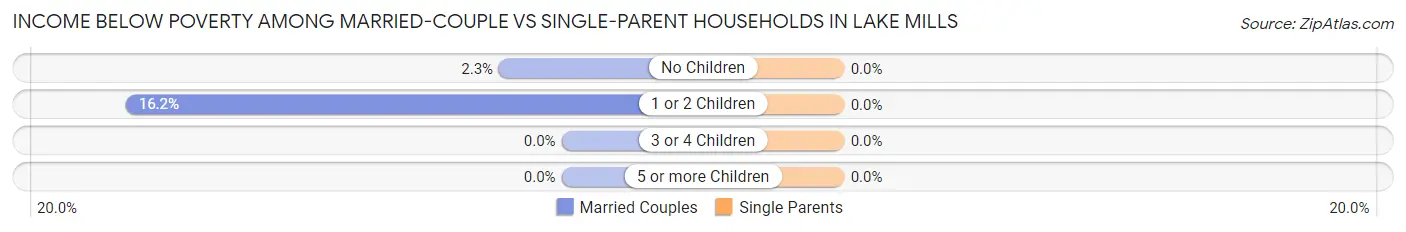
| Children | Married-Couple Families | Single-Parent Households |
| No Children | 18 (2.3%) | 0 (0.0%) |
| 1 or 2 Children | 62 (16.2%) | 0 (0.0%) |
| 3 or 4 Children | 0 (0.0%) | 0 (0.0%) |
| 5 or more Children | 0 (0.0%) | 0 (0.0%) |
| Total | 80 (6.1%) | 0 (0.0%) |
Race in Lake Mills
The most populous races in Lake Mills are White / Caucasian (5,694 | 90.7%), Hispanic or Latino (552 | 8.8%), and Two or more Races (333 | 5.3%).
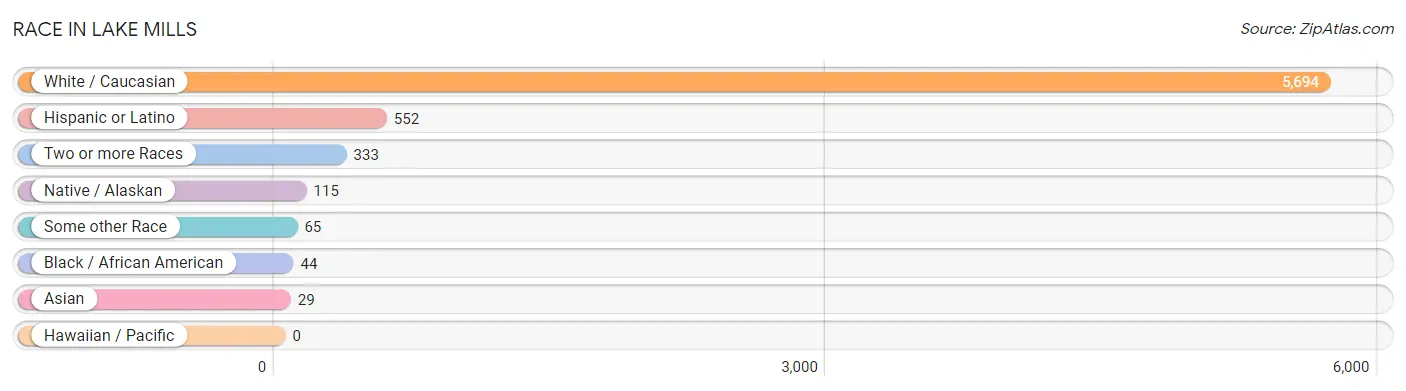
| Race | # Population | % Population |
| Asian | 29 | 0.5% |
| Black / African American | 44 | 0.7% |
| Hawaiian / Pacific | 0 | 0.0% |
| Hispanic or Latino | 552 | 8.8% |
| Native / Alaskan | 115 | 1.8% |
| White / Caucasian | 5,694 | 90.7% |
| Two or more Races | 333 | 5.3% |
| Some other Race | 65 | 1.0% |
| Total | 6,280 | 100.0% |
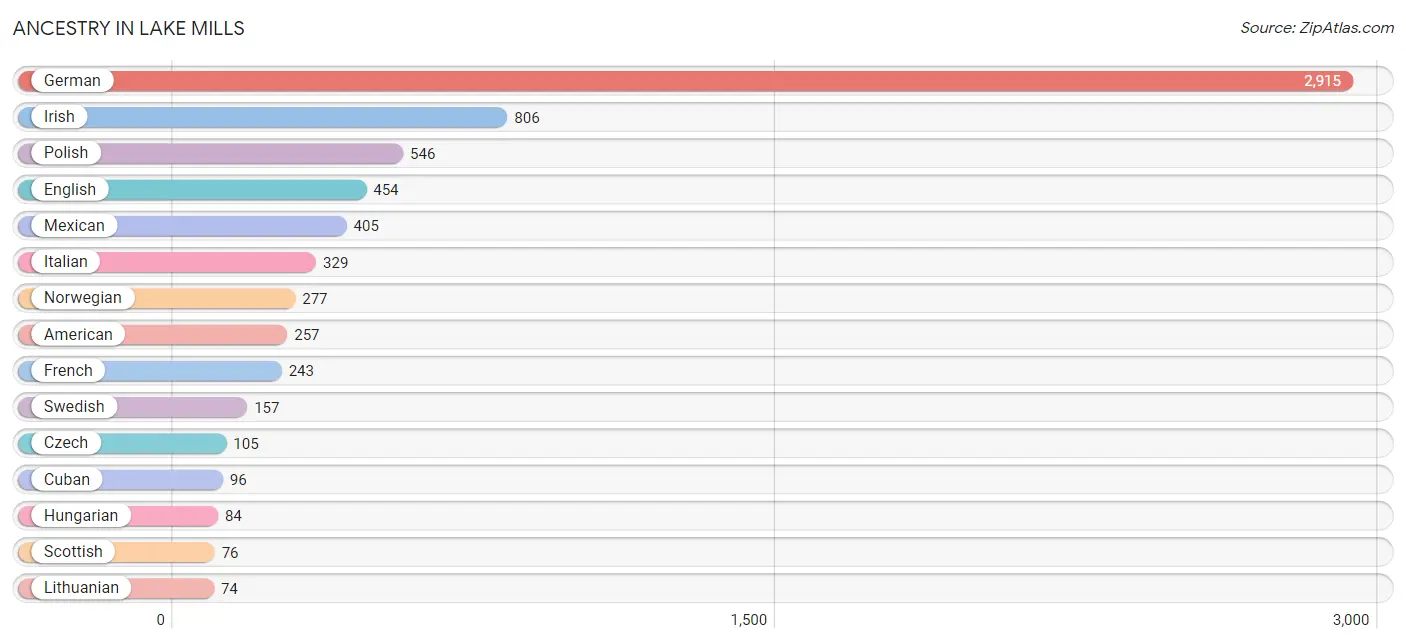
Ancestry in Lake Mills
The most populous ancestries reported in Lake Mills are German (2,915 | 46.4%), Irish (806 | 12.8%), Polish (546 | 8.7%), English (454 | 7.2%), and Mexican (405 | 6.5%), together accounting for 81.6% of all Lake Mills residents.
| Ancestry | # Population | % Population |
| African | 1 | 0.0% |
| American | 257 | 4.1% |
| Australian | 29 | 0.5% |
| Austrian | 24 | 0.4% |
| Bhutanese | 23 | 0.4% |
| British | 44 | 0.7% |
| Burmese | 5 | 0.1% |
| Cherokee | 12 | 0.2% |
| Chippewa | 10 | 0.2% |
| Cuban | 96 | 1.5% |
| Czech | 105 | 1.7% |
| Danish | 21 | 0.3% |
| English | 454 | 7.2% |
| European | 17 | 0.3% |
| French | 243 | 3.9% |
| French Canadian | 43 | 0.7% |
| German | 2,915 | 46.4% |
| Hungarian | 84 | 1.3% |
| Indian (Asian) | 9 | 0.1% |
| Irish | 806 | 12.8% |
| Italian | 329 | 5.2% |
| Lithuanian | 74 | 1.2% |
| Mexican | 405 | 6.5% |
| Northern European | 17 | 0.3% |
| Norwegian | 277 | 4.4% |
| Polish | 546 | 8.7% |
| Romanian | 19 | 0.3% |
| Russian | 19 | 0.3% |
| Scotch-Irish | 1 | 0.0% |
| Scottish | 76 | 1.2% |
| Serbian | 38 | 0.6% |
| Slovene | 21 | 0.3% |
| Subsaharan African | 1 | 0.0% |
| Swedish | 157 | 2.5% |
| Swiss | 18 | 0.3% |
| Thai | 15 | 0.2% |
| Ukrainian | 22 | 0.4% |
| Welsh | 42 | 0.7% | View All 38 Rows |
Immigrants in Lake Mills
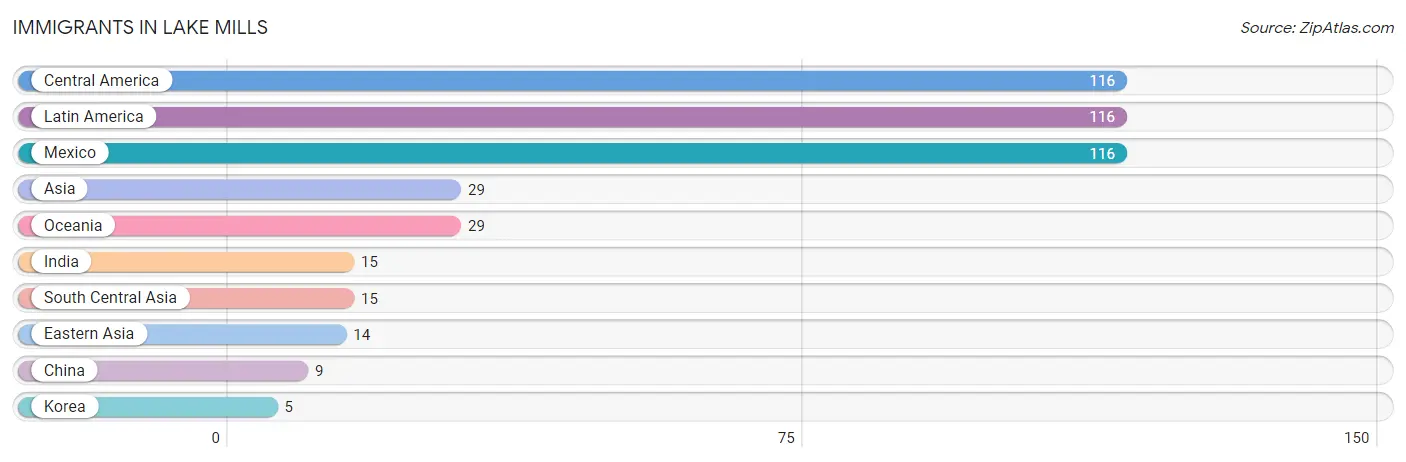
The most numerous immigrant groups reported in Lake Mills came from Central America (116 | 1.8%), Latin America (116 | 1.8%), Mexico (116 | 1.8%), Asia (29 | 0.5%), and Oceania (29 | 0.5%), together accounting for 6.5% of all Lake Mills residents.
| Immigration Origin | # Population | % Population |
| Asia | 29 | 0.5% |
| Central America | 116 | 1.8% |
| China | 9 | 0.1% |
| Eastern Asia | 14 | 0.2% |
| India | 15 | 0.2% |
| Korea | 5 | 0.1% |
| Latin America | 116 | 1.8% |
| Mexico | 116 | 1.8% |
| Oceania | 29 | 0.5% |
| South Central Asia | 15 | 0.2% | View All 10 Rows |
Sex and Age in Lake Mills
Sex and Age in Lake Mills
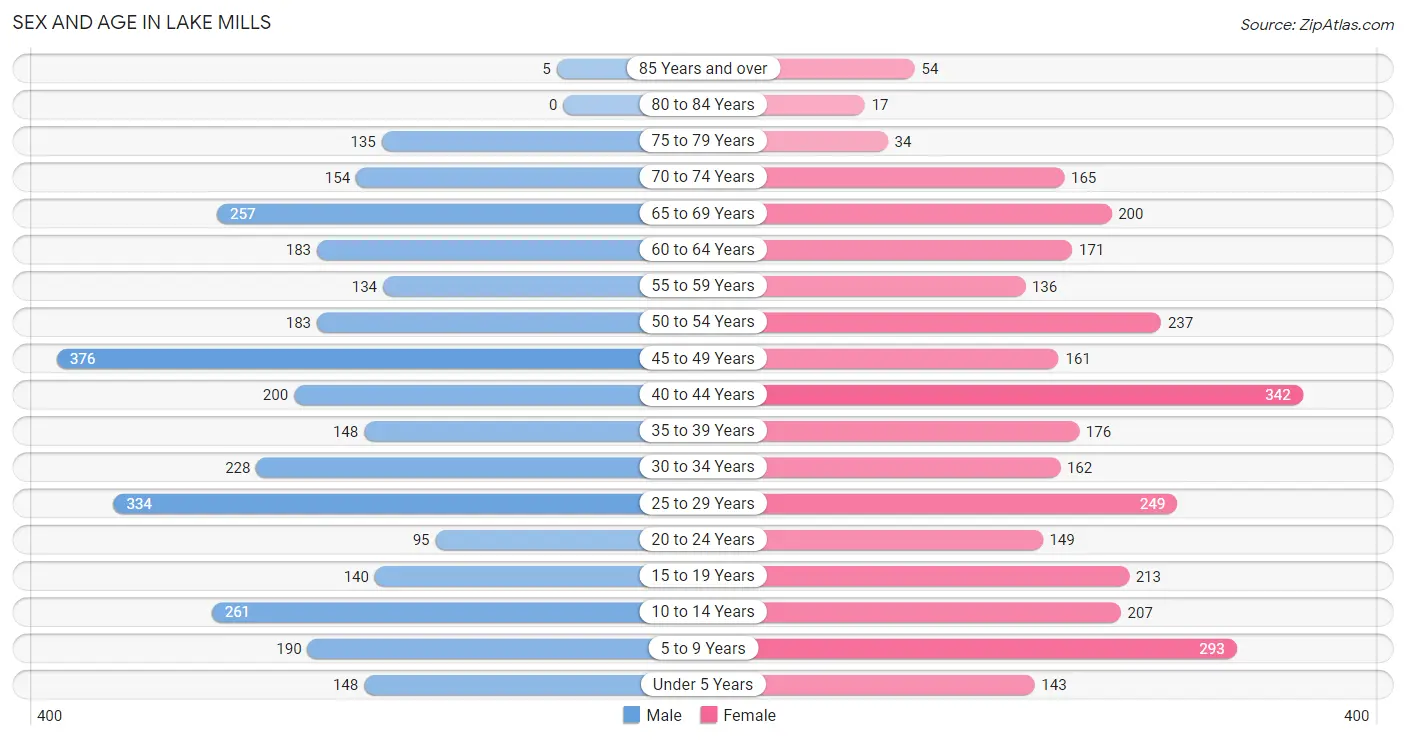
The most populous age groups in Lake Mills are 45 to 49 Years (376 | 11.9%) for men and 40 to 44 Years (342 | 11.0%) for women.
| Age Bracket | Male | Female |
| Under 5 Years | 148 (4.7%) | 143 (4.6%) |
| 5 to 9 Years | 190 (6.0%) | 293 (9.4%) |
| 10 to 14 Years | 261 (8.2%) | 207 (6.7%) |
| 15 to 19 Years | 140 (4.4%) | 213 (6.9%) |
| 20 to 24 Years | 95 (3.0%) | 149 (4.8%) |
| 25 to 29 Years | 334 (10.5%) | 249 (8.0%) |
| 30 to 34 Years | 228 (7.2%) | 162 (5.2%) |
| 35 to 39 Years | 148 (4.7%) | 176 (5.7%) |
| 40 to 44 Years | 200 (6.3%) | 342 (11.0%) |
| 45 to 49 Years | 376 (11.9%) | 161 (5.2%) |
| 50 to 54 Years | 183 (5.8%) | 237 (7.6%) |
| 55 to 59 Years | 134 (4.2%) | 136 (4.4%) |
| 60 to 64 Years | 183 (5.8%) | 171 (5.5%) |
| 65 to 69 Years | 257 (8.1%) | 200 (6.4%) |
| 70 to 74 Years | 154 (4.9%) | 165 (5.3%) |
| 75 to 79 Years | 135 (4.3%) | 34 (1.1%) |
| 80 to 84 Years | 0 (0.0%) | 17 (0.5%) |
| 85 Years and over | 5 (0.2%) | 54 (1.7%) |
| Total | 3,171 (100.0%) | 3,109 (100.0%) |
Families and Households in Lake Mills
Median Family Size in Lake Mills
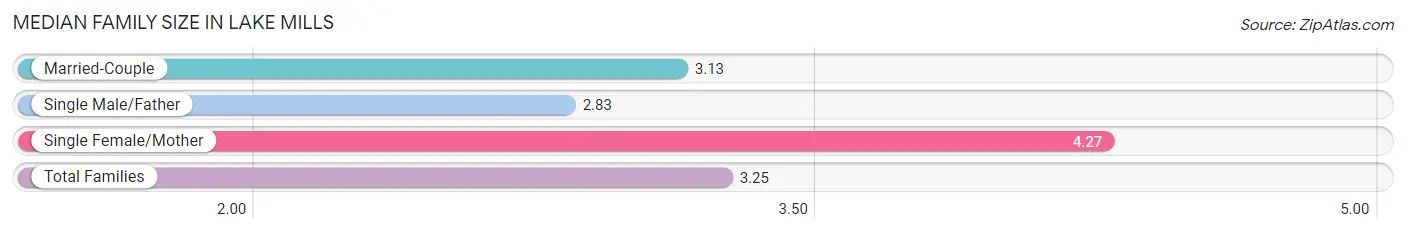
The median family size in Lake Mills is 3.25 persons per family, with single female/mother families (176 | 11.2%) accounting for the largest median family size of 4.27 persons per family. On the other hand, single male/father families (71 | 4.5%) represent the smallest median family size with 2.83 persons per family.
| Family Type | # Families | Family Size |
| Married-Couple | 1,320 (84.2%) | 3.13 |
| Single Male/Father | 71 (4.5%) | 2.83 |
| Single Female/Mother | 176 (11.2%) | 4.27 |
| Total Families | 1,567 (100.0%) | 3.25 |
Median Household Size in Lake Mills
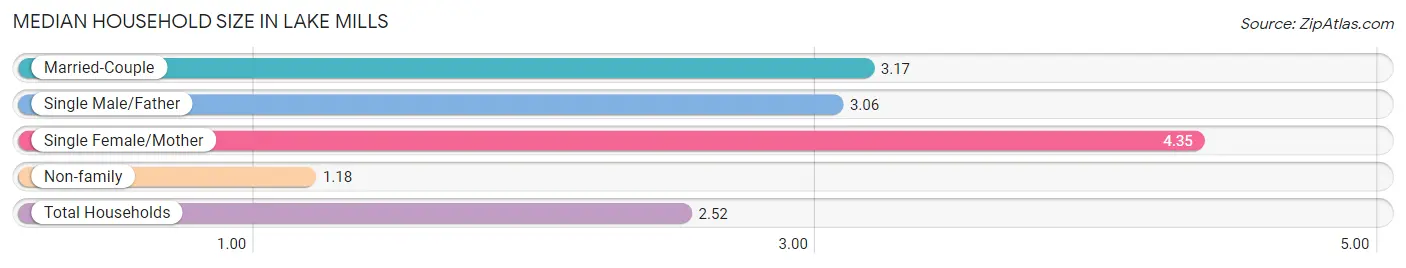
The median household size in Lake Mills is 2.52 persons per household, with single female/mother households (176 | 7.1%) accounting for the largest median household size of 4.35 persons per household. non-family households (897 | 36.4%) represent the smallest median household size with 1.18 persons per household.
| Household Type | # Households | Household Size |
| Married-Couple | 1,320 (53.6%) | 3.17 |
| Single Male/Father | 71 (2.9%) | 3.06 |
| Single Female/Mother | 176 (7.1%) | 4.35 |
| Non-family | 897 (36.4%) | 1.18 |
| Total Households | 2,464 (100.0%) | 2.52 |
Household Size by Marriage Status in Lake Mills
Out of a total of 2,464 households in Lake Mills, 1,567 (63.6%) are family households, while 897 (36.4%) are nonfamily households. The most numerous type of family households are 2-person households, comprising 775, and the most common type of nonfamily households are 1-person households, comprising 760.
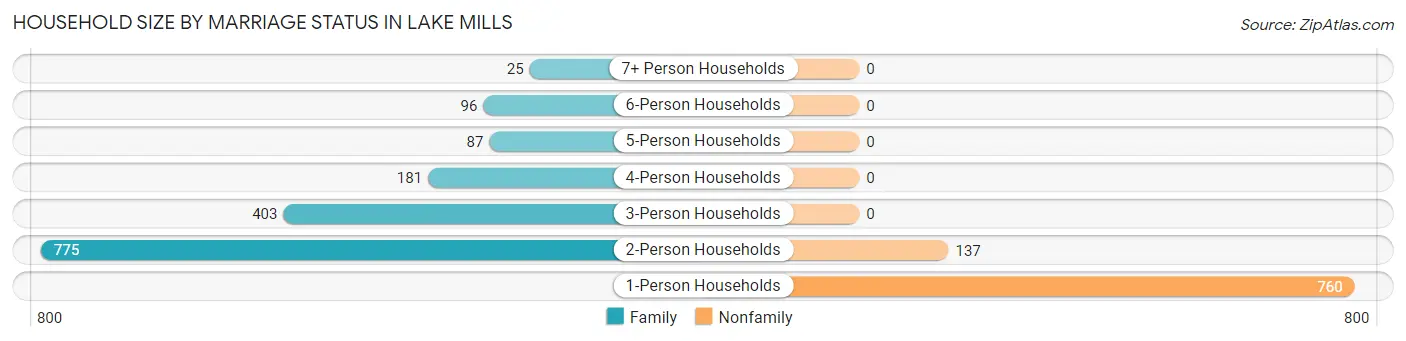
| Household Size | Family Households | Nonfamily Households |
| 1-Person Households | - | 760 (30.8%) |
| 2-Person Households | 775 (31.5%) | 137 (5.6%) |
| 3-Person Households | 403 (16.4%) | 0 (0.0%) |
| 4-Person Households | 181 (7.3%) | 0 (0.0%) |
| 5-Person Households | 87 (3.5%) | 0 (0.0%) |
| 6-Person Households | 96 (3.9%) | 0 (0.0%) |
| 7+ Person Households | 25 (1.0%) | 0 (0.0%) |
| Total | 1,567 (63.6%) | 897 (36.4%) |
Female Fertility in Lake Mills
Fertility by Age in Lake Mills
Average fertility rate in Lake Mills is 16.0 births per 1,000 women. Women in the age bracket of 20 to 34 years have the highest fertility rate with 21.0 births per 1,000 women. Women in the age bracket of 20 to 34 years acount for 52.2% of all women with births.
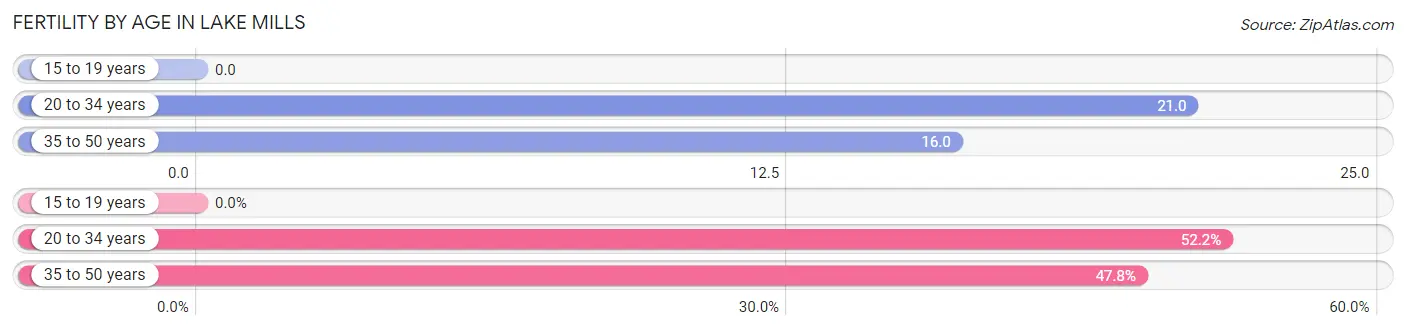
| Age Bracket | Women with Births | Births / 1,000 Women |
| 15 to 19 years | 0 (0.0%) | 0.0 |
| 20 to 34 years | 12 (52.2%) | 21.0 |
| 35 to 50 years | 11 (47.8%) | 16.0 |
| Total | 23 (100.0%) | 16.0 |
Fertility by Age by Marriage Status in Lake Mills
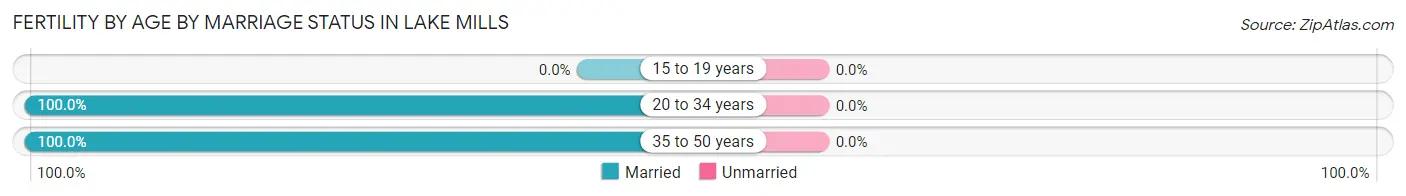
| Age Bracket | Married | Unmarried |
| 15 to 19 years | 0 (0.0%) | 0 (0.0%) |
| 20 to 34 years | 12 (100.0%) | 0 (0.0%) |
| 35 to 50 years | 11 (100.0%) | 0 (0.0%) |
| Total | 23 (100.0%) | 0 (0.0%) |
Fertility by Education in Lake Mills
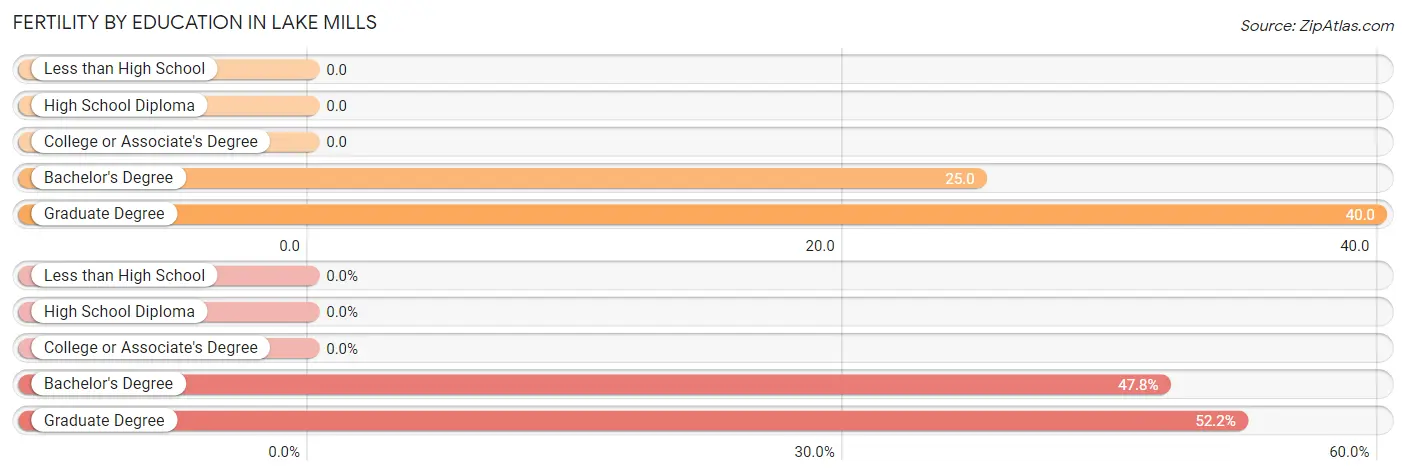
| Educational Attainment | Women with Births | Births / 1,000 Women |
| Less than High School | 0 (0.0%) | 0.0 |
| High School Diploma | 0 (0.0%) | 0.0 |
| College or Associate's Degree | 0 (0.0%) | 0.0 |
| Bachelor's Degree | 11 (47.8%) | 25.0 |
| Graduate Degree | 12 (52.2%) | 40.0 |
| Total | 23 (100.0%) | 16.0 |
Fertility by Education by Marriage Status in Lake Mills
| Educational Attainment | Married | Unmarried |
| Less than High School | 0 (0.0%) | 0 (0.0%) |
| High School Diploma | 0 (0.0%) | 0 (0.0%) |
| College or Associate's Degree | 0 (0.0%) | 0 (0.0%) |
| Bachelor's Degree | 11 (100.0%) | 0 (0.0%) |
| Graduate Degree | 12 (100.0%) | 0 (0.0%) |
| Total | 23 (100.0%) | 0 (0.0%) |
Employment Characteristics in Lake Mills
Employment by Class of Employer in Lake Mills
Among the 3,632 employed individuals in Lake Mills, private company employees (2,562 | 70.5%), local government employees (433 | 11.9%), and not-for-profit organizations (291 | 8.0%) make up the most common classes of employment.
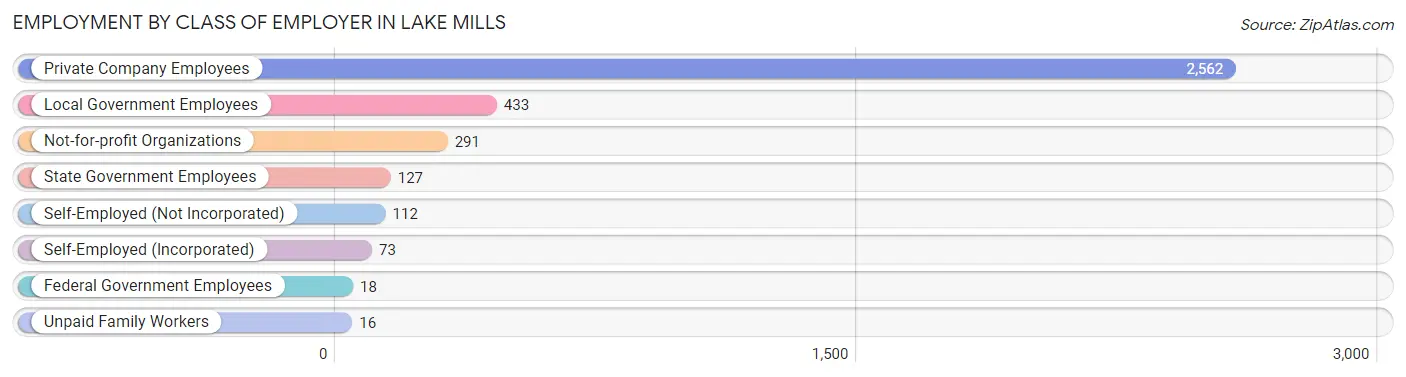
| Employer Class | # Employees | % Employees |
| Private Company Employees | 2,562 | 70.5% |
| Self-Employed (Incorporated) | 73 | 2.0% |
| Self-Employed (Not Incorporated) | 112 | 3.1% |
| Not-for-profit Organizations | 291 | 8.0% |
| Local Government Employees | 433 | 11.9% |
| State Government Employees | 127 | 3.5% |
| Federal Government Employees | 18 | 0.5% |
| Unpaid Family Workers | 16 | 0.4% |
| Total | 3,632 | 100.0% |
Employment Status by Age in Lake Mills
According to the labor force statistics for Lake Mills, out of the total population over 16 years of age (4,967), 74.0% or 3,676 individuals are in the labor force, with 0.5% or 18 of them unemployed. The age group with the highest labor force participation rate is 20 to 24 years, with 100.0% or 244 individuals in the labor force. Within the labor force, the 45 to 54 years age range has the highest percentage of unemployed individuals, with 2.1% or 18 of them being unemployed.
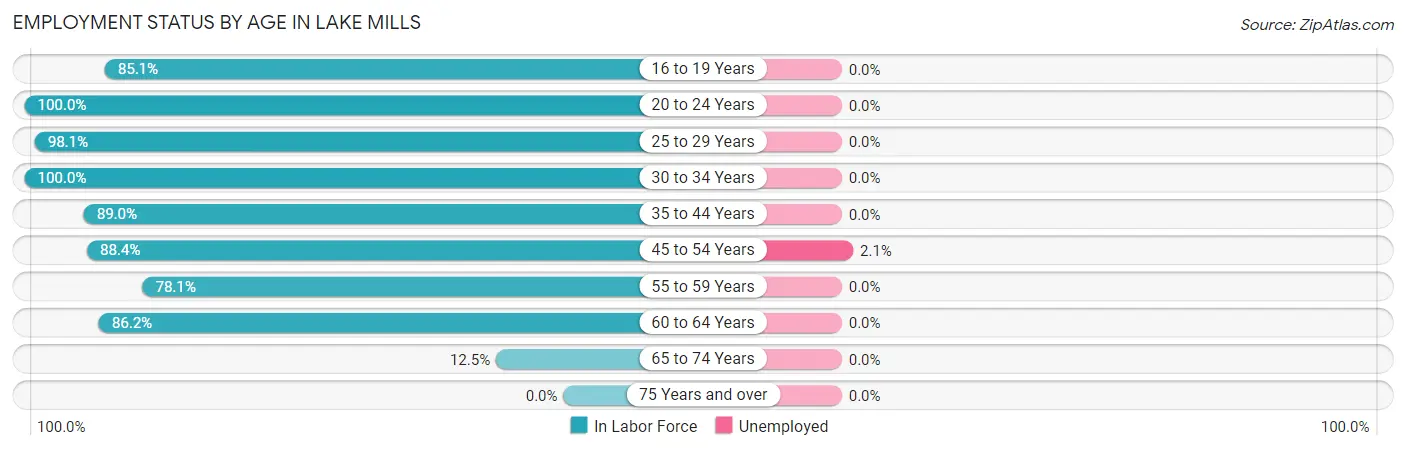
| Age Bracket | In Labor Force | Unemployed |
| 16 to 19 Years | 240 (85.1%) | 0 (0.0%) |
| 20 to 24 Years | 244 (100.0%) | 0 (0.0%) |
| 25 to 29 Years | 572 (98.1%) | 0 (0.0%) |
| 30 to 34 Years | 390 (100.0%) | 0 (0.0%) |
| 35 to 44 Years | 771 (89.0%) | 0 (0.0%) |
| 45 to 54 Years | 846 (88.4%) | 18 (2.1%) |
| 55 to 59 Years | 211 (78.1%) | 0 (0.0%) |
| 60 to 64 Years | 305 (86.2%) | 0 (0.0%) |
| 65 to 74 Years | 97 (12.5%) | 0 (0.0%) |
| 75 Years and over | 0 (0.0%) | 0 (0.0%) |
| Total | 3,676 (74.0%) | 18 (0.5%) |
Employment Status by Educational Attainment in Lake Mills
According to labor force statistics for Lake Mills, 90.5% of individuals (3,095) out of the total population between 25 and 64 years of age (3,420) are in the labor force, with 0.6% or 19 of them being unemployed. The group with the highest labor force participation rate are those with the educational attainment of bachelor's degree or higher, with 96.7% or 1,392 individuals in the labor force. Within the labor force, individuals with college / associate degree education have the highest percentage of unemployment, with 2.1% or 18 of them being unemployed.
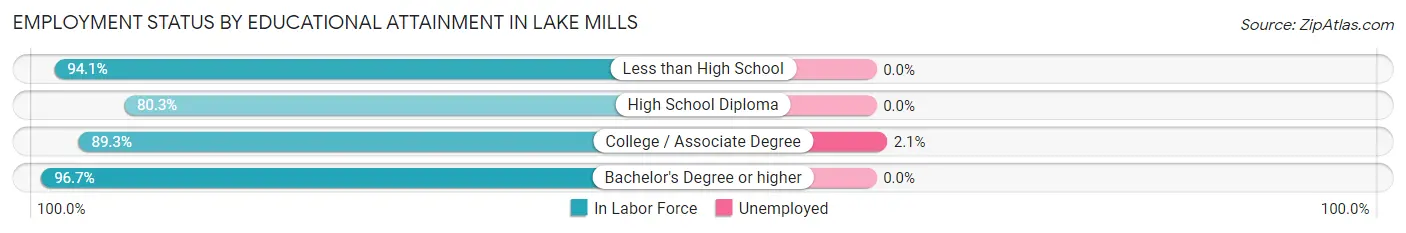
| Educational Attainment | In Labor Force | Unemployed |
| Less than High School | 192 (94.1%) | 0 (0.0%) |
| High School Diploma | 674 (80.3%) | 0 (0.0%) |
| College / Associate Degree | 838 (89.3%) | 20 (2.1%) |
| Bachelor's Degree or higher | 1,392 (96.7%) | 0 (0.0%) |
| Total | 3,095 (90.5%) | 21 (0.6%) |
Employment Occupations by Sex in Lake Mills
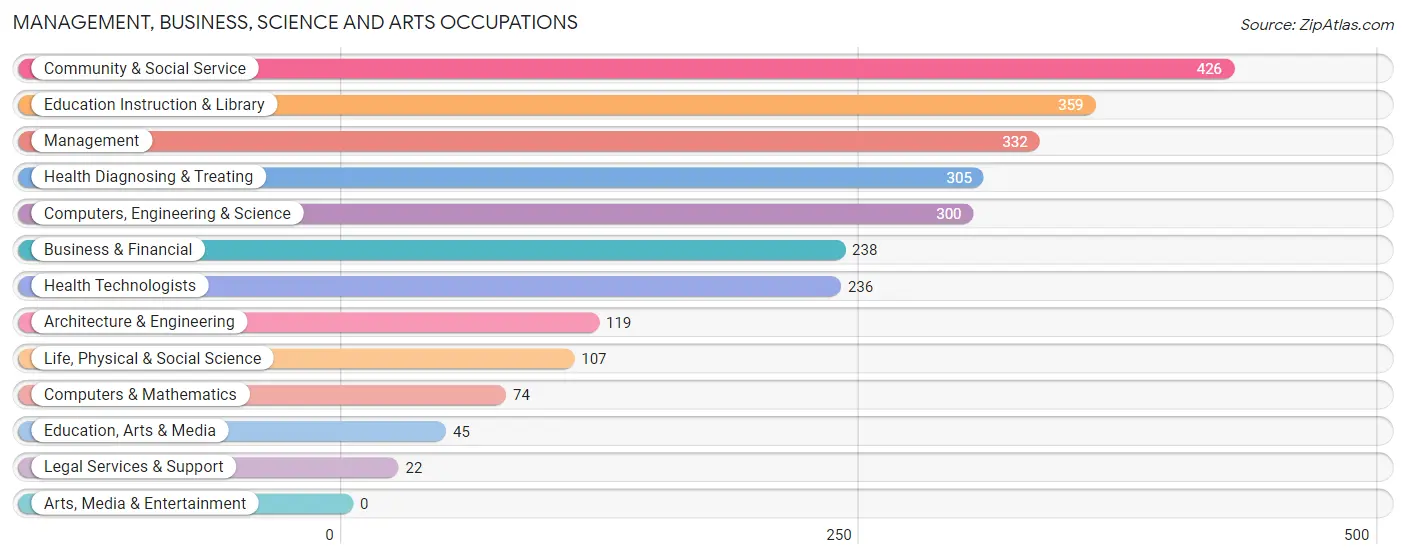
Management, Business, Science and Arts Occupations
The most common Management, Business, Science and Arts occupations in Lake Mills are Community & Social Service (426 | 11.7%), Education Instruction & Library (359 | 9.8%), Management (332 | 9.1%), Health Diagnosing & Treating (305 | 8.3%), and Computers, Engineering & Science (300 | 8.2%).
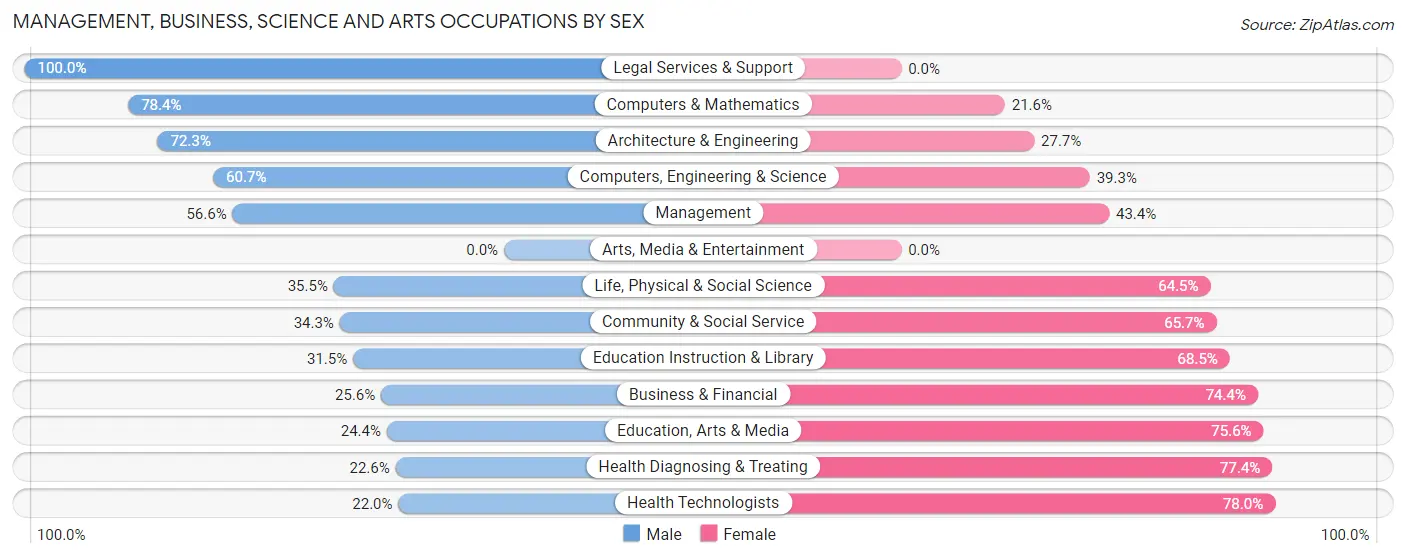
Management, Business, Science and Arts Occupations by Sex
Within the Management, Business, Science and Arts occupations in Lake Mills, the most male-oriented occupations are Legal Services & Support (100.0%), Computers & Mathematics (78.4%), and Architecture & Engineering (72.3%), while the most female-oriented occupations are Health Technologists (78.0%), Health Diagnosing & Treating (77.4%), and Education, Arts & Media (75.6%).
| Occupation | Male | Female |
| Management | 188 (56.6%) | 144 (43.4%) |
| Business & Financial | 61 (25.6%) | 177 (74.4%) |
| Computers, Engineering & Science | 182 (60.7%) | 118 (39.3%) |
| Computers & Mathematics | 58 (78.4%) | 16 (21.6%) |
| Architecture & Engineering | 86 (72.3%) | 33 (27.7%) |
| Life, Physical & Social Science | 38 (35.5%) | 69 (64.5%) |
| Community & Social Service | 146 (34.3%) | 280 (65.7%) |
| Education, Arts & Media | 11 (24.4%) | 34 (75.6%) |
| Legal Services & Support | 22 (100.0%) | 0 (0.0%) |
| Education Instruction & Library | 113 (31.5%) | 246 (68.5%) |
| Arts, Media & Entertainment | 0 (0.0%) | 0 (0.0%) |
| Health Diagnosing & Treating | 69 (22.6%) | 236 (77.4%) |
| Health Technologists | 52 (22.0%) | 184 (78.0%) |
| Total (Category) | 646 (40.4%) | 955 (59.7%) |
| Total (Overall) | 1,888 (51.6%) | 1,770 (48.4%) |
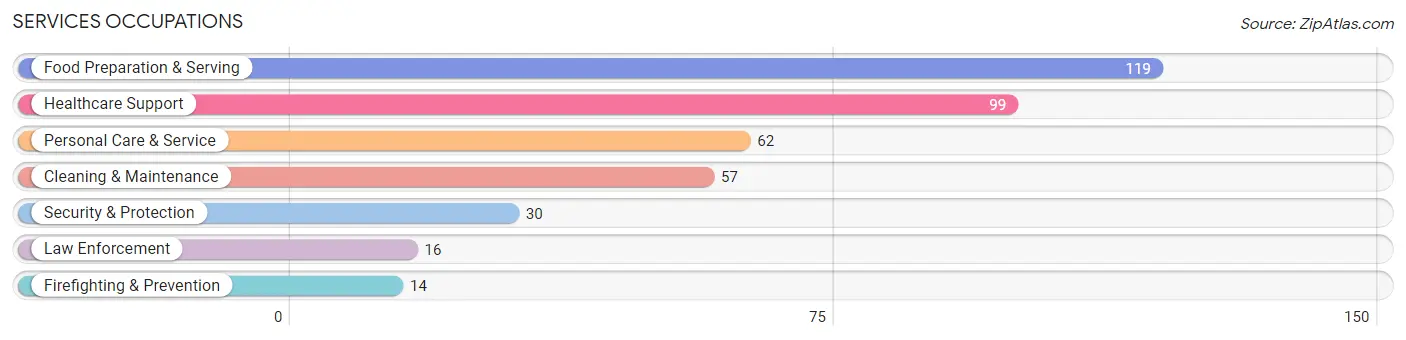
Services Occupations
The most common Services occupations in Lake Mills are Food Preparation & Serving (119 | 3.3%), Healthcare Support (99 | 2.7%), Personal Care & Service (62 | 1.7%), Cleaning & Maintenance (57 | 1.6%), and Security & Protection (30 | 0.8%).
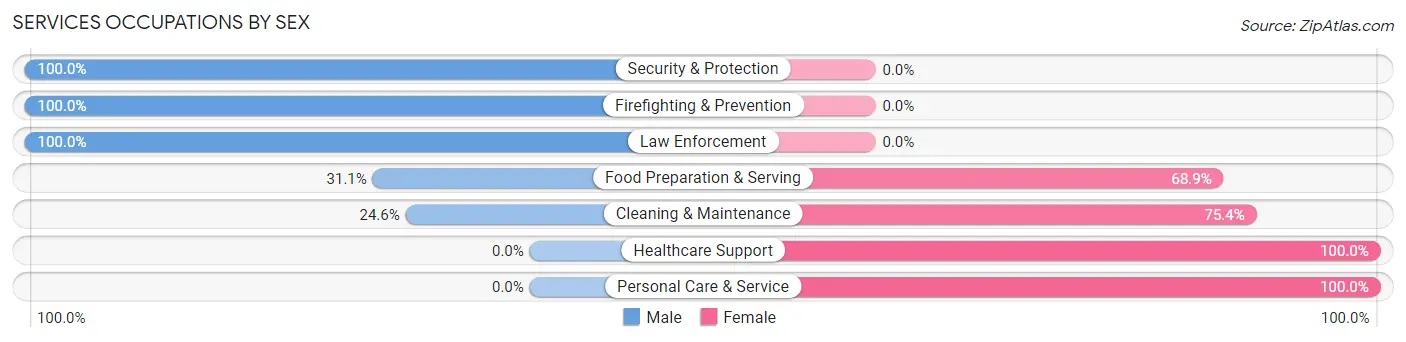
Services Occupations by Sex
Within the Services occupations in Lake Mills, the most male-oriented occupations are Security & Protection (100.0%), Firefighting & Prevention (100.0%), and Law Enforcement (100.0%), while the most female-oriented occupations are Healthcare Support (100.0%), Personal Care & Service (100.0%), and Cleaning & Maintenance (75.4%).
| Occupation | Male | Female |
| Healthcare Support | 0 (0.0%) | 99 (100.0%) |
| Security & Protection | 30 (100.0%) | 0 (0.0%) |
| Firefighting & Prevention | 14 (100.0%) | 0 (0.0%) |
| Law Enforcement | 16 (100.0%) | 0 (0.0%) |
| Food Preparation & Serving | 37 (31.1%) | 82 (68.9%) |
| Cleaning & Maintenance | 14 (24.6%) | 43 (75.4%) |
| Personal Care & Service | 0 (0.0%) | 62 (100.0%) |
| Total (Category) | 81 (22.1%) | 286 (77.9%) |
| Total (Overall) | 1,888 (51.6%) | 1,770 (48.4%) |
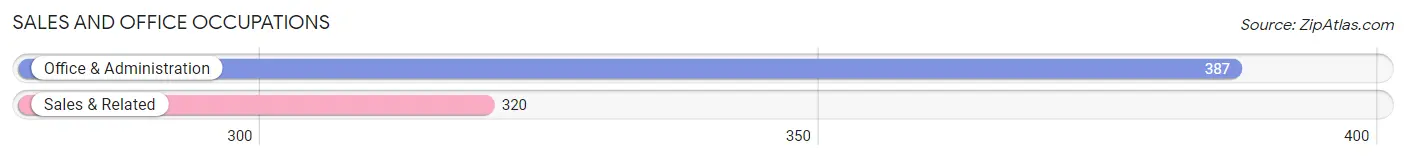
Sales and Office Occupations
The most common Sales and Office occupations in Lake Mills are Office & Administration (387 | 10.6%), and Sales & Related (320 | 8.7%).
Sales and Office Occupations by Sex
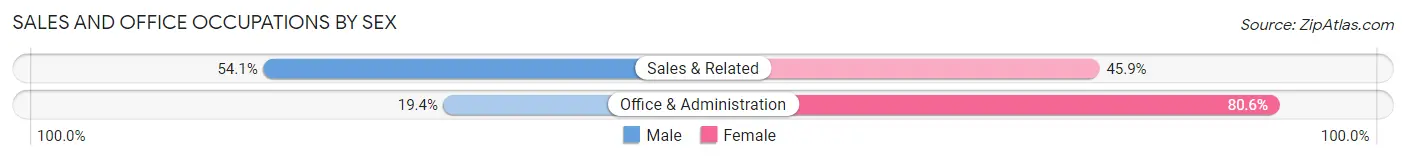
| Occupation | Male | Female |
| Sales & Related | 173 (54.1%) | 147 (45.9%) |
| Office & Administration | 75 (19.4%) | 312 (80.6%) |
| Total (Category) | 248 (35.1%) | 459 (64.9%) |
| Total (Overall) | 1,888 (51.6%) | 1,770 (48.4%) |
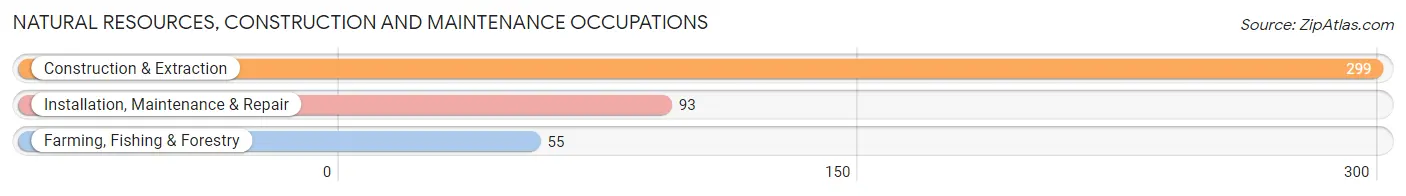
Natural Resources, Construction and Maintenance Occupations
The most common Natural Resources, Construction and Maintenance occupations in Lake Mills are Construction & Extraction (299 | 8.2%), Installation, Maintenance & Repair (93 | 2.5%), and Farming, Fishing & Forestry (55 | 1.5%).
Natural Resources, Construction and Maintenance Occupations by Sex
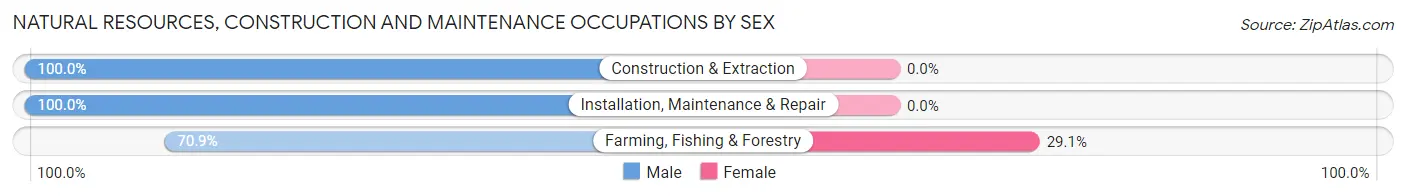
| Occupation | Male | Female |
| Farming, Fishing & Forestry | 39 (70.9%) | 16 (29.1%) |
| Construction & Extraction | 299 (100.0%) | 0 (0.0%) |
| Installation, Maintenance & Repair | 93 (100.0%) | 0 (0.0%) |
| Total (Category) | 431 (96.4%) | 16 (3.6%) |
| Total (Overall) | 1,888 (51.6%) | 1,770 (48.4%) |
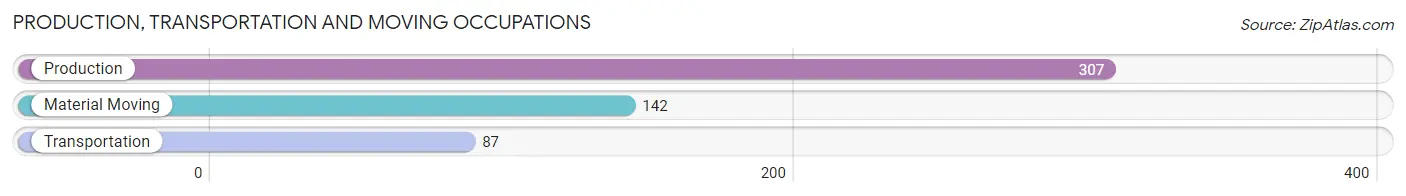
Production, Transportation and Moving Occupations
The most common Production, Transportation and Moving occupations in Lake Mills are Production (307 | 8.4%), Material Moving (142 | 3.9%), and Transportation (87 | 2.4%).
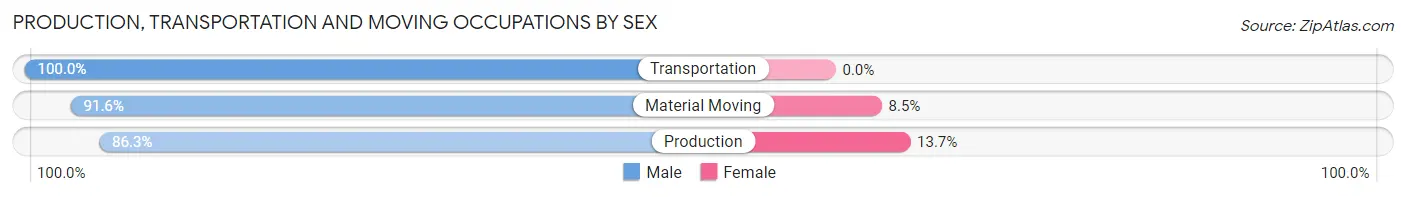
Production, Transportation and Moving Occupations by Sex
| Occupation | Male | Female |
| Production | 265 (86.3%) | 42 (13.7%) |
| Transportation | 87 (100.0%) | 0 (0.0%) |
| Material Moving | 130 (91.5%) | 12 (8.5%) |
| Total (Category) | 482 (89.9%) | 54 (10.1%) |
| Total (Overall) | 1,888 (51.6%) | 1,770 (48.4%) |
Employment Industries by Sex in Lake Mills
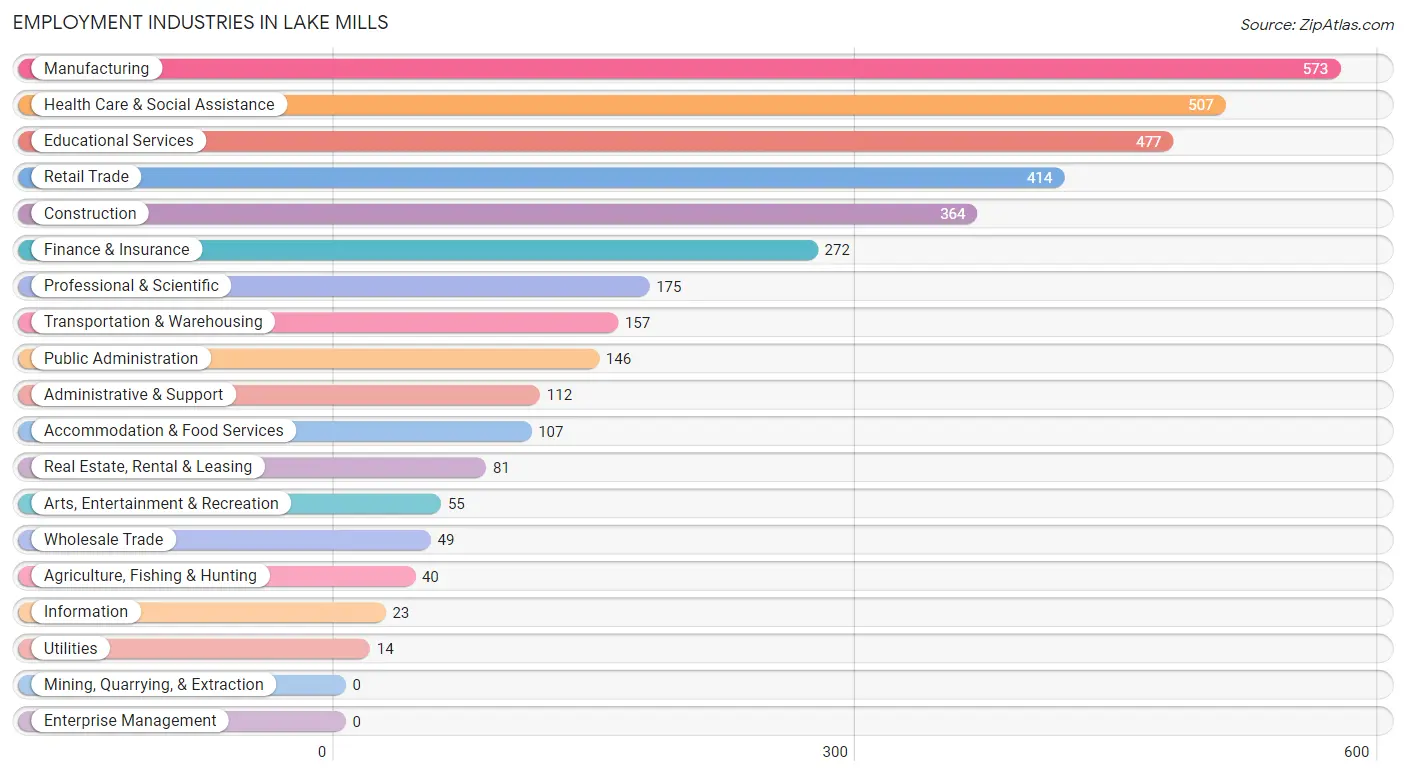
Employment Industries in Lake Mills
The major employment industries in Lake Mills include Manufacturing (573 | 15.7%), Health Care & Social Assistance (507 | 13.9%), Educational Services (477 | 13.0%), Retail Trade (414 | 11.3%), and Construction (364 | 10.0%).
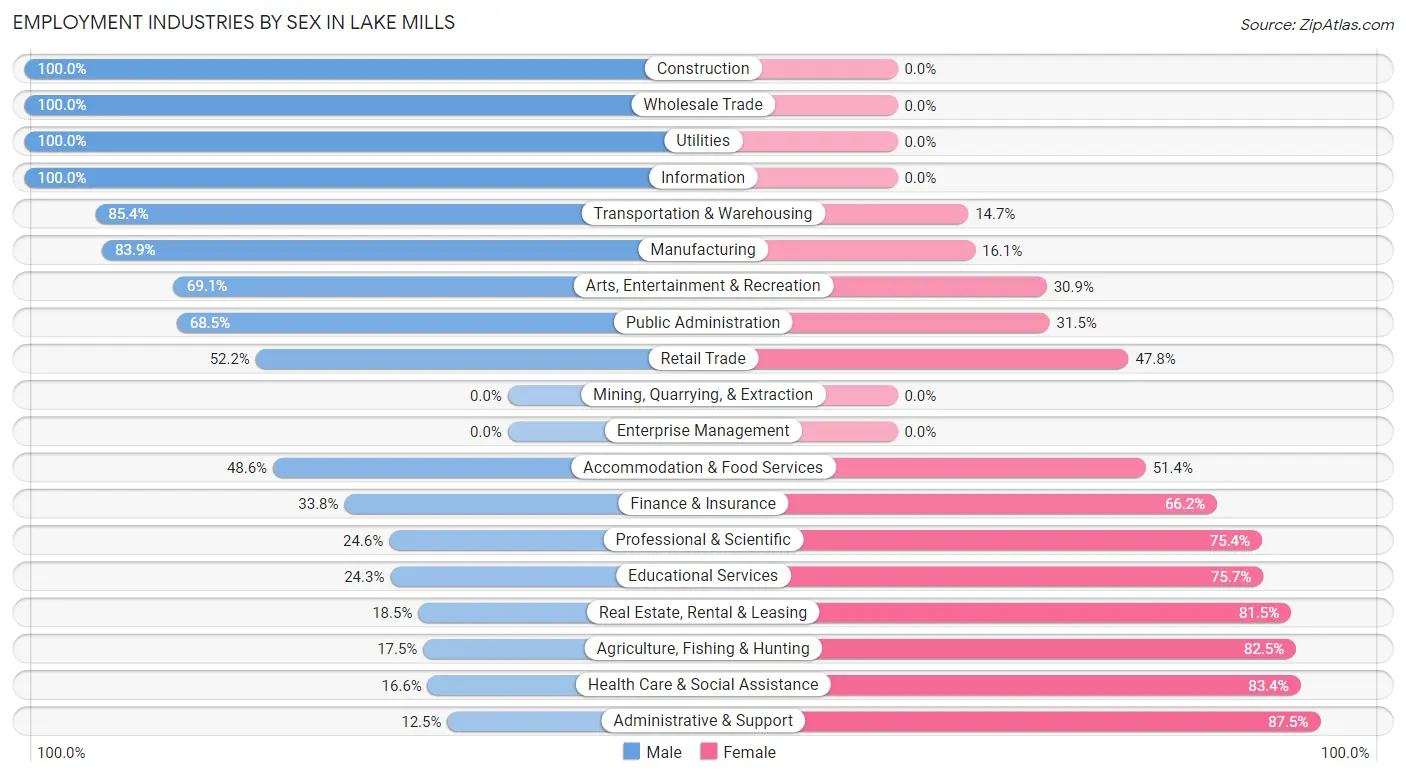
Employment Industries by Sex in Lake Mills
The Lake Mills industries that see more men than women are Construction (100.0%), Wholesale Trade (100.0%), and Utilities (100.0%), whereas the industries that tend to have a higher number of women are Administrative & Support (87.5%), Health Care & Social Assistance (83.4%), and Agriculture, Fishing & Hunting (82.5%).
| Industry | Male | Female |
| Agriculture, Fishing & Hunting | 7 (17.5%) | 33 (82.5%) |
| Mining, Quarrying, & Extraction | 0 (0.0%) | 0 (0.0%) |
| Construction | 364 (100.0%) | 0 (0.0%) |
| Manufacturing | 481 (83.9%) | 92 (16.1%) |
| Wholesale Trade | 49 (100.0%) | 0 (0.0%) |
| Retail Trade | 216 (52.2%) | 198 (47.8%) |
| Transportation & Warehousing | 134 (85.4%) | 23 (14.6%) |
| Utilities | 14 (100.0%) | 0 (0.0%) |
| Information | 23 (100.0%) | 0 (0.0%) |
| Finance & Insurance | 92 (33.8%) | 180 (66.2%) |
| Real Estate, Rental & Leasing | 15 (18.5%) | 66 (81.5%) |
| Professional & Scientific | 43 (24.6%) | 132 (75.4%) |
| Enterprise Management | 0 (0.0%) | 0 (0.0%) |
| Administrative & Support | 14 (12.5%) | 98 (87.5%) |
| Educational Services | 116 (24.3%) | 361 (75.7%) |
| Health Care & Social Assistance | 84 (16.6%) | 423 (83.4%) |
| Arts, Entertainment & Recreation | 38 (69.1%) | 17 (30.9%) |
| Accommodation & Food Services | 52 (48.6%) | 55 (51.4%) |
| Public Administration | 100 (68.5%) | 46 (31.5%) |
| Total | 1,888 (51.6%) | 1,770 (48.4%) |
Education in Lake Mills
School Enrollment in Lake Mills
The most common levels of schooling among the 1,541 students in Lake Mills are middle school (389 | 25.2%), elementary school (373 | 24.2%), and high school (239 | 15.5%).
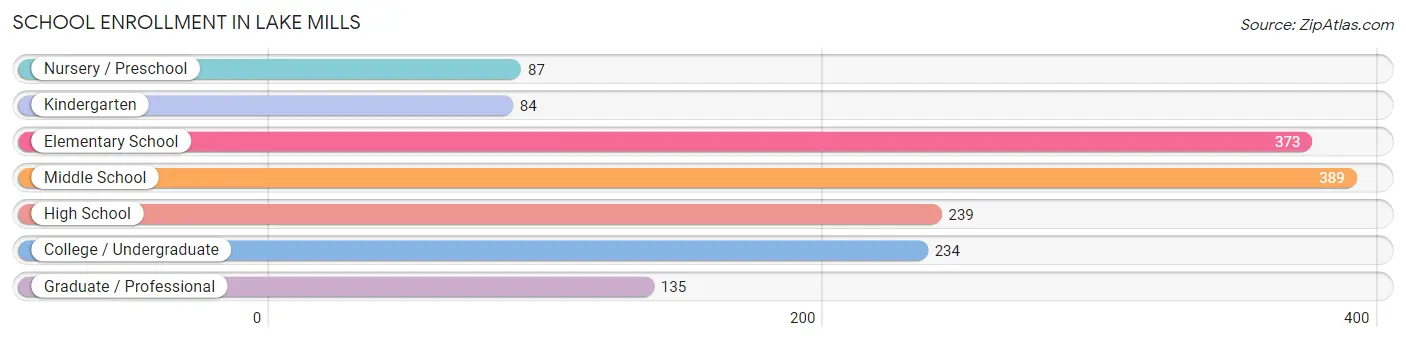
| School Level | # Students | % Students |
| Nursery / Preschool | 87 | 5.7% |
| Kindergarten | 84 | 5.4% |
| Elementary School | 373 | 24.2% |
| Middle School | 389 | 25.2% |
| High School | 239 | 15.5% |
| College / Undergraduate | 234 | 15.2% |
| Graduate / Professional | 135 | 8.8% |
| Total | 1,541 | 100.0% |
School Enrollment by Age by Funding Source in Lake Mills
Out of a total of 1,541 students who are enrolled in schools in Lake Mills, 173 (11.2%) attend a private institution, while the remaining 1,368 (88.8%) are enrolled in public schools. The age group of 35 years and over has the highest likelihood of being enrolled in private schools, with 51 (60.0% in the age bracket) enrolled. Conversely, the age group of 10 to 14 year olds has the lowest likelihood of being enrolled in a private school, with 468 (100.0% in the age bracket) attending a public institution.
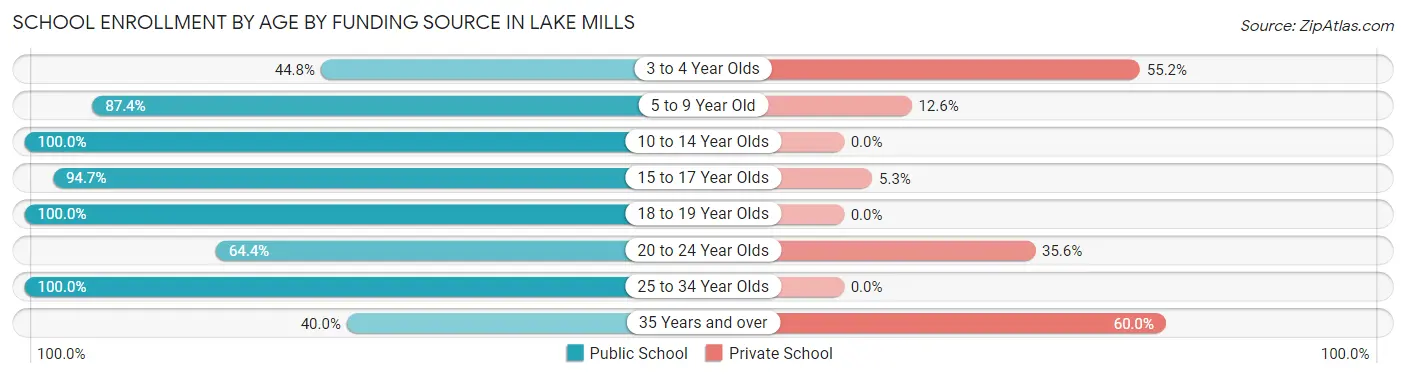
| Age Bracket | Public School | Private School |
| 3 to 4 Year Olds | 13 (44.8%) | 16 (55.2%) |
| 5 to 9 Year Old | 422 (87.4%) | 61 (12.6%) |
| 10 to 14 Year Olds | 468 (100.0%) | 0 (0.0%) |
| 15 to 17 Year Olds | 161 (94.7%) | 9 (5.3%) |
| 18 to 19 Year Olds | 125 (100.0%) | 0 (0.0%) |
| 20 to 24 Year Olds | 65 (64.4%) | 36 (35.6%) |
| 25 to 34 Year Olds | 80 (100.0%) | 0 (0.0%) |
| 35 Years and over | 34 (40.0%) | 51 (60.0%) |
| Total | 1,368 (88.8%) | 173 (11.2%) |
Educational Attainment by Field of Study in Lake Mills
Education (322 | 16.3%), social sciences (247 | 12.5%), bio, nature & agricultural (240 | 12.1%), business (238 | 12.0%), and science & technology (234 | 11.8%) are the most common fields of study among 1,980 individuals in Lake Mills who have obtained a bachelor's degree or higher.
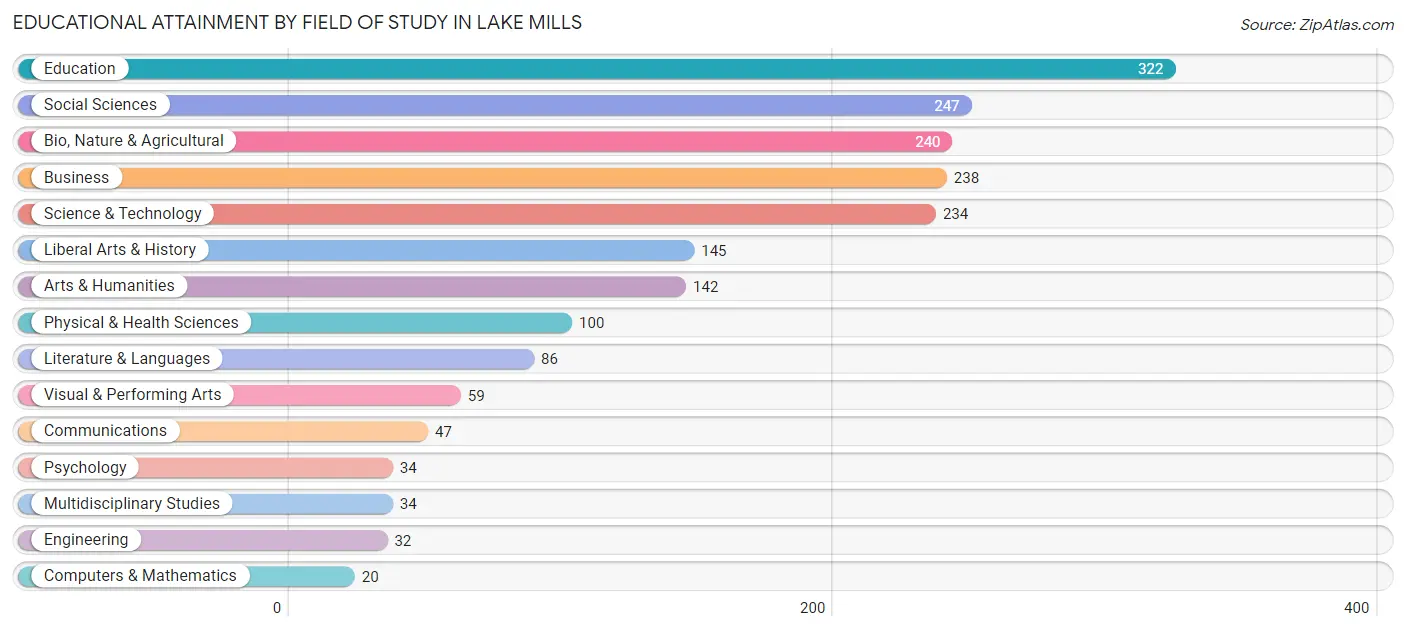
| Field of Study | # Graduates | % Graduates |
| Computers & Mathematics | 20 | 1.0% |
| Bio, Nature & Agricultural | 240 | 12.1% |
| Physical & Health Sciences | 100 | 5.1% |
| Psychology | 34 | 1.7% |
| Social Sciences | 247 | 12.5% |
| Engineering | 32 | 1.6% |
| Multidisciplinary Studies | 34 | 1.7% |
| Science & Technology | 234 | 11.8% |
| Business | 238 | 12.0% |
| Education | 322 | 16.3% |
| Literature & Languages | 86 | 4.3% |
| Liberal Arts & History | 145 | 7.3% |
| Visual & Performing Arts | 59 | 3.0% |
| Communications | 47 | 2.4% |
| Arts & Humanities | 142 | 7.2% |
| Total | 1,980 | 100.0% |
Transportation & Commute in Lake Mills
Vehicle Availability by Sex in Lake Mills
The most prevalent vehicle ownership categories in Lake Mills are males with 2 vehicles (836, accounting for 44.9%) and females with 2 vehicles (666, making up 47.3%).
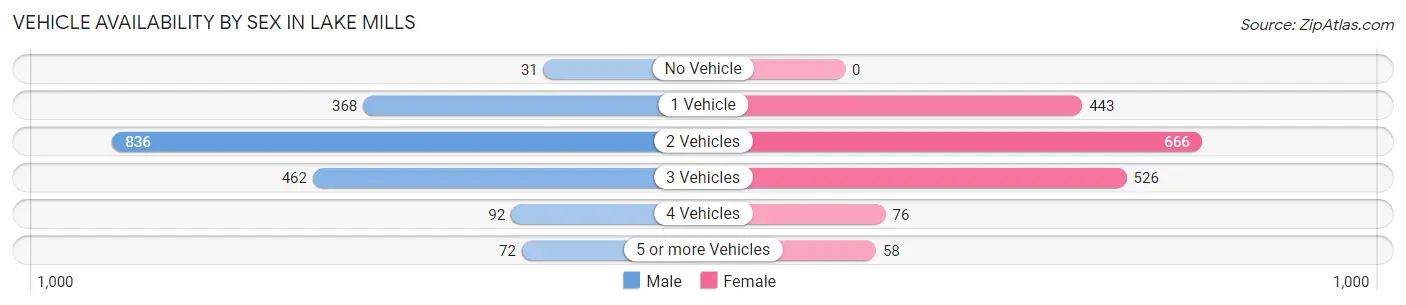
| Vehicles Available | Male | Female |
| No Vehicle | 31 (1.7%) | 0 (0.0%) |
| 1 Vehicle | 368 (19.8%) | 443 (25.0%) |
| 2 Vehicles | 836 (44.9%) | 666 (37.7%) |
| 3 Vehicles | 462 (24.8%) | 526 (29.7%) |
| 4 Vehicles | 92 (4.9%) | 76 (4.3%) |
| 5 or more Vehicles | 72 (3.9%) | 58 (3.3%) |
| Total | 1,861 (100.0%) | 1,769 (100.0%) |
Commute Time in Lake Mills
The most frequently occuring commute durations in Lake Mills are 5 to 9 minutes (685 commuters, 21.4%), 30 to 34 minutes (437 commuters, 13.7%), and 45 to 59 minutes (405 commuters, 12.7%).
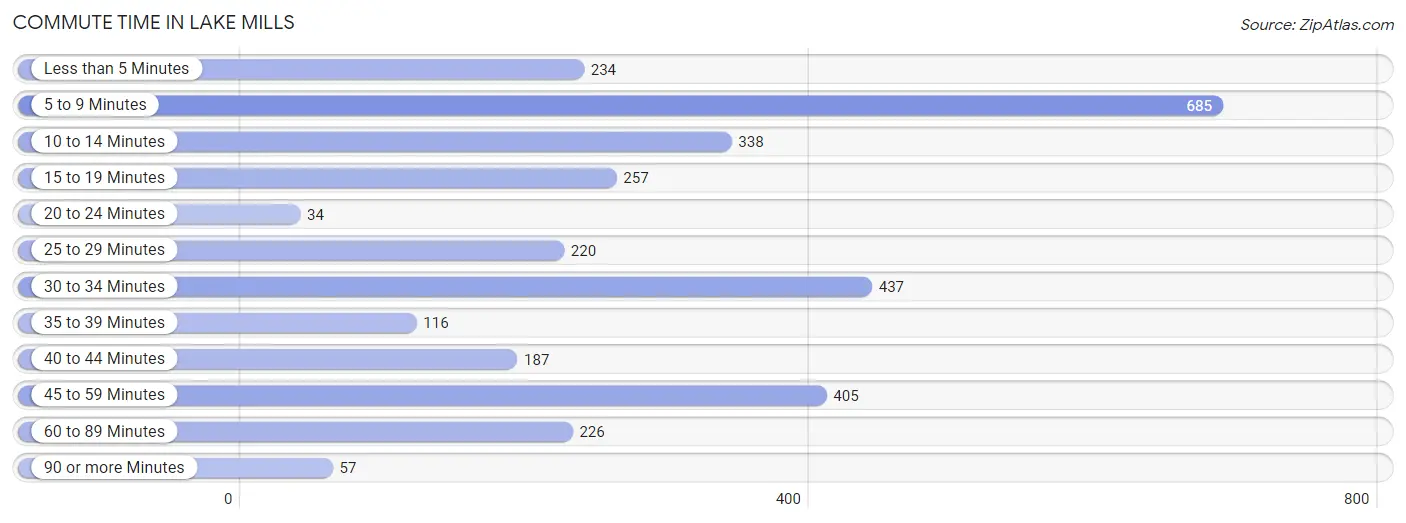
| Commute Time | # Commuters | % Commuters |
| Less than 5 Minutes | 234 | 7.3% |
| 5 to 9 Minutes | 685 | 21.4% |
| 10 to 14 Minutes | 338 | 10.6% |
| 15 to 19 Minutes | 257 | 8.0% |
| 20 to 24 Minutes | 34 | 1.1% |
| 25 to 29 Minutes | 220 | 6.9% |
| 30 to 34 Minutes | 437 | 13.7% |
| 35 to 39 Minutes | 116 | 3.6% |
| 40 to 44 Minutes | 187 | 5.9% |
| 45 to 59 Minutes | 405 | 12.7% |
| 60 to 89 Minutes | 226 | 7.1% |
| 90 or more Minutes | 57 | 1.8% |
Commute Time by Sex in Lake Mills
The most common commute times in Lake Mills are 5 to 9 minutes (411 commuters, 24.7%) for males and 30 to 34 minutes (276 commuters, 18.0%) for females.
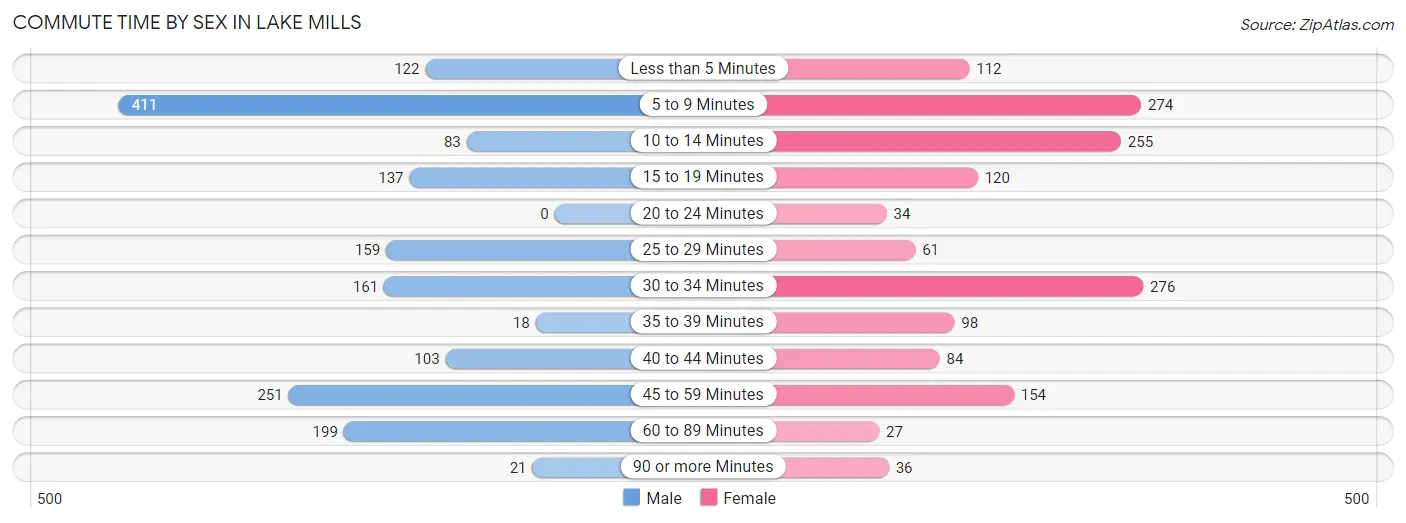
| Commute Time | Male | Female |
| Less than 5 Minutes | 122 (7.3%) | 112 (7.3%) |
| 5 to 9 Minutes | 411 (24.7%) | 274 (17.9%) |
| 10 to 14 Minutes | 83 (5.0%) | 255 (16.7%) |
| 15 to 19 Minutes | 137 (8.2%) | 120 (7.8%) |
| 20 to 24 Minutes | 0 (0.0%) | 34 (2.2%) |
| 25 to 29 Minutes | 159 (9.6%) | 61 (4.0%) |
| 30 to 34 Minutes | 161 (9.7%) | 276 (18.0%) |
| 35 to 39 Minutes | 18 (1.1%) | 98 (6.4%) |
| 40 to 44 Minutes | 103 (6.2%) | 84 (5.5%) |
| 45 to 59 Minutes | 251 (15.1%) | 154 (10.1%) |
| 60 to 89 Minutes | 199 (11.9%) | 27 (1.8%) |
| 90 or more Minutes | 21 (1.3%) | 36 (2.4%) |
Time of Departure to Work by Sex in Lake Mills
The most frequent times of departure to work in Lake Mills are 5:30 AM to 5:59 AM (300, 18.0%) for males and 7:30 AM to 7:59 AM (371, 24.2%) for females.
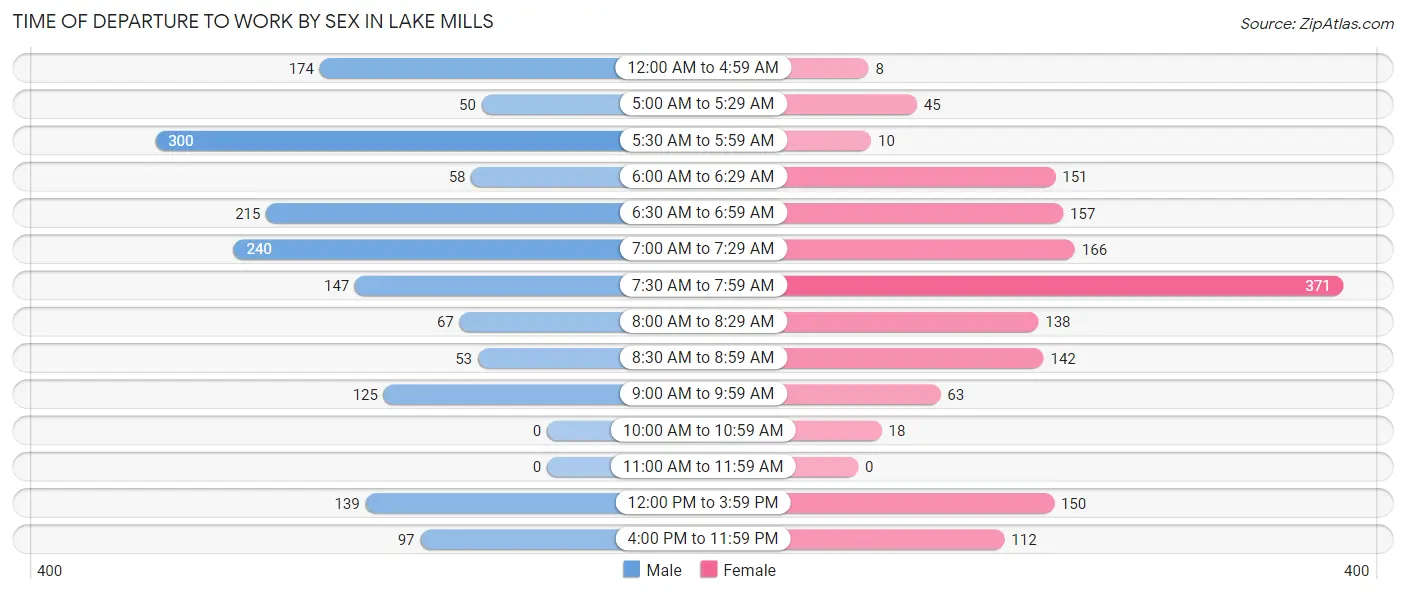
| Time of Departure | Male | Female |
| 12:00 AM to 4:59 AM | 174 (10.4%) | 8 (0.5%) |
| 5:00 AM to 5:29 AM | 50 (3.0%) | 45 (2.9%) |
| 5:30 AM to 5:59 AM | 300 (18.0%) | 10 (0.6%) |
| 6:00 AM to 6:29 AM | 58 (3.5%) | 151 (9.9%) |
| 6:30 AM to 6:59 AM | 215 (12.9%) | 157 (10.2%) |
| 7:00 AM to 7:29 AM | 240 (14.4%) | 166 (10.8%) |
| 7:30 AM to 7:59 AM | 147 (8.8%) | 371 (24.2%) |
| 8:00 AM to 8:29 AM | 67 (4.0%) | 138 (9.0%) |
| 8:30 AM to 8:59 AM | 53 (3.2%) | 142 (9.3%) |
| 9:00 AM to 9:59 AM | 125 (7.5%) | 63 (4.1%) |
| 10:00 AM to 10:59 AM | 0 (0.0%) | 18 (1.2%) |
| 11:00 AM to 11:59 AM | 0 (0.0%) | 0 (0.0%) |
| 12:00 PM to 3:59 PM | 139 (8.4%) | 150 (9.8%) |
| 4:00 PM to 11:59 PM | 97 (5.8%) | 112 (7.3%) |
| Total | 1,665 (100.0%) | 1,531 (100.0%) |
Housing Occupancy in Lake Mills
Occupancy by Ownership in Lake Mills
Of the total 2,464 dwellings in Lake Mills, owner-occupied units account for 1,666 (67.6%), while renter-occupied units make up 798 (32.4%).
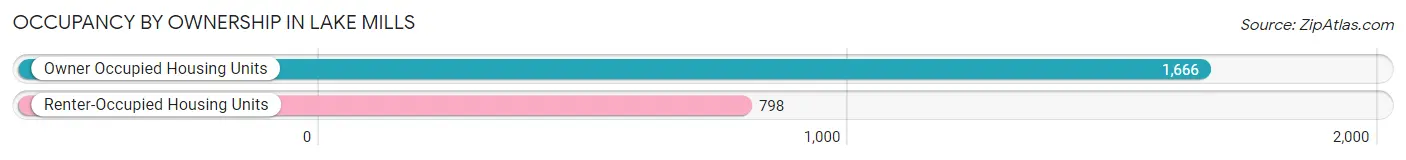
| Occupancy | # Housing Units | % Housing Units |
| Owner Occupied Housing Units | 1,666 | 67.6% |
| Renter-Occupied Housing Units | 798 | 32.4% |
| Total Occupied Housing Units | 2,464 | 100.0% |
Occupancy by Household Size in Lake Mills
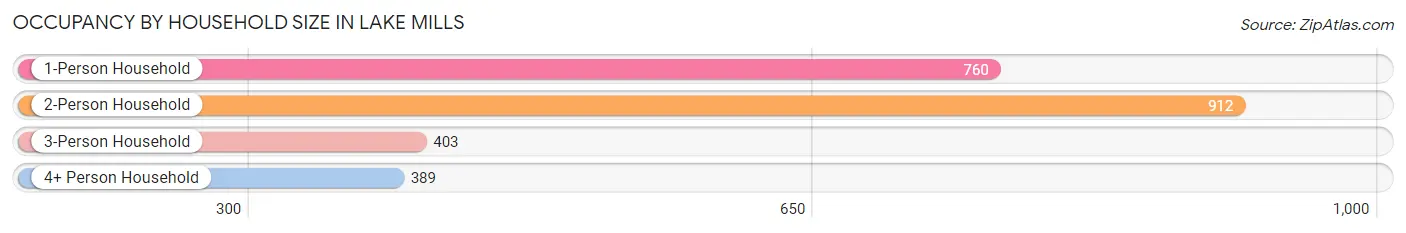
| Household Size | # Housing Units | % Housing Units |
| 1-Person Household | 760 | 30.8% |
| 2-Person Household | 912 | 37.0% |
| 3-Person Household | 403 | 16.4% |
| 4+ Person Household | 389 | 15.8% |
| Total Housing Units | 2,464 | 100.0% |
Occupancy by Ownership by Household Size in Lake Mills
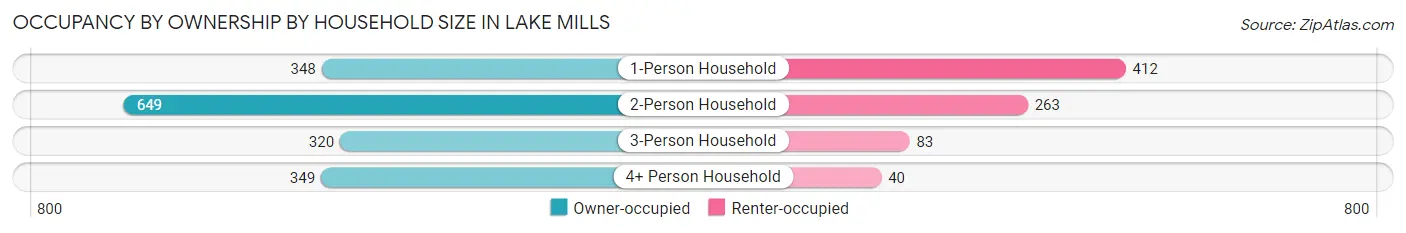
| Household Size | Owner-occupied | Renter-occupied |
| 1-Person Household | 348 (45.8%) | 412 (54.2%) |
| 2-Person Household | 649 (71.2%) | 263 (28.8%) |
| 3-Person Household | 320 (79.4%) | 83 (20.6%) |
| 4+ Person Household | 349 (89.7%) | 40 (10.3%) |
| Total Housing Units | 1,666 (67.6%) | 798 (32.4%) |
Occupancy by Educational Attainment in Lake Mills
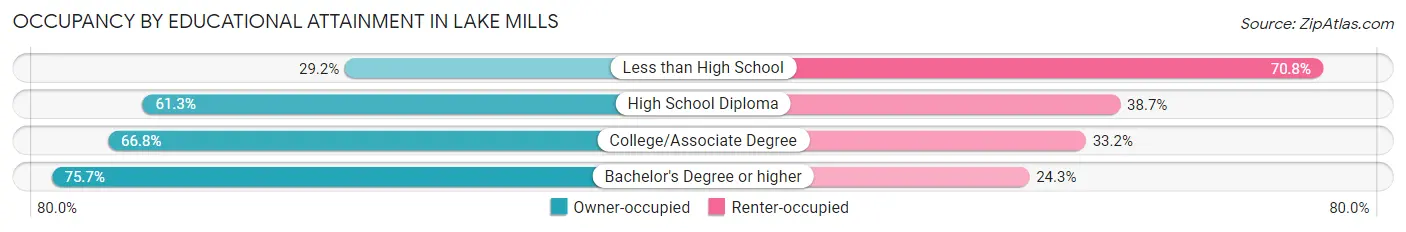
| Household Size | Owner-occupied | Renter-occupied |
| Less than High School | 35 (29.2%) | 85 (70.8%) |
| High School Diploma | 339 (61.3%) | 214 (38.7%) |
| College/Associate Degree | 478 (66.8%) | 238 (33.2%) |
| Bachelor's Degree or higher | 814 (75.7%) | 261 (24.3%) |
Occupancy by Age of Householder in Lake Mills
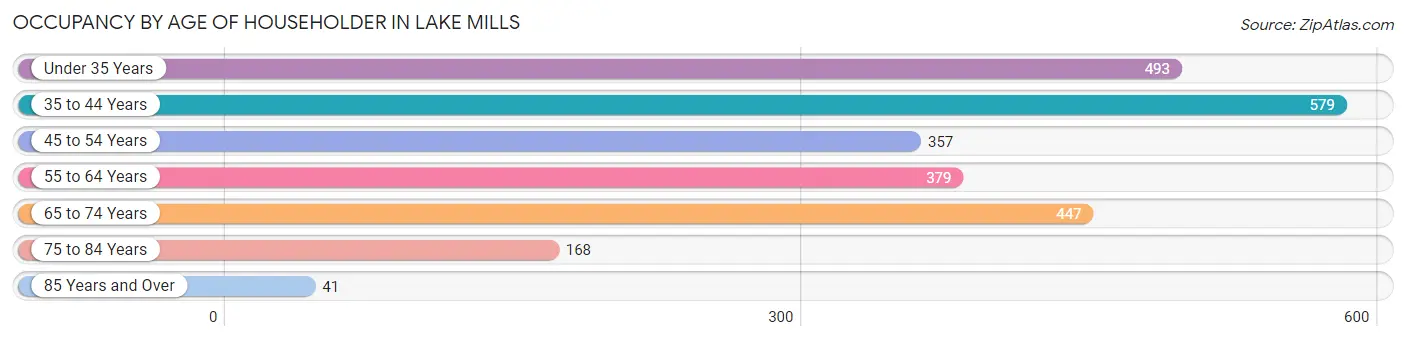
| Age Bracket | # Households | % Households |
| Under 35 Years | 493 | 20.0% |
| 35 to 44 Years | 579 | 23.5% |
| 45 to 54 Years | 357 | 14.5% |
| 55 to 64 Years | 379 | 15.4% |
| 65 to 74 Years | 447 | 18.1% |
| 75 to 84 Years | 168 | 6.8% |
| 85 Years and Over | 41 | 1.7% |
| Total | 2,464 | 100.0% |
Housing Finances in Lake Mills
Median Income by Occupancy in Lake Mills
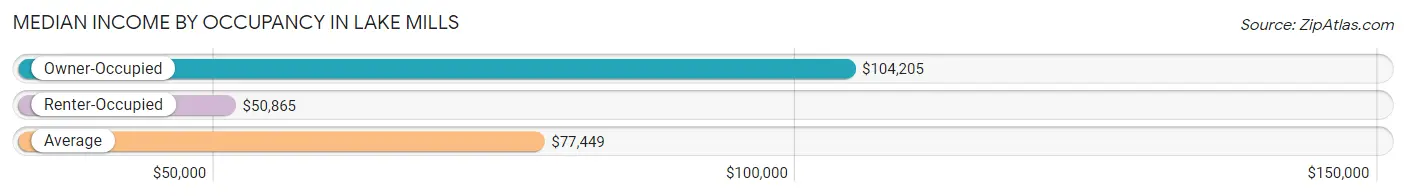
| Occupancy Type | # Households | Median Income |
| Owner-Occupied | 1,666 (67.6%) | $104,205 |
| Renter-Occupied | 798 (32.4%) | $50,865 |
| Average | 2,464 (100.0%) | $77,449 |
Occupancy by Householder Income Bracket in Lake Mills
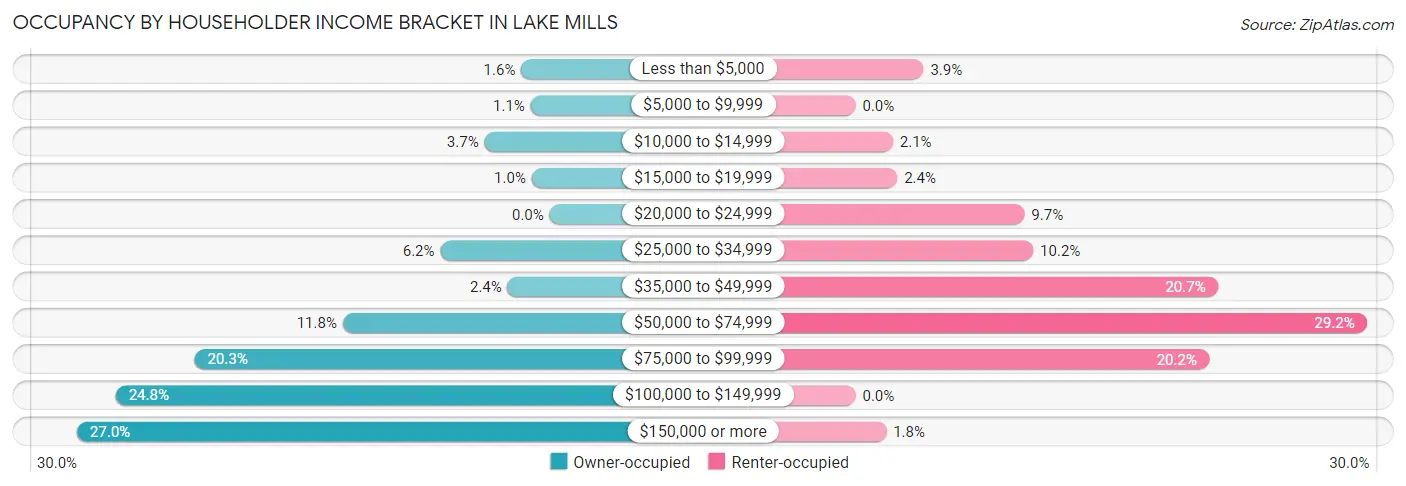
| Income Bracket | Owner-occupied | Renter-occupied |
| Less than $5,000 | 27 (1.6%) | 31 (3.9%) |
| $5,000 to $9,999 | 18 (1.1%) | 0 (0.0%) |
| $10,000 to $14,999 | 62 (3.7%) | 17 (2.1%) |
| $15,000 to $19,999 | 17 (1.0%) | 19 (2.4%) |
| $20,000 to $24,999 | 0 (0.0%) | 77 (9.7%) |
| $25,000 to $34,999 | 104 (6.2%) | 81 (10.2%) |
| $35,000 to $49,999 | 40 (2.4%) | 165 (20.7%) |
| $50,000 to $74,999 | 197 (11.8%) | 233 (29.2%) |
| $75,000 to $99,999 | 338 (20.3%) | 161 (20.2%) |
| $100,000 to $149,999 | 413 (24.8%) | 0 (0.0%) |
| $150,000 or more | 450 (27.0%) | 14 (1.8%) |
| Total | 1,666 (100.0%) | 798 (100.0%) |
Monthly Housing Cost Tiers in Lake Mills
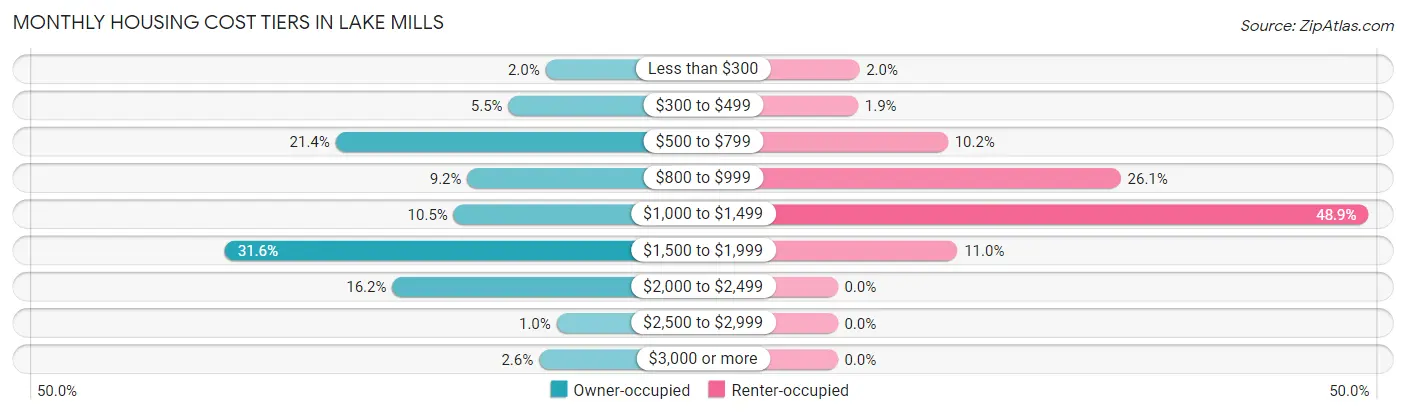
| Monthly Cost | Owner-occupied | Renter-occupied |
| Less than $300 | 34 (2.0%) | 16 (2.0%) |
| $300 to $499 | 91 (5.5%) | 15 (1.9%) |
| $500 to $799 | 356 (21.4%) | 81 (10.2%) |
| $800 to $999 | 154 (9.2%) | 208 (26.1%) |
| $1,000 to $1,499 | 175 (10.5%) | 390 (48.9%) |
| $1,500 to $1,999 | 526 (31.6%) | 88 (11.0%) |
| $2,000 to $2,499 | 269 (16.2%) | 0 (0.0%) |
| $2,500 to $2,999 | 17 (1.0%) | 0 (0.0%) |
| $3,000 or more | 44 (2.6%) | 0 (0.0%) |
| Total | 1,666 (100.0%) | 798 (100.0%) |
Physical Housing Characteristics in Lake Mills
Housing Structures in Lake Mills
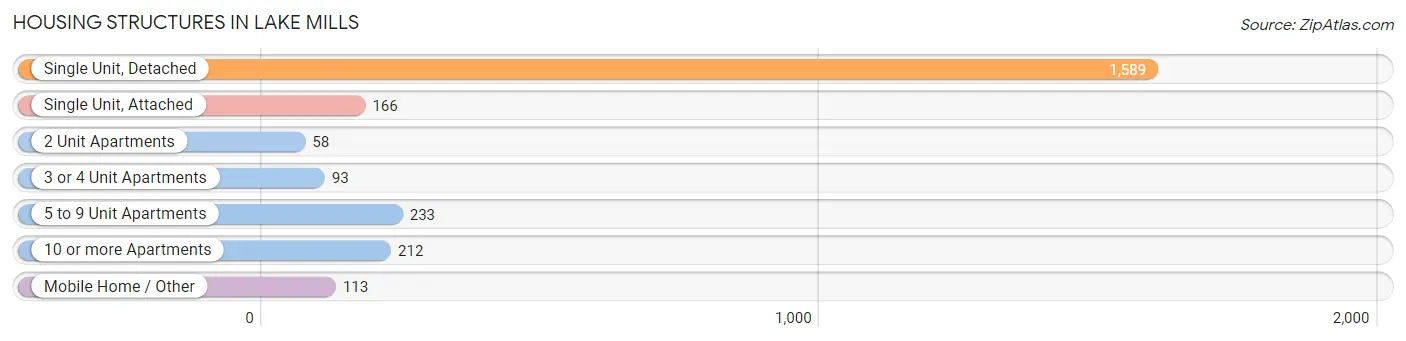
| Structure Type | # Housing Units | % Housing Units |
| Single Unit, Detached | 1,589 | 64.5% |
| Single Unit, Attached | 166 | 6.7% |
| 2 Unit Apartments | 58 | 2.4% |
| 3 or 4 Unit Apartments | 93 | 3.8% |
| 5 to 9 Unit Apartments | 233 | 9.5% |
| 10 or more Apartments | 212 | 8.6% |
| Mobile Home / Other | 113 | 4.6% |
| Total | 2,464 | 100.0% |
Housing Structures by Occupancy in Lake Mills
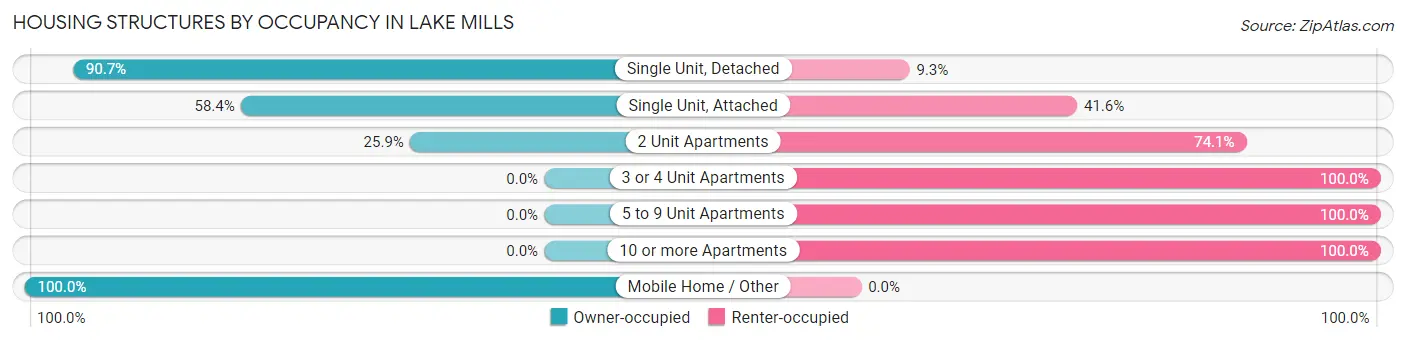
| Structure Type | Owner-occupied | Renter-occupied |
| Single Unit, Detached | 1,441 (90.7%) | 148 (9.3%) |
| Single Unit, Attached | 97 (58.4%) | 69 (41.6%) |
| 2 Unit Apartments | 15 (25.9%) | 43 (74.1%) |
| 3 or 4 Unit Apartments | 0 (0.0%) | 93 (100.0%) |
| 5 to 9 Unit Apartments | 0 (0.0%) | 233 (100.0%) |
| 10 or more Apartments | 0 (0.0%) | 212 (100.0%) |
| Mobile Home / Other | 113 (100.0%) | 0 (0.0%) |
| Total | 1,666 (67.6%) | 798 (32.4%) |
Housing Structures by Number of Rooms in Lake Mills
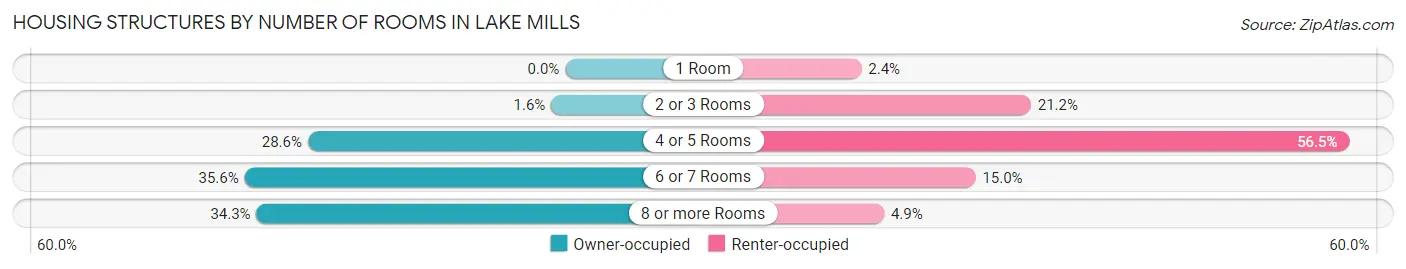
| Number of Rooms | Owner-occupied | Renter-occupied |
| 1 Room | 0 (0.0%) | 19 (2.4%) |
| 2 or 3 Rooms | 26 (1.6%) | 169 (21.2%) |
| 4 or 5 Rooms | 476 (28.6%) | 451 (56.5%) |
| 6 or 7 Rooms | 593 (35.6%) | 120 (15.0%) |
| 8 or more Rooms | 571 (34.3%) | 39 (4.9%) |
| Total | 1,666 (100.0%) | 798 (100.0%) |
Housing Structure by Heating Type in Lake Mills
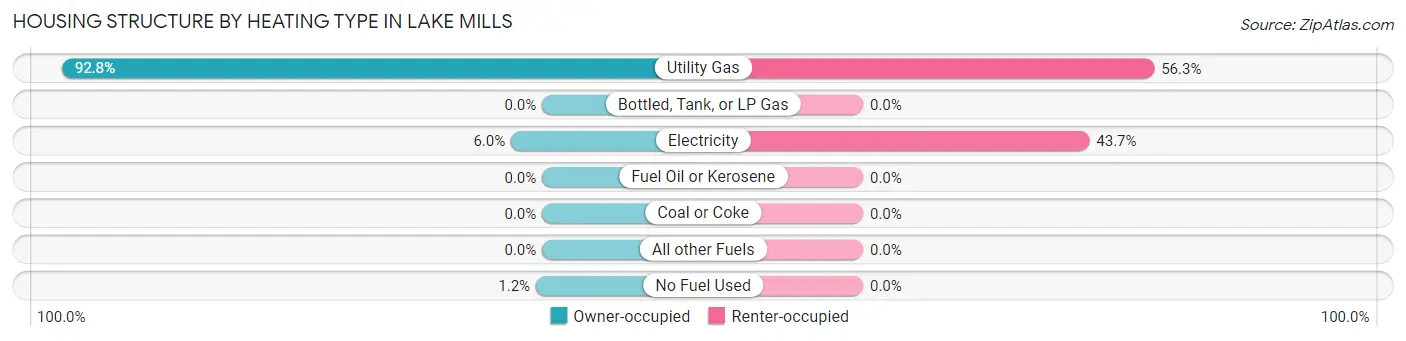
| Heating Type | Owner-occupied | Renter-occupied |
| Utility Gas | 1,546 (92.8%) | 449 (56.3%) |
| Bottled, Tank, or LP Gas | 0 (0.0%) | 0 (0.0%) |
| Electricity | 100 (6.0%) | 349 (43.7%) |
| Fuel Oil or Kerosene | 0 (0.0%) | 0 (0.0%) |
| Coal or Coke | 0 (0.0%) | 0 (0.0%) |
| All other Fuels | 0 (0.0%) | 0 (0.0%) |
| No Fuel Used | 20 (1.2%) | 0 (0.0%) |
| Total | 1,666 (100.0%) | 798 (100.0%) |
Household Vehicle Usage in Lake Mills
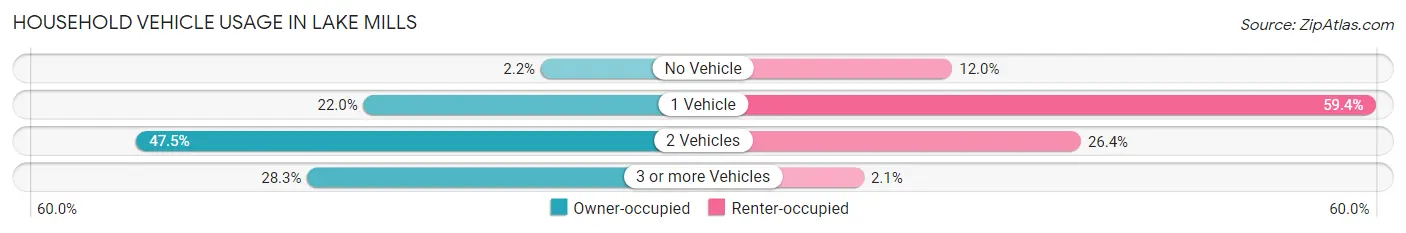
| Vehicles per Household | Owner-occupied | Renter-occupied |
| No Vehicle | 36 (2.2%) | 96 (12.0%) |
| 1 Vehicle | 367 (22.0%) | 474 (59.4%) |
| 2 Vehicles | 791 (47.5%) | 211 (26.4%) |
| 3 or more Vehicles | 472 (28.3%) | 17 (2.1%) |
| Total | 1,666 (100.0%) | 798 (100.0%) |
Real Estate & Mortgages in Lake Mills
Real Estate and Mortgage Overview in Lake Mills
| Characteristic | Without Mortgage | With Mortgage |
| Housing Units | 628 | 1,038 |
| Median Property Value | $239,700 | $269,200 |
| Median Household Income | $82,652 | $316 |
| Monthly Housing Costs | $608 | $44 |
| Real Estate Taxes | $4,709 | $45 |
Property Value by Mortgage Status in Lake Mills
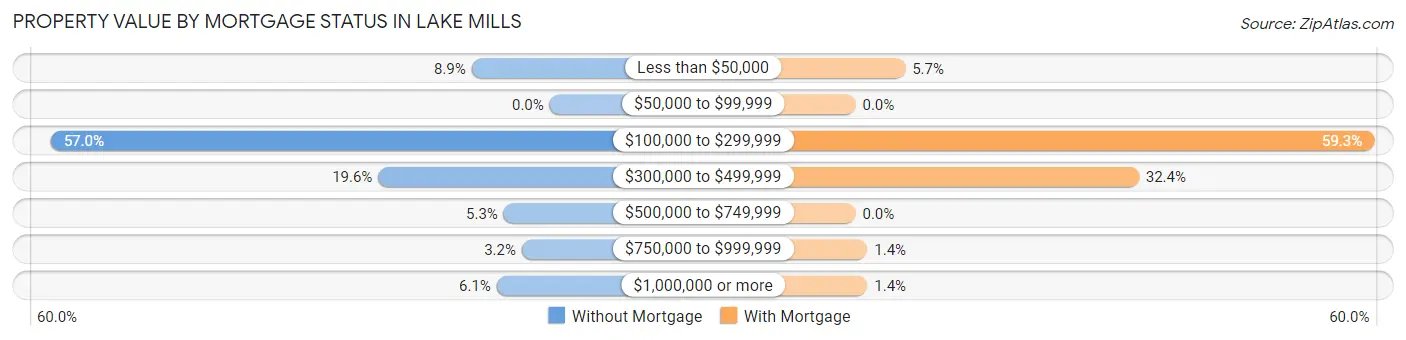
| Property Value | Without Mortgage | With Mortgage |
| Less than $50,000 | 56 (8.9%) | 59 (5.7%) |
| $50,000 to $99,999 | 0 (0.0%) | 0 (0.0%) |
| $100,000 to $299,999 | 358 (57.0%) | 615 (59.3%) |
| $300,000 to $499,999 | 123 (19.6%) | 336 (32.4%) |
| $500,000 to $749,999 | 33 (5.2%) | 0 (0.0%) |
| $750,000 to $999,999 | 20 (3.2%) | 14 (1.3%) |
| $1,000,000 or more | 38 (6.0%) | 14 (1.3%) |
| Total | 628 (100.0%) | 1,038 (100.0%) |
Household Income by Mortgage Status in Lake Mills
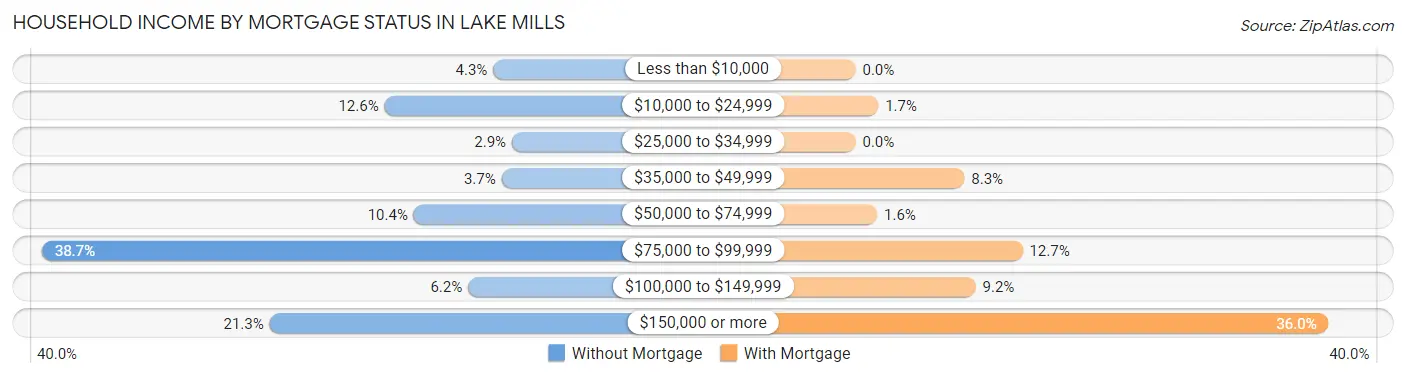
| Household Income | Without Mortgage | With Mortgage |
| Less than $10,000 | 27 (4.3%) | 0 (0.0%) |
| $10,000 to $24,999 | 79 (12.6%) | 18 (1.7%) |
| $25,000 to $34,999 | 18 (2.9%) | 0 (0.0%) |
| $35,000 to $49,999 | 23 (3.7%) | 86 (8.3%) |
| $50,000 to $74,999 | 65 (10.3%) | 17 (1.6%) |
| $75,000 to $99,999 | 243 (38.7%) | 132 (12.7%) |
| $100,000 to $149,999 | 39 (6.2%) | 95 (9.1%) |
| $150,000 or more | 134 (21.3%) | 374 (36.0%) |
| Total | 628 (100.0%) | 1,038 (100.0%) |
Property Value to Household Income Ratio in Lake Mills
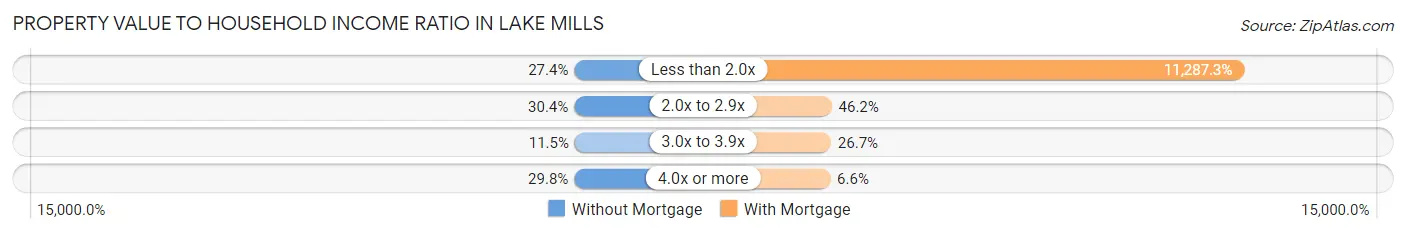
| Value-to-Income Ratio | Without Mortgage | With Mortgage |
| Less than 2.0x | 172 (27.4%) | 117,162 (11,287.3%) |
| 2.0x to 2.9x | 191 (30.4%) | 479 (46.2%) |
| 3.0x to 3.9x | 72 (11.5%) | 277 (26.7%) |
| 4.0x or more | 187 (29.8%) | 68 (6.6%) |
| Total | 628 (100.0%) | 1,038 (100.0%) |
Real Estate Taxes by Mortgage Status in Lake Mills
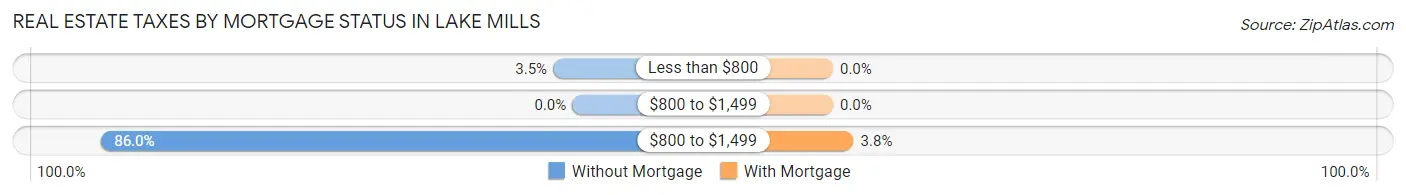
| Property Taxes | Without Mortgage | With Mortgage |
| Less than $800 | 22 (3.5%) | 0 (0.0%) |
| $800 to $1,499 | 0 (0.0%) | 0 (0.0%) |
| $800 to $1,499 | 540 (86.0%) | 39 (3.8%) |
| Total | 628 (100.0%) | 1,038 (100.0%) |
Health & Disability in Lake Mills
Health Insurance Coverage by Age in Lake Mills
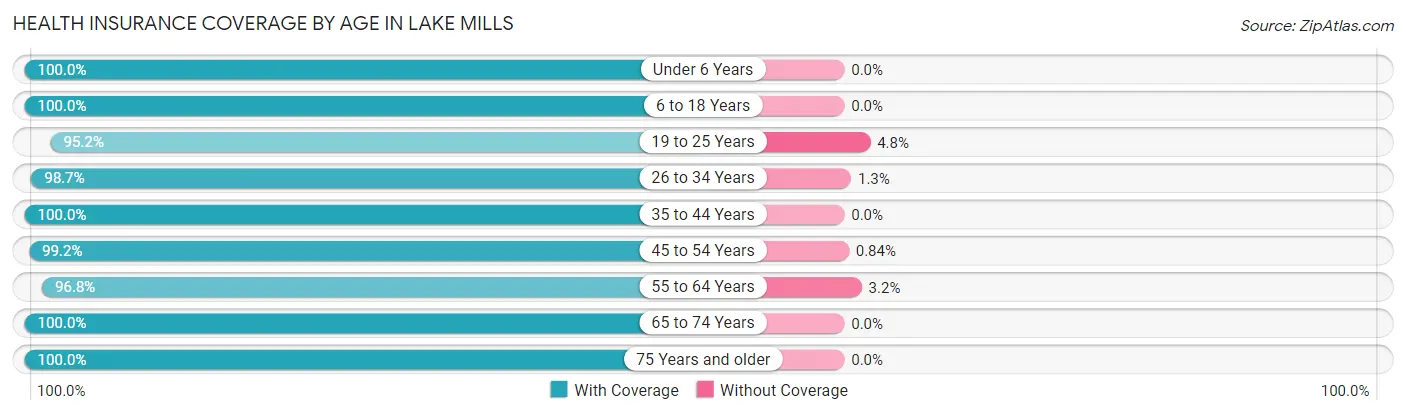
| Age Bracket | With Coverage | Without Coverage |
| Under 6 Years | 387 (100.0%) | 0 (0.0%) |
| 6 to 18 Years | 1,114 (100.0%) | 0 (0.0%) |
| 19 to 25 Years | 414 (95.2%) | 21 (4.8%) |
| 26 to 34 Years | 865 (98.7%) | 11 (1.3%) |
| 35 to 44 Years | 866 (100.0%) | 0 (0.0%) |
| 45 to 54 Years | 949 (99.2%) | 8 (0.8%) |
| 55 to 64 Years | 597 (96.8%) | 20 (3.2%) |
| 65 to 74 Years | 765 (100.0%) | 0 (0.0%) |
| 75 Years and older | 210 (100.0%) | 0 (0.0%) |
| Total | 6,167 (99.0%) | 60 (1.0%) |
Health Insurance Coverage by Citizenship Status in Lake Mills
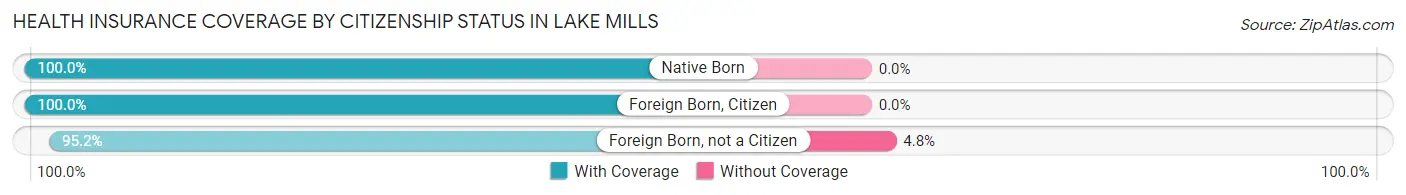
| Citizenship Status | With Coverage | Without Coverage |
| Native Born | 387 (100.0%) | 0 (0.0%) |
| Foreign Born, Citizen | 1,114 (100.0%) | 0 (0.0%) |
| Foreign Born, not a Citizen | 414 (95.2%) | 21 (4.8%) |
Health Insurance Coverage by Household Income in Lake Mills
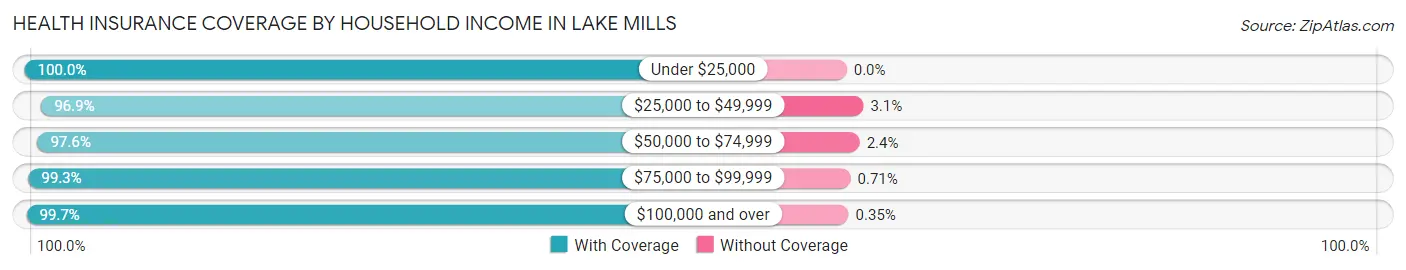
| Household Income | With Coverage | Without Coverage |
| Under $25,000 | 421 (100.0%) | 0 (0.0%) |
| $25,000 to $49,999 | 651 (96.9%) | 21 (3.1%) |
| $50,000 to $74,999 | 808 (97.6%) | 20 (2.4%) |
| $75,000 to $99,999 | 1,125 (99.3%) | 8 (0.7%) |
| $100,000 and over | 3,156 (99.7%) | 11 (0.4%) |
Public vs Private Health Insurance Coverage by Age in Lake Mills
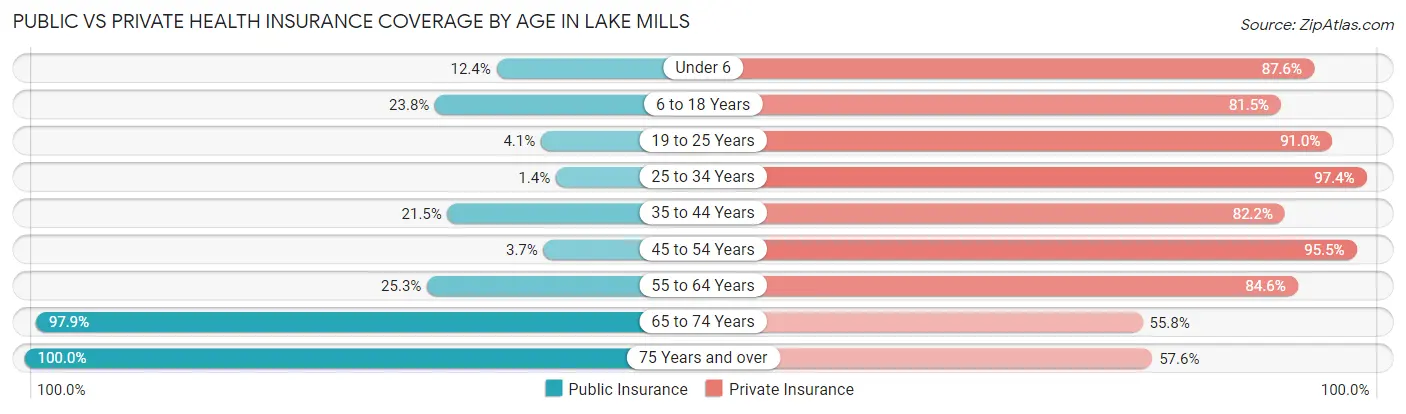
| Age Bracket | Public Insurance | Private Insurance |
| Under 6 | 48 (12.4%) | 339 (87.6%) |
| 6 to 18 Years | 265 (23.8%) | 908 (81.5%) |
| 19 to 25 Years | 18 (4.1%) | 396 (91.0%) |
| 25 to 34 Years | 12 (1.4%) | 853 (97.4%) |
| 35 to 44 Years | 186 (21.5%) | 712 (82.2%) |
| 45 to 54 Years | 35 (3.7%) | 914 (95.5%) |
| 55 to 64 Years | 156 (25.3%) | 522 (84.6%) |
| 65 to 74 Years | 749 (97.9%) | 427 (55.8%) |
| 75 Years and over | 210 (100.0%) | 121 (57.6%) |
| Total | 1,679 (27.0%) | 5,192 (83.4%) |
Disability Status by Sex by Age in Lake Mills
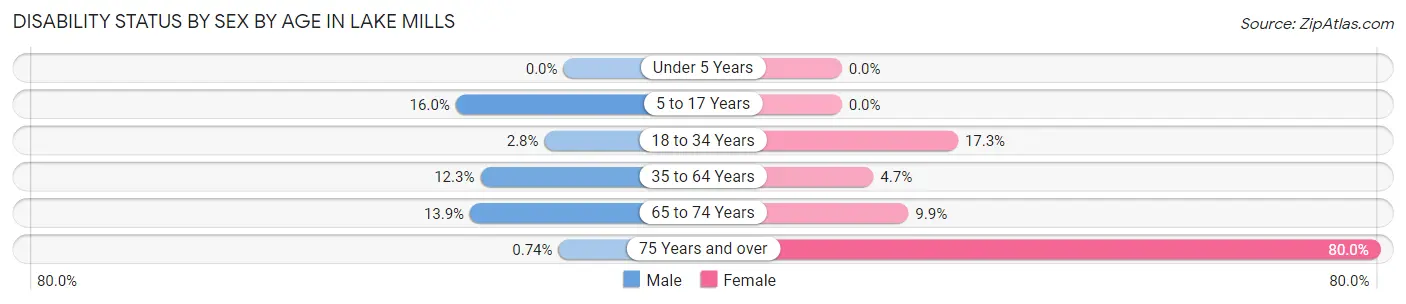
| Age Bracket | Male | Female |
| Under 5 Years | 0 (0.0%) | 0 (0.0%) |
| 5 to 17 Years | 86 (16.0%) | 0 (0.0%) |
| 18 to 34 Years | 20 (2.8%) | 119 (17.2%) |
| 35 to 64 Years | 151 (12.3%) | 57 (4.7%) |
| 65 to 74 Years | 57 (13.9%) | 35 (9.9%) |
| 75 Years and over | 1 (0.7%) | 60 (80.0%) |
Disability Class by Sex by Age in Lake Mills
Disability Class: Hearing Difficulty
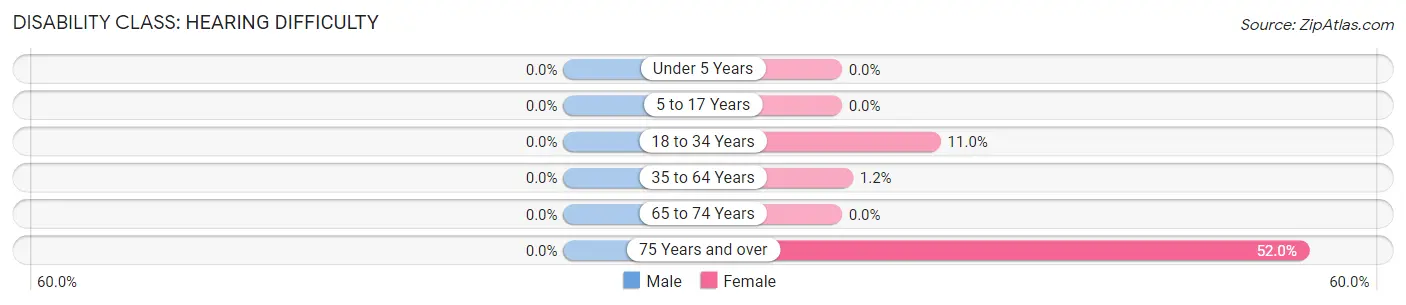
| Age Bracket | Male | Female |
| Under 5 Years | 0 (0.0%) | 0 (0.0%) |
| 5 to 17 Years | 0 (0.0%) | 0 (0.0%) |
| 18 to 34 Years | 0 (0.0%) | 76 (11.0%) |
| 35 to 64 Years | 0 (0.0%) | 15 (1.2%) |
| 65 to 74 Years | 0 (0.0%) | 0 (0.0%) |
| 75 Years and over | 0 (0.0%) | 39 (52.0%) |
Disability Class: Vision Difficulty
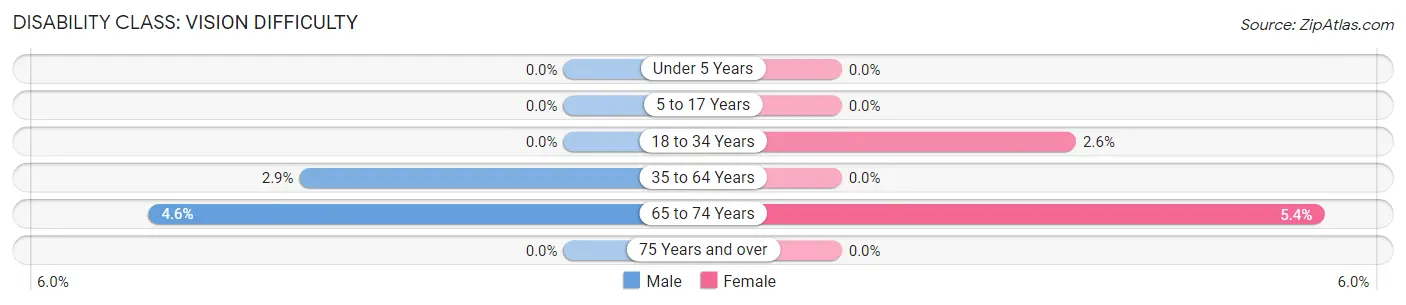
| Age Bracket | Male | Female |
| Under 5 Years | 0 (0.0%) | 0 (0.0%) |
| 5 to 17 Years | 0 (0.0%) | 0 (0.0%) |
| 18 to 34 Years | 0 (0.0%) | 18 (2.6%) |
| 35 to 64 Years | 36 (2.9%) | 0 (0.0%) |
| 65 to 74 Years | 19 (4.6%) | 19 (5.4%) |
| 75 Years and over | 0 (0.0%) | 0 (0.0%) |
Disability Class: Cognitive Difficulty
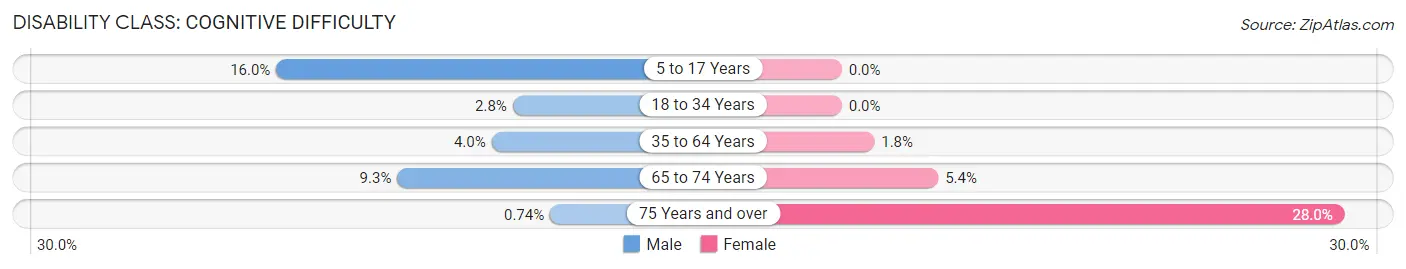
| Age Bracket | Male | Female |
| 5 to 17 Years | 86 (16.0%) | 0 (0.0%) |
| 18 to 34 Years | 20 (2.8%) | 0 (0.0%) |
| 35 to 64 Years | 49 (4.0%) | 22 (1.8%) |
| 65 to 74 Years | 38 (9.2%) | 19 (5.4%) |
| 75 Years and over | 1 (0.7%) | 21 (28.0%) |
Disability Class: Ambulatory Difficulty
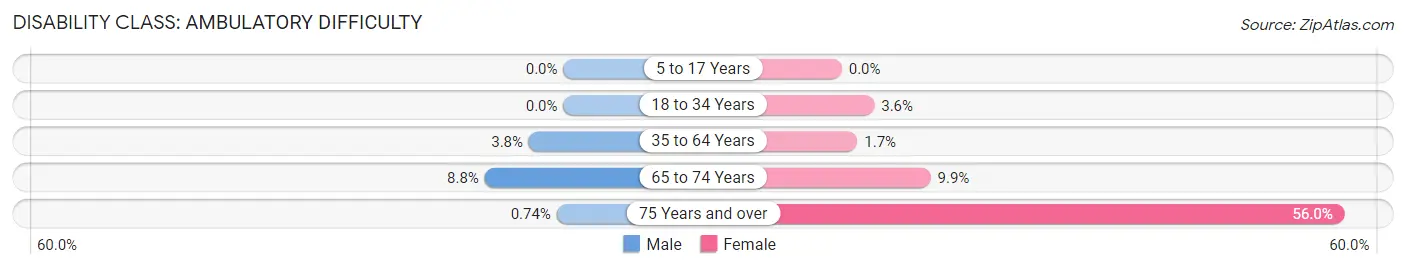
| Age Bracket | Male | Female |
| 5 to 17 Years | 0 (0.0%) | 0 (0.0%) |
| 18 to 34 Years | 0 (0.0%) | 25 (3.6%) |
| 35 to 64 Years | 47 (3.8%) | 21 (1.7%) |
| 65 to 74 Years | 36 (8.8%) | 35 (9.9%) |
| 75 Years and over | 1 (0.7%) | 42 (56.0%) |
Disability Class: Self-Care Difficulty
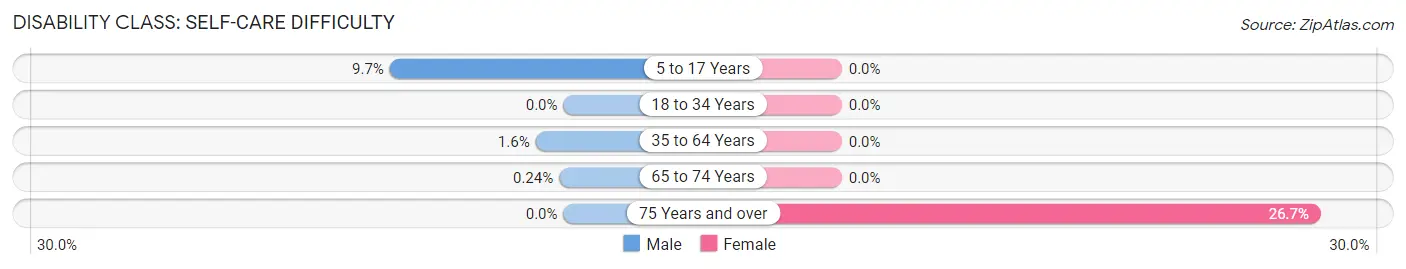
| Age Bracket | Male | Female |
| 5 to 17 Years | 52 (9.7%) | 0 (0.0%) |
| 18 to 34 Years | 0 (0.0%) | 0 (0.0%) |
| 35 to 64 Years | 19 (1.5%) | 0 (0.0%) |
| 65 to 74 Years | 1 (0.2%) | 0 (0.0%) |
| 75 Years and over | 0 (0.0%) | 20 (26.7%) |
Technology Access in Lake Mills
Computing Device Access in Lake Mills
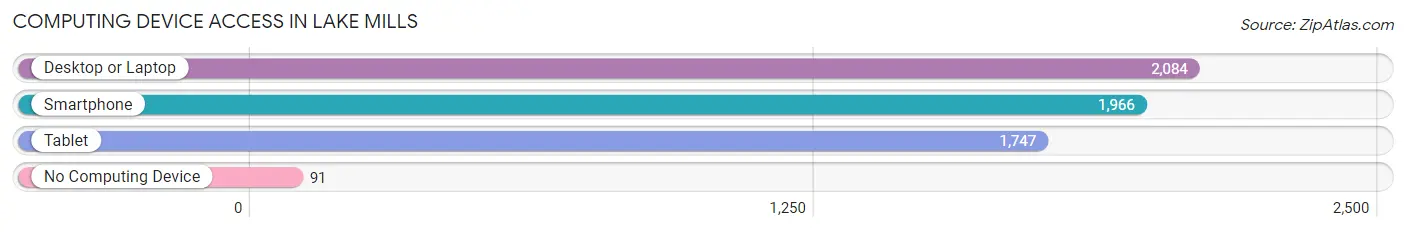
| Device Type | # Households | % Households |
| Desktop or Laptop | 2,084 | 84.6% |
| Smartphone | 1,966 | 79.8% |
| Tablet | 1,747 | 70.9% |
| No Computing Device | 91 | 3.7% |
| Total | 2,464 | 100.0% |
Internet Access in Lake Mills
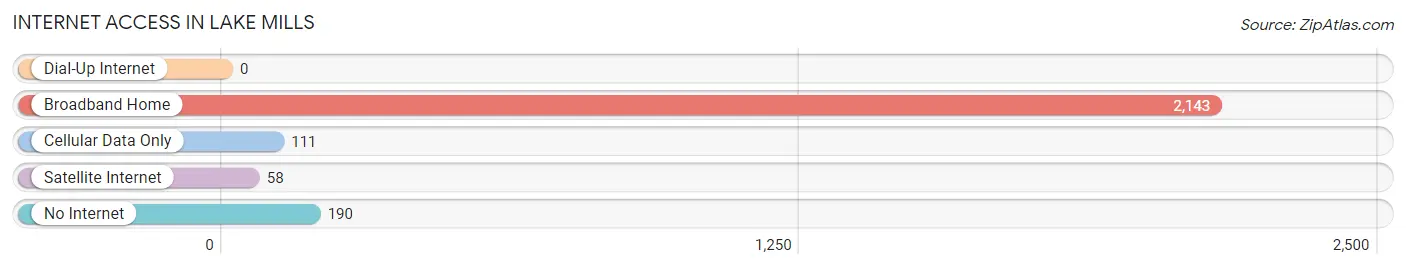
| Internet Type | # Households | % Households |
| Dial-Up Internet | 0 | 0.0% |
| Broadband Home | 2,143 | 87.0% |
| Cellular Data Only | 111 | 4.5% |
| Satellite Internet | 58 | 2.4% |
| No Internet | 190 | 7.7% |
| Total | 2,464 | 100.0% |
Lake Mills Summary
History
Lake Mills is a city located in Jefferson County, Wisconsin, United States. The population was 5,708 at the 2010 census. It is located on the Rock River, which flows into Lake Koshkonong. The city is located in the Town of Lake Mills.
The area was first settled in 1836 by William and Mary Ann (Henderson) Lake, who built a log cabin on the east side of the Rock River. The settlement was known as Lakes Mills, and the name was changed to Lake Mills in 1845. The city was incorporated in 1856.
The city was a major center of the Wisconsin dairy industry in the late 19th and early 20th centuries. The city was also home to the Lake Mills Creamery, which was founded in 1891 and operated until the 1950s.
Geography
Lake Mills is located at 43°06′N 88°52′W (43.10, -88.86). According to the United States Census Bureau, the city has a total area of 4.17 square miles (10.77 km2), of which, 4.14 square miles (10.69 km2) is land and 0.03 square miles (0.08 km2) is water.
Economy
The economy of Lake Mills is largely based on agriculture and manufacturing. The city is home to several large dairy farms, as well as a number of smaller farms that produce a variety of crops. The city is also home to several manufacturing companies, including a paper mill, a plastics manufacturer, and a metal fabrication plant.
Demographics
As of the census of 2010, there were 5,708 people, 2,310 households, and 1,541 families residing in the city. The population density was 1,384.2 people per square mile (534.2/km2). There were 2,521 housing units at an average density of 612.2 per square mile (236.2/km2). The racial makeup of the city was 95.2% White, 0.7% African American, 0.3% Native American, 0.7% Asian, 0.1% Pacific Islander, 1.7% from other races, and 1.2% from two or more races. Hispanic or Latino of any race were 4.2% of the population.
There were 2,310 households, out of which 32.2% had children under the age of 18 living with them, 51.2% were married couples living together, 10.7% had a female householder with no husband present, and 33.2% were non-families. 28.2% of all households were made up of individuals, and 11.7% had someone living alone who was 65 years of age or older. The average household size was 2.45 and the average family size was 3.02.
In the city, the population was spread out, with 25.7% under the age of 18, 7.2% from 18 to 24, 28.7% from 25 to 44, 22.7% from 45 to 64, and 15.7% who were 65 years of age or older. The median age was 38 years. For every 100 females, there were 93.2 males. For every 100 females age 18 and over, there were 90.2 males.
The median income for a household in the city was $45,938, and the median income for a family was $54,917. Males had a median income of $37,917 versus $26,917 for females. The per capita income for the city was $21,945. About 4.2% of families and 6.2% of the population were below the poverty line, including 8.2% of those under age 18 and 6.2% of those age 65 or over.
Common Questions
What is Per Capita Income in Lake Mills?
Per Capita income in Lake Mills is $40,258.
What is the Median Family Income in Lake Mills?
Median Family Income in Lake Mills is $96,657.
What is the Median Household income in Lake Mills?
Median Household Income in Lake Mills is $77,449.
What is Income or Wage Gap in Lake Mills?
Income or Wage Gap in Lake Mills is 19.3%.
Women in Lake Mills earn 80.7 cents for every dollar earned by a man.
What is Family Income Deficit in Lake Mills?
Family Income Deficit in Lake Mills is $12,588.
Families that are below poverty line in Lake Mills earn $12,588 less on average than the poverty threshold level.
What is Inequality or Gini Index in Lake Mills?
Inequality or Gini Index in Lake Mills is 0.37.
What is the Total Population of Lake Mills?
Total Population of Lake Mills is 6,280.
What is the Total Male Population of Lake Mills?
Total Male Population of Lake Mills is 3,171.
What is the Total Female Population of Lake Mills?
Total Female Population of Lake Mills is 3,109.
What is the Ratio of Males per 100 Females in Lake Mills?
There are 101.99 Males per 100 Females in Lake Mills.
What is the Ratio of Females per 100 Males in Lake Mills?
There are 98.04 Females per 100 Males in Lake Mills.
What is the Median Population Age in Lake Mills?
Median Population Age in Lake Mills is 40.0 Years.
What is the Average Family Size in Lake Mills
Average Family Size in Lake Mills is 3.2 People.
What is the Average Household Size in Lake Mills
Average Household Size in Lake Mills is 2.5 People.
How Large is the Labor Force in Lake Mills?
There are 3,676 People in the Labor Forcein in Lake Mills.
What is the Percentage of People in the Labor Force in Lake Mills?
74.0% of People are in the Labor Force in Lake Mills.
What is the Unemployment Rate in Lake Mills?
Unemployment Rate in Lake Mills is 0.5%.