La Farge, WI Map & Demographics
La Farge Map
La Farge Overview
$35,998
PER CAPITA INCOME
$46,563
AVG FAMILY INCOME
$34,792
AVG HOUSEHOLD INCOME
40.2%
WAGE / INCOME GAP [ % ]
59.8¢/ $1
WAGE / INCOME GAP [ $ ]
$6,325
FAMILY INCOME DEFICIT
0.42
INEQUALITY / GINI INDEX
750
TOTAL POPULATION
383
MALE POPULATION
367
FEMALE POPULATION
104.36
MALES / 100 FEMALES
95.82
FEMALES / 100 MALES
42.6
MEDIAN AGE
2.8
AVG FAMILY SIZE
2.0
AVG HOUSEHOLD SIZE
287
LABOR FORCE [ PEOPLE ]
48.4%
PERCENT IN LABOR FORCE
6.6%
UNEMPLOYMENT RATE
La Farge Zip Codes
La Farge Area Codes
Income in La Farge
Income Overview in La Farge
Per Capita Income in La Farge is $35,998, while median incomes of families and households are $46,563 and $34,792 respectively.
| Characteristic | Number | Measure |
| Per Capita Income | 750 | $35,998 |
| Median Family Income | 163 | $46,563 |
| Mean Family Income | 163 | $63,014 |
| Median Household Income | 360 | $34,792 |
| Mean Household Income | 360 | $50,266 |
| Income Deficit | 163 | $6,325 |
| Wage / Income Gap (%) | 750 | 40.16% |
| Wage / Income Gap ($) | 750 | 59.84¢ per $1 |
| Gini / Inequality Index | 750 | 0.42 |
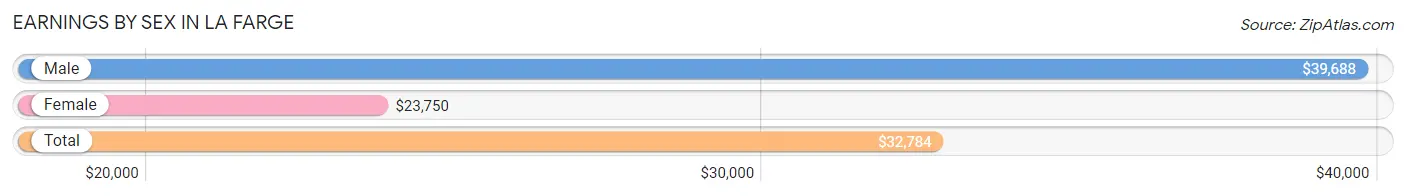
Earnings by Sex in La Farge
Average Earnings in La Farge are $32,784, $39,688 for men and $23,750 for women, a difference of 40.2%.
| Sex | Number | Average Earnings |
| Male | 164 (48.7%) | $39,688 |
| Female | 173 (51.3%) | $23,750 |
| Total | 337 (100.0%) | $32,784 |
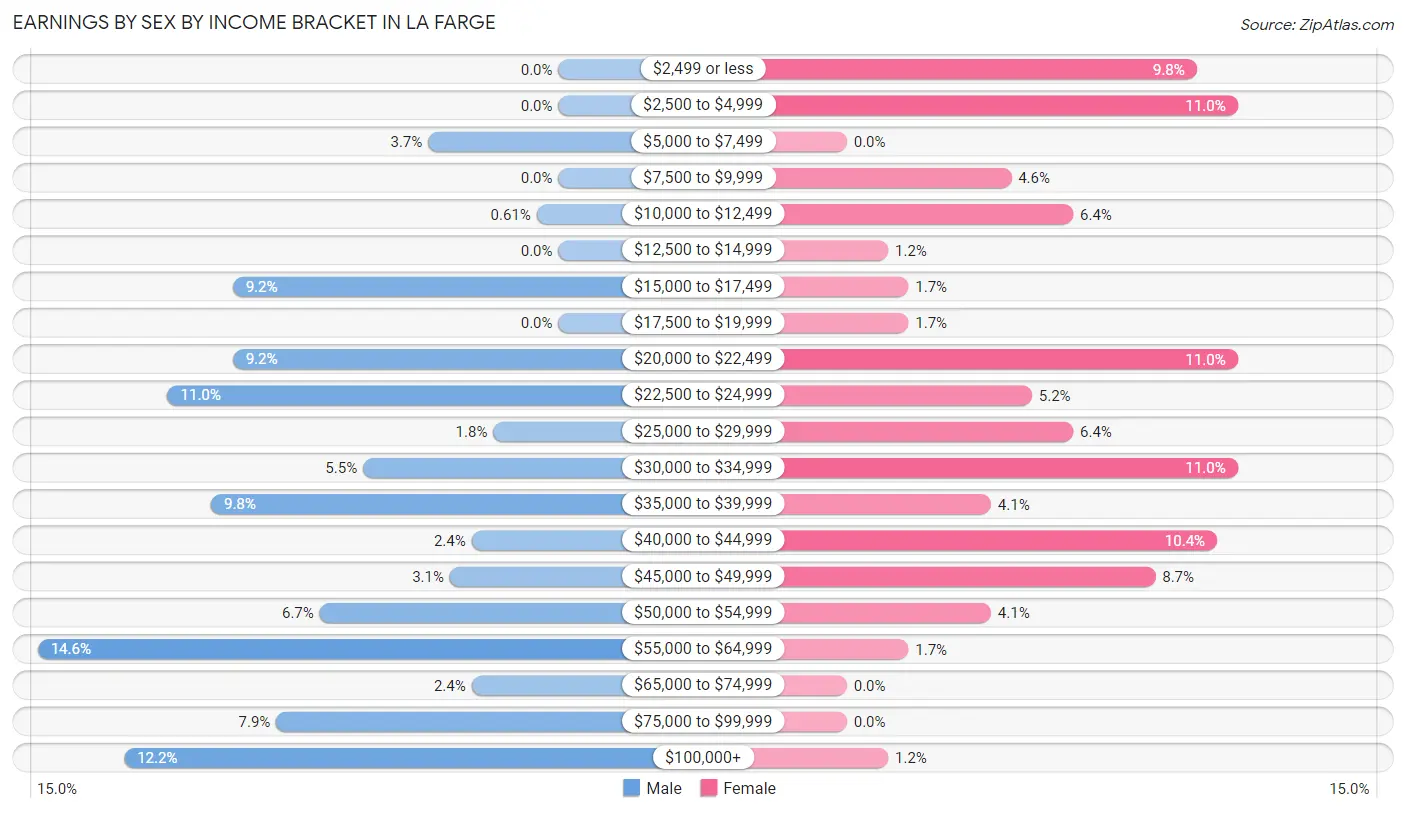
Earnings by Sex by Income Bracket in La Farge
The most common earnings brackets in La Farge are $55,000 to $64,999 for men (24 | 14.6%) and $2,500 to $4,999 for women (19 | 11.0%).
| Income | Male | Female |
| $2,499 or less | 0 (0.0%) | 17 (9.8%) |
| $2,500 to $4,999 | 0 (0.0%) | 19 (11.0%) |
| $5,000 to $7,499 | 6 (3.7%) | 0 (0.0%) |
| $7,500 to $9,999 | 0 (0.0%) | 8 (4.6%) |
| $10,000 to $12,499 | 1 (0.6%) | 11 (6.4%) |
| $12,500 to $14,999 | 0 (0.0%) | 2 (1.2%) |
| $15,000 to $17,499 | 15 (9.1%) | 3 (1.7%) |
| $17,500 to $19,999 | 0 (0.0%) | 3 (1.7%) |
| $20,000 to $22,499 | 15 (9.1%) | 19 (11.0%) |
| $22,500 to $24,999 | 18 (11.0%) | 9 (5.2%) |
| $25,000 to $29,999 | 3 (1.8%) | 11 (6.4%) |
| $30,000 to $34,999 | 9 (5.5%) | 19 (11.0%) |
| $35,000 to $39,999 | 16 (9.8%) | 7 (4.1%) |
| $40,000 to $44,999 | 4 (2.4%) | 18 (10.4%) |
| $45,000 to $49,999 | 5 (3.0%) | 15 (8.7%) |
| $50,000 to $54,999 | 11 (6.7%) | 7 (4.1%) |
| $55,000 to $64,999 | 24 (14.6%) | 3 (1.7%) |
| $65,000 to $74,999 | 4 (2.4%) | 0 (0.0%) |
| $75,000 to $99,999 | 13 (7.9%) | 0 (0.0%) |
| $100,000+ | 20 (12.2%) | 2 (1.2%) |
| Total | 164 (100.0%) | 173 (100.0%) |
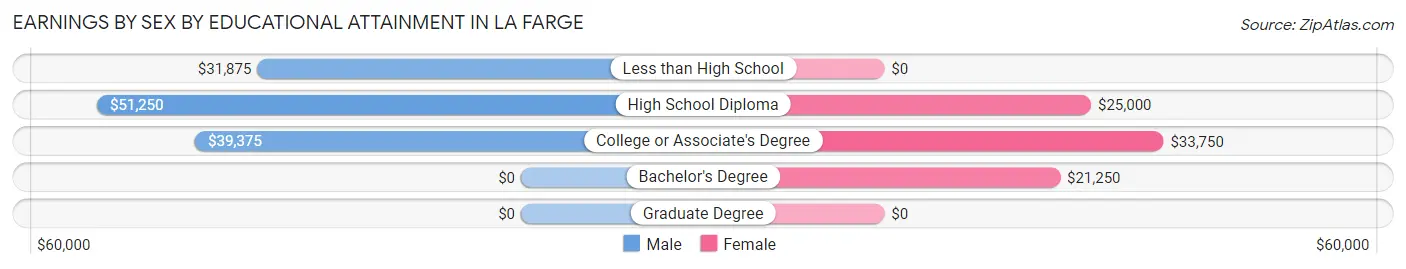
Earnings by Sex by Educational Attainment in La Farge
Average earnings in La Farge are $40,625 for men and $26,875 for women, a difference of 33.9%. Men with an educational attainment of high school diploma enjoy the highest average annual earnings of $51,250, while those with less than high school education earn the least with $31,875. Women with an educational attainment of college or associate's degree earn the most with the average annual earnings of $33,750, while those with bachelor's degree education have the smallest earnings of $21,250.
| Educational Attainment | Male Income | Female Income |
| Less than High School | $31,875 | $0 |
| High School Diploma | $51,250 | $25,000 |
| College or Associate's Degree | $39,375 | $33,750 |
| Bachelor's Degree | - | - |
| Graduate Degree | - | - |
| Total | $40,625 | $26,875 |
Family Income in La Farge
Family Income Brackets in La Farge
According to the La Farge family income data, there are 41 families falling into the $15,000 to $24,999 income range, which is the most common income bracket and makes up 25.2% of all families. Conversely, the less than $10,000 income bracket is the least frequent group with only 2 families (1.2%) belonging to this category.
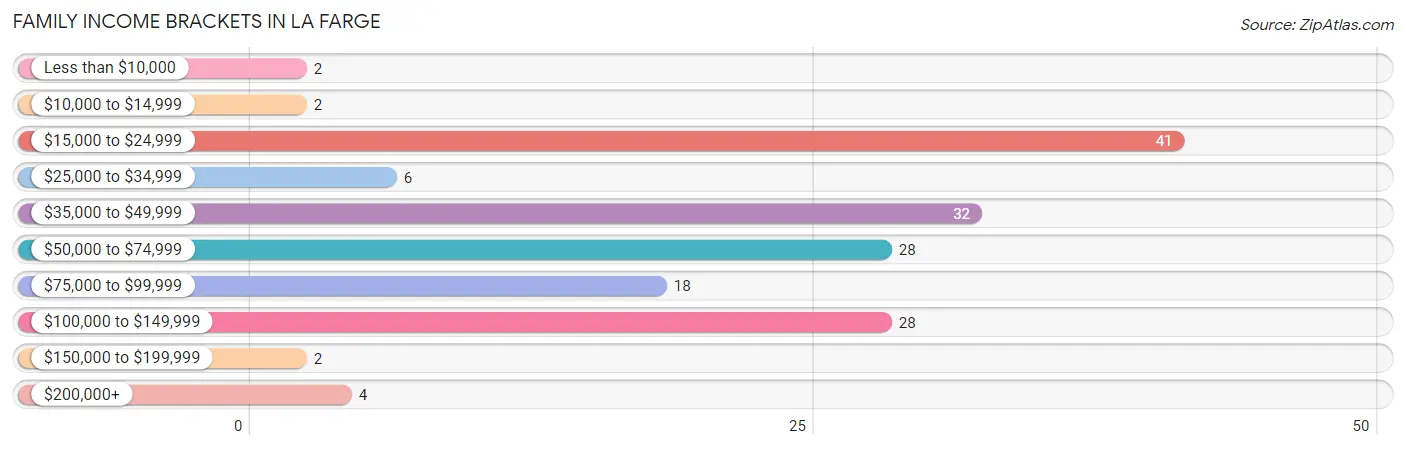
| Income Bracket | # Families | % Families |
| Less than $10,000 | 2 | 1.2% |
| $10,000 to $14,999 | 2 | 1.2% |
| $15,000 to $24,999 | 41 | 25.2% |
| $25,000 to $34,999 | 6 | 3.7% |
| $35,000 to $49,999 | 32 | 19.6% |
| $50,000 to $74,999 | 28 | 17.2% |
| $75,000 to $99,999 | 18 | 11.0% |
| $100,000 to $149,999 | 28 | 17.2% |
| $150,000 to $199,999 | 2 | 1.2% |
| $200,000+ | 4 | 2.5% |
Family Income by Famaliy Size in La Farge
2-person families (93 | 57.1%) account for the highest median family income in La Farge with $66,875 per family, while 2-person families (93 | 57.1%) have the highest median income of $33,438 per family member.
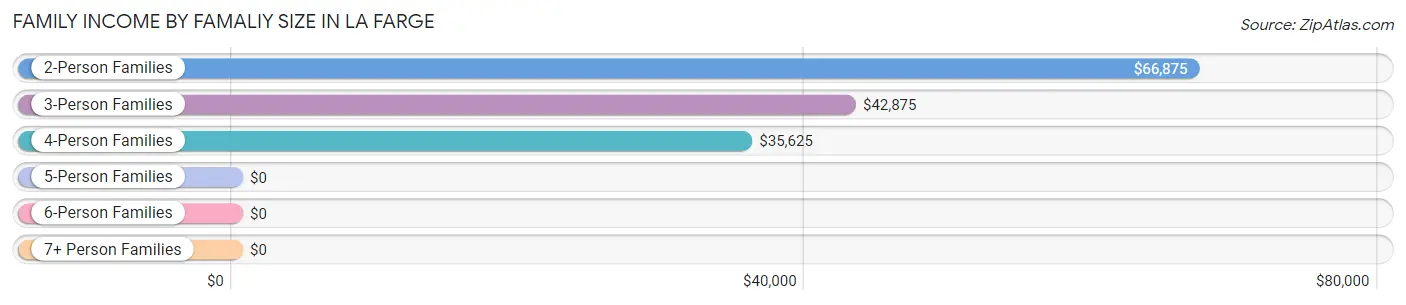
| Income Bracket | # Families | Median Income |
| 2-Person Families | 93 (57.1%) | $66,875 |
| 3-Person Families | 37 (22.7%) | $42,875 |
| 4-Person Families | 23 (14.1%) | $35,625 |
| 5-Person Families | 10 (6.1%) | $0 |
| 6-Person Families | 0 (0.0%) | $0 |
| 7+ Person Families | 0 (0.0%) | $0 |
| Total | 163 (100.0%) | $46,563 |
Family Income by Number of Earners in La Farge
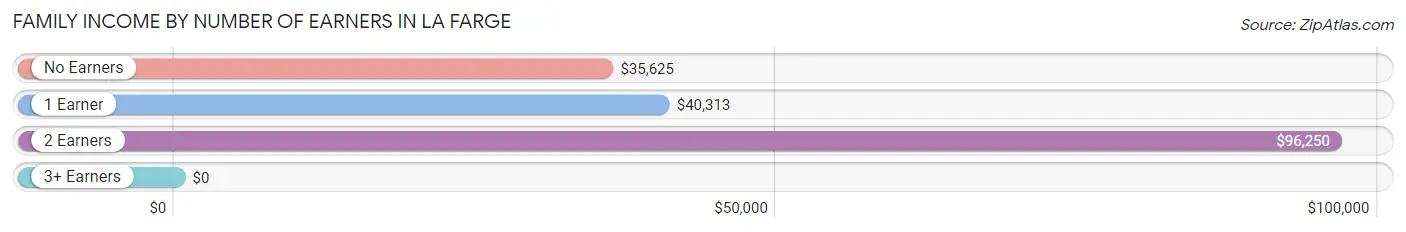
| Number of Earners | # Families | Median Income |
| No Earners | 32 (19.6%) | $35,625 |
| 1 Earner | 75 (46.0%) | $40,313 |
| 2 Earners | 56 (34.4%) | $96,250 |
| 3+ Earners | 0 (0.0%) | $0 |
| Total | 163 (100.0%) | $46,563 |
Household Income in La Farge
Household Income Brackets in La Farge
With 82 households falling in the category, the $15,000 to $24,999 income range is the most frequent in La Farge, accounting for 22.8% of all households. In contrast, only 3 households (0.8%) fall into the $150,000 to $199,999 income bracket, making it the least populous group.
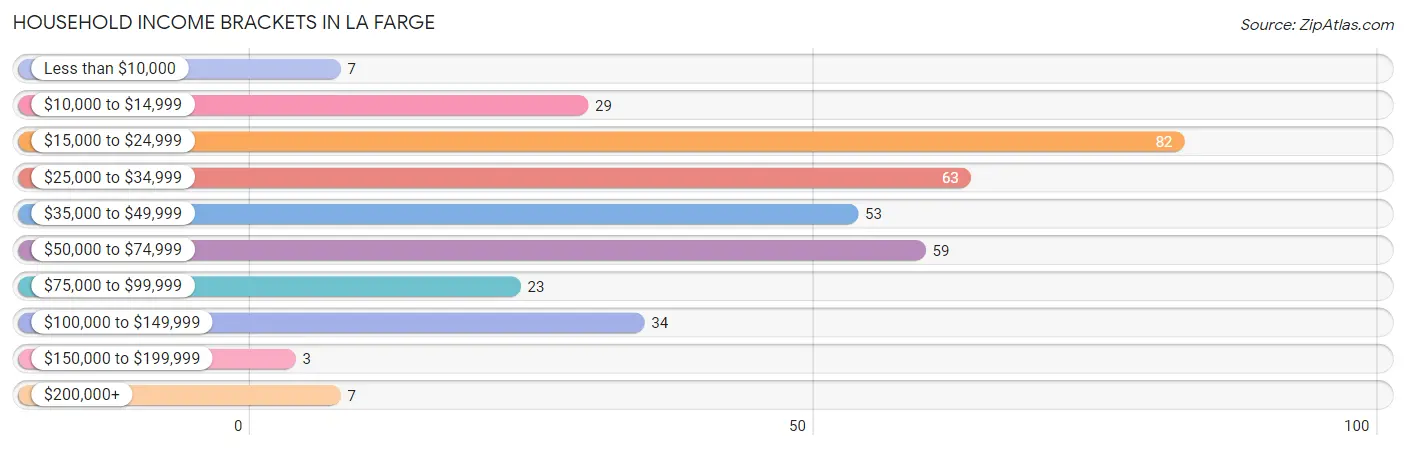
| Income Bracket | # Households | % Households |
| Less than $10,000 | 7 | 1.9% |
| $10,000 to $14,999 | 29 | 8.1% |
| $15,000 to $24,999 | 82 | 22.8% |
| $25,000 to $34,999 | 63 | 17.5% |
| $35,000 to $49,999 | 53 | 14.7% |
| $50,000 to $74,999 | 59 | 16.4% |
| $75,000 to $99,999 | 23 | 6.4% |
| $100,000 to $149,999 | 34 | 9.4% |
| $150,000 to $199,999 | 3 | 0.8% |
| $200,000+ | 7 | 1.9% |
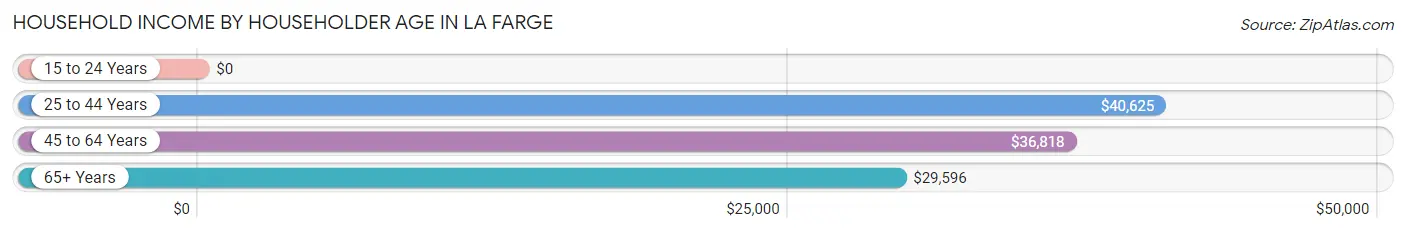
Household Income by Householder Age in La Farge
The median household income in La Farge is $34,792, with the highest median household income of $40,625 found in the 25 to 44 years age bracket for the primary householder. A total of 111 households (30.8%) fall into this category. Meanwhile, the 15 to 24 years age bracket for the primary householder has the lowest median household income of $0, with 6 households (1.7%) in this group.
| Income Bracket | # Households | Median Income |
| 15 to 24 Years | 6 (1.7%) | $0 |
| 25 to 44 Years | 111 (30.8%) | $40,625 |
| 45 to 64 Years | 122 (33.9%) | $36,818 |
| 65+ Years | 121 (33.6%) | $29,596 |
| Total | 360 (100.0%) | $34,792 |
Poverty in La Farge
Income Below Poverty by Sex and Age in La Farge
With 27.3% poverty level for males and 30.5% for females among the residents of La Farge, 5 year old males and under 5 year old females are the most vulnerable to poverty, with 8 males (100.0%) and 7 females (70.0%) in their respective age groups living below the poverty level.
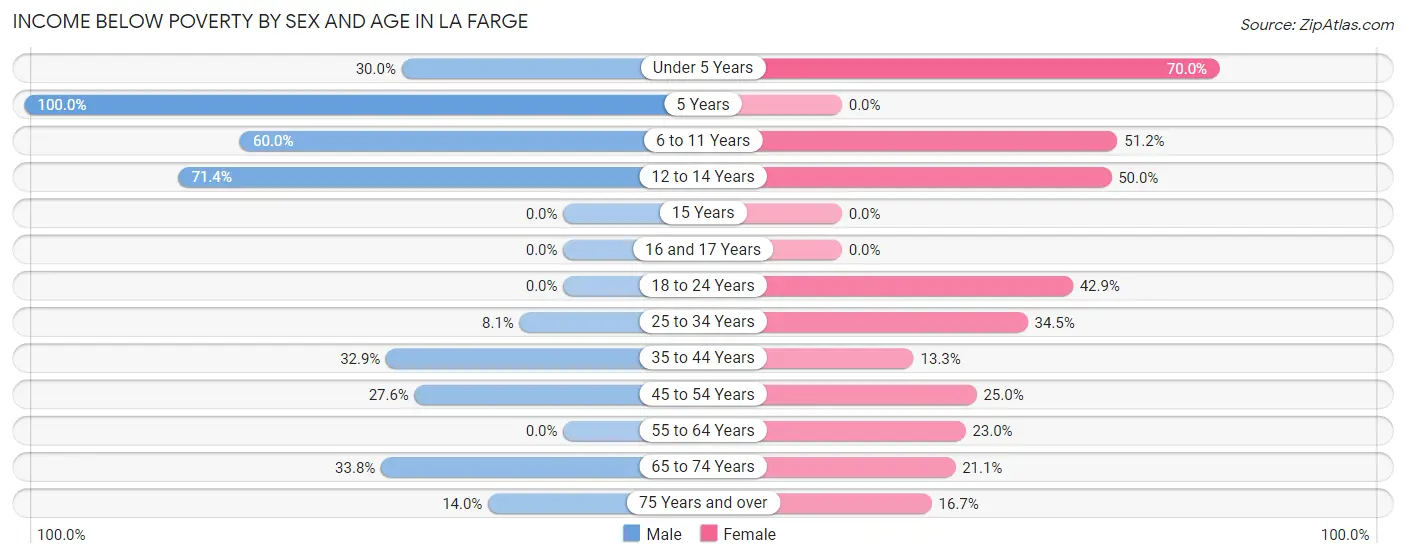
| Age Bracket | Male | Female |
| Under 5 Years | 6 (30.0%) | 7 (70.0%) |
| 5 Years | 8 (100.0%) | 0 (0.0%) |
| 6 to 11 Years | 15 (60.0%) | 22 (51.2%) |
| 12 to 14 Years | 10 (71.4%) | 14 (50.0%) |
| 15 Years | 0 (0.0%) | 0 (0.0%) |
| 16 and 17 Years | 0 (0.0%) | 0 (0.0%) |
| 18 to 24 Years | 0 (0.0%) | 9 (42.9%) |
| 25 to 34 Years | 3 (8.1%) | 20 (34.5%) |
| 35 to 44 Years | 24 (32.9%) | 4 (13.3%) |
| 45 to 54 Years | 8 (27.6%) | 5 (25.0%) |
| 55 to 64 Years | 0 (0.0%) | 14 (23.0%) |
| 65 to 74 Years | 23 (33.8%) | 12 (21.0%) |
| 75 Years and over | 6 (14.0%) | 5 (16.7%) |
| Total | 103 (27.3%) | 112 (30.5%) |
Income Above Poverty by Sex and Age in La Farge
According to the poverty statistics in La Farge, males aged 16 and 17 years and females aged 15 years are the age groups that are most secure financially, with 100.0% of males and 100.0% of females in these age groups living above the poverty line.
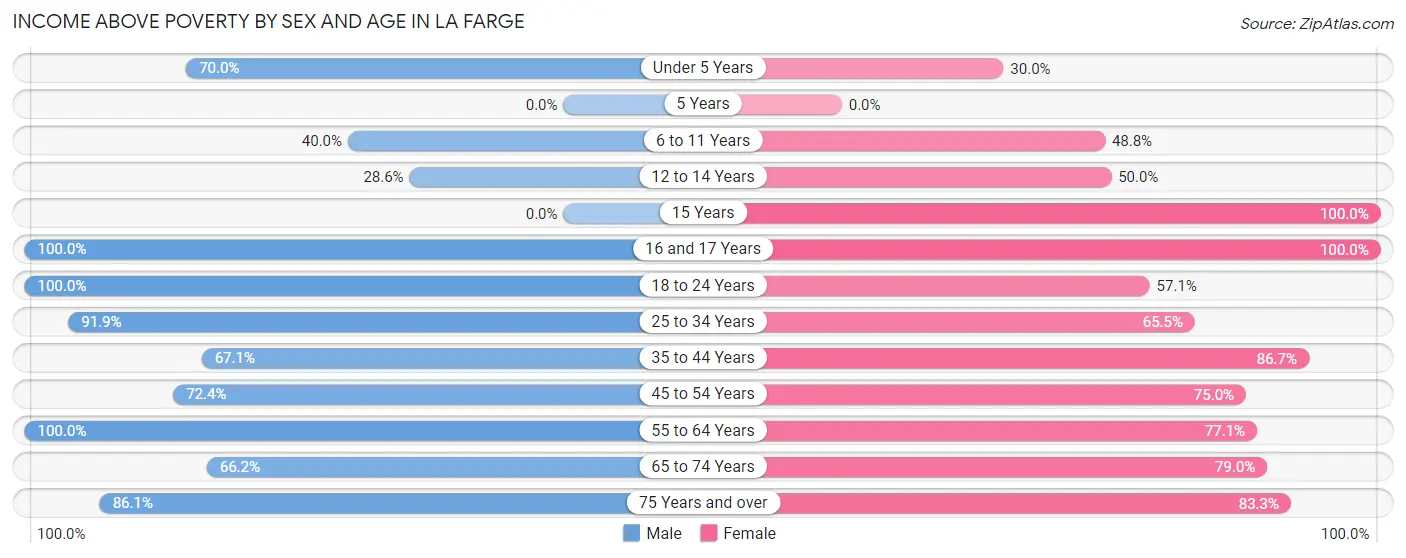
| Age Bracket | Male | Female |
| Under 5 Years | 14 (70.0%) | 3 (30.0%) |
| 5 Years | 0 (0.0%) | 0 (0.0%) |
| 6 to 11 Years | 10 (40.0%) | 21 (48.8%) |
| 12 to 14 Years | 4 (28.6%) | 14 (50.0%) |
| 15 Years | 0 (0.0%) | 3 (100.0%) |
| 16 and 17 Years | 8 (100.0%) | 6 (100.0%) |
| 18 to 24 Years | 3 (100.0%) | 12 (57.1%) |
| 25 to 34 Years | 34 (91.9%) | 38 (65.5%) |
| 35 to 44 Years | 49 (67.1%) | 26 (86.7%) |
| 45 to 54 Years | 21 (72.4%) | 15 (75.0%) |
| 55 to 64 Years | 49 (100.0%) | 47 (77.0%) |
| 65 to 74 Years | 45 (66.2%) | 45 (78.9%) |
| 75 Years and over | 37 (86.1%) | 25 (83.3%) |
| Total | 274 (72.7%) | 255 (69.5%) |
Income Below Poverty Among Married-Couple Families in La Farge
The poverty statistics for married-couple families in La Farge show that 11.7% or 12 of the total 103 families live below the poverty line. Families with 3 or 4 children have the highest poverty rate of 71.4%, comprising of 5 families. On the other hand, families with 1 or 2 children have the lowest poverty rate of 0.0%, which includes 0 families.
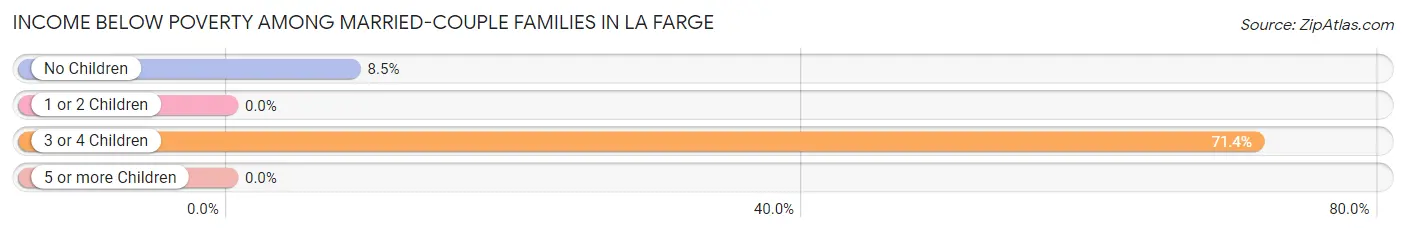
| Children | Above Poverty | Below Poverty |
| No Children | 75 (91.5%) | 7 (8.5%) |
| 1 or 2 Children | 14 (100.0%) | 0 (0.0%) |
| 3 or 4 Children | 2 (28.6%) | 5 (71.4%) |
| 5 or more Children | 0 (0.0%) | 0 (0.0%) |
| Total | 91 (88.3%) | 12 (11.7%) |
Income Below Poverty Among Single-Parent Households in La Farge
According to the poverty data in La Farge, 88.0% or 22 single-father households and 17.1% or 6 single-mother households are living below the poverty line. Among single-father households, those with 1 or 2 children have the highest poverty rate, with 15 households (100.0%) experiencing poverty. Likewise, among single-mother households, those with 3 or 4 children have the highest poverty rate, with 4 households (100.0%) falling below the poverty line.
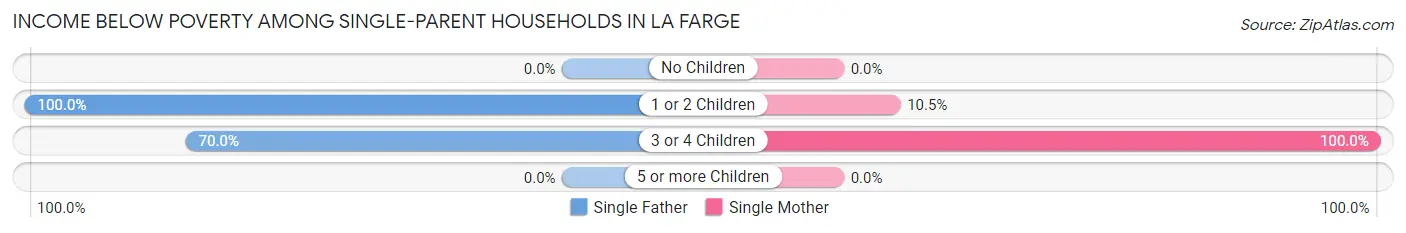
| Children | Single Father | Single Mother |
| No Children | 0 (0.0%) | 0 (0.0%) |
| 1 or 2 Children | 15 (100.0%) | 2 (10.5%) |
| 3 or 4 Children | 7 (70.0%) | 4 (100.0%) |
| 5 or more Children | 0 (0.0%) | 0 (0.0%) |
| Total | 22 (88.0%) | 6 (17.1%) |
Income Below Poverty Among Married-Couple vs Single-Parent Households in La Farge
The poverty data for La Farge shows that 12 of the married-couple family households (11.7%) and 28 of the single-parent households (46.7%) are living below the poverty level. Within the married-couple family households, those with 3 or 4 children have the highest poverty rate, with 5 households (71.4%) falling below the poverty line. Among the single-parent households, those with 3 or 4 children have the highest poverty rate, with 11 household (78.6%) living below poverty.
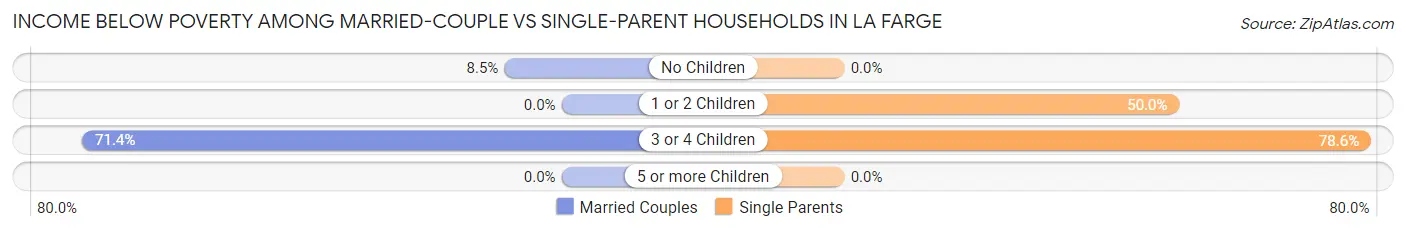
| Children | Married-Couple Families | Single-Parent Households |
| No Children | 7 (8.5%) | 0 (0.0%) |
| 1 or 2 Children | 0 (0.0%) | 17 (50.0%) |
| 3 or 4 Children | 5 (71.4%) | 11 (78.6%) |
| 5 or more Children | 0 (0.0%) | 0 (0.0%) |
| Total | 12 (11.7%) | 28 (46.7%) |
Race in La Farge
The most populous races in La Farge are White / Caucasian (743 | 99.1%), Hispanic or Latino (21 | 2.8%), and Two or more Races (7 | 0.9%).
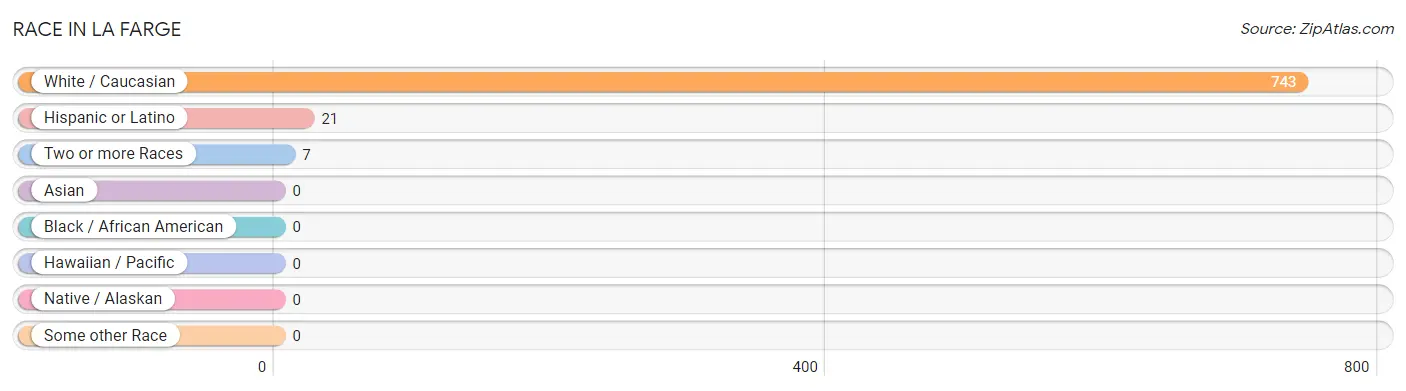
| Race | # Population | % Population |
| Asian | 0 | 0.0% |
| Black / African American | 0 | 0.0% |
| Hawaiian / Pacific | 0 | 0.0% |
| Hispanic or Latino | 21 | 2.8% |
| Native / Alaskan | 0 | 0.0% |
| White / Caucasian | 743 | 99.1% |
| Two or more Races | 7 | 0.9% |
| Some other Race | 0 | 0.0% |
| Total | 750 | 100.0% |
Ancestry in La Farge
The most populous ancestries reported in La Farge are German (242 | 32.3%), Norwegian (180 | 24.0%), Irish (164 | 21.9%), English (64 | 8.5%), and Czech (60 | 8.0%), together accounting for 94.7% of all La Farge residents.
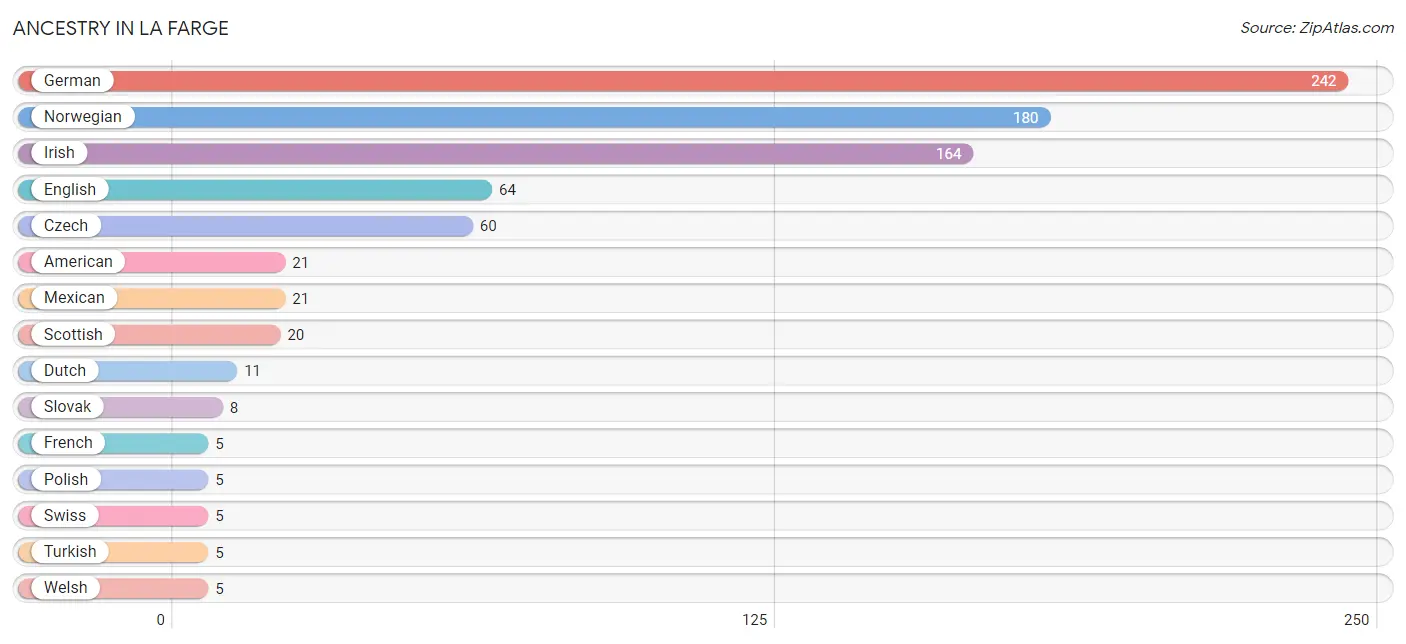
| Ancestry | # Population | % Population |
| American | 21 | 2.8% |
| Czech | 60 | 8.0% |
| Dutch | 11 | 1.5% |
| English | 64 | 8.5% |
| French | 5 | 0.7% |
| French Canadian | 2 | 0.3% |
| German | 242 | 32.3% |
| Irish | 164 | 21.9% |
| Mexican | 21 | 2.8% |
| Norwegian | 180 | 24.0% |
| Pennsylvania German | 2 | 0.3% |
| Polish | 5 | 0.7% |
| Scotch-Irish | 2 | 0.3% |
| Scottish | 20 | 2.7% |
| Slovak | 8 | 1.1% |
| Swiss | 5 | 0.7% |
| Turkish | 5 | 0.7% |
| Welsh | 5 | 0.7% | View All 18 Rows |
Immigrants in La Farge

| Immigration Origin | # Population | % Population | View All 0 Rows |
Sex and Age in La Farge
Sex and Age in La Farge
The most populous age groups in La Farge are 65 to 69 Years (47 | 12.3%) for men and 5 to 9 Years (42 | 11.4%) for women.
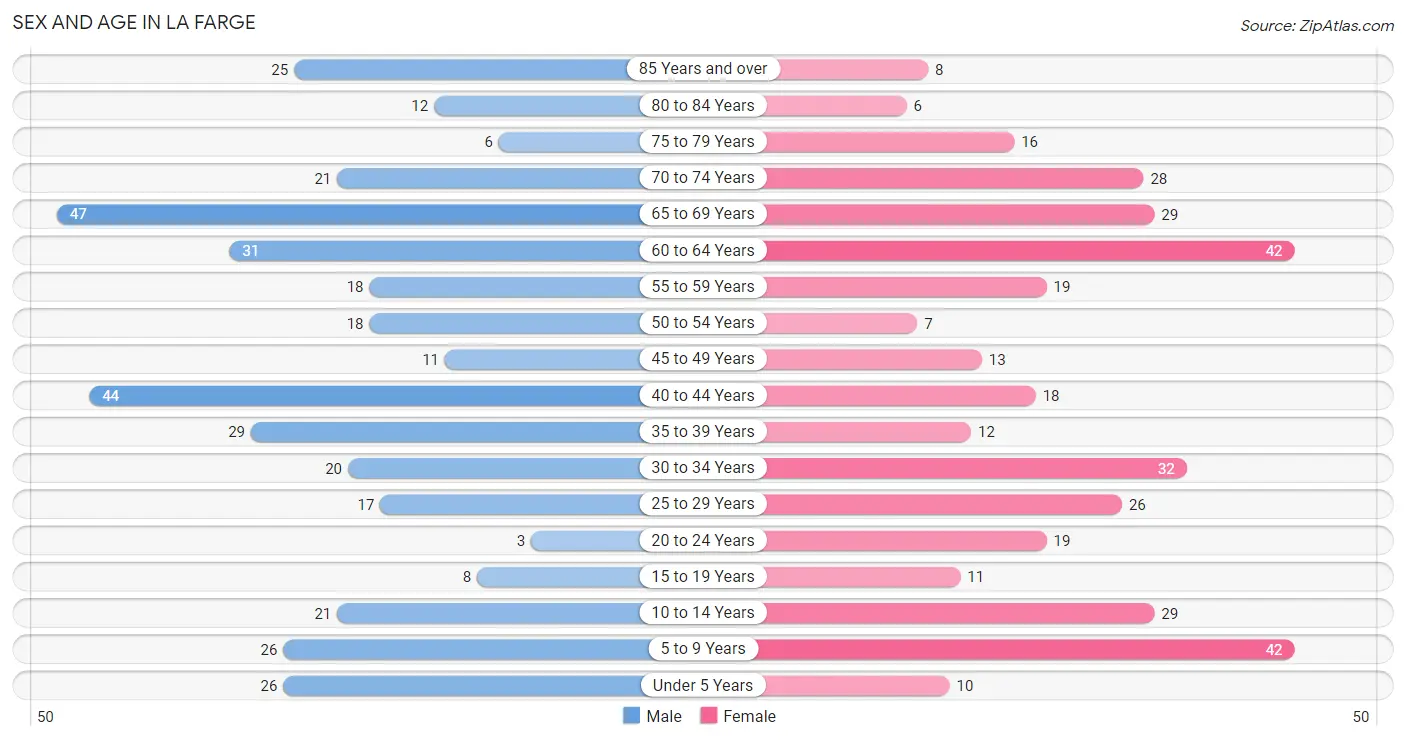
| Age Bracket | Male | Female |
| Under 5 Years | 26 (6.8%) | 10 (2.7%) |
| 5 to 9 Years | 26 (6.8%) | 42 (11.4%) |
| 10 to 14 Years | 21 (5.5%) | 29 (7.9%) |
| 15 to 19 Years | 8 (2.1%) | 11 (3.0%) |
| 20 to 24 Years | 3 (0.8%) | 19 (5.2%) |
| 25 to 29 Years | 17 (4.4%) | 26 (7.1%) |
| 30 to 34 Years | 20 (5.2%) | 32 (8.7%) |
| 35 to 39 Years | 29 (7.6%) | 12 (3.3%) |
| 40 to 44 Years | 44 (11.5%) | 18 (4.9%) |
| 45 to 49 Years | 11 (2.9%) | 13 (3.5%) |
| 50 to 54 Years | 18 (4.7%) | 7 (1.9%) |
| 55 to 59 Years | 18 (4.7%) | 19 (5.2%) |
| 60 to 64 Years | 31 (8.1%) | 42 (11.4%) |
| 65 to 69 Years | 47 (12.3%) | 29 (7.9%) |
| 70 to 74 Years | 21 (5.5%) | 28 (7.6%) |
| 75 to 79 Years | 6 (1.6%) | 16 (4.4%) |
| 80 to 84 Years | 12 (3.1%) | 6 (1.6%) |
| 85 Years and over | 25 (6.5%) | 8 (2.2%) |
| Total | 383 (100.0%) | 367 (100.0%) |
Families and Households in La Farge
Median Family Size in La Farge
The median family size in La Farge is 2.83 persons per family, with single male/father families (25 | 15.3%) accounting for the largest median family size of 3.44 persons per family. On the other hand, married-couple families (103 | 63.2%) represent the smallest median family size with 2.54 persons per family.
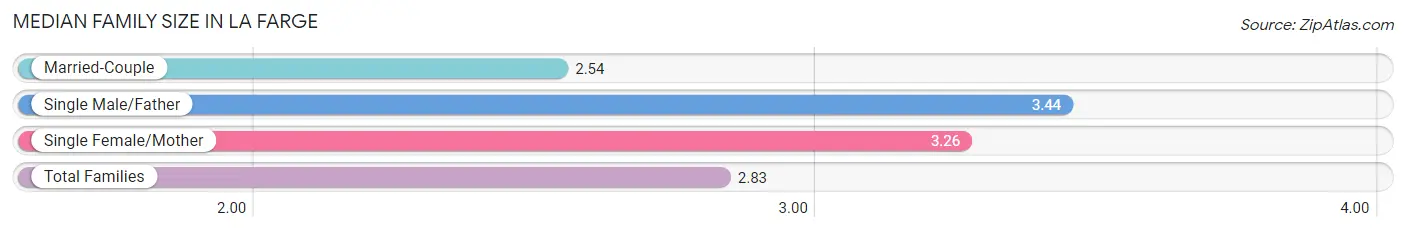
| Family Type | # Families | Family Size |
| Married-Couple | 103 (63.2%) | 2.54 |
| Single Male/Father | 25 (15.3%) | 3.44 |
| Single Female/Mother | 35 (21.5%) | 3.26 |
| Total Families | 163 (100.0%) | 2.83 |
Median Household Size in La Farge
The median household size in La Farge is 2.01 persons per household, with single male/father households (25 | 6.9%) accounting for the largest median household size of 4.28 persons per household. non-family households (197 | 54.7%) represent the smallest median household size with 1.07 persons per household.
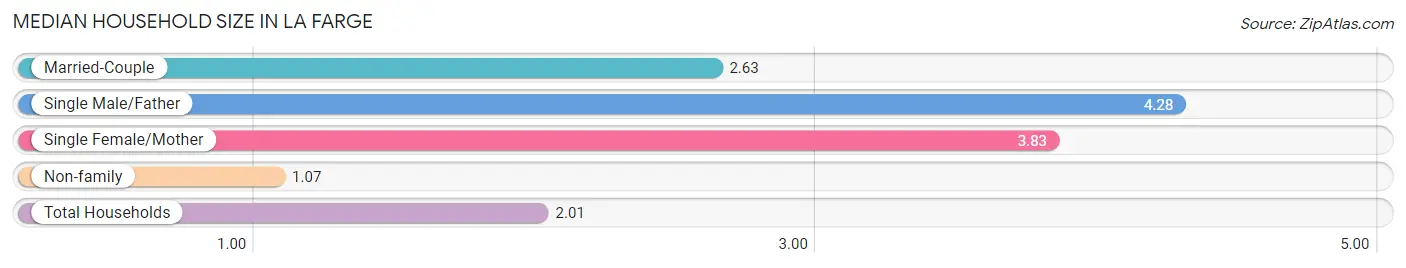
| Household Type | # Households | Household Size |
| Married-Couple | 103 (28.6%) | 2.63 |
| Single Male/Father | 25 (6.9%) | 4.28 |
| Single Female/Mother | 35 (9.7%) | 3.83 |
| Non-family | 197 (54.7%) | 1.07 |
| Total Households | 360 (100.0%) | 2.01 |
Household Size by Marriage Status in La Farge
Out of a total of 360 households in La Farge, 163 (45.3%) are family households, while 197 (54.7%) are nonfamily households. The most numerous type of family households are 2-person households, comprising 88, and the most common type of nonfamily households are 1-person households, comprising 185.
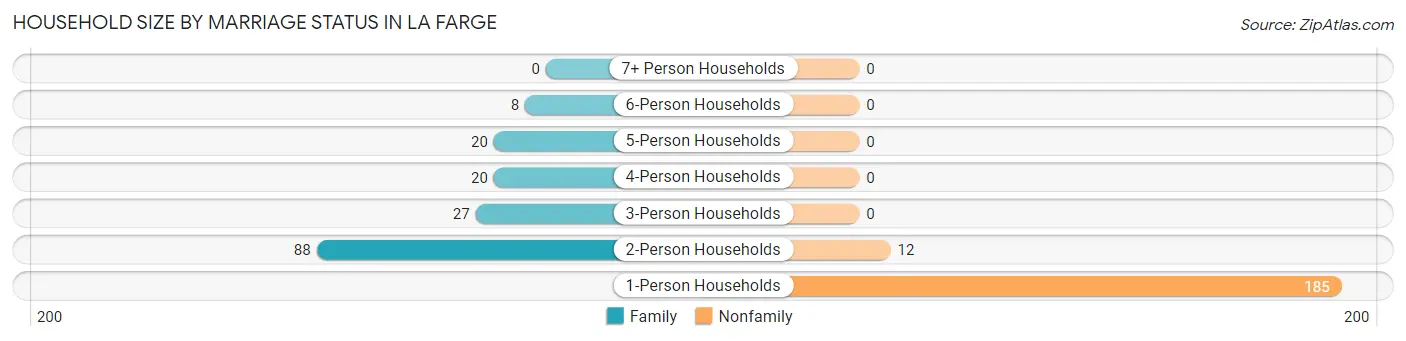
| Household Size | Family Households | Nonfamily Households |
| 1-Person Households | - | 185 (51.4%) |
| 2-Person Households | 88 (24.4%) | 12 (3.3%) |
| 3-Person Households | 27 (7.5%) | 0 (0.0%) |
| 4-Person Households | 20 (5.6%) | 0 (0.0%) |
| 5-Person Households | 20 (5.6%) | 0 (0.0%) |
| 6-Person Households | 8 (2.2%) | 0 (0.0%) |
| 7+ Person Households | 0 (0.0%) | 0 (0.0%) |
| Total | 163 (45.3%) | 197 (54.7%) |
Female Fertility in La Farge
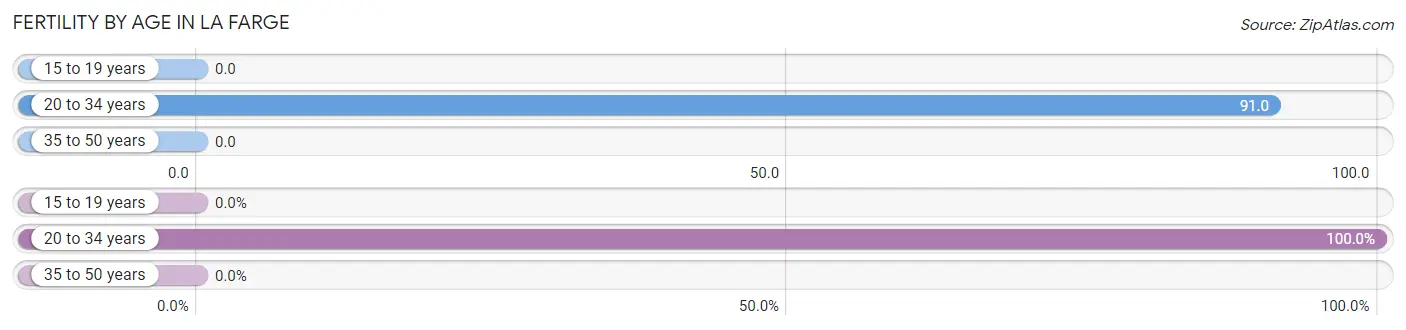
Fertility by Age in La Farge
Average fertility rate in La Farge is 53.0 births per 1,000 women. Women in the age bracket of 20 to 34 years have the highest fertility rate with 91.0 births per 1,000 women. Women in the age bracket of 20 to 34 years acount for 100.0% of all women with births.
| Age Bracket | Women with Births | Births / 1,000 Women |
| 15 to 19 years | 0 (0.0%) | 0.0 |
| 20 to 34 years | 7 (100.0%) | 91.0 |
| 35 to 50 years | 0 (0.0%) | 0.0 |
| Total | 7 (100.0%) | 53.0 |
Fertility by Age by Marriage Status in La Farge
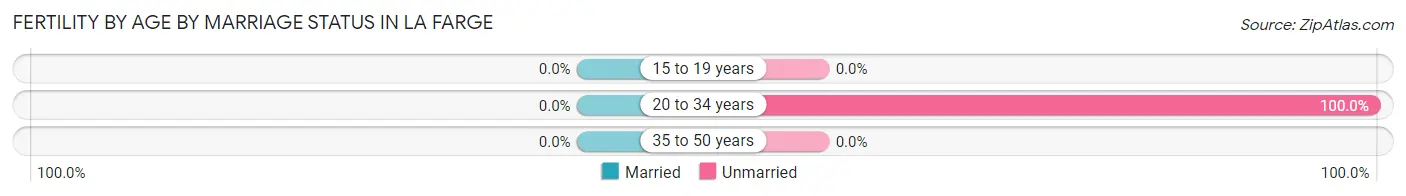
| Age Bracket | Married | Unmarried |
| 15 to 19 years | 0 (0.0%) | 0 (0.0%) |
| 20 to 34 years | 0 (0.0%) | 7 (100.0%) |
| 35 to 50 years | 0 (0.0%) | 0 (0.0%) |
| Total | 0 (0.0%) | 7 (100.0%) |
Fertility by Education in La Farge
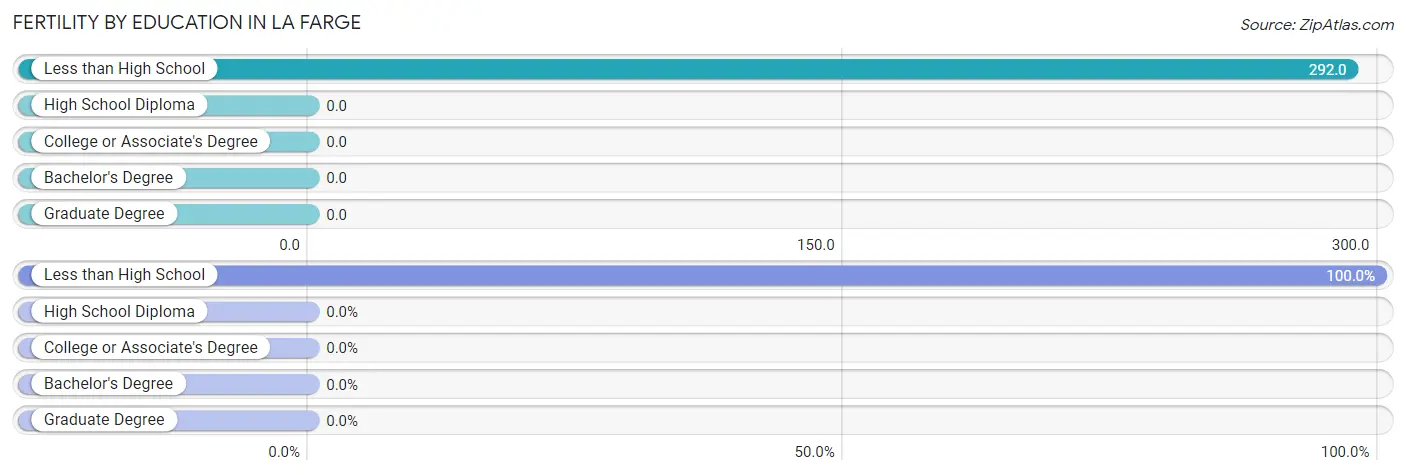
| Educational Attainment | Women with Births | Births / 1,000 Women |
| Less than High School | 7 (100.0%) | 292.0 |
| High School Diploma | 0 (0.0%) | 0.0 |
| College or Associate's Degree | 0 (0.0%) | 0.0 |
| Bachelor's Degree | 0 (0.0%) | 0.0 |
| Graduate Degree | 0 (0.0%) | 0.0 |
| Total | 7 (100.0%) | 53.0 |
Fertility by Education by Marriage Status in La Farge
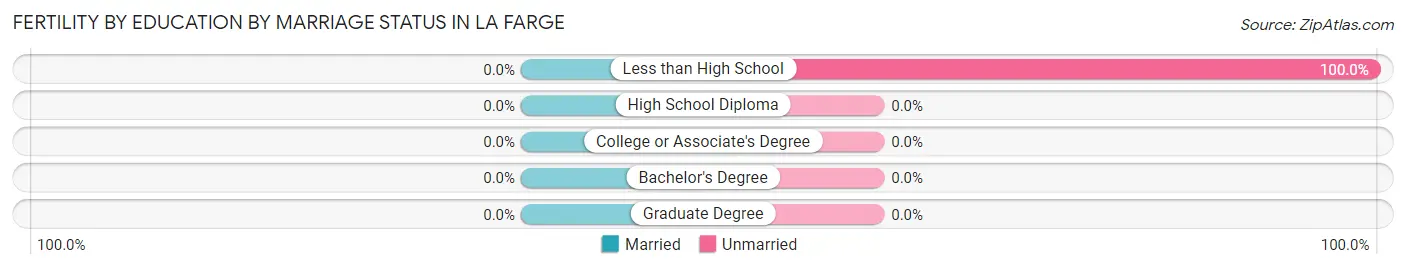
| Educational Attainment | Married | Unmarried |
| Less than High School | 0 (0.0%) | 7 (100.0%) |
| High School Diploma | 0 (0.0%) | 0 (0.0%) |
| College or Associate's Degree | 0 (0.0%) | 0 (0.0%) |
| Bachelor's Degree | 0 (0.0%) | 0 (0.0%) |
| Graduate Degree | 0 (0.0%) | 0 (0.0%) |
| Total | 0 (0.0%) | 7 (100.0%) |
Employment Characteristics in La Farge
Employment by Class of Employer in La Farge
Among the 263 employed individuals in La Farge, private company employees (187 | 71.1%), state government employees (22 | 8.4%), and self-employed (incorporated) (18 | 6.8%) make up the most common classes of employment.
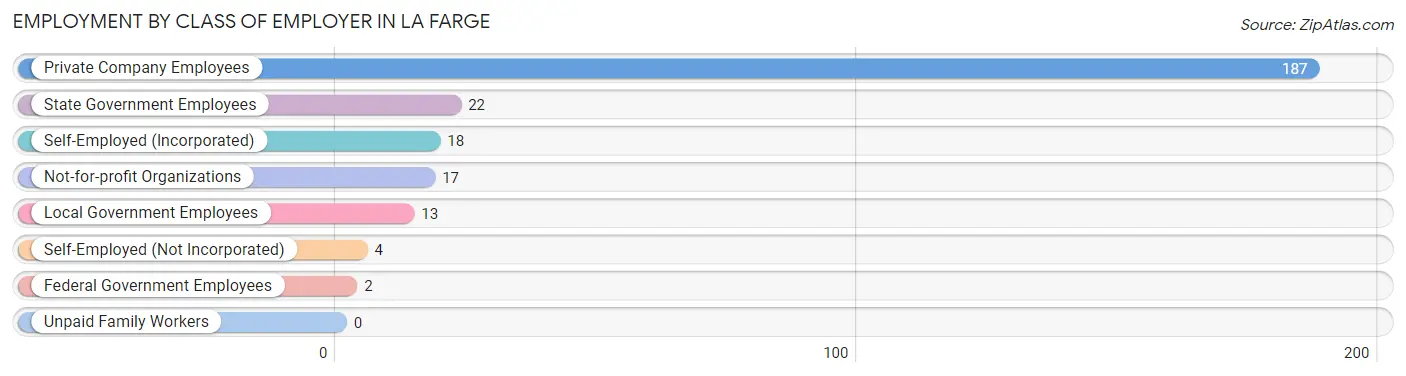
| Employer Class | # Employees | % Employees |
| Private Company Employees | 187 | 71.1% |
| Self-Employed (Incorporated) | 18 | 6.8% |
| Self-Employed (Not Incorporated) | 4 | 1.5% |
| Not-for-profit Organizations | 17 | 6.5% |
| Local Government Employees | 13 | 4.9% |
| State Government Employees | 22 | 8.4% |
| Federal Government Employees | 2 | 0.8% |
| Unpaid Family Workers | 0 | 0.0% |
| Total | 263 | 100.0% |
Employment Status by Age in La Farge
According to the labor force statistics for La Farge, out of the total population over 16 years of age (593), 48.4% or 287 individuals are in the labor force, with 6.6% or 19 of them unemployed. The age group with the highest labor force participation rate is 30 to 34 years, with 96.2% or 50 individuals in the labor force. Within the labor force, the 35 to 44 years age range has the highest percentage of unemployed individuals, with 17.9% or 12 of them being unemployed.
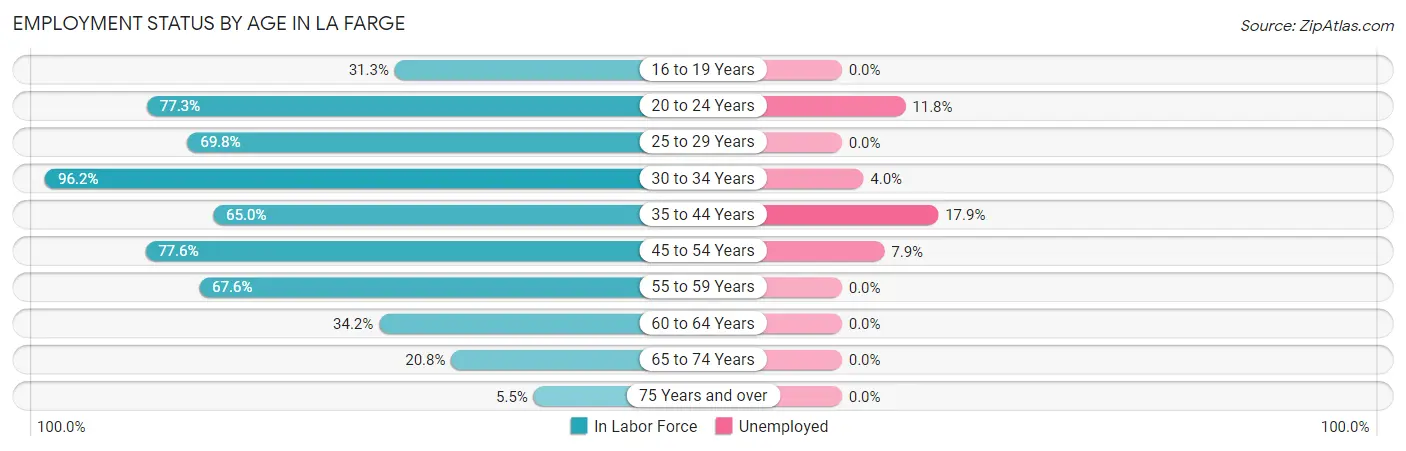
| Age Bracket | In Labor Force | Unemployed |
| 16 to 19 Years | 5 (31.3%) | 0 (0.0%) |
| 20 to 24 Years | 17 (77.3%) | 2 (11.8%) |
| 25 to 29 Years | 30 (69.8%) | 0 (0.0%) |
| 30 to 34 Years | 50 (96.2%) | 2 (4.0%) |
| 35 to 44 Years | 67 (65.0%) | 12 (17.9%) |
| 45 to 54 Years | 38 (77.6%) | 3 (7.9%) |
| 55 to 59 Years | 25 (67.6%) | 0 (0.0%) |
| 60 to 64 Years | 25 (34.2%) | 0 (0.0%) |
| 65 to 74 Years | 26 (20.8%) | 0 (0.0%) |
| 75 Years and over | 4 (5.5%) | 0 (0.0%) |
| Total | 287 (48.4%) | 19 (6.6%) |
Employment Status by Educational Attainment in La Farge
According to labor force statistics for La Farge, 65.8% of individuals (235) out of the total population between 25 and 64 years of age (357) are in the labor force, with 7.2% or 17 of them being unemployed. The group with the highest labor force participation rate are those with the educational attainment of college / associate degree, with 77.9% or 88 individuals in the labor force. Within the labor force, individuals with college / associate degree education have the highest percentage of unemployment, with 14.8% or 13 of them being unemployed.
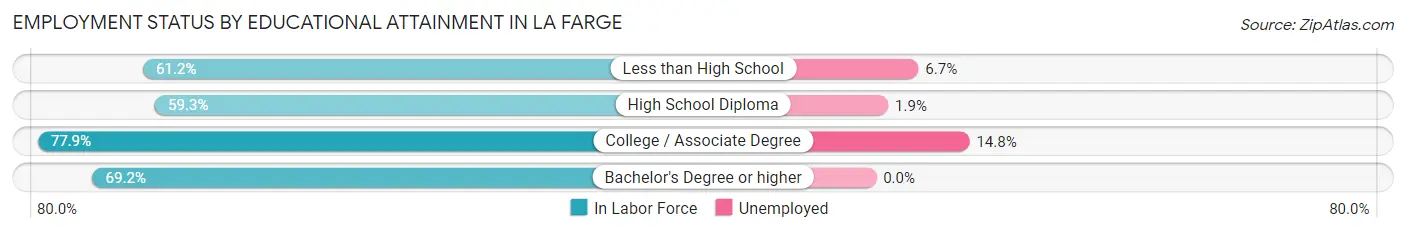
| Educational Attainment | In Labor Force | Unemployed |
| Less than High School | 30 (61.2%) | 3 (6.7%) |
| High School Diploma | 108 (59.3%) | 3 (1.9%) |
| College / Associate Degree | 88 (77.9%) | 17 (14.8%) |
| Bachelor's Degree or higher | 9 (69.2%) | 0 (0.0%) |
| Total | 235 (65.8%) | 26 (7.2%) |
Employment Occupations by Sex in La Farge
Management, Business, Science and Arts Occupations
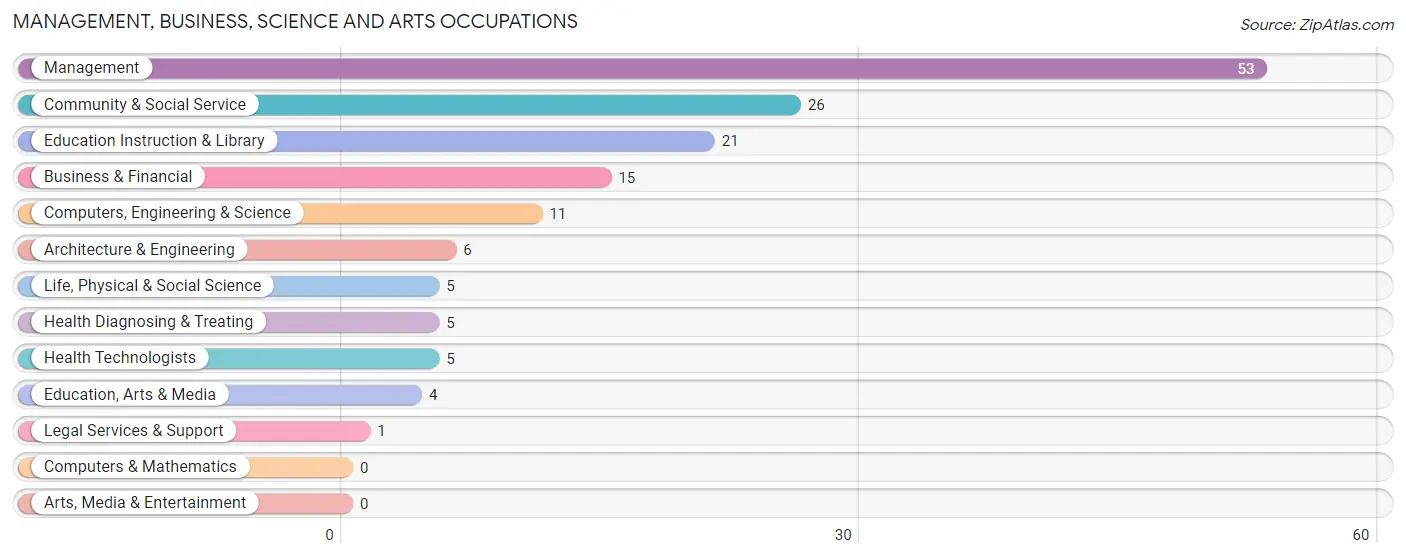
The most common Management, Business, Science and Arts occupations in La Farge are Management (53 | 19.8%), Community & Social Service (26 | 9.7%), Education Instruction & Library (21 | 7.8%), Business & Financial (15 | 5.6%), and Computers, Engineering & Science (11 | 4.1%).
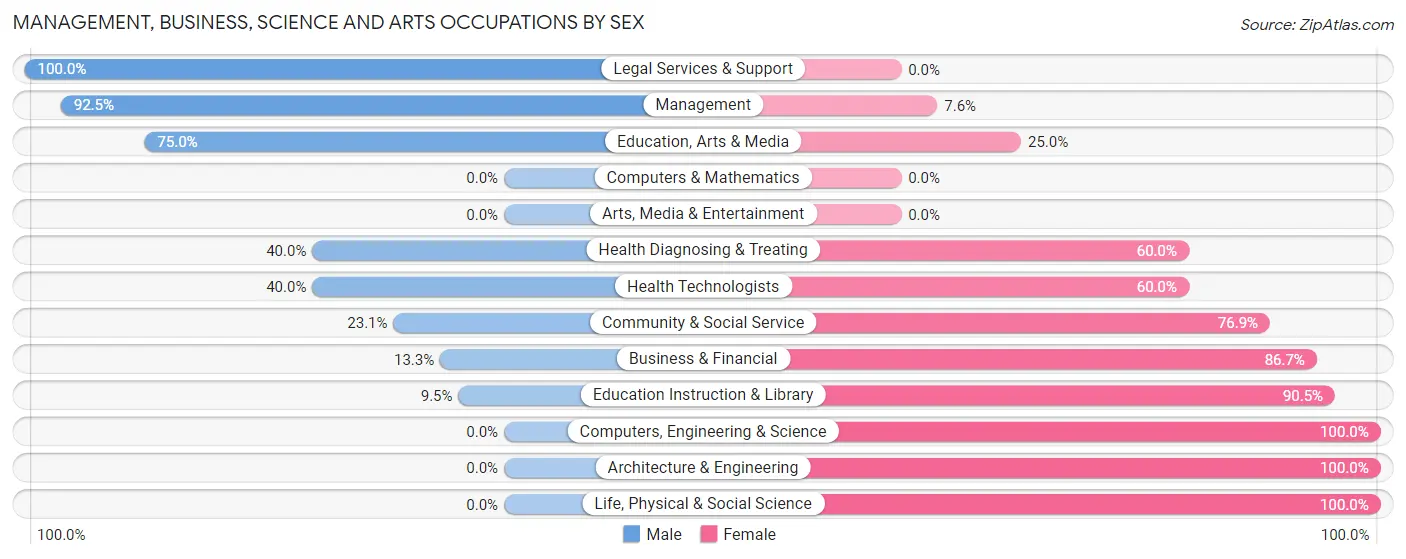
Management, Business, Science and Arts Occupations by Sex
Within the Management, Business, Science and Arts occupations in La Farge, the most male-oriented occupations are Legal Services & Support (100.0%), Management (92.4%), and Education, Arts & Media (75.0%), while the most female-oriented occupations are Computers, Engineering & Science (100.0%), Architecture & Engineering (100.0%), and Life, Physical & Social Science (100.0%).
| Occupation | Male | Female |
| Management | 49 (92.4%) | 4 (7.5%) |
| Business & Financial | 2 (13.3%) | 13 (86.7%) |
| Computers, Engineering & Science | 0 (0.0%) | 11 (100.0%) |
| Computers & Mathematics | 0 (0.0%) | 0 (0.0%) |
| Architecture & Engineering | 0 (0.0%) | 6 (100.0%) |
| Life, Physical & Social Science | 0 (0.0%) | 5 (100.0%) |
| Community & Social Service | 6 (23.1%) | 20 (76.9%) |
| Education, Arts & Media | 3 (75.0%) | 1 (25.0%) |
| Legal Services & Support | 1 (100.0%) | 0 (0.0%) |
| Education Instruction & Library | 2 (9.5%) | 19 (90.5%) |
| Arts, Media & Entertainment | 0 (0.0%) | 0 (0.0%) |
| Health Diagnosing & Treating | 2 (40.0%) | 3 (60.0%) |
| Health Technologists | 2 (40.0%) | 3 (60.0%) |
| Total (Category) | 59 (53.6%) | 51 (46.4%) |
| Total (Overall) | 133 (49.6%) | 135 (50.4%) |
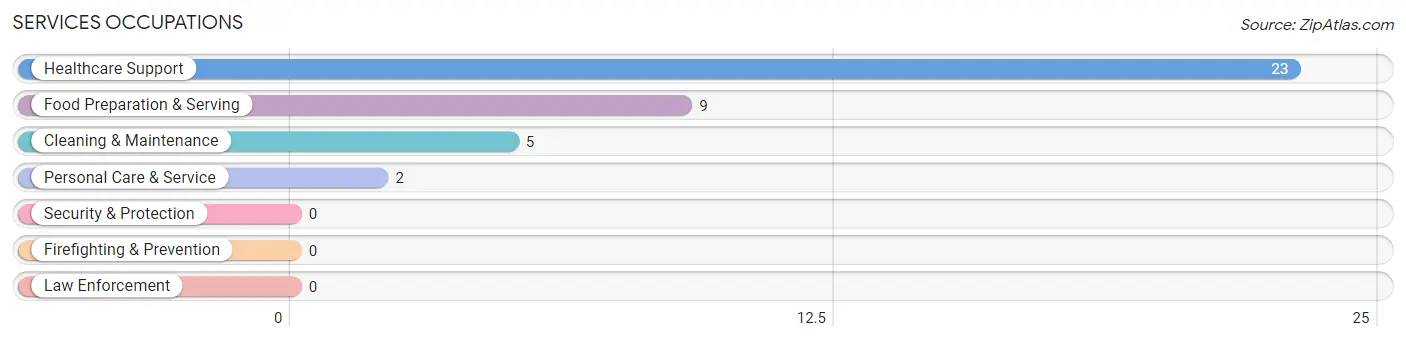
Services Occupations
The most common Services occupations in La Farge are Healthcare Support (23 | 8.6%), Food Preparation & Serving (9 | 3.4%), Cleaning & Maintenance (5 | 1.9%), and Personal Care & Service (2 | 0.7%).
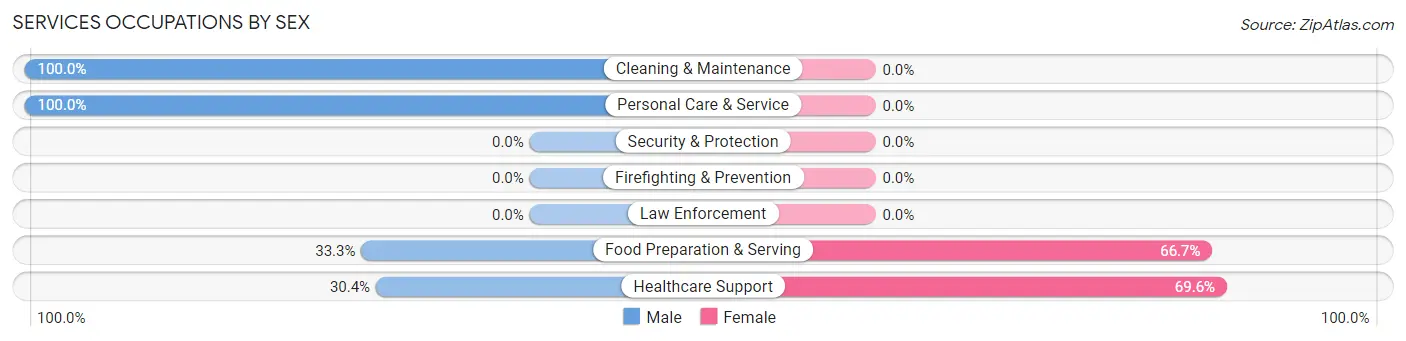
Services Occupations by Sex
Within the Services occupations in La Farge, the most male-oriented occupations are Cleaning & Maintenance (100.0%), Personal Care & Service (100.0%), and Food Preparation & Serving (33.3%), while the most female-oriented occupations are Healthcare Support (69.6%), and Food Preparation & Serving (66.7%).
| Occupation | Male | Female |
| Healthcare Support | 7 (30.4%) | 16 (69.6%) |
| Security & Protection | 0 (0.0%) | 0 (0.0%) |
| Firefighting & Prevention | 0 (0.0%) | 0 (0.0%) |
| Law Enforcement | 0 (0.0%) | 0 (0.0%) |
| Food Preparation & Serving | 3 (33.3%) | 6 (66.7%) |
| Cleaning & Maintenance | 5 (100.0%) | 0 (0.0%) |
| Personal Care & Service | 2 (100.0%) | 0 (0.0%) |
| Total (Category) | 17 (43.6%) | 22 (56.4%) |
| Total (Overall) | 133 (49.6%) | 135 (50.4%) |
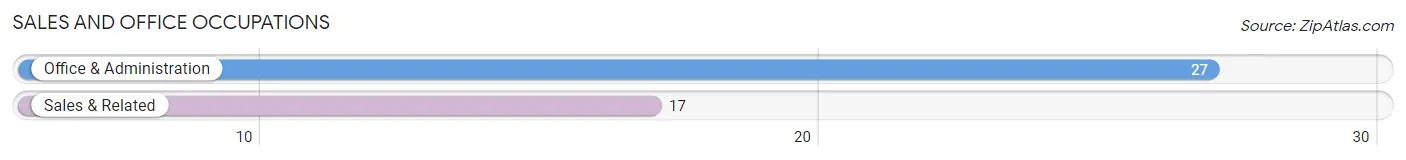
Sales and Office Occupations
The most common Sales and Office occupations in La Farge are Office & Administration (27 | 10.1%), and Sales & Related (17 | 6.3%).
Sales and Office Occupations by Sex
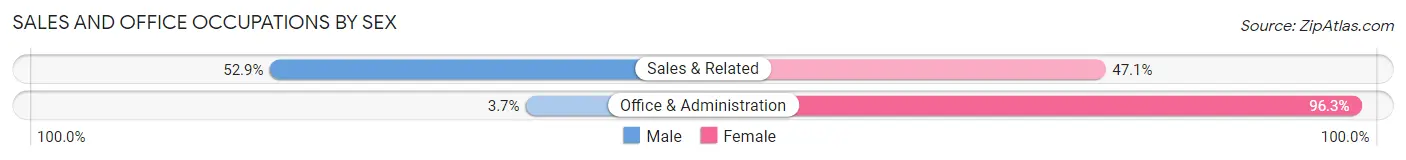
| Occupation | Male | Female |
| Sales & Related | 9 (52.9%) | 8 (47.1%) |
| Office & Administration | 1 (3.7%) | 26 (96.3%) |
| Total (Category) | 10 (22.7%) | 34 (77.3%) |
| Total (Overall) | 133 (49.6%) | 135 (50.4%) |
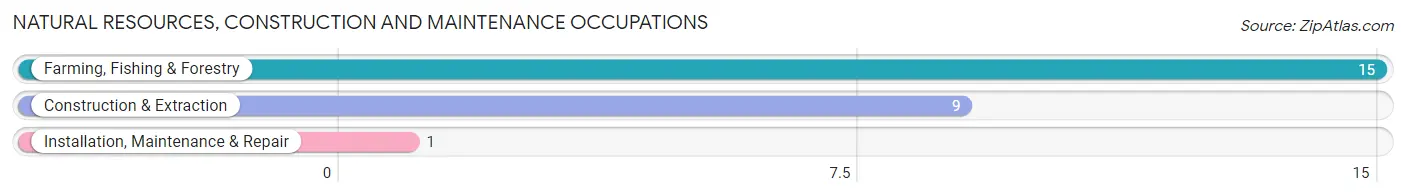
Natural Resources, Construction and Maintenance Occupations
The most common Natural Resources, Construction and Maintenance occupations in La Farge are Farming, Fishing & Forestry (15 | 5.6%), Construction & Extraction (9 | 3.4%), and Installation, Maintenance & Repair (1 | 0.4%).
Natural Resources, Construction and Maintenance Occupations by Sex
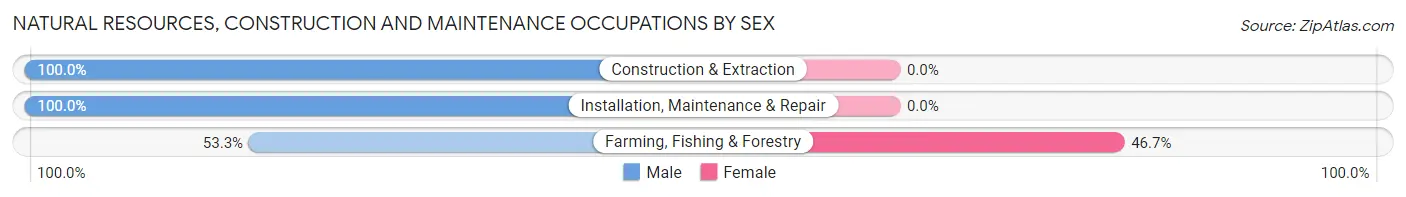
| Occupation | Male | Female |
| Farming, Fishing & Forestry | 8 (53.3%) | 7 (46.7%) |
| Construction & Extraction | 9 (100.0%) | 0 (0.0%) |
| Installation, Maintenance & Repair | 1 (100.0%) | 0 (0.0%) |
| Total (Category) | 18 (72.0%) | 7 (28.0%) |
| Total (Overall) | 133 (49.6%) | 135 (50.4%) |
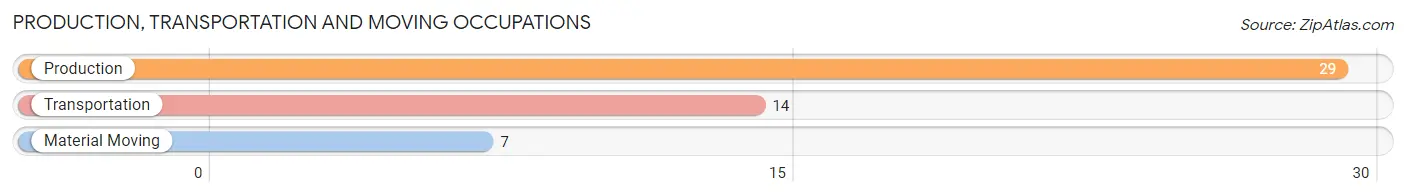
Production, Transportation and Moving Occupations
The most common Production, Transportation and Moving occupations in La Farge are Production (29 | 10.8%), Transportation (14 | 5.2%), and Material Moving (7 | 2.6%).
Production, Transportation and Moving Occupations by Sex
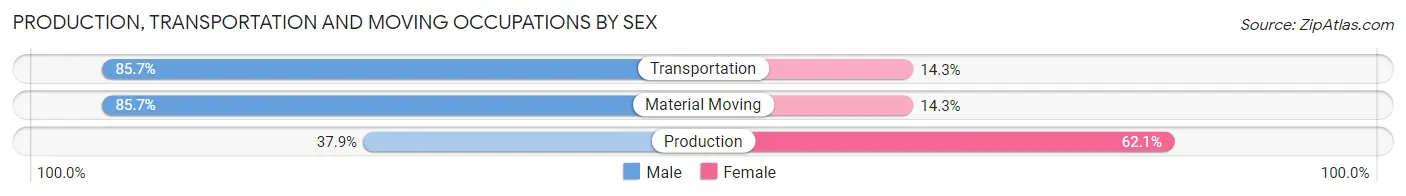
| Occupation | Male | Female |
| Production | 11 (37.9%) | 18 (62.1%) |
| Transportation | 12 (85.7%) | 2 (14.3%) |
| Material Moving | 6 (85.7%) | 1 (14.3%) |
| Total (Category) | 29 (58.0%) | 21 (42.0%) |
| Total (Overall) | 133 (49.6%) | 135 (50.4%) |
Employment Industries by Sex in La Farge
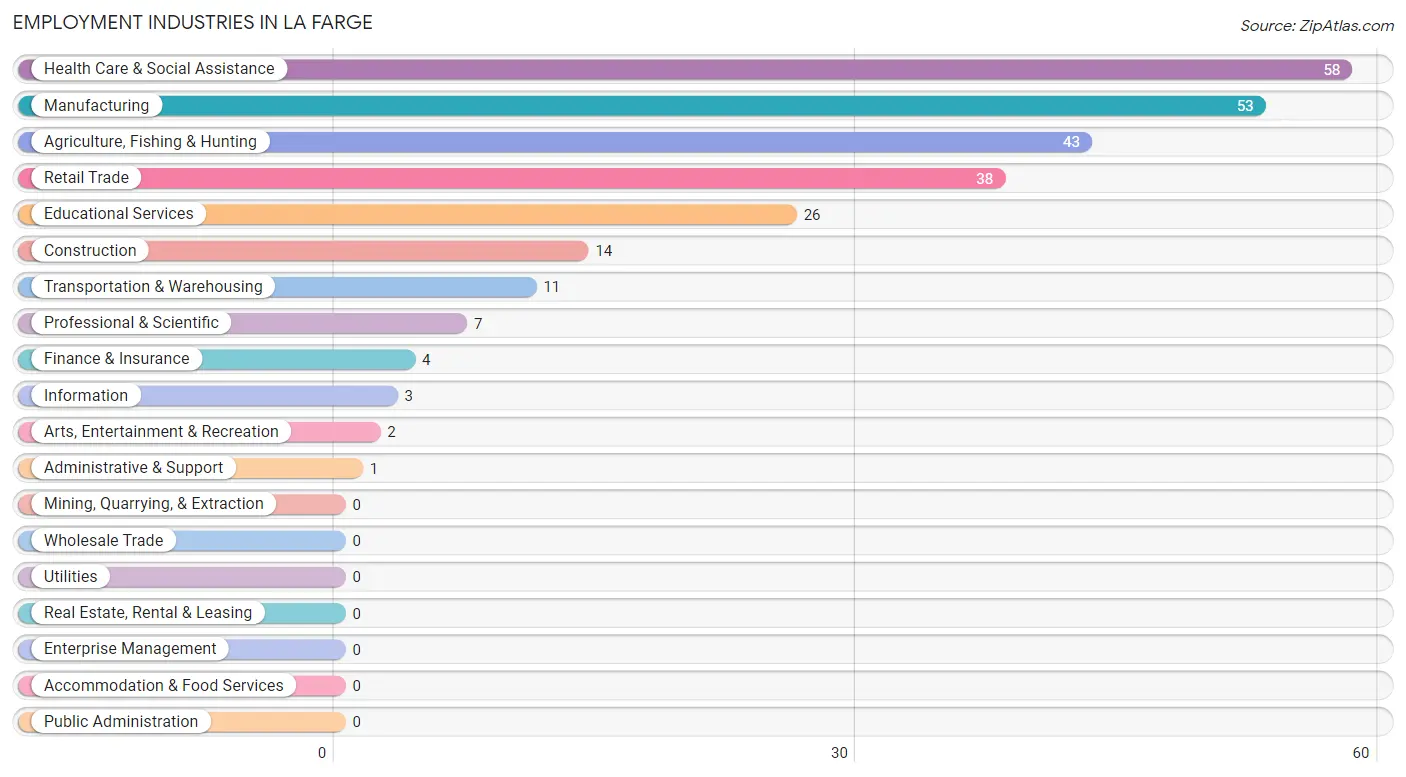
Employment Industries in La Farge
The major employment industries in La Farge include Health Care & Social Assistance (58 | 21.6%), Manufacturing (53 | 19.8%), Agriculture, Fishing & Hunting (43 | 16.0%), Retail Trade (38 | 14.2%), and Educational Services (26 | 9.7%).
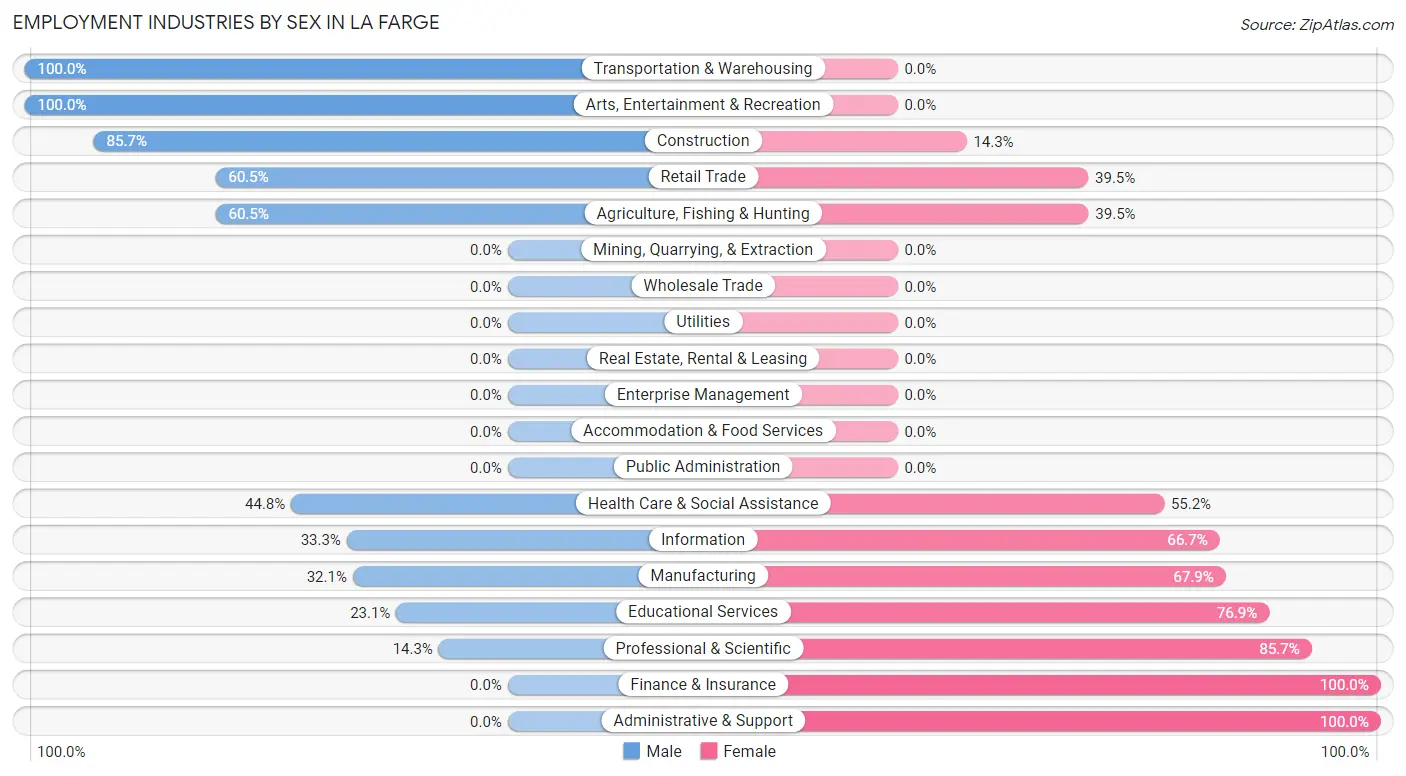
Employment Industries by Sex in La Farge
The La Farge industries that see more men than women are Transportation & Warehousing (100.0%), Arts, Entertainment & Recreation (100.0%), and Construction (85.7%), whereas the industries that tend to have a higher number of women are Finance & Insurance (100.0%), Administrative & Support (100.0%), and Professional & Scientific (85.7%).
| Industry | Male | Female |
| Agriculture, Fishing & Hunting | 26 (60.5%) | 17 (39.5%) |
| Mining, Quarrying, & Extraction | 0 (0.0%) | 0 (0.0%) |
| Construction | 12 (85.7%) | 2 (14.3%) |
| Manufacturing | 17 (32.1%) | 36 (67.9%) |
| Wholesale Trade | 0 (0.0%) | 0 (0.0%) |
| Retail Trade | 23 (60.5%) | 15 (39.5%) |
| Transportation & Warehousing | 11 (100.0%) | 0 (0.0%) |
| Utilities | 0 (0.0%) | 0 (0.0%) |
| Information | 1 (33.3%) | 2 (66.7%) |
| Finance & Insurance | 0 (0.0%) | 4 (100.0%) |
| Real Estate, Rental & Leasing | 0 (0.0%) | 0 (0.0%) |
| Professional & Scientific | 1 (14.3%) | 6 (85.7%) |
| Enterprise Management | 0 (0.0%) | 0 (0.0%) |
| Administrative & Support | 0 (0.0%) | 1 (100.0%) |
| Educational Services | 6 (23.1%) | 20 (76.9%) |
| Health Care & Social Assistance | 26 (44.8%) | 32 (55.2%) |
| Arts, Entertainment & Recreation | 2 (100.0%) | 0 (0.0%) |
| Accommodation & Food Services | 0 (0.0%) | 0 (0.0%) |
| Public Administration | 0 (0.0%) | 0 (0.0%) |
| Total | 133 (49.6%) | 135 (50.4%) |
Education in La Farge
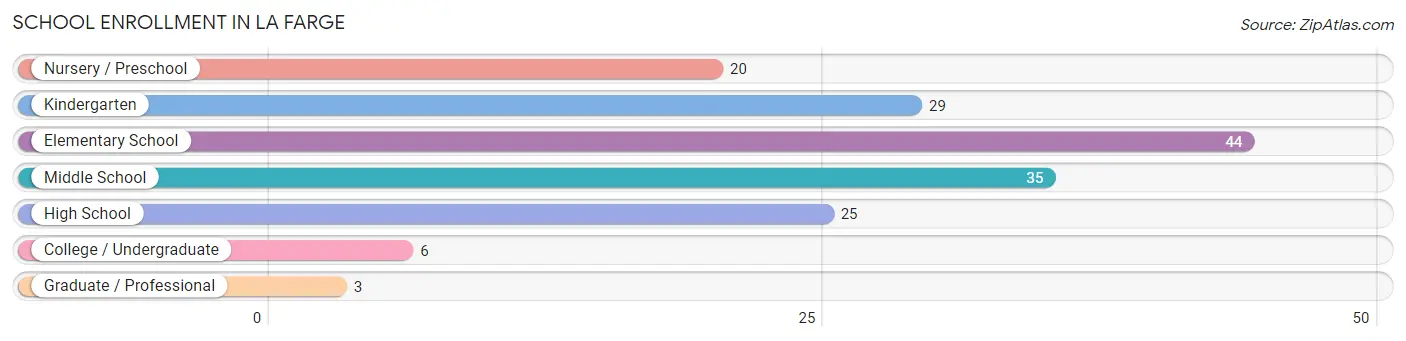
School Enrollment in La Farge
The most common levels of schooling among the 162 students in La Farge are elementary school (44 | 27.2%), middle school (35 | 21.6%), and kindergarten (29 | 17.9%).
| School Level | # Students | % Students |
| Nursery / Preschool | 20 | 12.3% |
| Kindergarten | 29 | 17.9% |
| Elementary School | 44 | 27.2% |
| Middle School | 35 | 21.6% |
| High School | 25 | 15.4% |
| College / Undergraduate | 6 | 3.7% |
| Graduate / Professional | 3 | 1.8% |
| Total | 162 | 100.0% |
School Enrollment by Age by Funding Source in La Farge
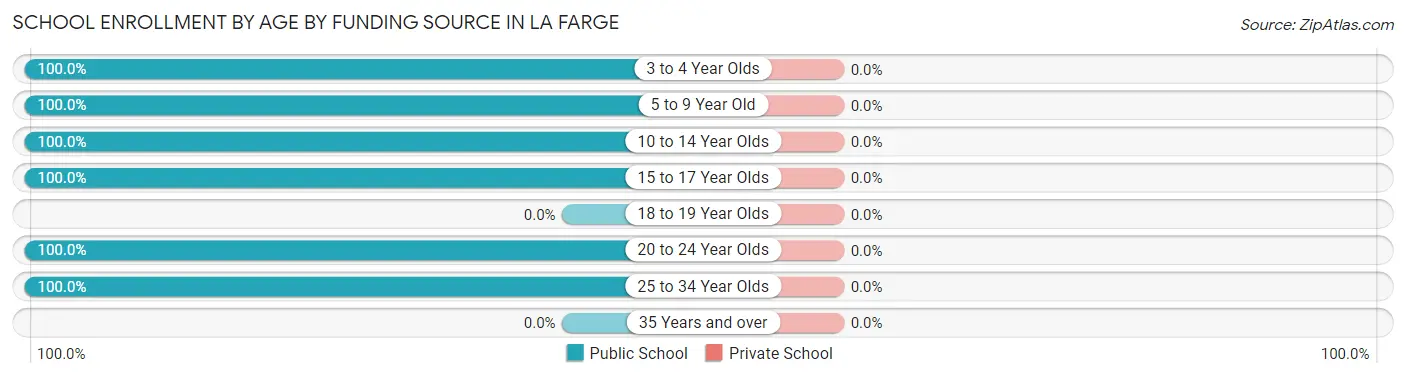
| Age Bracket | Public School | Private School |
| 3 to 4 Year Olds | 20 (100.0%) | 0 (0.0%) |
| 5 to 9 Year Old | 66 (100.0%) | 0 (0.0%) |
| 10 to 14 Year Olds | 50 (100.0%) | 0 (0.0%) |
| 15 to 17 Year Olds | 17 (100.0%) | 0 (0.0%) |
| 18 to 19 Year Olds | 0 (0.0%) | 0 (0.0%) |
| 20 to 24 Year Olds | 3 (100.0%) | 0 (0.0%) |
| 25 to 34 Year Olds | 6 (100.0%) | 0 (0.0%) |
| 35 Years and over | 0 (0.0%) | 0 (0.0%) |
| Total | 162 (100.0%) | 0 (0.0%) |
Educational Attainment by Field of Study in La Farge
Education (18 | 51.4%), science & technology (8 | 22.9%), bio, nature & agricultural (4 | 11.4%), business (3 | 8.6%), and social sciences (1 | 2.9%) are the most common fields of study among 35 individuals in La Farge who have obtained a bachelor's degree or higher.
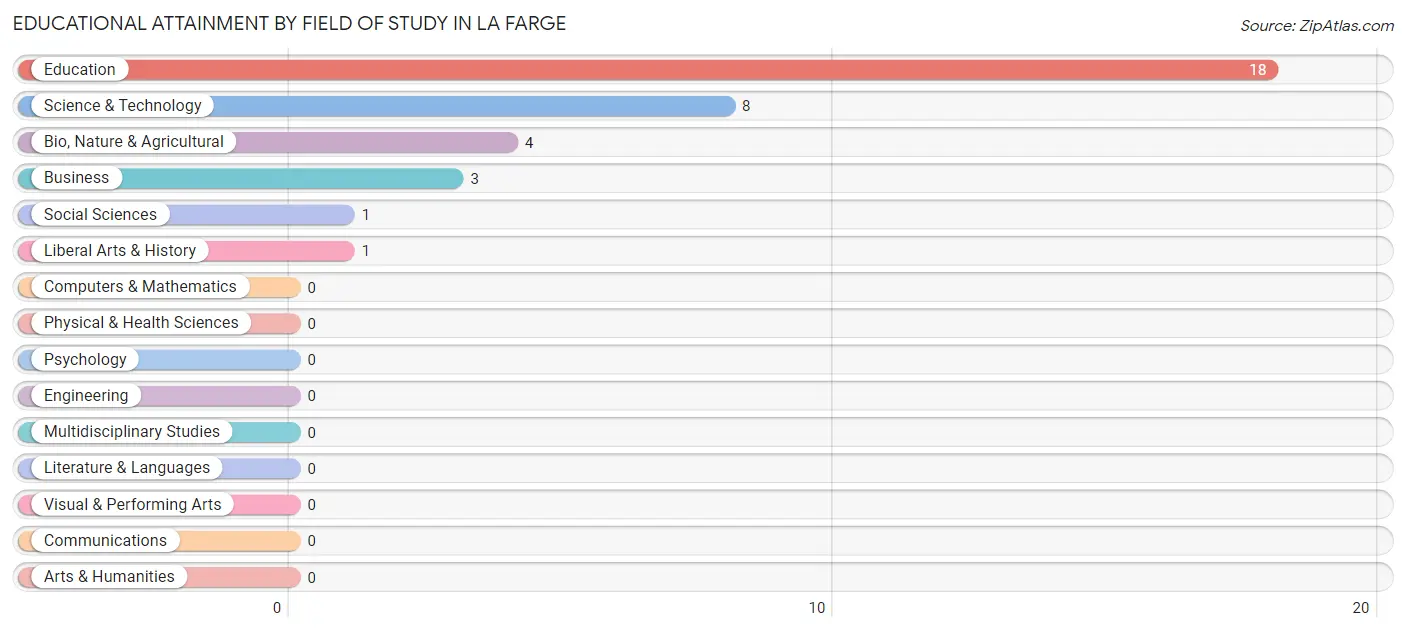
| Field of Study | # Graduates | % Graduates |
| Computers & Mathematics | 0 | 0.0% |
| Bio, Nature & Agricultural | 4 | 11.4% |
| Physical & Health Sciences | 0 | 0.0% |
| Psychology | 0 | 0.0% |
| Social Sciences | 1 | 2.9% |
| Engineering | 0 | 0.0% |
| Multidisciplinary Studies | 0 | 0.0% |
| Science & Technology | 8 | 22.9% |
| Business | 3 | 8.6% |
| Education | 18 | 51.4% |
| Literature & Languages | 0 | 0.0% |
| Liberal Arts & History | 1 | 2.9% |
| Visual & Performing Arts | 0 | 0.0% |
| Communications | 0 | 0.0% |
| Arts & Humanities | 0 | 0.0% |
| Total | 35 | 100.0% |
Transportation & Commute in La Farge
Vehicle Availability by Sex in La Farge
The most prevalent vehicle ownership categories in La Farge are males with 3 vehicles (40, accounting for 34.5%) and females with 3 vehicles (22, making up 30.1%).
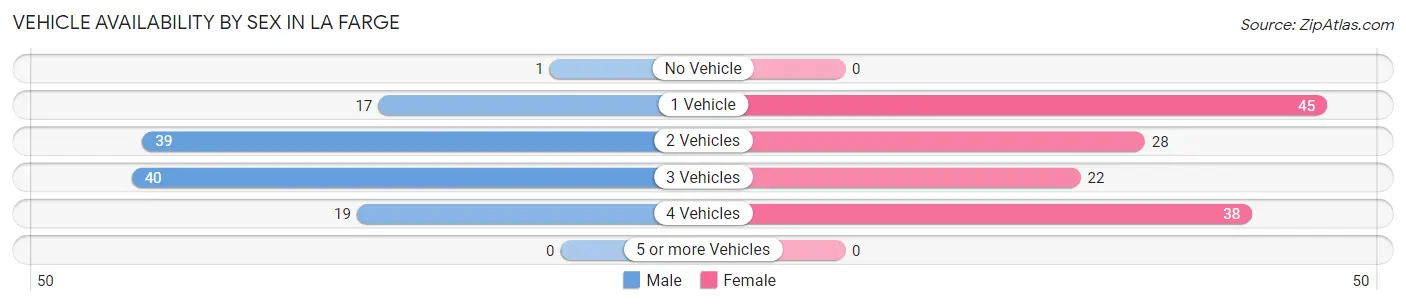
| Vehicles Available | Male | Female |
| No Vehicle | 1 (0.9%) | 0 (0.0%) |
| 1 Vehicle | 17 (14.7%) | 45 (33.8%) |
| 2 Vehicles | 39 (33.6%) | 28 (21.0%) |
| 3 Vehicles | 40 (34.5%) | 22 (16.5%) |
| 4 Vehicles | 19 (16.4%) | 38 (28.6%) |
| 5 or more Vehicles | 0 (0.0%) | 0 (0.0%) |
| Total | 116 (100.0%) | 133 (100.0%) |
Commute Time in La Farge
The most frequently occuring commute durations in La Farge are 30 to 34 minutes (49 commuters, 20.3%), 20 to 24 minutes (41 commuters, 17.0%), and 5 to 9 minutes (33 commuters, 13.7%).
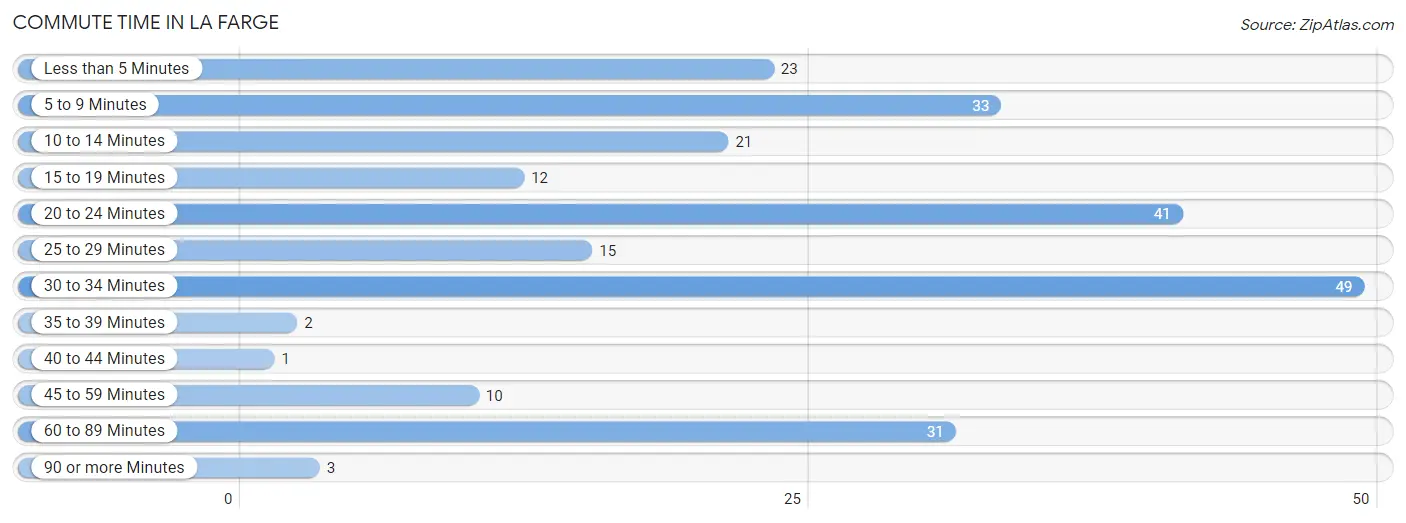
| Commute Time | # Commuters | % Commuters |
| Less than 5 Minutes | 23 | 9.5% |
| 5 to 9 Minutes | 33 | 13.7% |
| 10 to 14 Minutes | 21 | 8.7% |
| 15 to 19 Minutes | 12 | 5.0% |
| 20 to 24 Minutes | 41 | 17.0% |
| 25 to 29 Minutes | 15 | 6.2% |
| 30 to 34 Minutes | 49 | 20.3% |
| 35 to 39 Minutes | 2 | 0.8% |
| 40 to 44 Minutes | 1 | 0.4% |
| 45 to 59 Minutes | 10 | 4.2% |
| 60 to 89 Minutes | 31 | 12.9% |
| 90 or more Minutes | 3 | 1.2% |
Commute Time by Sex in La Farge
The most common commute times in La Farge are 20 to 24 minutes (33 commuters, 29.2%) for males and 30 to 34 minutes (29 commuters, 22.7%) for females.
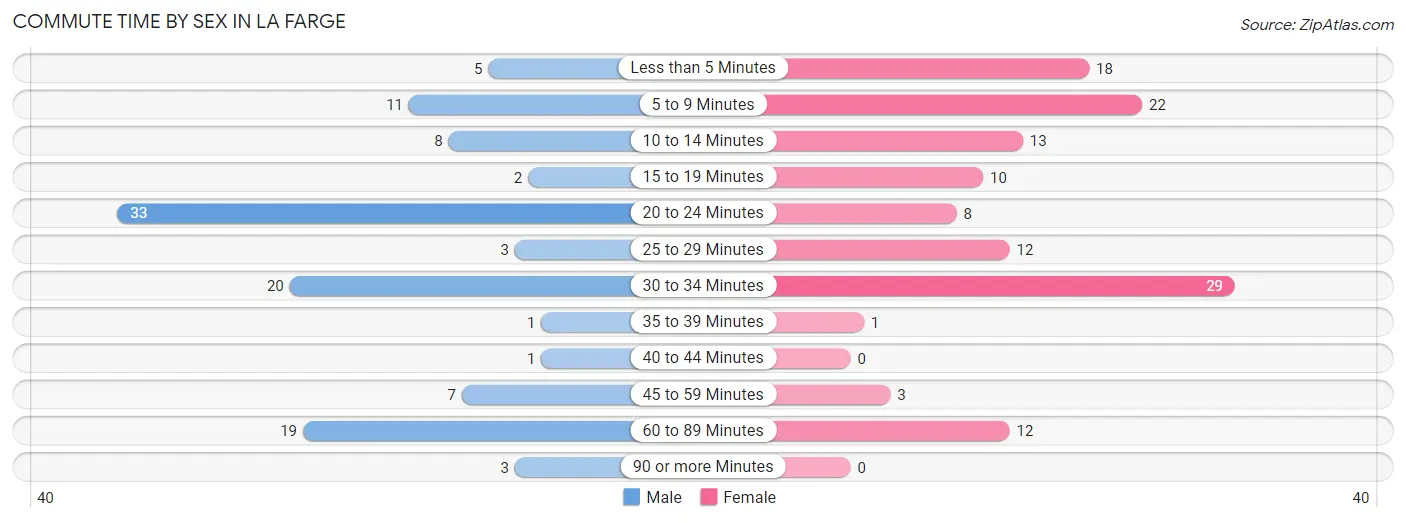
| Commute Time | Male | Female |
| Less than 5 Minutes | 5 (4.4%) | 18 (14.1%) |
| 5 to 9 Minutes | 11 (9.7%) | 22 (17.2%) |
| 10 to 14 Minutes | 8 (7.1%) | 13 (10.2%) |
| 15 to 19 Minutes | 2 (1.8%) | 10 (7.8%) |
| 20 to 24 Minutes | 33 (29.2%) | 8 (6.2%) |
| 25 to 29 Minutes | 3 (2.6%) | 12 (9.4%) |
| 30 to 34 Minutes | 20 (17.7%) | 29 (22.7%) |
| 35 to 39 Minutes | 1 (0.9%) | 1 (0.8%) |
| 40 to 44 Minutes | 1 (0.9%) | 0 (0.0%) |
| 45 to 59 Minutes | 7 (6.2%) | 3 (2.3%) |
| 60 to 89 Minutes | 19 (16.8%) | 12 (9.4%) |
| 90 or more Minutes | 3 (2.6%) | 0 (0.0%) |
Time of Departure to Work by Sex in La Farge
The most frequent times of departure to work in La Farge are 7:00 AM to 7:29 AM (26, 23.0%) for males and 12:00 PM to 3:59 PM (21, 16.4%) for females.
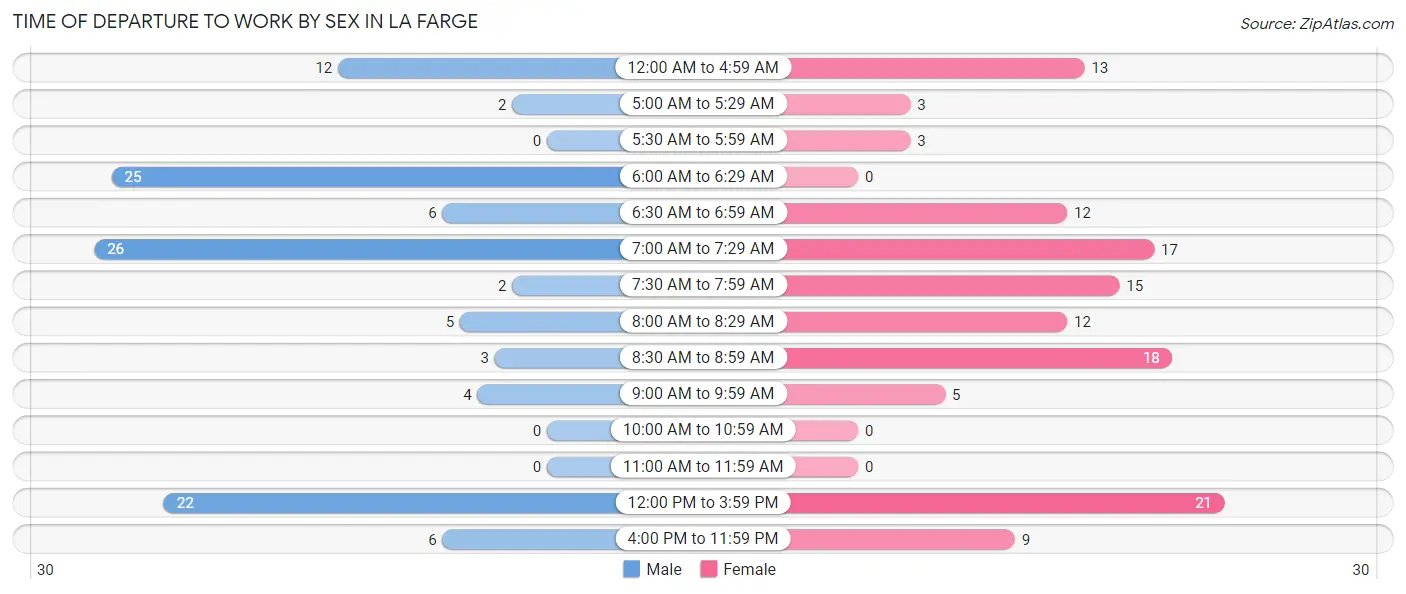
| Time of Departure | Male | Female |
| 12:00 AM to 4:59 AM | 12 (10.6%) | 13 (10.2%) |
| 5:00 AM to 5:29 AM | 2 (1.8%) | 3 (2.3%) |
| 5:30 AM to 5:59 AM | 0 (0.0%) | 3 (2.3%) |
| 6:00 AM to 6:29 AM | 25 (22.1%) | 0 (0.0%) |
| 6:30 AM to 6:59 AM | 6 (5.3%) | 12 (9.4%) |
| 7:00 AM to 7:29 AM | 26 (23.0%) | 17 (13.3%) |
| 7:30 AM to 7:59 AM | 2 (1.8%) | 15 (11.7%) |
| 8:00 AM to 8:29 AM | 5 (4.4%) | 12 (9.4%) |
| 8:30 AM to 8:59 AM | 3 (2.6%) | 18 (14.1%) |
| 9:00 AM to 9:59 AM | 4 (3.5%) | 5 (3.9%) |
| 10:00 AM to 10:59 AM | 0 (0.0%) | 0 (0.0%) |
| 11:00 AM to 11:59 AM | 0 (0.0%) | 0 (0.0%) |
| 12:00 PM to 3:59 PM | 22 (19.5%) | 21 (16.4%) |
| 4:00 PM to 11:59 PM | 6 (5.3%) | 9 (7.0%) |
| Total | 113 (100.0%) | 128 (100.0%) |
Housing Occupancy in La Farge
Occupancy by Ownership in La Farge
Of the total 360 dwellings in La Farge, owner-occupied units account for 228 (63.3%), while renter-occupied units make up 132 (36.7%).
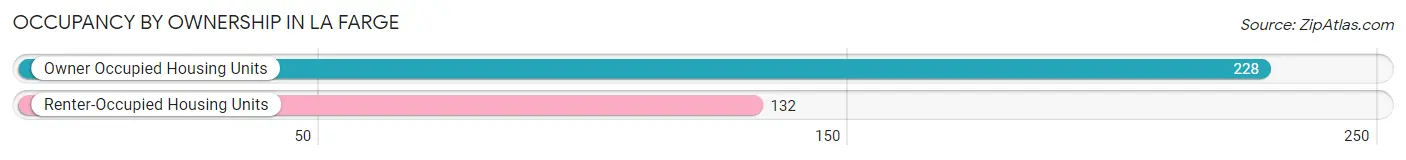
| Occupancy | # Housing Units | % Housing Units |
| Owner Occupied Housing Units | 228 | 63.3% |
| Renter-Occupied Housing Units | 132 | 36.7% |
| Total Occupied Housing Units | 360 | 100.0% |
Occupancy by Household Size in La Farge
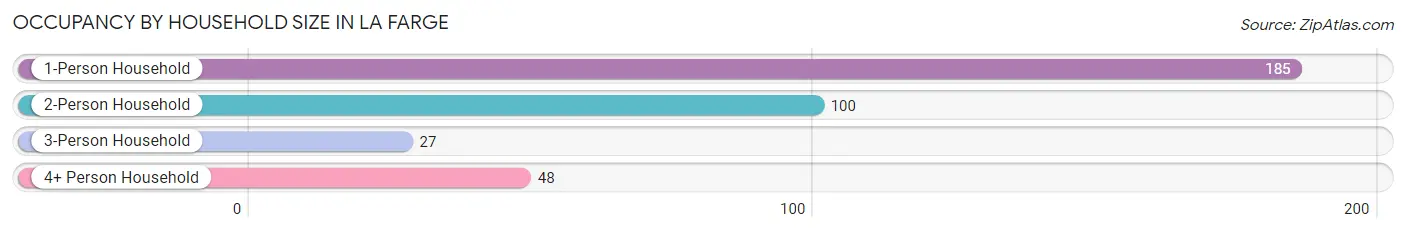
| Household Size | # Housing Units | % Housing Units |
| 1-Person Household | 185 | 51.4% |
| 2-Person Household | 100 | 27.8% |
| 3-Person Household | 27 | 7.5% |
| 4+ Person Household | 48 | 13.3% |
| Total Housing Units | 360 | 100.0% |
Occupancy by Ownership by Household Size in La Farge
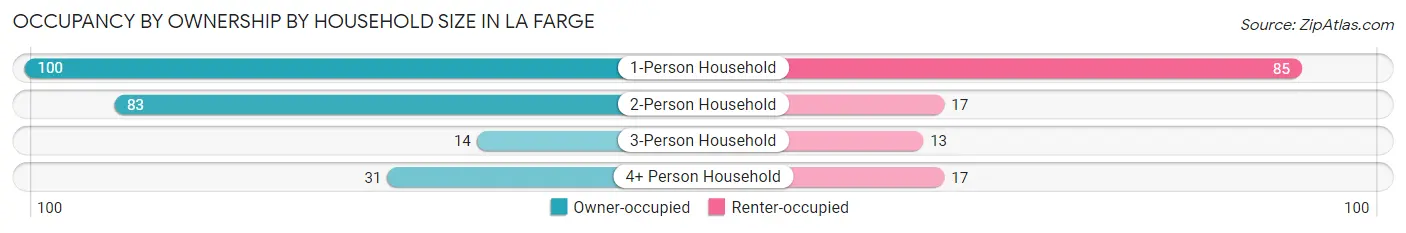
| Household Size | Owner-occupied | Renter-occupied |
| 1-Person Household | 100 (54.0%) | 85 (46.0%) |
| 2-Person Household | 83 (83.0%) | 17 (17.0%) |
| 3-Person Household | 14 (51.8%) | 13 (48.1%) |
| 4+ Person Household | 31 (64.6%) | 17 (35.4%) |
| Total Housing Units | 228 (63.3%) | 132 (36.7%) |
Occupancy by Educational Attainment in La Farge
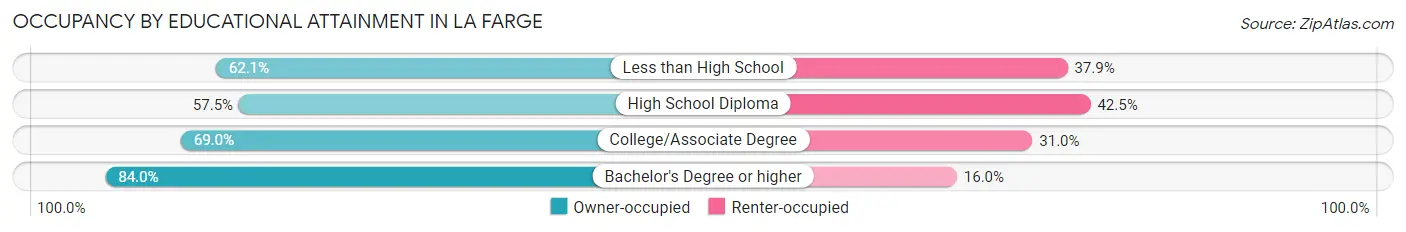
| Household Size | Owner-occupied | Renter-occupied |
| Less than High School | 18 (62.1%) | 11 (37.9%) |
| High School Diploma | 111 (57.5%) | 82 (42.5%) |
| College/Associate Degree | 78 (69.0%) | 35 (31.0%) |
| Bachelor's Degree or higher | 21 (84.0%) | 4 (16.0%) |
Occupancy by Age of Householder in La Farge
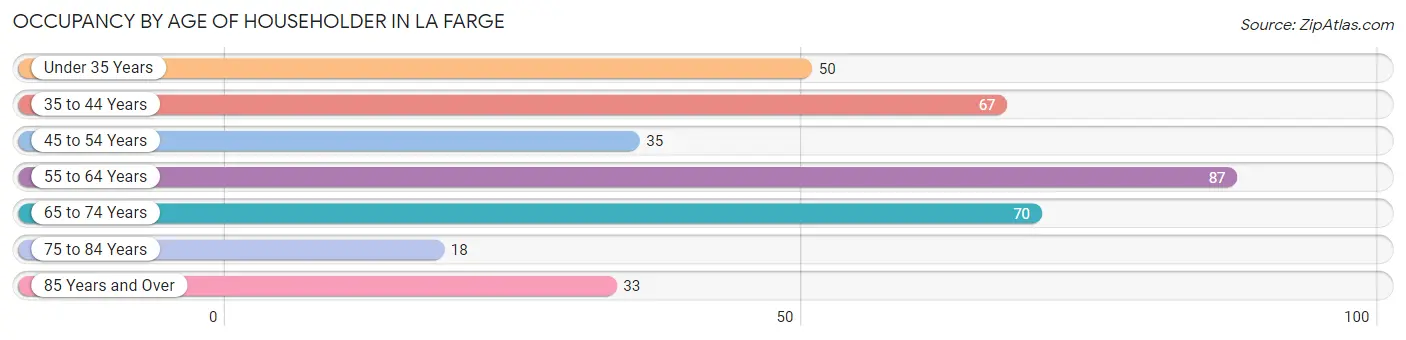
| Age Bracket | # Households | % Households |
| Under 35 Years | 50 | 13.9% |
| 35 to 44 Years | 67 | 18.6% |
| 45 to 54 Years | 35 | 9.7% |
| 55 to 64 Years | 87 | 24.2% |
| 65 to 74 Years | 70 | 19.4% |
| 75 to 84 Years | 18 | 5.0% |
| 85 Years and Over | 33 | 9.2% |
| Total | 360 | 100.0% |
Housing Finances in La Farge
Median Income by Occupancy in La Farge
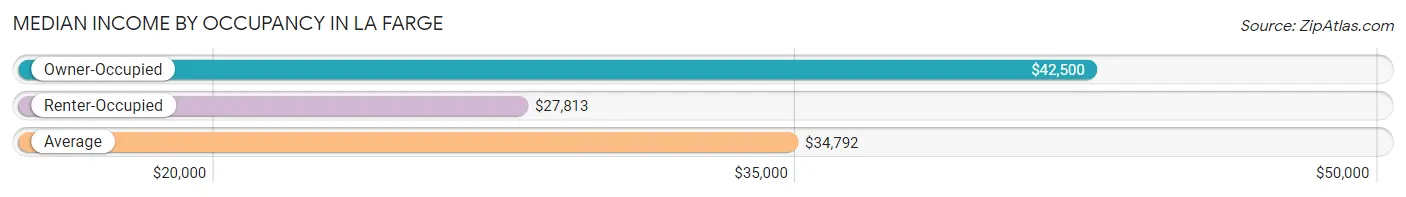
| Occupancy Type | # Households | Median Income |
| Owner-Occupied | 228 (63.3%) | $42,500 |
| Renter-Occupied | 132 (36.7%) | $27,813 |
| Average | 360 (100.0%) | $34,792 |
Occupancy by Householder Income Bracket in La Farge
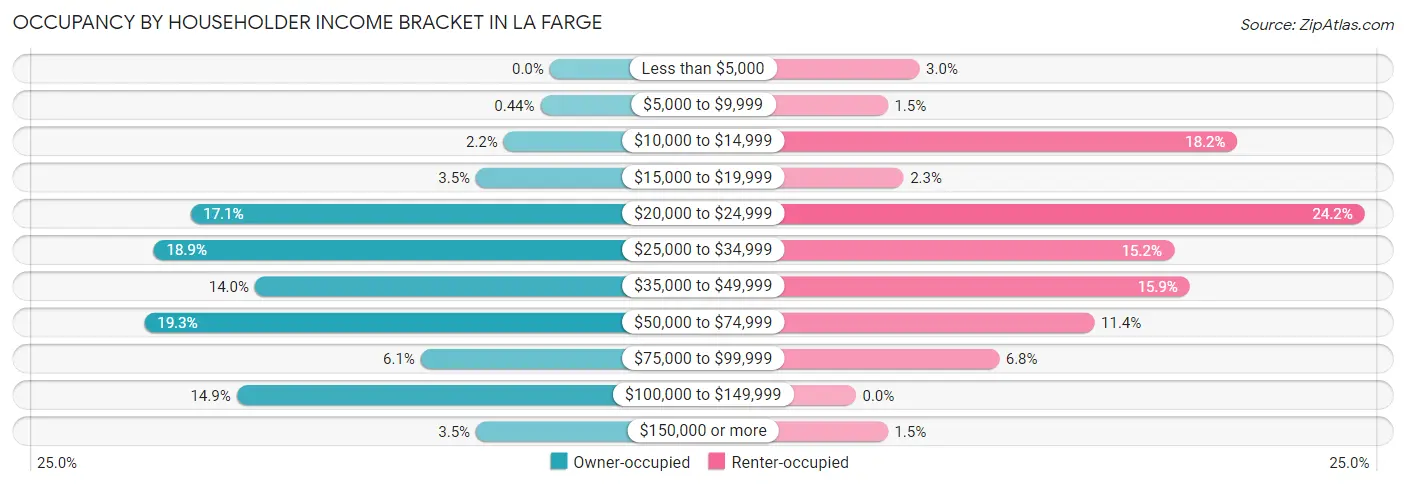
| Income Bracket | Owner-occupied | Renter-occupied |
| Less than $5,000 | 0 (0.0%) | 4 (3.0%) |
| $5,000 to $9,999 | 1 (0.4%) | 2 (1.5%) |
| $10,000 to $14,999 | 5 (2.2%) | 24 (18.2%) |
| $15,000 to $19,999 | 8 (3.5%) | 3 (2.3%) |
| $20,000 to $24,999 | 39 (17.1%) | 32 (24.2%) |
| $25,000 to $34,999 | 43 (18.9%) | 20 (15.1%) |
| $35,000 to $49,999 | 32 (14.0%) | 21 (15.9%) |
| $50,000 to $74,999 | 44 (19.3%) | 15 (11.4%) |
| $75,000 to $99,999 | 14 (6.1%) | 9 (6.8%) |
| $100,000 to $149,999 | 34 (14.9%) | 0 (0.0%) |
| $150,000 or more | 8 (3.5%) | 2 (1.5%) |
| Total | 228 (100.0%) | 132 (100.0%) |
Monthly Housing Cost Tiers in La Farge
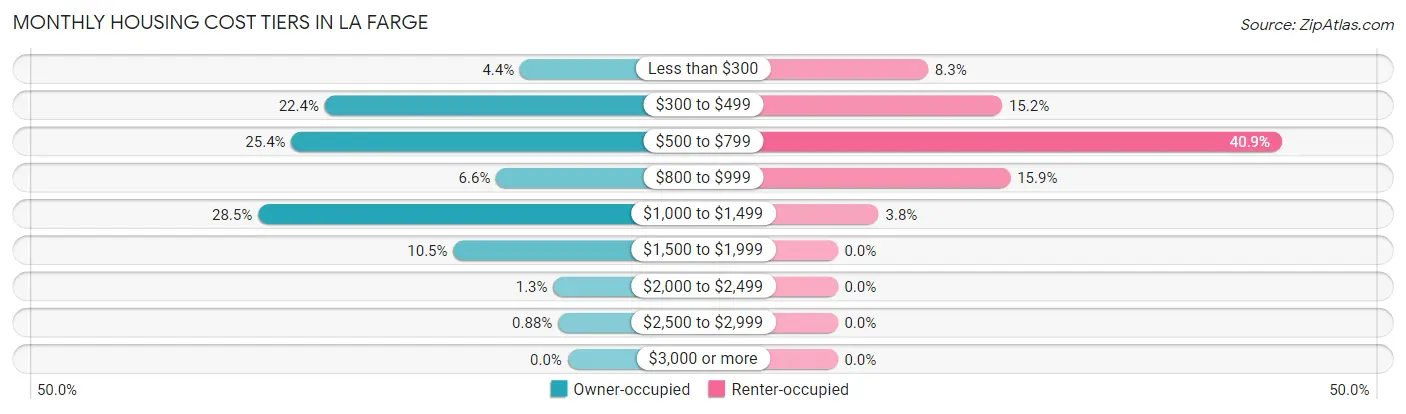
| Monthly Cost | Owner-occupied | Renter-occupied |
| Less than $300 | 10 (4.4%) | 11 (8.3%) |
| $300 to $499 | 51 (22.4%) | 20 (15.1%) |
| $500 to $799 | 58 (25.4%) | 54 (40.9%) |
| $800 to $999 | 15 (6.6%) | 21 (15.9%) |
| $1,000 to $1,499 | 65 (28.5%) | 5 (3.8%) |
| $1,500 to $1,999 | 24 (10.5%) | 0 (0.0%) |
| $2,000 to $2,499 | 3 (1.3%) | 0 (0.0%) |
| $2,500 to $2,999 | 2 (0.9%) | 0 (0.0%) |
| $3,000 or more | 0 (0.0%) | 0 (0.0%) |
| Total | 228 (100.0%) | 132 (100.0%) |
Physical Housing Characteristics in La Farge
Housing Structures in La Farge
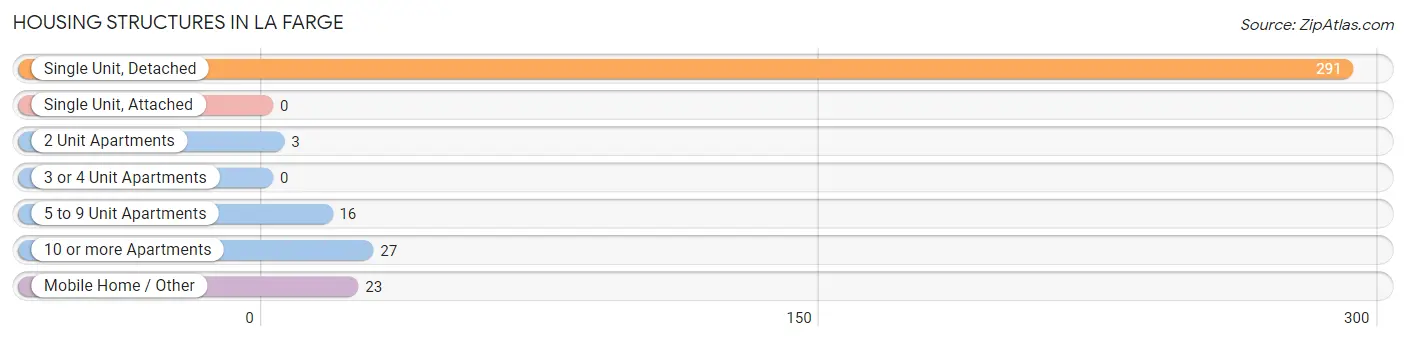
| Structure Type | # Housing Units | % Housing Units |
| Single Unit, Detached | 291 | 80.8% |
| Single Unit, Attached | 0 | 0.0% |
| 2 Unit Apartments | 3 | 0.8% |
| 3 or 4 Unit Apartments | 0 | 0.0% |
| 5 to 9 Unit Apartments | 16 | 4.4% |
| 10 or more Apartments | 27 | 7.5% |
| Mobile Home / Other | 23 | 6.4% |
| Total | 360 | 100.0% |
Housing Structures by Occupancy in La Farge
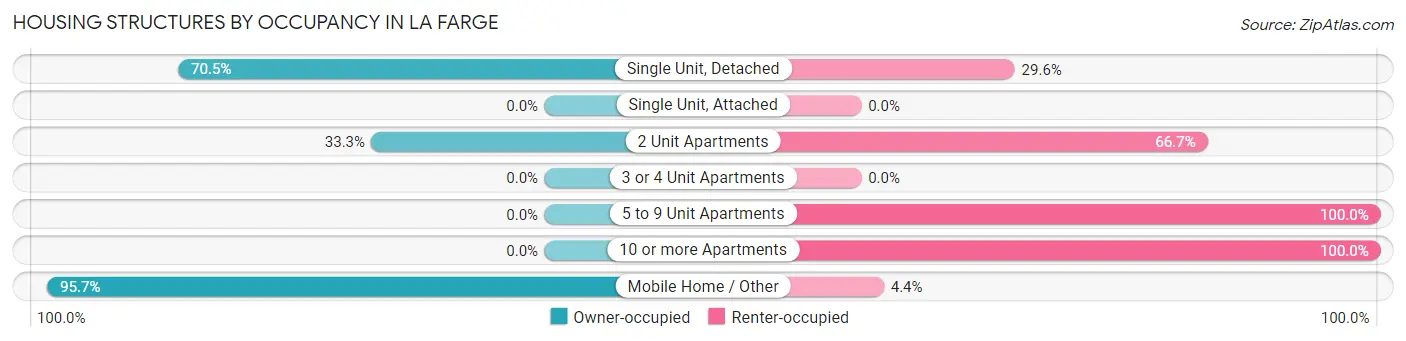
| Structure Type | Owner-occupied | Renter-occupied |
| Single Unit, Detached | 205 (70.5%) | 86 (29.5%) |
| Single Unit, Attached | 0 (0.0%) | 0 (0.0%) |
| 2 Unit Apartments | 1 (33.3%) | 2 (66.7%) |
| 3 or 4 Unit Apartments | 0 (0.0%) | 0 (0.0%) |
| 5 to 9 Unit Apartments | 0 (0.0%) | 16 (100.0%) |
| 10 or more Apartments | 0 (0.0%) | 27 (100.0%) |
| Mobile Home / Other | 22 (95.7%) | 1 (4.3%) |
| Total | 228 (63.3%) | 132 (36.7%) |
Housing Structures by Number of Rooms in La Farge
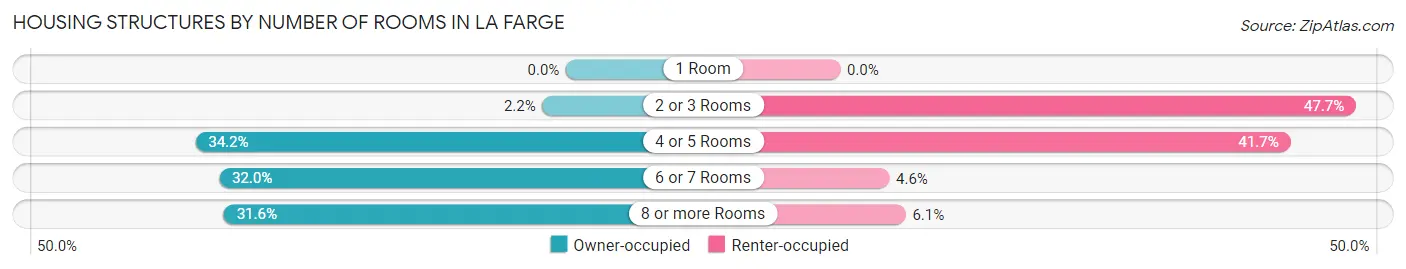
| Number of Rooms | Owner-occupied | Renter-occupied |
| 1 Room | 0 (0.0%) | 0 (0.0%) |
| 2 or 3 Rooms | 5 (2.2%) | 63 (47.7%) |
| 4 or 5 Rooms | 78 (34.2%) | 55 (41.7%) |
| 6 or 7 Rooms | 73 (32.0%) | 6 (4.5%) |
| 8 or more Rooms | 72 (31.6%) | 8 (6.1%) |
| Total | 228 (100.0%) | 132 (100.0%) |
Housing Structure by Heating Type in La Farge
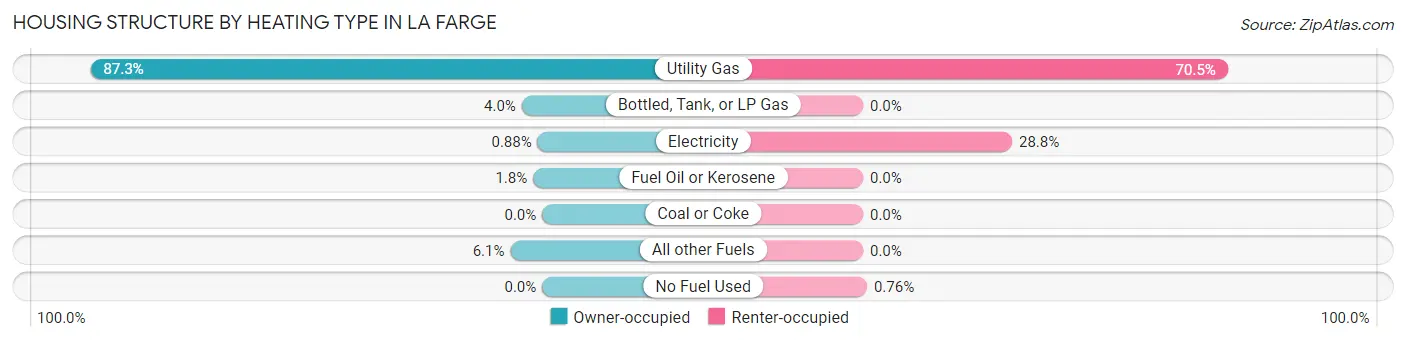
| Heating Type | Owner-occupied | Renter-occupied |
| Utility Gas | 199 (87.3%) | 93 (70.5%) |
| Bottled, Tank, or LP Gas | 9 (4.0%) | 0 (0.0%) |
| Electricity | 2 (0.9%) | 38 (28.8%) |
| Fuel Oil or Kerosene | 4 (1.8%) | 0 (0.0%) |
| Coal or Coke | 0 (0.0%) | 0 (0.0%) |
| All other Fuels | 14 (6.1%) | 0 (0.0%) |
| No Fuel Used | 0 (0.0%) | 1 (0.8%) |
| Total | 228 (100.0%) | 132 (100.0%) |
Household Vehicle Usage in La Farge
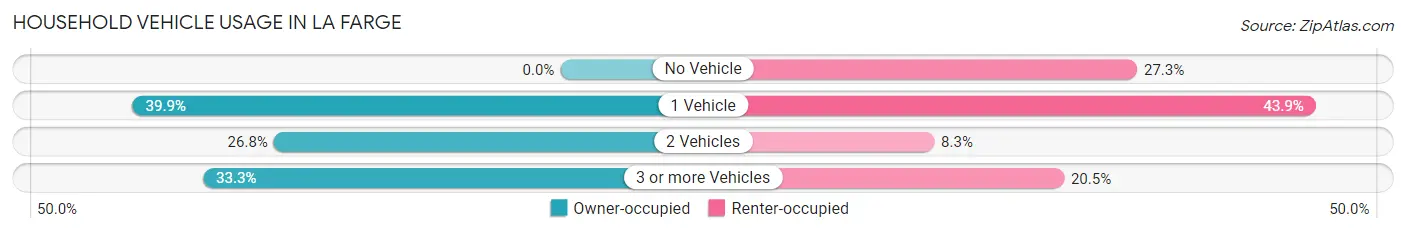
| Vehicles per Household | Owner-occupied | Renter-occupied |
| No Vehicle | 0 (0.0%) | 36 (27.3%) |
| 1 Vehicle | 91 (39.9%) | 58 (43.9%) |
| 2 Vehicles | 61 (26.8%) | 11 (8.3%) |
| 3 or more Vehicles | 76 (33.3%) | 27 (20.4%) |
| Total | 228 (100.0%) | 132 (100.0%) |
Real Estate & Mortgages in La Farge
Real Estate and Mortgage Overview in La Farge
| Characteristic | Without Mortgage | With Mortgage |
| Housing Units | 87 | 141 |
| Median Property Value | $81,000 | $123,400 |
| Median Household Income | $44,583 | $4 |
| Monthly Housing Costs | $439 | $0 |
| Real Estate Taxes | $1,321 | $0 |
Property Value by Mortgage Status in La Farge
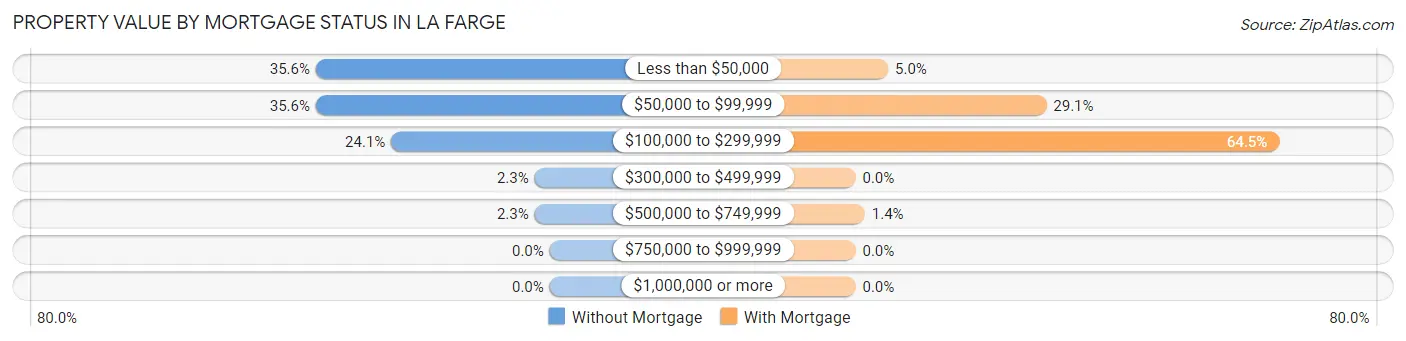
| Property Value | Without Mortgage | With Mortgage |
| Less than $50,000 | 31 (35.6%) | 7 (5.0%) |
| $50,000 to $99,999 | 31 (35.6%) | 41 (29.1%) |
| $100,000 to $299,999 | 21 (24.1%) | 91 (64.5%) |
| $300,000 to $499,999 | 2 (2.3%) | 0 (0.0%) |
| $500,000 to $749,999 | 2 (2.3%) | 2 (1.4%) |
| $750,000 to $999,999 | 0 (0.0%) | 0 (0.0%) |
| $1,000,000 or more | 0 (0.0%) | 0 (0.0%) |
| Total | 87 (100.0%) | 141 (100.0%) |
Household Income by Mortgage Status in La Farge
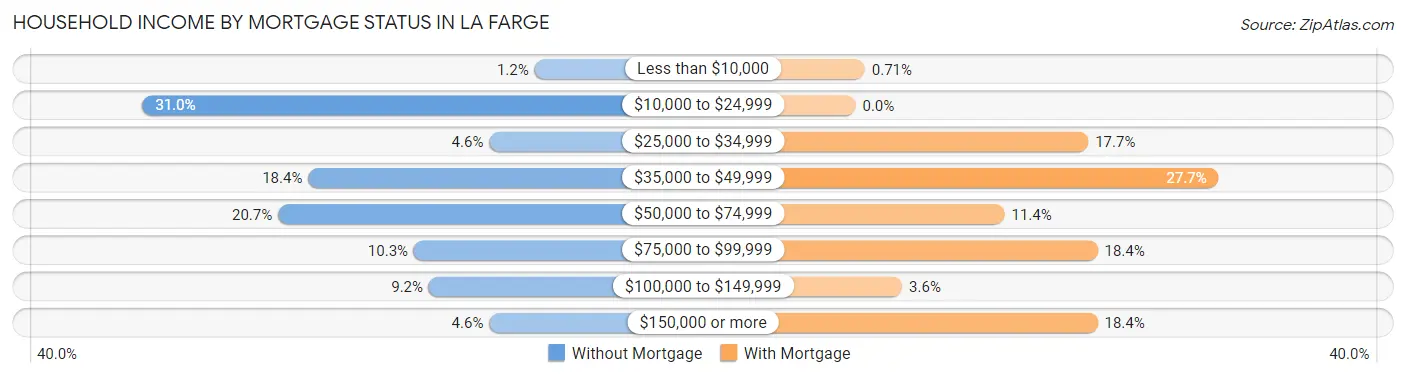
| Household Income | Without Mortgage | With Mortgage |
| Less than $10,000 | 1 (1.1%) | 1 (0.7%) |
| $10,000 to $24,999 | 27 (31.0%) | 0 (0.0%) |
| $25,000 to $34,999 | 4 (4.6%) | 25 (17.7%) |
| $35,000 to $49,999 | 16 (18.4%) | 39 (27.7%) |
| $50,000 to $74,999 | 18 (20.7%) | 16 (11.4%) |
| $75,000 to $99,999 | 9 (10.3%) | 26 (18.4%) |
| $100,000 to $149,999 | 8 (9.2%) | 5 (3.5%) |
| $150,000 or more | 4 (4.6%) | 26 (18.4%) |
| Total | 87 (100.0%) | 141 (100.0%) |
Property Value to Household Income Ratio in La Farge
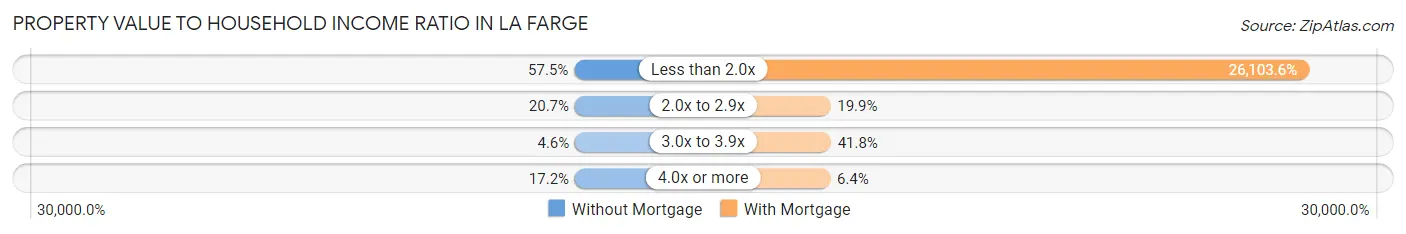
| Value-to-Income Ratio | Without Mortgage | With Mortgage |
| Less than 2.0x | 50 (57.5%) | 36,806 (26,103.6%) |
| 2.0x to 2.9x | 18 (20.7%) | 28 (19.9%) |
| 3.0x to 3.9x | 4 (4.6%) | 59 (41.8%) |
| 4.0x or more | 15 (17.2%) | 9 (6.4%) |
| Total | 87 (100.0%) | 141 (100.0%) |
Real Estate Taxes by Mortgage Status in La Farge
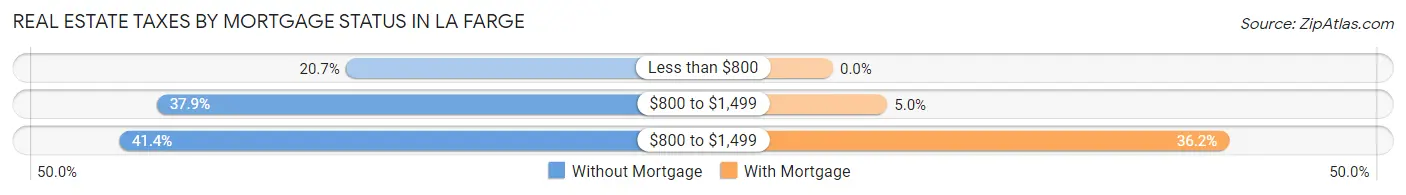
| Property Taxes | Without Mortgage | With Mortgage |
| Less than $800 | 18 (20.7%) | 0 (0.0%) |
| $800 to $1,499 | 33 (37.9%) | 7 (5.0%) |
| $800 to $1,499 | 36 (41.4%) | 51 (36.2%) |
| Total | 87 (100.0%) | 141 (100.0%) |
Health & Disability in La Farge
Health Insurance Coverage by Age in La Farge
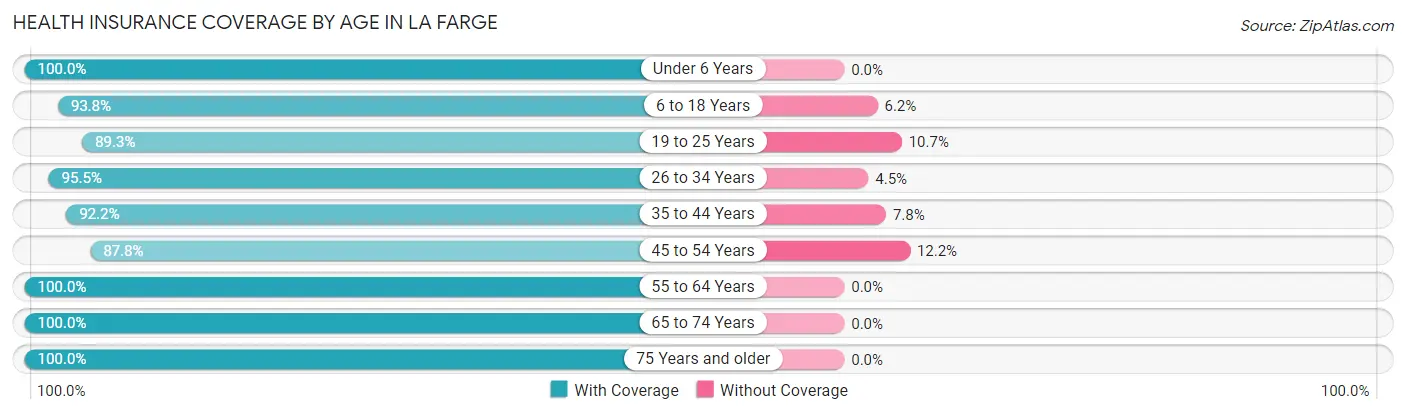
| Age Bracket | With Coverage | Without Coverage |
| Under 6 Years | 44 (100.0%) | 0 (0.0%) |
| 6 to 18 Years | 121 (93.8%) | 8 (6.2%) |
| 19 to 25 Years | 25 (89.3%) | 3 (10.7%) |
| 26 to 34 Years | 85 (95.5%) | 4 (4.5%) |
| 35 to 44 Years | 95 (92.2%) | 8 (7.8%) |
| 45 to 54 Years | 43 (87.8%) | 6 (12.2%) |
| 55 to 64 Years | 110 (100.0%) | 0 (0.0%) |
| 65 to 74 Years | 125 (100.0%) | 0 (0.0%) |
| 75 Years and older | 73 (100.0%) | 0 (0.0%) |
| Total | 721 (96.1%) | 29 (3.9%) |
Health Insurance Coverage by Citizenship Status in La Farge
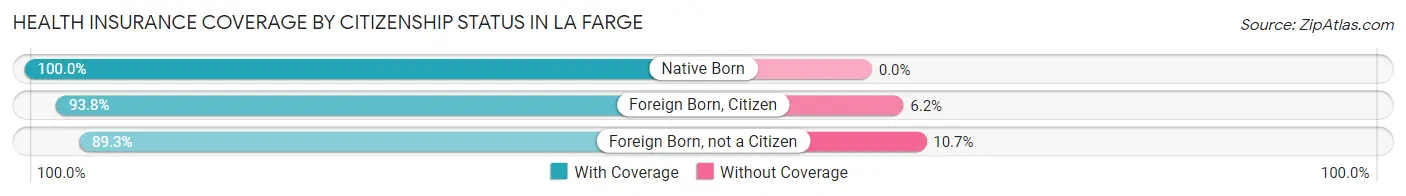
| Citizenship Status | With Coverage | Without Coverage |
| Native Born | 44 (100.0%) | 0 (0.0%) |
| Foreign Born, Citizen | 121 (93.8%) | 8 (6.2%) |
| Foreign Born, not a Citizen | 25 (89.3%) | 3 (10.7%) |
Health Insurance Coverage by Household Income in La Farge
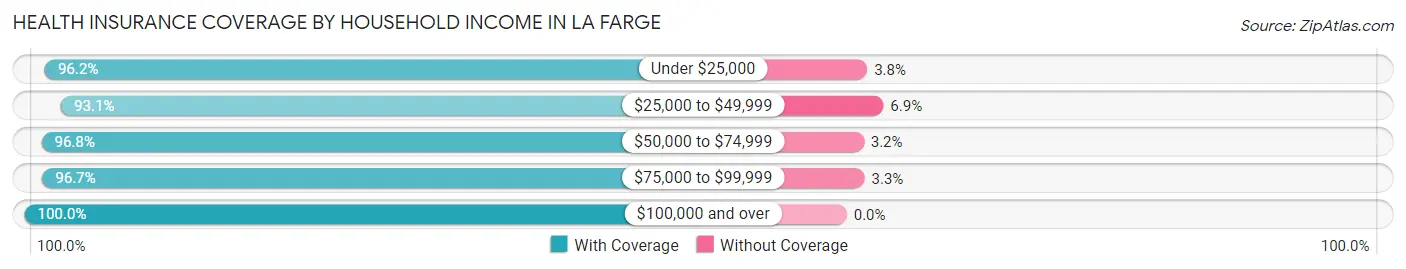
| Household Income | With Coverage | Without Coverage |
| Under $25,000 | 201 (96.2%) | 8 (3.8%) |
| $25,000 to $49,999 | 190 (93.1%) | 14 (6.9%) |
| $50,000 to $74,999 | 152 (96.8%) | 5 (3.2%) |
| $75,000 to $99,999 | 58 (96.7%) | 2 (3.3%) |
| $100,000 and over | 92 (100.0%) | 0 (0.0%) |
Public vs Private Health Insurance Coverage by Age in La Farge
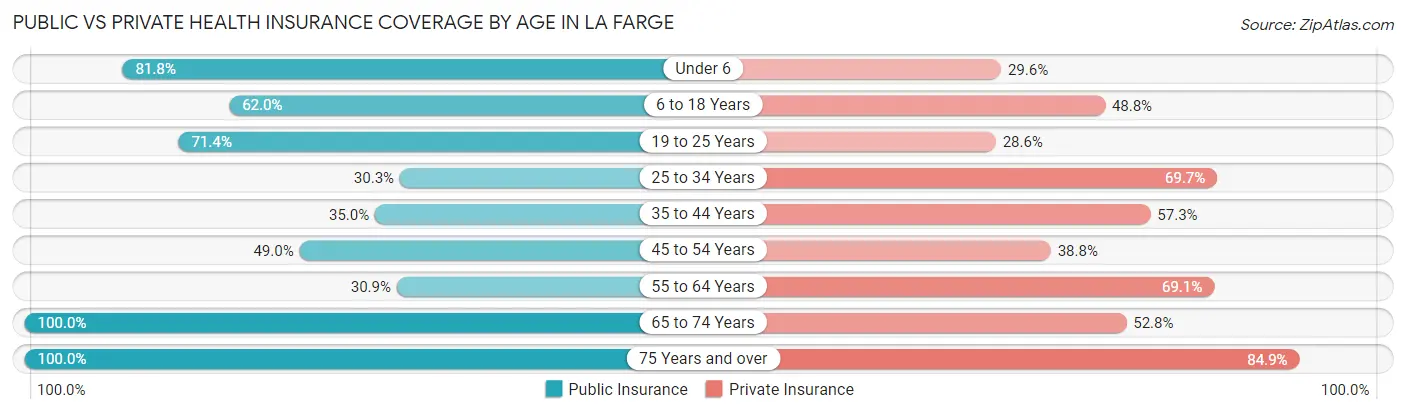
| Age Bracket | Public Insurance | Private Insurance |
| Under 6 | 36 (81.8%) | 13 (29.5%) |
| 6 to 18 Years | 80 (62.0%) | 63 (48.8%) |
| 19 to 25 Years | 20 (71.4%) | 8 (28.6%) |
| 25 to 34 Years | 27 (30.3%) | 62 (69.7%) |
| 35 to 44 Years | 36 (34.9%) | 59 (57.3%) |
| 45 to 54 Years | 24 (49.0%) | 19 (38.8%) |
| 55 to 64 Years | 34 (30.9%) | 76 (69.1%) |
| 65 to 74 Years | 125 (100.0%) | 66 (52.8%) |
| 75 Years and over | 73 (100.0%) | 62 (84.9%) |
| Total | 455 (60.7%) | 428 (57.1%) |
Disability Status by Sex by Age in La Farge
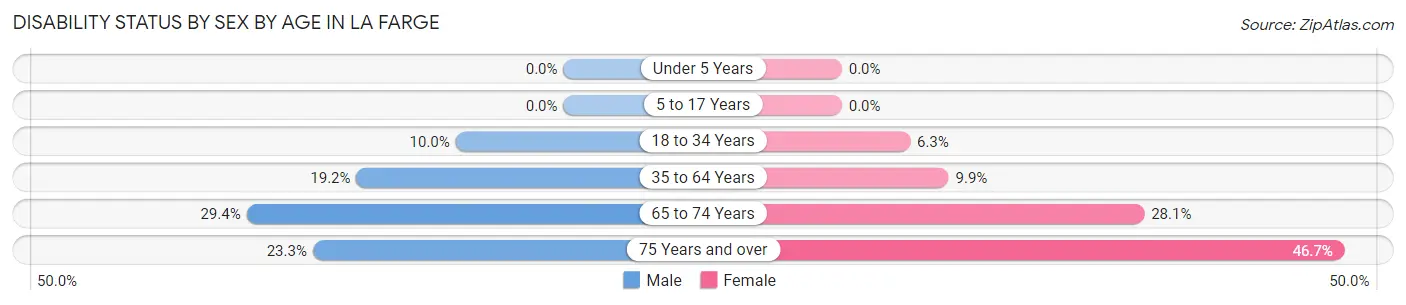
| Age Bracket | Male | Female |
| Under 5 Years | 0 (0.0%) | 0 (0.0%) |
| 5 to 17 Years | 0 (0.0%) | 0 (0.0%) |
| 18 to 34 Years | 4 (10.0%) | 5 (6.3%) |
| 35 to 64 Years | 29 (19.2%) | 11 (9.9%) |
| 65 to 74 Years | 20 (29.4%) | 16 (28.1%) |
| 75 Years and over | 10 (23.3%) | 14 (46.7%) |
Disability Class by Sex by Age in La Farge
Disability Class: Hearing Difficulty
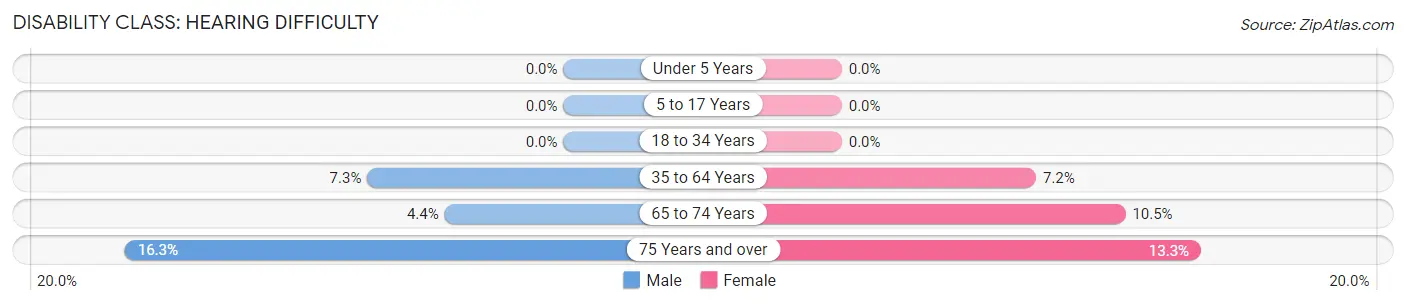
| Age Bracket | Male | Female |
| Under 5 Years | 0 (0.0%) | 0 (0.0%) |
| 5 to 17 Years | 0 (0.0%) | 0 (0.0%) |
| 18 to 34 Years | 0 (0.0%) | 0 (0.0%) |
| 35 to 64 Years | 11 (7.3%) | 8 (7.2%) |
| 65 to 74 Years | 3 (4.4%) | 6 (10.5%) |
| 75 Years and over | 7 (16.3%) | 4 (13.3%) |
Disability Class: Vision Difficulty
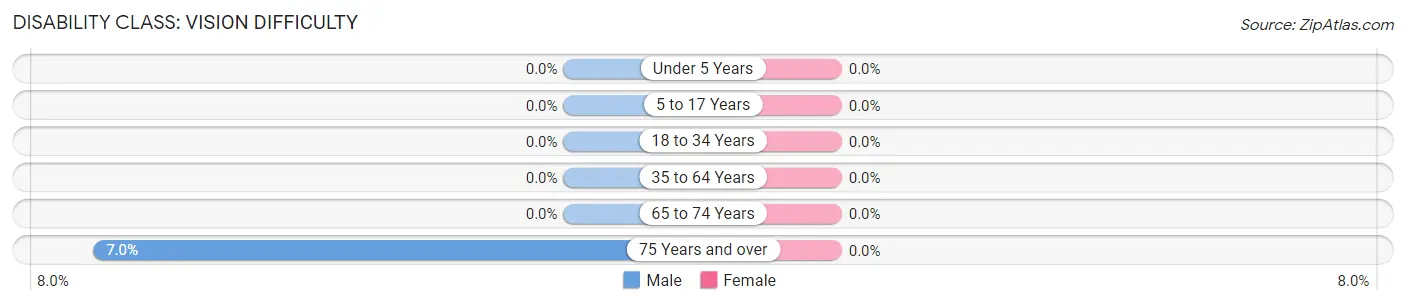
| Age Bracket | Male | Female |
| Under 5 Years | 0 (0.0%) | 0 (0.0%) |
| 5 to 17 Years | 0 (0.0%) | 0 (0.0%) |
| 18 to 34 Years | 0 (0.0%) | 0 (0.0%) |
| 35 to 64 Years | 0 (0.0%) | 0 (0.0%) |
| 65 to 74 Years | 0 (0.0%) | 0 (0.0%) |
| 75 Years and over | 3 (7.0%) | 0 (0.0%) |
Disability Class: Cognitive Difficulty
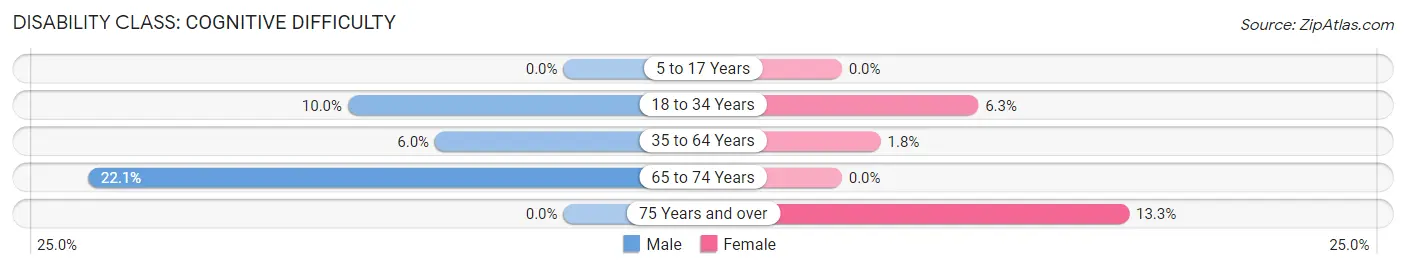
| Age Bracket | Male | Female |
| 5 to 17 Years | 0 (0.0%) | 0 (0.0%) |
| 18 to 34 Years | 4 (10.0%) | 5 (6.3%) |
| 35 to 64 Years | 9 (6.0%) | 2 (1.8%) |
| 65 to 74 Years | 15 (22.1%) | 0 (0.0%) |
| 75 Years and over | 0 (0.0%) | 4 (13.3%) |
Disability Class: Ambulatory Difficulty
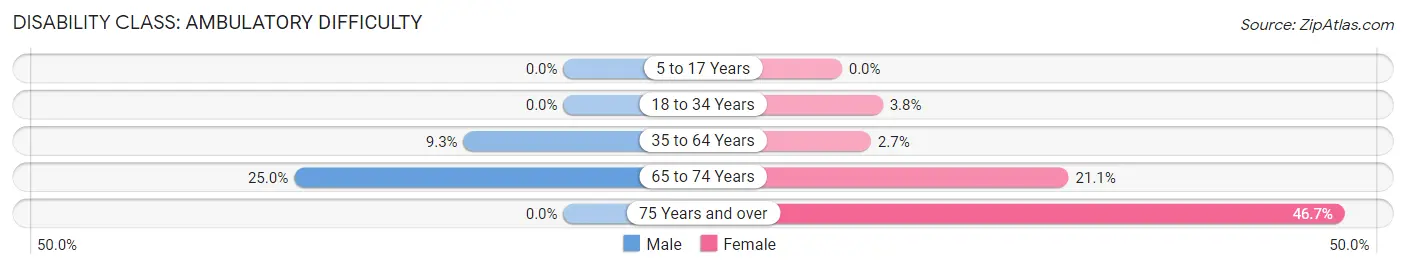
| Age Bracket | Male | Female |
| 5 to 17 Years | 0 (0.0%) | 0 (0.0%) |
| 18 to 34 Years | 0 (0.0%) | 3 (3.8%) |
| 35 to 64 Years | 14 (9.3%) | 3 (2.7%) |
| 65 to 74 Years | 17 (25.0%) | 12 (21.0%) |
| 75 Years and over | 0 (0.0%) | 14 (46.7%) |
Disability Class: Self-Care Difficulty
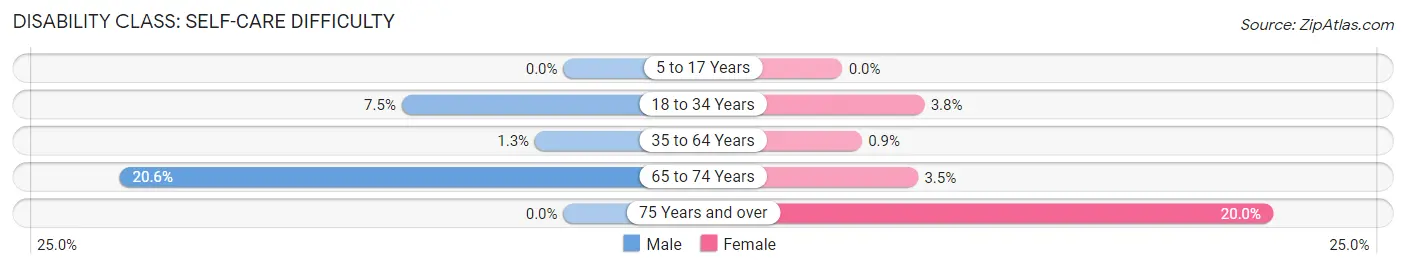
| Age Bracket | Male | Female |
| 5 to 17 Years | 0 (0.0%) | 0 (0.0%) |
| 18 to 34 Years | 3 (7.5%) | 3 (3.8%) |
| 35 to 64 Years | 2 (1.3%) | 1 (0.9%) |
| 65 to 74 Years | 14 (20.6%) | 2 (3.5%) |
| 75 Years and over | 0 (0.0%) | 6 (20.0%) |
Technology Access in La Farge
Computing Device Access in La Farge
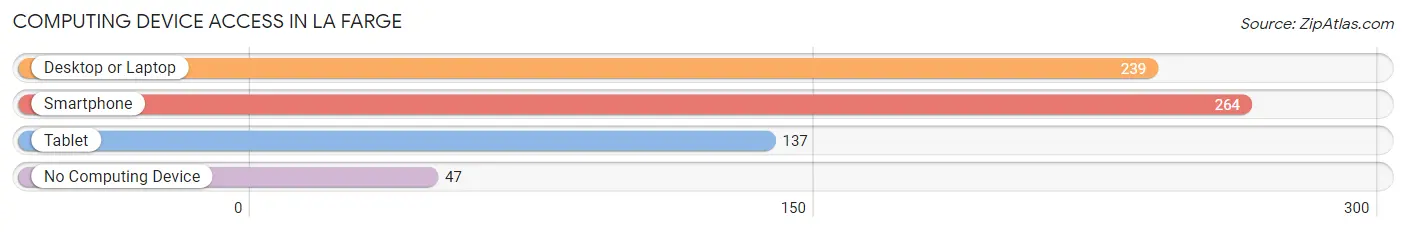
| Device Type | # Households | % Households |
| Desktop or Laptop | 239 | 66.4% |
| Smartphone | 264 | 73.3% |
| Tablet | 137 | 38.1% |
| No Computing Device | 47 | 13.1% |
| Total | 360 | 100.0% |
Internet Access in La Farge
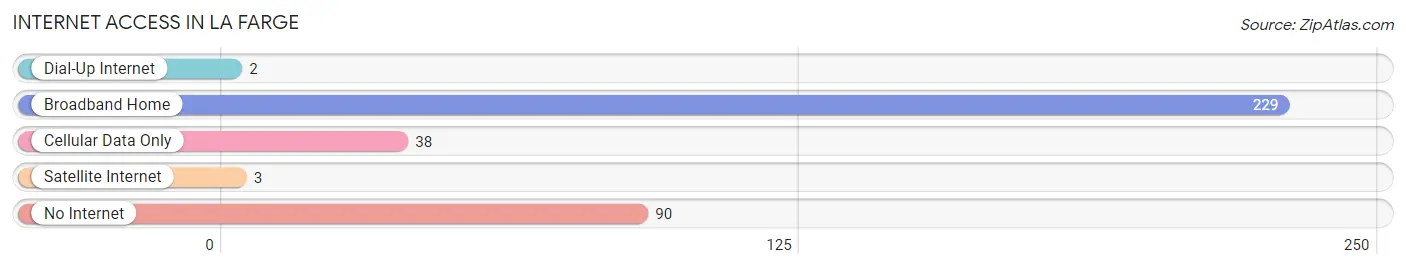
| Internet Type | # Households | % Households |
| Dial-Up Internet | 2 | 0.6% |
| Broadband Home | 229 | 63.6% |
| Cellular Data Only | 38 | 10.6% |
| Satellite Internet | 3 | 0.8% |
| No Internet | 90 | 25.0% |
| Total | 360 | 100.0% |
La Farge Summary
La Farge is a village located in the southwestern corner of Wisconsin in the United States. It is situated in the Kickapoo Valley, which is part of the Driftless Area of the Midwest. The village is located in the town of La Farge, which is part of the larger Vernon County. The village is home to a population of approximately 1,000 people, and the town has a population of around 2,000.
History
The area that is now La Farge was first settled in the early 1800s by French-Canadian fur traders. The village was officially founded in 1845 by a group of settlers from New York. The village was named after the La Farge family, who were prominent in the area. The village was incorporated in 1876.
In the late 1800s, the village was a major center for the lumber industry. The Kickapoo Valley was home to many sawmills, and the village was a major hub for the industry. The village also had a thriving agricultural industry, and it was home to several cheese factories.
In the early 1900s, the village began to decline as the lumber industry moved away. The village was also affected by the Great Depression, and many of the businesses in the village closed. The village was revitalized in the 1950s with the construction of the La Farge Dam. The dam was built to provide hydroelectric power to the area, and it also created a recreational lake.
Geography
La Farge is located in the southwestern corner of Wisconsin in the Kickapoo Valley. The village is situated on the banks of the Kickapoo River, and it is surrounded by rolling hills and bluffs. The village is located in the Driftless Area, which is characterized by its rugged terrain and lack of glacial activity.
The village is located approximately 30 miles from the Wisconsin-Minnesota border, and it is about 90 miles from the Wisconsin-Illinois border. The village is located about 60 miles from Madison, Wisconsin, and it is about 120 miles from Minneapolis, Minnesota.
Economy
The economy of La Farge is largely based on agriculture and tourism. The village is home to several dairy farms, and it is also home to a number of small businesses. The village is also a popular tourist destination, and it is home to several campgrounds and recreational areas.
The village is also home to a number of manufacturing businesses, including a furniture factory and a woodworking shop. The village is also home to a number of small retail businesses, including a grocery store and a hardware store.
Demographics
As of the 2010 census, the population of La Farge was 1,000. The racial makeup of the village was 97.2% White, 0.7% African American, 0.3% Native American, 0.2% Asian, 0.1% Pacific Islander, and 1.5% from other races. Hispanic or Latino of any race were 1.5% of the population.
The median household income in La Farge was $37,500, and the median family income was $45,000. The per capita income in the village was $18,000. About 10.3% of the population was below the poverty line.
La Farge is a small village with a rich history and a vibrant economy. The village is home to a diverse population, and it is a popular tourist destination. The village is also home to a number of small businesses, and it is a great place to live and work.
Common Questions
What is Per Capita Income in La Farge?
Per Capita income in La Farge is $35,998.
What is the Median Family Income in La Farge?
Median Family Income in La Farge is $46,563.
What is the Median Household income in La Farge?
Median Household Income in La Farge is $34,792.
What is Income or Wage Gap in La Farge?
Income or Wage Gap in La Farge is 40.2%.
Women in La Farge earn 59.8 cents for every dollar earned by a man.
What is Family Income Deficit in La Farge?
Family Income Deficit in La Farge is $6,325.
Families that are below poverty line in La Farge earn $6,325 less on average than the poverty threshold level.
What is Inequality or Gini Index in La Farge?
Inequality or Gini Index in La Farge is 0.42.
What is the Total Population of La Farge?
Total Population of La Farge is 750.
What is the Total Male Population of La Farge?
Total Male Population of La Farge is 383.
What is the Total Female Population of La Farge?
Total Female Population of La Farge is 367.
What is the Ratio of Males per 100 Females in La Farge?
There are 104.36 Males per 100 Females in La Farge.
What is the Ratio of Females per 100 Males in La Farge?
There are 95.82 Females per 100 Males in La Farge.
What is the Median Population Age in La Farge?
Median Population Age in La Farge is 42.6 Years.
What is the Average Family Size in La Farge
Average Family Size in La Farge is 2.8 People.
What is the Average Household Size in La Farge
Average Household Size in La Farge is 2.0 People.
How Large is the Labor Force in La Farge?
There are 287 People in the Labor Forcein in La Farge.
What is the Percentage of People in the Labor Force in La Farge?
48.4% of People are in the Labor Force in La Farge.
What is the Unemployment Rate in La Farge?
Unemployment Rate in La Farge is 6.6%.