Krakow, WI Map & Demographics
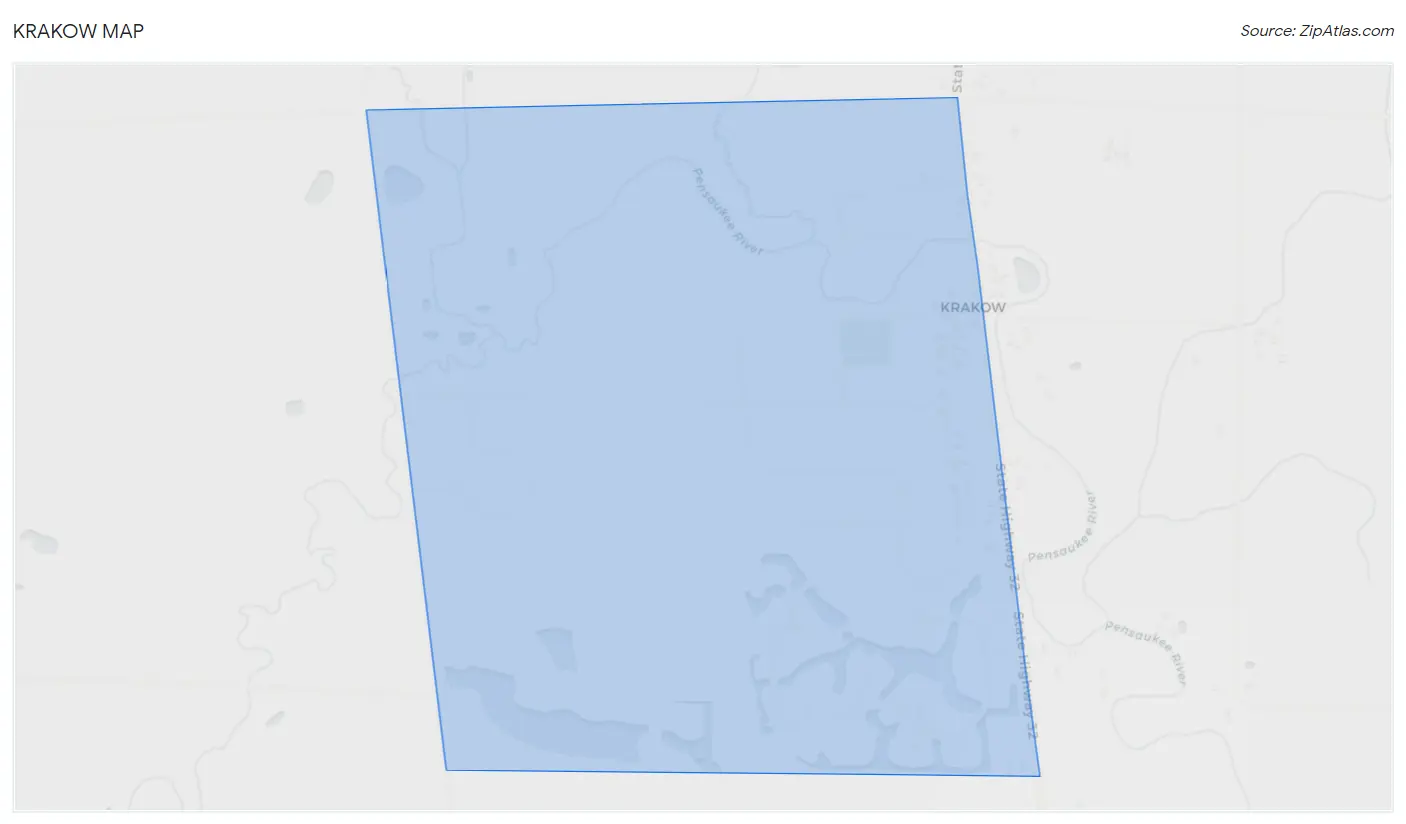
Krakow Map
Krakow Overview
$42,044
PER CAPITA INCOME
$91,667
AVG FAMILY INCOME
$93,365
AVG HOUSEHOLD INCOME
30.2%
WAGE / INCOME GAP [ % ]
69.8¢/ $1
WAGE / INCOME GAP [ $ ]
0.34
INEQUALITY / GINI INDEX
320
TOTAL POPULATION
164
MALE POPULATION
156
FEMALE POPULATION
105.13
MALES / 100 FEMALES
95.12
FEMALES / 100 MALES
38.3
MEDIAN AGE
2.9
AVG FAMILY SIZE
2.4
AVG HOUSEHOLD SIZE
175
LABOR FORCE [ PEOPLE ]
69.4%
PERCENT IN LABOR FORCE
Krakow Zip Codes
Krakow Area Codes
Income in Krakow
Income Overview in Krakow
Per Capita Income in Krakow is $42,044, while median incomes of families and households are $91,667 and $93,365 respectively.
| Characteristic | Number | Measure |
| Per Capita Income | 320 | $42,044 |
| Median Family Income | 86 | $91,667 |
| Mean Family Income | 86 | $113,022 |
| Median Household Income | 133 | $93,365 |
| Mean Household Income | 133 | $100,074 |
| Income Deficit | 86 | $0 |
| Wage / Income Gap (%) | 320 | 30.19% |
| Wage / Income Gap ($) | 320 | 69.81¢ per $1 |
| Gini / Inequality Index | 320 | 0.34 |
Earnings by Sex in Krakow
Average Earnings in Krakow are $58,304, $66,250 for men and $46,250 for women, a difference of 30.2%.
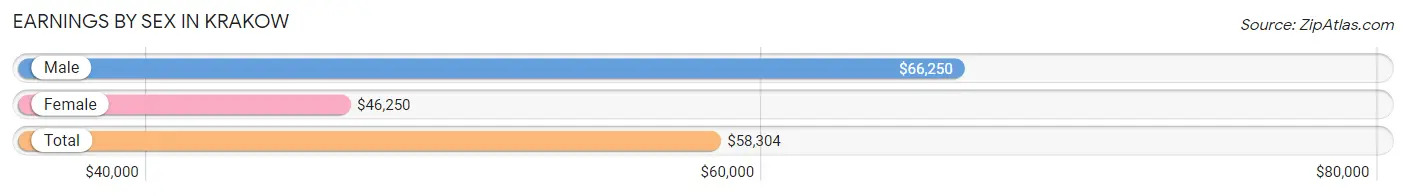
| Sex | Number | Average Earnings |
| Male | 105 (60.0%) | $66,250 |
| Female | 70 (40.0%) | $46,250 |
| Total | 175 (100.0%) | $58,304 |
Earnings by Sex by Income Bracket in Krakow
The most common earnings brackets in Krakow are $75,000 to $99,999 for men (23 | 21.9%) and $40,000 to $44,999 for women (19 | 27.1%).
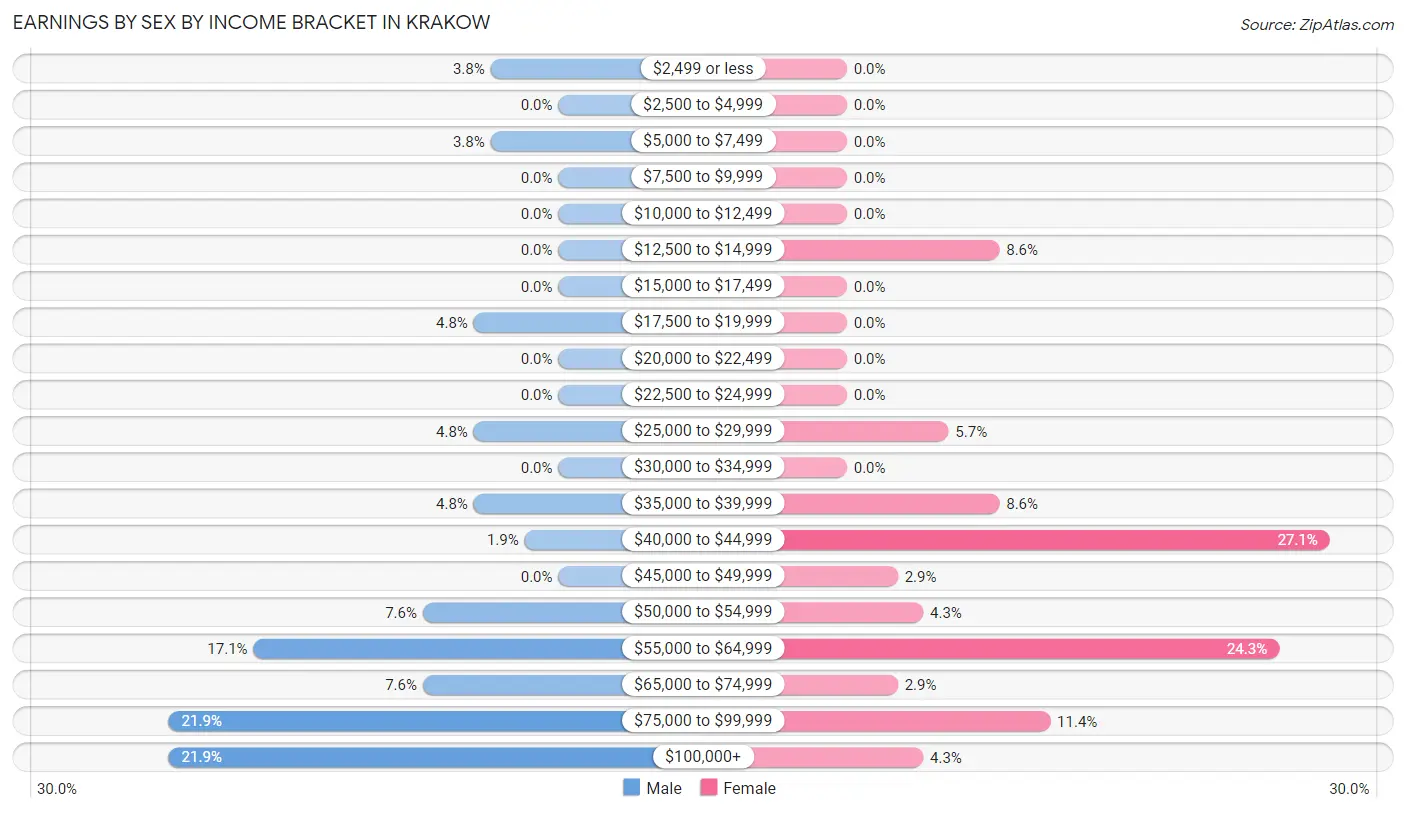
| Income | Male | Female |
| $2,499 or less | 4 (3.8%) | 0 (0.0%) |
| $2,500 to $4,999 | 0 (0.0%) | 0 (0.0%) |
| $5,000 to $7,499 | 4 (3.8%) | 0 (0.0%) |
| $7,500 to $9,999 | 0 (0.0%) | 0 (0.0%) |
| $10,000 to $12,499 | 0 (0.0%) | 0 (0.0%) |
| $12,500 to $14,999 | 0 (0.0%) | 6 (8.6%) |
| $15,000 to $17,499 | 0 (0.0%) | 0 (0.0%) |
| $17,500 to $19,999 | 5 (4.8%) | 0 (0.0%) |
| $20,000 to $22,499 | 0 (0.0%) | 0 (0.0%) |
| $22,500 to $24,999 | 0 (0.0%) | 0 (0.0%) |
| $25,000 to $29,999 | 5 (4.8%) | 4 (5.7%) |
| $30,000 to $34,999 | 0 (0.0%) | 0 (0.0%) |
| $35,000 to $39,999 | 5 (4.8%) | 6 (8.6%) |
| $40,000 to $44,999 | 2 (1.9%) | 19 (27.1%) |
| $45,000 to $49,999 | 0 (0.0%) | 2 (2.9%) |
| $50,000 to $54,999 | 8 (7.6%) | 3 (4.3%) |
| $55,000 to $64,999 | 18 (17.1%) | 17 (24.3%) |
| $65,000 to $74,999 | 8 (7.6%) | 2 (2.9%) |
| $75,000 to $99,999 | 23 (21.9%) | 8 (11.4%) |
| $100,000+ | 23 (21.9%) | 3 (4.3%) |
| Total | 105 (100.0%) | 70 (100.0%) |
Earnings by Sex by Educational Attainment in Krakow
Average earnings in Krakow are $67,083 for men and $54,583 for women, a difference of 18.6%. Men with an educational attainment of high school diploma enjoy the highest average annual earnings of $61,667, while those with college or associate's degree education earn the least with $58,750. Women with an educational attainment of college or associate's degree earn the most with the average annual earnings of $59,107, while those with high school diploma education have the smallest earnings of $43,542.
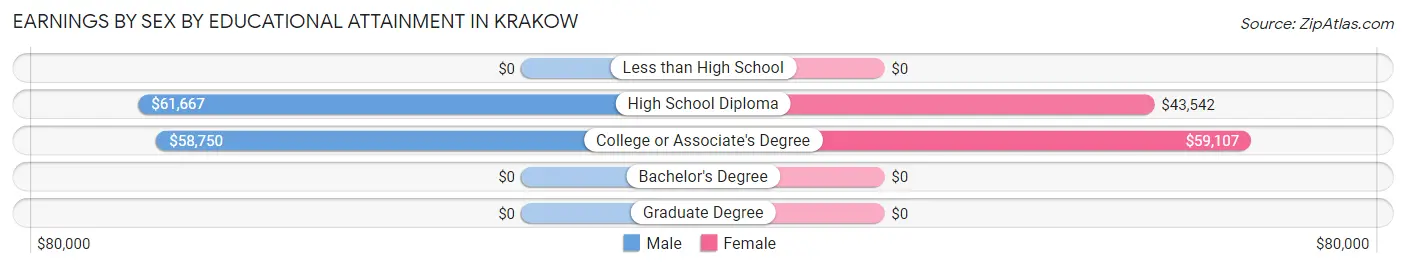
| Educational Attainment | Male Income | Female Income |
| Less than High School | - | - |
| High School Diploma | $61,667 | $43,542 |
| College or Associate's Degree | $58,750 | $59,107 |
| Bachelor's Degree | - | - |
| Graduate Degree | - | - |
| Total | $67,083 | $54,583 |
Family Income in Krakow
Family Income Brackets in Krakow
According to the Krakow family income data, there are 21 families falling into the $75,000 to $99,999 income range, which is the most common income bracket and makes up 24.4% of all families.
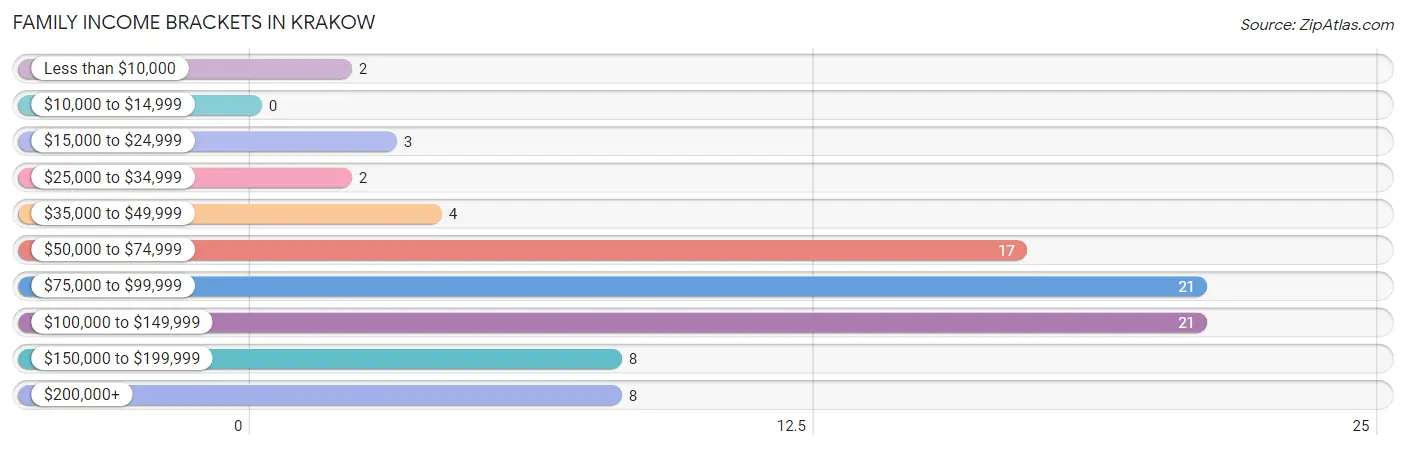
| Income Bracket | # Families | % Families |
| Less than $10,000 | 2 | 2.3% |
| $10,000 to $14,999 | 0 | 0.0% |
| $15,000 to $24,999 | 3 | 3.5% |
| $25,000 to $34,999 | 2 | 2.3% |
| $35,000 to $49,999 | 4 | 4.7% |
| $50,000 to $74,999 | 17 | 19.8% |
| $75,000 to $99,999 | 21 | 24.4% |
| $100,000 to $149,999 | 21 | 24.4% |
| $150,000 to $199,999 | 8 | 9.3% |
| $200,000+ | 8 | 9.3% |
Family Income by Famaliy Size in Krakow
4-person families (22 | 25.6%) account for the highest median family income in Krakow with $118,438 per family, while 2-person families (52 | 60.5%) have the highest median income of $37,969 per family member.
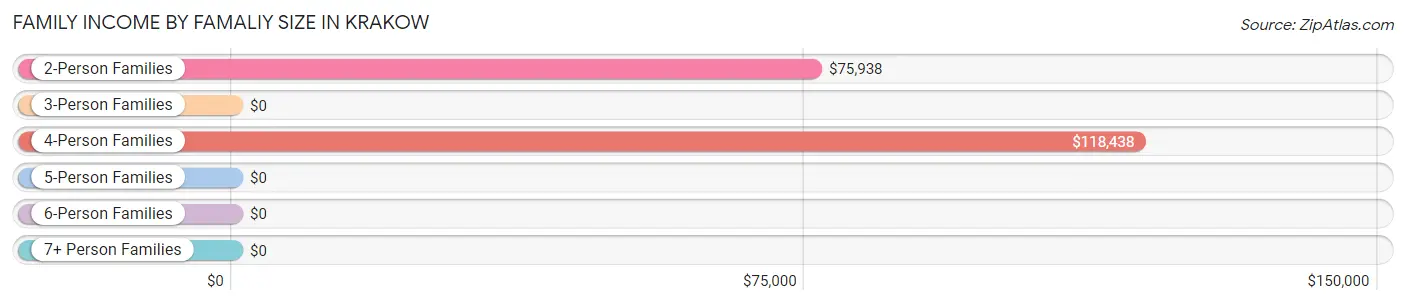
| Income Bracket | # Families | Median Income |
| 2-Person Families | 52 (60.5%) | $75,938 |
| 3-Person Families | 6 (7.0%) | $0 |
| 4-Person Families | 22 (25.6%) | $118,438 |
| 5-Person Families | 0 (0.0%) | $0 |
| 6-Person Families | 6 (7.0%) | $0 |
| 7+ Person Families | 0 (0.0%) | $0 |
| Total | 86 (100.0%) | $91,667 |
Family Income by Number of Earners in Krakow
The median family income in Krakow is $91,667, with families comprising 3+ earners (12) having the highest median family income of $178,125, while families with no earners (15) have the lowest median family income of $60,625, accounting for 14.0% and 17.4% of families, respectively.
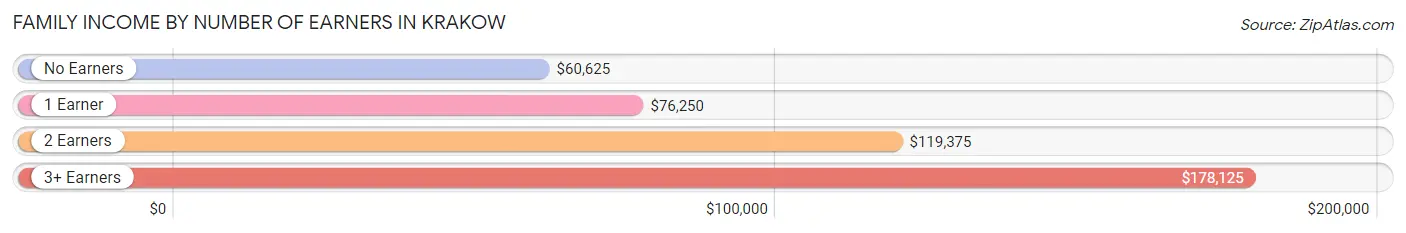
| Number of Earners | # Families | Median Income |
| No Earners | 15 (17.4%) | $60,625 |
| 1 Earner | 37 (43.0%) | $76,250 |
| 2 Earners | 22 (25.6%) | $119,375 |
| 3+ Earners | 12 (14.0%) | $178,125 |
| Total | 86 (100.0%) | $91,667 |
Household Income in Krakow
Household Income Brackets in Krakow
With 41 households falling in the category, the $75,000 to $99,999 income range is the most frequent in Krakow, accounting for 30.8% of all households.
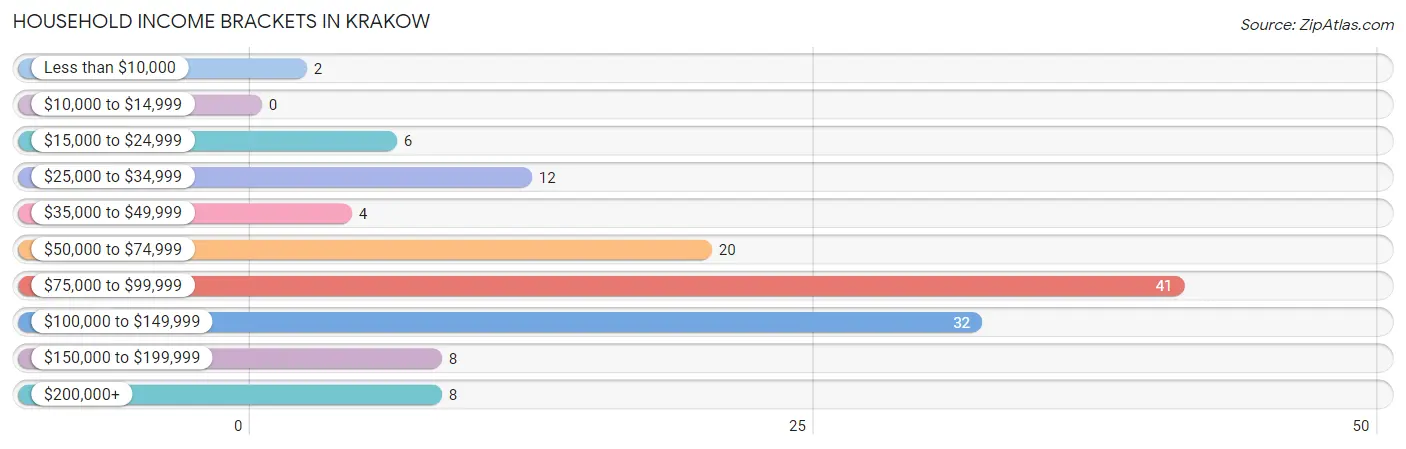
| Income Bracket | # Households | % Households |
| Less than $10,000 | 2 | 1.5% |
| $10,000 to $14,999 | 0 | 0.0% |
| $15,000 to $24,999 | 6 | 4.5% |
| $25,000 to $34,999 | 12 | 9.0% |
| $35,000 to $49,999 | 4 | 3.0% |
| $50,000 to $74,999 | 20 | 15.0% |
| $75,000 to $99,999 | 41 | 30.8% |
| $100,000 to $149,999 | 32 | 24.1% |
| $150,000 to $199,999 | 8 | 6.0% |
| $200,000+ | 8 | 6.0% |
Household Income by Householder Age in Krakow
The median household income in Krakow is $93,365, with the highest median household income of $98,333 found in the 25 to 44 years age bracket for the primary householder. A total of 54 households (40.6%) fall into this category.
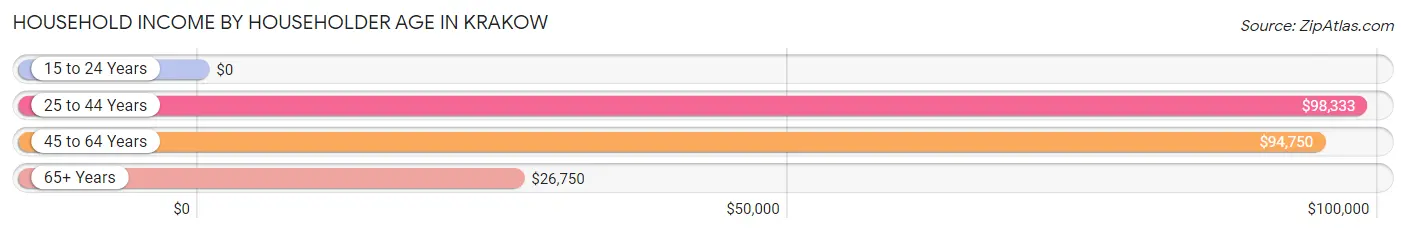
| Income Bracket | # Households | Median Income |
| 15 to 24 Years | 0 (0.0%) | $0 |
| 25 to 44 Years | 54 (40.6%) | $98,333 |
| 45 to 64 Years | 49 (36.8%) | $94,750 |
| 65+ Years | 30 (22.6%) | $26,750 |
| Total | 133 (100.0%) | $93,365 |
Poverty in Krakow
Income Below Poverty by Sex and Age in Krakow
With 1.2% poverty level for males and 4.5% for females among the residents of Krakow, 75 year old and over males and 75 year old and over females are the most vulnerable to poverty, with 2 males (28.6%) and 3 females (25.0%) in their respective age groups living below the poverty level.
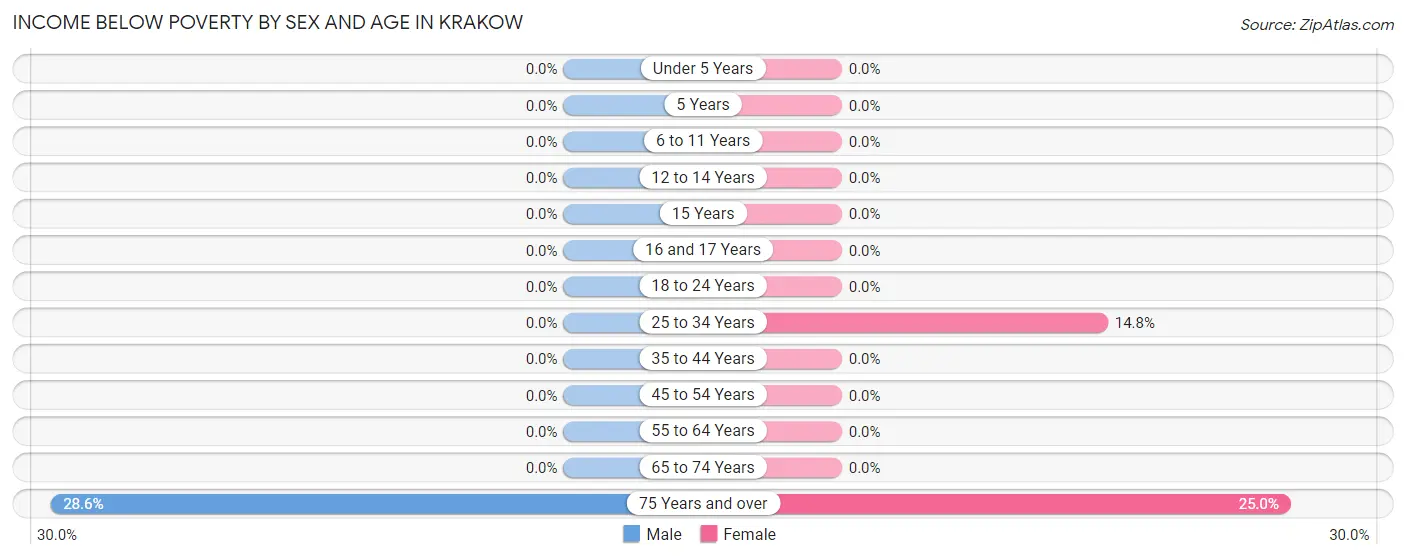
| Age Bracket | Male | Female |
| Under 5 Years | 0 (0.0%) | 0 (0.0%) |
| 5 Years | 0 (0.0%) | 0 (0.0%) |
| 6 to 11 Years | 0 (0.0%) | 0 (0.0%) |
| 12 to 14 Years | 0 (0.0%) | 0 (0.0%) |
| 15 Years | 0 (0.0%) | 0 (0.0%) |
| 16 and 17 Years | 0 (0.0%) | 0 (0.0%) |
| 18 to 24 Years | 0 (0.0%) | 0 (0.0%) |
| 25 to 34 Years | 0 (0.0%) | 4 (14.8%) |
| 35 to 44 Years | 0 (0.0%) | 0 (0.0%) |
| 45 to 54 Years | 0 (0.0%) | 0 (0.0%) |
| 55 to 64 Years | 0 (0.0%) | 0 (0.0%) |
| 65 to 74 Years | 0 (0.0%) | 0 (0.0%) |
| 75 Years and over | 2 (28.6%) | 3 (25.0%) |
| Total | 2 (1.2%) | 7 (4.5%) |
Income Above Poverty by Sex and Age in Krakow
According to the poverty statistics in Krakow, males aged 5 years and females aged under 5 years are the age groups that are most secure financially, with 100.0% of males and 100.0% of females in these age groups living above the poverty line.
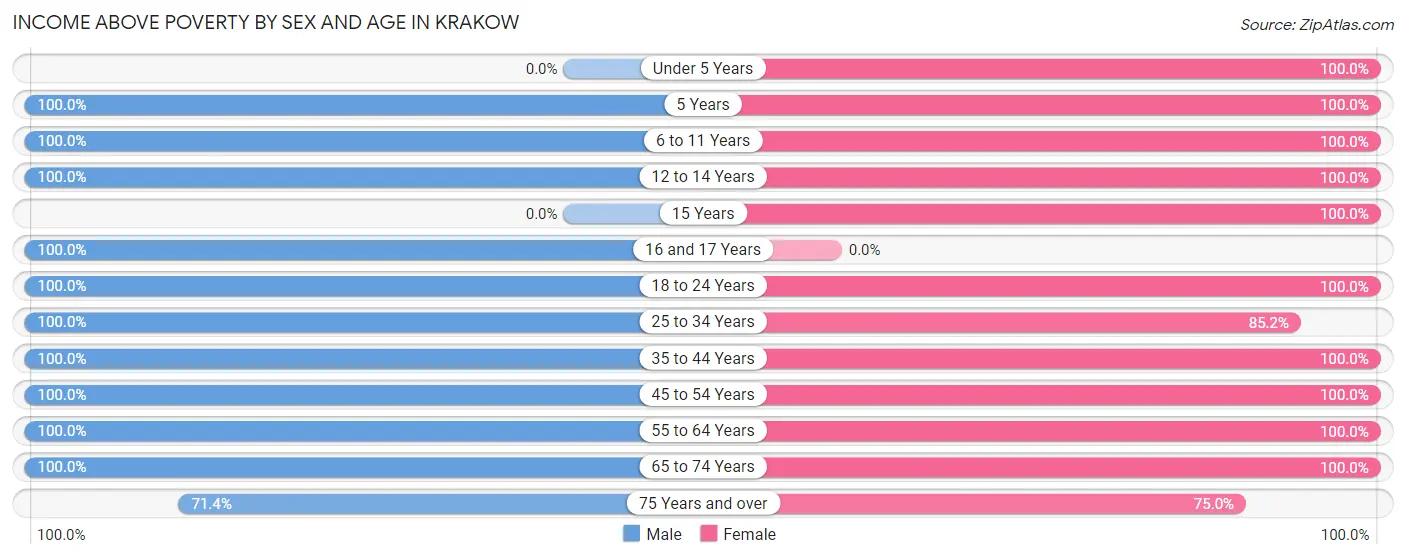
| Age Bracket | Male | Female |
| Under 5 Years | 0 (0.0%) | 6 (100.0%) |
| 5 Years | 3 (100.0%) | 4 (100.0%) |
| 6 to 11 Years | 20 (100.0%) | 11 (100.0%) |
| 12 to 14 Years | 10 (100.0%) | 10 (100.0%) |
| 15 Years | 0 (0.0%) | 4 (100.0%) |
| 16 and 17 Years | 4 (100.0%) | 0 (0.0%) |
| 18 to 24 Years | 10 (100.0%) | 9 (100.0%) |
| 25 to 34 Years | 30 (100.0%) | 23 (85.2%) |
| 35 to 44 Years | 19 (100.0%) | 24 (100.0%) |
| 45 to 54 Years | 21 (100.0%) | 16 (100.0%) |
| 55 to 64 Years | 31 (100.0%) | 11 (100.0%) |
| 65 to 74 Years | 9 (100.0%) | 22 (100.0%) |
| 75 Years and over | 5 (71.4%) | 9 (75.0%) |
| Total | 162 (98.8%) | 149 (95.5%) |
Income Below Poverty Among Married-Couple Families in Krakow
The poverty statistics for married-couple families in Krakow show that 2.9% or 2 of the total 68 families live below the poverty line. Families with no children have the highest poverty rate of 4.6%, comprising of 2 families. On the other hand, families with 1 or 2 children have the lowest poverty rate of 0.0%, which includes 0 families.
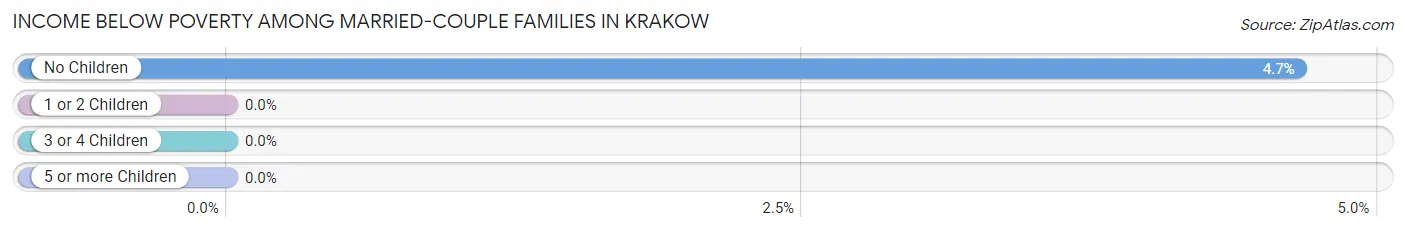
| Children | Above Poverty | Below Poverty |
| No Children | 41 (95.4%) | 2 (4.6%) |
| 1 or 2 Children | 19 (100.0%) | 0 (0.0%) |
| 3 or 4 Children | 6 (100.0%) | 0 (0.0%) |
| 5 or more Children | 0 (0.0%) | 0 (0.0%) |
| Total | 66 (97.1%) | 2 (2.9%) |
Income Below Poverty Among Single-Parent Households in Krakow
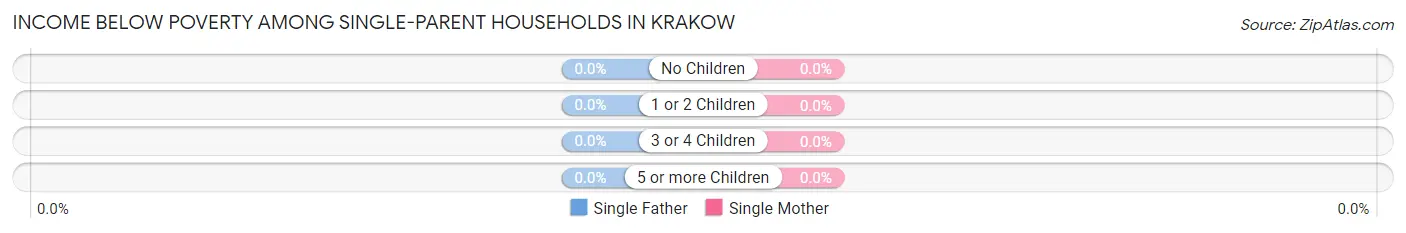
| Children | Single Father | Single Mother |
| No Children | 0 (0.0%) | 0 (0.0%) |
| 1 or 2 Children | 0 (0.0%) | 0 (0.0%) |
| 3 or 4 Children | 0 (0.0%) | 0 (0.0%) |
| 5 or more Children | 0 (0.0%) | 0 (0.0%) |
| Total | 0 (0.0%) | 0 (0.0%) |
Income Below Poverty Among Married-Couple vs Single-Parent Households in Krakow
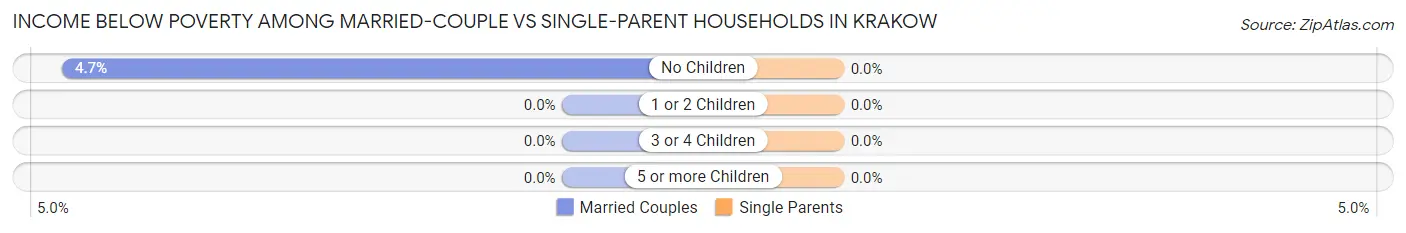
| Children | Married-Couple Families | Single-Parent Households |
| No Children | 2 (4.6%) | 0 (0.0%) |
| 1 or 2 Children | 0 (0.0%) | 0 (0.0%) |
| 3 or 4 Children | 0 (0.0%) | 0 (0.0%) |
| 5 or more Children | 0 (0.0%) | 0 (0.0%) |
| Total | 2 (2.9%) | 0 (0.0%) |
Race in Krakow
The most populous races in Krakow are White / Caucasian (308 | 96.3%), Two or more Races (7 | 2.2%), and Asian (3 | 0.9%).
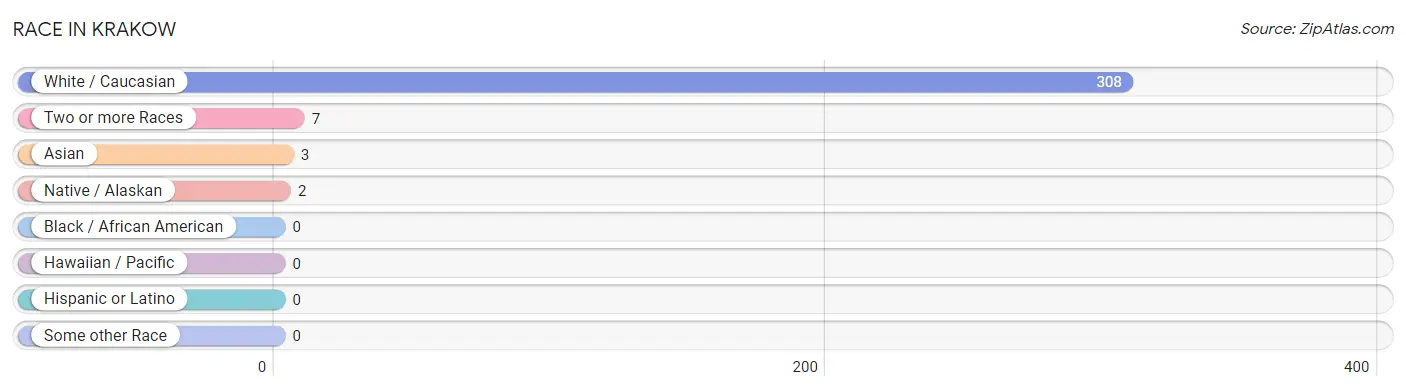
| Race | # Population | % Population |
| Asian | 3 | 0.9% |
| Black / African American | 0 | 0.0% |
| Hawaiian / Pacific | 0 | 0.0% |
| Hispanic or Latino | 0 | 0.0% |
| Native / Alaskan | 2 | 0.6% |
| White / Caucasian | 308 | 96.3% |
| Two or more Races | 7 | 2.2% |
| Some other Race | 0 | 0.0% |
| Total | 320 | 100.0% |
Ancestry in Krakow
The most populous ancestries reported in Krakow are German (67 | 20.9%), American (49 | 15.3%), Irish (41 | 12.8%), Polish (41 | 12.8%), and Swedish (28 | 8.7%), together accounting for 70.6% of all Krakow residents.
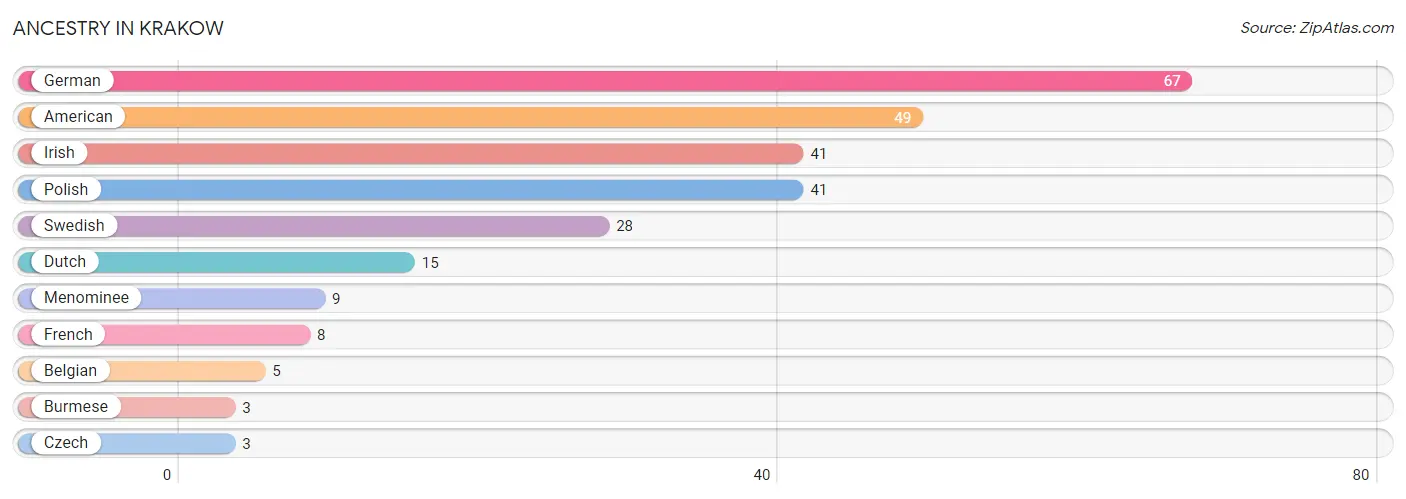
| Ancestry | # Population | % Population |
| American | 49 | 15.3% |
| Belgian | 5 | 1.6% |
| Burmese | 3 | 0.9% |
| Czech | 3 | 0.9% |
| Dutch | 15 | 4.7% |
| French | 8 | 2.5% |
| German | 67 | 20.9% |
| Irish | 41 | 12.8% |
| Menominee | 9 | 2.8% |
| Polish | 41 | 12.8% |
| Swedish | 28 | 8.7% | View All 11 Rows |
Immigrants in Krakow
The most numerous immigrant groups reported in Krakow came from Asia (3 | 0.9%), Eastern Asia (3 | 0.9%), and Korea (3 | 0.9%), together accounting for 2.8% of all Krakow residents.
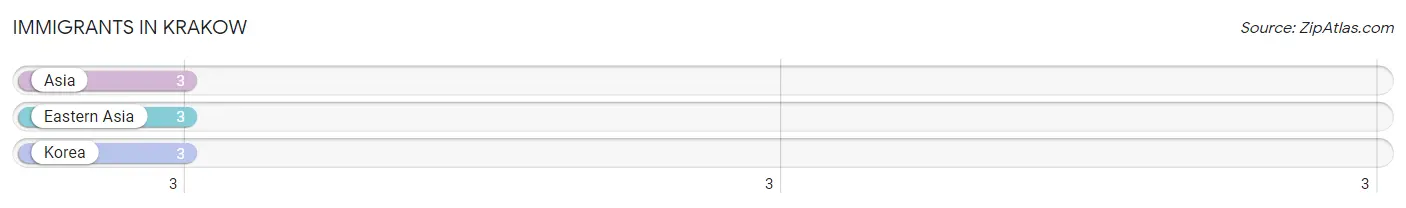
| Immigration Origin | # Population | % Population |
| Asia | 3 | 0.9% |
| Eastern Asia | 3 | 0.9% |
| Korea | 3 | 0.9% | View All 3 Rows |
Sex and Age in Krakow
Sex and Age in Krakow
The most populous age groups in Krakow are 5 to 9 Years (20 | 12.2%) for men and 30 to 34 Years (19 | 12.2%) for women.
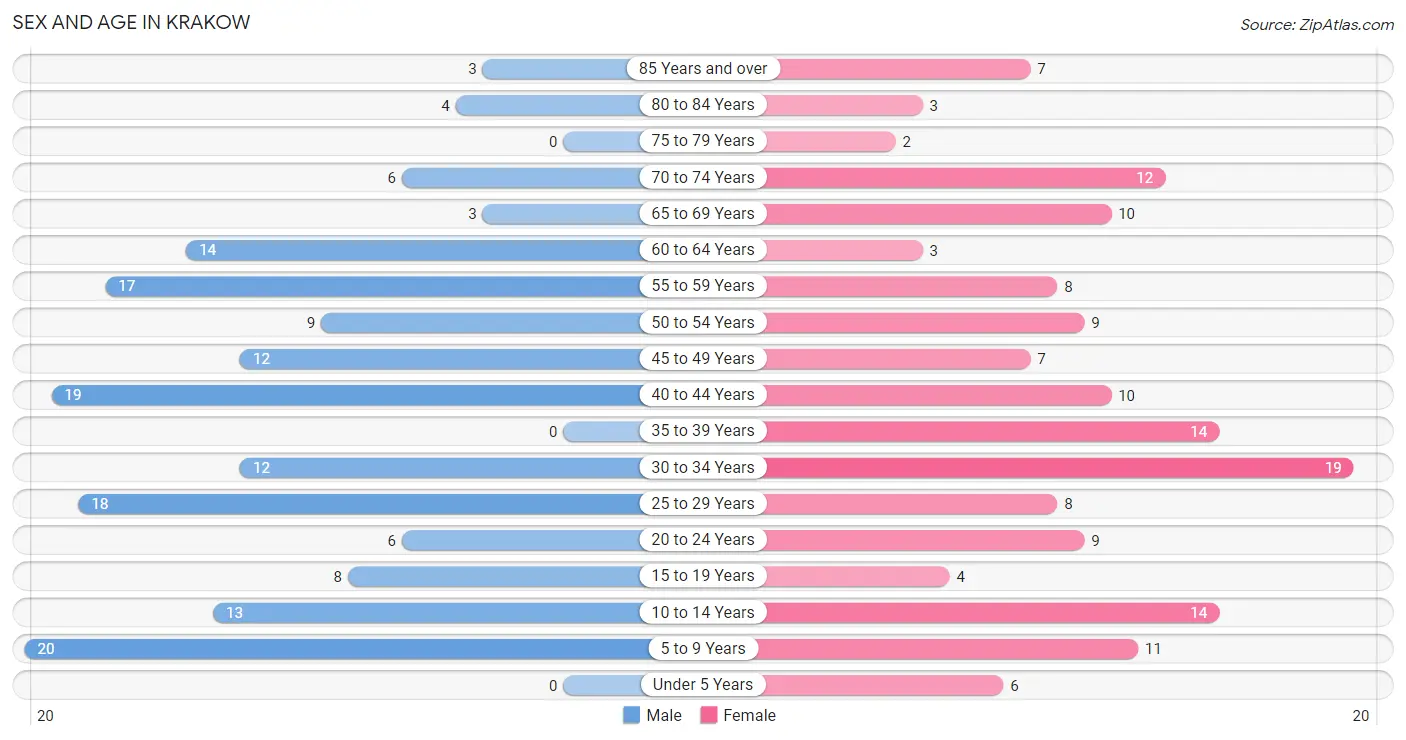
| Age Bracket | Male | Female |
| Under 5 Years | 0 (0.0%) | 6 (3.8%) |
| 5 to 9 Years | 20 (12.2%) | 11 (7.0%) |
| 10 to 14 Years | 13 (7.9%) | 14 (9.0%) |
| 15 to 19 Years | 8 (4.9%) | 4 (2.6%) |
| 20 to 24 Years | 6 (3.7%) | 9 (5.8%) |
| 25 to 29 Years | 18 (11.0%) | 8 (5.1%) |
| 30 to 34 Years | 12 (7.3%) | 19 (12.2%) |
| 35 to 39 Years | 0 (0.0%) | 14 (9.0%) |
| 40 to 44 Years | 19 (11.6%) | 10 (6.4%) |
| 45 to 49 Years | 12 (7.3%) | 7 (4.5%) |
| 50 to 54 Years | 9 (5.5%) | 9 (5.8%) |
| 55 to 59 Years | 17 (10.4%) | 8 (5.1%) |
| 60 to 64 Years | 14 (8.5%) | 3 (1.9%) |
| 65 to 69 Years | 3 (1.8%) | 10 (6.4%) |
| 70 to 74 Years | 6 (3.7%) | 12 (7.7%) |
| 75 to 79 Years | 0 (0.0%) | 2 (1.3%) |
| 80 to 84 Years | 4 (2.4%) | 3 (1.9%) |
| 85 Years and over | 3 (1.8%) | 7 (4.5%) |
| Total | 164 (100.0%) | 156 (100.0%) |
Families and Households in Krakow
Median Family Size in Krakow
The median family size in Krakow is 2.92 persons per family, with married-couple families (68 | 79.1%) accounting for the largest median family size of 3.07 persons per family. On the other hand, single male/father families (7 | 8.1%) represent the smallest median family size with 2.00 persons per family.
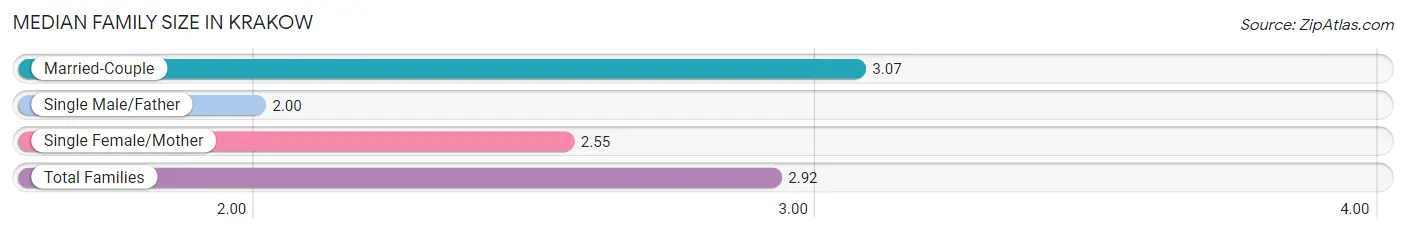
| Family Type | # Families | Family Size |
| Married-Couple | 68 (79.1%) | 3.07 |
| Single Male/Father | 7 (8.1%) | 2.00 |
| Single Female/Mother | 11 (12.8%) | 2.55 |
| Total Families | 86 (100.0%) | 2.92 |
Median Household Size in Krakow
The median household size in Krakow is 2.41 persons per household, with single female/mother households (11 | 8.3%) accounting for the largest median household size of 3.73 persons per household. non-family households (47 | 35.3%) represent the smallest median household size with 1.11 persons per household.
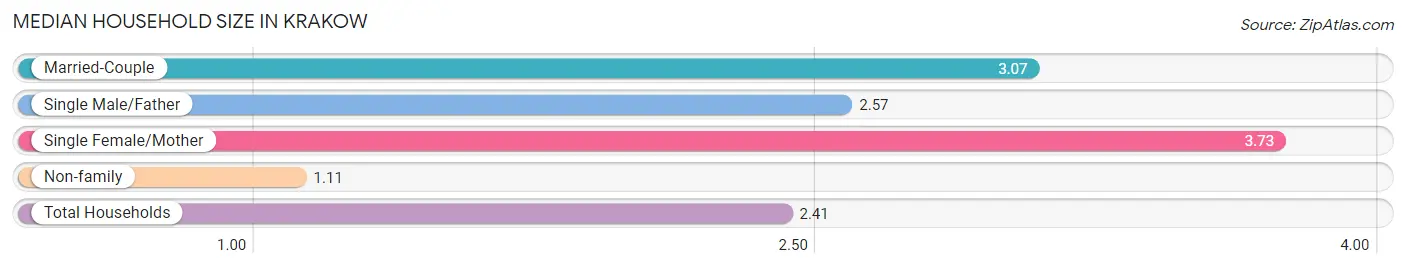
| Household Type | # Households | Household Size |
| Married-Couple | 68 (51.1%) | 3.07 |
| Single Male/Father | 7 (5.3%) | 2.57 |
| Single Female/Mother | 11 (8.3%) | 3.73 |
| Non-family | 47 (35.3%) | 1.11 |
| Total Households | 133 (100.0%) | 2.41 |
Household Size by Marriage Status in Krakow
Out of a total of 133 households in Krakow, 86 (64.7%) are family households, while 47 (35.3%) are nonfamily households. The most numerous type of family households are 2-person households, comprising 43, and the most common type of nonfamily households are 1-person households, comprising 42.
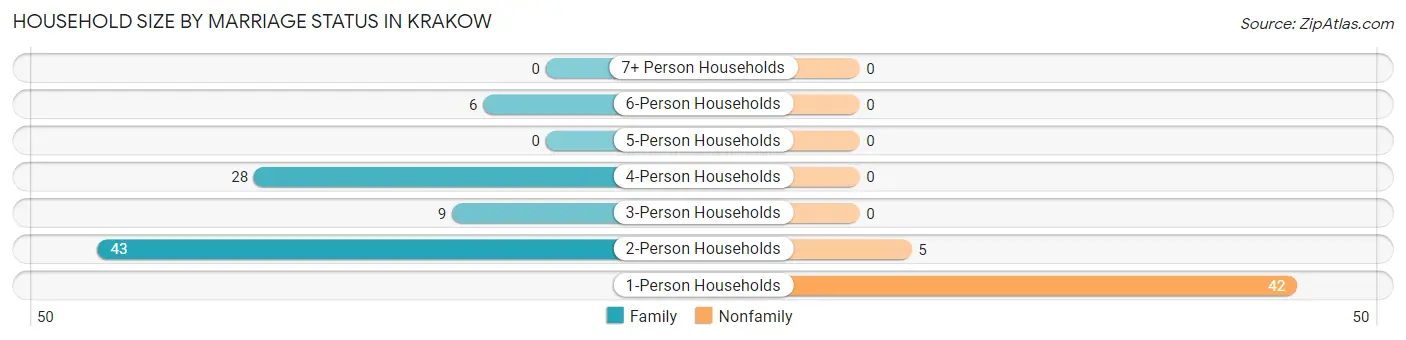
| Household Size | Family Households | Nonfamily Households |
| 1-Person Households | - | 42 (31.6%) |
| 2-Person Households | 43 (32.3%) | 5 (3.8%) |
| 3-Person Households | 9 (6.8%) | 0 (0.0%) |
| 4-Person Households | 28 (21.0%) | 0 (0.0%) |
| 5-Person Households | 0 (0.0%) | 0 (0.0%) |
| 6-Person Households | 6 (4.5%) | 0 (0.0%) |
| 7+ Person Households | 0 (0.0%) | 0 (0.0%) |
| Total | 86 (64.7%) | 47 (35.3%) |
Female Fertility in Krakow
Fertility by Age in Krakow
Average fertility rate in Krakow is 42.0 births per 1,000 women. Women in the age bracket of 35 to 50 years have the highest fertility rate with 97.0 births per 1,000 women. Women in the age bracket of 35 to 50 years acount for 100.0% of all women with births.
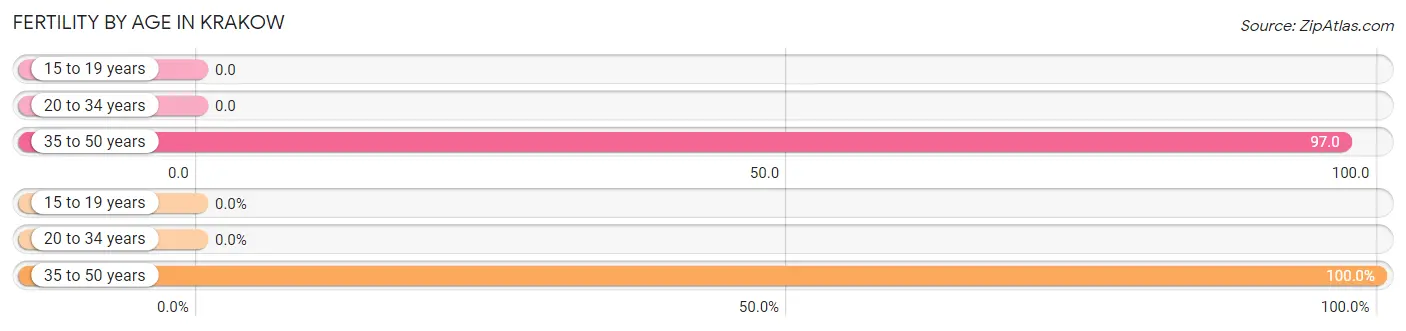
| Age Bracket | Women with Births | Births / 1,000 Women |
| 15 to 19 years | 0 (0.0%) | 0.0 |
| 20 to 34 years | 0 (0.0%) | 0.0 |
| 35 to 50 years | 3 (100.0%) | 97.0 |
| Total | 3 (100.0%) | 42.0 |
Fertility by Age by Marriage Status in Krakow
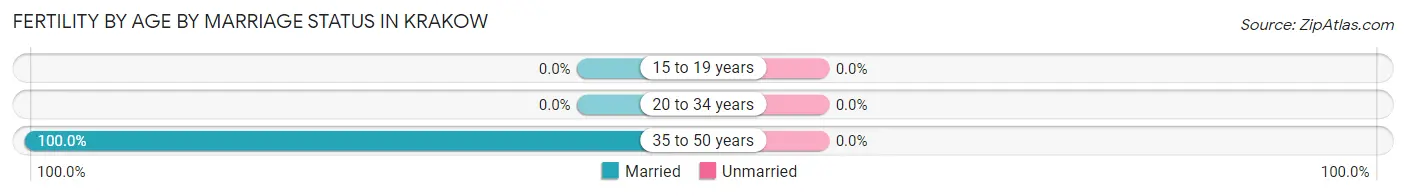
| Age Bracket | Married | Unmarried |
| 15 to 19 years | 0 (0.0%) | 0 (0.0%) |
| 20 to 34 years | 0 (0.0%) | 0 (0.0%) |
| 35 to 50 years | 3 (100.0%) | 0 (0.0%) |
| Total | 3 (100.0%) | 0 (0.0%) |
Fertility by Education in Krakow
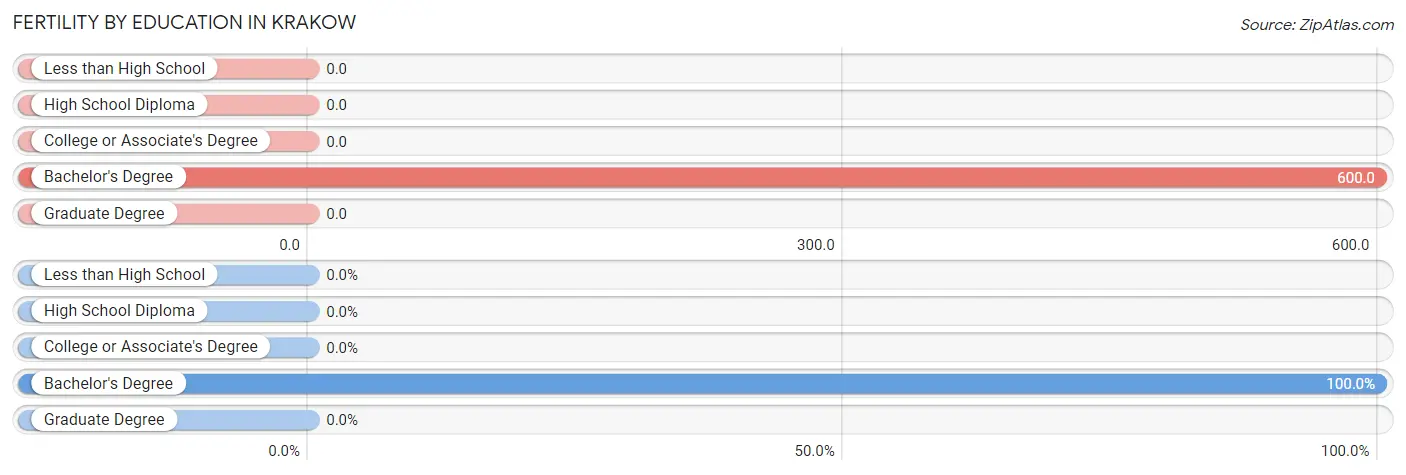
| Educational Attainment | Women with Births | Births / 1,000 Women |
| Less than High School | 0 (0.0%) | 0.0 |
| High School Diploma | 0 (0.0%) | 0.0 |
| College or Associate's Degree | 0 (0.0%) | 0.0 |
| Bachelor's Degree | 3 (100.0%) | 600.0 |
| Graduate Degree | 0 (0.0%) | 0.0 |
| Total | 3 (100.0%) | 42.0 |
Fertility by Education by Marriage Status in Krakow
| Educational Attainment | Married | Unmarried |
| Less than High School | 0 (0.0%) | 0 (0.0%) |
| High School Diploma | 0 (0.0%) | 0 (0.0%) |
| College or Associate's Degree | 0 (0.0%) | 0 (0.0%) |
| Bachelor's Degree | 3 (100.0%) | 0 (0.0%) |
| Graduate Degree | 0 (0.0%) | 0 (0.0%) |
| Total | 3 (100.0%) | 0 (0.0%) |
Employment Characteristics in Krakow
Employment by Class of Employer in Krakow
Among the 175 employed individuals in Krakow, private company employees (135 | 77.1%), self-employed (not incorporated) (18 | 10.3%), and not-for-profit organizations (11 | 6.3%) make up the most common classes of employment.
| Employer Class | # Employees | % Employees |
| Private Company Employees | 135 | 77.1% |
| Self-Employed (Incorporated) | 3 | 1.7% |
| Self-Employed (Not Incorporated) | 18 | 10.3% |
| Not-for-profit Organizations | 11 | 6.3% |
| Local Government Employees | 3 | 1.7% |
| State Government Employees | 0 | 0.0% |
| Federal Government Employees | 0 | 0.0% |
| Unpaid Family Workers | 5 | 2.9% |
| Total | 175 | 100.0% |
Employment Status by Age in Krakow
| Age Bracket | In Labor Force | Unemployed |
| 16 to 19 Years | 8 (100.0%) | 0 (0.0%) |
| 20 to 24 Years | 15 (100.0%) | 0 (0.0%) |
| 25 to 29 Years | 22 (84.6%) | 0 (0.0%) |
| 30 to 34 Years | 25 (80.6%) | 0 (0.0%) |
| 35 to 44 Years | 40 (93.0%) | 0 (0.0%) |
| 45 to 54 Years | 34 (91.9%) | 0 (0.0%) |
| 55 to 59 Years | 21 (84.0%) | 0 (0.0%) |
| 60 to 64 Years | 8 (47.1%) | 0 (0.0%) |
| 65 to 74 Years | 0 (0.0%) | 0 (0.0%) |
| 75 Years and over | 2 (10.5%) | 0 (0.0%) |
| Total | 175 (69.4%) | 0 (0.0%) |
Employment Status by Educational Attainment in Krakow
| Educational Attainment | In Labor Force | Unemployed |
| Less than High School | 14 (70.0%) | 0 (0.0%) |
| High School Diploma | 68 (87.2%) | 0 (0.0%) |
| College / Associate Degree | 43 (76.8%) | 0 (0.0%) |
| Bachelor's Degree or higher | 25 (100.0%) | 0 (0.0%) |
| Total | 150 (83.8%) | 0 (0.0%) |
Employment Occupations by Sex in Krakow
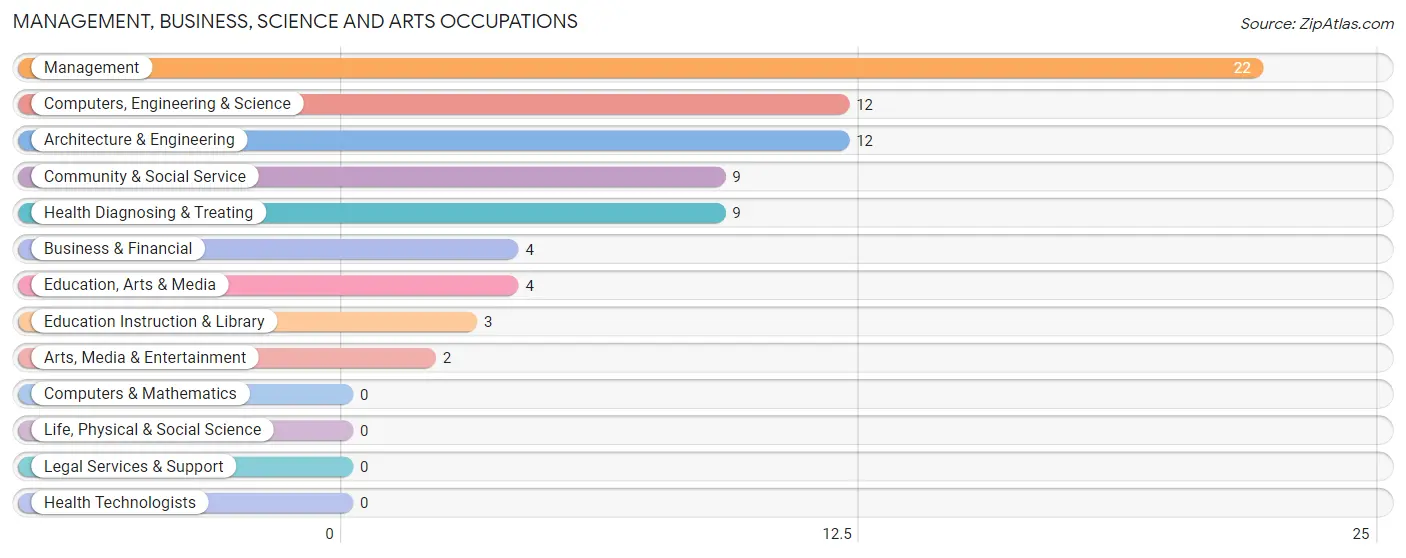
Management, Business, Science and Arts Occupations
The most common Management, Business, Science and Arts occupations in Krakow are Management (22 | 12.6%), Computers, Engineering & Science (12 | 6.9%), Architecture & Engineering (12 | 6.9%), Community & Social Service (9 | 5.1%), and Health Diagnosing & Treating (9 | 5.1%).
Management, Business, Science and Arts Occupations by Sex
Within the Management, Business, Science and Arts occupations in Krakow, the most male-oriented occupations are Computers, Engineering & Science (100.0%), Architecture & Engineering (100.0%), and Education, Arts & Media (100.0%), while the most female-oriented occupations are Business & Financial (100.0%), Arts, Media & Entertainment (100.0%), and Health Diagnosing & Treating (100.0%).
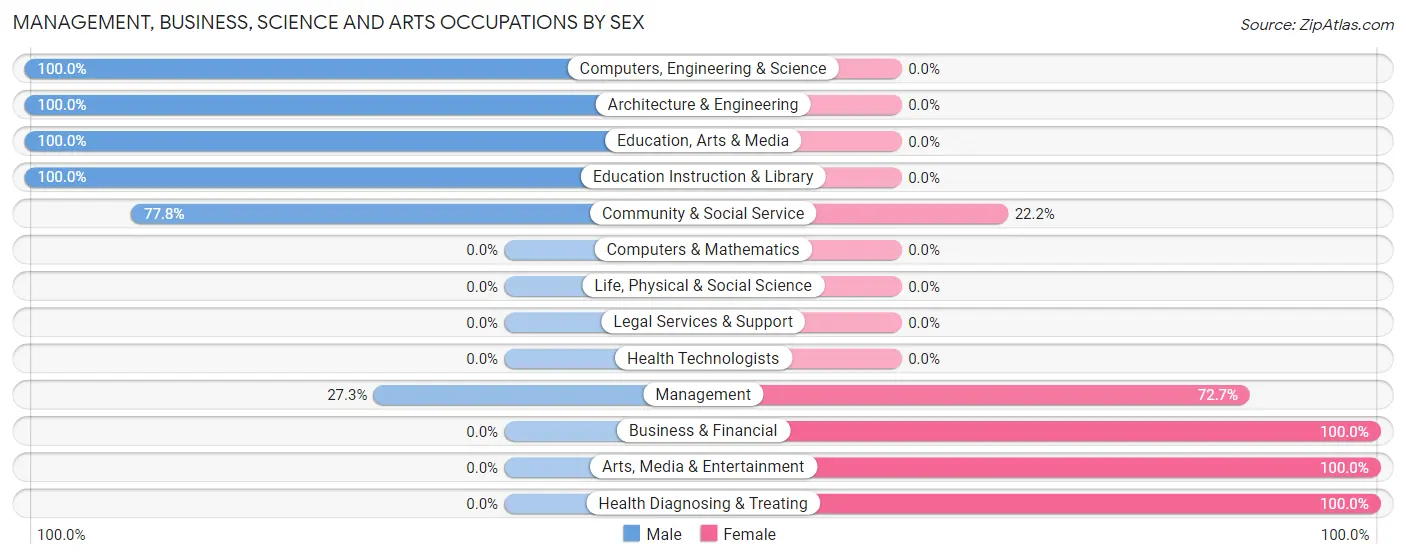
| Occupation | Male | Female |
| Management | 6 (27.3%) | 16 (72.7%) |
| Business & Financial | 0 (0.0%) | 4 (100.0%) |
| Computers, Engineering & Science | 12 (100.0%) | 0 (0.0%) |
| Computers & Mathematics | 0 (0.0%) | 0 (0.0%) |
| Architecture & Engineering | 12 (100.0%) | 0 (0.0%) |
| Life, Physical & Social Science | 0 (0.0%) | 0 (0.0%) |
| Community & Social Service | 7 (77.8%) | 2 (22.2%) |
| Education, Arts & Media | 4 (100.0%) | 0 (0.0%) |
| Legal Services & Support | 0 (0.0%) | 0 (0.0%) |
| Education Instruction & Library | 3 (100.0%) | 0 (0.0%) |
| Arts, Media & Entertainment | 0 (0.0%) | 2 (100.0%) |
| Health Diagnosing & Treating | 0 (0.0%) | 9 (100.0%) |
| Health Technologists | 0 (0.0%) | 0 (0.0%) |
| Total (Category) | 25 (44.6%) | 31 (55.4%) |
| Total (Overall) | 105 (60.0%) | 70 (40.0%) |
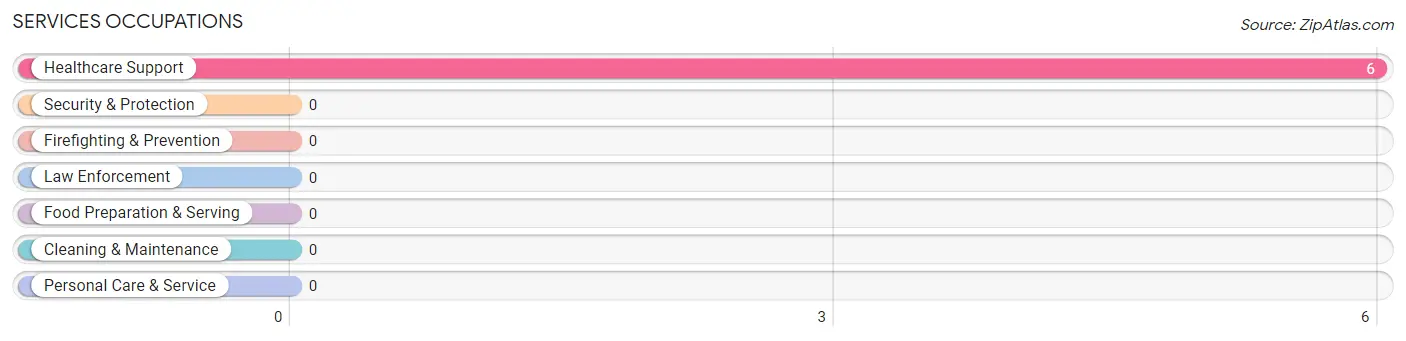
Services Occupations
The most common Services occupations in Krakow are , and Healthcare Support (6 | 3.4%).
Services Occupations by Sex
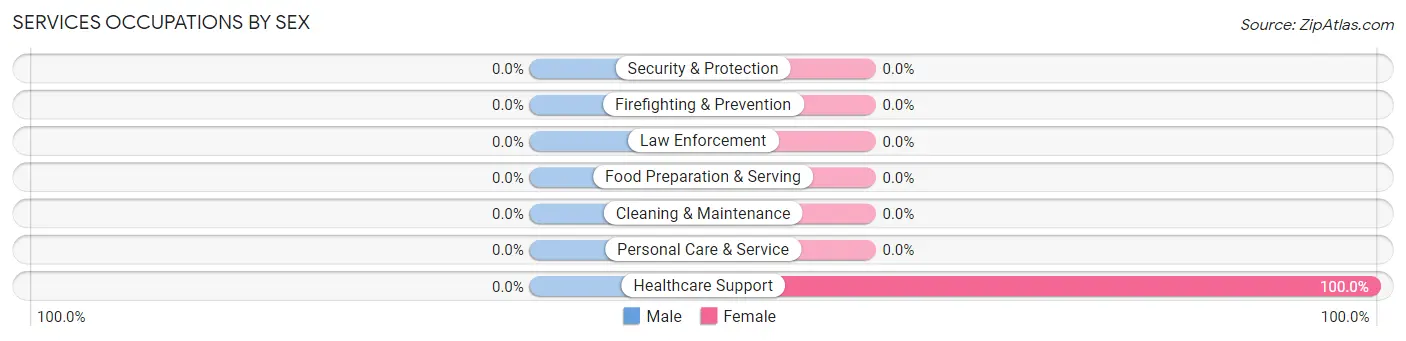
| Occupation | Male | Female |
| Healthcare Support | 0 (0.0%) | 6 (100.0%) |
| Security & Protection | 0 (0.0%) | 0 (0.0%) |
| Firefighting & Prevention | 0 (0.0%) | 0 (0.0%) |
| Law Enforcement | 0 (0.0%) | 0 (0.0%) |
| Food Preparation & Serving | 0 (0.0%) | 0 (0.0%) |
| Cleaning & Maintenance | 0 (0.0%) | 0 (0.0%) |
| Personal Care & Service | 0 (0.0%) | 0 (0.0%) |
| Total (Category) | 0 (0.0%) | 6 (100.0%) |
| Total (Overall) | 105 (60.0%) | 70 (40.0%) |
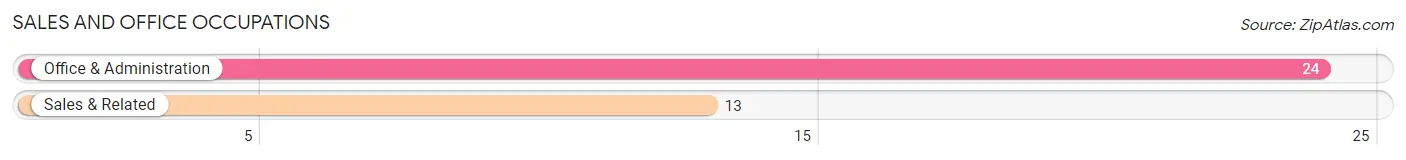
Sales and Office Occupations
The most common Sales and Office occupations in Krakow are Office & Administration (24 | 13.7%), and Sales & Related (13 | 7.4%).
Sales and Office Occupations by Sex
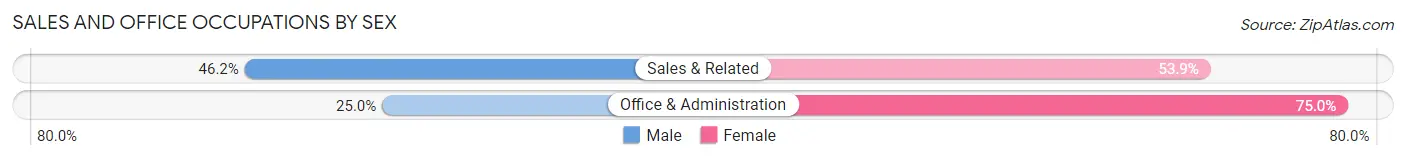
| Occupation | Male | Female |
| Sales & Related | 6 (46.2%) | 7 (53.8%) |
| Office & Administration | 6 (25.0%) | 18 (75.0%) |
| Total (Category) | 12 (32.4%) | 25 (67.6%) |
| Total (Overall) | 105 (60.0%) | 70 (40.0%) |
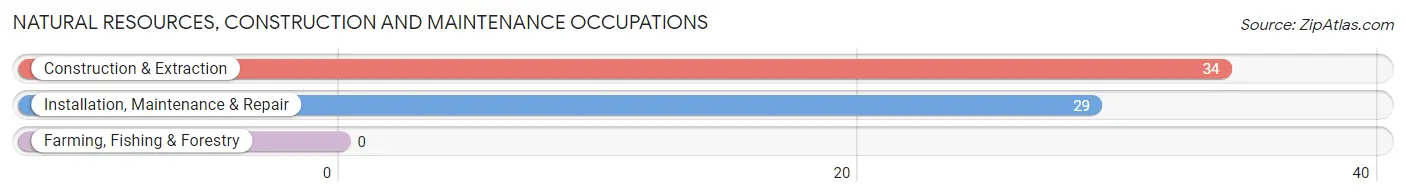
Natural Resources, Construction and Maintenance Occupations
The most common Natural Resources, Construction and Maintenance occupations in Krakow are Construction & Extraction (34 | 19.4%), and Installation, Maintenance & Repair (29 | 16.6%).
Natural Resources, Construction and Maintenance Occupations by Sex
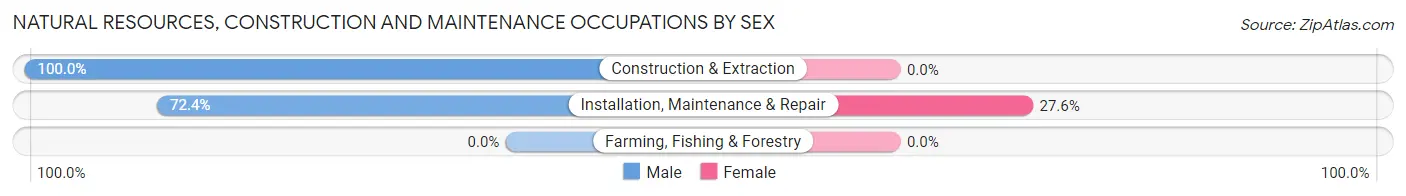
| Occupation | Male | Female |
| Farming, Fishing & Forestry | 0 (0.0%) | 0 (0.0%) |
| Construction & Extraction | 34 (100.0%) | 0 (0.0%) |
| Installation, Maintenance & Repair | 21 (72.4%) | 8 (27.6%) |
| Total (Category) | 55 (87.3%) | 8 (12.7%) |
| Total (Overall) | 105 (60.0%) | 70 (40.0%) |
Production, Transportation and Moving Occupations
The most common Production, Transportation and Moving occupations in Krakow are Material Moving (11 | 6.3%), and Production (2 | 1.1%).
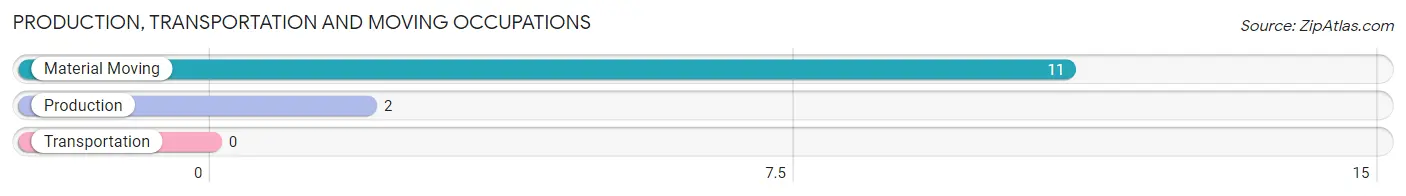
Production, Transportation and Moving Occupations by Sex
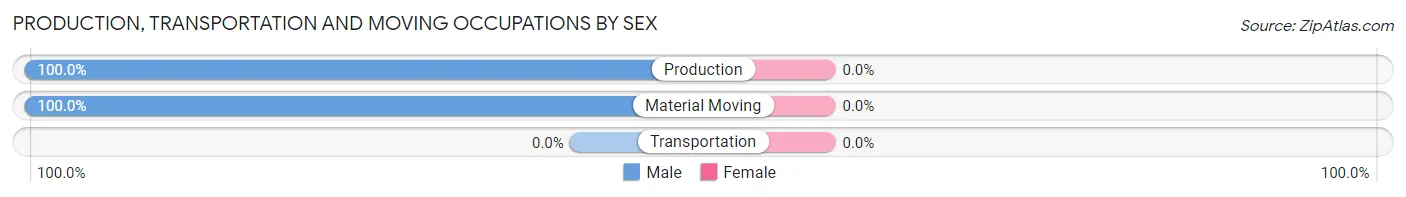
| Occupation | Male | Female |
| Production | 2 (100.0%) | 0 (0.0%) |
| Transportation | 0 (0.0%) | 0 (0.0%) |
| Material Moving | 11 (100.0%) | 0 (0.0%) |
| Total (Category) | 13 (100.0%) | 0 (0.0%) |
| Total (Overall) | 105 (60.0%) | 70 (40.0%) |
Employment Industries by Sex in Krakow
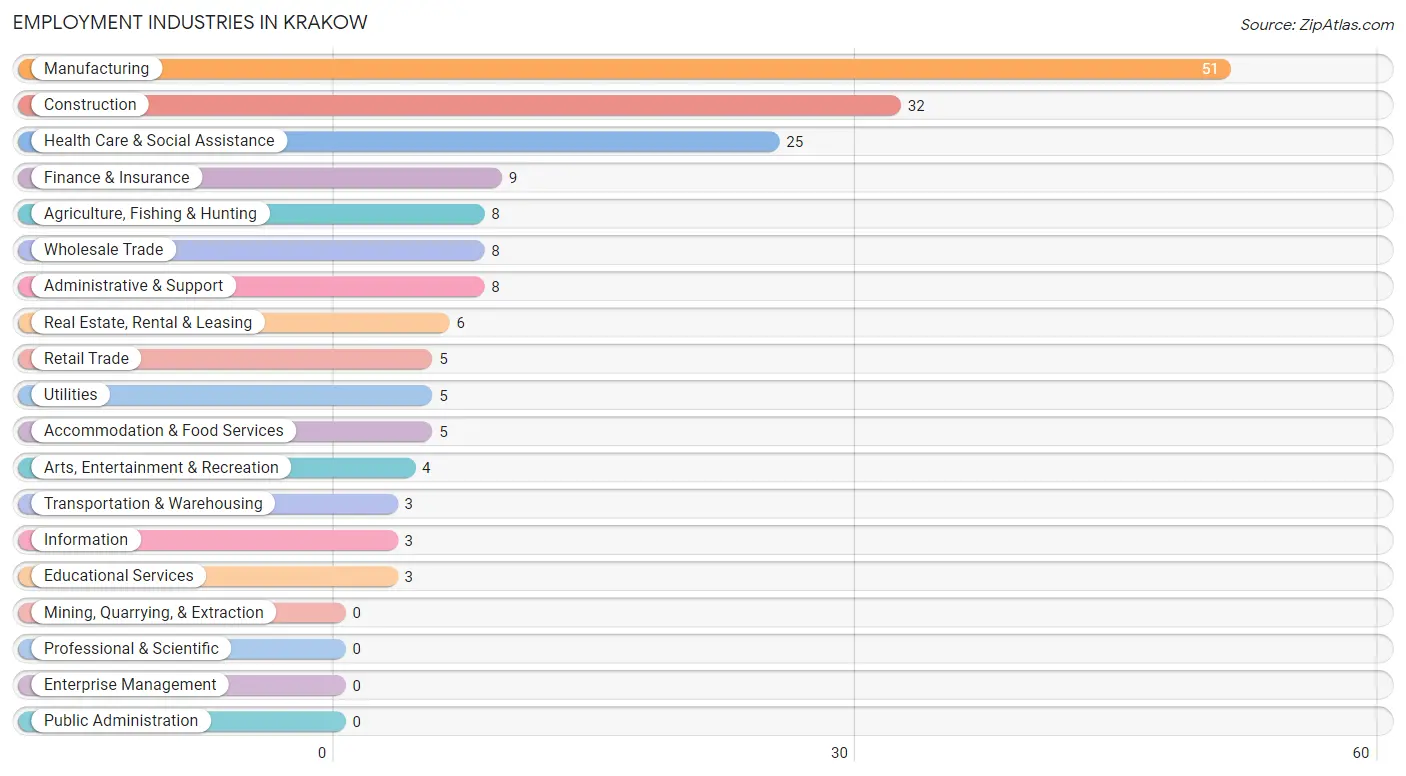
Employment Industries in Krakow
The major employment industries in Krakow include Manufacturing (51 | 29.1%), Construction (32 | 18.3%), Health Care & Social Assistance (25 | 14.3%), Finance & Insurance (9 | 5.1%), and Agriculture, Fishing & Hunting (8 | 4.6%).
Employment Industries by Sex in Krakow
The Krakow industries that see more men than women are Construction (100.0%), Retail Trade (100.0%), and Transportation & Warehousing (100.0%), whereas the industries that tend to have a higher number of women are Information (100.0%), Finance & Insurance (100.0%), and Accommodation & Food Services (100.0%).
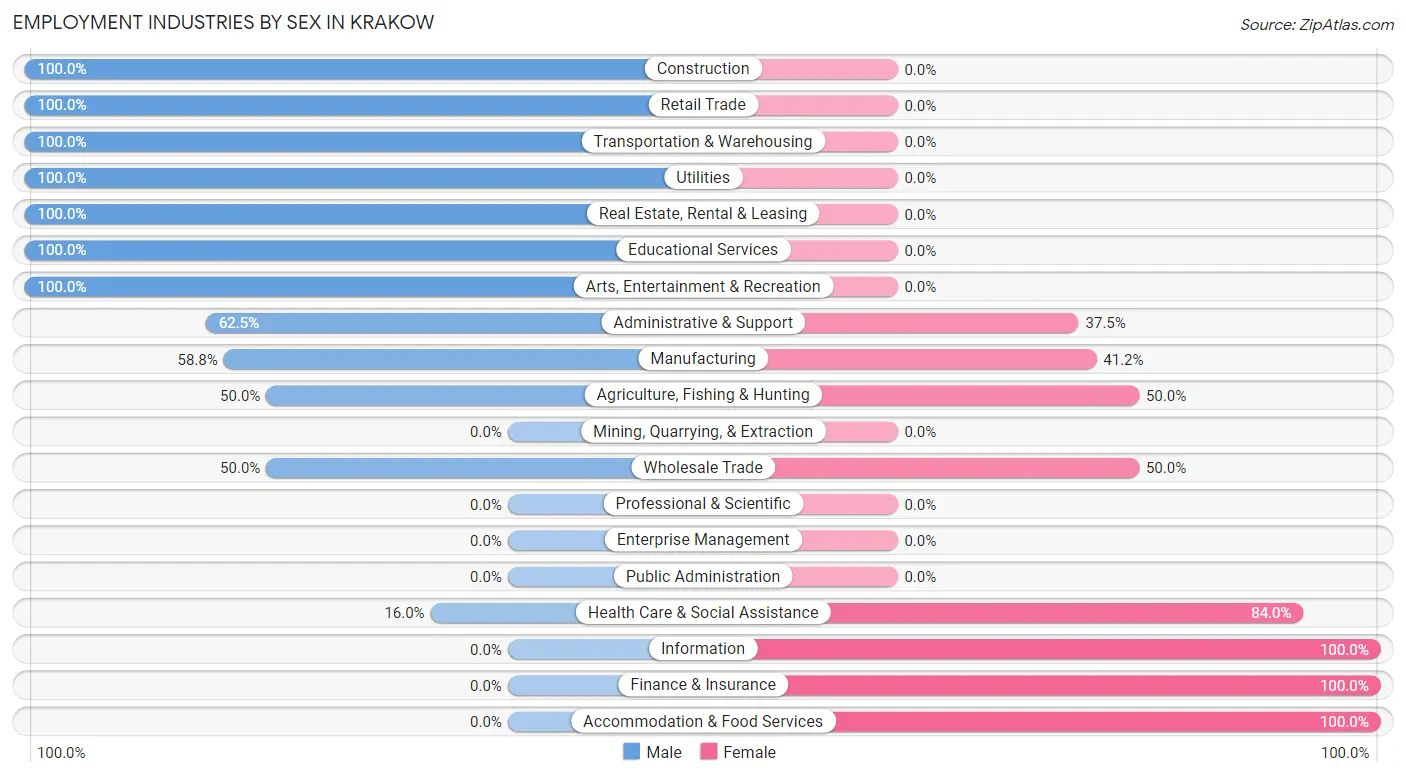
| Industry | Male | Female |
| Agriculture, Fishing & Hunting | 4 (50.0%) | 4 (50.0%) |
| Mining, Quarrying, & Extraction | 0 (0.0%) | 0 (0.0%) |
| Construction | 32 (100.0%) | 0 (0.0%) |
| Manufacturing | 30 (58.8%) | 21 (41.2%) |
| Wholesale Trade | 4 (50.0%) | 4 (50.0%) |
| Retail Trade | 5 (100.0%) | 0 (0.0%) |
| Transportation & Warehousing | 3 (100.0%) | 0 (0.0%) |
| Utilities | 5 (100.0%) | 0 (0.0%) |
| Information | 0 (0.0%) | 3 (100.0%) |
| Finance & Insurance | 0 (0.0%) | 9 (100.0%) |
| Real Estate, Rental & Leasing | 6 (100.0%) | 0 (0.0%) |
| Professional & Scientific | 0 (0.0%) | 0 (0.0%) |
| Enterprise Management | 0 (0.0%) | 0 (0.0%) |
| Administrative & Support | 5 (62.5%) | 3 (37.5%) |
| Educational Services | 3 (100.0%) | 0 (0.0%) |
| Health Care & Social Assistance | 4 (16.0%) | 21 (84.0%) |
| Arts, Entertainment & Recreation | 4 (100.0%) | 0 (0.0%) |
| Accommodation & Food Services | 0 (0.0%) | 5 (100.0%) |
| Public Administration | 0 (0.0%) | 0 (0.0%) |
| Total | 105 (60.0%) | 70 (40.0%) |
Education in Krakow
School Enrollment in Krakow
The most common levels of schooling among the 66 students in Krakow are elementary school (28 | 42.4%), middle school (23 | 34.8%), and high school (8 | 12.1%).
| School Level | # Students | % Students |
| Nursery / Preschool | 3 | 4.5% |
| Kindergarten | 0 | 0.0% |
| Elementary School | 28 | 42.4% |
| Middle School | 23 | 34.8% |
| High School | 8 | 12.1% |
| College / Undergraduate | 4 | 6.1% |
| Graduate / Professional | 0 | 0.0% |
| Total | 66 | 100.0% |
School Enrollment by Age by Funding Source in Krakow
Out of a total of 66 students who are enrolled in schools in Krakow, 3 (4.5%) attend a private institution, while the remaining 63 (95.5%) are enrolled in public schools. The age group of 10 to 14 year olds has the highest likelihood of being enrolled in private schools, with 3 (11.1% in the age bracket) enrolled. Conversely, the age group of 5 to 9 year old has the lowest likelihood of being enrolled in a private school, with 27 (100.0% in the age bracket) attending a public institution.
| Age Bracket | Public School | Private School |
| 3 to 4 Year Olds | 0 (0.0%) | 0 (0.0%) |
| 5 to 9 Year Old | 27 (100.0%) | 0 (0.0%) |
| 10 to 14 Year Olds | 24 (88.9%) | 3 (11.1%) |
| 15 to 17 Year Olds | 8 (100.0%) | 0 (0.0%) |
| 18 to 19 Year Olds | 4 (100.0%) | 0 (0.0%) |
| 20 to 24 Year Olds | 0 (0.0%) | 0 (0.0%) |
| 25 to 34 Year Olds | 0 (0.0%) | 0 (0.0%) |
| 35 Years and over | 0 (0.0%) | 0 (0.0%) |
| Total | 63 (95.5%) | 3 (4.5%) |
Educational Attainment by Field of Study in Krakow
Education (12 | 29.3%), science & technology (7 | 17.1%), psychology (4 | 9.8%), engineering (4 | 9.8%), and communications (4 | 9.8%) are the most common fields of study among 41 individuals in Krakow who have obtained a bachelor's degree or higher.
| Field of Study | # Graduates | % Graduates |
| Computers & Mathematics | 0 | 0.0% |
| Bio, Nature & Agricultural | 3 | 7.3% |
| Physical & Health Sciences | 0 | 0.0% |
| Psychology | 4 | 9.8% |
| Social Sciences | 0 | 0.0% |
| Engineering | 4 | 9.8% |
| Multidisciplinary Studies | 0 | 0.0% |
| Science & Technology | 7 | 17.1% |
| Business | 2 | 4.9% |
| Education | 12 | 29.3% |
| Literature & Languages | 3 | 7.3% |
| Liberal Arts & History | 0 | 0.0% |
| Visual & Performing Arts | 0 | 0.0% |
| Communications | 4 | 9.8% |
| Arts & Humanities | 2 | 4.9% |
| Total | 41 | 100.0% |
Transportation & Commute in Krakow
Vehicle Availability by Sex in Krakow
The most prevalent vehicle ownership categories in Krakow are males with 2 vehicles (51, accounting for 48.6%) and females with 2 vehicles (31, making up 72.9%).
| Vehicles Available | Male | Female |
| No Vehicle | 8 (7.6%) | 8 (11.4%) |
| 1 Vehicle | 10 (9.5%) | 8 (11.4%) |
| 2 Vehicles | 51 (48.6%) | 31 (44.3%) |
| 3 Vehicles | 6 (5.7%) | 3 (4.3%) |
| 4 Vehicles | 28 (26.7%) | 20 (28.6%) |
| 5 or more Vehicles | 2 (1.9%) | 0 (0.0%) |
| Total | 105 (100.0%) | 70 (100.0%) |
Commute Time in Krakow
The most frequently occuring commute durations in Krakow are 30 to 34 minutes (43 commuters, 25.8%), 35 to 39 minutes (29 commuters, 17.4%), and 25 to 29 minutes (21 commuters, 12.6%).
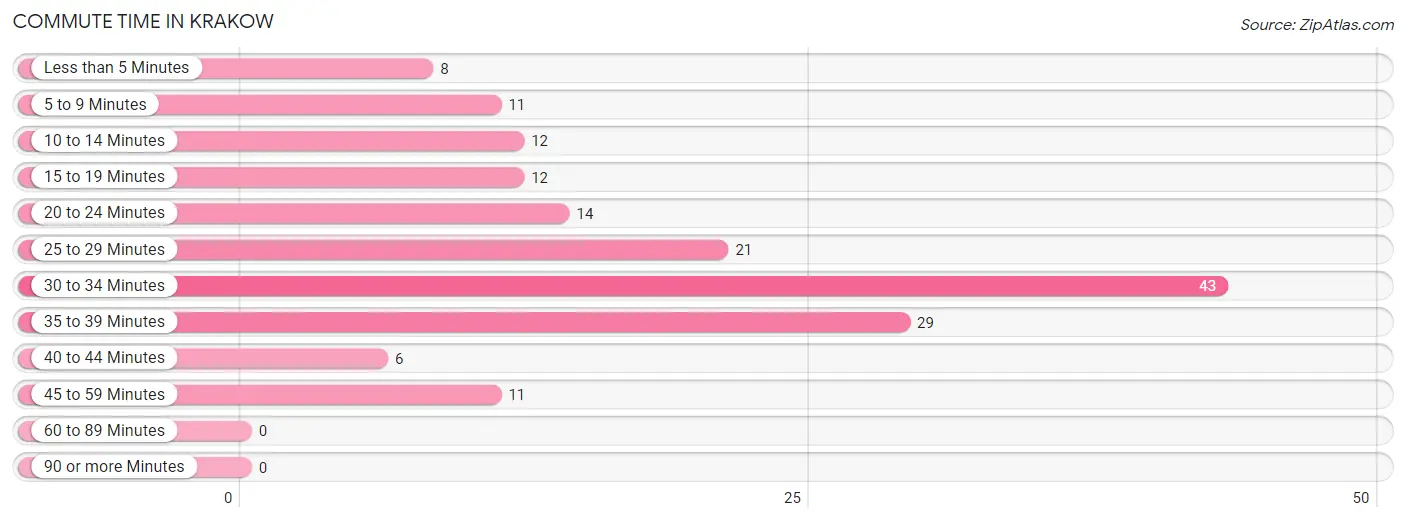
| Commute Time | # Commuters | % Commuters |
| Less than 5 Minutes | 8 | 4.8% |
| 5 to 9 Minutes | 11 | 6.6% |
| 10 to 14 Minutes | 12 | 7.2% |
| 15 to 19 Minutes | 12 | 7.2% |
| 20 to 24 Minutes | 14 | 8.4% |
| 25 to 29 Minutes | 21 | 12.6% |
| 30 to 34 Minutes | 43 | 25.8% |
| 35 to 39 Minutes | 29 | 17.4% |
| 40 to 44 Minutes | 6 | 3.6% |
| 45 to 59 Minutes | 11 | 6.6% |
| 60 to 89 Minutes | 0 | 0.0% |
| 90 or more Minutes | 0 | 0.0% |
Commute Time by Sex in Krakow
The most common commute times in Krakow are 30 to 34 minutes (29 commuters, 27.6%) for males and 30 to 34 minutes (14 commuters, 22.6%) for females.
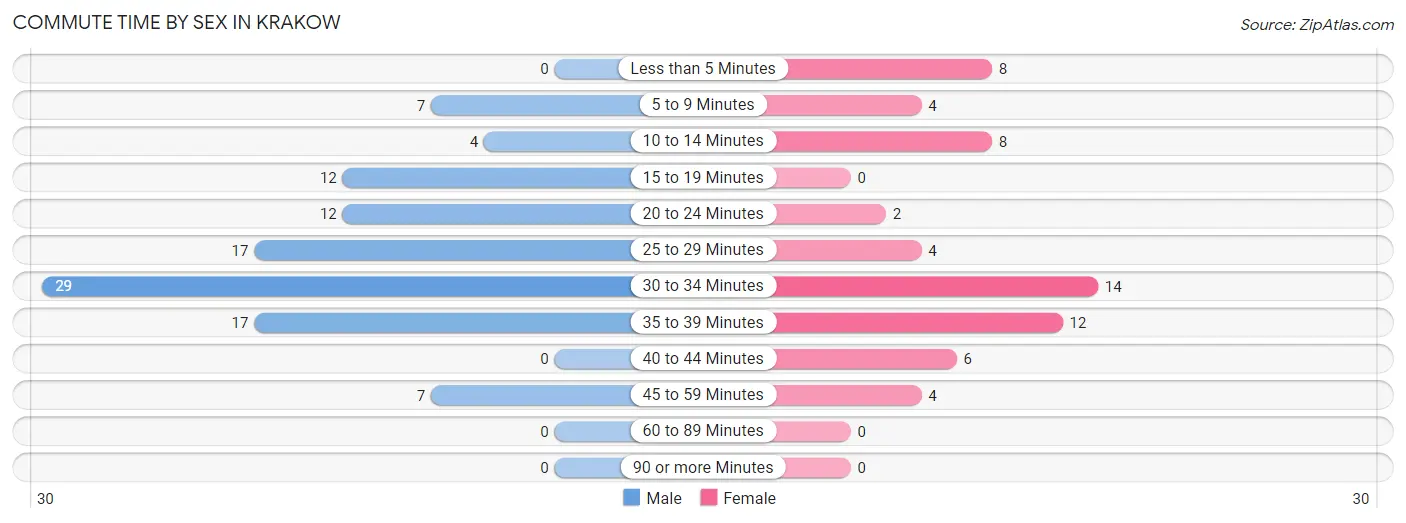
| Commute Time | Male | Female |
| Less than 5 Minutes | 0 (0.0%) | 8 (12.9%) |
| 5 to 9 Minutes | 7 (6.7%) | 4 (6.5%) |
| 10 to 14 Minutes | 4 (3.8%) | 8 (12.9%) |
| 15 to 19 Minutes | 12 (11.4%) | 0 (0.0%) |
| 20 to 24 Minutes | 12 (11.4%) | 2 (3.2%) |
| 25 to 29 Minutes | 17 (16.2%) | 4 (6.5%) |
| 30 to 34 Minutes | 29 (27.6%) | 14 (22.6%) |
| 35 to 39 Minutes | 17 (16.2%) | 12 (19.4%) |
| 40 to 44 Minutes | 0 (0.0%) | 6 (9.7%) |
| 45 to 59 Minutes | 7 (6.7%) | 4 (6.5%) |
| 60 to 89 Minutes | 0 (0.0%) | 0 (0.0%) |
| 90 or more Minutes | 0 (0.0%) | 0 (0.0%) |
Time of Departure to Work by Sex in Krakow
The most frequent times of departure to work in Krakow are 7:00 AM to 7:29 AM (17, 16.2%) for males and 5:00 AM to 5:29 AM (20, 32.3%) for females.
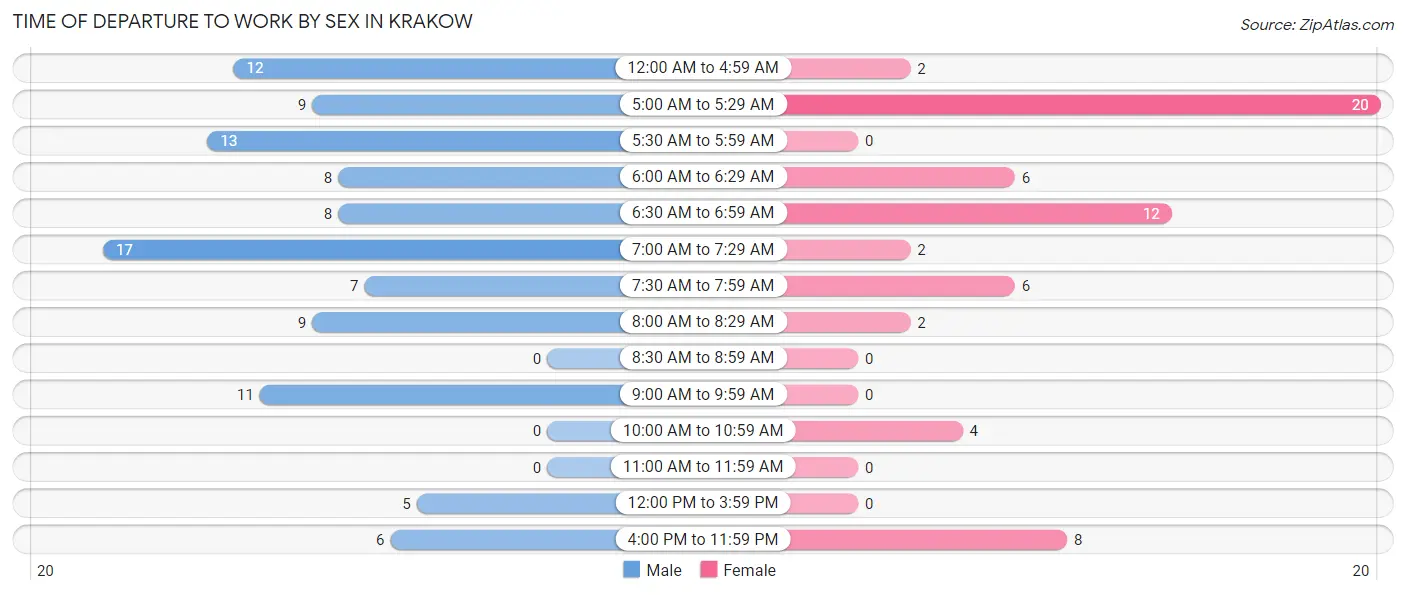
| Time of Departure | Male | Female |
| 12:00 AM to 4:59 AM | 12 (11.4%) | 2 (3.2%) |
| 5:00 AM to 5:29 AM | 9 (8.6%) | 20 (32.3%) |
| 5:30 AM to 5:59 AM | 13 (12.4%) | 0 (0.0%) |
| 6:00 AM to 6:29 AM | 8 (7.6%) | 6 (9.7%) |
| 6:30 AM to 6:59 AM | 8 (7.6%) | 12 (19.4%) |
| 7:00 AM to 7:29 AM | 17 (16.2%) | 2 (3.2%) |
| 7:30 AM to 7:59 AM | 7 (6.7%) | 6 (9.7%) |
| 8:00 AM to 8:29 AM | 9 (8.6%) | 2 (3.2%) |
| 8:30 AM to 8:59 AM | 0 (0.0%) | 0 (0.0%) |
| 9:00 AM to 9:59 AM | 11 (10.5%) | 0 (0.0%) |
| 10:00 AM to 10:59 AM | 0 (0.0%) | 4 (6.5%) |
| 11:00 AM to 11:59 AM | 0 (0.0%) | 0 (0.0%) |
| 12:00 PM to 3:59 PM | 5 (4.8%) | 0 (0.0%) |
| 4:00 PM to 11:59 PM | 6 (5.7%) | 8 (12.9%) |
| Total | 105 (100.0%) | 62 (100.0%) |
Housing Occupancy in Krakow
Occupancy by Ownership in Krakow
Of the total 133 dwellings in Krakow, owner-occupied units account for 123 (92.5%), while renter-occupied units make up 10 (7.5%).
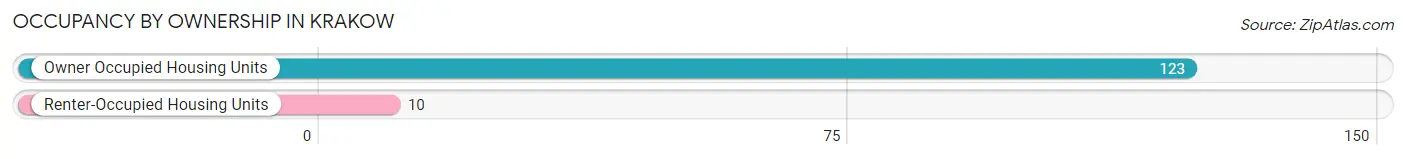
| Occupancy | # Housing Units | % Housing Units |
| Owner Occupied Housing Units | 123 | 92.5% |
| Renter-Occupied Housing Units | 10 | 7.5% |
| Total Occupied Housing Units | 133 | 100.0% |
Occupancy by Household Size in Krakow
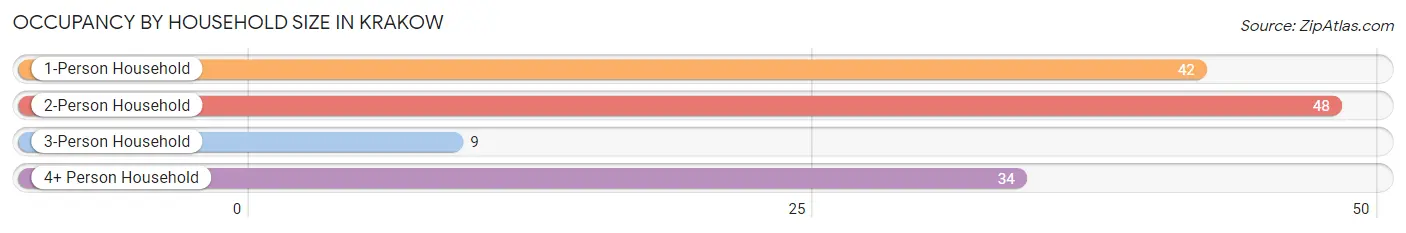
| Household Size | # Housing Units | % Housing Units |
| 1-Person Household | 42 | 31.6% |
| 2-Person Household | 48 | 36.1% |
| 3-Person Household | 9 | 6.8% |
| 4+ Person Household | 34 | 25.6% |
| Total Housing Units | 133 | 100.0% |
Occupancy by Ownership by Household Size in Krakow
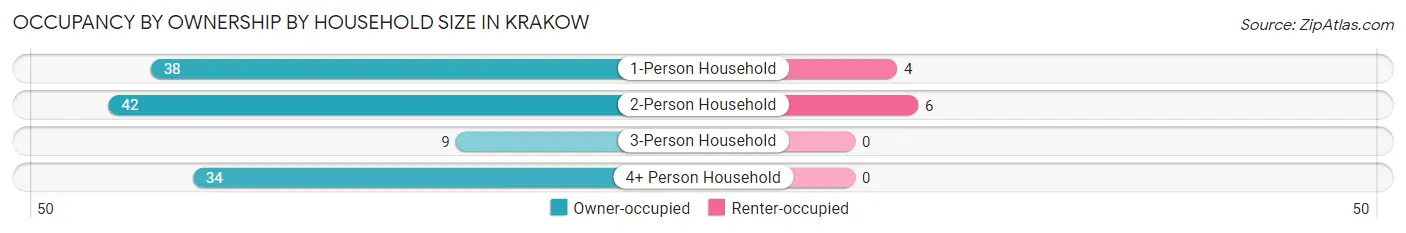
| Household Size | Owner-occupied | Renter-occupied |
| 1-Person Household | 38 (90.5%) | 4 (9.5%) |
| 2-Person Household | 42 (87.5%) | 6 (12.5%) |
| 3-Person Household | 9 (100.0%) | 0 (0.0%) |
| 4+ Person Household | 34 (100.0%) | 0 (0.0%) |
| Total Housing Units | 123 (92.5%) | 10 (7.5%) |
Occupancy by Educational Attainment in Krakow
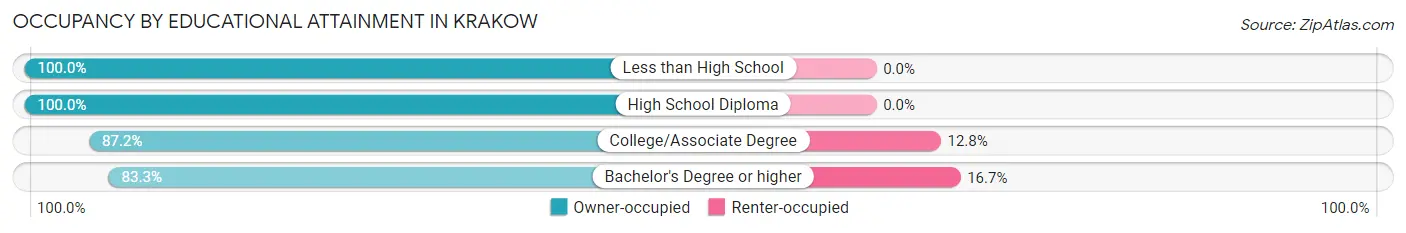
| Household Size | Owner-occupied | Renter-occupied |
| Less than High School | 9 (100.0%) | 0 (0.0%) |
| High School Diploma | 53 (100.0%) | 0 (0.0%) |
| College/Associate Degree | 41 (87.2%) | 6 (12.8%) |
| Bachelor's Degree or higher | 20 (83.3%) | 4 (16.7%) |
Occupancy by Age of Householder in Krakow
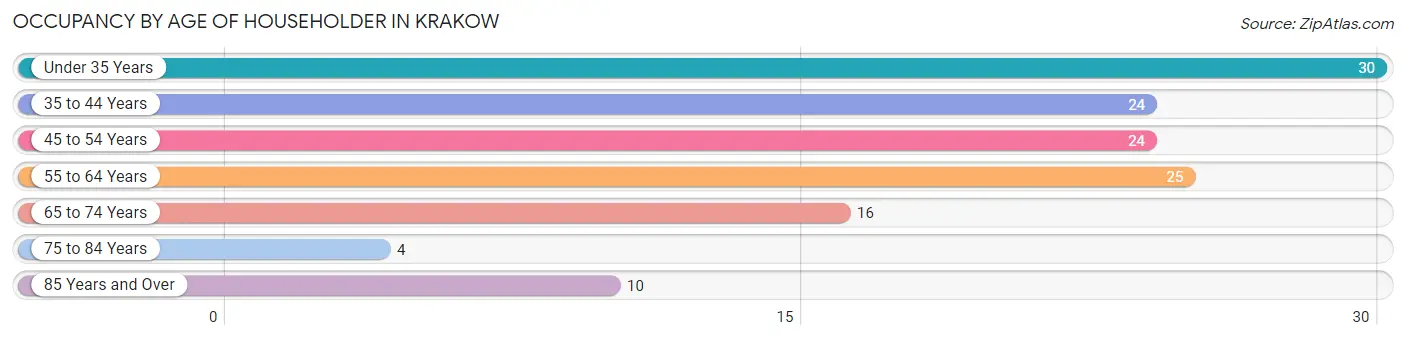
| Age Bracket | # Households | % Households |
| Under 35 Years | 30 | 22.6% |
| 35 to 44 Years | 24 | 18.0% |
| 45 to 54 Years | 24 | 18.0% |
| 55 to 64 Years | 25 | 18.8% |
| 65 to 74 Years | 16 | 12.0% |
| 75 to 84 Years | 4 | 3.0% |
| 85 Years and Over | 10 | 7.5% |
| Total | 133 | 100.0% |
Housing Finances in Krakow
Median Income by Occupancy in Krakow
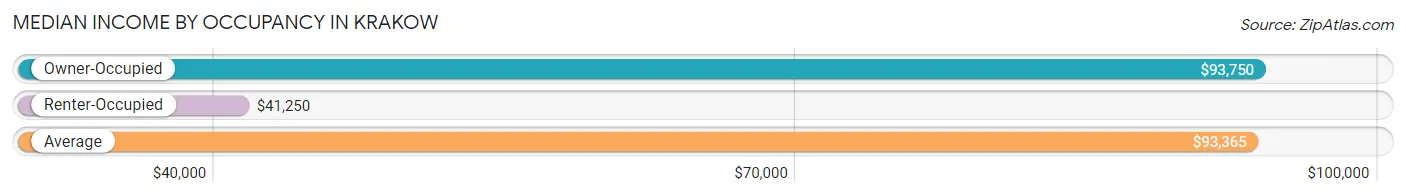
| Occupancy Type | # Households | Median Income |
| Owner-Occupied | 123 (92.5%) | $93,750 |
| Renter-Occupied | 10 (7.5%) | $41,250 |
| Average | 133 (100.0%) | $93,365 |
Occupancy by Householder Income Bracket in Krakow
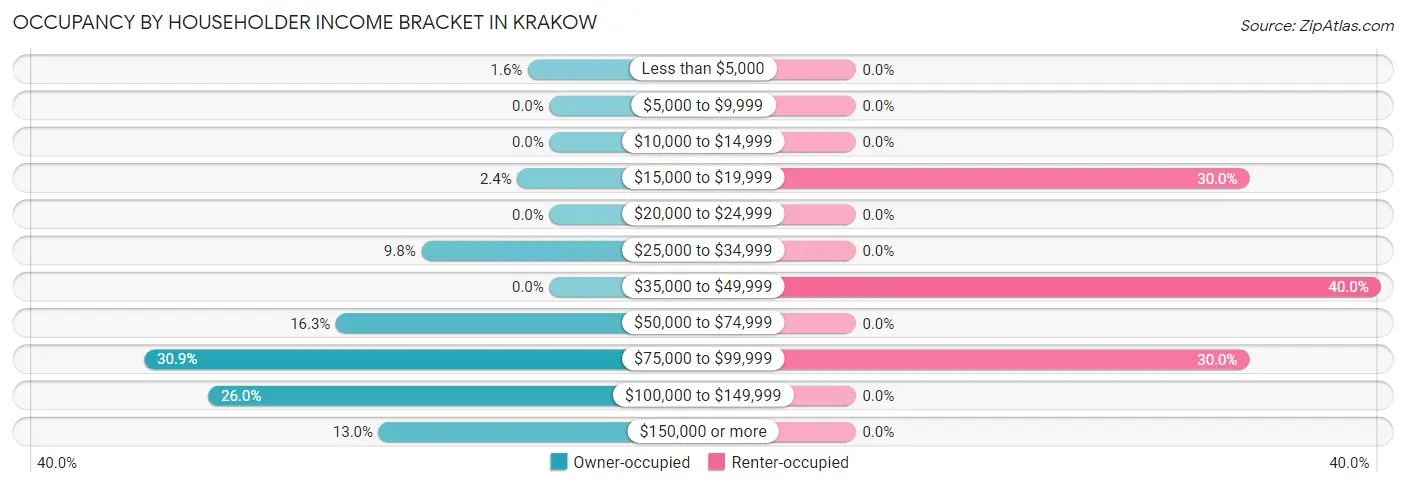
| Income Bracket | Owner-occupied | Renter-occupied |
| Less than $5,000 | 2 (1.6%) | 0 (0.0%) |
| $5,000 to $9,999 | 0 (0.0%) | 0 (0.0%) |
| $10,000 to $14,999 | 0 (0.0%) | 0 (0.0%) |
| $15,000 to $19,999 | 3 (2.4%) | 3 (30.0%) |
| $20,000 to $24,999 | 0 (0.0%) | 0 (0.0%) |
| $25,000 to $34,999 | 12 (9.8%) | 0 (0.0%) |
| $35,000 to $49,999 | 0 (0.0%) | 4 (40.0%) |
| $50,000 to $74,999 | 20 (16.3%) | 0 (0.0%) |
| $75,000 to $99,999 | 38 (30.9%) | 3 (30.0%) |
| $100,000 to $149,999 | 32 (26.0%) | 0 (0.0%) |
| $150,000 or more | 16 (13.0%) | 0 (0.0%) |
| Total | 123 (100.0%) | 10 (100.0%) |
Monthly Housing Cost Tiers in Krakow
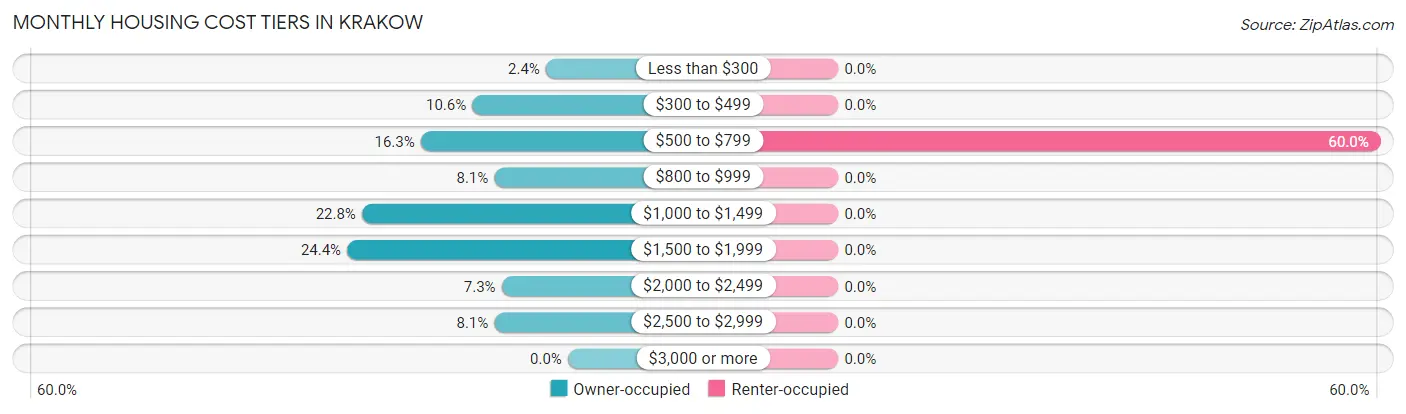
| Monthly Cost | Owner-occupied | Renter-occupied |
| Less than $300 | 3 (2.4%) | 0 (0.0%) |
| $300 to $499 | 13 (10.6%) | 0 (0.0%) |
| $500 to $799 | 20 (16.3%) | 6 (60.0%) |
| $800 to $999 | 10 (8.1%) | 0 (0.0%) |
| $1,000 to $1,499 | 28 (22.8%) | 0 (0.0%) |
| $1,500 to $1,999 | 30 (24.4%) | 0 (0.0%) |
| $2,000 to $2,499 | 9 (7.3%) | 0 (0.0%) |
| $2,500 to $2,999 | 10 (8.1%) | 0 (0.0%) |
| $3,000 or more | 0 (0.0%) | 0 (0.0%) |
| Total | 123 (100.0%) | 10 (100.0%) |
Physical Housing Characteristics in Krakow
Housing Structures in Krakow
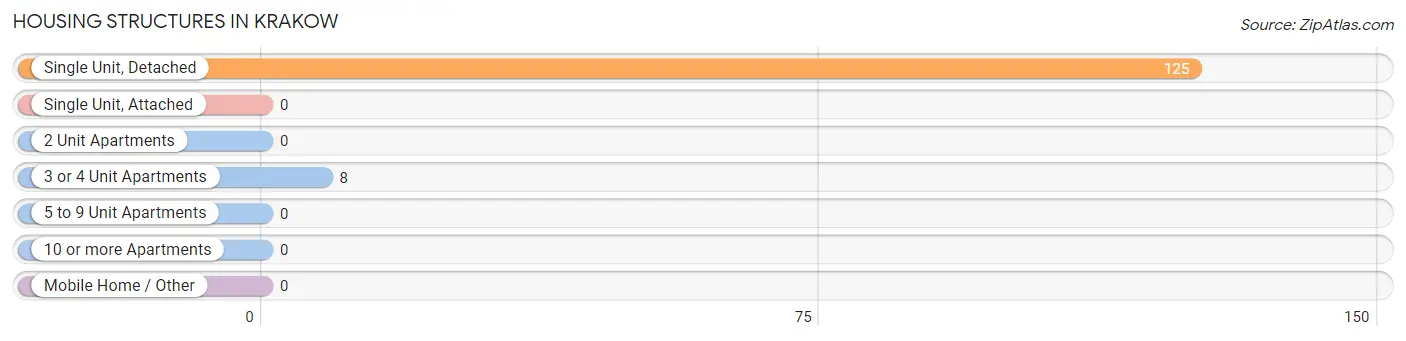
| Structure Type | # Housing Units | % Housing Units |
| Single Unit, Detached | 125 | 94.0% |
| Single Unit, Attached | 0 | 0.0% |
| 2 Unit Apartments | 0 | 0.0% |
| 3 or 4 Unit Apartments | 8 | 6.0% |
| 5 to 9 Unit Apartments | 0 | 0.0% |
| 10 or more Apartments | 0 | 0.0% |
| Mobile Home / Other | 0 | 0.0% |
| Total | 133 | 100.0% |
Housing Structures by Occupancy in Krakow
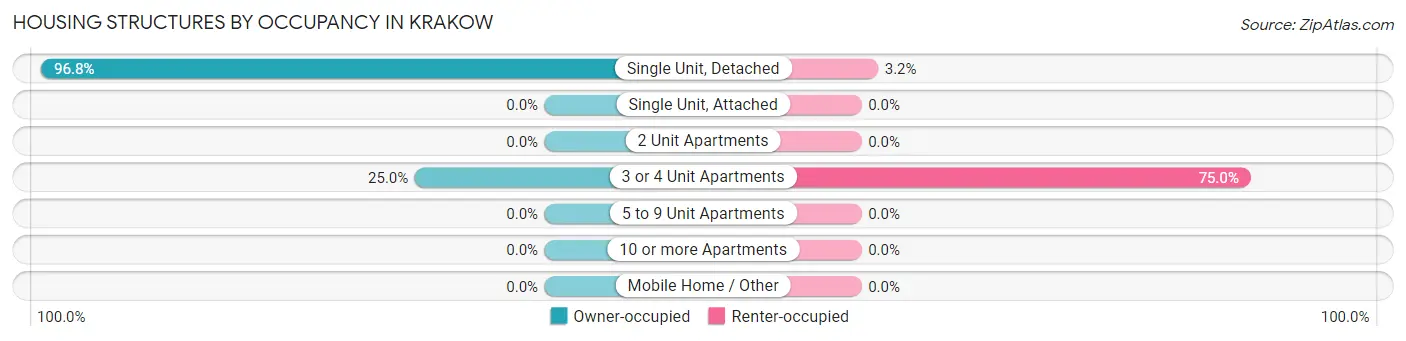
| Structure Type | Owner-occupied | Renter-occupied |
| Single Unit, Detached | 121 (96.8%) | 4 (3.2%) |
| Single Unit, Attached | 0 (0.0%) | 0 (0.0%) |
| 2 Unit Apartments | 0 (0.0%) | 0 (0.0%) |
| 3 or 4 Unit Apartments | 2 (25.0%) | 6 (75.0%) |
| 5 to 9 Unit Apartments | 0 (0.0%) | 0 (0.0%) |
| 10 or more Apartments | 0 (0.0%) | 0 (0.0%) |
| Mobile Home / Other | 0 (0.0%) | 0 (0.0%) |
| Total | 123 (92.5%) | 10 (7.5%) |
Housing Structures by Number of Rooms in Krakow
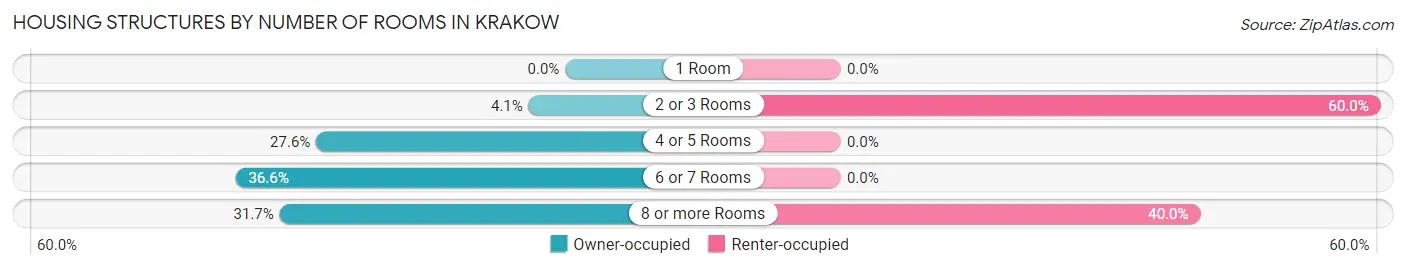
| Number of Rooms | Owner-occupied | Renter-occupied |
| 1 Room | 0 (0.0%) | 0 (0.0%) |
| 2 or 3 Rooms | 5 (4.1%) | 6 (60.0%) |
| 4 or 5 Rooms | 34 (27.6%) | 0 (0.0%) |
| 6 or 7 Rooms | 45 (36.6%) | 0 (0.0%) |
| 8 or more Rooms | 39 (31.7%) | 4 (40.0%) |
| Total | 123 (100.0%) | 10 (100.0%) |
Housing Structure by Heating Type in Krakow
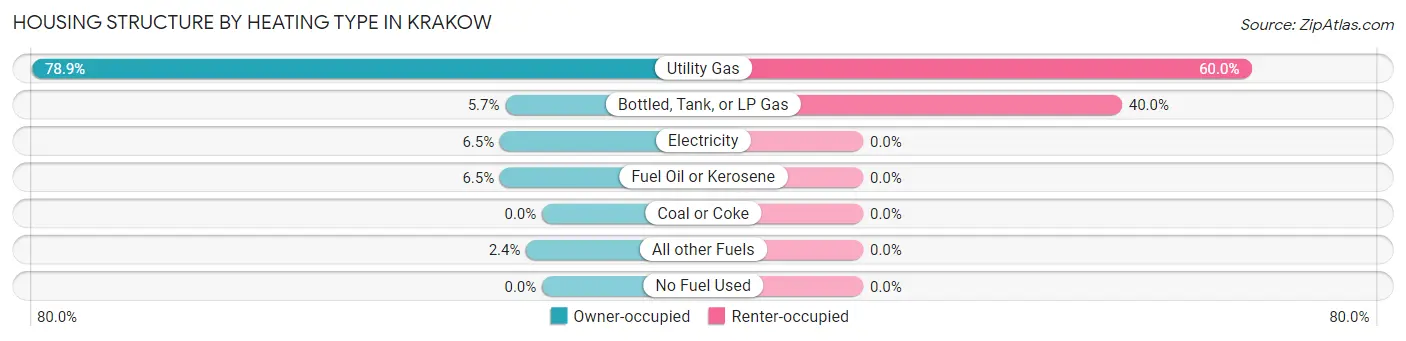
| Heating Type | Owner-occupied | Renter-occupied |
| Utility Gas | 97 (78.9%) | 6 (60.0%) |
| Bottled, Tank, or LP Gas | 7 (5.7%) | 4 (40.0%) |
| Electricity | 8 (6.5%) | 0 (0.0%) |
| Fuel Oil or Kerosene | 8 (6.5%) | 0 (0.0%) |
| Coal or Coke | 0 (0.0%) | 0 (0.0%) |
| All other Fuels | 3 (2.4%) | 0 (0.0%) |
| No Fuel Used | 0 (0.0%) | 0 (0.0%) |
| Total | 123 (100.0%) | 10 (100.0%) |
Household Vehicle Usage in Krakow
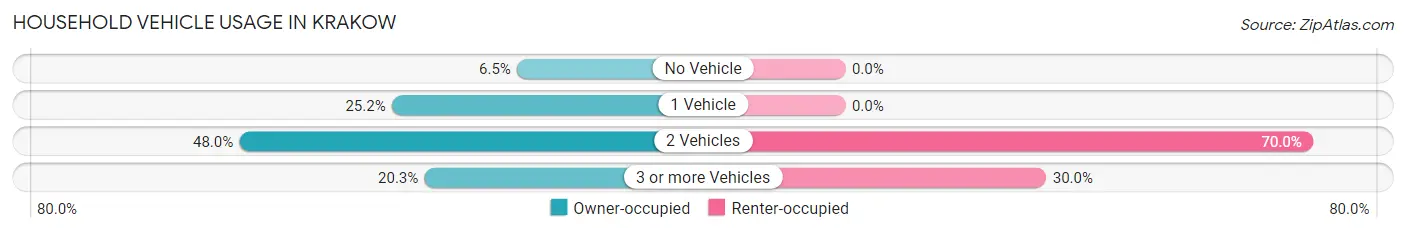
| Vehicles per Household | Owner-occupied | Renter-occupied |
| No Vehicle | 8 (6.5%) | 0 (0.0%) |
| 1 Vehicle | 31 (25.2%) | 0 (0.0%) |
| 2 Vehicles | 59 (48.0%) | 7 (70.0%) |
| 3 or more Vehicles | 25 (20.3%) | 3 (30.0%) |
| Total | 123 (100.0%) | 10 (100.0%) |
Real Estate & Mortgages in Krakow
Real Estate and Mortgage Overview in Krakow
| Characteristic | Without Mortgage | With Mortgage |
| Housing Units | 36 | 87 |
| Median Property Value | $150,000 | $216,100 |
| Median Household Income | $73,750 | $14 |
| Monthly Housing Costs | $517 | $0 |
| Real Estate Taxes | $2,435 | $4 |
Property Value by Mortgage Status in Krakow
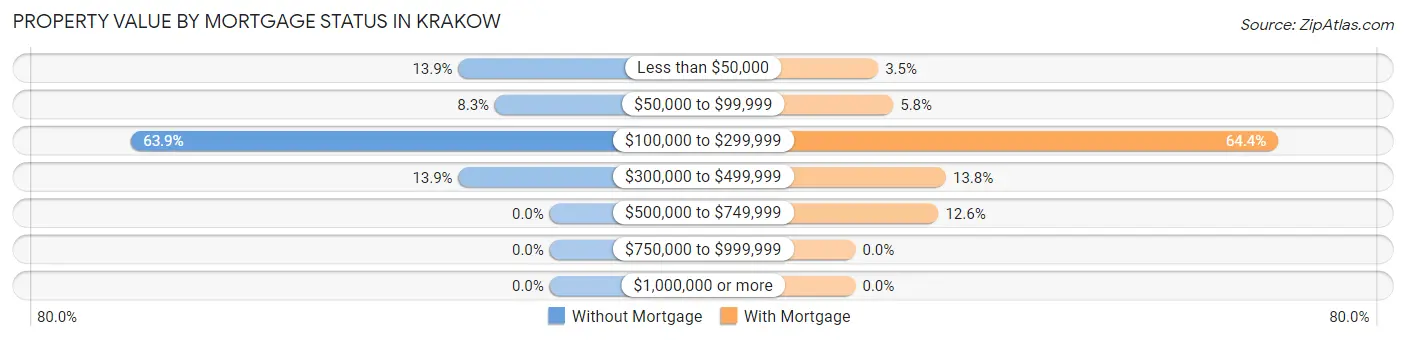
| Property Value | Without Mortgage | With Mortgage |
| Less than $50,000 | 5 (13.9%) | 3 (3.5%) |
| $50,000 to $99,999 | 3 (8.3%) | 5 (5.8%) |
| $100,000 to $299,999 | 23 (63.9%) | 56 (64.4%) |
| $300,000 to $499,999 | 5 (13.9%) | 12 (13.8%) |
| $500,000 to $749,999 | 0 (0.0%) | 11 (12.6%) |
| $750,000 to $999,999 | 0 (0.0%) | 0 (0.0%) |
| $1,000,000 or more | 0 (0.0%) | 0 (0.0%) |
| Total | 36 (100.0%) | 87 (100.0%) |
Household Income by Mortgage Status in Krakow
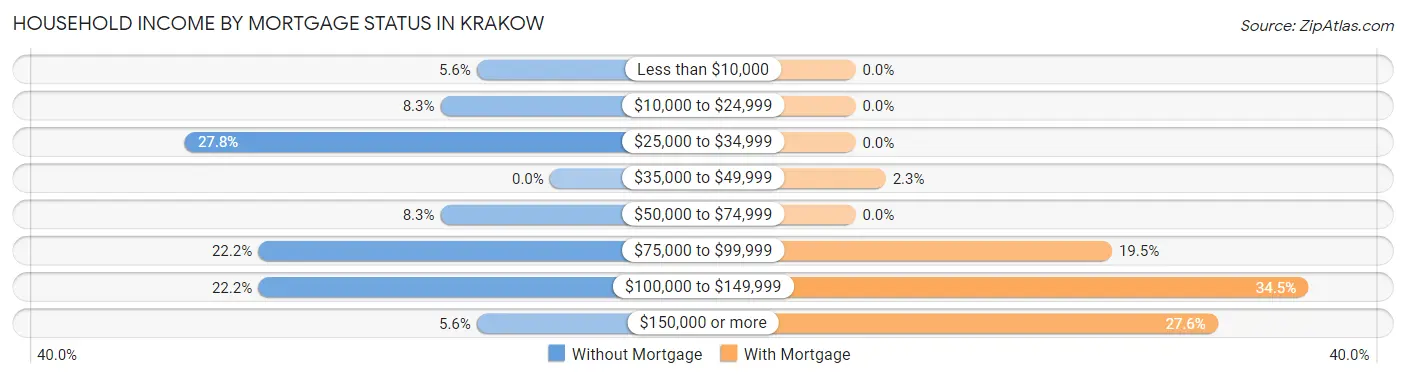
| Household Income | Without Mortgage | With Mortgage |
| Less than $10,000 | 2 (5.6%) | 0 (0.0%) |
| $10,000 to $24,999 | 3 (8.3%) | 0 (0.0%) |
| $25,000 to $34,999 | 10 (27.8%) | 0 (0.0%) |
| $35,000 to $49,999 | 0 (0.0%) | 2 (2.3%) |
| $50,000 to $74,999 | 3 (8.3%) | 0 (0.0%) |
| $75,000 to $99,999 | 8 (22.2%) | 17 (19.5%) |
| $100,000 to $149,999 | 8 (22.2%) | 30 (34.5%) |
| $150,000 or more | 2 (5.6%) | 24 (27.6%) |
| Total | 36 (100.0%) | 87 (100.0%) |
Property Value to Household Income Ratio in Krakow
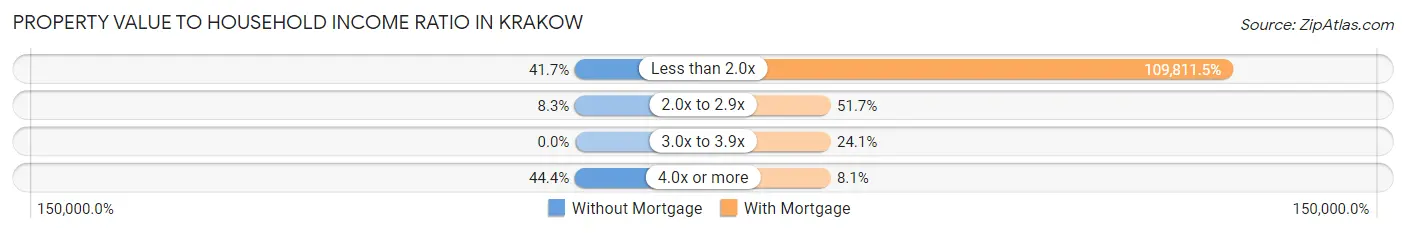
| Value-to-Income Ratio | Without Mortgage | With Mortgage |
| Less than 2.0x | 15 (41.7%) | 95,536 (109,811.5%) |
| 2.0x to 2.9x | 3 (8.3%) | 45 (51.7%) |
| 3.0x to 3.9x | 0 (0.0%) | 21 (24.1%) |
| 4.0x or more | 16 (44.4%) | 7 (8.1%) |
| Total | 36 (100.0%) | 87 (100.0%) |
Real Estate Taxes by Mortgage Status in Krakow
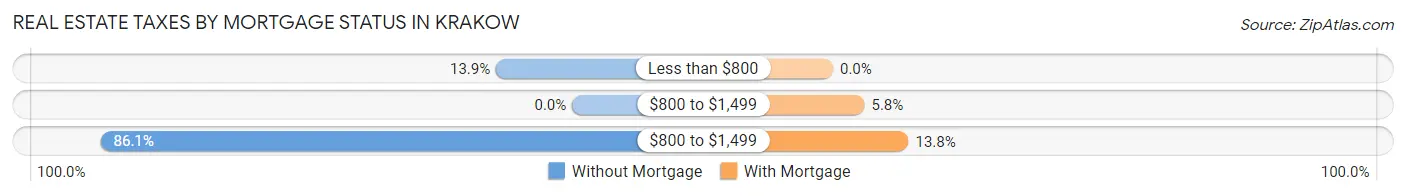
| Property Taxes | Without Mortgage | With Mortgage |
| Less than $800 | 5 (13.9%) | 0 (0.0%) |
| $800 to $1,499 | 0 (0.0%) | 5 (5.8%) |
| $800 to $1,499 | 31 (86.1%) | 12 (13.8%) |
| Total | 36 (100.0%) | 87 (100.0%) |
Health & Disability in Krakow
Health Insurance Coverage by Age in Krakow
| Age Bracket | With Coverage | Without Coverage |
| Under 6 Years | 13 (100.0%) | 0 (0.0%) |
| 6 to 18 Years | 59 (100.0%) | 0 (0.0%) |
| 19 to 25 Years | 19 (100.0%) | 0 (0.0%) |
| 26 to 34 Years | 46 (80.7%) | 11 (19.3%) |
| 35 to 44 Years | 43 (100.0%) | 0 (0.0%) |
| 45 to 54 Years | 37 (100.0%) | 0 (0.0%) |
| 55 to 64 Years | 42 (100.0%) | 0 (0.0%) |
| 65 to 74 Years | 31 (100.0%) | 0 (0.0%) |
| 75 Years and older | 19 (100.0%) | 0 (0.0%) |
| Total | 309 (96.6%) | 11 (3.4%) |
Health Insurance Coverage by Citizenship Status in Krakow
| Citizenship Status | With Coverage | Without Coverage |
| Native Born | 13 (100.0%) | 0 (0.0%) |
| Foreign Born, Citizen | 59 (100.0%) | 0 (0.0%) |
| Foreign Born, not a Citizen | 19 (100.0%) | 0 (0.0%) |
Health Insurance Coverage by Household Income in Krakow
| Household Income | With Coverage | Without Coverage |
| Under $25,000 | 14 (100.0%) | 0 (0.0%) |
| $25,000 to $49,999 | 19 (100.0%) | 0 (0.0%) |
| $50,000 to $74,999 | 49 (90.7%) | 5 (9.3%) |
| $75,000 to $99,999 | 96 (100.0%) | 0 (0.0%) |
| $100,000 and over | 131 (95.6%) | 6 (4.4%) |
Public vs Private Health Insurance Coverage by Age in Krakow
| Age Bracket | Public Insurance | Private Insurance |
| Under 6 | 0 (0.0%) | 13 (100.0%) |
| 6 to 18 Years | 15 (25.4%) | 44 (74.6%) |
| 19 to 25 Years | 0 (0.0%) | 19 (100.0%) |
| 25 to 34 Years | 4 (7.0%) | 42 (73.7%) |
| 35 to 44 Years | 3 (7.0%) | 40 (93.0%) |
| 45 to 54 Years | 3 (8.1%) | 34 (91.9%) |
| 55 to 64 Years | 3 (7.1%) | 42 (100.0%) |
| 65 to 74 Years | 31 (100.0%) | 12 (38.7%) |
| 75 Years and over | 19 (100.0%) | 6 (31.6%) |
| Total | 78 (24.4%) | 252 (78.7%) |
Disability Status by Sex by Age in Krakow
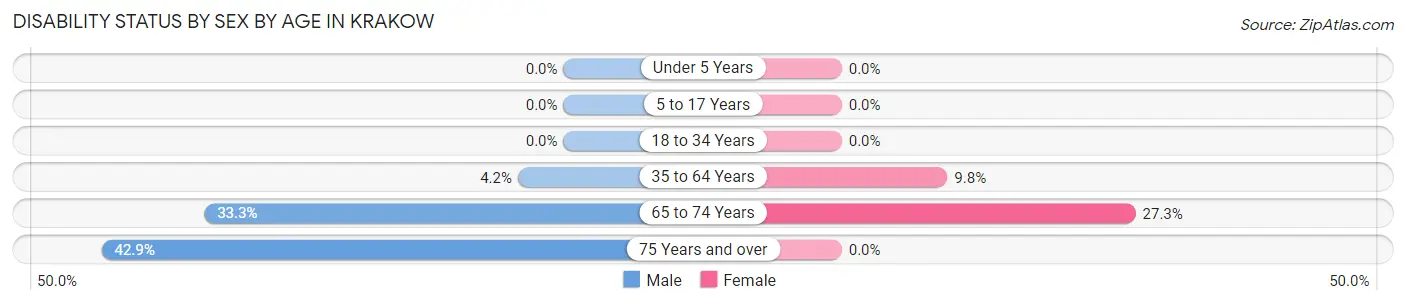
| Age Bracket | Male | Female |
| Under 5 Years | 0 (0.0%) | 0 (0.0%) |
| 5 to 17 Years | 0 (0.0%) | 0 (0.0%) |
| 18 to 34 Years | 0 (0.0%) | 0 (0.0%) |
| 35 to 64 Years | 3 (4.2%) | 5 (9.8%) |
| 65 to 74 Years | 3 (33.3%) | 6 (27.3%) |
| 75 Years and over | 3 (42.9%) | 0 (0.0%) |
Disability Class by Sex by Age in Krakow
Disability Class: Hearing Difficulty
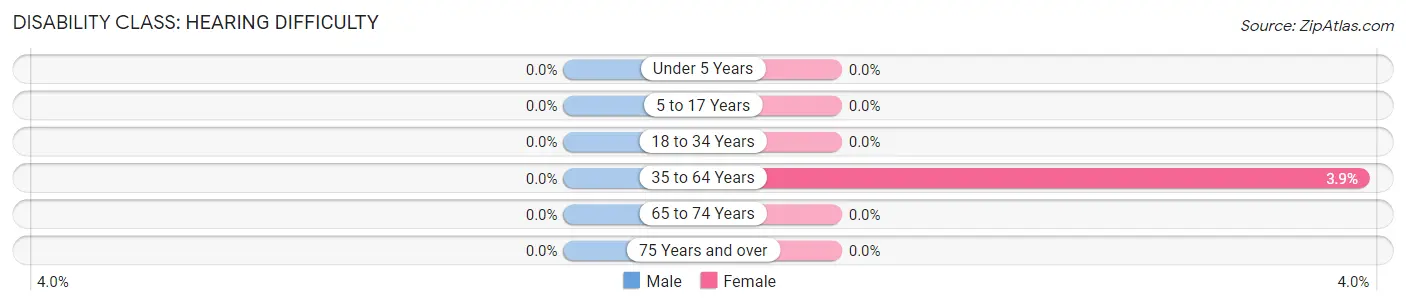
| Age Bracket | Male | Female |
| Under 5 Years | 0 (0.0%) | 0 (0.0%) |
| 5 to 17 Years | 0 (0.0%) | 0 (0.0%) |
| 18 to 34 Years | 0 (0.0%) | 0 (0.0%) |
| 35 to 64 Years | 0 (0.0%) | 2 (3.9%) |
| 65 to 74 Years | 0 (0.0%) | 0 (0.0%) |
| 75 Years and over | 0 (0.0%) | 0 (0.0%) |
Disability Class: Vision Difficulty
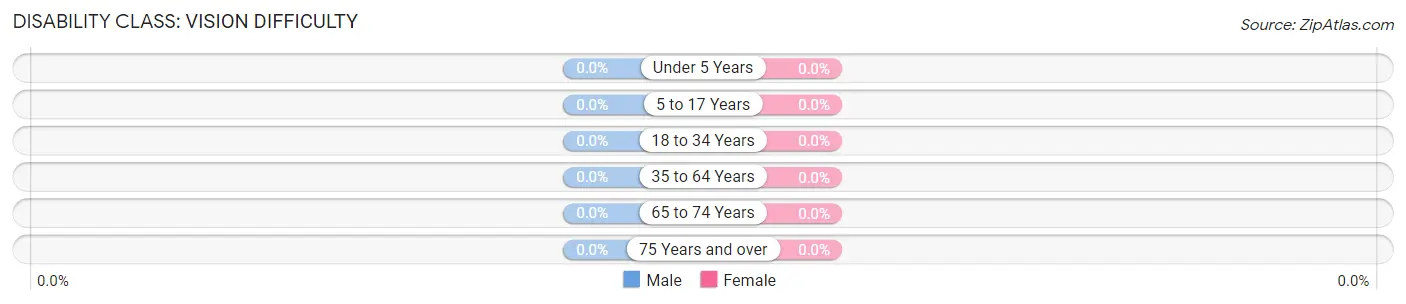
| Age Bracket | Male | Female |
| Under 5 Years | 0 (0.0%) | 0 (0.0%) |
| 5 to 17 Years | 0 (0.0%) | 0 (0.0%) |
| 18 to 34 Years | 0 (0.0%) | 0 (0.0%) |
| 35 to 64 Years | 0 (0.0%) | 0 (0.0%) |
| 65 to 74 Years | 0 (0.0%) | 0 (0.0%) |
| 75 Years and over | 0 (0.0%) | 0 (0.0%) |
Disability Class: Cognitive Difficulty
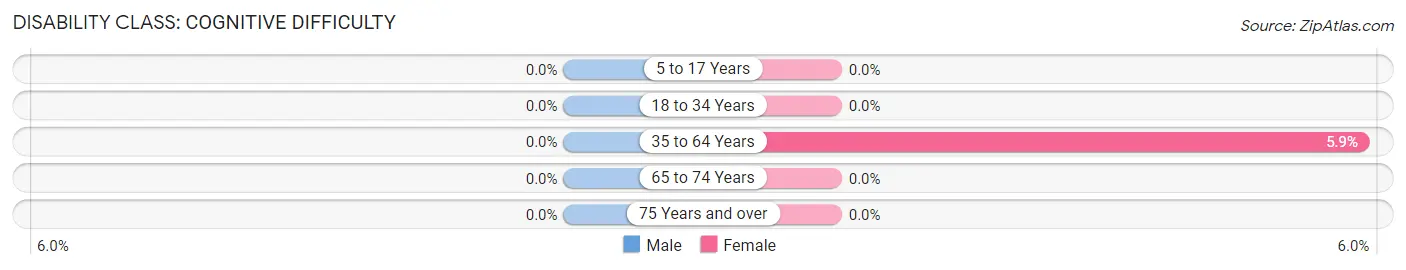
| Age Bracket | Male | Female |
| 5 to 17 Years | 0 (0.0%) | 0 (0.0%) |
| 18 to 34 Years | 0 (0.0%) | 0 (0.0%) |
| 35 to 64 Years | 0 (0.0%) | 3 (5.9%) |
| 65 to 74 Years | 0 (0.0%) | 0 (0.0%) |
| 75 Years and over | 0 (0.0%) | 0 (0.0%) |
Disability Class: Ambulatory Difficulty
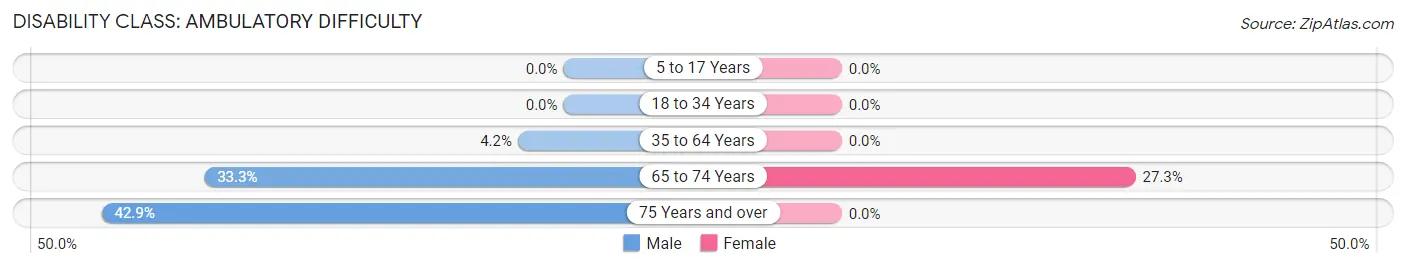
| Age Bracket | Male | Female |
| 5 to 17 Years | 0 (0.0%) | 0 (0.0%) |
| 18 to 34 Years | 0 (0.0%) | 0 (0.0%) |
| 35 to 64 Years | 3 (4.2%) | 0 (0.0%) |
| 65 to 74 Years | 3 (33.3%) | 6 (27.3%) |
| 75 Years and over | 3 (42.9%) | 0 (0.0%) |
Disability Class: Self-Care Difficulty
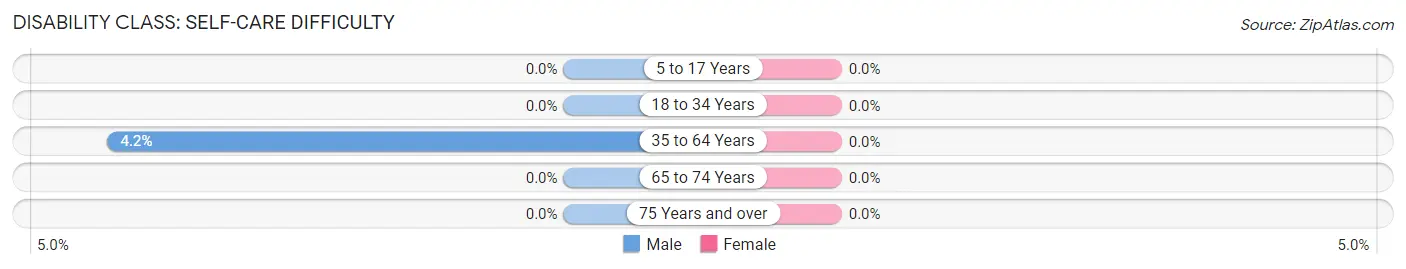
| Age Bracket | Male | Female |
| 5 to 17 Years | 0 (0.0%) | 0 (0.0%) |
| 18 to 34 Years | 0 (0.0%) | 0 (0.0%) |
| 35 to 64 Years | 3 (4.2%) | 0 (0.0%) |
| 65 to 74 Years | 0 (0.0%) | 0 (0.0%) |
| 75 Years and over | 0 (0.0%) | 0 (0.0%) |
Technology Access in Krakow
Computing Device Access in Krakow
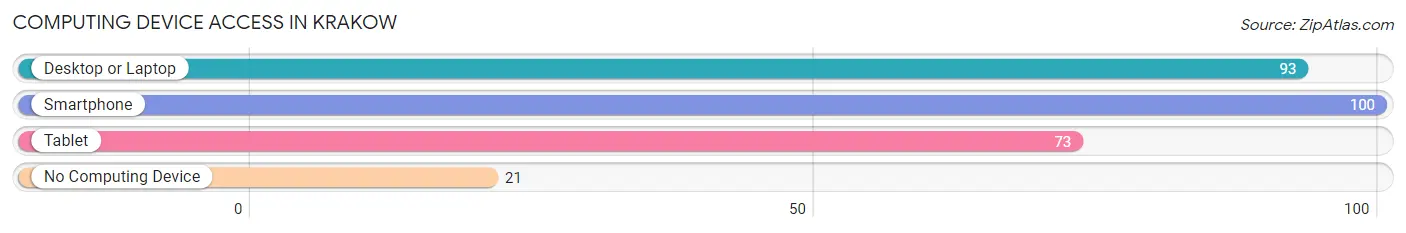
| Device Type | # Households | % Households |
| Desktop or Laptop | 93 | 69.9% |
| Smartphone | 100 | 75.2% |
| Tablet | 73 | 54.9% |
| No Computing Device | 21 | 15.8% |
| Total | 133 | 100.0% |
Internet Access in Krakow
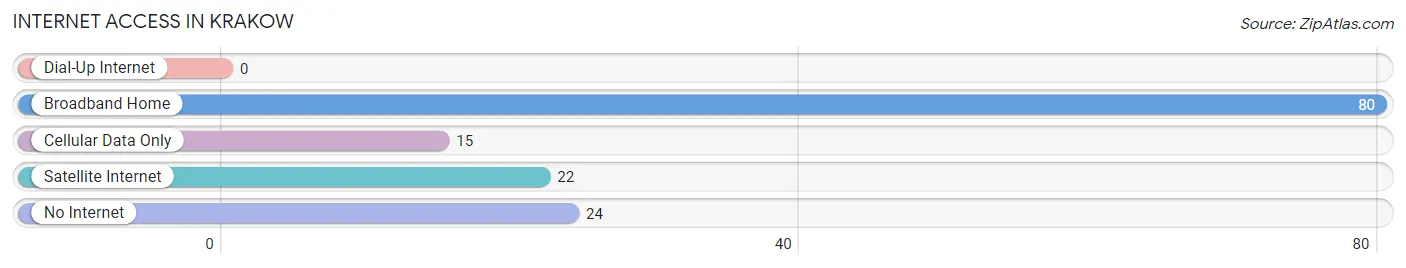
| Internet Type | # Households | % Households |
| Dial-Up Internet | 0 | 0.0% |
| Broadband Home | 80 | 60.2% |
| Cellular Data Only | 15 | 11.3% |
| Satellite Internet | 22 | 16.5% |
| No Internet | 24 | 18.0% |
| Total | 133 | 100.0% |
Krakow Summary
Krakow, Wisconsin is a small village located in the central part of the state, in Shawano County. It is situated on the banks of the Wolf River, and is surrounded by rolling hills and forests. The village has a population of just over 500 people, and is known for its small-town charm and friendly atmosphere.
History
Krakow was founded in 1854 by a group of Polish immigrants who had come to the United States in search of a better life. The village was named after the city of Krakow in Poland, and the settlers quickly established a thriving community. The village was incorporated in 1876, and the first mayor was elected in 1877.
The village grew steadily over the years, and by the early 1900s, it had become a bustling center of commerce and industry. The village was home to several factories, including a sawmill, a flour mill, and a cheese factory. The village also had a number of stores, including a general store, a hardware store, and a drug store.
Geography
Krakow is located in the central part of Wisconsin, in Shawano County. It is situated on the banks of the Wolf River, and is surrounded by rolling hills and forests. The village is located about 25 miles north of Green Bay, and about 50 miles south of Wausau.
The village has a total area of 0.7 square miles, all of which is land. The village is located at an elevation of 845 feet above sea level. The climate in Krakow is classified as humid continental, with cold winters and warm summers.
Economy
Krakow’s economy is largely based on agriculture and tourism. The village is home to several farms, which produce a variety of crops, including corn, soybeans, and hay. The village also has a number of small businesses, including a grocery store, a hardware store, and a restaurant.
Tourism is an important part of the local economy, as the village is a popular destination for outdoor enthusiasts. The village is home to several parks, including the Wolf River State Wildlife Area, which offers camping, fishing, and hiking opportunities. The village also has a number of historic sites, including the Krakow Historical Museum and the Krakow Mill.
Demographics
As of the 2010 census, the village of Krakow had a population of 517 people. The racial makeup of the village was 97.3% White, 0.4% African American, 0.2% Native American, 0.2% Asian, 0.2% from other races, and 1.7% from two or more races. Hispanic or Latino of any race were 1.2% of the population.
The median household income in Krakow was $41,250, and the median family income was $50,000. The per capita income for the village was $20,845. About 8.3% of families and 10.2% of the population were below the poverty line, including 14.3% of those under the age of 18 and none of those 65 and older.
Common Questions
What is Per Capita Income in Krakow?
Per Capita income in Krakow is $42,044.
What is the Median Family Income in Krakow?
Median Family Income in Krakow is $91,667.
What is the Median Household income in Krakow?
Median Household Income in Krakow is $93,365.
What is Income or Wage Gap in Krakow?
Income or Wage Gap in Krakow is 30.2%.
Women in Krakow earn 69.8 cents for every dollar earned by a man.
What is Inequality or Gini Index in Krakow?
Inequality or Gini Index in Krakow is 0.34.
What is the Total Population of Krakow?
Total Population of Krakow is 320.
What is the Total Male Population of Krakow?
Total Male Population of Krakow is 164.
What is the Total Female Population of Krakow?
Total Female Population of Krakow is 156.
What is the Ratio of Males per 100 Females in Krakow?
There are 105.13 Males per 100 Females in Krakow.
What is the Ratio of Females per 100 Males in Krakow?
There are 95.12 Females per 100 Males in Krakow.
What is the Median Population Age in Krakow?
Median Population Age in Krakow is 38.3 Years.
What is the Average Family Size in Krakow
Average Family Size in Krakow is 2.9 People.
What is the Average Household Size in Krakow
Average Household Size in Krakow is 2.4 People.
How Large is the Labor Force in Krakow?
There are 175 People in the Labor Forcein in Krakow.
What is the Percentage of People in the Labor Force in Krakow?
69.4% of People are in the Labor Force in Krakow.