Kohler, WI Map & Demographics
Kohler Map
Kohler Overview
$71,550
PER CAPITA INCOME
$142,989
AVG FAMILY INCOME
$128,036
AVG HOUSEHOLD INCOME
63.6%
WAGE / INCOME GAP [ % ]
36.4¢/ $1
WAGE / INCOME GAP [ $ ]
0.47
INEQUALITY / GINI INDEX
2,142
TOTAL POPULATION
1,017
MALE POPULATION
1,125
FEMALE POPULATION
90.40
MALES / 100 FEMALES
110.62
FEMALES / 100 MALES
42.3
MEDIAN AGE
3.1
AVG FAMILY SIZE
2.7
AVG HOUSEHOLD SIZE
1,091
LABOR FORCE [ PEOPLE ]
65.7%
PERCENT IN LABOR FORCE
4.0%
UNEMPLOYMENT RATE
Kohler Zip Codes
Kohler Area Codes
Income in Kohler
Income Overview in Kohler
Per Capita Income in Kohler is $71,550, while median incomes of families and households are $142,989 and $128,036 respectively.
| Characteristic | Number | Measure |
| Per Capita Income | 2,142 | $71,550 |
| Median Family Income | 627 | $142,989 |
| Mean Family Income | 627 | $204,719 |
| Median Household Income | 793 | $128,036 |
| Mean Household Income | 793 | $189,892 |
| Income Deficit | 627 | $0 |
| Wage / Income Gap (%) | 2,142 | 63.57% |
| Wage / Income Gap ($) | 2,142 | 36.43¢ per $1 |
| Gini / Inequality Index | 2,142 | 0.47 |
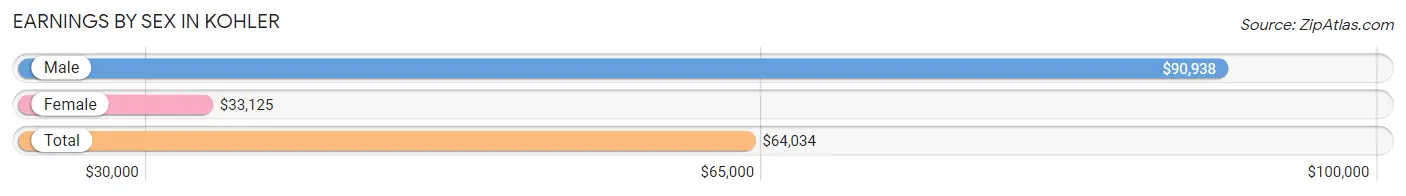
Earnings by Sex in Kohler
Average Earnings in Kohler are $64,034, $90,938 for men and $33,125 for women, a difference of 63.6%.
| Sex | Number | Average Earnings |
| Male | 619 (52.9%) | $90,938 |
| Female | 552 (47.1%) | $33,125 |
| Total | 1,171 (100.0%) | $64,034 |
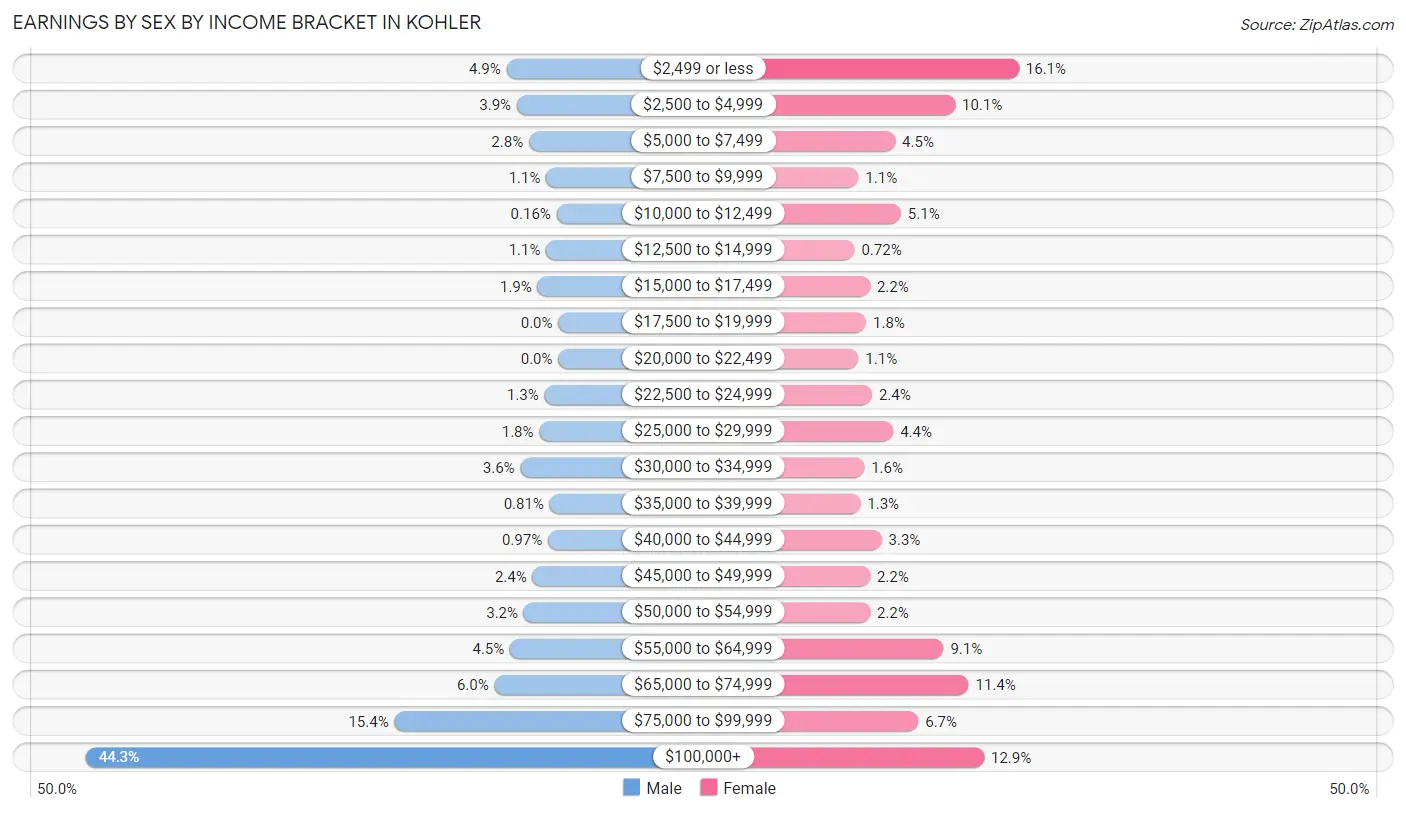
Earnings by Sex by Income Bracket in Kohler
The most common earnings brackets in Kohler are $100,000+ for men (274 | 44.3%) and $2,499 or less for women (89 | 16.1%).
| Income | Male | Female |
| $2,499 or less | 30 (4.9%) | 89 (16.1%) |
| $2,500 to $4,999 | 24 (3.9%) | 56 (10.1%) |
| $5,000 to $7,499 | 17 (2.8%) | 25 (4.5%) |
| $7,500 to $9,999 | 7 (1.1%) | 6 (1.1%) |
| $10,000 to $12,499 | 1 (0.2%) | 28 (5.1%) |
| $12,500 to $14,999 | 7 (1.1%) | 4 (0.7%) |
| $15,000 to $17,499 | 12 (1.9%) | 12 (2.2%) |
| $17,500 to $19,999 | 0 (0.0%) | 10 (1.8%) |
| $20,000 to $22,499 | 0 (0.0%) | 6 (1.1%) |
| $22,500 to $24,999 | 8 (1.3%) | 13 (2.4%) |
| $25,000 to $29,999 | 11 (1.8%) | 24 (4.3%) |
| $30,000 to $34,999 | 22 (3.5%) | 9 (1.6%) |
| $35,000 to $39,999 | 5 (0.8%) | 7 (1.3%) |
| $40,000 to $44,999 | 6 (1.0%) | 18 (3.3%) |
| $45,000 to $49,999 | 15 (2.4%) | 12 (2.2%) |
| $50,000 to $54,999 | 20 (3.2%) | 12 (2.2%) |
| $55,000 to $64,999 | 28 (4.5%) | 50 (9.1%) |
| $65,000 to $74,999 | 37 (6.0%) | 63 (11.4%) |
| $75,000 to $99,999 | 95 (15.3%) | 37 (6.7%) |
| $100,000+ | 274 (44.3%) | 71 (12.9%) |
| Total | 619 (100.0%) | 552 (100.0%) |
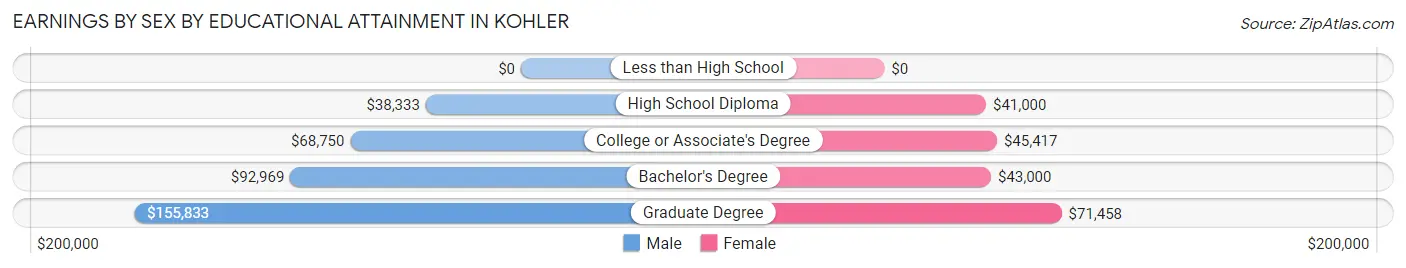
Earnings by Sex by Educational Attainment in Kohler
Average earnings in Kohler are $102,500 for men and $56,875 for women, a difference of 44.5%. Men with an educational attainment of graduate degree enjoy the highest average annual earnings of $155,833, while those with high school diploma education earn the least with $38,333. Women with an educational attainment of graduate degree earn the most with the average annual earnings of $71,458, while those with high school diploma education have the smallest earnings of $41,000.
| Educational Attainment | Male Income | Female Income |
| Less than High School | - | - |
| High School Diploma | $38,333 | $41,000 |
| College or Associate's Degree | $68,750 | $45,417 |
| Bachelor's Degree | $92,969 | $43,000 |
| Graduate Degree | $155,833 | $71,458 |
| Total | $102,500 | $56,875 |
Family Income in Kohler
Family Income Brackets in Kohler
According to the Kohler family income data, there are 195 families falling into the $100,000 to $149,999 income range, which is the most common income bracket and makes up 31.1% of all families.
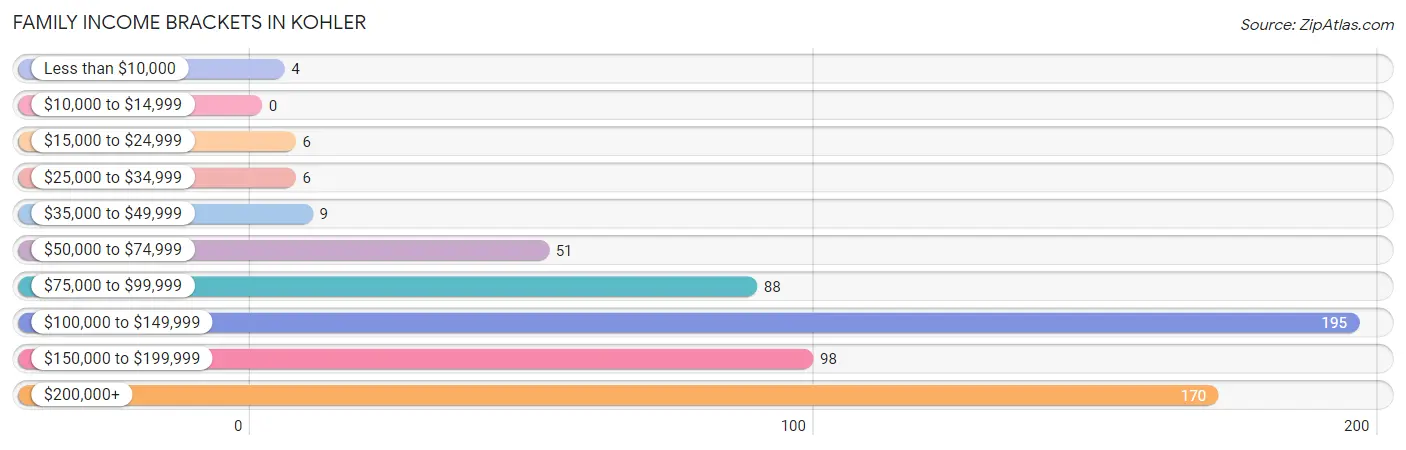
| Income Bracket | # Families | % Families |
| Less than $10,000 | 4 | 0.6% |
| $10,000 to $14,999 | 0 | 0.0% |
| $15,000 to $24,999 | 6 | 1.0% |
| $25,000 to $34,999 | 6 | 1.0% |
| $35,000 to $49,999 | 9 | 1.4% |
| $50,000 to $74,999 | 51 | 8.1% |
| $75,000 to $99,999 | 88 | 14.0% |
| $100,000 to $149,999 | 195 | 31.1% |
| $150,000 to $199,999 | 98 | 15.6% |
| $200,000+ | 170 | 27.1% |
Family Income by Famaliy Size in Kohler
6-person families (13 | 2.1%) account for the highest median family income in Kohler with $209,688 per family, while 2-person families (297 | 47.4%) have the highest median income of $61,406 per family member.
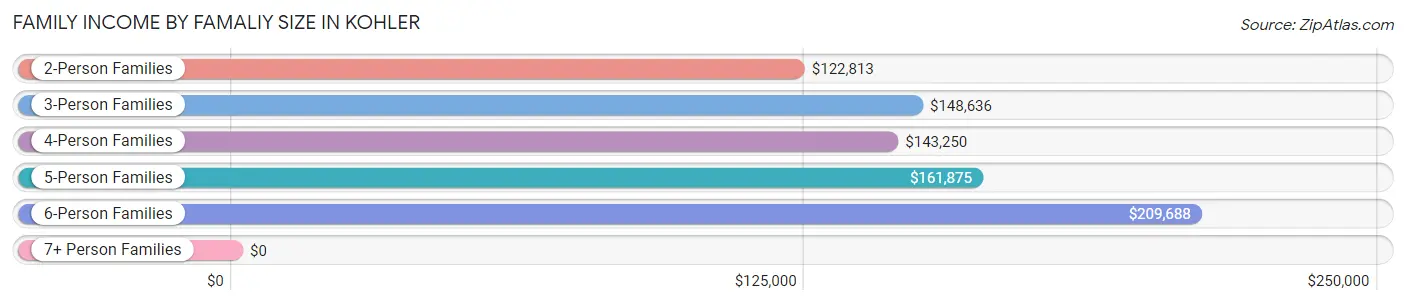
| Income Bracket | # Families | Median Income |
| 2-Person Families | 297 (47.4%) | $122,813 |
| 3-Person Families | 106 (16.9%) | $148,636 |
| 4-Person Families | 144 (23.0%) | $143,250 |
| 5-Person Families | 63 (10.1%) | $161,875 |
| 6-Person Families | 13 (2.1%) | $209,688 |
| 7+ Person Families | 4 (0.6%) | $0 |
| Total | 627 (100.0%) | $142,989 |
Family Income by Number of Earners in Kohler
The median family income in Kohler is $142,989, with families comprising 3+ earners (116) having the highest median family income of $155,000, while families with no earners (107) have the lowest median family income of $88,188, accounting for 18.5% and 17.1% of families, respectively.
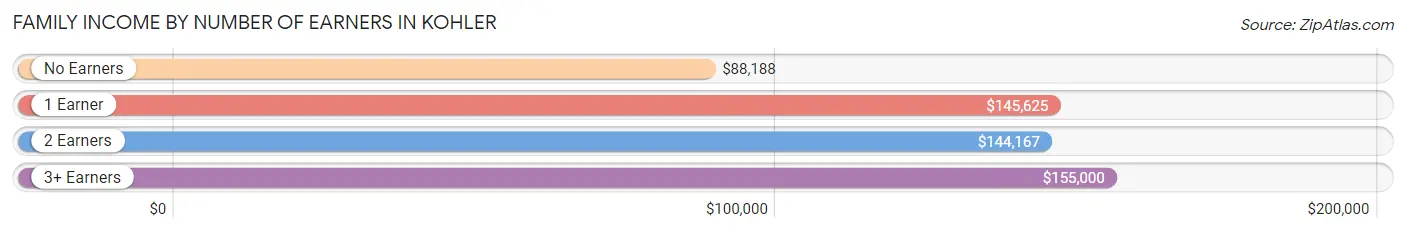
| Number of Earners | # Families | Median Income |
| No Earners | 107 (17.1%) | $88,188 |
| 1 Earner | 172 (27.4%) | $145,625 |
| 2 Earners | 232 (37.0%) | $144,167 |
| 3+ Earners | 116 (18.5%) | $155,000 |
| Total | 627 (100.0%) | $142,989 |
Household Income in Kohler
Household Income Brackets in Kohler
With 228 households falling in the category, the $100,000 to $149,999 income range is the most frequent in Kohler, accounting for 28.7% of all households.
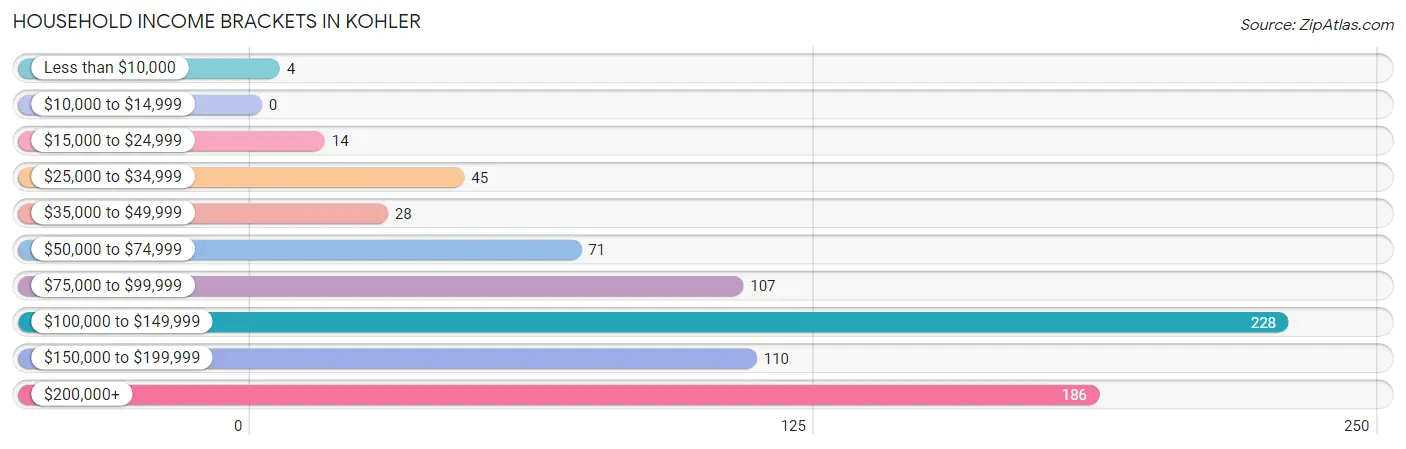
| Income Bracket | # Households | % Households |
| Less than $10,000 | 4 | 0.5% |
| $10,000 to $14,999 | 0 | 0.0% |
| $15,000 to $24,999 | 14 | 1.8% |
| $25,000 to $34,999 | 45 | 5.7% |
| $35,000 to $49,999 | 28 | 3.5% |
| $50,000 to $74,999 | 71 | 9.0% |
| $75,000 to $99,999 | 107 | 13.5% |
| $100,000 to $149,999 | 228 | 28.8% |
| $150,000 to $199,999 | 110 | 13.9% |
| $200,000+ | 186 | 23.5% |
Household Income by Householder Age in Kohler
The median household income in Kohler is $128,036, with the highest median household income of $164,028 found in the 45 to 64 years age bracket for the primary householder. A total of 282 households (35.6%) fall into this category.
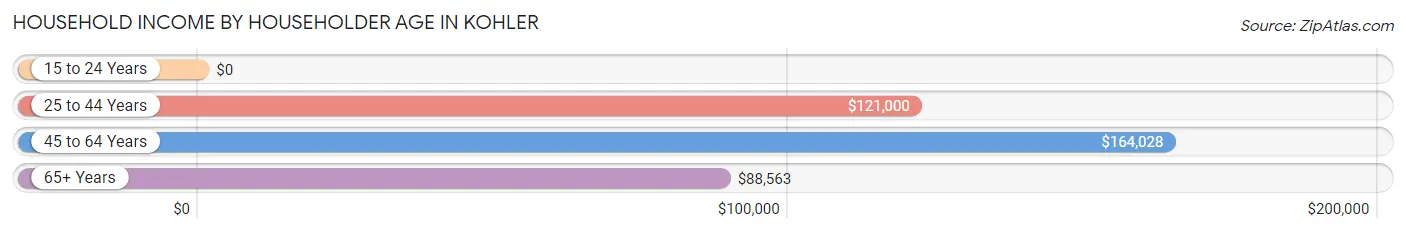
| Income Bracket | # Households | Median Income |
| 15 to 24 Years | 0 (0.0%) | $0 |
| 25 to 44 Years | 228 (28.7%) | $121,000 |
| 45 to 64 Years | 282 (35.6%) | $164,028 |
| 65+ Years | 283 (35.7%) | $88,563 |
| Total | 793 (100.0%) | $128,036 |
Poverty in Kohler
Income Below Poverty by Sex and Age in Kohler
With 0.7% poverty level for males and 0.6% for females among the residents of Kohler, 65 to 74 year old males and 55 to 64 year old females are the most vulnerable to poverty, with 7 males (5.7%) and 3 females (2.9%) in their respective age groups living below the poverty level.
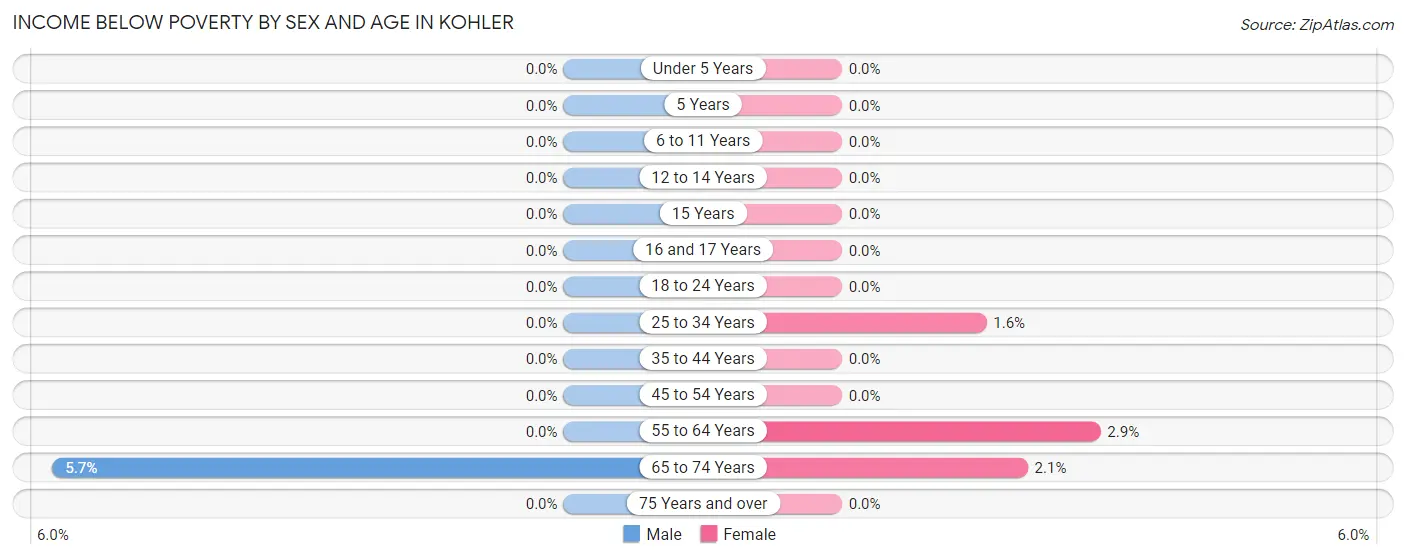
| Age Bracket | Male | Female |
| Under 5 Years | 0 (0.0%) | 0 (0.0%) |
| 5 Years | 0 (0.0%) | 0 (0.0%) |
| 6 to 11 Years | 0 (0.0%) | 0 (0.0%) |
| 12 to 14 Years | 0 (0.0%) | 0 (0.0%) |
| 15 Years | 0 (0.0%) | 0 (0.0%) |
| 16 and 17 Years | 0 (0.0%) | 0 (0.0%) |
| 18 to 24 Years | 0 (0.0%) | 0 (0.0%) |
| 25 to 34 Years | 0 (0.0%) | 1 (1.6%) |
| 35 to 44 Years | 0 (0.0%) | 0 (0.0%) |
| 45 to 54 Years | 0 (0.0%) | 0 (0.0%) |
| 55 to 64 Years | 0 (0.0%) | 3 (2.9%) |
| 65 to 74 Years | 7 (5.7%) | 3 (2.1%) |
| 75 Years and over | 0 (0.0%) | 0 (0.0%) |
| Total | 7 (0.7%) | 7 (0.6%) |
Income Above Poverty by Sex and Age in Kohler
According to the poverty statistics in Kohler, males aged under 5 years and females aged under 5 years are the age groups that are most secure financially, with 100.0% of males and 100.0% of females in these age groups living above the poverty line.
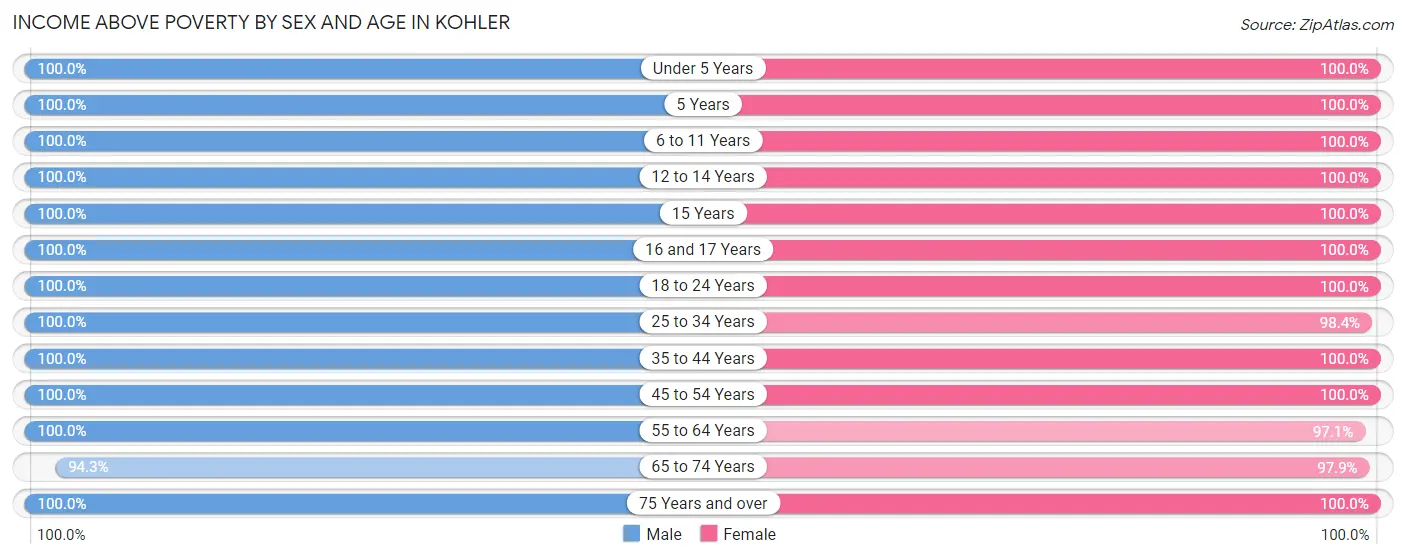
| Age Bracket | Male | Female |
| Under 5 Years | 57 (100.0%) | 37 (100.0%) |
| 5 Years | 12 (100.0%) | 26 (100.0%) |
| 6 to 11 Years | 131 (100.0%) | 73 (100.0%) |
| 12 to 14 Years | 36 (100.0%) | 65 (100.0%) |
| 15 Years | 7 (100.0%) | 38 (100.0%) |
| 16 and 17 Years | 35 (100.0%) | 82 (100.0%) |
| 18 to 24 Years | 52 (100.0%) | 74 (100.0%) |
| 25 to 34 Years | 58 (100.0%) | 61 (98.4%) |
| 35 to 44 Years | 152 (100.0%) | 163 (100.0%) |
| 45 to 54 Years | 152 (100.0%) | 172 (100.0%) |
| 55 to 64 Years | 119 (100.0%) | 101 (97.1%) |
| 65 to 74 Years | 116 (94.3%) | 142 (97.9%) |
| 75 Years and over | 83 (100.0%) | 84 (100.0%) |
| Total | 1,010 (99.3%) | 1,118 (99.4%) |
Income Below Poverty Among Married-Couple Families in Kohler
The poverty statistics for married-couple families in Kohler show that 1.2% or 7 of the total 577 families live below the poverty line. Families with no children have the highest poverty rate of 2.3%, comprising of 7 families. On the other hand, families with 1 or 2 children have the lowest poverty rate of 0.0%, which includes 0 families.
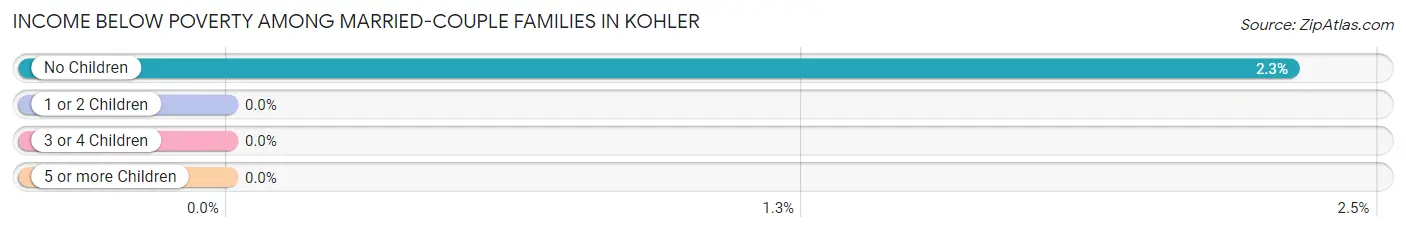
| Children | Above Poverty | Below Poverty |
| No Children | 296 (97.7%) | 7 (2.3%) |
| 1 or 2 Children | 213 (100.0%) | 0 (0.0%) |
| 3 or 4 Children | 57 (100.0%) | 0 (0.0%) |
| 5 or more Children | 4 (100.0%) | 0 (0.0%) |
| Total | 570 (98.8%) | 7 (1.2%) |
Income Below Poverty Among Single-Parent Households in Kohler
| Children | Single Father | Single Mother |
| No Children | 0 (0.0%) | 0 (0.0%) |
| 1 or 2 Children | 0 (0.0%) | 0 (0.0%) |
| 3 or 4 Children | 0 (0.0%) | 0 (0.0%) |
| 5 or more Children | 0 (0.0%) | 0 (0.0%) |
| Total | 0 (0.0%) | 0 (0.0%) |
Income Below Poverty Among Married-Couple vs Single-Parent Households in Kohler
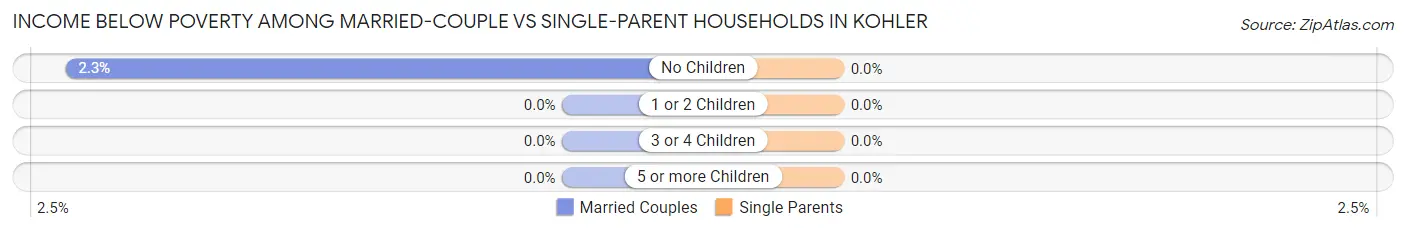
| Children | Married-Couple Families | Single-Parent Households |
| No Children | 7 (2.3%) | 0 (0.0%) |
| 1 or 2 Children | 0 (0.0%) | 0 (0.0%) |
| 3 or 4 Children | 0 (0.0%) | 0 (0.0%) |
| 5 or more Children | 0 (0.0%) | 0 (0.0%) |
| Total | 7 (1.2%) | 0 (0.0%) |
Race in Kohler
The most populous races in Kohler are White / Caucasian (2,008 | 93.7%), Hispanic or Latino (94 | 4.4%), and Two or more Races (67 | 3.1%).
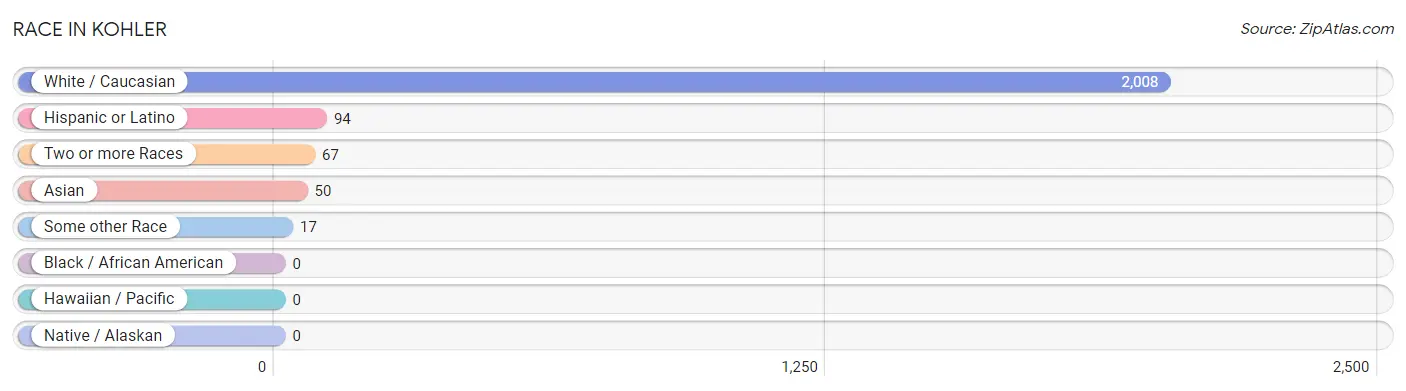
| Race | # Population | % Population |
| Asian | 50 | 2.3% |
| Black / African American | 0 | 0.0% |
| Hawaiian / Pacific | 0 | 0.0% |
| Hispanic or Latino | 94 | 4.4% |
| Native / Alaskan | 0 | 0.0% |
| White / Caucasian | 2,008 | 93.7% |
| Two or more Races | 67 | 3.1% |
| Some other Race | 17 | 0.8% |
| Total | 2,142 | 100.0% |
Ancestry in Kohler
The most populous ancestries reported in Kohler are German (1,010 | 47.1%), Irish (265 | 12.4%), Swedish (132 | 6.2%), French (122 | 5.7%), and Dutch (114 | 5.3%), together accounting for 76.7% of all Kohler residents.
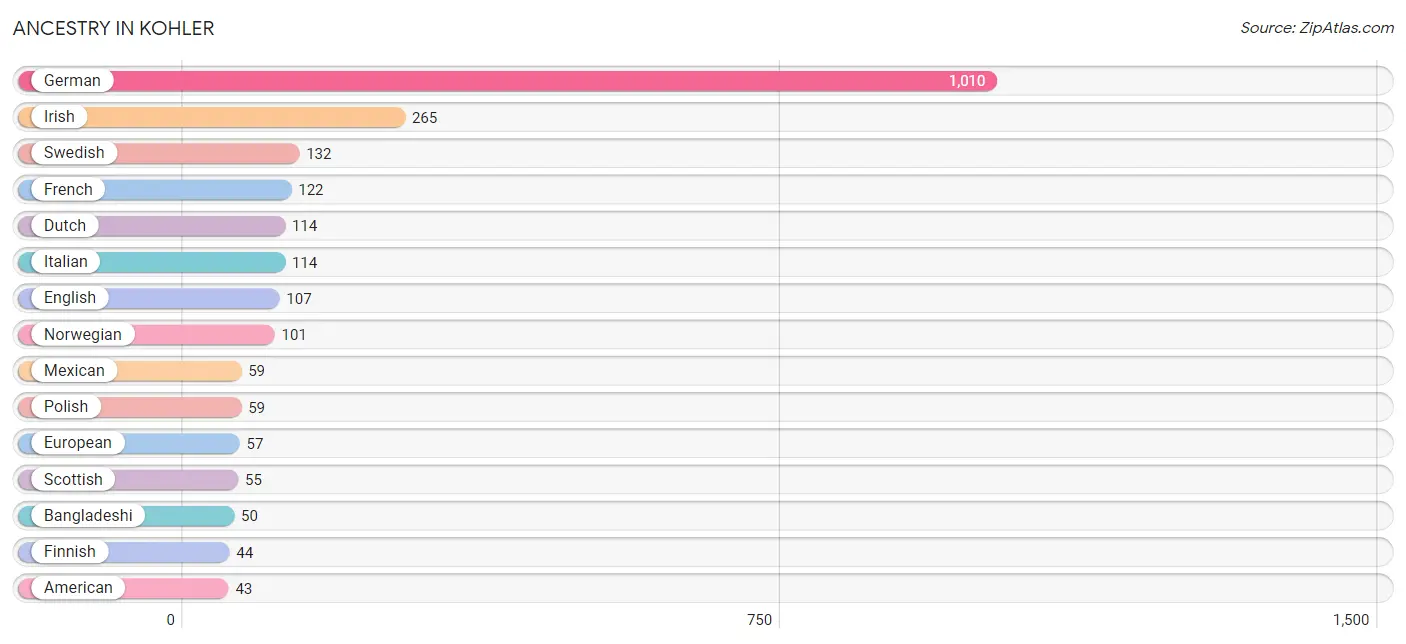
| Ancestry | # Population | % Population |
| African | 7 | 0.3% |
| American | 43 | 2.0% |
| Austrian | 13 | 0.6% |
| Bangladeshi | 50 | 2.3% |
| Belgian | 2 | 0.1% |
| British | 9 | 0.4% |
| Canadian | 4 | 0.2% |
| Central American | 27 | 1.3% |
| Chilean | 6 | 0.3% |
| Croatian | 3 | 0.1% |
| Czechoslovakian | 2 | 0.1% |
| Danish | 15 | 0.7% |
| Dutch | 114 | 5.3% |
| Eastern European | 8 | 0.4% |
| Ecuadorian | 2 | 0.1% |
| English | 107 | 5.0% |
| European | 57 | 2.7% |
| Finnish | 44 | 2.1% |
| French | 122 | 5.7% |
| French Canadian | 31 | 1.5% |
| German | 1,010 | 47.1% |
| Greek | 20 | 0.9% |
| Guatemalan | 4 | 0.2% |
| Iranian | 7 | 0.3% |
| Irish | 265 | 12.4% |
| Italian | 114 | 5.3% |
| Lithuanian | 41 | 1.9% |
| Luxembourger | 20 | 0.9% |
| Mexican | 59 | 2.8% |
| Northern European | 21 | 1.0% |
| Norwegian | 101 | 4.7% |
| Polish | 59 | 2.8% |
| Russian | 10 | 0.5% |
| Salvadoran | 23 | 1.1% |
| Scandinavian | 39 | 1.8% |
| Scotch-Irish | 14 | 0.6% |
| Scottish | 55 | 2.6% |
| South American | 8 | 0.4% |
| Subsaharan African | 7 | 0.3% |
| Swedish | 132 | 6.2% |
| Swiss | 5 | 0.2% |
| Welsh | 19 | 0.9% | View All 42 Rows |
Immigrants in Kohler
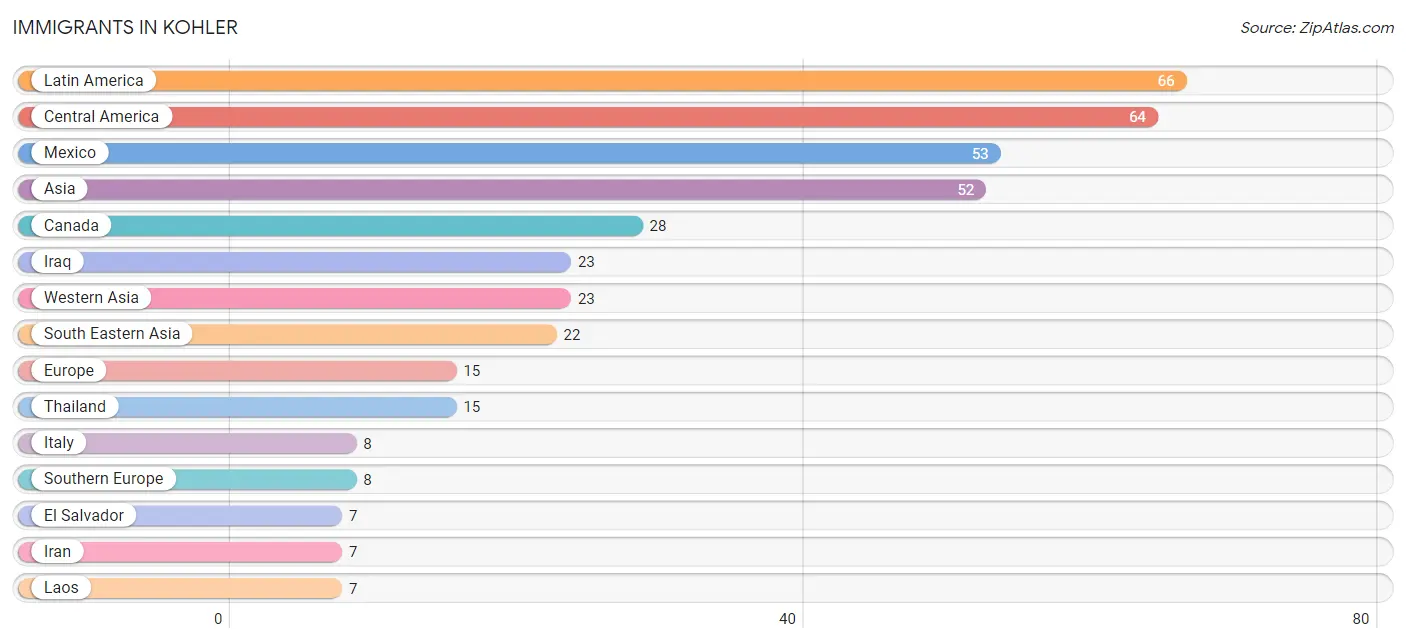
The most numerous immigrant groups reported in Kohler came from Latin America (66 | 3.1%), Central America (64 | 3.0%), Mexico (53 | 2.5%), Asia (52 | 2.4%), and Canada (28 | 1.3%), together accounting for 12.3% of all Kohler residents.
| Immigration Origin | # Population | % Population |
| Asia | 52 | 2.4% |
| Canada | 28 | 1.3% |
| Central America | 64 | 3.0% |
| Ecuador | 2 | 0.1% |
| El Salvador | 7 | 0.3% |
| Europe | 15 | 0.7% |
| Germany | 2 | 0.1% |
| Guatemala | 4 | 0.2% |
| Iran | 7 | 0.3% |
| Iraq | 23 | 1.1% |
| Italy | 8 | 0.4% |
| Laos | 7 | 0.3% |
| Latin America | 66 | 3.1% |
| Mexico | 53 | 2.5% |
| Netherlands | 5 | 0.2% |
| South America | 2 | 0.1% |
| South Central Asia | 7 | 0.3% |
| South Eastern Asia | 22 | 1.0% |
| Southern Europe | 8 | 0.4% |
| Thailand | 15 | 0.7% |
| Western Asia | 23 | 1.1% |
| Western Europe | 7 | 0.3% | View All 22 Rows |
Sex and Age in Kohler
Sex and Age in Kohler
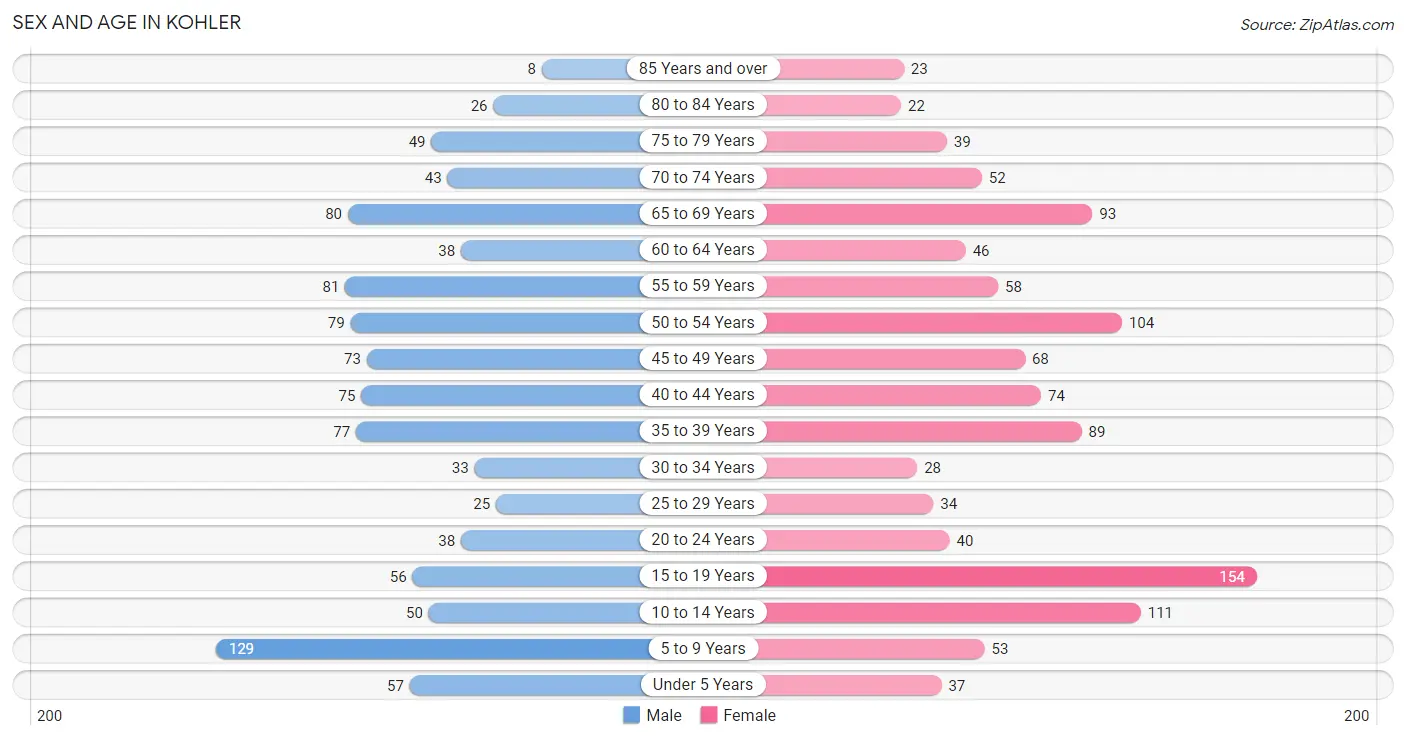
The most populous age groups in Kohler are 5 to 9 Years (129 | 12.7%) for men and 15 to 19 Years (154 | 13.7%) for women.
| Age Bracket | Male | Female |
| Under 5 Years | 57 (5.6%) | 37 (3.3%) |
| 5 to 9 Years | 129 (12.7%) | 53 (4.7%) |
| 10 to 14 Years | 50 (4.9%) | 111 (9.9%) |
| 15 to 19 Years | 56 (5.5%) | 154 (13.7%) |
| 20 to 24 Years | 38 (3.7%) | 40 (3.6%) |
| 25 to 29 Years | 25 (2.5%) | 34 (3.0%) |
| 30 to 34 Years | 33 (3.2%) | 28 (2.5%) |
| 35 to 39 Years | 77 (7.6%) | 89 (7.9%) |
| 40 to 44 Years | 75 (7.4%) | 74 (6.6%) |
| 45 to 49 Years | 73 (7.2%) | 68 (6.0%) |
| 50 to 54 Years | 79 (7.8%) | 104 (9.2%) |
| 55 to 59 Years | 81 (8.0%) | 58 (5.2%) |
| 60 to 64 Years | 38 (3.7%) | 46 (4.1%) |
| 65 to 69 Years | 80 (7.9%) | 93 (8.3%) |
| 70 to 74 Years | 43 (4.2%) | 52 (4.6%) |
| 75 to 79 Years | 49 (4.8%) | 39 (3.5%) |
| 80 to 84 Years | 26 (2.6%) | 22 (2.0%) |
| 85 Years and over | 8 (0.8%) | 23 (2.0%) |
| Total | 1,017 (100.0%) | 1,125 (100.0%) |
Families and Households in Kohler
Median Family Size in Kohler
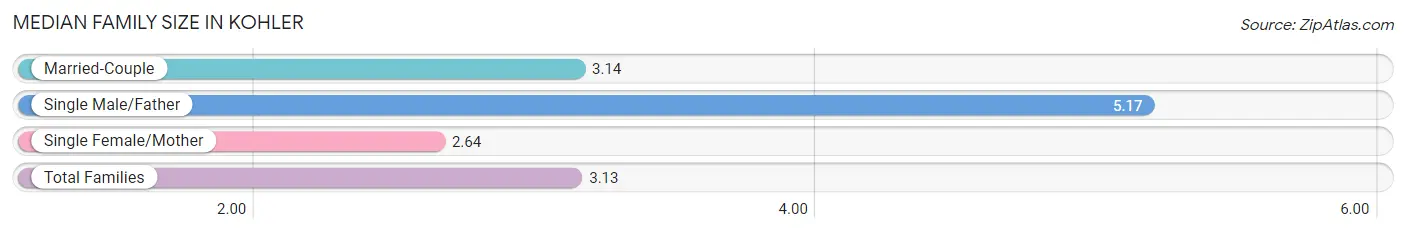
The median family size in Kohler is 3.13 persons per family, with single male/father families (6 | 1.0%) accounting for the largest median family size of 5.17 persons per family. On the other hand, single female/mother families (44 | 7.0%) represent the smallest median family size with 2.64 persons per family.
| Family Type | # Families | Family Size |
| Married-Couple | 577 (92.0%) | 3.14 |
| Single Male/Father | 6 (1.0%) | 5.17 |
| Single Female/Mother | 44 (7.0%) | 2.64 |
| Total Families | 627 (100.0%) | 3.13 |
Median Household Size in Kohler
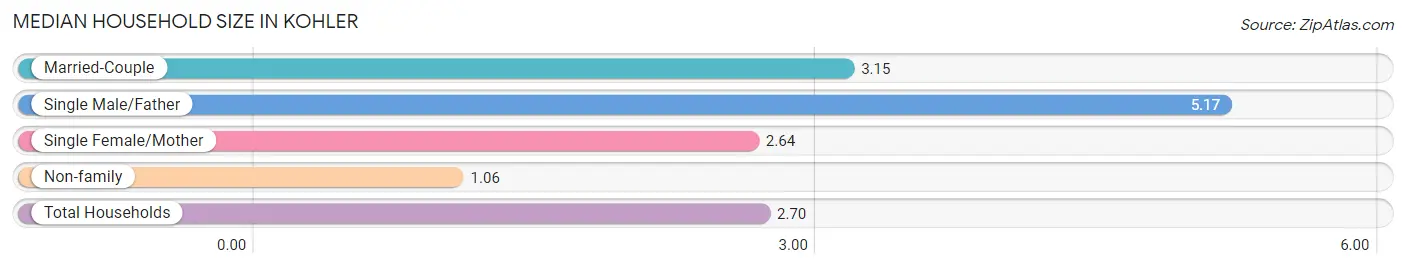
The median household size in Kohler is 2.70 persons per household, with single male/father households (6 | 0.8%) accounting for the largest median household size of 5.17 persons per household. non-family households (166 | 20.9%) represent the smallest median household size with 1.06 persons per household.
| Household Type | # Households | Household Size |
| Married-Couple | 577 (72.8%) | 3.15 |
| Single Male/Father | 6 (0.8%) | 5.17 |
| Single Female/Mother | 44 (5.6%) | 2.64 |
| Non-family | 166 (20.9%) | 1.06 |
| Total Households | 793 (100.0%) | 2.70 |
Household Size by Marriage Status in Kohler
Out of a total of 793 households in Kohler, 627 (79.1%) are family households, while 166 (20.9%) are nonfamily households. The most numerous type of family households are 2-person households, comprising 296, and the most common type of nonfamily households are 1-person households, comprising 160.
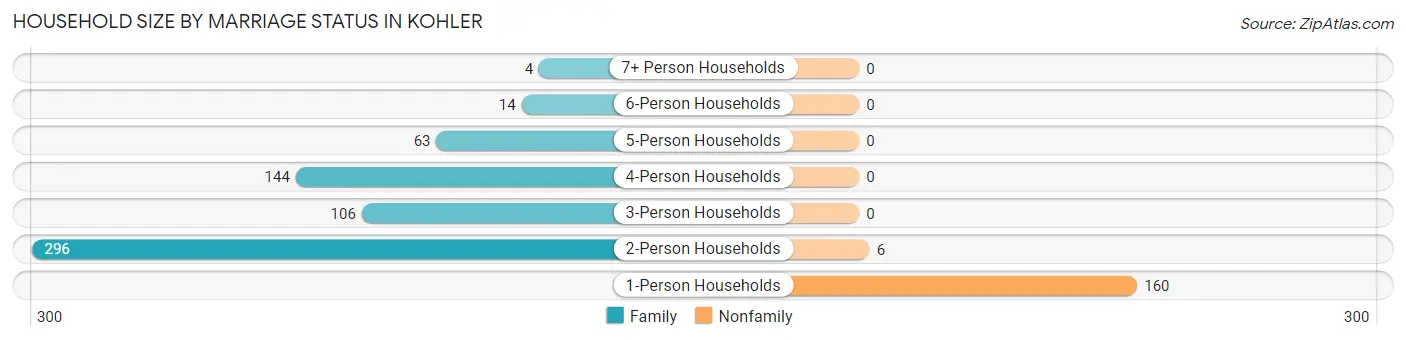
| Household Size | Family Households | Nonfamily Households |
| 1-Person Households | - | 160 (20.2%) |
| 2-Person Households | 296 (37.3%) | 6 (0.8%) |
| 3-Person Households | 106 (13.4%) | 0 (0.0%) |
| 4-Person Households | 144 (18.2%) | 0 (0.0%) |
| 5-Person Households | 63 (7.9%) | 0 (0.0%) |
| 6-Person Households | 14 (1.8%) | 0 (0.0%) |
| 7+ Person Households | 4 (0.5%) | 0 (0.0%) |
| Total | 627 (79.1%) | 166 (20.9%) |
Female Fertility in Kohler
Fertility by Age in Kohler
Average fertility rate in Kohler is 57.0 births per 1,000 women. Women in the age bracket of 20 to 34 years have the highest fertility rate with 225.0 births per 1,000 women. Women in the age bracket of 20 to 34 years acount for 79.3% of all women with births.
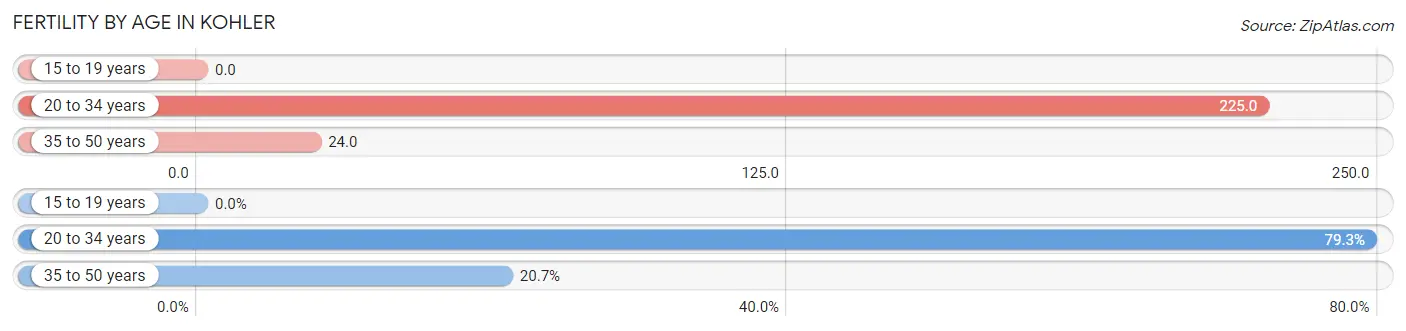
| Age Bracket | Women with Births | Births / 1,000 Women |
| 15 to 19 years | 0 (0.0%) | 0.0 |
| 20 to 34 years | 23 (79.3%) | 225.0 |
| 35 to 50 years | 6 (20.7%) | 24.0 |
| Total | 29 (100.0%) | 57.0 |
Fertility by Age by Marriage Status in Kohler
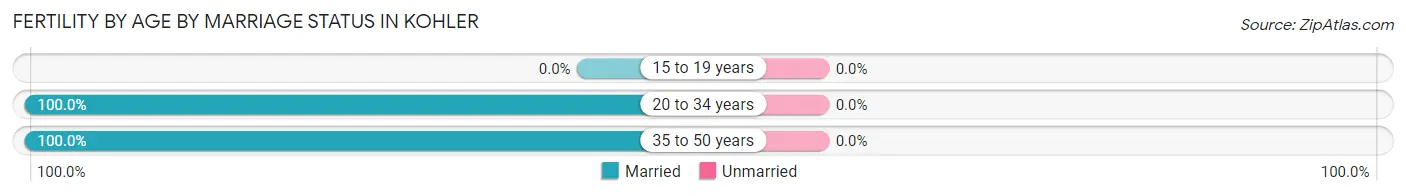
| Age Bracket | Married | Unmarried |
| 15 to 19 years | 0 (0.0%) | 0 (0.0%) |
| 20 to 34 years | 23 (100.0%) | 0 (0.0%) |
| 35 to 50 years | 6 (100.0%) | 0 (0.0%) |
| Total | 29 (100.0%) | 0 (0.0%) |
Fertility by Education in Kohler
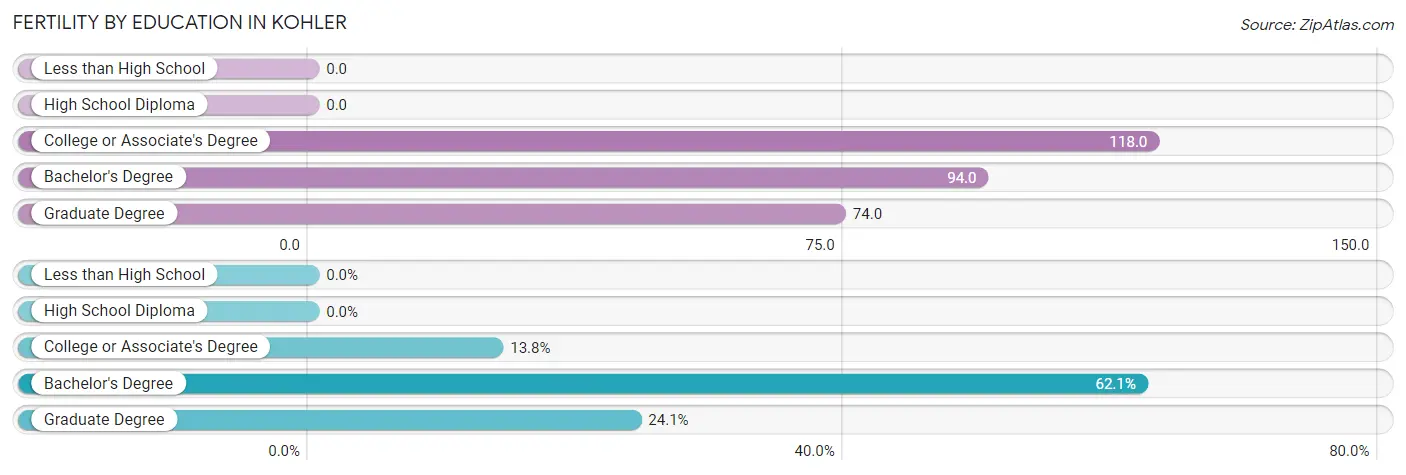
| Educational Attainment | Women with Births | Births / 1,000 Women |
| Less than High School | 0 (0.0%) | 0.0 |
| High School Diploma | 0 (0.0%) | 0.0 |
| College or Associate's Degree | 4 (13.8%) | 118.0 |
| Bachelor's Degree | 18 (62.1%) | 94.0 |
| Graduate Degree | 7 (24.1%) | 74.0 |
| Total | 29 (100.0%) | 57.0 |
Fertility by Education by Marriage Status in Kohler
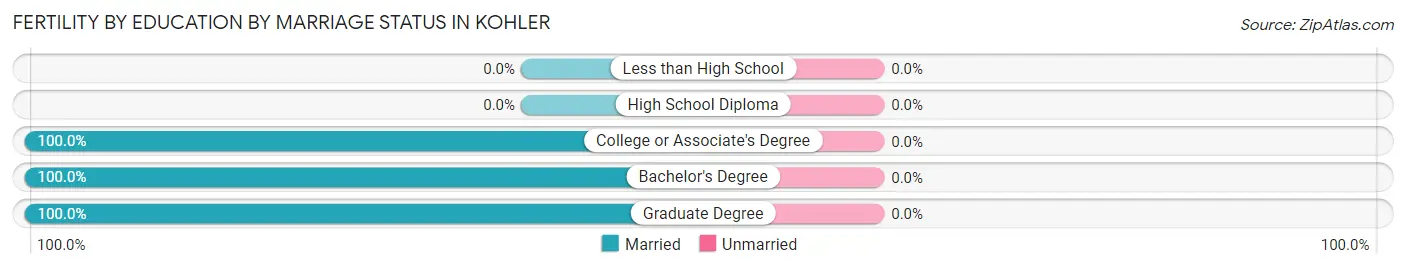
| Educational Attainment | Married | Unmarried |
| Less than High School | 0 (0.0%) | 0 (0.0%) |
| High School Diploma | 0 (0.0%) | 0 (0.0%) |
| College or Associate's Degree | 4 (100.0%) | 0 (0.0%) |
| Bachelor's Degree | 18 (100.0%) | 0 (0.0%) |
| Graduate Degree | 7 (100.0%) | 0 (0.0%) |
| Total | 29 (100.0%) | 0 (0.0%) |
Employment Characteristics in Kohler
Employment by Class of Employer in Kohler
Among the 1,036 employed individuals in Kohler, private company employees (730 | 70.5%), local government employees (95 | 9.2%), and not-for-profit organizations (93 | 9.0%) make up the most common classes of employment.
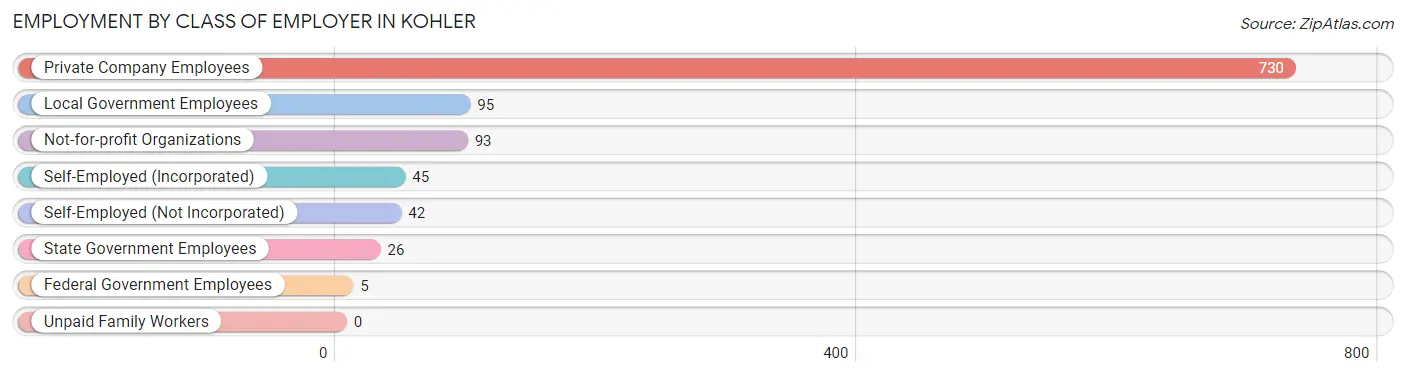
| Employer Class | # Employees | % Employees |
| Private Company Employees | 730 | 70.5% |
| Self-Employed (Incorporated) | 45 | 4.3% |
| Self-Employed (Not Incorporated) | 42 | 4.1% |
| Not-for-profit Organizations | 93 | 9.0% |
| Local Government Employees | 95 | 9.2% |
| State Government Employees | 26 | 2.5% |
| Federal Government Employees | 5 | 0.5% |
| Unpaid Family Workers | 0 | 0.0% |
| Total | 1,036 | 100.0% |
Employment Status by Age in Kohler
According to the labor force statistics for Kohler, out of the total population over 16 years of age (1,660), 65.7% or 1,091 individuals are in the labor force, with 4.0% or 44 of them unemployed. The age group with the highest labor force participation rate is 35 to 44 years, with 93.7% or 295 individuals in the labor force. Within the labor force, the 20 to 24 years age range has the highest percentage of unemployed individuals, with 9.9% or 7 of them being unemployed.
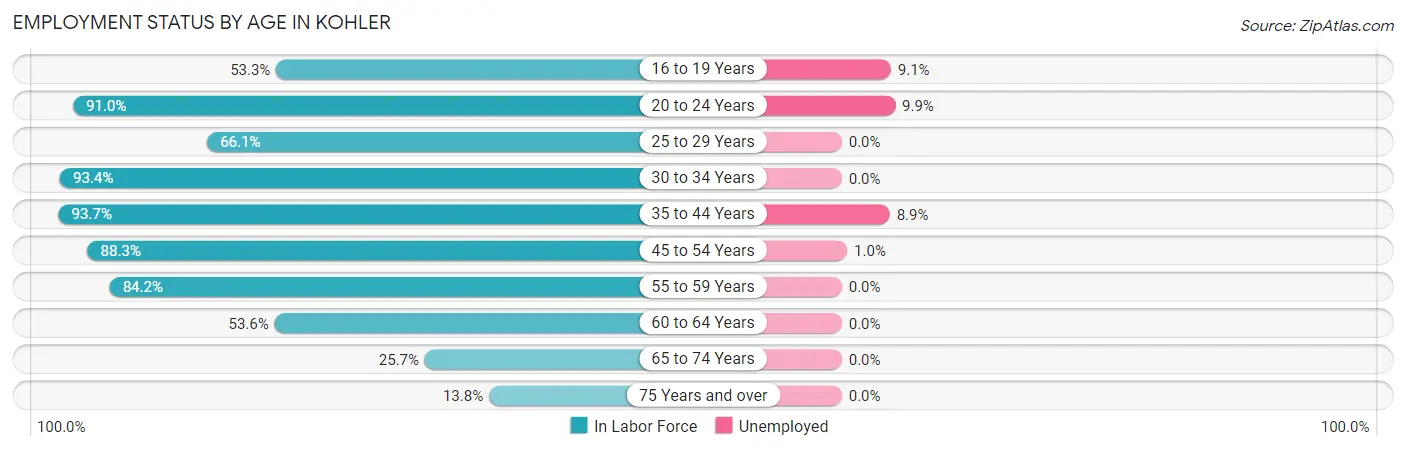
| Age Bracket | In Labor Force | Unemployed |
| 16 to 19 Years | 88 (53.3%) | 8 (9.1%) |
| 20 to 24 Years | 71 (91.0%) | 7 (9.9%) |
| 25 to 29 Years | 39 (66.1%) | 0 (0.0%) |
| 30 to 34 Years | 57 (93.4%) | 0 (0.0%) |
| 35 to 44 Years | 295 (93.7%) | 26 (8.9%) |
| 45 to 54 Years | 286 (88.3%) | 3 (1.0%) |
| 55 to 59 Years | 117 (84.2%) | 0 (0.0%) |
| 60 to 64 Years | 45 (53.6%) | 0 (0.0%) |
| 65 to 74 Years | 69 (25.7%) | 0 (0.0%) |
| 75 Years and over | 23 (13.8%) | 0 (0.0%) |
| Total | 1,091 (65.7%) | 44 (4.0%) |
Employment Status by Educational Attainment in Kohler
According to labor force statistics for Kohler, 85.4% of individuals (839) out of the total population between 25 and 64 years of age (982) are in the labor force, with 3.5% or 29 of them being unemployed. The group with the highest labor force participation rate are those with the educational attainment of high school diploma, with 95.0% or 38 individuals in the labor force. Within the labor force, individuals with bachelor's degree or higher education have the highest percentage of unemployment, with 4.5% or 29 of them being unemployed.
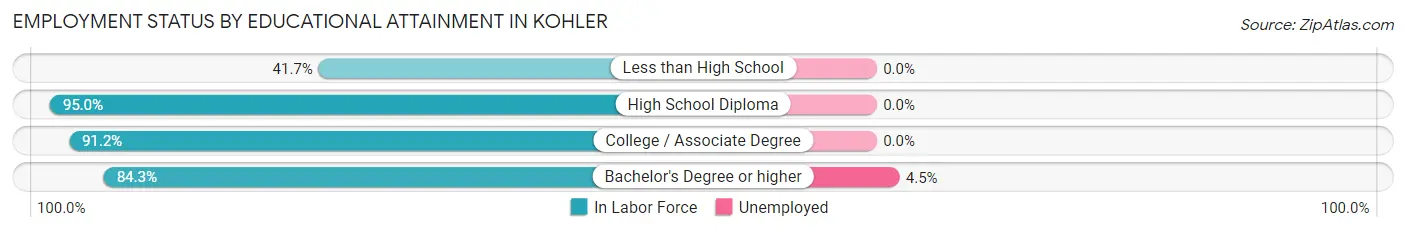
| Educational Attainment | In Labor Force | Unemployed |
| Less than High School | 5 (41.7%) | 0 (0.0%) |
| High School Diploma | 38 (95.0%) | 0 (0.0%) |
| College / Associate Degree | 156 (91.2%) | 0 (0.0%) |
| Bachelor's Degree or higher | 640 (84.3%) | 34 (4.5%) |
| Total | 839 (85.4%) | 34 (3.5%) |
Employment Occupations by Sex in Kohler
Management, Business, Science and Arts Occupations
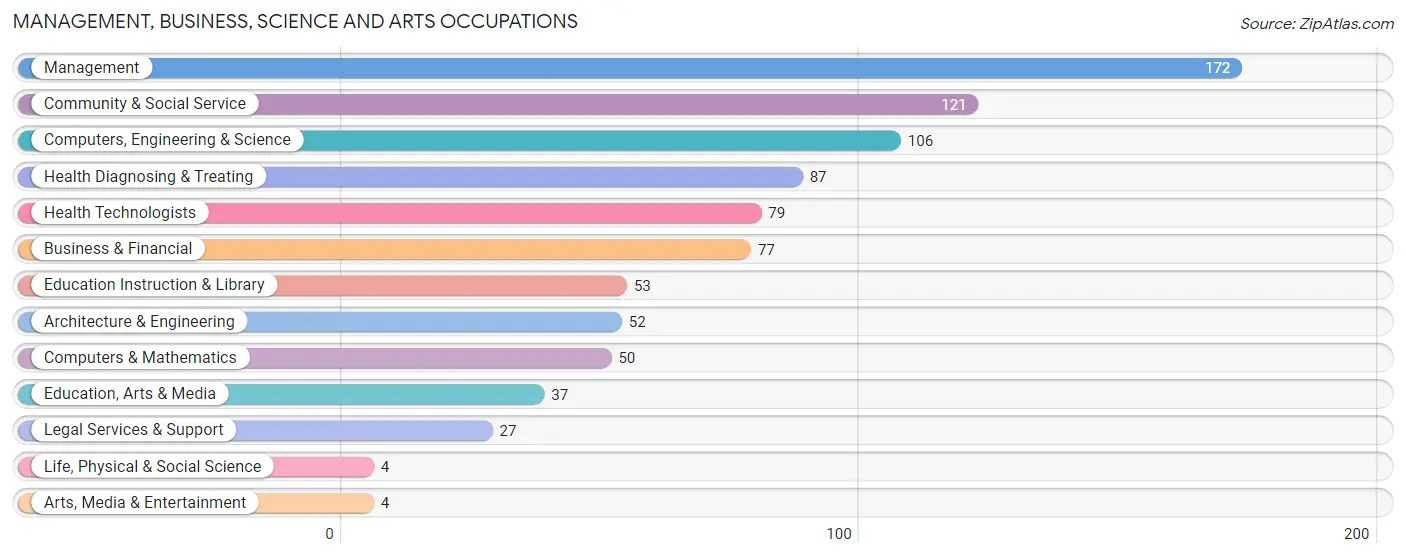
The most common Management, Business, Science and Arts occupations in Kohler are Management (172 | 16.5%), Community & Social Service (121 | 11.6%), Computers, Engineering & Science (106 | 10.2%), Health Diagnosing & Treating (87 | 8.3%), and Health Technologists (79 | 7.6%).
Management, Business, Science and Arts Occupations by Sex
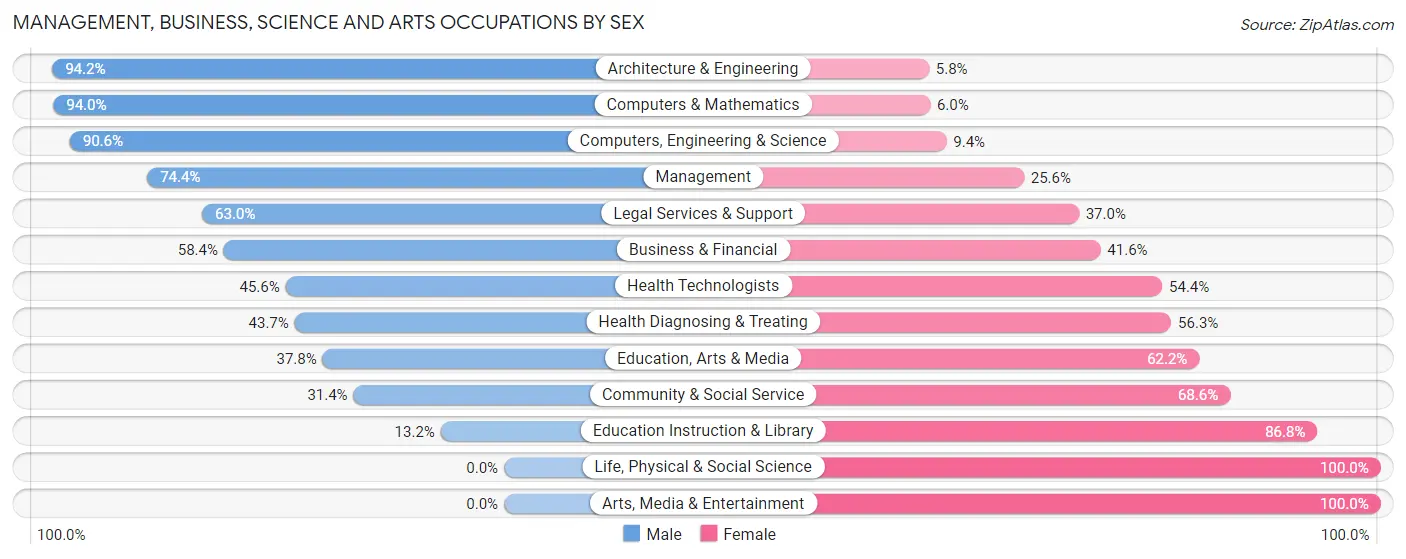
Within the Management, Business, Science and Arts occupations in Kohler, the most male-oriented occupations are Architecture & Engineering (94.2%), Computers & Mathematics (94.0%), and Computers, Engineering & Science (90.6%), while the most female-oriented occupations are Life, Physical & Social Science (100.0%), Arts, Media & Entertainment (100.0%), and Education Instruction & Library (86.8%).
| Occupation | Male | Female |
| Management | 128 (74.4%) | 44 (25.6%) |
| Business & Financial | 45 (58.4%) | 32 (41.6%) |
| Computers, Engineering & Science | 96 (90.6%) | 10 (9.4%) |
| Computers & Mathematics | 47 (94.0%) | 3 (6.0%) |
| Architecture & Engineering | 49 (94.2%) | 3 (5.8%) |
| Life, Physical & Social Science | 0 (0.0%) | 4 (100.0%) |
| Community & Social Service | 38 (31.4%) | 83 (68.6%) |
| Education, Arts & Media | 14 (37.8%) | 23 (62.2%) |
| Legal Services & Support | 17 (63.0%) | 10 (37.0%) |
| Education Instruction & Library | 7 (13.2%) | 46 (86.8%) |
| Arts, Media & Entertainment | 0 (0.0%) | 4 (100.0%) |
| Health Diagnosing & Treating | 38 (43.7%) | 49 (56.3%) |
| Health Technologists | 36 (45.6%) | 43 (54.4%) |
| Total (Category) | 345 (61.3%) | 218 (38.7%) |
| Total (Overall) | 585 (56.0%) | 459 (44.0%) |
Services Occupations
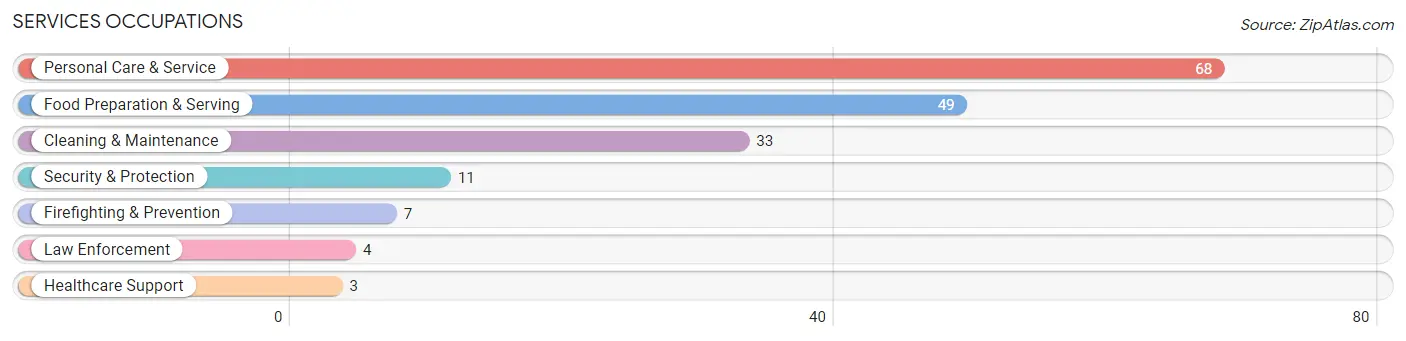
The most common Services occupations in Kohler are Personal Care & Service (68 | 6.5%), Food Preparation & Serving (49 | 4.7%), Cleaning & Maintenance (33 | 3.2%), Security & Protection (11 | 1.1%), and Firefighting & Prevention (7 | 0.7%).
Services Occupations by Sex
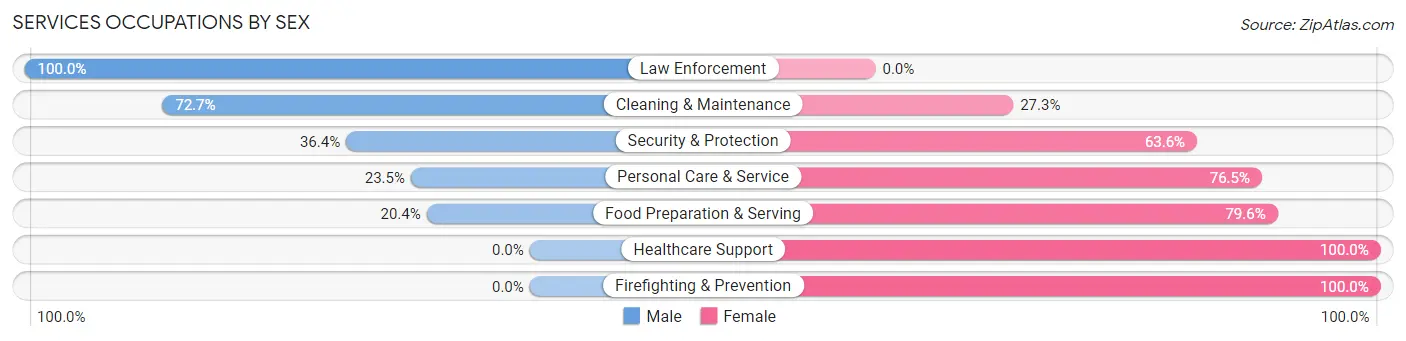
Within the Services occupations in Kohler, the most male-oriented occupations are Law Enforcement (100.0%), Cleaning & Maintenance (72.7%), and Security & Protection (36.4%), while the most female-oriented occupations are Healthcare Support (100.0%), Firefighting & Prevention (100.0%), and Food Preparation & Serving (79.6%).
| Occupation | Male | Female |
| Healthcare Support | 0 (0.0%) | 3 (100.0%) |
| Security & Protection | 4 (36.4%) | 7 (63.6%) |
| Firefighting & Prevention | 0 (0.0%) | 7 (100.0%) |
| Law Enforcement | 4 (100.0%) | 0 (0.0%) |
| Food Preparation & Serving | 10 (20.4%) | 39 (79.6%) |
| Cleaning & Maintenance | 24 (72.7%) | 9 (27.3%) |
| Personal Care & Service | 16 (23.5%) | 52 (76.5%) |
| Total (Category) | 54 (32.9%) | 110 (67.1%) |
| Total (Overall) | 585 (56.0%) | 459 (44.0%) |
Sales and Office Occupations
The most common Sales and Office occupations in Kohler are Sales & Related (116 | 11.1%), and Office & Administration (74 | 7.1%).
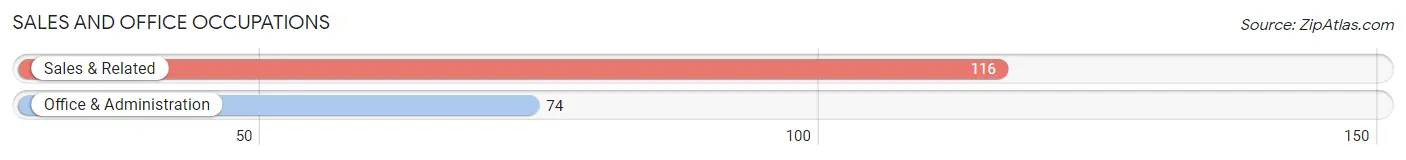
Sales and Office Occupations by Sex
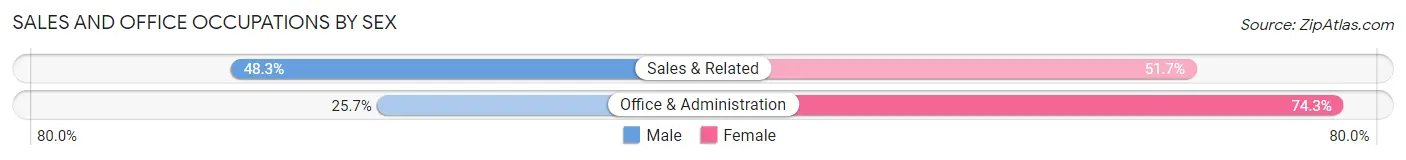
| Occupation | Male | Female |
| Sales & Related | 56 (48.3%) | 60 (51.7%) |
| Office & Administration | 19 (25.7%) | 55 (74.3%) |
| Total (Category) | 75 (39.5%) | 115 (60.5%) |
| Total (Overall) | 585 (56.0%) | 459 (44.0%) |
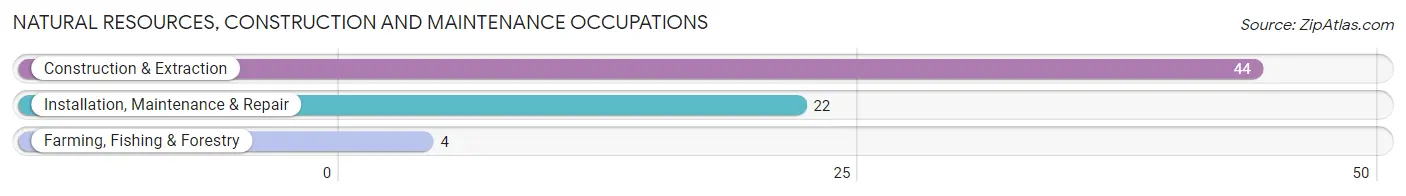
Natural Resources, Construction and Maintenance Occupations
The most common Natural Resources, Construction and Maintenance occupations in Kohler are Construction & Extraction (44 | 4.2%), Installation, Maintenance & Repair (22 | 2.1%), and Farming, Fishing & Forestry (4 | 0.4%).
Natural Resources, Construction and Maintenance Occupations by Sex
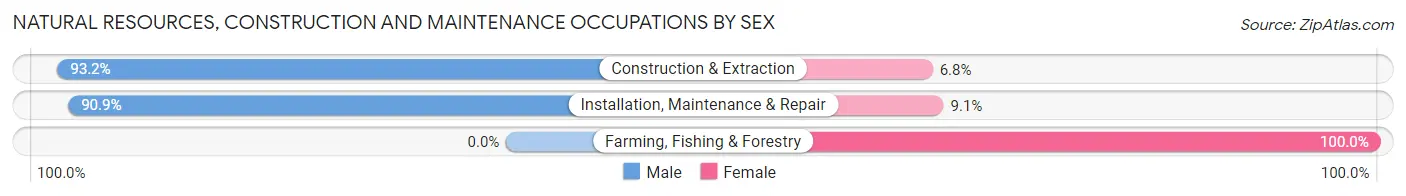
| Occupation | Male | Female |
| Farming, Fishing & Forestry | 0 (0.0%) | 4 (100.0%) |
| Construction & Extraction | 41 (93.2%) | 3 (6.8%) |
| Installation, Maintenance & Repair | 20 (90.9%) | 2 (9.1%) |
| Total (Category) | 61 (87.1%) | 9 (12.9%) |
| Total (Overall) | 585 (56.0%) | 459 (44.0%) |
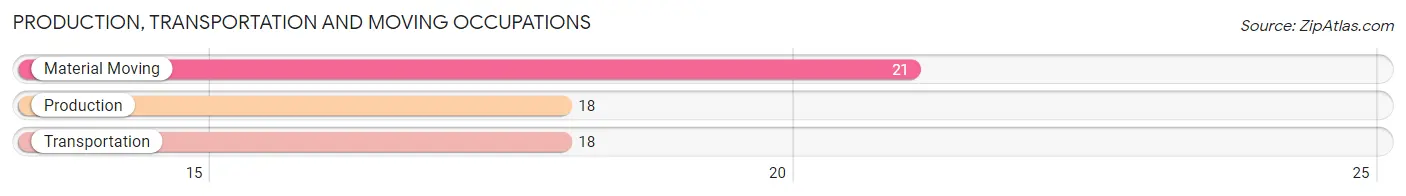
Production, Transportation and Moving Occupations
The most common Production, Transportation and Moving occupations in Kohler are Material Moving (21 | 2.0%), Production (18 | 1.7%), and Transportation (18 | 1.7%).
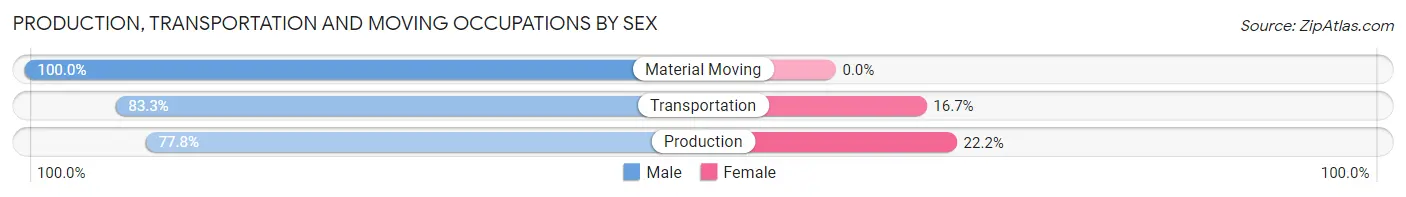
Production, Transportation and Moving Occupations by Sex
| Occupation | Male | Female |
| Production | 14 (77.8%) | 4 (22.2%) |
| Transportation | 15 (83.3%) | 3 (16.7%) |
| Material Moving | 21 (100.0%) | 0 (0.0%) |
| Total (Category) | 50 (87.7%) | 7 (12.3%) |
| Total (Overall) | 585 (56.0%) | 459 (44.0%) |
Employment Industries by Sex in Kohler
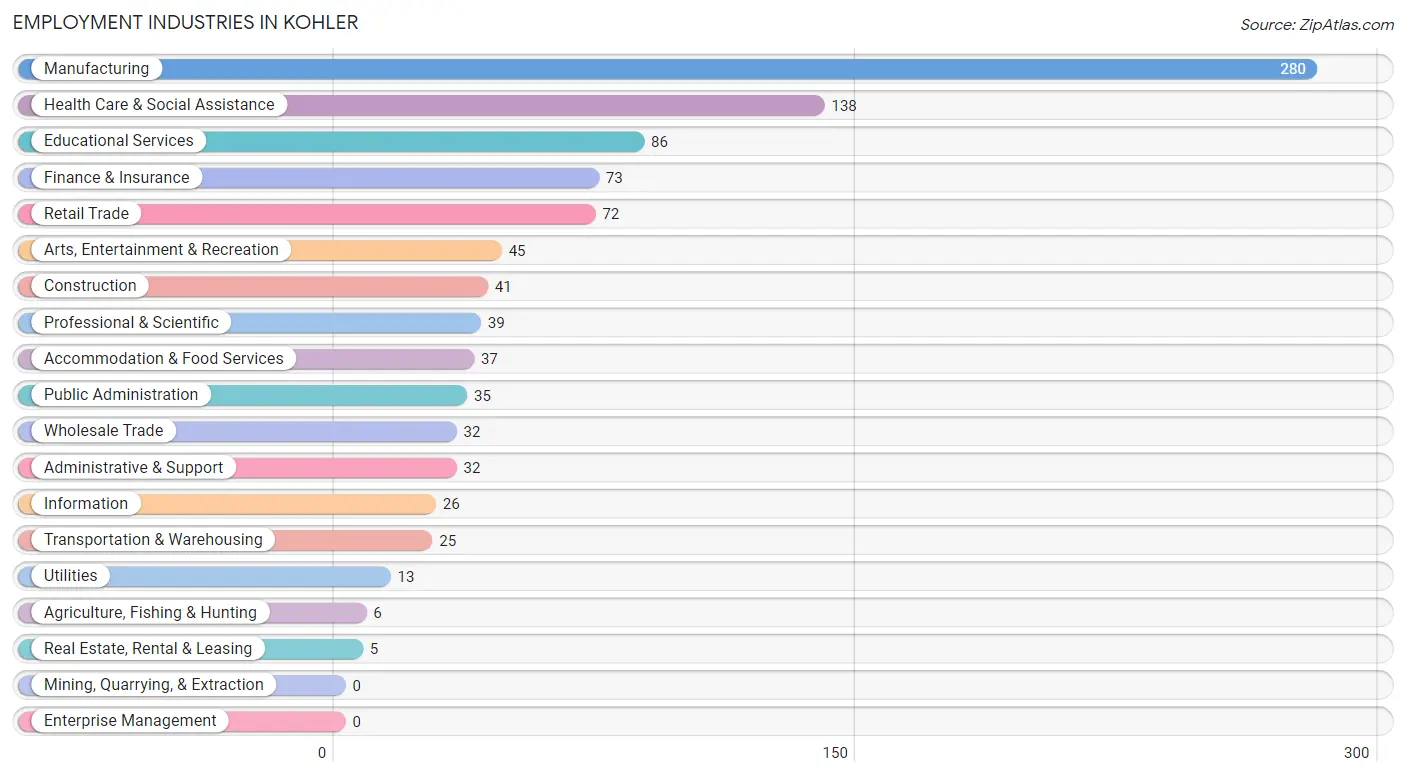
Employment Industries in Kohler
The major employment industries in Kohler include Manufacturing (280 | 26.8%), Health Care & Social Assistance (138 | 13.2%), Educational Services (86 | 8.2%), Finance & Insurance (73 | 7.0%), and Retail Trade (72 | 6.9%).
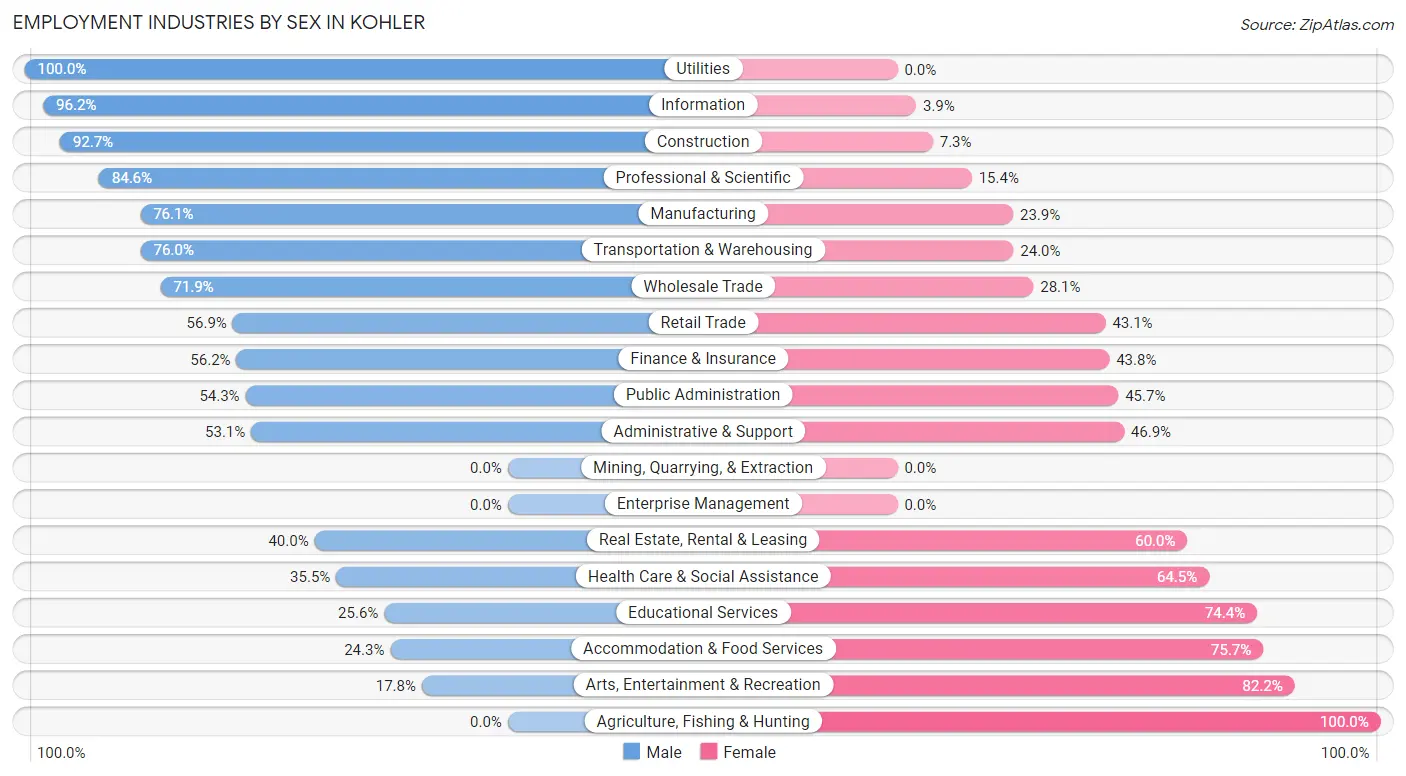
Employment Industries by Sex in Kohler
The Kohler industries that see more men than women are Utilities (100.0%), Information (96.2%), and Construction (92.7%), whereas the industries that tend to have a higher number of women are Agriculture, Fishing & Hunting (100.0%), Arts, Entertainment & Recreation (82.2%), and Accommodation & Food Services (75.7%).
| Industry | Male | Female |
| Agriculture, Fishing & Hunting | 0 (0.0%) | 6 (100.0%) |
| Mining, Quarrying, & Extraction | 0 (0.0%) | 0 (0.0%) |
| Construction | 38 (92.7%) | 3 (7.3%) |
| Manufacturing | 213 (76.1%) | 67 (23.9%) |
| Wholesale Trade | 23 (71.9%) | 9 (28.1%) |
| Retail Trade | 41 (56.9%) | 31 (43.1%) |
| Transportation & Warehousing | 19 (76.0%) | 6 (24.0%) |
| Utilities | 13 (100.0%) | 0 (0.0%) |
| Information | 25 (96.2%) | 1 (3.8%) |
| Finance & Insurance | 41 (56.2%) | 32 (43.8%) |
| Real Estate, Rental & Leasing | 2 (40.0%) | 3 (60.0%) |
| Professional & Scientific | 33 (84.6%) | 6 (15.4%) |
| Enterprise Management | 0 (0.0%) | 0 (0.0%) |
| Administrative & Support | 17 (53.1%) | 15 (46.9%) |
| Educational Services | 22 (25.6%) | 64 (74.4%) |
| Health Care & Social Assistance | 49 (35.5%) | 89 (64.5%) |
| Arts, Entertainment & Recreation | 8 (17.8%) | 37 (82.2%) |
| Accommodation & Food Services | 9 (24.3%) | 28 (75.7%) |
| Public Administration | 19 (54.3%) | 16 (45.7%) |
| Total | 585 (56.0%) | 459 (44.0%) |
Education in Kohler
School Enrollment in Kohler
The most common levels of schooling among the 656 students in Kohler are high school (208 | 31.7%), elementary school (151 | 23.0%), and middle school (131 | 20.0%).
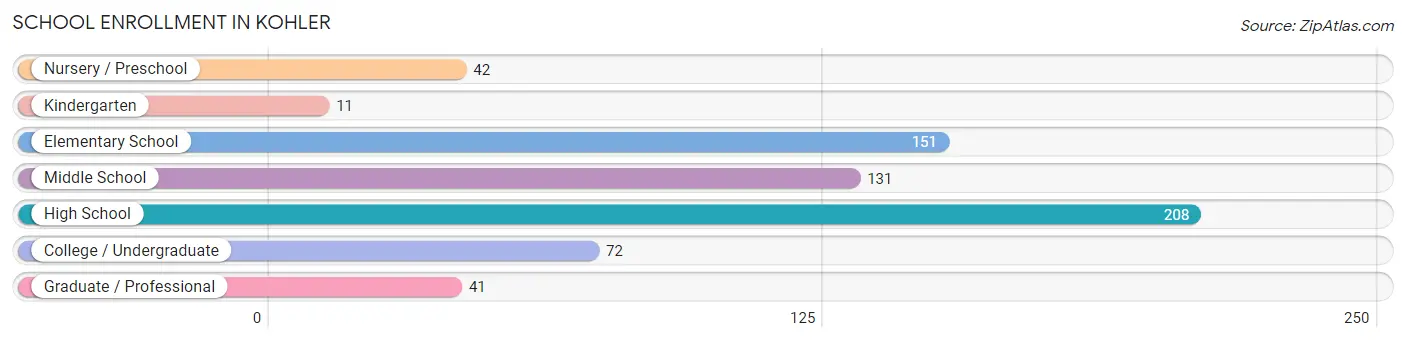
| School Level | # Students | % Students |
| Nursery / Preschool | 42 | 6.4% |
| Kindergarten | 11 | 1.7% |
| Elementary School | 151 | 23.0% |
| Middle School | 131 | 20.0% |
| High School | 208 | 31.7% |
| College / Undergraduate | 72 | 11.0% |
| Graduate / Professional | 41 | 6.2% |
| Total | 656 | 100.0% |
School Enrollment by Age by Funding Source in Kohler
Out of a total of 656 students who are enrolled in schools in Kohler, 83 (12.7%) attend a private institution, while the remaining 573 (87.3%) are enrolled in public schools. The age group of 25 to 34 year olds has the highest likelihood of being enrolled in private schools, with 15 (93.8% in the age bracket) enrolled. Conversely, the age group of 18 to 19 year olds has the lowest likelihood of being enrolled in a private school, with 45 (100.0% in the age bracket) attending a public institution.
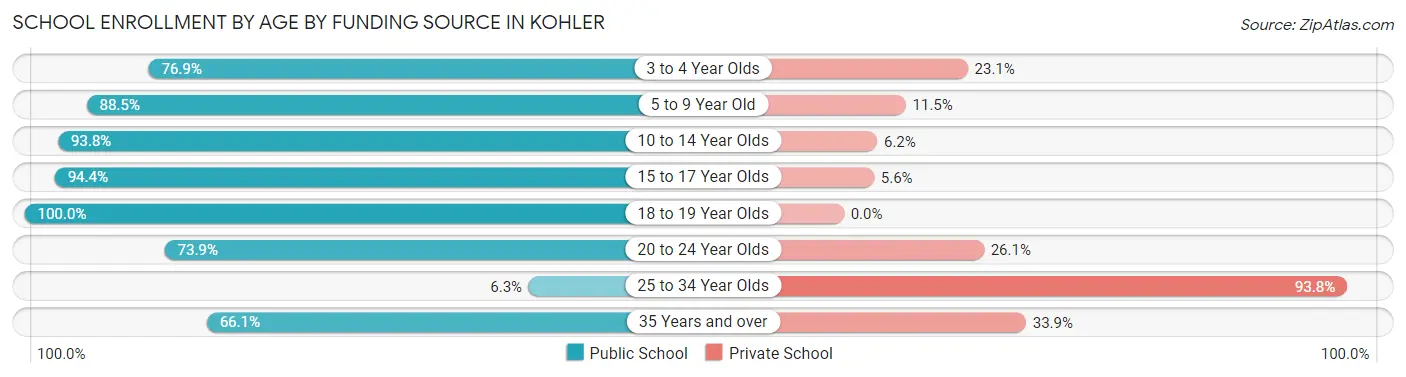
| Age Bracket | Public School | Private School |
| 3 to 4 Year Olds | 10 (76.9%) | 3 (23.1%) |
| 5 to 9 Year Old | 161 (88.5%) | 21 (11.5%) |
| 10 to 14 Year Olds | 151 (93.8%) | 10 (6.2%) |
| 15 to 17 Year Olds | 151 (94.4%) | 9 (5.6%) |
| 18 to 19 Year Olds | 45 (100.0%) | 0 (0.0%) |
| 20 to 24 Year Olds | 17 (73.9%) | 6 (26.1%) |
| 25 to 34 Year Olds | 1 (6.2%) | 15 (93.8%) |
| 35 Years and over | 37 (66.1%) | 19 (33.9%) |
| Total | 573 (87.3%) | 83 (12.7%) |
Educational Attainment by Field of Study in Kohler
Business (250 | 22.7%), education (125 | 11.3%), engineering (119 | 10.8%), social sciences (85 | 7.7%), and science & technology (76 | 6.9%) are the most common fields of study among 1,102 individuals in Kohler who have obtained a bachelor's degree or higher.
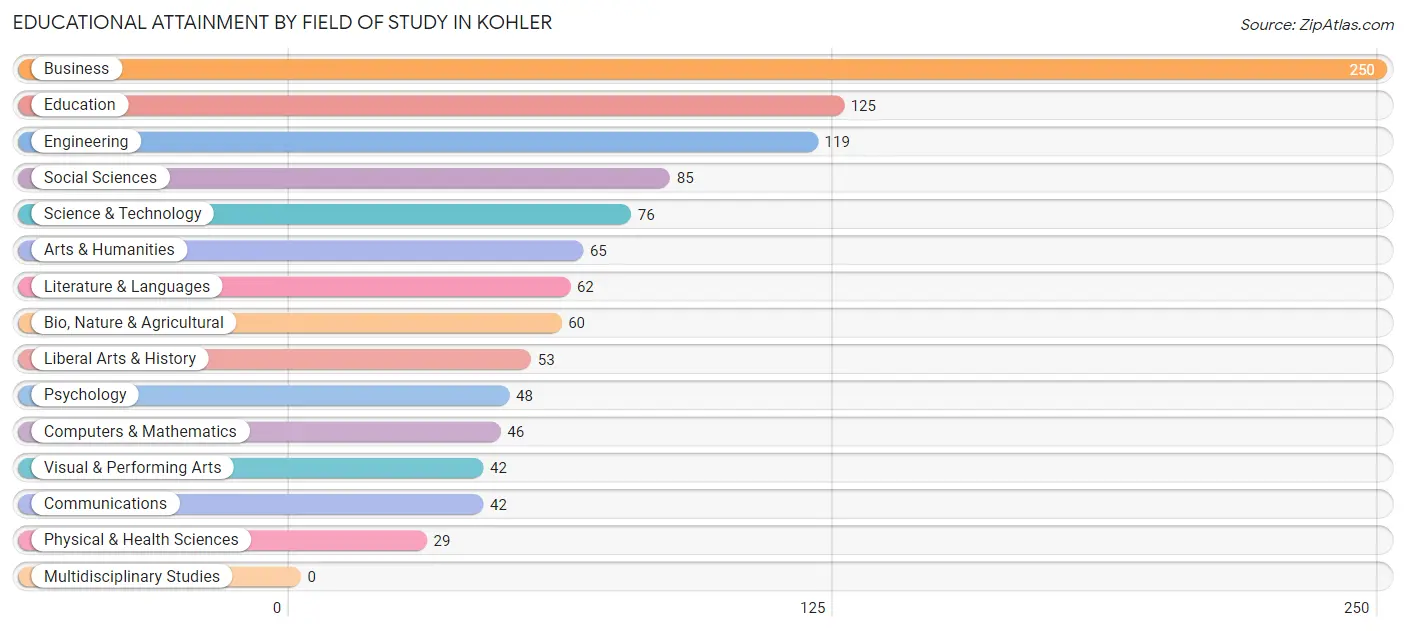
| Field of Study | # Graduates | % Graduates |
| Computers & Mathematics | 46 | 4.2% |
| Bio, Nature & Agricultural | 60 | 5.4% |
| Physical & Health Sciences | 29 | 2.6% |
| Psychology | 48 | 4.4% |
| Social Sciences | 85 | 7.7% |
| Engineering | 119 | 10.8% |
| Multidisciplinary Studies | 0 | 0.0% |
| Science & Technology | 76 | 6.9% |
| Business | 250 | 22.7% |
| Education | 125 | 11.3% |
| Literature & Languages | 62 | 5.6% |
| Liberal Arts & History | 53 | 4.8% |
| Visual & Performing Arts | 42 | 3.8% |
| Communications | 42 | 3.8% |
| Arts & Humanities | 65 | 5.9% |
| Total | 1,102 | 100.0% |
Transportation & Commute in Kohler
Vehicle Availability by Sex in Kohler
The most prevalent vehicle ownership categories in Kohler are males with 2 vehicles (320, accounting for 54.5%) and females with 2 vehicles (223, making up 71.3%).
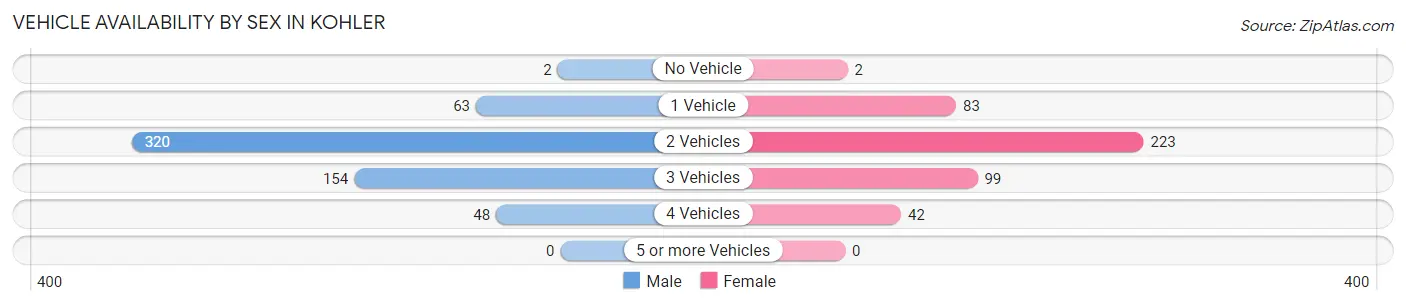
| Vehicles Available | Male | Female |
| No Vehicle | 2 (0.3%) | 2 (0.4%) |
| 1 Vehicle | 63 (10.7%) | 83 (18.5%) |
| 2 Vehicles | 320 (54.5%) | 223 (49.7%) |
| 3 Vehicles | 154 (26.2%) | 99 (22.1%) |
| 4 Vehicles | 48 (8.2%) | 42 (9.3%) |
| 5 or more Vehicles | 0 (0.0%) | 0 (0.0%) |
| Total | 587 (100.0%) | 449 (100.0%) |
Commute Time in Kohler
The most frequently occuring commute durations in Kohler are 10 to 14 minutes (247 commuters, 27.9%), 5 to 9 minutes (238 commuters, 26.9%), and less than 5 minutes (117 commuters, 13.2%).
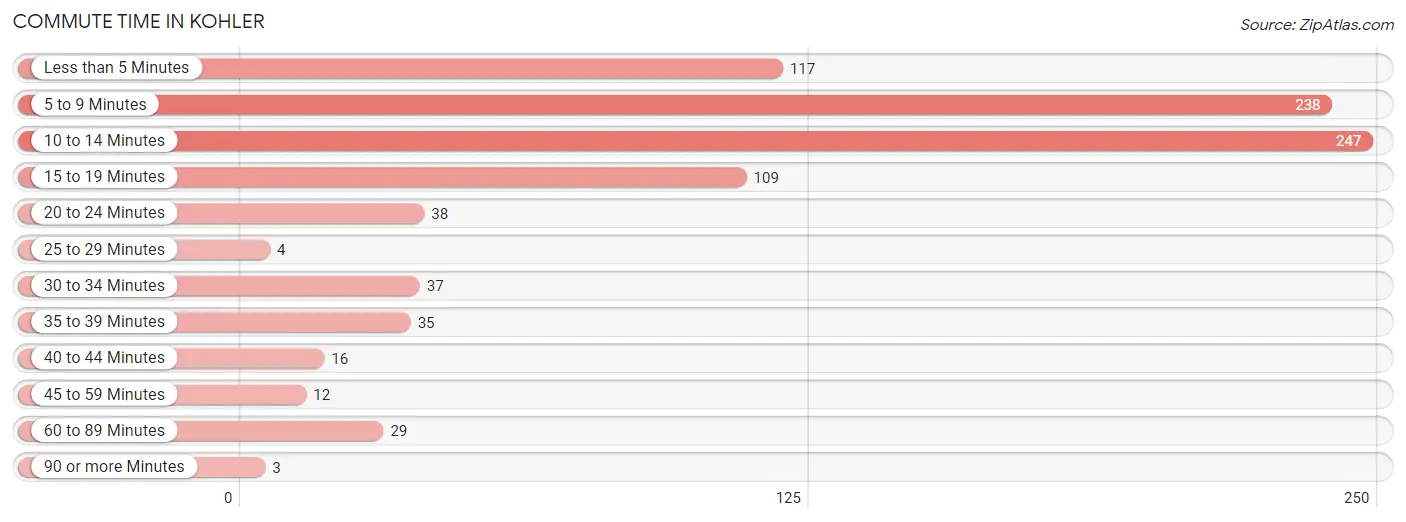
| Commute Time | # Commuters | % Commuters |
| Less than 5 Minutes | 117 | 13.2% |
| 5 to 9 Minutes | 238 | 26.9% |
| 10 to 14 Minutes | 247 | 27.9% |
| 15 to 19 Minutes | 109 | 12.3% |
| 20 to 24 Minutes | 38 | 4.3% |
| 25 to 29 Minutes | 4 | 0.4% |
| 30 to 34 Minutes | 37 | 4.2% |
| 35 to 39 Minutes | 35 | 4.0% |
| 40 to 44 Minutes | 16 | 1.8% |
| 45 to 59 Minutes | 12 | 1.4% |
| 60 to 89 Minutes | 29 | 3.3% |
| 90 or more Minutes | 3 | 0.3% |
Commute Time by Sex in Kohler
The most common commute times in Kohler are 10 to 14 minutes (152 commuters, 31.3%) for males and 5 to 9 minutes (123 commuters, 30.8%) for females.
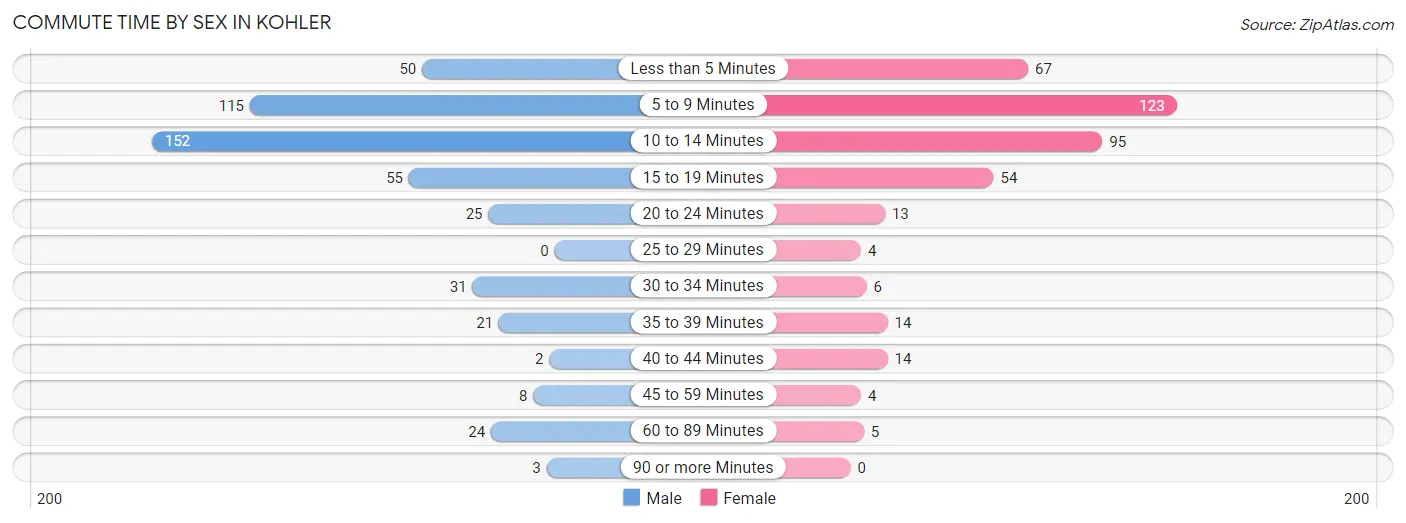
| Commute Time | Male | Female |
| Less than 5 Minutes | 50 (10.3%) | 67 (16.8%) |
| 5 to 9 Minutes | 115 (23.7%) | 123 (30.8%) |
| 10 to 14 Minutes | 152 (31.3%) | 95 (23.8%) |
| 15 to 19 Minutes | 55 (11.3%) | 54 (13.5%) |
| 20 to 24 Minutes | 25 (5.1%) | 13 (3.3%) |
| 25 to 29 Minutes | 0 (0.0%) | 4 (1.0%) |
| 30 to 34 Minutes | 31 (6.4%) | 6 (1.5%) |
| 35 to 39 Minutes | 21 (4.3%) | 14 (3.5%) |
| 40 to 44 Minutes | 2 (0.4%) | 14 (3.5%) |
| 45 to 59 Minutes | 8 (1.7%) | 4 (1.0%) |
| 60 to 89 Minutes | 24 (4.9%) | 5 (1.3%) |
| 90 or more Minutes | 3 (0.6%) | 0 (0.0%) |
Time of Departure to Work by Sex in Kohler
The most frequent times of departure to work in Kohler are 7:30 AM to 7:59 AM (122, 25.1%) for males and 7:30 AM to 7:59 AM (93, 23.3%) for females.
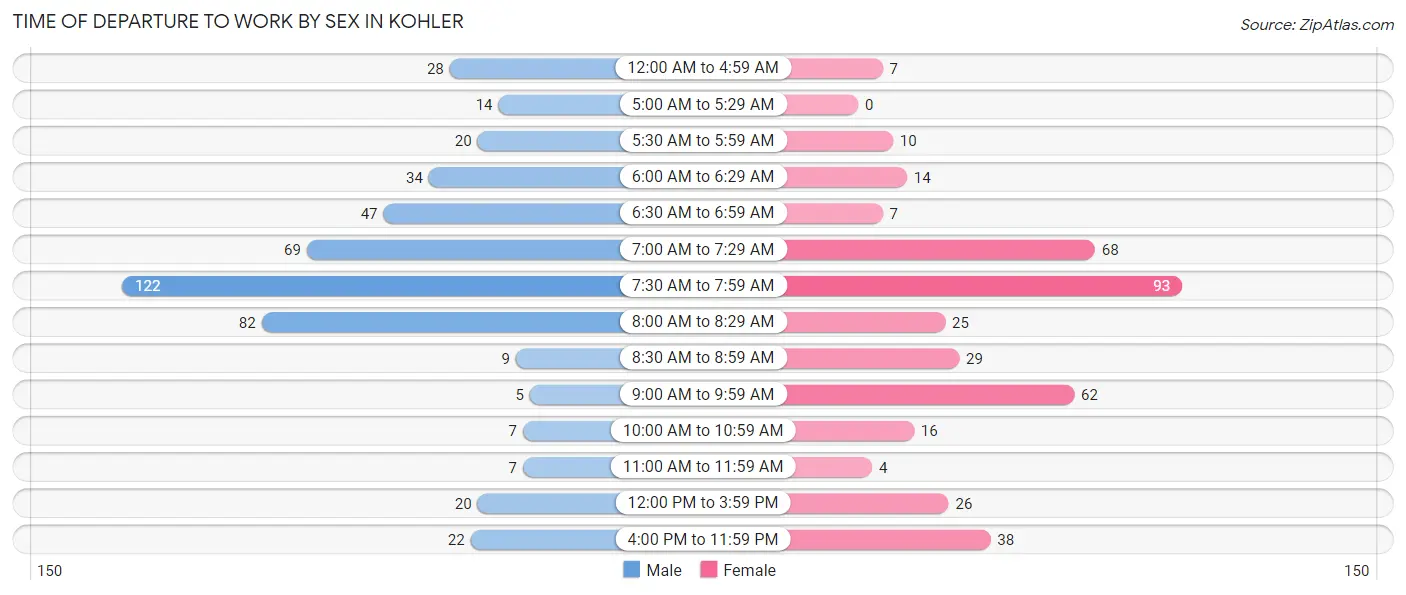
| Time of Departure | Male | Female |
| 12:00 AM to 4:59 AM | 28 (5.8%) | 7 (1.8%) |
| 5:00 AM to 5:29 AM | 14 (2.9%) | 0 (0.0%) |
| 5:30 AM to 5:59 AM | 20 (4.1%) | 10 (2.5%) |
| 6:00 AM to 6:29 AM | 34 (7.0%) | 14 (3.5%) |
| 6:30 AM to 6:59 AM | 47 (9.7%) | 7 (1.8%) |
| 7:00 AM to 7:29 AM | 69 (14.2%) | 68 (17.0%) |
| 7:30 AM to 7:59 AM | 122 (25.1%) | 93 (23.3%) |
| 8:00 AM to 8:29 AM | 82 (16.9%) | 25 (6.3%) |
| 8:30 AM to 8:59 AM | 9 (1.8%) | 29 (7.3%) |
| 9:00 AM to 9:59 AM | 5 (1.0%) | 62 (15.5%) |
| 10:00 AM to 10:59 AM | 7 (1.4%) | 16 (4.0%) |
| 11:00 AM to 11:59 AM | 7 (1.4%) | 4 (1.0%) |
| 12:00 PM to 3:59 PM | 20 (4.1%) | 26 (6.5%) |
| 4:00 PM to 11:59 PM | 22 (4.5%) | 38 (9.5%) |
| Total | 486 (100.0%) | 399 (100.0%) |
Housing Occupancy in Kohler
Occupancy by Ownership in Kohler
Of the total 793 dwellings in Kohler, owner-occupied units account for 741 (93.4%), while renter-occupied units make up 52 (6.6%).
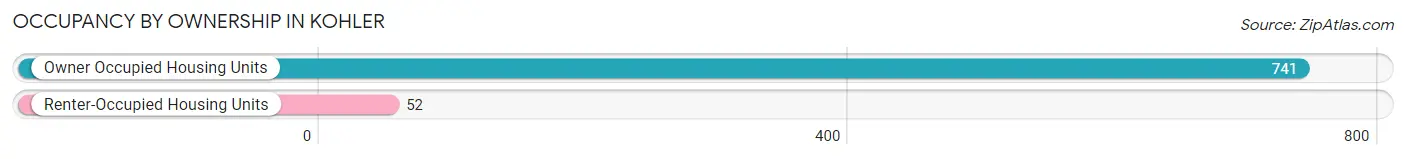
| Occupancy | # Housing Units | % Housing Units |
| Owner Occupied Housing Units | 741 | 93.4% |
| Renter-Occupied Housing Units | 52 | 6.6% |
| Total Occupied Housing Units | 793 | 100.0% |
Occupancy by Household Size in Kohler
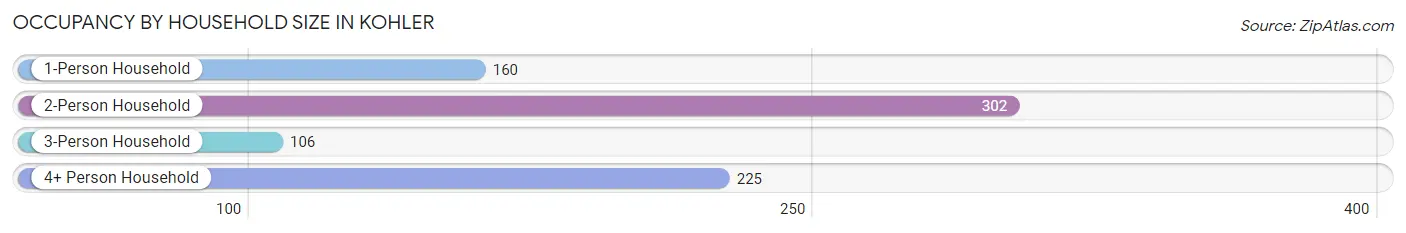
| Household Size | # Housing Units | % Housing Units |
| 1-Person Household | 160 | 20.2% |
| 2-Person Household | 302 | 38.1% |
| 3-Person Household | 106 | 13.4% |
| 4+ Person Household | 225 | 28.4% |
| Total Housing Units | 793 | 100.0% |
Occupancy by Ownership by Household Size in Kohler
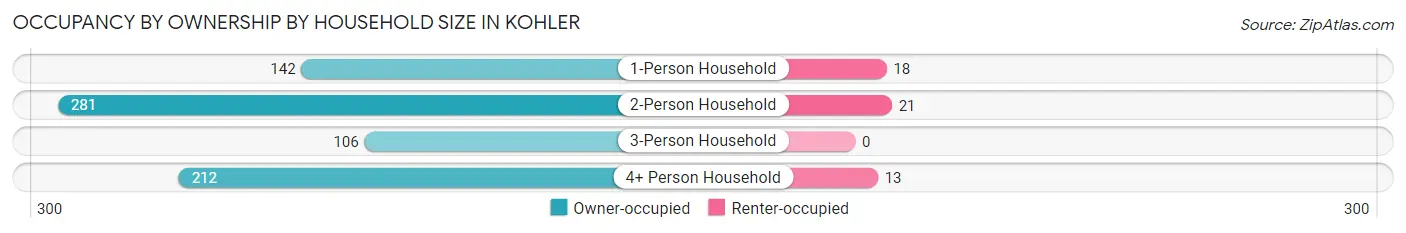
| Household Size | Owner-occupied | Renter-occupied |
| 1-Person Household | 142 (88.7%) | 18 (11.3%) |
| 2-Person Household | 281 (93.0%) | 21 (7.0%) |
| 3-Person Household | 106 (100.0%) | 0 (0.0%) |
| 4+ Person Household | 212 (94.2%) | 13 (5.8%) |
| Total Housing Units | 741 (93.4%) | 52 (6.6%) |
Occupancy by Educational Attainment in Kohler
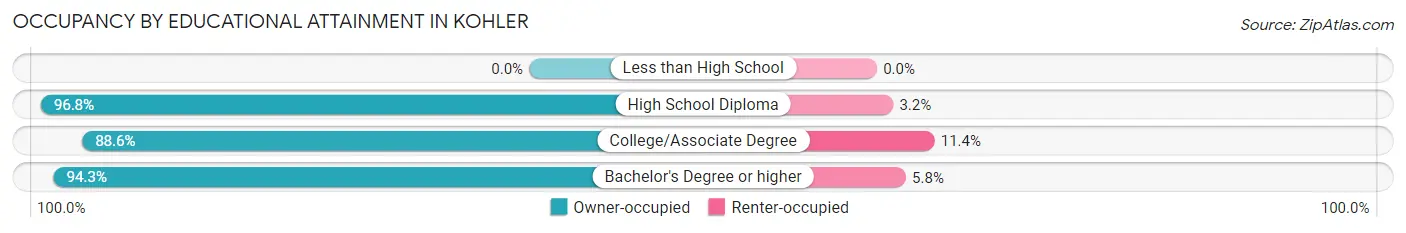
| Household Size | Owner-occupied | Renter-occupied |
| Less than High School | 0 (0.0%) | 0 (0.0%) |
| High School Diploma | 60 (96.8%) | 2 (3.2%) |
| College/Associate Degree | 124 (88.6%) | 16 (11.4%) |
| Bachelor's Degree or higher | 557 (94.3%) | 34 (5.8%) |
Occupancy by Age of Householder in Kohler
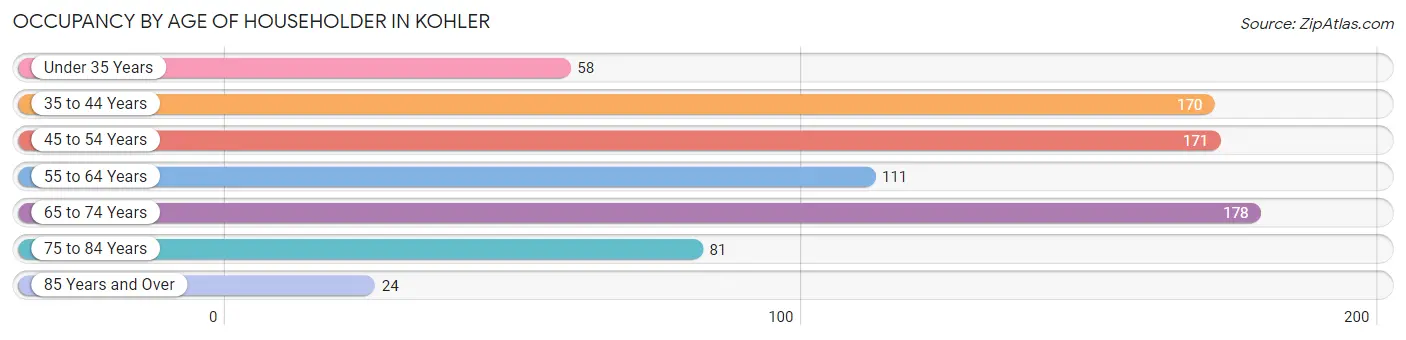
| Age Bracket | # Households | % Households |
| Under 35 Years | 58 | 7.3% |
| 35 to 44 Years | 170 | 21.4% |
| 45 to 54 Years | 171 | 21.6% |
| 55 to 64 Years | 111 | 14.0% |
| 65 to 74 Years | 178 | 22.5% |
| 75 to 84 Years | 81 | 10.2% |
| 85 Years and Over | 24 | 3.0% |
| Total | 793 | 100.0% |
Housing Finances in Kohler
Median Income by Occupancy in Kohler
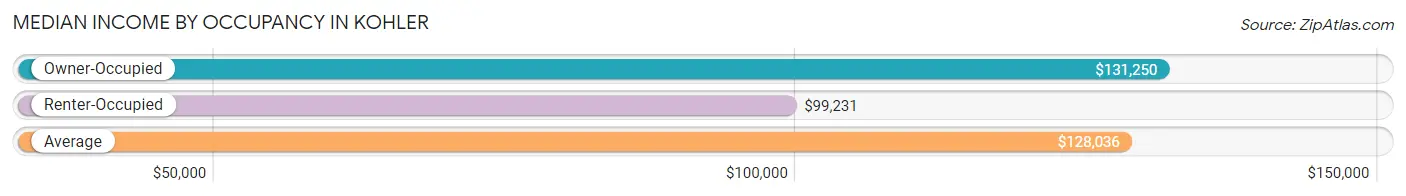
| Occupancy Type | # Households | Median Income |
| Owner-Occupied | 741 (93.4%) | $131,250 |
| Renter-Occupied | 52 (6.6%) | $99,231 |
| Average | 793 (100.0%) | $128,036 |
Occupancy by Householder Income Bracket in Kohler
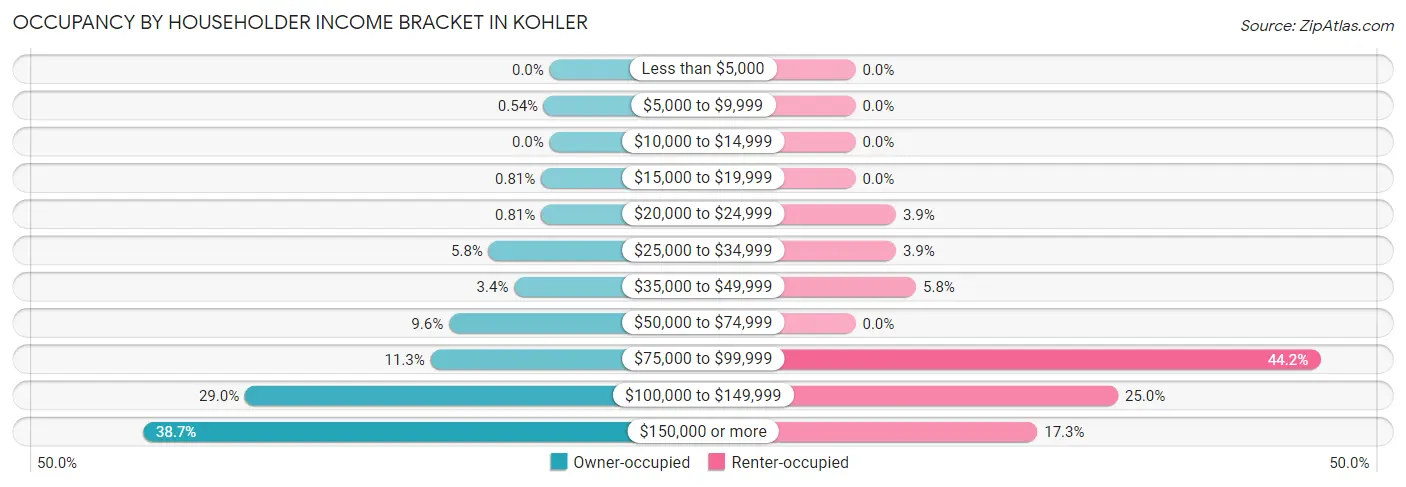
| Income Bracket | Owner-occupied | Renter-occupied |
| Less than $5,000 | 0 (0.0%) | 0 (0.0%) |
| $5,000 to $9,999 | 4 (0.5%) | 0 (0.0%) |
| $10,000 to $14,999 | 0 (0.0%) | 0 (0.0%) |
| $15,000 to $19,999 | 6 (0.8%) | 0 (0.0%) |
| $20,000 to $24,999 | 6 (0.8%) | 2 (3.8%) |
| $25,000 to $34,999 | 43 (5.8%) | 2 (3.8%) |
| $35,000 to $49,999 | 25 (3.4%) | 3 (5.8%) |
| $50,000 to $74,999 | 71 (9.6%) | 0 (0.0%) |
| $75,000 to $99,999 | 84 (11.3%) | 23 (44.2%) |
| $100,000 to $149,999 | 215 (29.0%) | 13 (25.0%) |
| $150,000 or more | 287 (38.7%) | 9 (17.3%) |
| Total | 741 (100.0%) | 52 (100.0%) |
Monthly Housing Cost Tiers in Kohler
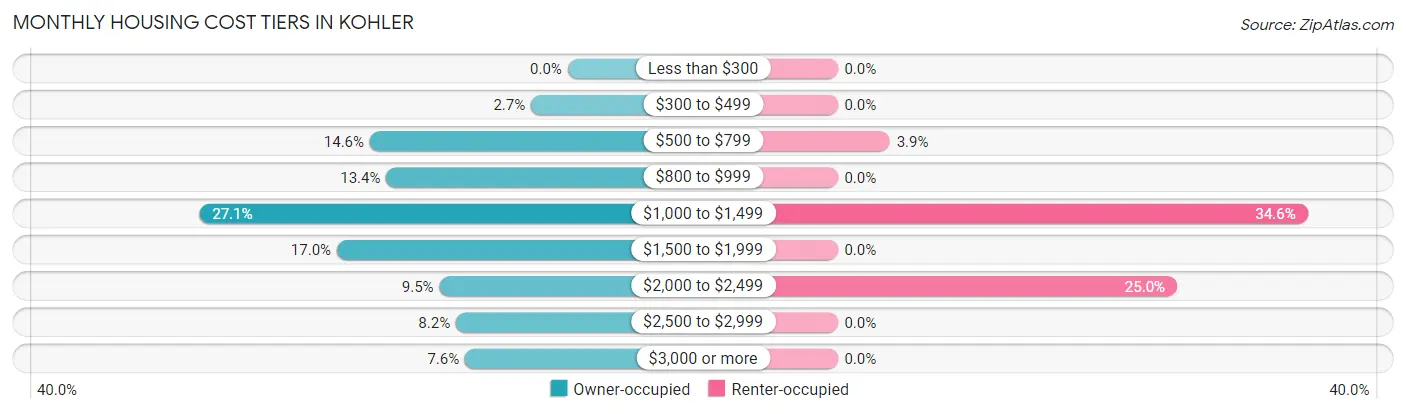
| Monthly Cost | Owner-occupied | Renter-occupied |
| Less than $300 | 0 (0.0%) | 0 (0.0%) |
| $300 to $499 | 20 (2.7%) | 0 (0.0%) |
| $500 to $799 | 108 (14.6%) | 2 (3.8%) |
| $800 to $999 | 99 (13.4%) | 0 (0.0%) |
| $1,000 to $1,499 | 201 (27.1%) | 18 (34.6%) |
| $1,500 to $1,999 | 126 (17.0%) | 0 (0.0%) |
| $2,000 to $2,499 | 70 (9.5%) | 13 (25.0%) |
| $2,500 to $2,999 | 61 (8.2%) | 0 (0.0%) |
| $3,000 or more | 56 (7.6%) | 0 (0.0%) |
| Total | 741 (100.0%) | 52 (100.0%) |
Physical Housing Characteristics in Kohler
Housing Structures in Kohler
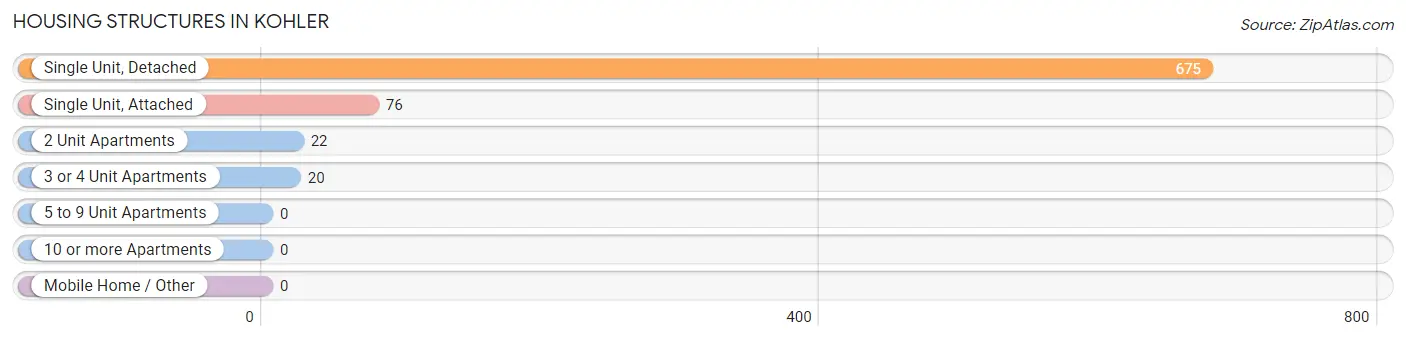
| Structure Type | # Housing Units | % Housing Units |
| Single Unit, Detached | 675 | 85.1% |
| Single Unit, Attached | 76 | 9.6% |
| 2 Unit Apartments | 22 | 2.8% |
| 3 or 4 Unit Apartments | 20 | 2.5% |
| 5 to 9 Unit Apartments | 0 | 0.0% |
| 10 or more Apartments | 0 | 0.0% |
| Mobile Home / Other | 0 | 0.0% |
| Total | 793 | 100.0% |
Housing Structures by Occupancy in Kohler
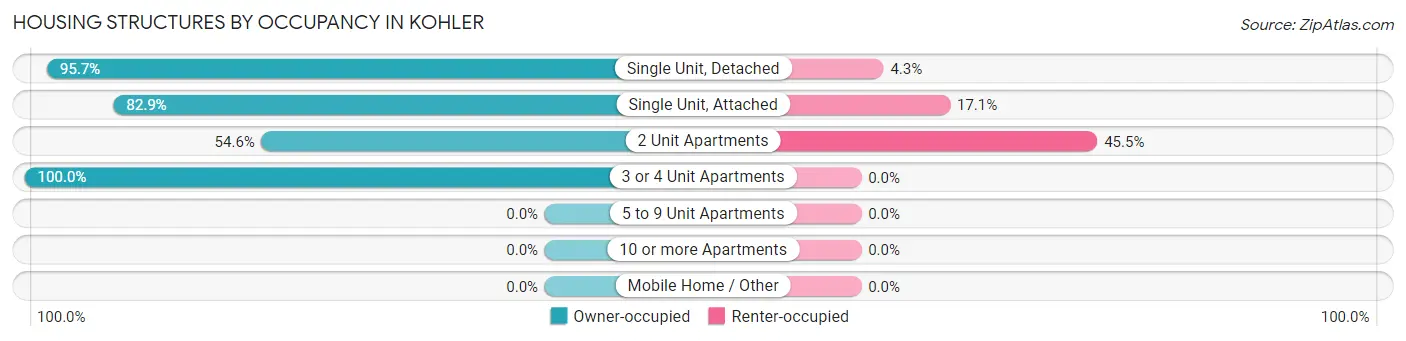
| Structure Type | Owner-occupied | Renter-occupied |
| Single Unit, Detached | 646 (95.7%) | 29 (4.3%) |
| Single Unit, Attached | 63 (82.9%) | 13 (17.1%) |
| 2 Unit Apartments | 12 (54.5%) | 10 (45.5%) |
| 3 or 4 Unit Apartments | 20 (100.0%) | 0 (0.0%) |
| 5 to 9 Unit Apartments | 0 (0.0%) | 0 (0.0%) |
| 10 or more Apartments | 0 (0.0%) | 0 (0.0%) |
| Mobile Home / Other | 0 (0.0%) | 0 (0.0%) |
| Total | 741 (93.4%) | 52 (6.6%) |
Housing Structures by Number of Rooms in Kohler
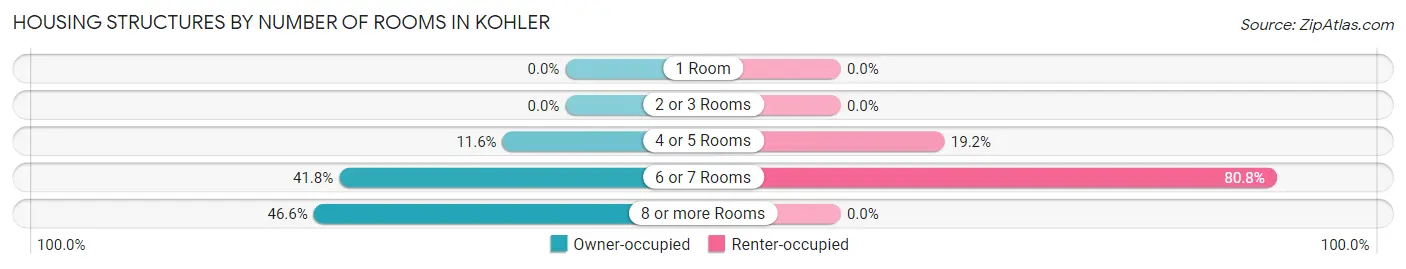
| Number of Rooms | Owner-occupied | Renter-occupied |
| 1 Room | 0 (0.0%) | 0 (0.0%) |
| 2 or 3 Rooms | 0 (0.0%) | 0 (0.0%) |
| 4 or 5 Rooms | 86 (11.6%) | 10 (19.2%) |
| 6 or 7 Rooms | 310 (41.8%) | 42 (80.8%) |
| 8 or more Rooms | 345 (46.6%) | 0 (0.0%) |
| Total | 741 (100.0%) | 52 (100.0%) |
Housing Structure by Heating Type in Kohler
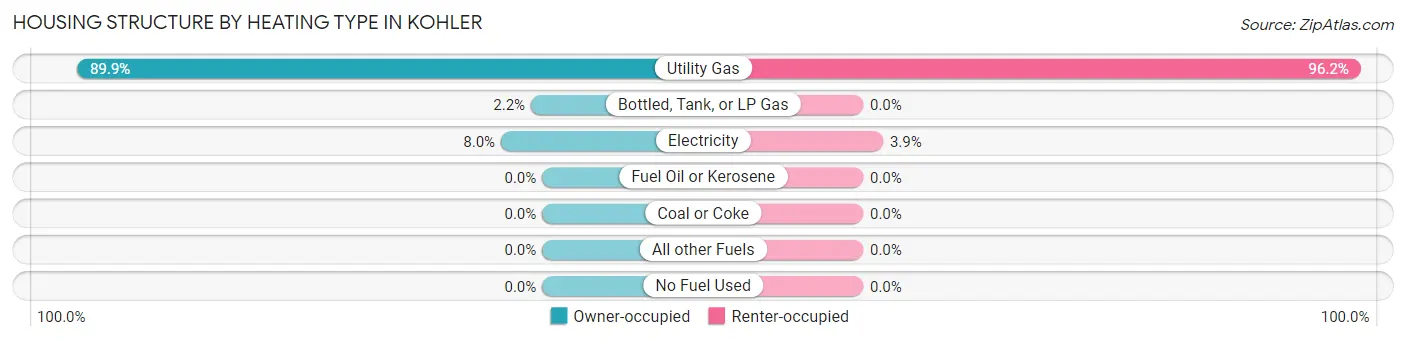
| Heating Type | Owner-occupied | Renter-occupied |
| Utility Gas | 666 (89.9%) | 50 (96.2%) |
| Bottled, Tank, or LP Gas | 16 (2.2%) | 0 (0.0%) |
| Electricity | 59 (8.0%) | 2 (3.8%) |
| Fuel Oil or Kerosene | 0 (0.0%) | 0 (0.0%) |
| Coal or Coke | 0 (0.0%) | 0 (0.0%) |
| All other Fuels | 0 (0.0%) | 0 (0.0%) |
| No Fuel Used | 0 (0.0%) | 0 (0.0%) |
| Total | 741 (100.0%) | 52 (100.0%) |
Household Vehicle Usage in Kohler
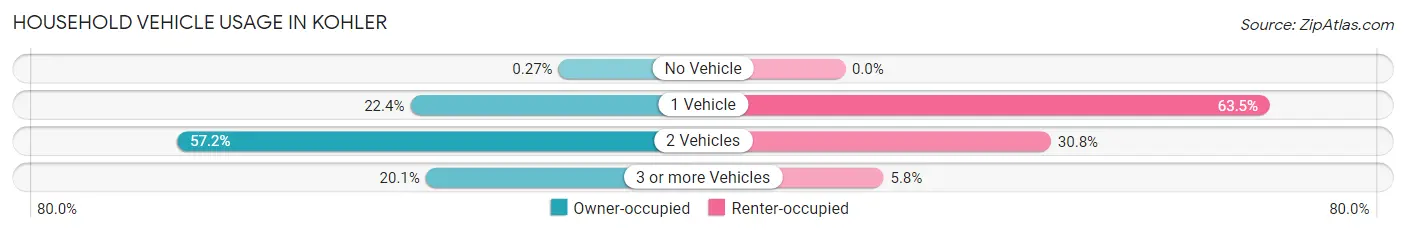
| Vehicles per Household | Owner-occupied | Renter-occupied |
| No Vehicle | 2 (0.3%) | 0 (0.0%) |
| 1 Vehicle | 166 (22.4%) | 33 (63.5%) |
| 2 Vehicles | 424 (57.2%) | 16 (30.8%) |
| 3 or more Vehicles | 149 (20.1%) | 3 (5.8%) |
| Total | 741 (100.0%) | 52 (100.0%) |
Real Estate & Mortgages in Kohler
Real Estate and Mortgage Overview in Kohler
| Characteristic | Without Mortgage | With Mortgage |
| Housing Units | 292 | 449 |
| Median Property Value | $364,800 | $321,100 |
| Median Household Income | $123,750 | $182 |
| Monthly Housing Costs | $860 | $54 |
| Real Estate Taxes | $5,308 | $0 |
Property Value by Mortgage Status in Kohler
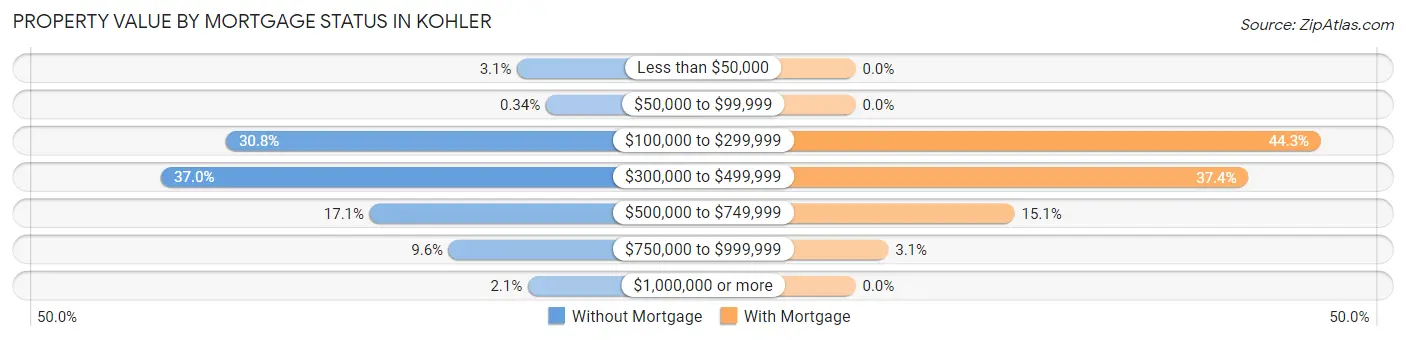
| Property Value | Without Mortgage | With Mortgage |
| Less than $50,000 | 9 (3.1%) | 0 (0.0%) |
| $50,000 to $99,999 | 1 (0.3%) | 0 (0.0%) |
| $100,000 to $299,999 | 90 (30.8%) | 199 (44.3%) |
| $300,000 to $499,999 | 108 (37.0%) | 168 (37.4%) |
| $500,000 to $749,999 | 50 (17.1%) | 68 (15.1%) |
| $750,000 to $999,999 | 28 (9.6%) | 14 (3.1%) |
| $1,000,000 or more | 6 (2.1%) | 0 (0.0%) |
| Total | 292 (100.0%) | 449 (100.0%) |
Household Income by Mortgage Status in Kohler
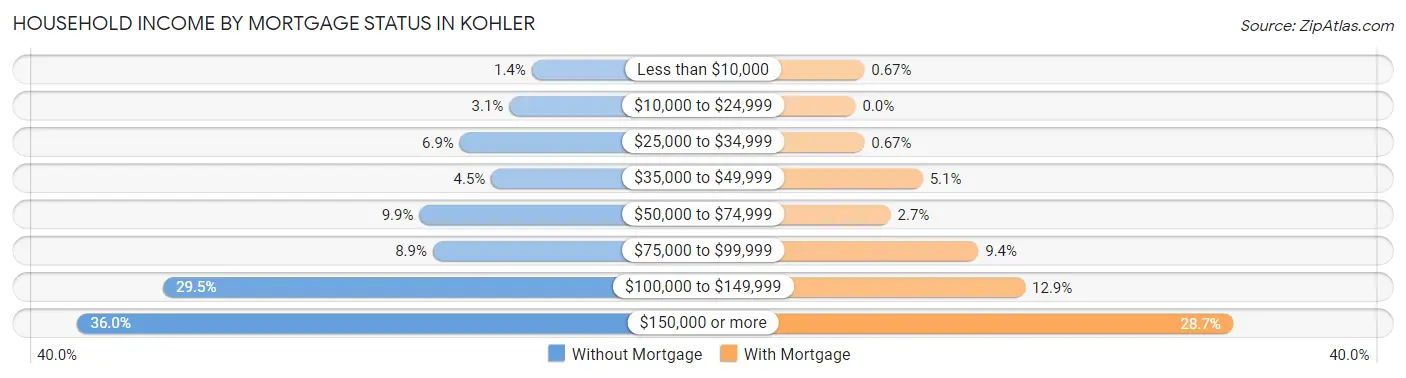
| Household Income | Without Mortgage | With Mortgage |
| Less than $10,000 | 4 (1.4%) | 3 (0.7%) |
| $10,000 to $24,999 | 9 (3.1%) | 0 (0.0%) |
| $25,000 to $34,999 | 20 (6.9%) | 3 (0.7%) |
| $35,000 to $49,999 | 13 (4.4%) | 23 (5.1%) |
| $50,000 to $74,999 | 29 (9.9%) | 12 (2.7%) |
| $75,000 to $99,999 | 26 (8.9%) | 42 (9.3%) |
| $100,000 to $149,999 | 86 (29.4%) | 58 (12.9%) |
| $150,000 or more | 105 (36.0%) | 129 (28.7%) |
| Total | 292 (100.0%) | 449 (100.0%) |
Property Value to Household Income Ratio in Kohler
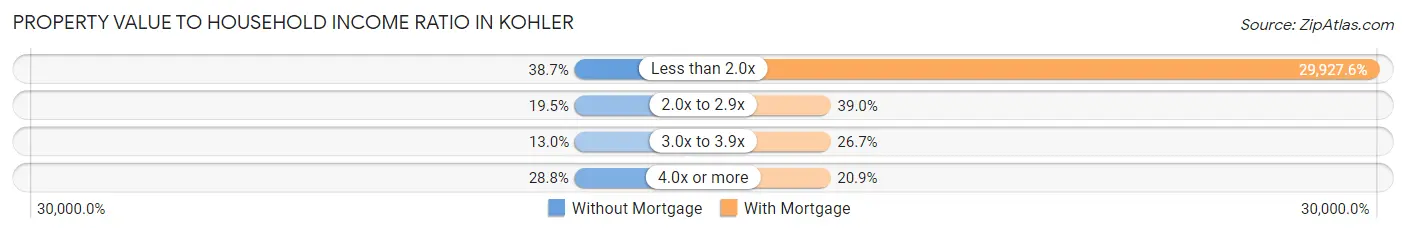
| Value-to-Income Ratio | Without Mortgage | With Mortgage |
| Less than 2.0x | 113 (38.7%) | 134,375 (29,927.6%) |
| 2.0x to 2.9x | 57 (19.5%) | 175 (39.0%) |
| 3.0x to 3.9x | 38 (13.0%) | 120 (26.7%) |
| 4.0x or more | 84 (28.8%) | 94 (20.9%) |
| Total | 292 (100.0%) | 449 (100.0%) |
Real Estate Taxes by Mortgage Status in Kohler
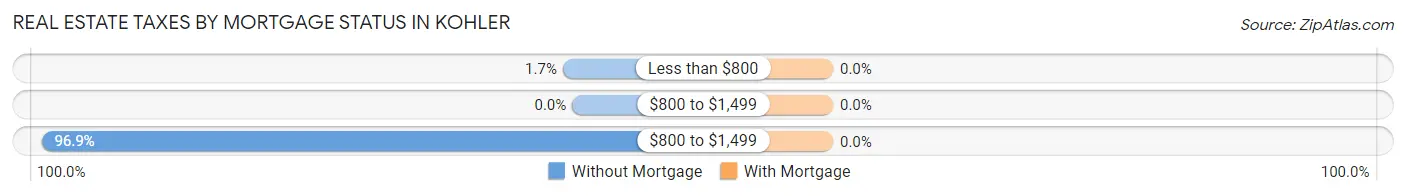
| Property Taxes | Without Mortgage | With Mortgage |
| Less than $800 | 5 (1.7%) | 0 (0.0%) |
| $800 to $1,499 | 0 (0.0%) | 0 (0.0%) |
| $800 to $1,499 | 283 (96.9%) | 0 (0.0%) |
| Total | 292 (100.0%) | 449 (100.0%) |
Health & Disability in Kohler
Health Insurance Coverage by Age in Kohler
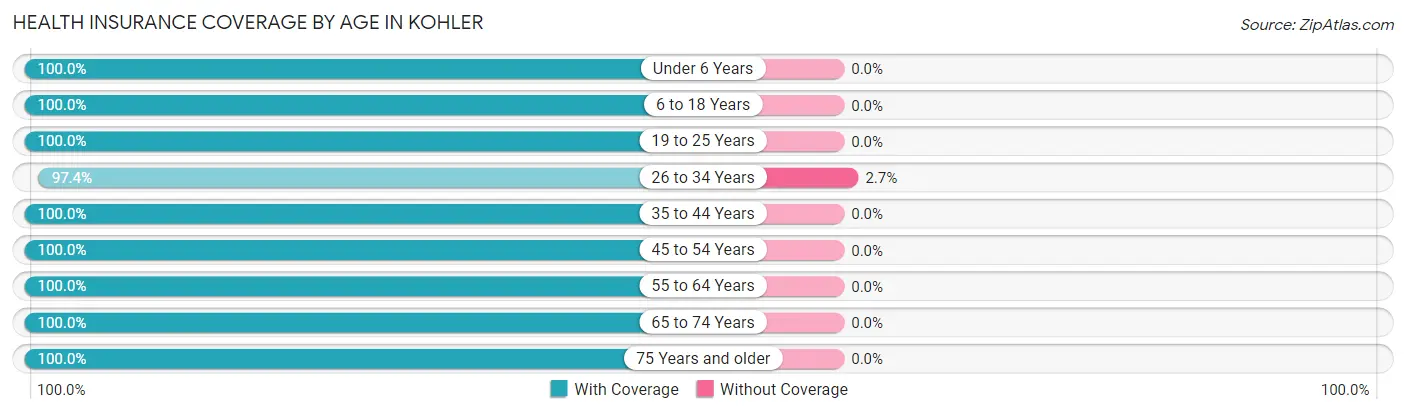
| Age Bracket | With Coverage | Without Coverage |
| Under 6 Years | 132 (100.0%) | 0 (0.0%) |
| 6 to 18 Years | 512 (100.0%) | 0 (0.0%) |
| 19 to 25 Years | 88 (100.0%) | 0 (0.0%) |
| 26 to 34 Years | 110 (97.4%) | 3 (2.6%) |
| 35 to 44 Years | 313 (100.0%) | 0 (0.0%) |
| 45 to 54 Years | 324 (100.0%) | 0 (0.0%) |
| 55 to 64 Years | 223 (100.0%) | 0 (0.0%) |
| 65 to 74 Years | 268 (100.0%) | 0 (0.0%) |
| 75 Years and older | 167 (100.0%) | 0 (0.0%) |
| Total | 2,137 (99.9%) | 3 (0.1%) |
Health Insurance Coverage by Citizenship Status in Kohler
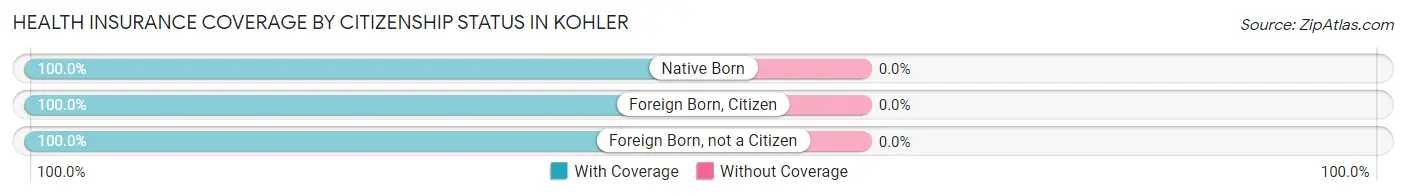
| Citizenship Status | With Coverage | Without Coverage |
| Native Born | 132 (100.0%) | 0 (0.0%) |
| Foreign Born, Citizen | 512 (100.0%) | 0 (0.0%) |
| Foreign Born, not a Citizen | 88 (100.0%) | 0 (0.0%) |
Health Insurance Coverage by Household Income in Kohler
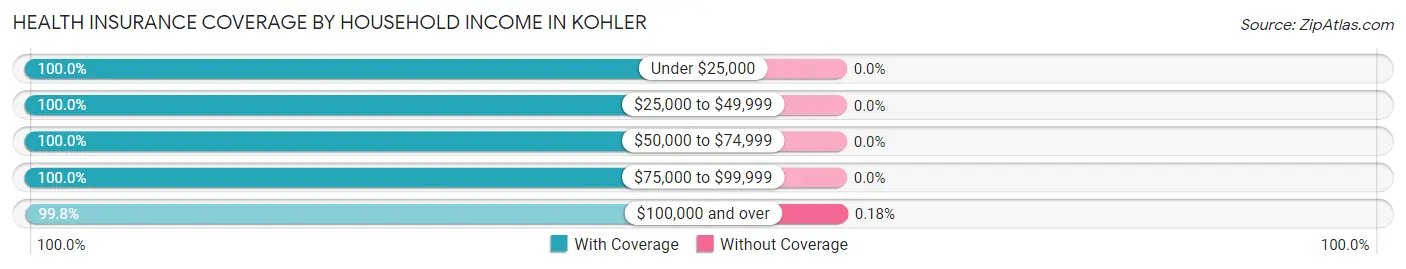
| Household Income | With Coverage | Without Coverage |
| Under $25,000 | 28 (100.0%) | 0 (0.0%) |
| $25,000 to $49,999 | 88 (100.0%) | 0 (0.0%) |
| $50,000 to $74,999 | 133 (100.0%) | 0 (0.0%) |
| $75,000 to $99,999 | 267 (100.0%) | 0 (0.0%) |
| $100,000 and over | 1,621 (99.8%) | 3 (0.2%) |
Public vs Private Health Insurance Coverage by Age in Kohler
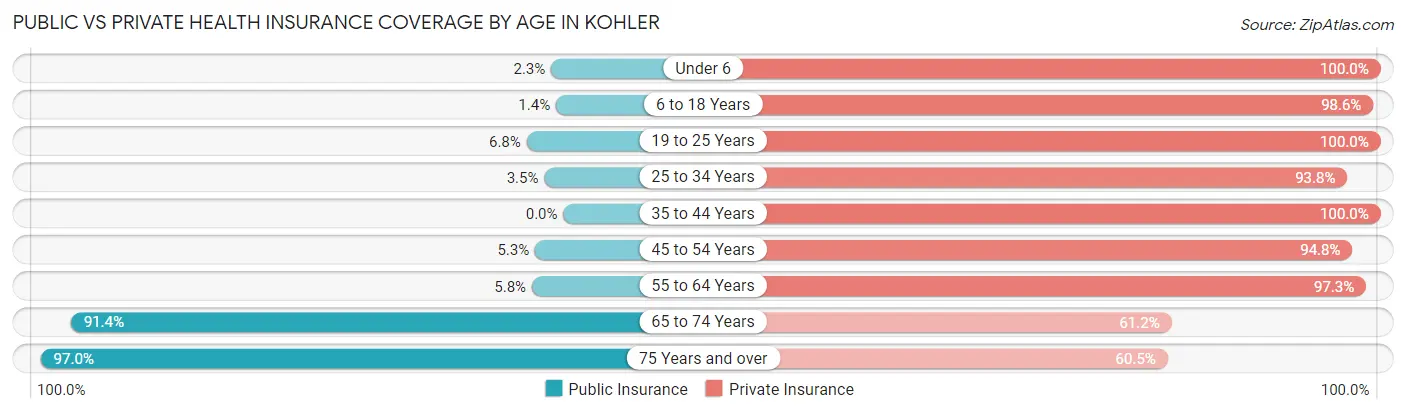
| Age Bracket | Public Insurance | Private Insurance |
| Under 6 | 3 (2.3%) | 132 (100.0%) |
| 6 to 18 Years | 7 (1.4%) | 505 (98.6%) |
| 19 to 25 Years | 6 (6.8%) | 88 (100.0%) |
| 25 to 34 Years | 4 (3.5%) | 106 (93.8%) |
| 35 to 44 Years | 0 (0.0%) | 313 (100.0%) |
| 45 to 54 Years | 17 (5.2%) | 307 (94.8%) |
| 55 to 64 Years | 13 (5.8%) | 217 (97.3%) |
| 65 to 74 Years | 245 (91.4%) | 164 (61.2%) |
| 75 Years and over | 162 (97.0%) | 101 (60.5%) |
| Total | 457 (21.4%) | 1,933 (90.3%) |
Disability Status by Sex by Age in Kohler
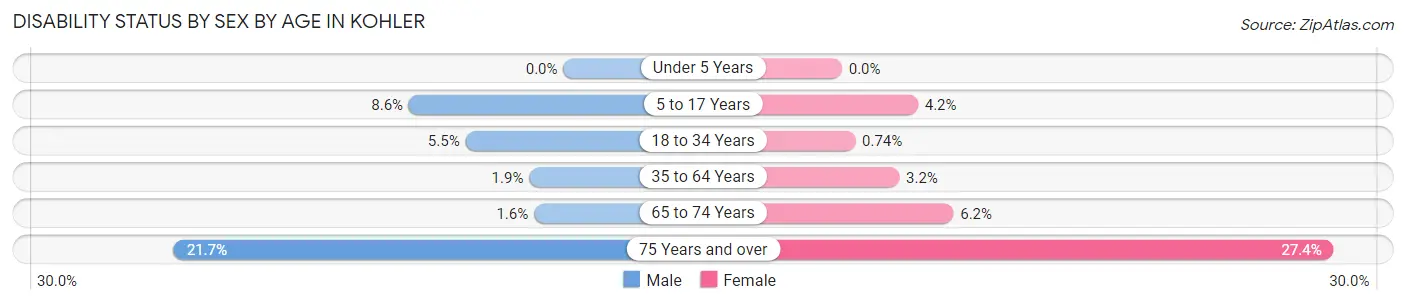
| Age Bracket | Male | Female |
| Under 5 Years | 0 (0.0%) | 0 (0.0%) |
| 5 to 17 Years | 19 (8.6%) | 12 (4.2%) |
| 18 to 34 Years | 6 (5.4%) | 1 (0.7%) |
| 35 to 64 Years | 8 (1.9%) | 14 (3.2%) |
| 65 to 74 Years | 2 (1.6%) | 9 (6.2%) |
| 75 Years and over | 18 (21.7%) | 23 (27.4%) |
Disability Class by Sex by Age in Kohler
Disability Class: Hearing Difficulty
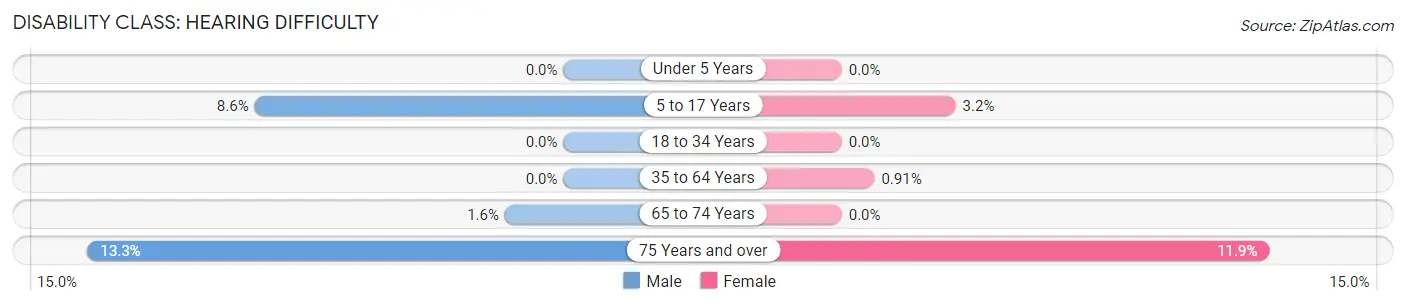
| Age Bracket | Male | Female |
| Under 5 Years | 0 (0.0%) | 0 (0.0%) |
| 5 to 17 Years | 19 (8.6%) | 9 (3.2%) |
| 18 to 34 Years | 0 (0.0%) | 0 (0.0%) |
| 35 to 64 Years | 0 (0.0%) | 4 (0.9%) |
| 65 to 74 Years | 2 (1.6%) | 0 (0.0%) |
| 75 Years and over | 11 (13.3%) | 10 (11.9%) |
Disability Class: Vision Difficulty
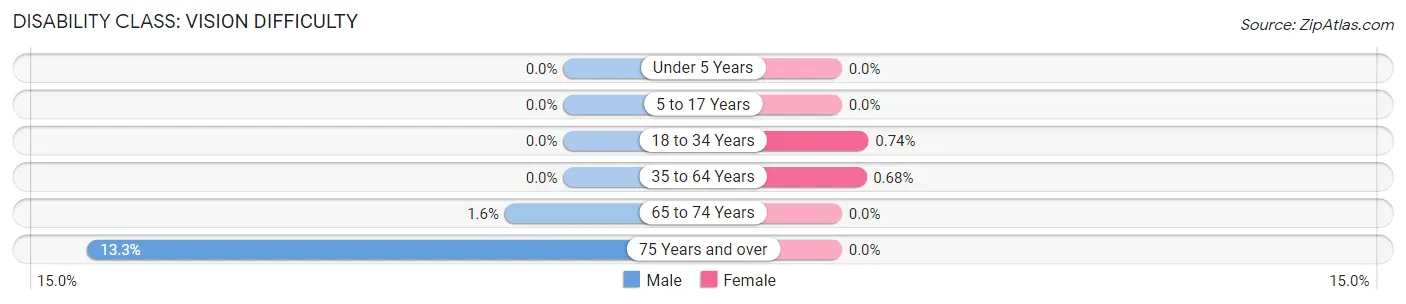
| Age Bracket | Male | Female |
| Under 5 Years | 0 (0.0%) | 0 (0.0%) |
| 5 to 17 Years | 0 (0.0%) | 0 (0.0%) |
| 18 to 34 Years | 0 (0.0%) | 1 (0.7%) |
| 35 to 64 Years | 0 (0.0%) | 3 (0.7%) |
| 65 to 74 Years | 2 (1.6%) | 0 (0.0%) |
| 75 Years and over | 11 (13.3%) | 0 (0.0%) |
Disability Class: Cognitive Difficulty
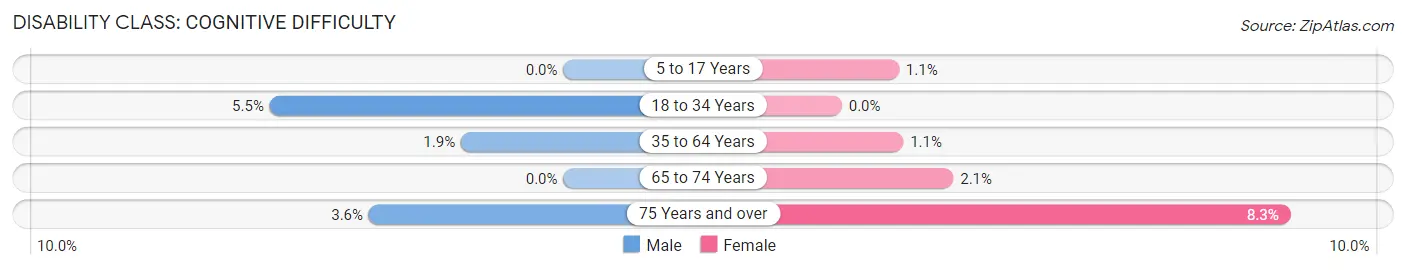
| Age Bracket | Male | Female |
| 5 to 17 Years | 0 (0.0%) | 3 (1.1%) |
| 18 to 34 Years | 6 (5.4%) | 0 (0.0%) |
| 35 to 64 Years | 8 (1.9%) | 5 (1.1%) |
| 65 to 74 Years | 0 (0.0%) | 3 (2.1%) |
| 75 Years and over | 3 (3.6%) | 7 (8.3%) |
Disability Class: Ambulatory Difficulty
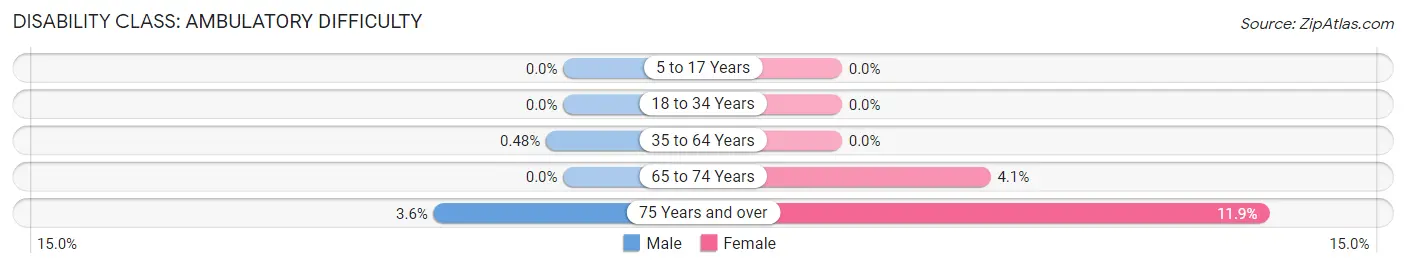
| Age Bracket | Male | Female |
| 5 to 17 Years | 0 (0.0%) | 0 (0.0%) |
| 18 to 34 Years | 0 (0.0%) | 0 (0.0%) |
| 35 to 64 Years | 2 (0.5%) | 0 (0.0%) |
| 65 to 74 Years | 0 (0.0%) | 6 (4.1%) |
| 75 Years and over | 3 (3.6%) | 10 (11.9%) |
Disability Class: Self-Care Difficulty
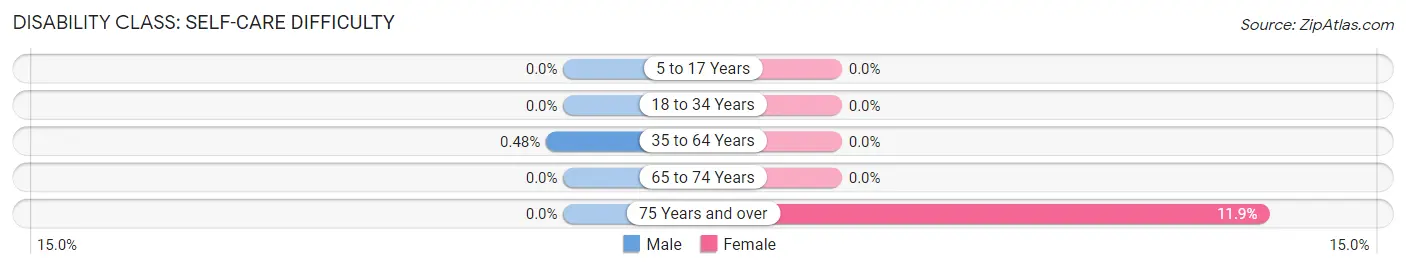
| Age Bracket | Male | Female |
| 5 to 17 Years | 0 (0.0%) | 0 (0.0%) |
| 18 to 34 Years | 0 (0.0%) | 0 (0.0%) |
| 35 to 64 Years | 2 (0.5%) | 0 (0.0%) |
| 65 to 74 Years | 0 (0.0%) | 0 (0.0%) |
| 75 Years and over | 0 (0.0%) | 10 (11.9%) |
Technology Access in Kohler
Computing Device Access in Kohler
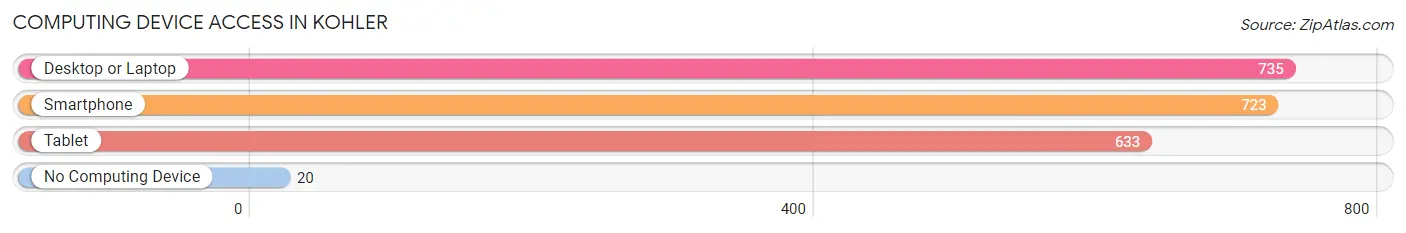
| Device Type | # Households | % Households |
| Desktop or Laptop | 735 | 92.7% |
| Smartphone | 723 | 91.2% |
| Tablet | 633 | 79.8% |
| No Computing Device | 20 | 2.5% |
| Total | 793 | 100.0% |
Internet Access in Kohler
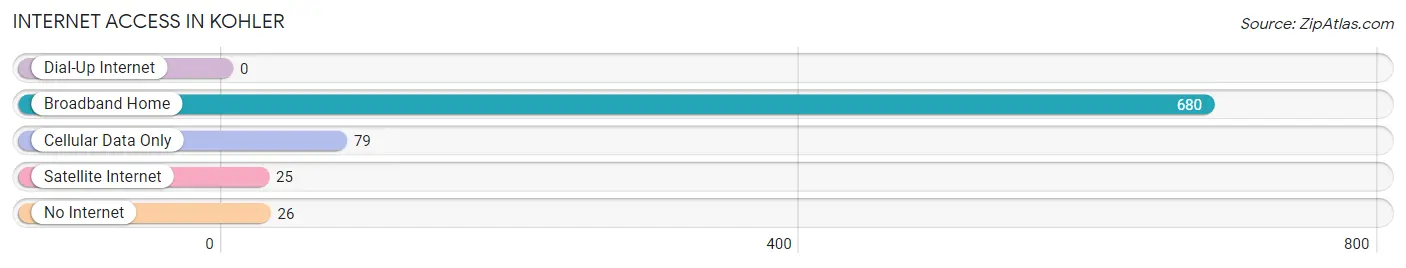
| Internet Type | # Households | % Households |
| Dial-Up Internet | 0 | 0.0% |
| Broadband Home | 680 | 85.8% |
| Cellular Data Only | 79 | 10.0% |
| Satellite Internet | 25 | 3.2% |
| No Internet | 26 | 3.3% |
| Total | 793 | 100.0% |
Kohler Summary
Kohler, Wisconsin is a village located in Sheboygan County, Wisconsin, United States. The population was 2,093 at the 2010 census. It is included in the Sheboygan, Wisconsin Metropolitan Statistical Area. The village is located within the Town of Sheboygan.
History
Kohler was founded in 1912 by John Michael Kohler, who purchased the Sheboygan Union Stockyards and the surrounding land. He then developed the area into a planned community, with a village center, residential areas, and industrial areas. The village was incorporated in 1912.
Kohler is best known for its plumbing fixtures, which are manufactured by the Kohler Company, founded by John Michael Kohler in 1873. The company is still headquartered in Kohler, and is the largest employer in the village.
Geography
Kohler is located at 43 37 17 N 87 45 17 W 43 621445 87 754717
According to the United States Census Bureau, the village has a total area of 1.3 square miles (3.4 km2), all of it land.
Economy
Kohler is home to the Kohler Company, a manufacturer of plumbing fixtures, furniture, tile, and engines. The company is the largest employer in the village, and is the main source of economic activity in the area.
Kohler is also home to several other businesses including a golf course a hotel and a spa
Demographics
As of the census of 2010, there were 2,093 people, 845 households, and 590 families residing in the village. The population density was 1,619.2 people per square mile (625.2/km2). There were 890 housing units at an average density of 688.5 per square mile (266.2/km2). The racial makeup of the village was 97.2% White, 0.3% African American, 0.2% Native American, 0.9% Asian, 0.2% from other races, and 1.2% from two or more races. Hispanic or Latino of any race were 1.2% of the population.
There were 845 households, out of which 33.2% had children under the age of 18 living with them, 57.2% were married couples living together, 8.2% had a female householder with no husband present, and 31.2% were non-families. 26.2% of all households were made up of individuals, and 11.2% had someone living alone who was 65 years of age or older. The average household size was 2.48 and the average family size was 3.02.
In the village, the population was spread out, with 25.2% under the age of 18, 5.7% from 18 to 24, 28.2% from 25 to 44, 25.2% from 45 to 64, and 15.7% who were 65 years of age or older. The median age was 40 years. For every 100 females, there were 93.2 males. For every 100 females age 18 and over, there were 91.2 males.
The median income for a household in the village was $60,938, and the median income for a family was $71,917. Males had a median income of $50,000 versus $31,250 for females. The per capita income for the village was $30,945. About 1.7% of families and 2.7% of the population were below the poverty line, including 2.2% of those under age 18 and 4.2% of those age 65 or over.
Common Questions
What is Per Capita Income in Kohler?
Per Capita income in Kohler is $71,550.
What is the Median Family Income in Kohler?
Median Family Income in Kohler is $142,989.
What is the Median Household income in Kohler?
Median Household Income in Kohler is $128,036.
What is Income or Wage Gap in Kohler?
Income or Wage Gap in Kohler is 63.6%.
Women in Kohler earn 36.4 cents for every dollar earned by a man.
What is Inequality or Gini Index in Kohler?
Inequality or Gini Index in Kohler is 0.47.
What is the Total Population of Kohler?
Total Population of Kohler is 2,142.
What is the Total Male Population of Kohler?
Total Male Population of Kohler is 1,017.
What is the Total Female Population of Kohler?
Total Female Population of Kohler is 1,125.
What is the Ratio of Males per 100 Females in Kohler?
There are 90.40 Males per 100 Females in Kohler.
What is the Ratio of Females per 100 Males in Kohler?
There are 110.62 Females per 100 Males in Kohler.
What is the Median Population Age in Kohler?
Median Population Age in Kohler is 42.3 Years.
What is the Average Family Size in Kohler
Average Family Size in Kohler is 3.1 People.
What is the Average Household Size in Kohler
Average Household Size in Kohler is 2.7 People.
How Large is the Labor Force in Kohler?
There are 1,091 People in the Labor Forcein in Kohler.
What is the Percentage of People in the Labor Force in Kohler?
65.7% of People are in the Labor Force in Kohler.
What is the Unemployment Rate in Kohler?
Unemployment Rate in Kohler is 4.0%.