Kingston, WI Map & Demographics
Kingston Map
Kingston Overview
$35,307
PER CAPITA INCOME
$75,000
AVG FAMILY INCOME
$75,250
AVG HOUSEHOLD INCOME
0.40
INEQUALITY / GINI INDEX
316
TOTAL POPULATION
176
MALE POPULATION
140
FEMALE POPULATION
125.71
MALES / 100 FEMALES
79.55
FEMALES / 100 MALES
55.0
MEDIAN AGE
3.0
AVG FAMILY SIZE
2.6
AVG HOUSEHOLD SIZE
136
LABOR FORCE [ PEOPLE ]
49.3%
PERCENT IN LABOR FORCE
4.4%
UNEMPLOYMENT RATE
Kingston Zip Codes
Kingston Area Codes
Income in Kingston
Income Overview in Kingston
Per Capita Income in Kingston is $35,307, while median incomes of families and households are $75,000 and $75,250 respectively.
| Characteristic | Number | Measure |
| Per Capita Income | 316 | $35,307 |
| Median Family Income | 92 | $75,000 |
| Mean Family Income | 92 | $76,246 |
| Median Household Income | 122 | $75,250 |
| Mean Household Income | 122 | $87,125 |
| Income Deficit | 92 | $0 |
| Wage / Income Gap (%) | 316 | 0.00% |
| Wage / Income Gap ($) | 316 | 100.00¢ per $1 |
| Gini / Inequality Index | 316 | 0.40 |
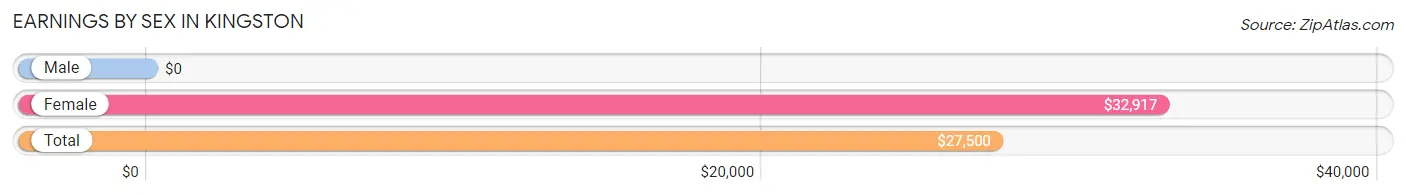
Earnings by Sex in Kingston
| Sex | Number | Average Earnings |
| Male | 107 (62.9%) | $0 |
| Female | 63 (37.1%) | $32,917 |
| Total | 170 (100.0%) | $27,500 |
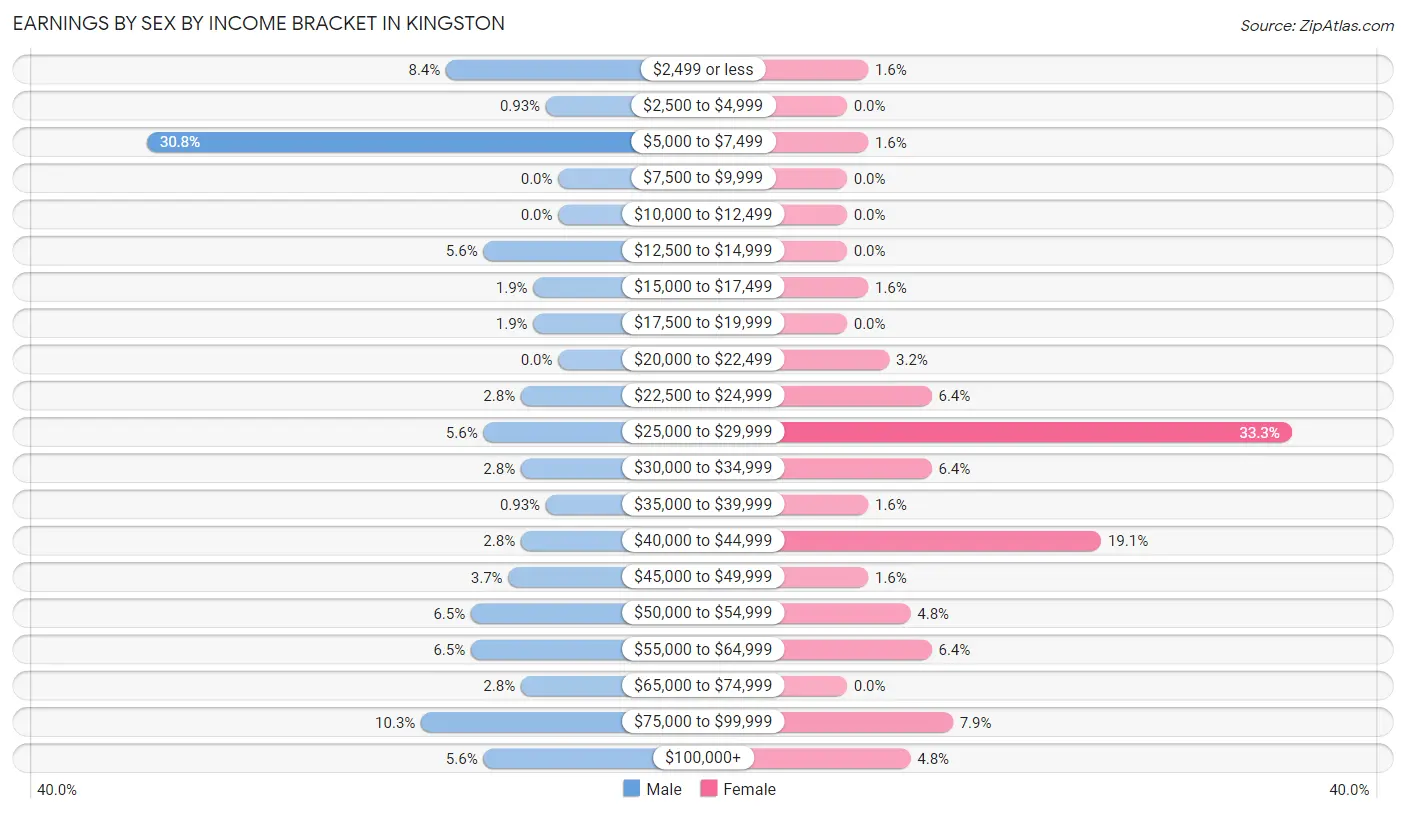
Earnings by Sex by Income Bracket in Kingston
The most common earnings brackets in Kingston are $5,000 to $7,499 for men (33 | 30.8%) and $25,000 to $29,999 for women (21 | 33.3%).
| Income | Male | Female |
| $2,499 or less | 9 (8.4%) | 1 (1.6%) |
| $2,500 to $4,999 | 1 (0.9%) | 0 (0.0%) |
| $5,000 to $7,499 | 33 (30.8%) | 1 (1.6%) |
| $7,500 to $9,999 | 0 (0.0%) | 0 (0.0%) |
| $10,000 to $12,499 | 0 (0.0%) | 0 (0.0%) |
| $12,500 to $14,999 | 6 (5.6%) | 0 (0.0%) |
| $15,000 to $17,499 | 2 (1.9%) | 1 (1.6%) |
| $17,500 to $19,999 | 2 (1.9%) | 0 (0.0%) |
| $20,000 to $22,499 | 0 (0.0%) | 2 (3.2%) |
| $22,500 to $24,999 | 3 (2.8%) | 4 (6.4%) |
| $25,000 to $29,999 | 6 (5.6%) | 21 (33.3%) |
| $30,000 to $34,999 | 3 (2.8%) | 4 (6.4%) |
| $35,000 to $39,999 | 1 (0.9%) | 1 (1.6%) |
| $40,000 to $44,999 | 3 (2.8%) | 12 (19.1%) |
| $45,000 to $49,999 | 4 (3.7%) | 1 (1.6%) |
| $50,000 to $54,999 | 7 (6.5%) | 3 (4.8%) |
| $55,000 to $64,999 | 7 (6.5%) | 4 (6.4%) |
| $65,000 to $74,999 | 3 (2.8%) | 0 (0.0%) |
| $75,000 to $99,999 | 11 (10.3%) | 5 (7.9%) |
| $100,000+ | 6 (5.6%) | 3 (4.8%) |
| Total | 107 (100.0%) | 63 (100.0%) |
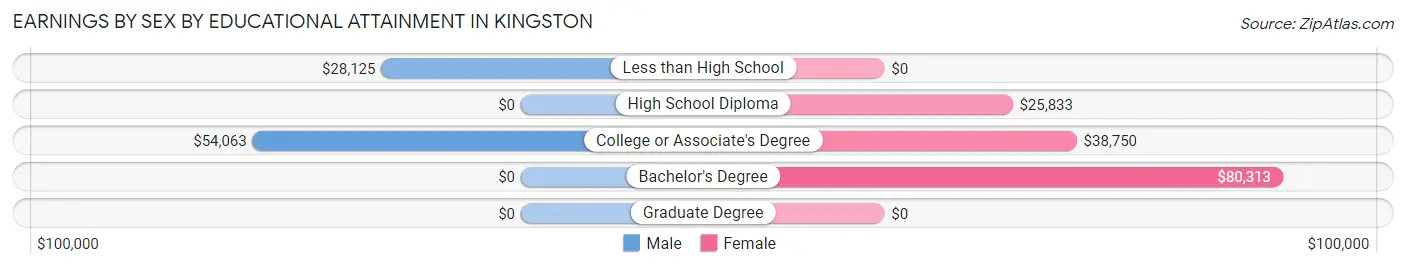
Earnings by Sex by Educational Attainment in Kingston
| Educational Attainment | Male Income | Female Income |
| Less than High School | $28,125 | $0 |
| High School Diploma | - | - |
| College or Associate's Degree | $54,063 | $38,750 |
| Bachelor's Degree | - | - |
| Graduate Degree | - | - |
| Total | - | - |
Family Income in Kingston
Family Income Brackets in Kingston
According to the Kingston family income data, there are 26 families falling into the $100,000 to $149,999 income range, which is the most common income bracket and makes up 28.3% of all families.
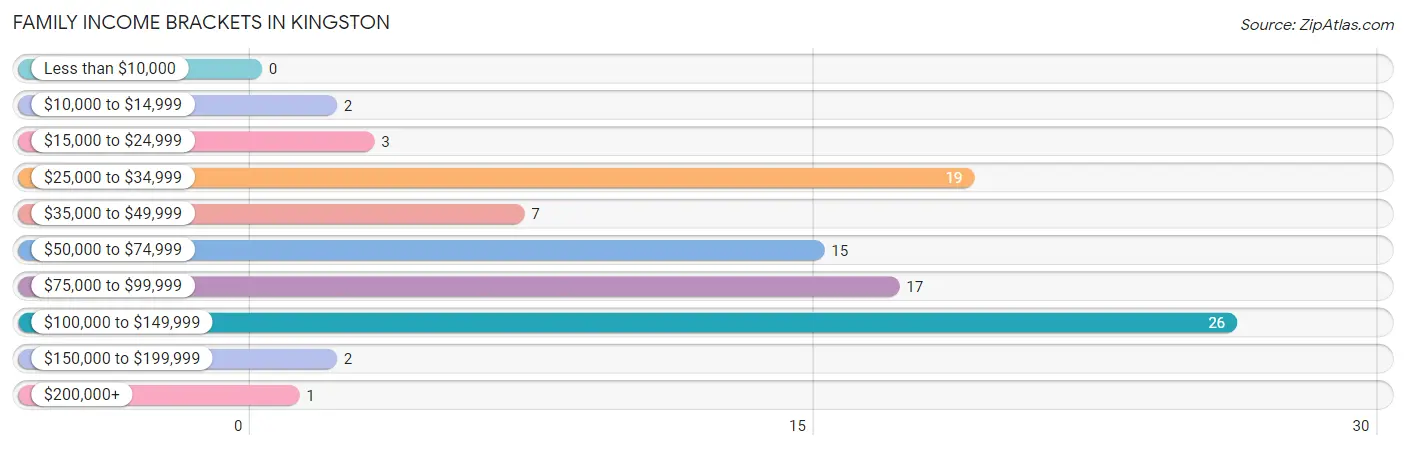
| Income Bracket | # Families | % Families |
| Less than $10,000 | 0 | 0.0% |
| $10,000 to $14,999 | 2 | 2.2% |
| $15,000 to $24,999 | 3 | 3.3% |
| $25,000 to $34,999 | 19 | 20.7% |
| $35,000 to $49,999 | 7 | 7.6% |
| $50,000 to $74,999 | 15 | 16.3% |
| $75,000 to $99,999 | 17 | 18.5% |
| $100,000 to $149,999 | 26 | 28.3% |
| $150,000 to $199,999 | 2 | 2.2% |
| $200,000+ | 1 | 1.1% |
Family Income by Famaliy Size in Kingston
3-person families (10 | 10.9%) account for the highest median family income in Kingston with $112,500 per family, while 3-person families (10 | 10.9%) have the highest median income of $37,500 per family member.
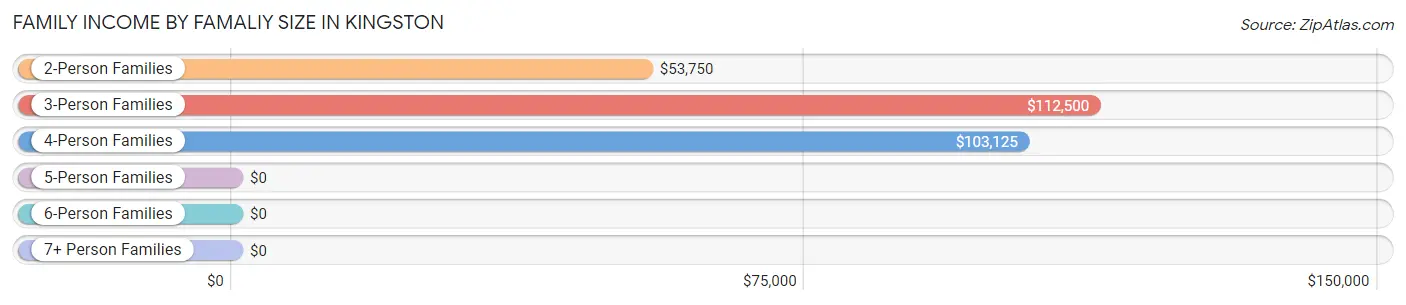
| Income Bracket | # Families | Median Income |
| 2-Person Families | 67 (72.8%) | $53,750 |
| 3-Person Families | 10 (10.9%) | $112,500 |
| 4-Person Families | 12 (13.0%) | $103,125 |
| 5-Person Families | 1 (1.1%) | $0 |
| 6-Person Families | 2 (2.2%) | $0 |
| 7+ Person Families | 0 (0.0%) | $0 |
| Total | 92 (100.0%) | $75,000 |
Family Income by Number of Earners in Kingston
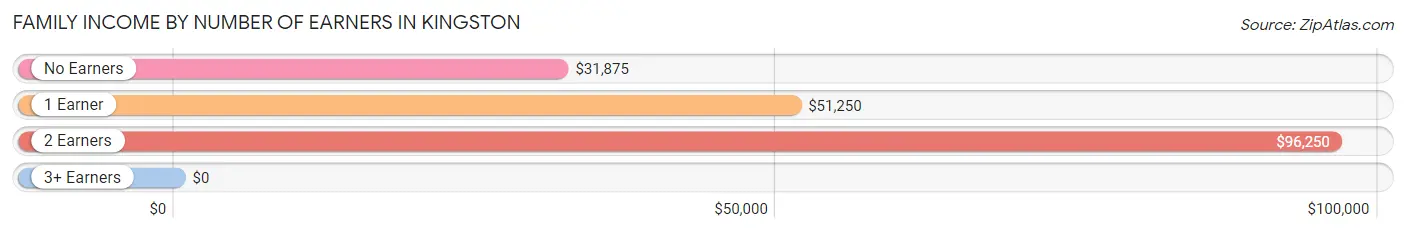
| Number of Earners | # Families | Median Income |
| No Earners | 23 (25.0%) | $31,875 |
| 1 Earner | 21 (22.8%) | $51,250 |
| 2 Earners | 48 (52.2%) | $96,250 |
| 3+ Earners | 0 (0.0%) | $0 |
| Total | 92 (100.0%) | $75,000 |
Household Income in Kingston
Household Income Brackets in Kingston
With 28 households falling in the category, the $100,000 to $149,999 income range is the most frequent in Kingston, accounting for 23.0% of all households. In contrast, only 2 households (1.6%) fall into the less than $10,000 income bracket, making it the least populous group.
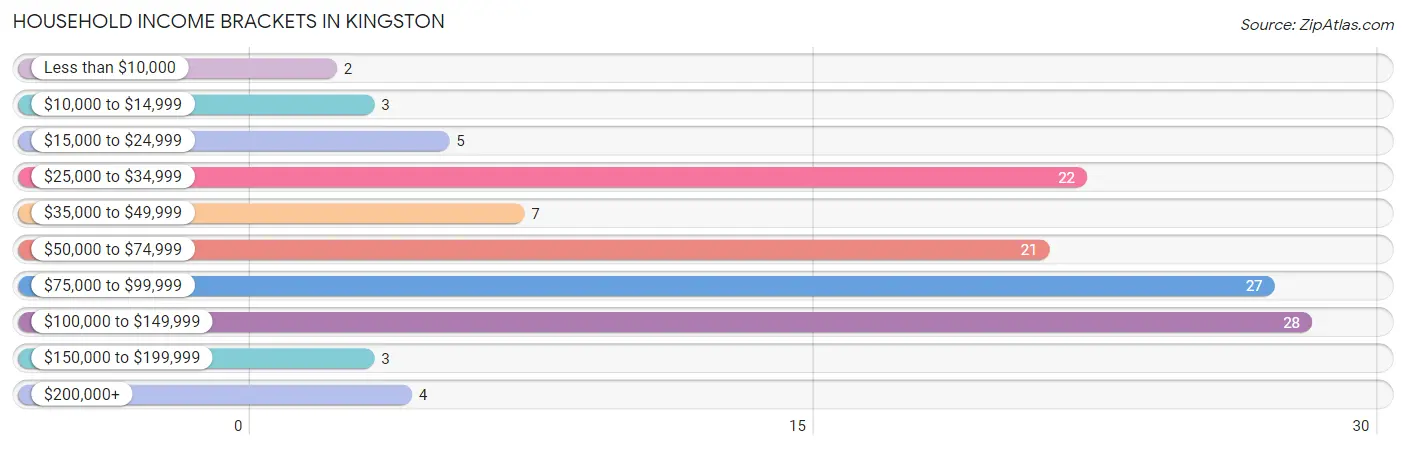
| Income Bracket | # Households | % Households |
| Less than $10,000 | 2 | 1.6% |
| $10,000 to $14,999 | 3 | 2.5% |
| $15,000 to $24,999 | 5 | 4.1% |
| $25,000 to $34,999 | 22 | 18.0% |
| $35,000 to $49,999 | 7 | 5.7% |
| $50,000 to $74,999 | 21 | 17.2% |
| $75,000 to $99,999 | 27 | 22.1% |
| $100,000 to $149,999 | 28 | 23.0% |
| $150,000 to $199,999 | 3 | 2.5% |
| $200,000+ | 4 | 3.3% |
Household Income by Householder Age in Kingston
The median household income in Kingston is $75,250, with the highest median household income of $76,875 found in the 25 to 44 years age bracket for the primary householder. A total of 23 households (18.9%) fall into this category. Meanwhile, the 65+ years age bracket for the primary householder has the lowest median household income of $53,750, with 41 households (33.6%) in this group.
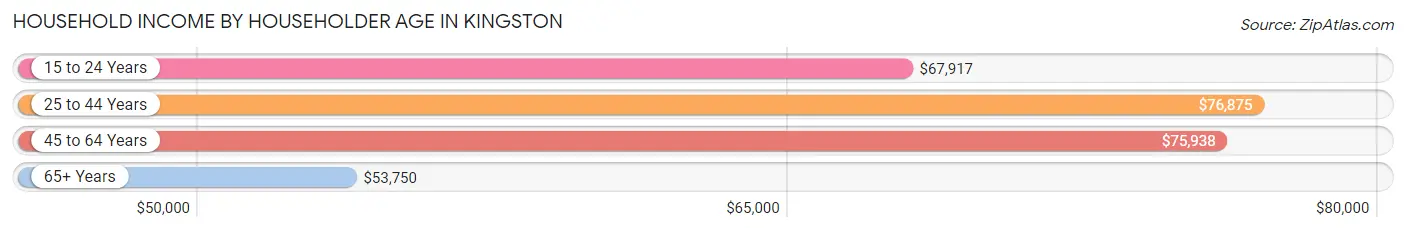
| Income Bracket | # Households | Median Income |
| 15 to 24 Years | 5 (4.1%) | $67,917 |
| 25 to 44 Years | 23 (18.9%) | $76,875 |
| 45 to 64 Years | 53 (43.4%) | $75,938 |
| 65+ Years | 41 (33.6%) | $53,750 |
| Total | 122 (100.0%) | $75,250 |
Poverty in Kingston
Income Below Poverty by Sex and Age in Kingston
With 4.0% poverty level for males and 5.0% for females among the residents of Kingston, 75 year old and over males and 75 year old and over females are the most vulnerable to poverty, with 3 males (15.8%) and 3 females (13.6%) in their respective age groups living below the poverty level.
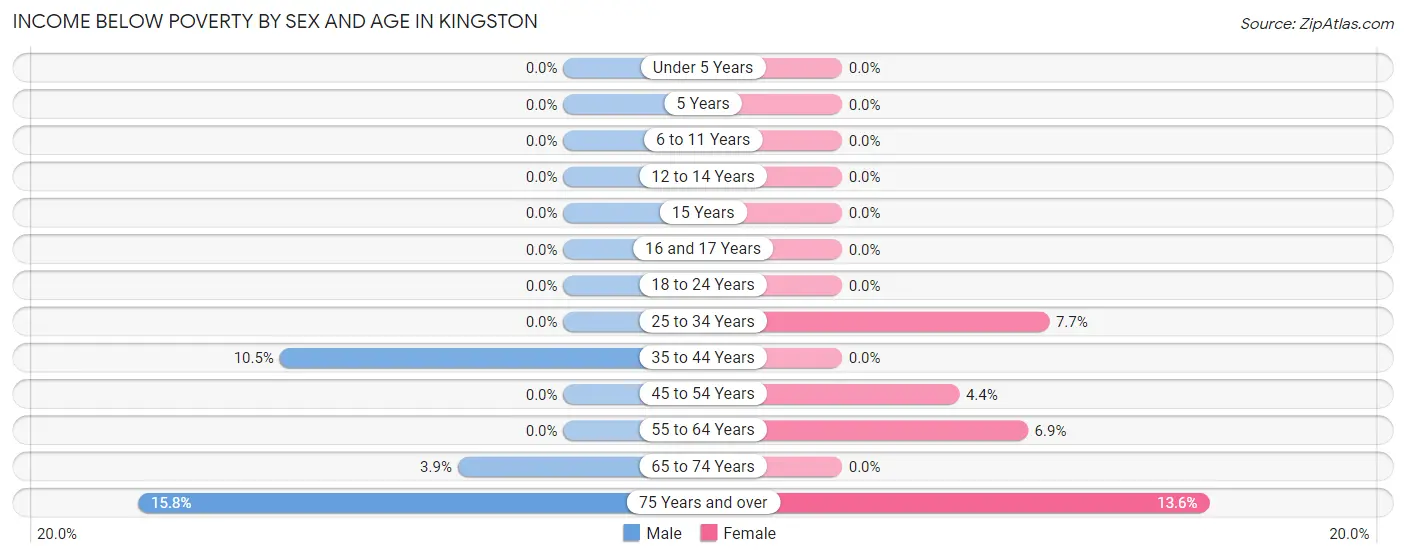
| Age Bracket | Male | Female |
| Under 5 Years | 0 (0.0%) | 0 (0.0%) |
| 5 Years | 0 (0.0%) | 0 (0.0%) |
| 6 to 11 Years | 0 (0.0%) | 0 (0.0%) |
| 12 to 14 Years | 0 (0.0%) | 0 (0.0%) |
| 15 Years | 0 (0.0%) | 0 (0.0%) |
| 16 and 17 Years | 0 (0.0%) | 0 (0.0%) |
| 18 to 24 Years | 0 (0.0%) | 0 (0.0%) |
| 25 to 34 Years | 0 (0.0%) | 1 (7.7%) |
| 35 to 44 Years | 2 (10.5%) | 0 (0.0%) |
| 45 to 54 Years | 0 (0.0%) | 1 (4.3%) |
| 55 to 64 Years | 0 (0.0%) | 2 (6.9%) |
| 65 to 74 Years | 2 (3.9%) | 0 (0.0%) |
| 75 Years and over | 3 (15.8%) | 3 (13.6%) |
| Total | 7 (4.0%) | 7 (5.0%) |
Income Above Poverty by Sex and Age in Kingston
According to the poverty statistics in Kingston, males aged under 5 years and females aged under 5 years are the age groups that are most secure financially, with 100.0% of males and 100.0% of females in these age groups living above the poverty line.
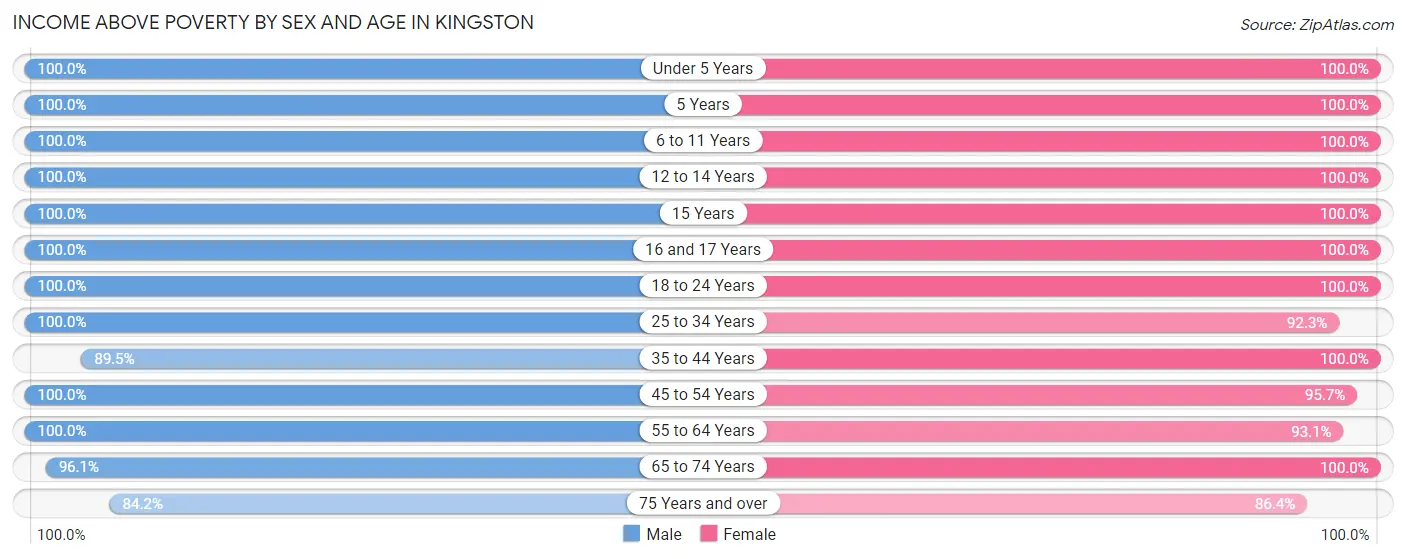
| Age Bracket | Male | Female |
| Under 5 Years | 4 (100.0%) | 4 (100.0%) |
| 5 Years | 1 (100.0%) | 1 (100.0%) |
| 6 to 11 Years | 10 (100.0%) | 7 (100.0%) |
| 12 to 14 Years | 1 (100.0%) | 7 (100.0%) |
| 15 Years | 3 (100.0%) | 2 (100.0%) |
| 16 and 17 Years | 3 (100.0%) | 1 (100.0%) |
| 18 to 24 Years | 4 (100.0%) | 4 (100.0%) |
| 25 to 34 Years | 9 (100.0%) | 12 (92.3%) |
| 35 to 44 Years | 17 (89.5%) | 16 (100.0%) |
| 45 to 54 Years | 26 (100.0%) | 22 (95.7%) |
| 55 to 64 Years | 26 (100.0%) | 27 (93.1%) |
| 65 to 74 Years | 49 (96.1%) | 11 (100.0%) |
| 75 Years and over | 16 (84.2%) | 19 (86.4%) |
| Total | 169 (96.0%) | 133 (95.0%) |
Income Below Poverty Among Married-Couple Families in Kingston
The poverty statistics for married-couple families in Kingston show that 6.2% or 5 of the total 80 families live below the poverty line. Families with no children have the highest poverty rate of 7.7%, comprising of 5 families. On the other hand, families with 1 or 2 children have the lowest poverty rate of 0.0%, which includes 0 families.
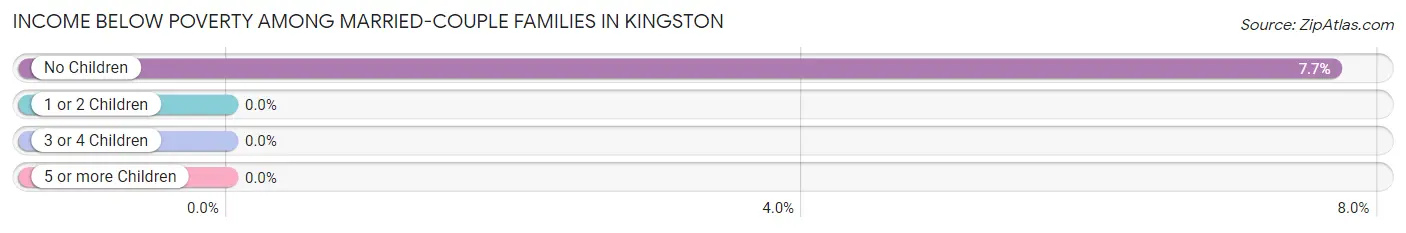
| Children | Above Poverty | Below Poverty |
| No Children | 60 (92.3%) | 5 (7.7%) |
| 1 or 2 Children | 13 (100.0%) | 0 (0.0%) |
| 3 or 4 Children | 2 (100.0%) | 0 (0.0%) |
| 5 or more Children | 0 (0.0%) | 0 (0.0%) |
| Total | 75 (93.8%) | 5 (6.2%) |
Income Below Poverty Among Single-Parent Households in Kingston
| Children | Single Father | Single Mother |
| No Children | 0 (0.0%) | 0 (0.0%) |
| 1 or 2 Children | 0 (0.0%) | 0 (0.0%) |
| 3 or 4 Children | 0 (0.0%) | 0 (0.0%) |
| 5 or more Children | 0 (0.0%) | 0 (0.0%) |
| Total | 0 (0.0%) | 0 (0.0%) |
Income Below Poverty Among Married-Couple vs Single-Parent Households in Kingston
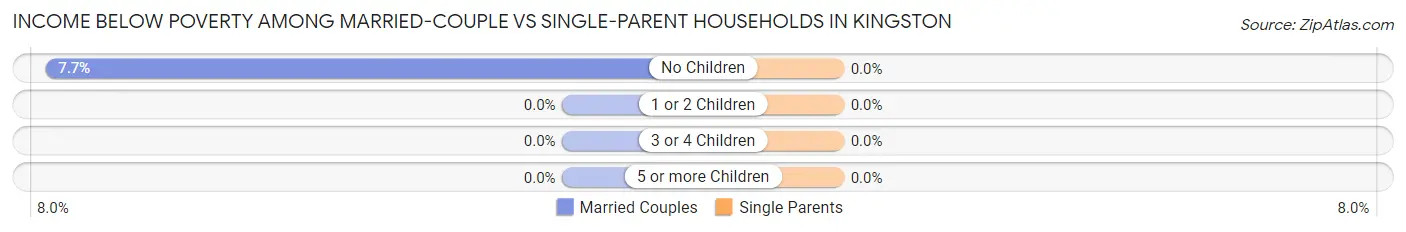
| Children | Married-Couple Families | Single-Parent Households |
| No Children | 5 (7.7%) | 0 (0.0%) |
| 1 or 2 Children | 0 (0.0%) | 0 (0.0%) |
| 3 or 4 Children | 0 (0.0%) | 0 (0.0%) |
| 5 or more Children | 0 (0.0%) | 0 (0.0%) |
| Total | 5 (6.2%) | 0 (0.0%) |
Race in Kingston
The most populous races in Kingston are White / Caucasian (314 | 99.4%), and Two or more Races (2 | 0.6%).
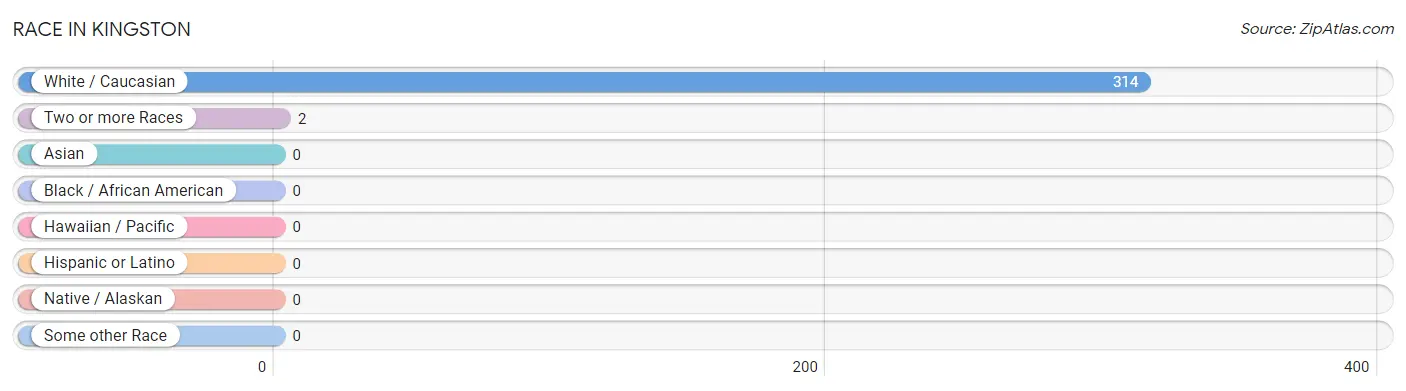
| Race | # Population | % Population |
| Asian | 0 | 0.0% |
| Black / African American | 0 | 0.0% |
| Hawaiian / Pacific | 0 | 0.0% |
| Hispanic or Latino | 0 | 0.0% |
| Native / Alaskan | 0 | 0.0% |
| White / Caucasian | 314 | 99.4% |
| Two or more Races | 2 | 0.6% |
| Some other Race | 0 | 0.0% |
| Total | 316 | 100.0% |
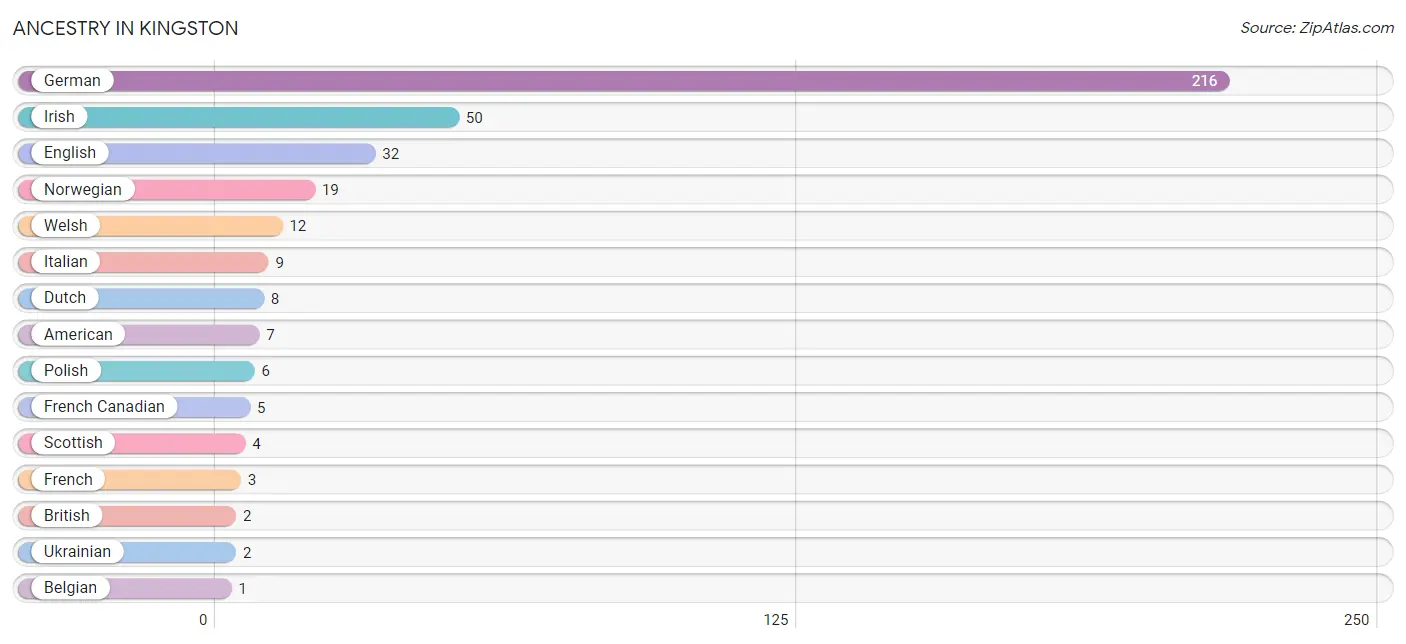
Ancestry in Kingston
The most populous ancestries reported in Kingston are German (216 | 68.3%), Irish (50 | 15.8%), English (32 | 10.1%), Norwegian (19 | 6.0%), and Welsh (12 | 3.8%), together accounting for 104.1% of all Kingston residents.
| Ancestry | # Population | % Population |
| American | 7 | 2.2% |
| Belgian | 1 | 0.3% |
| British | 2 | 0.6% |
| Czech | 1 | 0.3% |
| Danish | 1 | 0.3% |
| Dutch | 8 | 2.5% |
| English | 32 | 10.1% |
| French | 3 | 0.9% |
| French Canadian | 5 | 1.6% |
| German | 216 | 68.3% |
| Irish | 50 | 15.8% |
| Italian | 9 | 2.9% |
| Lithuanian | 1 | 0.3% |
| Norwegian | 19 | 6.0% |
| Polish | 6 | 1.9% |
| Portuguese | 1 | 0.3% |
| Scottish | 4 | 1.3% |
| Swedish | 1 | 0.3% |
| Ukrainian | 2 | 0.6% |
| Welsh | 12 | 3.8% | View All 20 Rows |
Immigrants in Kingston
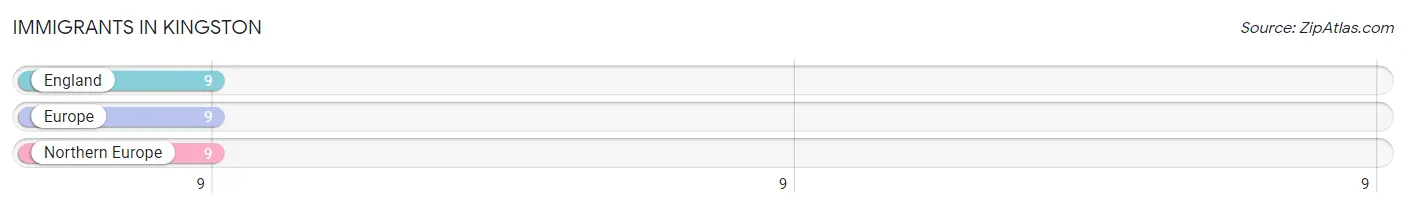
The most numerous immigrant groups reported in Kingston came from England (9 | 2.9%), Europe (9 | 2.9%), and Northern Europe (9 | 2.9%), together accounting for 8.6% of all Kingston residents.
| Immigration Origin | # Population | % Population |
| England | 9 | 2.9% |
| Europe | 9 | 2.9% |
| Northern Europe | 9 | 2.9% | View All 3 Rows |
Sex and Age in Kingston
Sex and Age in Kingston
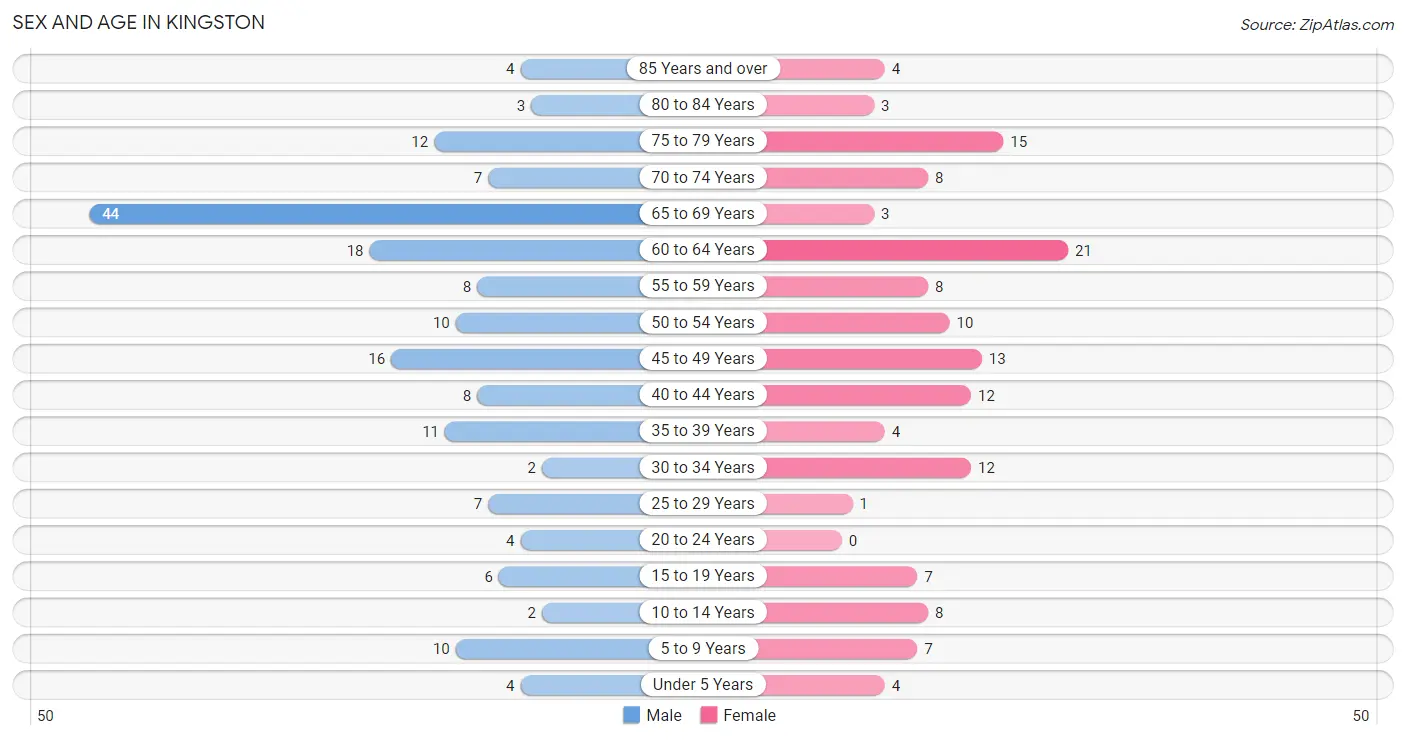
The most populous age groups in Kingston are 65 to 69 Years (44 | 25.0%) for men and 60 to 64 Years (21 | 15.0%) for women.
| Age Bracket | Male | Female |
| Under 5 Years | 4 (2.3%) | 4 (2.9%) |
| 5 to 9 Years | 10 (5.7%) | 7 (5.0%) |
| 10 to 14 Years | 2 (1.1%) | 8 (5.7%) |
| 15 to 19 Years | 6 (3.4%) | 7 (5.0%) |
| 20 to 24 Years | 4 (2.3%) | 0 (0.0%) |
| 25 to 29 Years | 7 (4.0%) | 1 (0.7%) |
| 30 to 34 Years | 2 (1.1%) | 12 (8.6%) |
| 35 to 39 Years | 11 (6.2%) | 4 (2.9%) |
| 40 to 44 Years | 8 (4.5%) | 12 (8.6%) |
| 45 to 49 Years | 16 (9.1%) | 13 (9.3%) |
| 50 to 54 Years | 10 (5.7%) | 10 (7.1%) |
| 55 to 59 Years | 8 (4.5%) | 8 (5.7%) |
| 60 to 64 Years | 18 (10.2%) | 21 (15.0%) |
| 65 to 69 Years | 44 (25.0%) | 3 (2.1%) |
| 70 to 74 Years | 7 (4.0%) | 8 (5.7%) |
| 75 to 79 Years | 12 (6.8%) | 15 (10.7%) |
| 80 to 84 Years | 3 (1.7%) | 3 (2.1%) |
| 85 Years and over | 4 (2.3%) | 4 (2.9%) |
| Total | 176 (100.0%) | 140 (100.0%) |
Families and Households in Kingston
Median Family Size in Kingston
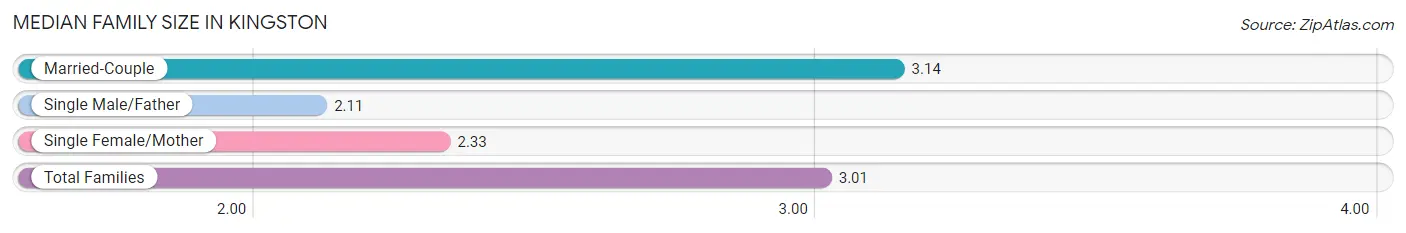
The median family size in Kingston is 3.01 persons per family, with married-couple families (80 | 87.0%) accounting for the largest median family size of 3.14 persons per family. On the other hand, single male/father families (9 | 9.8%) represent the smallest median family size with 2.11 persons per family.
| Family Type | # Families | Family Size |
| Married-Couple | 80 (87.0%) | 3.14 |
| Single Male/Father | 9 (9.8%) | 2.11 |
| Single Female/Mother | 3 (3.3%) | 2.33 |
| Total Families | 92 (100.0%) | 3.01 |
Median Household Size in Kingston
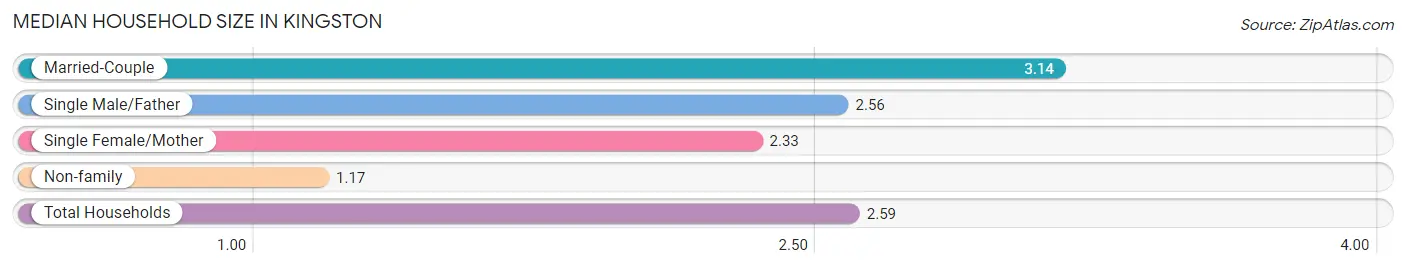
The median household size in Kingston is 2.59 persons per household, with married-couple households (80 | 65.6%) accounting for the largest median household size of 3.14 persons per household. non-family households (30 | 24.6%) represent the smallest median household size with 1.17 persons per household.
| Household Type | # Households | Household Size |
| Married-Couple | 80 (65.6%) | 3.14 |
| Single Male/Father | 9 (7.4%) | 2.56 |
| Single Female/Mother | 3 (2.5%) | 2.33 |
| Non-family | 30 (24.6%) | 1.17 |
| Total Households | 122 (100.0%) | 2.59 |
Household Size by Marriage Status in Kingston
Out of a total of 122 households in Kingston, 92 (75.4%) are family households, while 30 (24.6%) are nonfamily households. The most numerous type of family households are 2-person households, comprising 67, and the most common type of nonfamily households are 1-person households, comprising 22.
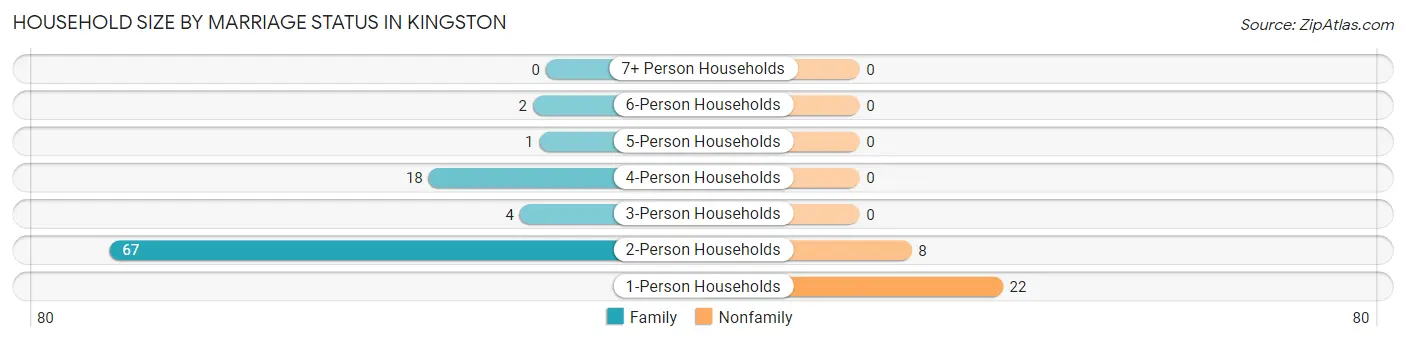
| Household Size | Family Households | Nonfamily Households |
| 1-Person Households | - | 22 (18.0%) |
| 2-Person Households | 67 (54.9%) | 8 (6.6%) |
| 3-Person Households | 4 (3.3%) | 0 (0.0%) |
| 4-Person Households | 18 (14.7%) | 0 (0.0%) |
| 5-Person Households | 1 (0.8%) | 0 (0.0%) |
| 6-Person Households | 2 (1.6%) | 0 (0.0%) |
| 7+ Person Households | 0 (0.0%) | 0 (0.0%) |
| Total | 92 (75.4%) | 30 (24.6%) |
Female Fertility in Kingston
Fertility by Age in Kingston
Average fertility rate in Kingston is 19.0 births per 1,000 women. Women in the age bracket of 20 to 34 years have the highest fertility rate with 77.0 births per 1,000 women. Women in the age bracket of 20 to 34 years acount for 100.0% of all women with births.
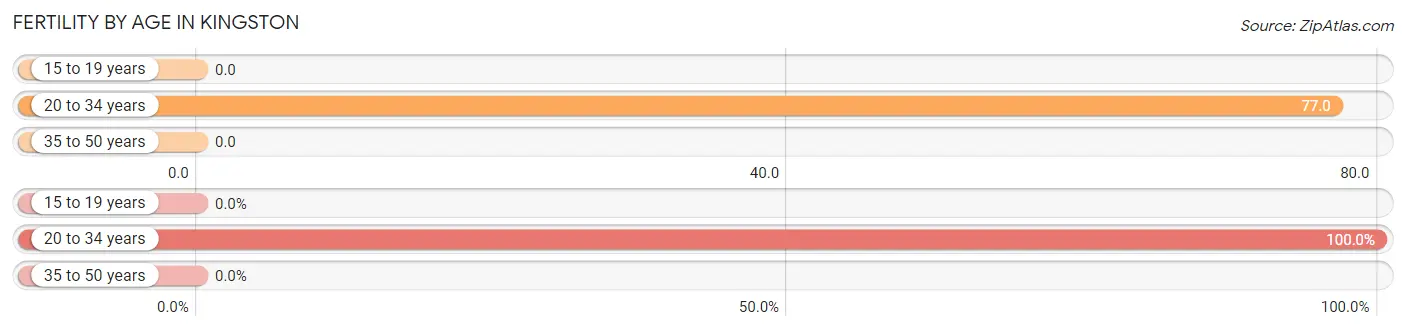
| Age Bracket | Women with Births | Births / 1,000 Women |
| 15 to 19 years | 0 (0.0%) | 0.0 |
| 20 to 34 years | 1 (100.0%) | 77.0 |
| 35 to 50 years | 0 (0.0%) | 0.0 |
| Total | 1 (100.0%) | 19.0 |
Fertility by Age by Marriage Status in Kingston
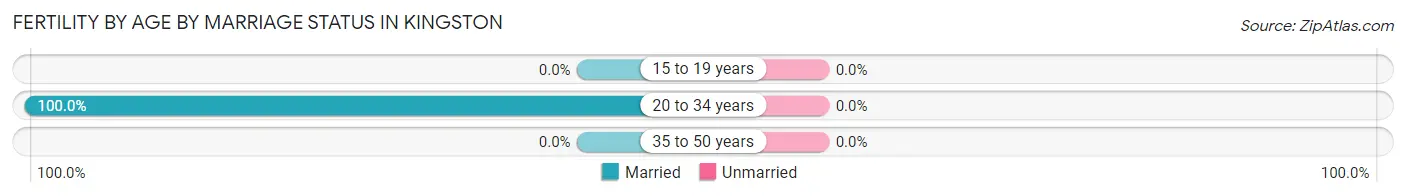
| Age Bracket | Married | Unmarried |
| 15 to 19 years | 0 (0.0%) | 0 (0.0%) |
| 20 to 34 years | 1 (100.0%) | 0 (0.0%) |
| 35 to 50 years | 0 (0.0%) | 0 (0.0%) |
| Total | 1 (100.0%) | 0 (0.0%) |
Fertility by Education in Kingston
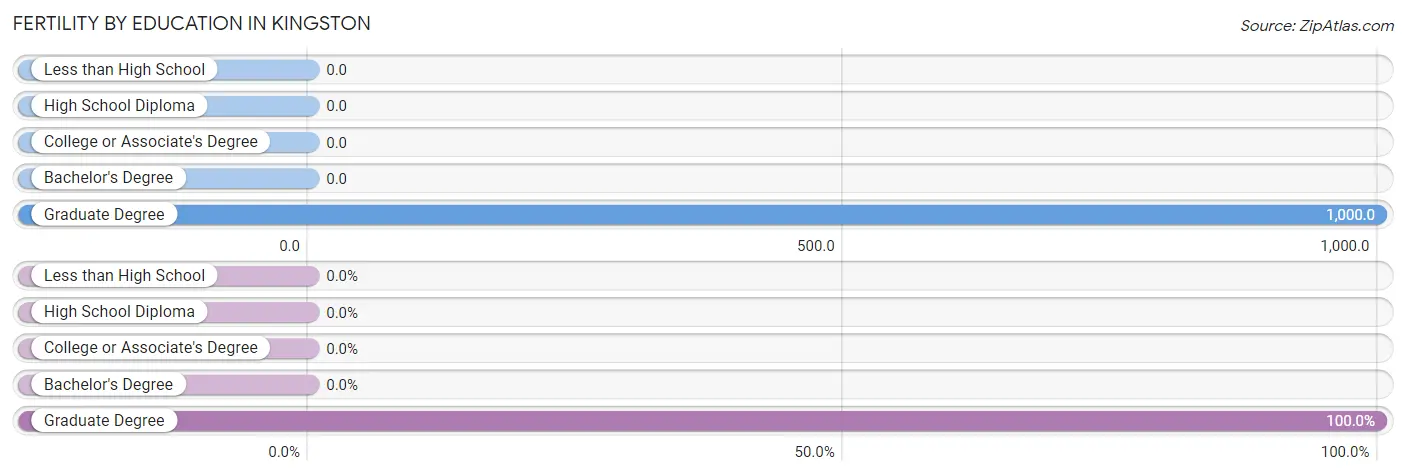
| Educational Attainment | Women with Births | Births / 1,000 Women |
| Less than High School | 0 (0.0%) | 0.0 |
| High School Diploma | 0 (0.0%) | 0.0 |
| College or Associate's Degree | 0 (0.0%) | 0.0 |
| Bachelor's Degree | 0 (0.0%) | 0.0 |
| Graduate Degree | 1 (100.0%) | 1,000.0 |
| Total | 1 (100.0%) | 19.0 |
Fertility by Education by Marriage Status in Kingston
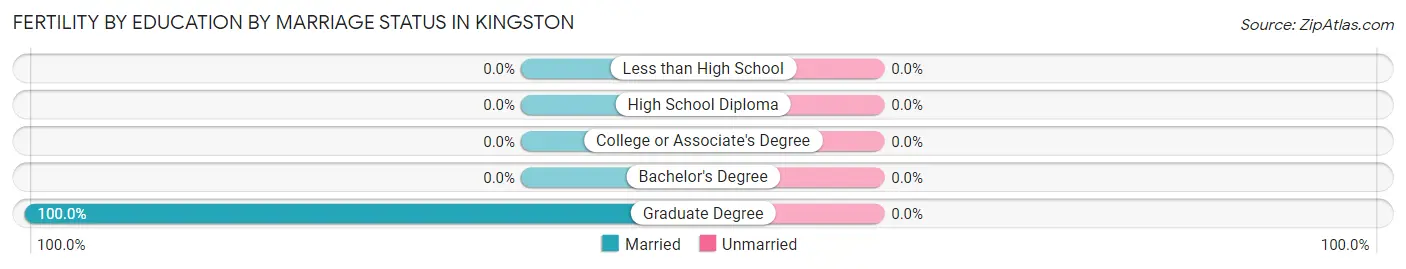
| Educational Attainment | Married | Unmarried |
| Less than High School | 0 (0.0%) | 0 (0.0%) |
| High School Diploma | 0 (0.0%) | 0 (0.0%) |
| College or Associate's Degree | 0 (0.0%) | 0 (0.0%) |
| Bachelor's Degree | 0 (0.0%) | 0 (0.0%) |
| Graduate Degree | 1 (100.0%) | 0 (0.0%) |
| Total | 1 (100.0%) | 0 (0.0%) |
Employment Characteristics in Kingston
Employment by Class of Employer in Kingston
Among the 128 employed individuals in Kingston, private company employees (80 | 62.5%), self-employed (not incorporated) (16 | 12.5%), and not-for-profit organizations (12 | 9.4%) make up the most common classes of employment.
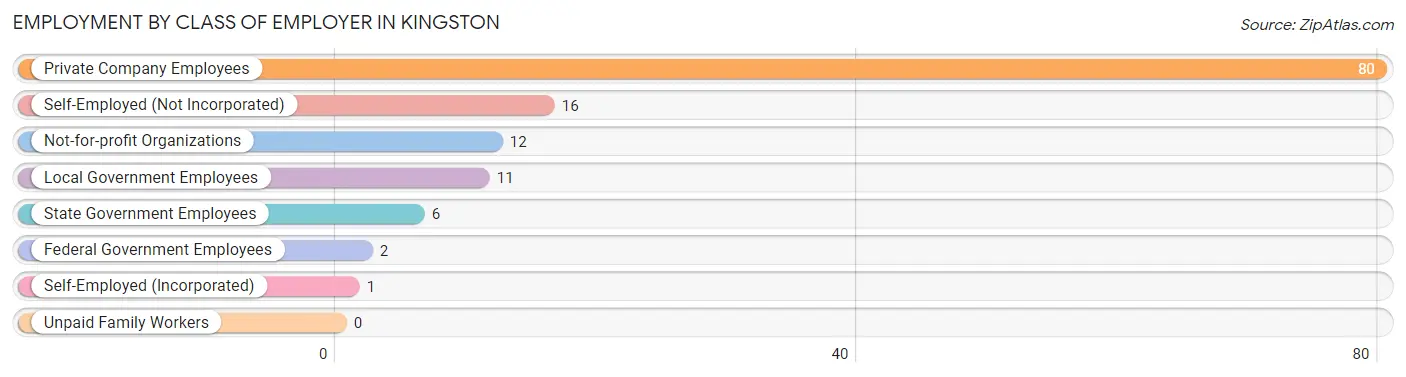
| Employer Class | # Employees | % Employees |
| Private Company Employees | 80 | 62.5% |
| Self-Employed (Incorporated) | 1 | 0.8% |
| Self-Employed (Not Incorporated) | 16 | 12.5% |
| Not-for-profit Organizations | 12 | 9.4% |
| Local Government Employees | 11 | 8.6% |
| State Government Employees | 6 | 4.7% |
| Federal Government Employees | 2 | 1.6% |
| Unpaid Family Workers | 0 | 0.0% |
| Total | 128 | 100.0% |
Employment Status by Age in Kingston
According to the labor force statistics for Kingston, out of the total population over 16 years of age (276), 49.3% or 136 individuals are in the labor force, with 4.4% or 6 of them unemployed. The age group with the highest labor force participation rate is 20 to 24 years, with 100.0% or 4 individuals in the labor force. Within the labor force, the 25 to 29 years age range has the highest percentage of unemployed individuals, with 42.9% or 3 of them being unemployed.
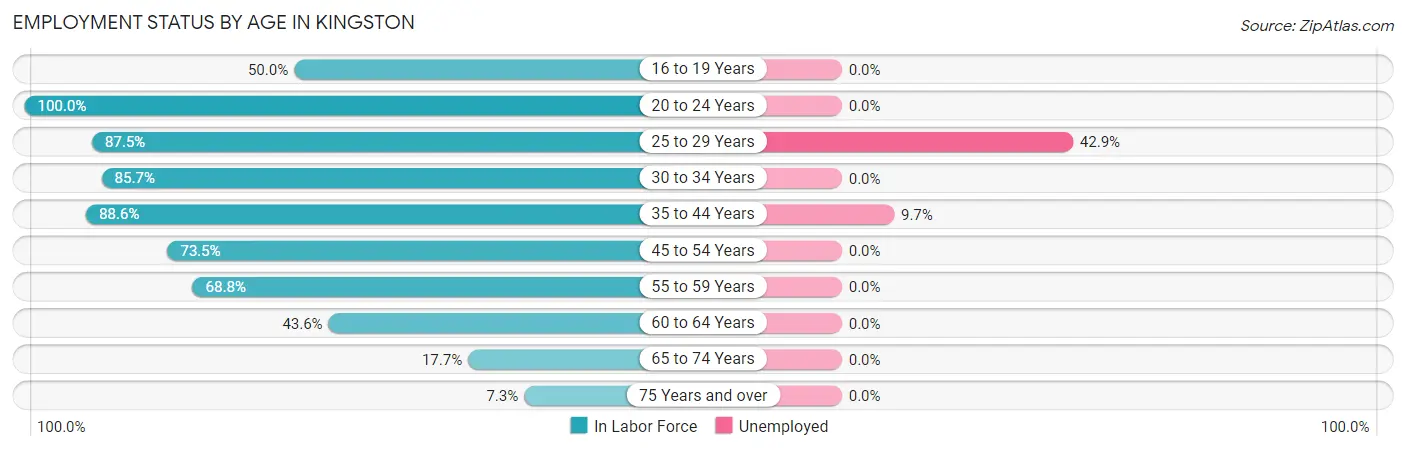
| Age Bracket | In Labor Force | Unemployed |
| 16 to 19 Years | 4 (50.0%) | 0 (0.0%) |
| 20 to 24 Years | 4 (100.0%) | 0 (0.0%) |
| 25 to 29 Years | 7 (87.5%) | 3 (42.9%) |
| 30 to 34 Years | 12 (85.7%) | 0 (0.0%) |
| 35 to 44 Years | 31 (88.6%) | 3 (9.7%) |
| 45 to 54 Years | 36 (73.5%) | 0 (0.0%) |
| 55 to 59 Years | 11 (68.8%) | 0 (0.0%) |
| 60 to 64 Years | 17 (43.6%) | 0 (0.0%) |
| 65 to 74 Years | 11 (17.7%) | 0 (0.0%) |
| 75 Years and over | 3 (7.3%) | 0 (0.0%) |
| Total | 136 (49.3%) | 6 (4.4%) |
Employment Status by Educational Attainment in Kingston
According to labor force statistics for Kingston, 70.8% of individuals (114) out of the total population between 25 and 64 years of age (161) are in the labor force, with 5.3% or 6 of them being unemployed. The group with the highest labor force participation rate are those with the educational attainment of bachelor's degree or higher, with 94.1% or 16 individuals in the labor force. Within the labor force, individuals with college / associate degree education have the highest percentage of unemployment, with 6.5% or 3 of them being unemployed.
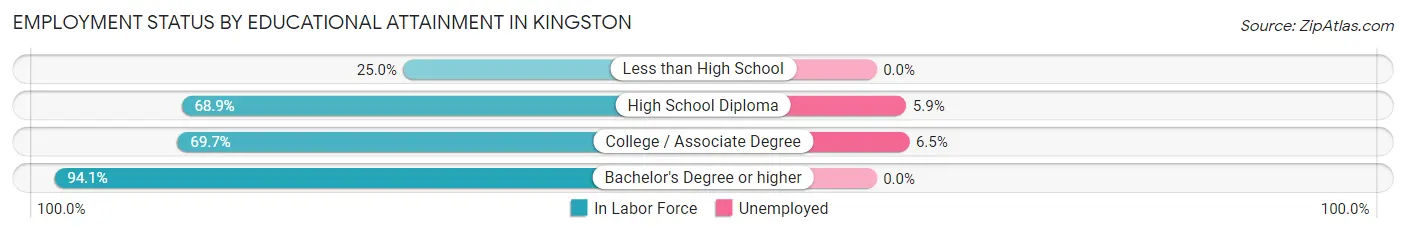
| Educational Attainment | In Labor Force | Unemployed |
| Less than High School | 1 (25.0%) | 0 (0.0%) |
| High School Diploma | 51 (68.9%) | 4 (5.9%) |
| College / Associate Degree | 46 (69.7%) | 4 (6.5%) |
| Bachelor's Degree or higher | 16 (94.1%) | 0 (0.0%) |
| Total | 114 (70.8%) | 9 (5.3%) |
Employment Occupations by Sex in Kingston
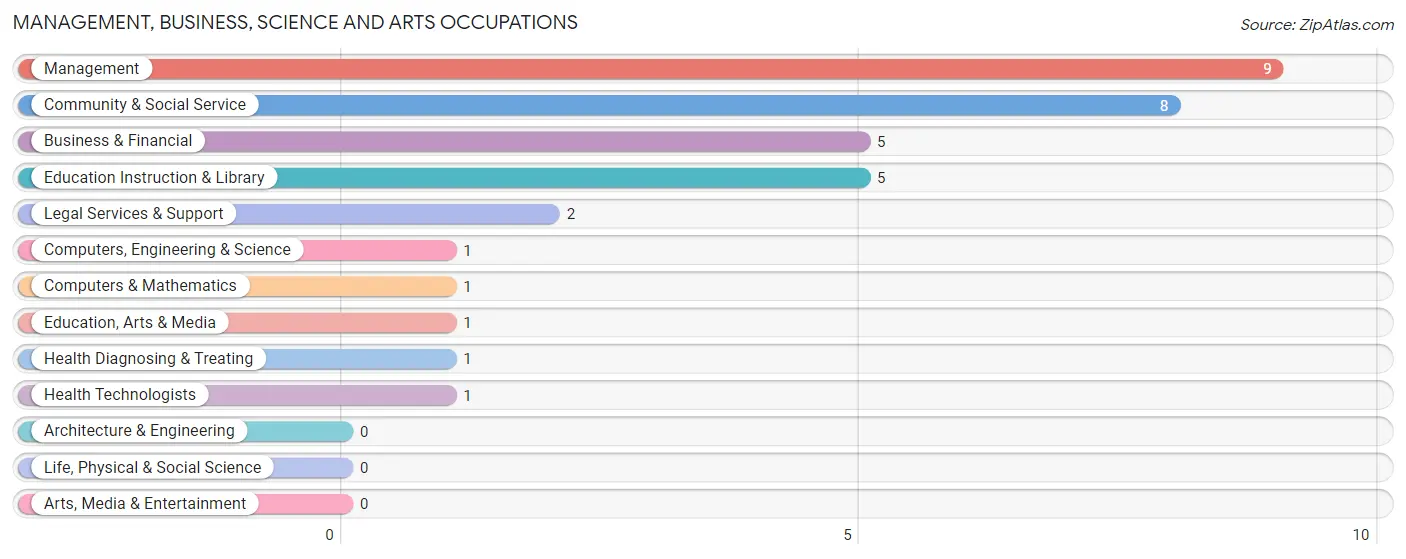
Management, Business, Science and Arts Occupations
The most common Management, Business, Science and Arts occupations in Kingston are Management (9 | 6.9%), Community & Social Service (8 | 6.1%), Business & Financial (5 | 3.8%), Education Instruction & Library (5 | 3.8%), and Legal Services & Support (2 | 1.5%).
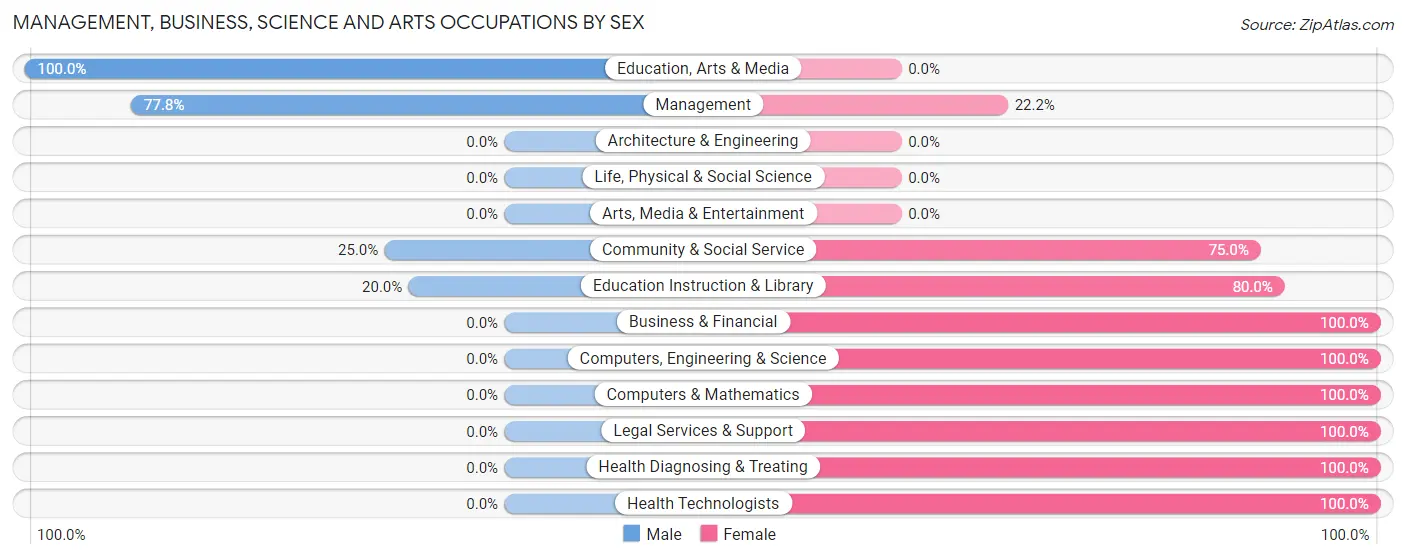
Management, Business, Science and Arts Occupations by Sex
Within the Management, Business, Science and Arts occupations in Kingston, the most male-oriented occupations are Education, Arts & Media (100.0%), Management (77.8%), and Community & Social Service (25.0%), while the most female-oriented occupations are Business & Financial (100.0%), Computers, Engineering & Science (100.0%), and Computers & Mathematics (100.0%).
| Occupation | Male | Female |
| Management | 7 (77.8%) | 2 (22.2%) |
| Business & Financial | 0 (0.0%) | 5 (100.0%) |
| Computers, Engineering & Science | 0 (0.0%) | 1 (100.0%) |
| Computers & Mathematics | 0 (0.0%) | 1 (100.0%) |
| Architecture & Engineering | 0 (0.0%) | 0 (0.0%) |
| Life, Physical & Social Science | 0 (0.0%) | 0 (0.0%) |
| Community & Social Service | 2 (25.0%) | 6 (75.0%) |
| Education, Arts & Media | 1 (100.0%) | 0 (0.0%) |
| Legal Services & Support | 0 (0.0%) | 2 (100.0%) |
| Education Instruction & Library | 1 (20.0%) | 4 (80.0%) |
| Arts, Media & Entertainment | 0 (0.0%) | 0 (0.0%) |
| Health Diagnosing & Treating | 0 (0.0%) | 1 (100.0%) |
| Health Technologists | 0 (0.0%) | 1 (100.0%) |
| Total (Category) | 9 (37.5%) | 15 (62.5%) |
| Total (Overall) | 68 (52.3%) | 62 (47.7%) |
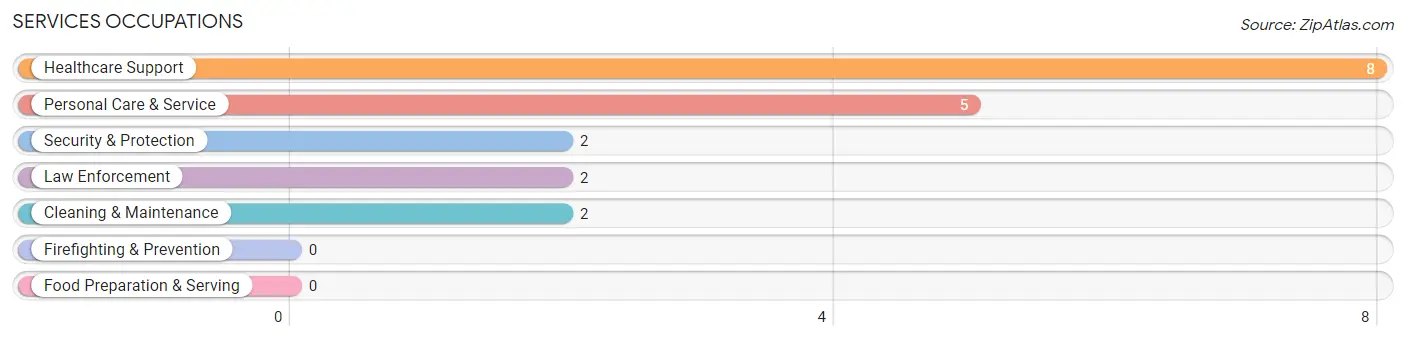
Services Occupations
The most common Services occupations in Kingston are Healthcare Support (8 | 6.1%), Personal Care & Service (5 | 3.8%), Security & Protection (2 | 1.5%), Law Enforcement (2 | 1.5%), and Cleaning & Maintenance (2 | 1.5%).
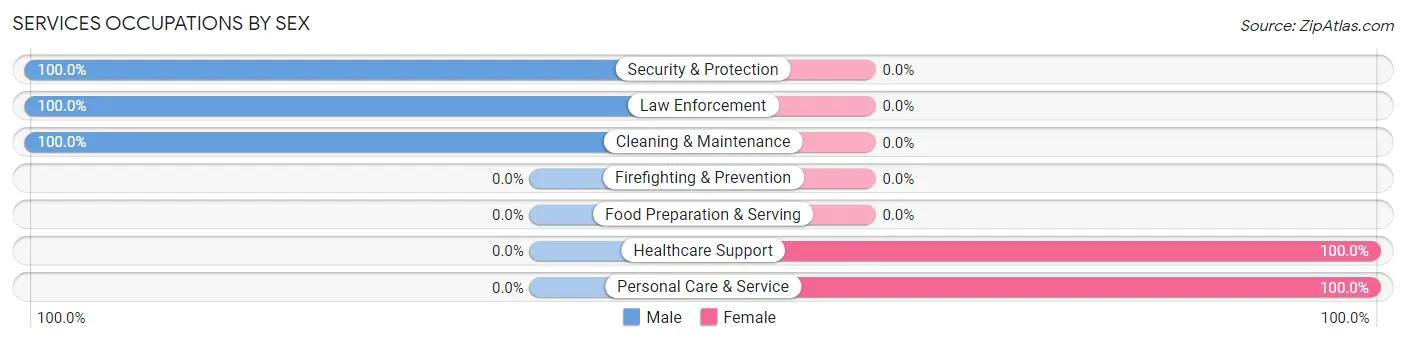
Services Occupations by Sex
Within the Services occupations in Kingston, the most male-oriented occupations are Security & Protection (100.0%), Law Enforcement (100.0%), and Cleaning & Maintenance (100.0%), while the most female-oriented occupations are Healthcare Support (100.0%), and Personal Care & Service (100.0%).
| Occupation | Male | Female |
| Healthcare Support | 0 (0.0%) | 8 (100.0%) |
| Security & Protection | 2 (100.0%) | 0 (0.0%) |
| Firefighting & Prevention | 0 (0.0%) | 0 (0.0%) |
| Law Enforcement | 2 (100.0%) | 0 (0.0%) |
| Food Preparation & Serving | 0 (0.0%) | 0 (0.0%) |
| Cleaning & Maintenance | 2 (100.0%) | 0 (0.0%) |
| Personal Care & Service | 0 (0.0%) | 5 (100.0%) |
| Total (Category) | 4 (23.5%) | 13 (76.5%) |
| Total (Overall) | 68 (52.3%) | 62 (47.7%) |
Sales and Office Occupations
The most common Sales and Office occupations in Kingston are Office & Administration (20 | 15.4%), and Sales & Related (3 | 2.3%).
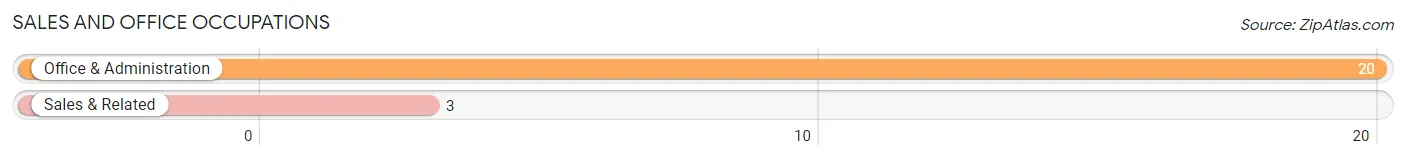
Sales and Office Occupations by Sex
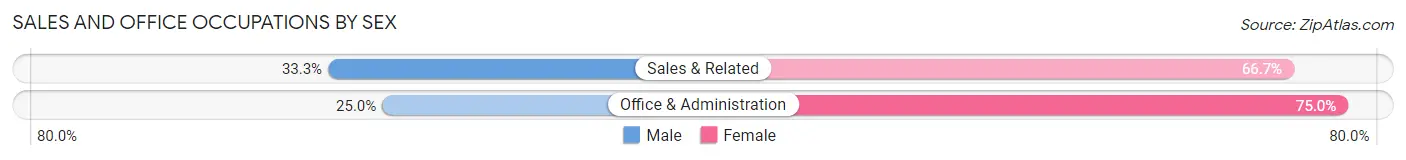
| Occupation | Male | Female |
| Sales & Related | 1 (33.3%) | 2 (66.7%) |
| Office & Administration | 5 (25.0%) | 15 (75.0%) |
| Total (Category) | 6 (26.1%) | 17 (73.9%) |
| Total (Overall) | 68 (52.3%) | 62 (47.7%) |
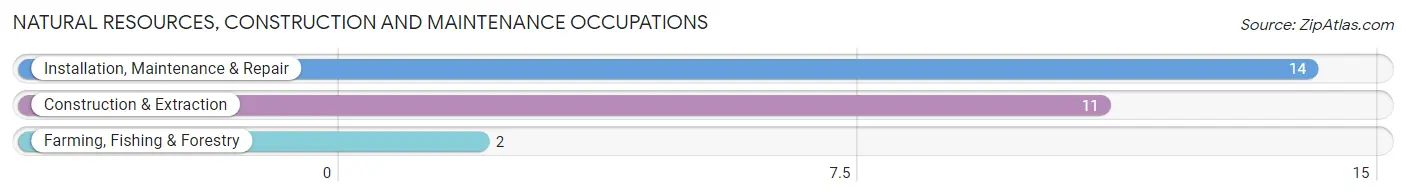
Natural Resources, Construction and Maintenance Occupations
The most common Natural Resources, Construction and Maintenance occupations in Kingston are Installation, Maintenance & Repair (14 | 10.8%), Construction & Extraction (11 | 8.5%), and Farming, Fishing & Forestry (2 | 1.5%).
Natural Resources, Construction and Maintenance Occupations by Sex
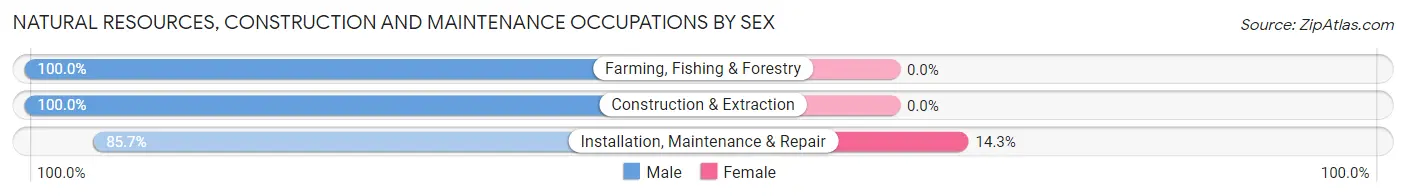
| Occupation | Male | Female |
| Farming, Fishing & Forestry | 2 (100.0%) | 0 (0.0%) |
| Construction & Extraction | 11 (100.0%) | 0 (0.0%) |
| Installation, Maintenance & Repair | 12 (85.7%) | 2 (14.3%) |
| Total (Category) | 25 (92.6%) | 2 (7.4%) |
| Total (Overall) | 68 (52.3%) | 62 (47.7%) |
Production, Transportation and Moving Occupations
The most common Production, Transportation and Moving occupations in Kingston are Transportation (17 | 13.1%), Production (16 | 12.3%), and Material Moving (6 | 4.6%).

Production, Transportation and Moving Occupations by Sex
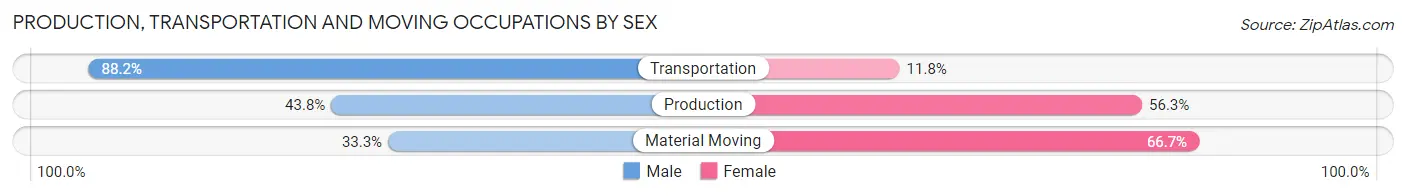
| Occupation | Male | Female |
| Production | 7 (43.8%) | 9 (56.2%) |
| Transportation | 15 (88.2%) | 2 (11.8%) |
| Material Moving | 2 (33.3%) | 4 (66.7%) |
| Total (Category) | 24 (61.5%) | 15 (38.5%) |
| Total (Overall) | 68 (52.3%) | 62 (47.7%) |
Employment Industries by Sex in Kingston
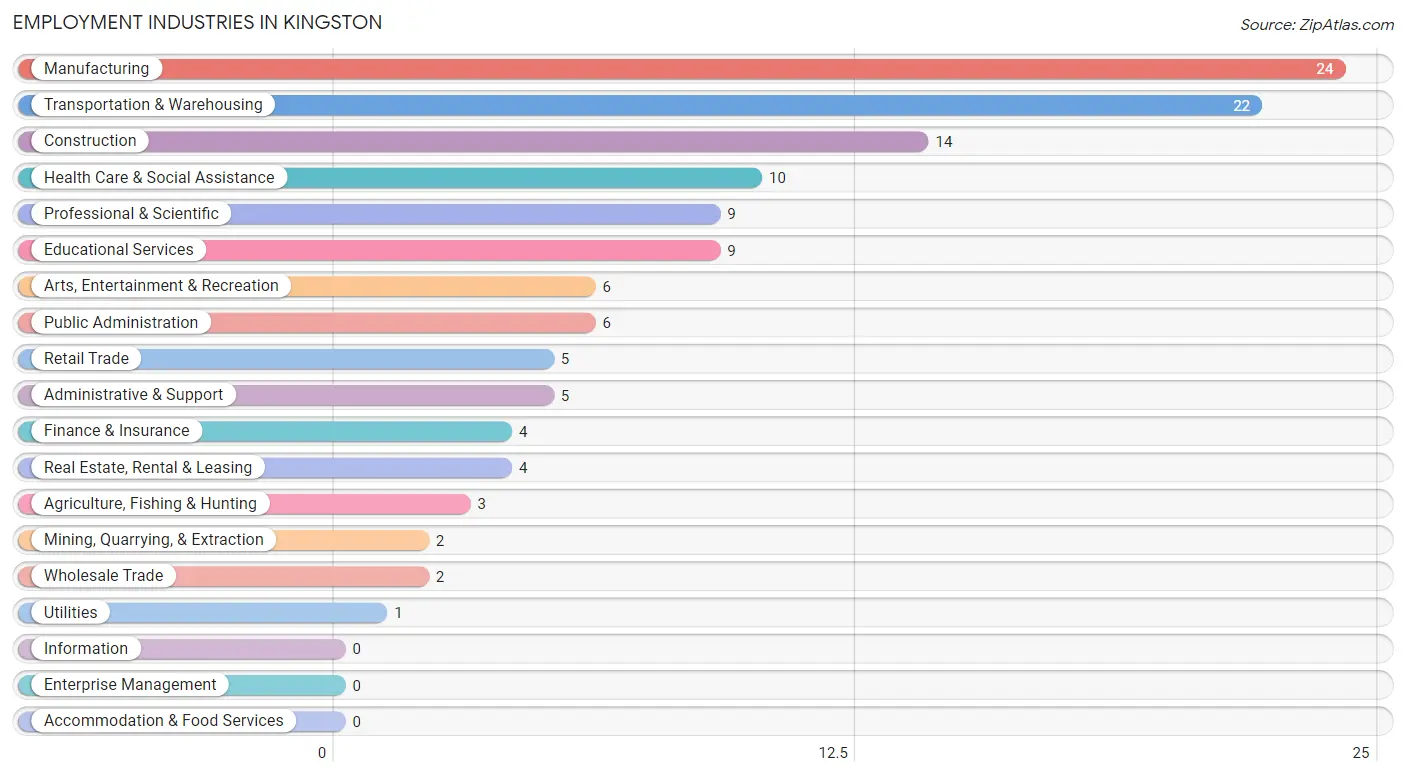
Employment Industries in Kingston
The major employment industries in Kingston include Manufacturing (24 | 18.5%), Transportation & Warehousing (22 | 16.9%), Construction (14 | 10.8%), Health Care & Social Assistance (10 | 7.7%), and Professional & Scientific (9 | 6.9%).
Employment Industries by Sex in Kingston
The Kingston industries that see more men than women are Agriculture, Fishing & Hunting (100.0%), Construction (100.0%), and Wholesale Trade (100.0%), whereas the industries that tend to have a higher number of women are Mining, Quarrying, & Extraction (100.0%), Finance & Insurance (100.0%), and Professional & Scientific (100.0%).
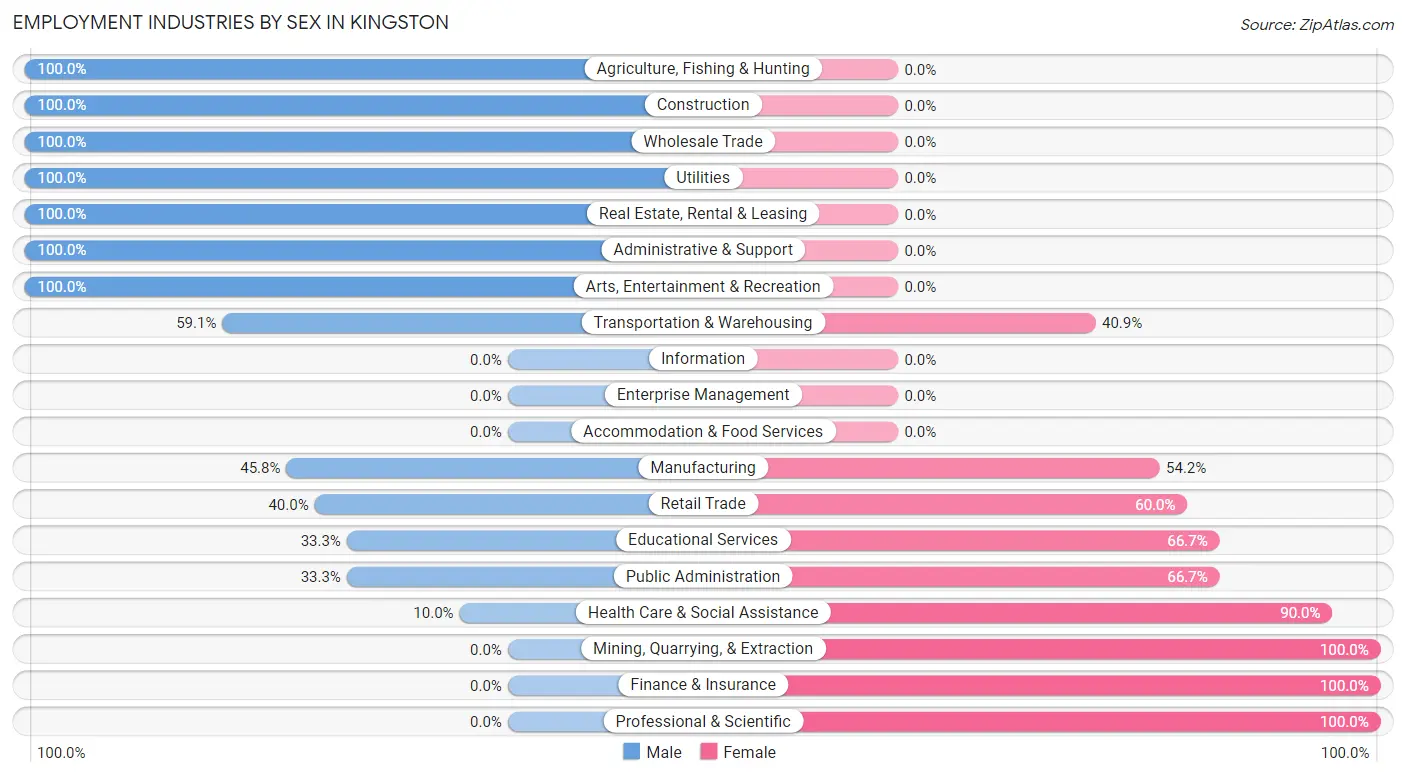
| Industry | Male | Female |
| Agriculture, Fishing & Hunting | 3 (100.0%) | 0 (0.0%) |
| Mining, Quarrying, & Extraction | 0 (0.0%) | 2 (100.0%) |
| Construction | 14 (100.0%) | 0 (0.0%) |
| Manufacturing | 11 (45.8%) | 13 (54.2%) |
| Wholesale Trade | 2 (100.0%) | 0 (0.0%) |
| Retail Trade | 2 (40.0%) | 3 (60.0%) |
| Transportation & Warehousing | 13 (59.1%) | 9 (40.9%) |
| Utilities | 1 (100.0%) | 0 (0.0%) |
| Information | 0 (0.0%) | 0 (0.0%) |
| Finance & Insurance | 0 (0.0%) | 4 (100.0%) |
| Real Estate, Rental & Leasing | 4 (100.0%) | 0 (0.0%) |
| Professional & Scientific | 0 (0.0%) | 9 (100.0%) |
| Enterprise Management | 0 (0.0%) | 0 (0.0%) |
| Administrative & Support | 5 (100.0%) | 0 (0.0%) |
| Educational Services | 3 (33.3%) | 6 (66.7%) |
| Health Care & Social Assistance | 1 (10.0%) | 9 (90.0%) |
| Arts, Entertainment & Recreation | 6 (100.0%) | 0 (0.0%) |
| Accommodation & Food Services | 0 (0.0%) | 0 (0.0%) |
| Public Administration | 2 (33.3%) | 4 (66.7%) |
| Total | 68 (52.3%) | 62 (47.7%) |
Education in Kingston
School Enrollment in Kingston
The most common levels of schooling among the 33 students in Kingston are elementary school (10 | 30.3%), college / undergraduate (7 | 21.2%), and high school (6 | 18.2%).
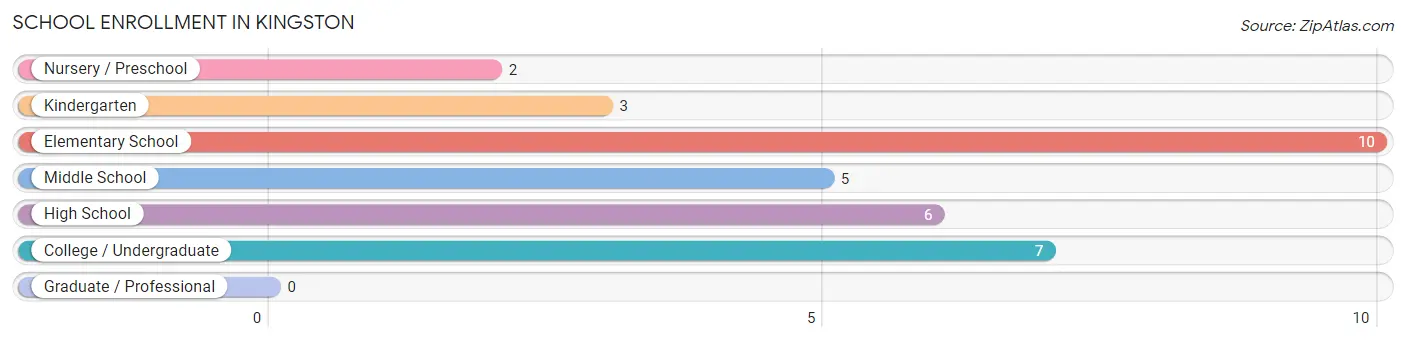
| School Level | # Students | % Students |
| Nursery / Preschool | 2 | 6.1% |
| Kindergarten | 3 | 9.1% |
| Elementary School | 10 | 30.3% |
| Middle School | 5 | 15.1% |
| High School | 6 | 18.2% |
| College / Undergraduate | 7 | 21.2% |
| Graduate / Professional | 0 | 0.0% |
| Total | 33 | 100.0% |
School Enrollment by Age by Funding Source in Kingston
Out of a total of 33 students who are enrolled in schools in Kingston, 5 (15.2%) attend a private institution, while the remaining 28 (84.8%) are enrolled in public schools. The age group of 3 to 4 year olds has the highest likelihood of being enrolled in private schools, with 1 (100.0% in the age bracket) enrolled. Conversely, the age group of 15 to 17 year olds has the lowest likelihood of being enrolled in a private school, with 6 (100.0% in the age bracket) attending a public institution.
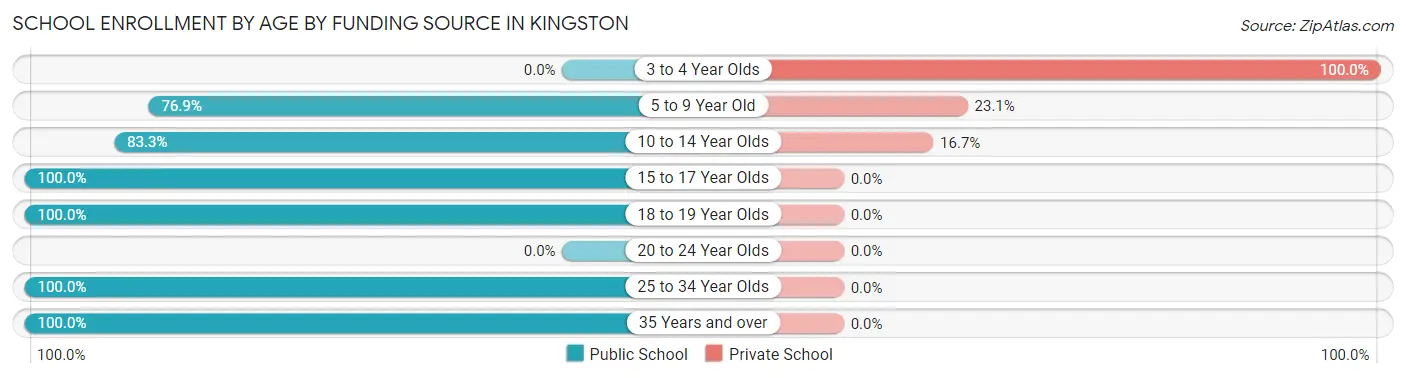
| Age Bracket | Public School | Private School |
| 3 to 4 Year Olds | 0 (0.0%) | 1 (100.0%) |
| 5 to 9 Year Old | 10 (76.9%) | 3 (23.1%) |
| 10 to 14 Year Olds | 5 (83.3%) | 1 (16.7%) |
| 15 to 17 Year Olds | 6 (100.0%) | 0 (0.0%) |
| 18 to 19 Year Olds | 1 (100.0%) | 0 (0.0%) |
| 20 to 24 Year Olds | 0 (0.0%) | 0 (0.0%) |
| 25 to 34 Year Olds | 5 (100.0%) | 0 (0.0%) |
| 35 Years and over | 1 (100.0%) | 0 (0.0%) |
| Total | 28 (84.8%) | 5 (15.2%) |
Educational Attainment by Field of Study in Kingston
Arts & humanities (10 | 28.6%), business (7 | 20.0%), education (6 | 17.1%), physical & health sciences (3 | 8.6%), and bio, nature & agricultural (2 | 5.7%) are the most common fields of study among 35 individuals in Kingston who have obtained a bachelor's degree or higher.
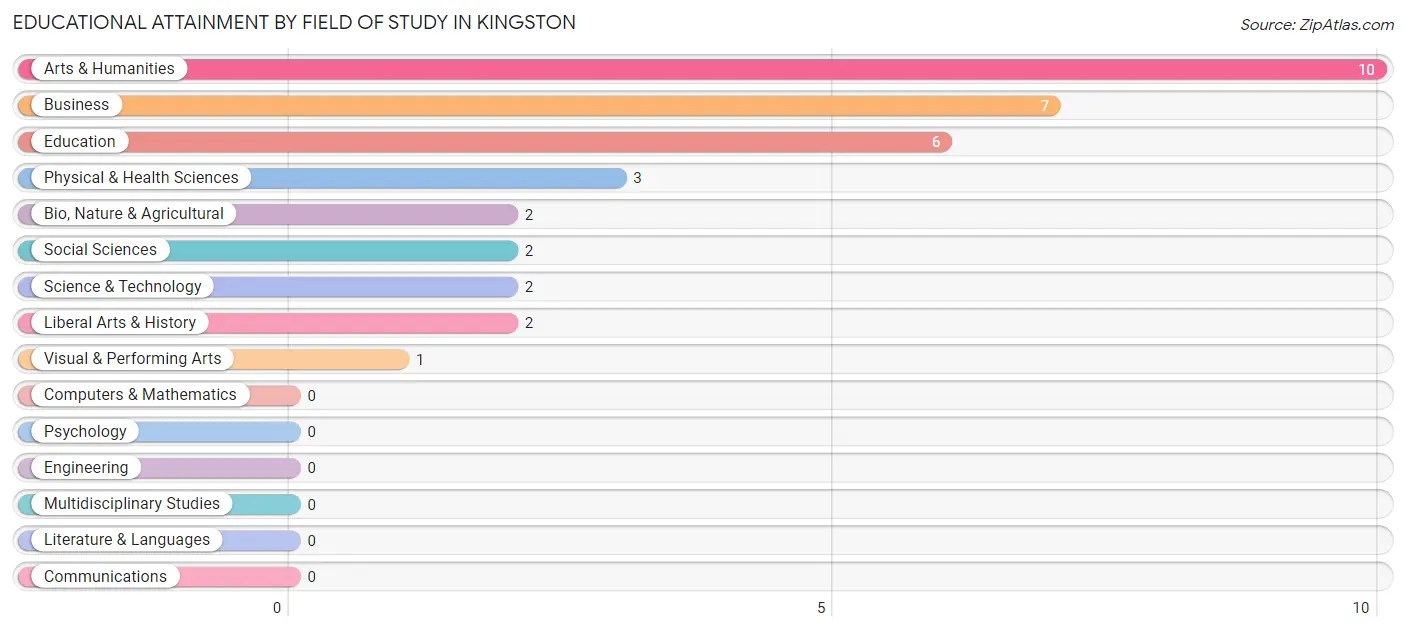
| Field of Study | # Graduates | % Graduates |
| Computers & Mathematics | 0 | 0.0% |
| Bio, Nature & Agricultural | 2 | 5.7% |
| Physical & Health Sciences | 3 | 8.6% |
| Psychology | 0 | 0.0% |
| Social Sciences | 2 | 5.7% |
| Engineering | 0 | 0.0% |
| Multidisciplinary Studies | 0 | 0.0% |
| Science & Technology | 2 | 5.7% |
| Business | 7 | 20.0% |
| Education | 6 | 17.1% |
| Literature & Languages | 0 | 0.0% |
| Liberal Arts & History | 2 | 5.7% |
| Visual & Performing Arts | 1 | 2.9% |
| Communications | 0 | 0.0% |
| Arts & Humanities | 10 | 28.6% |
| Total | 35 | 100.0% |
Transportation & Commute in Kingston
Vehicle Availability by Sex in Kingston
The most prevalent vehicle ownership categories in Kingston are males with 2 vehicles (35, accounting for 51.5%) and females with 2 vehicles (29, making up 58.3%).
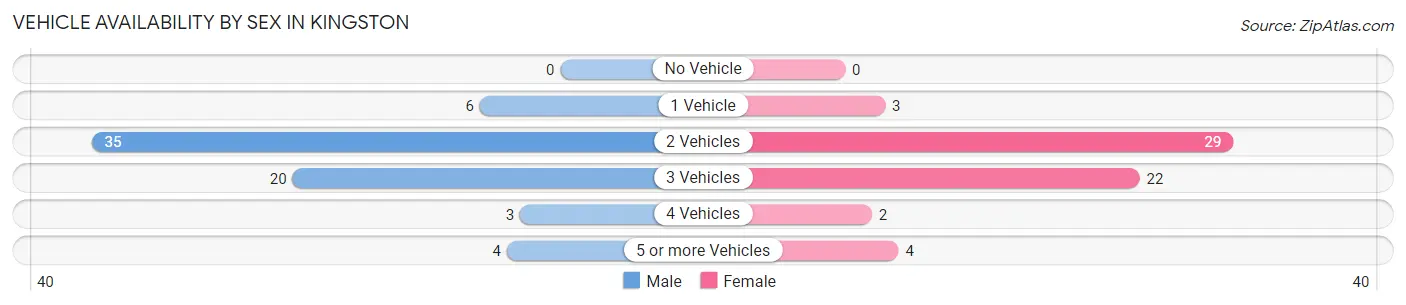
| Vehicles Available | Male | Female |
| No Vehicle | 0 (0.0%) | 0 (0.0%) |
| 1 Vehicle | 6 (8.8%) | 3 (5.0%) |
| 2 Vehicles | 35 (51.5%) | 29 (48.3%) |
| 3 Vehicles | 20 (29.4%) | 22 (36.7%) |
| 4 Vehicles | 3 (4.4%) | 2 (3.3%) |
| 5 or more Vehicles | 4 (5.9%) | 4 (6.7%) |
| Total | 68 (100.0%) | 60 (100.0%) |
Commute Time in Kingston
The most frequently occuring commute durations in Kingston are 30 to 34 minutes (27 commuters, 23.1%), 20 to 24 minutes (18 commuters, 15.4%), and 10 to 14 minutes (14 commuters, 12.0%).
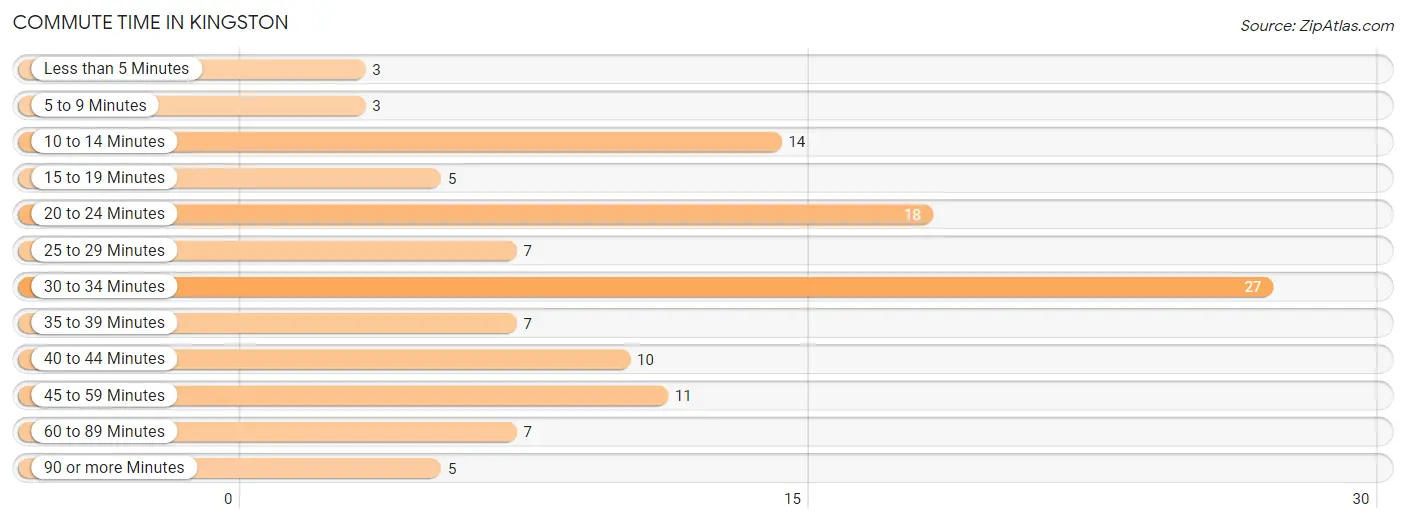
| Commute Time | # Commuters | % Commuters |
| Less than 5 Minutes | 3 | 2.6% |
| 5 to 9 Minutes | 3 | 2.6% |
| 10 to 14 Minutes | 14 | 12.0% |
| 15 to 19 Minutes | 5 | 4.3% |
| 20 to 24 Minutes | 18 | 15.4% |
| 25 to 29 Minutes | 7 | 6.0% |
| 30 to 34 Minutes | 27 | 23.1% |
| 35 to 39 Minutes | 7 | 6.0% |
| 40 to 44 Minutes | 10 | 8.6% |
| 45 to 59 Minutes | 11 | 9.4% |
| 60 to 89 Minutes | 7 | 6.0% |
| 90 or more Minutes | 5 | 4.3% |
Commute Time by Sex in Kingston
The most common commute times in Kingston are 30 to 34 minutes (15 commuters, 23.8%) for males and 30 to 34 minutes (12 commuters, 22.2%) for females.
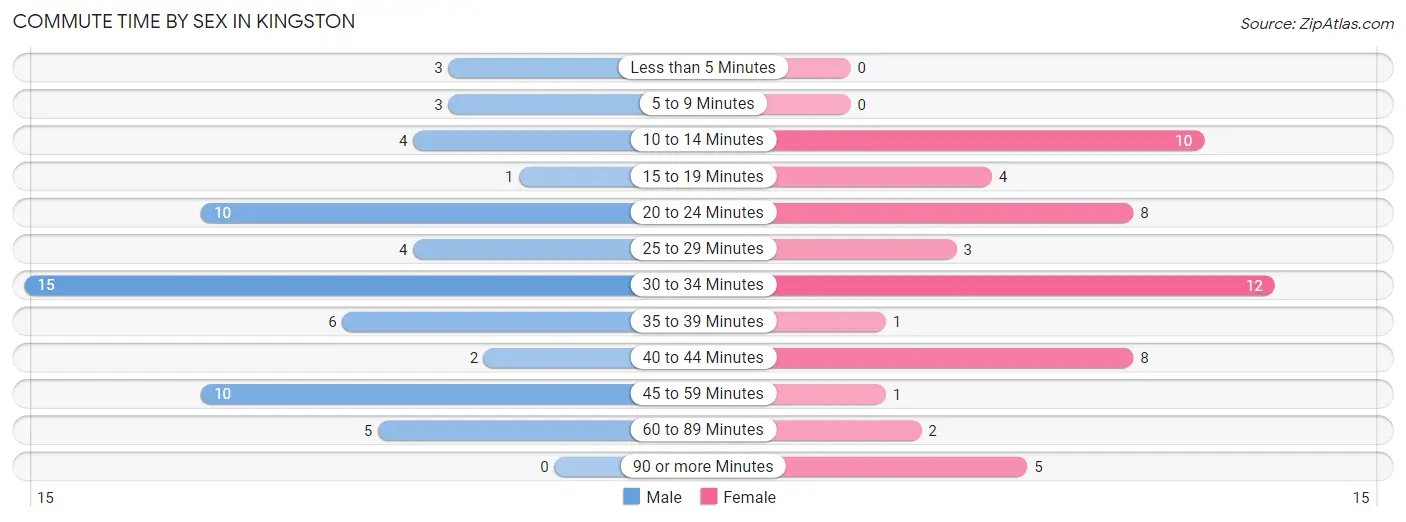
| Commute Time | Male | Female |
| Less than 5 Minutes | 3 (4.8%) | 0 (0.0%) |
| 5 to 9 Minutes | 3 (4.8%) | 0 (0.0%) |
| 10 to 14 Minutes | 4 (6.4%) | 10 (18.5%) |
| 15 to 19 Minutes | 1 (1.6%) | 4 (7.4%) |
| 20 to 24 Minutes | 10 (15.9%) | 8 (14.8%) |
| 25 to 29 Minutes | 4 (6.4%) | 3 (5.6%) |
| 30 to 34 Minutes | 15 (23.8%) | 12 (22.2%) |
| 35 to 39 Minutes | 6 (9.5%) | 1 (1.8%) |
| 40 to 44 Minutes | 2 (3.2%) | 8 (14.8%) |
| 45 to 59 Minutes | 10 (15.9%) | 1 (1.8%) |
| 60 to 89 Minutes | 5 (7.9%) | 2 (3.7%) |
| 90 or more Minutes | 0 (0.0%) | 5 (9.3%) |
Time of Departure to Work by Sex in Kingston
The most frequent times of departure to work in Kingston are 12:00 PM to 3:59 PM (13, 20.6%) for males and 7:00 AM to 7:29 AM (12, 22.2%) for females.
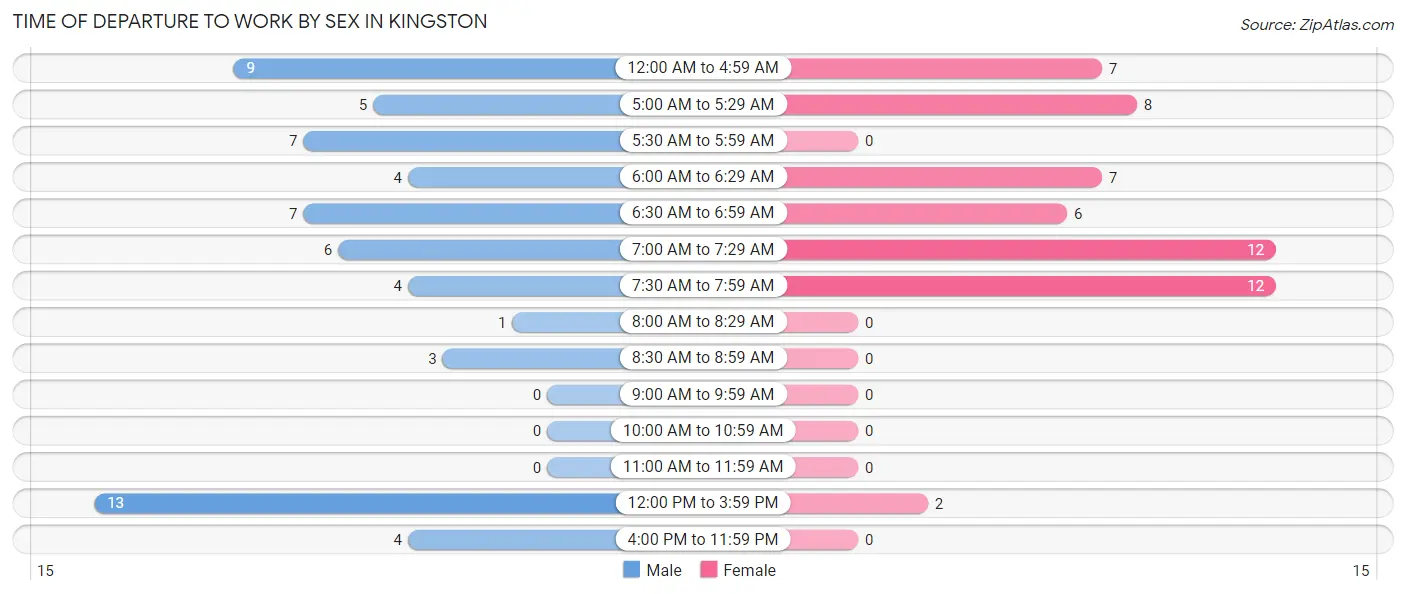
| Time of Departure | Male | Female |
| 12:00 AM to 4:59 AM | 9 (14.3%) | 7 (13.0%) |
| 5:00 AM to 5:29 AM | 5 (7.9%) | 8 (14.8%) |
| 5:30 AM to 5:59 AM | 7 (11.1%) | 0 (0.0%) |
| 6:00 AM to 6:29 AM | 4 (6.4%) | 7 (13.0%) |
| 6:30 AM to 6:59 AM | 7 (11.1%) | 6 (11.1%) |
| 7:00 AM to 7:29 AM | 6 (9.5%) | 12 (22.2%) |
| 7:30 AM to 7:59 AM | 4 (6.4%) | 12 (22.2%) |
| 8:00 AM to 8:29 AM | 1 (1.6%) | 0 (0.0%) |
| 8:30 AM to 8:59 AM | 3 (4.8%) | 0 (0.0%) |
| 9:00 AM to 9:59 AM | 0 (0.0%) | 0 (0.0%) |
| 10:00 AM to 10:59 AM | 0 (0.0%) | 0 (0.0%) |
| 11:00 AM to 11:59 AM | 0 (0.0%) | 0 (0.0%) |
| 12:00 PM to 3:59 PM | 13 (20.6%) | 2 (3.7%) |
| 4:00 PM to 11:59 PM | 4 (6.4%) | 0 (0.0%) |
| Total | 63 (100.0%) | 54 (100.0%) |
Housing Occupancy in Kingston
Occupancy by Ownership in Kingston
Of the total 122 dwellings in Kingston, owner-occupied units account for 108 (88.5%), while renter-occupied units make up 14 (11.5%).
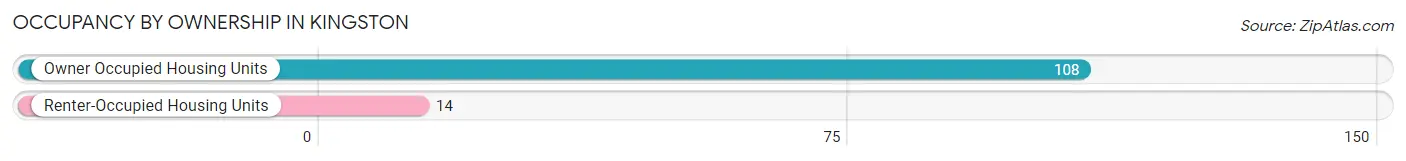
| Occupancy | # Housing Units | % Housing Units |
| Owner Occupied Housing Units | 108 | 88.5% |
| Renter-Occupied Housing Units | 14 | 11.5% |
| Total Occupied Housing Units | 122 | 100.0% |
Occupancy by Household Size in Kingston
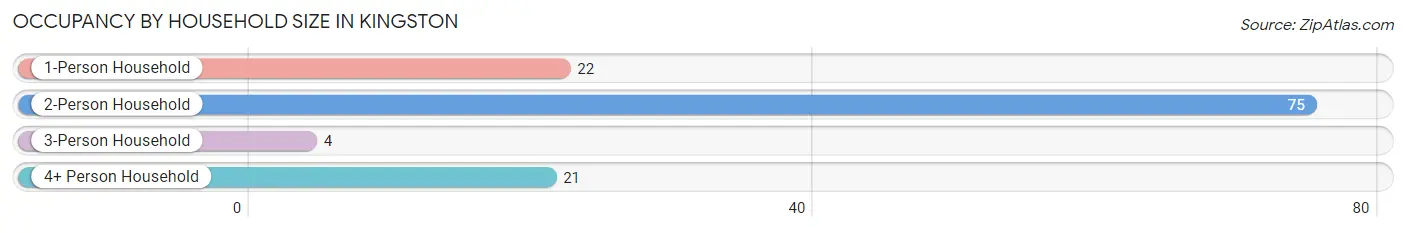
| Household Size | # Housing Units | % Housing Units |
| 1-Person Household | 22 | 18.0% |
| 2-Person Household | 75 | 61.5% |
| 3-Person Household | 4 | 3.3% |
| 4+ Person Household | 21 | 17.2% |
| Total Housing Units | 122 | 100.0% |
Occupancy by Ownership by Household Size in Kingston
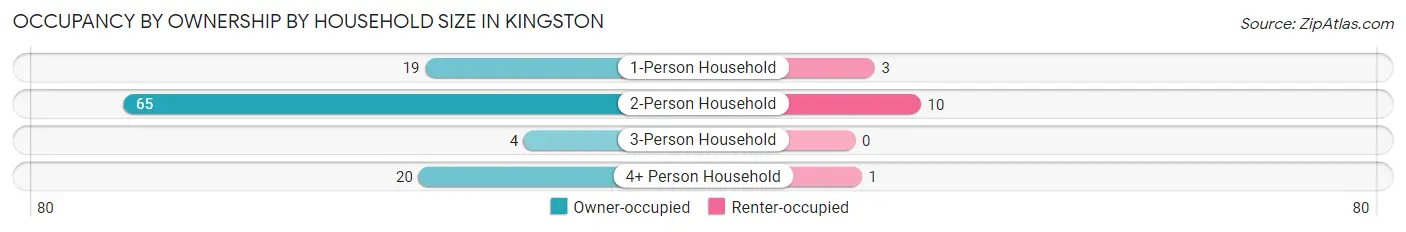
| Household Size | Owner-occupied | Renter-occupied |
| 1-Person Household | 19 (86.4%) | 3 (13.6%) |
| 2-Person Household | 65 (86.7%) | 10 (13.3%) |
| 3-Person Household | 4 (100.0%) | 0 (0.0%) |
| 4+ Person Household | 20 (95.2%) | 1 (4.8%) |
| Total Housing Units | 108 (88.5%) | 14 (11.5%) |
Occupancy by Educational Attainment in Kingston
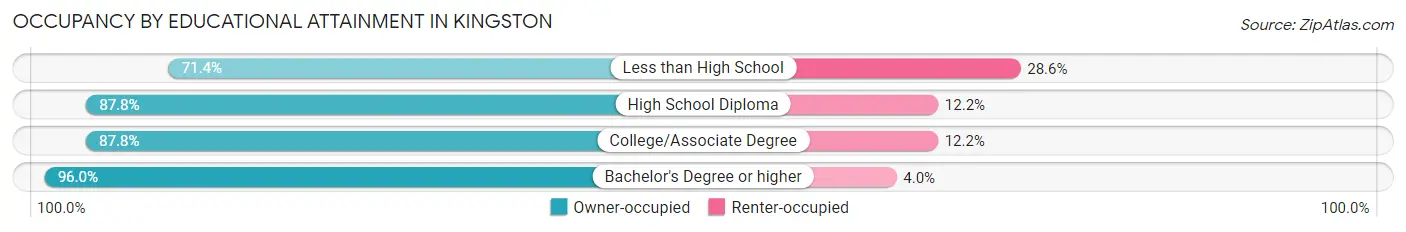
| Household Size | Owner-occupied | Renter-occupied |
| Less than High School | 5 (71.4%) | 2 (28.6%) |
| High School Diploma | 43 (87.8%) | 6 (12.2%) |
| College/Associate Degree | 36 (87.8%) | 5 (12.2%) |
| Bachelor's Degree or higher | 24 (96.0%) | 1 (4.0%) |
Occupancy by Age of Householder in Kingston
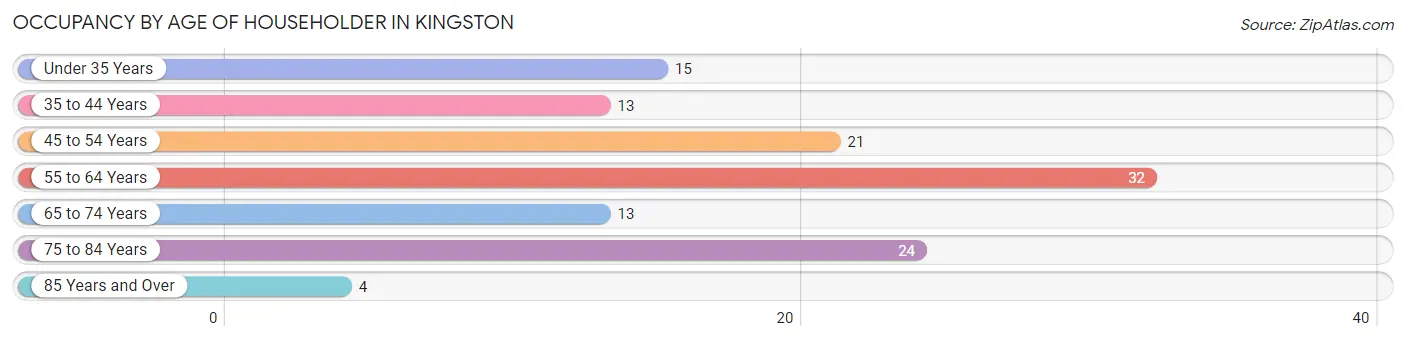
| Age Bracket | # Households | % Households |
| Under 35 Years | 15 | 12.3% |
| 35 to 44 Years | 13 | 10.7% |
| 45 to 54 Years | 21 | 17.2% |
| 55 to 64 Years | 32 | 26.2% |
| 65 to 74 Years | 13 | 10.7% |
| 75 to 84 Years | 24 | 19.7% |
| 85 Years and Over | 4 | 3.3% |
| Total | 122 | 100.0% |
Housing Finances in Kingston
Median Income by Occupancy in Kingston
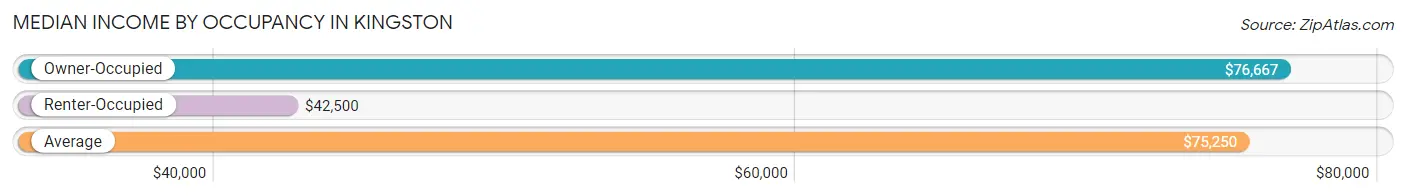
| Occupancy Type | # Households | Median Income |
| Owner-Occupied | 108 (88.5%) | $76,667 |
| Renter-Occupied | 14 (11.5%) | $42,500 |
| Average | 122 (100.0%) | $75,250 |
Occupancy by Householder Income Bracket in Kingston
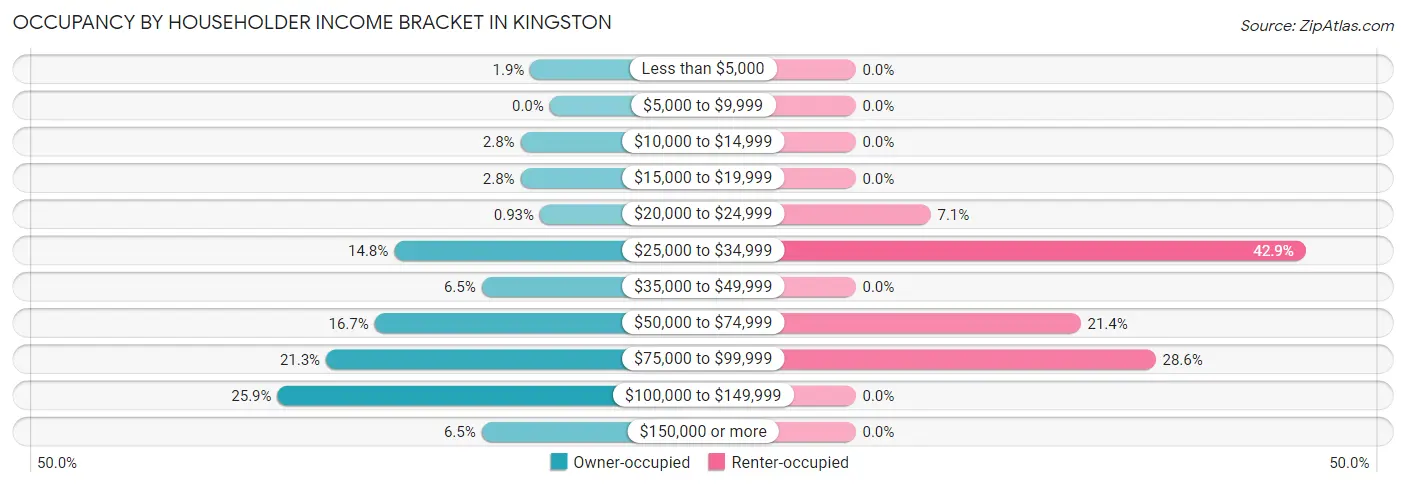
| Income Bracket | Owner-occupied | Renter-occupied |
| Less than $5,000 | 2 (1.8%) | 0 (0.0%) |
| $5,000 to $9,999 | 0 (0.0%) | 0 (0.0%) |
| $10,000 to $14,999 | 3 (2.8%) | 0 (0.0%) |
| $15,000 to $19,999 | 3 (2.8%) | 0 (0.0%) |
| $20,000 to $24,999 | 1 (0.9%) | 1 (7.1%) |
| $25,000 to $34,999 | 16 (14.8%) | 6 (42.9%) |
| $35,000 to $49,999 | 7 (6.5%) | 0 (0.0%) |
| $50,000 to $74,999 | 18 (16.7%) | 3 (21.4%) |
| $75,000 to $99,999 | 23 (21.3%) | 4 (28.6%) |
| $100,000 to $149,999 | 28 (25.9%) | 0 (0.0%) |
| $150,000 or more | 7 (6.5%) | 0 (0.0%) |
| Total | 108 (100.0%) | 14 (100.0%) |
Monthly Housing Cost Tiers in Kingston
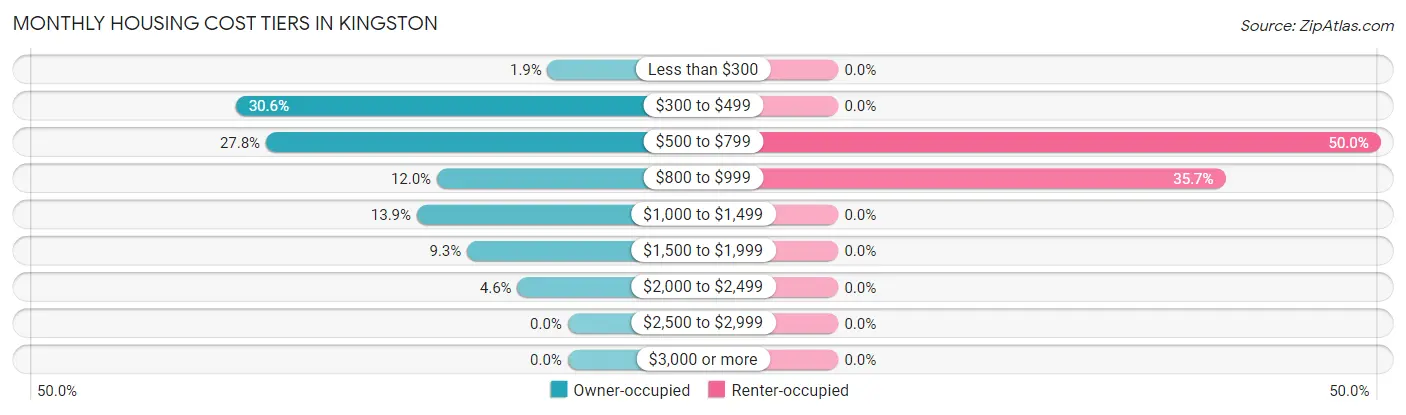
| Monthly Cost | Owner-occupied | Renter-occupied |
| Less than $300 | 2 (1.8%) | 0 (0.0%) |
| $300 to $499 | 33 (30.6%) | 0 (0.0%) |
| $500 to $799 | 30 (27.8%) | 7 (50.0%) |
| $800 to $999 | 13 (12.0%) | 5 (35.7%) |
| $1,000 to $1,499 | 15 (13.9%) | 0 (0.0%) |
| $1,500 to $1,999 | 10 (9.3%) | 0 (0.0%) |
| $2,000 to $2,499 | 5 (4.6%) | 0 (0.0%) |
| $2,500 to $2,999 | 0 (0.0%) | 0 (0.0%) |
| $3,000 or more | 0 (0.0%) | 0 (0.0%) |
| Total | 108 (100.0%) | 14 (100.0%) |
Physical Housing Characteristics in Kingston
Housing Structures in Kingston
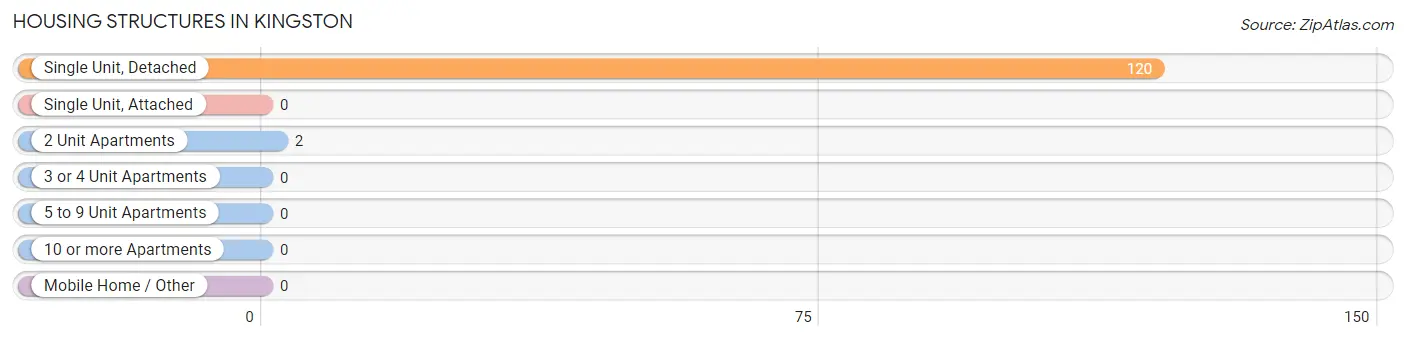
| Structure Type | # Housing Units | % Housing Units |
| Single Unit, Detached | 120 | 98.4% |
| Single Unit, Attached | 0 | 0.0% |
| 2 Unit Apartments | 2 | 1.6% |
| 3 or 4 Unit Apartments | 0 | 0.0% |
| 5 to 9 Unit Apartments | 0 | 0.0% |
| 10 or more Apartments | 0 | 0.0% |
| Mobile Home / Other | 0 | 0.0% |
| Total | 122 | 100.0% |
Housing Structures by Occupancy in Kingston
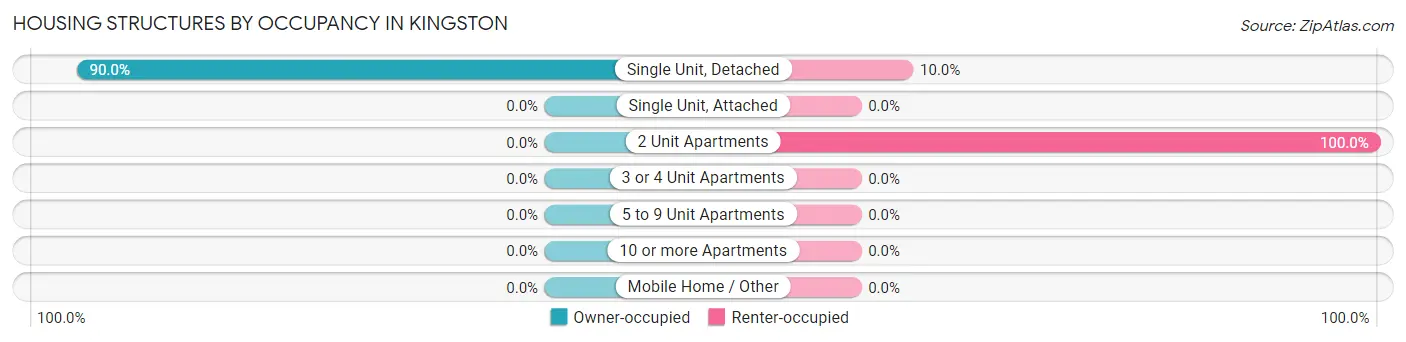
| Structure Type | Owner-occupied | Renter-occupied |
| Single Unit, Detached | 108 (90.0%) | 12 (10.0%) |
| Single Unit, Attached | 0 (0.0%) | 0 (0.0%) |
| 2 Unit Apartments | 0 (0.0%) | 2 (100.0%) |
| 3 or 4 Unit Apartments | 0 (0.0%) | 0 (0.0%) |
| 5 to 9 Unit Apartments | 0 (0.0%) | 0 (0.0%) |
| 10 or more Apartments | 0 (0.0%) | 0 (0.0%) |
| Mobile Home / Other | 0 (0.0%) | 0 (0.0%) |
| Total | 108 (88.5%) | 14 (11.5%) |
Housing Structures by Number of Rooms in Kingston
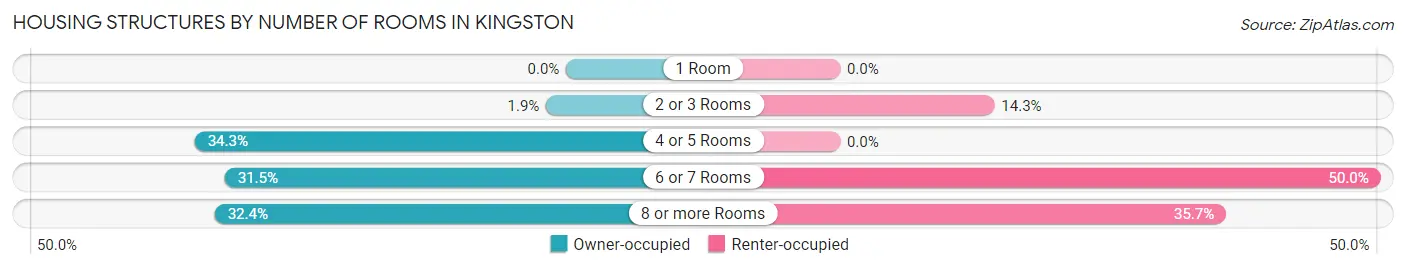
| Number of Rooms | Owner-occupied | Renter-occupied |
| 1 Room | 0 (0.0%) | 0 (0.0%) |
| 2 or 3 Rooms | 2 (1.8%) | 2 (14.3%) |
| 4 or 5 Rooms | 37 (34.3%) | 0 (0.0%) |
| 6 or 7 Rooms | 34 (31.5%) | 7 (50.0%) |
| 8 or more Rooms | 35 (32.4%) | 5 (35.7%) |
| Total | 108 (100.0%) | 14 (100.0%) |
Housing Structure by Heating Type in Kingston
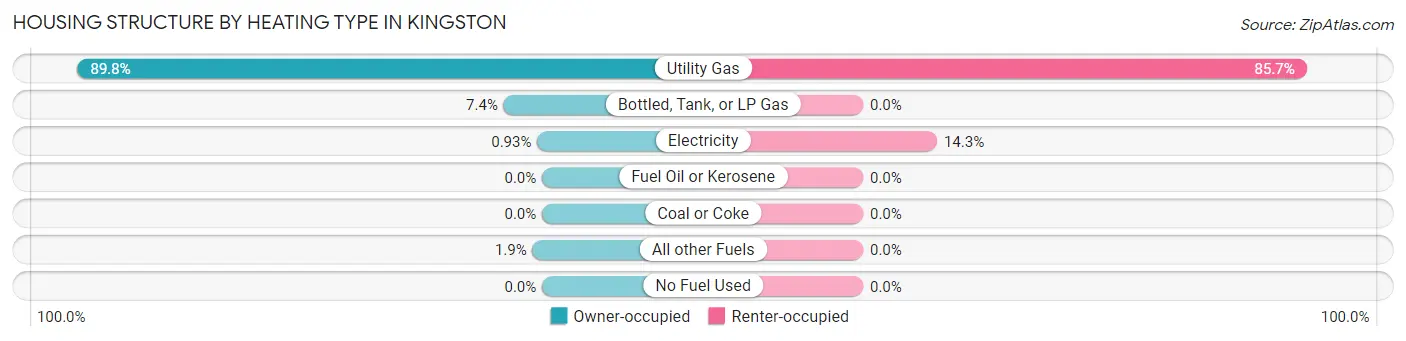
| Heating Type | Owner-occupied | Renter-occupied |
| Utility Gas | 97 (89.8%) | 12 (85.7%) |
| Bottled, Tank, or LP Gas | 8 (7.4%) | 0 (0.0%) |
| Electricity | 1 (0.9%) | 2 (14.3%) |
| Fuel Oil or Kerosene | 0 (0.0%) | 0 (0.0%) |
| Coal or Coke | 0 (0.0%) | 0 (0.0%) |
| All other Fuels | 2 (1.8%) | 0 (0.0%) |
| No Fuel Used | 0 (0.0%) | 0 (0.0%) |
| Total | 108 (100.0%) | 14 (100.0%) |
Household Vehicle Usage in Kingston
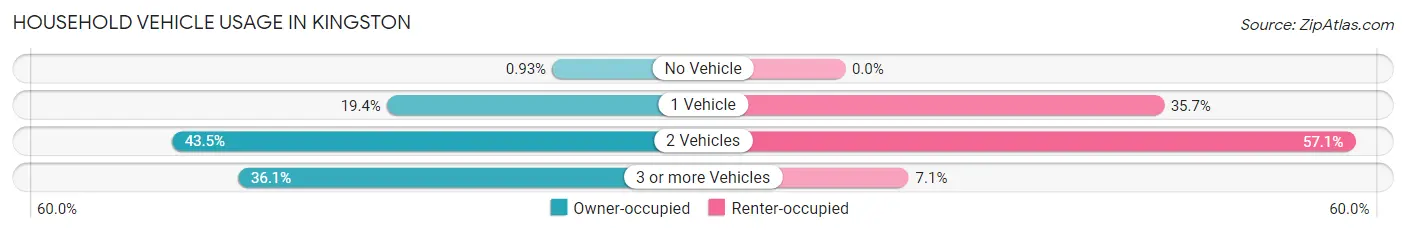
| Vehicles per Household | Owner-occupied | Renter-occupied |
| No Vehicle | 1 (0.9%) | 0 (0.0%) |
| 1 Vehicle | 21 (19.4%) | 5 (35.7%) |
| 2 Vehicles | 47 (43.5%) | 8 (57.1%) |
| 3 or more Vehicles | 39 (36.1%) | 1 (7.1%) |
| Total | 108 (100.0%) | 14 (100.0%) |
Real Estate & Mortgages in Kingston
Real Estate and Mortgage Overview in Kingston
| Characteristic | Without Mortgage | With Mortgage |
| Housing Units | 47 | 61 |
| Median Property Value | $126,000 | $122,100 |
| Median Household Income | $43,125 | $4 |
| Monthly Housing Costs | $428 | $0 |
| Real Estate Taxes | $2,205 | $0 |
Property Value by Mortgage Status in Kingston
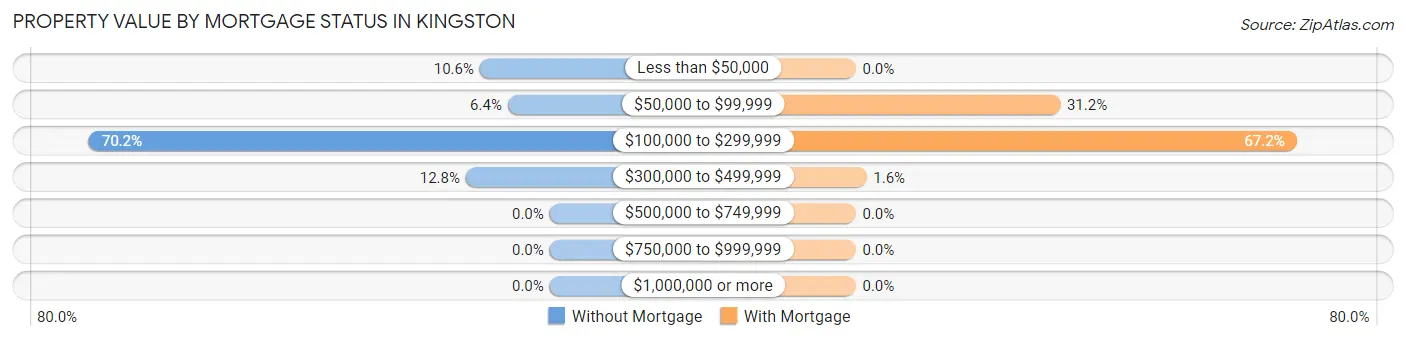
| Property Value | Without Mortgage | With Mortgage |
| Less than $50,000 | 5 (10.6%) | 0 (0.0%) |
| $50,000 to $99,999 | 3 (6.4%) | 19 (31.1%) |
| $100,000 to $299,999 | 33 (70.2%) | 41 (67.2%) |
| $300,000 to $499,999 | 6 (12.8%) | 1 (1.6%) |
| $500,000 to $749,999 | 0 (0.0%) | 0 (0.0%) |
| $750,000 to $999,999 | 0 (0.0%) | 0 (0.0%) |
| $1,000,000 or more | 0 (0.0%) | 0 (0.0%) |
| Total | 47 (100.0%) | 61 (100.0%) |
Household Income by Mortgage Status in Kingston
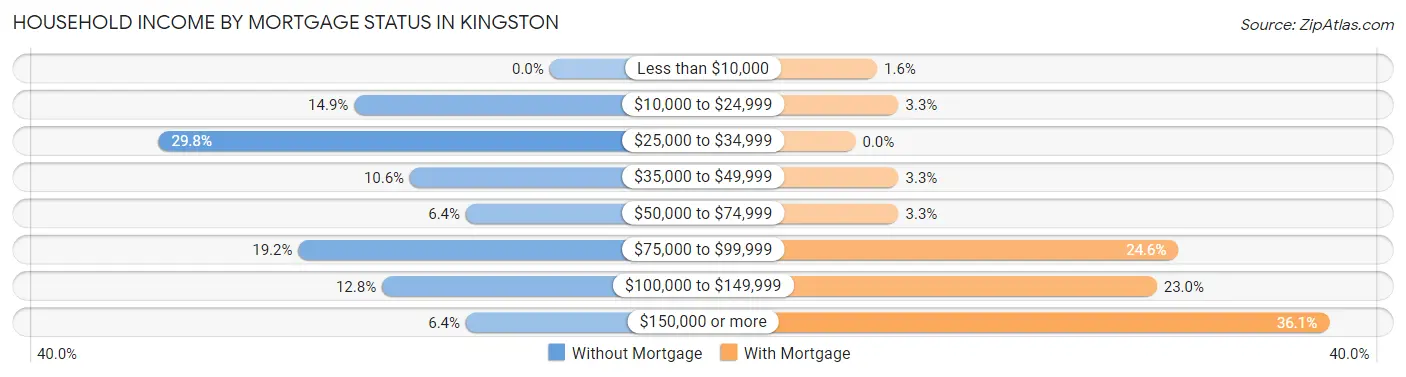
| Household Income | Without Mortgage | With Mortgage |
| Less than $10,000 | 0 (0.0%) | 1 (1.6%) |
| $10,000 to $24,999 | 7 (14.9%) | 2 (3.3%) |
| $25,000 to $34,999 | 14 (29.8%) | 0 (0.0%) |
| $35,000 to $49,999 | 5 (10.6%) | 2 (3.3%) |
| $50,000 to $74,999 | 3 (6.4%) | 2 (3.3%) |
| $75,000 to $99,999 | 9 (19.2%) | 15 (24.6%) |
| $100,000 to $149,999 | 6 (12.8%) | 14 (23.0%) |
| $150,000 or more | 3 (6.4%) | 22 (36.1%) |
| Total | 47 (100.0%) | 61 (100.0%) |
Property Value to Household Income Ratio in Kingston
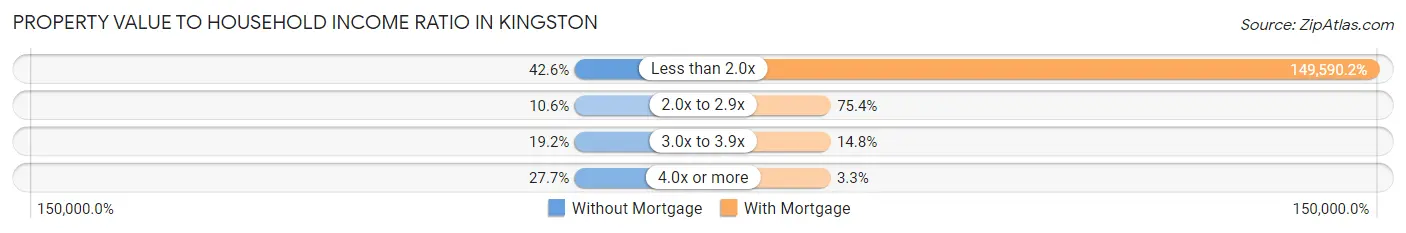
| Value-to-Income Ratio | Without Mortgage | With Mortgage |
| Less than 2.0x | 20 (42.5%) | 91,250 (149,590.2%) |
| 2.0x to 2.9x | 5 (10.6%) | 46 (75.4%) |
| 3.0x to 3.9x | 9 (19.2%) | 9 (14.7%) |
| 4.0x or more | 13 (27.7%) | 2 (3.3%) |
| Total | 47 (100.0%) | 61 (100.0%) |
Real Estate Taxes by Mortgage Status in Kingston
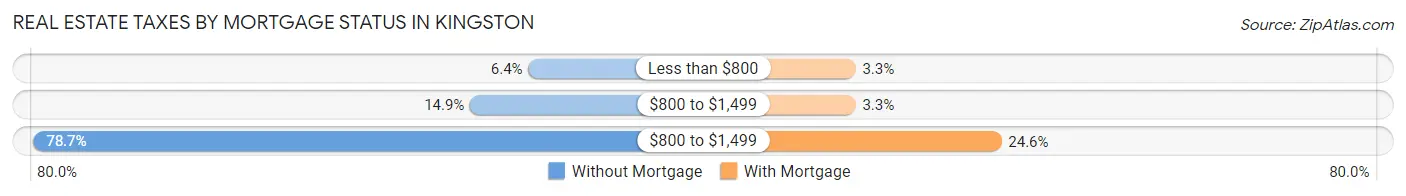
| Property Taxes | Without Mortgage | With Mortgage |
| Less than $800 | 3 (6.4%) | 2 (3.3%) |
| $800 to $1,499 | 7 (14.9%) | 2 (3.3%) |
| $800 to $1,499 | 37 (78.7%) | 15 (24.6%) |
| Total | 47 (100.0%) | 61 (100.0%) |
Health & Disability in Kingston
Health Insurance Coverage by Age in Kingston
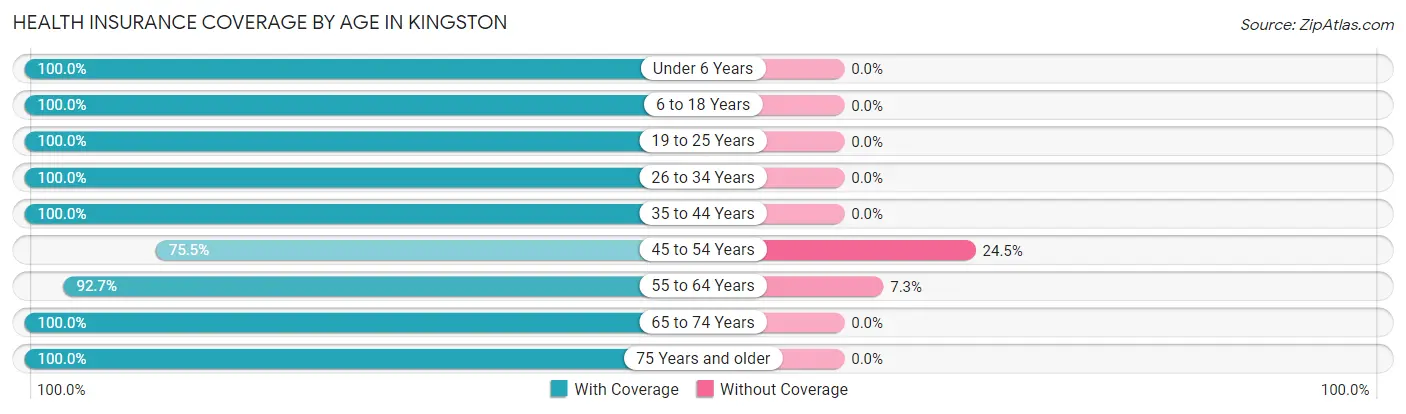
| Age Bracket | With Coverage | Without Coverage |
| Under 6 Years | 10 (100.0%) | 0 (0.0%) |
| 6 to 18 Years | 36 (100.0%) | 0 (0.0%) |
| 19 to 25 Years | 7 (100.0%) | 0 (0.0%) |
| 26 to 34 Years | 21 (100.0%) | 0 (0.0%) |
| 35 to 44 Years | 35 (100.0%) | 0 (0.0%) |
| 45 to 54 Years | 37 (75.5%) | 12 (24.5%) |
| 55 to 64 Years | 51 (92.7%) | 4 (7.3%) |
| 65 to 74 Years | 62 (100.0%) | 0 (0.0%) |
| 75 Years and older | 41 (100.0%) | 0 (0.0%) |
| Total | 300 (94.9%) | 16 (5.1%) |
Health Insurance Coverage by Citizenship Status in Kingston
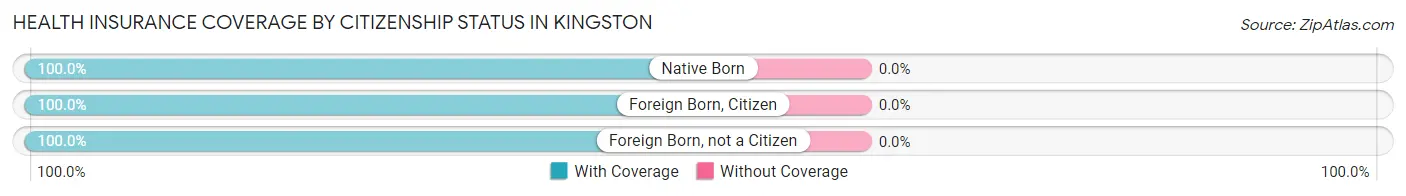
| Citizenship Status | With Coverage | Without Coverage |
| Native Born | 10 (100.0%) | 0 (0.0%) |
| Foreign Born, Citizen | 36 (100.0%) | 0 (0.0%) |
| Foreign Born, not a Citizen | 7 (100.0%) | 0 (0.0%) |
Health Insurance Coverage by Household Income in Kingston
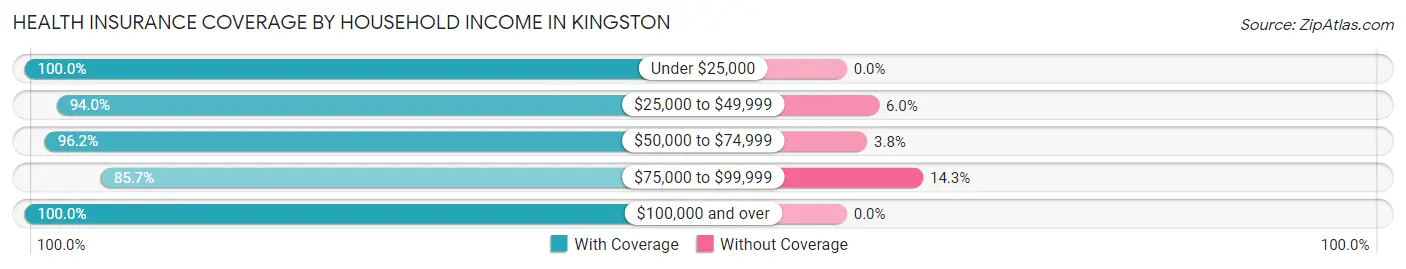
| Household Income | With Coverage | Without Coverage |
| Under $25,000 | 15 (100.0%) | 0 (0.0%) |
| $25,000 to $49,999 | 78 (94.0%) | 5 (6.0%) |
| $50,000 to $74,999 | 76 (96.2%) | 3 (3.8%) |
| $75,000 to $99,999 | 48 (85.7%) | 8 (14.3%) |
| $100,000 and over | 83 (100.0%) | 0 (0.0%) |
Public vs Private Health Insurance Coverage by Age in Kingston
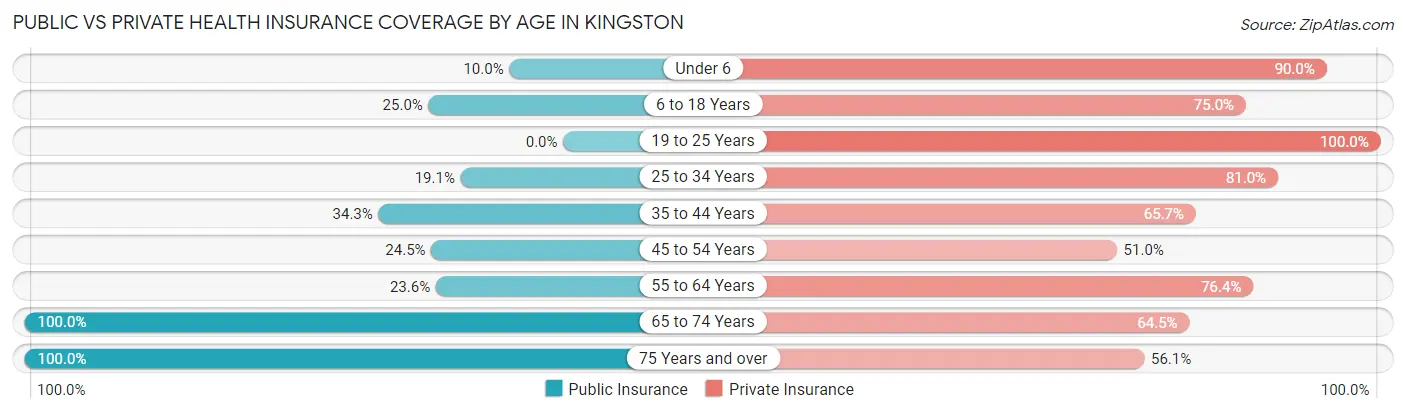
| Age Bracket | Public Insurance | Private Insurance |
| Under 6 | 1 (10.0%) | 9 (90.0%) |
| 6 to 18 Years | 9 (25.0%) | 27 (75.0%) |
| 19 to 25 Years | 0 (0.0%) | 7 (100.0%) |
| 25 to 34 Years | 4 (19.1%) | 17 (80.9%) |
| 35 to 44 Years | 12 (34.3%) | 23 (65.7%) |
| 45 to 54 Years | 12 (24.5%) | 25 (51.0%) |
| 55 to 64 Years | 13 (23.6%) | 42 (76.4%) |
| 65 to 74 Years | 62 (100.0%) | 40 (64.5%) |
| 75 Years and over | 41 (100.0%) | 23 (56.1%) |
| Total | 154 (48.7%) | 213 (67.4%) |
Disability Status by Sex by Age in Kingston
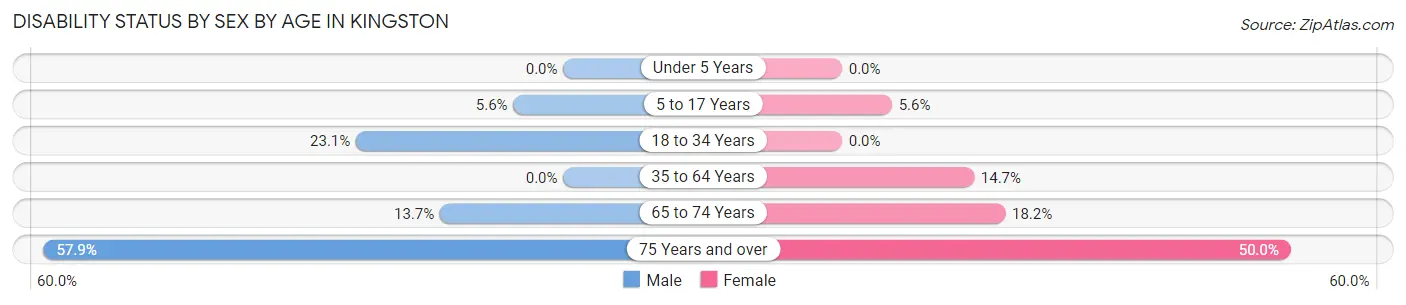
| Age Bracket | Male | Female |
| Under 5 Years | 0 (0.0%) | 0 (0.0%) |
| 5 to 17 Years | 1 (5.6%) | 1 (5.6%) |
| 18 to 34 Years | 3 (23.1%) | 0 (0.0%) |
| 35 to 64 Years | 0 (0.0%) | 10 (14.7%) |
| 65 to 74 Years | 7 (13.7%) | 2 (18.2%) |
| 75 Years and over | 11 (57.9%) | 11 (50.0%) |
Disability Class by Sex by Age in Kingston
Disability Class: Hearing Difficulty
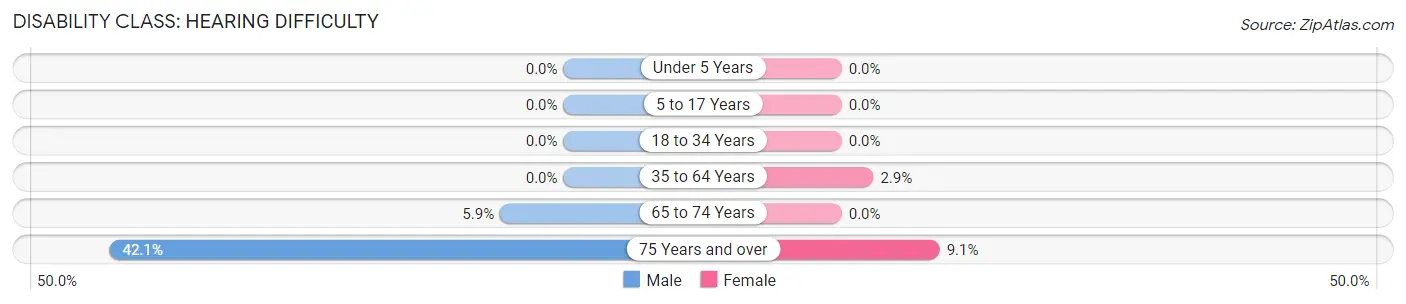
| Age Bracket | Male | Female |
| Under 5 Years | 0 (0.0%) | 0 (0.0%) |
| 5 to 17 Years | 0 (0.0%) | 0 (0.0%) |
| 18 to 34 Years | 0 (0.0%) | 0 (0.0%) |
| 35 to 64 Years | 0 (0.0%) | 2 (2.9%) |
| 65 to 74 Years | 3 (5.9%) | 0 (0.0%) |
| 75 Years and over | 8 (42.1%) | 2 (9.1%) |
Disability Class: Vision Difficulty
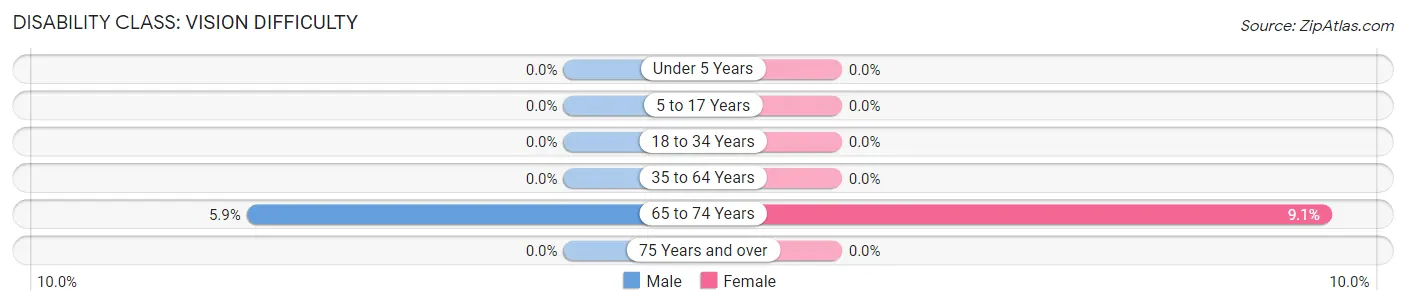
| Age Bracket | Male | Female |
| Under 5 Years | 0 (0.0%) | 0 (0.0%) |
| 5 to 17 Years | 0 (0.0%) | 0 (0.0%) |
| 18 to 34 Years | 0 (0.0%) | 0 (0.0%) |
| 35 to 64 Years | 0 (0.0%) | 0 (0.0%) |
| 65 to 74 Years | 3 (5.9%) | 1 (9.1%) |
| 75 Years and over | 0 (0.0%) | 0 (0.0%) |
Disability Class: Cognitive Difficulty
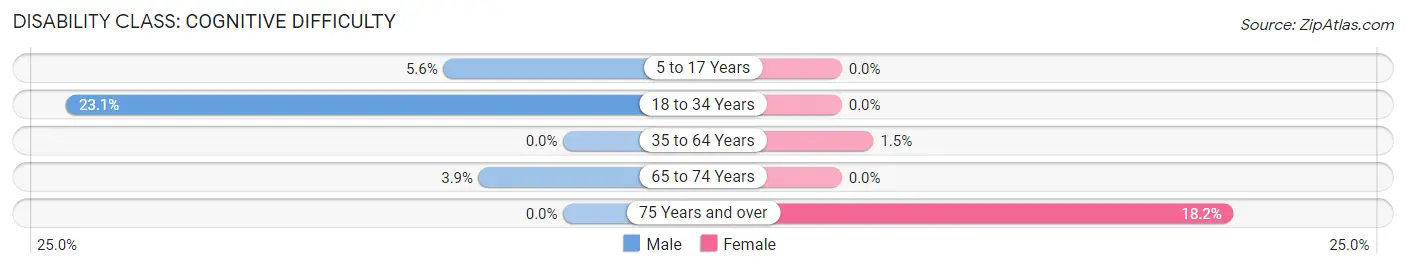
| Age Bracket | Male | Female |
| 5 to 17 Years | 1 (5.6%) | 0 (0.0%) |
| 18 to 34 Years | 3 (23.1%) | 0 (0.0%) |
| 35 to 64 Years | 0 (0.0%) | 1 (1.5%) |
| 65 to 74 Years | 2 (3.9%) | 0 (0.0%) |
| 75 Years and over | 0 (0.0%) | 4 (18.2%) |
Disability Class: Ambulatory Difficulty
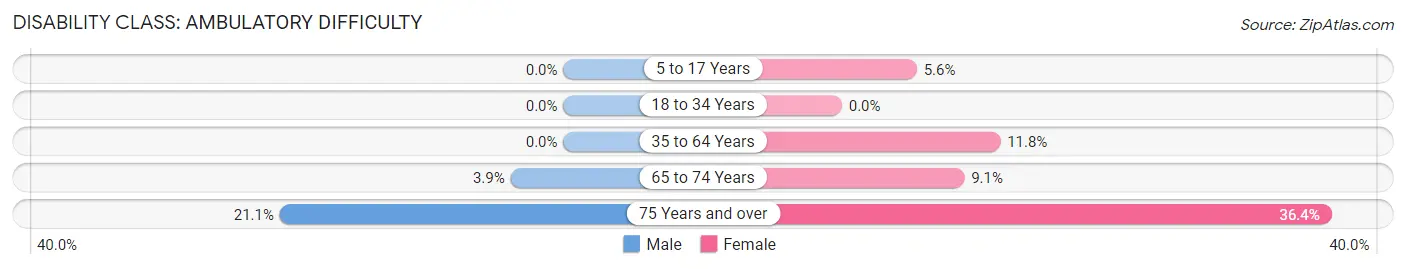
| Age Bracket | Male | Female |
| 5 to 17 Years | 0 (0.0%) | 1 (5.6%) |
| 18 to 34 Years | 0 (0.0%) | 0 (0.0%) |
| 35 to 64 Years | 0 (0.0%) | 8 (11.8%) |
| 65 to 74 Years | 2 (3.9%) | 1 (9.1%) |
| 75 Years and over | 4 (21.0%) | 8 (36.4%) |
Disability Class: Self-Care Difficulty
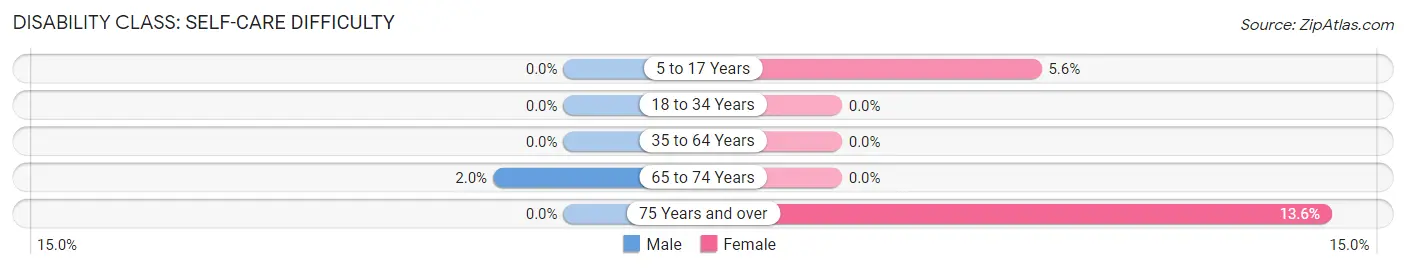
| Age Bracket | Male | Female |
| 5 to 17 Years | 0 (0.0%) | 1 (5.6%) |
| 18 to 34 Years | 0 (0.0%) | 0 (0.0%) |
| 35 to 64 Years | 0 (0.0%) | 0 (0.0%) |
| 65 to 74 Years | 1 (2.0%) | 0 (0.0%) |
| 75 Years and over | 0 (0.0%) | 3 (13.6%) |
Technology Access in Kingston
Computing Device Access in Kingston
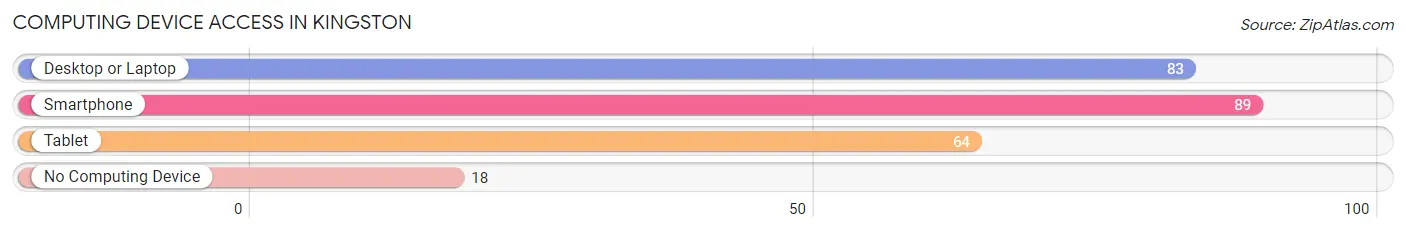
| Device Type | # Households | % Households |
| Desktop or Laptop | 83 | 68.0% |
| Smartphone | 89 | 73.0% |
| Tablet | 64 | 52.5% |
| No Computing Device | 18 | 14.7% |
| Total | 122 | 100.0% |
Internet Access in Kingston
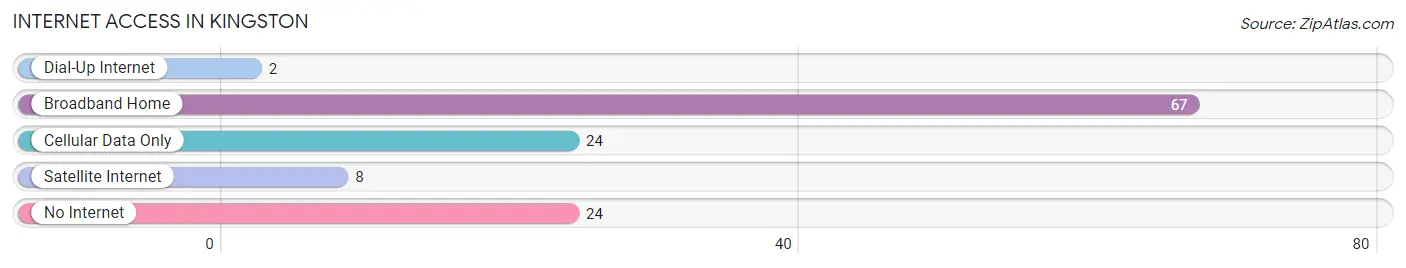
| Internet Type | # Households | % Households |
| Dial-Up Internet | 2 | 1.6% |
| Broadband Home | 67 | 54.9% |
| Cellular Data Only | 24 | 19.7% |
| Satellite Internet | 8 | 6.6% |
| No Internet | 24 | 19.7% |
| Total | 122 | 100.0% |
Kingston Summary
Kingston is a small town located in the southeastern corner of Wisconsin, in the United States. It is situated in the Rock River Valley, in the county of Rock. The town is located about 25 miles south of the state capital, Madison. The population of Kingston was estimated to be 1,845 in 2020.
History
The area that is now Kingston was first settled in 1836 by a group of settlers from New York. The town was originally known as “New York Settlement”, but was later renamed Kingston in 1845. The name was chosen in honor of the town’s first settler, William Kingston.
The town was officially incorporated in 1848. During the 19th century, Kingston was a small farming community. The town was also home to a number of small businesses, including a sawmill, a grist mill, and a blacksmith shop.
In the early 20th century, Kingston began to experience a period of growth. The town was connected to the rest of the state by the Milwaukee Road railroad in 1910. This allowed for the transportation of goods and people to and from the town.
In the 1950s, Kingston experienced a period of rapid growth. This was due to the construction of a number of new factories in the area. These factories provided jobs for many of the town’s residents.
Geography
Kingston is located in the southeastern corner of Wisconsin, in the county of Rock. The town is situated in the Rock River Valley, which is part of the Driftless Area. The town is located about 25 miles south of the state capital, Madison.
The town is surrounded by rolling hills and valleys. The town is also home to a number of small lakes and ponds. The town is located near the Wisconsin River, which is a major tributary of the Mississippi River.
Economy
The economy of Kingston is largely based on agriculture and manufacturing. The town is home to a number of small businesses, including a sawmill, a grist mill, and a blacksmith shop.
The town is also home to a number of factories, which provide jobs for many of the town’s residents. These factories produce a variety of products, including furniture, paper products, and automotive parts.
Demographics
The population of Kingston was estimated to be 1,845 in 2020. The town has a diverse population, with people of various ethnic backgrounds. The town is also home to a number of immigrants, with the largest group being from Mexico.
The median household income in Kingston is $50,845, which is slightly higher than the national average. The town has a poverty rate of 11.3%, which is slightly lower than the national average.
Conclusion
Kingston is a small town located in the southeastern corner of Wisconsin, in the United States. The town has a long history, dating back to the 19th century. The town is surrounded by rolling hills and valleys, and is home to a number of small businesses and factories. The population of Kingston is diverse, with people of various ethnic backgrounds. The town has a median household income of $50,845, and a poverty rate of 11.3%.
Common Questions
What is Per Capita Income in Kingston?
Per Capita income in Kingston is $35,307.
What is the Median Family Income in Kingston?
Median Family Income in Kingston is $75,000.
What is the Median Household income in Kingston?
Median Household Income in Kingston is $75,250.
What is Inequality or Gini Index in Kingston?
Inequality or Gini Index in Kingston is 0.40.
What is the Total Population of Kingston?
Total Population of Kingston is 316.
What is the Total Male Population of Kingston?
Total Male Population of Kingston is 176.
What is the Total Female Population of Kingston?
Total Female Population of Kingston is 140.
What is the Ratio of Males per 100 Females in Kingston?
There are 125.71 Males per 100 Females in Kingston.
What is the Ratio of Females per 100 Males in Kingston?
There are 79.55 Females per 100 Males in Kingston.
What is the Median Population Age in Kingston?
Median Population Age in Kingston is 55.0 Years.
What is the Average Family Size in Kingston
Average Family Size in Kingston is 3.0 People.
What is the Average Household Size in Kingston
Average Household Size in Kingston is 2.6 People.
How Large is the Labor Force in Kingston?
There are 136 People in the Labor Forcein in Kingston.
What is the Percentage of People in the Labor Force in Kingston?
49.3% of People are in the Labor Force in Kingston.
What is the Unemployment Rate in Kingston?
Unemployment Rate in Kingston is 4.4%.