Kimberly, WI Map & Demographics
Kimberly Map
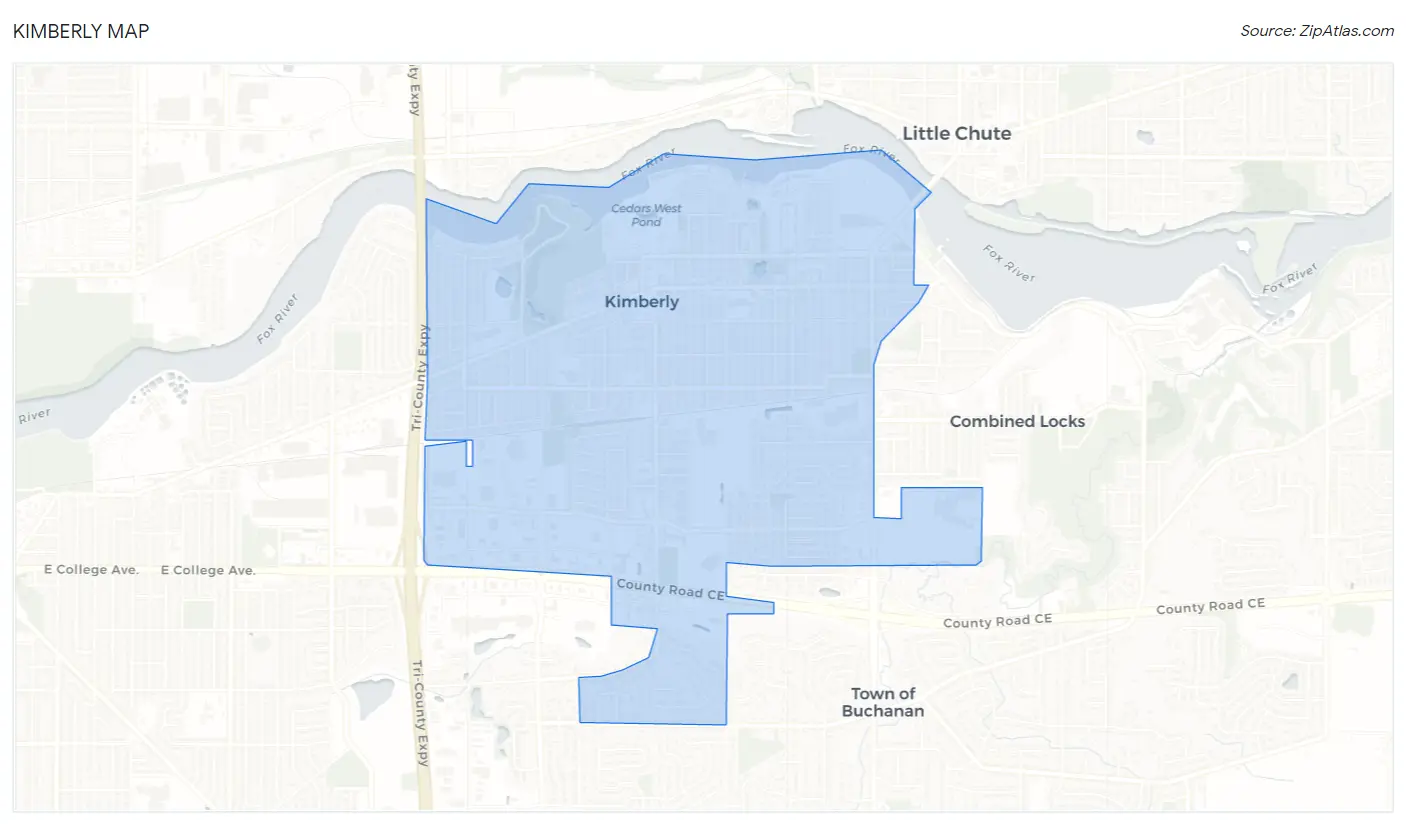
Kimberly Overview
$34,623
PER CAPITA INCOME
$86,566
AVG FAMILY INCOME
$65,061
AVG HOUSEHOLD INCOME
34.4%
WAGE / INCOME GAP [ % ]
65.6¢/ $1
WAGE / INCOME GAP [ $ ]
0.42
INEQUALITY / GINI INDEX
7,331
TOTAL POPULATION
3,689
MALE POPULATION
3,642
FEMALE POPULATION
101.29
MALES / 100 FEMALES
98.73
FEMALES / 100 MALES
39.2
MEDIAN AGE
3.2
AVG FAMILY SIZE
2.5
AVG HOUSEHOLD SIZE
3,511
LABOR FORCE [ PEOPLE ]
64.5%
PERCENT IN LABOR FORCE
5.1%
UNEMPLOYMENT RATE
Kimberly Zip Codes
Income in Kimberly
Income Overview in Kimberly
Per Capita Income in Kimberly is $34,623, while median incomes of families and households are $86,566 and $65,061 respectively.
| Characteristic | Number | Measure |
| Per Capita Income | 7,331 | $34,623 |
| Median Family Income | 1,816 | $86,566 |
| Mean Family Income | 1,816 | $105,502 |
| Median Household Income | 2,984 | $65,061 |
| Mean Household Income | 2,984 | $82,149 |
| Income Deficit | 1,816 | $0 |
| Wage / Income Gap (%) | 7,331 | 34.37% |
| Wage / Income Gap ($) | 7,331 | 65.63¢ per $1 |
| Gini / Inequality Index | 7,331 | 0.42 |
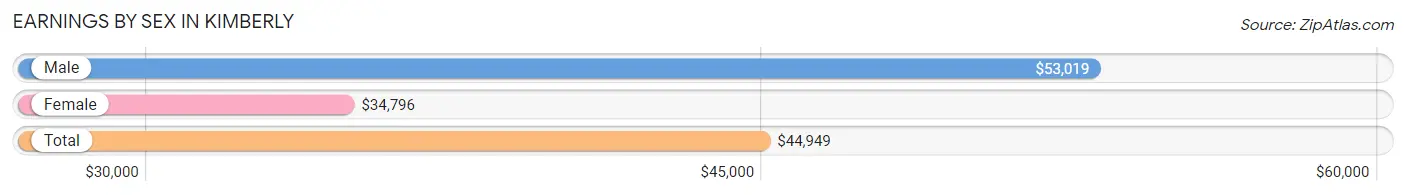
Earnings by Sex in Kimberly
Average Earnings in Kimberly are $44,949, $53,019 for men and $34,796 for women, a difference of 34.4%.
| Sex | Number | Average Earnings |
| Male | 2,080 (54.3%) | $53,019 |
| Female | 1,751 (45.7%) | $34,796 |
| Total | 3,831 (100.0%) | $44,949 |
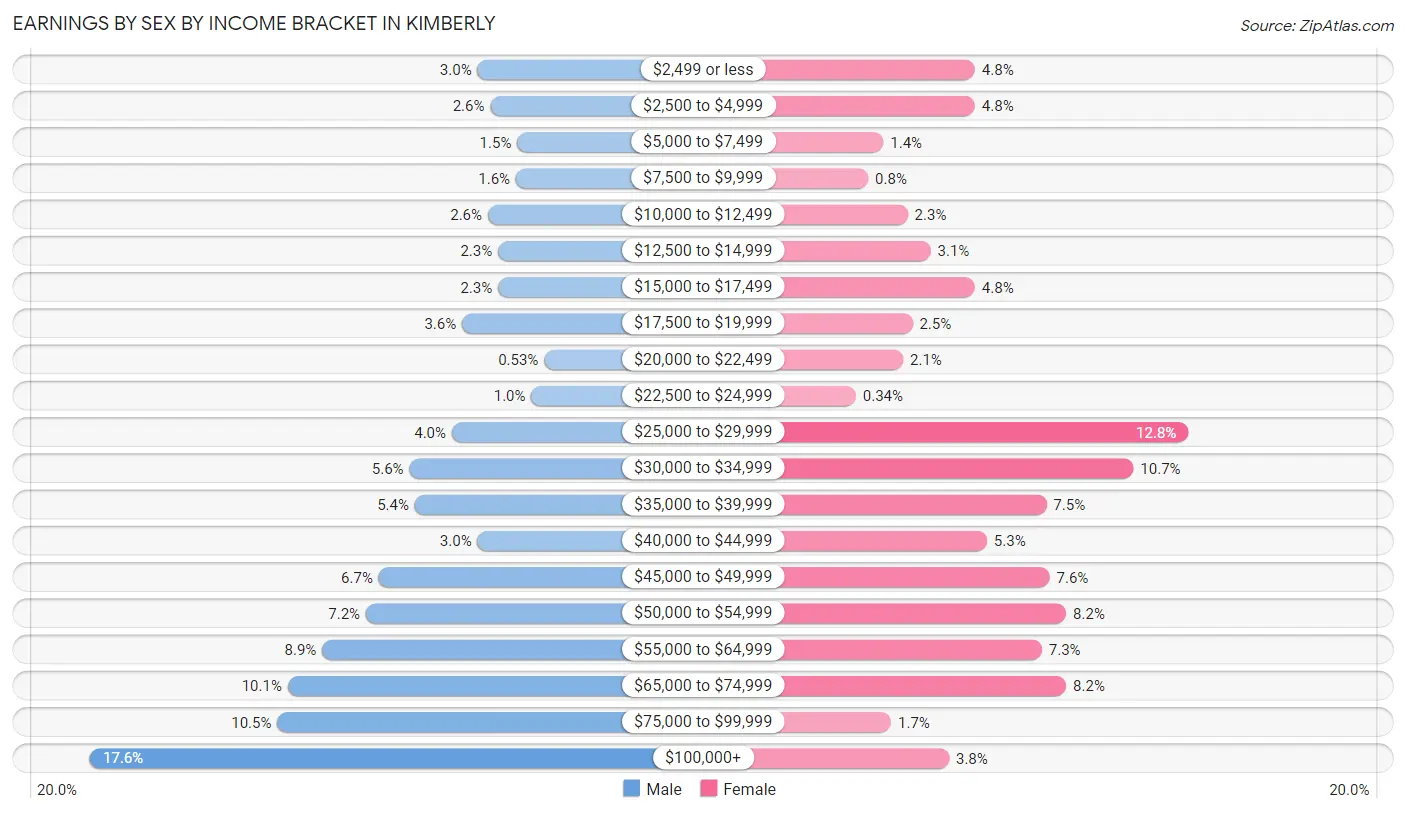
Earnings by Sex by Income Bracket in Kimberly
The most common earnings brackets in Kimberly are $100,000+ for men (365 | 17.5%) and $25,000 to $29,999 for women (224 | 12.8%).
| Income | Male | Female |
| $2,499 or less | 63 (3.0%) | 84 (4.8%) |
| $2,500 to $4,999 | 53 (2.5%) | 84 (4.8%) |
| $5,000 to $7,499 | 32 (1.5%) | 24 (1.4%) |
| $7,500 to $9,999 | 33 (1.6%) | 14 (0.8%) |
| $10,000 to $12,499 | 55 (2.6%) | 40 (2.3%) |
| $12,500 to $14,999 | 47 (2.3%) | 55 (3.1%) |
| $15,000 to $17,499 | 47 (2.3%) | 84 (4.8%) |
| $17,500 to $19,999 | 75 (3.6%) | 43 (2.5%) |
| $20,000 to $22,499 | 11 (0.5%) | 37 (2.1%) |
| $22,500 to $24,999 | 21 (1.0%) | 6 (0.3%) |
| $25,000 to $29,999 | 83 (4.0%) | 224 (12.8%) |
| $30,000 to $34,999 | 116 (5.6%) | 188 (10.7%) |
| $35,000 to $39,999 | 112 (5.4%) | 131 (7.5%) |
| $40,000 to $44,999 | 63 (3.0%) | 92 (5.2%) |
| $45,000 to $49,999 | 140 (6.7%) | 133 (7.6%) |
| $50,000 to $54,999 | 150 (7.2%) | 144 (8.2%) |
| $55,000 to $64,999 | 184 (8.8%) | 128 (7.3%) |
| $65,000 to $74,999 | 211 (10.1%) | 144 (8.2%) |
| $75,000 to $99,999 | 219 (10.5%) | 29 (1.7%) |
| $100,000+ | 365 (17.5%) | 67 (3.8%) |
| Total | 2,080 (100.0%) | 1,751 (100.0%) |
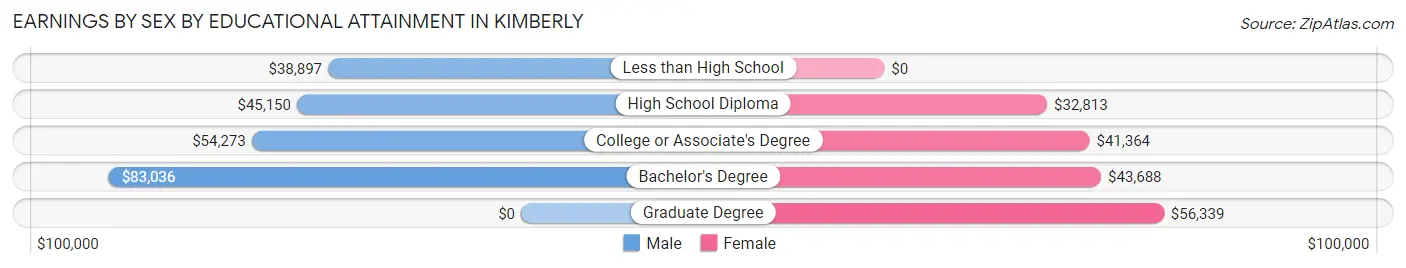
Earnings by Sex by Educational Attainment in Kimberly
Average earnings in Kimberly are $57,922 for men and $36,433 for women, a difference of 37.1%. Men with an educational attainment of bachelor's degree enjoy the highest average annual earnings of $83,036, while those with less than high school education earn the least with $38,897. Women with an educational attainment of graduate degree earn the most with the average annual earnings of $56,339, while those with high school diploma education have the smallest earnings of $32,813.
| Educational Attainment | Male Income | Female Income |
| Less than High School | $38,897 | $0 |
| High School Diploma | $45,150 | $32,813 |
| College or Associate's Degree | $54,273 | $41,364 |
| Bachelor's Degree | $83,036 | $43,688 |
| Graduate Degree | - | - |
| Total | $57,922 | $36,433 |
Family Income in Kimberly
Family Income Brackets in Kimberly
According to the Kimberly family income data, there are 414 families falling into the $100,000 to $149,999 income range, which is the most common income bracket and makes up 22.8% of all families. Conversely, the $10,000 to $14,999 income bracket is the least frequent group with only 11 families (0.6%) belonging to this category.
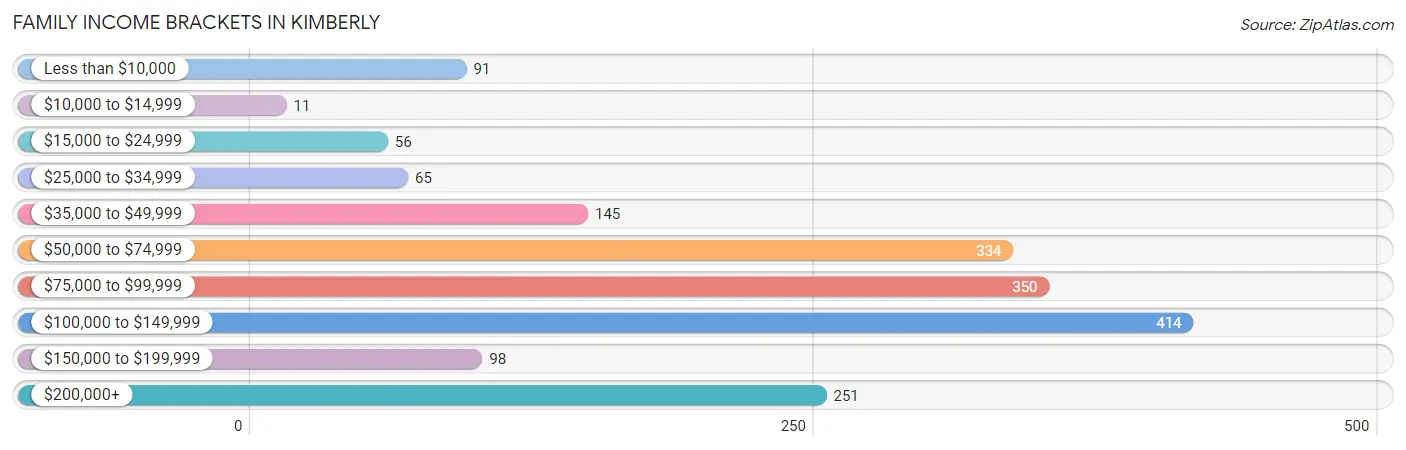
| Income Bracket | # Families | % Families |
| Less than $10,000 | 91 | 5.0% |
| $10,000 to $14,999 | 11 | 0.6% |
| $15,000 to $24,999 | 56 | 3.1% |
| $25,000 to $34,999 | 65 | 3.6% |
| $35,000 to $49,999 | 145 | 8.0% |
| $50,000 to $74,999 | 334 | 18.4% |
| $75,000 to $99,999 | 350 | 19.3% |
| $100,000 to $149,999 | 414 | 22.8% |
| $150,000 to $199,999 | 98 | 5.4% |
| $200,000+ | 251 | 13.8% |
Family Income by Famaliy Size in Kimberly
5-person families (180 | 9.9%) account for the highest median family income in Kimberly with $122,652 per family, while 2-person families (789 | 43.4%) have the highest median income of $39,568 per family member.
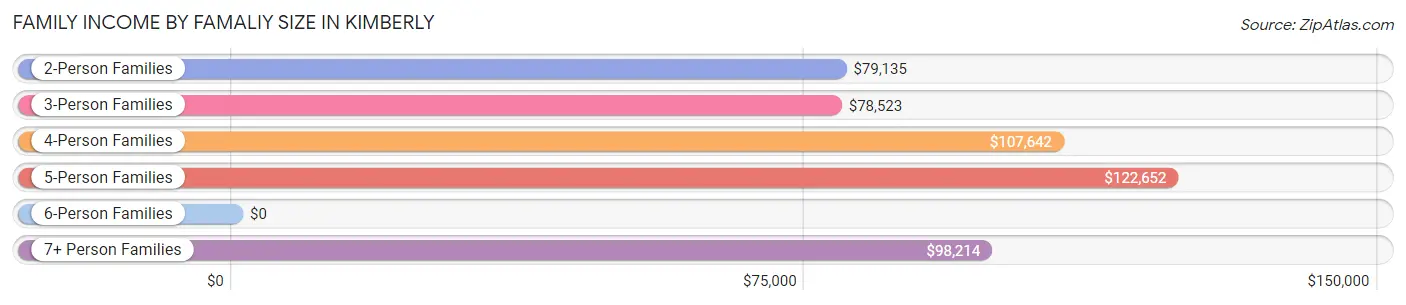
| Income Bracket | # Families | Median Income |
| 2-Person Families | 789 (43.4%) | $79,135 |
| 3-Person Families | 333 (18.3%) | $78,523 |
| 4-Person Families | 460 (25.3%) | $107,642 |
| 5-Person Families | 180 (9.9%) | $122,652 |
| 6-Person Families | 26 (1.4%) | $0 |
| 7+ Person Families | 28 (1.5%) | $98,214 |
| Total | 1,816 (100.0%) | $86,566 |
Family Income by Number of Earners in Kimberly
The median family income in Kimberly is $86,566, with families comprising 3+ earners (216) having the highest median family income of $134,375, while families with no earners (255) have the lowest median family income of $46,750, accounting for 11.9% and 14.0% of families, respectively.
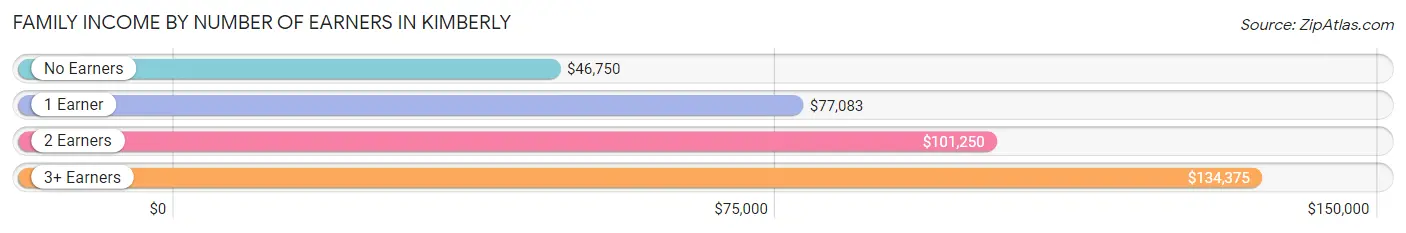
| Number of Earners | # Families | Median Income |
| No Earners | 255 (14.0%) | $46,750 |
| 1 Earner | 563 (31.0%) | $77,083 |
| 2 Earners | 782 (43.1%) | $101,250 |
| 3+ Earners | 216 (11.9%) | $134,375 |
| Total | 1,816 (100.0%) | $86,566 |
Household Income in Kimberly
Household Income Brackets in Kimberly
With 558 households falling in the category, the $50,000 to $74,999 income range is the most frequent in Kimberly, accounting for 18.7% of all households. In contrast, only 57 households (1.9%) fall into the $10,000 to $14,999 income bracket, making it the least populous group.
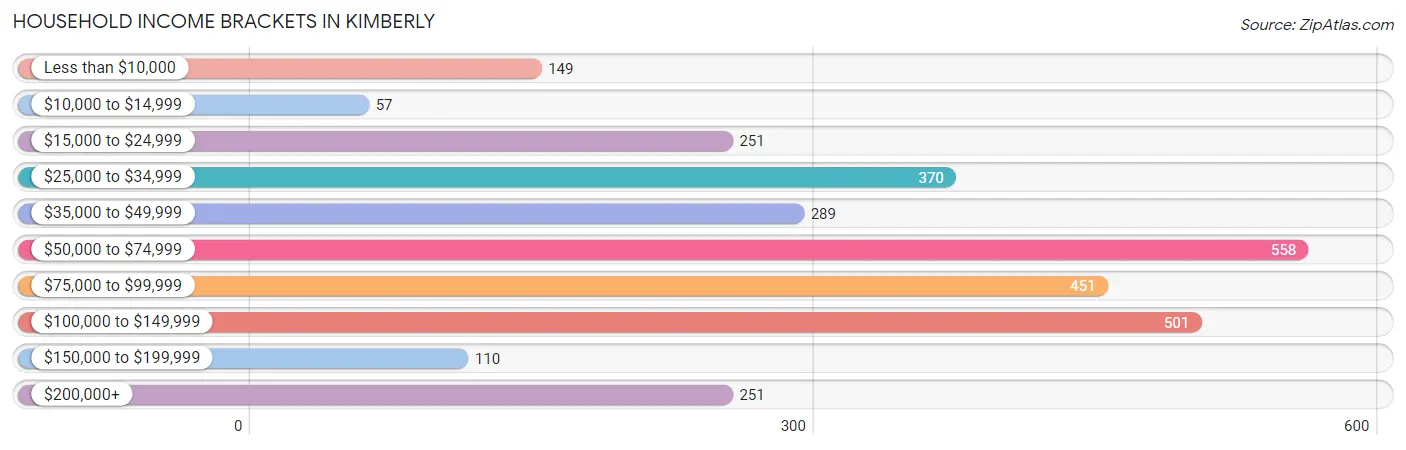
| Income Bracket | # Households | % Households |
| Less than $10,000 | 149 | 5.0% |
| $10,000 to $14,999 | 57 | 1.9% |
| $15,000 to $24,999 | 251 | 8.4% |
| $25,000 to $34,999 | 370 | 12.4% |
| $35,000 to $49,999 | 289 | 9.7% |
| $50,000 to $74,999 | 558 | 18.7% |
| $75,000 to $99,999 | 451 | 15.1% |
| $100,000 to $149,999 | 501 | 16.8% |
| $150,000 to $199,999 | 110 | 3.7% |
| $200,000+ | 251 | 8.4% |
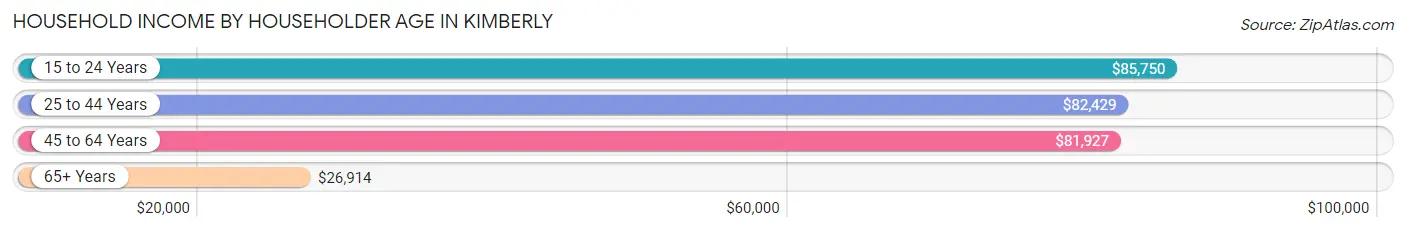
Household Income by Householder Age in Kimberly
The median household income in Kimberly is $65,061, with the highest median household income of $85,750 found in the 15 to 24 years age bracket for the primary householder. A total of 85 households (2.9%) fall into this category. Meanwhile, the 65+ years age bracket for the primary householder has the lowest median household income of $26,914, with 862 households (28.9%) in this group.
| Income Bracket | # Households | Median Income |
| 15 to 24 Years | 85 (2.9%) | $85,750 |
| 25 to 44 Years | 1,032 (34.6%) | $82,429 |
| 45 to 64 Years | 1,005 (33.7%) | $81,927 |
| 65+ Years | 862 (28.9%) | $26,914 |
| Total | 2,984 (100.0%) | $65,061 |
Poverty in Kimberly
Income Below Poverty by Sex and Age in Kimberly
With 7.7% poverty level for males and 10.7% for females among the residents of Kimberly, 75 year old and over males and under 5 year old females are the most vulnerable to poverty, with 46 males (19.3%) and 71 females (46.7%) in their respective age groups living below the poverty level.
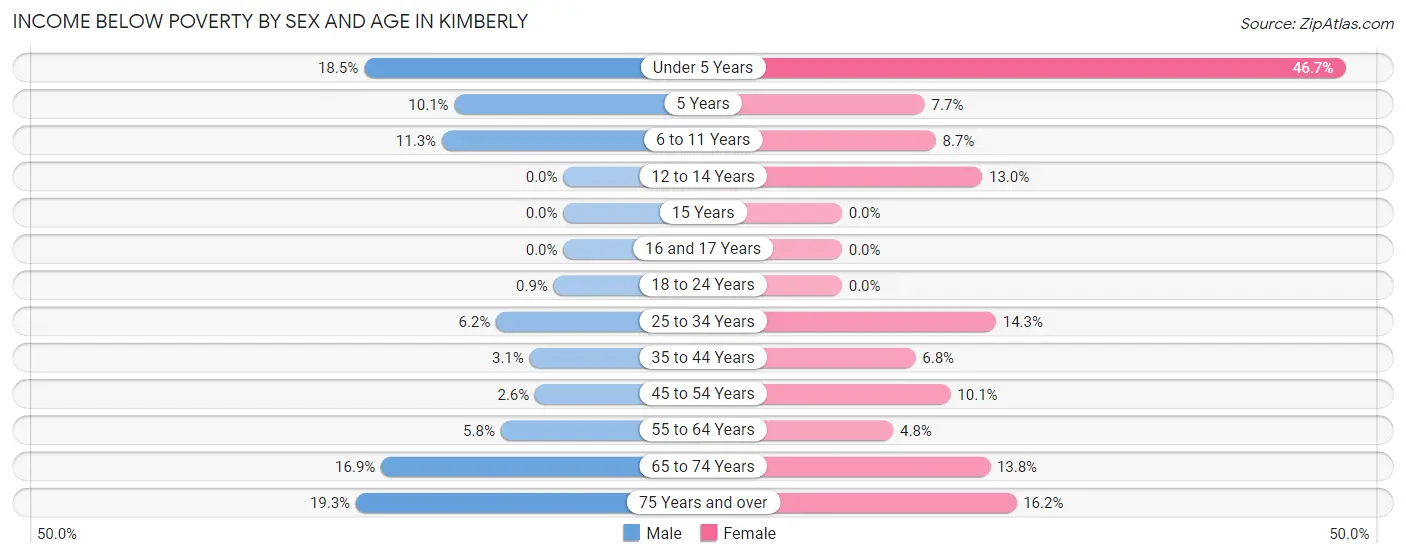
| Age Bracket | Male | Female |
| Under 5 Years | 47 (18.5%) | 71 (46.7%) |
| 5 Years | 9 (10.1%) | 8 (7.7%) |
| 6 to 11 Years | 54 (11.3%) | 26 (8.7%) |
| 12 to 14 Years | 0 (0.0%) | 22 (13.0%) |
| 15 Years | 0 (0.0%) | 0 (0.0%) |
| 16 and 17 Years | 0 (0.0%) | 0 (0.0%) |
| 18 to 24 Years | 2 (0.9%) | 0 (0.0%) |
| 25 to 34 Years | 33 (6.2%) | 54 (14.3%) |
| 35 to 44 Years | 16 (3.1%) | 37 (6.8%) |
| 45 to 54 Years | 8 (2.6%) | 37 (10.1%) |
| 55 to 64 Years | 31 (5.8%) | 32 (4.8%) |
| 65 to 74 Years | 35 (16.9%) | 55 (13.8%) |
| 75 Years and over | 46 (19.3%) | 45 (16.2%) |
| Total | 281 (7.7%) | 387 (10.7%) |
Income Above Poverty by Sex and Age in Kimberly
According to the poverty statistics in Kimberly, males aged 12 to 14 years and females aged 15 years are the age groups that are most secure financially, with 100.0% of males and 100.0% of females in these age groups living above the poverty line.
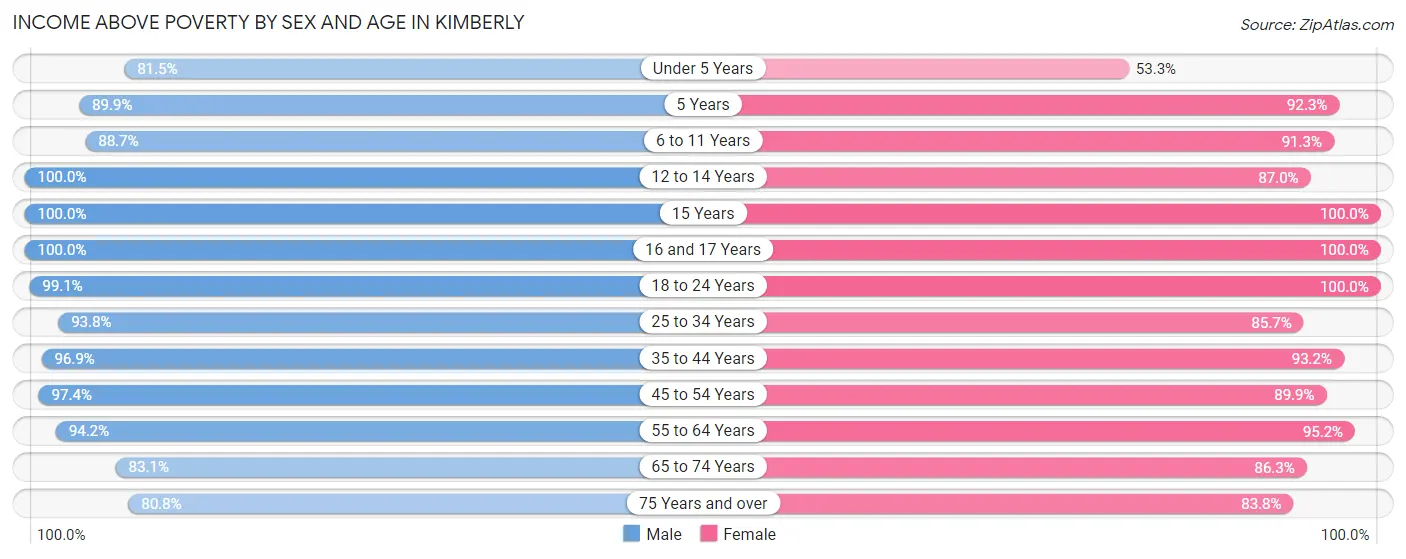
| Age Bracket | Male | Female |
| Under 5 Years | 207 (81.5%) | 81 (53.3%) |
| 5 Years | 80 (89.9%) | 96 (92.3%) |
| 6 to 11 Years | 425 (88.7%) | 273 (91.3%) |
| 12 to 14 Years | 211 (100.0%) | 147 (87.0%) |
| 15 Years | 65 (100.0%) | 11 (100.0%) |
| 16 and 17 Years | 10 (100.0%) | 97 (100.0%) |
| 18 to 24 Years | 219 (99.1%) | 138 (100.0%) |
| 25 to 34 Years | 496 (93.8%) | 324 (85.7%) |
| 35 to 44 Years | 495 (96.9%) | 505 (93.2%) |
| 45 to 54 Years | 297 (97.4%) | 330 (89.9%) |
| 55 to 64 Years | 503 (94.2%) | 640 (95.2%) |
| 65 to 74 Years | 172 (83.1%) | 345 (86.3%) |
| 75 Years and over | 193 (80.7%) | 233 (83.8%) |
| Total | 3,373 (92.3%) | 3,220 (89.3%) |
Income Below Poverty Among Married-Couple Families in Kimberly
The poverty statistics for married-couple families in Kimberly show that 5.9% or 88 of the total 1,505 families live below the poverty line. Families with 3 or 4 children have the highest poverty rate of 9.3%, comprising of 14 families. On the other hand, families with 5 or more children have the lowest poverty rate of 0.0%, which includes 0 families.
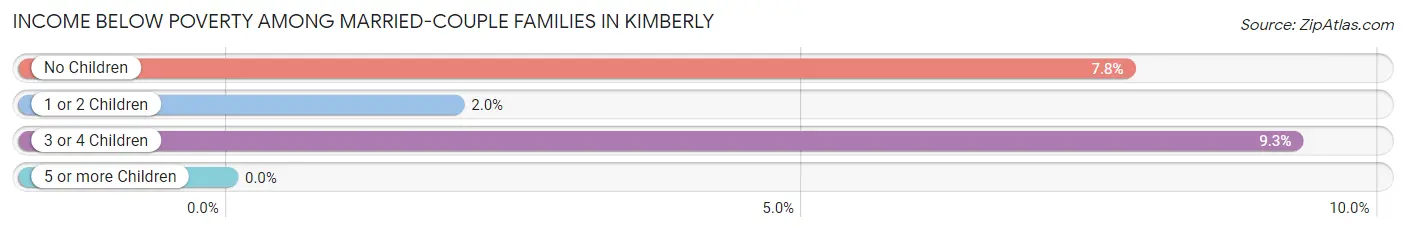
| Children | Above Poverty | Below Poverty |
| No Children | 755 (92.2%) | 64 (7.8%) |
| 1 or 2 Children | 497 (98.0%) | 10 (2.0%) |
| 3 or 4 Children | 137 (90.7%) | 14 (9.3%) |
| 5 or more Children | 28 (100.0%) | 0 (0.0%) |
| Total | 1,417 (94.2%) | 88 (5.9%) |
Income Below Poverty Among Single-Parent Households in Kimberly
According to the poverty data in Kimberly, 16.8% or 23 single-father households and 31.6% or 55 single-mother households are living below the poverty line. Among single-father households, those with 3 or 4 children have the highest poverty rate, with 12 households (66.7%) experiencing poverty. Likewise, among single-mother households, those with no children have the highest poverty rate, with 18 households (78.3%) falling below the poverty line.
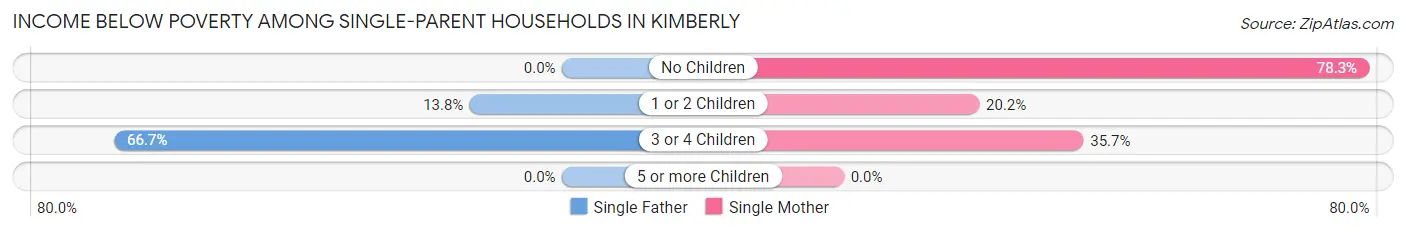
| Children | Single Father | Single Mother |
| No Children | 0 (0.0%) | 18 (78.3%) |
| 1 or 2 Children | 11 (13.8%) | 22 (20.2%) |
| 3 or 4 Children | 12 (66.7%) | 15 (35.7%) |
| 5 or more Children | 0 (0.0%) | 0 (0.0%) |
| Total | 23 (16.8%) | 55 (31.6%) |
Income Below Poverty Among Married-Couple vs Single-Parent Households in Kimberly
The poverty data for Kimberly shows that 88 of the married-couple family households (5.9%) and 78 of the single-parent households (25.1%) are living below the poverty level. Within the married-couple family households, those with 3 or 4 children have the highest poverty rate, with 14 households (9.3%) falling below the poverty line. Among the single-parent households, those with 3 or 4 children have the highest poverty rate, with 27 household (45.0%) living below poverty.
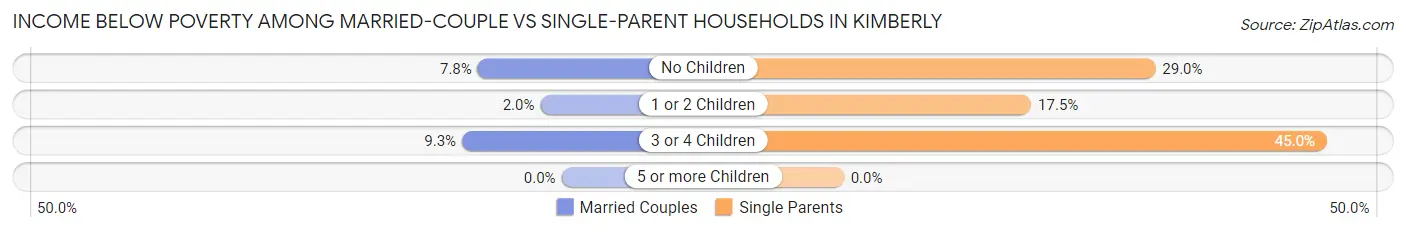
| Children | Married-Couple Families | Single-Parent Households |
| No Children | 64 (7.8%) | 18 (29.0%) |
| 1 or 2 Children | 10 (2.0%) | 33 (17.5%) |
| 3 or 4 Children | 14 (9.3%) | 27 (45.0%) |
| 5 or more Children | 0 (0.0%) | 0 (0.0%) |
| Total | 88 (5.9%) | 78 (25.1%) |
Race in Kimberly
The most populous races in Kimberly are White / Caucasian (6,492 | 88.6%), Two or more Races (447 | 6.1%), and Asian (357 | 4.9%).
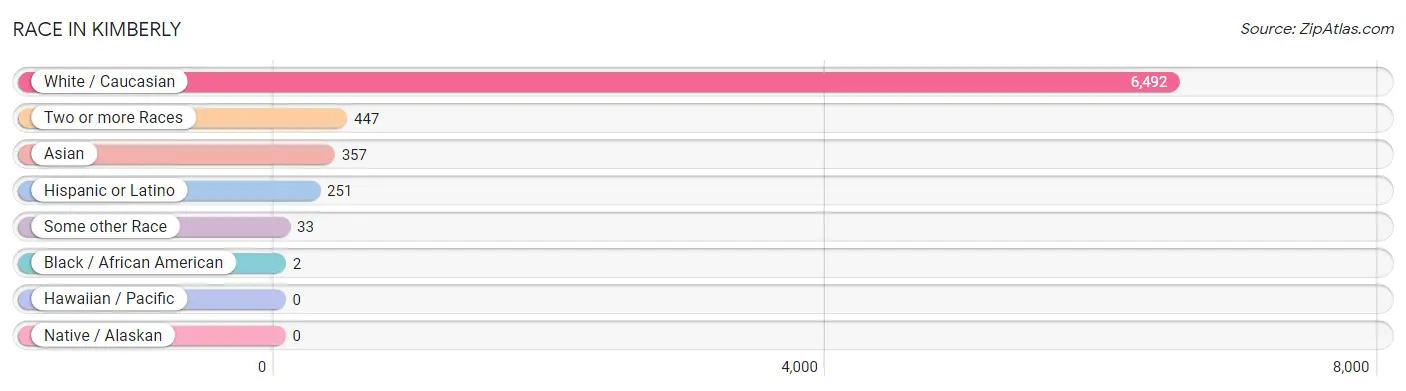
| Race | # Population | % Population |
| Asian | 357 | 4.9% |
| Black / African American | 2 | 0.0% |
| Hawaiian / Pacific | 0 | 0.0% |
| Hispanic or Latino | 251 | 3.4% |
| Native / Alaskan | 0 | 0.0% |
| White / Caucasian | 6,492 | 88.6% |
| Two or more Races | 447 | 6.1% |
| Some other Race | 33 | 0.4% |
| Total | 7,331 | 100.0% |
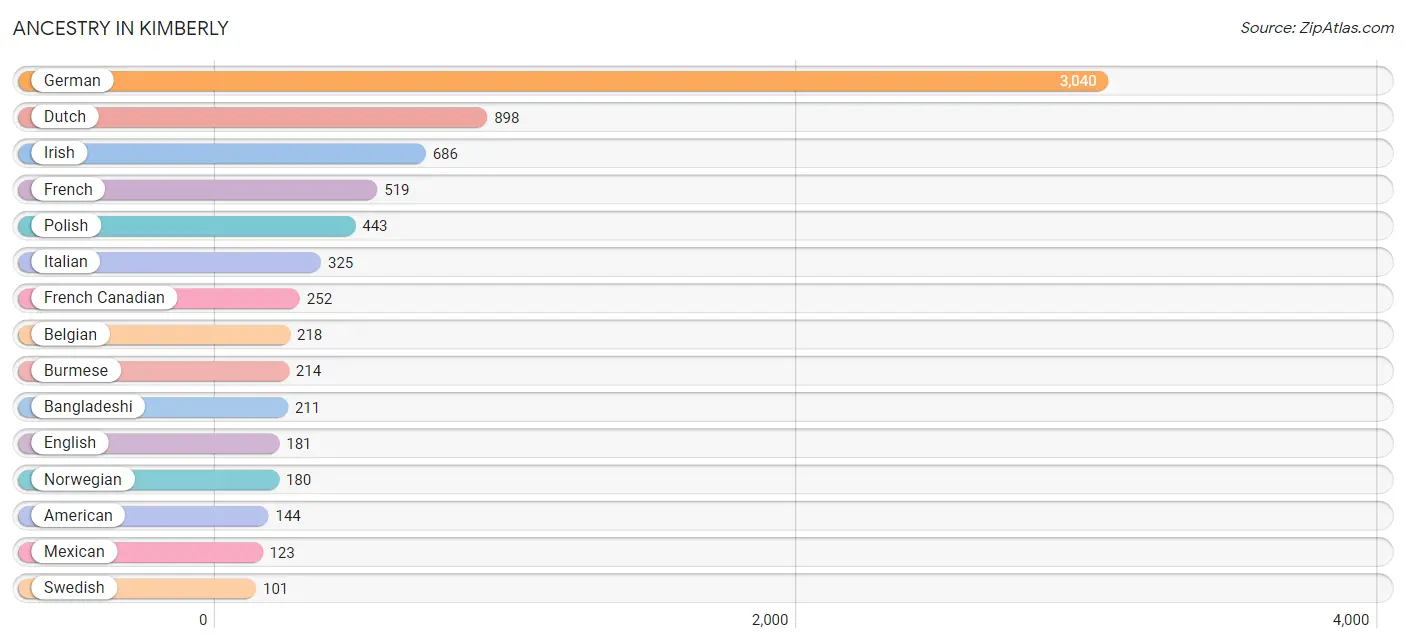
Ancestry in Kimberly
The most populous ancestries reported in Kimberly are German (3,040 | 41.5%), Dutch (898 | 12.2%), Irish (686 | 9.4%), French (519 | 7.1%), and Polish (443 | 6.0%), together accounting for 76.2% of all Kimberly residents.
| Ancestry | # Population | % Population |
| American | 144 | 2.0% |
| Austrian | 15 | 0.2% |
| Bangladeshi | 211 | 2.9% |
| Belgian | 218 | 3.0% |
| Bhutanese | 10 | 0.1% |
| Bulgarian | 14 | 0.2% |
| Burmese | 214 | 2.9% |
| Canadian | 10 | 0.1% |
| Central American | 49 | 0.7% |
| Cherokee | 76 | 1.0% |
| Chippewa | 71 | 1.0% |
| Choctaw | 71 | 1.0% |
| Croatian | 49 | 0.7% |
| Czech | 61 | 0.8% |
| Danish | 16 | 0.2% |
| Dutch | 898 | 12.2% |
| Eastern European | 95 | 1.3% |
| English | 181 | 2.5% |
| European | 48 | 0.6% |
| Finnish | 10 | 0.1% |
| French | 519 | 7.1% |
| French Canadian | 252 | 3.4% |
| German | 3,040 | 41.5% |
| Honduran | 10 | 0.1% |
| Hungarian | 15 | 0.2% |
| Indonesian | 36 | 0.5% |
| Irish | 686 | 9.4% |
| Iroquois | 17 | 0.2% |
| Italian | 325 | 4.4% |
| Lithuanian | 15 | 0.2% |
| Malaysian | 54 | 0.7% |
| Mexican | 123 | 1.7% |
| Norwegian | 180 | 2.5% |
| Polish | 443 | 6.0% |
| Puerto Rican | 44 | 0.6% |
| Russian | 9 | 0.1% |
| Salvadoran | 39 | 0.5% |
| Scandinavian | 41 | 0.6% |
| Scottish | 15 | 0.2% |
| Sri Lankan | 51 | 0.7% |
| Swedish | 101 | 1.4% |
| Ukrainian | 11 | 0.2% |
| Welsh | 27 | 0.4% |
| Yugoslavian | 15 | 0.2% | View All 44 Rows |
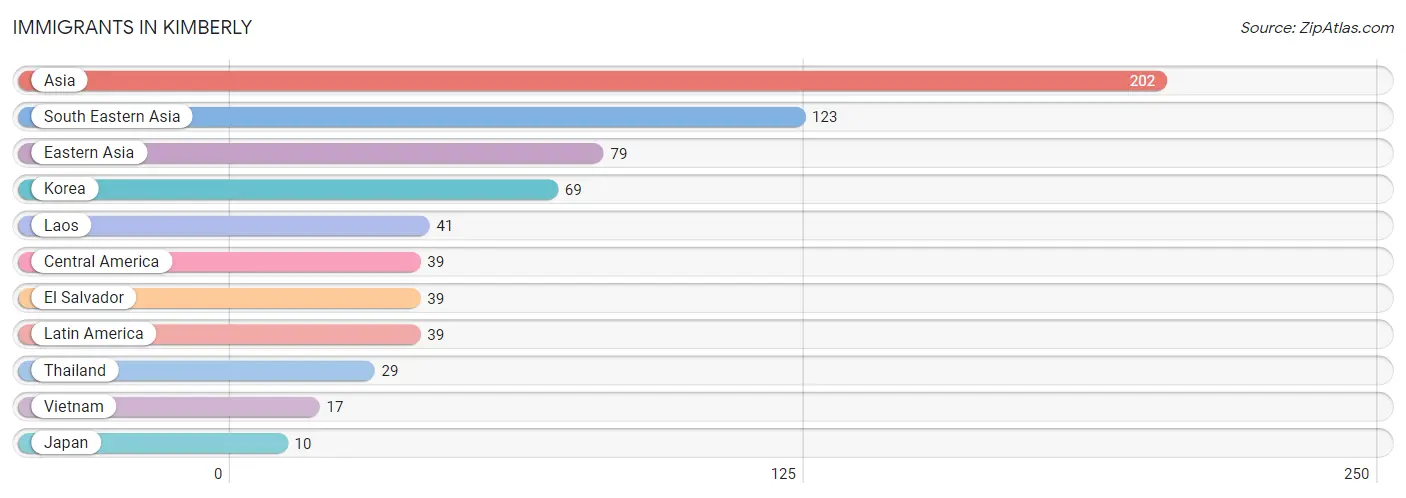
Immigrants in Kimberly
The most numerous immigrant groups reported in Kimberly came from Asia (202 | 2.8%), South Eastern Asia (123 | 1.7%), Eastern Asia (79 | 1.1%), Korea (69 | 0.9%), and Laos (41 | 0.6%), together accounting for 7.0% of all Kimberly residents.
| Immigration Origin | # Population | % Population |
| Asia | 202 | 2.8% |
| Central America | 39 | 0.5% |
| Eastern Asia | 79 | 1.1% |
| El Salvador | 39 | 0.5% |
| Japan | 10 | 0.1% |
| Korea | 69 | 0.9% |
| Laos | 41 | 0.6% |
| Latin America | 39 | 0.5% |
| South Eastern Asia | 123 | 1.7% |
| Thailand | 29 | 0.4% |
| Vietnam | 17 | 0.2% | View All 11 Rows |
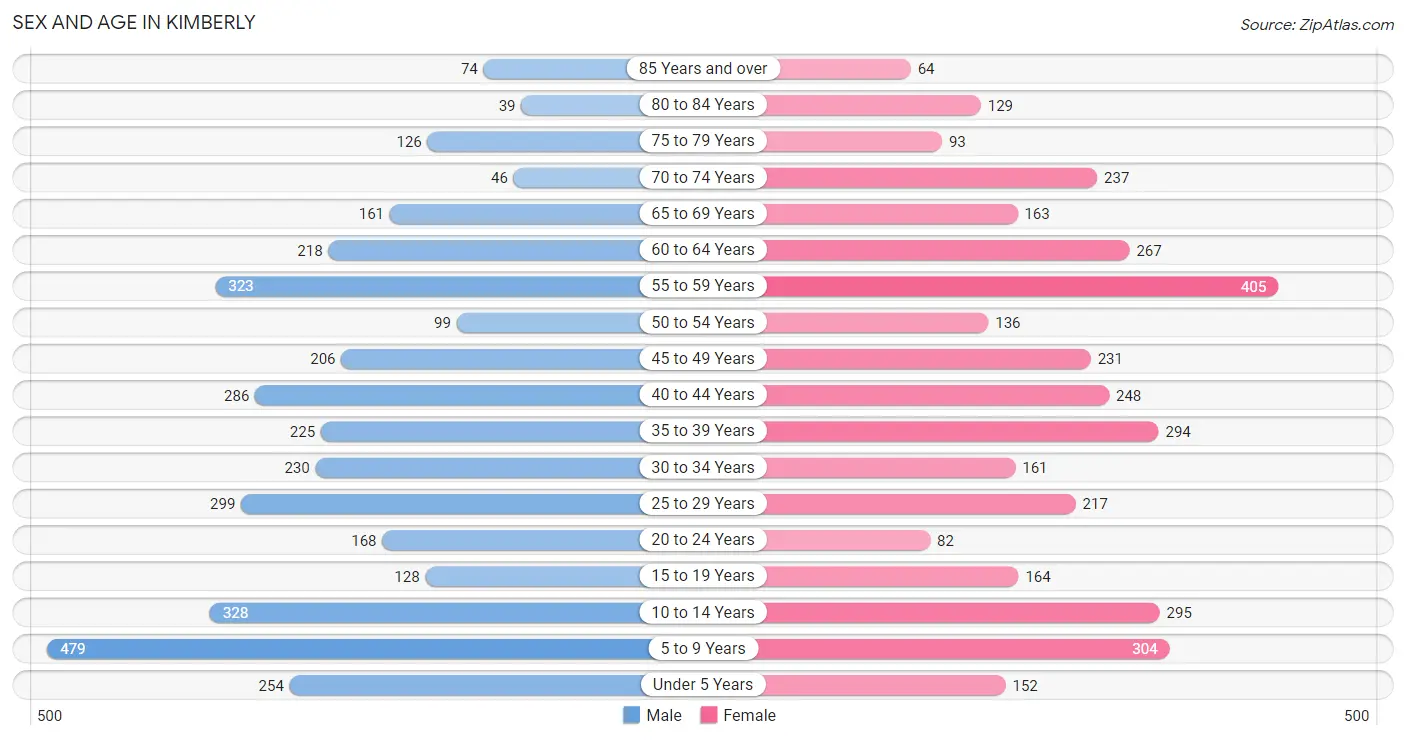
Sex and Age in Kimberly
Sex and Age in Kimberly
The most populous age groups in Kimberly are 5 to 9 Years (479 | 13.0%) for men and 55 to 59 Years (405 | 11.1%) for women.
| Age Bracket | Male | Female |
| Under 5 Years | 254 (6.9%) | 152 (4.2%) |
| 5 to 9 Years | 479 (13.0%) | 304 (8.4%) |
| 10 to 14 Years | 328 (8.9%) | 295 (8.1%) |
| 15 to 19 Years | 128 (3.5%) | 164 (4.5%) |
| 20 to 24 Years | 168 (4.5%) | 82 (2.2%) |
| 25 to 29 Years | 299 (8.1%) | 217 (6.0%) |
| 30 to 34 Years | 230 (6.2%) | 161 (4.4%) |
| 35 to 39 Years | 225 (6.1%) | 294 (8.1%) |
| 40 to 44 Years | 286 (7.7%) | 248 (6.8%) |
| 45 to 49 Years | 206 (5.6%) | 231 (6.3%) |
| 50 to 54 Years | 99 (2.7%) | 136 (3.7%) |
| 55 to 59 Years | 323 (8.8%) | 405 (11.1%) |
| 60 to 64 Years | 218 (5.9%) | 267 (7.3%) |
| 65 to 69 Years | 161 (4.4%) | 163 (4.5%) |
| 70 to 74 Years | 46 (1.3%) | 237 (6.5%) |
| 75 to 79 Years | 126 (3.4%) | 93 (2.5%) |
| 80 to 84 Years | 39 (1.1%) | 129 (3.5%) |
| 85 Years and over | 74 (2.0%) | 64 (1.8%) |
| Total | 3,689 (100.0%) | 3,642 (100.0%) |
Families and Households in Kimberly
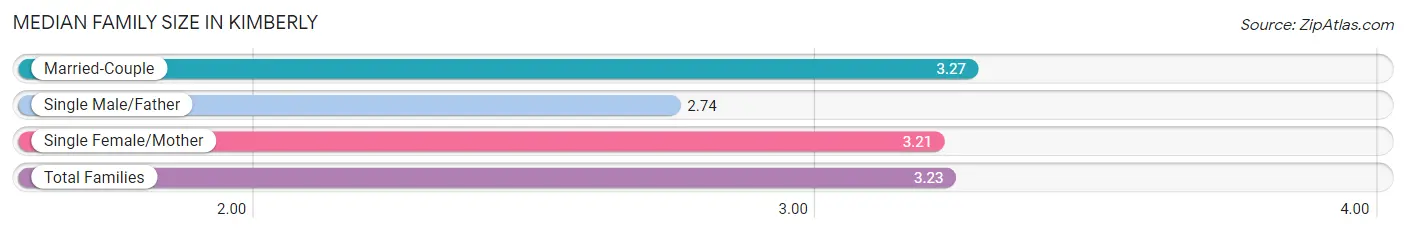
Median Family Size in Kimberly
The median family size in Kimberly is 3.23 persons per family, with married-couple families (1,505 | 82.9%) accounting for the largest median family size of 3.27 persons per family. On the other hand, single male/father families (137 | 7.5%) represent the smallest median family size with 2.74 persons per family.
| Family Type | # Families | Family Size |
| Married-Couple | 1,505 (82.9%) | 3.27 |
| Single Male/Father | 137 (7.5%) | 2.74 |
| Single Female/Mother | 174 (9.6%) | 3.21 |
| Total Families | 1,816 (100.0%) | 3.23 |
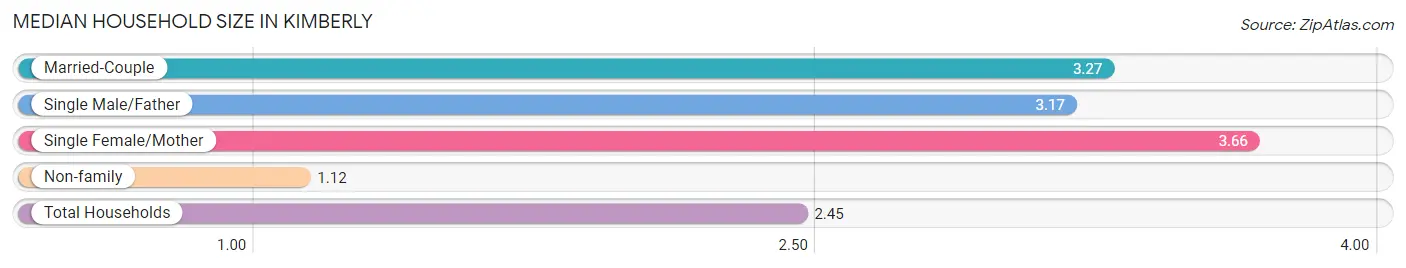
Median Household Size in Kimberly
The median household size in Kimberly is 2.45 persons per household, with single female/mother households (174 | 5.8%) accounting for the largest median household size of 3.66 persons per household. non-family households (1,168 | 39.1%) represent the smallest median household size with 1.12 persons per household.
| Household Type | # Households | Household Size |
| Married-Couple | 1,505 (50.4%) | 3.27 |
| Single Male/Father | 137 (4.6%) | 3.17 |
| Single Female/Mother | 174 (5.8%) | 3.66 |
| Non-family | 1,168 (39.1%) | 1.12 |
| Total Households | 2,984 (100.0%) | 2.45 |
Household Size by Marriage Status in Kimberly
Out of a total of 2,984 households in Kimberly, 1,816 (60.9%) are family households, while 1,168 (39.1%) are nonfamily households. The most numerous type of family households are 2-person households, comprising 766, and the most common type of nonfamily households are 1-person households, comprising 1,053.
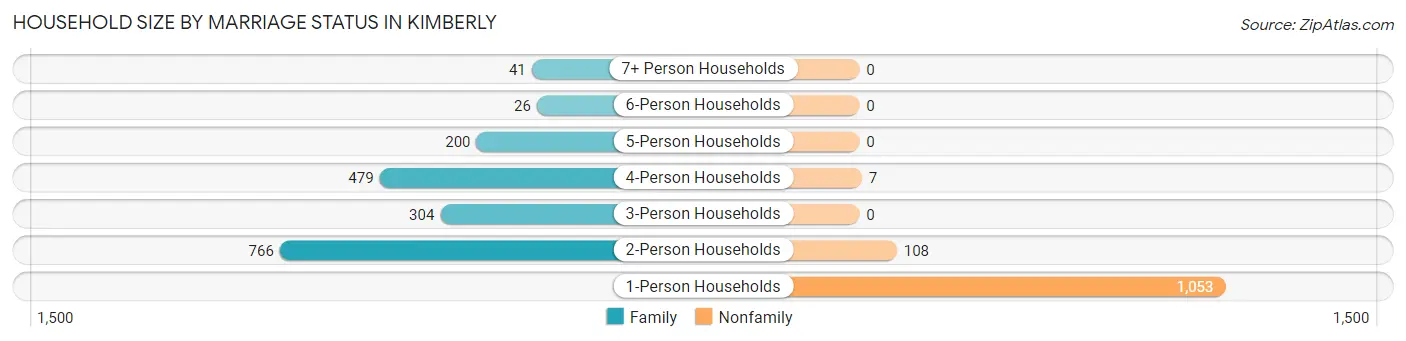
| Household Size | Family Households | Nonfamily Households |
| 1-Person Households | - | 1,053 (35.3%) |
| 2-Person Households | 766 (25.7%) | 108 (3.6%) |
| 3-Person Households | 304 (10.2%) | 0 (0.0%) |
| 4-Person Households | 479 (16.1%) | 7 (0.2%) |
| 5-Person Households | 200 (6.7%) | 0 (0.0%) |
| 6-Person Households | 26 (0.9%) | 0 (0.0%) |
| 7+ Person Households | 41 (1.4%) | 0 (0.0%) |
| Total | 1,816 (60.9%) | 1,168 (39.1%) |
Female Fertility in Kimberly
Fertility by Age in Kimberly
Average fertility rate in Kimberly is 53.0 births per 1,000 women. Women in the age bracket of 20 to 34 years have the highest fertility rate with 163.0 births per 1,000 women. Women in the age bracket of 20 to 34 years acount for 100.0% of all women with births.
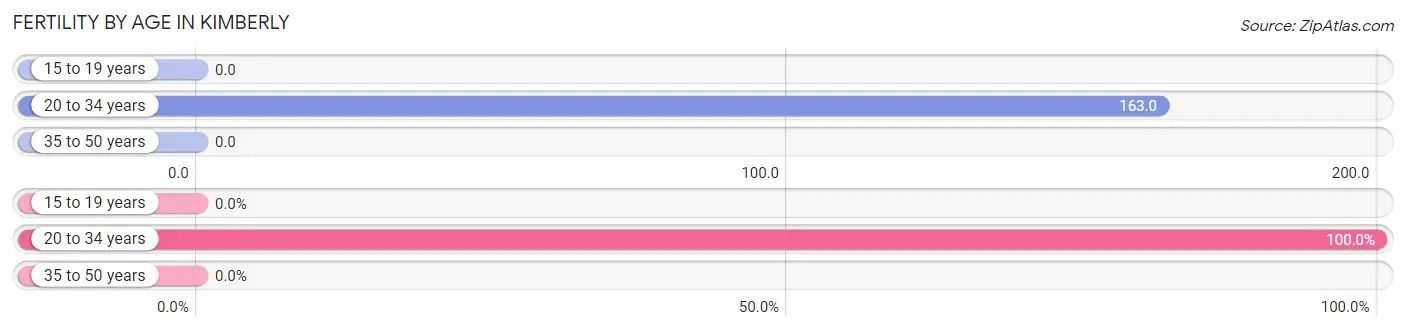
| Age Bracket | Women with Births | Births / 1,000 Women |
| 15 to 19 years | 0 (0.0%) | 0.0 |
| 20 to 34 years | 75 (100.0%) | 163.0 |
| 35 to 50 years | 0 (0.0%) | 0.0 |
| Total | 75 (100.0%) | 53.0 |
Fertility by Age by Marriage Status in Kimberly
85.3% of women with births (75) in Kimberly are married. The highest percentage of unmarried women with births falls into 20 to 34 years age bracket with 14.7% of them unmarried at the time of birth, while the lowest percentage of unmarried women with births belong to 20 to 34 years age bracket with 14.7% of them unmarried.
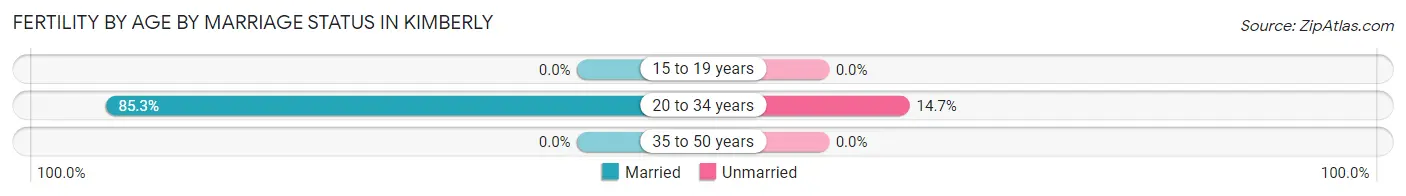
| Age Bracket | Married | Unmarried |
| 15 to 19 years | 0 (0.0%) | 0 (0.0%) |
| 20 to 34 years | 64 (85.3%) | 11 (14.7%) |
| 35 to 50 years | 0 (0.0%) | 0 (0.0%) |
| Total | 64 (85.3%) | 11 (14.7%) |
Fertility by Education in Kimberly
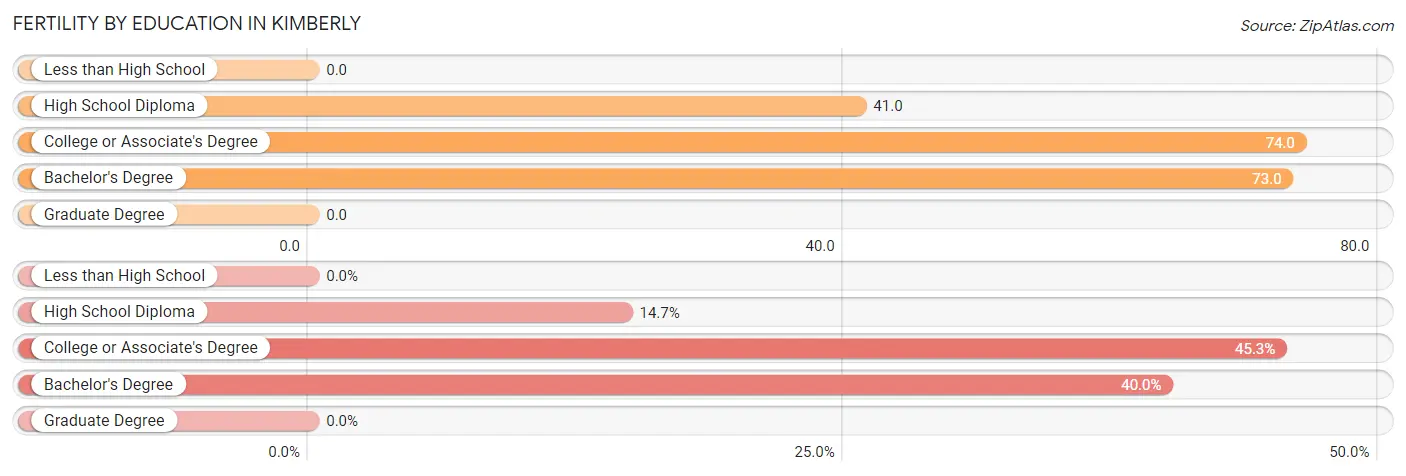
| Educational Attainment | Women with Births | Births / 1,000 Women |
| Less than High School | 0 (0.0%) | 0.0 |
| High School Diploma | 11 (14.7%) | 41.0 |
| College or Associate's Degree | 34 (45.3%) | 74.0 |
| Bachelor's Degree | 30 (40.0%) | 73.0 |
| Graduate Degree | 0 (0.0%) | 0.0 |
| Total | 75 (100.0%) | 53.0 |
Fertility by Education by Marriage Status in Kimberly
14.7% of women with births in Kimberly are unmarried. Women with the educational attainment of college or associate's degree are most likely to be married with 100.0% of them married at childbirth, while women with the educational attainment of high school diploma are least likely to be married with 100.0% of them unmarried at childbirth.
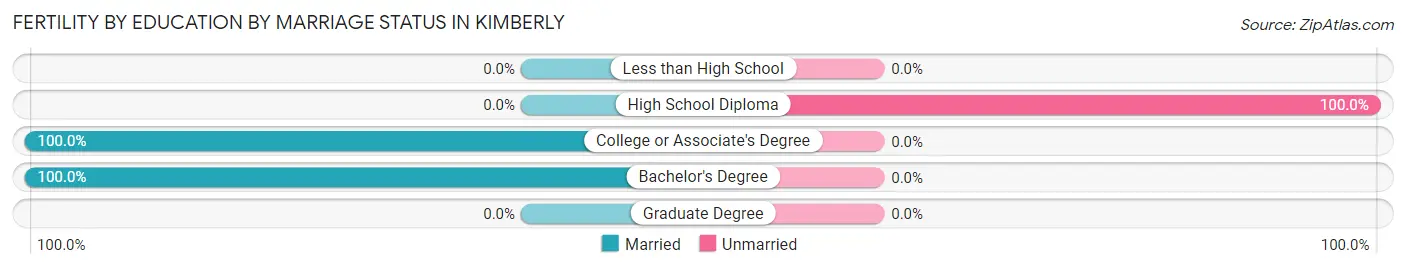
| Educational Attainment | Married | Unmarried |
| Less than High School | 0 (0.0%) | 0 (0.0%) |
| High School Diploma | 0 (0.0%) | 11 (100.0%) |
| College or Associate's Degree | 34 (100.0%) | 0 (0.0%) |
| Bachelor's Degree | 30 (100.0%) | 0 (0.0%) |
| Graduate Degree | 0 (0.0%) | 0 (0.0%) |
| Total | 64 (85.3%) | 11 (14.7%) |
Employment Characteristics in Kimberly
Employment by Class of Employer in Kimberly
Among the 3,287 employed individuals in Kimberly, private company employees (2,528 | 76.9%), local government employees (267 | 8.1%), and not-for-profit organizations (207 | 6.3%) make up the most common classes of employment.
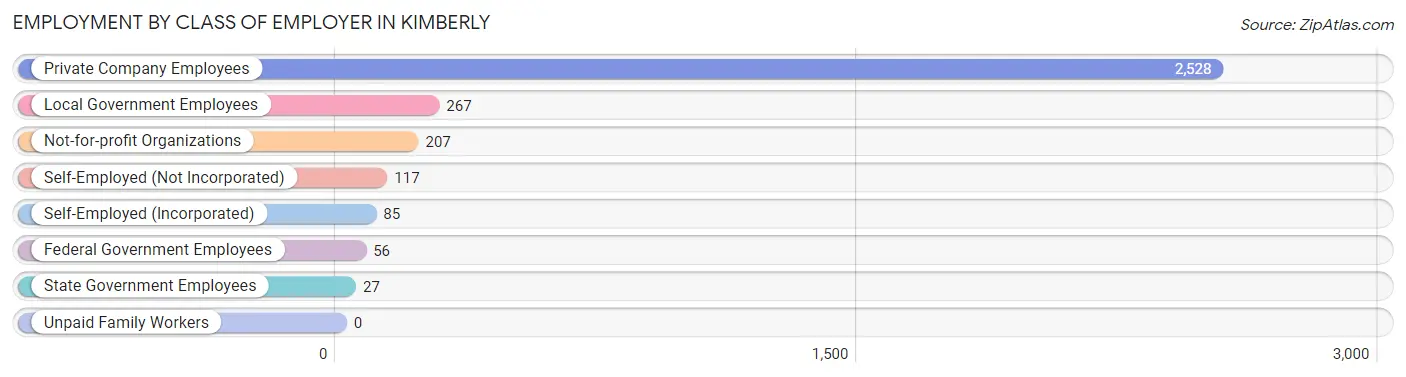
| Employer Class | # Employees | % Employees |
| Private Company Employees | 2,528 | 76.9% |
| Self-Employed (Incorporated) | 85 | 2.6% |
| Self-Employed (Not Incorporated) | 117 | 3.6% |
| Not-for-profit Organizations | 207 | 6.3% |
| Local Government Employees | 267 | 8.1% |
| State Government Employees | 27 | 0.8% |
| Federal Government Employees | 56 | 1.7% |
| Unpaid Family Workers | 0 | 0.0% |
| Total | 3,287 | 100.0% |
Employment Status by Age in Kimberly
According to the labor force statistics for Kimberly, out of the total population over 16 years of age (5,443), 64.5% or 3,511 individuals are in the labor force, with 5.1% or 179 of them unemployed. The age group with the highest labor force participation rate is 20 to 24 years, with 91.6% or 229 individuals in the labor force. Within the labor force, the 65 to 74 years age range has the highest percentage of unemployed individuals, with 15.5% or 11 of them being unemployed.
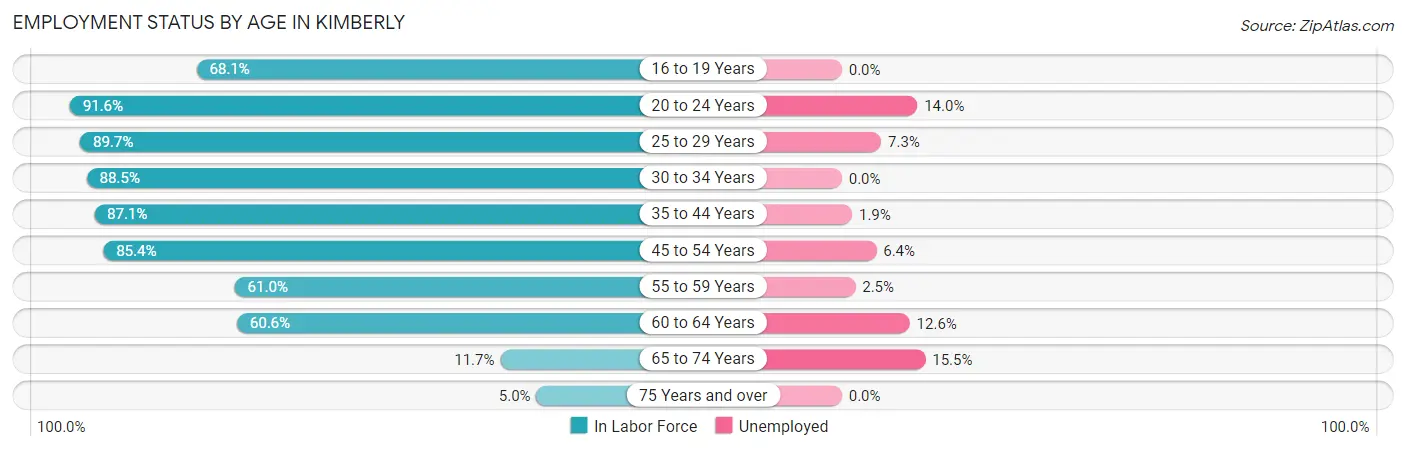
| Age Bracket | In Labor Force | Unemployed |
| 16 to 19 Years | 147 (68.1%) | 0 (0.0%) |
| 20 to 24 Years | 229 (91.6%) | 32 (14.0%) |
| 25 to 29 Years | 463 (89.7%) | 34 (7.3%) |
| 30 to 34 Years | 346 (88.5%) | 0 (0.0%) |
| 35 to 44 Years | 917 (87.1%) | 17 (1.9%) |
| 45 to 54 Years | 574 (85.4%) | 37 (6.4%) |
| 55 to 59 Years | 444 (61.0%) | 11 (2.5%) |
| 60 to 64 Years | 294 (60.6%) | 37 (12.6%) |
| 65 to 74 Years | 71 (11.7%) | 11 (15.5%) |
| 75 Years and over | 26 (5.0%) | 0 (0.0%) |
| Total | 3,511 (64.5%) | 179 (5.1%) |
Employment Status by Educational Attainment in Kimberly
According to labor force statistics for Kimberly, 79.0% of individuals (3,038) out of the total population between 25 and 64 years of age (3,845) are in the labor force, with 4.5% or 137 of them being unemployed. The group with the highest labor force participation rate are those with the educational attainment of college / associate degree, with 87.2% or 1,127 individuals in the labor force. Within the labor force, individuals with less than high school education have the highest percentage of unemployment, with 11.7% or 11 of them being unemployed.
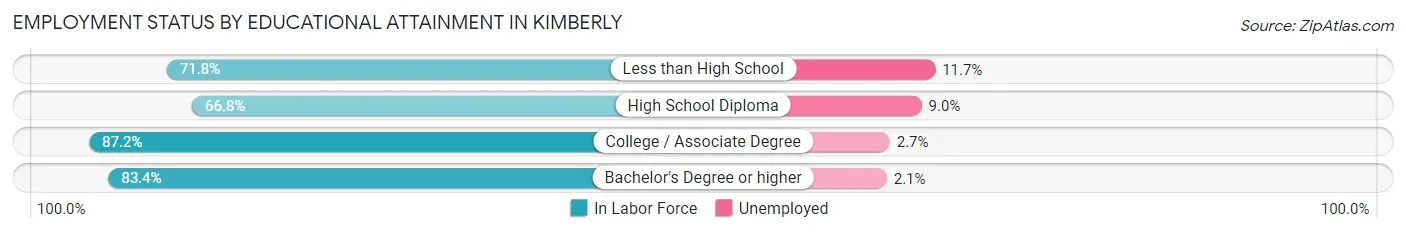
| Educational Attainment | In Labor Force | Unemployed |
| Less than High School | 94 (71.8%) | 15 (11.7%) |
| High School Diploma | 820 (66.8%) | 110 (9.0%) |
| College / Associate Degree | 1,127 (87.2%) | 35 (2.7%) |
| Bachelor's Degree or higher | 997 (83.4%) | 25 (2.1%) |
| Total | 3,038 (79.0%) | 173 (4.5%) |
Employment Occupations by Sex in Kimberly
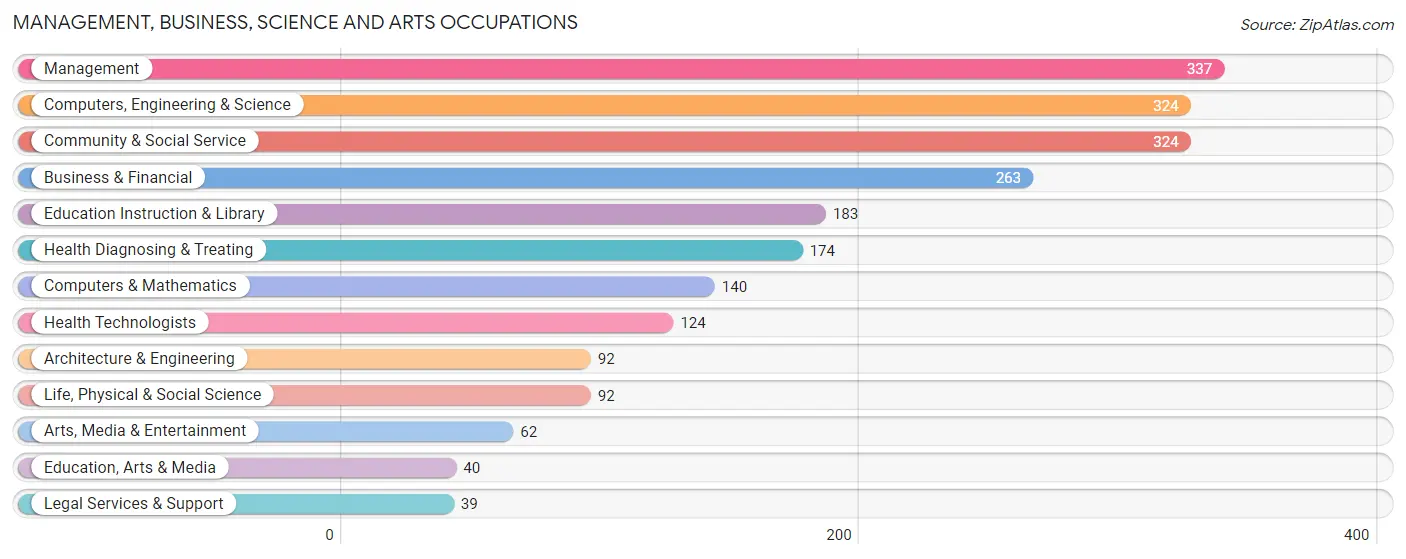
Management, Business, Science and Arts Occupations
The most common Management, Business, Science and Arts occupations in Kimberly are Management (337 | 10.1%), Computers, Engineering & Science (324 | 9.7%), Community & Social Service (324 | 9.7%), Business & Financial (263 | 7.9%), and Education Instruction & Library (183 | 5.5%).
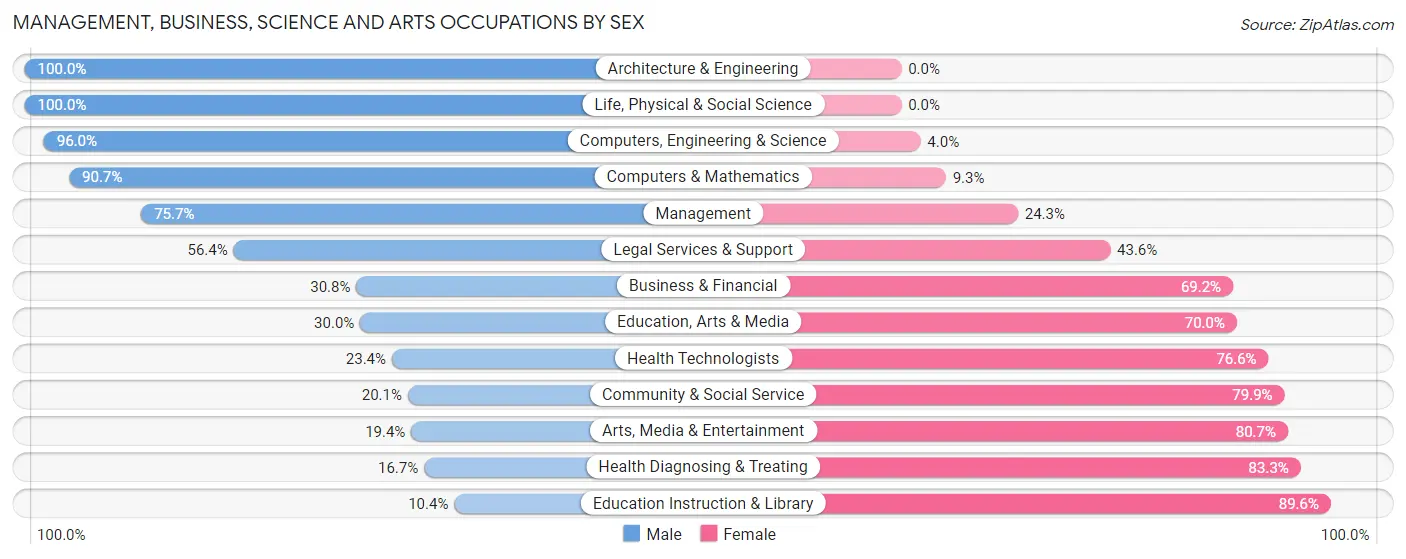
Management, Business, Science and Arts Occupations by Sex
Within the Management, Business, Science and Arts occupations in Kimberly, the most male-oriented occupations are Architecture & Engineering (100.0%), Life, Physical & Social Science (100.0%), and Computers, Engineering & Science (96.0%), while the most female-oriented occupations are Education Instruction & Library (89.6%), Health Diagnosing & Treating (83.3%), and Arts, Media & Entertainment (80.6%).
| Occupation | Male | Female |
| Management | 255 (75.7%) | 82 (24.3%) |
| Business & Financial | 81 (30.8%) | 182 (69.2%) |
| Computers, Engineering & Science | 311 (96.0%) | 13 (4.0%) |
| Computers & Mathematics | 127 (90.7%) | 13 (9.3%) |
| Architecture & Engineering | 92 (100.0%) | 0 (0.0%) |
| Life, Physical & Social Science | 92 (100.0%) | 0 (0.0%) |
| Community & Social Service | 65 (20.1%) | 259 (79.9%) |
| Education, Arts & Media | 12 (30.0%) | 28 (70.0%) |
| Legal Services & Support | 22 (56.4%) | 17 (43.6%) |
| Education Instruction & Library | 19 (10.4%) | 164 (89.6%) |
| Arts, Media & Entertainment | 12 (19.4%) | 50 (80.6%) |
| Health Diagnosing & Treating | 29 (16.7%) | 145 (83.3%) |
| Health Technologists | 29 (23.4%) | 95 (76.6%) |
| Total (Category) | 741 (52.1%) | 681 (47.9%) |
| Total (Overall) | 1,921 (57.7%) | 1,411 (42.3%) |
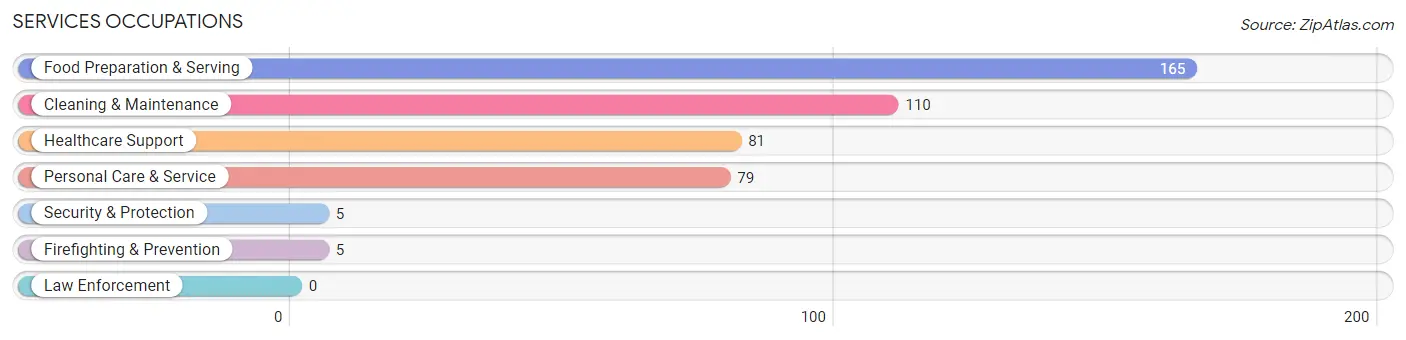
Services Occupations
The most common Services occupations in Kimberly are Food Preparation & Serving (165 | 5.0%), Cleaning & Maintenance (110 | 3.3%), Healthcare Support (81 | 2.4%), Personal Care & Service (79 | 2.4%), and Security & Protection (5 | 0.2%).
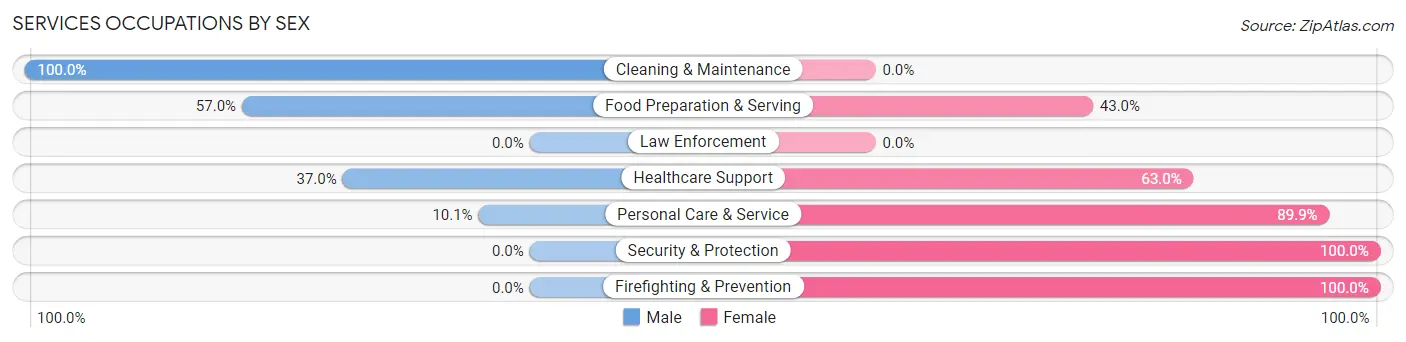
Services Occupations by Sex
Within the Services occupations in Kimberly, the most male-oriented occupations are Cleaning & Maintenance (100.0%), Food Preparation & Serving (57.0%), and Healthcare Support (37.0%), while the most female-oriented occupations are Security & Protection (100.0%), Firefighting & Prevention (100.0%), and Personal Care & Service (89.9%).
| Occupation | Male | Female |
| Healthcare Support | 30 (37.0%) | 51 (63.0%) |
| Security & Protection | 0 (0.0%) | 5 (100.0%) |
| Firefighting & Prevention | 0 (0.0%) | 5 (100.0%) |
| Law Enforcement | 0 (0.0%) | 0 (0.0%) |
| Food Preparation & Serving | 94 (57.0%) | 71 (43.0%) |
| Cleaning & Maintenance | 110 (100.0%) | 0 (0.0%) |
| Personal Care & Service | 8 (10.1%) | 71 (89.9%) |
| Total (Category) | 242 (55.0%) | 198 (45.0%) |
| Total (Overall) | 1,921 (57.7%) | 1,411 (42.3%) |
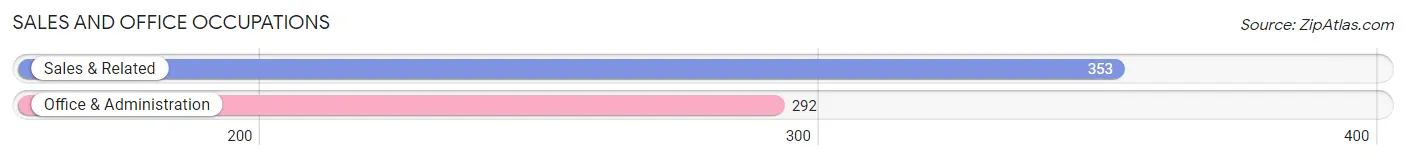
Sales and Office Occupations
The most common Sales and Office occupations in Kimberly are Sales & Related (353 | 10.6%), and Office & Administration (292 | 8.8%).
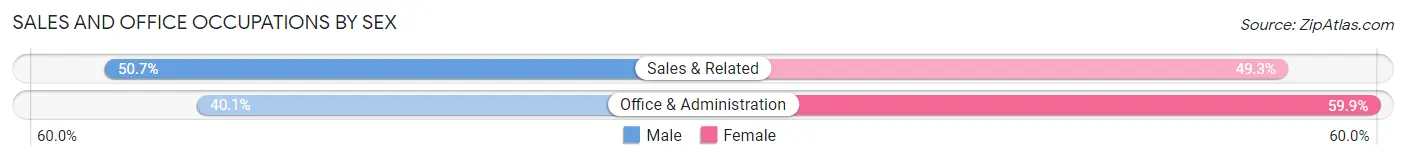
Sales and Office Occupations by Sex
| Occupation | Male | Female |
| Sales & Related | 179 (50.7%) | 174 (49.3%) |
| Office & Administration | 117 (40.1%) | 175 (59.9%) |
| Total (Category) | 296 (45.9%) | 349 (54.1%) |
| Total (Overall) | 1,921 (57.7%) | 1,411 (42.3%) |
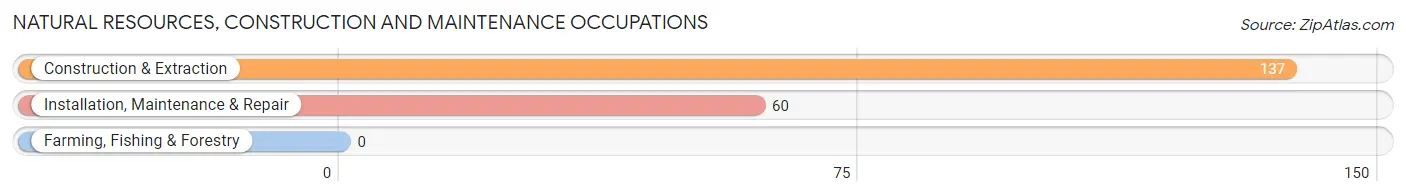
Natural Resources, Construction and Maintenance Occupations
The most common Natural Resources, Construction and Maintenance occupations in Kimberly are Construction & Extraction (137 | 4.1%), and Installation, Maintenance & Repair (60 | 1.8%).
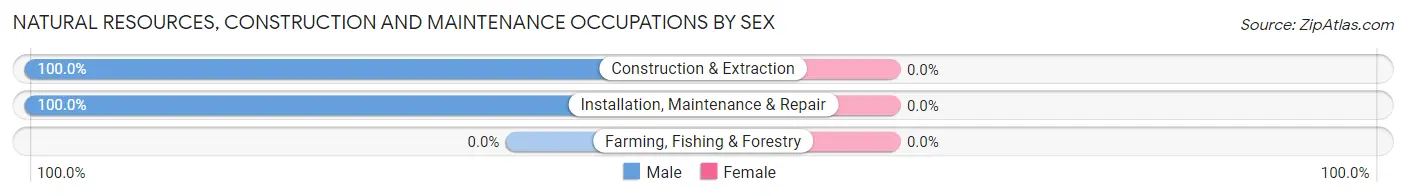
Natural Resources, Construction and Maintenance Occupations by Sex
| Occupation | Male | Female |
| Farming, Fishing & Forestry | 0 (0.0%) | 0 (0.0%) |
| Construction & Extraction | 137 (100.0%) | 0 (0.0%) |
| Installation, Maintenance & Repair | 60 (100.0%) | 0 (0.0%) |
| Total (Category) | 197 (100.0%) | 0 (0.0%) |
| Total (Overall) | 1,921 (57.7%) | 1,411 (42.3%) |
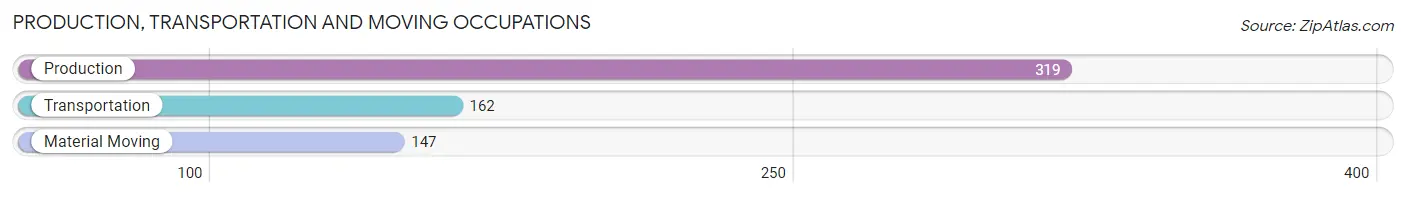
Production, Transportation and Moving Occupations
The most common Production, Transportation and Moving occupations in Kimberly are Production (319 | 9.6%), Transportation (162 | 4.9%), and Material Moving (147 | 4.4%).
Production, Transportation and Moving Occupations by Sex
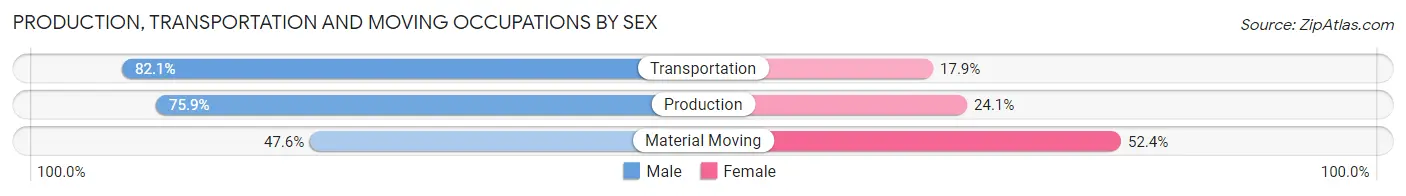
| Occupation | Male | Female |
| Production | 242 (75.9%) | 77 (24.1%) |
| Transportation | 133 (82.1%) | 29 (17.9%) |
| Material Moving | 70 (47.6%) | 77 (52.4%) |
| Total (Category) | 445 (70.9%) | 183 (29.1%) |
| Total (Overall) | 1,921 (57.7%) | 1,411 (42.3%) |
Employment Industries by Sex in Kimberly
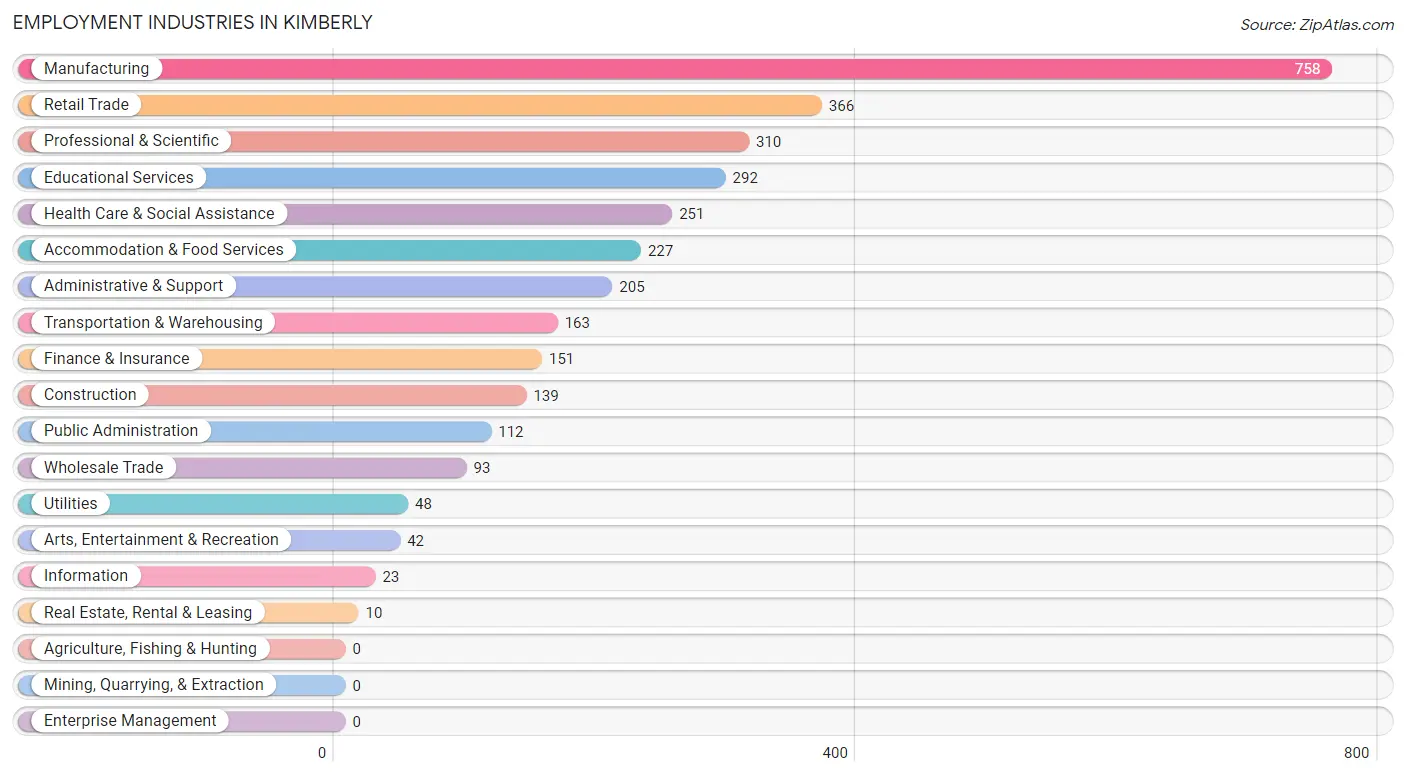
Employment Industries in Kimberly
The major employment industries in Kimberly include Manufacturing (758 | 22.8%), Retail Trade (366 | 11.0%), Professional & Scientific (310 | 9.3%), Educational Services (292 | 8.8%), and Health Care & Social Assistance (251 | 7.5%).
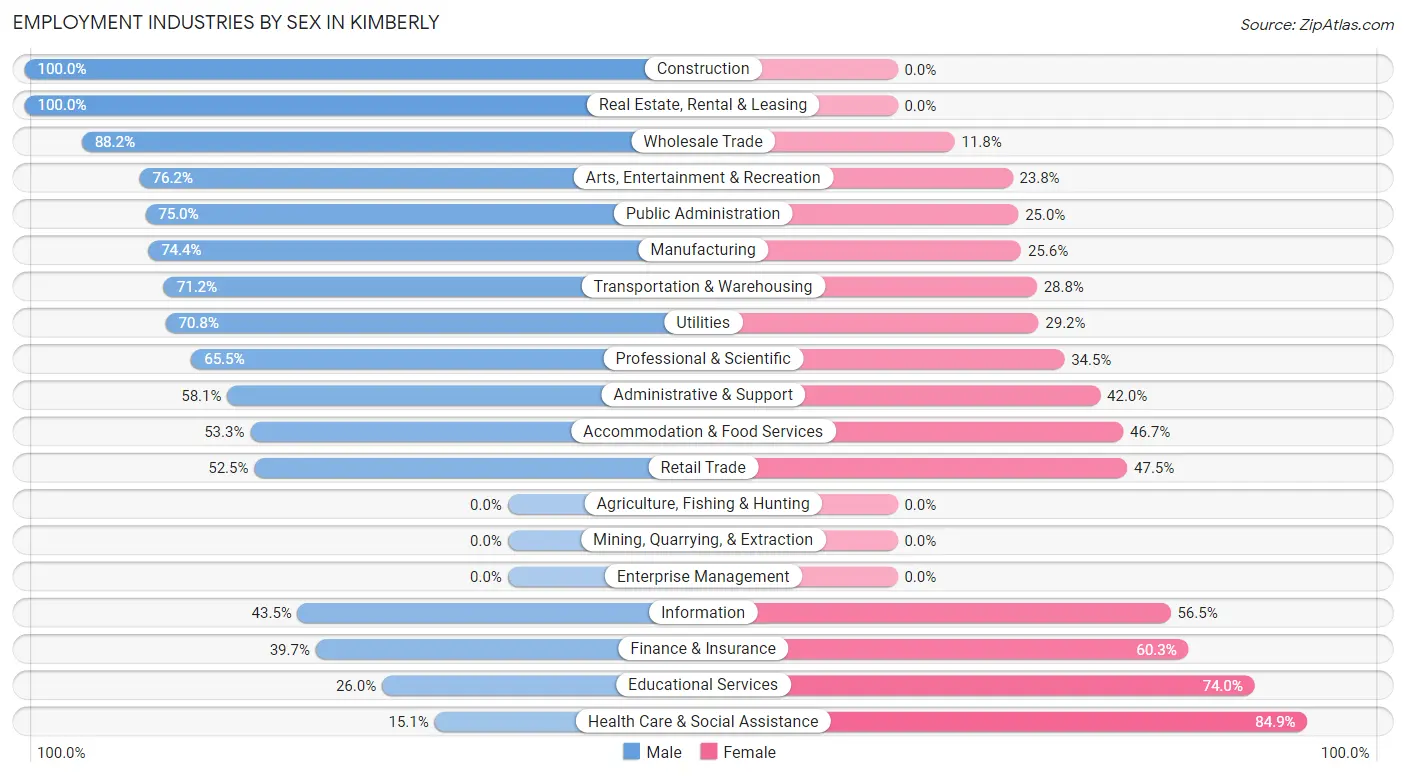
Employment Industries by Sex in Kimberly
The Kimberly industries that see more men than women are Construction (100.0%), Real Estate, Rental & Leasing (100.0%), and Wholesale Trade (88.2%), whereas the industries that tend to have a higher number of women are Health Care & Social Assistance (84.9%), Educational Services (74.0%), and Finance & Insurance (60.3%).
| Industry | Male | Female |
| Agriculture, Fishing & Hunting | 0 (0.0%) | 0 (0.0%) |
| Mining, Quarrying, & Extraction | 0 (0.0%) | 0 (0.0%) |
| Construction | 139 (100.0%) | 0 (0.0%) |
| Manufacturing | 564 (74.4%) | 194 (25.6%) |
| Wholesale Trade | 82 (88.2%) | 11 (11.8%) |
| Retail Trade | 192 (52.5%) | 174 (47.5%) |
| Transportation & Warehousing | 116 (71.2%) | 47 (28.8%) |
| Utilities | 34 (70.8%) | 14 (29.2%) |
| Information | 10 (43.5%) | 13 (56.5%) |
| Finance & Insurance | 60 (39.7%) | 91 (60.3%) |
| Real Estate, Rental & Leasing | 10 (100.0%) | 0 (0.0%) |
| Professional & Scientific | 203 (65.5%) | 107 (34.5%) |
| Enterprise Management | 0 (0.0%) | 0 (0.0%) |
| Administrative & Support | 119 (58.1%) | 86 (41.9%) |
| Educational Services | 76 (26.0%) | 216 (74.0%) |
| Health Care & Social Assistance | 38 (15.1%) | 213 (84.9%) |
| Arts, Entertainment & Recreation | 32 (76.2%) | 10 (23.8%) |
| Accommodation & Food Services | 121 (53.3%) | 106 (46.7%) |
| Public Administration | 84 (75.0%) | 28 (25.0%) |
| Total | 1,921 (57.7%) | 1,411 (42.3%) |
Education in Kimberly
School Enrollment in Kimberly
The most common levels of schooling among the 1,940 students in Kimberly are elementary school (591 | 30.5%), middle school (479 | 24.7%), and high school (304 | 15.7%).
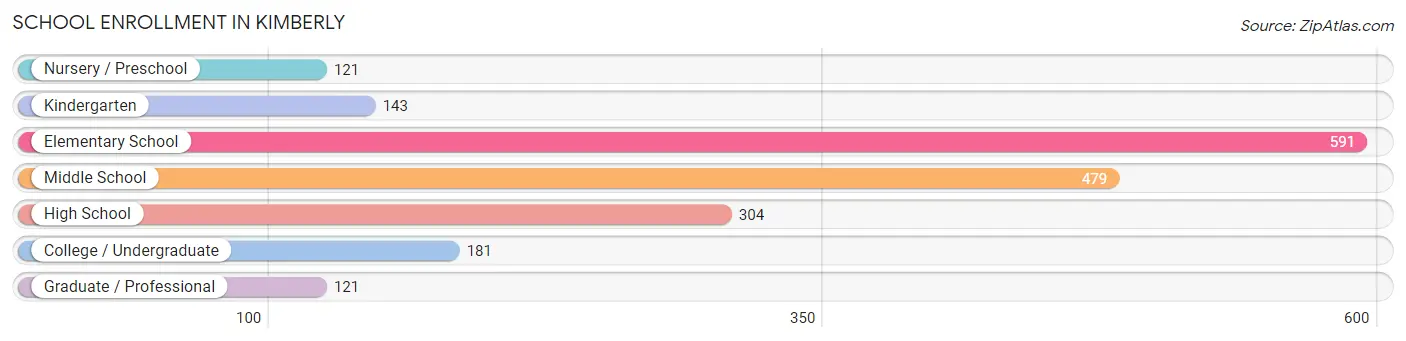
| School Level | # Students | % Students |
| Nursery / Preschool | 121 | 6.2% |
| Kindergarten | 143 | 7.4% |
| Elementary School | 591 | 30.5% |
| Middle School | 479 | 24.7% |
| High School | 304 | 15.7% |
| College / Undergraduate | 181 | 9.3% |
| Graduate / Professional | 121 | 6.2% |
| Total | 1,940 | 100.0% |
School Enrollment by Age by Funding Source in Kimberly
Out of a total of 1,940 students who are enrolled in schools in Kimberly, 111 (5.7%) attend a private institution, while the remaining 1,829 (94.3%) are enrolled in public schools. The age group of 3 to 4 year olds has the highest likelihood of being enrolled in private schools, with 21 (39.6% in the age bracket) enrolled. Conversely, the age group of 20 to 24 year olds has the lowest likelihood of being enrolled in a private school, with 77 (100.0% in the age bracket) attending a public institution.
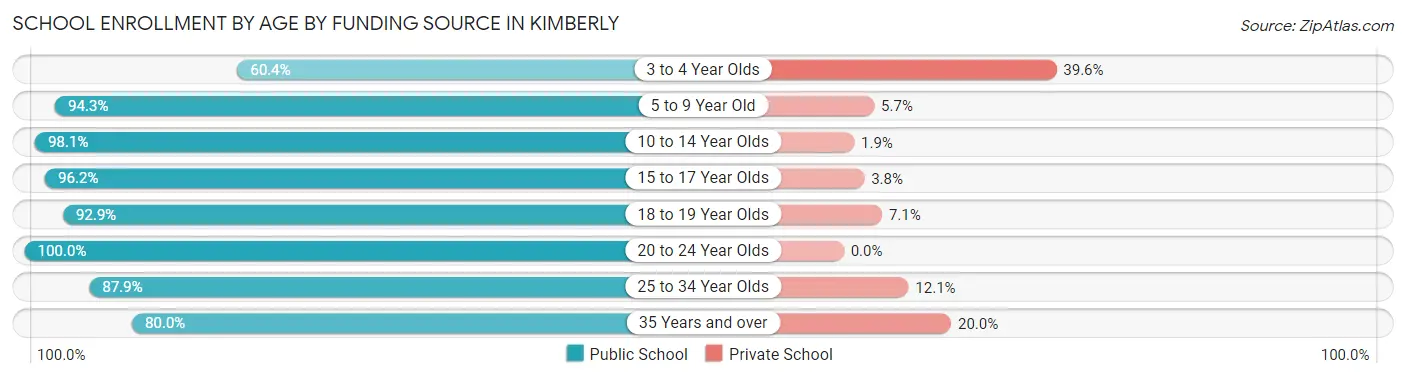
| Age Bracket | Public School | Private School |
| 3 to 4 Year Olds | 32 (60.4%) | 21 (39.6%) |
| 5 to 9 Year Old | 730 (94.3%) | 44 (5.7%) |
| 10 to 14 Year Olds | 605 (98.1%) | 12 (1.9%) |
| 15 to 17 Year Olds | 176 (96.2%) | 7 (3.8%) |
| 18 to 19 Year Olds | 65 (92.9%) | 5 (7.1%) |
| 20 to 24 Year Olds | 77 (100.0%) | 0 (0.0%) |
| 25 to 34 Year Olds | 124 (87.9%) | 17 (12.1%) |
| 35 Years and over | 20 (80.0%) | 5 (20.0%) |
| Total | 1,829 (94.3%) | 111 (5.7%) |
Educational Attainment by Field of Study in Kimberly
Business (478 | 32.8%), education (229 | 15.7%), bio, nature & agricultural (125 | 8.6%), arts & humanities (99 | 6.8%), and computers & mathematics (98 | 6.7%) are the most common fields of study among 1,459 individuals in Kimberly who have obtained a bachelor's degree or higher.
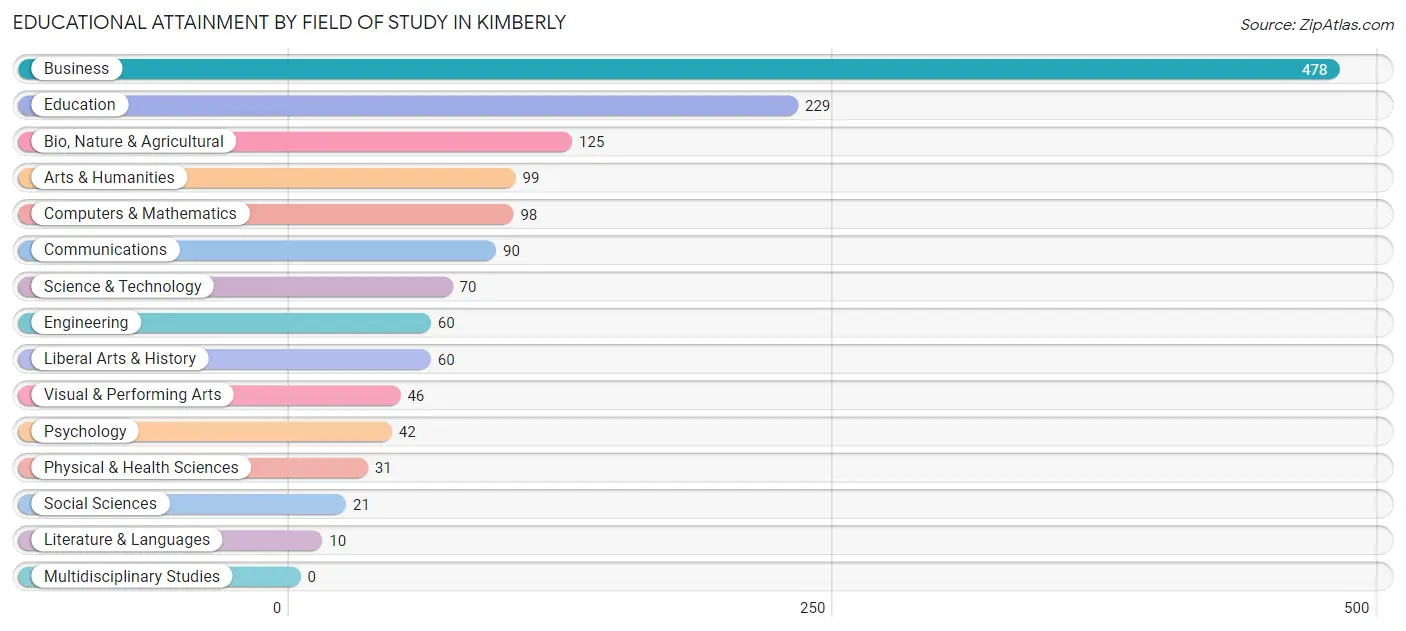
| Field of Study | # Graduates | % Graduates |
| Computers & Mathematics | 98 | 6.7% |
| Bio, Nature & Agricultural | 125 | 8.6% |
| Physical & Health Sciences | 31 | 2.1% |
| Psychology | 42 | 2.9% |
| Social Sciences | 21 | 1.4% |
| Engineering | 60 | 4.1% |
| Multidisciplinary Studies | 0 | 0.0% |
| Science & Technology | 70 | 4.8% |
| Business | 478 | 32.8% |
| Education | 229 | 15.7% |
| Literature & Languages | 10 | 0.7% |
| Liberal Arts & History | 60 | 4.1% |
| Visual & Performing Arts | 46 | 3.2% |
| Communications | 90 | 6.2% |
| Arts & Humanities | 99 | 6.8% |
| Total | 1,459 | 100.0% |
Transportation & Commute in Kimberly
Vehicle Availability by Sex in Kimberly
The most prevalent vehicle ownership categories in Kimberly are males with 2 vehicles (1,006, accounting for 53.3%) and females with 2 vehicles (790, making up 71.9%).
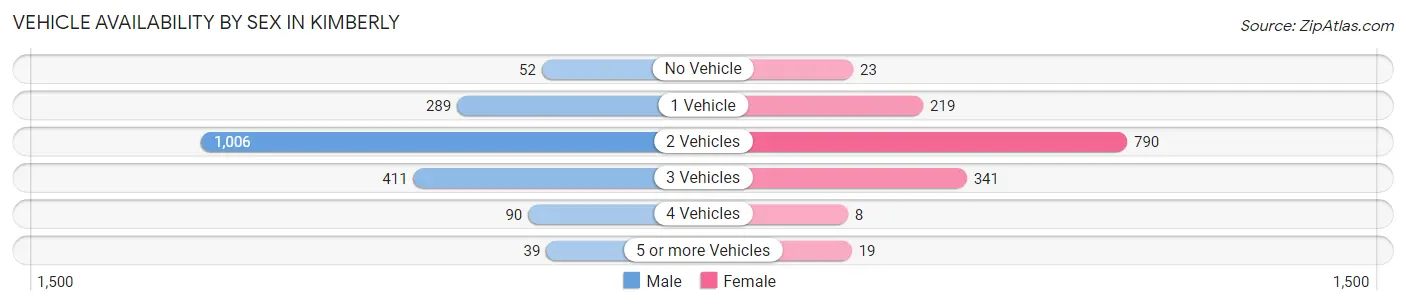
| Vehicles Available | Male | Female |
| No Vehicle | 52 (2.8%) | 23 (1.6%) |
| 1 Vehicle | 289 (15.3%) | 219 (15.6%) |
| 2 Vehicles | 1,006 (53.3%) | 790 (56.4%) |
| 3 Vehicles | 411 (21.8%) | 341 (24.4%) |
| 4 Vehicles | 90 (4.8%) | 8 (0.6%) |
| 5 or more Vehicles | 39 (2.1%) | 19 (1.4%) |
| Total | 1,887 (100.0%) | 1,400 (100.0%) |
Commute Time in Kimberly
The most frequently occuring commute durations in Kimberly are 15 to 19 minutes (698 commuters, 23.1%), 20 to 24 minutes (653 commuters, 21.6%), and 10 to 14 minutes (465 commuters, 15.4%).
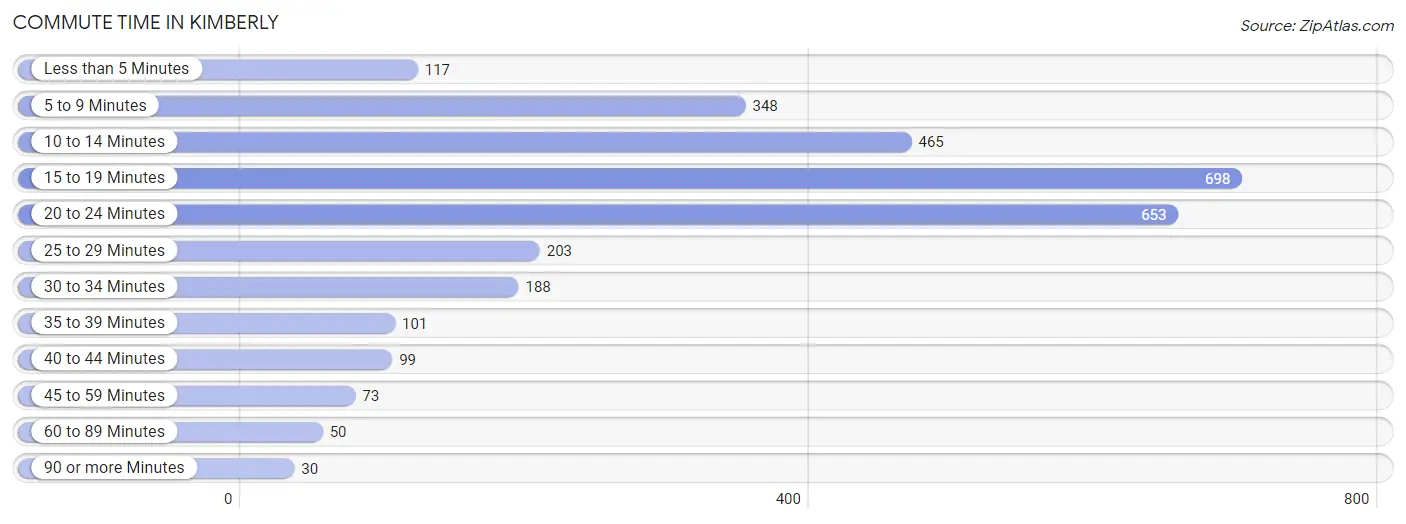
| Commute Time | # Commuters | % Commuters |
| Less than 5 Minutes | 117 | 3.9% |
| 5 to 9 Minutes | 348 | 11.5% |
| 10 to 14 Minutes | 465 | 15.4% |
| 15 to 19 Minutes | 698 | 23.1% |
| 20 to 24 Minutes | 653 | 21.6% |
| 25 to 29 Minutes | 203 | 6.7% |
| 30 to 34 Minutes | 188 | 6.2% |
| 35 to 39 Minutes | 101 | 3.3% |
| 40 to 44 Minutes | 99 | 3.3% |
| 45 to 59 Minutes | 73 | 2.4% |
| 60 to 89 Minutes | 50 | 1.7% |
| 90 or more Minutes | 30 | 1.0% |
Commute Time by Sex in Kimberly
The most common commute times in Kimberly are 15 to 19 minutes (441 commuters, 25.1%) for males and 20 to 24 minutes (386 commuters, 30.5%) for females.
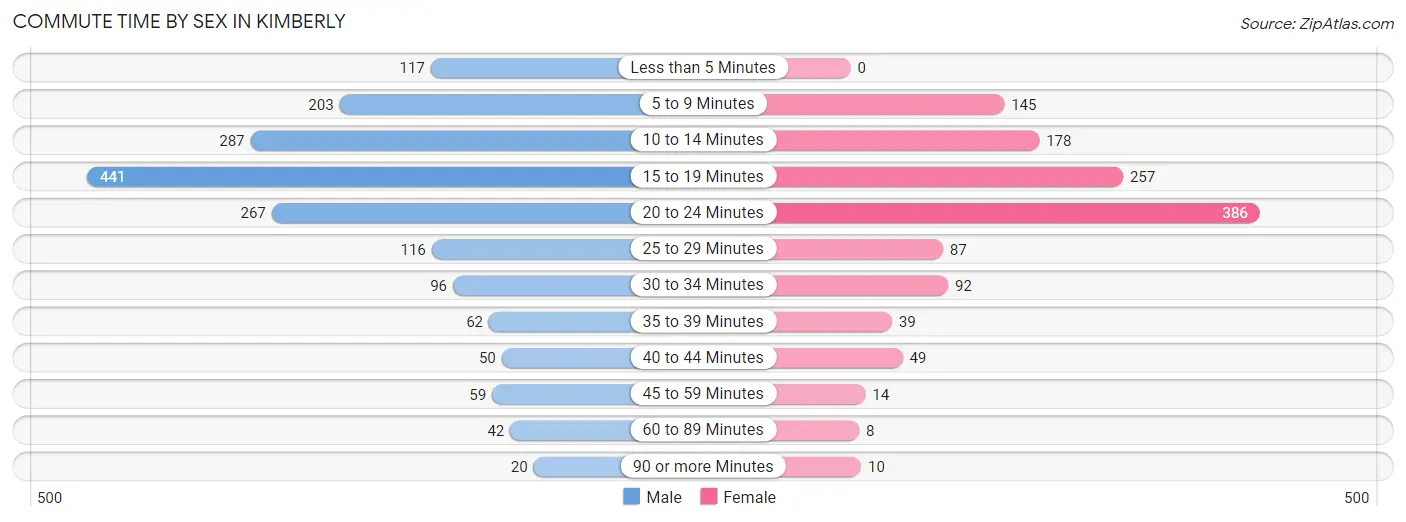
| Commute Time | Male | Female |
| Less than 5 Minutes | 117 (6.7%) | 0 (0.0%) |
| 5 to 9 Minutes | 203 (11.5%) | 145 (11.5%) |
| 10 to 14 Minutes | 287 (16.3%) | 178 (14.1%) |
| 15 to 19 Minutes | 441 (25.1%) | 257 (20.3%) |
| 20 to 24 Minutes | 267 (15.2%) | 386 (30.5%) |
| 25 to 29 Minutes | 116 (6.6%) | 87 (6.9%) |
| 30 to 34 Minutes | 96 (5.4%) | 92 (7.3%) |
| 35 to 39 Minutes | 62 (3.5%) | 39 (3.1%) |
| 40 to 44 Minutes | 50 (2.8%) | 49 (3.9%) |
| 45 to 59 Minutes | 59 (3.4%) | 14 (1.1%) |
| 60 to 89 Minutes | 42 (2.4%) | 8 (0.6%) |
| 90 or more Minutes | 20 (1.1%) | 10 (0.8%) |
Time of Departure to Work by Sex in Kimberly
The most frequent times of departure to work in Kimberly are 7:00 AM to 7:29 AM (306, 17.4%) for males and 7:00 AM to 7:29 AM (328, 25.9%) for females.
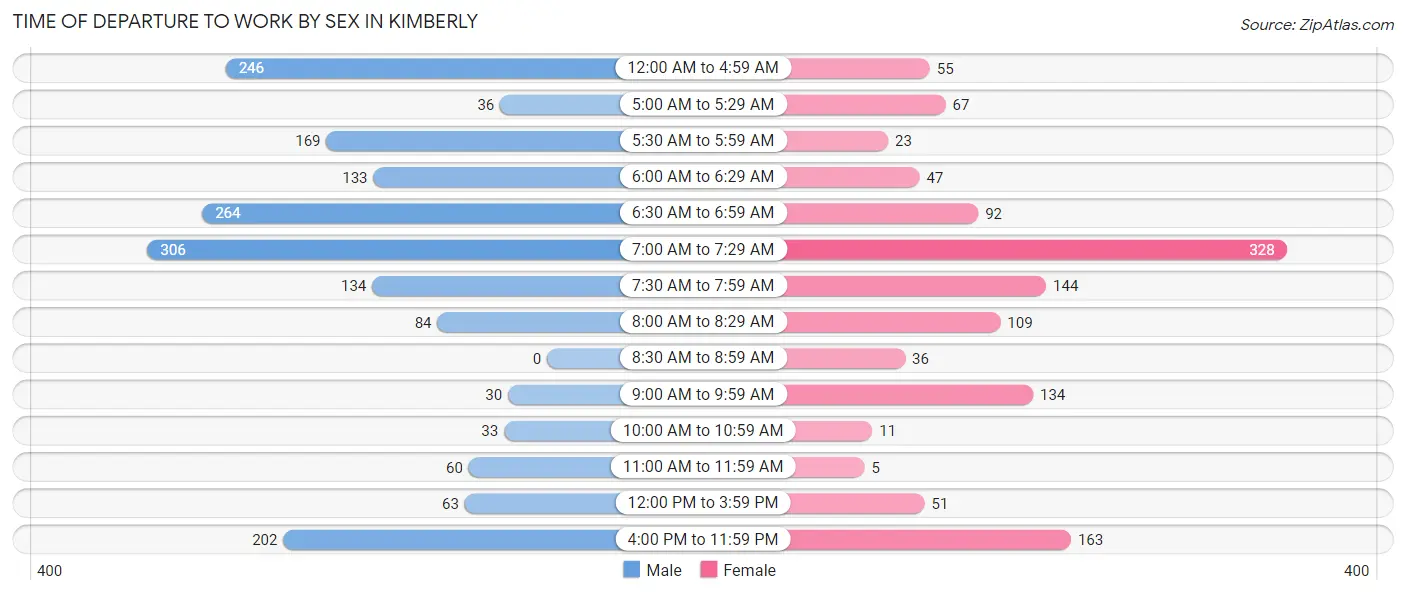
| Time of Departure | Male | Female |
| 12:00 AM to 4:59 AM | 246 (14.0%) | 55 (4.3%) |
| 5:00 AM to 5:29 AM | 36 (2.1%) | 67 (5.3%) |
| 5:30 AM to 5:59 AM | 169 (9.6%) | 23 (1.8%) |
| 6:00 AM to 6:29 AM | 133 (7.6%) | 47 (3.7%) |
| 6:30 AM to 6:59 AM | 264 (15.0%) | 92 (7.3%) |
| 7:00 AM to 7:29 AM | 306 (17.4%) | 328 (25.9%) |
| 7:30 AM to 7:59 AM | 134 (7.6%) | 144 (11.4%) |
| 8:00 AM to 8:29 AM | 84 (4.8%) | 109 (8.6%) |
| 8:30 AM to 8:59 AM | 0 (0.0%) | 36 (2.9%) |
| 9:00 AM to 9:59 AM | 30 (1.7%) | 134 (10.6%) |
| 10:00 AM to 10:59 AM | 33 (1.9%) | 11 (0.9%) |
| 11:00 AM to 11:59 AM | 60 (3.4%) | 5 (0.4%) |
| 12:00 PM to 3:59 PM | 63 (3.6%) | 51 (4.0%) |
| 4:00 PM to 11:59 PM | 202 (11.5%) | 163 (12.9%) |
| Total | 1,760 (100.0%) | 1,265 (100.0%) |
Housing Occupancy in Kimberly
Occupancy by Ownership in Kimberly
Of the total 2,984 dwellings in Kimberly, owner-occupied units account for 1,803 (60.4%), while renter-occupied units make up 1,181 (39.6%).
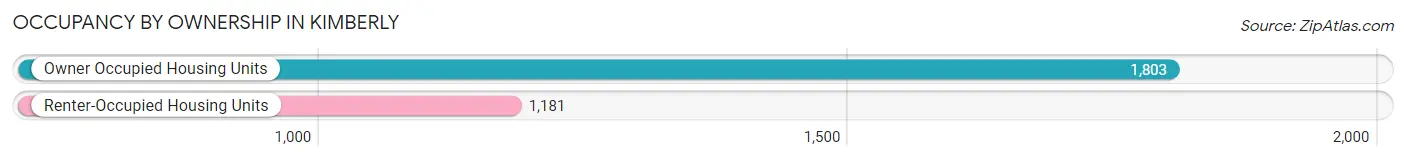
| Occupancy | # Housing Units | % Housing Units |
| Owner Occupied Housing Units | 1,803 | 60.4% |
| Renter-Occupied Housing Units | 1,181 | 39.6% |
| Total Occupied Housing Units | 2,984 | 100.0% |
Occupancy by Household Size in Kimberly
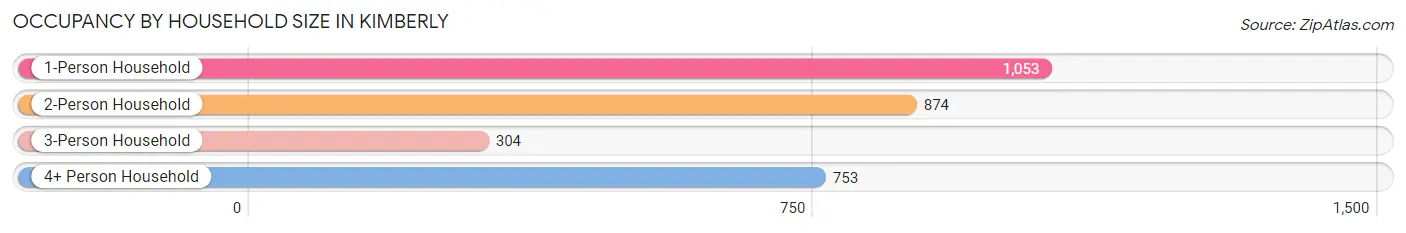
| Household Size | # Housing Units | % Housing Units |
| 1-Person Household | 1,053 | 35.3% |
| 2-Person Household | 874 | 29.3% |
| 3-Person Household | 304 | 10.2% |
| 4+ Person Household | 753 | 25.2% |
| Total Housing Units | 2,984 | 100.0% |
Occupancy by Ownership by Household Size in Kimberly
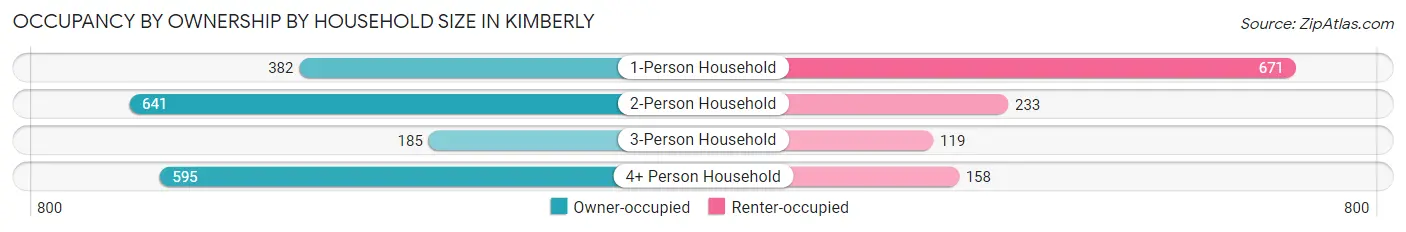
| Household Size | Owner-occupied | Renter-occupied |
| 1-Person Household | 382 (36.3%) | 671 (63.7%) |
| 2-Person Household | 641 (73.3%) | 233 (26.7%) |
| 3-Person Household | 185 (60.9%) | 119 (39.1%) |
| 4+ Person Household | 595 (79.0%) | 158 (21.0%) |
| Total Housing Units | 1,803 (60.4%) | 1,181 (39.6%) |
Occupancy by Educational Attainment in Kimberly
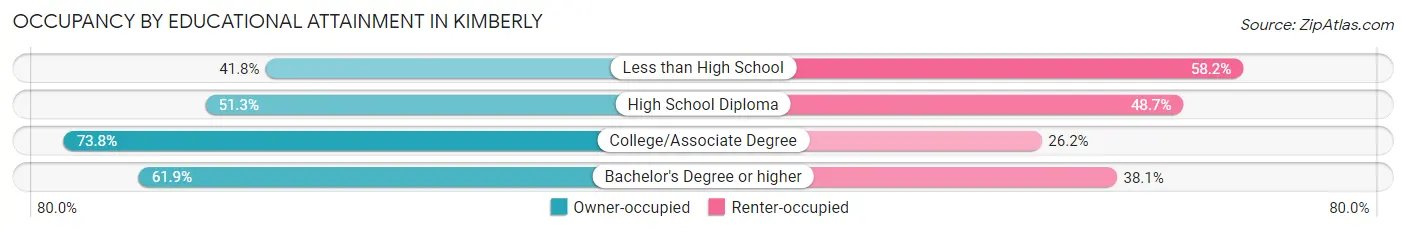
| Household Size | Owner-occupied | Renter-occupied |
| Less than High School | 74 (41.8%) | 103 (58.2%) |
| High School Diploma | 552 (51.3%) | 524 (48.7%) |
| College/Associate Degree | 656 (73.8%) | 233 (26.2%) |
| Bachelor's Degree or higher | 521 (61.9%) | 321 (38.1%) |
Occupancy by Age of Householder in Kimberly
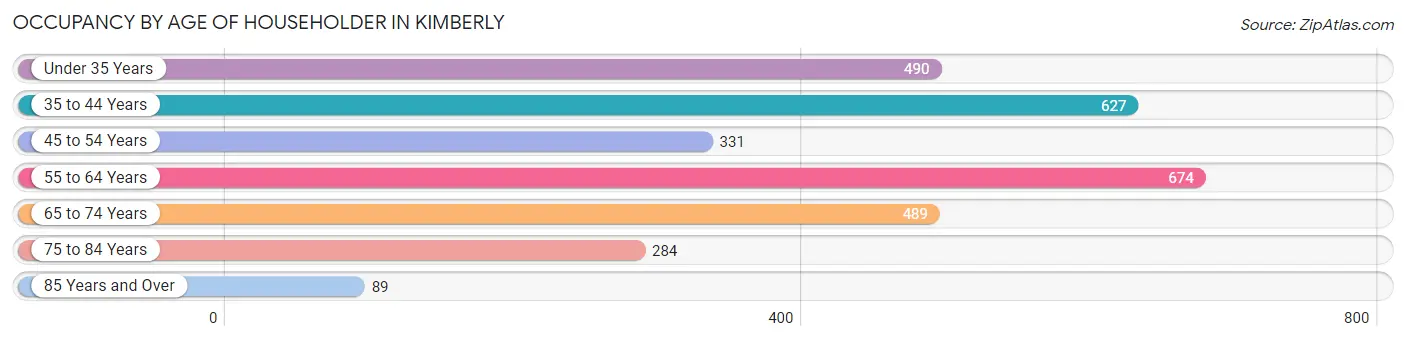
| Age Bracket | # Households | % Households |
| Under 35 Years | 490 | 16.4% |
| 35 to 44 Years | 627 | 21.0% |
| 45 to 54 Years | 331 | 11.1% |
| 55 to 64 Years | 674 | 22.6% |
| 65 to 74 Years | 489 | 16.4% |
| 75 to 84 Years | 284 | 9.5% |
| 85 Years and Over | 89 | 3.0% |
| Total | 2,984 | 100.0% |
Housing Finances in Kimberly
Median Income by Occupancy in Kimberly
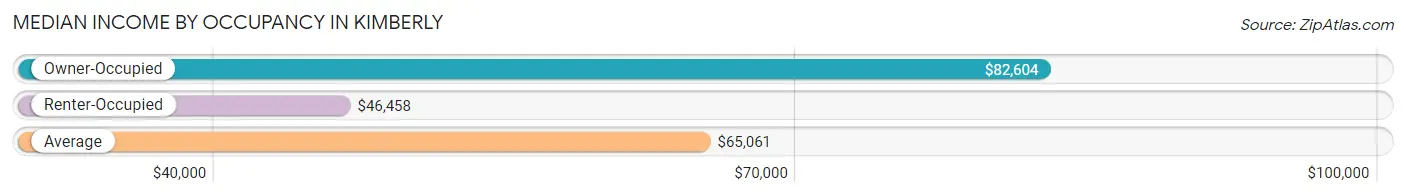
| Occupancy Type | # Households | Median Income |
| Owner-Occupied | 1,803 (60.4%) | $82,604 |
| Renter-Occupied | 1,181 (39.6%) | $46,458 |
| Average | 2,984 (100.0%) | $65,061 |
Occupancy by Householder Income Bracket in Kimberly
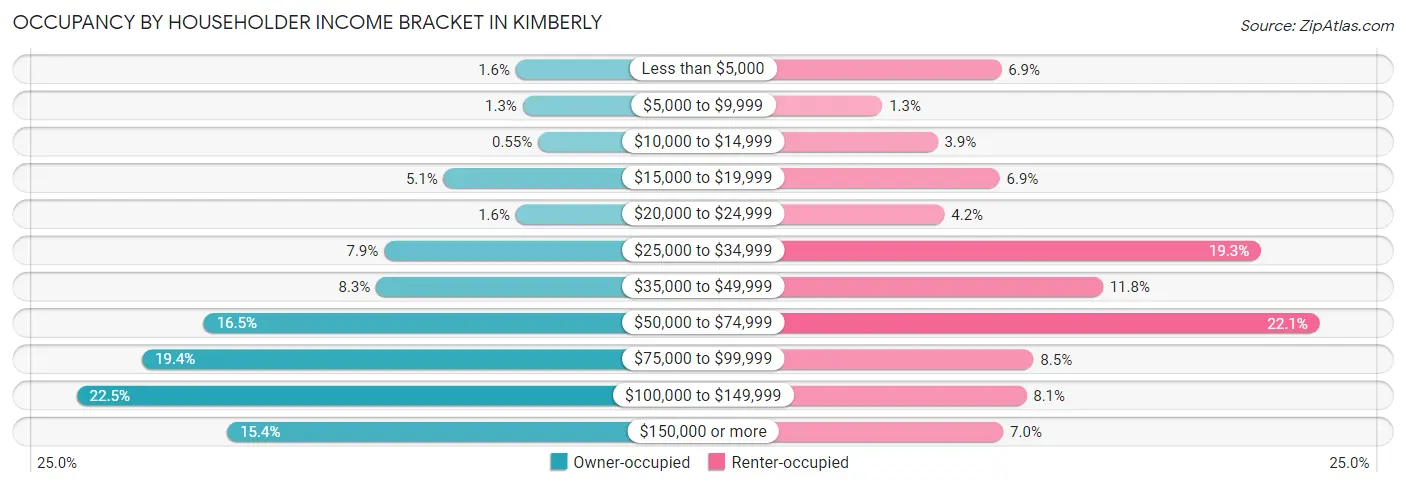
| Income Bracket | Owner-occupied | Renter-occupied |
| Less than $5,000 | 29 (1.6%) | 82 (6.9%) |
| $5,000 to $9,999 | 23 (1.3%) | 15 (1.3%) |
| $10,000 to $14,999 | 10 (0.5%) | 46 (3.9%) |
| $15,000 to $19,999 | 91 (5.1%) | 81 (6.9%) |
| $20,000 to $24,999 | 29 (1.6%) | 50 (4.2%) |
| $25,000 to $34,999 | 142 (7.9%) | 228 (19.3%) |
| $35,000 to $49,999 | 149 (8.3%) | 139 (11.8%) |
| $50,000 to $74,999 | 297 (16.5%) | 261 (22.1%) |
| $75,000 to $99,999 | 350 (19.4%) | 100 (8.5%) |
| $100,000 to $149,999 | 406 (22.5%) | 96 (8.1%) |
| $150,000 or more | 277 (15.4%) | 83 (7.0%) |
| Total | 1,803 (100.0%) | 1,181 (100.0%) |
Monthly Housing Cost Tiers in Kimberly
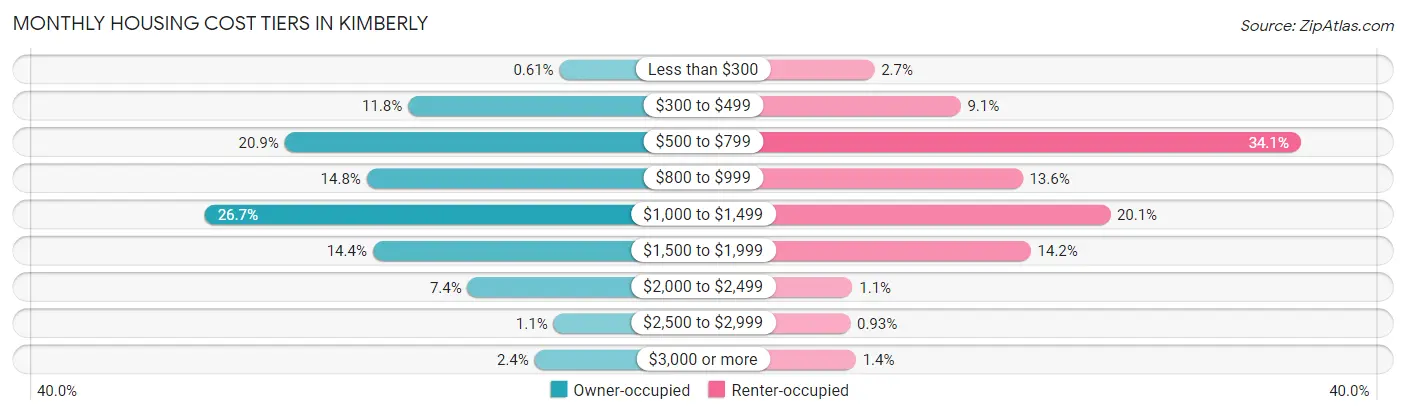
| Monthly Cost | Owner-occupied | Renter-occupied |
| Less than $300 | 11 (0.6%) | 32 (2.7%) |
| $300 to $499 | 212 (11.8%) | 107 (9.1%) |
| $500 to $799 | 376 (20.8%) | 403 (34.1%) |
| $800 to $999 | 267 (14.8%) | 161 (13.6%) |
| $1,000 to $1,499 | 482 (26.7%) | 237 (20.1%) |
| $1,500 to $1,999 | 259 (14.4%) | 168 (14.2%) |
| $2,000 to $2,499 | 133 (7.4%) | 13 (1.1%) |
| $2,500 to $2,999 | 19 (1.1%) | 11 (0.9%) |
| $3,000 or more | 44 (2.4%) | 16 (1.3%) |
| Total | 1,803 (100.0%) | 1,181 (100.0%) |
Physical Housing Characteristics in Kimberly
Housing Structures in Kimberly
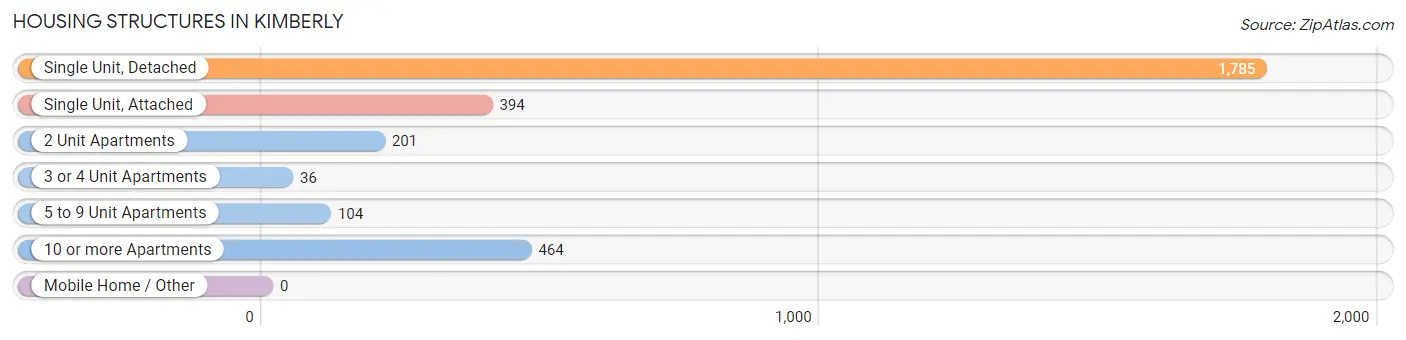
| Structure Type | # Housing Units | % Housing Units |
| Single Unit, Detached | 1,785 | 59.8% |
| Single Unit, Attached | 394 | 13.2% |
| 2 Unit Apartments | 201 | 6.7% |
| 3 or 4 Unit Apartments | 36 | 1.2% |
| 5 to 9 Unit Apartments | 104 | 3.5% |
| 10 or more Apartments | 464 | 15.5% |
| Mobile Home / Other | 0 | 0.0% |
| Total | 2,984 | 100.0% |
Housing Structures by Occupancy in Kimberly
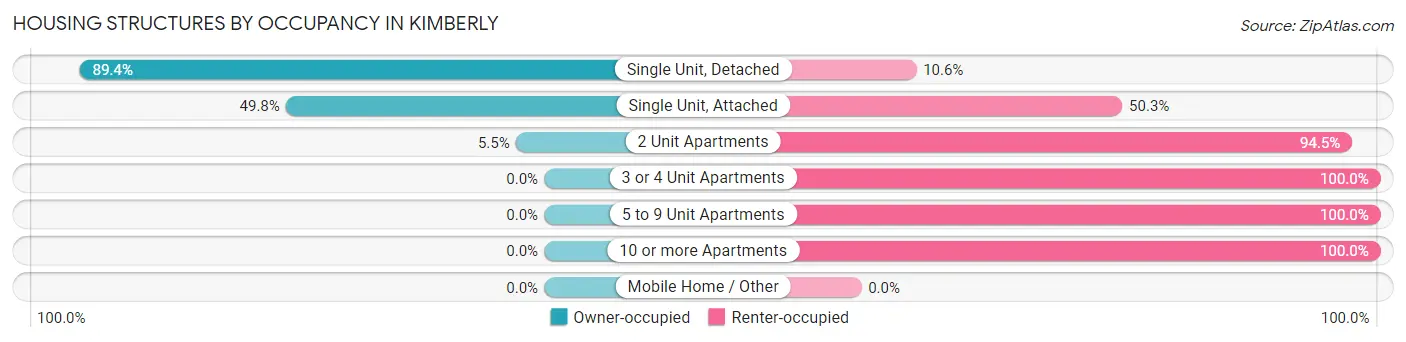
| Structure Type | Owner-occupied | Renter-occupied |
| Single Unit, Detached | 1,596 (89.4%) | 189 (10.6%) |
| Single Unit, Attached | 196 (49.7%) | 198 (50.2%) |
| 2 Unit Apartments | 11 (5.5%) | 190 (94.5%) |
| 3 or 4 Unit Apartments | 0 (0.0%) | 36 (100.0%) |
| 5 to 9 Unit Apartments | 0 (0.0%) | 104 (100.0%) |
| 10 or more Apartments | 0 (0.0%) | 464 (100.0%) |
| Mobile Home / Other | 0 (0.0%) | 0 (0.0%) |
| Total | 1,803 (60.4%) | 1,181 (39.6%) |
Housing Structures by Number of Rooms in Kimberly
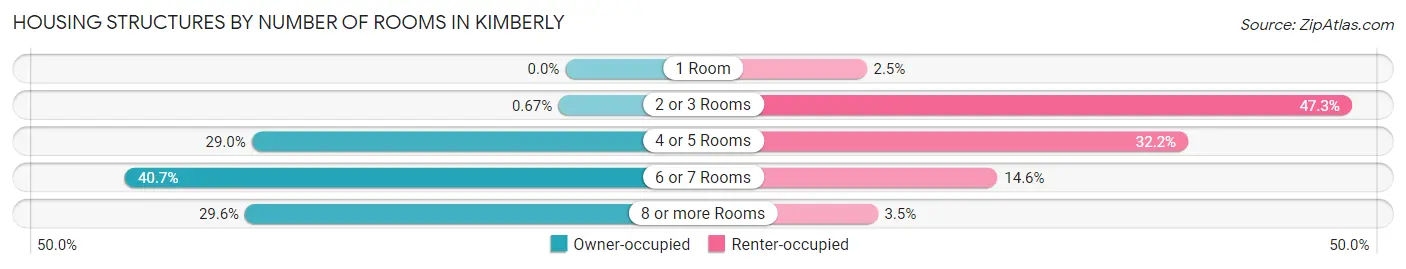
| Number of Rooms | Owner-occupied | Renter-occupied |
| 1 Room | 0 (0.0%) | 29 (2.5%) |
| 2 or 3 Rooms | 12 (0.7%) | 559 (47.3%) |
| 4 or 5 Rooms | 523 (29.0%) | 380 (32.2%) |
| 6 or 7 Rooms | 734 (40.7%) | 172 (14.6%) |
| 8 or more Rooms | 534 (29.6%) | 41 (3.5%) |
| Total | 1,803 (100.0%) | 1,181 (100.0%) |
Housing Structure by Heating Type in Kimberly
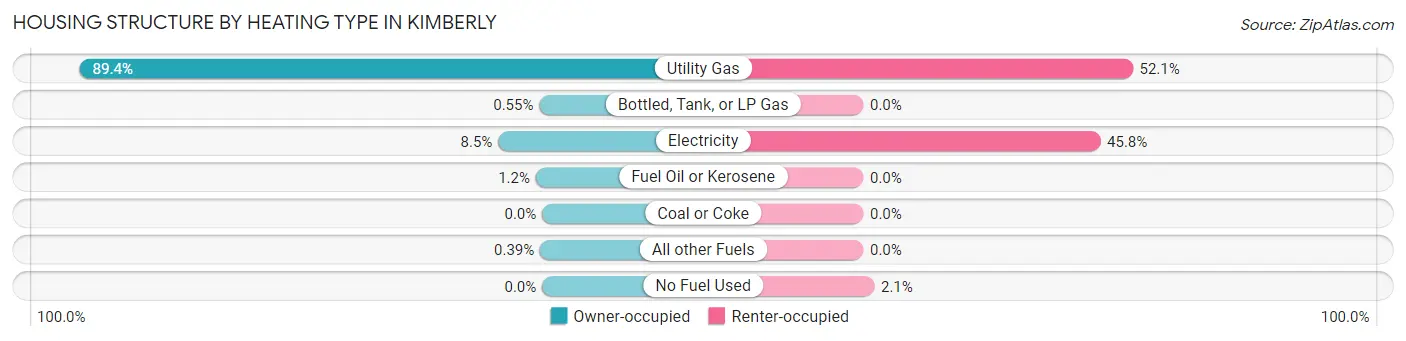
| Heating Type | Owner-occupied | Renter-occupied |
| Utility Gas | 1,611 (89.3%) | 615 (52.1%) |
| Bottled, Tank, or LP Gas | 10 (0.5%) | 0 (0.0%) |
| Electricity | 153 (8.5%) | 541 (45.8%) |
| Fuel Oil or Kerosene | 22 (1.2%) | 0 (0.0%) |
| Coal or Coke | 0 (0.0%) | 0 (0.0%) |
| All other Fuels | 7 (0.4%) | 0 (0.0%) |
| No Fuel Used | 0 (0.0%) | 25 (2.1%) |
| Total | 1,803 (100.0%) | 1,181 (100.0%) |
Household Vehicle Usage in Kimberly
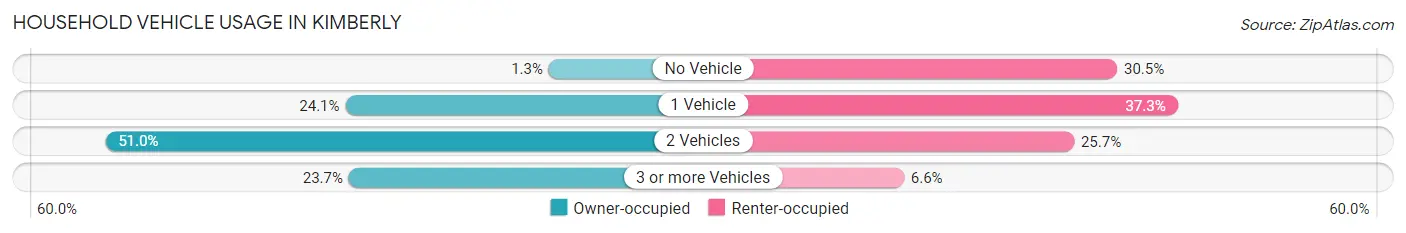
| Vehicles per Household | Owner-occupied | Renter-occupied |
| No Vehicle | 23 (1.3%) | 360 (30.5%) |
| 1 Vehicle | 434 (24.1%) | 440 (37.3%) |
| 2 Vehicles | 919 (51.0%) | 303 (25.7%) |
| 3 or more Vehicles | 427 (23.7%) | 78 (6.6%) |
| Total | 1,803 (100.0%) | 1,181 (100.0%) |
Real Estate & Mortgages in Kimberly
Real Estate and Mortgage Overview in Kimberly
| Characteristic | Without Mortgage | With Mortgage |
| Housing Units | 751 | 1,052 |
| Median Property Value | $191,900 | $175,900 |
| Median Household Income | $63,516 | $115 |
| Monthly Housing Costs | $596 | $44 |
| Real Estate Taxes | $3,046 | $0 |
Property Value by Mortgage Status in Kimberly
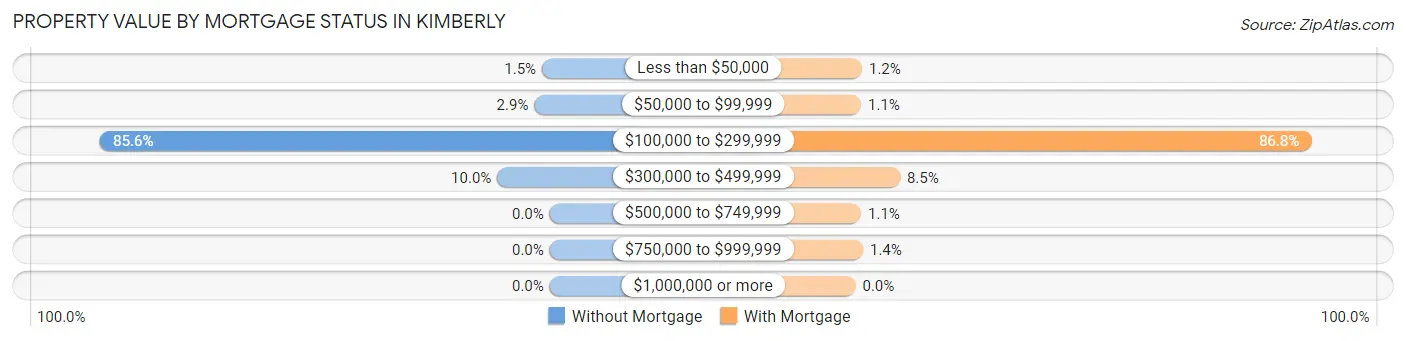
| Property Value | Without Mortgage | With Mortgage |
| Less than $50,000 | 11 (1.5%) | 13 (1.2%) |
| $50,000 to $99,999 | 22 (2.9%) | 11 (1.1%) |
| $100,000 to $299,999 | 643 (85.6%) | 913 (86.8%) |
| $300,000 to $499,999 | 75 (10.0%) | 89 (8.5%) |
| $500,000 to $749,999 | 0 (0.0%) | 11 (1.1%) |
| $750,000 to $999,999 | 0 (0.0%) | 15 (1.4%) |
| $1,000,000 or more | 0 (0.0%) | 0 (0.0%) |
| Total | 751 (100.0%) | 1,052 (100.0%) |
Household Income by Mortgage Status in Kimberly
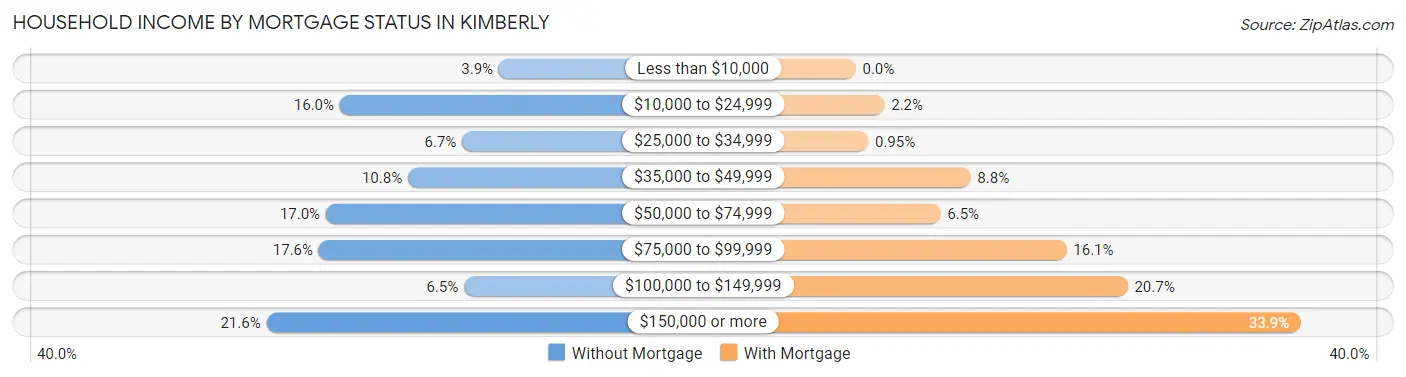
| Household Income | Without Mortgage | With Mortgage |
| Less than $10,000 | 29 (3.9%) | 0 (0.0%) |
| $10,000 to $24,999 | 120 (16.0%) | 23 (2.2%) |
| $25,000 to $34,999 | 50 (6.7%) | 10 (0.9%) |
| $35,000 to $49,999 | 81 (10.8%) | 92 (8.7%) |
| $50,000 to $74,999 | 128 (17.0%) | 68 (6.5%) |
| $75,000 to $99,999 | 132 (17.6%) | 169 (16.1%) |
| $100,000 to $149,999 | 49 (6.5%) | 218 (20.7%) |
| $150,000 or more | 162 (21.6%) | 357 (33.9%) |
| Total | 751 (100.0%) | 1,052 (100.0%) |
Property Value to Household Income Ratio in Kimberly
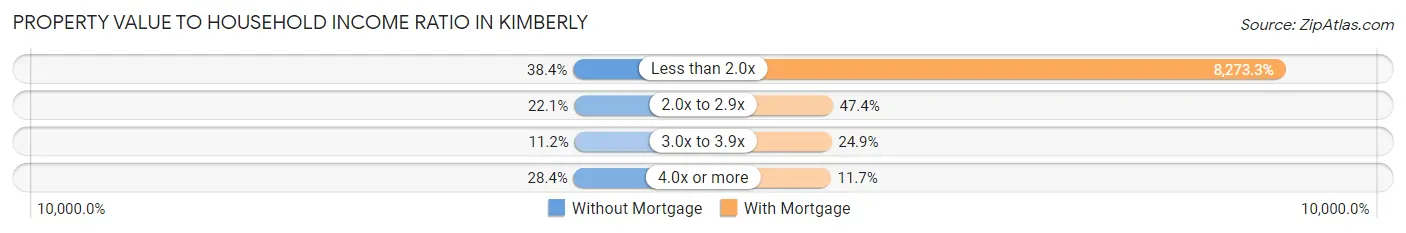
| Value-to-Income Ratio | Without Mortgage | With Mortgage |
| Less than 2.0x | 288 (38.4%) | 87,035 (8,273.3%) |
| 2.0x to 2.9x | 166 (22.1%) | 499 (47.4%) |
| 3.0x to 3.9x | 84 (11.2%) | 262 (24.9%) |
| 4.0x or more | 213 (28.4%) | 123 (11.7%) |
| Total | 751 (100.0%) | 1,052 (100.0%) |
Real Estate Taxes by Mortgage Status in Kimberly
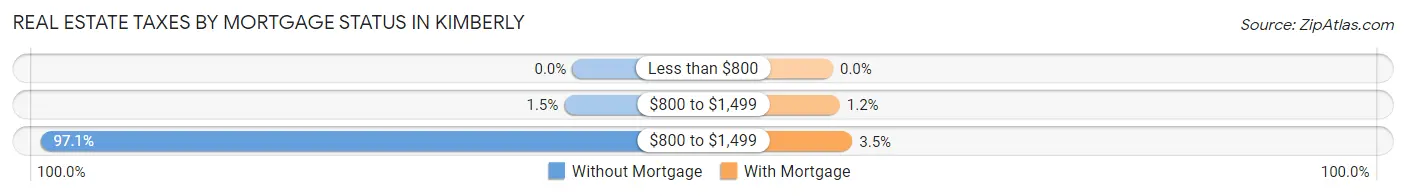
| Property Taxes | Without Mortgage | With Mortgage |
| Less than $800 | 0 (0.0%) | 0 (0.0%) |
| $800 to $1,499 | 11 (1.5%) | 13 (1.2%) |
| $800 to $1,499 | 729 (97.1%) | 37 (3.5%) |
| Total | 751 (100.0%) | 1,052 (100.0%) |
Health & Disability in Kimberly
Health Insurance Coverage by Age in Kimberly
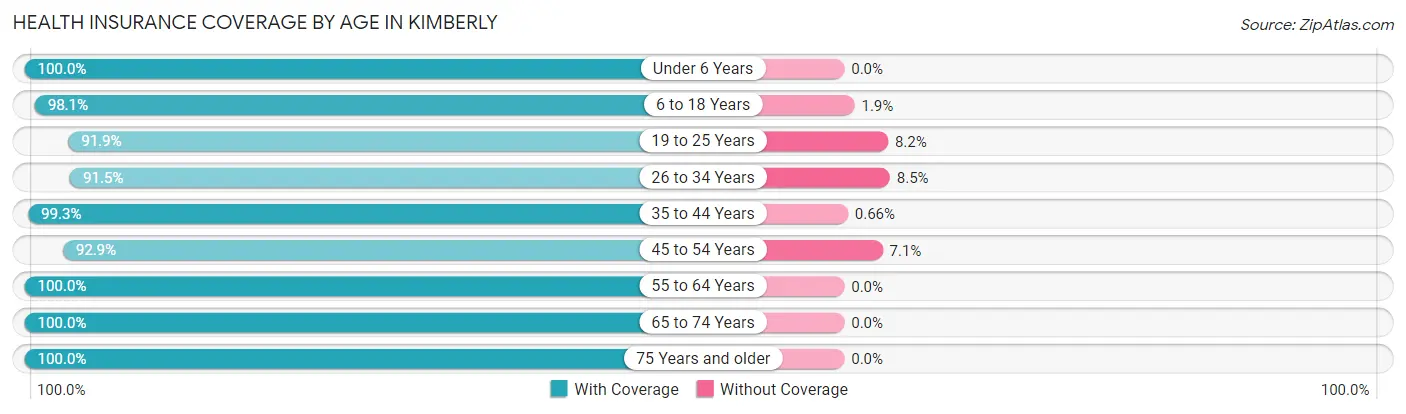
| Age Bracket | With Coverage | Without Coverage |
| Under 6 Years | 599 (100.0%) | 0 (0.0%) |
| 6 to 18 Years | 1,390 (98.1%) | 27 (1.9%) |
| 19 to 25 Years | 462 (91.8%) | 41 (8.2%) |
| 26 to 34 Years | 679 (91.5%) | 63 (8.5%) |
| 35 to 44 Years | 1,046 (99.3%) | 7 (0.7%) |
| 45 to 54 Years | 624 (92.9%) | 48 (7.1%) |
| 55 to 64 Years | 1,206 (100.0%) | 0 (0.0%) |
| 65 to 74 Years | 607 (100.0%) | 0 (0.0%) |
| 75 Years and older | 517 (100.0%) | 0 (0.0%) |
| Total | 7,130 (97.5%) | 186 (2.5%) |
Health Insurance Coverage by Citizenship Status in Kimberly
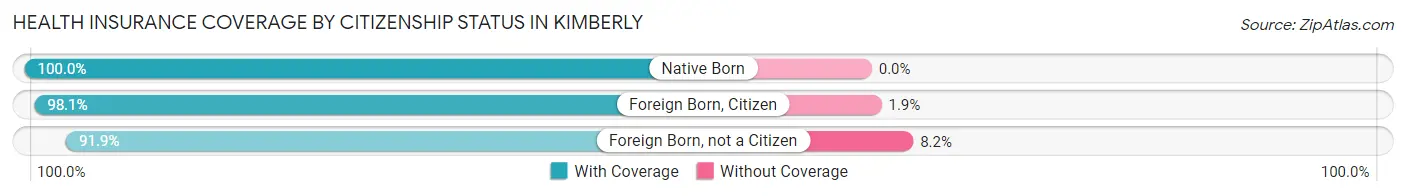
| Citizenship Status | With Coverage | Without Coverage |
| Native Born | 599 (100.0%) | 0 (0.0%) |
| Foreign Born, Citizen | 1,390 (98.1%) | 27 (1.9%) |
| Foreign Born, not a Citizen | 462 (91.8%) | 41 (8.2%) |
Health Insurance Coverage by Household Income in Kimberly
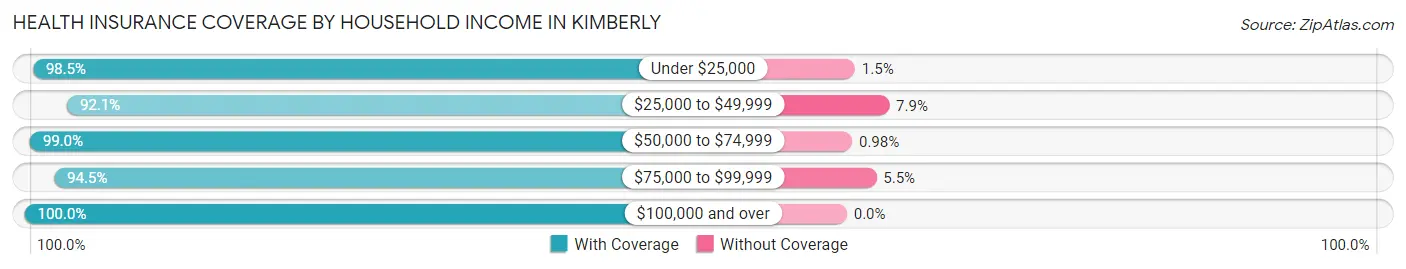
| Household Income | With Coverage | Without Coverage |
| Under $25,000 | 713 (98.5%) | 11 (1.5%) |
| $25,000 to $49,999 | 939 (92.1%) | 81 (7.9%) |
| $50,000 to $74,999 | 1,307 (99.0%) | 13 (1.0%) |
| $75,000 to $99,999 | 1,381 (94.5%) | 81 (5.5%) |
| $100,000 and over | 2,781 (100.0%) | 0 (0.0%) |
Public vs Private Health Insurance Coverage by Age in Kimberly
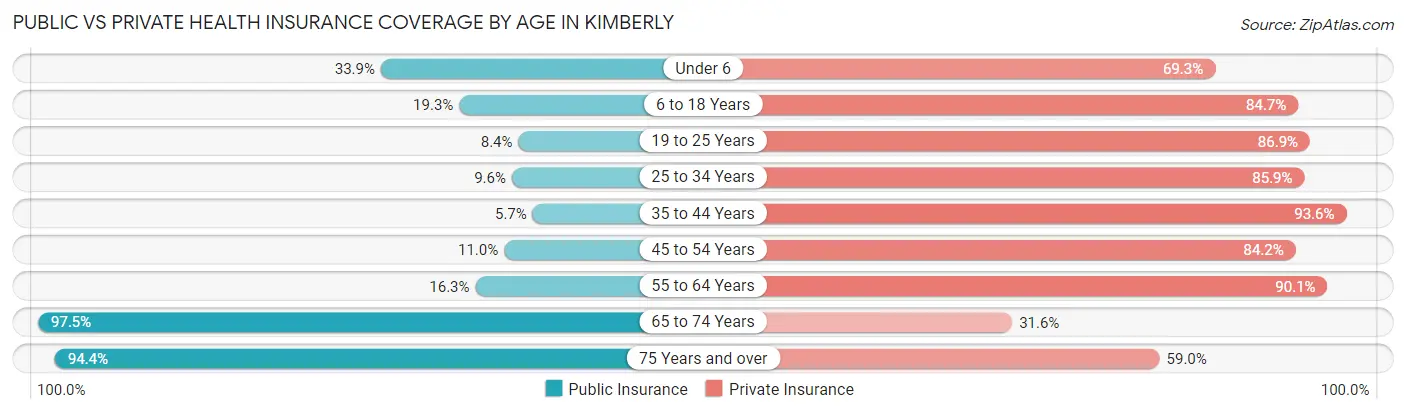
| Age Bracket | Public Insurance | Private Insurance |
| Under 6 | 203 (33.9%) | 415 (69.3%) |
| 6 to 18 Years | 274 (19.3%) | 1,200 (84.7%) |
| 19 to 25 Years | 42 (8.4%) | 437 (86.9%) |
| 25 to 34 Years | 71 (9.6%) | 637 (85.9%) |
| 35 to 44 Years | 60 (5.7%) | 986 (93.6%) |
| 45 to 54 Years | 74 (11.0%) | 566 (84.2%) |
| 55 to 64 Years | 197 (16.3%) | 1,087 (90.1%) |
| 65 to 74 Years | 592 (97.5%) | 192 (31.6%) |
| 75 Years and over | 488 (94.4%) | 305 (59.0%) |
| Total | 2,001 (27.4%) | 5,825 (79.6%) |
Disability Status by Sex by Age in Kimberly
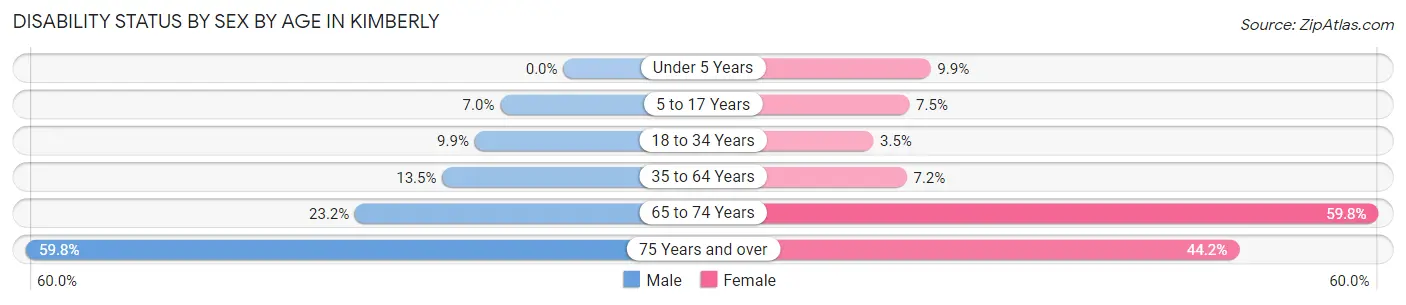
| Age Bracket | Male | Female |
| Under 5 Years | 0 (0.0%) | 15 (9.9%) |
| 5 to 17 Years | 62 (7.0%) | 53 (7.5%) |
| 18 to 34 Years | 74 (9.9%) | 18 (3.5%) |
| 35 to 64 Years | 182 (13.5%) | 114 (7.2%) |
| 65 to 74 Years | 48 (23.2%) | 239 (59.8%) |
| 75 Years and over | 143 (59.8%) | 123 (44.2%) |
Disability Class by Sex by Age in Kimberly
Disability Class: Hearing Difficulty
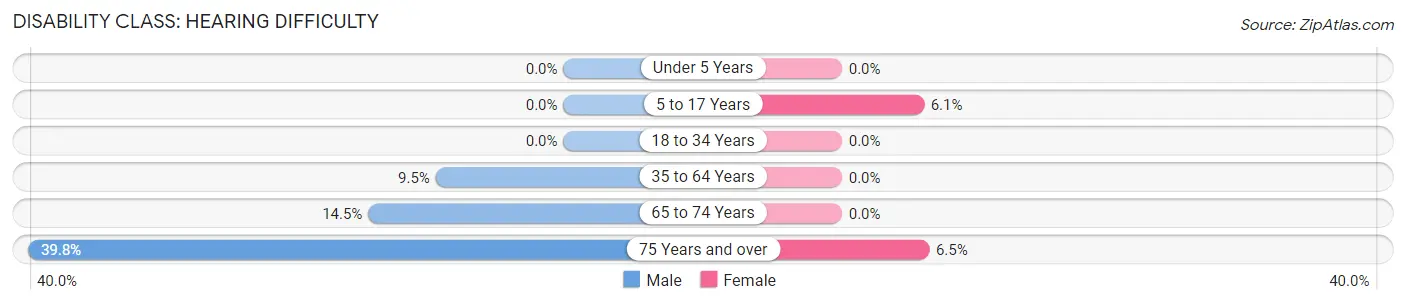
| Age Bracket | Male | Female |
| Under 5 Years | 0 (0.0%) | 0 (0.0%) |
| 5 to 17 Years | 0 (0.0%) | 43 (6.1%) |
| 18 to 34 Years | 0 (0.0%) | 0 (0.0%) |
| 35 to 64 Years | 128 (9.5%) | 0 (0.0%) |
| 65 to 74 Years | 30 (14.5%) | 0 (0.0%) |
| 75 Years and over | 95 (39.8%) | 18 (6.5%) |
Disability Class: Vision Difficulty
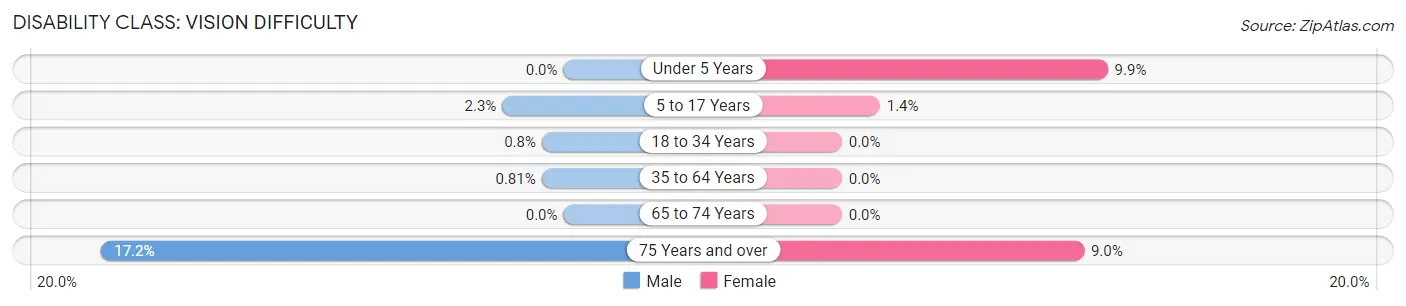
| Age Bracket | Male | Female |
| Under 5 Years | 0 (0.0%) | 15 (9.9%) |
| 5 to 17 Years | 20 (2.3%) | 10 (1.4%) |
| 18 to 34 Years | 6 (0.8%) | 0 (0.0%) |
| 35 to 64 Years | 11 (0.8%) | 0 (0.0%) |
| 65 to 74 Years | 0 (0.0%) | 0 (0.0%) |
| 75 Years and over | 41 (17.2%) | 25 (9.0%) |
Disability Class: Cognitive Difficulty
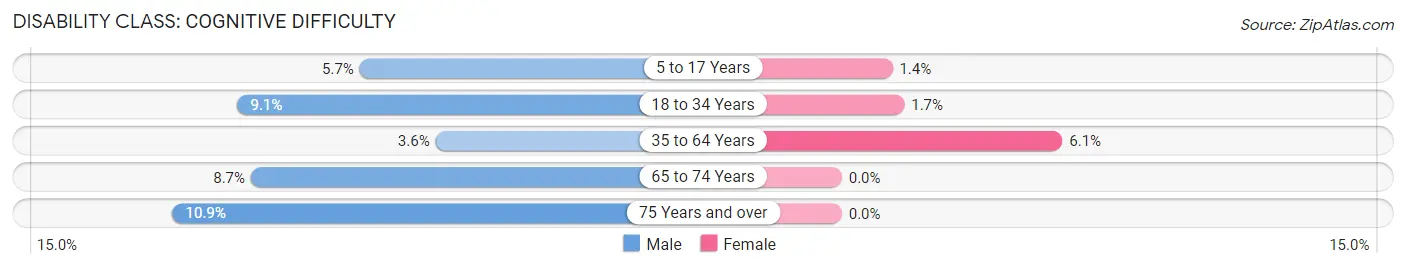
| Age Bracket | Male | Female |
| 5 to 17 Years | 50 (5.7%) | 10 (1.4%) |
| 18 to 34 Years | 68 (9.1%) | 9 (1.7%) |
| 35 to 64 Years | 48 (3.6%) | 97 (6.1%) |
| 65 to 74 Years | 18 (8.7%) | 0 (0.0%) |
| 75 Years and over | 26 (10.9%) | 0 (0.0%) |
Disability Class: Ambulatory Difficulty
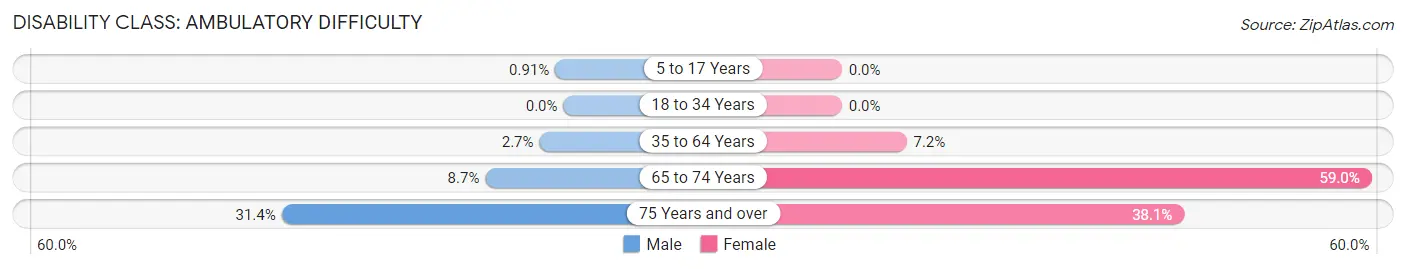
| Age Bracket | Male | Female |
| 5 to 17 Years | 8 (0.9%) | 0 (0.0%) |
| 18 to 34 Years | 0 (0.0%) | 0 (0.0%) |
| 35 to 64 Years | 36 (2.7%) | 114 (7.2%) |
| 65 to 74 Years | 18 (8.7%) | 236 (59.0%) |
| 75 Years and over | 75 (31.4%) | 106 (38.1%) |
Disability Class: Self-Care Difficulty
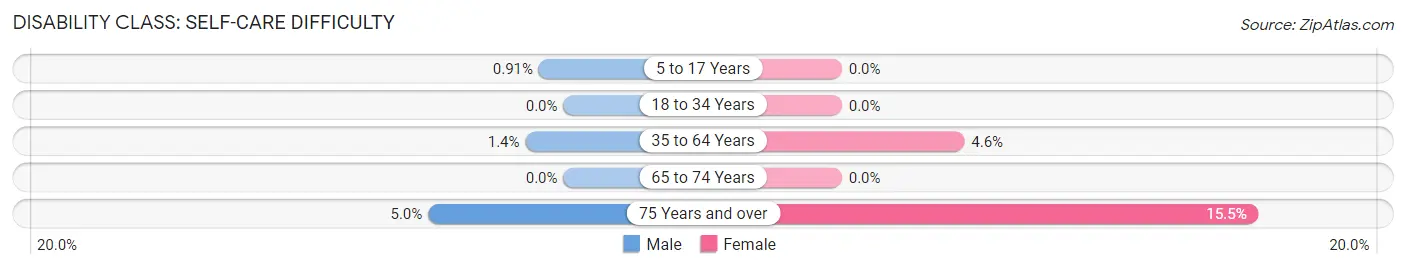
| Age Bracket | Male | Female |
| 5 to 17 Years | 8 (0.9%) | 0 (0.0%) |
| 18 to 34 Years | 0 (0.0%) | 0 (0.0%) |
| 35 to 64 Years | 19 (1.4%) | 72 (4.5%) |
| 65 to 74 Years | 0 (0.0%) | 0 (0.0%) |
| 75 Years and over | 12 (5.0%) | 43 (15.5%) |
Technology Access in Kimberly
Computing Device Access in Kimberly
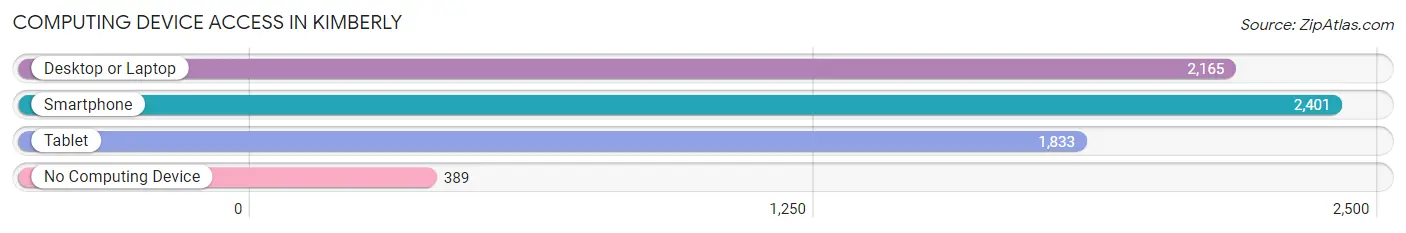
| Device Type | # Households | % Households |
| Desktop or Laptop | 2,165 | 72.6% |
| Smartphone | 2,401 | 80.5% |
| Tablet | 1,833 | 61.4% |
| No Computing Device | 389 | 13.0% |
| Total | 2,984 | 100.0% |
Internet Access in Kimberly
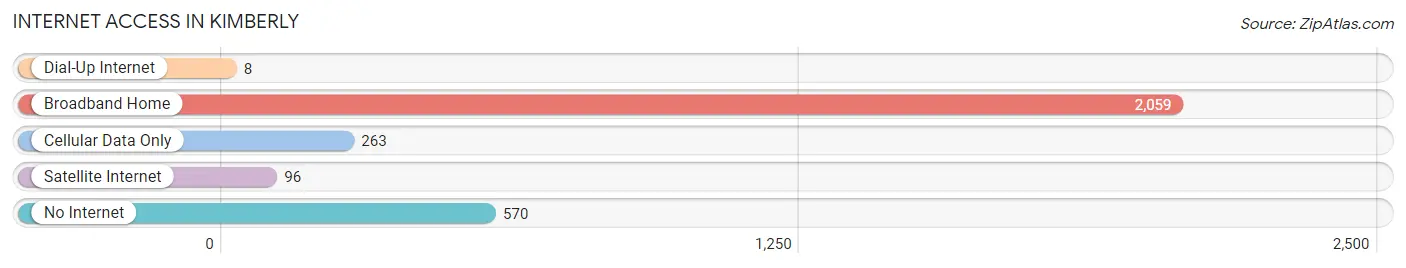
| Internet Type | # Households | % Households |
| Dial-Up Internet | 8 | 0.3% |
| Broadband Home | 2,059 | 69.0% |
| Cellular Data Only | 263 | 8.8% |
| Satellite Internet | 96 | 3.2% |
| No Internet | 570 | 19.1% |
| Total | 2,984 | 100.0% |
Kimberly Summary
Kimberly, Wisconsin is a small village located in Outagamie County, Wisconsin. It is situated on the Fox River, about 20 miles south of Green Bay. The village has a population of 6,462 people, according to the 2010 census.
History
The area that is now Kimberly was first settled in 1848 by a group of German immigrants. The village was originally known as “Kleinsville”, after the first settler, John Kleinschmidt. In 1854, the village was renamed “Kimberly” after John A. Kimberly, a prominent businessman from Milwaukee.
Kimberly was incorporated as a village in 1876. The village grew rapidly in the late 19th century, and by 1900, it had a population of 1,845. The village was known for its paper mills, which were the main source of employment for the residents.
Geography
Kimberly is located in Outagamie County, Wisconsin, about 20 miles south of Green Bay. The village is situated on the Fox River, and is surrounded by rolling hills and farmland. The village covers an area of 2.3 square miles, and has a population density of 2,817 people per square mile.
Economy
Kimberly’s economy is largely based on manufacturing. The village is home to several paper mills, which are the main source of employment for the residents. Other industries in the village include food processing, plastics manufacturing, and metal fabrication.
Kimberly also has a thriving retail sector, with several stores and restaurants located in the village. The village also has a number of small businesses, including auto repair shops, beauty salons, and pet stores.
Demographics
Kimberly has a population of 6,462 people, according to the 2010 census. The village has a median household income of $50,945, and a median age of 38.7 years. The village is predominantly white (94.3%), with small percentages of African American (2.2%), Asian (1.2%), and Hispanic (1.3%) residents.
Kimberly is a small village with a rich history and a vibrant economy. The village is home to several paper mills, which are the main source of employment for the residents. The village also has a thriving retail sector, with several stores and restaurants located in the village. The village has a population of 6,462 people, and a median household income of $50,945.
Common Questions
What is Per Capita Income in Kimberly?
Per Capita income in Kimberly is $34,623.
What is the Median Family Income in Kimberly?
Median Family Income in Kimberly is $86,566.
What is the Median Household income in Kimberly?
Median Household Income in Kimberly is $65,061.
What is Income or Wage Gap in Kimberly?
Income or Wage Gap in Kimberly is 34.4%.
Women in Kimberly earn 65.6 cents for every dollar earned by a man.
What is Inequality or Gini Index in Kimberly?
Inequality or Gini Index in Kimberly is 0.42.
What is the Total Population of Kimberly?
Total Population of Kimberly is 7,331.
What is the Total Male Population of Kimberly?
Total Male Population of Kimberly is 3,689.
What is the Total Female Population of Kimberly?
Total Female Population of Kimberly is 3,642.
What is the Ratio of Males per 100 Females in Kimberly?
There are 101.29 Males per 100 Females in Kimberly.
What is the Ratio of Females per 100 Males in Kimberly?
There are 98.73 Females per 100 Males in Kimberly.
What is the Median Population Age in Kimberly?
Median Population Age in Kimberly is 39.2 Years.
What is the Average Family Size in Kimberly
Average Family Size in Kimberly is 3.2 People.
What is the Average Household Size in Kimberly
Average Household Size in Kimberly is 2.5 People.
How Large is the Labor Force in Kimberly?
There are 3,511 People in the Labor Forcein in Kimberly.
What is the Percentage of People in the Labor Force in Kimberly?
64.5% of People are in the Labor Force in Kimberly.
What is the Unemployment Rate in Kimberly?
Unemployment Rate in Kimberly is 5.1%.