Kiel, WI Map & Demographics
Kiel Map
Kiel Overview
$33,710
PER CAPITA INCOME
$87,821
AVG FAMILY INCOME
$71,019
AVG HOUSEHOLD INCOME
27.1%
WAGE / INCOME GAP [ % ]
72.9¢/ $1
WAGE / INCOME GAP [ $ ]
0.37
INEQUALITY / GINI INDEX
3,878
TOTAL POPULATION
1,901
MALE POPULATION
1,977
FEMALE POPULATION
96.16
MALES / 100 FEMALES
104.00
FEMALES / 100 MALES
39.3
MEDIAN AGE
3.0
AVG FAMILY SIZE
2.4
AVG HOUSEHOLD SIZE
2,183
LABOR FORCE [ PEOPLE ]
70.7%
PERCENT IN LABOR FORCE
2.2%
UNEMPLOYMENT RATE
Kiel Zip Codes
Kiel Area Codes
Income in Kiel
Income Overview in Kiel
Per Capita Income in Kiel is $33,710, while median incomes of families and households are $87,821 and $71,019 respectively.
| Characteristic | Number | Measure |
| Per Capita Income | 3,878 | $33,710 |
| Median Family Income | 992 | $87,821 |
| Mean Family Income | 992 | $93,749 |
| Median Household Income | 1,642 | $71,019 |
| Mean Household Income | 1,642 | $79,655 |
| Income Deficit | 992 | $0 |
| Wage / Income Gap (%) | 3,878 | 27.12% |
| Wage / Income Gap ($) | 3,878 | 72.88¢ per $1 |
| Gini / Inequality Index | 3,878 | 0.37 |
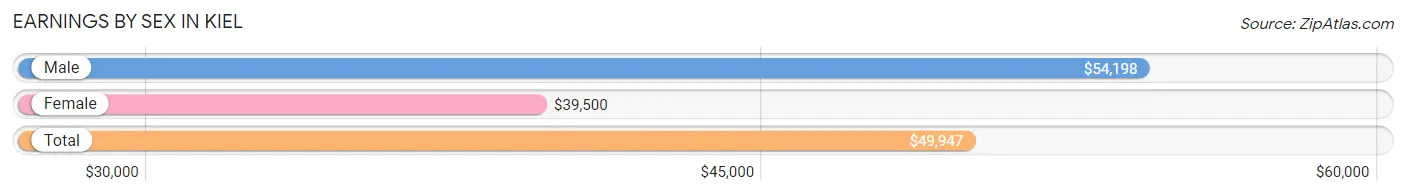
Earnings by Sex in Kiel
Average Earnings in Kiel are $49,947, $54,198 for men and $39,500 for women, a difference of 27.1%.
| Sex | Number | Average Earnings |
| Male | 1,278 (57.5%) | $54,198 |
| Female | 944 (42.5%) | $39,500 |
| Total | 2,222 (100.0%) | $49,947 |
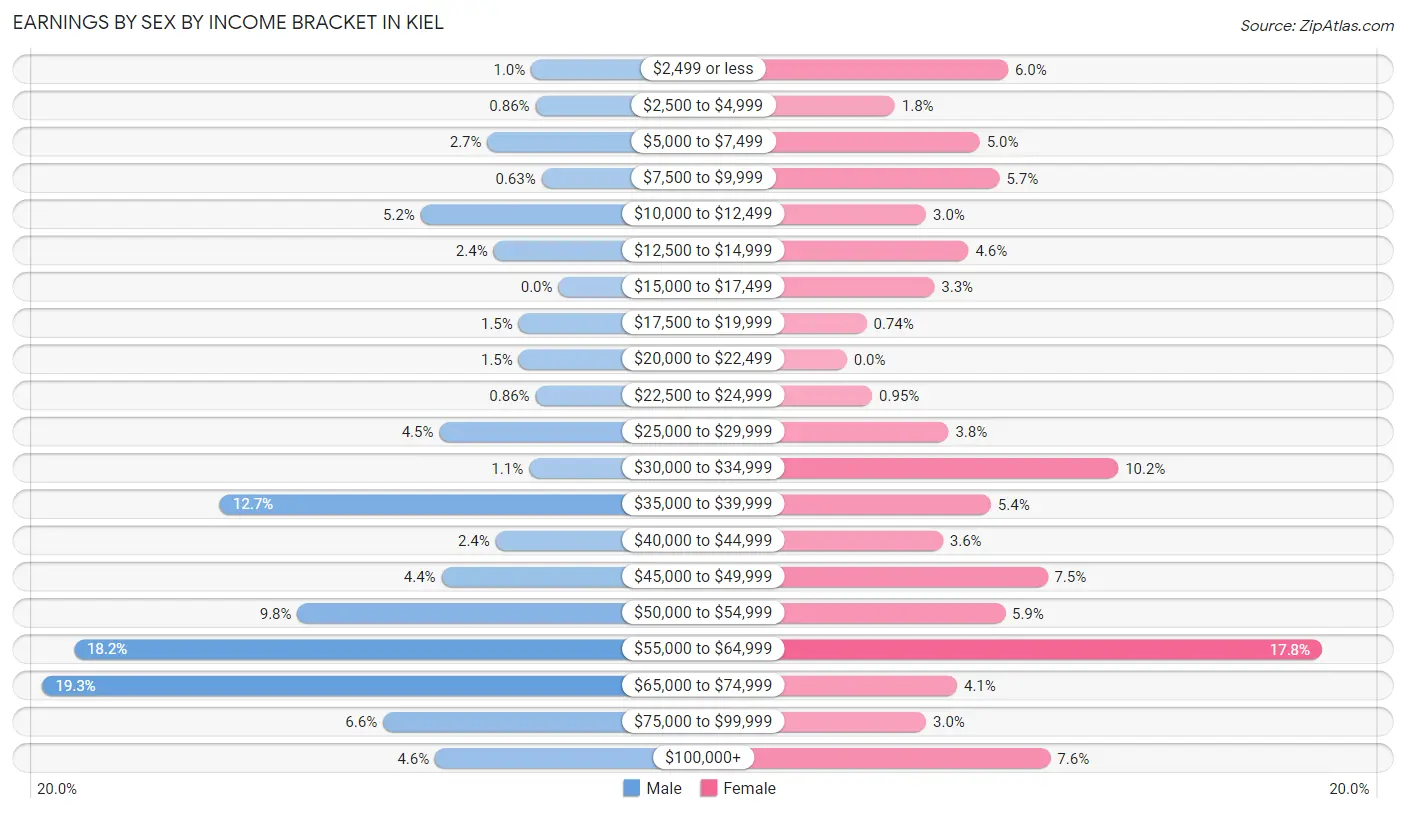
Earnings by Sex by Income Bracket in Kiel
The most common earnings brackets in Kiel are $65,000 to $74,999 for men (247 | 19.3%) and $55,000 to $64,999 for women (168 | 17.8%).
| Income | Male | Female |
| $2,499 or less | 13 (1.0%) | 57 (6.0%) |
| $2,500 to $4,999 | 11 (0.9%) | 17 (1.8%) |
| $5,000 to $7,499 | 34 (2.7%) | 47 (5.0%) |
| $7,500 to $9,999 | 8 (0.6%) | 54 (5.7%) |
| $10,000 to $12,499 | 66 (5.2%) | 28 (3.0%) |
| $12,500 to $14,999 | 31 (2.4%) | 43 (4.6%) |
| $15,000 to $17,499 | 0 (0.0%) | 31 (3.3%) |
| $17,500 to $19,999 | 19 (1.5%) | 7 (0.7%) |
| $20,000 to $22,499 | 19 (1.5%) | 0 (0.0%) |
| $22,500 to $24,999 | 11 (0.9%) | 9 (0.9%) |
| $25,000 to $29,999 | 57 (4.5%) | 36 (3.8%) |
| $30,000 to $34,999 | 14 (1.1%) | 96 (10.2%) |
| $35,000 to $39,999 | 162 (12.7%) | 51 (5.4%) |
| $40,000 to $44,999 | 30 (2.4%) | 34 (3.6%) |
| $45,000 to $49,999 | 56 (4.4%) | 71 (7.5%) |
| $50,000 to $54,999 | 125 (9.8%) | 56 (5.9%) |
| $55,000 to $64,999 | 232 (18.1%) | 168 (17.8%) |
| $65,000 to $74,999 | 247 (19.3%) | 39 (4.1%) |
| $75,000 to $99,999 | 84 (6.6%) | 28 (3.0%) |
| $100,000+ | 59 (4.6%) | 72 (7.6%) |
| Total | 1,278 (100.0%) | 944 (100.0%) |
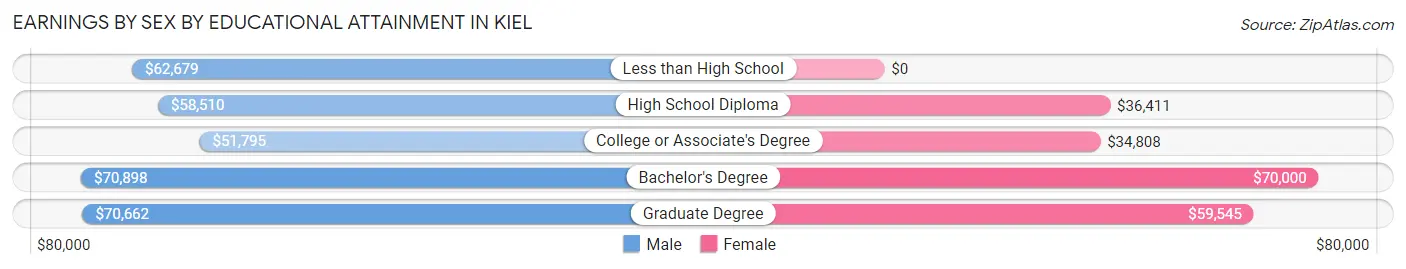
Earnings by Sex by Educational Attainment in Kiel
Average earnings in Kiel are $56,948 for men and $46,844 for women, a difference of 17.7%. Men with an educational attainment of bachelor's degree enjoy the highest average annual earnings of $70,898, while those with college or associate's degree education earn the least with $51,795. Women with an educational attainment of bachelor's degree earn the most with the average annual earnings of $70,000, while those with college or associate's degree education have the smallest earnings of $34,808.
| Educational Attainment | Male Income | Female Income |
| Less than High School | $62,679 | $0 |
| High School Diploma | $58,510 | $36,411 |
| College or Associate's Degree | $51,795 | $34,808 |
| Bachelor's Degree | $70,898 | $70,000 |
| Graduate Degree | $70,662 | $59,545 |
| Total | $56,948 | $46,844 |
Family Income in Kiel
Family Income Brackets in Kiel
According to the Kiel family income data, there are 241 families falling into the $100,000 to $149,999 income range, which is the most common income bracket and makes up 24.3% of all families.
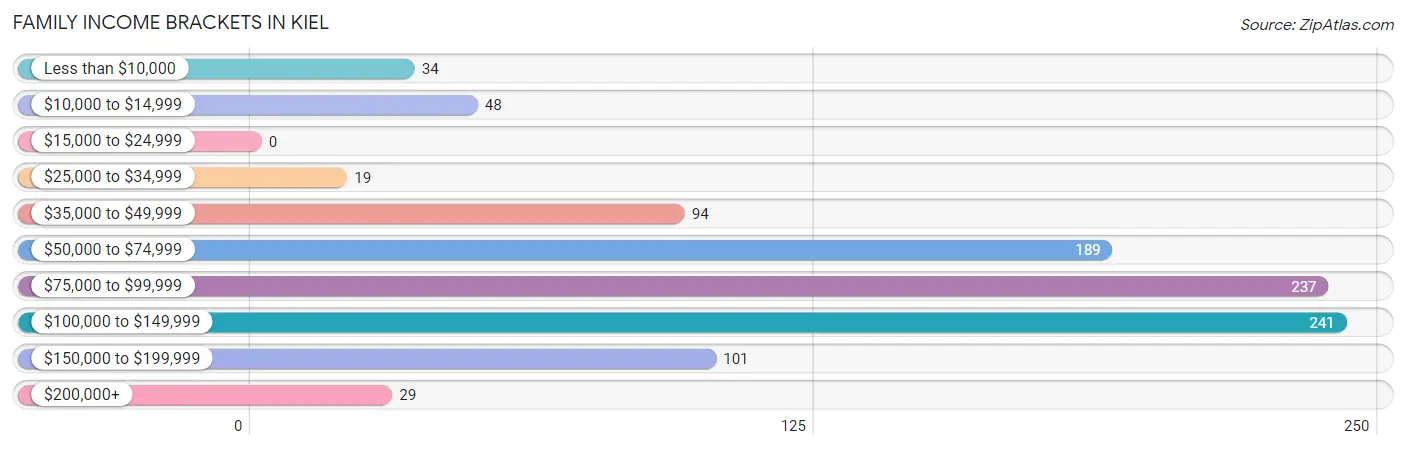
| Income Bracket | # Families | % Families |
| Less than $10,000 | 34 | 3.4% |
| $10,000 to $14,999 | 48 | 4.8% |
| $15,000 to $24,999 | 0 | 0.0% |
| $25,000 to $34,999 | 19 | 1.9% |
| $35,000 to $49,999 | 94 | 9.5% |
| $50,000 to $74,999 | 189 | 19.1% |
| $75,000 to $99,999 | 237 | 23.9% |
| $100,000 to $149,999 | 241 | 24.3% |
| $150,000 to $199,999 | 101 | 10.2% |
| $200,000+ | 29 | 2.9% |
Family Income by Famaliy Size in Kiel
4-person families (348 | 35.1%) account for the highest median family income in Kiel with $97,411 per family, while 2-person families (438 | 44.2%) have the highest median income of $36,250 per family member.
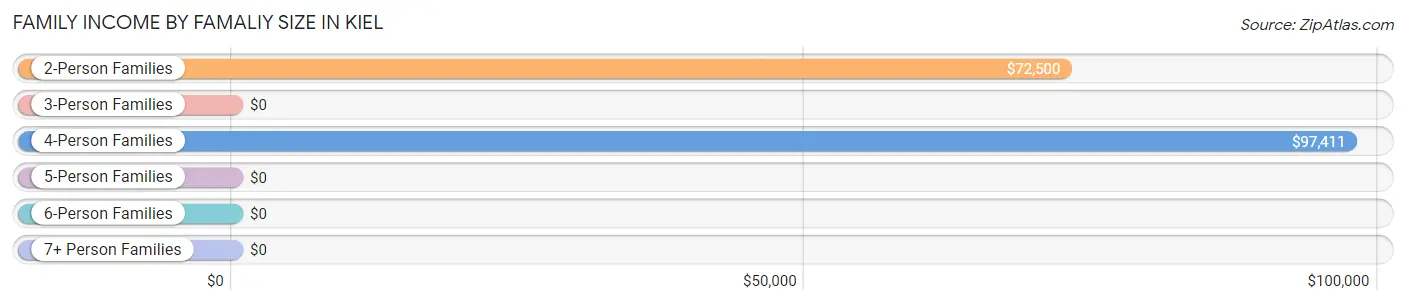
| Income Bracket | # Families | Median Income |
| 2-Person Families | 438 (44.2%) | $72,500 |
| 3-Person Families | 124 (12.5%) | $0 |
| 4-Person Families | 348 (35.1%) | $97,411 |
| 5-Person Families | 69 (7.0%) | $0 |
| 6-Person Families | 13 (1.3%) | $0 |
| 7+ Person Families | 0 (0.0%) | $0 |
| Total | 992 (100.0%) | $87,821 |
Family Income by Number of Earners in Kiel
The median family income in Kiel is $87,821, with families comprising 3+ earners (201) having the highest median family income of $125,417, while families with no earners (84) have the lowest median family income of $32,222, accounting for 20.3% and 8.5% of families, respectively.
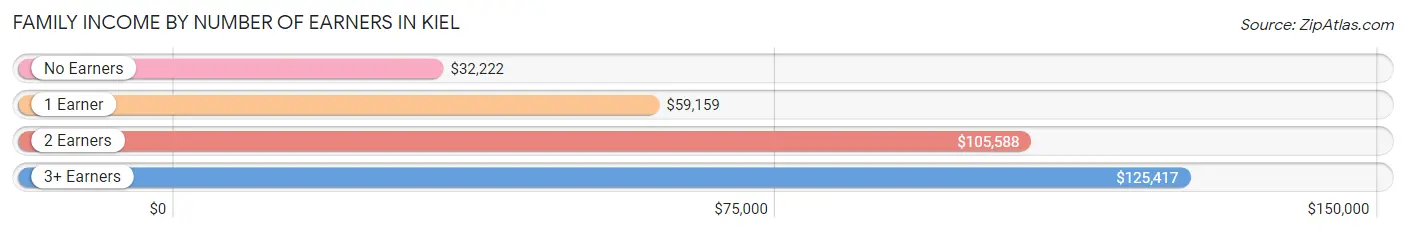
| Number of Earners | # Families | Median Income |
| No Earners | 84 (8.5%) | $32,222 |
| 1 Earner | 367 (37.0%) | $59,159 |
| 2 Earners | 340 (34.3%) | $105,588 |
| 3+ Earners | 201 (20.3%) | $125,417 |
| Total | 992 (100.0%) | $87,821 |
Household Income in Kiel
Household Income Brackets in Kiel
With 401 households falling in the category, the $50,000 to $74,999 income range is the most frequent in Kiel, accounting for 24.4% of all households. In contrast, only 39 households (2.4%) fall into the $200,000+ income bracket, making it the least populous group.
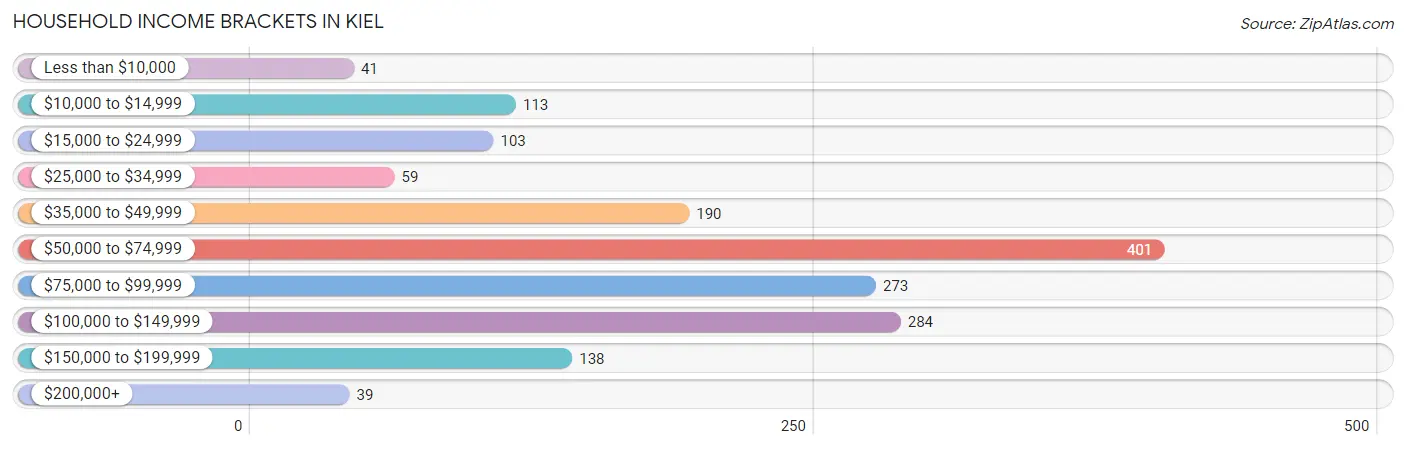
| Income Bracket | # Households | % Households |
| Less than $10,000 | 41 | 2.5% |
| $10,000 to $14,999 | 113 | 6.9% |
| $15,000 to $24,999 | 103 | 6.3% |
| $25,000 to $34,999 | 59 | 3.6% |
| $35,000 to $49,999 | 190 | 11.6% |
| $50,000 to $74,999 | 401 | 24.4% |
| $75,000 to $99,999 | 273 | 16.6% |
| $100,000 to $149,999 | 284 | 17.3% |
| $150,000 to $199,999 | 138 | 8.4% |
| $200,000+ | 39 | 2.4% |
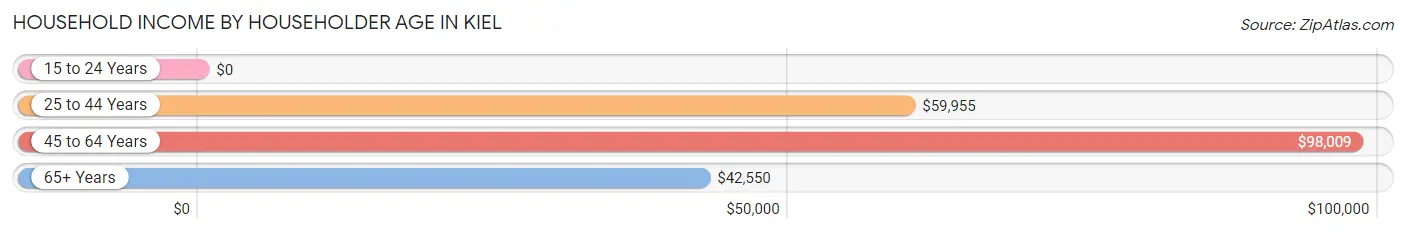
Household Income by Householder Age in Kiel
The median household income in Kiel is $71,019, with the highest median household income of $98,009 found in the 45 to 64 years age bracket for the primary householder. A total of 637 households (38.8%) fall into this category. Meanwhile, the 15 to 24 years age bracket for the primary householder has the lowest median household income of $0, with 121 households (7.4%) in this group.
| Income Bracket | # Households | Median Income |
| 15 to 24 Years | 121 (7.4%) | $0 |
| 25 to 44 Years | 479 (29.2%) | $59,955 |
| 45 to 64 Years | 637 (38.8%) | $98,009 |
| 65+ Years | 405 (24.7%) | $42,550 |
| Total | 1,642 (100.0%) | $71,019 |
Poverty in Kiel
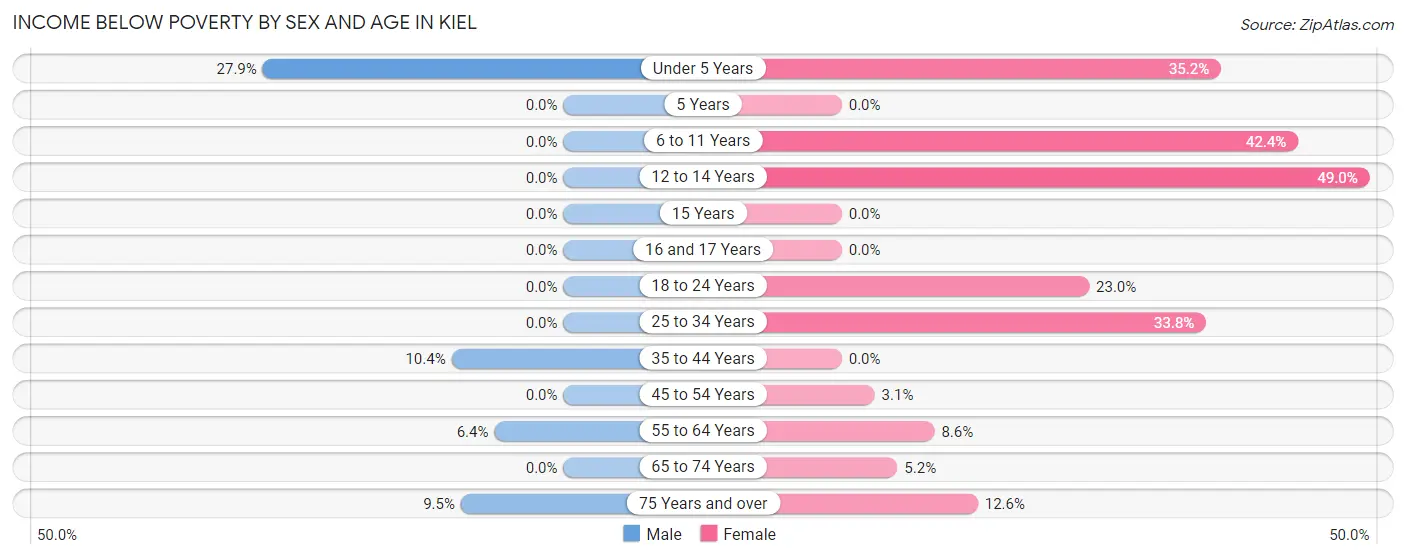
Income Below Poverty by Sex and Age in Kiel
With 4.7% poverty level for males and 17.3% for females among the residents of Kiel, under 5 year old males and 12 to 14 year old females are the most vulnerable to poverty, with 24 males (27.9%) and 48 females (49.0%) in their respective age groups living below the poverty level.
| Age Bracket | Male | Female |
| Under 5 Years | 24 (27.9%) | 57 (35.2%) |
| 5 Years | 0 (0.0%) | 0 (0.0%) |
| 6 to 11 Years | 0 (0.0%) | 36 (42.3%) |
| 12 to 14 Years | 0 (0.0%) | 48 (49.0%) |
| 15 Years | 0 (0.0%) | 0 (0.0%) |
| 16 and 17 Years | 0 (0.0%) | 0 (0.0%) |
| 18 to 24 Years | 0 (0.0%) | 42 (23.0%) |
| 25 to 34 Years | 0 (0.0%) | 95 (33.8%) |
| 35 to 44 Years | 33 (10.4%) | 0 (0.0%) |
| 45 to 54 Years | 0 (0.0%) | 9 (3.0%) |
| 55 to 64 Years | 25 (6.4%) | 16 (8.6%) |
| 65 to 74 Years | 0 (0.0%) | 8 (5.2%) |
| 75 Years and over | 8 (9.5%) | 26 (12.6%) |
| Total | 90 (4.7%) | 337 (17.3%) |
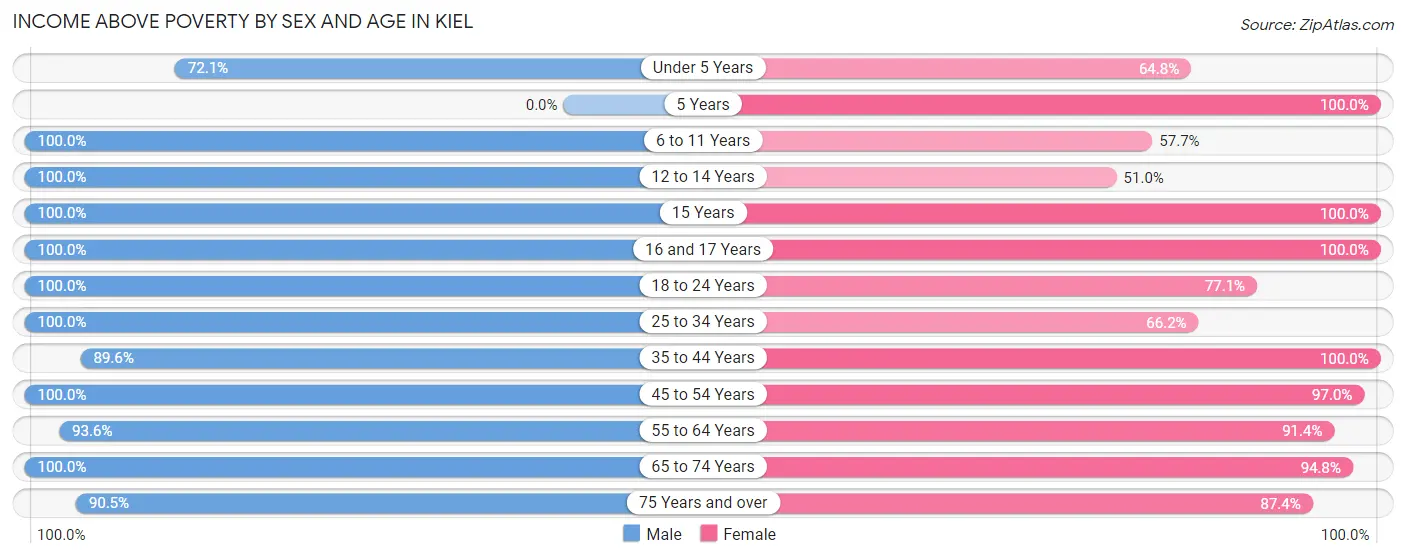
Income Above Poverty by Sex and Age in Kiel
According to the poverty statistics in Kiel, males aged 6 to 11 years and females aged 5 years are the age groups that are most secure financially, with 100.0% of males and 100.0% of females in these age groups living above the poverty line.
| Age Bracket | Male | Female |
| Under 5 Years | 62 (72.1%) | 105 (64.8%) |
| 5 Years | 0 (0.0%) | 25 (100.0%) |
| 6 to 11 Years | 175 (100.0%) | 49 (57.7%) |
| 12 to 14 Years | 42 (100.0%) | 50 (51.0%) |
| 15 Years | 26 (100.0%) | 63 (100.0%) |
| 16 and 17 Years | 53 (100.0%) | 27 (100.0%) |
| 18 to 24 Years | 161 (100.0%) | 141 (77.0%) |
| 25 to 34 Years | 207 (100.0%) | 186 (66.2%) |
| 35 to 44 Years | 285 (89.6%) | 183 (100.0%) |
| 45 to 54 Years | 219 (100.0%) | 286 (97.0%) |
| 55 to 64 Years | 365 (93.6%) | 170 (91.4%) |
| 65 to 74 Years | 140 (100.0%) | 147 (94.8%) |
| 75 Years and over | 76 (90.5%) | 180 (87.4%) |
| Total | 1,811 (95.3%) | 1,612 (82.7%) |
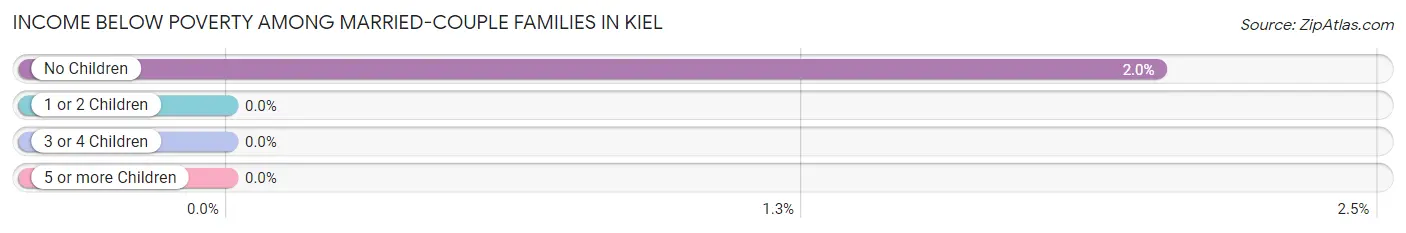
Income Below Poverty Among Married-Couple Families in Kiel
The poverty statistics for married-couple families in Kiel show that 1.1% or 8 of the total 718 families live below the poverty line. Families with no children have the highest poverty rate of 2.0%, comprising of 8 families. On the other hand, families with 1 or 2 children have the lowest poverty rate of 0.0%, which includes 0 families.
| Children | Above Poverty | Below Poverty |
| No Children | 388 (98.0%) | 8 (2.0%) |
| 1 or 2 Children | 255 (100.0%) | 0 (0.0%) |
| 3 or 4 Children | 67 (100.0%) | 0 (0.0%) |
| 5 or more Children | 0 (0.0%) | 0 (0.0%) |
| Total | 710 (98.9%) | 8 (1.1%) |
Income Below Poverty Among Single-Parent Households in Kiel
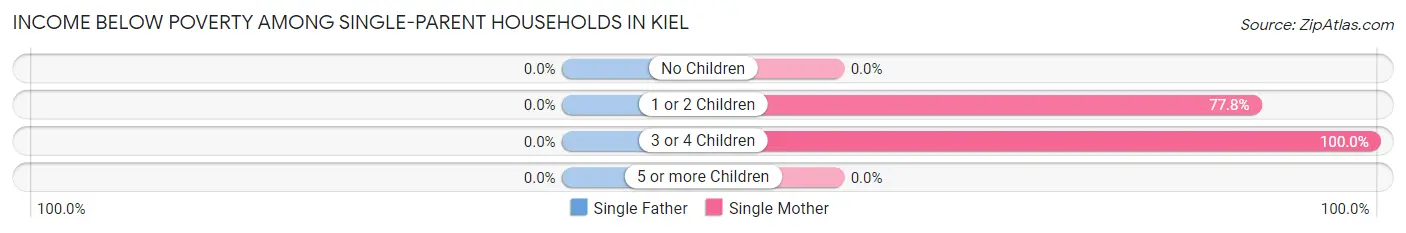
| Children | Single Father | Single Mother |
| No Children | 0 (0.0%) | 0 (0.0%) |
| 1 or 2 Children | 0 (0.0%) | 56 (77.8%) |
| 3 or 4 Children | 0 (0.0%) | 18 (100.0%) |
| 5 or more Children | 0 (0.0%) | 0 (0.0%) |
| Total | 0 (0.0%) | 74 (48.0%) |
Income Below Poverty Among Married-Couple vs Single-Parent Households in Kiel
The poverty data for Kiel shows that 8 of the married-couple family households (1.1%) and 74 of the single-parent households (27.0%) are living below the poverty level. Within the married-couple family households, those with no children have the highest poverty rate, with 8 households (2.0%) falling below the poverty line. Among the single-parent households, those with 3 or 4 children have the highest poverty rate, with 18 household (58.1%) living below poverty.
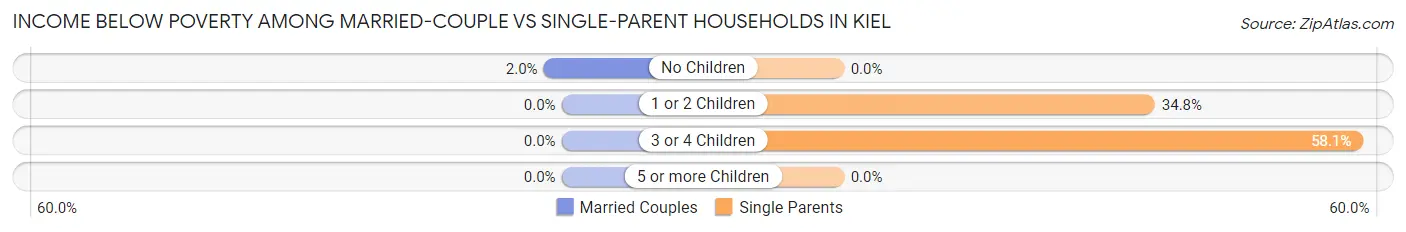
| Children | Married-Couple Families | Single-Parent Households |
| No Children | 8 (2.0%) | 0 (0.0%) |
| 1 or 2 Children | 0 (0.0%) | 56 (34.8%) |
| 3 or 4 Children | 0 (0.0%) | 18 (58.1%) |
| 5 or more Children | 0 (0.0%) | 0 (0.0%) |
| Total | 8 (1.1%) | 74 (27.0%) |
Race in Kiel
The most populous races in Kiel are White / Caucasian (3,642 | 93.9%), Two or more Races (173 | 4.5%), and Hispanic or Latino (101 | 2.6%).
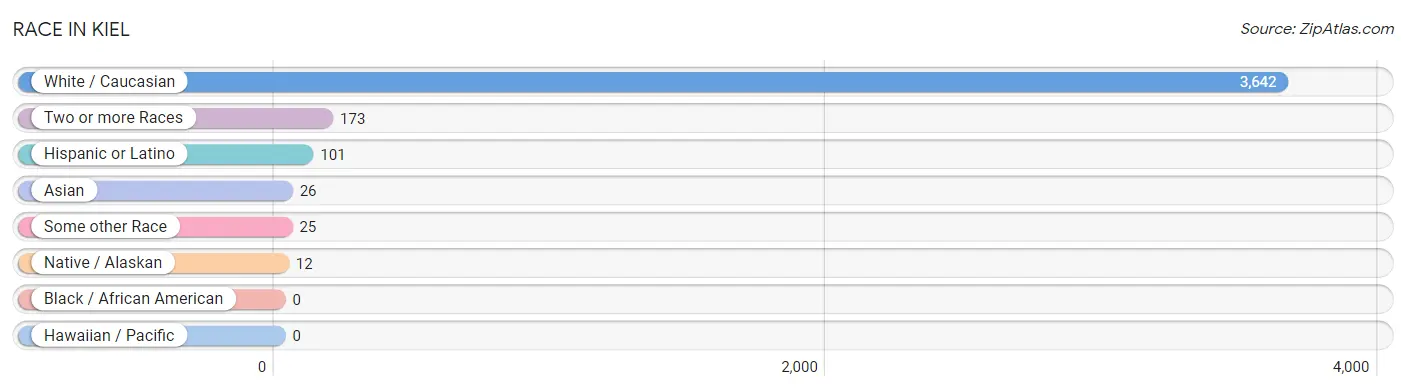
| Race | # Population | % Population |
| Asian | 26 | 0.7% |
| Black / African American | 0 | 0.0% |
| Hawaiian / Pacific | 0 | 0.0% |
| Hispanic or Latino | 101 | 2.6% |
| Native / Alaskan | 12 | 0.3% |
| White / Caucasian | 3,642 | 93.9% |
| Two or more Races | 173 | 4.5% |
| Some other Race | 25 | 0.6% |
| Total | 3,878 | 100.0% |
Ancestry in Kiel
The most populous ancestries reported in Kiel are German (2,278 | 58.7%), American (278 | 7.2%), English (226 | 5.8%), Polish (172 | 4.4%), and Irish (137 | 3.5%), together accounting for 79.7% of all Kiel residents.
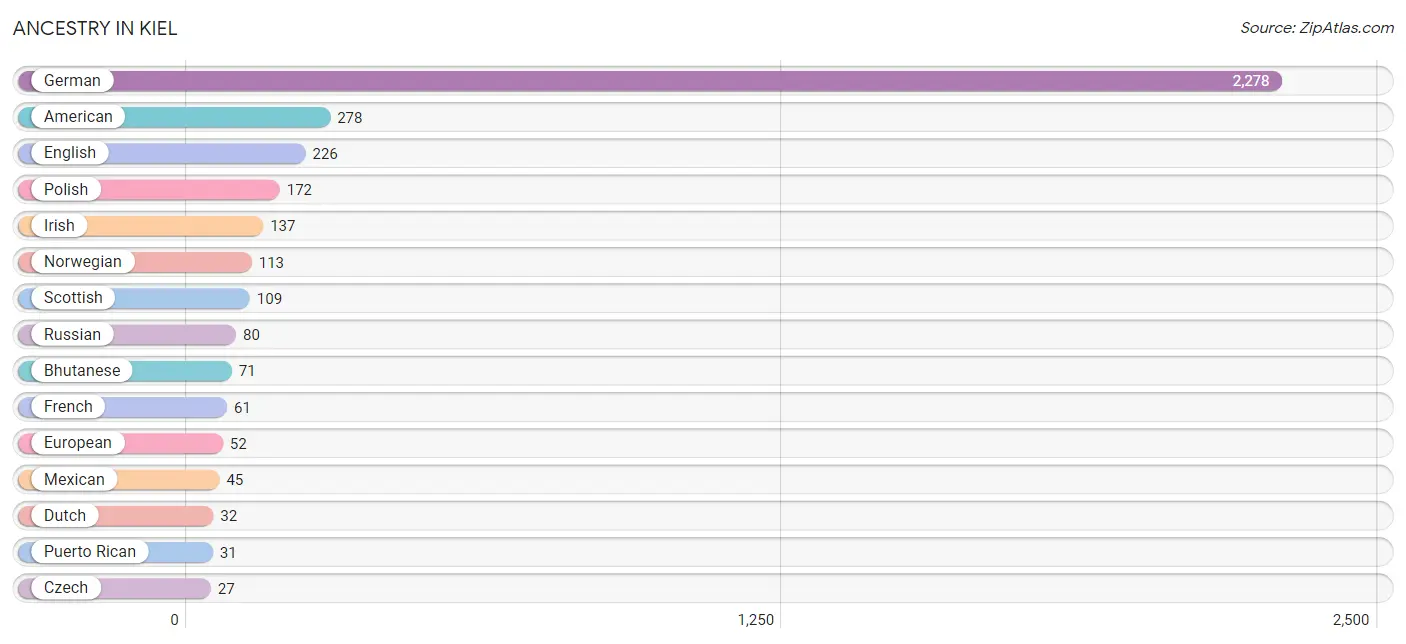
| Ancestry | # Population | % Population |
| American | 278 | 7.2% |
| Bhutanese | 71 | 1.8% |
| British | 8 | 0.2% |
| Canadian | 17 | 0.4% |
| Czech | 27 | 0.7% |
| Czechoslovakian | 9 | 0.2% |
| Dutch | 32 | 0.8% |
| English | 226 | 5.8% |
| European | 52 | 1.3% |
| French | 61 | 1.6% |
| French Canadian | 24 | 0.6% |
| German | 2,278 | 58.7% |
| Hungarian | 9 | 0.2% |
| Iranian | 9 | 0.2% |
| Irish | 137 | 3.5% |
| Iroquois | 12 | 0.3% |
| Italian | 27 | 0.7% |
| Korean | 18 | 0.5% |
| Mexican | 45 | 1.2% |
| Norwegian | 113 | 2.9% |
| Polish | 172 | 4.4% |
| Puerto Rican | 31 | 0.8% |
| Russian | 80 | 2.1% |
| Scandinavian | 6 | 0.2% |
| Scotch-Irish | 25 | 0.6% |
| Scottish | 109 | 2.8% |
| Slovene | 14 | 0.4% |
| Swedish | 27 | 0.7% |
| Thai | 8 | 0.2% |
| Welsh | 15 | 0.4% | View All 30 Rows |
Immigrants in Kiel
The most numerous immigrant groups reported in Kiel came from Europe (27 | 0.7%), Asia (26 | 0.7%), England (20 | 0.5%), Northern Europe (20 | 0.5%), and Philippines (18 | 0.5%), together accounting for 2.9% of all Kiel residents.
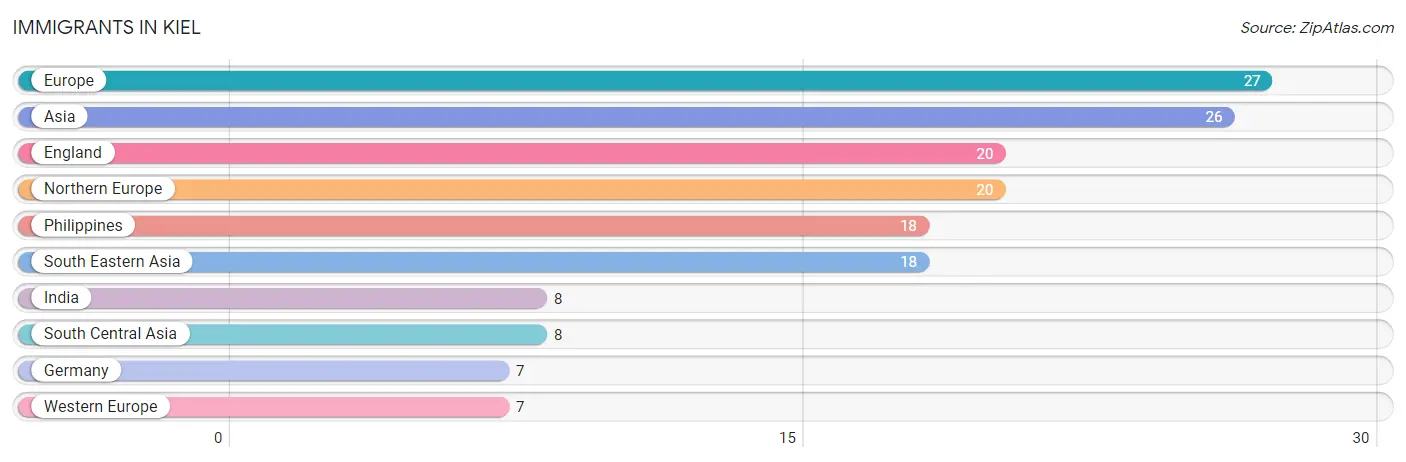
| Immigration Origin | # Population | % Population |
| Asia | 26 | 0.7% |
| England | 20 | 0.5% |
| Europe | 27 | 0.7% |
| Germany | 7 | 0.2% |
| India | 8 | 0.2% |
| Northern Europe | 20 | 0.5% |
| Philippines | 18 | 0.5% |
| South Central Asia | 8 | 0.2% |
| South Eastern Asia | 18 | 0.5% |
| Western Europe | 7 | 0.2% | View All 10 Rows |
Sex and Age in Kiel
Sex and Age in Kiel
The most populous age groups in Kiel are 55 to 59 Years (296 | 15.6%) for men and 30 to 34 Years (216 | 10.9%) for women.
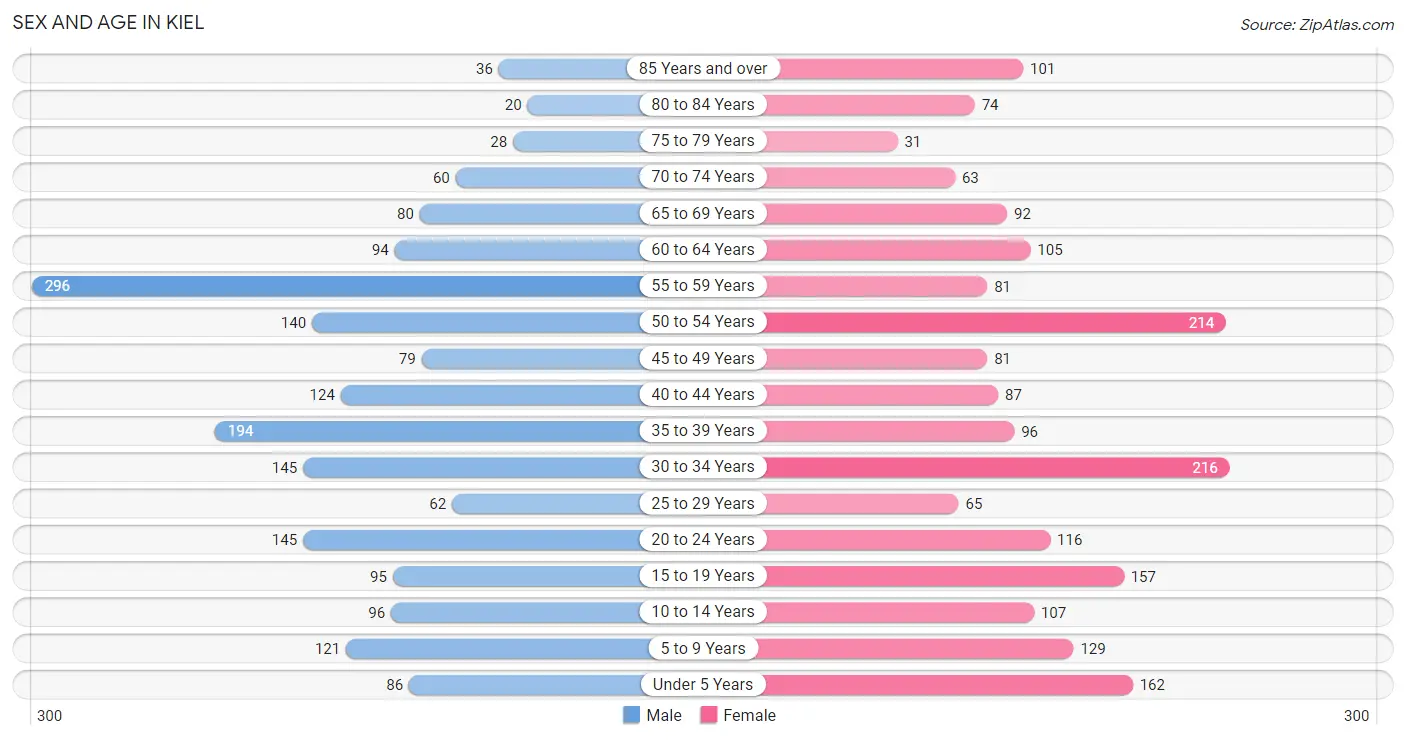
| Age Bracket | Male | Female |
| Under 5 Years | 86 (4.5%) | 162 (8.2%) |
| 5 to 9 Years | 121 (6.4%) | 129 (6.5%) |
| 10 to 14 Years | 96 (5.1%) | 107 (5.4%) |
| 15 to 19 Years | 95 (5.0%) | 157 (7.9%) |
| 20 to 24 Years | 145 (7.6%) | 116 (5.9%) |
| 25 to 29 Years | 62 (3.3%) | 65 (3.3%) |
| 30 to 34 Years | 145 (7.6%) | 216 (10.9%) |
| 35 to 39 Years | 194 (10.2%) | 96 (4.9%) |
| 40 to 44 Years | 124 (6.5%) | 87 (4.4%) |
| 45 to 49 Years | 79 (4.2%) | 81 (4.1%) |
| 50 to 54 Years | 140 (7.4%) | 214 (10.8%) |
| 55 to 59 Years | 296 (15.6%) | 81 (4.1%) |
| 60 to 64 Years | 94 (4.9%) | 105 (5.3%) |
| 65 to 69 Years | 80 (4.2%) | 92 (4.6%) |
| 70 to 74 Years | 60 (3.2%) | 63 (3.2%) |
| 75 to 79 Years | 28 (1.5%) | 31 (1.6%) |
| 80 to 84 Years | 20 (1.1%) | 74 (3.7%) |
| 85 Years and over | 36 (1.9%) | 101 (5.1%) |
| Total | 1,901 (100.0%) | 1,977 (100.0%) |
Families and Households in Kiel
Median Family Size in Kiel
The median family size in Kiel is 3.00 persons per family, with single female/mother families (154 | 15.5%) accounting for the largest median family size of 3.03 persons per family. On the other hand, married-couple families (718 | 72.4%) represent the smallest median family size with 2.99 persons per family.
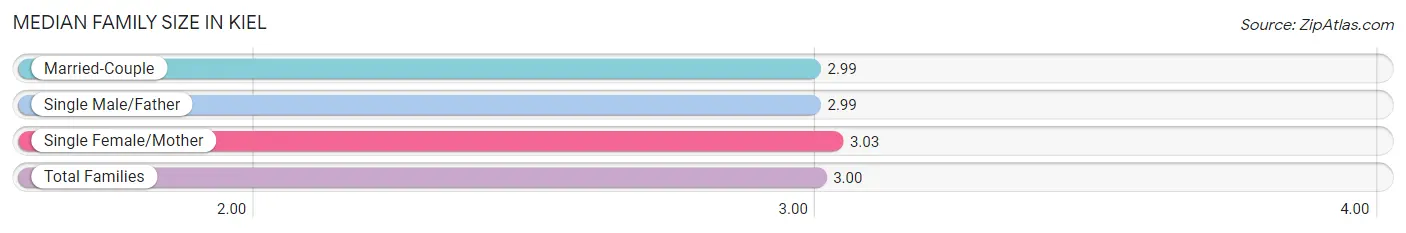
| Family Type | # Families | Family Size |
| Married-Couple | 718 (72.4%) | 2.99 |
| Single Male/Father | 120 (12.1%) | 2.99 |
| Single Female/Mother | 154 (15.5%) | 3.03 |
| Total Families | 992 (100.0%) | 3.00 |
Median Household Size in Kiel
The median household size in Kiel is 2.36 persons per household, with single female/mother households (154 | 9.4%) accounting for the largest median household size of 3.31 persons per household. non-family households (650 | 39.6%) represent the smallest median household size with 1.27 persons per household.
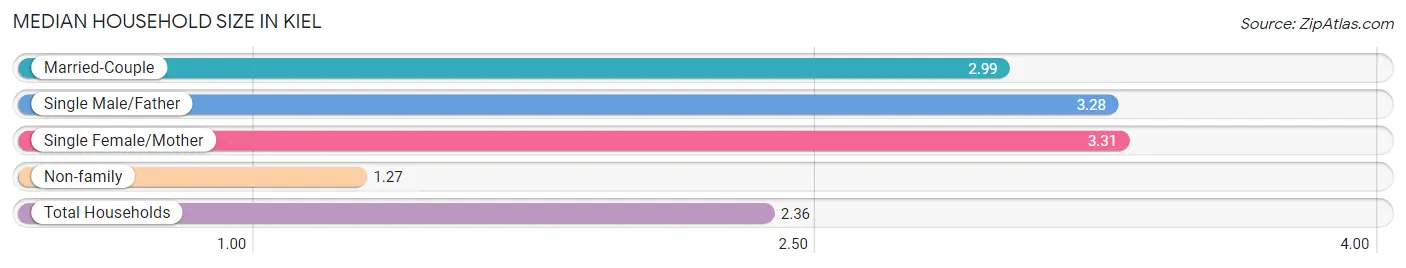
| Household Type | # Households | Household Size |
| Married-Couple | 718 (43.7%) | 2.99 |
| Single Male/Father | 120 (7.3%) | 3.28 |
| Single Female/Mother | 154 (9.4%) | 3.31 |
| Non-family | 650 (39.6%) | 1.27 |
| Total Households | 1,642 (100.0%) | 2.36 |
Household Size by Marriage Status in Kiel
Out of a total of 1,642 households in Kiel, 992 (60.4%) are family households, while 650 (39.6%) are nonfamily households. The most numerous type of family households are 2-person households, comprising 421, and the most common type of nonfamily households are 1-person households, comprising 468.
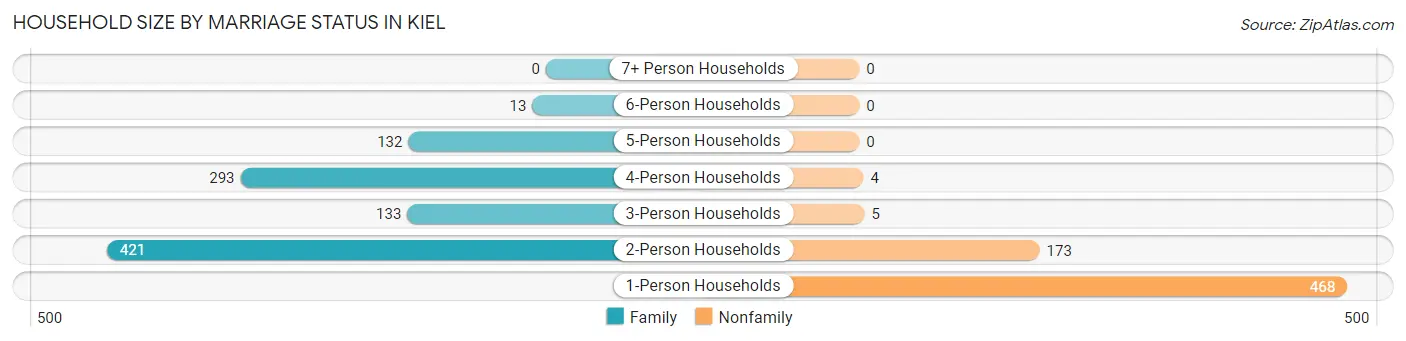
| Household Size | Family Households | Nonfamily Households |
| 1-Person Households | - | 468 (28.5%) |
| 2-Person Households | 421 (25.6%) | 173 (10.5%) |
| 3-Person Households | 133 (8.1%) | 5 (0.3%) |
| 4-Person Households | 293 (17.8%) | 4 (0.2%) |
| 5-Person Households | 132 (8.0%) | 0 (0.0%) |
| 6-Person Households | 13 (0.8%) | 0 (0.0%) |
| 7+ Person Households | 0 (0.0%) | 0 (0.0%) |
| Total | 992 (60.4%) | 650 (39.6%) |
Female Fertility in Kiel
Fertility by Age in Kiel
Average fertility rate in Kiel is 58.0 births per 1,000 women. Women in the age bracket of 20 to 34 years have the highest fertility rate with 108.0 births per 1,000 women. Women in the age bracket of 20 to 34 years acount for 87.8% of all women with births.
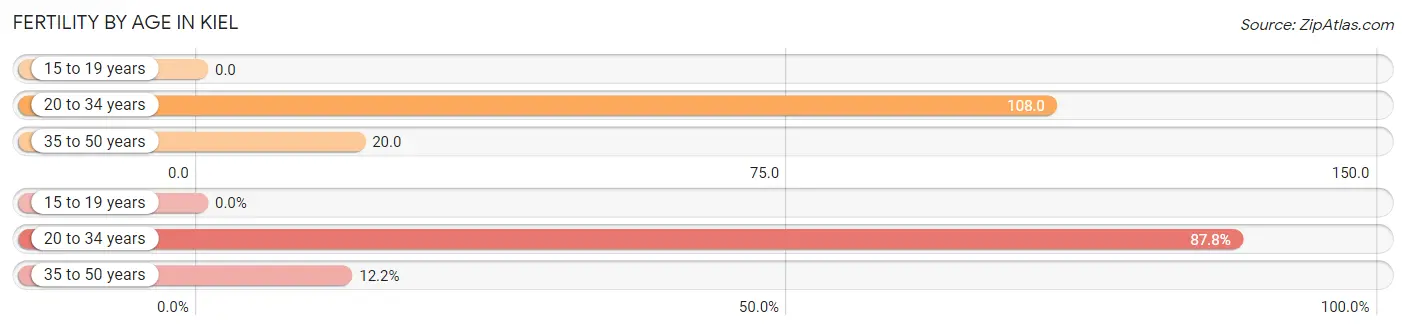
| Age Bracket | Women with Births | Births / 1,000 Women |
| 15 to 19 years | 0 (0.0%) | 0.0 |
| 20 to 34 years | 43 (87.8%) | 108.0 |
| 35 to 50 years | 6 (12.2%) | 20.0 |
| Total | 49 (100.0%) | 58.0 |
Fertility by Age by Marriage Status in Kiel
83.7% of women with births (49) in Kiel are married. The highest percentage of unmarried women with births falls into 20 to 34 years age bracket with 18.6% of them unmarried at the time of birth, while the lowest percentage of unmarried women with births belong to 35 to 50 years age bracket with 0.0% of them unmarried.
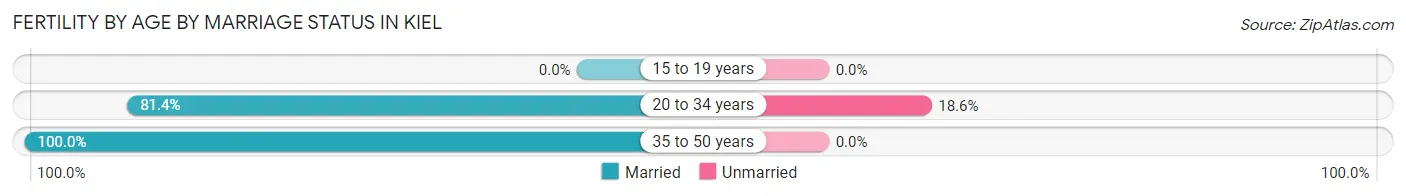
| Age Bracket | Married | Unmarried |
| 15 to 19 years | 0 (0.0%) | 0 (0.0%) |
| 20 to 34 years | 35 (81.4%) | 8 (18.6%) |
| 35 to 50 years | 6 (100.0%) | 0 (0.0%) |
| Total | 41 (83.7%) | 8 (16.3%) |
Fertility by Education in Kiel
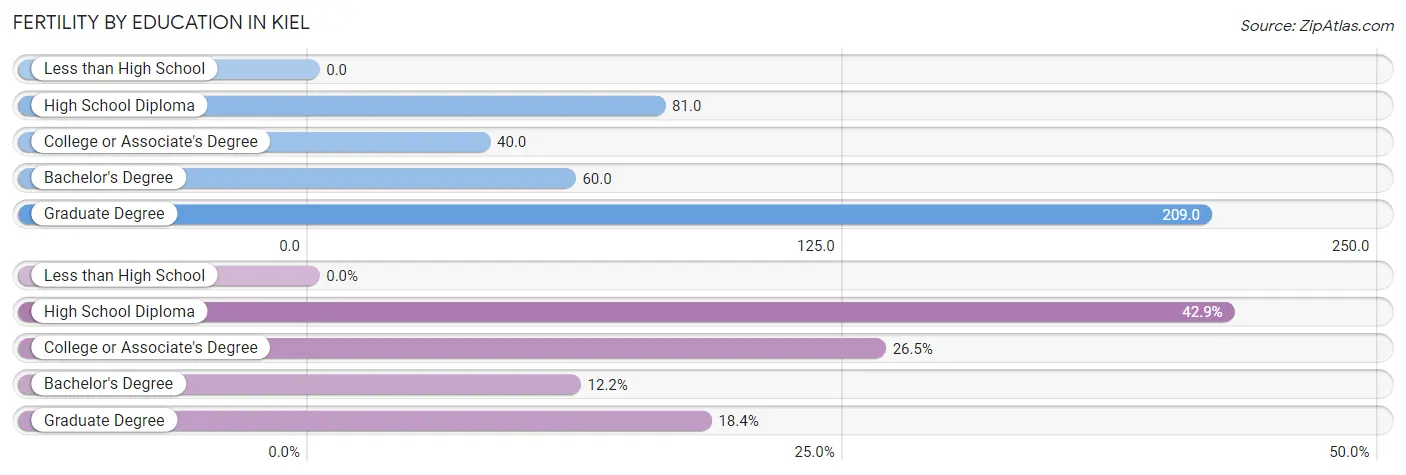
| Educational Attainment | Women with Births | Births / 1,000 Women |
| Less than High School | 0 (0.0%) | 0.0 |
| High School Diploma | 21 (42.9%) | 81.0 |
| College or Associate's Degree | 13 (26.5%) | 40.0 |
| Bachelor's Degree | 6 (12.2%) | 60.0 |
| Graduate Degree | 9 (18.4%) | 209.0 |
| Total | 49 (100.0%) | 58.0 |
Fertility by Education by Marriage Status in Kiel
16.3% of women with births in Kiel are unmarried. Women with the educational attainment of high school diploma are most likely to be married with 100.0% of them married at childbirth, while women with the educational attainment of college or associate's degree are least likely to be married with 61.5% of them unmarried at childbirth.
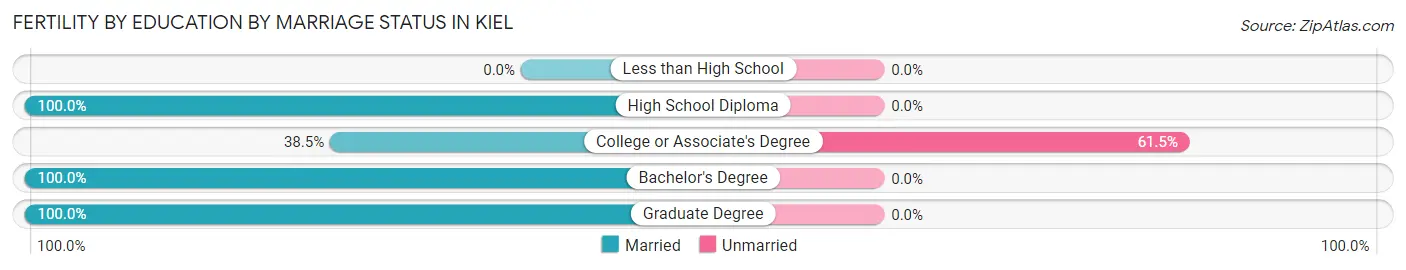
| Educational Attainment | Married | Unmarried |
| Less than High School | 0 (0.0%) | 0 (0.0%) |
| High School Diploma | 21 (100.0%) | 0 (0.0%) |
| College or Associate's Degree | 5 (38.5%) | 8 (61.5%) |
| Bachelor's Degree | 6 (100.0%) | 0 (0.0%) |
| Graduate Degree | 9 (100.0%) | 0 (0.0%) |
| Total | 41 (83.7%) | 8 (16.3%) |
Employment Characteristics in Kiel
Employment by Class of Employer in Kiel
Among the 2,124 employed individuals in Kiel, private company employees (1,544 | 72.7%), not-for-profit organizations (241 | 11.4%), and local government employees (136 | 6.4%) make up the most common classes of employment.
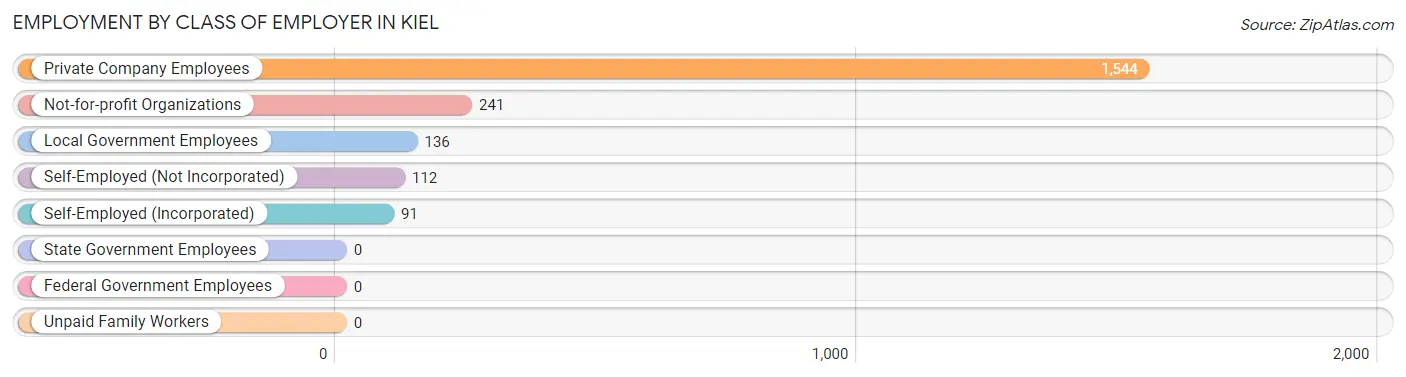
| Employer Class | # Employees | % Employees |
| Private Company Employees | 1,544 | 72.7% |
| Self-Employed (Incorporated) | 91 | 4.3% |
| Self-Employed (Not Incorporated) | 112 | 5.3% |
| Not-for-profit Organizations | 241 | 11.4% |
| Local Government Employees | 136 | 6.4% |
| State Government Employees | 0 | 0.0% |
| Federal Government Employees | 0 | 0.0% |
| Unpaid Family Workers | 0 | 0.0% |
| Total | 2,124 | 100.0% |
Employment Status by Age in Kiel
According to the labor force statistics for Kiel, out of the total population over 16 years of age (3,088), 70.7% or 2,183 individuals are in the labor force, with 2.2% or 48 of them unemployed. The age group with the highest labor force participation rate is 55 to 59 years, with 97.9% or 369 individuals in the labor force. Within the labor force, the 25 to 29 years age range has the highest percentage of unemployed individuals, with 14.1% or 10 of them being unemployed.
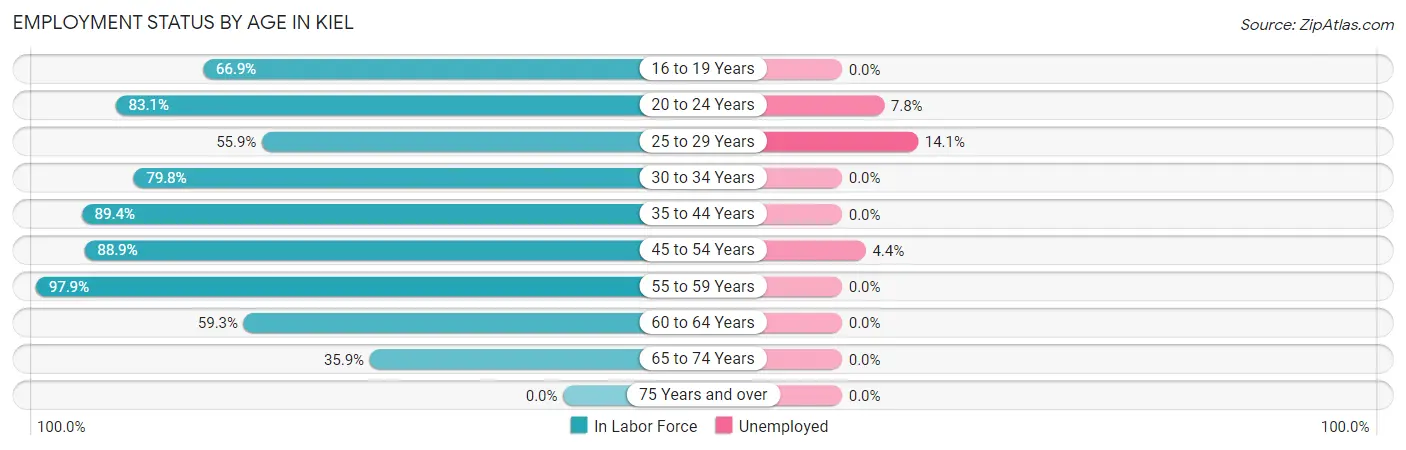
| Age Bracket | In Labor Force | Unemployed |
| 16 to 19 Years | 109 (66.9%) | 0 (0.0%) |
| 20 to 24 Years | 217 (83.1%) | 17 (7.8%) |
| 25 to 29 Years | 71 (55.9%) | 10 (14.1%) |
| 30 to 34 Years | 288 (79.8%) | 0 (0.0%) |
| 35 to 44 Years | 448 (89.4%) | 0 (0.0%) |
| 45 to 54 Years | 457 (88.9%) | 20 (4.4%) |
| 55 to 59 Years | 369 (97.9%) | 0 (0.0%) |
| 60 to 64 Years | 118 (59.3%) | 0 (0.0%) |
| 65 to 74 Years | 106 (35.9%) | 0 (0.0%) |
| 75 Years and over | 0 (0.0%) | 0 (0.0%) |
| Total | 2,183 (70.7%) | 48 (2.2%) |
Employment Status by Educational Attainment in Kiel
According to labor force statistics for Kiel, 84.2% of individuals (1,751) out of the total population between 25 and 64 years of age (2,079) are in the labor force, with 1.7% or 30 of them being unemployed. The group with the highest labor force participation rate are those with the educational attainment of bachelor's degree or higher, with 92.6% or 374 individuals in the labor force. Within the labor force, individuals with high school diploma education have the highest percentage of unemployment, with 3.1% or 20 of them being unemployed.
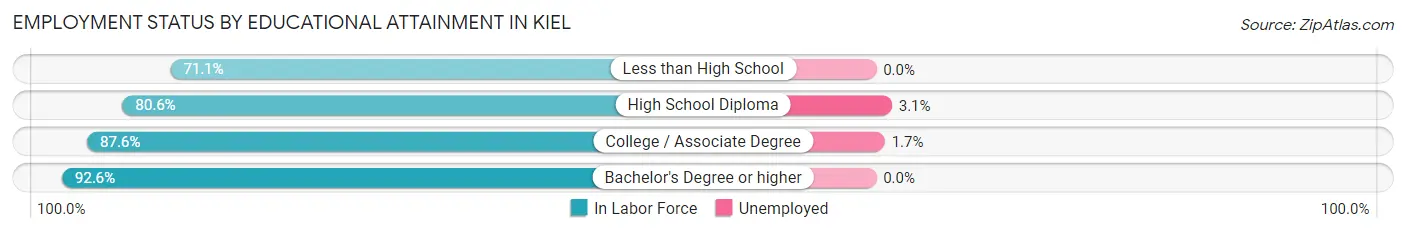
| Educational Attainment | In Labor Force | Unemployed |
| Less than High School | 150 (71.1%) | 0 (0.0%) |
| High School Diploma | 638 (80.6%) | 25 (3.1%) |
| College / Associate Degree | 589 (87.6%) | 11 (1.7%) |
| Bachelor's Degree or higher | 374 (92.6%) | 0 (0.0%) |
| Total | 1,751 (84.2%) | 35 (1.7%) |
Employment Occupations by Sex in Kiel
Management, Business, Science and Arts Occupations
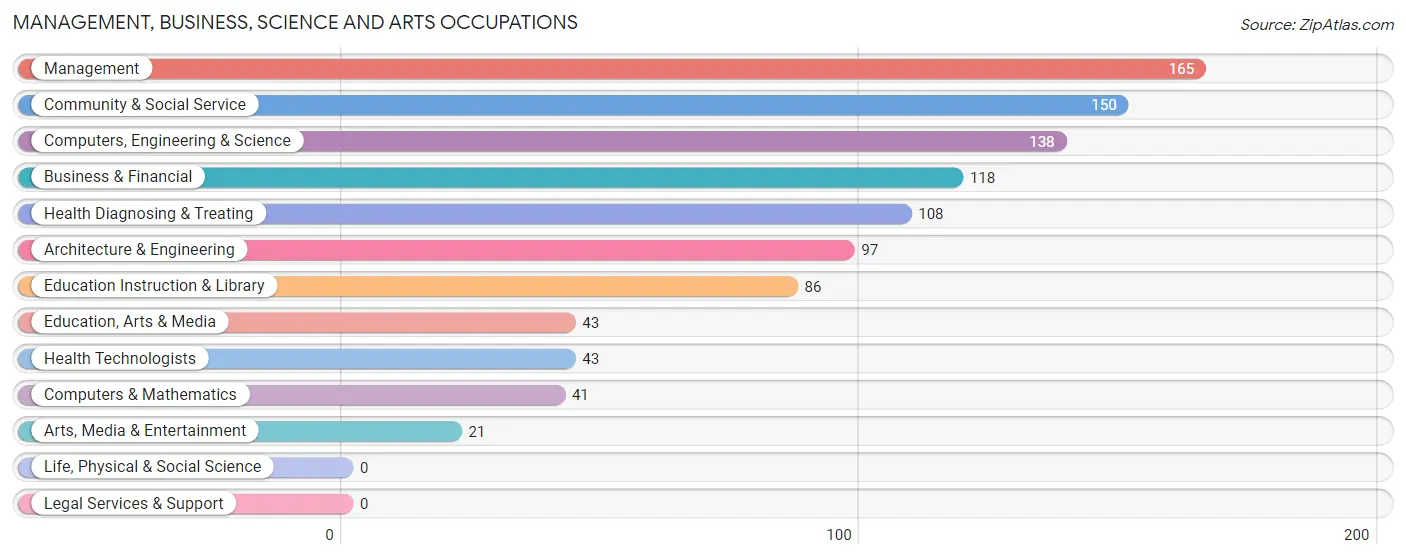
The most common Management, Business, Science and Arts occupations in Kiel are Management (165 | 7.7%), Community & Social Service (150 | 7.0%), Computers, Engineering & Science (138 | 6.5%), Business & Financial (118 | 5.5%), and Health Diagnosing & Treating (108 | 5.1%).
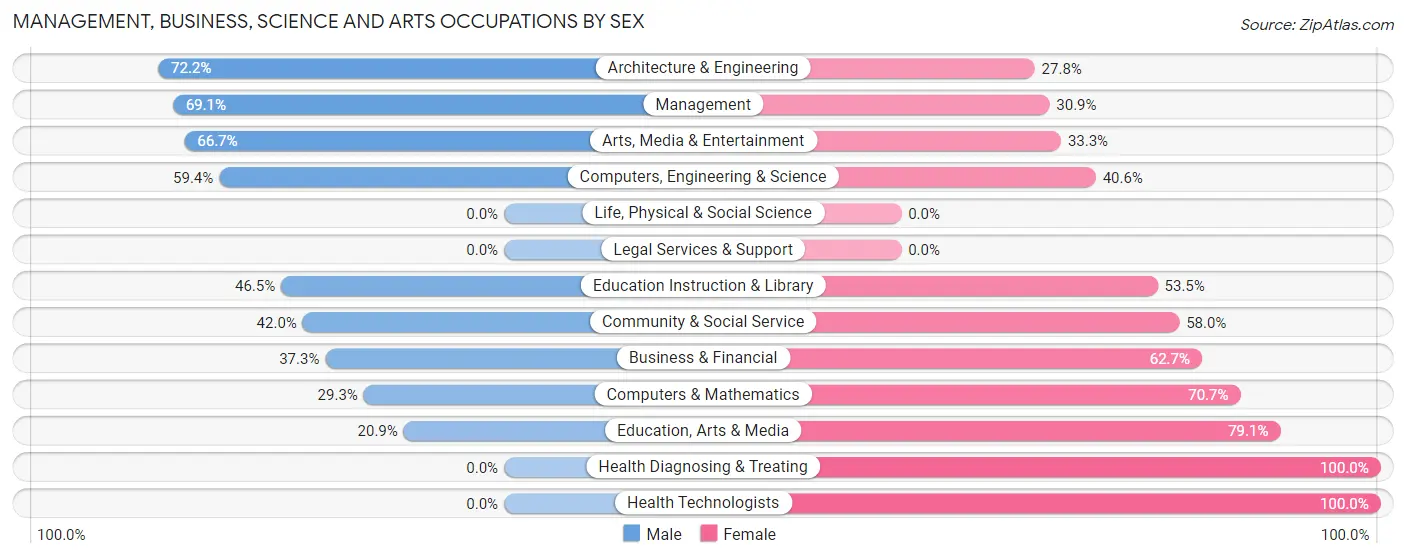
Management, Business, Science and Arts Occupations by Sex
Within the Management, Business, Science and Arts occupations in Kiel, the most male-oriented occupations are Architecture & Engineering (72.2%), Management (69.1%), and Arts, Media & Entertainment (66.7%), while the most female-oriented occupations are Health Diagnosing & Treating (100.0%), Health Technologists (100.0%), and Education, Arts & Media (79.1%).
| Occupation | Male | Female |
| Management | 114 (69.1%) | 51 (30.9%) |
| Business & Financial | 44 (37.3%) | 74 (62.7%) |
| Computers, Engineering & Science | 82 (59.4%) | 56 (40.6%) |
| Computers & Mathematics | 12 (29.3%) | 29 (70.7%) |
| Architecture & Engineering | 70 (72.2%) | 27 (27.8%) |
| Life, Physical & Social Science | 0 (0.0%) | 0 (0.0%) |
| Community & Social Service | 63 (42.0%) | 87 (58.0%) |
| Education, Arts & Media | 9 (20.9%) | 34 (79.1%) |
| Legal Services & Support | 0 (0.0%) | 0 (0.0%) |
| Education Instruction & Library | 40 (46.5%) | 46 (53.5%) |
| Arts, Media & Entertainment | 14 (66.7%) | 7 (33.3%) |
| Health Diagnosing & Treating | 0 (0.0%) | 108 (100.0%) |
| Health Technologists | 0 (0.0%) | 43 (100.0%) |
| Total (Category) | 303 (44.6%) | 376 (55.4%) |
| Total (Overall) | 1,237 (57.9%) | 899 (42.1%) |
Services Occupations
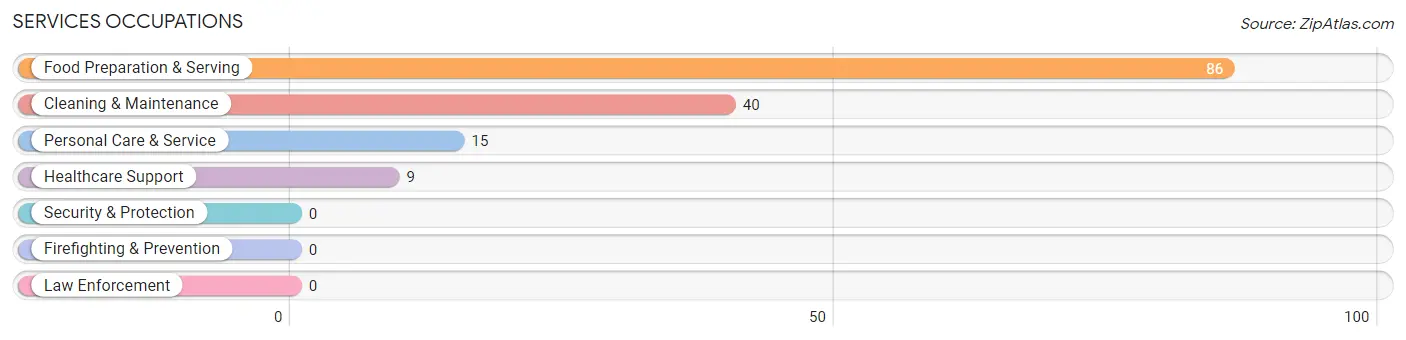
The most common Services occupations in Kiel are Food Preparation & Serving (86 | 4.0%), Cleaning & Maintenance (40 | 1.9%), Personal Care & Service (15 | 0.7%), and Healthcare Support (9 | 0.4%).
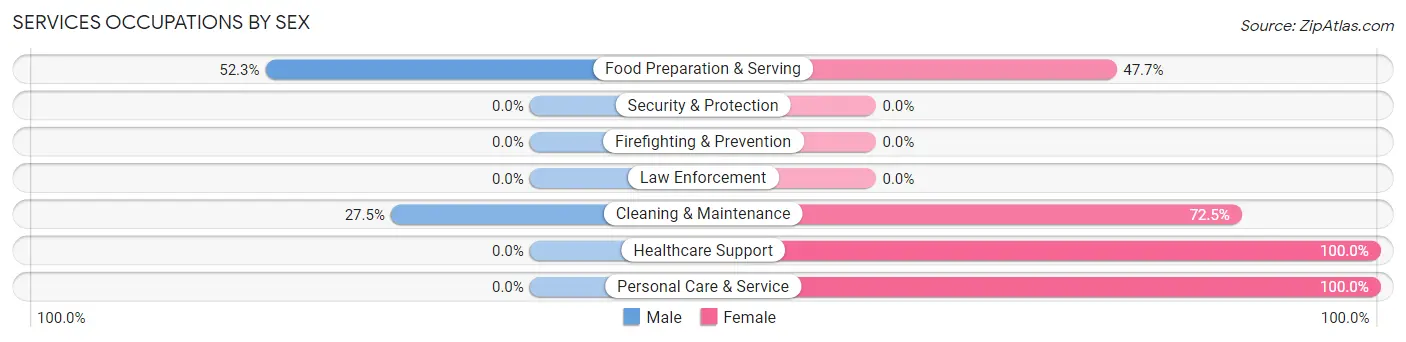
Services Occupations by Sex
Within the Services occupations in Kiel, the most male-oriented occupations are Food Preparation & Serving (52.3%), and Cleaning & Maintenance (27.5%), while the most female-oriented occupations are Healthcare Support (100.0%), Personal Care & Service (100.0%), and Cleaning & Maintenance (72.5%).
| Occupation | Male | Female |
| Healthcare Support | 0 (0.0%) | 9 (100.0%) |
| Security & Protection | 0 (0.0%) | 0 (0.0%) |
| Firefighting & Prevention | 0 (0.0%) | 0 (0.0%) |
| Law Enforcement | 0 (0.0%) | 0 (0.0%) |
| Food Preparation & Serving | 45 (52.3%) | 41 (47.7%) |
| Cleaning & Maintenance | 11 (27.5%) | 29 (72.5%) |
| Personal Care & Service | 0 (0.0%) | 15 (100.0%) |
| Total (Category) | 56 (37.3%) | 94 (62.7%) |
| Total (Overall) | 1,237 (57.9%) | 899 (42.1%) |
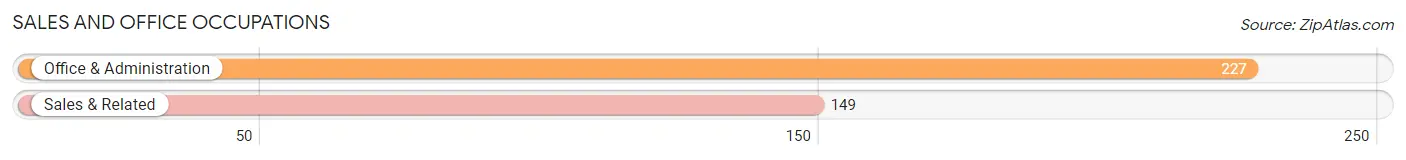
Sales and Office Occupations
The most common Sales and Office occupations in Kiel are Office & Administration (227 | 10.6%), and Sales & Related (149 | 7.0%).
Sales and Office Occupations by Sex
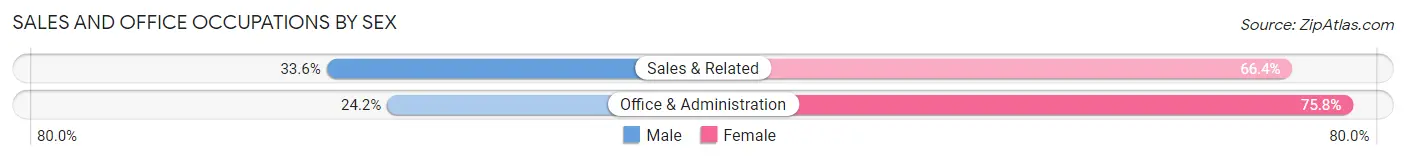
| Occupation | Male | Female |
| Sales & Related | 50 (33.6%) | 99 (66.4%) |
| Office & Administration | 55 (24.2%) | 172 (75.8%) |
| Total (Category) | 105 (27.9%) | 271 (72.1%) |
| Total (Overall) | 1,237 (57.9%) | 899 (42.1%) |
Natural Resources, Construction and Maintenance Occupations
The most common Natural Resources, Construction and Maintenance occupations in Kiel are Installation, Maintenance & Repair (85 | 4.0%), Construction & Extraction (83 | 3.9%), and Farming, Fishing & Forestry (30 | 1.4%).

Natural Resources, Construction and Maintenance Occupations by Sex
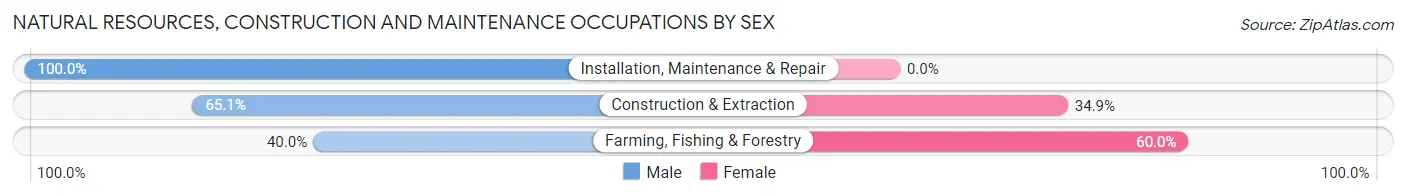
| Occupation | Male | Female |
| Farming, Fishing & Forestry | 12 (40.0%) | 18 (60.0%) |
| Construction & Extraction | 54 (65.1%) | 29 (34.9%) |
| Installation, Maintenance & Repair | 85 (100.0%) | 0 (0.0%) |
| Total (Category) | 151 (76.3%) | 47 (23.7%) |
| Total (Overall) | 1,237 (57.9%) | 899 (42.1%) |
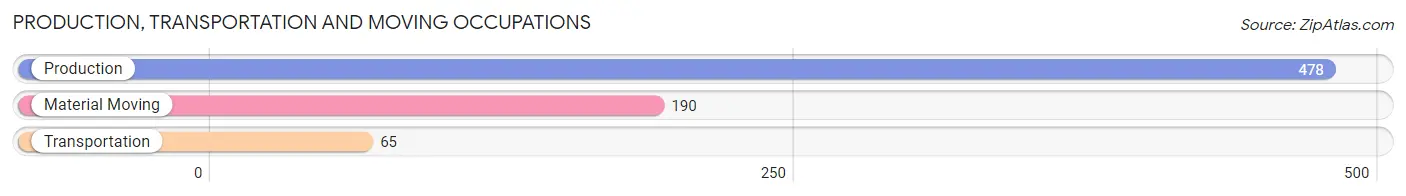
Production, Transportation and Moving Occupations
The most common Production, Transportation and Moving occupations in Kiel are Production (478 | 22.4%), Material Moving (190 | 8.9%), and Transportation (65 | 3.0%).
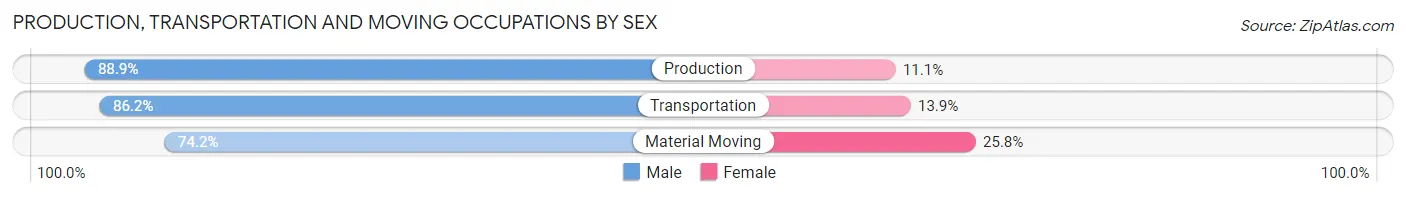
Production, Transportation and Moving Occupations by Sex
| Occupation | Male | Female |
| Production | 425 (88.9%) | 53 (11.1%) |
| Transportation | 56 (86.2%) | 9 (13.9%) |
| Material Moving | 141 (74.2%) | 49 (25.8%) |
| Total (Category) | 622 (84.9%) | 111 (15.1%) |
| Total (Overall) | 1,237 (57.9%) | 899 (42.1%) |
Employment Industries by Sex in Kiel
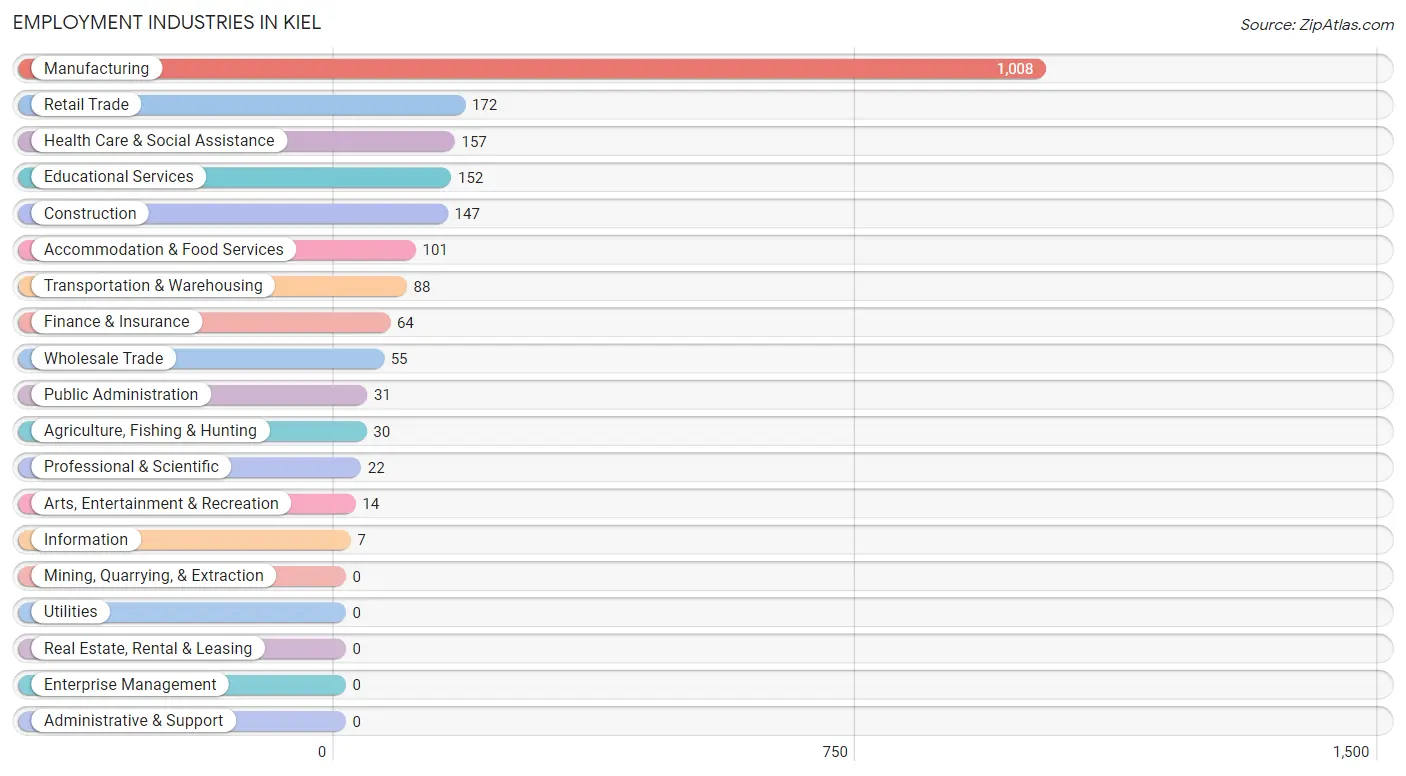
Employment Industries in Kiel
The major employment industries in Kiel include Manufacturing (1,008 | 47.2%), Retail Trade (172 | 8.1%), Health Care & Social Assistance (157 | 7.3%), Educational Services (152 | 7.1%), and Construction (147 | 6.9%).
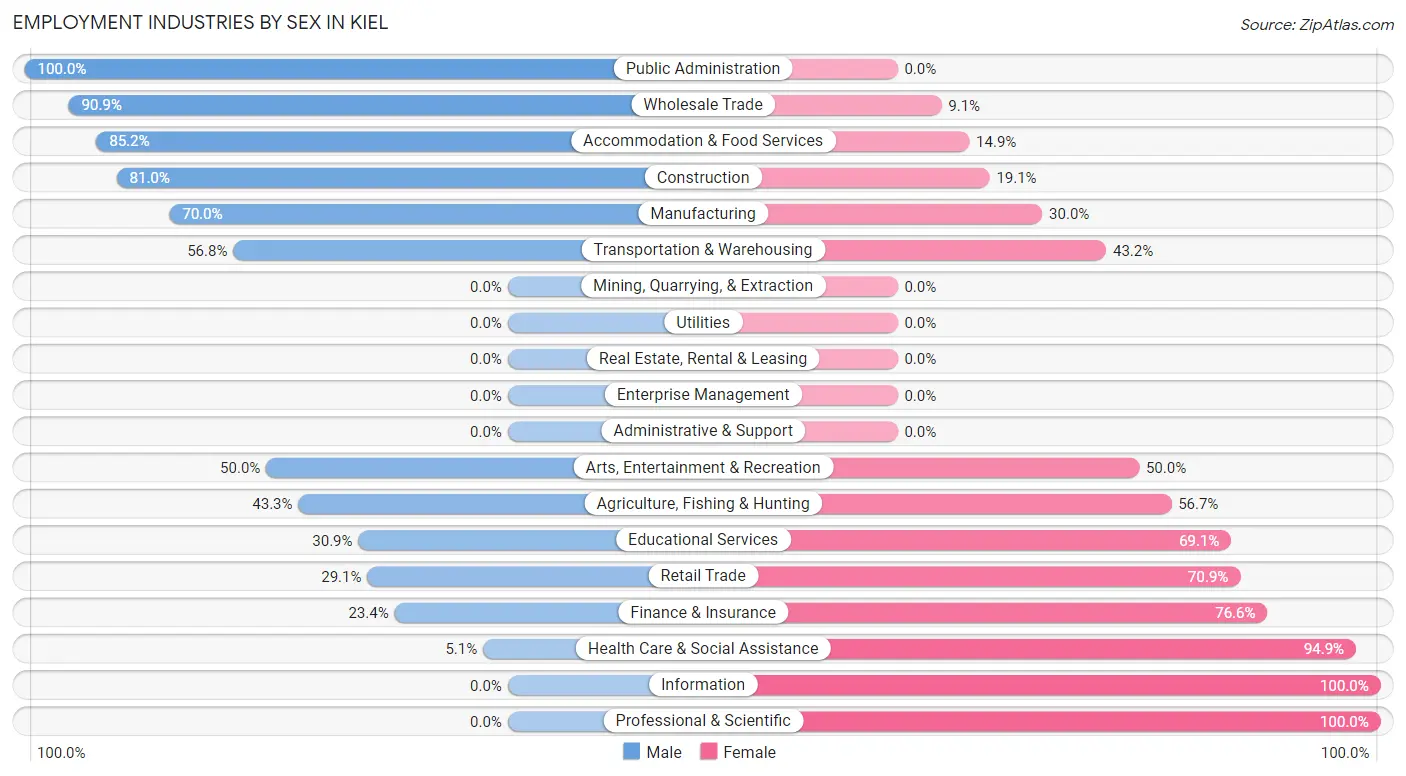
Employment Industries by Sex in Kiel
The Kiel industries that see more men than women are Public Administration (100.0%), Wholesale Trade (90.9%), and Accommodation & Food Services (85.2%), whereas the industries that tend to have a higher number of women are Information (100.0%), Professional & Scientific (100.0%), and Health Care & Social Assistance (94.9%).
| Industry | Male | Female |
| Agriculture, Fishing & Hunting | 13 (43.3%) | 17 (56.7%) |
| Mining, Quarrying, & Extraction | 0 (0.0%) | 0 (0.0%) |
| Construction | 119 (80.9%) | 28 (19.1%) |
| Manufacturing | 706 (70.0%) | 302 (30.0%) |
| Wholesale Trade | 50 (90.9%) | 5 (9.1%) |
| Retail Trade | 50 (29.1%) | 122 (70.9%) |
| Transportation & Warehousing | 50 (56.8%) | 38 (43.2%) |
| Utilities | 0 (0.0%) | 0 (0.0%) |
| Information | 0 (0.0%) | 7 (100.0%) |
| Finance & Insurance | 15 (23.4%) | 49 (76.6%) |
| Real Estate, Rental & Leasing | 0 (0.0%) | 0 (0.0%) |
| Professional & Scientific | 0 (0.0%) | 22 (100.0%) |
| Enterprise Management | 0 (0.0%) | 0 (0.0%) |
| Administrative & Support | 0 (0.0%) | 0 (0.0%) |
| Educational Services | 47 (30.9%) | 105 (69.1%) |
| Health Care & Social Assistance | 8 (5.1%) | 149 (94.9%) |
| Arts, Entertainment & Recreation | 7 (50.0%) | 7 (50.0%) |
| Accommodation & Food Services | 86 (85.2%) | 15 (14.8%) |
| Public Administration | 31 (100.0%) | 0 (0.0%) |
| Total | 1,237 (57.9%) | 899 (42.1%) |
Education in Kiel
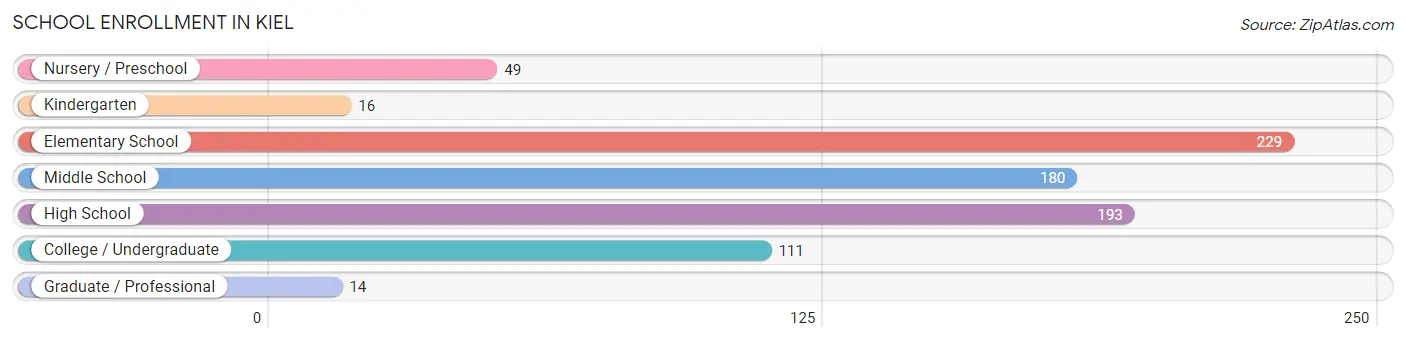
School Enrollment in Kiel
The most common levels of schooling among the 792 students in Kiel are elementary school (229 | 28.9%), high school (193 | 24.4%), and middle school (180 | 22.7%).
| School Level | # Students | % Students |
| Nursery / Preschool | 49 | 6.2% |
| Kindergarten | 16 | 2.0% |
| Elementary School | 229 | 28.9% |
| Middle School | 180 | 22.7% |
| High School | 193 | 24.4% |
| College / Undergraduate | 111 | 14.0% |
| Graduate / Professional | 14 | 1.8% |
| Total | 792 | 100.0% |
School Enrollment by Age by Funding Source in Kiel
Out of a total of 792 students who are enrolled in schools in Kiel, 70 (8.8%) attend a private institution, while the remaining 722 (91.2%) are enrolled in public schools. The age group of 35 years and over has the highest likelihood of being enrolled in private schools, with 7 (50.0% in the age bracket) enrolled. Conversely, the age group of 10 to 14 year olds has the lowest likelihood of being enrolled in a private school, with 189 (100.0% in the age bracket) attending a public institution.
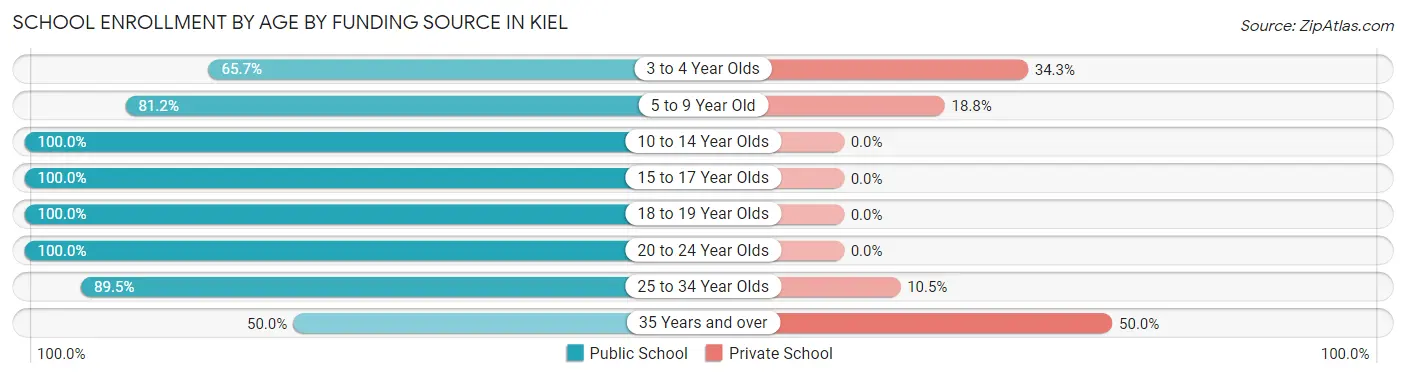
| Age Bracket | Public School | Private School |
| 3 to 4 Year Olds | 23 (65.7%) | 12 (34.3%) |
| 5 to 9 Year Old | 203 (81.2%) | 47 (18.8%) |
| 10 to 14 Year Olds | 189 (100.0%) | 0 (0.0%) |
| 15 to 17 Year Olds | 169 (100.0%) | 0 (0.0%) |
| 18 to 19 Year Olds | 33 (100.0%) | 0 (0.0%) |
| 20 to 24 Year Olds | 64 (100.0%) | 0 (0.0%) |
| 25 to 34 Year Olds | 34 (89.5%) | 4 (10.5%) |
| 35 Years and over | 7 (50.0%) | 7 (50.0%) |
| Total | 722 (91.2%) | 70 (8.8%) |
Educational Attainment by Field of Study in Kiel
Business (138 | 25.1%), education (119 | 21.6%), science & technology (68 | 12.3%), engineering (59 | 10.7%), and psychology (40 | 7.3%) are the most common fields of study among 551 individuals in Kiel who have obtained a bachelor's degree or higher.
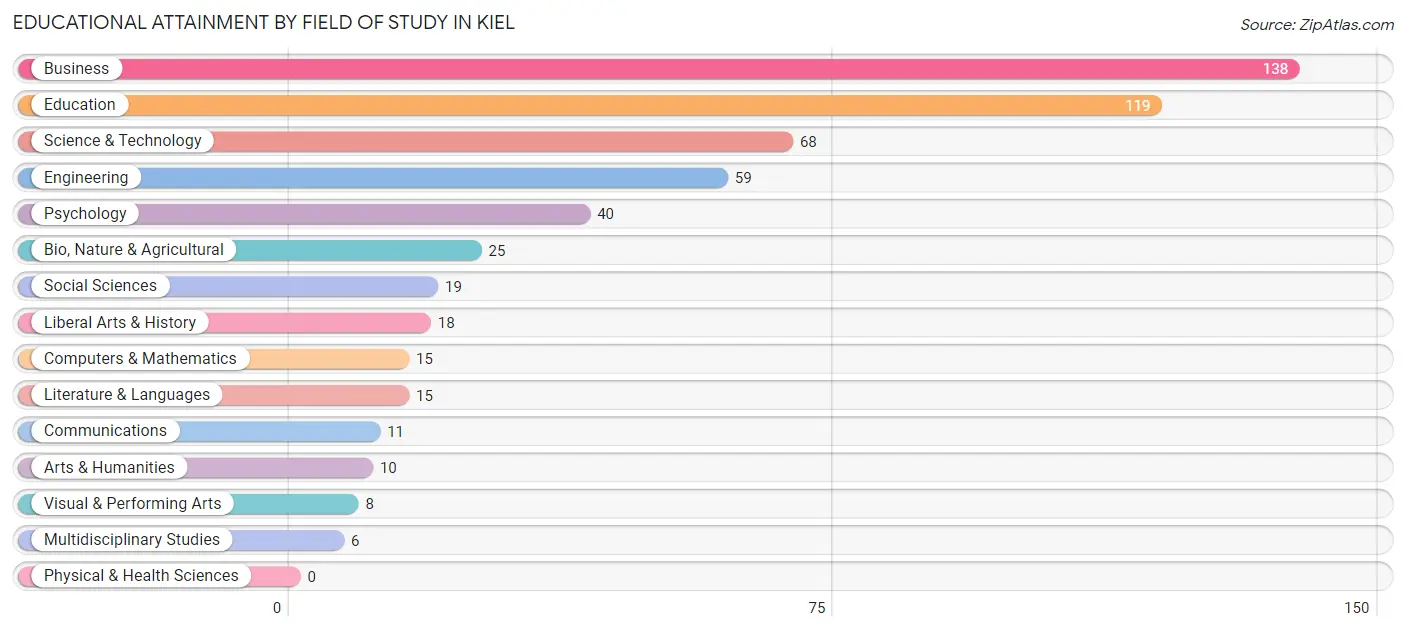
| Field of Study | # Graduates | % Graduates |
| Computers & Mathematics | 15 | 2.7% |
| Bio, Nature & Agricultural | 25 | 4.5% |
| Physical & Health Sciences | 0 | 0.0% |
| Psychology | 40 | 7.3% |
| Social Sciences | 19 | 3.5% |
| Engineering | 59 | 10.7% |
| Multidisciplinary Studies | 6 | 1.1% |
| Science & Technology | 68 | 12.3% |
| Business | 138 | 25.1% |
| Education | 119 | 21.6% |
| Literature & Languages | 15 | 2.7% |
| Liberal Arts & History | 18 | 3.3% |
| Visual & Performing Arts | 8 | 1.5% |
| Communications | 11 | 2.0% |
| Arts & Humanities | 10 | 1.8% |
| Total | 551 | 100.0% |
Transportation & Commute in Kiel
Vehicle Availability by Sex in Kiel
The most prevalent vehicle ownership categories in Kiel are males with 2 vehicles (576, accounting for 46.6%) and females with 2 vehicles (384, making up 64.9%).
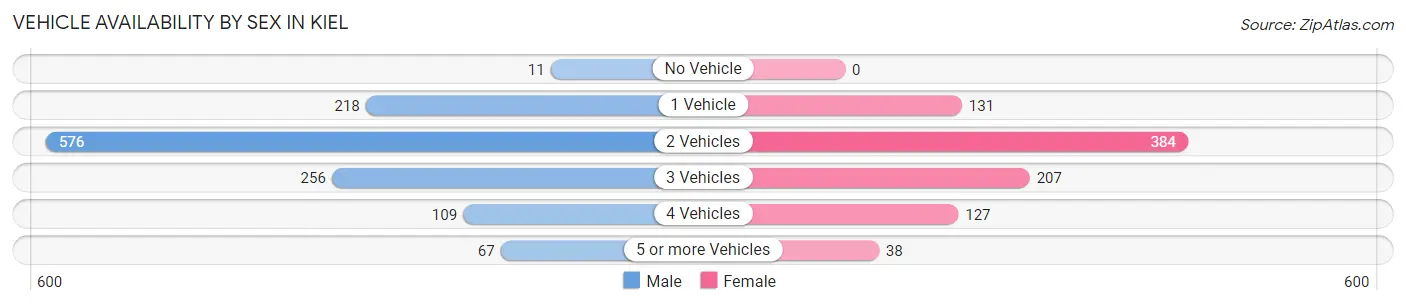
| Vehicles Available | Male | Female |
| No Vehicle | 11 (0.9%) | 0 (0.0%) |
| 1 Vehicle | 218 (17.6%) | 131 (14.8%) |
| 2 Vehicles | 576 (46.6%) | 384 (43.3%) |
| 3 Vehicles | 256 (20.7%) | 207 (23.3%) |
| 4 Vehicles | 109 (8.8%) | 127 (14.3%) |
| 5 or more Vehicles | 67 (5.4%) | 38 (4.3%) |
| Total | 1,237 (100.0%) | 887 (100.0%) |
Commute Time in Kiel
The most frequently occuring commute durations in Kiel are 5 to 9 minutes (407 commuters, 20.4%), less than 5 minutes (327 commuters, 16.4%), and 20 to 24 minutes (254 commuters, 12.7%).
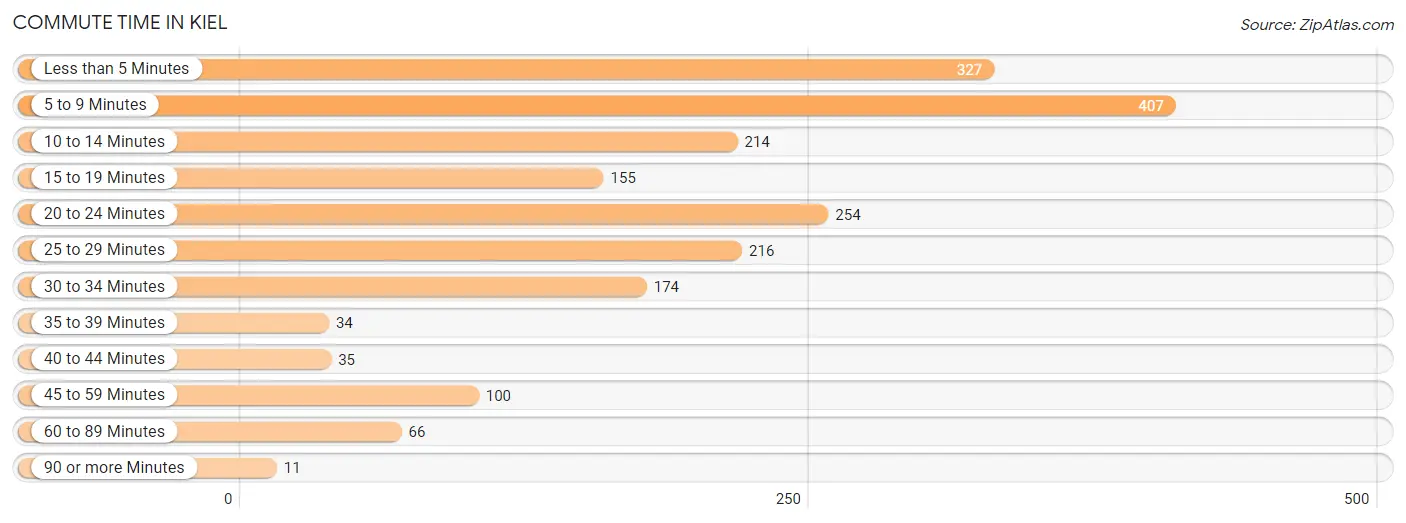
| Commute Time | # Commuters | % Commuters |
| Less than 5 Minutes | 327 | 16.4% |
| 5 to 9 Minutes | 407 | 20.4% |
| 10 to 14 Minutes | 214 | 10.7% |
| 15 to 19 Minutes | 155 | 7.8% |
| 20 to 24 Minutes | 254 | 12.7% |
| 25 to 29 Minutes | 216 | 10.8% |
| 30 to 34 Minutes | 174 | 8.7% |
| 35 to 39 Minutes | 34 | 1.7% |
| 40 to 44 Minutes | 35 | 1.8% |
| 45 to 59 Minutes | 100 | 5.0% |
| 60 to 89 Minutes | 66 | 3.3% |
| 90 or more Minutes | 11 | 0.5% |
Commute Time by Sex in Kiel
The most common commute times in Kiel are 5 to 9 minutes (248 commuters, 21.2%) for males and less than 5 minutes (166 commuters, 20.2%) for females.
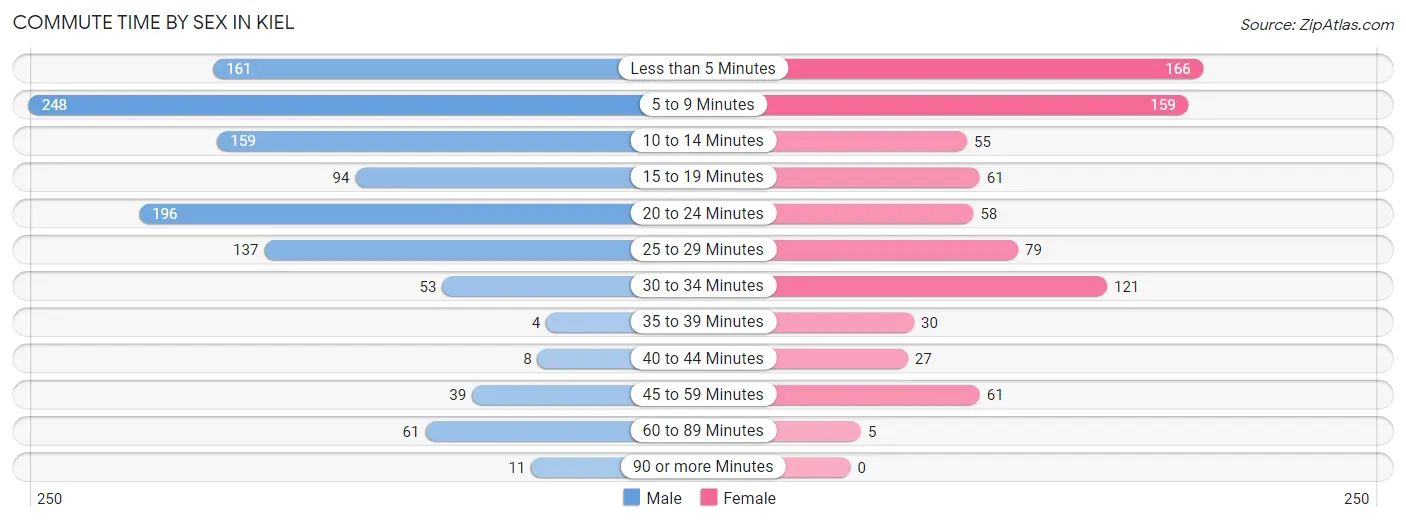
| Commute Time | Male | Female |
| Less than 5 Minutes | 161 (13.8%) | 166 (20.2%) |
| 5 to 9 Minutes | 248 (21.2%) | 159 (19.3%) |
| 10 to 14 Minutes | 159 (13.6%) | 55 (6.7%) |
| 15 to 19 Minutes | 94 (8.0%) | 61 (7.4%) |
| 20 to 24 Minutes | 196 (16.7%) | 58 (7.1%) |
| 25 to 29 Minutes | 137 (11.7%) | 79 (9.6%) |
| 30 to 34 Minutes | 53 (4.5%) | 121 (14.7%) |
| 35 to 39 Minutes | 4 (0.3%) | 30 (3.6%) |
| 40 to 44 Minutes | 8 (0.7%) | 27 (3.3%) |
| 45 to 59 Minutes | 39 (3.3%) | 61 (7.4%) |
| 60 to 89 Minutes | 61 (5.2%) | 5 (0.6%) |
| 90 or more Minutes | 11 (0.9%) | 0 (0.0%) |
Time of Departure to Work by Sex in Kiel
The most frequent times of departure to work in Kiel are 5:30 AM to 5:59 AM (178, 15.2%) for males and 7:00 AM to 7:29 AM (167, 20.3%) for females.
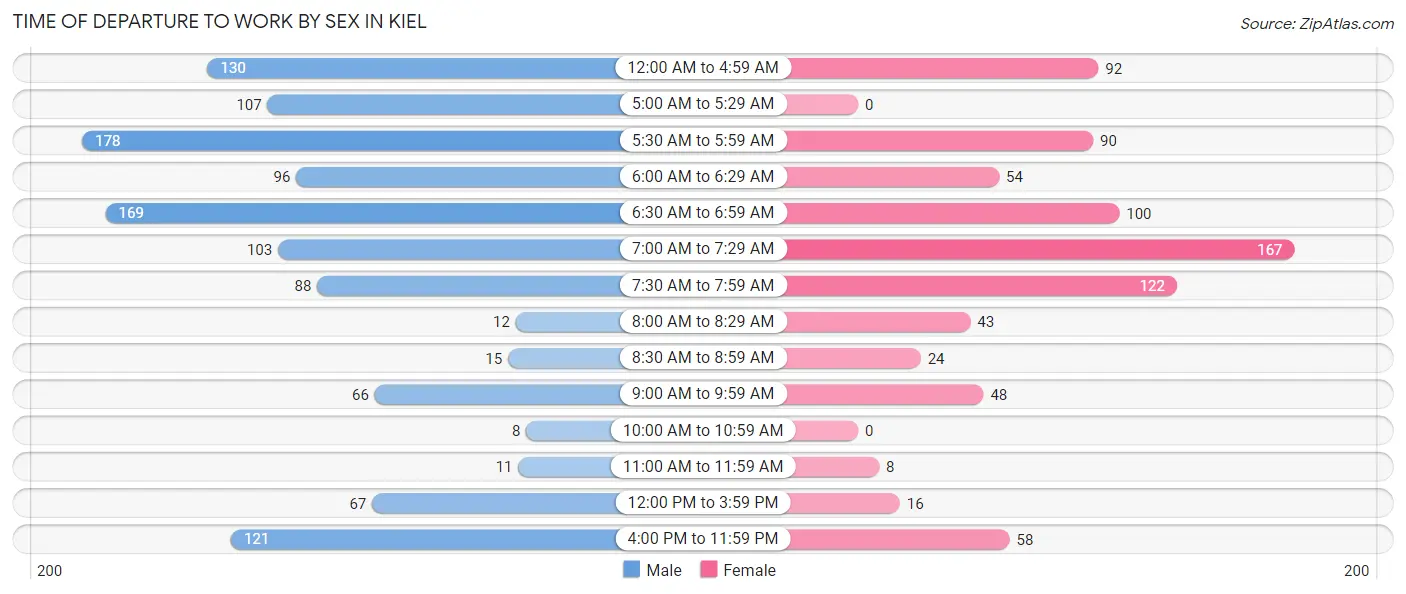
| Time of Departure | Male | Female |
| 12:00 AM to 4:59 AM | 130 (11.1%) | 92 (11.2%) |
| 5:00 AM to 5:29 AM | 107 (9.1%) | 0 (0.0%) |
| 5:30 AM to 5:59 AM | 178 (15.2%) | 90 (11.0%) |
| 6:00 AM to 6:29 AM | 96 (8.2%) | 54 (6.6%) |
| 6:30 AM to 6:59 AM | 169 (14.4%) | 100 (12.2%) |
| 7:00 AM to 7:29 AM | 103 (8.8%) | 167 (20.3%) |
| 7:30 AM to 7:59 AM | 88 (7.5%) | 122 (14.8%) |
| 8:00 AM to 8:29 AM | 12 (1.0%) | 43 (5.2%) |
| 8:30 AM to 8:59 AM | 15 (1.3%) | 24 (2.9%) |
| 9:00 AM to 9:59 AM | 66 (5.6%) | 48 (5.8%) |
| 10:00 AM to 10:59 AM | 8 (0.7%) | 0 (0.0%) |
| 11:00 AM to 11:59 AM | 11 (0.9%) | 8 (1.0%) |
| 12:00 PM to 3:59 PM | 67 (5.7%) | 16 (1.9%) |
| 4:00 PM to 11:59 PM | 121 (10.3%) | 58 (7.1%) |
| Total | 1,171 (100.0%) | 822 (100.0%) |
Housing Occupancy in Kiel
Occupancy by Ownership in Kiel
Of the total 1,642 dwellings in Kiel, owner-occupied units account for 1,179 (71.8%), while renter-occupied units make up 463 (28.2%).
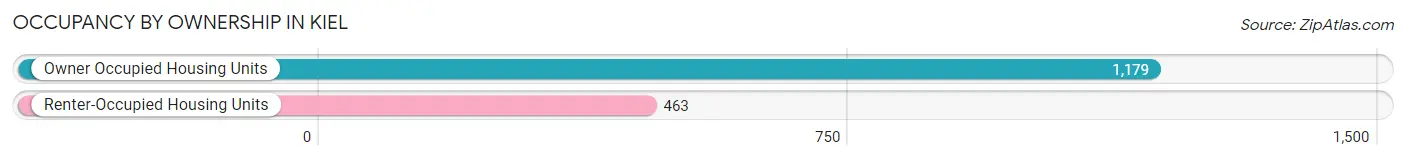
| Occupancy | # Housing Units | % Housing Units |
| Owner Occupied Housing Units | 1,179 | 71.8% |
| Renter-Occupied Housing Units | 463 | 28.2% |
| Total Occupied Housing Units | 1,642 | 100.0% |
Occupancy by Household Size in Kiel
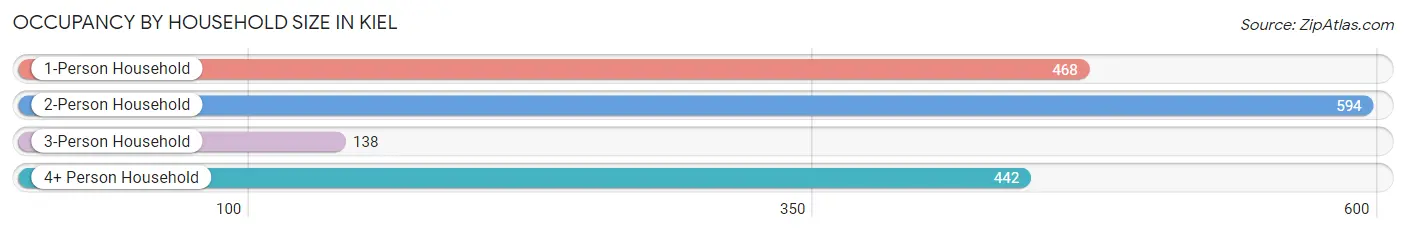
| Household Size | # Housing Units | % Housing Units |
| 1-Person Household | 468 | 28.5% |
| 2-Person Household | 594 | 36.2% |
| 3-Person Household | 138 | 8.4% |
| 4+ Person Household | 442 | 26.9% |
| Total Housing Units | 1,642 | 100.0% |
Occupancy by Ownership by Household Size in Kiel
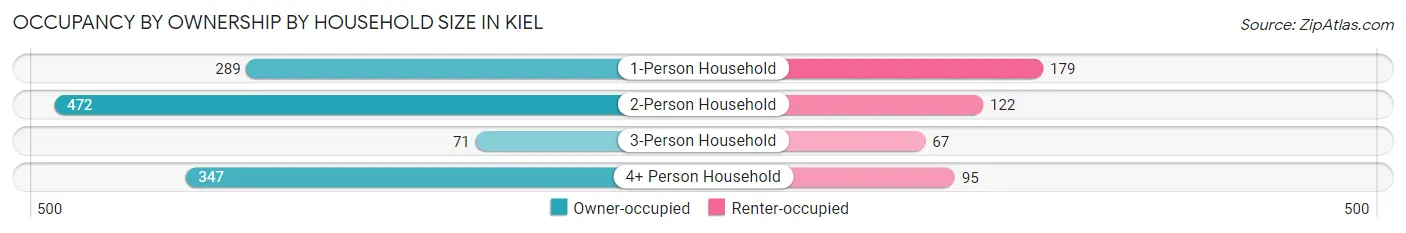
| Household Size | Owner-occupied | Renter-occupied |
| 1-Person Household | 289 (61.8%) | 179 (38.3%) |
| 2-Person Household | 472 (79.5%) | 122 (20.5%) |
| 3-Person Household | 71 (51.4%) | 67 (48.5%) |
| 4+ Person Household | 347 (78.5%) | 95 (21.5%) |
| Total Housing Units | 1,179 (71.8%) | 463 (28.2%) |
Occupancy by Educational Attainment in Kiel
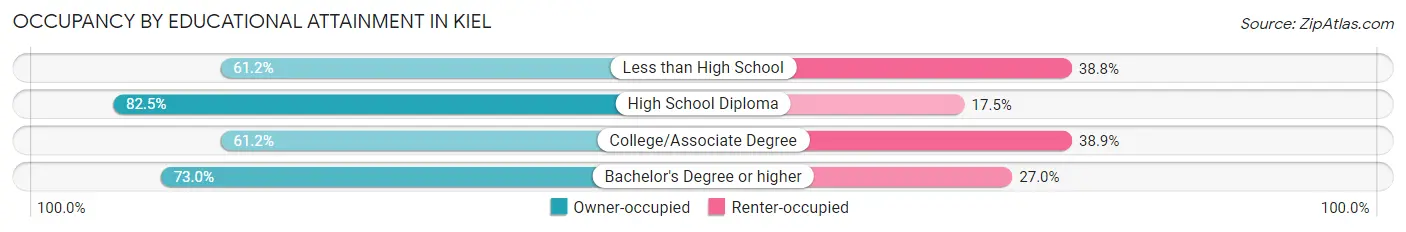
| Household Size | Owner-occupied | Renter-occupied |
| Less than High School | 112 (61.2%) | 71 (38.8%) |
| High School Diploma | 522 (82.5%) | 111 (17.5%) |
| College/Associate Degree | 299 (61.2%) | 190 (38.9%) |
| Bachelor's Degree or higher | 246 (73.0%) | 91 (27.0%) |
Occupancy by Age of Householder in Kiel
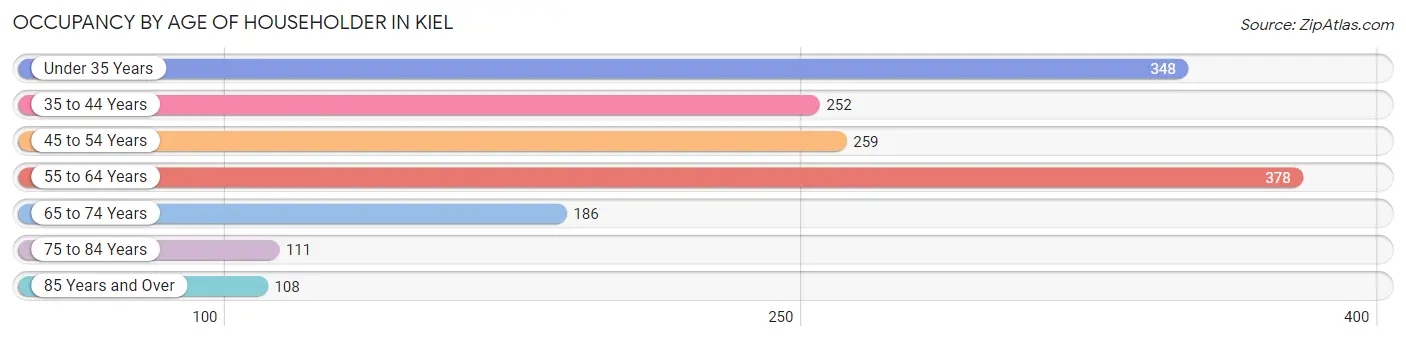
| Age Bracket | # Households | % Households |
| Under 35 Years | 348 | 21.2% |
| 35 to 44 Years | 252 | 15.3% |
| 45 to 54 Years | 259 | 15.8% |
| 55 to 64 Years | 378 | 23.0% |
| 65 to 74 Years | 186 | 11.3% |
| 75 to 84 Years | 111 | 6.8% |
| 85 Years and Over | 108 | 6.6% |
| Total | 1,642 | 100.0% |
Housing Finances in Kiel
Median Income by Occupancy in Kiel
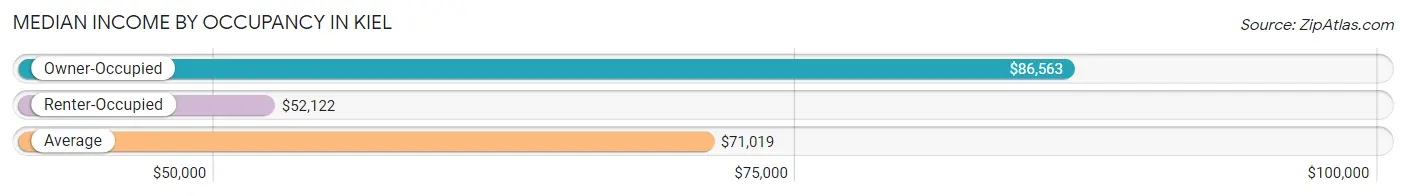
| Occupancy Type | # Households | Median Income |
| Owner-Occupied | 1,179 (71.8%) | $86,563 |
| Renter-Occupied | 463 (28.2%) | $52,122 |
| Average | 1,642 (100.0%) | $71,019 |
Occupancy by Householder Income Bracket in Kiel
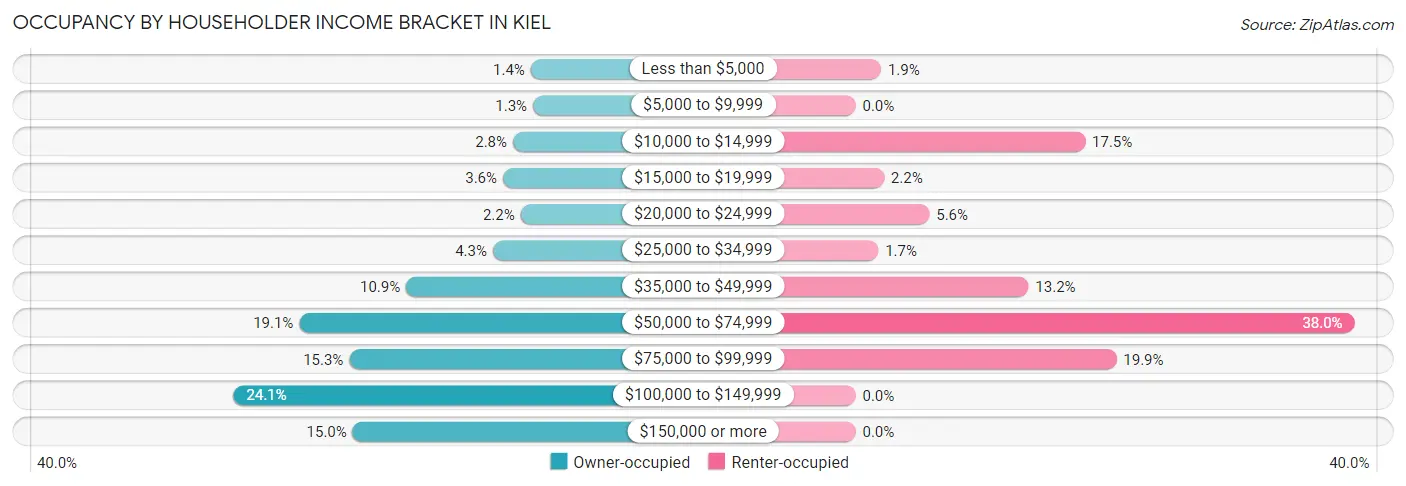
| Income Bracket | Owner-occupied | Renter-occupied |
| Less than $5,000 | 17 (1.4%) | 9 (1.9%) |
| $5,000 to $9,999 | 15 (1.3%) | 0 (0.0%) |
| $10,000 to $14,999 | 33 (2.8%) | 81 (17.5%) |
| $15,000 to $19,999 | 42 (3.6%) | 10 (2.2%) |
| $20,000 to $24,999 | 26 (2.2%) | 26 (5.6%) |
| $25,000 to $34,999 | 51 (4.3%) | 8 (1.7%) |
| $35,000 to $49,999 | 129 (10.9%) | 61 (13.2%) |
| $50,000 to $74,999 | 225 (19.1%) | 176 (38.0%) |
| $75,000 to $99,999 | 180 (15.3%) | 92 (19.9%) |
| $100,000 to $149,999 | 284 (24.1%) | 0 (0.0%) |
| $150,000 or more | 177 (15.0%) | 0 (0.0%) |
| Total | 1,179 (100.0%) | 463 (100.0%) |
Monthly Housing Cost Tiers in Kiel
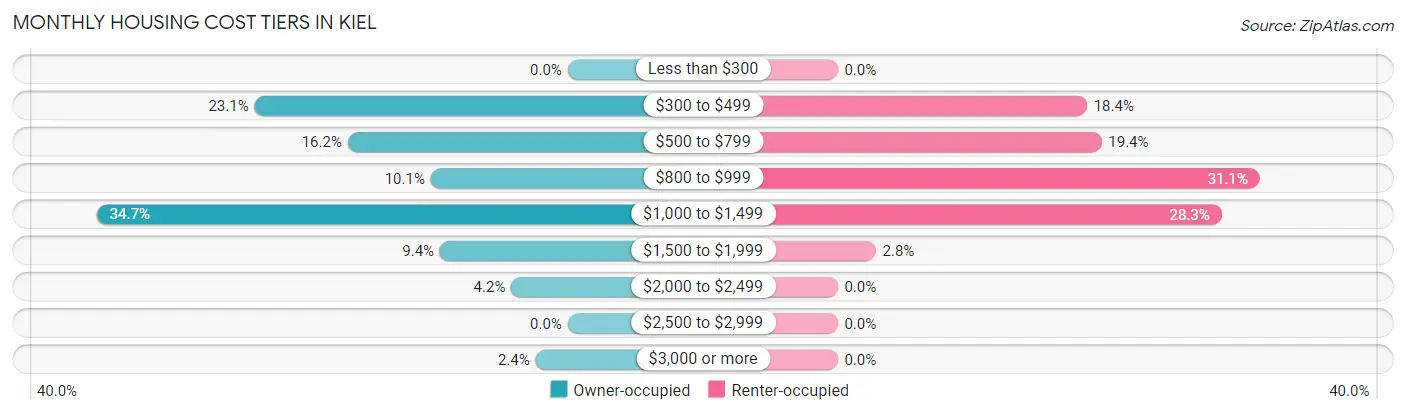
| Monthly Cost | Owner-occupied | Renter-occupied |
| Less than $300 | 0 (0.0%) | 0 (0.0%) |
| $300 to $499 | 272 (23.1%) | 85 (18.4%) |
| $500 to $799 | 191 (16.2%) | 90 (19.4%) |
| $800 to $999 | 119 (10.1%) | 144 (31.1%) |
| $1,000 to $1,499 | 409 (34.7%) | 131 (28.3%) |
| $1,500 to $1,999 | 111 (9.4%) | 13 (2.8%) |
| $2,000 to $2,499 | 49 (4.2%) | 0 (0.0%) |
| $2,500 to $2,999 | 0 (0.0%) | 0 (0.0%) |
| $3,000 or more | 28 (2.4%) | 0 (0.0%) |
| Total | 1,179 (100.0%) | 463 (100.0%) |
Physical Housing Characteristics in Kiel
Housing Structures in Kiel
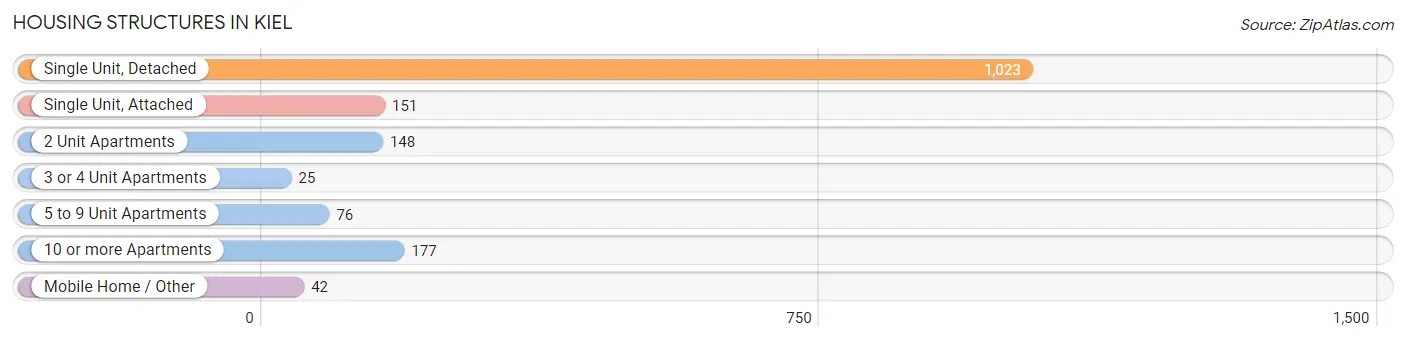
| Structure Type | # Housing Units | % Housing Units |
| Single Unit, Detached | 1,023 | 62.3% |
| Single Unit, Attached | 151 | 9.2% |
| 2 Unit Apartments | 148 | 9.0% |
| 3 or 4 Unit Apartments | 25 | 1.5% |
| 5 to 9 Unit Apartments | 76 | 4.6% |
| 10 or more Apartments | 177 | 10.8% |
| Mobile Home / Other | 42 | 2.6% |
| Total | 1,642 | 100.0% |
Housing Structures by Occupancy in Kiel
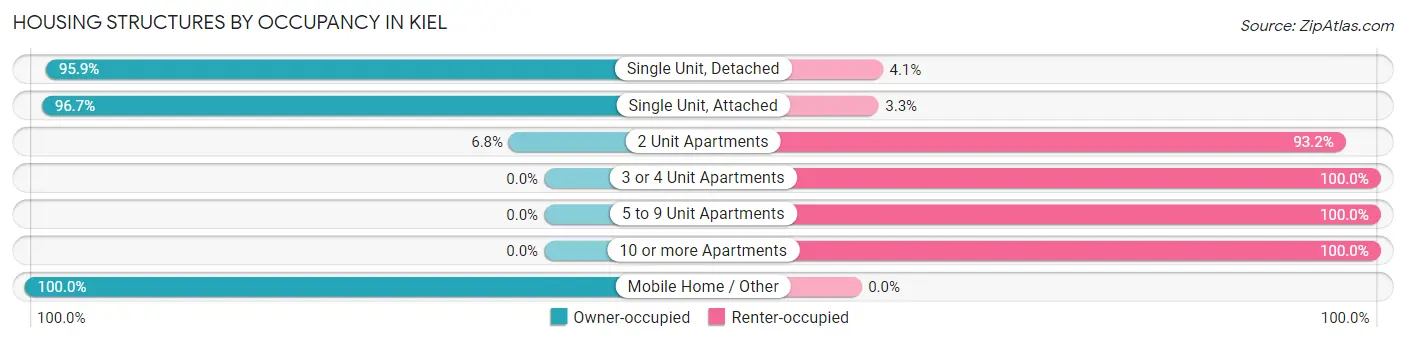
| Structure Type | Owner-occupied | Renter-occupied |
| Single Unit, Detached | 981 (95.9%) | 42 (4.1%) |
| Single Unit, Attached | 146 (96.7%) | 5 (3.3%) |
| 2 Unit Apartments | 10 (6.8%) | 138 (93.2%) |
| 3 or 4 Unit Apartments | 0 (0.0%) | 25 (100.0%) |
| 5 to 9 Unit Apartments | 0 (0.0%) | 76 (100.0%) |
| 10 or more Apartments | 0 (0.0%) | 177 (100.0%) |
| Mobile Home / Other | 42 (100.0%) | 0 (0.0%) |
| Total | 1,179 (71.8%) | 463 (28.2%) |
Housing Structures by Number of Rooms in Kiel
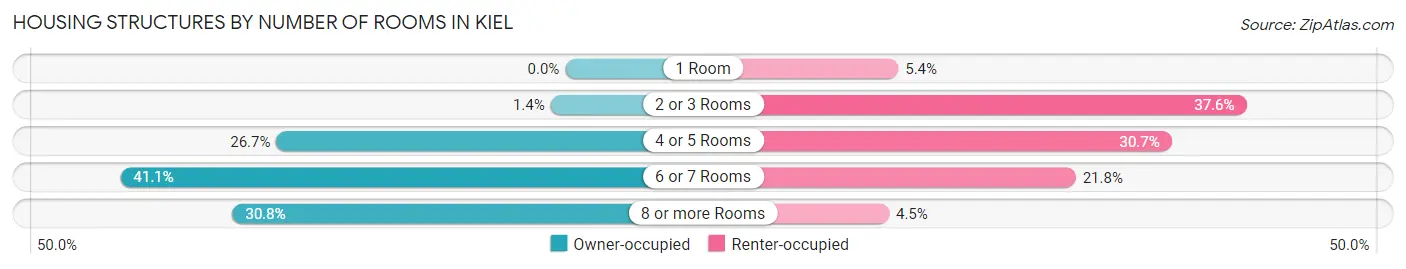
| Number of Rooms | Owner-occupied | Renter-occupied |
| 1 Room | 0 (0.0%) | 25 (5.4%) |
| 2 or 3 Rooms | 16 (1.4%) | 174 (37.6%) |
| 4 or 5 Rooms | 315 (26.7%) | 142 (30.7%) |
| 6 or 7 Rooms | 485 (41.1%) | 101 (21.8%) |
| 8 or more Rooms | 363 (30.8%) | 21 (4.5%) |
| Total | 1,179 (100.0%) | 463 (100.0%) |
Housing Structure by Heating Type in Kiel
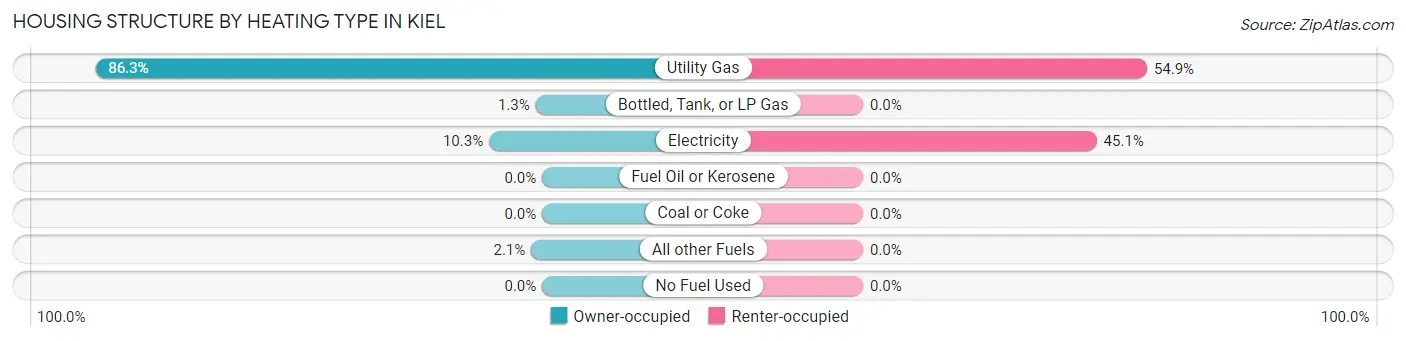
| Heating Type | Owner-occupied | Renter-occupied |
| Utility Gas | 1,018 (86.3%) | 254 (54.9%) |
| Bottled, Tank, or LP Gas | 15 (1.3%) | 0 (0.0%) |
| Electricity | 121 (10.3%) | 209 (45.1%) |
| Fuel Oil or Kerosene | 0 (0.0%) | 0 (0.0%) |
| Coal or Coke | 0 (0.0%) | 0 (0.0%) |
| All other Fuels | 25 (2.1%) | 0 (0.0%) |
| No Fuel Used | 0 (0.0%) | 0 (0.0%) |
| Total | 1,179 (100.0%) | 463 (100.0%) |
Household Vehicle Usage in Kiel
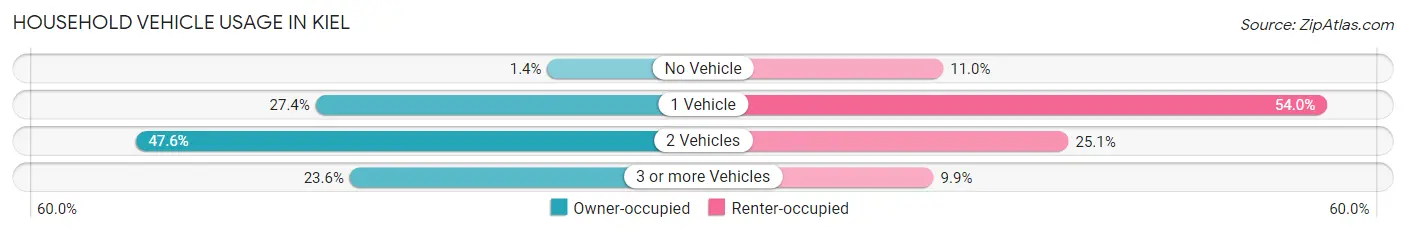
| Vehicles per Household | Owner-occupied | Renter-occupied |
| No Vehicle | 17 (1.4%) | 51 (11.0%) |
| 1 Vehicle | 323 (27.4%) | 250 (54.0%) |
| 2 Vehicles | 561 (47.6%) | 116 (25.1%) |
| 3 or more Vehicles | 278 (23.6%) | 46 (9.9%) |
| Total | 1,179 (100.0%) | 463 (100.0%) |
Real Estate & Mortgages in Kiel
Real Estate and Mortgage Overview in Kiel
| Characteristic | Without Mortgage | With Mortgage |
| Housing Units | 468 | 711 |
| Median Property Value | $129,400 | $170,700 |
| Median Household Income | $46,304 | $166 |
| Monthly Housing Costs | $476 | $21 |
| Real Estate Taxes | $2,399 | $0 |
Property Value by Mortgage Status in Kiel
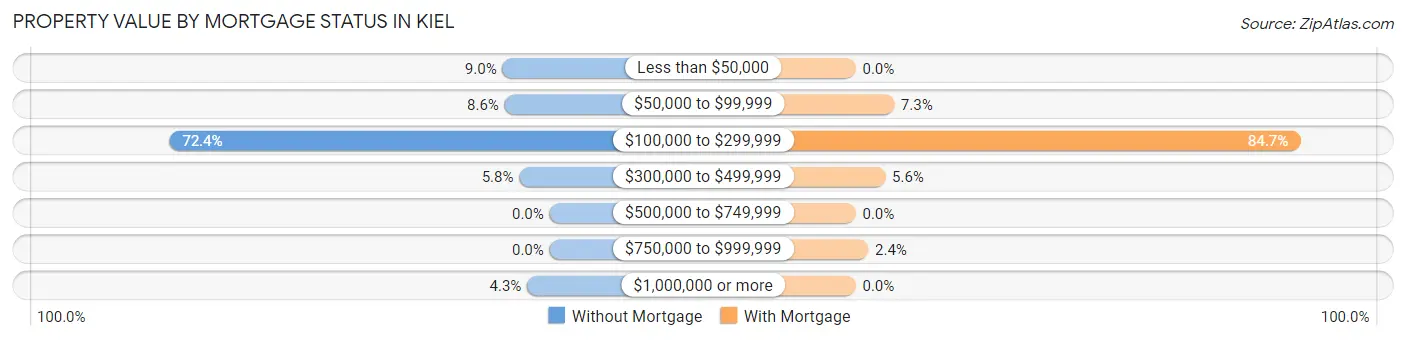
| Property Value | Without Mortgage | With Mortgage |
| Less than $50,000 | 42 (9.0%) | 0 (0.0%) |
| $50,000 to $99,999 | 40 (8.6%) | 52 (7.3%) |
| $100,000 to $299,999 | 339 (72.4%) | 602 (84.7%) |
| $300,000 to $499,999 | 27 (5.8%) | 40 (5.6%) |
| $500,000 to $749,999 | 0 (0.0%) | 0 (0.0%) |
| $750,000 to $999,999 | 0 (0.0%) | 17 (2.4%) |
| $1,000,000 or more | 20 (4.3%) | 0 (0.0%) |
| Total | 468 (100.0%) | 711 (100.0%) |
Household Income by Mortgage Status in Kiel
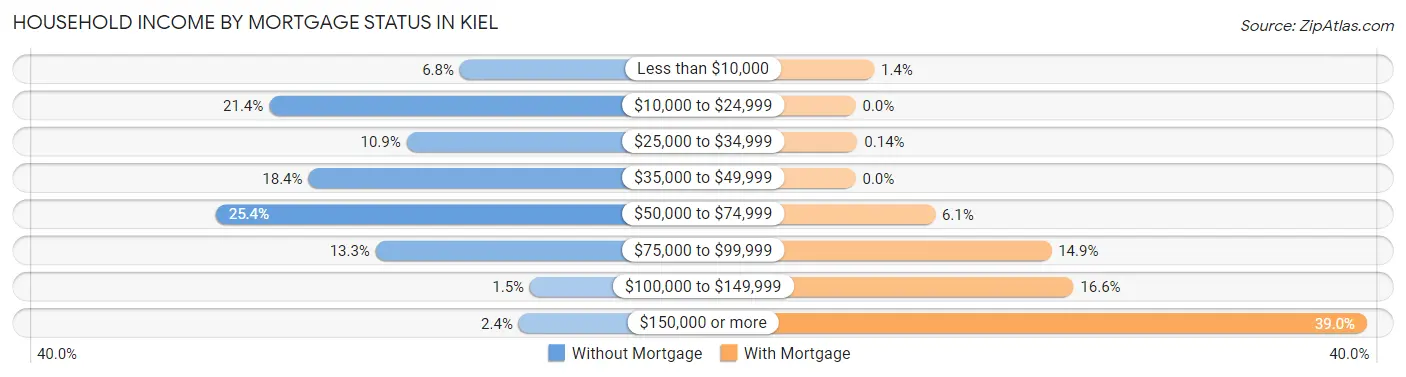
| Household Income | Without Mortgage | With Mortgage |
| Less than $10,000 | 32 (6.8%) | 10 (1.4%) |
| $10,000 to $24,999 | 100 (21.4%) | 0 (0.0%) |
| $25,000 to $34,999 | 51 (10.9%) | 1 (0.1%) |
| $35,000 to $49,999 | 86 (18.4%) | 0 (0.0%) |
| $50,000 to $74,999 | 119 (25.4%) | 43 (6.0%) |
| $75,000 to $99,999 | 62 (13.3%) | 106 (14.9%) |
| $100,000 to $149,999 | 7 (1.5%) | 118 (16.6%) |
| $150,000 or more | 11 (2.4%) | 277 (39.0%) |
| Total | 468 (100.0%) | 711 (100.0%) |
Property Value to Household Income Ratio in Kiel
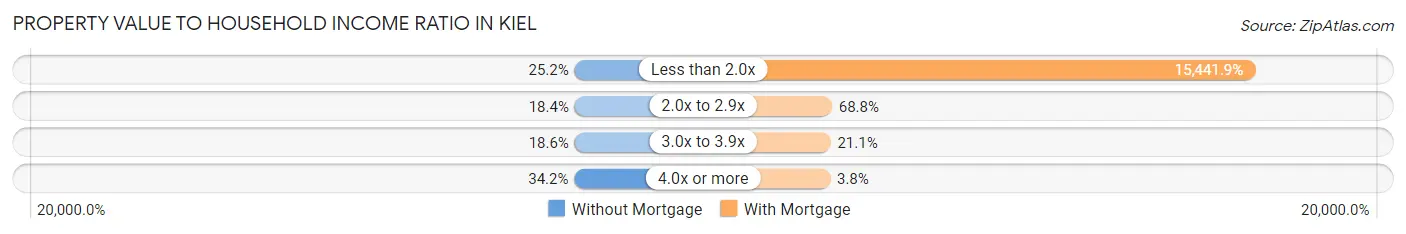
| Value-to-Income Ratio | Without Mortgage | With Mortgage |
| Less than 2.0x | 118 (25.2%) | 109,792 (15,441.9%) |
| 2.0x to 2.9x | 86 (18.4%) | 489 (68.8%) |
| 3.0x to 3.9x | 87 (18.6%) | 150 (21.1%) |
| 4.0x or more | 160 (34.2%) | 27 (3.8%) |
| Total | 468 (100.0%) | 711 (100.0%) |
Real Estate Taxes by Mortgage Status in Kiel
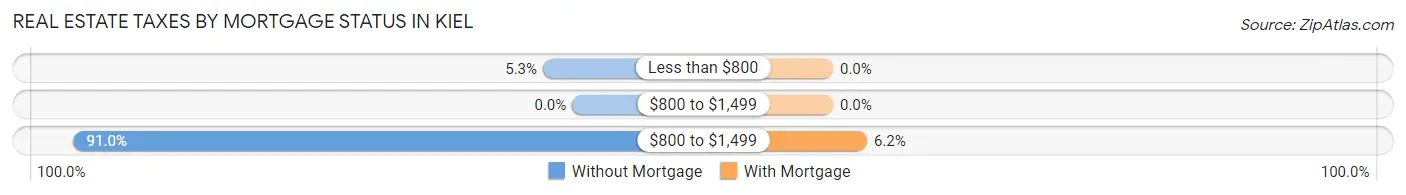
| Property Taxes | Without Mortgage | With Mortgage |
| Less than $800 | 25 (5.3%) | 0 (0.0%) |
| $800 to $1,499 | 0 (0.0%) | 0 (0.0%) |
| $800 to $1,499 | 426 (91.0%) | 44 (6.2%) |
| Total | 468 (100.0%) | 711 (100.0%) |
Health & Disability in Kiel
Health Insurance Coverage by Age in Kiel
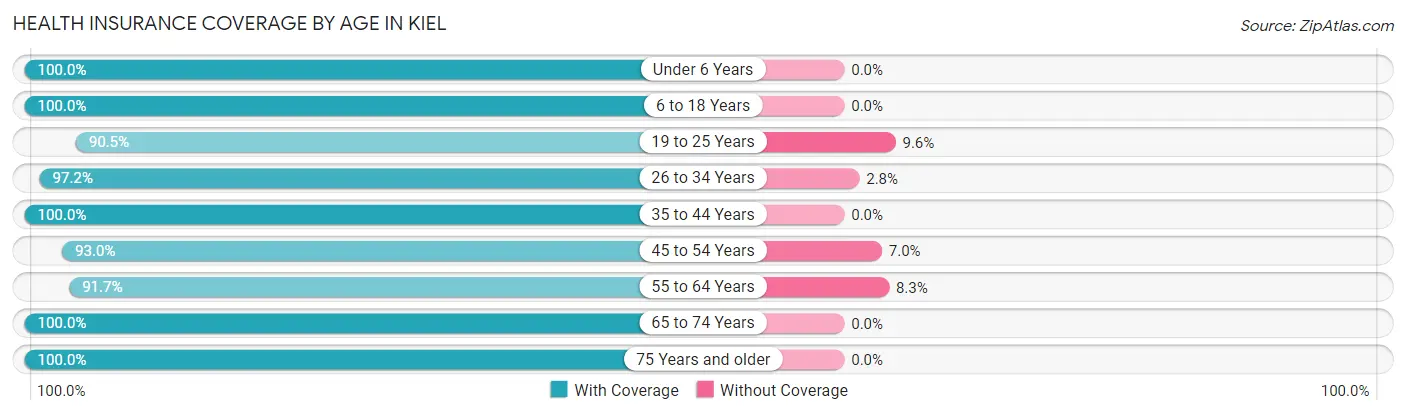
| Age Bracket | With Coverage | Without Coverage |
| Under 6 Years | 273 (100.0%) | 0 (0.0%) |
| 6 to 18 Years | 630 (100.0%) | 0 (0.0%) |
| 19 to 25 Years | 303 (90.4%) | 32 (9.6%) |
| 26 to 34 Years | 451 (97.2%) | 13 (2.8%) |
| 35 to 44 Years | 501 (100.0%) | 0 (0.0%) |
| 45 to 54 Years | 478 (93.0%) | 36 (7.0%) |
| 55 to 64 Years | 528 (91.7%) | 48 (8.3%) |
| 65 to 74 Years | 295 (100.0%) | 0 (0.0%) |
| 75 Years and older | 290 (100.0%) | 0 (0.0%) |
| Total | 3,749 (96.7%) | 129 (3.3%) |
Health Insurance Coverage by Citizenship Status in Kiel
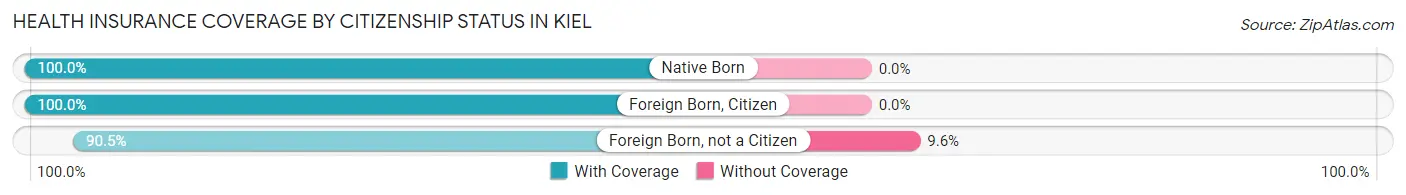
| Citizenship Status | With Coverage | Without Coverage |
| Native Born | 273 (100.0%) | 0 (0.0%) |
| Foreign Born, Citizen | 630 (100.0%) | 0 (0.0%) |
| Foreign Born, not a Citizen | 303 (90.4%) | 32 (9.6%) |
Health Insurance Coverage by Household Income in Kiel
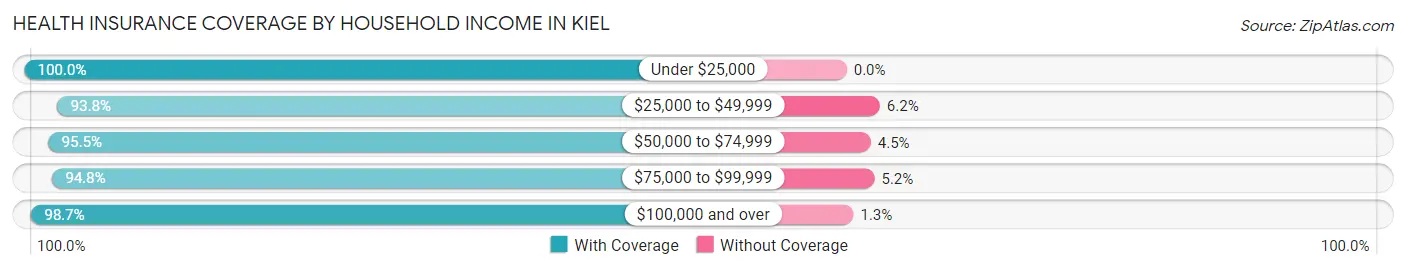
| Household Income | With Coverage | Without Coverage |
| Under $25,000 | 365 (100.0%) | 0 (0.0%) |
| $25,000 to $49,999 | 469 (93.8%) | 31 (6.2%) |
| $50,000 to $74,999 | 763 (95.5%) | 36 (4.5%) |
| $75,000 to $99,999 | 820 (94.8%) | 45 (5.2%) |
| $100,000 and over | 1,330 (98.7%) | 17 (1.3%) |
Public vs Private Health Insurance Coverage by Age in Kiel
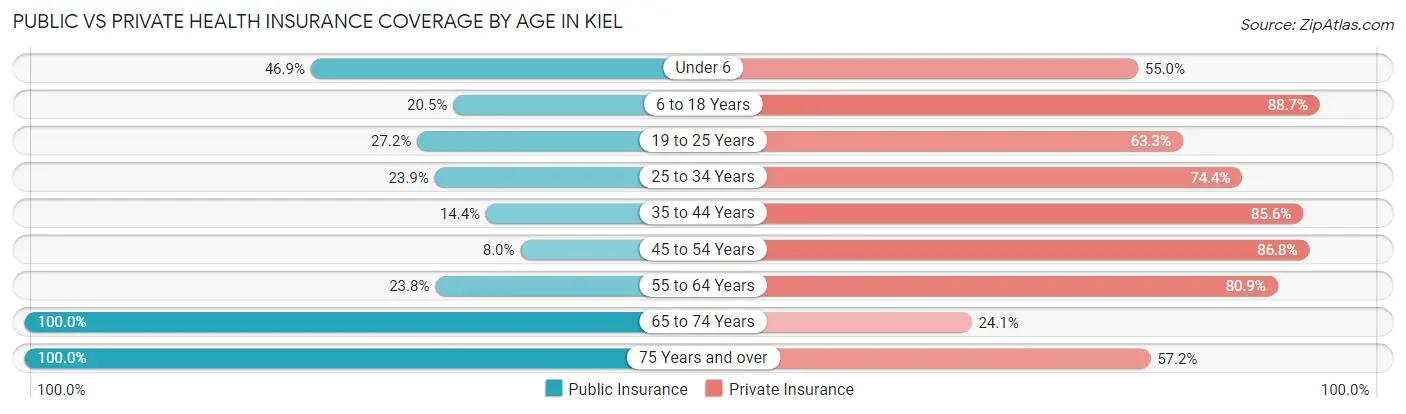
| Age Bracket | Public Insurance | Private Insurance |
| Under 6 | 128 (46.9%) | 150 (54.9%) |
| 6 to 18 Years | 129 (20.5%) | 559 (88.7%) |
| 19 to 25 Years | 91 (27.2%) | 212 (63.3%) |
| 25 to 34 Years | 111 (23.9%) | 345 (74.4%) |
| 35 to 44 Years | 72 (14.4%) | 429 (85.6%) |
| 45 to 54 Years | 41 (8.0%) | 446 (86.8%) |
| 55 to 64 Years | 137 (23.8%) | 466 (80.9%) |
| 65 to 74 Years | 295 (100.0%) | 71 (24.1%) |
| 75 Years and over | 290 (100.0%) | 166 (57.2%) |
| Total | 1,294 (33.4%) | 2,844 (73.3%) |
Disability Status by Sex by Age in Kiel
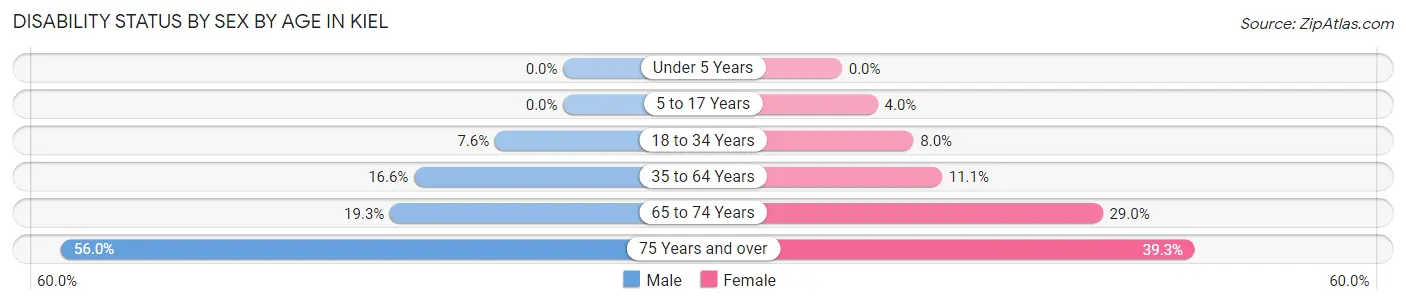
| Age Bracket | Male | Female |
| Under 5 Years | 0 (0.0%) | 0 (0.0%) |
| 5 to 17 Years | 0 (0.0%) | 13 (4.0%) |
| 18 to 34 Years | 28 (7.6%) | 37 (8.0%) |
| 35 to 64 Years | 154 (16.6%) | 74 (11.1%) |
| 65 to 74 Years | 27 (19.3%) | 45 (29.0%) |
| 75 Years and over | 47 (55.9%) | 81 (39.3%) |
Disability Class by Sex by Age in Kiel
Disability Class: Hearing Difficulty
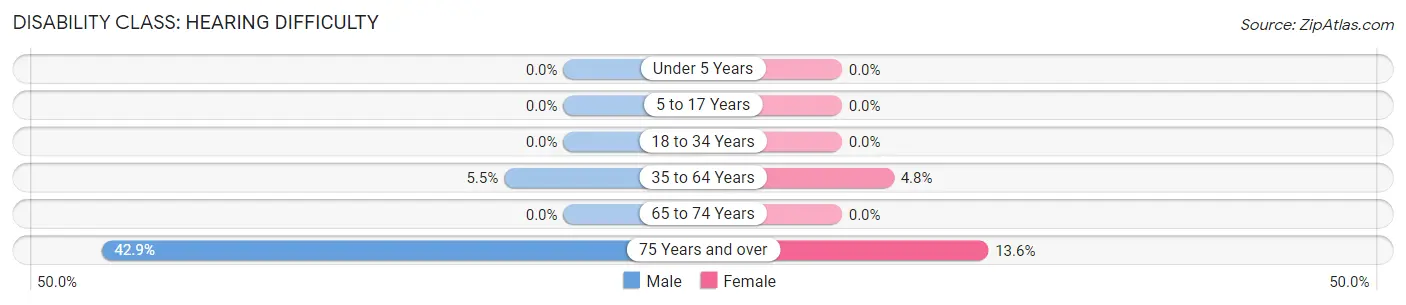
| Age Bracket | Male | Female |
| Under 5 Years | 0 (0.0%) | 0 (0.0%) |
| 5 to 17 Years | 0 (0.0%) | 0 (0.0%) |
| 18 to 34 Years | 0 (0.0%) | 0 (0.0%) |
| 35 to 64 Years | 51 (5.5%) | 32 (4.8%) |
| 65 to 74 Years | 0 (0.0%) | 0 (0.0%) |
| 75 Years and over | 36 (42.9%) | 28 (13.6%) |
Disability Class: Vision Difficulty
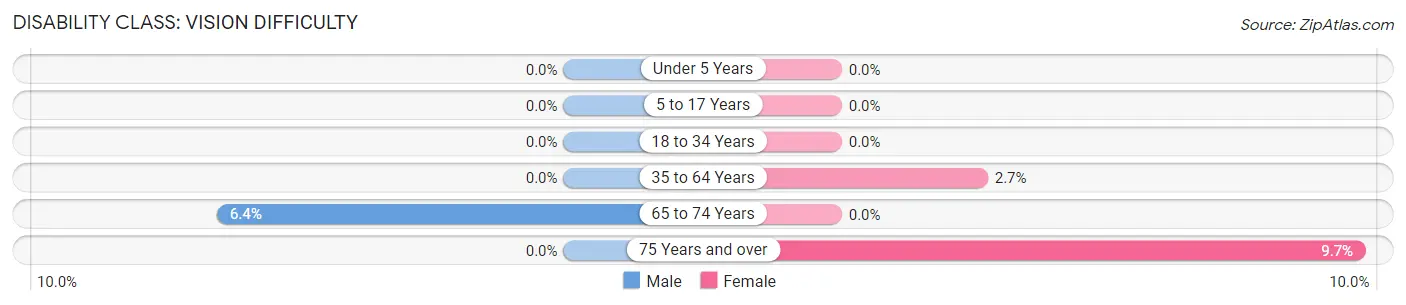
| Age Bracket | Male | Female |
| Under 5 Years | 0 (0.0%) | 0 (0.0%) |
| 5 to 17 Years | 0 (0.0%) | 0 (0.0%) |
| 18 to 34 Years | 0 (0.0%) | 0 (0.0%) |
| 35 to 64 Years | 0 (0.0%) | 18 (2.7%) |
| 65 to 74 Years | 9 (6.4%) | 0 (0.0%) |
| 75 Years and over | 0 (0.0%) | 20 (9.7%) |
Disability Class: Cognitive Difficulty
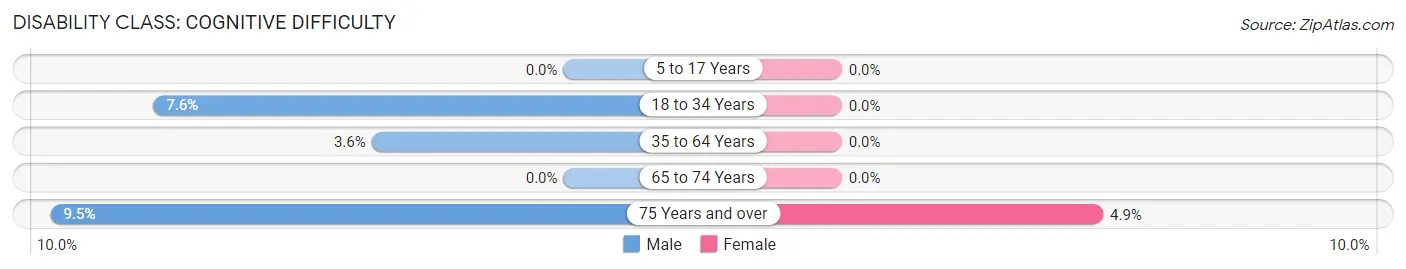
| Age Bracket | Male | Female |
| 5 to 17 Years | 0 (0.0%) | 0 (0.0%) |
| 18 to 34 Years | 28 (7.6%) | 0 (0.0%) |
| 35 to 64 Years | 33 (3.6%) | 0 (0.0%) |
| 65 to 74 Years | 0 (0.0%) | 0 (0.0%) |
| 75 Years and over | 8 (9.5%) | 10 (4.9%) |
Disability Class: Ambulatory Difficulty
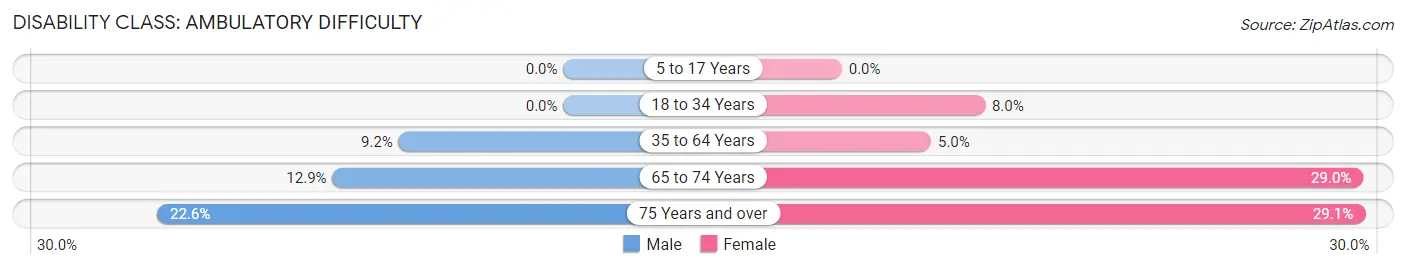
| Age Bracket | Male | Female |
| 5 to 17 Years | 0 (0.0%) | 0 (0.0%) |
| 18 to 34 Years | 0 (0.0%) | 37 (8.0%) |
| 35 to 64 Years | 85 (9.2%) | 33 (5.0%) |
| 65 to 74 Years | 18 (12.9%) | 45 (29.0%) |
| 75 Years and over | 19 (22.6%) | 60 (29.1%) |
Disability Class: Self-Care Difficulty
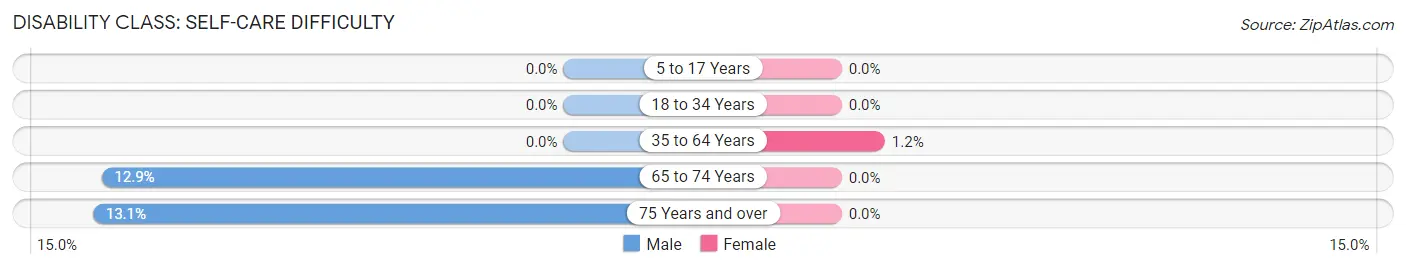
| Age Bracket | Male | Female |
| 5 to 17 Years | 0 (0.0%) | 0 (0.0%) |
| 18 to 34 Years | 0 (0.0%) | 0 (0.0%) |
| 35 to 64 Years | 0 (0.0%) | 8 (1.2%) |
| 65 to 74 Years | 18 (12.9%) | 0 (0.0%) |
| 75 Years and over | 11 (13.1%) | 0 (0.0%) |
Technology Access in Kiel
Computing Device Access in Kiel
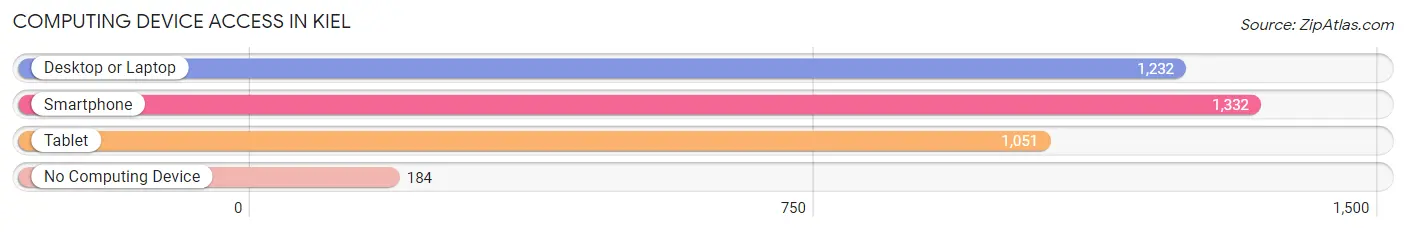
| Device Type | # Households | % Households |
| Desktop or Laptop | 1,232 | 75.0% |
| Smartphone | 1,332 | 81.1% |
| Tablet | 1,051 | 64.0% |
| No Computing Device | 184 | 11.2% |
| Total | 1,642 | 100.0% |
Internet Access in Kiel
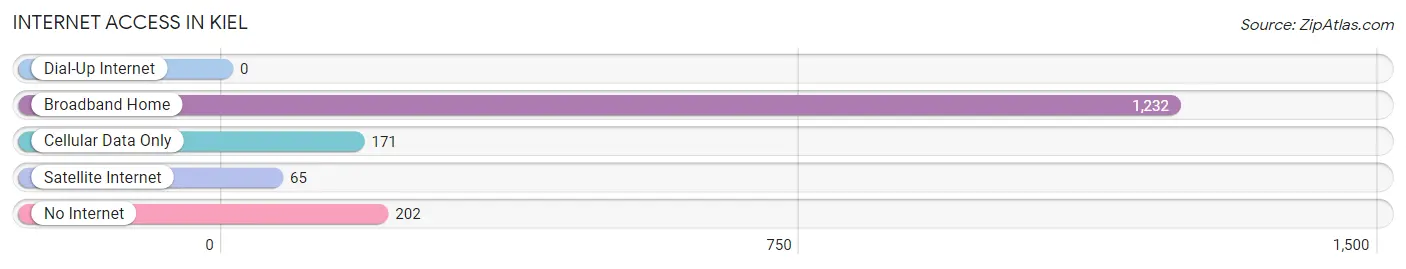
| Internet Type | # Households | % Households |
| Dial-Up Internet | 0 | 0.0% |
| Broadband Home | 1,232 | 75.0% |
| Cellular Data Only | 171 | 10.4% |
| Satellite Internet | 65 | 4.0% |
| No Internet | 202 | 12.3% |
| Total | 1,642 | 100.0% |
Kiel Summary
Kiel, Wisconsin is a small city located in Manitowoc County, Wisconsin. It is situated on the western shore of Lake Michigan, about 40 miles north of Milwaukee. The city has a population of 3,737 people, according to the 2010 census.
History
Kiel was founded in 1846 by German immigrants who were looking for a place to settle and start a new life. The city was named after the German city of Kiel, which is located on the Baltic Sea. The first settlers were mostly farmers, and the city quickly grew as more people moved to the area. By the late 1800s, Kiel had become a thriving community with a variety of businesses, including a brewery, a cheese factory, and a sawmill.
In the early 1900s, Kiel experienced a period of growth and prosperity. The city was home to several large factories, including a paper mill, a canning factory, and a furniture factory. The city also had a thriving downtown area, with several stores and restaurants.
Geography
Kiel is located in the eastern part of Manitowoc County, Wisconsin. It is situated on the western shore of Lake Michigan, about 40 miles north of Milwaukee. The city is bordered by the towns of Schleswig, New Holstein, and Rhine. The city covers an area of 4.2 square miles, and has a population density of 890 people per square mile.
The city is located in a region of rolling hills and wooded areas. The terrain is mostly flat, with some areas of higher elevation. The city is located in a temperate climate, with warm summers and cold winters.
Economy
Kiel’s economy is largely based on manufacturing and agriculture. The city is home to several large factories, including a paper mill, a canning factory, and a furniture factory. The city also has a thriving downtown area, with several stores and restaurants.
The city is also home to several agricultural businesses, including dairy farms, fruit orchards, and vegetable farms. The city is also home to several wineries, which produce a variety of wines.
Demographics
Kiel has a population of 3,737 people, according to the 2010 census. The city has a median age of 39.7 years, and a median household income of $45,945. The city is predominantly white, with a population that is 94.3% white, 1.2% African American, 0.7% Asian, and 0.6% Hispanic or Latino.
Kiel is a small city with a strong sense of community. The city is home to several churches, schools, and parks, and is a popular destination for outdoor activities such as fishing, boating, and camping. The city also hosts several annual festivals and events, including the Kiel Summerfest and the Kiel Cheese Days.
Common Questions
What is Per Capita Income in Kiel?
Per Capita income in Kiel is $33,710.
What is the Median Family Income in Kiel?
Median Family Income in Kiel is $87,821.
What is the Median Household income in Kiel?
Median Household Income in Kiel is $71,019.
What is Income or Wage Gap in Kiel?
Income or Wage Gap in Kiel is 27.1%.
Women in Kiel earn 72.9 cents for every dollar earned by a man.
What is Inequality or Gini Index in Kiel?
Inequality or Gini Index in Kiel is 0.37.
What is the Total Population of Kiel?
Total Population of Kiel is 3,878.
What is the Total Male Population of Kiel?
Total Male Population of Kiel is 1,901.
What is the Total Female Population of Kiel?
Total Female Population of Kiel is 1,977.
What is the Ratio of Males per 100 Females in Kiel?
There are 96.16 Males per 100 Females in Kiel.
What is the Ratio of Females per 100 Males in Kiel?
There are 104.00 Females per 100 Males in Kiel.
What is the Median Population Age in Kiel?
Median Population Age in Kiel is 39.3 Years.
What is the Average Family Size in Kiel
Average Family Size in Kiel is 3.0 People.
What is the Average Household Size in Kiel
Average Household Size in Kiel is 2.4 People.
How Large is the Labor Force in Kiel?
There are 2,183 People in the Labor Forcein in Kiel.
What is the Percentage of People in the Labor Force in Kiel?
70.7% of People are in the Labor Force in Kiel.
What is the Unemployment Rate in Kiel?
Unemployment Rate in Kiel is 2.2%.