Kellnersville, WI Map & Demographics
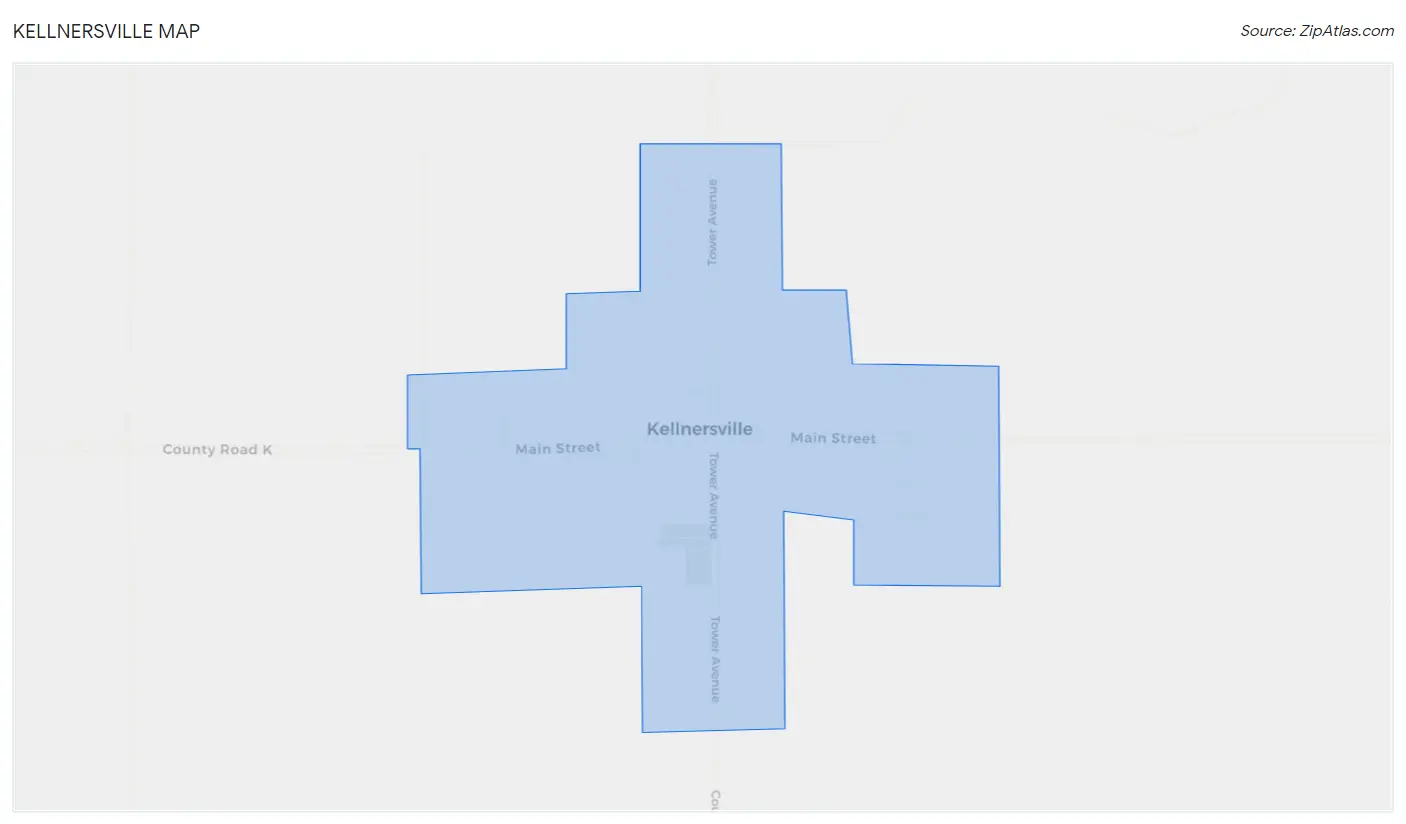
Kellnersville Map
Kellnersville Overview
$30,445
PER CAPITA INCOME
$63,750
AVG FAMILY INCOME
$38,750
AVG HOUSEHOLD INCOME
20.3%
WAGE / INCOME GAP [ % ]
79.7¢/ $1
WAGE / INCOME GAP [ $ ]
0.41
INEQUALITY / GINI INDEX
255
TOTAL POPULATION
130
MALE POPULATION
125
FEMALE POPULATION
104.00
MALES / 100 FEMALES
96.15
FEMALES / 100 MALES
55.0
MEDIAN AGE
2.9
AVG FAMILY SIZE
1.8
AVG HOUSEHOLD SIZE
132
LABOR FORCE [ PEOPLE ]
57.9%
PERCENT IN LABOR FORCE
2.3%
UNEMPLOYMENT RATE
Kellnersville Zip Codes
Kellnersville Area Codes
Income in Kellnersville
Income Overview in Kellnersville
Per Capita Income in Kellnersville is $30,445, while median incomes of families and households are $63,750 and $38,750 respectively.
| Characteristic | Number | Measure |
| Per Capita Income | 255 | $30,445 |
| Median Family Income | 52 | $63,750 |
| Mean Family Income | 52 | $82,788 |
| Median Household Income | 143 | $38,750 |
| Mean Household Income | 143 | $53,859 |
| Income Deficit | 52 | $0 |
| Wage / Income Gap (%) | 255 | 20.25% |
| Wage / Income Gap ($) | 255 | 79.75¢ per $1 |
| Gini / Inequality Index | 255 | 0.41 |
Earnings by Sex in Kellnersville
Average Earnings in Kellnersville are $35,625, $41,750 for men and $33,295 for women, a difference of 20.3%.
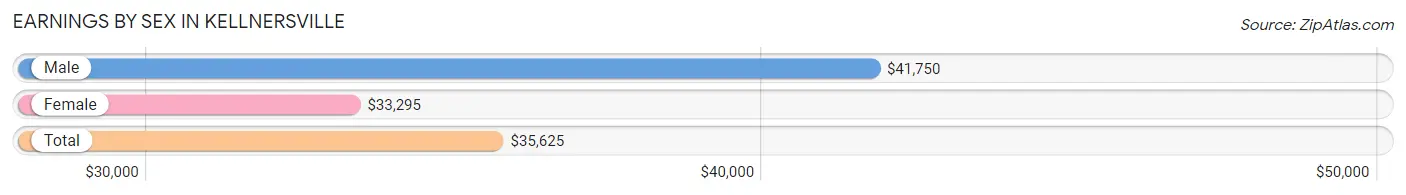
| Sex | Number | Average Earnings |
| Male | 91 (64.1%) | $41,750 |
| Female | 51 (35.9%) | $33,295 |
| Total | 142 (100.0%) | $35,625 |
Earnings by Sex by Income Bracket in Kellnersville
The most common earnings brackets in Kellnersville are $5,000 to $7,499 for men (19 | 20.9%) and $30,000 to $34,999 for women (13 | 25.5%).
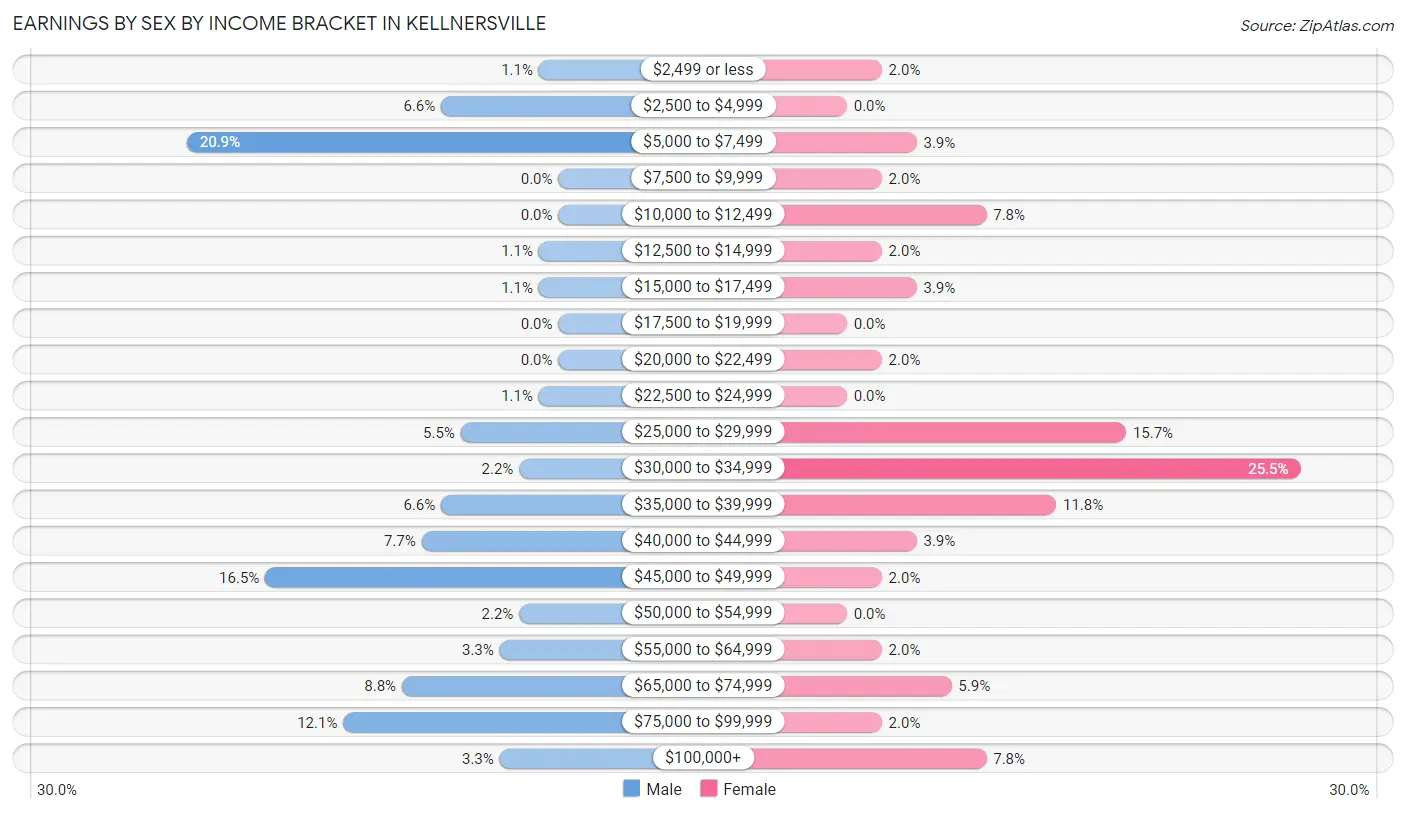
| Income | Male | Female |
| $2,499 or less | 1 (1.1%) | 1 (2.0%) |
| $2,500 to $4,999 | 6 (6.6%) | 0 (0.0%) |
| $5,000 to $7,499 | 19 (20.9%) | 2 (3.9%) |
| $7,500 to $9,999 | 0 (0.0%) | 1 (2.0%) |
| $10,000 to $12,499 | 0 (0.0%) | 4 (7.8%) |
| $12,500 to $14,999 | 1 (1.1%) | 1 (2.0%) |
| $15,000 to $17,499 | 1 (1.1%) | 2 (3.9%) |
| $17,500 to $19,999 | 0 (0.0%) | 0 (0.0%) |
| $20,000 to $22,499 | 0 (0.0%) | 1 (2.0%) |
| $22,500 to $24,999 | 1 (1.1%) | 0 (0.0%) |
| $25,000 to $29,999 | 5 (5.5%) | 8 (15.7%) |
| $30,000 to $34,999 | 2 (2.2%) | 13 (25.5%) |
| $35,000 to $39,999 | 6 (6.6%) | 6 (11.8%) |
| $40,000 to $44,999 | 7 (7.7%) | 2 (3.9%) |
| $45,000 to $49,999 | 15 (16.5%) | 1 (2.0%) |
| $50,000 to $54,999 | 2 (2.2%) | 0 (0.0%) |
| $55,000 to $64,999 | 3 (3.3%) | 1 (2.0%) |
| $65,000 to $74,999 | 8 (8.8%) | 3 (5.9%) |
| $75,000 to $99,999 | 11 (12.1%) | 1 (2.0%) |
| $100,000+ | 3 (3.3%) | 4 (7.8%) |
| Total | 91 (100.0%) | 51 (100.0%) |
Earnings by Sex by Educational Attainment in Kellnersville
Average earnings in Kellnersville are $45,000 for men and $34,205 for women, a difference of 24.0%. Men with an educational attainment of college or associate's degree enjoy the highest average annual earnings of $70,000, while those with less than high school education earn the least with $36,250. Women with an educational attainment of college or associate's degree earn the most with the average annual earnings of $37,813, while those with high school diploma education have the smallest earnings of $29,167.
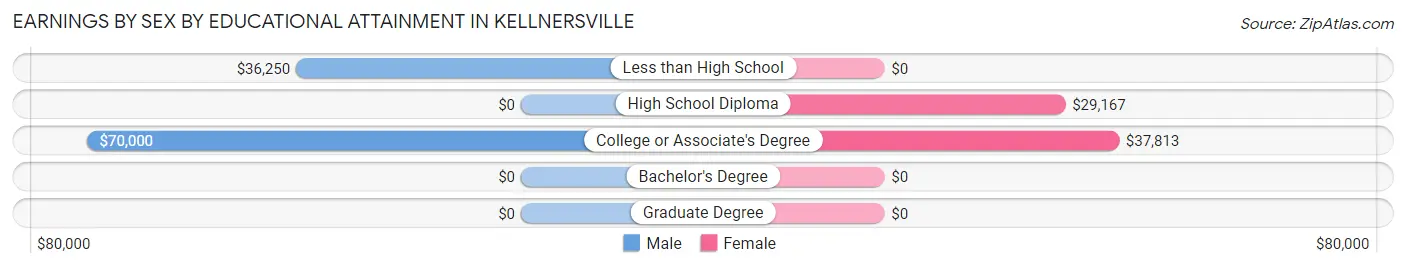
| Educational Attainment | Male Income | Female Income |
| Less than High School | $36,250 | $0 |
| High School Diploma | - | - |
| College or Associate's Degree | $70,000 | $37,813 |
| Bachelor's Degree | - | - |
| Graduate Degree | - | - |
| Total | $45,000 | $34,205 |
Family Income in Kellnersville
Family Income Brackets in Kellnersville
According to the Kellnersville family income data, there are 11 families falling into the $100,000 to $149,999 income range, which is the most common income bracket and makes up 21.1% of all families.
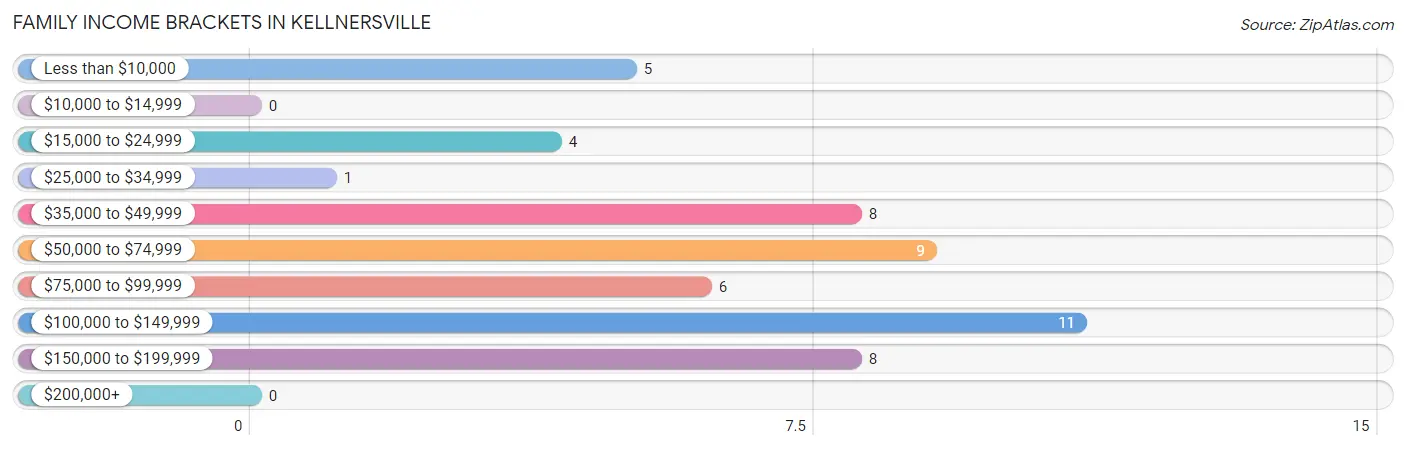
| Income Bracket | # Families | % Families |
| Less than $10,000 | 5 | 9.6% |
| $10,000 to $14,999 | 0 | 0.0% |
| $15,000 to $24,999 | 4 | 7.7% |
| $25,000 to $34,999 | 1 | 1.9% |
| $35,000 to $49,999 | 8 | 15.4% |
| $50,000 to $74,999 | 9 | 17.3% |
| $75,000 to $99,999 | 6 | 11.5% |
| $100,000 to $149,999 | 11 | 21.2% |
| $150,000 to $199,999 | 8 | 15.4% |
| $200,000+ | 0 | 0.0% |
Family Income by Famaliy Size in Kellnersville
3-person families (13 | 25.0%) account for the highest median family income in Kellnersville with $115,625 per family, while 3-person families (13 | 25.0%) have the highest median income of $38,542 per family member.
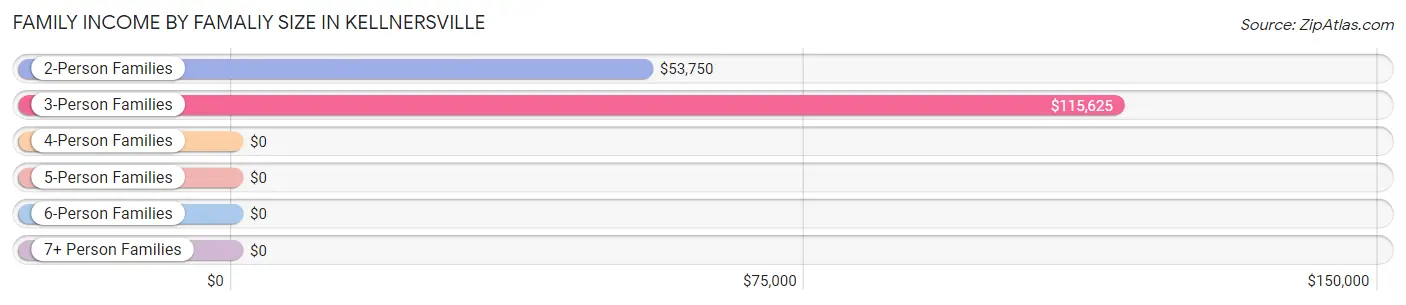
| Income Bracket | # Families | Median Income |
| 2-Person Families | 29 (55.8%) | $53,750 |
| 3-Person Families | 13 (25.0%) | $115,625 |
| 4-Person Families | 6 (11.5%) | $0 |
| 5-Person Families | 2 (3.8%) | $0 |
| 6-Person Families | 2 (3.8%) | $0 |
| 7+ Person Families | 0 (0.0%) | $0 |
| Total | 52 (100.0%) | $63,750 |
Family Income by Number of Earners in Kellnersville
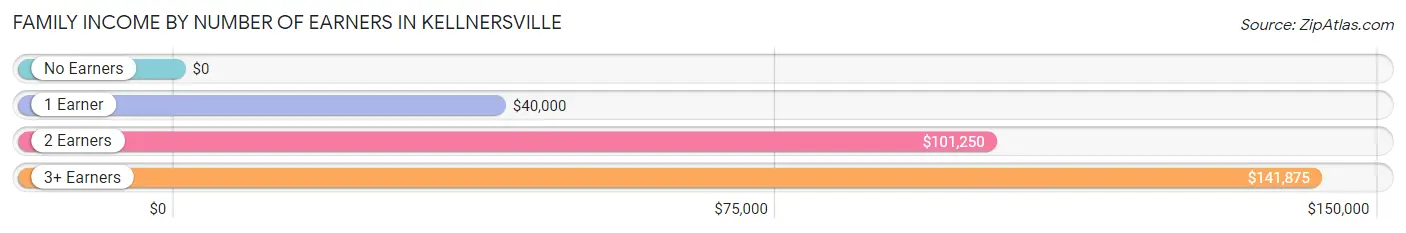
| Number of Earners | # Families | Median Income |
| No Earners | 12 (23.1%) | $0 |
| 1 Earner | 12 (23.1%) | $40,000 |
| 2 Earners | 21 (40.4%) | $101,250 |
| 3+ Earners | 7 (13.5%) | $141,875 |
| Total | 52 (100.0%) | $63,750 |
Household Income in Kellnersville
Household Income Brackets in Kellnersville
With 40 households falling in the category, the $35,000 to $49,999 income range is the most frequent in Kellnersville, accounting for 28.0% of all households.
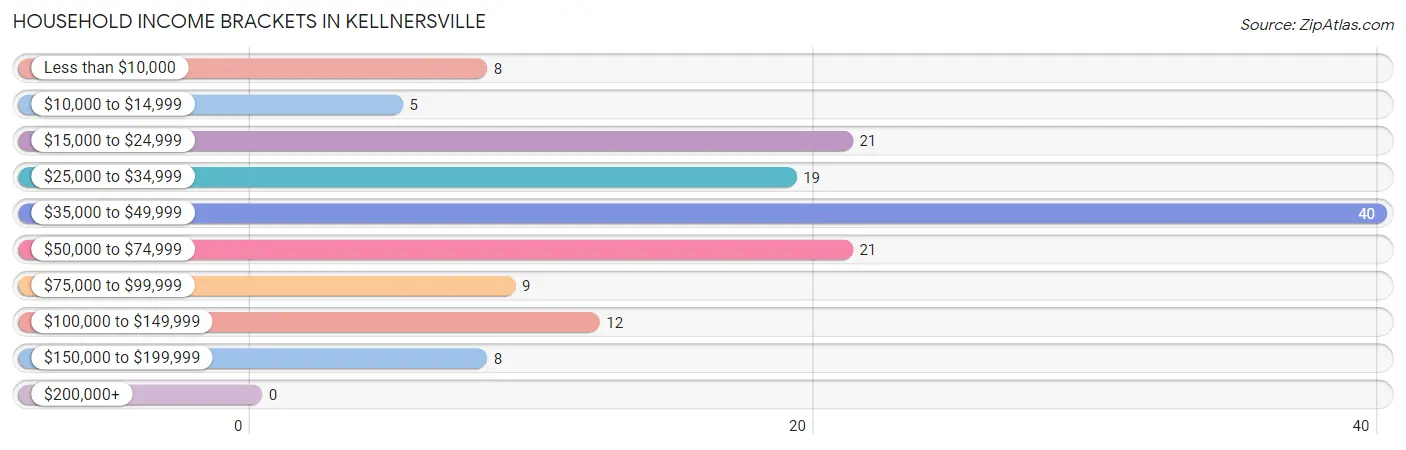
| Income Bracket | # Households | % Households |
| Less than $10,000 | 8 | 5.6% |
| $10,000 to $14,999 | 5 | 3.5% |
| $15,000 to $24,999 | 21 | 14.7% |
| $25,000 to $34,999 | 19 | 13.3% |
| $35,000 to $49,999 | 40 | 28.0% |
| $50,000 to $74,999 | 21 | 14.7% |
| $75,000 to $99,999 | 9 | 6.3% |
| $100,000 to $149,999 | 12 | 8.4% |
| $150,000 to $199,999 | 8 | 5.6% |
| $200,000+ | 0 | 0.0% |
Household Income by Householder Age in Kellnersville
The median household income in Kellnersville is $38,750, with the highest median household income of $64,375 found in the 25 to 44 years age bracket for the primary householder. A total of 21 households (14.7%) fall into this category. Meanwhile, the 15 to 24 years age bracket for the primary householder has the lowest median household income of $0, with 10 households (7.0%) in this group.
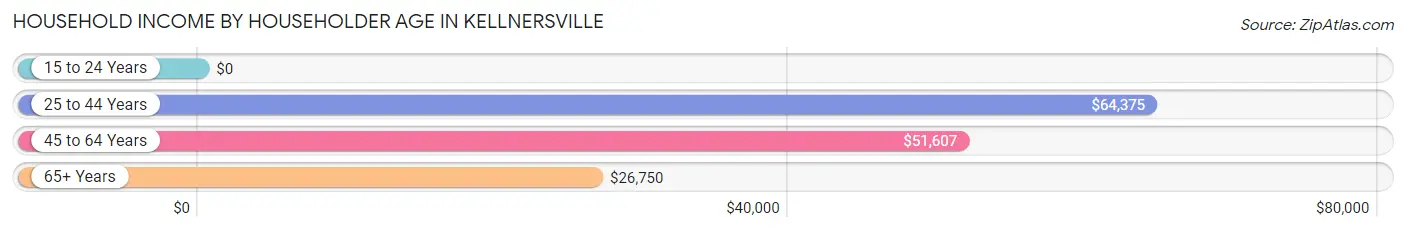
| Income Bracket | # Households | Median Income |
| 15 to 24 Years | 10 (7.0%) | $0 |
| 25 to 44 Years | 21 (14.7%) | $64,375 |
| 45 to 64 Years | 53 (37.1%) | $51,607 |
| 65+ Years | 59 (41.3%) | $26,750 |
| Total | 143 (100.0%) | $38,750 |
Poverty in Kellnersville
Income Below Poverty by Sex and Age in Kellnersville
With 2.3% poverty level for males and 19.2% for females among the residents of Kellnersville, 75 year old and over males and under 5 year old females are the most vulnerable to poverty, with 1 males (11.1%) and 7 females (87.5%) in their respective age groups living below the poverty level.
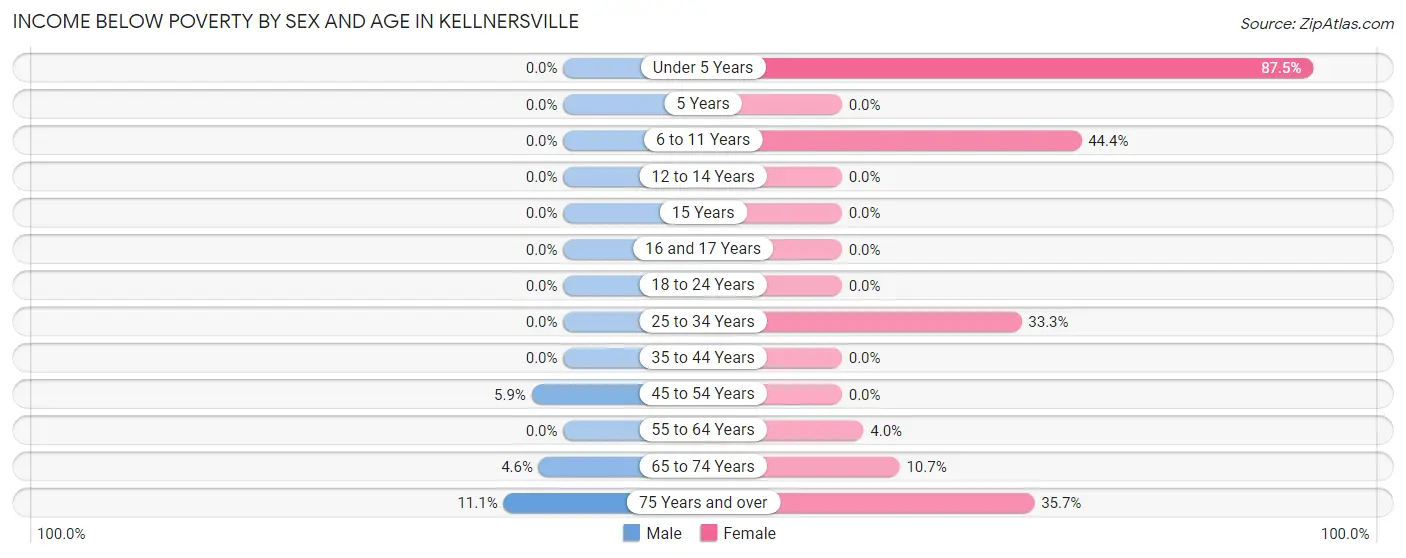
| Age Bracket | Male | Female |
| Under 5 Years | 0 (0.0%) | 7 (87.5%) |
| 5 Years | 0 (0.0%) | 0 (0.0%) |
| 6 to 11 Years | 0 (0.0%) | 4 (44.4%) |
| 12 to 14 Years | 0 (0.0%) | 0 (0.0%) |
| 15 Years | 0 (0.0%) | 0 (0.0%) |
| 16 and 17 Years | 0 (0.0%) | 0 (0.0%) |
| 18 to 24 Years | 0 (0.0%) | 0 (0.0%) |
| 25 to 34 Years | 0 (0.0%) | 4 (33.3%) |
| 35 to 44 Years | 0 (0.0%) | 0 (0.0%) |
| 45 to 54 Years | 1 (5.9%) | 0 (0.0%) |
| 55 to 64 Years | 0 (0.0%) | 1 (4.0%) |
| 65 to 74 Years | 1 (4.5%) | 3 (10.7%) |
| 75 Years and over | 1 (11.1%) | 5 (35.7%) |
| Total | 3 (2.3%) | 24 (19.2%) |
Income Above Poverty by Sex and Age in Kellnersville
According to the poverty statistics in Kellnersville, males aged under 5 years and females aged 15 years are the age groups that are most secure financially, with 100.0% of males and 100.0% of females in these age groups living above the poverty line.
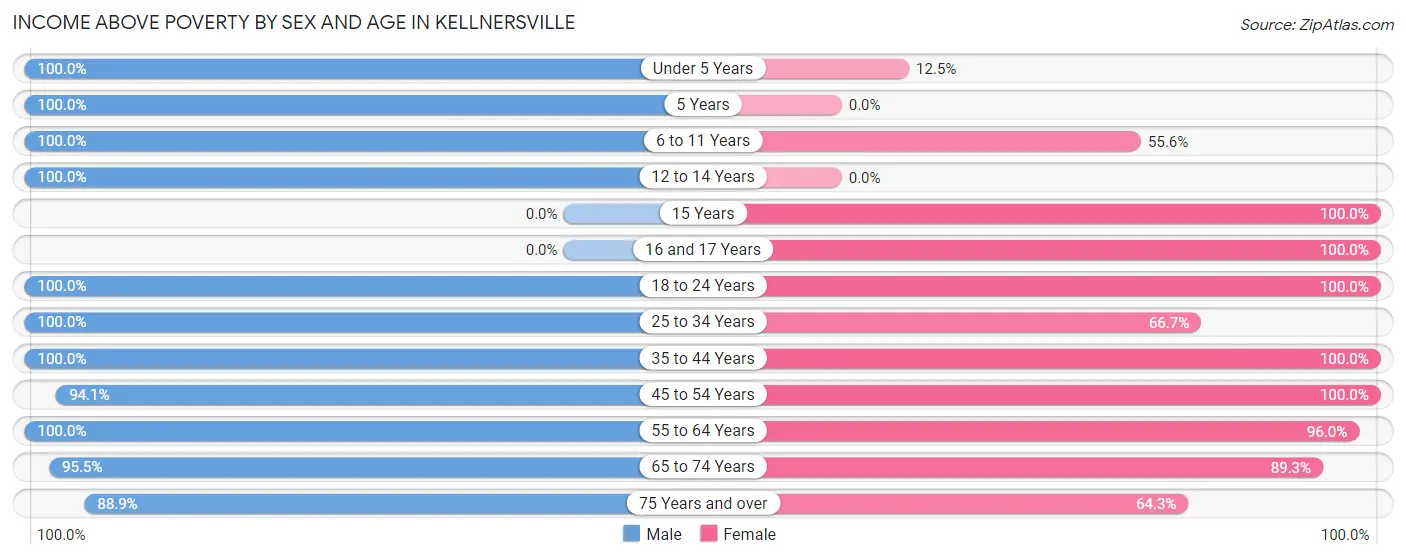
| Age Bracket | Male | Female |
| Under 5 Years | 3 (100.0%) | 1 (12.5%) |
| 5 Years | 2 (100.0%) | 0 (0.0%) |
| 6 to 11 Years | 1 (100.0%) | 5 (55.6%) |
| 12 to 14 Years | 1 (100.0%) | 0 (0.0%) |
| 15 Years | 0 (0.0%) | 1 (100.0%) |
| 16 and 17 Years | 0 (0.0%) | 1 (100.0%) |
| 18 to 24 Years | 28 (100.0%) | 7 (100.0%) |
| 25 to 34 Years | 8 (100.0%) | 8 (66.7%) |
| 35 to 44 Years | 7 (100.0%) | 5 (100.0%) |
| 45 to 54 Years | 16 (94.1%) | 15 (100.0%) |
| 55 to 64 Years | 30 (100.0%) | 24 (96.0%) |
| 65 to 74 Years | 21 (95.5%) | 25 (89.3%) |
| 75 Years and over | 8 (88.9%) | 9 (64.3%) |
| Total | 125 (97.7%) | 101 (80.8%) |
Income Below Poverty Among Married-Couple Families in Kellnersville
The poverty statistics for married-couple families in Kellnersville show that 2.1% or 1 of the total 47 families live below the poverty line. Families with no children have the highest poverty rate of 2.6%, comprising of 1 families. On the other hand, families with 1 or 2 children have the lowest poverty rate of 0.0%, which includes 0 families.
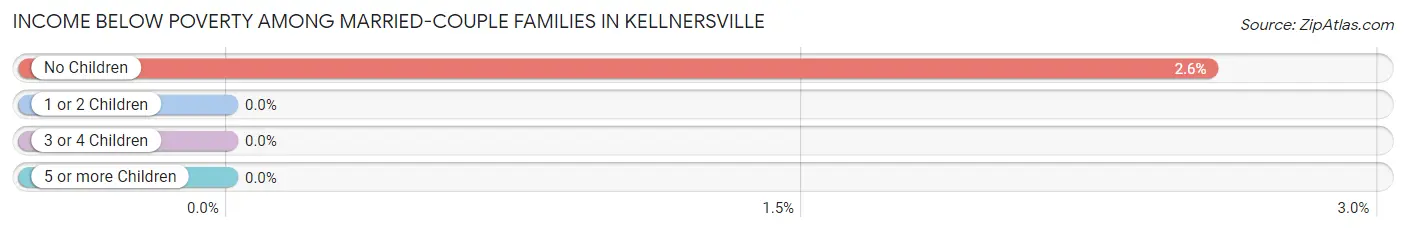
| Children | Above Poverty | Below Poverty |
| No Children | 38 (97.4%) | 1 (2.6%) |
| 1 or 2 Children | 5 (100.0%) | 0 (0.0%) |
| 3 or 4 Children | 3 (100.0%) | 0 (0.0%) |
| 5 or more Children | 0 (0.0%) | 0 (0.0%) |
| Total | 46 (97.9%) | 1 (2.1%) |
Income Below Poverty Among Single-Parent Households in Kellnersville
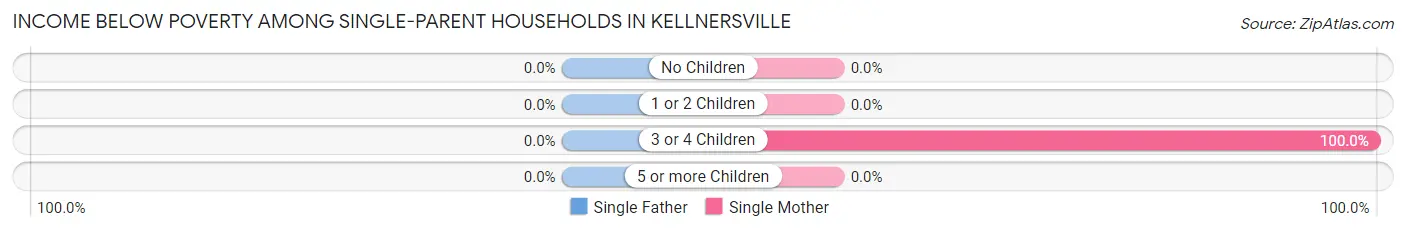
| Children | Single Father | Single Mother |
| No Children | 0 (0.0%) | 0 (0.0%) |
| 1 or 2 Children | 0 (0.0%) | 0 (0.0%) |
| 3 or 4 Children | 0 (0.0%) | 4 (100.0%) |
| 5 or more Children | 0 (0.0%) | 0 (0.0%) |
| Total | 0 (0.0%) | 4 (100.0%) |
Income Below Poverty Among Married-Couple vs Single-Parent Households in Kellnersville
The poverty data for Kellnersville shows that 1 of the married-couple family households (2.1%) and 4 of the single-parent households (80.0%) are living below the poverty level. Within the married-couple family households, those with no children have the highest poverty rate, with 1 households (2.6%) falling below the poverty line. Among the single-parent households, those with 3 or 4 children have the highest poverty rate, with 4 household (100.0%) living below poverty.
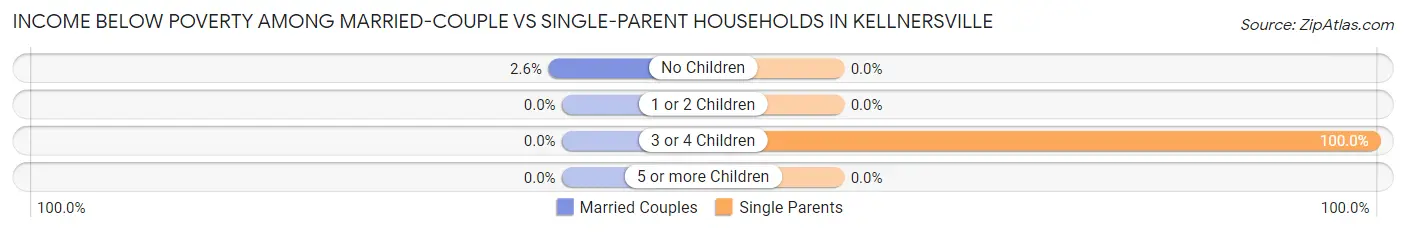
| Children | Married-Couple Families | Single-Parent Households |
| No Children | 1 (2.6%) | 0 (0.0%) |
| 1 or 2 Children | 0 (0.0%) | 0 (0.0%) |
| 3 or 4 Children | 0 (0.0%) | 4 (100.0%) |
| 5 or more Children | 0 (0.0%) | 0 (0.0%) |
| Total | 1 (2.1%) | 4 (80.0%) |
Race in Kellnersville
The most populous races in Kellnersville are White / Caucasian (231 | 90.6%), Hispanic or Latino (24 | 9.4%), and Two or more Races (24 | 9.4%).
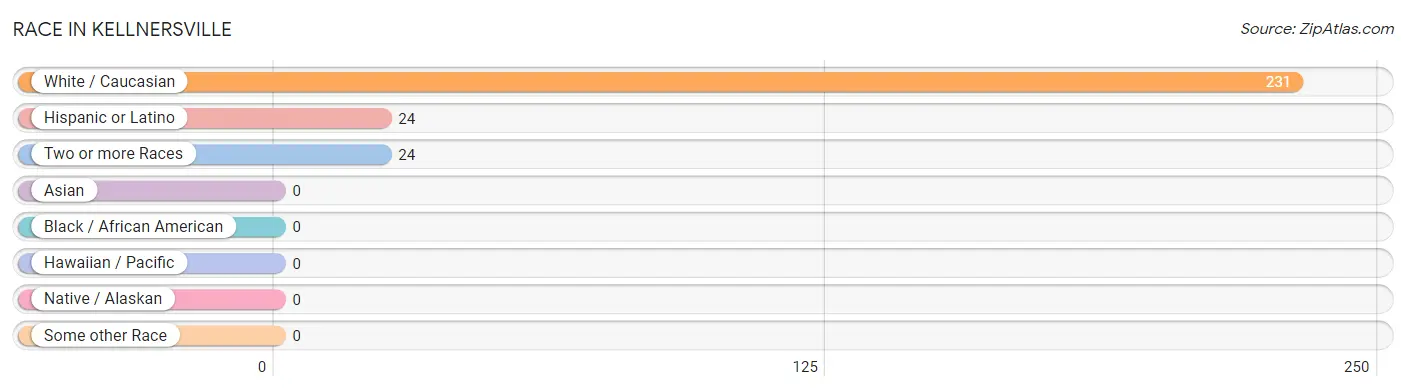
| Race | # Population | % Population |
| Asian | 0 | 0.0% |
| Black / African American | 0 | 0.0% |
| Hawaiian / Pacific | 0 | 0.0% |
| Hispanic or Latino | 24 | 9.4% |
| Native / Alaskan | 0 | 0.0% |
| White / Caucasian | 231 | 90.6% |
| Two or more Races | 24 | 9.4% |
| Some other Race | 0 | 0.0% |
| Total | 255 | 100.0% |
Ancestry in Kellnersville
The most populous ancestries reported in Kellnersville are German (128 | 50.2%), Czech (52 | 20.4%), Irish (33 | 12.9%), Mexican (24 | 9.4%), and Polish (22 | 8.6%), together accounting for 101.6% of all Kellnersville residents.
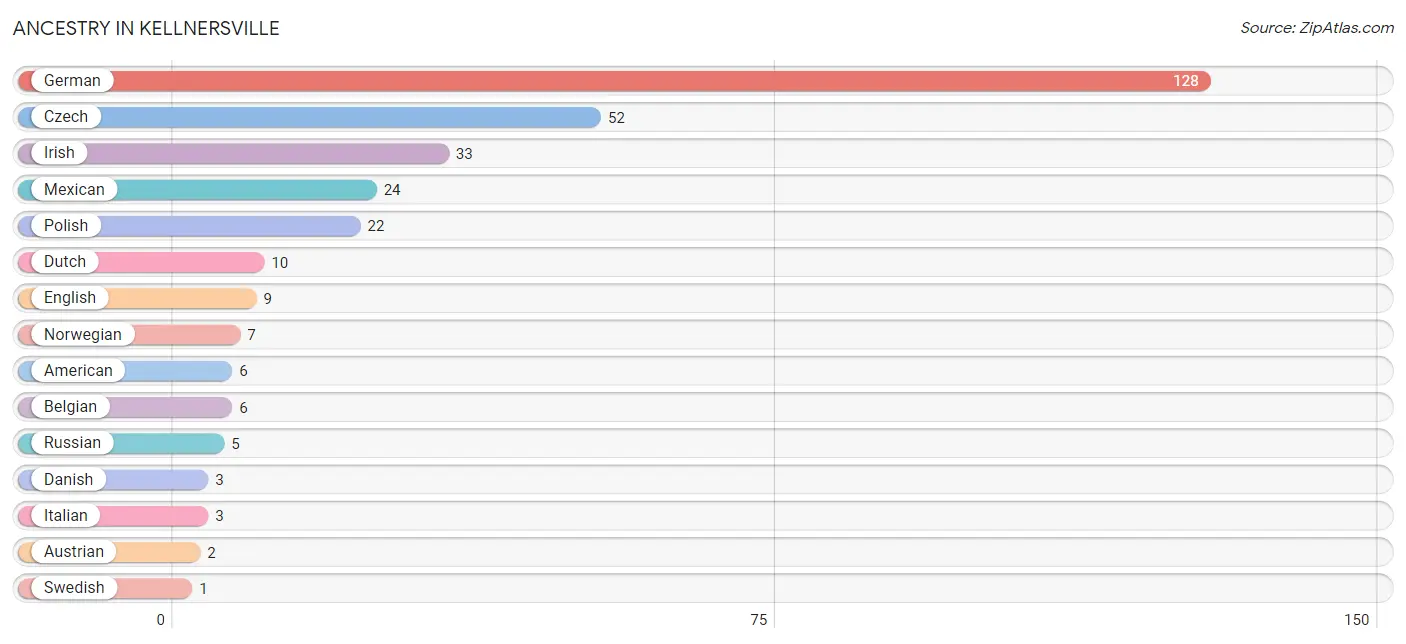
| Ancestry | # Population | % Population |
| American | 6 | 2.4% |
| Austrian | 2 | 0.8% |
| Belgian | 6 | 2.4% |
| Czech | 52 | 20.4% |
| Danish | 3 | 1.2% |
| Dutch | 10 | 3.9% |
| English | 9 | 3.5% |
| German | 128 | 50.2% |
| Irish | 33 | 12.9% |
| Italian | 3 | 1.2% |
| Mexican | 24 | 9.4% |
| Norwegian | 7 | 2.8% |
| Polish | 22 | 8.6% |
| Russian | 5 | 2.0% |
| Swedish | 1 | 0.4% |
| Swiss | 1 | 0.4% | View All 16 Rows |
Immigrants in Kellnersville
The most numerous immigrant groups reported in Kellnersville came from Central America (9 | 3.5%), Latin America (9 | 3.5%), and Mexico (9 | 3.5%), together accounting for 10.6% of all Kellnersville residents.
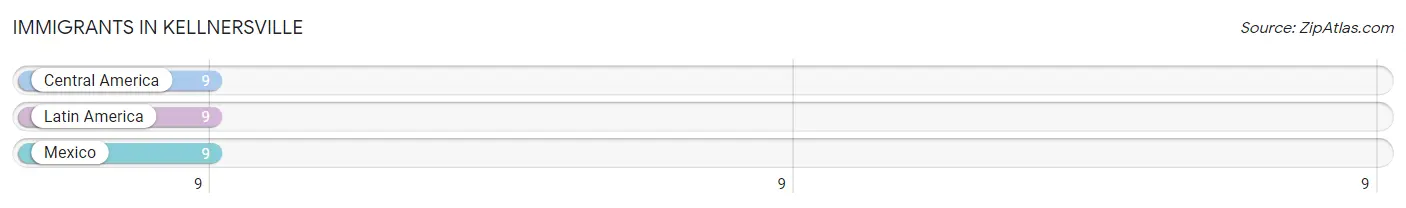
| Immigration Origin | # Population | % Population |
| Central America | 9 | 3.5% |
| Latin America | 9 | 3.5% |
| Mexico | 9 | 3.5% | View All 3 Rows |
Sex and Age in Kellnersville
Sex and Age in Kellnersville
The most populous age groups in Kellnersville are 55 to 59 Years (24 | 18.5%) for men and 65 to 69 Years (23 | 18.4%) for women.
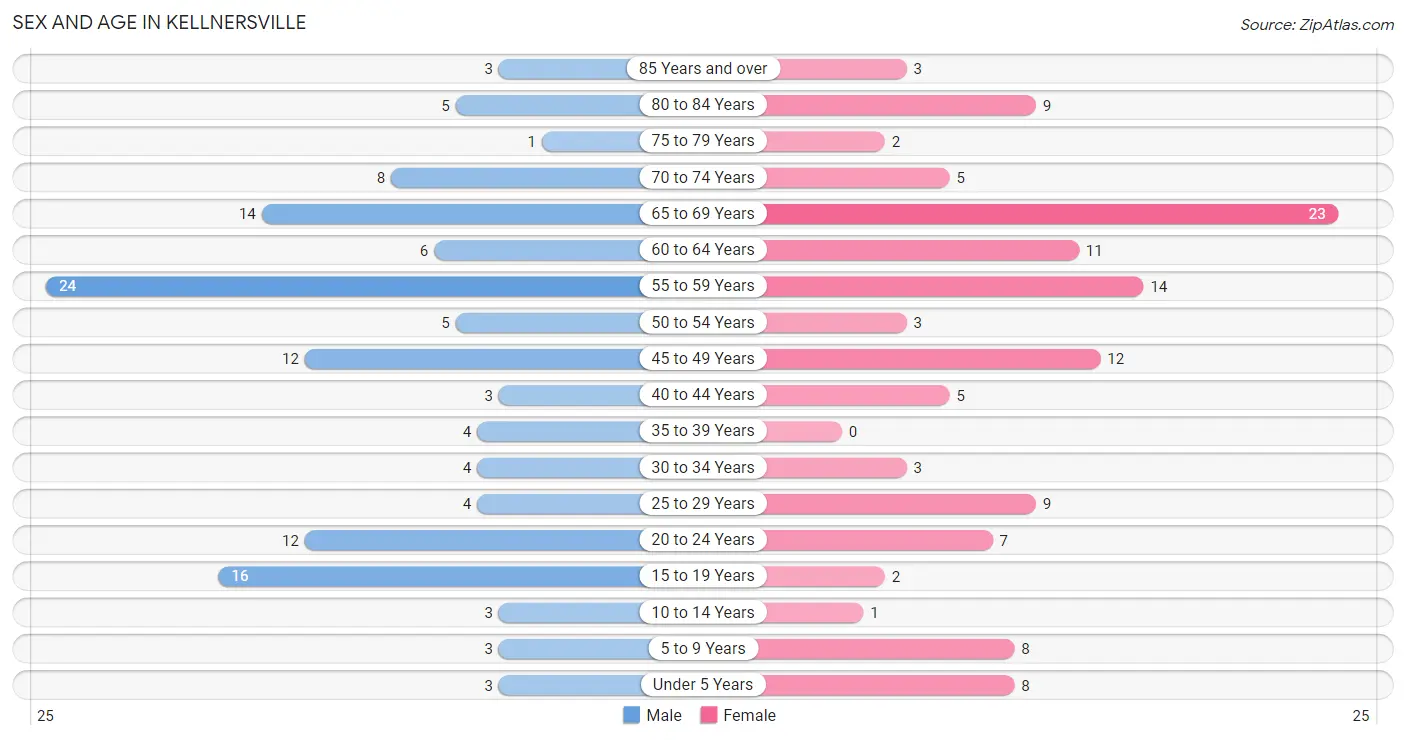
| Age Bracket | Male | Female |
| Under 5 Years | 3 (2.3%) | 8 (6.4%) |
| 5 to 9 Years | 3 (2.3%) | 8 (6.4%) |
| 10 to 14 Years | 3 (2.3%) | 1 (0.8%) |
| 15 to 19 Years | 16 (12.3%) | 2 (1.6%) |
| 20 to 24 Years | 12 (9.2%) | 7 (5.6%) |
| 25 to 29 Years | 4 (3.1%) | 9 (7.2%) |
| 30 to 34 Years | 4 (3.1%) | 3 (2.4%) |
| 35 to 39 Years | 4 (3.1%) | 0 (0.0%) |
| 40 to 44 Years | 3 (2.3%) | 5 (4.0%) |
| 45 to 49 Years | 12 (9.2%) | 12 (9.6%) |
| 50 to 54 Years | 5 (3.8%) | 3 (2.4%) |
| 55 to 59 Years | 24 (18.5%) | 14 (11.2%) |
| 60 to 64 Years | 6 (4.6%) | 11 (8.8%) |
| 65 to 69 Years | 14 (10.8%) | 23 (18.4%) |
| 70 to 74 Years | 8 (6.1%) | 5 (4.0%) |
| 75 to 79 Years | 1 (0.8%) | 2 (1.6%) |
| 80 to 84 Years | 5 (3.8%) | 9 (7.2%) |
| 85 Years and over | 3 (2.3%) | 3 (2.4%) |
| Total | 130 (100.0%) | 125 (100.0%) |
Families and Households in Kellnersville
Median Family Size in Kellnersville
The median family size in Kellnersville is 2.87 persons per family, with single female/mother families (4 | 7.7%) accounting for the largest median family size of 3.75 persons per family. On the other hand, married-couple families (47 | 90.4%) represent the smallest median family size with 2.79 persons per family.
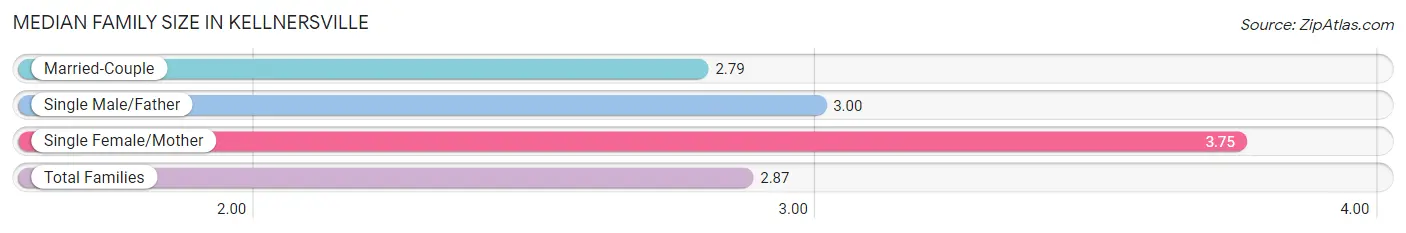
| Family Type | # Families | Family Size |
| Married-Couple | 47 (90.4%) | 2.79 |
| Single Male/Father | 1 (1.9%) | 3.00 |
| Single Female/Mother | 4 (7.7%) | 3.75 |
| Total Families | 52 (100.0%) | 2.87 |
Median Household Size in Kellnersville
The median household size in Kellnersville is 1.78 persons per household, with single male/father households (1 | 0.7%) accounting for the largest median household size of 4 persons per household. non-family households (91 | 63.6%) represent the smallest median household size with 1.15 persons per household.
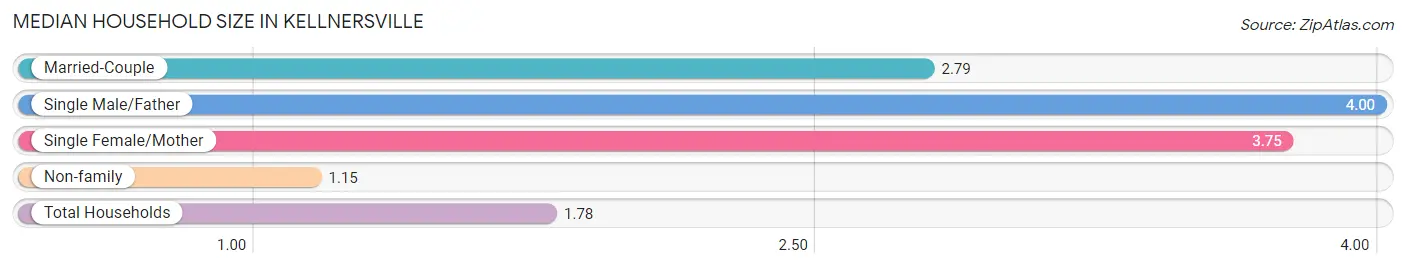
| Household Type | # Households | Household Size |
| Married-Couple | 47 (32.9%) | 2.79 |
| Single Male/Father | 1 (0.7%) | 4.00 |
| Single Female/Mother | 4 (2.8%) | 3.75 |
| Non-family | 91 (63.6%) | 1.15 |
| Total Households | 143 (100.0%) | 1.78 |
Household Size by Marriage Status in Kellnersville
Out of a total of 143 households in Kellnersville, 52 (36.4%) are family households, while 91 (63.6%) are nonfamily households. The most numerous type of family households are 2-person households, comprising 29, and the most common type of nonfamily households are 1-person households, comprising 80.
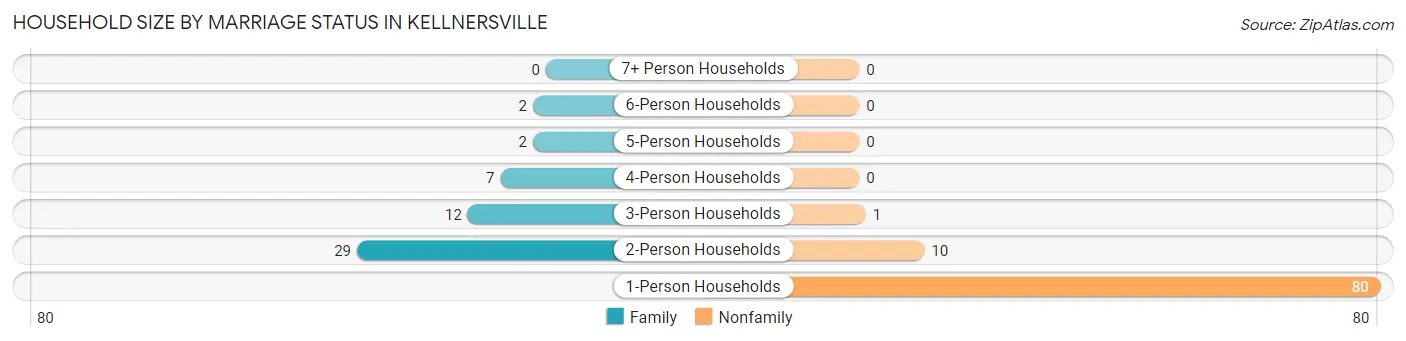
| Household Size | Family Households | Nonfamily Households |
| 1-Person Households | - | 80 (55.9%) |
| 2-Person Households | 29 (20.3%) | 10 (7.0%) |
| 3-Person Households | 12 (8.4%) | 1 (0.7%) |
| 4-Person Households | 7 (4.9%) | 0 (0.0%) |
| 5-Person Households | 2 (1.4%) | 0 (0.0%) |
| 6-Person Households | 2 (1.4%) | 0 (0.0%) |
| 7+ Person Households | 0 (0.0%) | 0 (0.0%) |
| Total | 52 (36.4%) | 91 (63.6%) |
Female Fertility in Kellnersville
Fertility by Age in Kellnersville
| Age Bracket | Women with Births | Births / 1,000 Women |
| 15 to 19 years | 0 (0.0%) | 0.0 |
| 20 to 34 years | 0 (0.0%) | 0.0 |
| 35 to 50 years | 0 (0.0%) | 0.0 |
| Total | 0 (0.0%) | 0.0 |
Fertility by Age by Marriage Status in Kellnersville
| Age Bracket | Married | Unmarried |
| 15 to 19 years | 0 (0.0%) | 0 (0.0%) |
| 20 to 34 years | 0 (0.0%) | 0 (0.0%) |
| 35 to 50 years | 0 (0.0%) | 0 (0.0%) |
| Total | 0 (0.0%) | 0 (0.0%) |
Fertility by Education in Kellnersville
| Educational Attainment | Women with Births | Births / 1,000 Women |
| Less than High School | 0 (0.0%) | 0.0 |
| High School Diploma | 0 (0.0%) | 0.0 |
| College or Associate's Degree | 0 (0.0%) | 0.0 |
| Bachelor's Degree | 0 (0.0%) | 0.0 |
| Graduate Degree | 0 (0.0%) | 0.0 |
| Total | 0 (0.0%) | 0.0 |
Fertility by Education by Marriage Status in Kellnersville
| Educational Attainment | Married | Unmarried |
| Less than High School | 0 (0.0%) | 0 (0.0%) |
| High School Diploma | 0 (0.0%) | 0 (0.0%) |
| College or Associate's Degree | 0 (0.0%) | 0 (0.0%) |
| Bachelor's Degree | 0 (0.0%) | 0 (0.0%) |
| Graduate Degree | 0 (0.0%) | 0 (0.0%) |
| Total | 0 (0.0%) | 0 (0.0%) |
Employment Characteristics in Kellnersville
Employment by Class of Employer in Kellnersville
Among the 129 employed individuals in Kellnersville, private company employees (109 | 84.5%), local government employees (5 | 3.9%), and self-employed (incorporated) (4 | 3.1%) make up the most common classes of employment.
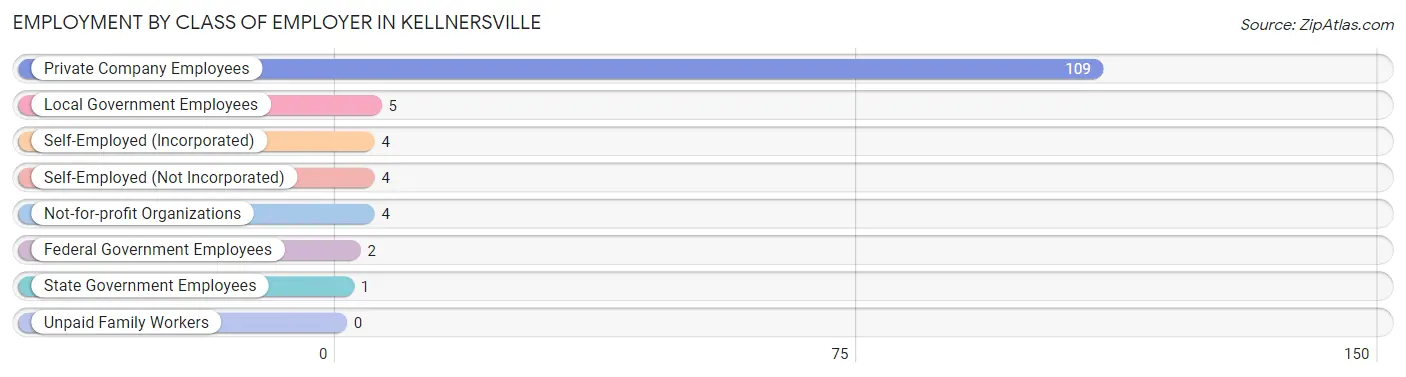
| Employer Class | # Employees | % Employees |
| Private Company Employees | 109 | 84.5% |
| Self-Employed (Incorporated) | 4 | 3.1% |
| Self-Employed (Not Incorporated) | 4 | 3.1% |
| Not-for-profit Organizations | 4 | 3.1% |
| Local Government Employees | 5 | 3.9% |
| State Government Employees | 1 | 0.8% |
| Federal Government Employees | 2 | 1.5% |
| Unpaid Family Workers | 0 | 0.0% |
| Total | 129 | 100.0% |
Employment Status by Age in Kellnersville
According to the labor force statistics for Kellnersville, out of the total population over 16 years of age (228), 57.9% or 132 individuals are in the labor force, with 2.3% or 3 of them unemployed. The age group with the highest labor force participation rate is 20 to 24 years, with 100.0% or 19 individuals in the labor force. Within the labor force, the 35 to 44 years age range has the highest percentage of unemployed individuals, with 18.2% or 2 of them being unemployed.
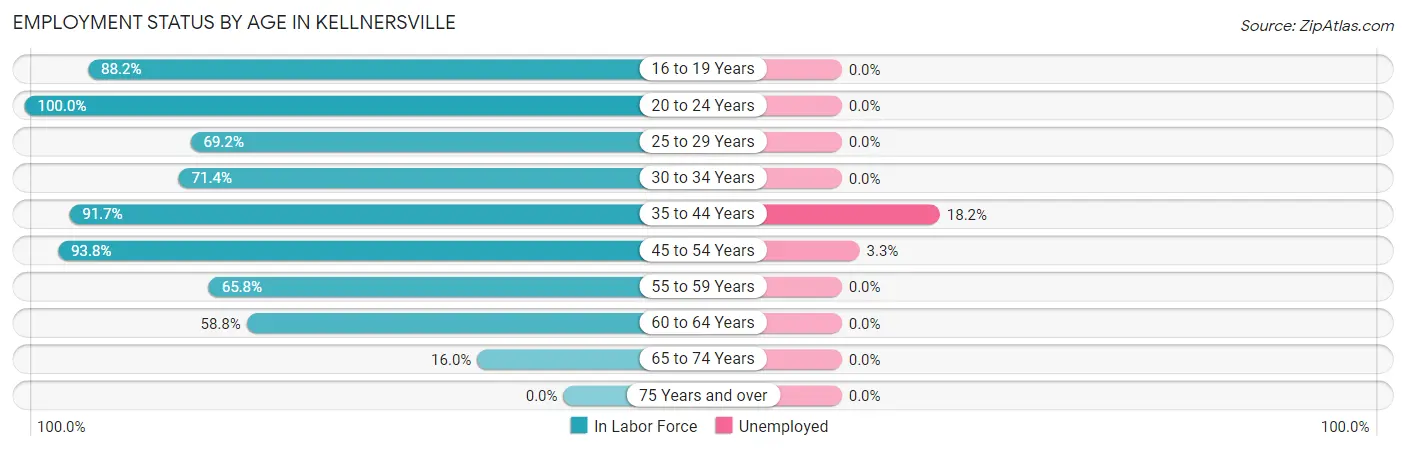
| Age Bracket | In Labor Force | Unemployed |
| 16 to 19 Years | 15 (88.2%) | 0 (0.0%) |
| 20 to 24 Years | 19 (100.0%) | 0 (0.0%) |
| 25 to 29 Years | 9 (69.2%) | 0 (0.0%) |
| 30 to 34 Years | 5 (71.4%) | 0 (0.0%) |
| 35 to 44 Years | 11 (91.7%) | 2 (18.2%) |
| 45 to 54 Years | 30 (93.8%) | 1 (3.3%) |
| 55 to 59 Years | 25 (65.8%) | 0 (0.0%) |
| 60 to 64 Years | 10 (58.8%) | 0 (0.0%) |
| 65 to 74 Years | 8 (16.0%) | 0 (0.0%) |
| 75 Years and over | 0 (0.0%) | 0 (0.0%) |
| Total | 132 (57.9%) | 3 (2.3%) |
Employment Status by Educational Attainment in Kellnersville
According to labor force statistics for Kellnersville, 75.6% of individuals (90) out of the total population between 25 and 64 years of age (119) are in the labor force, with 3.3% or 3 of them being unemployed. The group with the highest labor force participation rate are those with the educational attainment of bachelor's degree or higher, with 100.0% or 12 individuals in the labor force. Within the labor force, individuals with less than high school education have the highest percentage of unemployment, with 25.0% or 2 of them being unemployed.
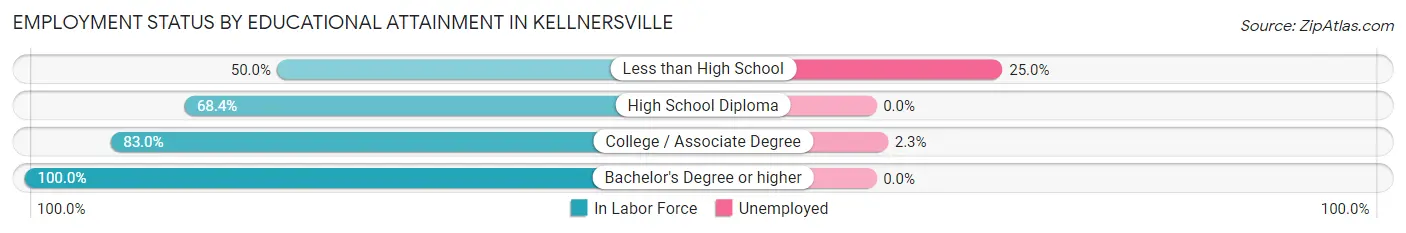
| Educational Attainment | In Labor Force | Unemployed |
| Less than High School | 8 (50.0%) | 4 (25.0%) |
| High School Diploma | 26 (68.4%) | 0 (0.0%) |
| College / Associate Degree | 44 (83.0%) | 1 (2.3%) |
| Bachelor's Degree or higher | 12 (100.0%) | 0 (0.0%) |
| Total | 90 (75.6%) | 4 (3.3%) |
Employment Occupations by Sex in Kellnersville
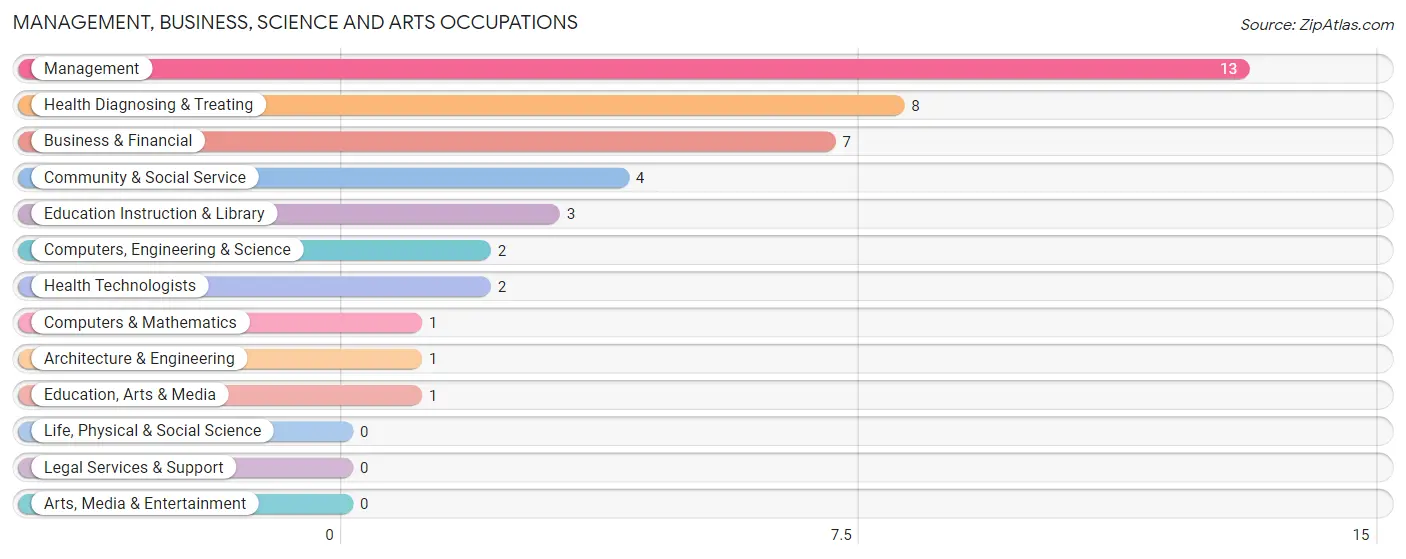
Management, Business, Science and Arts Occupations
The most common Management, Business, Science and Arts occupations in Kellnersville are Management (13 | 10.1%), Health Diagnosing & Treating (8 | 6.2%), Business & Financial (7 | 5.4%), Community & Social Service (4 | 3.1%), and Education Instruction & Library (3 | 2.3%).
Management, Business, Science and Arts Occupations by Sex
Within the Management, Business, Science and Arts occupations in Kellnersville, the most male-oriented occupations are Computers, Engineering & Science (100.0%), Computers & Mathematics (100.0%), and Architecture & Engineering (100.0%), while the most female-oriented occupations are Education, Arts & Media (100.0%), Health Technologists (100.0%), and Community & Social Service (75.0%).
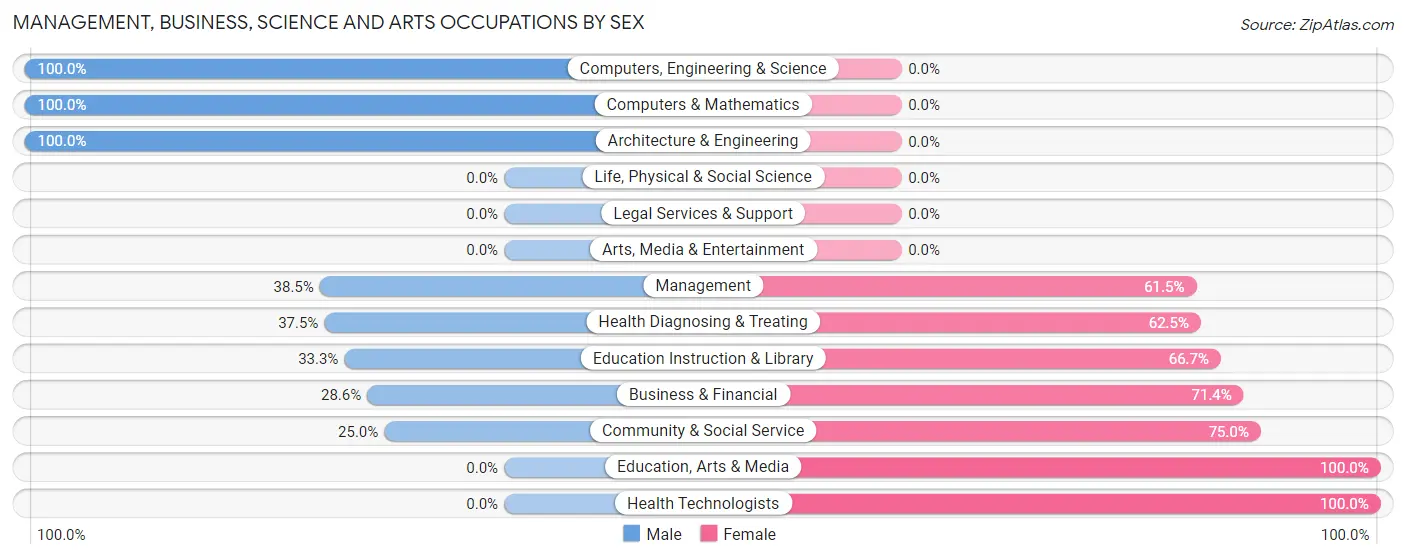
| Occupation | Male | Female |
| Management | 5 (38.5%) | 8 (61.5%) |
| Business & Financial | 2 (28.6%) | 5 (71.4%) |
| Computers, Engineering & Science | 2 (100.0%) | 0 (0.0%) |
| Computers & Mathematics | 1 (100.0%) | 0 (0.0%) |
| Architecture & Engineering | 1 (100.0%) | 0 (0.0%) |
| Life, Physical & Social Science | 0 (0.0%) | 0 (0.0%) |
| Community & Social Service | 1 (25.0%) | 3 (75.0%) |
| Education, Arts & Media | 0 (0.0%) | 1 (100.0%) |
| Legal Services & Support | 0 (0.0%) | 0 (0.0%) |
| Education Instruction & Library | 1 (33.3%) | 2 (66.7%) |
| Arts, Media & Entertainment | 0 (0.0%) | 0 (0.0%) |
| Health Diagnosing & Treating | 3 (37.5%) | 5 (62.5%) |
| Health Technologists | 0 (0.0%) | 2 (100.0%) |
| Total (Category) | 13 (38.2%) | 21 (61.8%) |
| Total (Overall) | 82 (63.6%) | 47 (36.4%) |
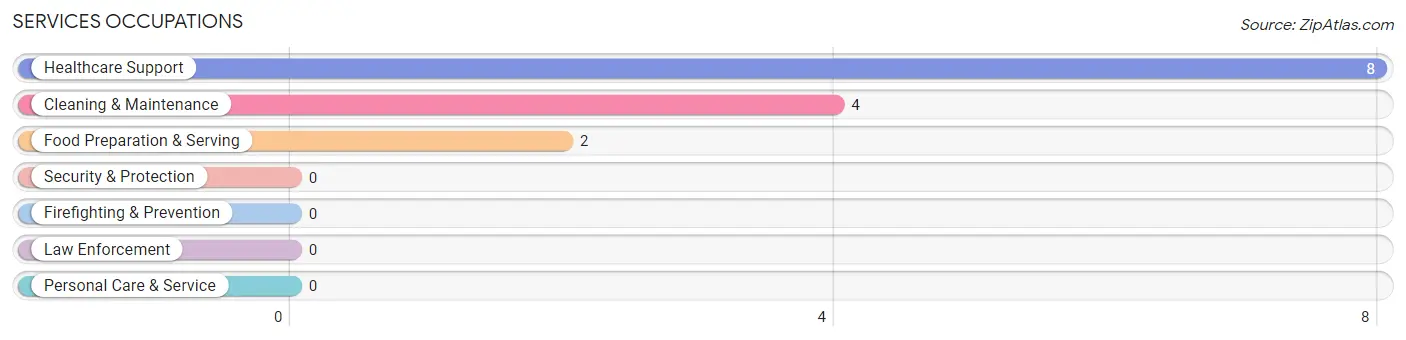
Services Occupations
The most common Services occupations in Kellnersville are Healthcare Support (8 | 6.2%), Cleaning & Maintenance (4 | 3.1%), and Food Preparation & Serving (2 | 1.5%).
Services Occupations by Sex
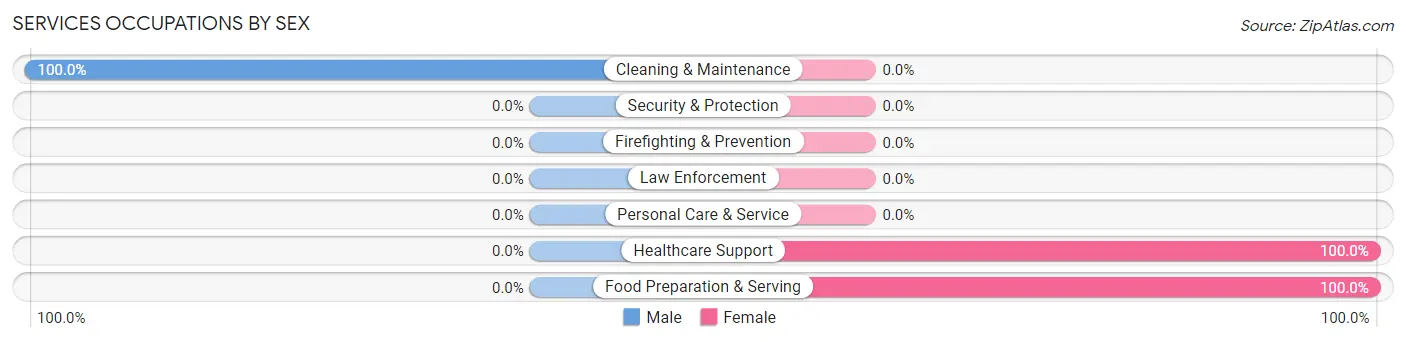
| Occupation | Male | Female |
| Healthcare Support | 0 (0.0%) | 8 (100.0%) |
| Security & Protection | 0 (0.0%) | 0 (0.0%) |
| Firefighting & Prevention | 0 (0.0%) | 0 (0.0%) |
| Law Enforcement | 0 (0.0%) | 0 (0.0%) |
| Food Preparation & Serving | 0 (0.0%) | 2 (100.0%) |
| Cleaning & Maintenance | 4 (100.0%) | 0 (0.0%) |
| Personal Care & Service | 0 (0.0%) | 0 (0.0%) |
| Total (Category) | 4 (28.6%) | 10 (71.4%) |
| Total (Overall) | 82 (63.6%) | 47 (36.4%) |
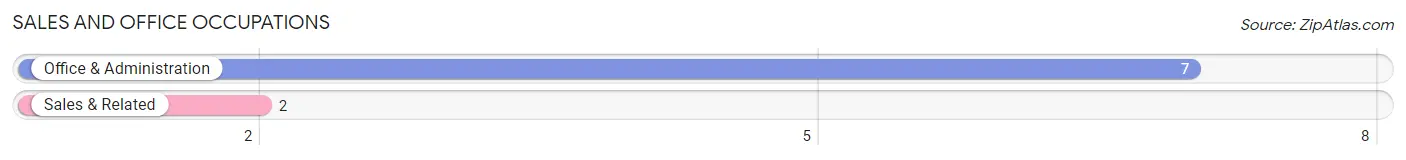
Sales and Office Occupations
The most common Sales and Office occupations in Kellnersville are Office & Administration (7 | 5.4%), and Sales & Related (2 | 1.5%).
Sales and Office Occupations by Sex
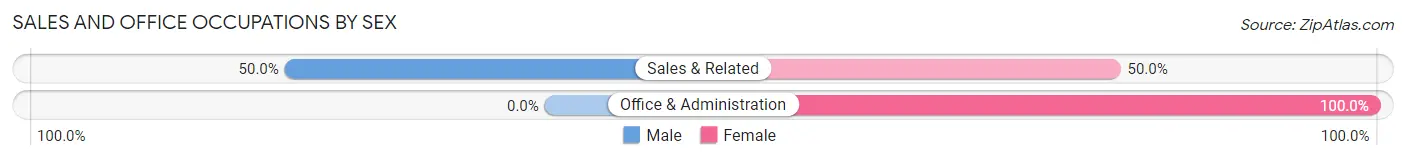
| Occupation | Male | Female |
| Sales & Related | 1 (50.0%) | 1 (50.0%) |
| Office & Administration | 0 (0.0%) | 7 (100.0%) |
| Total (Category) | 1 (11.1%) | 8 (88.9%) |
| Total (Overall) | 82 (63.6%) | 47 (36.4%) |
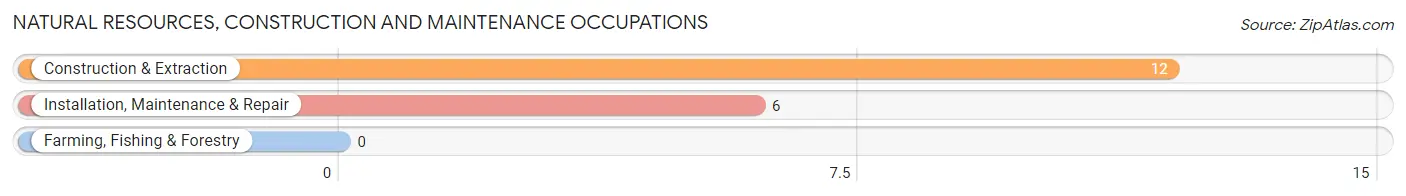
Natural Resources, Construction and Maintenance Occupations
The most common Natural Resources, Construction and Maintenance occupations in Kellnersville are Construction & Extraction (12 | 9.3%), and Installation, Maintenance & Repair (6 | 4.6%).
Natural Resources, Construction and Maintenance Occupations by Sex
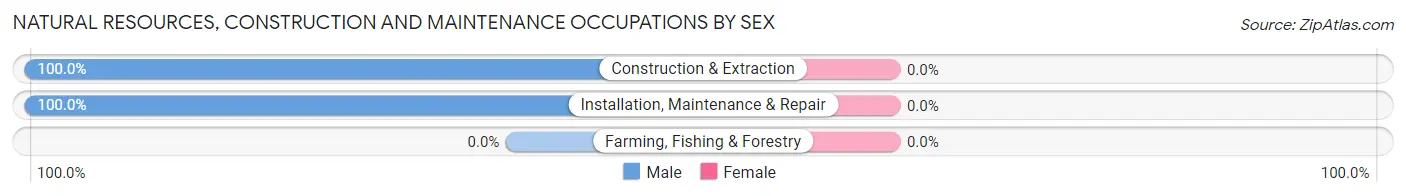
| Occupation | Male | Female |
| Farming, Fishing & Forestry | 0 (0.0%) | 0 (0.0%) |
| Construction & Extraction | 12 (100.0%) | 0 (0.0%) |
| Installation, Maintenance & Repair | 6 (100.0%) | 0 (0.0%) |
| Total (Category) | 18 (100.0%) | 0 (0.0%) |
| Total (Overall) | 82 (63.6%) | 47 (36.4%) |
Production, Transportation and Moving Occupations
The most common Production, Transportation and Moving occupations in Kellnersville are Production (43 | 33.3%), Transportation (7 | 5.4%), and Material Moving (4 | 3.1%).
Production, Transportation and Moving Occupations by Sex
| Occupation | Male | Female |
| Production | 38 (88.4%) | 5 (11.6%) |
| Transportation | 7 (100.0%) | 0 (0.0%) |
| Material Moving | 1 (25.0%) | 3 (75.0%) |
| Total (Category) | 46 (85.2%) | 8 (14.8%) |
| Total (Overall) | 82 (63.6%) | 47 (36.4%) |
Employment Industries by Sex in Kellnersville
Employment Industries in Kellnersville
The major employment industries in Kellnersville include Manufacturing (50 | 38.8%), Health Care & Social Assistance (15 | 11.6%), Construction (12 | 9.3%), Retail Trade (8 | 6.2%), and Transportation & Warehousing (8 | 6.2%).
Employment Industries by Sex in Kellnersville
The Kellnersville industries that see more men than women are Agriculture, Fishing & Hunting (100.0%), Construction (100.0%), and Utilities (100.0%), whereas the industries that tend to have a higher number of women are Retail Trade (100.0%), Information (100.0%), and Professional & Scientific (100.0%).
| Industry | Male | Female |
| Agriculture, Fishing & Hunting | 2 (100.0%) | 0 (0.0%) |
| Mining, Quarrying, & Extraction | 0 (0.0%) | 0 (0.0%) |
| Construction | 12 (100.0%) | 0 (0.0%) |
| Manufacturing | 43 (86.0%) | 7 (14.0%) |
| Wholesale Trade | 0 (0.0%) | 0 (0.0%) |
| Retail Trade | 0 (0.0%) | 8 (100.0%) |
| Transportation & Warehousing | 6 (75.0%) | 2 (25.0%) |
| Utilities | 3 (100.0%) | 0 (0.0%) |
| Information | 0 (0.0%) | 4 (100.0%) |
| Finance & Insurance | 1 (25.0%) | 3 (75.0%) |
| Real Estate, Rental & Leasing | 4 (100.0%) | 0 (0.0%) |
| Professional & Scientific | 0 (0.0%) | 3 (100.0%) |
| Enterprise Management | 0 (0.0%) | 0 (0.0%) |
| Administrative & Support | 0 (0.0%) | 0 (0.0%) |
| Educational Services | 3 (60.0%) | 2 (40.0%) |
| Health Care & Social Assistance | 3 (20.0%) | 12 (80.0%) |
| Arts, Entertainment & Recreation | 0 (0.0%) | 0 (0.0%) |
| Accommodation & Food Services | 0 (0.0%) | 0 (0.0%) |
| Public Administration | 0 (0.0%) | 0 (0.0%) |
| Total | 82 (63.6%) | 47 (36.4%) |
Education in Kellnersville
School Enrollment in Kellnersville
The most common levels of schooling among the 42 students in Kellnersville are high school (17 | 40.5%), elementary school (10 | 23.8%), and college / undergraduate (5 | 11.9%).
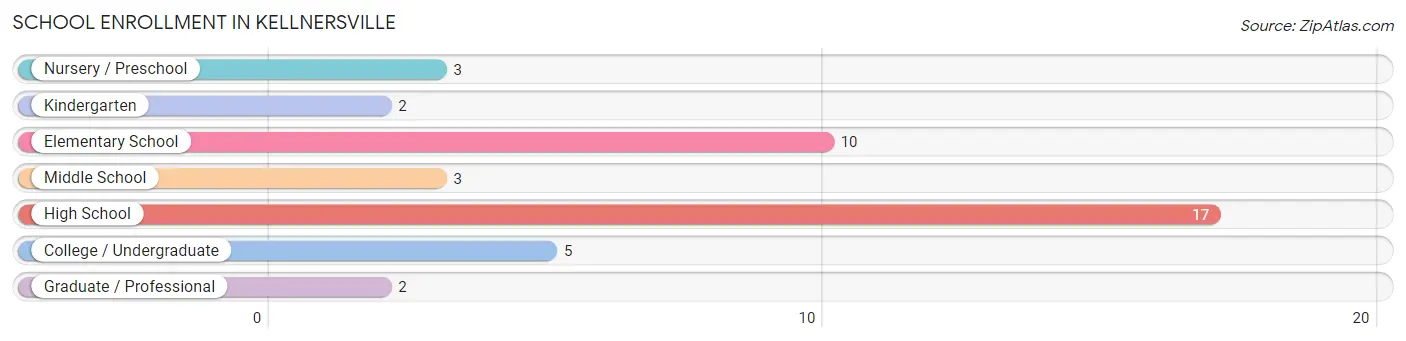
| School Level | # Students | % Students |
| Nursery / Preschool | 3 | 7.1% |
| Kindergarten | 2 | 4.8% |
| Elementary School | 10 | 23.8% |
| Middle School | 3 | 7.1% |
| High School | 17 | 40.5% |
| College / Undergraduate | 5 | 11.9% |
| Graduate / Professional | 2 | 4.8% |
| Total | 42 | 100.0% |
School Enrollment by Age by Funding Source in Kellnersville
Out of a total of 42 students who are enrolled in schools in Kellnersville, 8 (19.0%) attend a private institution, while the remaining 34 (81.0%) are enrolled in public schools. The age group of 20 to 24 year olds has the highest likelihood of being enrolled in private schools, with 2 (66.7% in the age bracket) enrolled. Conversely, the age group of 3 to 4 year olds has the lowest likelihood of being enrolled in a private school, with 3 (100.0% in the age bracket) attending a public institution.
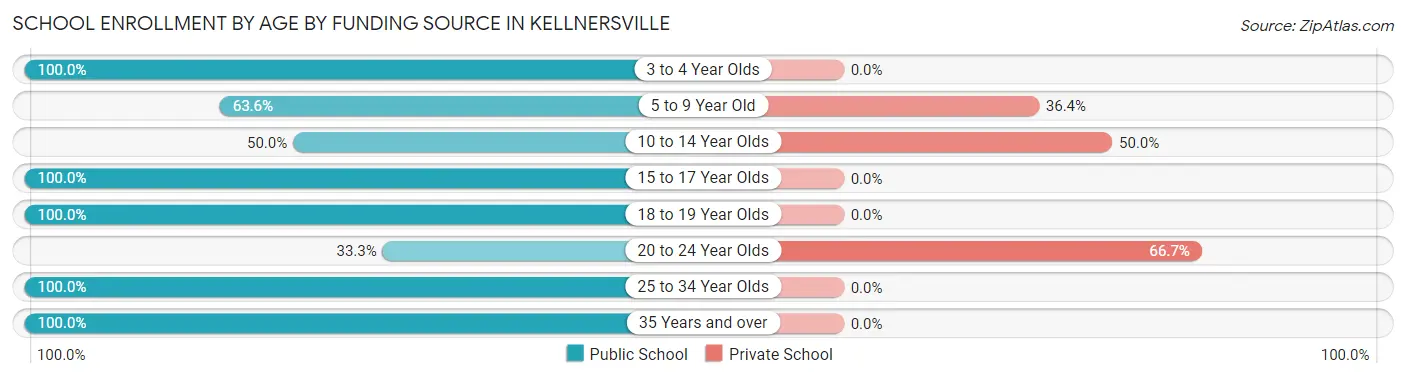
| Age Bracket | Public School | Private School |
| 3 to 4 Year Olds | 3 (100.0%) | 0 (0.0%) |
| 5 to 9 Year Old | 7 (63.6%) | 4 (36.4%) |
| 10 to 14 Year Olds | 2 (50.0%) | 2 (50.0%) |
| 15 to 17 Year Olds | 2 (100.0%) | 0 (0.0%) |
| 18 to 19 Year Olds | 16 (100.0%) | 0 (0.0%) |
| 20 to 24 Year Olds | 1 (33.3%) | 2 (66.7%) |
| 25 to 34 Year Olds | 1 (100.0%) | 0 (0.0%) |
| 35 Years and over | 2 (100.0%) | 0 (0.0%) |
| Total | 34 (81.0%) | 8 (19.0%) |
Educational Attainment by Field of Study in Kellnersville
Business (5 | 33.3%), education (5 | 33.3%), social sciences (2 | 13.3%), liberal arts & history (2 | 13.3%), and bio, nature & agricultural (1 | 6.7%) are the most common fields of study among 15 individuals in Kellnersville who have obtained a bachelor's degree or higher.
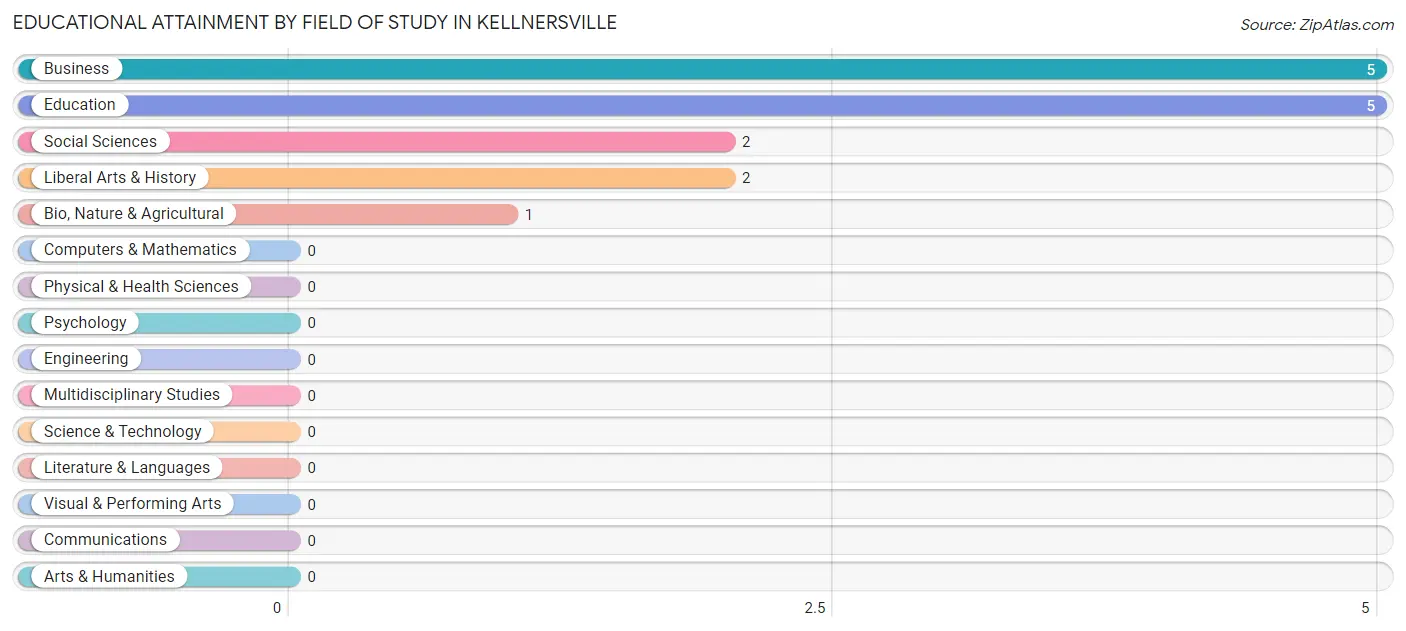
| Field of Study | # Graduates | % Graduates |
| Computers & Mathematics | 0 | 0.0% |
| Bio, Nature & Agricultural | 1 | 6.7% |
| Physical & Health Sciences | 0 | 0.0% |
| Psychology | 0 | 0.0% |
| Social Sciences | 2 | 13.3% |
| Engineering | 0 | 0.0% |
| Multidisciplinary Studies | 0 | 0.0% |
| Science & Technology | 0 | 0.0% |
| Business | 5 | 33.3% |
| Education | 5 | 33.3% |
| Literature & Languages | 0 | 0.0% |
| Liberal Arts & History | 2 | 13.3% |
| Visual & Performing Arts | 0 | 0.0% |
| Communications | 0 | 0.0% |
| Arts & Humanities | 0 | 0.0% |
| Total | 15 | 100.0% |
Transportation & Commute in Kellnersville
Vehicle Availability by Sex in Kellnersville
The most prevalent vehicle ownership categories in Kellnersville are males with 2 vehicles (36, accounting for 43.9%) and females with 2 vehicles (13, making up 76.6%).
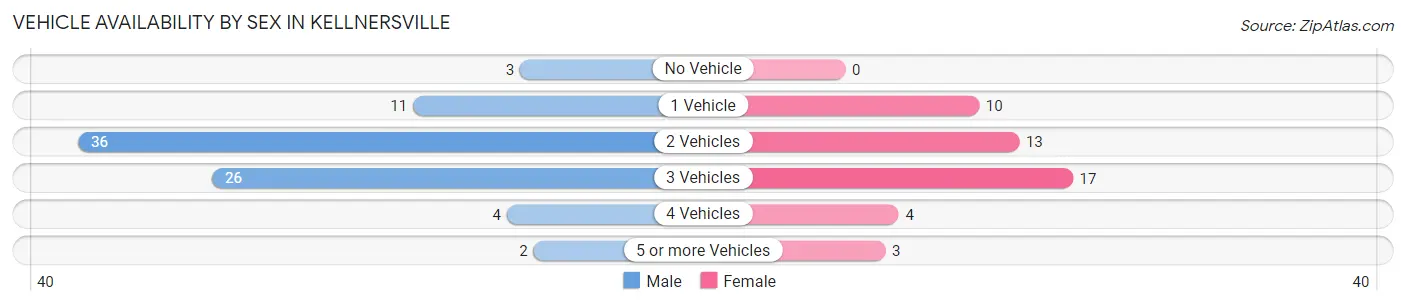
| Vehicles Available | Male | Female |
| No Vehicle | 3 (3.7%) | 0 (0.0%) |
| 1 Vehicle | 11 (13.4%) | 10 (21.3%) |
| 2 Vehicles | 36 (43.9%) | 13 (27.7%) |
| 3 Vehicles | 26 (31.7%) | 17 (36.2%) |
| 4 Vehicles | 4 (4.9%) | 4 (8.5%) |
| 5 or more Vehicles | 2 (2.4%) | 3 (6.4%) |
| Total | 82 (100.0%) | 47 (100.0%) |
Commute Time in Kellnersville
The most frequently occuring commute durations in Kellnersville are 20 to 24 minutes (33 commuters, 27.3%), 15 to 19 minutes (26 commuters, 21.5%), and 25 to 29 minutes (25 commuters, 20.7%).
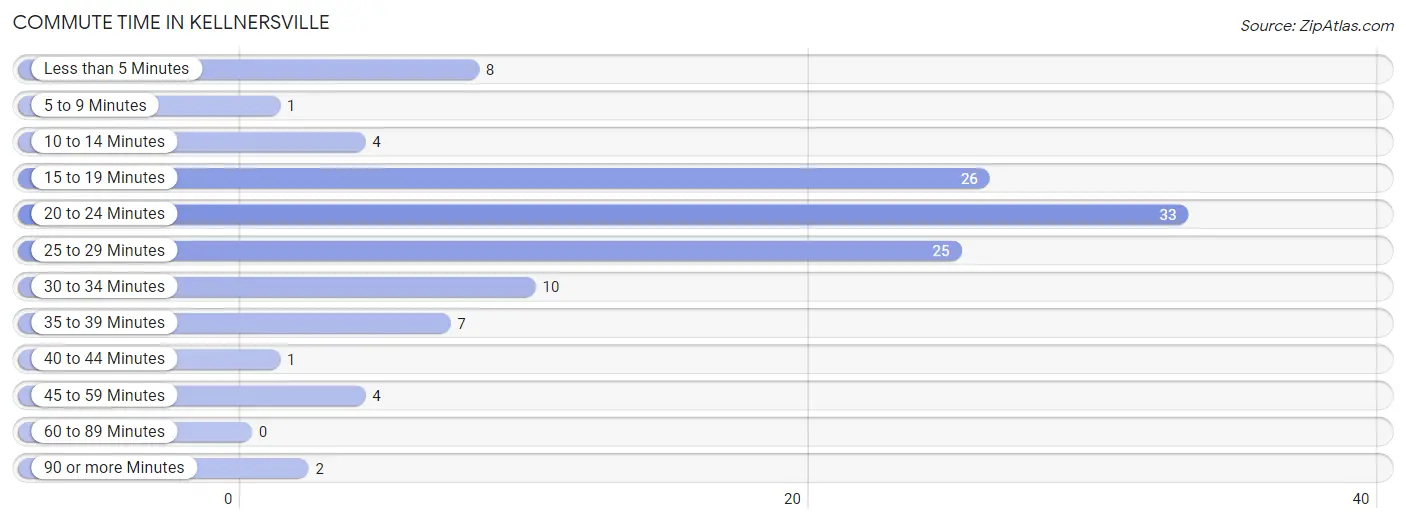
| Commute Time | # Commuters | % Commuters |
| Less than 5 Minutes | 8 | 6.6% |
| 5 to 9 Minutes | 1 | 0.8% |
| 10 to 14 Minutes | 4 | 3.3% |
| 15 to 19 Minutes | 26 | 21.5% |
| 20 to 24 Minutes | 33 | 27.3% |
| 25 to 29 Minutes | 25 | 20.7% |
| 30 to 34 Minutes | 10 | 8.3% |
| 35 to 39 Minutes | 7 | 5.8% |
| 40 to 44 Minutes | 1 | 0.8% |
| 45 to 59 Minutes | 4 | 3.3% |
| 60 to 89 Minutes | 0 | 0.0% |
| 90 or more Minutes | 2 | 1.7% |
Commute Time by Sex in Kellnersville
The most common commute times in Kellnersville are 15 to 19 minutes (20 commuters, 24.4%) for males and 20 to 24 minutes (14 commuters, 35.9%) for females.
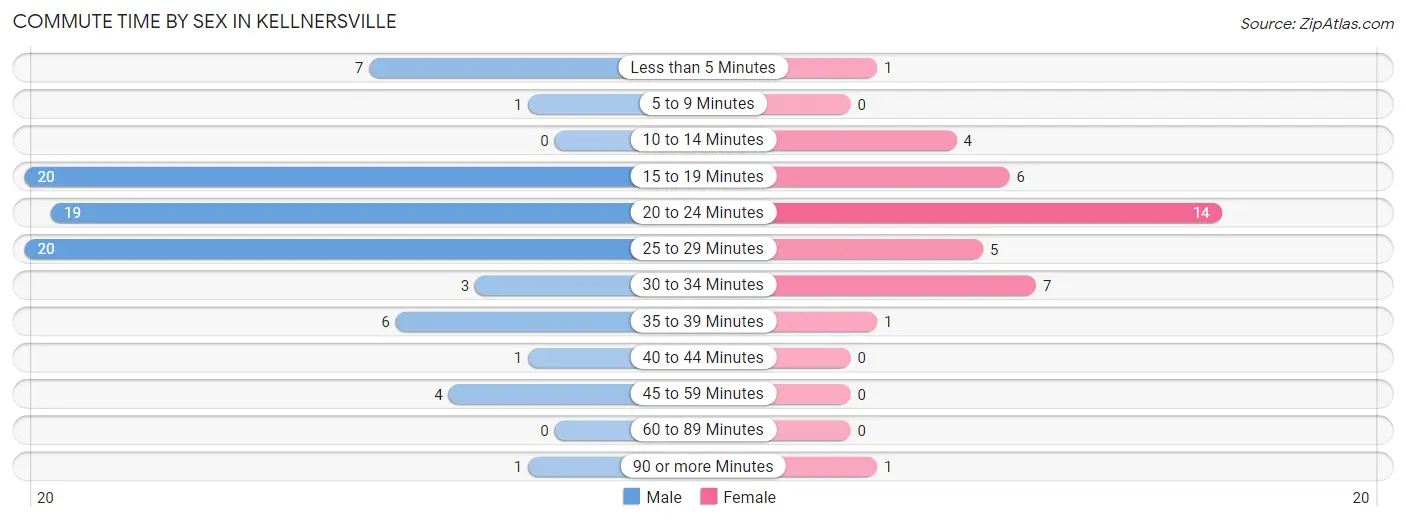
| Commute Time | Male | Female |
| Less than 5 Minutes | 7 (8.5%) | 1 (2.6%) |
| 5 to 9 Minutes | 1 (1.2%) | 0 (0.0%) |
| 10 to 14 Minutes | 0 (0.0%) | 4 (10.3%) |
| 15 to 19 Minutes | 20 (24.4%) | 6 (15.4%) |
| 20 to 24 Minutes | 19 (23.2%) | 14 (35.9%) |
| 25 to 29 Minutes | 20 (24.4%) | 5 (12.8%) |
| 30 to 34 Minutes | 3 (3.7%) | 7 (17.9%) |
| 35 to 39 Minutes | 6 (7.3%) | 1 (2.6%) |
| 40 to 44 Minutes | 1 (1.2%) | 0 (0.0%) |
| 45 to 59 Minutes | 4 (4.9%) | 0 (0.0%) |
| 60 to 89 Minutes | 0 (0.0%) | 0 (0.0%) |
| 90 or more Minutes | 1 (1.2%) | 1 (2.6%) |
Time of Departure to Work by Sex in Kellnersville
The most frequent times of departure to work in Kellnersville are 6:00 AM to 6:29 AM (18, 22.0%) for males and 7:00 AM to 7:29 AM (13, 33.3%) for females.
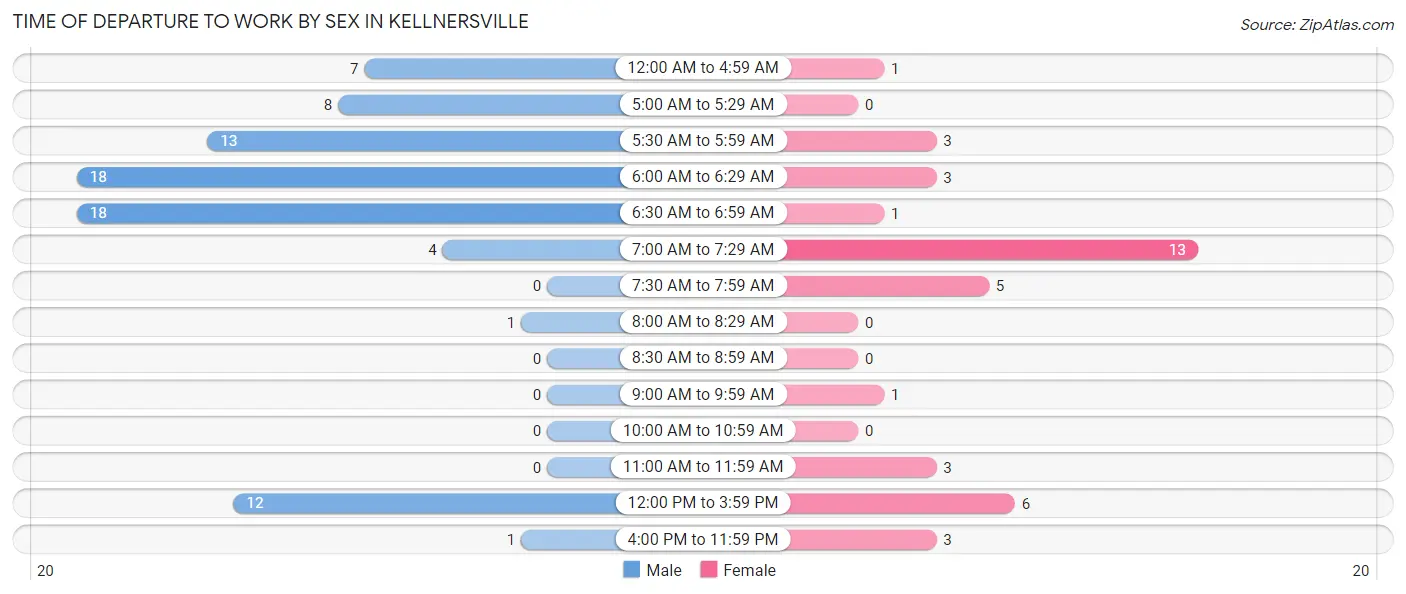
| Time of Departure | Male | Female |
| 12:00 AM to 4:59 AM | 7 (8.5%) | 1 (2.6%) |
| 5:00 AM to 5:29 AM | 8 (9.8%) | 0 (0.0%) |
| 5:30 AM to 5:59 AM | 13 (15.9%) | 3 (7.7%) |
| 6:00 AM to 6:29 AM | 18 (22.0%) | 3 (7.7%) |
| 6:30 AM to 6:59 AM | 18 (22.0%) | 1 (2.6%) |
| 7:00 AM to 7:29 AM | 4 (4.9%) | 13 (33.3%) |
| 7:30 AM to 7:59 AM | 0 (0.0%) | 5 (12.8%) |
| 8:00 AM to 8:29 AM | 1 (1.2%) | 0 (0.0%) |
| 8:30 AM to 8:59 AM | 0 (0.0%) | 0 (0.0%) |
| 9:00 AM to 9:59 AM | 0 (0.0%) | 1 (2.6%) |
| 10:00 AM to 10:59 AM | 0 (0.0%) | 0 (0.0%) |
| 11:00 AM to 11:59 AM | 0 (0.0%) | 3 (7.7%) |
| 12:00 PM to 3:59 PM | 12 (14.6%) | 6 (15.4%) |
| 4:00 PM to 11:59 PM | 1 (1.2%) | 3 (7.7%) |
| Total | 82 (100.0%) | 39 (100.0%) |
Housing Occupancy in Kellnersville
Occupancy by Ownership in Kellnersville
Of the total 143 dwellings in Kellnersville, owner-occupied units account for 98 (68.5%), while renter-occupied units make up 45 (31.5%).
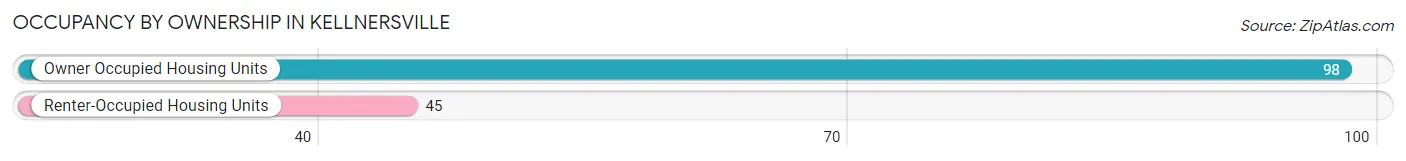
| Occupancy | # Housing Units | % Housing Units |
| Owner Occupied Housing Units | 98 | 68.5% |
| Renter-Occupied Housing Units | 45 | 31.5% |
| Total Occupied Housing Units | 143 | 100.0% |
Occupancy by Household Size in Kellnersville
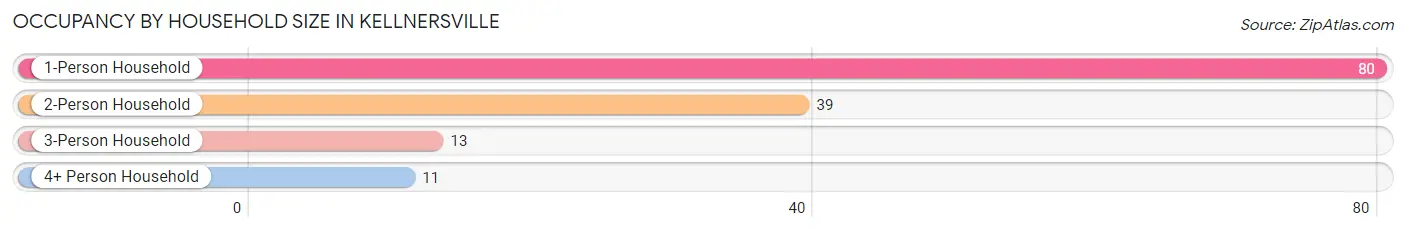
| Household Size | # Housing Units | % Housing Units |
| 1-Person Household | 80 | 55.9% |
| 2-Person Household | 39 | 27.3% |
| 3-Person Household | 13 | 9.1% |
| 4+ Person Household | 11 | 7.7% |
| Total Housing Units | 143 | 100.0% |
Occupancy by Ownership by Household Size in Kellnersville
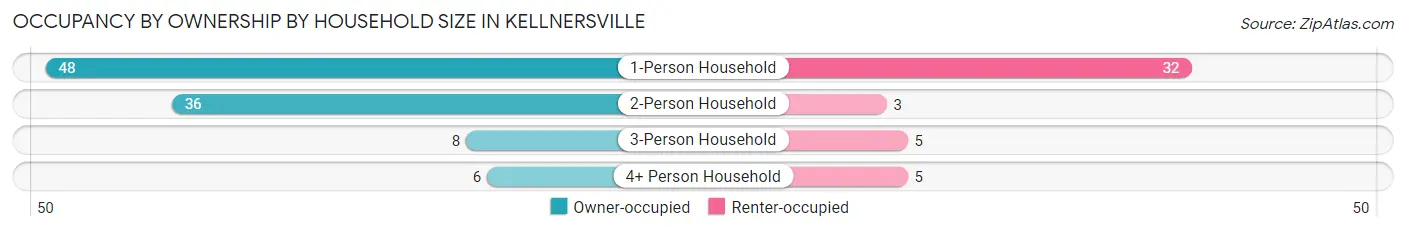
| Household Size | Owner-occupied | Renter-occupied |
| 1-Person Household | 48 (60.0%) | 32 (40.0%) |
| 2-Person Household | 36 (92.3%) | 3 (7.7%) |
| 3-Person Household | 8 (61.5%) | 5 (38.5%) |
| 4+ Person Household | 6 (54.5%) | 5 (45.5%) |
| Total Housing Units | 98 (68.5%) | 45 (31.5%) |
Occupancy by Educational Attainment in Kellnersville
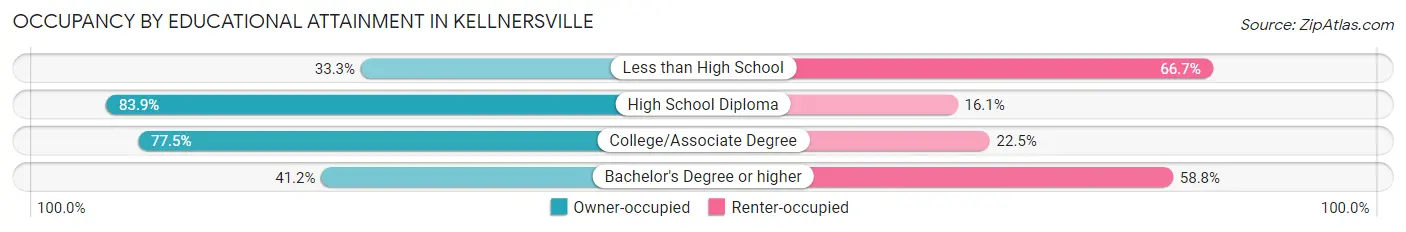
| Household Size | Owner-occupied | Renter-occupied |
| Less than High School | 8 (33.3%) | 16 (66.7%) |
| High School Diploma | 52 (83.9%) | 10 (16.1%) |
| College/Associate Degree | 31 (77.5%) | 9 (22.5%) |
| Bachelor's Degree or higher | 7 (41.2%) | 10 (58.8%) |
Occupancy by Age of Householder in Kellnersville
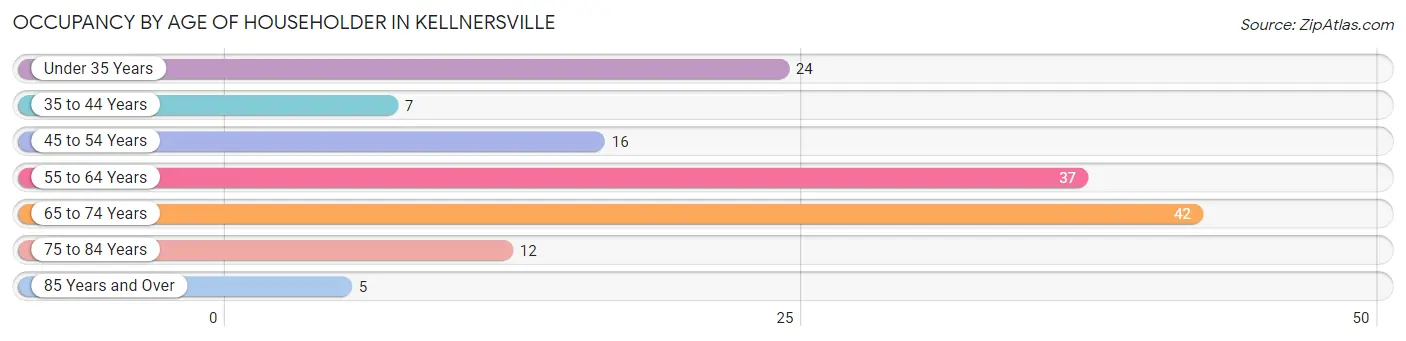
| Age Bracket | # Households | % Households |
| Under 35 Years | 24 | 16.8% |
| 35 to 44 Years | 7 | 4.9% |
| 45 to 54 Years | 16 | 11.2% |
| 55 to 64 Years | 37 | 25.9% |
| 65 to 74 Years | 42 | 29.4% |
| 75 to 84 Years | 12 | 8.4% |
| 85 Years and Over | 5 | 3.5% |
| Total | 143 | 100.0% |
Housing Finances in Kellnersville
Median Income by Occupancy in Kellnersville
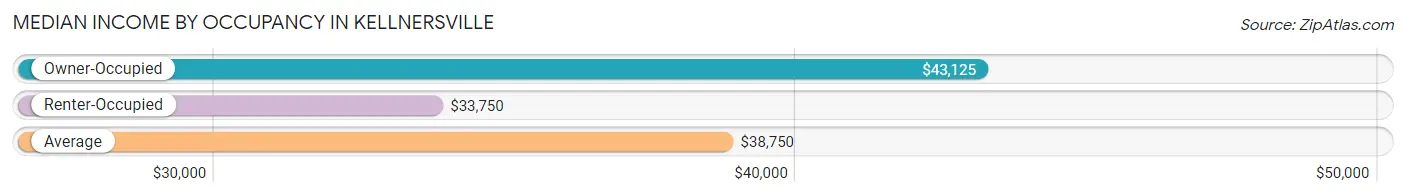
| Occupancy Type | # Households | Median Income |
| Owner-Occupied | 98 (68.5%) | $43,125 |
| Renter-Occupied | 45 (31.5%) | $33,750 |
| Average | 143 (100.0%) | $38,750 |
Occupancy by Householder Income Bracket in Kellnersville
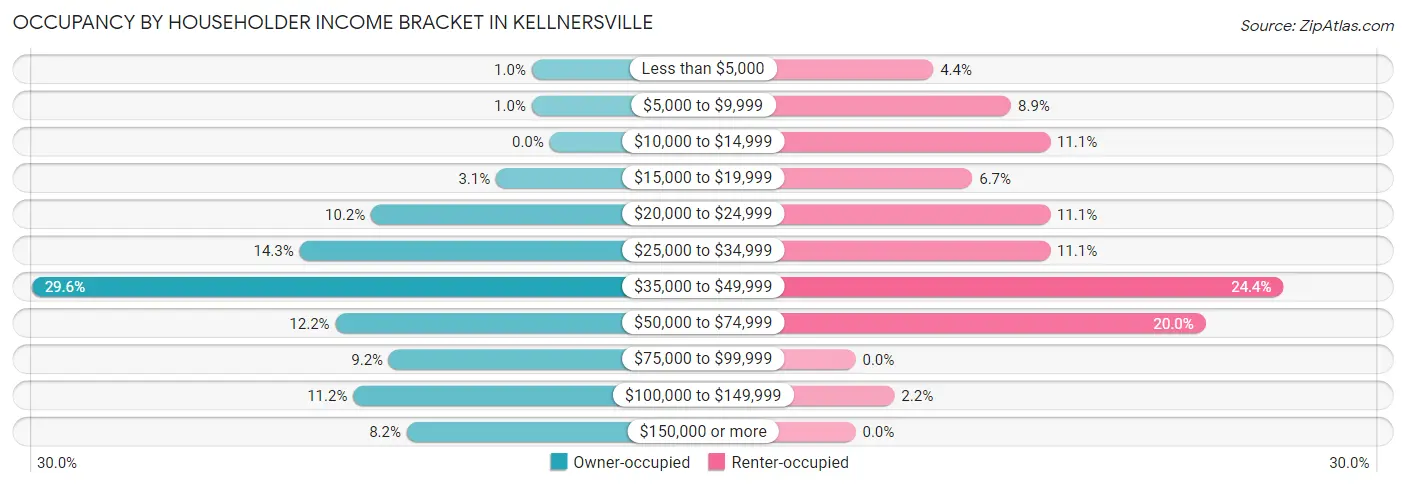
| Income Bracket | Owner-occupied | Renter-occupied |
| Less than $5,000 | 1 (1.0%) | 2 (4.4%) |
| $5,000 to $9,999 | 1 (1.0%) | 4 (8.9%) |
| $10,000 to $14,999 | 0 (0.0%) | 5 (11.1%) |
| $15,000 to $19,999 | 3 (3.1%) | 3 (6.7%) |
| $20,000 to $24,999 | 10 (10.2%) | 5 (11.1%) |
| $25,000 to $34,999 | 14 (14.3%) | 5 (11.1%) |
| $35,000 to $49,999 | 29 (29.6%) | 11 (24.4%) |
| $50,000 to $74,999 | 12 (12.2%) | 9 (20.0%) |
| $75,000 to $99,999 | 9 (9.2%) | 0 (0.0%) |
| $100,000 to $149,999 | 11 (11.2%) | 1 (2.2%) |
| $150,000 or more | 8 (8.2%) | 0 (0.0%) |
| Total | 98 (100.0%) | 45 (100.0%) |
Monthly Housing Cost Tiers in Kellnersville
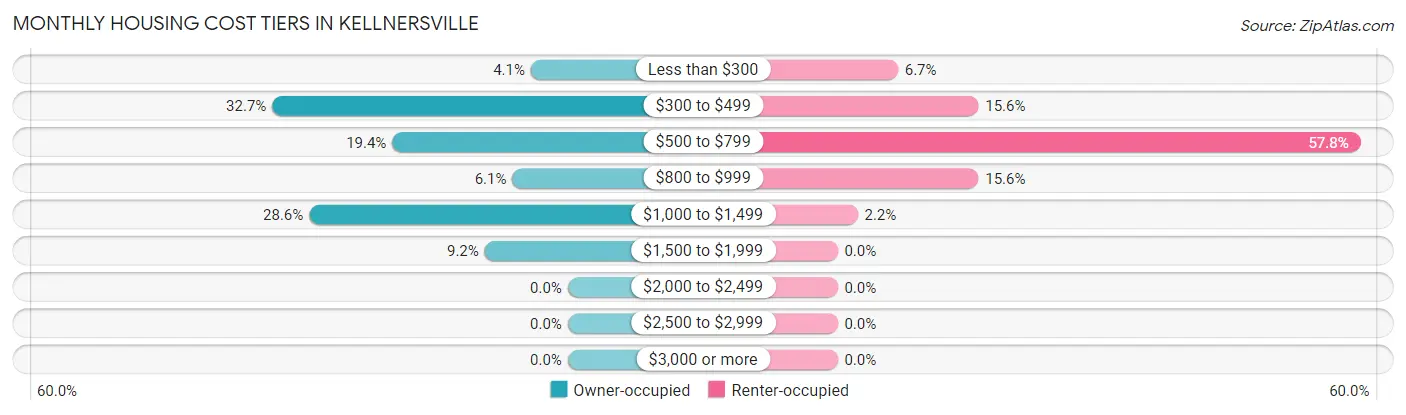
| Monthly Cost | Owner-occupied | Renter-occupied |
| Less than $300 | 4 (4.1%) | 3 (6.7%) |
| $300 to $499 | 32 (32.7%) | 7 (15.6%) |
| $500 to $799 | 19 (19.4%) | 26 (57.8%) |
| $800 to $999 | 6 (6.1%) | 7 (15.6%) |
| $1,000 to $1,499 | 28 (28.6%) | 1 (2.2%) |
| $1,500 to $1,999 | 9 (9.2%) | 0 (0.0%) |
| $2,000 to $2,499 | 0 (0.0%) | 0 (0.0%) |
| $2,500 to $2,999 | 0 (0.0%) | 0 (0.0%) |
| $3,000 or more | 0 (0.0%) | 0 (0.0%) |
| Total | 98 (100.0%) | 45 (100.0%) |
Physical Housing Characteristics in Kellnersville
Housing Structures in Kellnersville
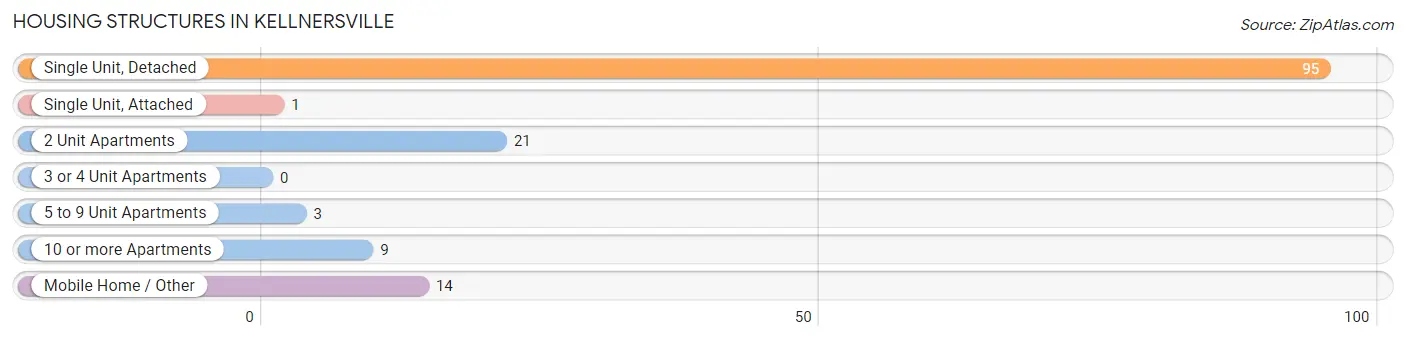
| Structure Type | # Housing Units | % Housing Units |
| Single Unit, Detached | 95 | 66.4% |
| Single Unit, Attached | 1 | 0.7% |
| 2 Unit Apartments | 21 | 14.7% |
| 3 or 4 Unit Apartments | 0 | 0.0% |
| 5 to 9 Unit Apartments | 3 | 2.1% |
| 10 or more Apartments | 9 | 6.3% |
| Mobile Home / Other | 14 | 9.8% |
| Total | 143 | 100.0% |
Housing Structures by Occupancy in Kellnersville
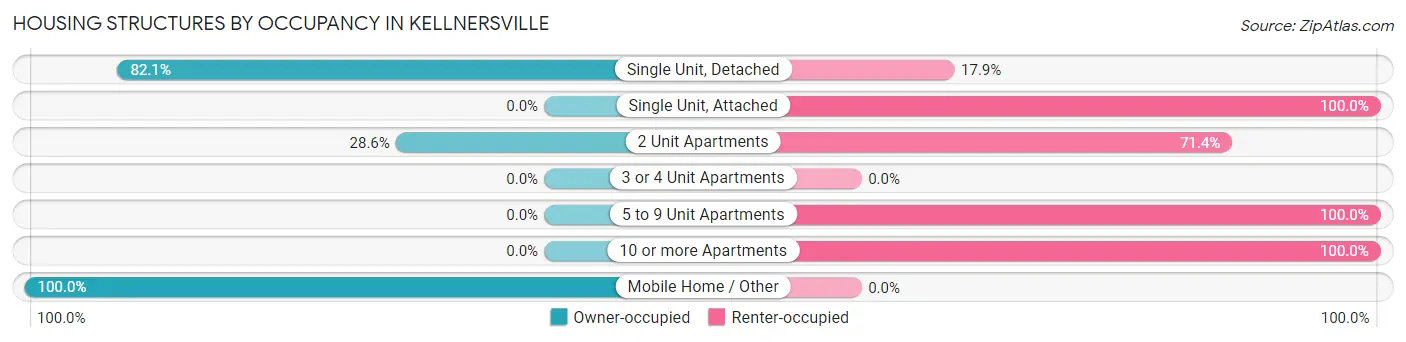
| Structure Type | Owner-occupied | Renter-occupied |
| Single Unit, Detached | 78 (82.1%) | 17 (17.9%) |
| Single Unit, Attached | 0 (0.0%) | 1 (100.0%) |
| 2 Unit Apartments | 6 (28.6%) | 15 (71.4%) |
| 3 or 4 Unit Apartments | 0 (0.0%) | 0 (0.0%) |
| 5 to 9 Unit Apartments | 0 (0.0%) | 3 (100.0%) |
| 10 or more Apartments | 0 (0.0%) | 9 (100.0%) |
| Mobile Home / Other | 14 (100.0%) | 0 (0.0%) |
| Total | 98 (68.5%) | 45 (31.5%) |
Housing Structures by Number of Rooms in Kellnersville
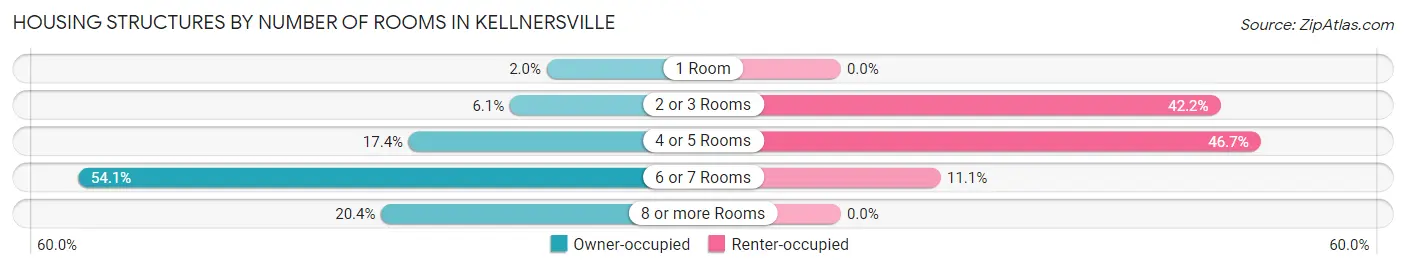
| Number of Rooms | Owner-occupied | Renter-occupied |
| 1 Room | 2 (2.0%) | 0 (0.0%) |
| 2 or 3 Rooms | 6 (6.1%) | 19 (42.2%) |
| 4 or 5 Rooms | 17 (17.3%) | 21 (46.7%) |
| 6 or 7 Rooms | 53 (54.1%) | 5 (11.1%) |
| 8 or more Rooms | 20 (20.4%) | 0 (0.0%) |
| Total | 98 (100.0%) | 45 (100.0%) |
Housing Structure by Heating Type in Kellnersville
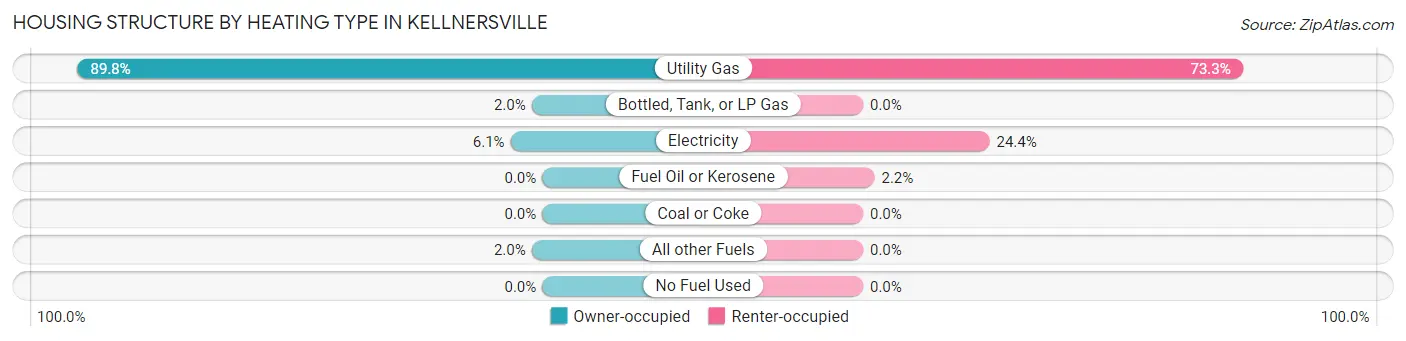
| Heating Type | Owner-occupied | Renter-occupied |
| Utility Gas | 88 (89.8%) | 33 (73.3%) |
| Bottled, Tank, or LP Gas | 2 (2.0%) | 0 (0.0%) |
| Electricity | 6 (6.1%) | 11 (24.4%) |
| Fuel Oil or Kerosene | 0 (0.0%) | 1 (2.2%) |
| Coal or Coke | 0 (0.0%) | 0 (0.0%) |
| All other Fuels | 2 (2.0%) | 0 (0.0%) |
| No Fuel Used | 0 (0.0%) | 0 (0.0%) |
| Total | 98 (100.0%) | 45 (100.0%) |
Household Vehicle Usage in Kellnersville
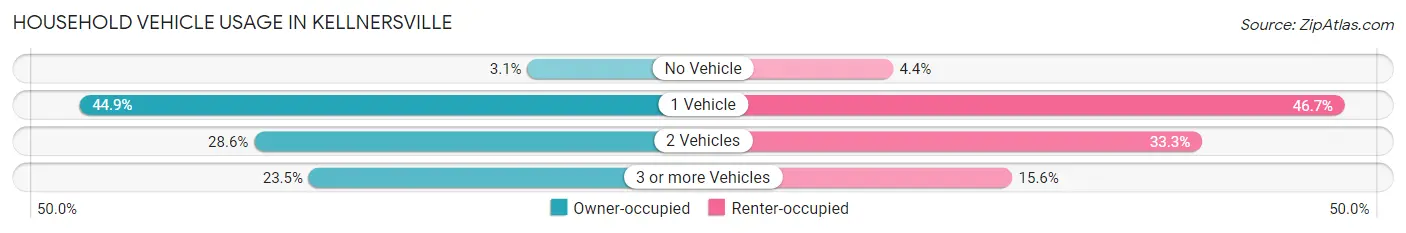
| Vehicles per Household | Owner-occupied | Renter-occupied |
| No Vehicle | 3 (3.1%) | 2 (4.4%) |
| 1 Vehicle | 44 (44.9%) | 21 (46.7%) |
| 2 Vehicles | 28 (28.6%) | 15 (33.3%) |
| 3 or more Vehicles | 23 (23.5%) | 7 (15.6%) |
| Total | 98 (100.0%) | 45 (100.0%) |
Real Estate & Mortgages in Kellnersville
Real Estate and Mortgage Overview in Kellnersville
| Characteristic | Without Mortgage | With Mortgage |
| Housing Units | 48 | 50 |
| Median Property Value | $125,000 | $153,600 |
| Median Household Income | $42,708 | $8 |
| Monthly Housing Costs | $383 | $0 |
| Real Estate Taxes | $1,703 | $2 |
Property Value by Mortgage Status in Kellnersville
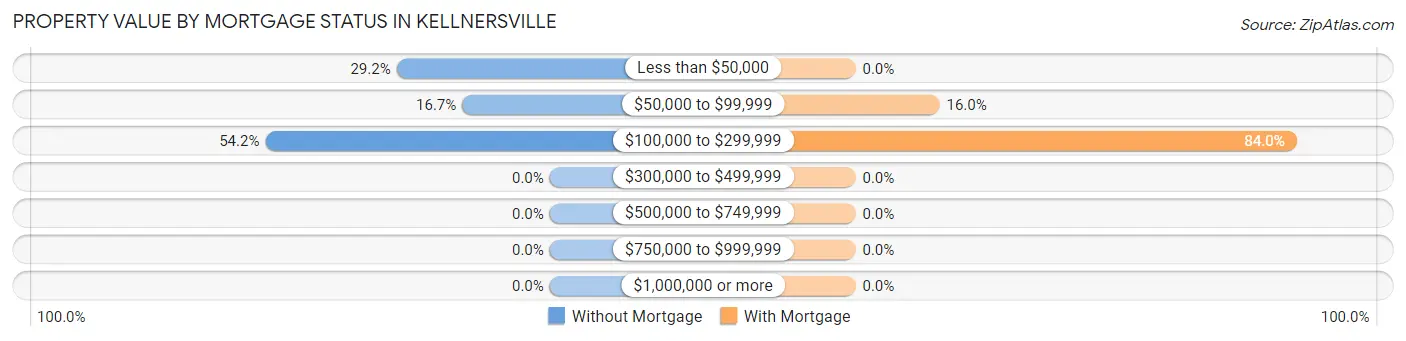
| Property Value | Without Mortgage | With Mortgage |
| Less than $50,000 | 14 (29.2%) | 0 (0.0%) |
| $50,000 to $99,999 | 8 (16.7%) | 8 (16.0%) |
| $100,000 to $299,999 | 26 (54.2%) | 42 (84.0%) |
| $300,000 to $499,999 | 0 (0.0%) | 0 (0.0%) |
| $500,000 to $749,999 | 0 (0.0%) | 0 (0.0%) |
| $750,000 to $999,999 | 0 (0.0%) | 0 (0.0%) |
| $1,000,000 or more | 0 (0.0%) | 0 (0.0%) |
| Total | 48 (100.0%) | 50 (100.0%) |
Household Income by Mortgage Status in Kellnersville
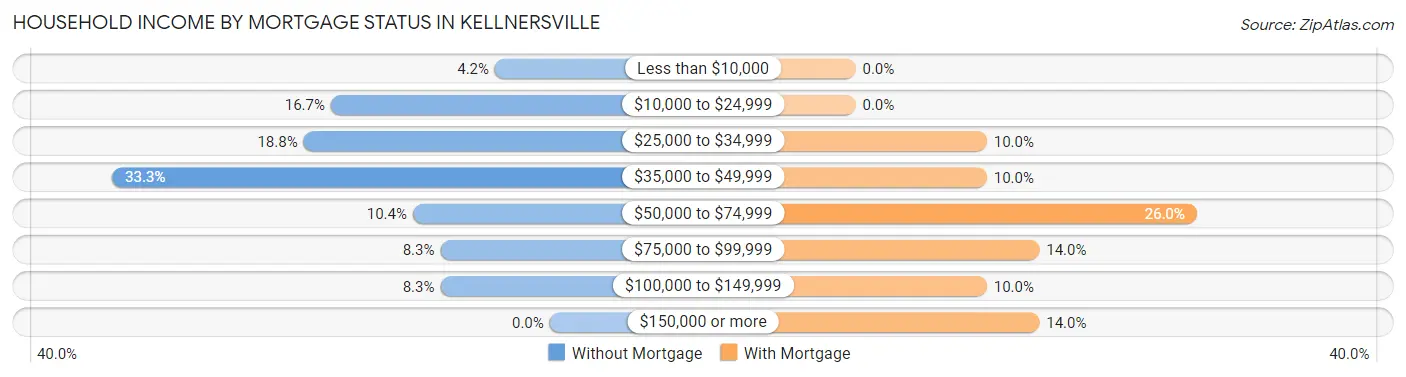
| Household Income | Without Mortgage | With Mortgage |
| Less than $10,000 | 2 (4.2%) | 0 (0.0%) |
| $10,000 to $24,999 | 8 (16.7%) | 0 (0.0%) |
| $25,000 to $34,999 | 9 (18.8%) | 5 (10.0%) |
| $35,000 to $49,999 | 16 (33.3%) | 5 (10.0%) |
| $50,000 to $74,999 | 5 (10.4%) | 13 (26.0%) |
| $75,000 to $99,999 | 4 (8.3%) | 7 (14.0%) |
| $100,000 to $149,999 | 4 (8.3%) | 5 (10.0%) |
| $150,000 or more | 0 (0.0%) | 7 (14.0%) |
| Total | 48 (100.0%) | 50 (100.0%) |
Property Value to Household Income Ratio in Kellnersville
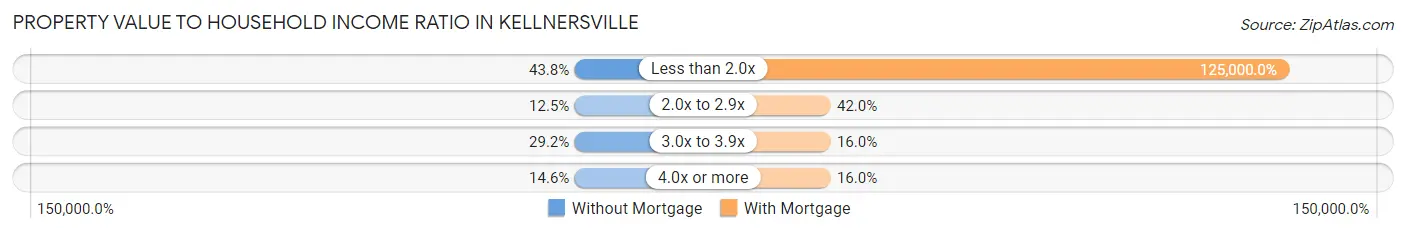
| Value-to-Income Ratio | Without Mortgage | With Mortgage |
| Less than 2.0x | 21 (43.8%) | 62,500 (125,000.0%) |
| 2.0x to 2.9x | 6 (12.5%) | 21 (42.0%) |
| 3.0x to 3.9x | 14 (29.2%) | 8 (16.0%) |
| 4.0x or more | 7 (14.6%) | 8 (16.0%) |
| Total | 48 (100.0%) | 50 (100.0%) |
Real Estate Taxes by Mortgage Status in Kellnersville
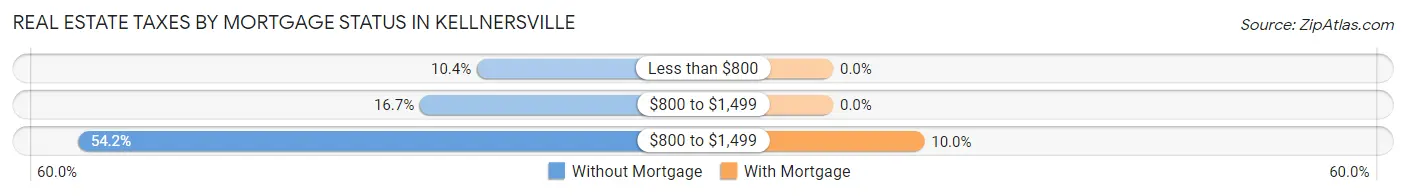
| Property Taxes | Without Mortgage | With Mortgage |
| Less than $800 | 5 (10.4%) | 0 (0.0%) |
| $800 to $1,499 | 8 (16.7%) | 0 (0.0%) |
| $800 to $1,499 | 26 (54.2%) | 5 (10.0%) |
| Total | 48 (100.0%) | 50 (100.0%) |
Health & Disability in Kellnersville
Health Insurance Coverage by Age in Kellnersville
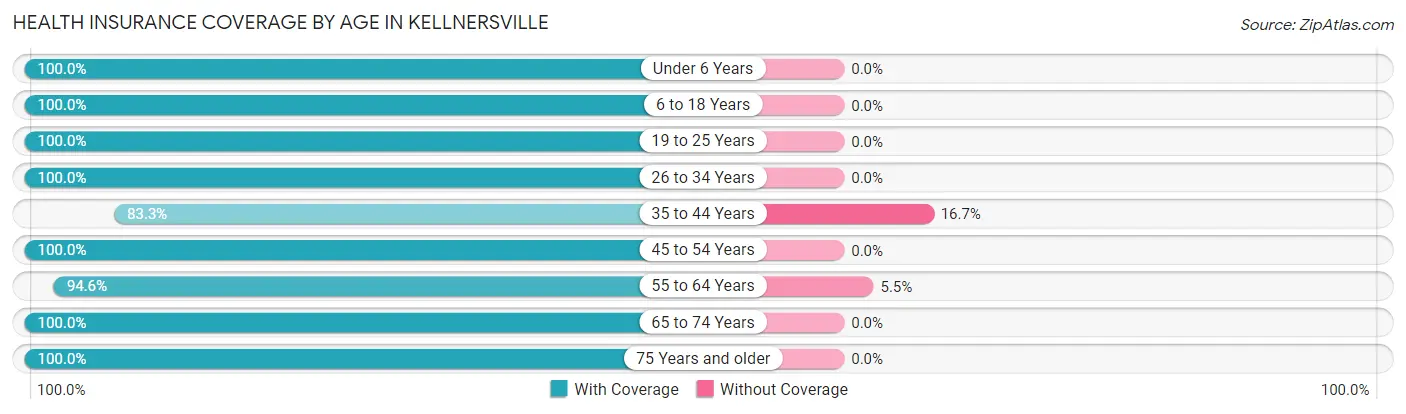
| Age Bracket | With Coverage | Without Coverage |
| Under 6 Years | 13 (100.0%) | 0 (0.0%) |
| 6 to 18 Years | 31 (100.0%) | 0 (0.0%) |
| 19 to 25 Years | 21 (100.0%) | 0 (0.0%) |
| 26 to 34 Years | 18 (100.0%) | 0 (0.0%) |
| 35 to 44 Years | 10 (83.3%) | 2 (16.7%) |
| 45 to 54 Years | 32 (100.0%) | 0 (0.0%) |
| 55 to 64 Years | 52 (94.6%) | 3 (5.4%) |
| 65 to 74 Years | 50 (100.0%) | 0 (0.0%) |
| 75 Years and older | 23 (100.0%) | 0 (0.0%) |
| Total | 250 (98.0%) | 5 (2.0%) |
Health Insurance Coverage by Citizenship Status in Kellnersville
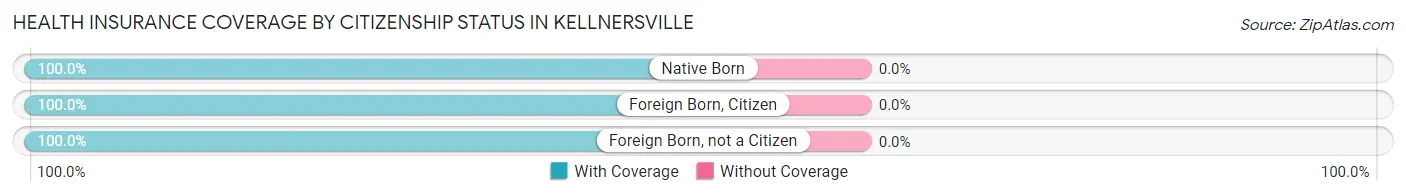
| Citizenship Status | With Coverage | Without Coverage |
| Native Born | 13 (100.0%) | 0 (0.0%) |
| Foreign Born, Citizen | 31 (100.0%) | 0 (0.0%) |
| Foreign Born, not a Citizen | 21 (100.0%) | 0 (0.0%) |
Health Insurance Coverage by Household Income in Kellnersville
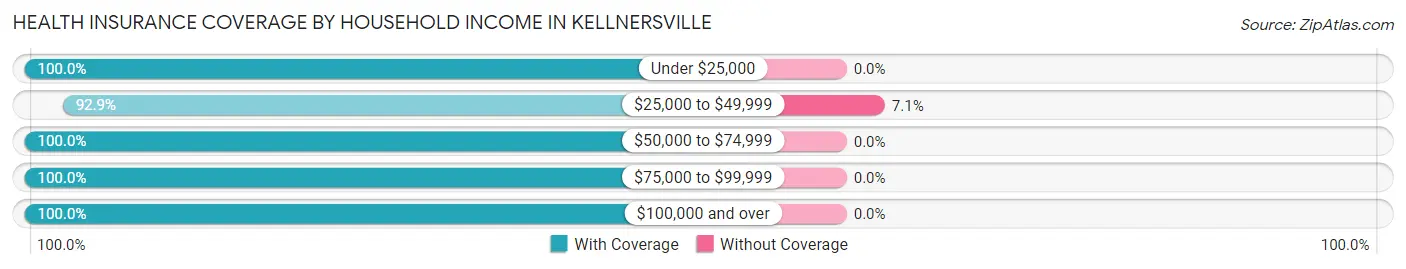
| Household Income | With Coverage | Without Coverage |
| Under $25,000 | 51 (100.0%) | 0 (0.0%) |
| $25,000 to $49,999 | 65 (92.9%) | 5 (7.1%) |
| $50,000 to $74,999 | 58 (100.0%) | 0 (0.0%) |
| $75,000 to $99,999 | 22 (100.0%) | 0 (0.0%) |
| $100,000 and over | 54 (100.0%) | 0 (0.0%) |
Public vs Private Health Insurance Coverage by Age in Kellnersville
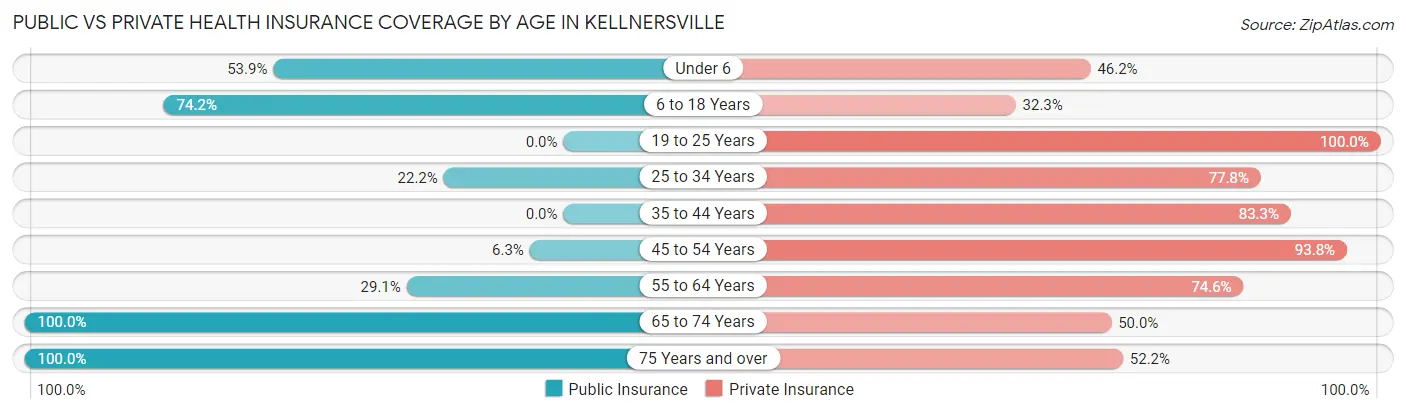
| Age Bracket | Public Insurance | Private Insurance |
| Under 6 | 7 (53.8%) | 6 (46.2%) |
| 6 to 18 Years | 23 (74.2%) | 10 (32.3%) |
| 19 to 25 Years | 0 (0.0%) | 21 (100.0%) |
| 25 to 34 Years | 4 (22.2%) | 14 (77.8%) |
| 35 to 44 Years | 0 (0.0%) | 10 (83.3%) |
| 45 to 54 Years | 2 (6.2%) | 30 (93.8%) |
| 55 to 64 Years | 16 (29.1%) | 41 (74.6%) |
| 65 to 74 Years | 50 (100.0%) | 25 (50.0%) |
| 75 Years and over | 23 (100.0%) | 12 (52.2%) |
| Total | 125 (49.0%) | 169 (66.3%) |
Disability Status by Sex by Age in Kellnersville
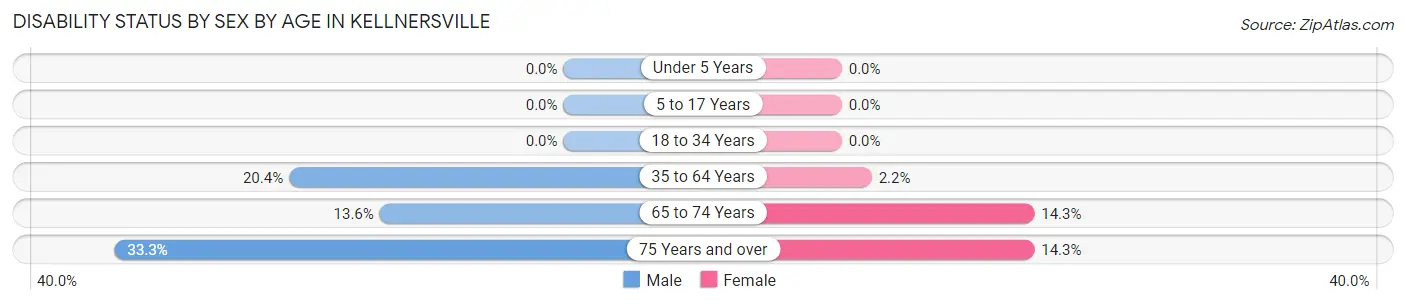
| Age Bracket | Male | Female |
| Under 5 Years | 0 (0.0%) | 0 (0.0%) |
| 5 to 17 Years | 0 (0.0%) | 0 (0.0%) |
| 18 to 34 Years | 0 (0.0%) | 0 (0.0%) |
| 35 to 64 Years | 11 (20.4%) | 1 (2.2%) |
| 65 to 74 Years | 3 (13.6%) | 4 (14.3%) |
| 75 Years and over | 3 (33.3%) | 2 (14.3%) |
Disability Class by Sex by Age in Kellnersville
Disability Class: Hearing Difficulty
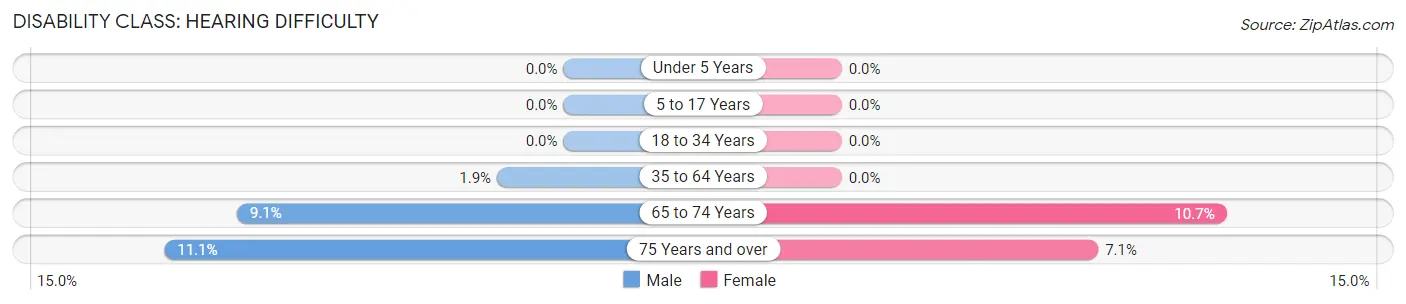
| Age Bracket | Male | Female |
| Under 5 Years | 0 (0.0%) | 0 (0.0%) |
| 5 to 17 Years | 0 (0.0%) | 0 (0.0%) |
| 18 to 34 Years | 0 (0.0%) | 0 (0.0%) |
| 35 to 64 Years | 1 (1.8%) | 0 (0.0%) |
| 65 to 74 Years | 2 (9.1%) | 3 (10.7%) |
| 75 Years and over | 1 (11.1%) | 1 (7.1%) |
Disability Class: Vision Difficulty
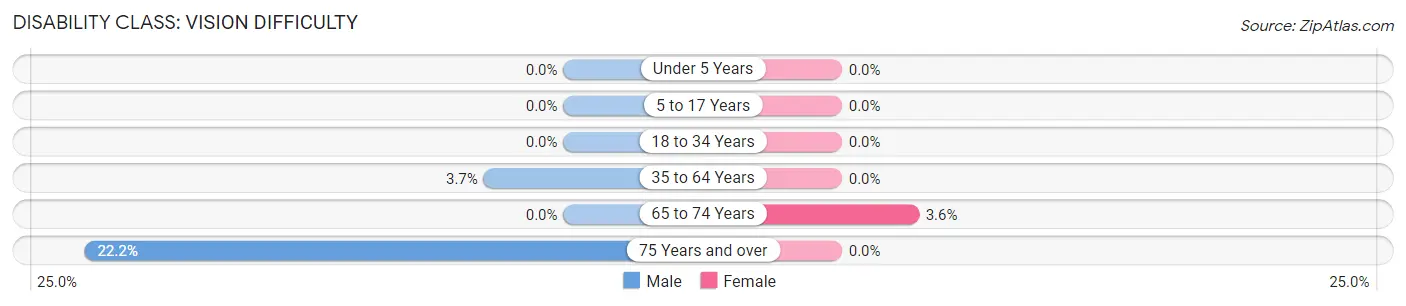
| Age Bracket | Male | Female |
| Under 5 Years | 0 (0.0%) | 0 (0.0%) |
| 5 to 17 Years | 0 (0.0%) | 0 (0.0%) |
| 18 to 34 Years | 0 (0.0%) | 0 (0.0%) |
| 35 to 64 Years | 2 (3.7%) | 0 (0.0%) |
| 65 to 74 Years | 0 (0.0%) | 1 (3.6%) |
| 75 Years and over | 2 (22.2%) | 0 (0.0%) |
Disability Class: Cognitive Difficulty
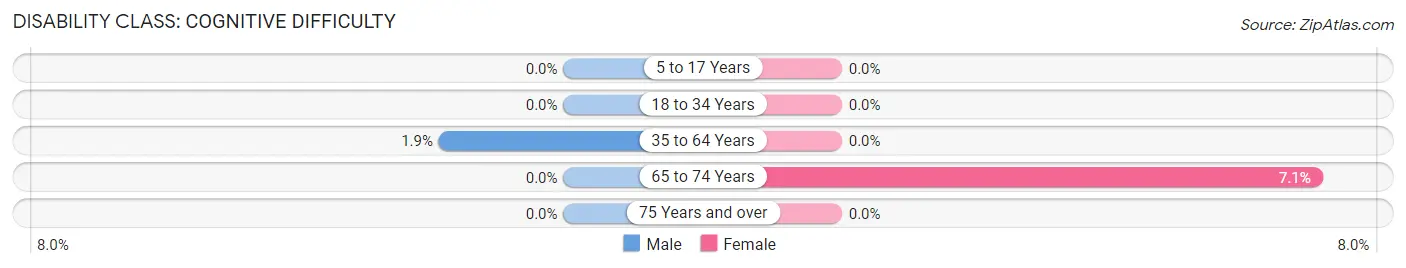
| Age Bracket | Male | Female |
| 5 to 17 Years | 0 (0.0%) | 0 (0.0%) |
| 18 to 34 Years | 0 (0.0%) | 0 (0.0%) |
| 35 to 64 Years | 1 (1.8%) | 0 (0.0%) |
| 65 to 74 Years | 0 (0.0%) | 2 (7.1%) |
| 75 Years and over | 0 (0.0%) | 0 (0.0%) |
Disability Class: Ambulatory Difficulty
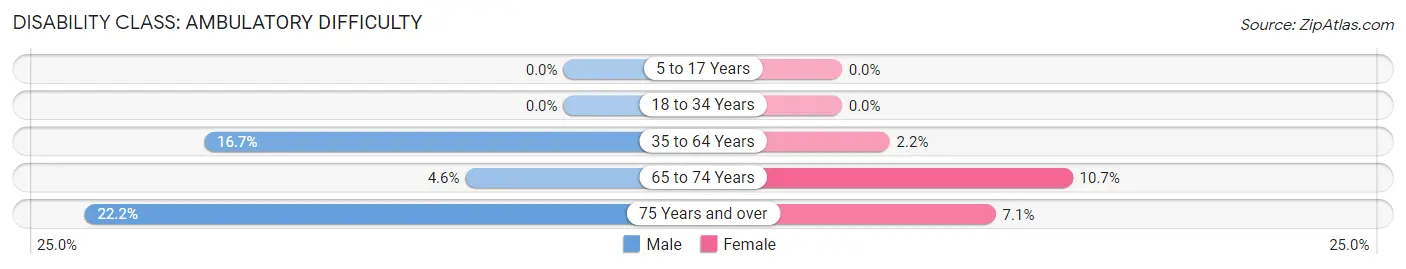
| Age Bracket | Male | Female |
| 5 to 17 Years | 0 (0.0%) | 0 (0.0%) |
| 18 to 34 Years | 0 (0.0%) | 0 (0.0%) |
| 35 to 64 Years | 9 (16.7%) | 1 (2.2%) |
| 65 to 74 Years | 1 (4.5%) | 3 (10.7%) |
| 75 Years and over | 2 (22.2%) | 1 (7.1%) |
Disability Class: Self-Care Difficulty
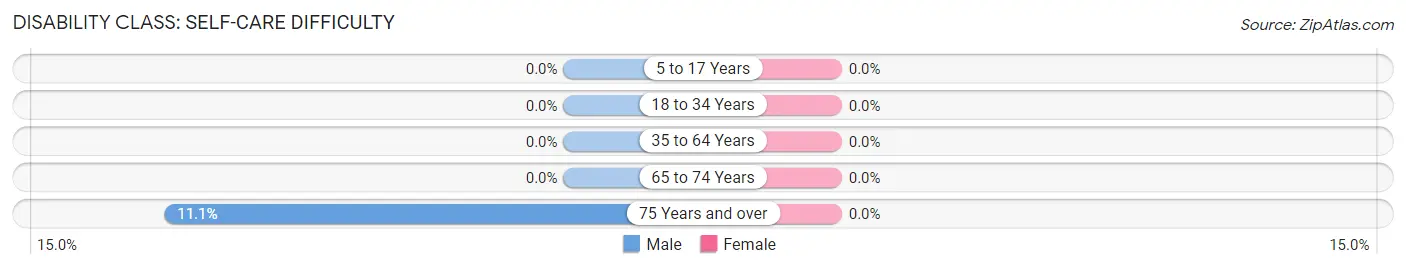
| Age Bracket | Male | Female |
| 5 to 17 Years | 0 (0.0%) | 0 (0.0%) |
| 18 to 34 Years | 0 (0.0%) | 0 (0.0%) |
| 35 to 64 Years | 0 (0.0%) | 0 (0.0%) |
| 65 to 74 Years | 0 (0.0%) | 0 (0.0%) |
| 75 Years and over | 1 (11.1%) | 0 (0.0%) |
Technology Access in Kellnersville
Computing Device Access in Kellnersville
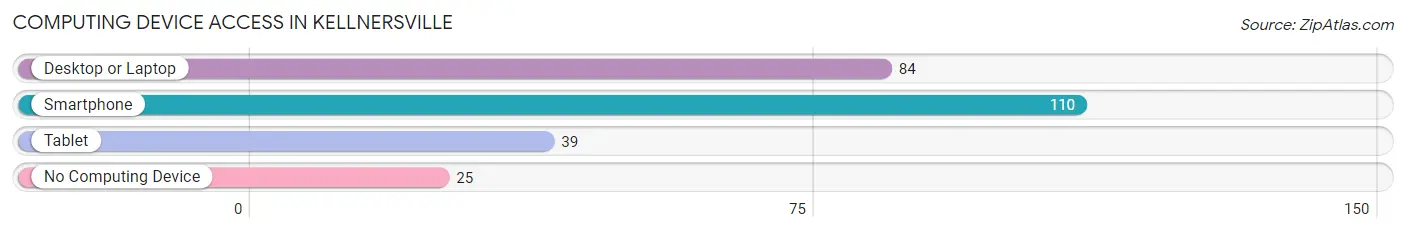
| Device Type | # Households | % Households |
| Desktop or Laptop | 84 | 58.7% |
| Smartphone | 110 | 76.9% |
| Tablet | 39 | 27.3% |
| No Computing Device | 25 | 17.5% |
| Total | 143 | 100.0% |
Internet Access in Kellnersville
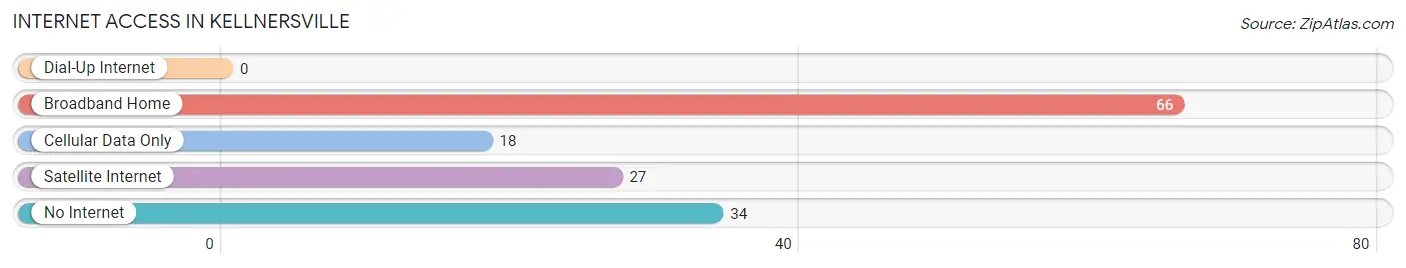
| Internet Type | # Households | % Households |
| Dial-Up Internet | 0 | 0.0% |
| Broadband Home | 66 | 46.2% |
| Cellular Data Only | 18 | 12.6% |
| Satellite Internet | 27 | 18.9% |
| No Internet | 34 | 23.8% |
| Total | 143 | 100.0% |
Kellnersville Summary
Kellnersville is a small unincorporated community located in the town of Eaton in Manitowoc County, Wisconsin, United States. It is situated on the banks of the Manitowoc River, about 10 miles (16 km) northwest of the city of Manitowoc. The population of Kellnersville was estimated to be around 200 in 2020.
History
Kellnersville was founded in 1854 by German immigrants, John and Mary Kellner. The Kellners had emigrated from Germany in 1848 and settled in the area in search of a better life. The town was originally known as Kellner's Settlement, but the name was changed to Kellnersville in 1858.
The town grew rapidly in the late 19th century, with the arrival of the railroad in 1871. The railroad provided a convenient way for farmers to transport their goods to market, and the town soon became a hub for the local agricultural industry.
In the early 20th century, Kellnersville was home to a number of small businesses, including a cheese factory, a creamery, a sawmill, and a blacksmith shop. The town also had a hotel, a general store, and a post office.
Geography
Kellnersville is located in the town of Eaton in Manitowoc County, Wisconsin. It is situated on the banks of the Manitowoc River, about 10 miles (16 km) northwest of the city of Manitowoc. The town is surrounded by rolling hills and farmland, and is located near the intersection of State Highways 147 and 310.
The climate in Kellnersville is typical of the Midwest, with cold winters and hot, humid summers. The average annual temperature is around 45°F (7°C), and the average annual precipitation is around 33 inches (84 cm).
Economy
Kellnersville is a small, rural community with a limited economy. The town is home to a few small businesses, including a general store, a gas station, and a few restaurants. The town also has a post office and a volunteer fire department.
The town is also home to a number of small farms, which produce a variety of crops, including corn, soybeans, and hay. The town is also home to a number of small businesses, including a cheese factory, a creamery, and a sawmill.
Demographics
Kellnersville is a small, rural community with a population of around 200 people. The town is predominantly white, with a small Hispanic population. The median household income in Kellnersville is around $45,000, and the median home value is around $150,000. The town has a low unemployment rate, and the majority of residents are employed in the agricultural industry.
Common Questions
What is Per Capita Income in Kellnersville?
Per Capita income in Kellnersville is $30,445.
What is the Median Family Income in Kellnersville?
Median Family Income in Kellnersville is $63,750.
What is the Median Household income in Kellnersville?
Median Household Income in Kellnersville is $38,750.
What is Income or Wage Gap in Kellnersville?
Income or Wage Gap in Kellnersville is 20.3%.
Women in Kellnersville earn 79.7 cents for every dollar earned by a man.
What is Inequality or Gini Index in Kellnersville?
Inequality or Gini Index in Kellnersville is 0.41.
What is the Total Population of Kellnersville?
Total Population of Kellnersville is 255.
What is the Total Male Population of Kellnersville?
Total Male Population of Kellnersville is 130.
What is the Total Female Population of Kellnersville?
Total Female Population of Kellnersville is 125.
What is the Ratio of Males per 100 Females in Kellnersville?
There are 104.00 Males per 100 Females in Kellnersville.
What is the Ratio of Females per 100 Males in Kellnersville?
There are 96.15 Females per 100 Males in Kellnersville.
What is the Median Population Age in Kellnersville?
Median Population Age in Kellnersville is 55.0 Years.
What is the Average Family Size in Kellnersville
Average Family Size in Kellnersville is 2.9 People.
What is the Average Household Size in Kellnersville
Average Household Size in Kellnersville is 1.8 People.
How Large is the Labor Force in Kellnersville?
There are 132 People in the Labor Forcein in Kellnersville.
What is the Percentage of People in the Labor Force in Kellnersville?
57.9% of People are in the Labor Force in Kellnersville.
What is the Unemployment Rate in Kellnersville?
Unemployment Rate in Kellnersville is 2.3%.