Jim Falls, WI Map & Demographics
Jim Falls Map
Jim Falls Overview
$41,573
PER CAPITA INCOME
$115,547
AVG FAMILY INCOME
$87,143
AVG HOUSEHOLD INCOME
48.2%
WAGE / INCOME GAP [ % ]
51.8¢/ $1
WAGE / INCOME GAP [ $ ]
0.34
INEQUALITY / GINI INDEX
219
TOTAL POPULATION
131
MALE POPULATION
88
FEMALE POPULATION
148.86
MALES / 100 FEMALES
67.18
FEMALES / 100 MALES
40.6
MEDIAN AGE
2.5
AVG FAMILY SIZE
1.9
AVG HOUSEHOLD SIZE
131
LABOR FORCE [ PEOPLE ]
74.4%
PERCENT IN LABOR FORCE
Jim Falls Zip Codes
Jim Falls Area Codes
Income in Jim Falls
Income Overview in Jim Falls
Per Capita Income in Jim Falls is $41,573, while median incomes of families and households are $115,547 and $87,143 respectively.
| Characteristic | Number | Measure |
| Per Capita Income | 219 | $41,573 |
| Median Family Income | 65 | $115,547 |
| Mean Family Income | 65 | $111,472 |
| Median Household Income | 114 | $87,143 |
| Mean Household Income | 114 | $79,697 |
| Income Deficit | 65 | $0 |
| Wage / Income Gap (%) | 219 | 48.16% |
| Wage / Income Gap ($) | 219 | 51.84¢ per $1 |
| Gini / Inequality Index | 219 | 0.34 |
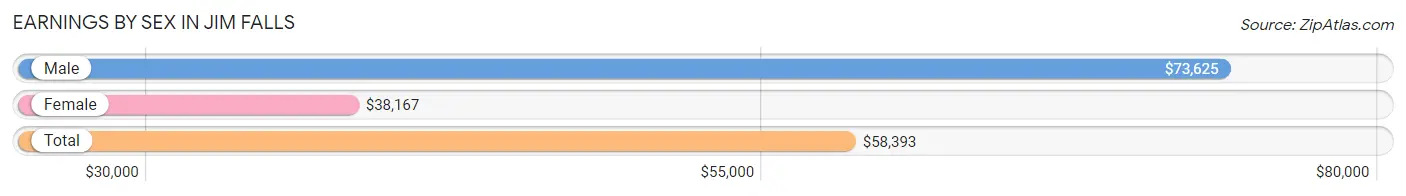
Earnings by Sex in Jim Falls
Average Earnings in Jim Falls are $58,393, $73,625 for men and $38,167 for women, a difference of 48.2%.
| Sex | Number | Average Earnings |
| Male | 77 (58.8%) | $73,625 |
| Female | 54 (41.2%) | $38,167 |
| Total | 131 (100.0%) | $58,393 |
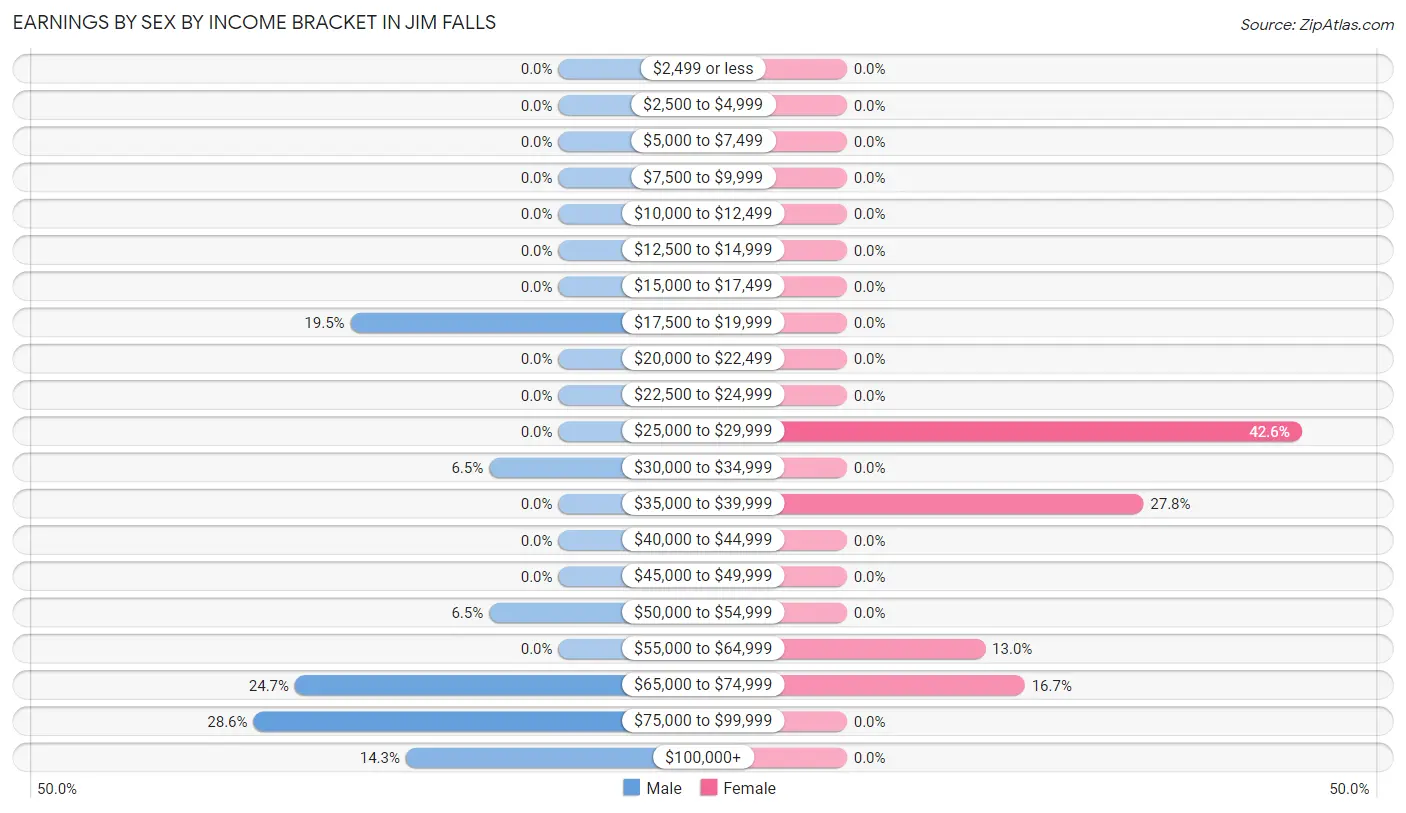
Earnings by Sex by Income Bracket in Jim Falls
The most common earnings brackets in Jim Falls are $75,000 to $99,999 for men (22 | 28.6%) and $25,000 to $29,999 for women (23 | 42.6%).
| Income | Male | Female |
| $2,499 or less | 0 (0.0%) | 0 (0.0%) |
| $2,500 to $4,999 | 0 (0.0%) | 0 (0.0%) |
| $5,000 to $7,499 | 0 (0.0%) | 0 (0.0%) |
| $7,500 to $9,999 | 0 (0.0%) | 0 (0.0%) |
| $10,000 to $12,499 | 0 (0.0%) | 0 (0.0%) |
| $12,500 to $14,999 | 0 (0.0%) | 0 (0.0%) |
| $15,000 to $17,499 | 0 (0.0%) | 0 (0.0%) |
| $17,500 to $19,999 | 15 (19.5%) | 0 (0.0%) |
| $20,000 to $22,499 | 0 (0.0%) | 0 (0.0%) |
| $22,500 to $24,999 | 0 (0.0%) | 0 (0.0%) |
| $25,000 to $29,999 | 0 (0.0%) | 23 (42.6%) |
| $30,000 to $34,999 | 5 (6.5%) | 0 (0.0%) |
| $35,000 to $39,999 | 0 (0.0%) | 15 (27.8%) |
| $40,000 to $44,999 | 0 (0.0%) | 0 (0.0%) |
| $45,000 to $49,999 | 0 (0.0%) | 0 (0.0%) |
| $50,000 to $54,999 | 5 (6.5%) | 0 (0.0%) |
| $55,000 to $64,999 | 0 (0.0%) | 7 (13.0%) |
| $65,000 to $74,999 | 19 (24.7%) | 9 (16.7%) |
| $75,000 to $99,999 | 22 (28.6%) | 0 (0.0%) |
| $100,000+ | 11 (14.3%) | 0 (0.0%) |
| Total | 77 (100.0%) | 54 (100.0%) |
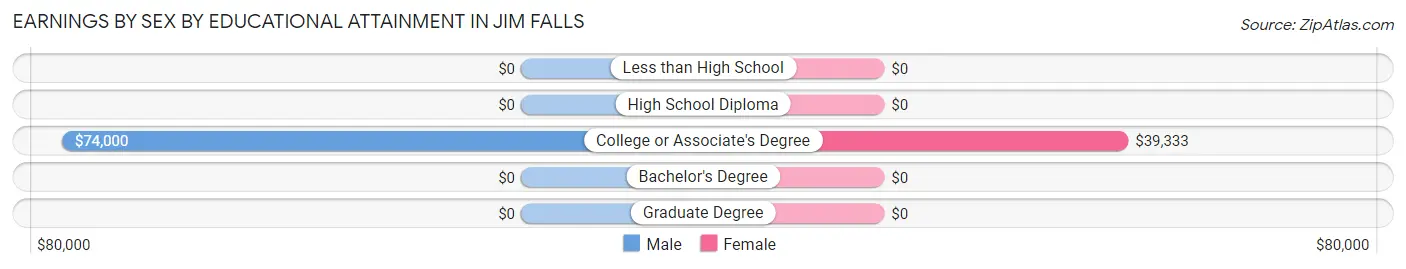
Earnings by Sex by Educational Attainment in Jim Falls
Average earnings in Jim Falls are $73,625 for men and $38,833 for women, a difference of 47.3%. Men with an educational attainment of college or associate's degree enjoy the highest average annual earnings of $74,000, while those with college or associate's degree education earn the least with $74,000. Women with an educational attainment of college or associate's degree earn the most with the average annual earnings of $39,333, while those with college or associate's degree education have the smallest earnings of $39,333.
| Educational Attainment | Male Income | Female Income |
| Less than High School | - | - |
| High School Diploma | - | - |
| College or Associate's Degree | $74,000 | $39,333 |
| Bachelor's Degree | - | - |
| Graduate Degree | - | - |
| Total | $73,625 | $38,833 |
Family Income in Jim Falls
Family Income Brackets in Jim Falls
According to the Jim Falls family income data, there are 35 families falling into the $100,000 to $149,999 income range, which is the most common income bracket and makes up 53.8% of all families.
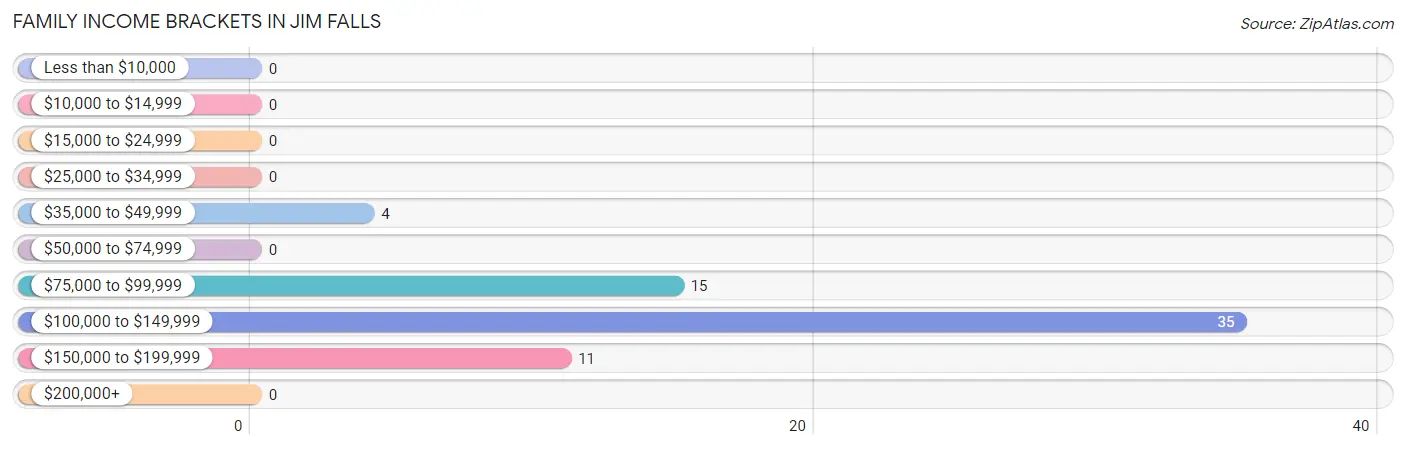
| Income Bracket | # Families | % Families |
| Less than $10,000 | 0 | 0.0% |
| $10,000 to $14,999 | 0 | 0.0% |
| $15,000 to $24,999 | 0 | 0.0% |
| $25,000 to $34,999 | 0 | 0.0% |
| $35,000 to $49,999 | 4 | 6.2% |
| $50,000 to $74,999 | 0 | 0.0% |
| $75,000 to $99,999 | 15 | 23.1% |
| $100,000 to $149,999 | 35 | 53.8% |
| $150,000 to $199,999 | 11 | 16.9% |
| $200,000+ | 0 | 0.0% |
Family Income by Famaliy Size in Jim Falls
2-person families (29 | 44.6%) account for the highest median family income in Jim Falls with $86,607 per family, while 2-person families (29 | 44.6%) have the highest median income of $43,304 per family member.
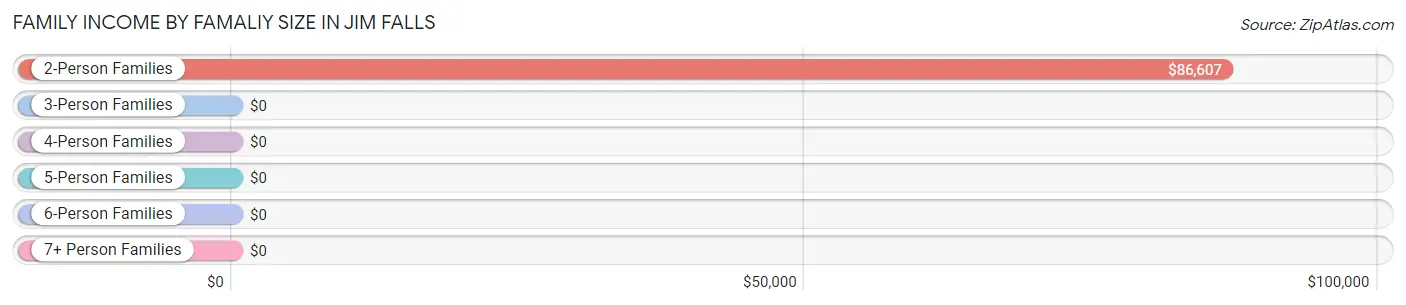
| Income Bracket | # Families | Median Income |
| 2-Person Families | 29 (44.6%) | $86,607 |
| 3-Person Families | 25 (38.5%) | $0 |
| 4-Person Families | 11 (16.9%) | $0 |
| 5-Person Families | 0 (0.0%) | $0 |
| 6-Person Families | 0 (0.0%) | $0 |
| 7+ Person Families | 0 (0.0%) | $0 |
| Total | 65 (100.0%) | $115,547 |
Family Income by Number of Earners in Jim Falls
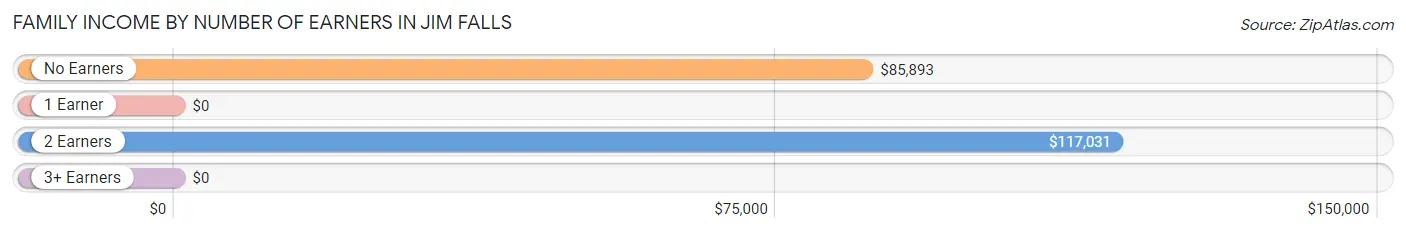
| Number of Earners | # Families | Median Income |
| No Earners | 13 (20.0%) | $85,893 |
| 1 Earner | 6 (9.2%) | $0 |
| 2 Earners | 46 (70.8%) | $117,031 |
| 3+ Earners | 0 (0.0%) | $0 |
| Total | 65 (100.0%) | $115,547 |
Household Income in Jim Falls
Household Income Brackets in Jim Falls
With 39 households falling in the category, the $100,000 to $149,999 income range is the most frequent in Jim Falls, accounting for 34.2% of all households.

| Income Bracket | # Households | % Households |
| Less than $10,000 | 6 | 5.3% |
| $10,000 to $14,999 | 8 | 7.0% |
| $15,000 to $24,999 | 15 | 13.2% |
| $25,000 to $34,999 | 5 | 4.4% |
| $35,000 to $49,999 | 4 | 3.5% |
| $50,000 to $74,999 | 7 | 6.1% |
| $75,000 to $99,999 | 19 | 16.7% |
| $100,000 to $149,999 | 39 | 34.2% |
| $150,000 to $199,999 | 11 | 9.6% |
| $200,000+ | 0 | 0.0% |
Household Income by Householder Age in Jim Falls
The median household income in Jim Falls is $87,143, with the highest median household income of $116,250 found in the 25 to 44 years age bracket for the primary householder. A total of 56 households (49.1%) fall into this category.
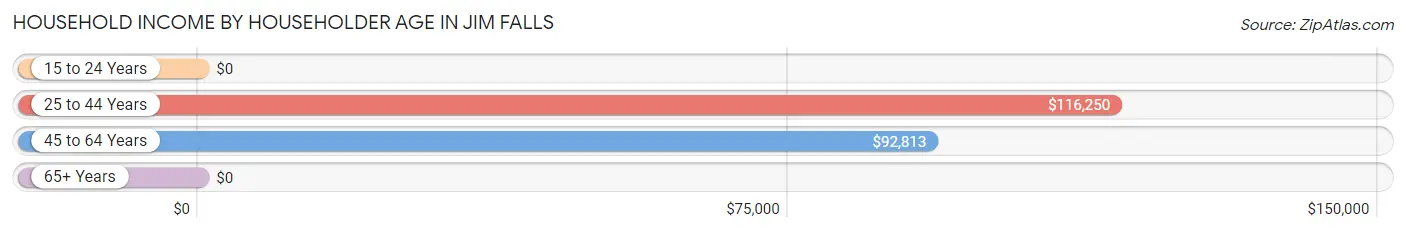
| Income Bracket | # Households | Median Income |
| 15 to 24 Years | 0 (0.0%) | $0 |
| 25 to 44 Years | 56 (49.1%) | $116,250 |
| 45 to 64 Years | 27 (23.7%) | $92,813 |
| 65+ Years | 31 (27.2%) | $0 |
| Total | 114 (100.0%) | $87,143 |
Poverty in Jim Falls
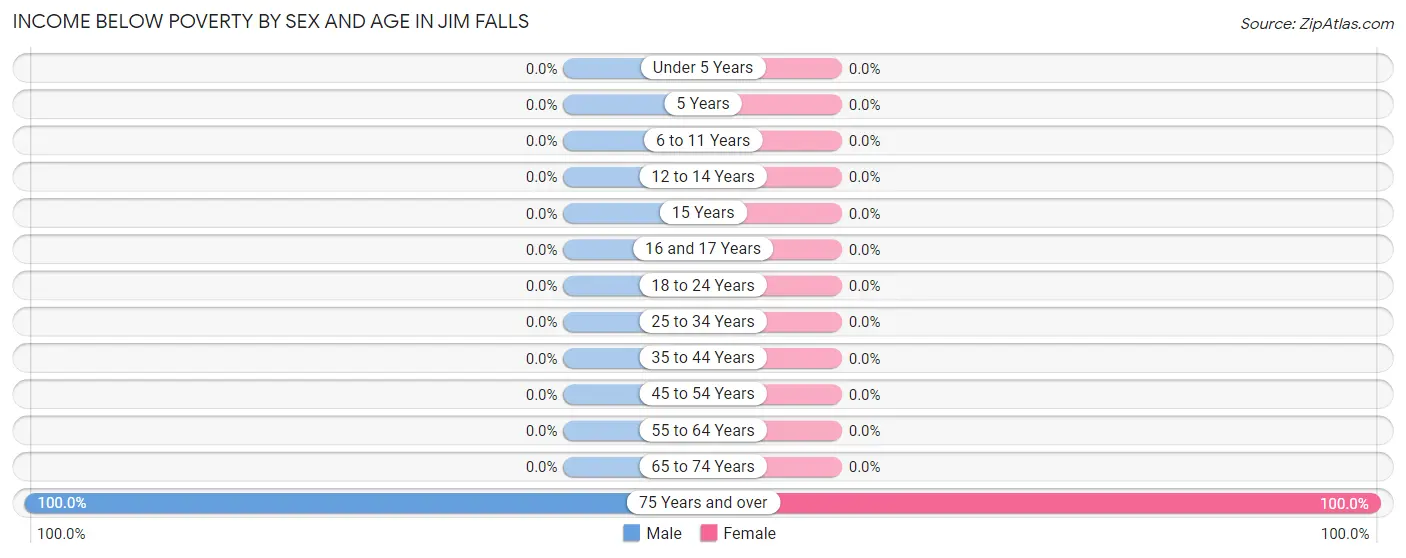
Income Below Poverty by Sex and Age in Jim Falls
With 6.1% poverty level for males and 6.8% for females among the residents of Jim Falls, 75 year old and over males and 75 year old and over females are the most vulnerable to poverty, with 8 males (100.0%) and 6 females (100.0%) in their respective age groups living below the poverty level.
| Age Bracket | Male | Female |
| Under 5 Years | 0 (0.0%) | 0 (0.0%) |
| 5 Years | 0 (0.0%) | 0 (0.0%) |
| 6 to 11 Years | 0 (0.0%) | 0 (0.0%) |
| 12 to 14 Years | 0 (0.0%) | 0 (0.0%) |
| 15 Years | 0 (0.0%) | 0 (0.0%) |
| 16 and 17 Years | 0 (0.0%) | 0 (0.0%) |
| 18 to 24 Years | 0 (0.0%) | 0 (0.0%) |
| 25 to 34 Years | 0 (0.0%) | 0 (0.0%) |
| 35 to 44 Years | 0 (0.0%) | 0 (0.0%) |
| 45 to 54 Years | 0 (0.0%) | 0 (0.0%) |
| 55 to 64 Years | 0 (0.0%) | 0 (0.0%) |
| 65 to 74 Years | 0 (0.0%) | 0 (0.0%) |
| 75 Years and over | 8 (100.0%) | 6 (100.0%) |
| Total | 8 (6.1%) | 6 (6.8%) |
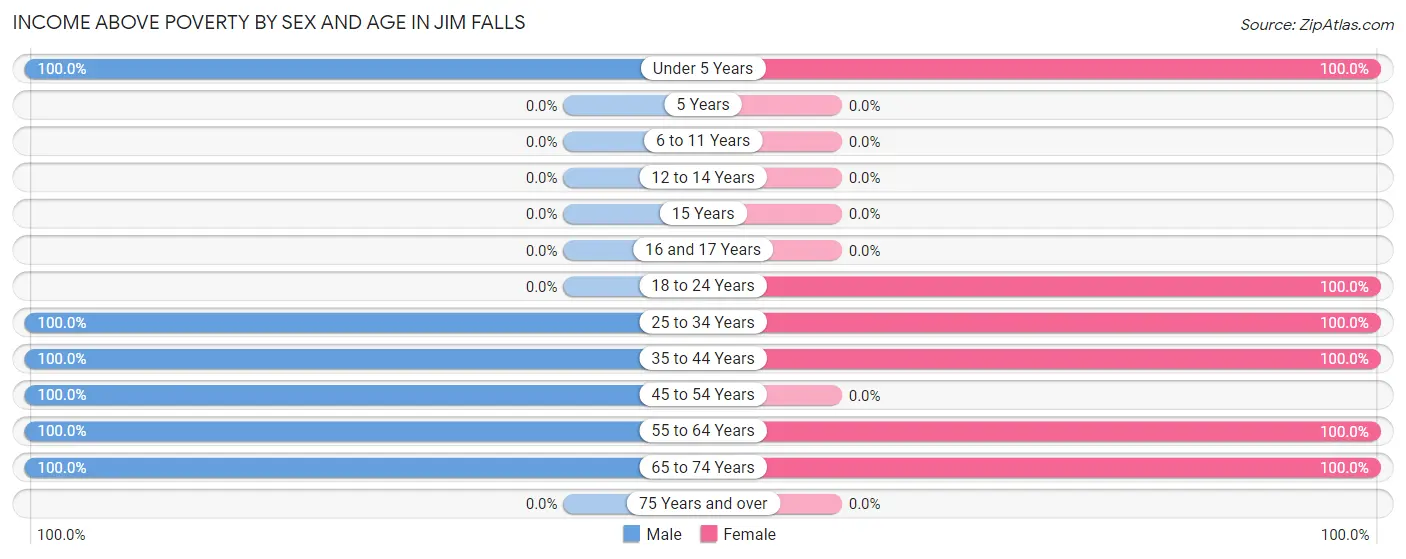
Income Above Poverty by Sex and Age in Jim Falls
According to the poverty statistics in Jim Falls, males aged under 5 years and females aged under 5 years are the age groups that are most secure financially, with 100.0% of males and 100.0% of females in these age groups living above the poverty line.
| Age Bracket | Male | Female |
| Under 5 Years | 29 (100.0%) | 14 (100.0%) |
| 5 Years | 0 (0.0%) | 0 (0.0%) |
| 6 to 11 Years | 0 (0.0%) | 0 (0.0%) |
| 12 to 14 Years | 0 (0.0%) | 0 (0.0%) |
| 15 Years | 0 (0.0%) | 0 (0.0%) |
| 16 and 17 Years | 0 (0.0%) | 0 (0.0%) |
| 18 to 24 Years | 0 (0.0%) | 8 (100.0%) |
| 25 to 34 Years | 20 (100.0%) | 11 (100.0%) |
| 35 to 44 Years | 36 (100.0%) | 24 (100.0%) |
| 45 to 54 Years | 10 (100.0%) | 0 (0.0%) |
| 55 to 64 Years | 11 (100.0%) | 18 (100.0%) |
| 65 to 74 Years | 17 (100.0%) | 7 (100.0%) |
| 75 Years and over | 0 (0.0%) | 0 (0.0%) |
| Total | 123 (93.9%) | 82 (93.2%) |
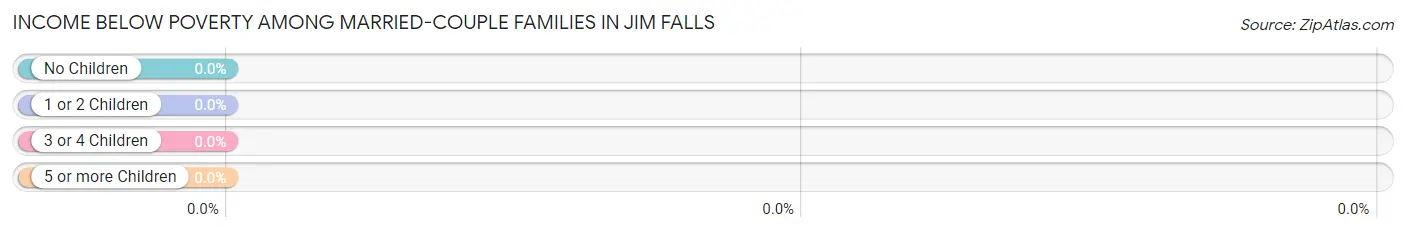
Income Below Poverty Among Married-Couple Families in Jim Falls
| Children | Above Poverty | Below Poverty |
| No Children | 13 (100.0%) | 0 (0.0%) |
| 1 or 2 Children | 36 (100.0%) | 0 (0.0%) |
| 3 or 4 Children | 0 (0.0%) | 0 (0.0%) |
| 5 or more Children | 0 (0.0%) | 0 (0.0%) |
| Total | 49 (100.0%) | 0 (0.0%) |
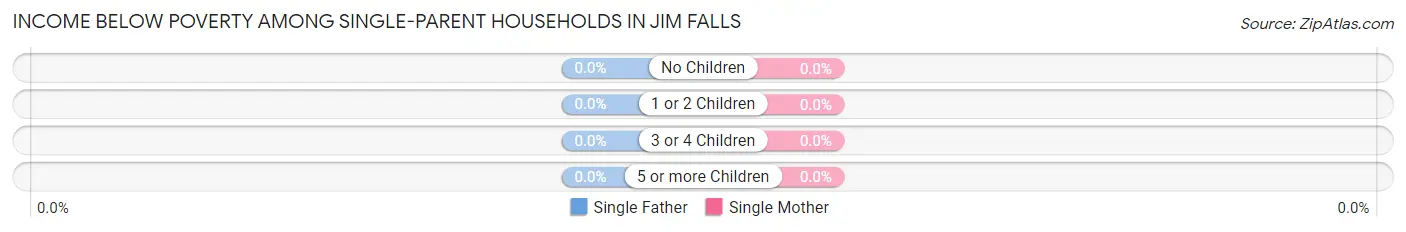
Income Below Poverty Among Single-Parent Households in Jim Falls
| Children | Single Father | Single Mother |
| No Children | 0 (0.0%) | 0 (0.0%) |
| 1 or 2 Children | 0 (0.0%) | 0 (0.0%) |
| 3 or 4 Children | 0 (0.0%) | 0 (0.0%) |
| 5 or more Children | 0 (0.0%) | 0 (0.0%) |
| Total | 0 (0.0%) | 0 (0.0%) |
Income Below Poverty Among Married-Couple vs Single-Parent Households in Jim Falls
| Children | Married-Couple Families | Single-Parent Households |
| No Children | 0 (0.0%) | 0 (0.0%) |
| 1 or 2 Children | 0 (0.0%) | 0 (0.0%) |
| 3 or 4 Children | 0 (0.0%) | 0 (0.0%) |
| 5 or more Children | 0 (0.0%) | 0 (0.0%) |
| Total | 0 (0.0%) | 0 (0.0%) |
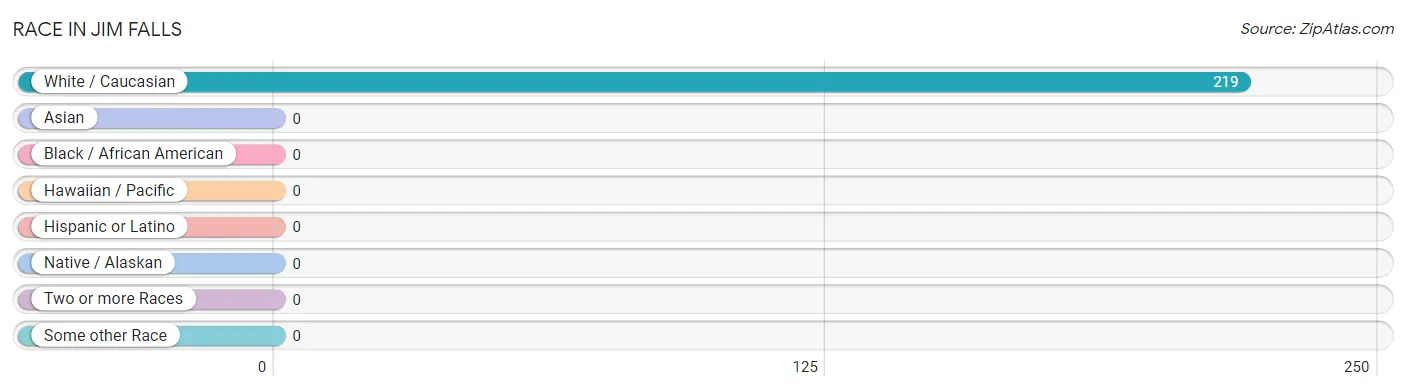
Race in Jim Falls
The most populous races in Jim Falls are , and White / Caucasian (219 | 100.0%).
| Race | # Population | % Population |
| Asian | 0 | 0.0% |
| Black / African American | 0 | 0.0% |
| Hawaiian / Pacific | 0 | 0.0% |
| Hispanic or Latino | 0 | 0.0% |
| Native / Alaskan | 0 | 0.0% |
| White / Caucasian | 219 | 100.0% |
| Two or more Races | 0 | 0.0% |
| Some other Race | 0 | 0.0% |
| Total | 219 | 100.0% |
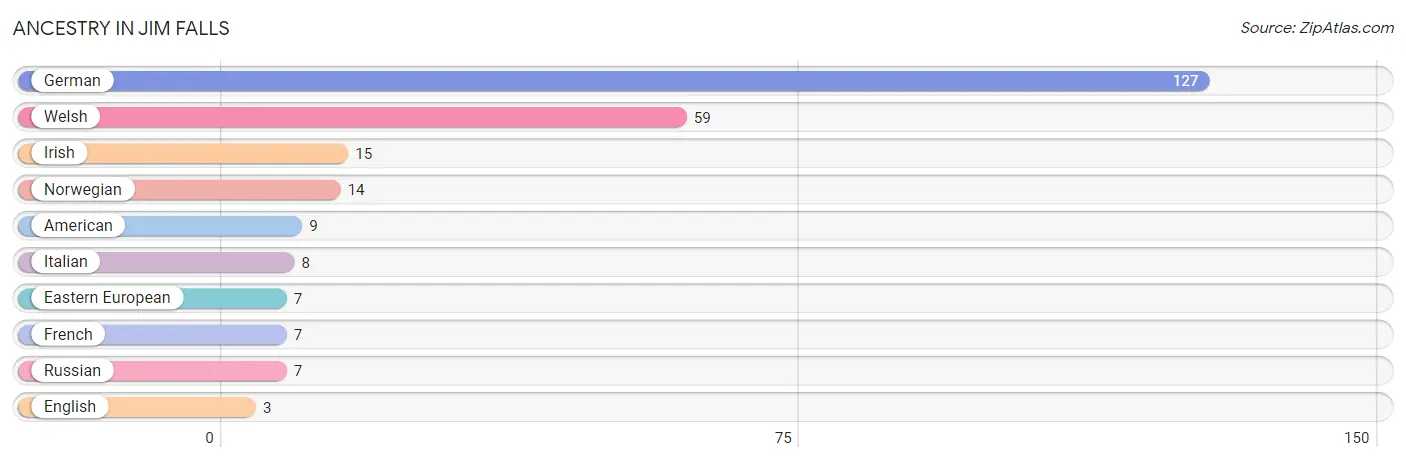
Ancestry in Jim Falls
The most populous ancestries reported in Jim Falls are German (127 | 58.0%), Welsh (59 | 26.9%), Irish (15 | 6.9%), Norwegian (14 | 6.4%), and American (9 | 4.1%), together accounting for 102.3% of all Jim Falls residents.
| Ancestry | # Population | % Population |
| American | 9 | 4.1% |
| Eastern European | 7 | 3.2% |
| English | 3 | 1.4% |
| French | 7 | 3.2% |
| German | 127 | 58.0% |
| Irish | 15 | 6.9% |
| Italian | 8 | 3.6% |
| Norwegian | 14 | 6.4% |
| Russian | 7 | 3.2% |
| Welsh | 59 | 26.9% | View All 10 Rows |
Immigrants in Jim Falls

| Immigration Origin | # Population | % Population | View All 0 Rows |
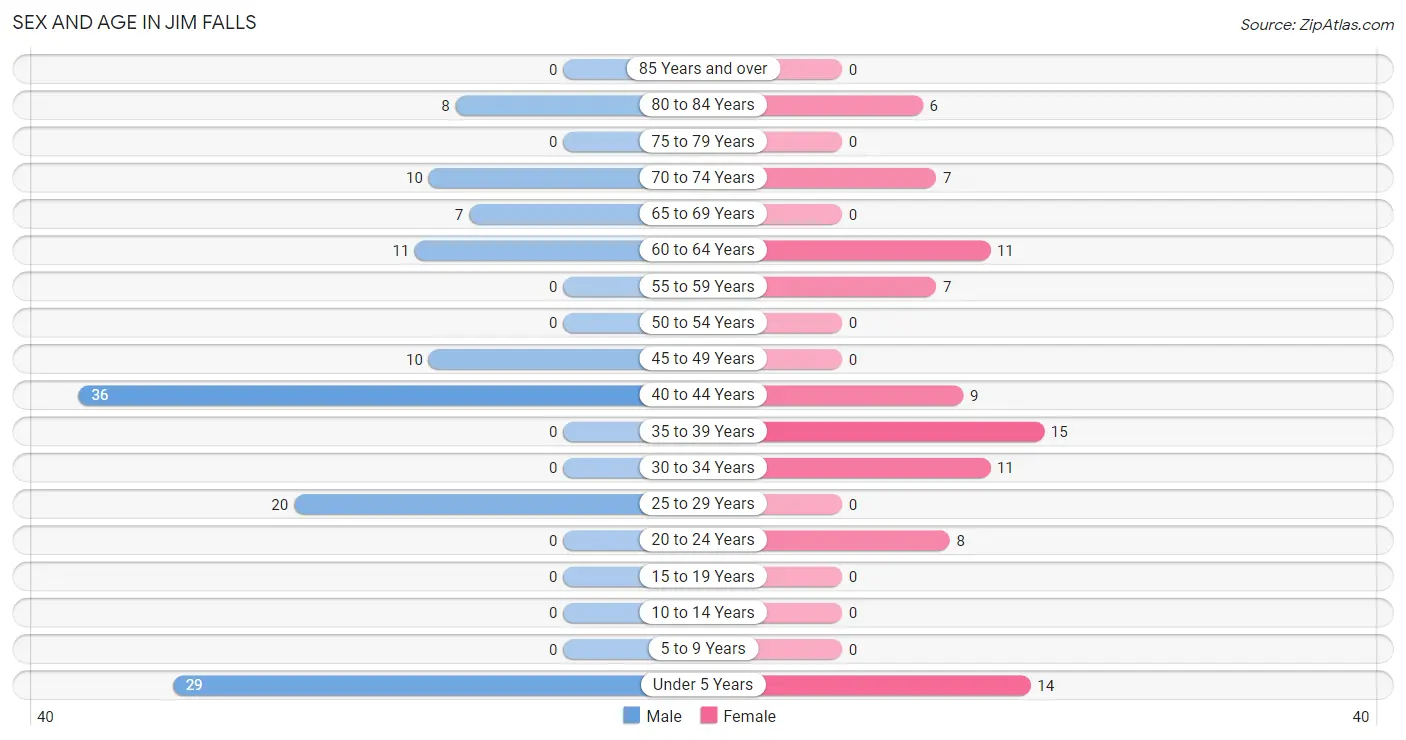
Sex and Age in Jim Falls
Sex and Age in Jim Falls
The most populous age groups in Jim Falls are 40 to 44 Years (36 | 27.5%) for men and 35 to 39 Years (15 | 17.1%) for women.
| Age Bracket | Male | Female |
| Under 5 Years | 29 (22.1%) | 14 (15.9%) |
| 5 to 9 Years | 0 (0.0%) | 0 (0.0%) |
| 10 to 14 Years | 0 (0.0%) | 0 (0.0%) |
| 15 to 19 Years | 0 (0.0%) | 0 (0.0%) |
| 20 to 24 Years | 0 (0.0%) | 8 (9.1%) |
| 25 to 29 Years | 20 (15.3%) | 0 (0.0%) |
| 30 to 34 Years | 0 (0.0%) | 11 (12.5%) |
| 35 to 39 Years | 0 (0.0%) | 15 (17.1%) |
| 40 to 44 Years | 36 (27.5%) | 9 (10.2%) |
| 45 to 49 Years | 10 (7.6%) | 0 (0.0%) |
| 50 to 54 Years | 0 (0.0%) | 0 (0.0%) |
| 55 to 59 Years | 0 (0.0%) | 7 (8.0%) |
| 60 to 64 Years | 11 (8.4%) | 11 (12.5%) |
| 65 to 69 Years | 7 (5.3%) | 0 (0.0%) |
| 70 to 74 Years | 10 (7.6%) | 7 (8.0%) |
| 75 to 79 Years | 0 (0.0%) | 0 (0.0%) |
| 80 to 84 Years | 8 (6.1%) | 6 (6.8%) |
| 85 Years and over | 0 (0.0%) | 0 (0.0%) |
| Total | 131 (100.0%) | 88 (100.0%) |
Families and Households in Jim Falls
Median Family Size in Jim Falls
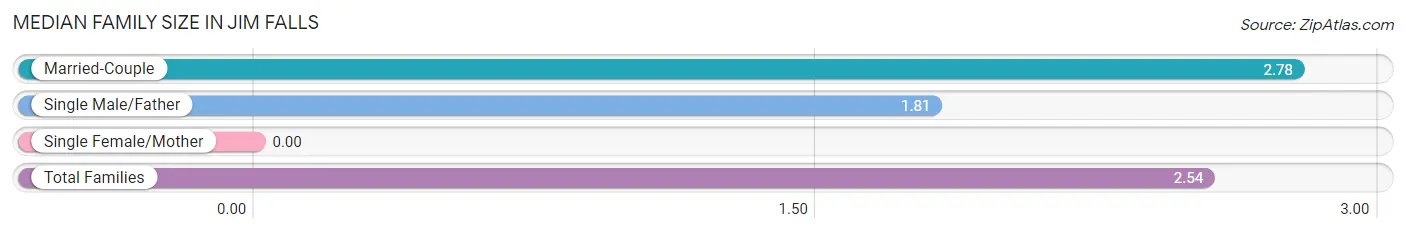
| Family Type | # Families | Family Size |
| Married-Couple | 49 (75.4%) | 2.78 |
| Single Male/Father | 16 (24.6%) | 1.81 |
| Single Female/Mother | 0 (0.0%) | - |
| Total Families | 65 (100.0%) | 2.54 |
Median Household Size in Jim Falls
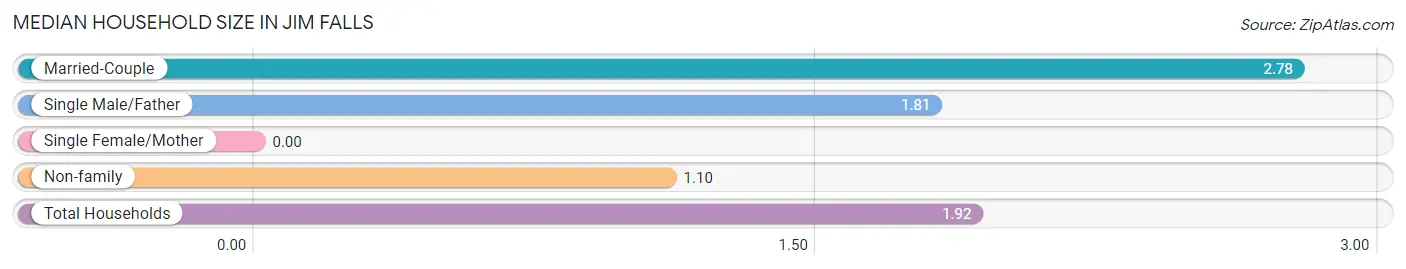
| Household Type | # Households | Household Size |
| Married-Couple | 49 (43.0%) | 2.78 |
| Single Male/Father | 16 (14.0%) | 1.81 |
| Single Female/Mother | 0 (0.0%) | - |
| Non-family | 49 (43.0%) | 1.10 |
| Total Households | 114 (100.0%) | 1.92 |
Household Size by Marriage Status in Jim Falls
Out of a total of 114 households in Jim Falls, 65 (57.0%) are family households, while 49 (43.0%) are nonfamily households. The most numerous type of family households are 2-person households, comprising 29, and the most common type of nonfamily households are 1-person households, comprising 45.
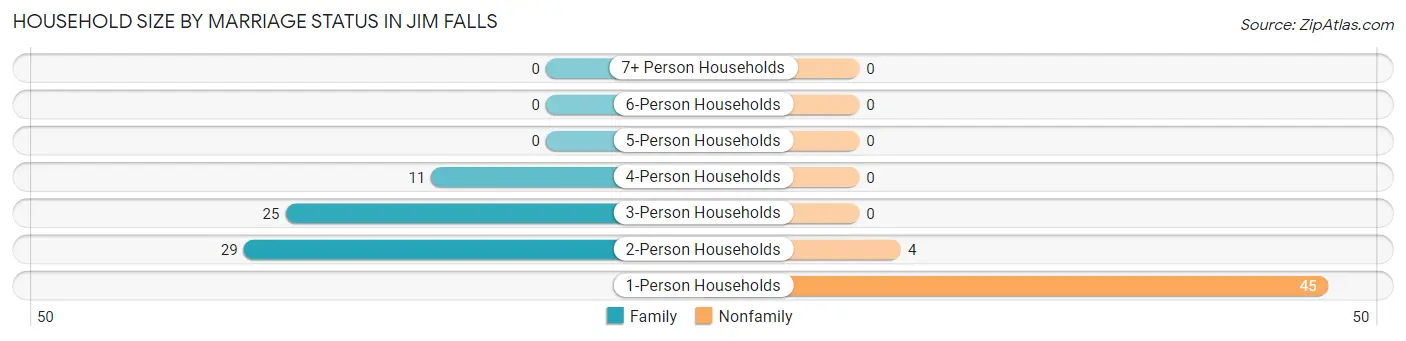
| Household Size | Family Households | Nonfamily Households |
| 1-Person Households | - | 45 (39.5%) |
| 2-Person Households | 29 (25.4%) | 4 (3.5%) |
| 3-Person Households | 25 (21.9%) | 0 (0.0%) |
| 4-Person Households | 11 (9.7%) | 0 (0.0%) |
| 5-Person Households | 0 (0.0%) | 0 (0.0%) |
| 6-Person Households | 0 (0.0%) | 0 (0.0%) |
| 7+ Person Households | 0 (0.0%) | 0 (0.0%) |
| Total | 65 (57.0%) | 49 (43.0%) |
Female Fertility in Jim Falls
Fertility by Age in Jim Falls
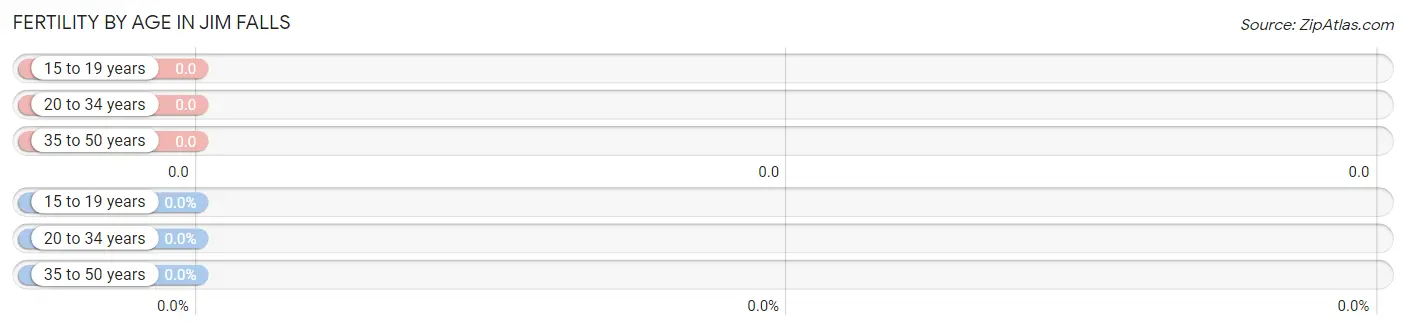
| Age Bracket | Women with Births | Births / 1,000 Women |
| 15 to 19 years | 0 (0.0%) | 0.0 |
| 20 to 34 years | 0 (0.0%) | 0.0 |
| 35 to 50 years | 0 (0.0%) | 0.0 |
| Total | 0 (0.0%) | 0.0 |
Fertility by Age by Marriage Status in Jim Falls
| Age Bracket | Married | Unmarried |
| 15 to 19 years | 0 (0.0%) | 0 (0.0%) |
| 20 to 34 years | 0 (0.0%) | 0 (0.0%) |
| 35 to 50 years | 0 (0.0%) | 0 (0.0%) |
| Total | 0 (0.0%) | 0 (0.0%) |
Fertility by Education in Jim Falls
| Educational Attainment | Women with Births | Births / 1,000 Women |
| Less than High School | 0 (0.0%) | 0.0 |
| High School Diploma | 0 (0.0%) | 0.0 |
| College or Associate's Degree | 0 (0.0%) | 0.0 |
| Bachelor's Degree | 0 (0.0%) | 0.0 |
| Graduate Degree | 0 (0.0%) | 0.0 |
| Total | 0 (0.0%) | 0.0 |
Fertility by Education by Marriage Status in Jim Falls
| Educational Attainment | Married | Unmarried |
| Less than High School | 0 (0.0%) | 0 (0.0%) |
| High School Diploma | 0 (0.0%) | 0 (0.0%) |
| College or Associate's Degree | 0 (0.0%) | 0 (0.0%) |
| Bachelor's Degree | 0 (0.0%) | 0 (0.0%) |
| Graduate Degree | 0 (0.0%) | 0 (0.0%) |
| Total | 0 (0.0%) | 0 (0.0%) |
Employment Characteristics in Jim Falls
Employment by Class of Employer in Jim Falls
Among the 131 employed individuals in Jim Falls, private company employees (79 | 60.3%), self-employed (incorporated) (27 | 20.6%), and local government employees (19 | 14.5%) make up the most common classes of employment.
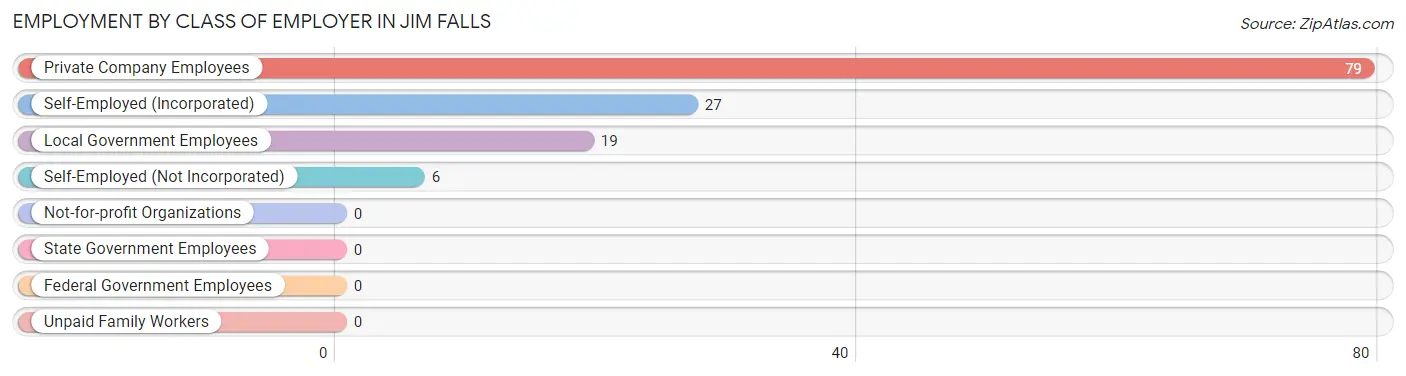
| Employer Class | # Employees | % Employees |
| Private Company Employees | 79 | 60.3% |
| Self-Employed (Incorporated) | 27 | 20.6% |
| Self-Employed (Not Incorporated) | 6 | 4.6% |
| Not-for-profit Organizations | 0 | 0.0% |
| Local Government Employees | 19 | 14.5% |
| State Government Employees | 0 | 0.0% |
| Federal Government Employees | 0 | 0.0% |
| Unpaid Family Workers | 0 | 0.0% |
| Total | 131 | 100.0% |
Employment Status by Age in Jim Falls
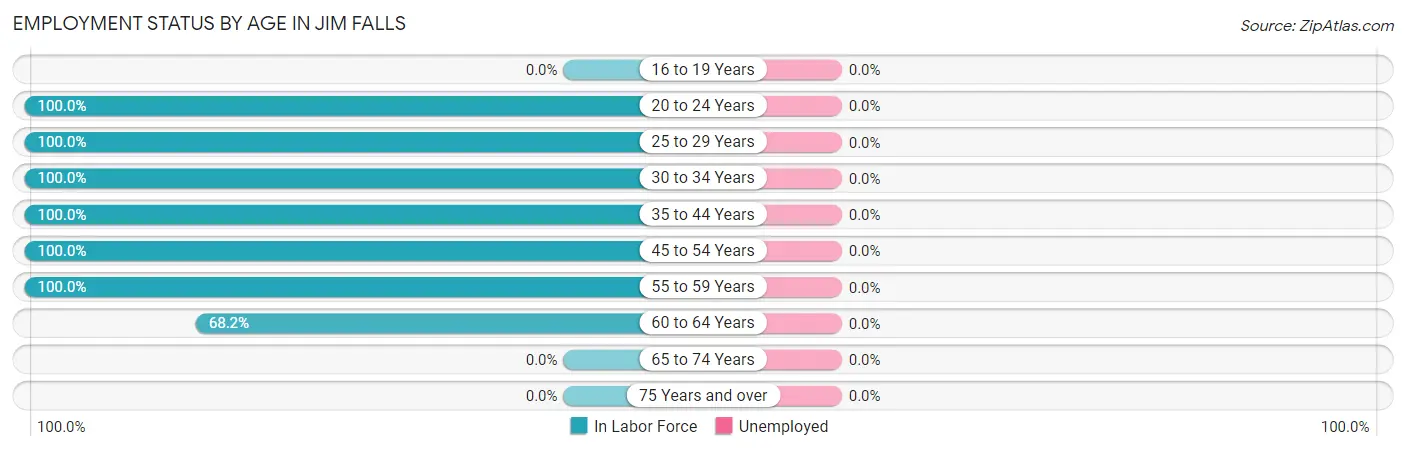
| Age Bracket | In Labor Force | Unemployed |
| 16 to 19 Years | 0 (0.0%) | 0 (0.0%) |
| 20 to 24 Years | 8 (100.0%) | 0 (0.0%) |
| 25 to 29 Years | 20 (100.0%) | 0 (0.0%) |
| 30 to 34 Years | 11 (100.0%) | 0 (0.0%) |
| 35 to 44 Years | 60 (100.0%) | 0 (0.0%) |
| 45 to 54 Years | 10 (100.0%) | 0 (0.0%) |
| 55 to 59 Years | 7 (100.0%) | 0 (0.0%) |
| 60 to 64 Years | 15 (68.2%) | 0 (0.0%) |
| 65 to 74 Years | 0 (0.0%) | 0 (0.0%) |
| 75 Years and over | 0 (0.0%) | 0 (0.0%) |
| Total | 131 (74.4%) | 0 (0.0%) |
Employment Status by Educational Attainment in Jim Falls
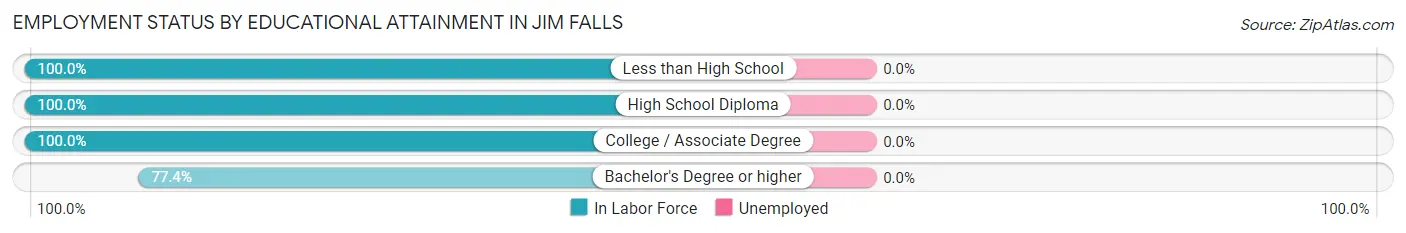
| Educational Attainment | In Labor Force | Unemployed |
| Less than High School | 11 (100.0%) | 0 (0.0%) |
| High School Diploma | 36 (100.0%) | 0 (0.0%) |
| College / Associate Degree | 52 (100.0%) | 0 (0.0%) |
| Bachelor's Degree or higher | 24 (77.4%) | 0 (0.0%) |
| Total | 123 (94.6%) | 0 (0.0%) |
Employment Occupations by Sex in Jim Falls
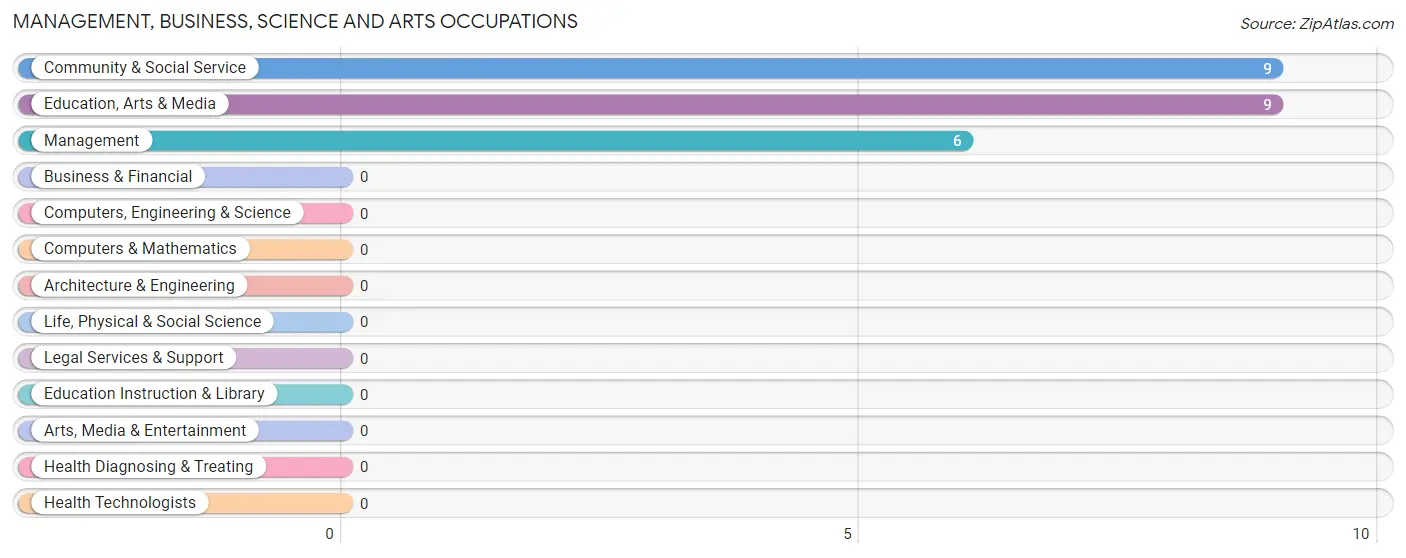
Management, Business, Science and Arts Occupations
The most common Management, Business, Science and Arts occupations in Jim Falls are Community & Social Service (9 | 6.9%), Education, Arts & Media (9 | 6.9%), and Management (6 | 4.6%).
Management, Business, Science and Arts Occupations by Sex
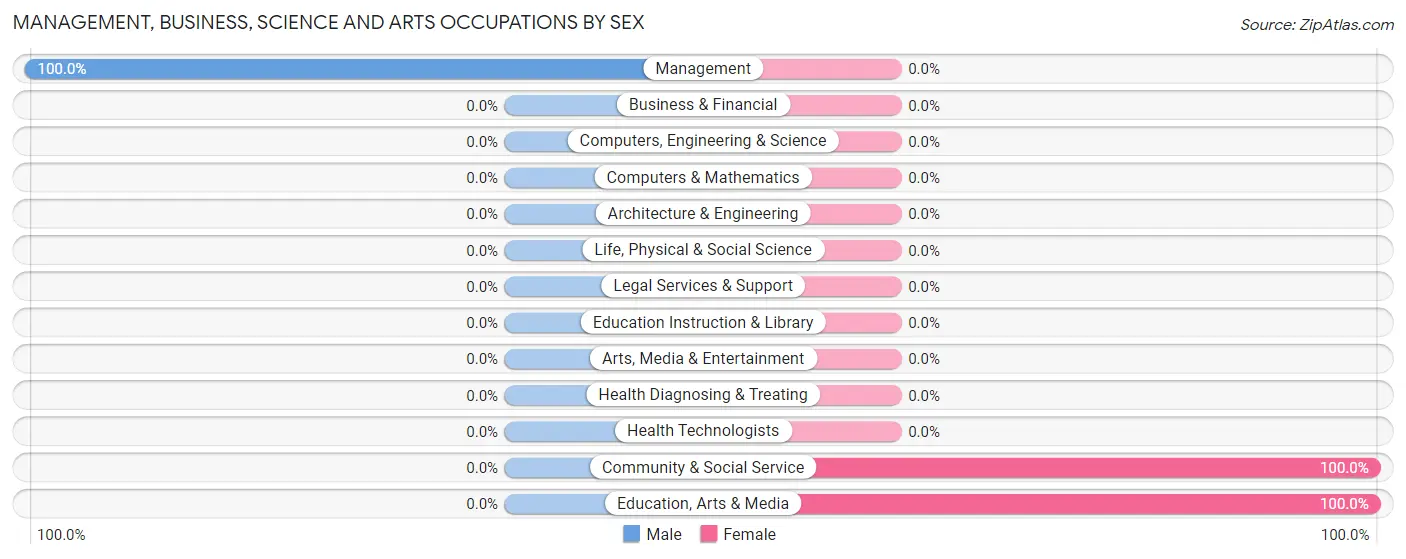
| Occupation | Male | Female |
| Management | 6 (100.0%) | 0 (0.0%) |
| Business & Financial | 0 (0.0%) | 0 (0.0%) |
| Computers, Engineering & Science | 0 (0.0%) | 0 (0.0%) |
| Computers & Mathematics | 0 (0.0%) | 0 (0.0%) |
| Architecture & Engineering | 0 (0.0%) | 0 (0.0%) |
| Life, Physical & Social Science | 0 (0.0%) | 0 (0.0%) |
| Community & Social Service | 0 (0.0%) | 9 (100.0%) |
| Education, Arts & Media | 0 (0.0%) | 9 (100.0%) |
| Legal Services & Support | 0 (0.0%) | 0 (0.0%) |
| Education Instruction & Library | 0 (0.0%) | 0 (0.0%) |
| Arts, Media & Entertainment | 0 (0.0%) | 0 (0.0%) |
| Health Diagnosing & Treating | 0 (0.0%) | 0 (0.0%) |
| Health Technologists | 0 (0.0%) | 0 (0.0%) |
| Total (Category) | 6 (40.0%) | 9 (60.0%) |
| Total (Overall) | 77 (58.8%) | 54 (41.2%) |
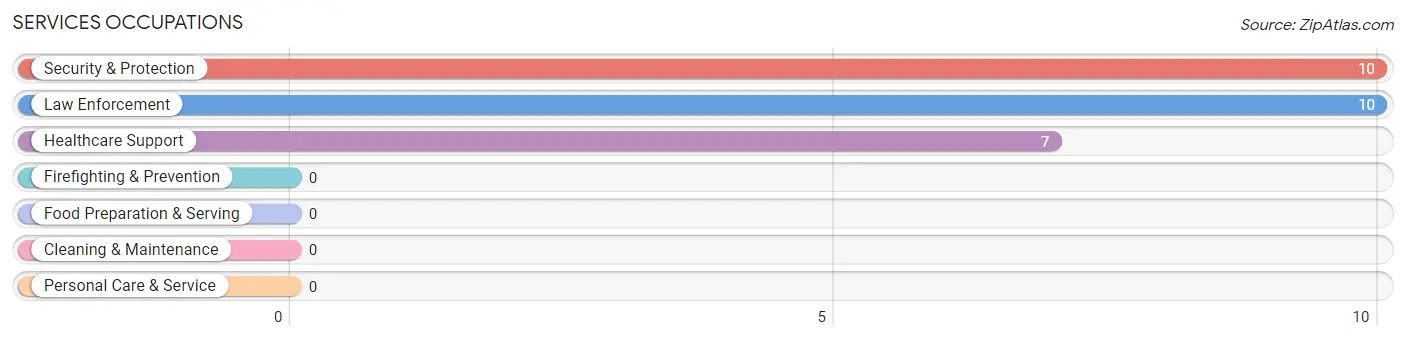
Services Occupations
The most common Services occupations in Jim Falls are Security & Protection (10 | 7.6%), Law Enforcement (10 | 7.6%), and Healthcare Support (7 | 5.3%).
Services Occupations by Sex
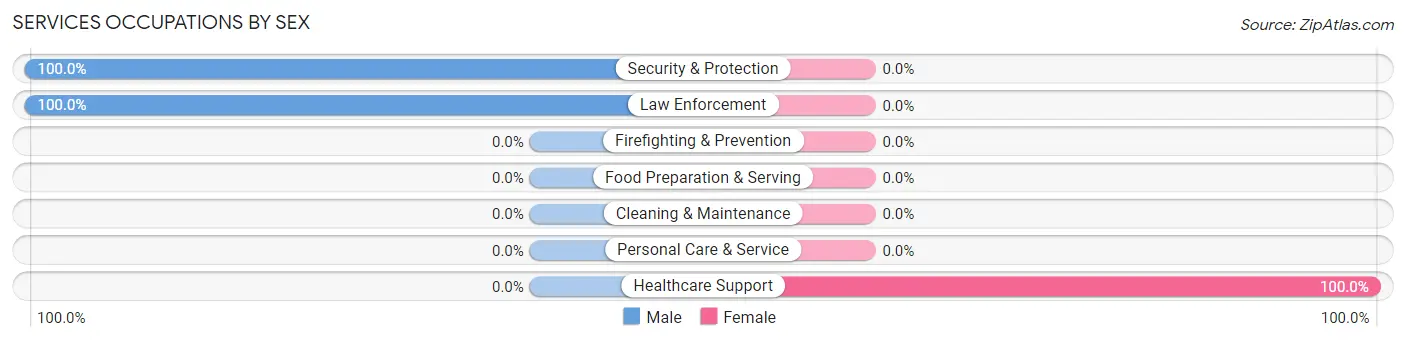
| Occupation | Male | Female |
| Healthcare Support | 0 (0.0%) | 7 (100.0%) |
| Security & Protection | 10 (100.0%) | 0 (0.0%) |
| Firefighting & Prevention | 0 (0.0%) | 0 (0.0%) |
| Law Enforcement | 10 (100.0%) | 0 (0.0%) |
| Food Preparation & Serving | 0 (0.0%) | 0 (0.0%) |
| Cleaning & Maintenance | 0 (0.0%) | 0 (0.0%) |
| Personal Care & Service | 0 (0.0%) | 0 (0.0%) |
| Total (Category) | 10 (58.8%) | 7 (41.2%) |
| Total (Overall) | 77 (58.8%) | 54 (41.2%) |
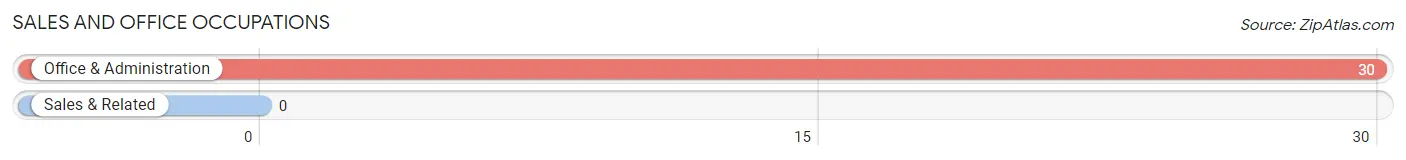
Sales and Office Occupations
The most common Sales and Office occupations in Jim Falls are , and Office & Administration (30 | 22.9%).
Sales and Office Occupations by Sex
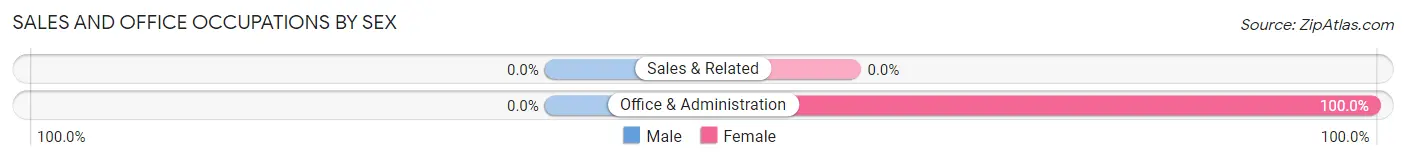
| Occupation | Male | Female |
| Sales & Related | 0 (0.0%) | 0 (0.0%) |
| Office & Administration | 0 (0.0%) | 30 (100.0%) |
| Total (Category) | 0 (0.0%) | 30 (100.0%) |
| Total (Overall) | 77 (58.8%) | 54 (41.2%) |
Natural Resources, Construction and Maintenance Occupations
The most common Natural Resources, Construction and Maintenance occupations in Jim Falls are , and Installation, Maintenance & Repair (24 | 18.3%).
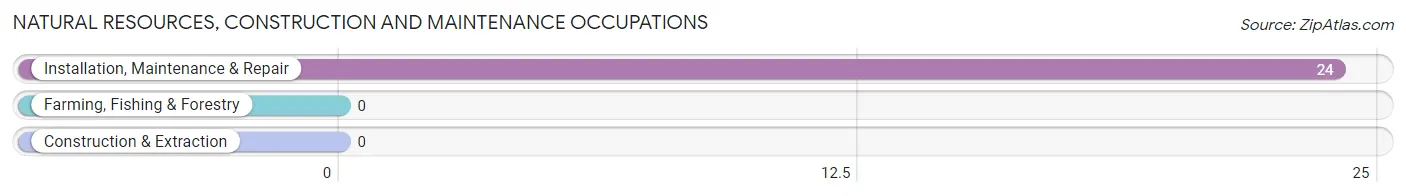
Natural Resources, Construction and Maintenance Occupations by Sex
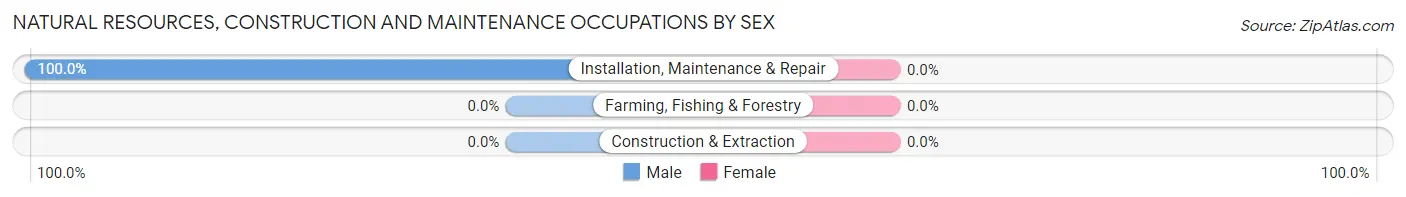
| Occupation | Male | Female |
| Farming, Fishing & Forestry | 0 (0.0%) | 0 (0.0%) |
| Construction & Extraction | 0 (0.0%) | 0 (0.0%) |
| Installation, Maintenance & Repair | 24 (100.0%) | 0 (0.0%) |
| Total (Category) | 24 (100.0%) | 0 (0.0%) |
| Total (Overall) | 77 (58.8%) | 54 (41.2%) |
Production, Transportation and Moving Occupations
The most common Production, Transportation and Moving occupations in Jim Falls are Transportation (37 | 28.2%), and Material Moving (8 | 6.1%).
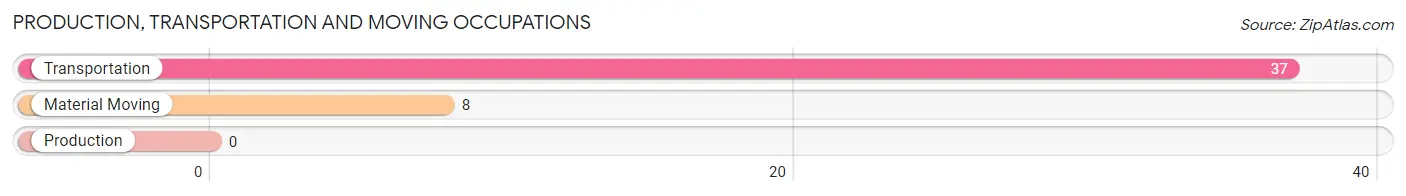
Production, Transportation and Moving Occupations by Sex
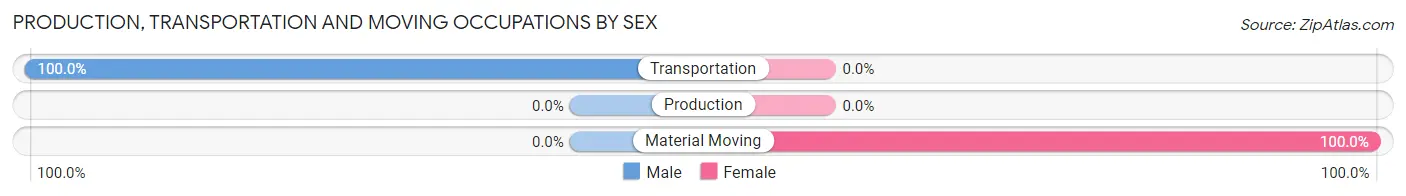
| Occupation | Male | Female |
| Production | 0 (0.0%) | 0 (0.0%) |
| Transportation | 37 (100.0%) | 0 (0.0%) |
| Material Moving | 0 (0.0%) | 8 (100.0%) |
| Total (Category) | 37 (82.2%) | 8 (17.8%) |
| Total (Overall) | 77 (58.8%) | 54 (41.2%) |
Employment Industries by Sex in Jim Falls
Employment Industries in Jim Falls
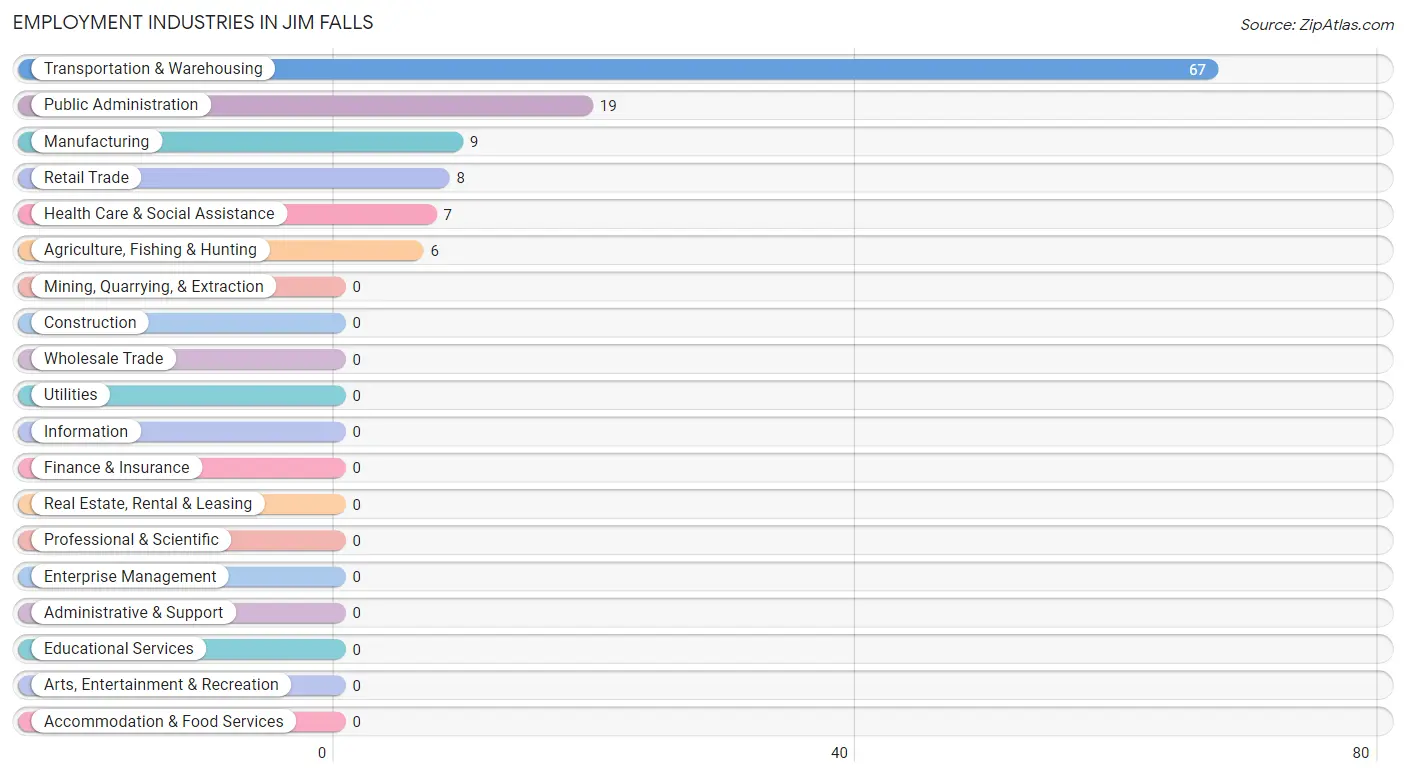
The major employment industries in Jim Falls include Transportation & Warehousing (67 | 51.1%), Public Administration (19 | 14.5%), Manufacturing (9 | 6.9%), Retail Trade (8 | 6.1%), and Health Care & Social Assistance (7 | 5.3%).
Employment Industries by Sex in Jim Falls
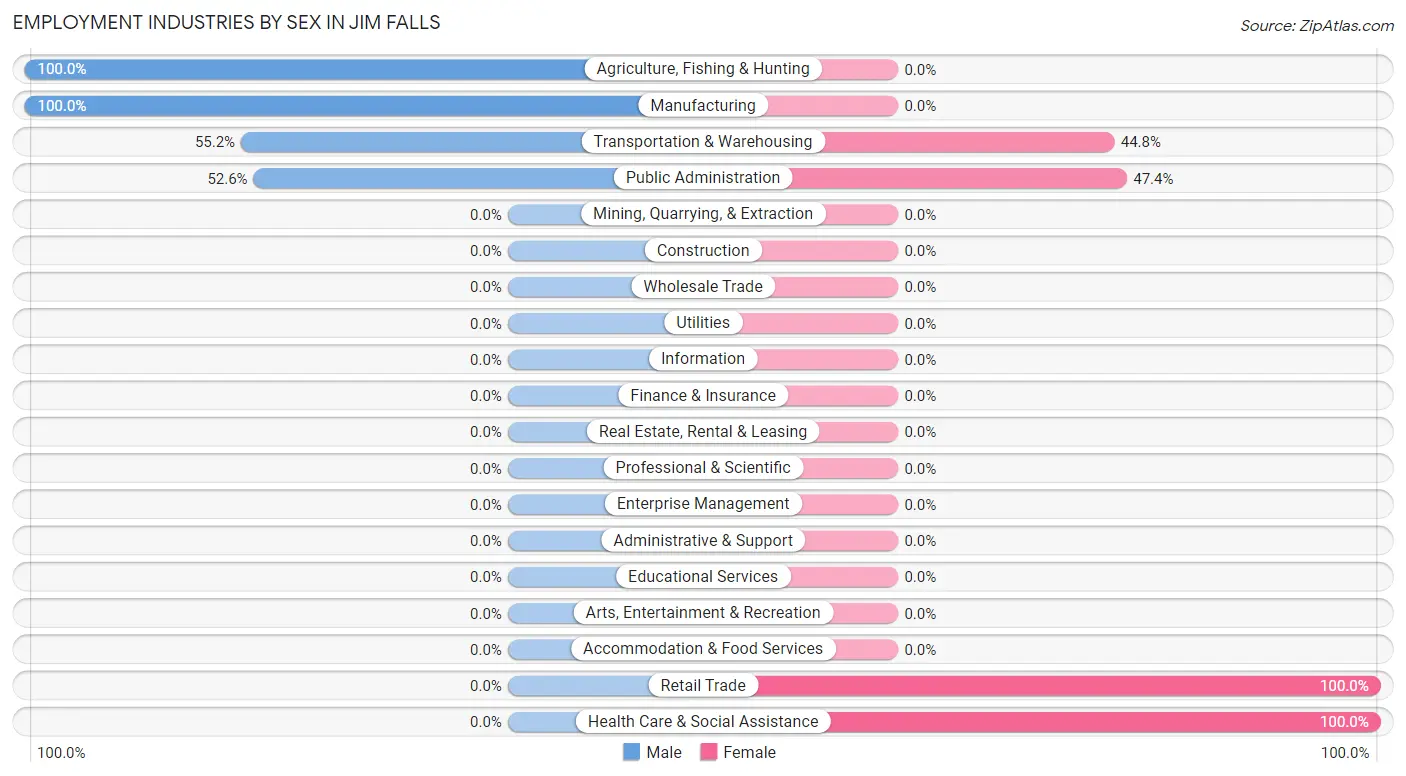
The Jim Falls industries that see more men than women are Agriculture, Fishing & Hunting (100.0%), Manufacturing (100.0%), and Transportation & Warehousing (55.2%), whereas the industries that tend to have a higher number of women are Retail Trade (100.0%), Health Care & Social Assistance (100.0%), and Public Administration (47.4%).
| Industry | Male | Female |
| Agriculture, Fishing & Hunting | 6 (100.0%) | 0 (0.0%) |
| Mining, Quarrying, & Extraction | 0 (0.0%) | 0 (0.0%) |
| Construction | 0 (0.0%) | 0 (0.0%) |
| Manufacturing | 9 (100.0%) | 0 (0.0%) |
| Wholesale Trade | 0 (0.0%) | 0 (0.0%) |
| Retail Trade | 0 (0.0%) | 8 (100.0%) |
| Transportation & Warehousing | 37 (55.2%) | 30 (44.8%) |
| Utilities | 0 (0.0%) | 0 (0.0%) |
| Information | 0 (0.0%) | 0 (0.0%) |
| Finance & Insurance | 0 (0.0%) | 0 (0.0%) |
| Real Estate, Rental & Leasing | 0 (0.0%) | 0 (0.0%) |
| Professional & Scientific | 0 (0.0%) | 0 (0.0%) |
| Enterprise Management | 0 (0.0%) | 0 (0.0%) |
| Administrative & Support | 0 (0.0%) | 0 (0.0%) |
| Educational Services | 0 (0.0%) | 0 (0.0%) |
| Health Care & Social Assistance | 0 (0.0%) | 7 (100.0%) |
| Arts, Entertainment & Recreation | 0 (0.0%) | 0 (0.0%) |
| Accommodation & Food Services | 0 (0.0%) | 0 (0.0%) |
| Public Administration | 10 (52.6%) | 9 (47.4%) |
| Total | 77 (58.8%) | 54 (41.2%) |
Education in Jim Falls
School Enrollment in Jim Falls
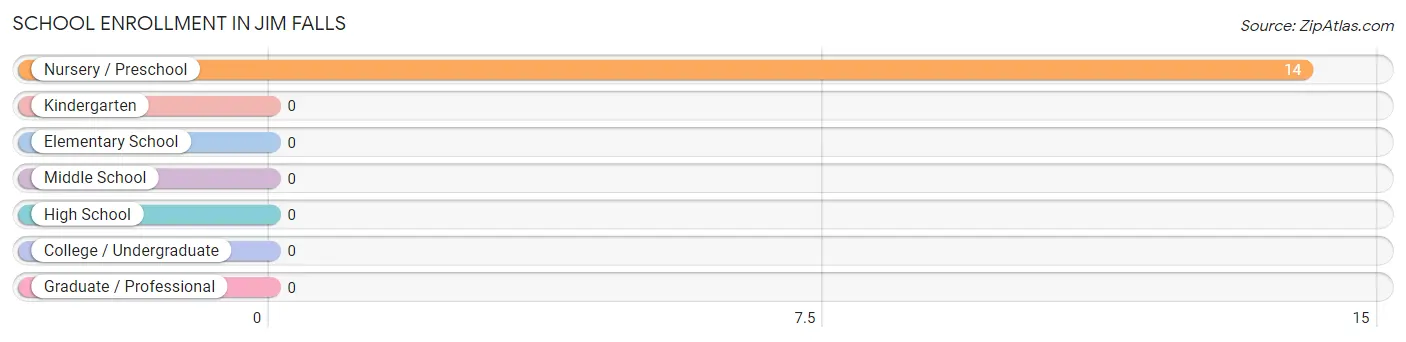
| School Level | # Students | % Students |
| Nursery / Preschool | 14 | 100.0% |
| Kindergarten | 0 | 0.0% |
| Elementary School | 0 | 0.0% |
| Middle School | 0 | 0.0% |
| High School | 0 | 0.0% |
| College / Undergraduate | 0 | 0.0% |
| Graduate / Professional | 0 | 0.0% |
| Total | 14 | 100.0% |
School Enrollment by Age by Funding Source in Jim Falls
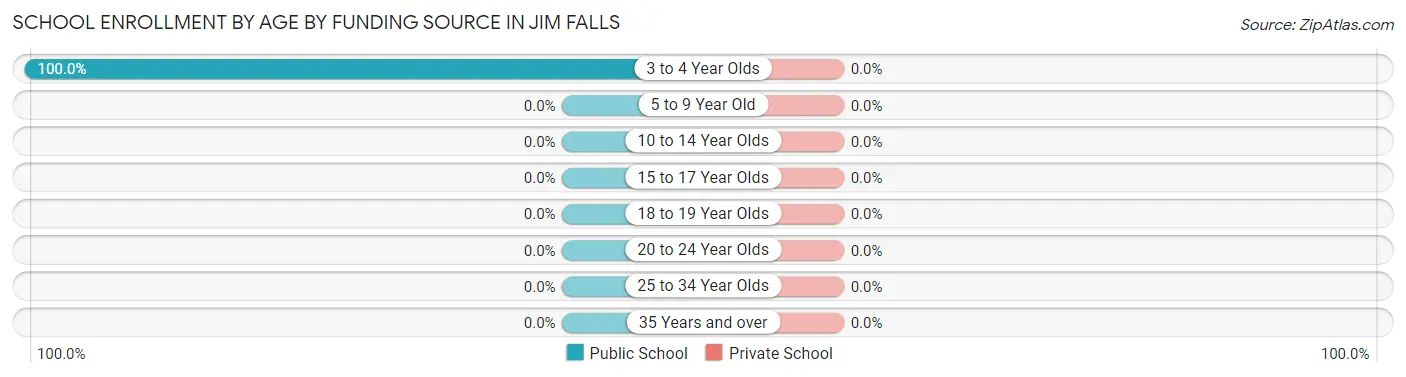
| Age Bracket | Public School | Private School |
| 3 to 4 Year Olds | 14 (100.0%) | 0 (0.0%) |
| 5 to 9 Year Old | 0 (0.0%) | 0 (0.0%) |
| 10 to 14 Year Olds | 0 (0.0%) | 0 (0.0%) |
| 15 to 17 Year Olds | 0 (0.0%) | 0 (0.0%) |
| 18 to 19 Year Olds | 0 (0.0%) | 0 (0.0%) |
| 20 to 24 Year Olds | 0 (0.0%) | 0 (0.0%) |
| 25 to 34 Year Olds | 0 (0.0%) | 0 (0.0%) |
| 35 Years and over | 0 (0.0%) | 0 (0.0%) |
| Total | 14 (100.0%) | 0 (0.0%) |
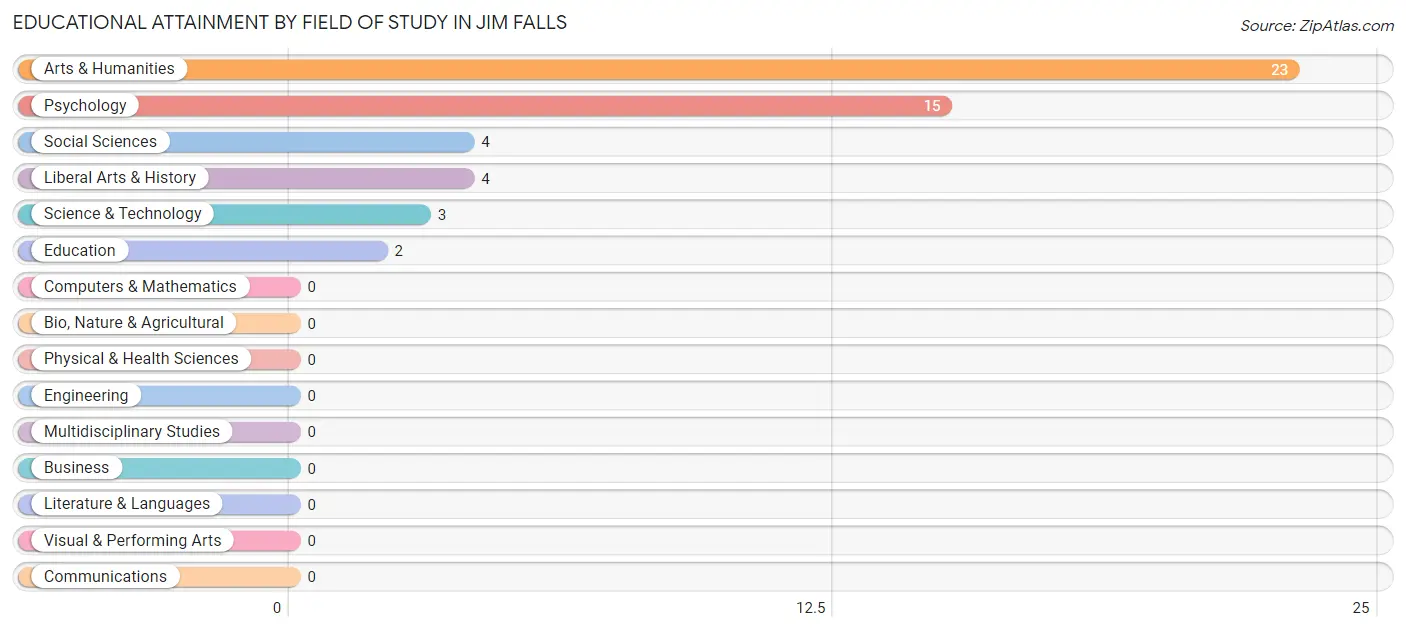
Educational Attainment by Field of Study in Jim Falls
Arts & humanities (23 | 45.1%), psychology (15 | 29.4%), social sciences (4 | 7.8%), liberal arts & history (4 | 7.8%), and science & technology (3 | 5.9%) are the most common fields of study among 51 individuals in Jim Falls who have obtained a bachelor's degree or higher.
| Field of Study | # Graduates | % Graduates |
| Computers & Mathematics | 0 | 0.0% |
| Bio, Nature & Agricultural | 0 | 0.0% |
| Physical & Health Sciences | 0 | 0.0% |
| Psychology | 15 | 29.4% |
| Social Sciences | 4 | 7.8% |
| Engineering | 0 | 0.0% |
| Multidisciplinary Studies | 0 | 0.0% |
| Science & Technology | 3 | 5.9% |
| Business | 0 | 0.0% |
| Education | 2 | 3.9% |
| Literature & Languages | 0 | 0.0% |
| Liberal Arts & History | 4 | 7.8% |
| Visual & Performing Arts | 0 | 0.0% |
| Communications | 0 | 0.0% |
| Arts & Humanities | 23 | 45.1% |
| Total | 51 | 100.0% |
Transportation & Commute in Jim Falls
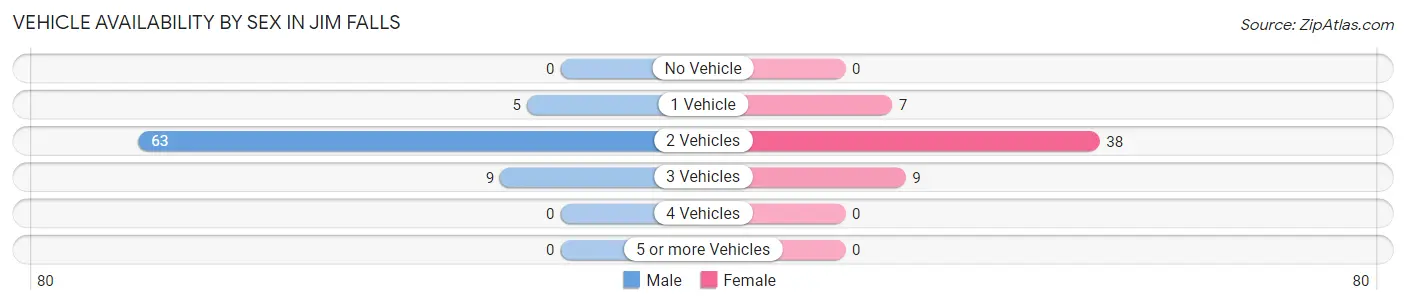
Vehicle Availability by Sex in Jim Falls
The most prevalent vehicle ownership categories in Jim Falls are males with 2 vehicles (63, accounting for 81.8%) and females with 2 vehicles (38, making up 116.7%).
| Vehicles Available | Male | Female |
| No Vehicle | 0 (0.0%) | 0 (0.0%) |
| 1 Vehicle | 5 (6.5%) | 7 (13.0%) |
| 2 Vehicles | 63 (81.8%) | 38 (70.4%) |
| 3 Vehicles | 9 (11.7%) | 9 (16.7%) |
| 4 Vehicles | 0 (0.0%) | 0 (0.0%) |
| 5 or more Vehicles | 0 (0.0%) | 0 (0.0%) |
| Total | 77 (100.0%) | 54 (100.0%) |
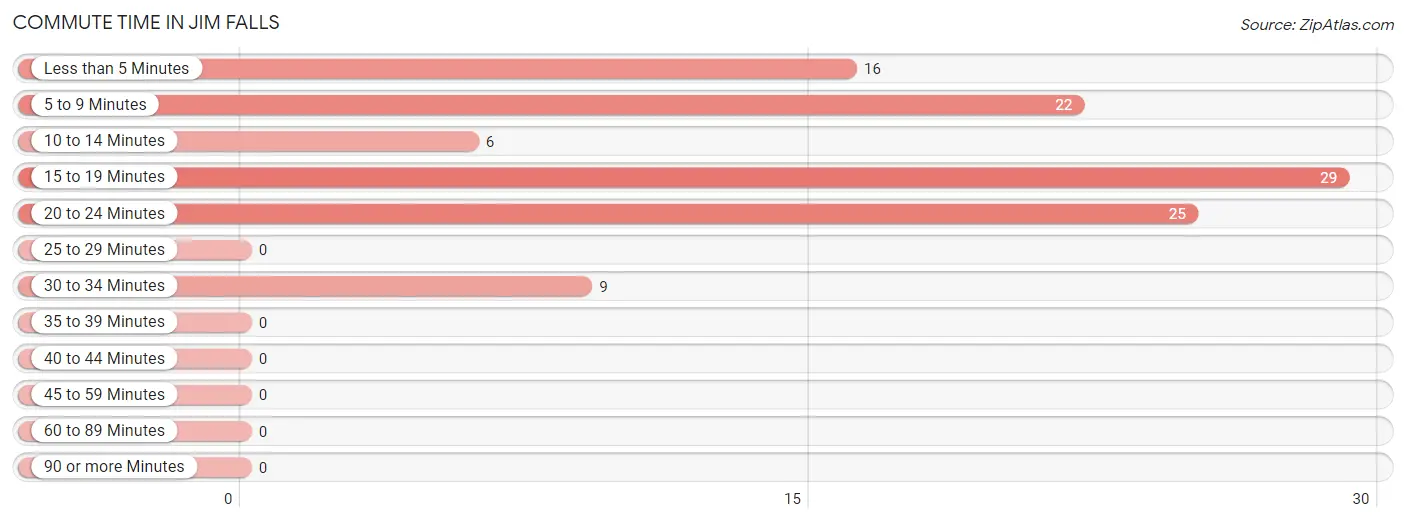
Commute Time in Jim Falls
The most frequently occuring commute durations in Jim Falls are 15 to 19 minutes (29 commuters, 27.1%), 20 to 24 minutes (25 commuters, 23.4%), and 5 to 9 minutes (22 commuters, 20.6%).
| Commute Time | # Commuters | % Commuters |
| Less than 5 Minutes | 16 | 14.9% |
| 5 to 9 Minutes | 22 | 20.6% |
| 10 to 14 Minutes | 6 | 5.6% |
| 15 to 19 Minutes | 29 | 27.1% |
| 20 to 24 Minutes | 25 | 23.4% |
| 25 to 29 Minutes | 0 | 0.0% |
| 30 to 34 Minutes | 9 | 8.4% |
| 35 to 39 Minutes | 0 | 0.0% |
| 40 to 44 Minutes | 0 | 0.0% |
| 45 to 59 Minutes | 0 | 0.0% |
| 60 to 89 Minutes | 0 | 0.0% |
| 90 or more Minutes | 0 | 0.0% |
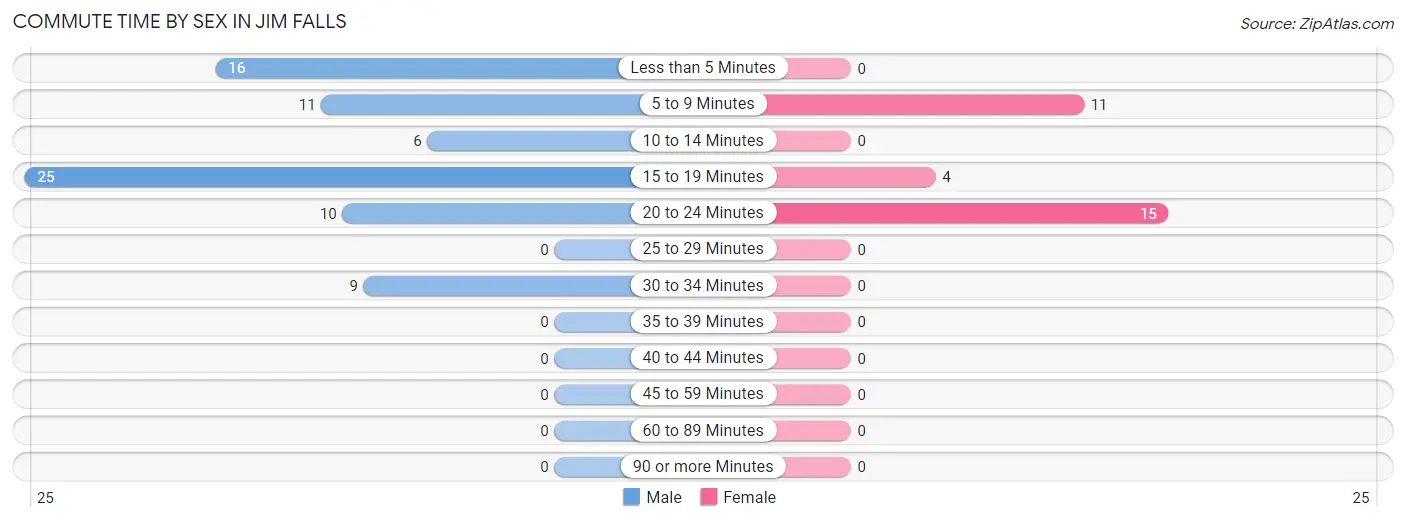
Commute Time by Sex in Jim Falls
The most common commute times in Jim Falls are 15 to 19 minutes (25 commuters, 32.5%) for males and 20 to 24 minutes (15 commuters, 50.0%) for females.
| Commute Time | Male | Female |
| Less than 5 Minutes | 16 (20.8%) | 0 (0.0%) |
| 5 to 9 Minutes | 11 (14.3%) | 11 (36.7%) |
| 10 to 14 Minutes | 6 (7.8%) | 0 (0.0%) |
| 15 to 19 Minutes | 25 (32.5%) | 4 (13.3%) |
| 20 to 24 Minutes | 10 (13.0%) | 15 (50.0%) |
| 25 to 29 Minutes | 0 (0.0%) | 0 (0.0%) |
| 30 to 34 Minutes | 9 (11.7%) | 0 (0.0%) |
| 35 to 39 Minutes | 0 (0.0%) | 0 (0.0%) |
| 40 to 44 Minutes | 0 (0.0%) | 0 (0.0%) |
| 45 to 59 Minutes | 0 (0.0%) | 0 (0.0%) |
| 60 to 89 Minutes | 0 (0.0%) | 0 (0.0%) |
| 90 or more Minutes | 0 (0.0%) | 0 (0.0%) |
Time of Departure to Work by Sex in Jim Falls
The most frequent times of departure to work in Jim Falls are 6:30 AM to 6:59 AM (26, 33.8%) for males and 9:00 AM to 9:59 AM (11, 36.7%) for females.
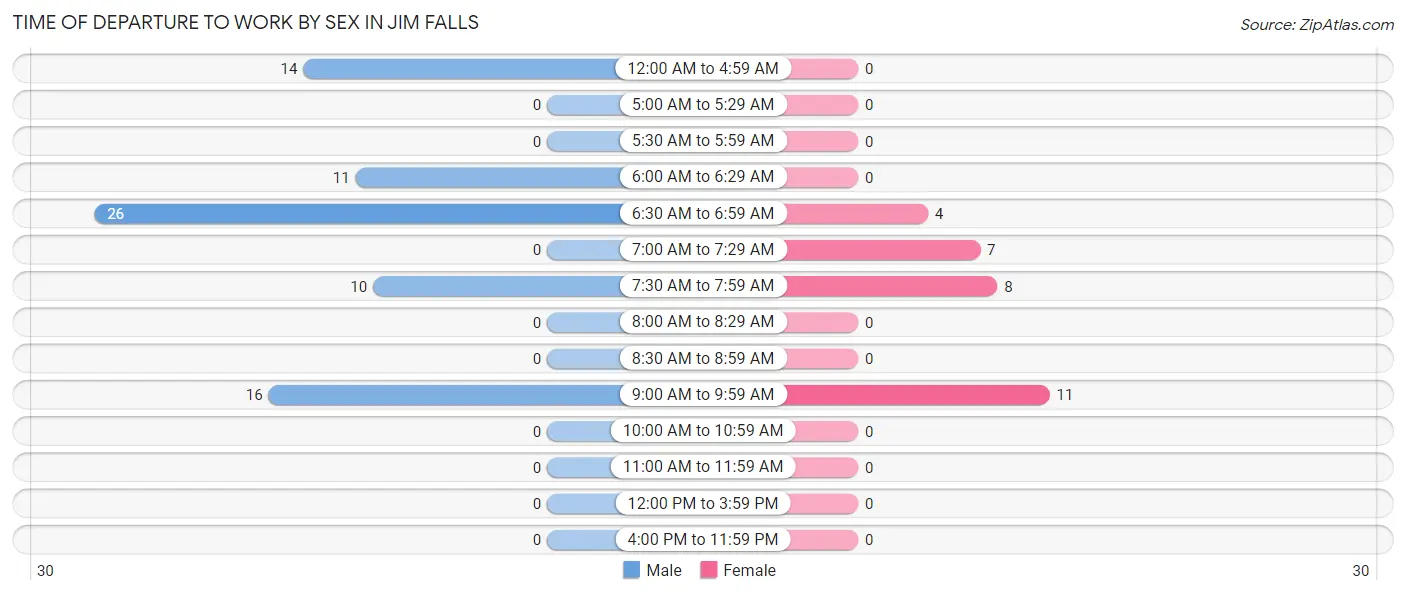
| Time of Departure | Male | Female |
| 12:00 AM to 4:59 AM | 14 (18.2%) | 0 (0.0%) |
| 5:00 AM to 5:29 AM | 0 (0.0%) | 0 (0.0%) |
| 5:30 AM to 5:59 AM | 0 (0.0%) | 0 (0.0%) |
| 6:00 AM to 6:29 AM | 11 (14.3%) | 0 (0.0%) |
| 6:30 AM to 6:59 AM | 26 (33.8%) | 4 (13.3%) |
| 7:00 AM to 7:29 AM | 0 (0.0%) | 7 (23.3%) |
| 7:30 AM to 7:59 AM | 10 (13.0%) | 8 (26.7%) |
| 8:00 AM to 8:29 AM | 0 (0.0%) | 0 (0.0%) |
| 8:30 AM to 8:59 AM | 0 (0.0%) | 0 (0.0%) |
| 9:00 AM to 9:59 AM | 16 (20.8%) | 11 (36.7%) |
| 10:00 AM to 10:59 AM | 0 (0.0%) | 0 (0.0%) |
| 11:00 AM to 11:59 AM | 0 (0.0%) | 0 (0.0%) |
| 12:00 PM to 3:59 PM | 0 (0.0%) | 0 (0.0%) |
| 4:00 PM to 11:59 PM | 0 (0.0%) | 0 (0.0%) |
| Total | 77 (100.0%) | 30 (100.0%) |
Housing Occupancy in Jim Falls
Occupancy by Ownership in Jim Falls
Of the total 114 dwellings in Jim Falls, owner-occupied units account for 69 (60.5%), while renter-occupied units make up 45 (39.5%).
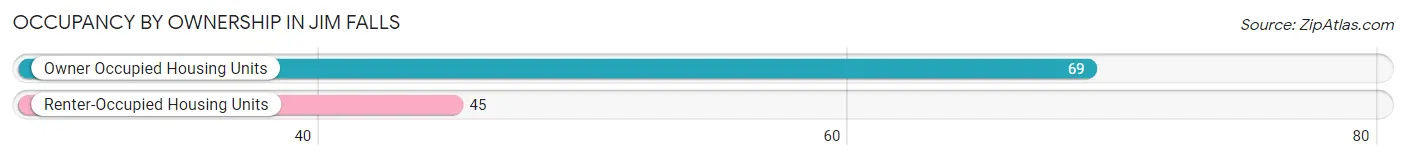
| Occupancy | # Housing Units | % Housing Units |
| Owner Occupied Housing Units | 69 | 60.5% |
| Renter-Occupied Housing Units | 45 | 39.5% |
| Total Occupied Housing Units | 114 | 100.0% |
Occupancy by Household Size in Jim Falls
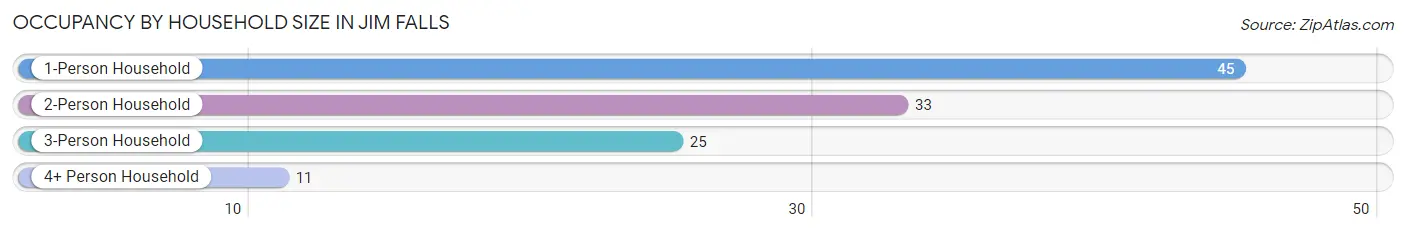
| Household Size | # Housing Units | % Housing Units |
| 1-Person Household | 45 | 39.5% |
| 2-Person Household | 33 | 28.9% |
| 3-Person Household | 25 | 21.9% |
| 4+ Person Household | 11 | 9.7% |
| Total Housing Units | 114 | 100.0% |
Occupancy by Ownership by Household Size in Jim Falls
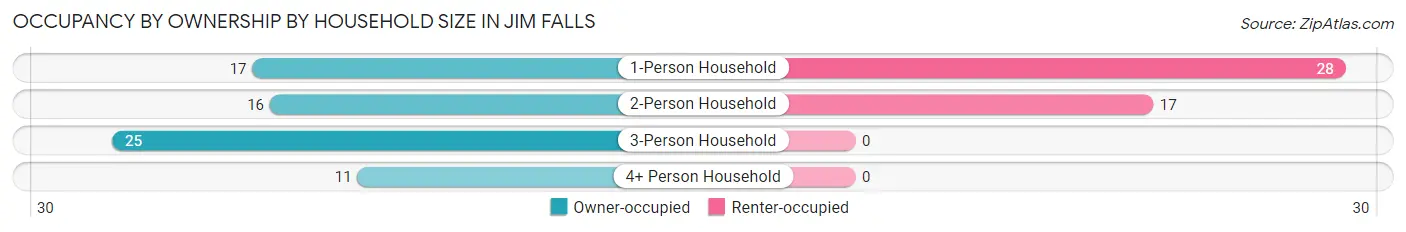
| Household Size | Owner-occupied | Renter-occupied |
| 1-Person Household | 17 (37.8%) | 28 (62.2%) |
| 2-Person Household | 16 (48.5%) | 17 (51.5%) |
| 3-Person Household | 25 (100.0%) | 0 (0.0%) |
| 4+ Person Household | 11 (100.0%) | 0 (0.0%) |
| Total Housing Units | 69 (60.5%) | 45 (39.5%) |
Occupancy by Educational Attainment in Jim Falls
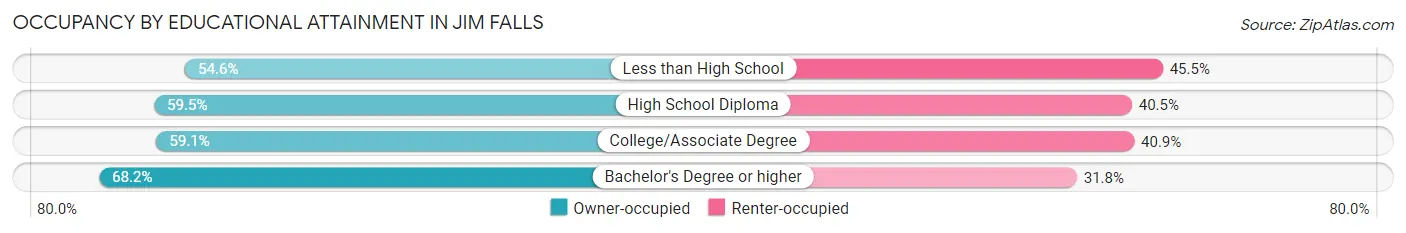
| Household Size | Owner-occupied | Renter-occupied |
| Less than High School | 6 (54.5%) | 5 (45.5%) |
| High School Diploma | 22 (59.5%) | 15 (40.5%) |
| College/Associate Degree | 26 (59.1%) | 18 (40.9%) |
| Bachelor's Degree or higher | 15 (68.2%) | 7 (31.8%) |
Occupancy by Age of Householder in Jim Falls
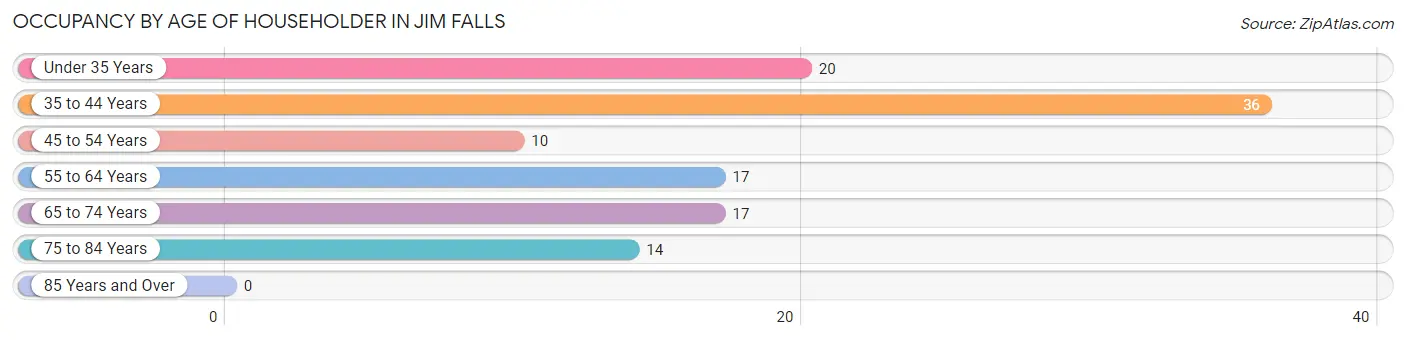
| Age Bracket | # Households | % Households |
| Under 35 Years | 20 | 17.5% |
| 35 to 44 Years | 36 | 31.6% |
| 45 to 54 Years | 10 | 8.8% |
| 55 to 64 Years | 17 | 14.9% |
| 65 to 74 Years | 17 | 14.9% |
| 75 to 84 Years | 14 | 12.3% |
| 85 Years and Over | 0 | 0.0% |
| Total | 114 | 100.0% |
Housing Finances in Jim Falls
Median Income by Occupancy in Jim Falls
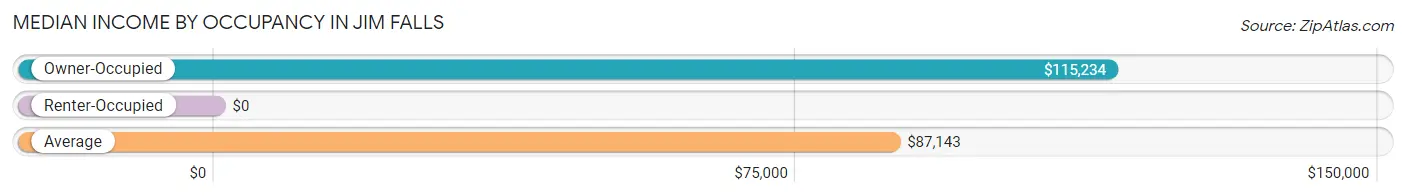
| Occupancy Type | # Households | Median Income |
| Owner-Occupied | 69 (60.5%) | $115,234 |
| Renter-Occupied | 45 (39.5%) | $0 |
| Average | 114 (100.0%) | $87,143 |
Occupancy by Householder Income Bracket in Jim Falls
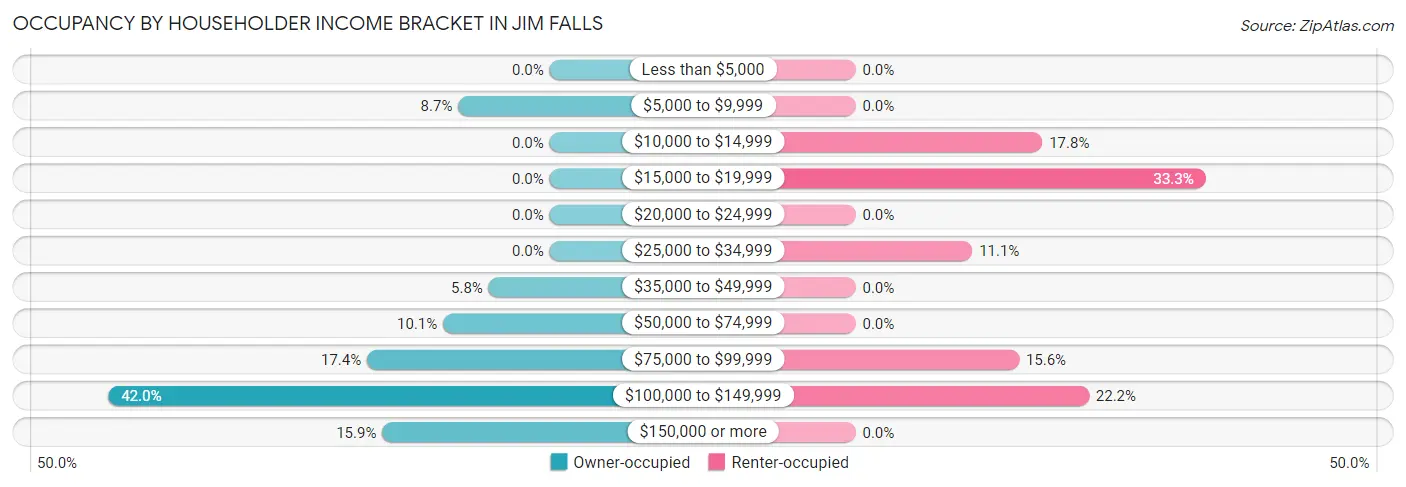
| Income Bracket | Owner-occupied | Renter-occupied |
| Less than $5,000 | 0 (0.0%) | 0 (0.0%) |
| $5,000 to $9,999 | 6 (8.7%) | 0 (0.0%) |
| $10,000 to $14,999 | 0 (0.0%) | 8 (17.8%) |
| $15,000 to $19,999 | 0 (0.0%) | 15 (33.3%) |
| $20,000 to $24,999 | 0 (0.0%) | 0 (0.0%) |
| $25,000 to $34,999 | 0 (0.0%) | 5 (11.1%) |
| $35,000 to $49,999 | 4 (5.8%) | 0 (0.0%) |
| $50,000 to $74,999 | 7 (10.1%) | 0 (0.0%) |
| $75,000 to $99,999 | 12 (17.4%) | 7 (15.6%) |
| $100,000 to $149,999 | 29 (42.0%) | 10 (22.2%) |
| $150,000 or more | 11 (15.9%) | 0 (0.0%) |
| Total | 69 (100.0%) | 45 (100.0%) |
Monthly Housing Cost Tiers in Jim Falls
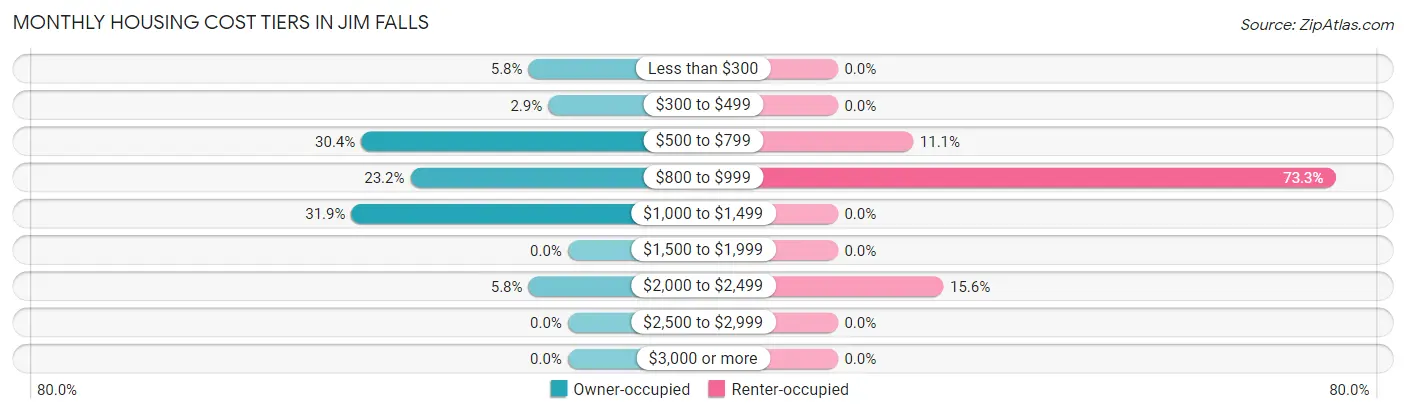
| Monthly Cost | Owner-occupied | Renter-occupied |
| Less than $300 | 4 (5.8%) | 0 (0.0%) |
| $300 to $499 | 2 (2.9%) | 0 (0.0%) |
| $500 to $799 | 21 (30.4%) | 5 (11.1%) |
| $800 to $999 | 16 (23.2%) | 33 (73.3%) |
| $1,000 to $1,499 | 22 (31.9%) | 0 (0.0%) |
| $1,500 to $1,999 | 0 (0.0%) | 0 (0.0%) |
| $2,000 to $2,499 | 4 (5.8%) | 7 (15.6%) |
| $2,500 to $2,999 | 0 (0.0%) | 0 (0.0%) |
| $3,000 or more | 0 (0.0%) | 0 (0.0%) |
| Total | 69 (100.0%) | 45 (100.0%) |
Physical Housing Characteristics in Jim Falls
Housing Structures in Jim Falls
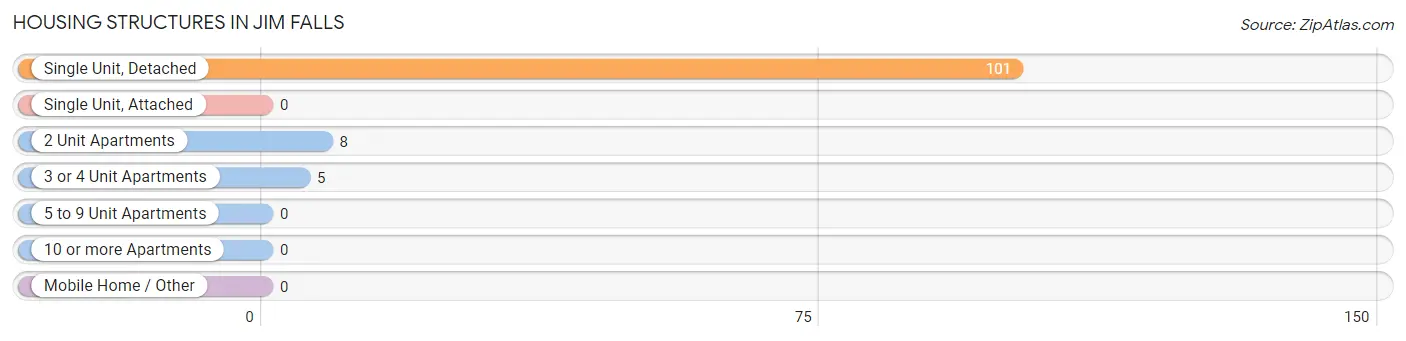
| Structure Type | # Housing Units | % Housing Units |
| Single Unit, Detached | 101 | 88.6% |
| Single Unit, Attached | 0 | 0.0% |
| 2 Unit Apartments | 8 | 7.0% |
| 3 or 4 Unit Apartments | 5 | 4.4% |
| 5 to 9 Unit Apartments | 0 | 0.0% |
| 10 or more Apartments | 0 | 0.0% |
| Mobile Home / Other | 0 | 0.0% |
| Total | 114 | 100.0% |
Housing Structures by Occupancy in Jim Falls
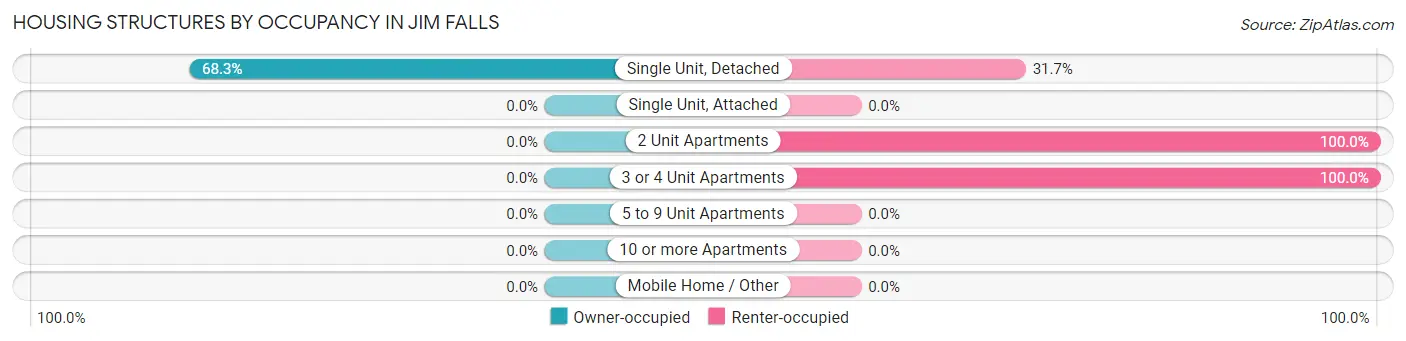
| Structure Type | Owner-occupied | Renter-occupied |
| Single Unit, Detached | 69 (68.3%) | 32 (31.7%) |
| Single Unit, Attached | 0 (0.0%) | 0 (0.0%) |
| 2 Unit Apartments | 0 (0.0%) | 8 (100.0%) |
| 3 or 4 Unit Apartments | 0 (0.0%) | 5 (100.0%) |
| 5 to 9 Unit Apartments | 0 (0.0%) | 0 (0.0%) |
| 10 or more Apartments | 0 (0.0%) | 0 (0.0%) |
| Mobile Home / Other | 0 (0.0%) | 0 (0.0%) |
| Total | 69 (60.5%) | 45 (39.5%) |
Housing Structures by Number of Rooms in Jim Falls
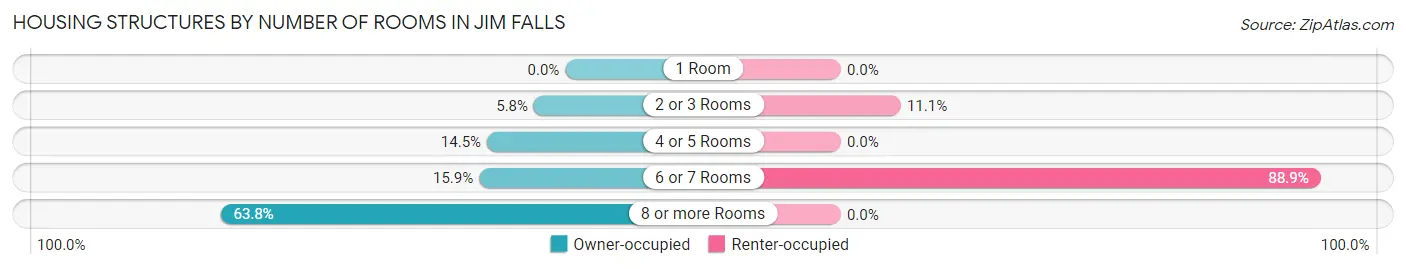
| Number of Rooms | Owner-occupied | Renter-occupied |
| 1 Room | 0 (0.0%) | 0 (0.0%) |
| 2 or 3 Rooms | 4 (5.8%) | 5 (11.1%) |
| 4 or 5 Rooms | 10 (14.5%) | 0 (0.0%) |
| 6 or 7 Rooms | 11 (15.9%) | 40 (88.9%) |
| 8 or more Rooms | 44 (63.8%) | 0 (0.0%) |
| Total | 69 (100.0%) | 45 (100.0%) |
Housing Structure by Heating Type in Jim Falls
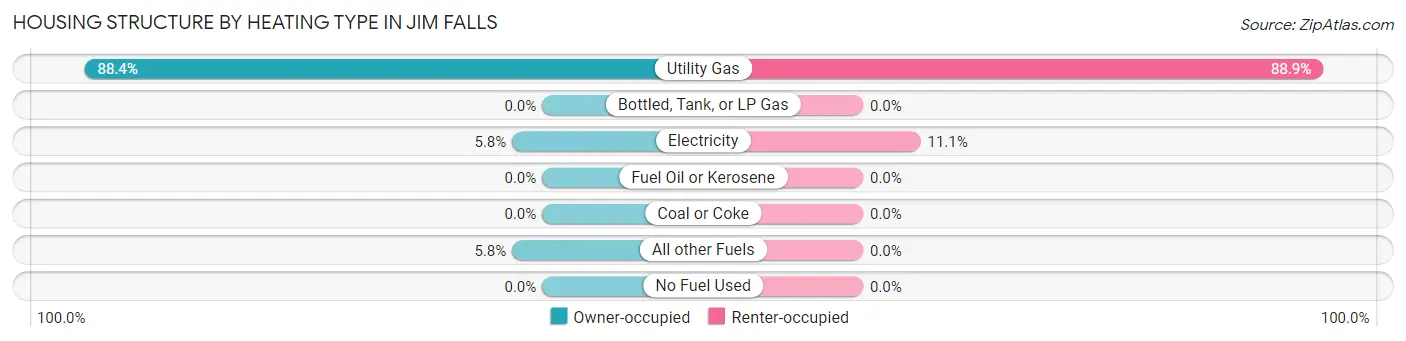
| Heating Type | Owner-occupied | Renter-occupied |
| Utility Gas | 61 (88.4%) | 40 (88.9%) |
| Bottled, Tank, or LP Gas | 0 (0.0%) | 0 (0.0%) |
| Electricity | 4 (5.8%) | 5 (11.1%) |
| Fuel Oil or Kerosene | 0 (0.0%) | 0 (0.0%) |
| Coal or Coke | 0 (0.0%) | 0 (0.0%) |
| All other Fuels | 4 (5.8%) | 0 (0.0%) |
| No Fuel Used | 0 (0.0%) | 0 (0.0%) |
| Total | 69 (100.0%) | 45 (100.0%) |
Household Vehicle Usage in Jim Falls
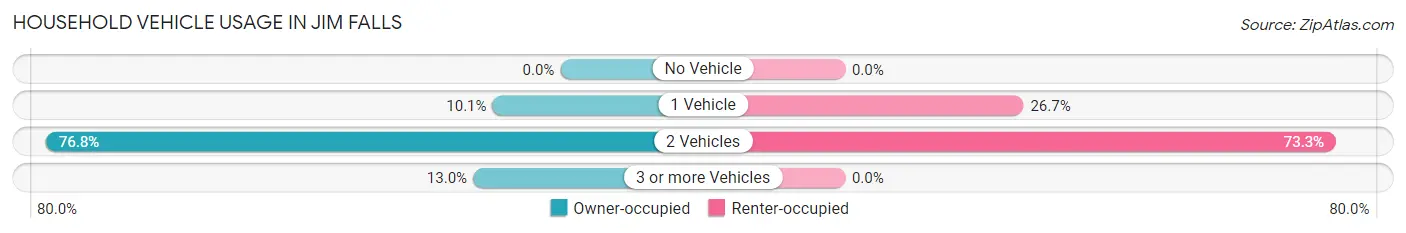
| Vehicles per Household | Owner-occupied | Renter-occupied |
| No Vehicle | 0 (0.0%) | 0 (0.0%) |
| 1 Vehicle | 7 (10.1%) | 12 (26.7%) |
| 2 Vehicles | 53 (76.8%) | 33 (73.3%) |
| 3 or more Vehicles | 9 (13.0%) | 0 (0.0%) |
| Total | 69 (100.0%) | 45 (100.0%) |
Real Estate & Mortgages in Jim Falls
Real Estate and Mortgage Overview in Jim Falls
| Characteristic | Without Mortgage | With Mortgage |
| Housing Units | 17 | 52 |
| Median Property Value | $270,500 | $163,800 |
| Median Household Income | $153,068 | $0 |
| Monthly Housing Costs | $623 | $0 |
| Real Estate Taxes | $2,346 | $0 |
Property Value by Mortgage Status in Jim Falls
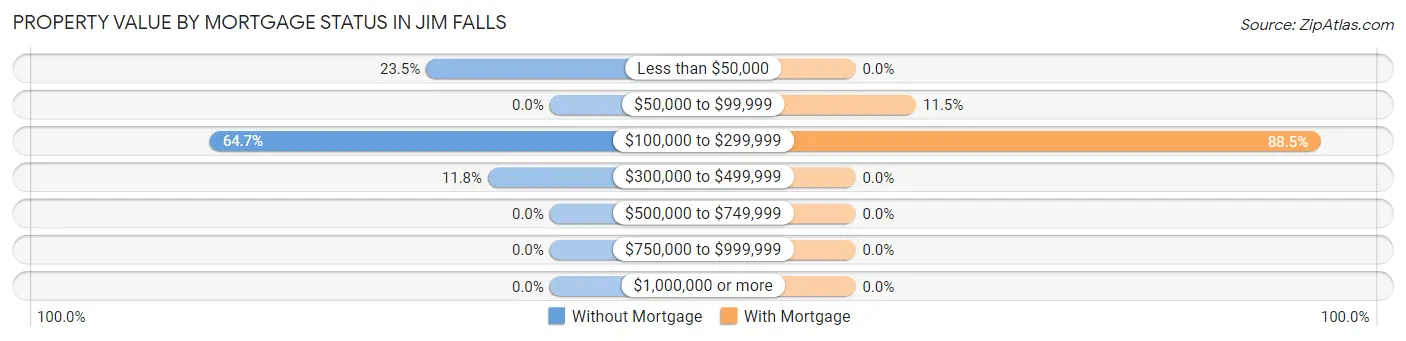
| Property Value | Without Mortgage | With Mortgage |
| Less than $50,000 | 4 (23.5%) | 0 (0.0%) |
| $50,000 to $99,999 | 0 (0.0%) | 6 (11.5%) |
| $100,000 to $299,999 | 11 (64.7%) | 46 (88.5%) |
| $300,000 to $499,999 | 2 (11.8%) | 0 (0.0%) |
| $500,000 to $749,999 | 0 (0.0%) | 0 (0.0%) |
| $750,000 to $999,999 | 0 (0.0%) | 0 (0.0%) |
| $1,000,000 or more | 0 (0.0%) | 0 (0.0%) |
| Total | 17 (100.0%) | 52 (100.0%) |
Household Income by Mortgage Status in Jim Falls
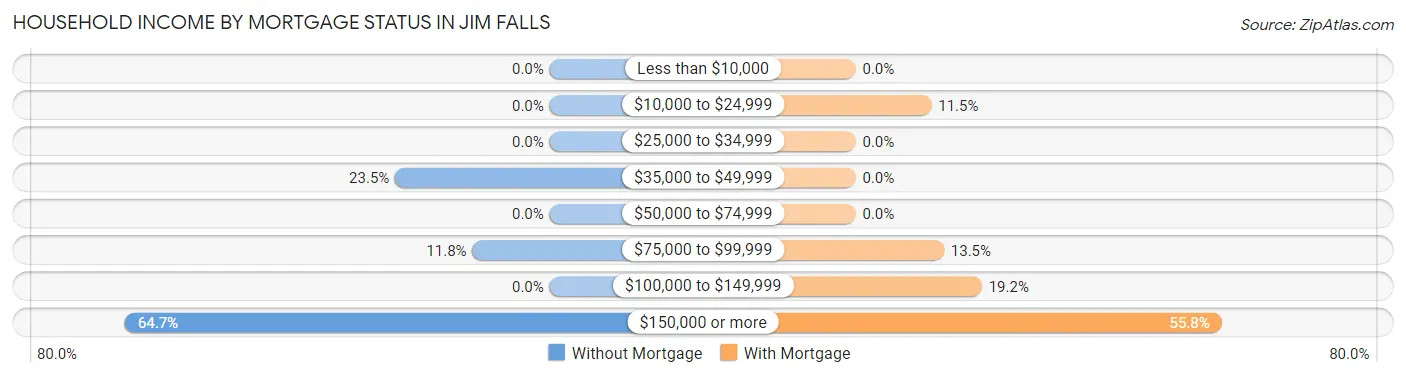
| Household Income | Without Mortgage | With Mortgage |
| Less than $10,000 | 0 (0.0%) | 0 (0.0%) |
| $10,000 to $24,999 | 0 (0.0%) | 6 (11.5%) |
| $25,000 to $34,999 | 0 (0.0%) | 0 (0.0%) |
| $35,000 to $49,999 | 4 (23.5%) | 0 (0.0%) |
| $50,000 to $74,999 | 0 (0.0%) | 0 (0.0%) |
| $75,000 to $99,999 | 2 (11.8%) | 7 (13.5%) |
| $100,000 to $149,999 | 0 (0.0%) | 10 (19.2%) |
| $150,000 or more | 11 (64.7%) | 29 (55.8%) |
| Total | 17 (100.0%) | 52 (100.0%) |
Property Value to Household Income Ratio in Jim Falls
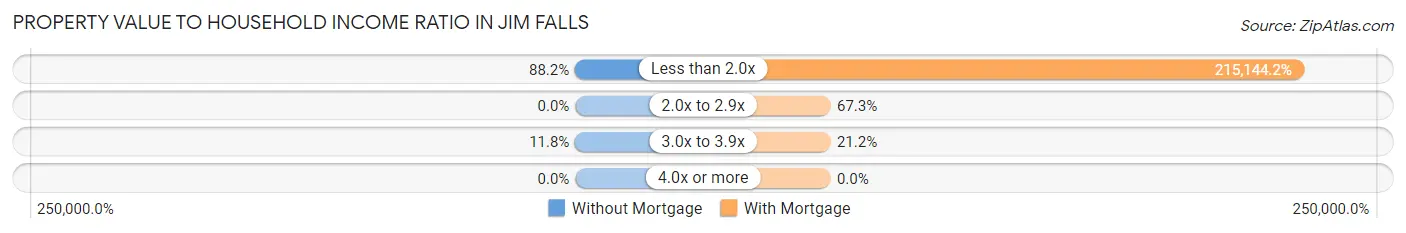
| Value-to-Income Ratio | Without Mortgage | With Mortgage |
| Less than 2.0x | 15 (88.2%) | 111,875 (215,144.2%) |
| 2.0x to 2.9x | 0 (0.0%) | 35 (67.3%) |
| 3.0x to 3.9x | 2 (11.8%) | 11 (21.1%) |
| 4.0x or more | 0 (0.0%) | 0 (0.0%) |
| Total | 17 (100.0%) | 52 (100.0%) |
Real Estate Taxes by Mortgage Status in Jim Falls
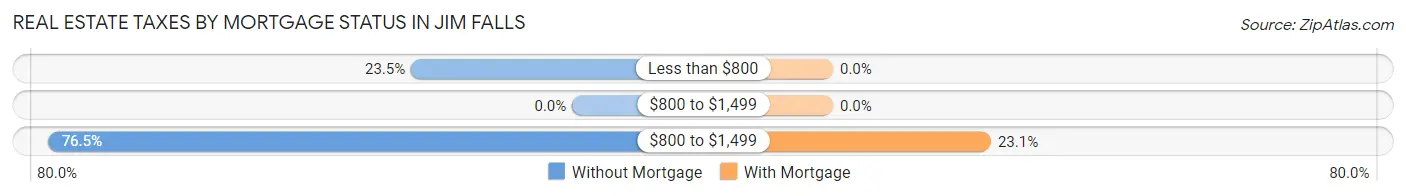
| Property Taxes | Without Mortgage | With Mortgage |
| Less than $800 | 4 (23.5%) | 0 (0.0%) |
| $800 to $1,499 | 0 (0.0%) | 0 (0.0%) |
| $800 to $1,499 | 13 (76.5%) | 12 (23.1%) |
| Total | 17 (100.0%) | 52 (100.0%) |
Health & Disability in Jim Falls
Health Insurance Coverage by Age in Jim Falls
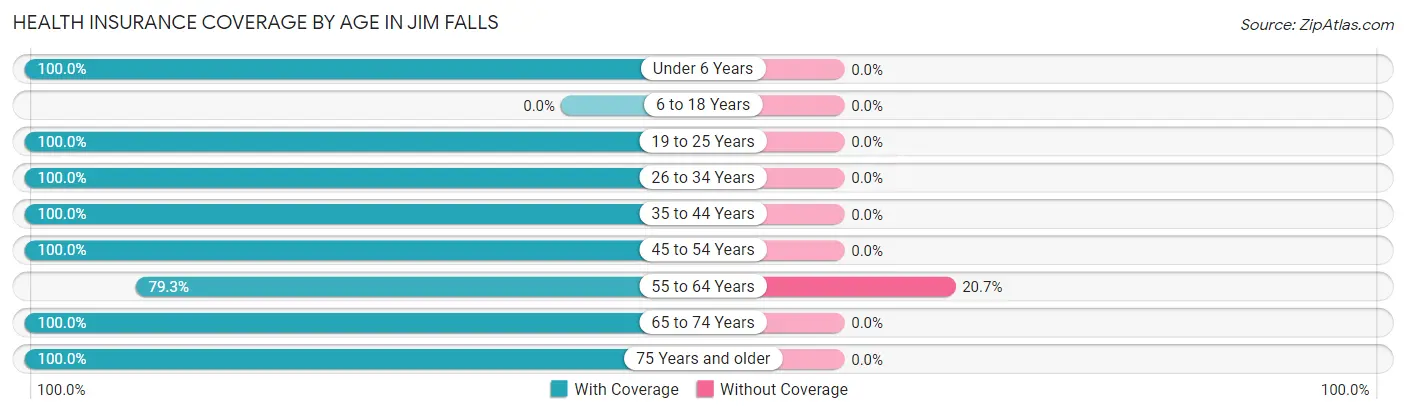
| Age Bracket | With Coverage | Without Coverage |
| Under 6 Years | 43 (100.0%) | 0 (0.0%) |
| 6 to 18 Years | 0 (0.0%) | 0 (0.0%) |
| 19 to 25 Years | 8 (100.0%) | 0 (0.0%) |
| 26 to 34 Years | 31 (100.0%) | 0 (0.0%) |
| 35 to 44 Years | 60 (100.0%) | 0 (0.0%) |
| 45 to 54 Years | 10 (100.0%) | 0 (0.0%) |
| 55 to 64 Years | 23 (79.3%) | 6 (20.7%) |
| 65 to 74 Years | 24 (100.0%) | 0 (0.0%) |
| 75 Years and older | 14 (100.0%) | 0 (0.0%) |
| Total | 213 (97.3%) | 6 (2.7%) |
Health Insurance Coverage by Citizenship Status in Jim Falls
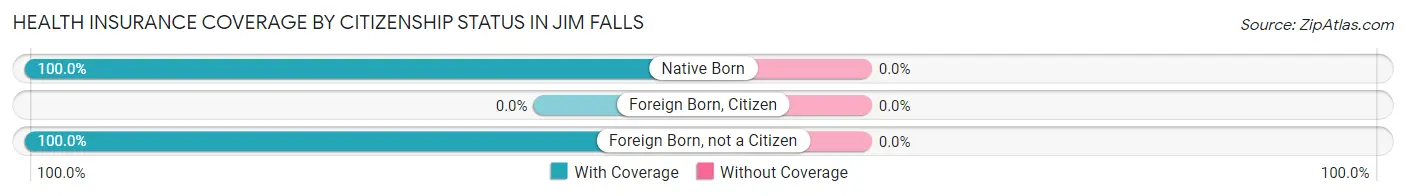
| Citizenship Status | With Coverage | Without Coverage |
| Native Born | 43 (100.0%) | 0 (0.0%) |
| Foreign Born, Citizen | 0 (0.0%) | 0 (0.0%) |
| Foreign Born, not a Citizen | 8 (100.0%) | 0 (0.0%) |
Health Insurance Coverage by Household Income in Jim Falls
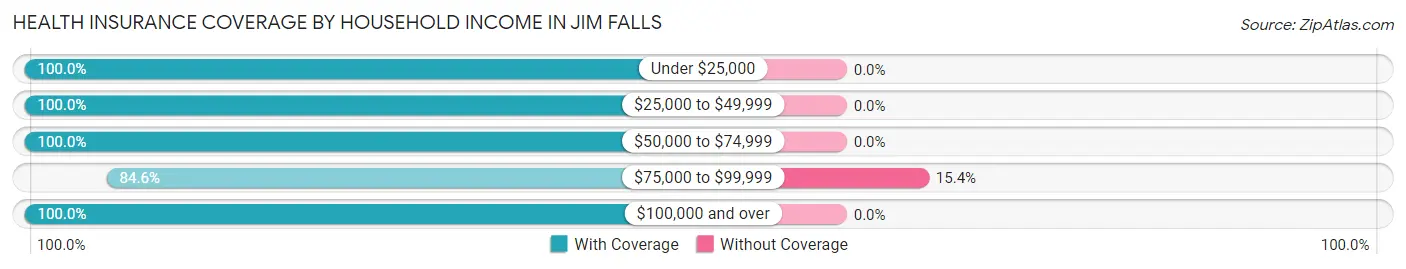
| Household Income | With Coverage | Without Coverage |
| Under $25,000 | 29 (100.0%) | 0 (0.0%) |
| $25,000 to $49,999 | 13 (100.0%) | 0 (0.0%) |
| $50,000 to $74,999 | 7 (100.0%) | 0 (0.0%) |
| $75,000 to $99,999 | 33 (84.6%) | 6 (15.4%) |
| $100,000 and over | 131 (100.0%) | 0 (0.0%) |
Public vs Private Health Insurance Coverage by Age in Jim Falls
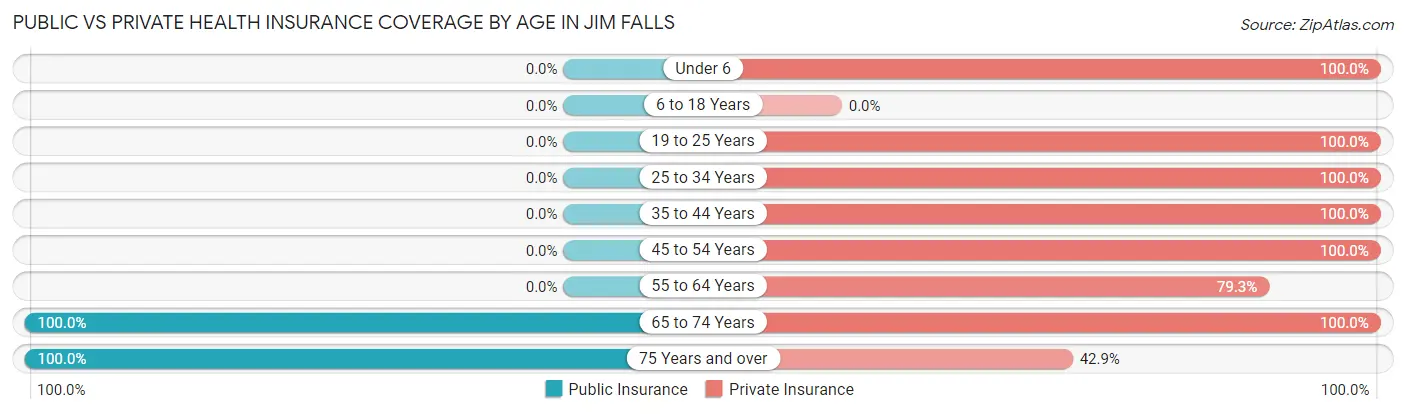
| Age Bracket | Public Insurance | Private Insurance |
| Under 6 | 0 (0.0%) | 43 (100.0%) |
| 6 to 18 Years | 0 (0.0%) | 0 (0.0%) |
| 19 to 25 Years | 0 (0.0%) | 8 (100.0%) |
| 25 to 34 Years | 0 (0.0%) | 31 (100.0%) |
| 35 to 44 Years | 0 (0.0%) | 60 (100.0%) |
| 45 to 54 Years | 0 (0.0%) | 10 (100.0%) |
| 55 to 64 Years | 0 (0.0%) | 23 (79.3%) |
| 65 to 74 Years | 24 (100.0%) | 24 (100.0%) |
| 75 Years and over | 14 (100.0%) | 6 (42.9%) |
| Total | 38 (17.3%) | 205 (93.6%) |
Disability Status by Sex by Age in Jim Falls
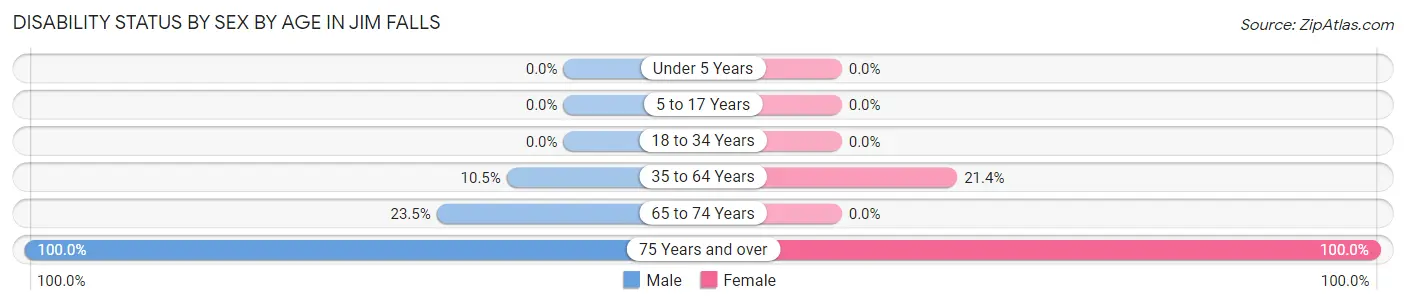
| Age Bracket | Male | Female |
| Under 5 Years | 0 (0.0%) | 0 (0.0%) |
| 5 to 17 Years | 0 (0.0%) | 0 (0.0%) |
| 18 to 34 Years | 0 (0.0%) | 0 (0.0%) |
| 35 to 64 Years | 6 (10.5%) | 9 (21.4%) |
| 65 to 74 Years | 4 (23.5%) | 0 (0.0%) |
| 75 Years and over | 8 (100.0%) | 6 (100.0%) |
Disability Class by Sex by Age in Jim Falls
Disability Class: Hearing Difficulty
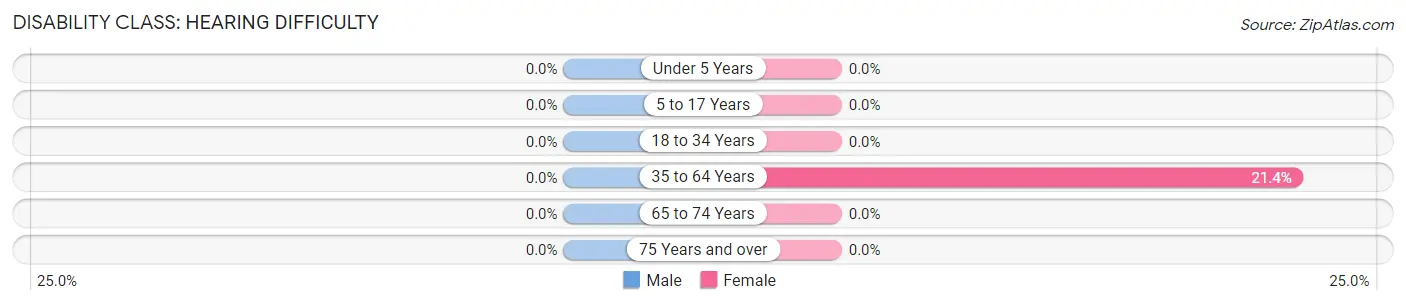
| Age Bracket | Male | Female |
| Under 5 Years | 0 (0.0%) | 0 (0.0%) |
| 5 to 17 Years | 0 (0.0%) | 0 (0.0%) |
| 18 to 34 Years | 0 (0.0%) | 0 (0.0%) |
| 35 to 64 Years | 0 (0.0%) | 9 (21.4%) |
| 65 to 74 Years | 0 (0.0%) | 0 (0.0%) |
| 75 Years and over | 0 (0.0%) | 0 (0.0%) |
Disability Class: Vision Difficulty
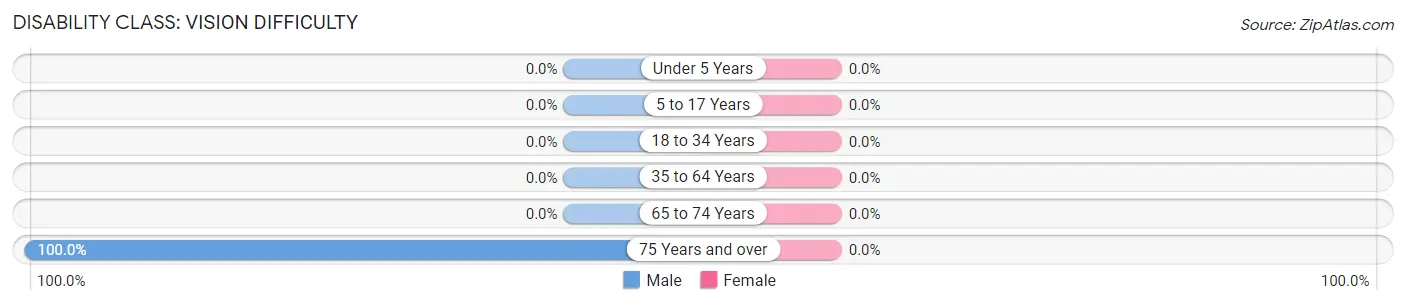
| Age Bracket | Male | Female |
| Under 5 Years | 0 (0.0%) | 0 (0.0%) |
| 5 to 17 Years | 0 (0.0%) | 0 (0.0%) |
| 18 to 34 Years | 0 (0.0%) | 0 (0.0%) |
| 35 to 64 Years | 0 (0.0%) | 0 (0.0%) |
| 65 to 74 Years | 0 (0.0%) | 0 (0.0%) |
| 75 Years and over | 8 (100.0%) | 0 (0.0%) |
Disability Class: Cognitive Difficulty
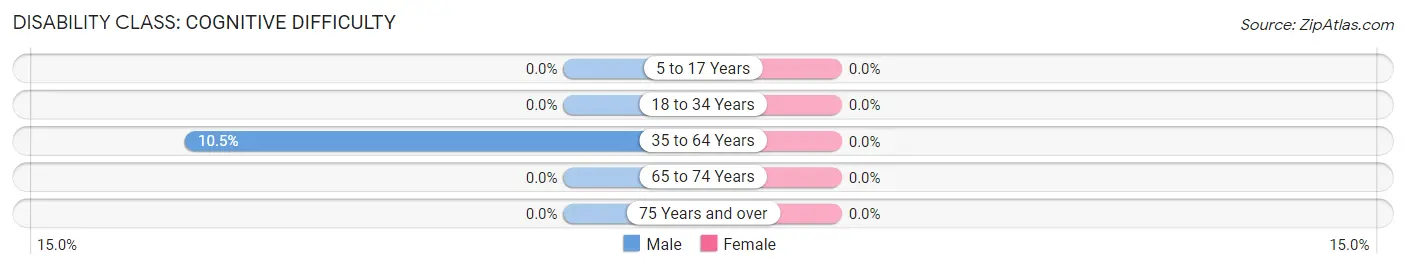
| Age Bracket | Male | Female |
| 5 to 17 Years | 0 (0.0%) | 0 (0.0%) |
| 18 to 34 Years | 0 (0.0%) | 0 (0.0%) |
| 35 to 64 Years | 6 (10.5%) | 0 (0.0%) |
| 65 to 74 Years | 0 (0.0%) | 0 (0.0%) |
| 75 Years and over | 0 (0.0%) | 0 (0.0%) |
Disability Class: Ambulatory Difficulty
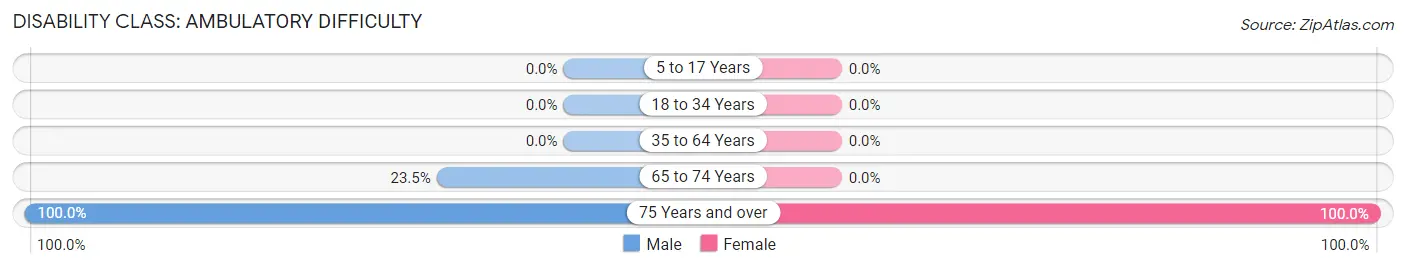
| Age Bracket | Male | Female |
| 5 to 17 Years | 0 (0.0%) | 0 (0.0%) |
| 18 to 34 Years | 0 (0.0%) | 0 (0.0%) |
| 35 to 64 Years | 0 (0.0%) | 0 (0.0%) |
| 65 to 74 Years | 4 (23.5%) | 0 (0.0%) |
| 75 Years and over | 8 (100.0%) | 6 (100.0%) |
Disability Class: Self-Care Difficulty
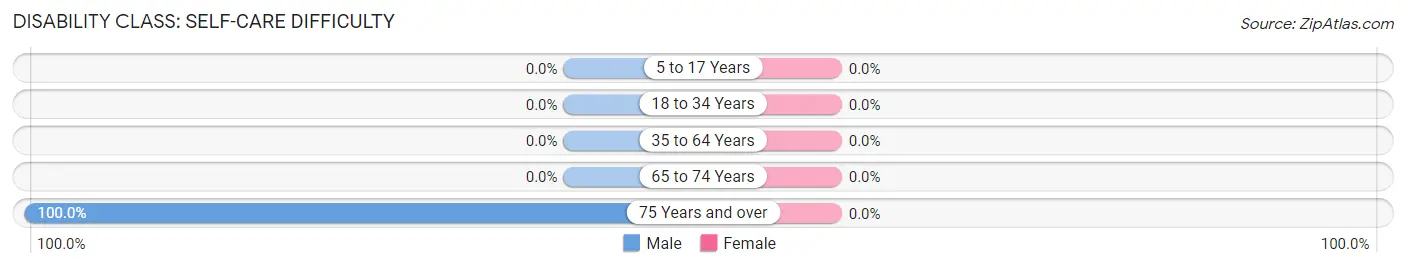
| Age Bracket | Male | Female |
| 5 to 17 Years | 0 (0.0%) | 0 (0.0%) |
| 18 to 34 Years | 0 (0.0%) | 0 (0.0%) |
| 35 to 64 Years | 0 (0.0%) | 0 (0.0%) |
| 65 to 74 Years | 0 (0.0%) | 0 (0.0%) |
| 75 Years and over | 8 (100.0%) | 0 (0.0%) |
Technology Access in Jim Falls
Computing Device Access in Jim Falls
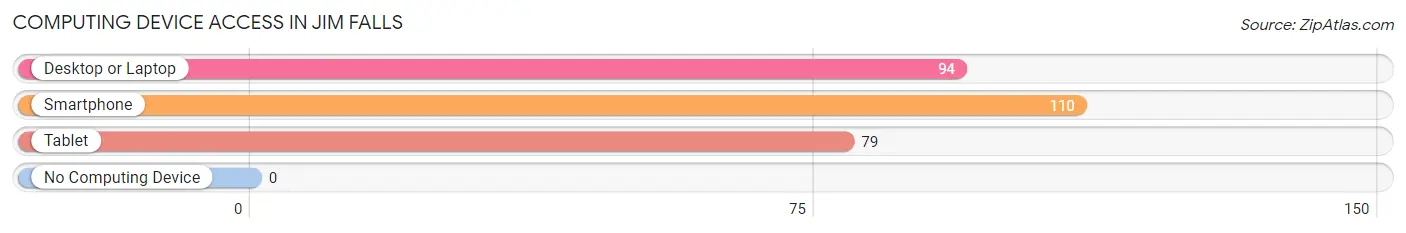
| Device Type | # Households | % Households |
| Desktop or Laptop | 94 | 82.5% |
| Smartphone | 110 | 96.5% |
| Tablet | 79 | 69.3% |
| No Computing Device | 0 | 0.0% |
| Total | 114 | 100.0% |
Internet Access in Jim Falls
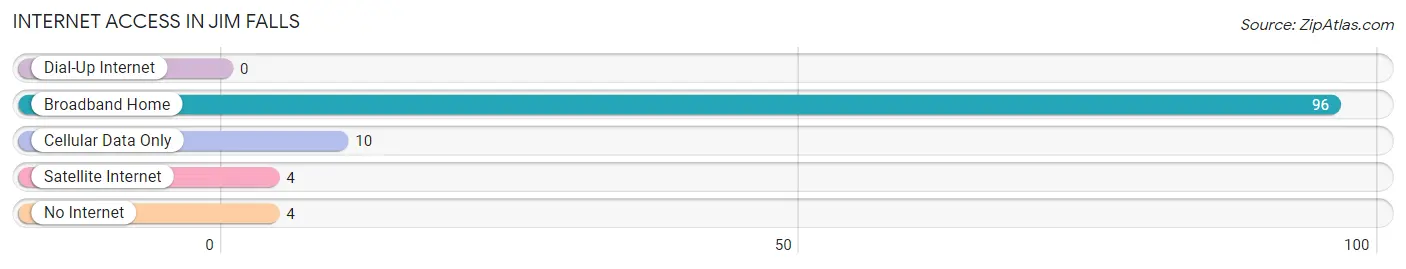
| Internet Type | # Households | % Households |
| Dial-Up Internet | 0 | 0.0% |
| Broadband Home | 96 | 84.2% |
| Cellular Data Only | 10 | 8.8% |
| Satellite Internet | 4 | 3.5% |
| No Internet | 4 | 3.5% |
| Total | 114 | 100.0% |
Jim Falls Summary
History
Jim Falls is a small unincorporated community located in Chippewa County, Wisconsin. It is situated on the Chippewa River, approximately 10 miles east of Chippewa Falls. The area was first settled in the late 1800s by a group of lumberjacks who were attracted to the area by the abundance of timber. The town was named after James “Jim” Falls, a local lumberjack who was instrumental in the development of the area.
The town of Jim Falls was officially incorporated in 1891. At the time, the town was a bustling lumber town with a population of over 500 people. The town was home to several sawmills, a grist mill, a blacksmith shop, a general store, and a post office. The town also had a school, a church, and a hotel.
The town’s economy was heavily dependent on the lumber industry, and when the timber ran out in the early 1900s, the town’s population began to decline. By the 1950s, the population had dropped to just over 200 people.
Geography
Jim Falls is located in Chippewa County, Wisconsin. It is situated on the Chippewa River, approximately 10 miles east of Chippewa Falls. The town is located in a rural area, surrounded by rolling hills and farmland. The town is located on the edge of the Chippewa National Forest, which provides a variety of recreational opportunities.
The town is located at an elevation of 890 feet above sea level. The climate is characterized by cold, snowy winters and warm, humid summers. The average annual temperature is around 40 degrees Fahrenheit.
Economy
The economy of Jim Falls is largely based on agriculture and tourism. The town is home to several small farms, which produce a variety of crops, including corn, soybeans, and hay. The town is also home to several small businesses, including a general store, a restaurant, and a gas station.
The town is also a popular tourist destination, due to its proximity to the Chippewa National Forest and the Chippewa River. The town is home to several campgrounds, as well as a variety of outdoor activities, such as fishing, hunting, and hiking.
Demographics
As of the 2010 census, the population of Jim Falls was 545 people. The racial makeup of the town was 97.3% White, 0.2% African American, 0.2% Native American, 0.4% Asian, 0.2% from other races, and 1.9% from two or more races. Hispanic or Latino of any race were 0.7% of the population.
The median household income in Jim Falls was $41,250, and the median family income was $45,833. The per capita income was $19,945. About 8.3% of families and 10.2% of the population were below the poverty line, including 14.3% of those under age 18 and 6.3% of those age 65 or over.
Common Questions
What is Per Capita Income in Jim Falls?
Per Capita income in Jim Falls is $41,573.
What is the Median Family Income in Jim Falls?
Median Family Income in Jim Falls is $115,547.
What is the Median Household income in Jim Falls?
Median Household Income in Jim Falls is $87,143.
What is Income or Wage Gap in Jim Falls?
Income or Wage Gap in Jim Falls is 48.2%.
Women in Jim Falls earn 51.8 cents for every dollar earned by a man.
What is Inequality or Gini Index in Jim Falls?
Inequality or Gini Index in Jim Falls is 0.34.
What is the Total Population of Jim Falls?
Total Population of Jim Falls is 219.
What is the Total Male Population of Jim Falls?
Total Male Population of Jim Falls is 131.
What is the Total Female Population of Jim Falls?
Total Female Population of Jim Falls is 88.
What is the Ratio of Males per 100 Females in Jim Falls?
There are 148.86 Males per 100 Females in Jim Falls.
What is the Ratio of Females per 100 Males in Jim Falls?
There are 67.18 Females per 100 Males in Jim Falls.
What is the Median Population Age in Jim Falls?
Median Population Age in Jim Falls is 40.6 Years.
What is the Average Family Size in Jim Falls
Average Family Size in Jim Falls is 2.5 People.
What is the Average Household Size in Jim Falls
Average Household Size in Jim Falls is 1.9 People.
How Large is the Labor Force in Jim Falls?
There are 131 People in the Labor Forcein in Jim Falls.
What is the Percentage of People in the Labor Force in Jim Falls?
74.4% of People are in the Labor Force in Jim Falls.