Jackson, WI Map & Demographics
Jackson Map
Jackson Overview
$45,384
PER CAPITA INCOME
$102,312
AVG FAMILY INCOME
$94,621
AVG HOUSEHOLD INCOME
22.1%
WAGE / INCOME GAP [ % ]
77.9¢/ $1
WAGE / INCOME GAP [ $ ]
0.33
INEQUALITY / GINI INDEX
7,814
TOTAL POPULATION
3,969
MALE POPULATION
3,845
FEMALE POPULATION
103.22
MALES / 100 FEMALES
96.88
FEMALES / 100 MALES
41.4
MEDIAN AGE
2.7
AVG FAMILY SIZE
2.2
AVG HOUSEHOLD SIZE
4,781
LABOR FORCE [ PEOPLE ]
73.9%
PERCENT IN LABOR FORCE
5.9%
UNEMPLOYMENT RATE
Jackson Zip Codes
Jackson Area Codes
Income in Jackson
Income Overview in Jackson
Per Capita Income in Jackson is $45,384, while median incomes of families and households are $102,312 and $94,621 respectively.
| Characteristic | Number | Measure |
| Per Capita Income | 7,814 | $45,384 |
| Median Family Income | 2,139 | $102,312 |
| Mean Family Income | 2,139 | $117,166 |
| Median Household Income | 3,505 | $94,621 |
| Mean Household Income | 3,505 | $100,608 |
| Income Deficit | 2,139 | $0 |
| Wage / Income Gap (%) | 7,814 | 22.10% |
| Wage / Income Gap ($) | 7,814 | 77.90¢ per $1 |
| Gini / Inequality Index | 7,814 | 0.33 |
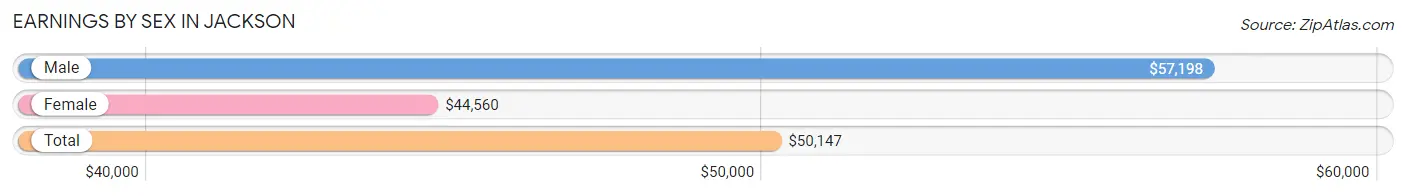
Earnings by Sex in Jackson
Average Earnings in Jackson are $50,147, $57,198 for men and $44,560 for women, a difference of 22.1%.
| Sex | Number | Average Earnings |
| Male | 2,615 (53.7%) | $57,198 |
| Female | 2,257 (46.3%) | $44,560 |
| Total | 4,872 (100.0%) | $50,147 |
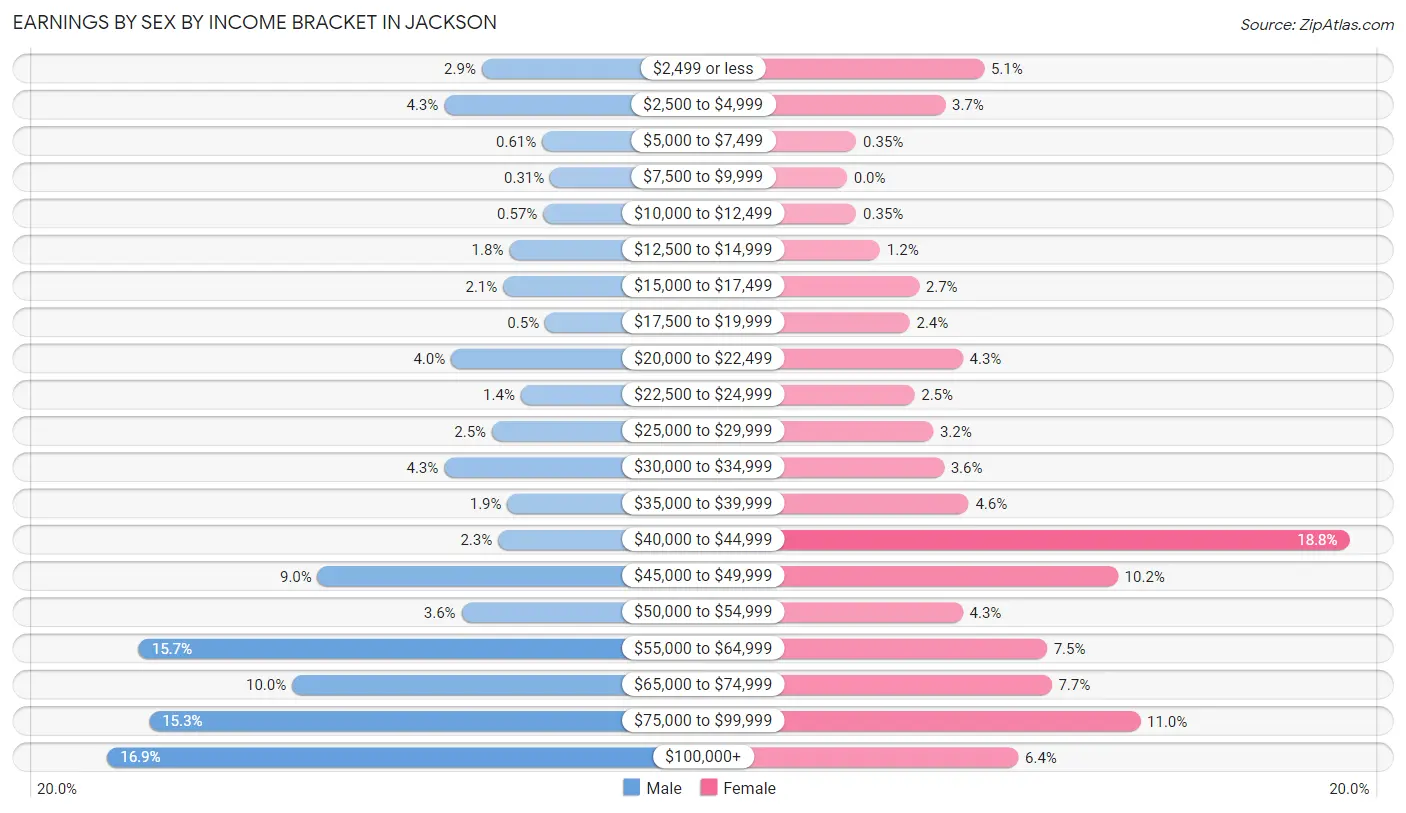
Earnings by Sex by Income Bracket in Jackson
The most common earnings brackets in Jackson are $100,000+ for men (442 | 16.9%) and $40,000 to $44,999 for women (425 | 18.8%).
| Income | Male | Female |
| $2,499 or less | 75 (2.9%) | 116 (5.1%) |
| $2,500 to $4,999 | 112 (4.3%) | 83 (3.7%) |
| $5,000 to $7,499 | 16 (0.6%) | 8 (0.4%) |
| $7,500 to $9,999 | 8 (0.3%) | 0 (0.0%) |
| $10,000 to $12,499 | 15 (0.6%) | 8 (0.4%) |
| $12,500 to $14,999 | 48 (1.8%) | 28 (1.2%) |
| $15,000 to $17,499 | 54 (2.1%) | 61 (2.7%) |
| $17,500 to $19,999 | 13 (0.5%) | 53 (2.4%) |
| $20,000 to $22,499 | 105 (4.0%) | 98 (4.3%) |
| $22,500 to $24,999 | 37 (1.4%) | 57 (2.5%) |
| $25,000 to $29,999 | 65 (2.5%) | 73 (3.2%) |
| $30,000 to $34,999 | 112 (4.3%) | 82 (3.6%) |
| $35,000 to $39,999 | 50 (1.9%) | 103 (4.6%) |
| $40,000 to $44,999 | 59 (2.3%) | 425 (18.8%) |
| $45,000 to $49,999 | 236 (9.0%) | 229 (10.2%) |
| $50,000 to $54,999 | 95 (3.6%) | 98 (4.3%) |
| $55,000 to $64,999 | 411 (15.7%) | 169 (7.5%) |
| $65,000 to $74,999 | 261 (10.0%) | 173 (7.7%) |
| $75,000 to $99,999 | 401 (15.3%) | 248 (11.0%) |
| $100,000+ | 442 (16.9%) | 145 (6.4%) |
| Total | 2,615 (100.0%) | 2,257 (100.0%) |
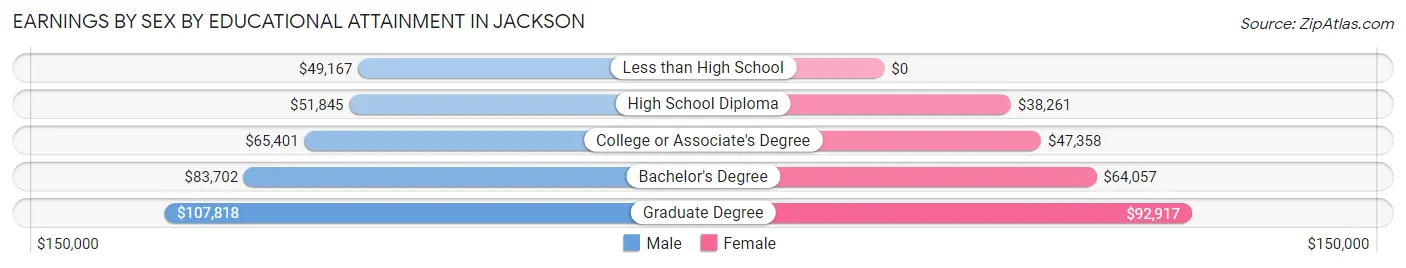
Earnings by Sex by Educational Attainment in Jackson
Average earnings in Jackson are $65,526 for men and $48,694 for women, a difference of 25.7%. Men with an educational attainment of graduate degree enjoy the highest average annual earnings of $107,818, while those with less than high school education earn the least with $49,167. Women with an educational attainment of graduate degree earn the most with the average annual earnings of $92,917, while those with high school diploma education have the smallest earnings of $38,261.
| Educational Attainment | Male Income | Female Income |
| Less than High School | $49,167 | $0 |
| High School Diploma | $51,845 | $38,261 |
| College or Associate's Degree | $65,401 | $47,358 |
| Bachelor's Degree | $83,702 | $64,057 |
| Graduate Degree | $107,818 | $92,917 |
| Total | $65,526 | $48,694 |
Family Income in Jackson
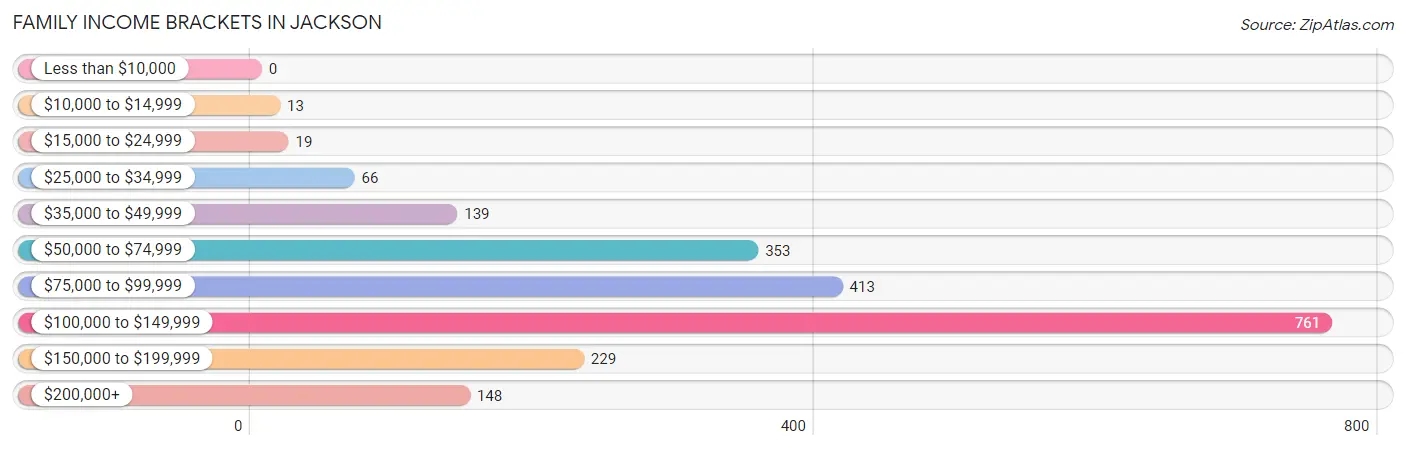
Family Income Brackets in Jackson
According to the Jackson family income data, there are 761 families falling into the $100,000 to $149,999 income range, which is the most common income bracket and makes up 35.6% of all families.
| Income Bracket | # Families | % Families |
| Less than $10,000 | 0 | 0.0% |
| $10,000 to $14,999 | 13 | 0.6% |
| $15,000 to $24,999 | 19 | 0.9% |
| $25,000 to $34,999 | 66 | 3.1% |
| $35,000 to $49,999 | 139 | 6.5% |
| $50,000 to $74,999 | 353 | 16.5% |
| $75,000 to $99,999 | 413 | 19.3% |
| $100,000 to $149,999 | 761 | 35.6% |
| $150,000 to $199,999 | 229 | 10.7% |
| $200,000+ | 148 | 6.9% |
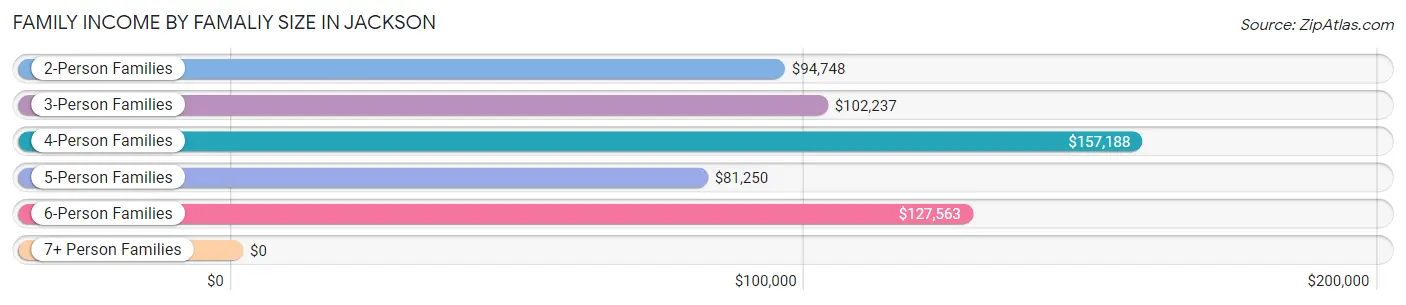
Family Income by Famaliy Size in Jackson
4-person families (277 | 13.0%) account for the highest median family income in Jackson with $157,188 per family, while 2-person families (1,314 | 61.4%) have the highest median income of $47,374 per family member.
| Income Bracket | # Families | Median Income |
| 2-Person Families | 1,314 (61.4%) | $94,748 |
| 3-Person Families | 368 (17.2%) | $102,237 |
| 4-Person Families | 277 (13.0%) | $157,188 |
| 5-Person Families | 113 (5.3%) | $81,250 |
| 6-Person Families | 67 (3.1%) | $127,563 |
| 7+ Person Families | 0 (0.0%) | $0 |
| Total | 2,139 (100.0%) | $102,312 |
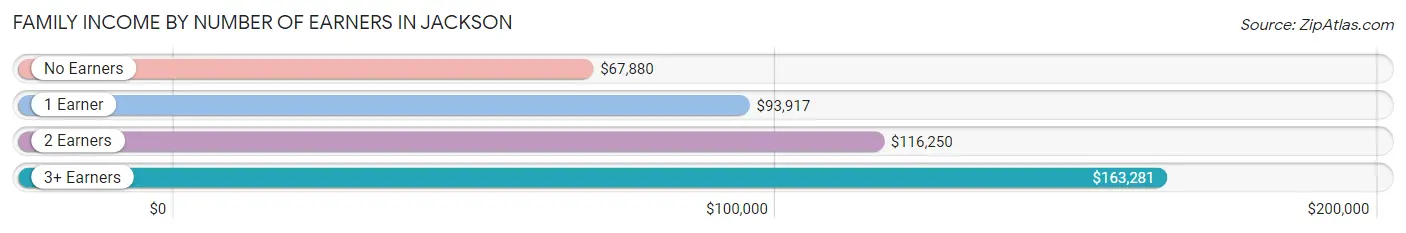
Family Income by Number of Earners in Jackson
The median family income in Jackson is $102,312, with families comprising 3+ earners (191) having the highest median family income of $163,281, while families with no earners (351) have the lowest median family income of $67,880, accounting for 8.9% and 16.4% of families, respectively.
| Number of Earners | # Families | Median Income |
| No Earners | 351 (16.4%) | $67,880 |
| 1 Earner | 543 (25.4%) | $93,917 |
| 2 Earners | 1,054 (49.3%) | $116,250 |
| 3+ Earners | 191 (8.9%) | $163,281 |
| Total | 2,139 (100.0%) | $102,312 |
Household Income in Jackson
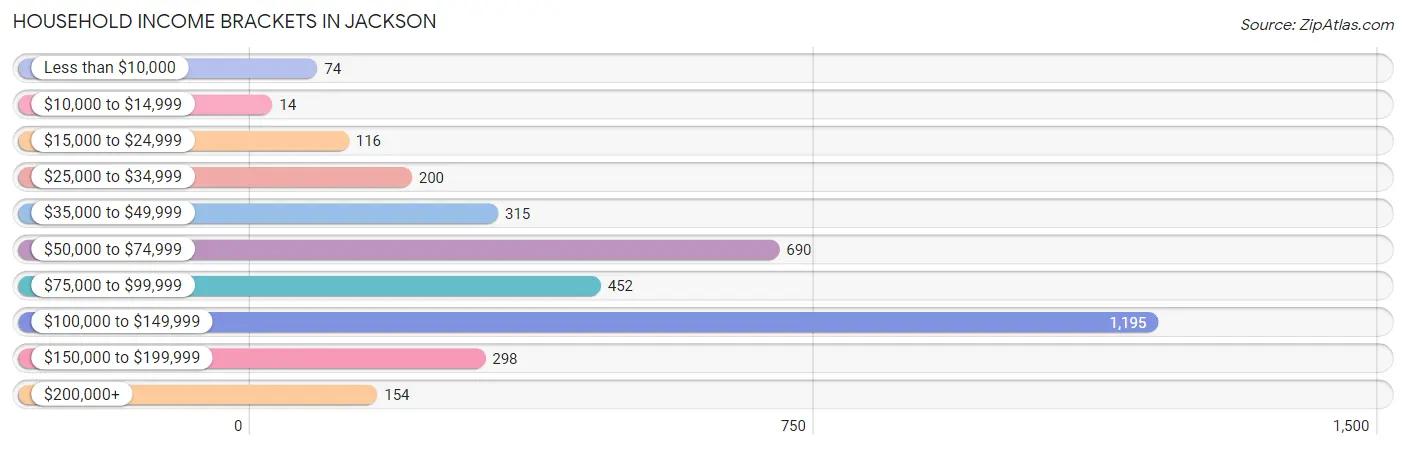
Household Income Brackets in Jackson
With 1,195 households falling in the category, the $100,000 to $149,999 income range is the most frequent in Jackson, accounting for 34.1% of all households. In contrast, only 14 households (0.4%) fall into the $10,000 to $14,999 income bracket, making it the least populous group.
| Income Bracket | # Households | % Households |
| Less than $10,000 | 74 | 2.1% |
| $10,000 to $14,999 | 14 | 0.4% |
| $15,000 to $24,999 | 116 | 3.3% |
| $25,000 to $34,999 | 200 | 5.7% |
| $35,000 to $49,999 | 315 | 9.0% |
| $50,000 to $74,999 | 690 | 19.7% |
| $75,000 to $99,999 | 452 | 12.9% |
| $100,000 to $149,999 | 1,195 | 34.1% |
| $150,000 to $199,999 | 298 | 8.5% |
| $200,000+ | 154 | 4.4% |
Household Income by Householder Age in Jackson
The median household income in Jackson is $94,621, with the highest median household income of $97,234 found in the 25 to 44 years age bracket for the primary householder. A total of 1,046 households (29.8%) fall into this category. Meanwhile, the 15 to 24 years age bracket for the primary householder has the lowest median household income of $0, with 317 households (9.0%) in this group.
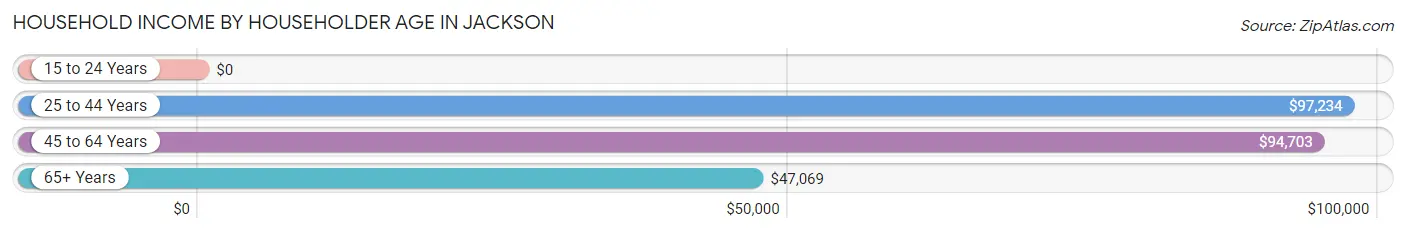
| Income Bracket | # Households | Median Income |
| 15 to 24 Years | 317 (9.0%) | $0 |
| 25 to 44 Years | 1,046 (29.8%) | $97,234 |
| 45 to 64 Years | 1,418 (40.5%) | $94,703 |
| 65+ Years | 724 (20.7%) | $47,069 |
| Total | 3,505 (100.0%) | $94,621 |
Poverty in Jackson
Income Below Poverty by Sex and Age in Jackson
With 3.0% poverty level for males and 3.8% for females among the residents of Jackson, 25 to 34 year old males and 65 to 74 year old females are the most vulnerable to poverty, with 47 males (9.3%) and 54 females (15.6%) in their respective age groups living below the poverty level.
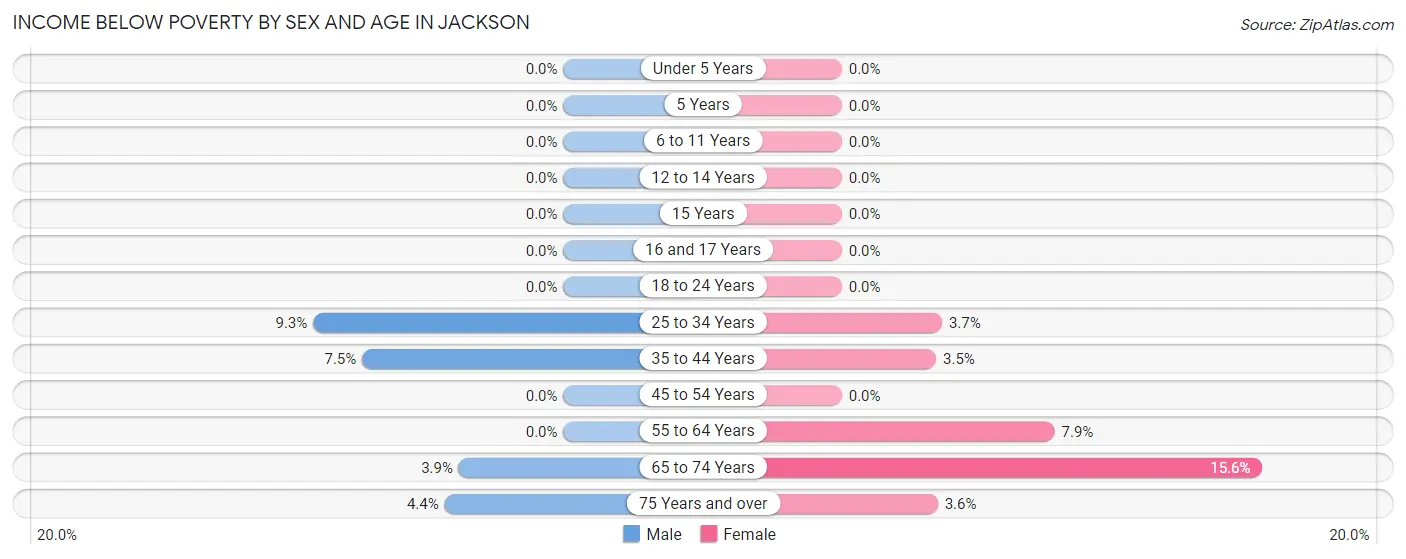
| Age Bracket | Male | Female |
| Under 5 Years | 0 (0.0%) | 0 (0.0%) |
| 5 Years | 0 (0.0%) | 0 (0.0%) |
| 6 to 11 Years | 0 (0.0%) | 0 (0.0%) |
| 12 to 14 Years | 0 (0.0%) | 0 (0.0%) |
| 15 Years | 0 (0.0%) | 0 (0.0%) |
| 16 and 17 Years | 0 (0.0%) | 0 (0.0%) |
| 18 to 24 Years | 0 (0.0%) | 0 (0.0%) |
| 25 to 34 Years | 47 (9.3%) | 12 (3.7%) |
| 35 to 44 Years | 47 (7.5%) | 21 (3.5%) |
| 45 to 54 Years | 0 (0.0%) | 0 (0.0%) |
| 55 to 64 Years | 0 (0.0%) | 49 (7.9%) |
| 65 to 74 Years | 15 (3.9%) | 54 (15.6%) |
| 75 Years and over | 10 (4.4%) | 10 (3.6%) |
| Total | 119 (3.0%) | 146 (3.8%) |
Income Above Poverty by Sex and Age in Jackson
According to the poverty statistics in Jackson, males aged under 5 years and females aged under 5 years are the age groups that are most secure financially, with 100.0% of males and 100.0% of females in these age groups living above the poverty line.
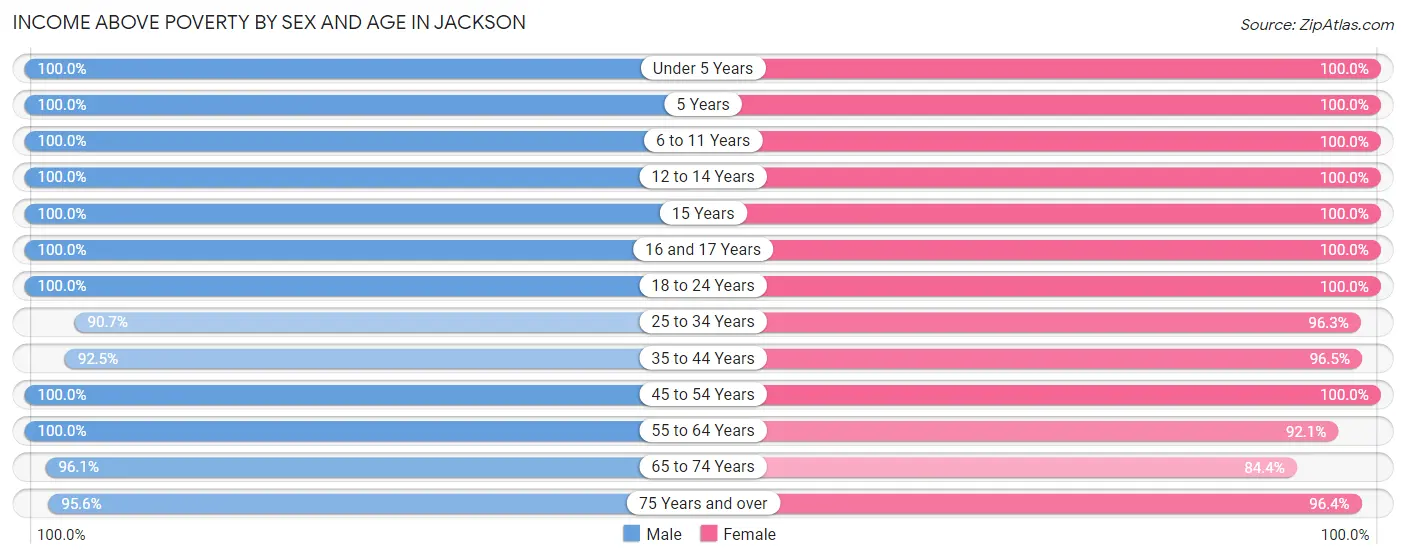
| Age Bracket | Male | Female |
| Under 5 Years | 71 (100.0%) | 148 (100.0%) |
| 5 Years | 48 (100.0%) | 38 (100.0%) |
| 6 to 11 Years | 367 (100.0%) | 252 (100.0%) |
| 12 to 14 Years | 200 (100.0%) | 177 (100.0%) |
| 15 Years | 25 (100.0%) | 19 (100.0%) |
| 16 and 17 Years | 111 (100.0%) | 123 (100.0%) |
| 18 to 24 Years | 366 (100.0%) | 401 (100.0%) |
| 25 to 34 Years | 459 (90.7%) | 311 (96.3%) |
| 35 to 44 Years | 582 (92.5%) | 579 (96.5%) |
| 45 to 54 Years | 531 (100.0%) | 517 (100.0%) |
| 55 to 64 Years | 501 (100.0%) | 571 (92.1%) |
| 65 to 74 Years | 372 (96.1%) | 292 (84.4%) |
| 75 Years and over | 217 (95.6%) | 271 (96.4%) |
| Total | 3,850 (97.0%) | 3,699 (96.2%) |
Income Below Poverty Among Married-Couple Families in Jackson
The poverty statistics for married-couple families in Jackson show that 1.2% or 21 of the total 1,734 families live below the poverty line. Families with no children have the highest poverty rate of 1.8%, comprising of 21 families. On the other hand, families with 1 or 2 children have the lowest poverty rate of 0.0%, which includes 0 families.
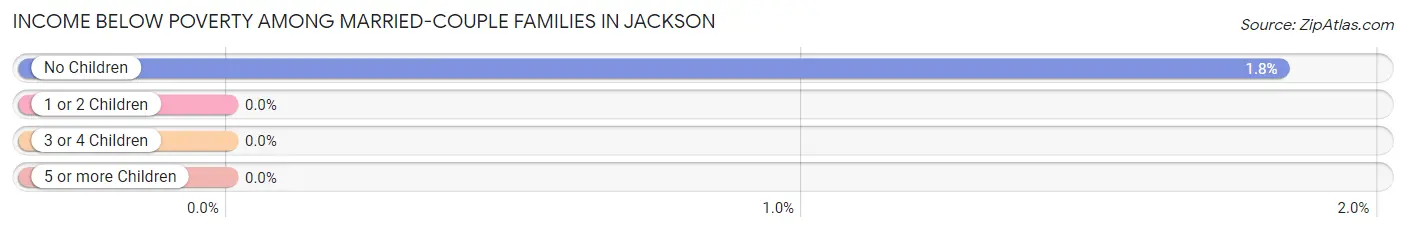
| Children | Above Poverty | Below Poverty |
| No Children | 1,127 (98.2%) | 21 (1.8%) |
| 1 or 2 Children | 441 (100.0%) | 0 (0.0%) |
| 3 or 4 Children | 145 (100.0%) | 0 (0.0%) |
| 5 or more Children | 0 (0.0%) | 0 (0.0%) |
| Total | 1,713 (98.8%) | 21 (1.2%) |
Income Below Poverty Among Single-Parent Households in Jackson
| Children | Single Father | Single Mother |
| No Children | 0 (0.0%) | 0 (0.0%) |
| 1 or 2 Children | 0 (0.0%) | 0 (0.0%) |
| 3 or 4 Children | 0 (0.0%) | 0 (0.0%) |
| 5 or more Children | 0 (0.0%) | 0 (0.0%) |
| Total | 0 (0.0%) | 0 (0.0%) |
Income Below Poverty Among Married-Couple vs Single-Parent Households in Jackson
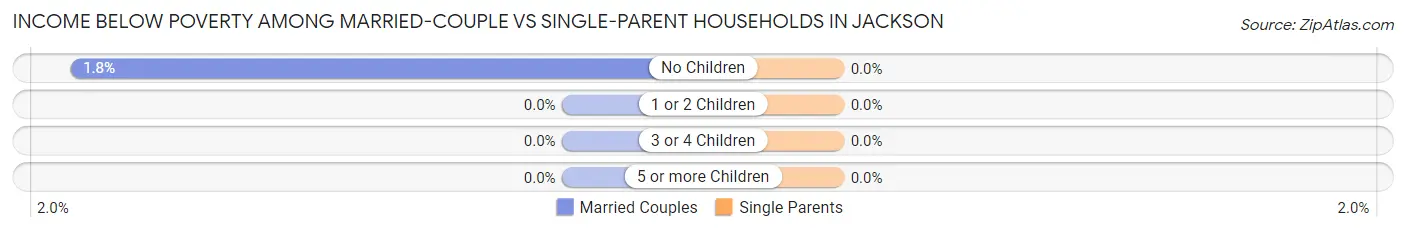
| Children | Married-Couple Families | Single-Parent Households |
| No Children | 21 (1.8%) | 0 (0.0%) |
| 1 or 2 Children | 0 (0.0%) | 0 (0.0%) |
| 3 or 4 Children | 0 (0.0%) | 0 (0.0%) |
| 5 or more Children | 0 (0.0%) | 0 (0.0%) |
| Total | 21 (1.2%) | 0 (0.0%) |
Race in Jackson
The most populous races in Jackson are White / Caucasian (7,269 | 93.0%), Two or more Races (267 | 3.4%), and Hispanic or Latino (193 | 2.5%).
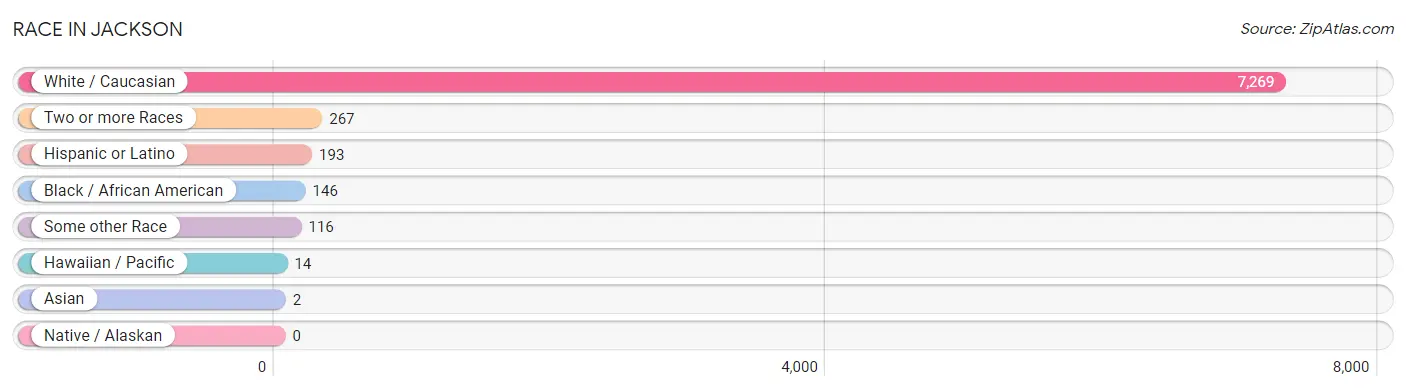
| Race | # Population | % Population |
| Asian | 2 | 0.0% |
| Black / African American | 146 | 1.9% |
| Hawaiian / Pacific | 14 | 0.2% |
| Hispanic or Latino | 193 | 2.5% |
| Native / Alaskan | 0 | 0.0% |
| White / Caucasian | 7,269 | 93.0% |
| Two or more Races | 267 | 3.4% |
| Some other Race | 116 | 1.5% |
| Total | 7,814 | 100.0% |
Ancestry in Jackson
The most populous ancestries reported in Jackson are German (4,357 | 55.8%), Polish (1,344 | 17.2%), Irish (752 | 9.6%), Italian (411 | 5.3%), and English (396 | 5.1%), together accounting for 92.9% of all Jackson residents.
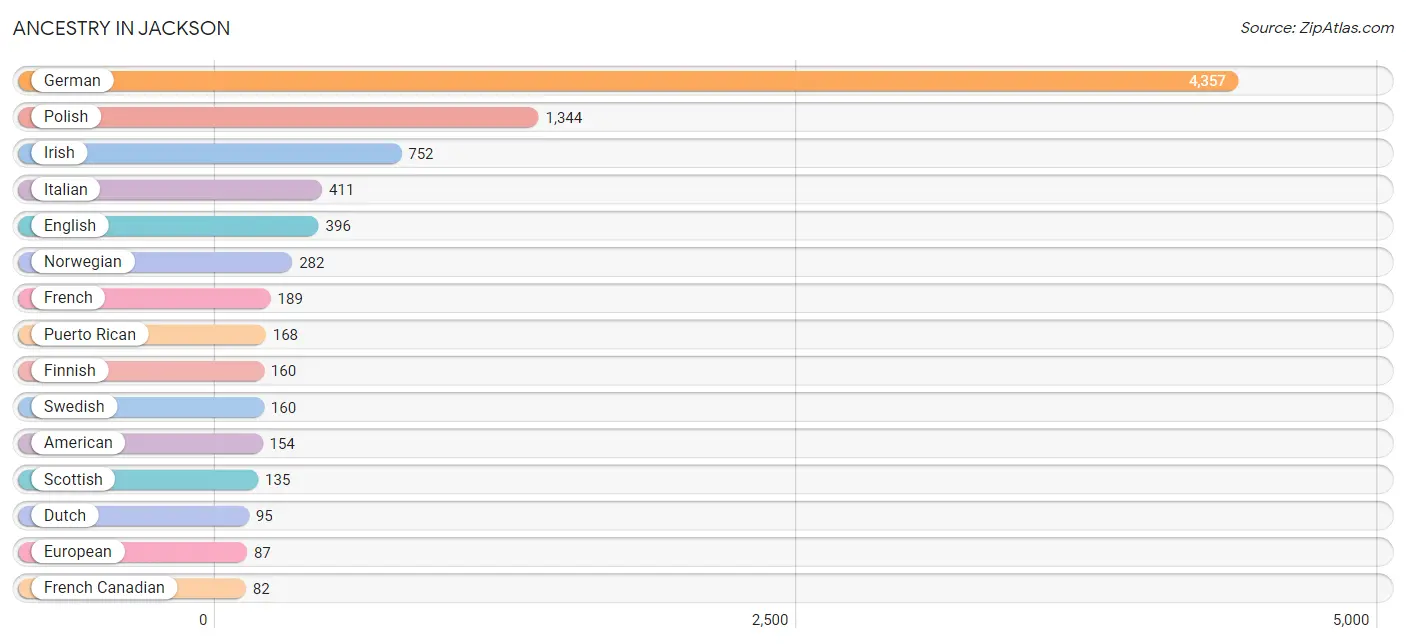
| Ancestry | # Population | % Population |
| American | 154 | 2.0% |
| Austrian | 30 | 0.4% |
| Belgian | 22 | 0.3% |
| British | 21 | 0.3% |
| Canadian | 16 | 0.2% |
| Chippewa | 13 | 0.2% |
| Croatian | 19 | 0.2% |
| Czechoslovakian | 11 | 0.1% |
| Danish | 71 | 0.9% |
| Dutch | 95 | 1.2% |
| Eastern European | 12 | 0.2% |
| English | 396 | 5.1% |
| European | 87 | 1.1% |
| Finnish | 160 | 2.1% |
| French | 189 | 2.4% |
| French Canadian | 82 | 1.1% |
| German | 4,357 | 55.8% |
| Greek | 54 | 0.7% |
| Guamanian / Chamorro | 14 | 0.2% |
| Hungarian | 37 | 0.5% |
| Icelander | 7 | 0.1% |
| Irish | 752 | 9.6% |
| Italian | 411 | 5.3% |
| Jamaican | 82 | 1.1% |
| Korean | 10 | 0.1% |
| Lithuanian | 7 | 0.1% |
| Luxembourger | 15 | 0.2% |
| Menominee | 4 | 0.1% |
| Mexican | 14 | 0.2% |
| Norwegian | 282 | 3.6% |
| Polish | 1,344 | 17.2% |
| Portuguese | 15 | 0.2% |
| Puerto Rican | 168 | 2.1% |
| Russian | 24 | 0.3% |
| Scandinavian | 26 | 0.3% |
| Scotch-Irish | 20 | 0.3% |
| Scottish | 135 | 1.7% |
| Serbian | 14 | 0.2% |
| Slavic | 8 | 0.1% |
| Slovak | 77 | 1.0% |
| Spaniard | 11 | 0.1% |
| Swedish | 160 | 2.1% |
| Swiss | 27 | 0.4% | View All 43 Rows |
Immigrants in Jackson
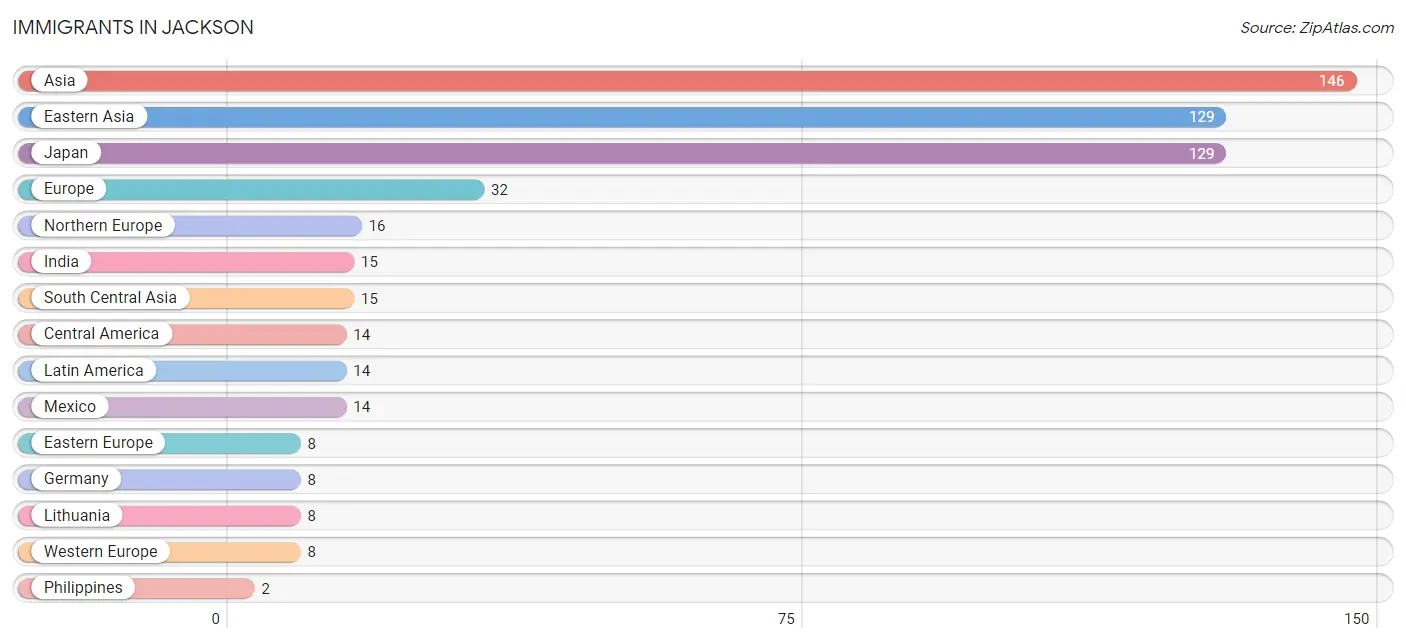
The most numerous immigrant groups reported in Jackson came from Asia (146 | 1.9%), Eastern Asia (129 | 1.7%), Japan (129 | 1.7%), Europe (32 | 0.4%), and Northern Europe (16 | 0.2%), together accounting for 5.8% of all Jackson residents.
| Immigration Origin | # Population | % Population |
| Asia | 146 | 1.9% |
| Central America | 14 | 0.2% |
| Eastern Asia | 129 | 1.7% |
| Eastern Europe | 8 | 0.1% |
| Europe | 32 | 0.4% |
| Germany | 8 | 0.1% |
| India | 15 | 0.2% |
| Japan | 129 | 1.7% |
| Latin America | 14 | 0.2% |
| Lithuania | 8 | 0.1% |
| Mexico | 14 | 0.2% |
| Northern Europe | 16 | 0.2% |
| Philippines | 2 | 0.0% |
| South Central Asia | 15 | 0.2% |
| South Eastern Asia | 2 | 0.0% |
| Western Europe | 8 | 0.1% | View All 16 Rows |
Sex and Age in Jackson
Sex and Age in Jackson
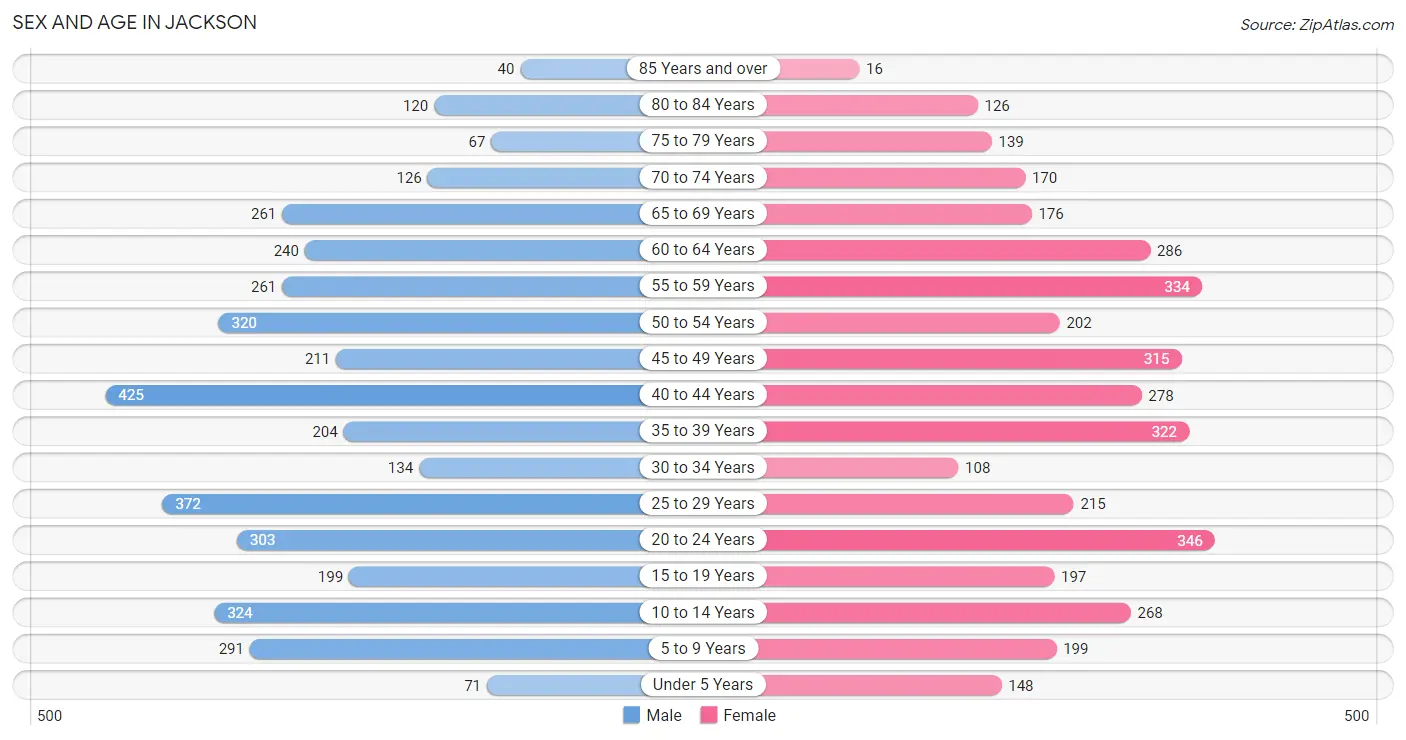
The most populous age groups in Jackson are 40 to 44 Years (425 | 10.7%) for men and 20 to 24 Years (346 | 9.0%) for women.
| Age Bracket | Male | Female |
| Under 5 Years | 71 (1.8%) | 148 (3.8%) |
| 5 to 9 Years | 291 (7.3%) | 199 (5.2%) |
| 10 to 14 Years | 324 (8.2%) | 268 (7.0%) |
| 15 to 19 Years | 199 (5.0%) | 197 (5.1%) |
| 20 to 24 Years | 303 (7.6%) | 346 (9.0%) |
| 25 to 29 Years | 372 (9.4%) | 215 (5.6%) |
| 30 to 34 Years | 134 (3.4%) | 108 (2.8%) |
| 35 to 39 Years | 204 (5.1%) | 322 (8.4%) |
| 40 to 44 Years | 425 (10.7%) | 278 (7.2%) |
| 45 to 49 Years | 211 (5.3%) | 315 (8.2%) |
| 50 to 54 Years | 320 (8.1%) | 202 (5.2%) |
| 55 to 59 Years | 261 (6.6%) | 334 (8.7%) |
| 60 to 64 Years | 240 (6.0%) | 286 (7.4%) |
| 65 to 69 Years | 261 (6.6%) | 176 (4.6%) |
| 70 to 74 Years | 126 (3.2%) | 170 (4.4%) |
| 75 to 79 Years | 67 (1.7%) | 139 (3.6%) |
| 80 to 84 Years | 120 (3.0%) | 126 (3.3%) |
| 85 Years and over | 40 (1.0%) | 16 (0.4%) |
| Total | 3,969 (100.0%) | 3,845 (100.0%) |
Families and Households in Jackson
Median Family Size in Jackson
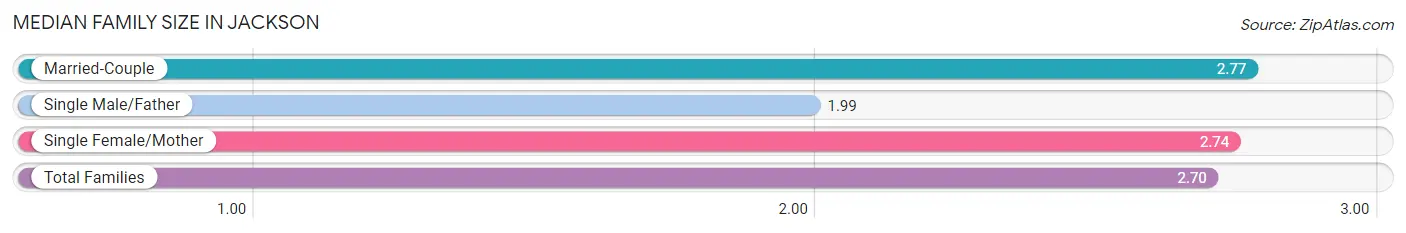
The median family size in Jackson is 2.70 persons per family, with married-couple families (1,734 | 81.1%) accounting for the largest median family size of 2.77 persons per family. On the other hand, single male/father families (176 | 8.2%) represent the smallest median family size with 1.99 persons per family.
| Family Type | # Families | Family Size |
| Married-Couple | 1,734 (81.1%) | 2.77 |
| Single Male/Father | 176 (8.2%) | 1.99 |
| Single Female/Mother | 229 (10.7%) | 2.74 |
| Total Families | 2,139 (100.0%) | 2.70 |
Median Household Size in Jackson
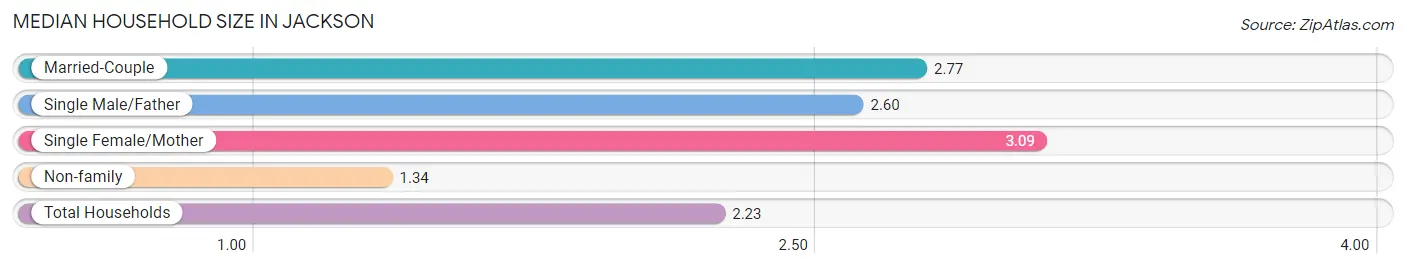
The median household size in Jackson is 2.23 persons per household, with single female/mother households (229 | 6.5%) accounting for the largest median household size of 3.09 persons per household. non-family households (1,366 | 39.0%) represent the smallest median household size with 1.34 persons per household.
| Household Type | # Households | Household Size |
| Married-Couple | 1,734 (49.5%) | 2.77 |
| Single Male/Father | 176 (5.0%) | 2.60 |
| Single Female/Mother | 229 (6.5%) | 3.09 |
| Non-family | 1,366 (39.0%) | 1.34 |
| Total Households | 3,505 (100.0%) | 2.23 |
Household Size by Marriage Status in Jackson
Out of a total of 3,505 households in Jackson, 2,139 (61.0%) are family households, while 1,366 (39.0%) are nonfamily households. The most numerous type of family households are 2-person households, comprising 1,207, and the most common type of nonfamily households are 1-person households, comprising 866.
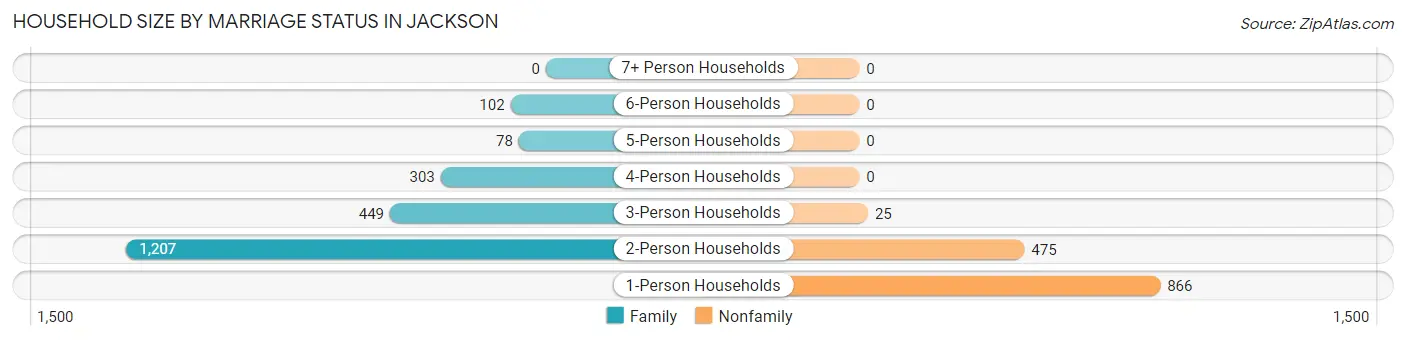
| Household Size | Family Households | Nonfamily Households |
| 1-Person Households | - | 866 (24.7%) |
| 2-Person Households | 1,207 (34.4%) | 475 (13.6%) |
| 3-Person Households | 449 (12.8%) | 25 (0.7%) |
| 4-Person Households | 303 (8.6%) | 0 (0.0%) |
| 5-Person Households | 78 (2.2%) | 0 (0.0%) |
| 6-Person Households | 102 (2.9%) | 0 (0.0%) |
| 7+ Person Households | 0 (0.0%) | 0 (0.0%) |
| Total | 2,139 (61.0%) | 1,366 (39.0%) |
Female Fertility in Jackson
Fertility by Age in Jackson
Average fertility rate in Jackson is 17.0 births per 1,000 women. Women in the age bracket of 20 to 34 years have the highest fertility rate with 45.0 births per 1,000 women. Women in the age bracket of 20 to 34 years acount for 100.0% of all women with births.
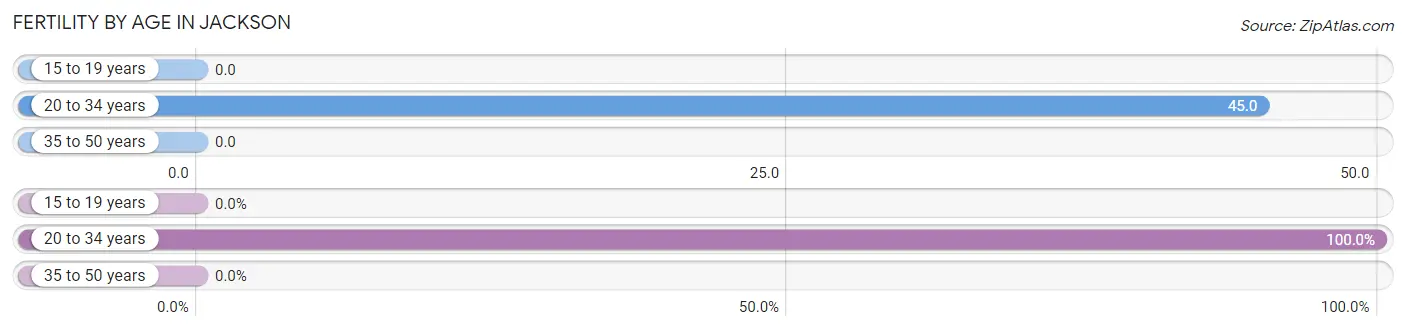
| Age Bracket | Women with Births | Births / 1,000 Women |
| 15 to 19 years | 0 (0.0%) | 0.0 |
| 20 to 34 years | 30 (100.0%) | 45.0 |
| 35 to 50 years | 0 (0.0%) | 0.0 |
| Total | 30 (100.0%) | 17.0 |
Fertility by Age by Marriage Status in Jackson
53.3% of women with births (30) in Jackson are married. The highest percentage of unmarried women with births falls into 20 to 34 years age bracket with 46.7% of them unmarried at the time of birth, while the lowest percentage of unmarried women with births belong to 20 to 34 years age bracket with 46.7% of them unmarried.
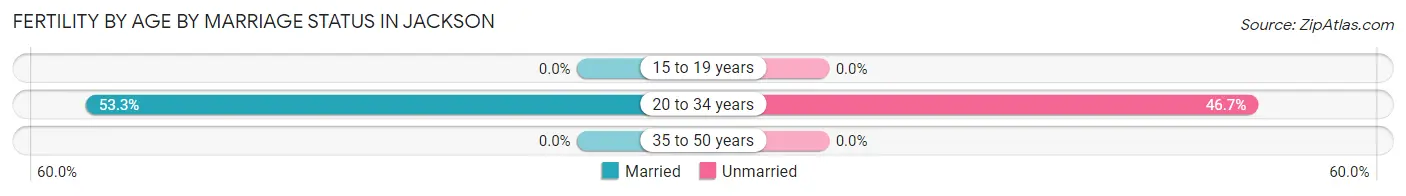
| Age Bracket | Married | Unmarried |
| 15 to 19 years | 0 (0.0%) | 0 (0.0%) |
| 20 to 34 years | 16 (53.3%) | 14 (46.7%) |
| 35 to 50 years | 0 (0.0%) | 0 (0.0%) |
| Total | 16 (53.3%) | 14 (46.7%) |
Fertility by Education in Jackson
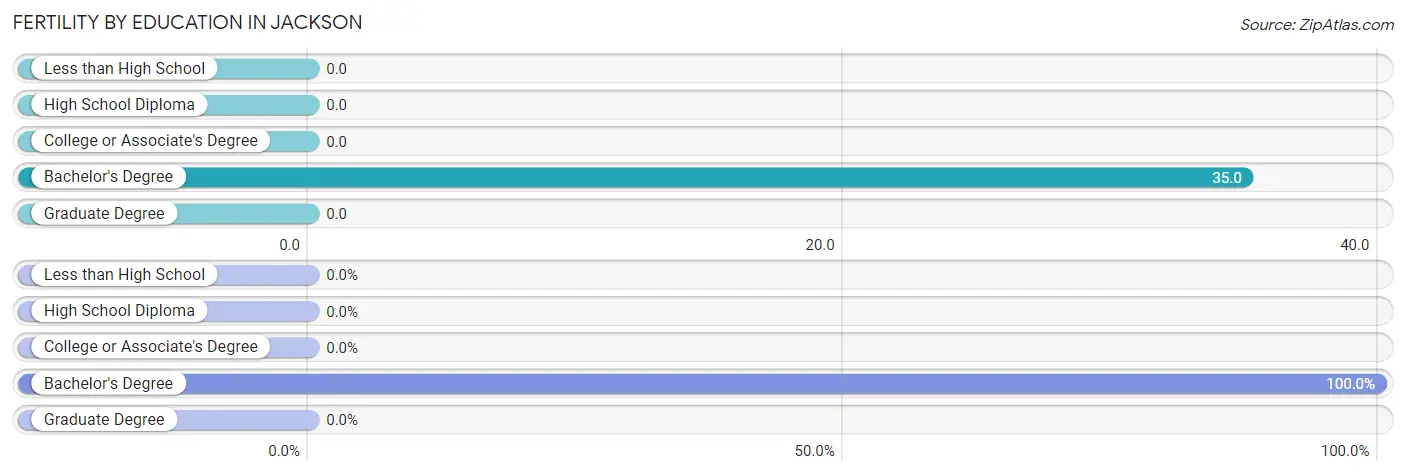
| Educational Attainment | Women with Births | Births / 1,000 Women |
| Less than High School | 0 (0.0%) | 0.0 |
| High School Diploma | 0 (0.0%) | 0.0 |
| College or Associate's Degree | 0 (0.0%) | 0.0 |
| Bachelor's Degree | 30 (100.0%) | 35.0 |
| Graduate Degree | 0 (0.0%) | 0.0 |
| Total | 30 (100.0%) | 17.0 |
Fertility by Education by Marriage Status in Jackson
46.7% of women with births in Jackson are unmarried. Women with the educational attainment of bachelor's degree are most likely to be married with 53.3% of them married at childbirth, while women with the educational attainment of bachelor's degree are least likely to be married with 46.7% of them unmarried at childbirth.
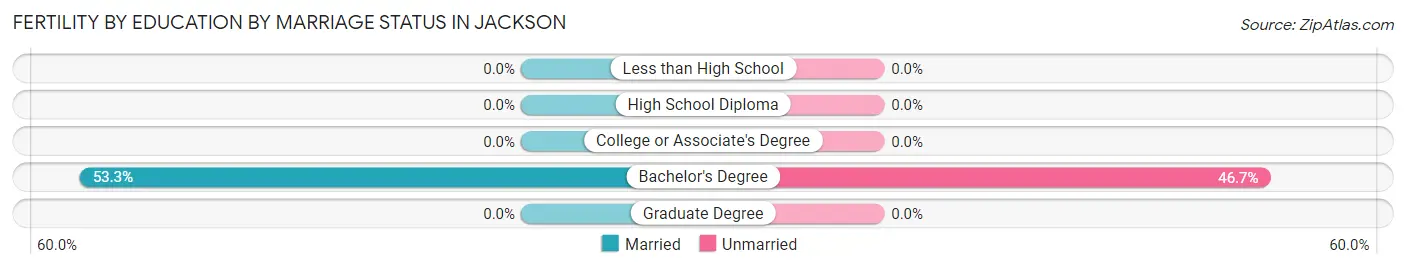
| Educational Attainment | Married | Unmarried |
| Less than High School | 0 (0.0%) | 0 (0.0%) |
| High School Diploma | 0 (0.0%) | 0 (0.0%) |
| College or Associate's Degree | 0 (0.0%) | 0 (0.0%) |
| Bachelor's Degree | 16 (53.3%) | 14 (46.7%) |
| Graduate Degree | 0 (0.0%) | 0 (0.0%) |
| Total | 16 (53.3%) | 14 (46.7%) |
Employment Characteristics in Jackson
Employment by Class of Employer in Jackson
Among the 4,479 employed individuals in Jackson, private company employees (3,198 | 71.4%), not-for-profit organizations (494 | 11.0%), and local government employees (349 | 7.8%) make up the most common classes of employment.
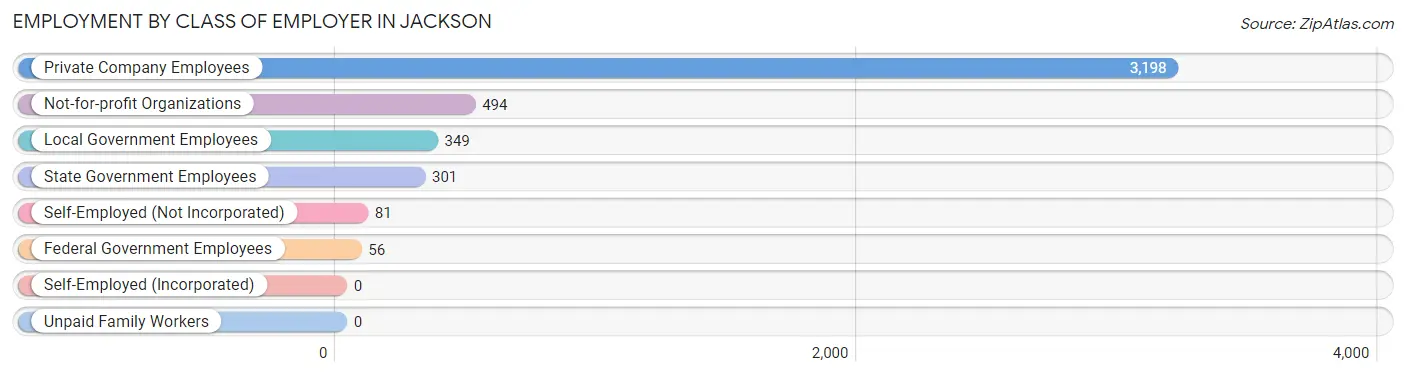
| Employer Class | # Employees | % Employees |
| Private Company Employees | 3,198 | 71.4% |
| Self-Employed (Incorporated) | 0 | 0.0% |
| Self-Employed (Not Incorporated) | 81 | 1.8% |
| Not-for-profit Organizations | 494 | 11.0% |
| Local Government Employees | 349 | 7.8% |
| State Government Employees | 301 | 6.7% |
| Federal Government Employees | 56 | 1.3% |
| Unpaid Family Workers | 0 | 0.0% |
| Total | 4,479 | 100.0% |
Employment Status by Age in Jackson
According to the labor force statistics for Jackson, out of the total population over 16 years of age (6,469), 73.9% or 4,781 individuals are in the labor force, with 5.9% or 282 of them unemployed. The age group with the highest labor force participation rate is 20 to 24 years, with 100.0% or 649 individuals in the labor force. Within the labor force, the 25 to 29 years age range has the highest percentage of unemployed individuals, with 23.7% or 116 of them being unemployed.
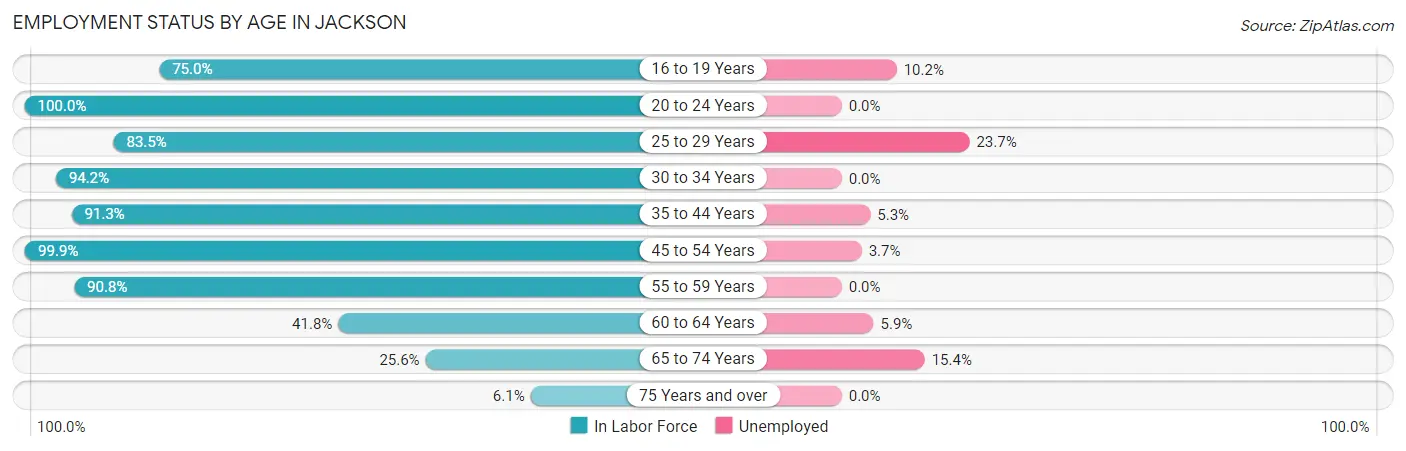
| Age Bracket | In Labor Force | Unemployed |
| 16 to 19 Years | 264 (75.0%) | 27 (10.2%) |
| 20 to 24 Years | 649 (100.0%) | 0 (0.0%) |
| 25 to 29 Years | 490 (83.5%) | 116 (23.7%) |
| 30 to 34 Years | 228 (94.2%) | 0 (0.0%) |
| 35 to 44 Years | 1,122 (91.3%) | 59 (5.3%) |
| 45 to 54 Years | 1,047 (99.9%) | 39 (3.7%) |
| 55 to 59 Years | 540 (90.8%) | 0 (0.0%) |
| 60 to 64 Years | 220 (41.8%) | 13 (5.9%) |
| 65 to 74 Years | 188 (25.6%) | 29 (15.4%) |
| 75 Years and over | 31 (6.1%) | 0 (0.0%) |
| Total | 4,781 (73.9%) | 282 (5.9%) |
Employment Status by Educational Attainment in Jackson
According to labor force statistics for Jackson, 86.3% of individuals (3,648) out of the total population between 25 and 64 years of age (4,227) are in the labor force, with 6.3% or 230 of them being unemployed. The group with the highest labor force participation rate are those with the educational attainment of less than high school, with 98.2% or 56 individuals in the labor force. Within the labor force, individuals with less than high school education have the highest percentage of unemployment, with 32.1% or 18 of them being unemployed.
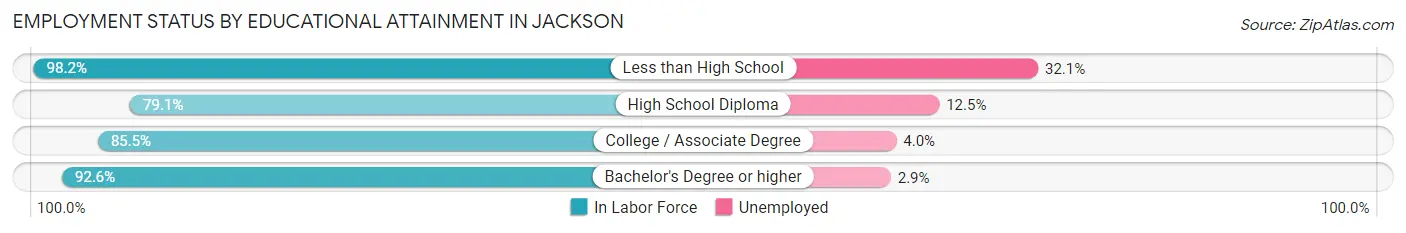
| Educational Attainment | In Labor Force | Unemployed |
| Less than High School | 56 (98.2%) | 18 (32.1%) |
| High School Diploma | 967 (79.1%) | 153 (12.5%) |
| College / Associate Degree | 1,265 (85.5%) | 59 (4.0%) |
| Bachelor's Degree or higher | 1,358 (92.6%) | 43 (2.9%) |
| Total | 3,648 (86.3%) | 266 (6.3%) |
Employment Occupations by Sex in Jackson
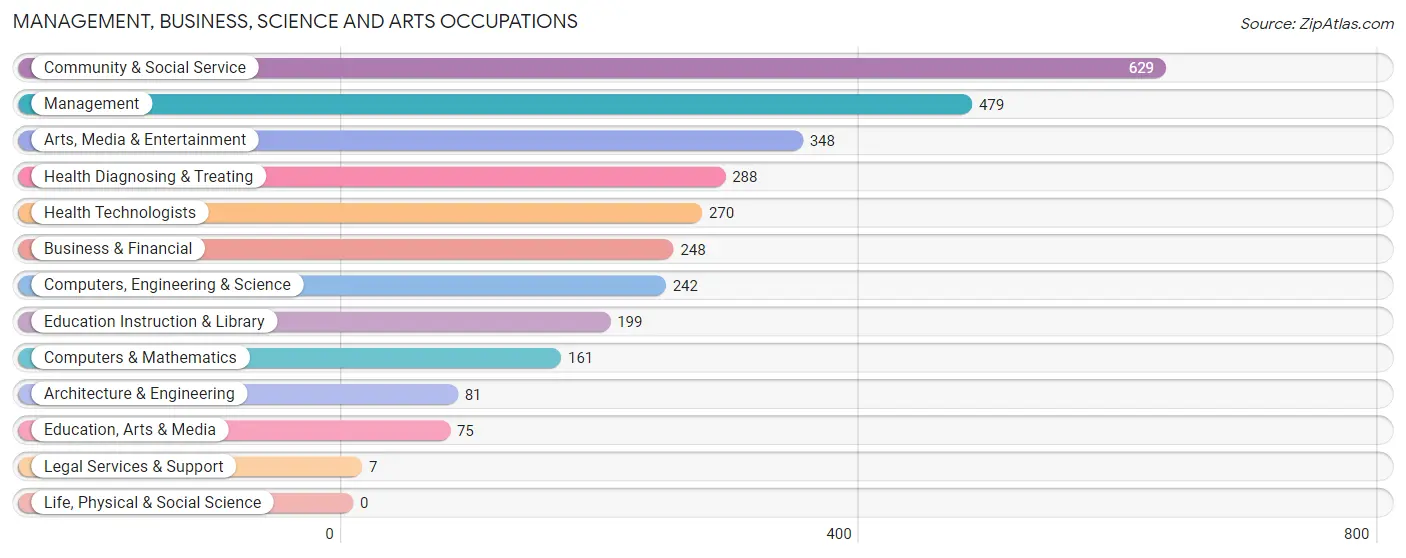
Management, Business, Science and Arts Occupations
The most common Management, Business, Science and Arts occupations in Jackson are Community & Social Service (629 | 14.0%), Management (479 | 10.7%), Arts, Media & Entertainment (348 | 7.7%), Health Diagnosing & Treating (288 | 6.4%), and Health Technologists (270 | 6.0%).
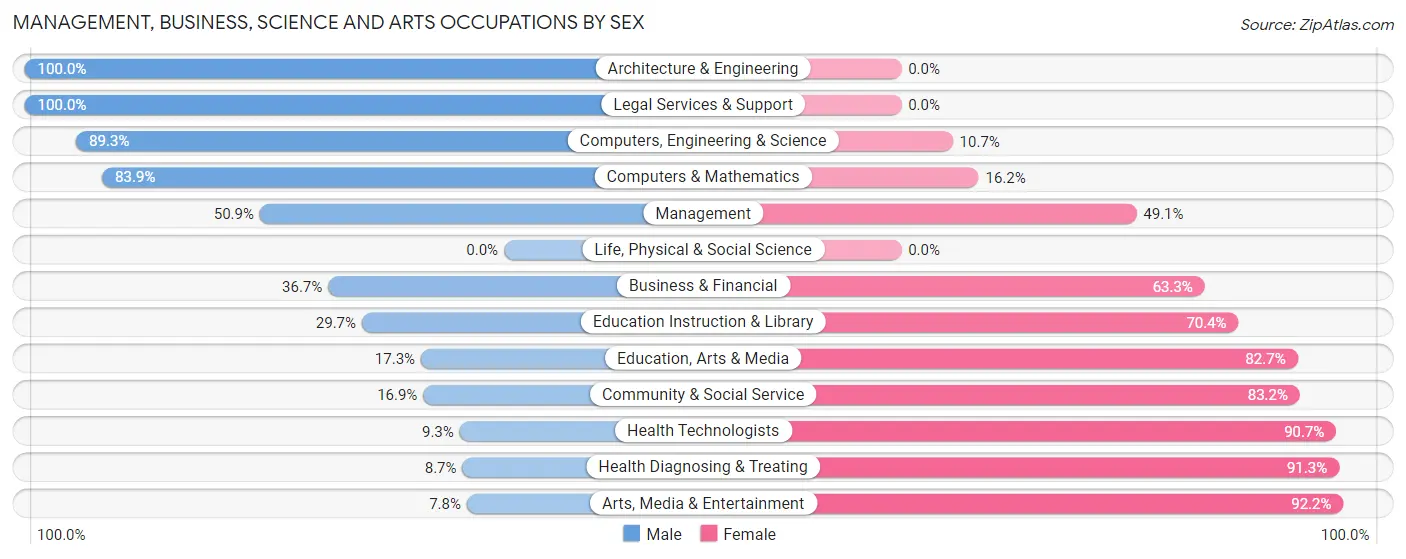
Management, Business, Science and Arts Occupations by Sex
Within the Management, Business, Science and Arts occupations in Jackson, the most male-oriented occupations are Architecture & Engineering (100.0%), Legal Services & Support (100.0%), and Computers, Engineering & Science (89.3%), while the most female-oriented occupations are Arts, Media & Entertainment (92.2%), Health Diagnosing & Treating (91.3%), and Health Technologists (90.7%).
| Occupation | Male | Female |
| Management | 244 (50.9%) | 235 (49.1%) |
| Business & Financial | 91 (36.7%) | 157 (63.3%) |
| Computers, Engineering & Science | 216 (89.3%) | 26 (10.7%) |
| Computers & Mathematics | 135 (83.9%) | 26 (16.2%) |
| Architecture & Engineering | 81 (100.0%) | 0 (0.0%) |
| Life, Physical & Social Science | 0 (0.0%) | 0 (0.0%) |
| Community & Social Service | 106 (16.9%) | 523 (83.2%) |
| Education, Arts & Media | 13 (17.3%) | 62 (82.7%) |
| Legal Services & Support | 7 (100.0%) | 0 (0.0%) |
| Education Instruction & Library | 59 (29.6%) | 140 (70.4%) |
| Arts, Media & Entertainment | 27 (7.8%) | 321 (92.2%) |
| Health Diagnosing & Treating | 25 (8.7%) | 263 (91.3%) |
| Health Technologists | 25 (9.3%) | 245 (90.7%) |
| Total (Category) | 682 (36.2%) | 1,204 (63.8%) |
| Total (Overall) | 2,351 (52.3%) | 2,144 (47.7%) |
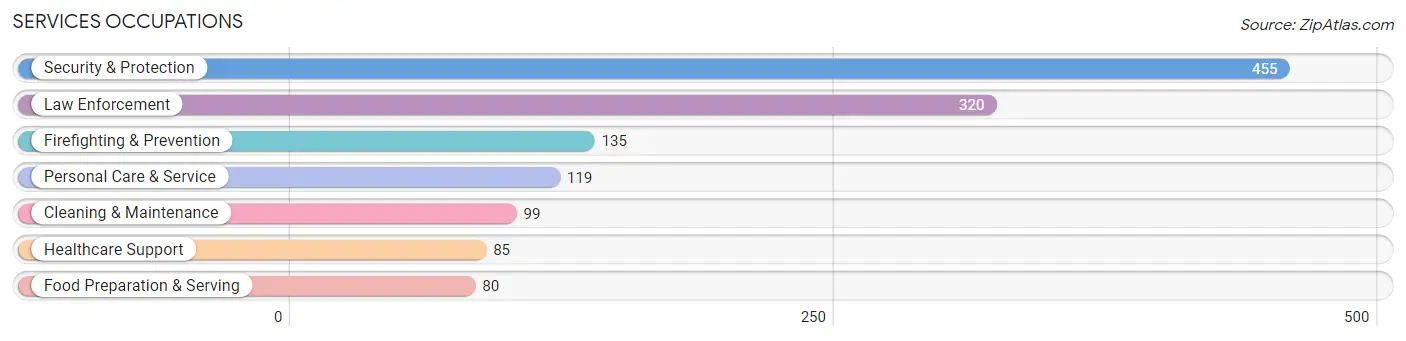
Services Occupations
The most common Services occupations in Jackson are Security & Protection (455 | 10.1%), Law Enforcement (320 | 7.1%), Firefighting & Prevention (135 | 3.0%), Personal Care & Service (119 | 2.6%), and Cleaning & Maintenance (99 | 2.2%).
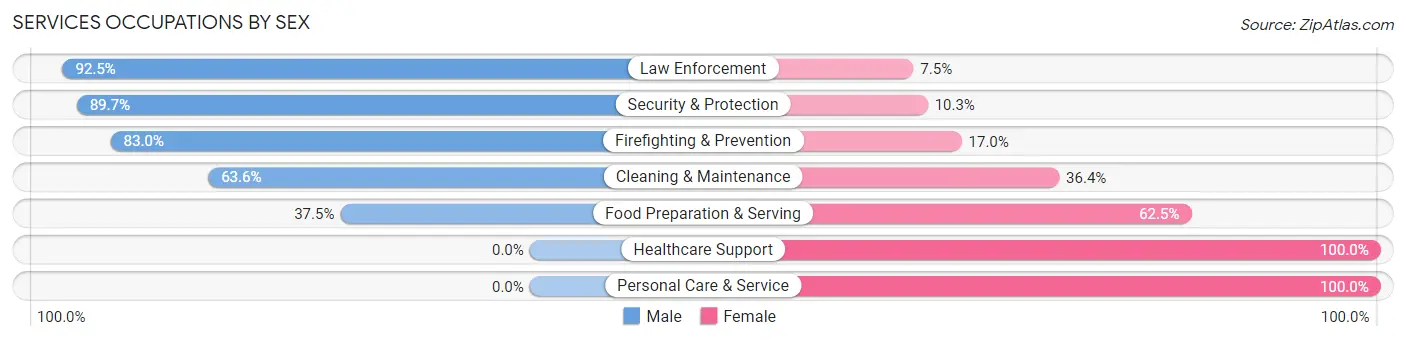
Services Occupations by Sex
Within the Services occupations in Jackson, the most male-oriented occupations are Law Enforcement (92.5%), Security & Protection (89.7%), and Firefighting & Prevention (83.0%), while the most female-oriented occupations are Healthcare Support (100.0%), Personal Care & Service (100.0%), and Food Preparation & Serving (62.5%).
| Occupation | Male | Female |
| Healthcare Support | 0 (0.0%) | 85 (100.0%) |
| Security & Protection | 408 (89.7%) | 47 (10.3%) |
| Firefighting & Prevention | 112 (83.0%) | 23 (17.0%) |
| Law Enforcement | 296 (92.5%) | 24 (7.5%) |
| Food Preparation & Serving | 30 (37.5%) | 50 (62.5%) |
| Cleaning & Maintenance | 63 (63.6%) | 36 (36.4%) |
| Personal Care & Service | 0 (0.0%) | 119 (100.0%) |
| Total (Category) | 501 (59.8%) | 337 (40.2%) |
| Total (Overall) | 2,351 (52.3%) | 2,144 (47.7%) |
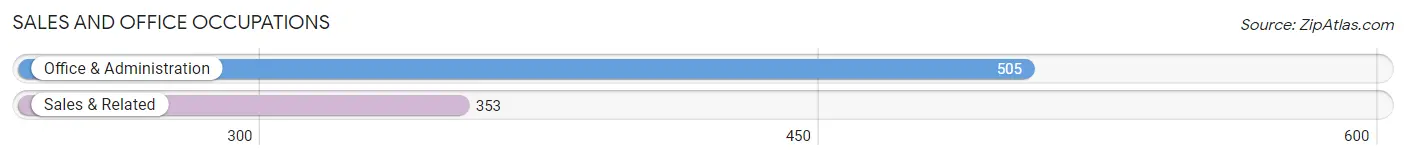
Sales and Office Occupations
The most common Sales and Office occupations in Jackson are Office & Administration (505 | 11.2%), and Sales & Related (353 | 7.9%).
Sales and Office Occupations by Sex
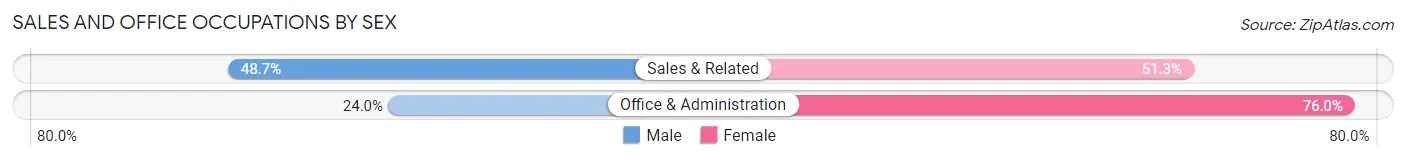
| Occupation | Male | Female |
| Sales & Related | 172 (48.7%) | 181 (51.3%) |
| Office & Administration | 121 (24.0%) | 384 (76.0%) |
| Total (Category) | 293 (34.2%) | 565 (65.8%) |
| Total (Overall) | 2,351 (52.3%) | 2,144 (47.7%) |
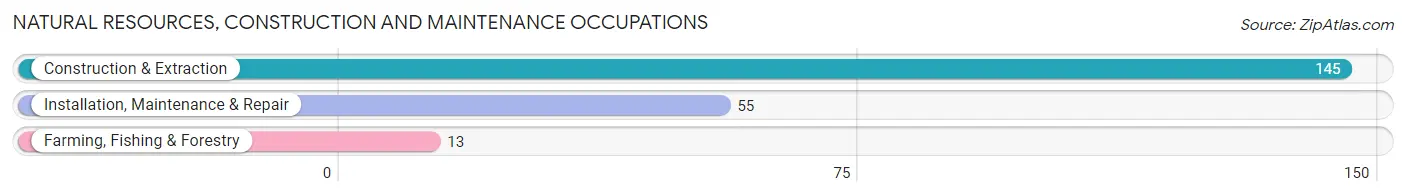
Natural Resources, Construction and Maintenance Occupations
The most common Natural Resources, Construction and Maintenance occupations in Jackson are Construction & Extraction (145 | 3.2%), Installation, Maintenance & Repair (55 | 1.2%), and Farming, Fishing & Forestry (13 | 0.3%).
Natural Resources, Construction and Maintenance Occupations by Sex
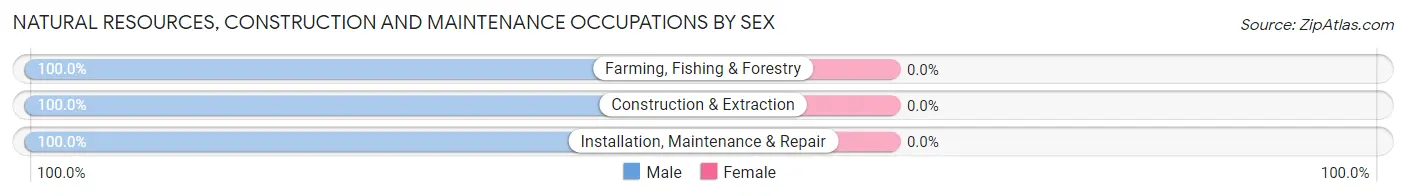
| Occupation | Male | Female |
| Farming, Fishing & Forestry | 13 (100.0%) | 0 (0.0%) |
| Construction & Extraction | 145 (100.0%) | 0 (0.0%) |
| Installation, Maintenance & Repair | 55 (100.0%) | 0 (0.0%) |
| Total (Category) | 213 (100.0%) | 0 (0.0%) |
| Total (Overall) | 2,351 (52.3%) | 2,144 (47.7%) |
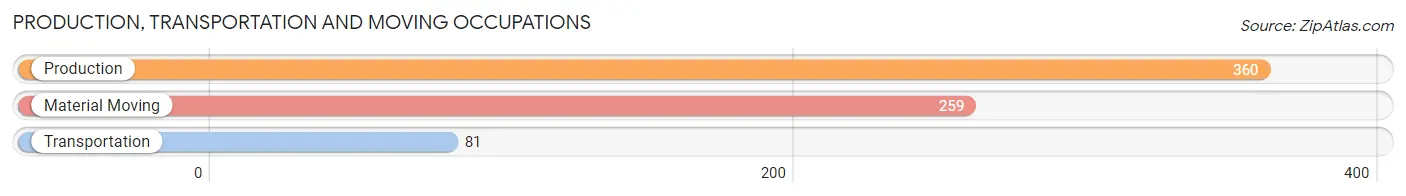
Production, Transportation and Moving Occupations
The most common Production, Transportation and Moving occupations in Jackson are Production (360 | 8.0%), Material Moving (259 | 5.8%), and Transportation (81 | 1.8%).
Production, Transportation and Moving Occupations by Sex
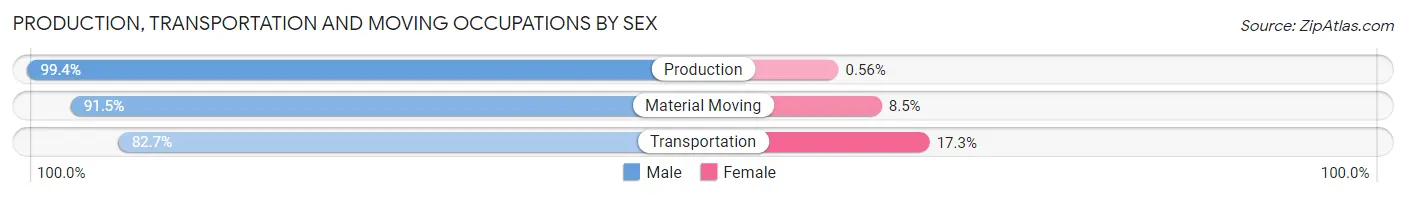
| Occupation | Male | Female |
| Production | 358 (99.4%) | 2 (0.6%) |
| Transportation | 67 (82.7%) | 14 (17.3%) |
| Material Moving | 237 (91.5%) | 22 (8.5%) |
| Total (Category) | 662 (94.6%) | 38 (5.4%) |
| Total (Overall) | 2,351 (52.3%) | 2,144 (47.7%) |
Employment Industries by Sex in Jackson
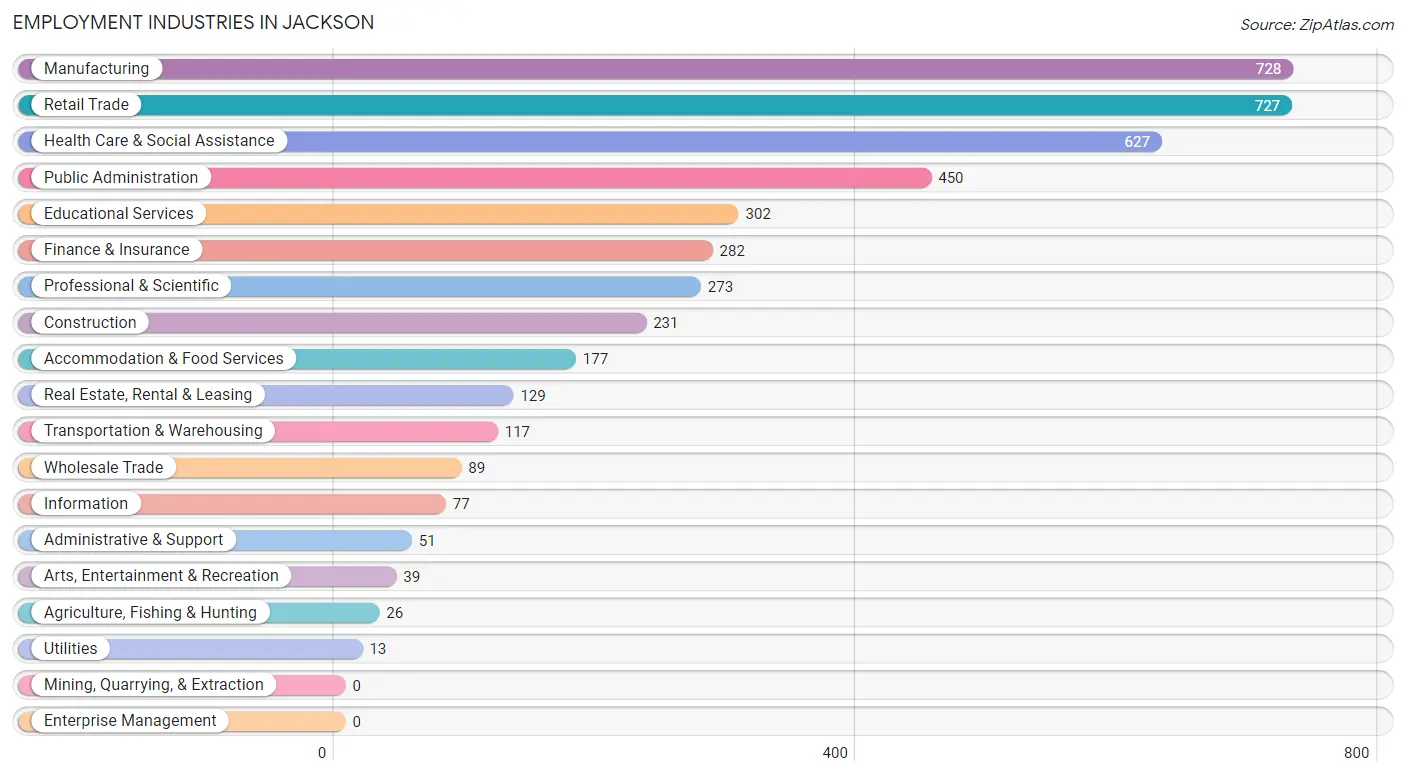
Employment Industries in Jackson
The major employment industries in Jackson include Manufacturing (728 | 16.2%), Retail Trade (727 | 16.2%), Health Care & Social Assistance (627 | 14.0%), Public Administration (450 | 10.0%), and Educational Services (302 | 6.7%).
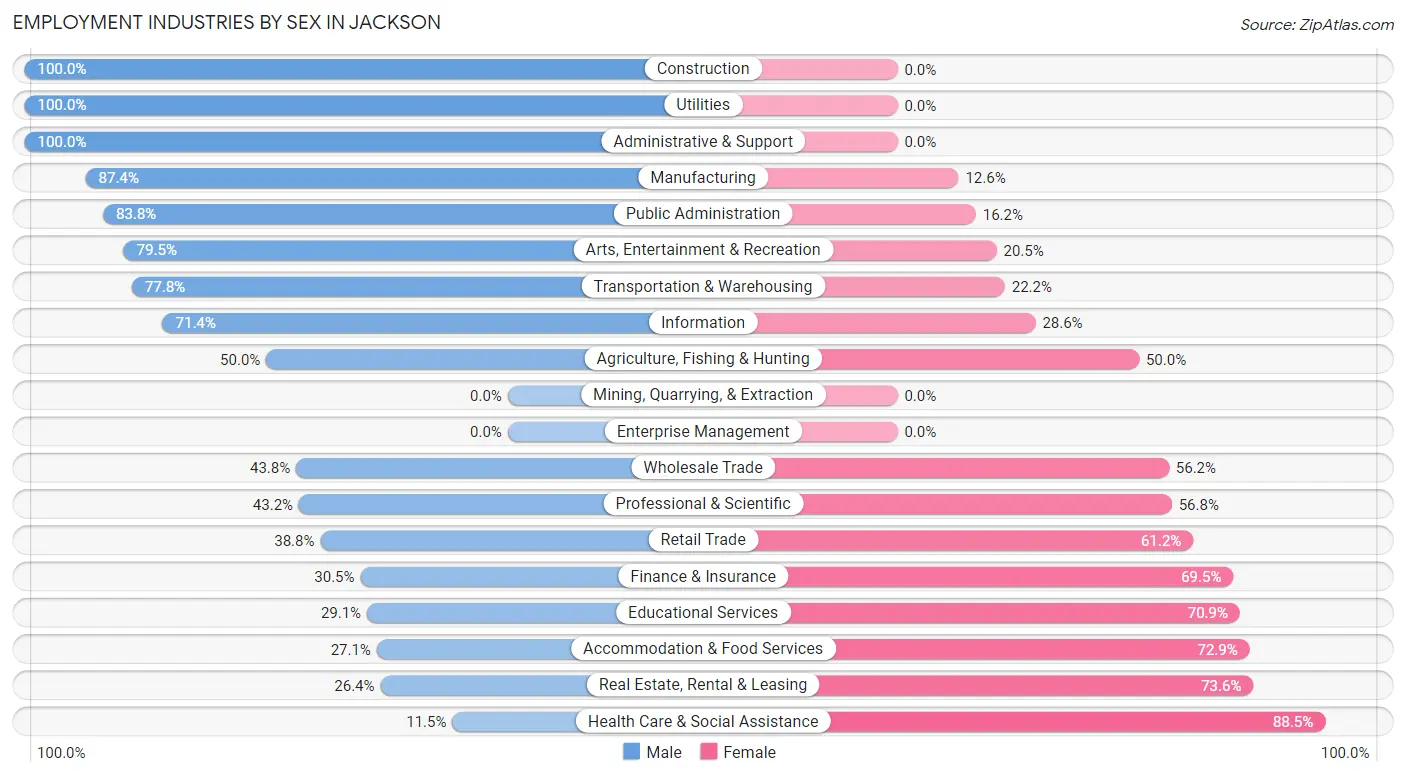
Employment Industries by Sex in Jackson
The Jackson industries that see more men than women are Construction (100.0%), Utilities (100.0%), and Administrative & Support (100.0%), whereas the industries that tend to have a higher number of women are Health Care & Social Assistance (88.5%), Real Estate, Rental & Leasing (73.6%), and Accommodation & Food Services (72.9%).
| Industry | Male | Female |
| Agriculture, Fishing & Hunting | 13 (50.0%) | 13 (50.0%) |
| Mining, Quarrying, & Extraction | 0 (0.0%) | 0 (0.0%) |
| Construction | 231 (100.0%) | 0 (0.0%) |
| Manufacturing | 636 (87.4%) | 92 (12.6%) |
| Wholesale Trade | 39 (43.8%) | 50 (56.2%) |
| Retail Trade | 282 (38.8%) | 445 (61.2%) |
| Transportation & Warehousing | 91 (77.8%) | 26 (22.2%) |
| Utilities | 13 (100.0%) | 0 (0.0%) |
| Information | 55 (71.4%) | 22 (28.6%) |
| Finance & Insurance | 86 (30.5%) | 196 (69.5%) |
| Real Estate, Rental & Leasing | 34 (26.4%) | 95 (73.6%) |
| Professional & Scientific | 118 (43.2%) | 155 (56.8%) |
| Enterprise Management | 0 (0.0%) | 0 (0.0%) |
| Administrative & Support | 51 (100.0%) | 0 (0.0%) |
| Educational Services | 88 (29.1%) | 214 (70.9%) |
| Health Care & Social Assistance | 72 (11.5%) | 555 (88.5%) |
| Arts, Entertainment & Recreation | 31 (79.5%) | 8 (20.5%) |
| Accommodation & Food Services | 48 (27.1%) | 129 (72.9%) |
| Public Administration | 377 (83.8%) | 73 (16.2%) |
| Total | 2,351 (52.3%) | 2,144 (47.7%) |
Education in Jackson
School Enrollment in Jackson
The most common levels of schooling among the 1,591 students in Jackson are middle school (490 | 30.8%), elementary school (380 | 23.9%), and high school (339 | 21.3%).
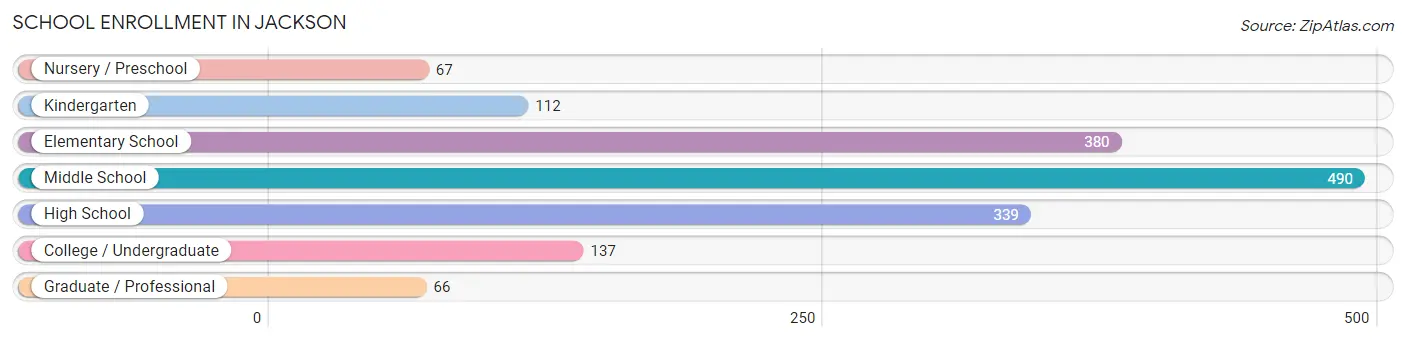
| School Level | # Students | % Students |
| Nursery / Preschool | 67 | 4.2% |
| Kindergarten | 112 | 7.0% |
| Elementary School | 380 | 23.9% |
| Middle School | 490 | 30.8% |
| High School | 339 | 21.3% |
| College / Undergraduate | 137 | 8.6% |
| Graduate / Professional | 66 | 4.2% |
| Total | 1,591 | 100.0% |
School Enrollment by Age by Funding Source in Jackson
Out of a total of 1,591 students who are enrolled in schools in Jackson, 329 (20.7%) attend a private institution, while the remaining 1,262 (79.3%) are enrolled in public schools. The age group of 3 to 4 year olds has the highest likelihood of being enrolled in private schools, with 17 (100.0% in the age bracket) enrolled. Conversely, the age group of 35 years and over has the lowest likelihood of being enrolled in a private school, with 72 (100.0% in the age bracket) attending a public institution.
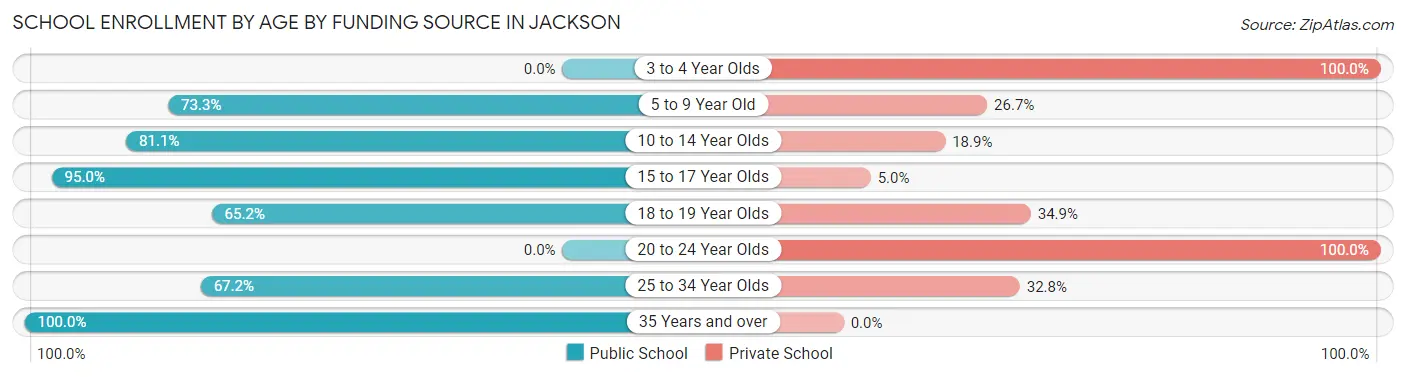
| Age Bracket | Public School | Private School |
| 3 to 4 Year Olds | 0 (0.0%) | 17 (100.0%) |
| 5 to 9 Year Old | 359 (73.3%) | 131 (26.7%) |
| 10 to 14 Year Olds | 480 (81.1%) | 112 (18.9%) |
| 15 to 17 Year Olds | 264 (95.0%) | 14 (5.0%) |
| 18 to 19 Year Olds | 43 (65.1%) | 23 (34.8%) |
| 20 to 24 Year Olds | 0 (0.0%) | 12 (100.0%) |
| 25 to 34 Year Olds | 43 (67.2%) | 21 (32.8%) |
| 35 Years and over | 72 (100.0%) | 0 (0.0%) |
| Total | 1,262 (79.3%) | 329 (20.7%) |
Educational Attainment by Field of Study in Jackson
Business (411 | 23.6%), education (354 | 20.4%), science & technology (281 | 16.2%), arts & humanities (214 | 12.3%), and engineering (112 | 6.4%) are the most common fields of study among 1,738 individuals in Jackson who have obtained a bachelor's degree or higher.
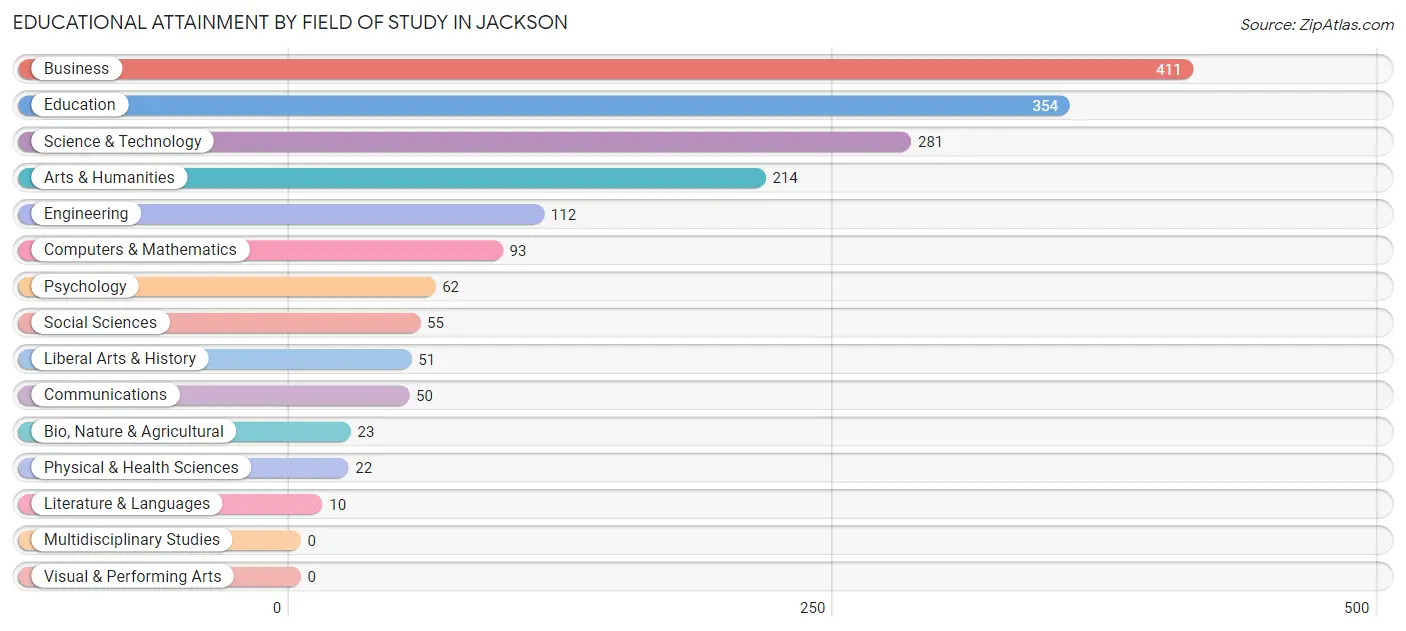
| Field of Study | # Graduates | % Graduates |
| Computers & Mathematics | 93 | 5.3% |
| Bio, Nature & Agricultural | 23 | 1.3% |
| Physical & Health Sciences | 22 | 1.3% |
| Psychology | 62 | 3.6% |
| Social Sciences | 55 | 3.2% |
| Engineering | 112 | 6.4% |
| Multidisciplinary Studies | 0 | 0.0% |
| Science & Technology | 281 | 16.2% |
| Business | 411 | 23.6% |
| Education | 354 | 20.4% |
| Literature & Languages | 10 | 0.6% |
| Liberal Arts & History | 51 | 2.9% |
| Visual & Performing Arts | 0 | 0.0% |
| Communications | 50 | 2.9% |
| Arts & Humanities | 214 | 12.3% |
| Total | 1,738 | 100.0% |
Transportation & Commute in Jackson
Vehicle Availability by Sex in Jackson
The most prevalent vehicle ownership categories in Jackson are males with 2 vehicles (1,332, accounting for 57.0%) and females with 2 vehicles (1,320, making up 62.1%).
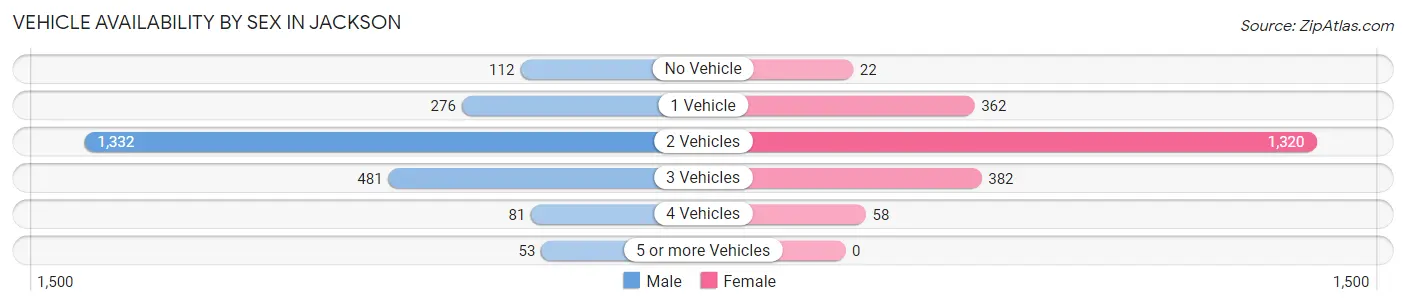
| Vehicles Available | Male | Female |
| No Vehicle | 112 (4.8%) | 22 (1.0%) |
| 1 Vehicle | 276 (11.8%) | 362 (16.9%) |
| 2 Vehicles | 1,332 (57.0%) | 1,320 (61.6%) |
| 3 Vehicles | 481 (20.6%) | 382 (17.8%) |
| 4 Vehicles | 81 (3.5%) | 58 (2.7%) |
| 5 or more Vehicles | 53 (2.3%) | 0 (0.0%) |
| Total | 2,335 (100.0%) | 2,144 (100.0%) |
Commute Time in Jackson
The most frequently occuring commute durations in Jackson are 15 to 19 minutes (900 commuters, 22.9%), 20 to 24 minutes (584 commuters, 14.9%), and 30 to 34 minutes (566 commuters, 14.4%).
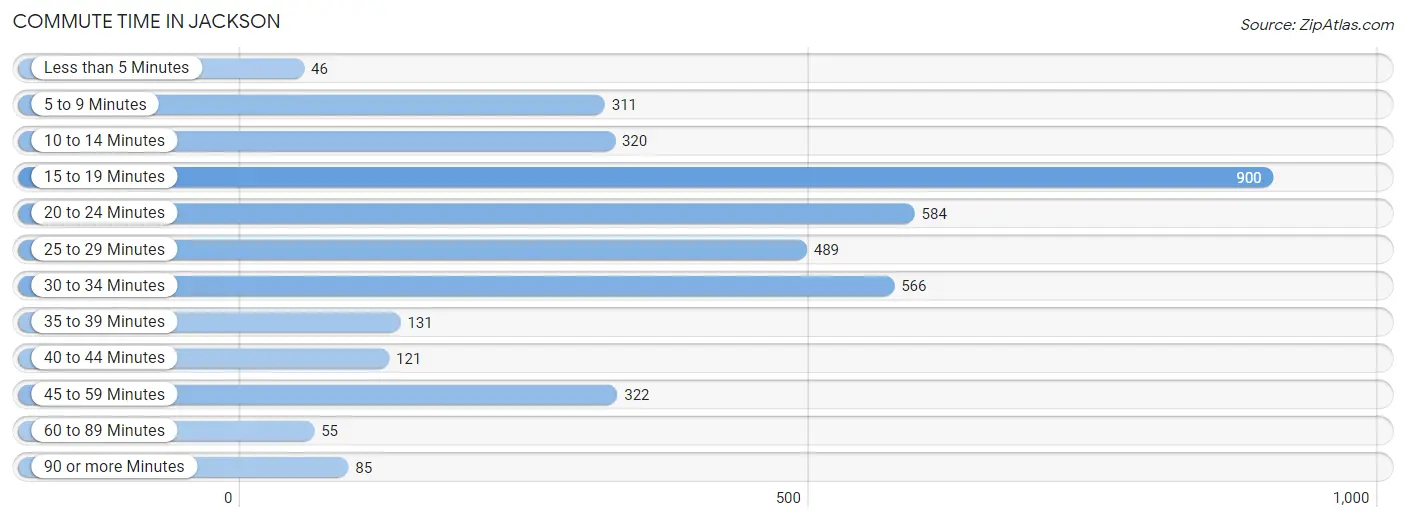
| Commute Time | # Commuters | % Commuters |
| Less than 5 Minutes | 46 | 1.2% |
| 5 to 9 Minutes | 311 | 7.9% |
| 10 to 14 Minutes | 320 | 8.1% |
| 15 to 19 Minutes | 900 | 22.9% |
| 20 to 24 Minutes | 584 | 14.9% |
| 25 to 29 Minutes | 489 | 12.4% |
| 30 to 34 Minutes | 566 | 14.4% |
| 35 to 39 Minutes | 131 | 3.3% |
| 40 to 44 Minutes | 121 | 3.1% |
| 45 to 59 Minutes | 322 | 8.2% |
| 60 to 89 Minutes | 55 | 1.4% |
| 90 or more Minutes | 85 | 2.2% |
Commute Time by Sex in Jackson
The most common commute times in Jackson are 30 to 34 minutes (446 commuters, 21.1%) for males and 15 to 19 minutes (538 commuters, 29.6%) for females.
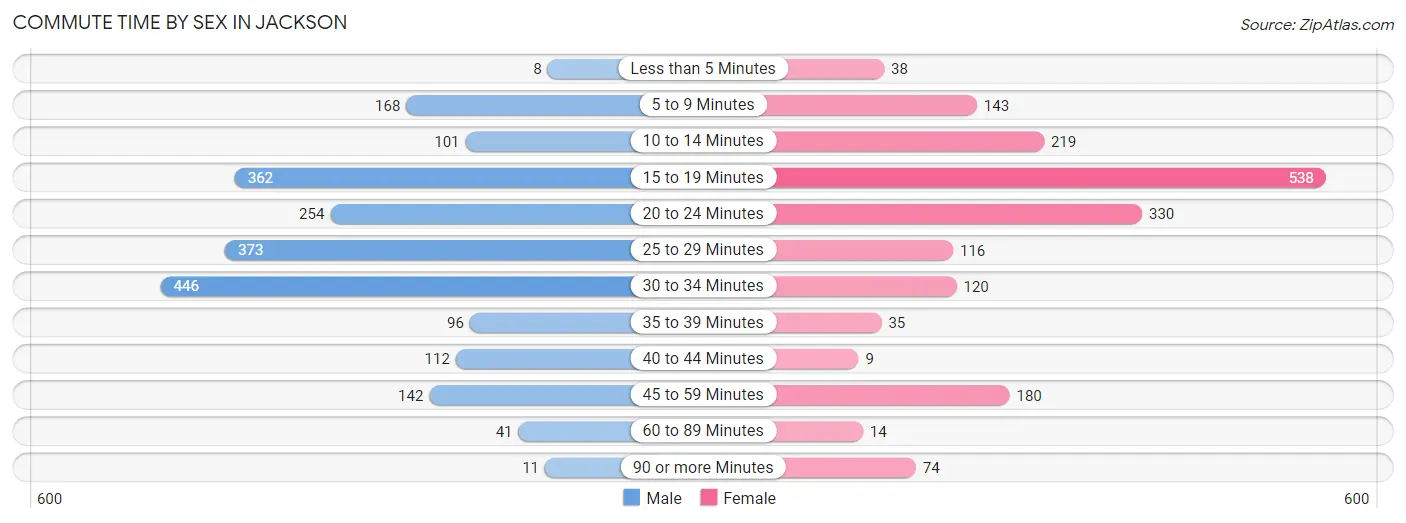
| Commute Time | Male | Female |
| Less than 5 Minutes | 8 (0.4%) | 38 (2.1%) |
| 5 to 9 Minutes | 168 (8.0%) | 143 (7.9%) |
| 10 to 14 Minutes | 101 (4.8%) | 219 (12.1%) |
| 15 to 19 Minutes | 362 (17.1%) | 538 (29.6%) |
| 20 to 24 Minutes | 254 (12.0%) | 330 (18.2%) |
| 25 to 29 Minutes | 373 (17.6%) | 116 (6.4%) |
| 30 to 34 Minutes | 446 (21.1%) | 120 (6.6%) |
| 35 to 39 Minutes | 96 (4.5%) | 35 (1.9%) |
| 40 to 44 Minutes | 112 (5.3%) | 9 (0.5%) |
| 45 to 59 Minutes | 142 (6.7%) | 180 (9.9%) |
| 60 to 89 Minutes | 41 (1.9%) | 14 (0.8%) |
| 90 or more Minutes | 11 (0.5%) | 74 (4.1%) |
Time of Departure to Work by Sex in Jackson
The most frequent times of departure to work in Jackson are 12:00 PM to 3:59 PM (491, 23.2%) for males and 8:00 AM to 8:29 AM (431, 23.7%) for females.
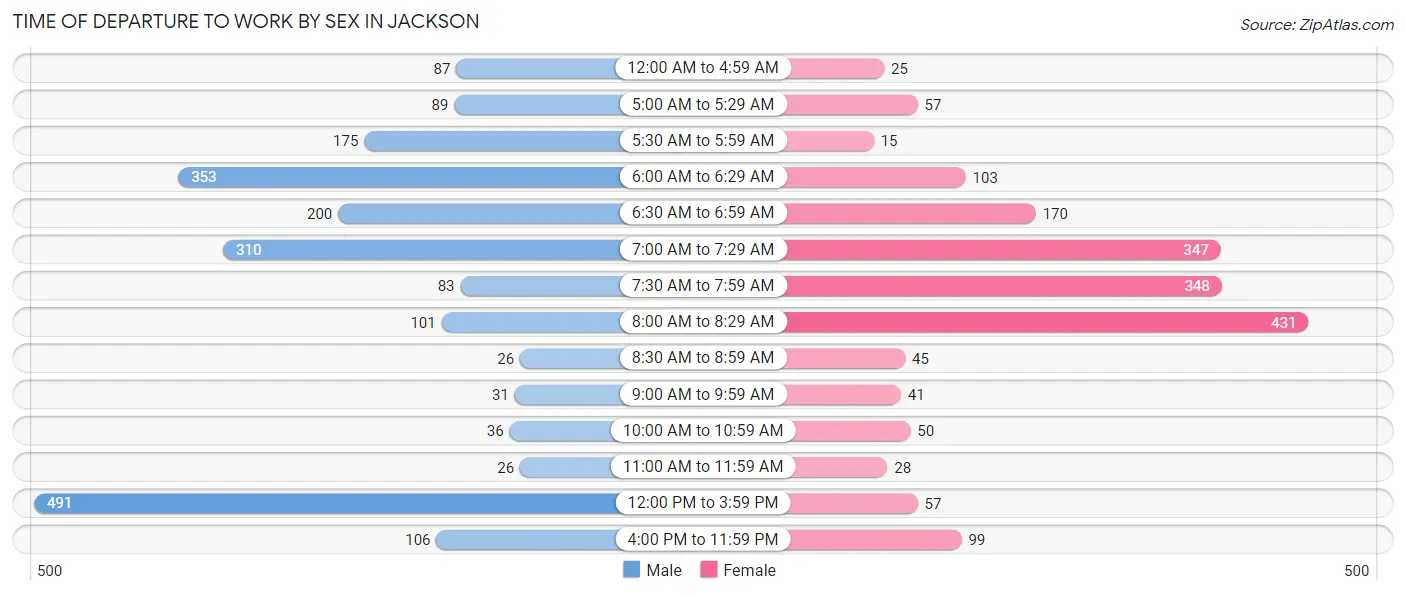
| Time of Departure | Male | Female |
| 12:00 AM to 4:59 AM | 87 (4.1%) | 25 (1.4%) |
| 5:00 AM to 5:29 AM | 89 (4.2%) | 57 (3.1%) |
| 5:30 AM to 5:59 AM | 175 (8.3%) | 15 (0.8%) |
| 6:00 AM to 6:29 AM | 353 (16.7%) | 103 (5.7%) |
| 6:30 AM to 6:59 AM | 200 (9.5%) | 170 (9.4%) |
| 7:00 AM to 7:29 AM | 310 (14.7%) | 347 (19.1%) |
| 7:30 AM to 7:59 AM | 83 (3.9%) | 348 (19.2%) |
| 8:00 AM to 8:29 AM | 101 (4.8%) | 431 (23.7%) |
| 8:30 AM to 8:59 AM | 26 (1.2%) | 45 (2.5%) |
| 9:00 AM to 9:59 AM | 31 (1.5%) | 41 (2.3%) |
| 10:00 AM to 10:59 AM | 36 (1.7%) | 50 (2.8%) |
| 11:00 AM to 11:59 AM | 26 (1.2%) | 28 (1.5%) |
| 12:00 PM to 3:59 PM | 491 (23.2%) | 57 (3.1%) |
| 4:00 PM to 11:59 PM | 106 (5.0%) | 99 (5.4%) |
| Total | 2,114 (100.0%) | 1,816 (100.0%) |
Housing Occupancy in Jackson
Occupancy by Ownership in Jackson
Of the total 3,505 dwellings in Jackson, owner-occupied units account for 2,369 (67.6%), while renter-occupied units make up 1,136 (32.4%).
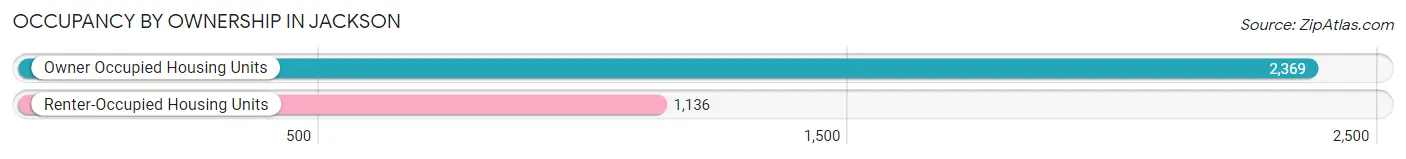
| Occupancy | # Housing Units | % Housing Units |
| Owner Occupied Housing Units | 2,369 | 67.6% |
| Renter-Occupied Housing Units | 1,136 | 32.4% |
| Total Occupied Housing Units | 3,505 | 100.0% |
Occupancy by Household Size in Jackson
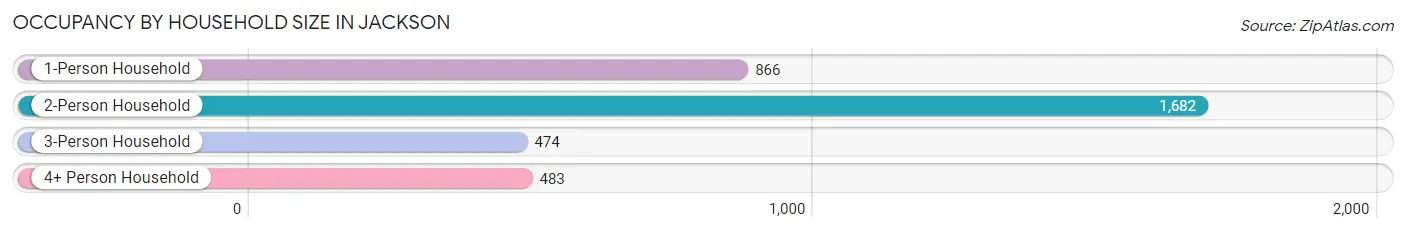
| Household Size | # Housing Units | % Housing Units |
| 1-Person Household | 866 | 24.7% |
| 2-Person Household | 1,682 | 48.0% |
| 3-Person Household | 474 | 13.5% |
| 4+ Person Household | 483 | 13.8% |
| Total Housing Units | 3,505 | 100.0% |
Occupancy by Ownership by Household Size in Jackson
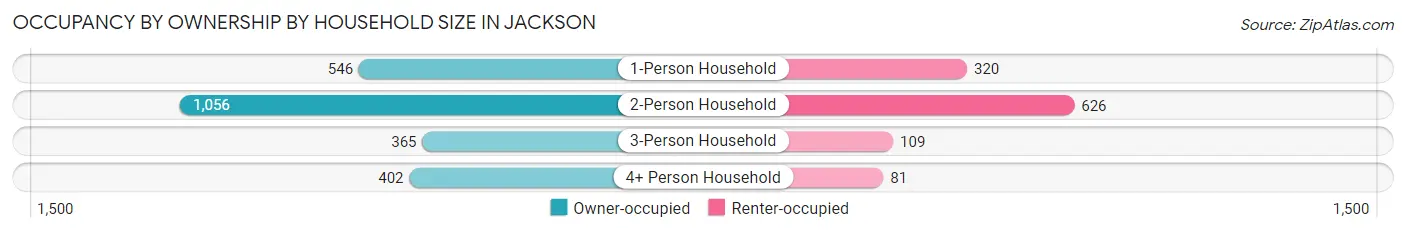
| Household Size | Owner-occupied | Renter-occupied |
| 1-Person Household | 546 (63.0%) | 320 (36.9%) |
| 2-Person Household | 1,056 (62.8%) | 626 (37.2%) |
| 3-Person Household | 365 (77.0%) | 109 (23.0%) |
| 4+ Person Household | 402 (83.2%) | 81 (16.8%) |
| Total Housing Units | 2,369 (67.6%) | 1,136 (32.4%) |
Occupancy by Educational Attainment in Jackson
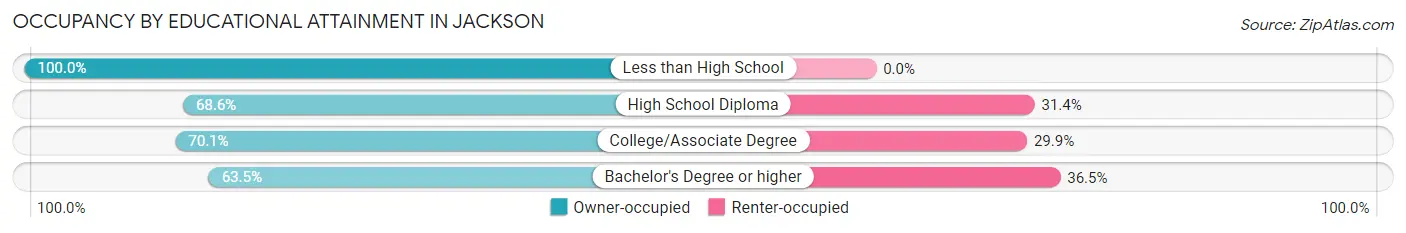
| Household Size | Owner-occupied | Renter-occupied |
| Less than High School | 42 (100.0%) | 0 (0.0%) |
| High School Diploma | 732 (68.6%) | 335 (31.4%) |
| College/Associate Degree | 783 (70.1%) | 334 (29.9%) |
| Bachelor's Degree or higher | 812 (63.5%) | 467 (36.5%) |
Occupancy by Age of Householder in Jackson

| Age Bracket | # Households | % Households |
| Under 35 Years | 739 | 21.1% |
| 35 to 44 Years | 624 | 17.8% |
| 45 to 54 Years | 686 | 19.6% |
| 55 to 64 Years | 732 | 20.9% |
| 65 to 74 Years | 451 | 12.9% |
| 75 to 84 Years | 221 | 6.3% |
| 85 Years and Over | 52 | 1.5% |
| Total | 3,505 | 100.0% |
Housing Finances in Jackson
Median Income by Occupancy in Jackson
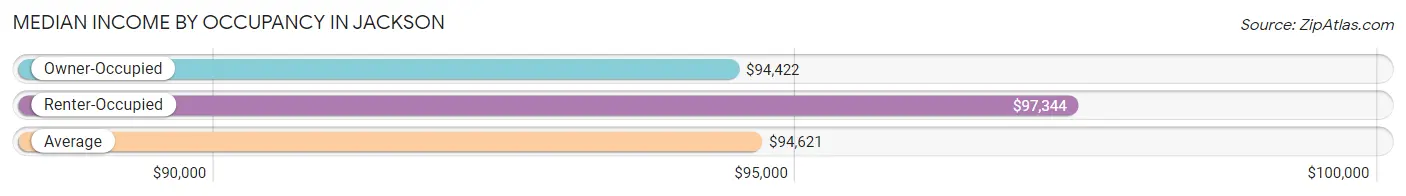
| Occupancy Type | # Households | Median Income |
| Owner-Occupied | 2,369 (67.6%) | $94,422 |
| Renter-Occupied | 1,136 (32.4%) | $97,344 |
| Average | 3,505 (100.0%) | $94,621 |
Occupancy by Householder Income Bracket in Jackson
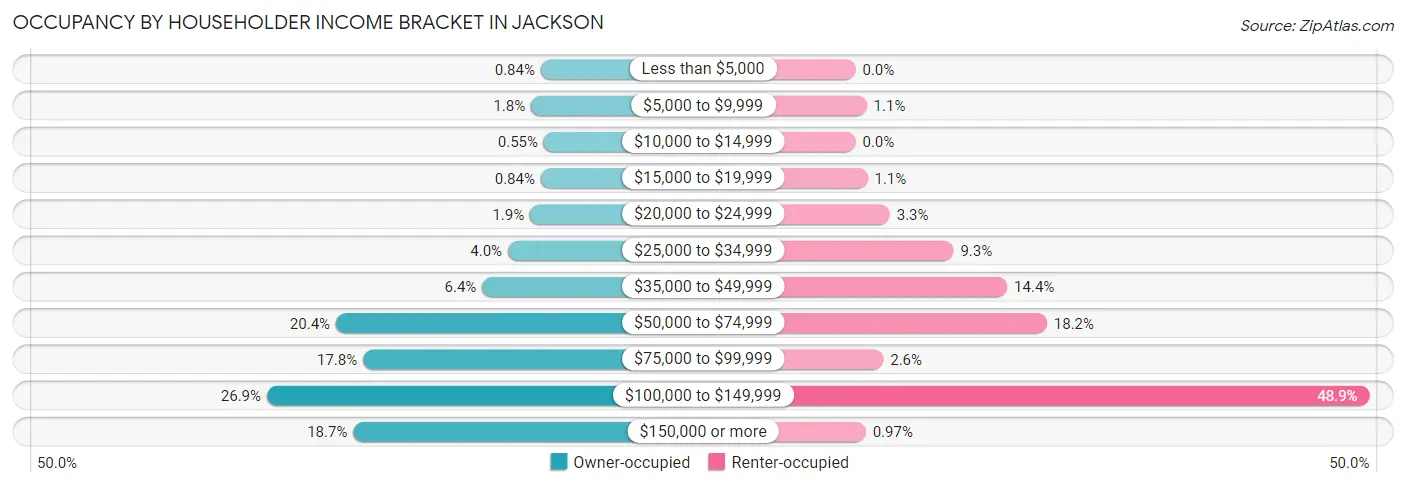
| Income Bracket | Owner-occupied | Renter-occupied |
| Less than $5,000 | 20 (0.8%) | 0 (0.0%) |
| $5,000 to $9,999 | 42 (1.8%) | 12 (1.1%) |
| $10,000 to $14,999 | 13 (0.5%) | 0 (0.0%) |
| $15,000 to $19,999 | 20 (0.8%) | 13 (1.1%) |
| $20,000 to $24,999 | 44 (1.9%) | 37 (3.3%) |
| $25,000 to $34,999 | 94 (4.0%) | 106 (9.3%) |
| $35,000 to $49,999 | 152 (6.4%) | 164 (14.4%) |
| $50,000 to $74,999 | 482 (20.3%) | 207 (18.2%) |
| $75,000 to $99,999 | 421 (17.8%) | 30 (2.6%) |
| $100,000 to $149,999 | 638 (26.9%) | 556 (48.9%) |
| $150,000 or more | 443 (18.7%) | 11 (1.0%) |
| Total | 2,369 (100.0%) | 1,136 (100.0%) |
Monthly Housing Cost Tiers in Jackson
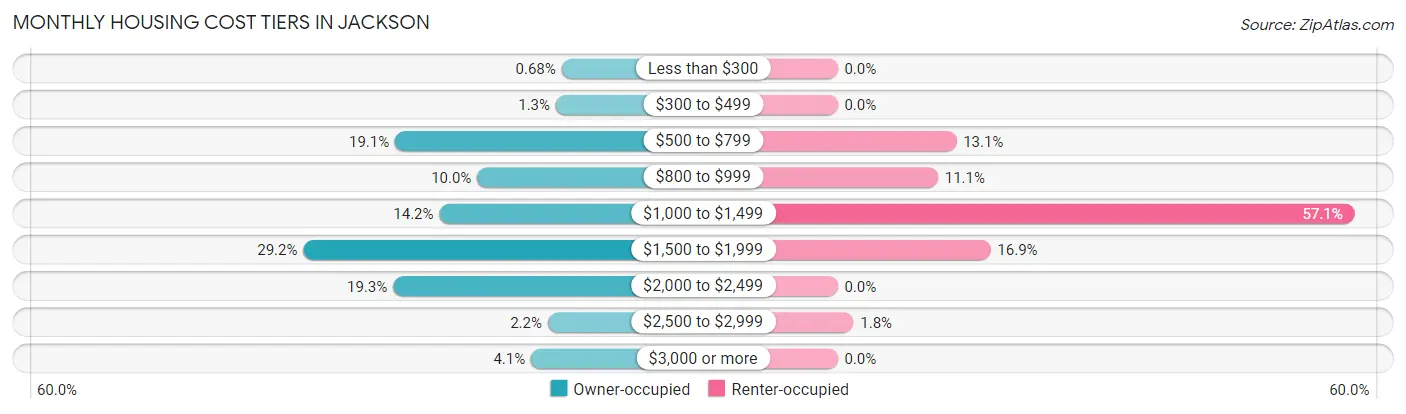
| Monthly Cost | Owner-occupied | Renter-occupied |
| Less than $300 | 16 (0.7%) | 0 (0.0%) |
| $300 to $499 | 31 (1.3%) | 0 (0.0%) |
| $500 to $799 | 452 (19.1%) | 149 (13.1%) |
| $800 to $999 | 237 (10.0%) | 126 (11.1%) |
| $1,000 to $1,499 | 336 (14.2%) | 649 (57.1%) |
| $1,500 to $1,999 | 692 (29.2%) | 192 (16.9%) |
| $2,000 to $2,499 | 457 (19.3%) | 0 (0.0%) |
| $2,500 to $2,999 | 52 (2.2%) | 20 (1.8%) |
| $3,000 or more | 96 (4.1%) | 0 (0.0%) |
| Total | 2,369 (100.0%) | 1,136 (100.0%) |
Physical Housing Characteristics in Jackson
Housing Structures in Jackson
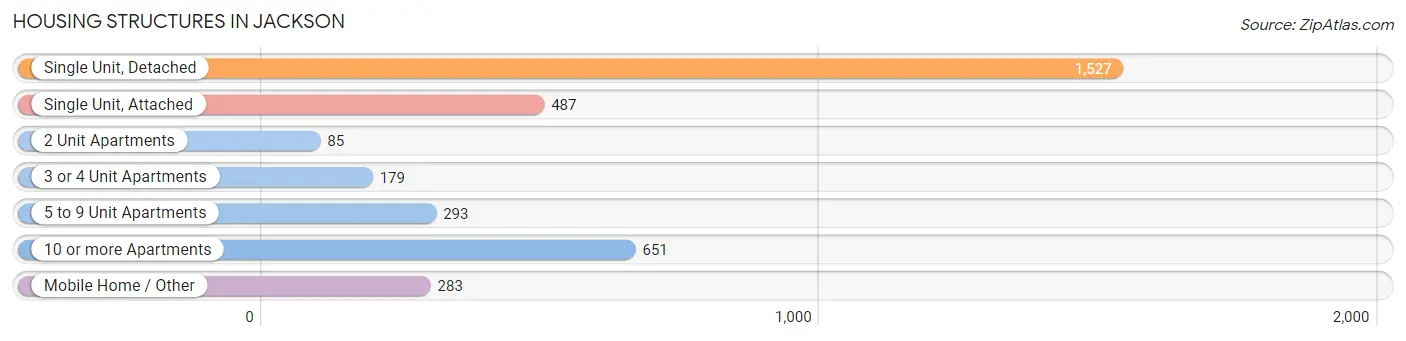
| Structure Type | # Housing Units | % Housing Units |
| Single Unit, Detached | 1,527 | 43.6% |
| Single Unit, Attached | 487 | 13.9% |
| 2 Unit Apartments | 85 | 2.4% |
| 3 or 4 Unit Apartments | 179 | 5.1% |
| 5 to 9 Unit Apartments | 293 | 8.4% |
| 10 or more Apartments | 651 | 18.6% |
| Mobile Home / Other | 283 | 8.1% |
| Total | 3,505 | 100.0% |
Housing Structures by Occupancy in Jackson
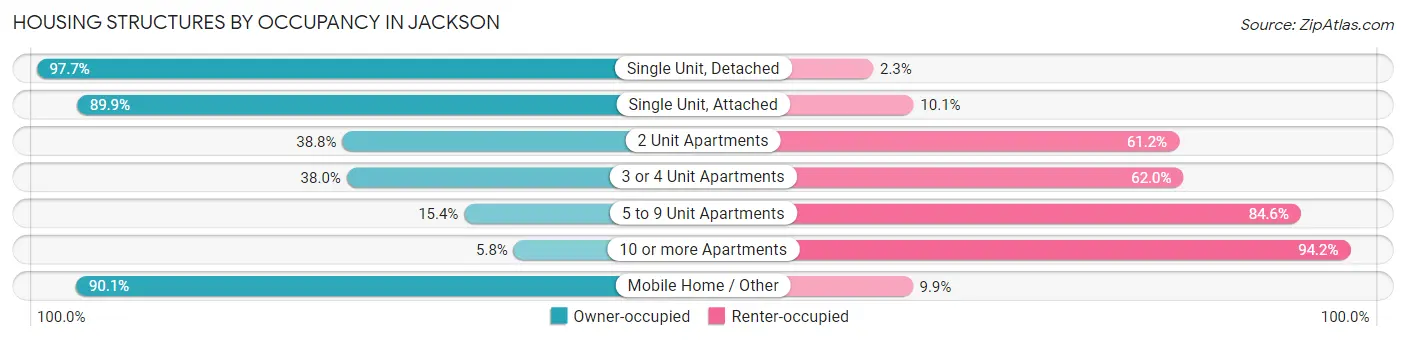
| Structure Type | Owner-occupied | Renter-occupied |
| Single Unit, Detached | 1,492 (97.7%) | 35 (2.3%) |
| Single Unit, Attached | 438 (89.9%) | 49 (10.1%) |
| 2 Unit Apartments | 33 (38.8%) | 52 (61.2%) |
| 3 or 4 Unit Apartments | 68 (38.0%) | 111 (62.0%) |
| 5 to 9 Unit Apartments | 45 (15.4%) | 248 (84.6%) |
| 10 or more Apartments | 38 (5.8%) | 613 (94.2%) |
| Mobile Home / Other | 255 (90.1%) | 28 (9.9%) |
| Total | 2,369 (67.6%) | 1,136 (32.4%) |
Housing Structures by Number of Rooms in Jackson
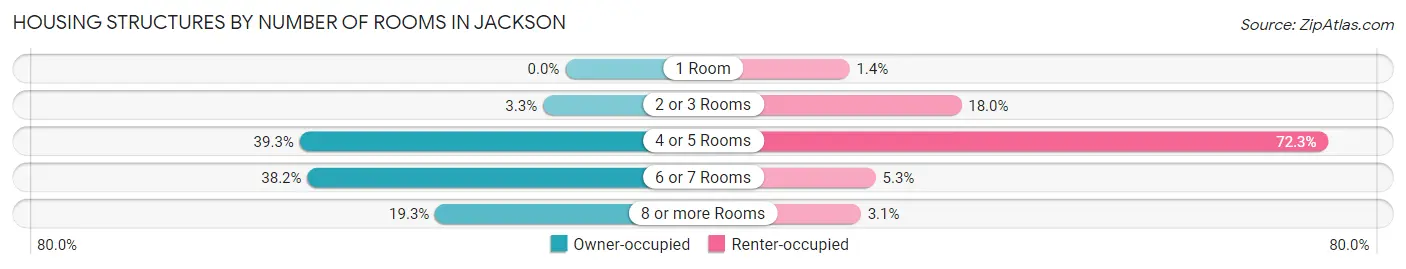
| Number of Rooms | Owner-occupied | Renter-occupied |
| 1 Room | 0 (0.0%) | 16 (1.4%) |
| 2 or 3 Rooms | 78 (3.3%) | 204 (18.0%) |
| 4 or 5 Rooms | 931 (39.3%) | 821 (72.3%) |
| 6 or 7 Rooms | 904 (38.2%) | 60 (5.3%) |
| 8 or more Rooms | 456 (19.3%) | 35 (3.1%) |
| Total | 2,369 (100.0%) | 1,136 (100.0%) |
Housing Structure by Heating Type in Jackson
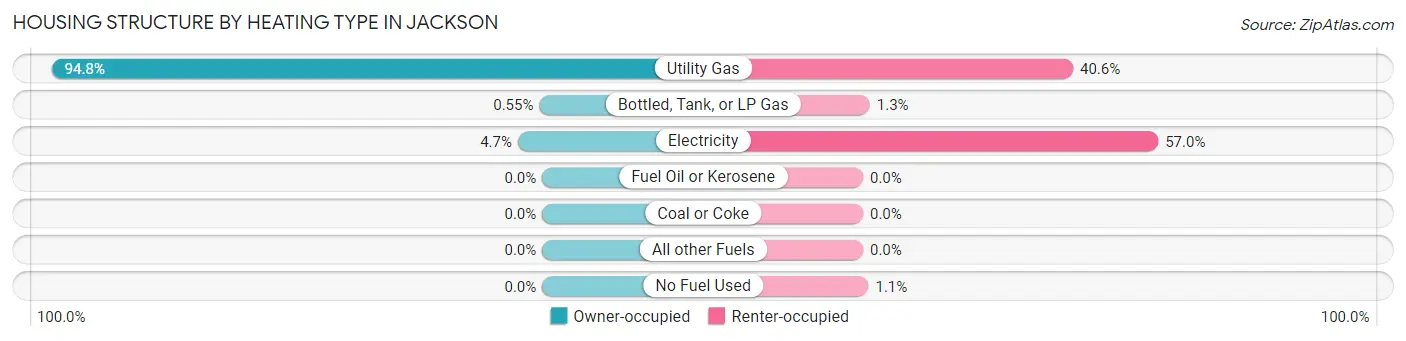
| Heating Type | Owner-occupied | Renter-occupied |
| Utility Gas | 2,245 (94.8%) | 461 (40.6%) |
| Bottled, Tank, or LP Gas | 13 (0.5%) | 15 (1.3%) |
| Electricity | 111 (4.7%) | 648 (57.0%) |
| Fuel Oil or Kerosene | 0 (0.0%) | 0 (0.0%) |
| Coal or Coke | 0 (0.0%) | 0 (0.0%) |
| All other Fuels | 0 (0.0%) | 0 (0.0%) |
| No Fuel Used | 0 (0.0%) | 12 (1.1%) |
| Total | 2,369 (100.0%) | 1,136 (100.0%) |
Household Vehicle Usage in Jackson
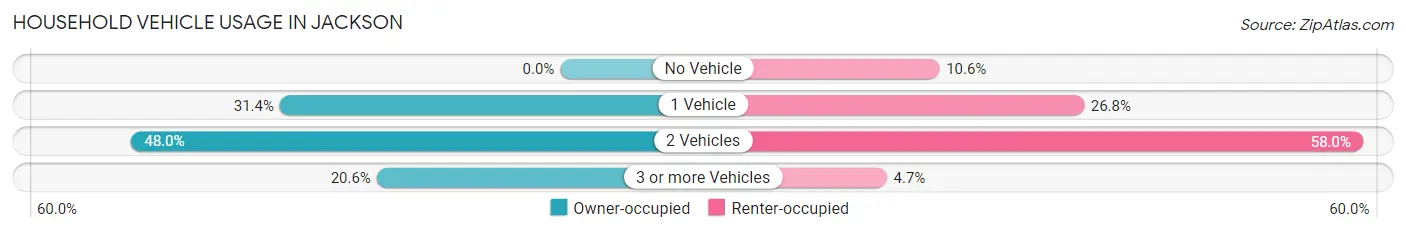
| Vehicles per Household | Owner-occupied | Renter-occupied |
| No Vehicle | 0 (0.0%) | 120 (10.6%) |
| 1 Vehicle | 744 (31.4%) | 304 (26.8%) |
| 2 Vehicles | 1,138 (48.0%) | 659 (58.0%) |
| 3 or more Vehicles | 487 (20.6%) | 53 (4.7%) |
| Total | 2,369 (100.0%) | 1,136 (100.0%) |
Real Estate & Mortgages in Jackson
Real Estate and Mortgage Overview in Jackson
| Characteristic | Without Mortgage | With Mortgage |
| Housing Units | 753 | 1,616 |
| Median Property Value | $208,300 | $286,800 |
| Median Household Income | $65,375 | $322 |
| Monthly Housing Costs | $715 | $96 |
| Real Estate Taxes | $3,727 | $0 |
Property Value by Mortgage Status in Jackson
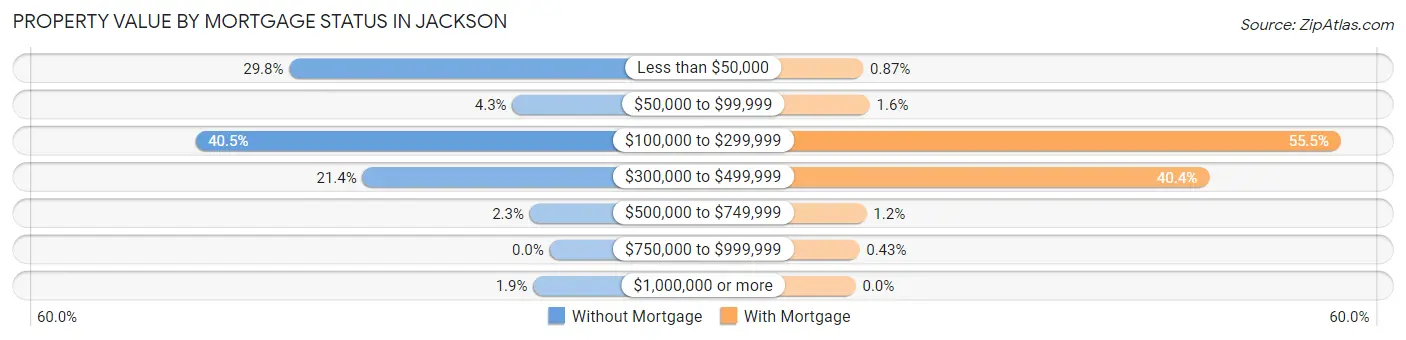
| Property Value | Without Mortgage | With Mortgage |
| Less than $50,000 | 224 (29.7%) | 14 (0.9%) |
| $50,000 to $99,999 | 32 (4.3%) | 26 (1.6%) |
| $100,000 to $299,999 | 305 (40.5%) | 896 (55.4%) |
| $300,000 to $499,999 | 161 (21.4%) | 653 (40.4%) |
| $500,000 to $749,999 | 17 (2.3%) | 20 (1.2%) |
| $750,000 to $999,999 | 0 (0.0%) | 7 (0.4%) |
| $1,000,000 or more | 14 (1.9%) | 0 (0.0%) |
| Total | 753 (100.0%) | 1,616 (100.0%) |
Household Income by Mortgage Status in Jackson
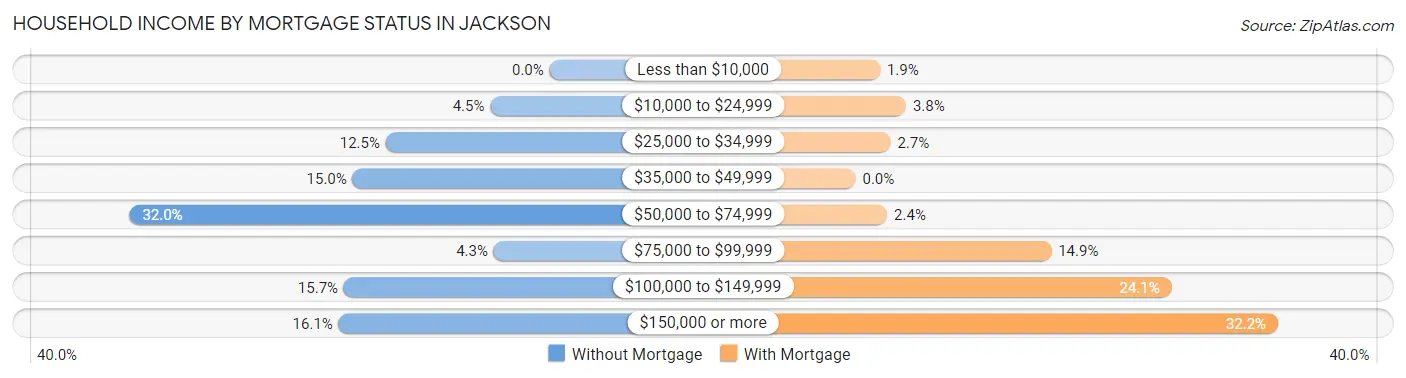
| Household Income | Without Mortgage | With Mortgage |
| Less than $10,000 | 0 (0.0%) | 30 (1.9%) |
| $10,000 to $24,999 | 34 (4.5%) | 62 (3.8%) |
| $25,000 to $34,999 | 94 (12.5%) | 43 (2.7%) |
| $35,000 to $49,999 | 113 (15.0%) | 0 (0.0%) |
| $50,000 to $74,999 | 241 (32.0%) | 39 (2.4%) |
| $75,000 to $99,999 | 32 (4.3%) | 241 (14.9%) |
| $100,000 to $149,999 | 118 (15.7%) | 389 (24.1%) |
| $150,000 or more | 121 (16.1%) | 520 (32.2%) |
| Total | 753 (100.0%) | 1,616 (100.0%) |
Property Value to Household Income Ratio in Jackson
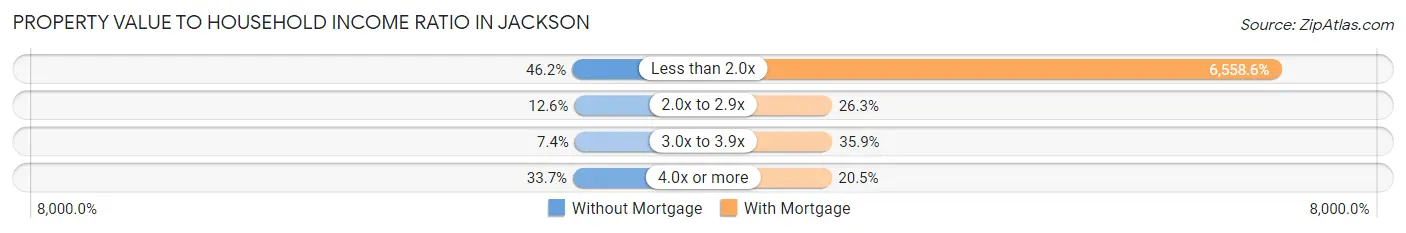
| Value-to-Income Ratio | Without Mortgage | With Mortgage |
| Less than 2.0x | 348 (46.2%) | 105,987 (6,558.6%) |
| 2.0x to 2.9x | 95 (12.6%) | 425 (26.3%) |
| 3.0x to 3.9x | 56 (7.4%) | 580 (35.9%) |
| 4.0x or more | 254 (33.7%) | 332 (20.5%) |
| Total | 753 (100.0%) | 1,616 (100.0%) |
Real Estate Taxes by Mortgage Status in Jackson
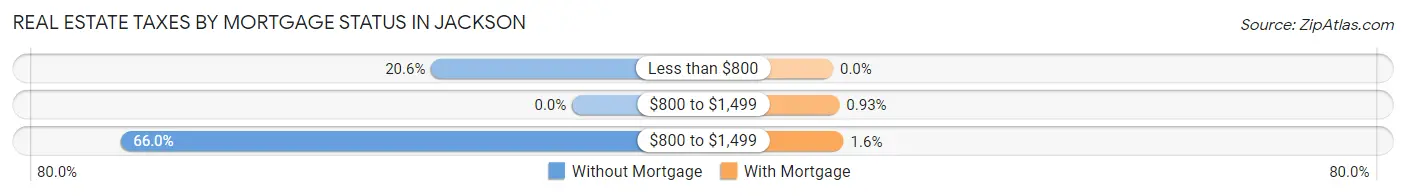
| Property Taxes | Without Mortgage | With Mortgage |
| Less than $800 | 155 (20.6%) | 0 (0.0%) |
| $800 to $1,499 | 0 (0.0%) | 15 (0.9%) |
| $800 to $1,499 | 497 (66.0%) | 25 (1.5%) |
| Total | 753 (100.0%) | 1,616 (100.0%) |
Health & Disability in Jackson
Health Insurance Coverage by Age in Jackson
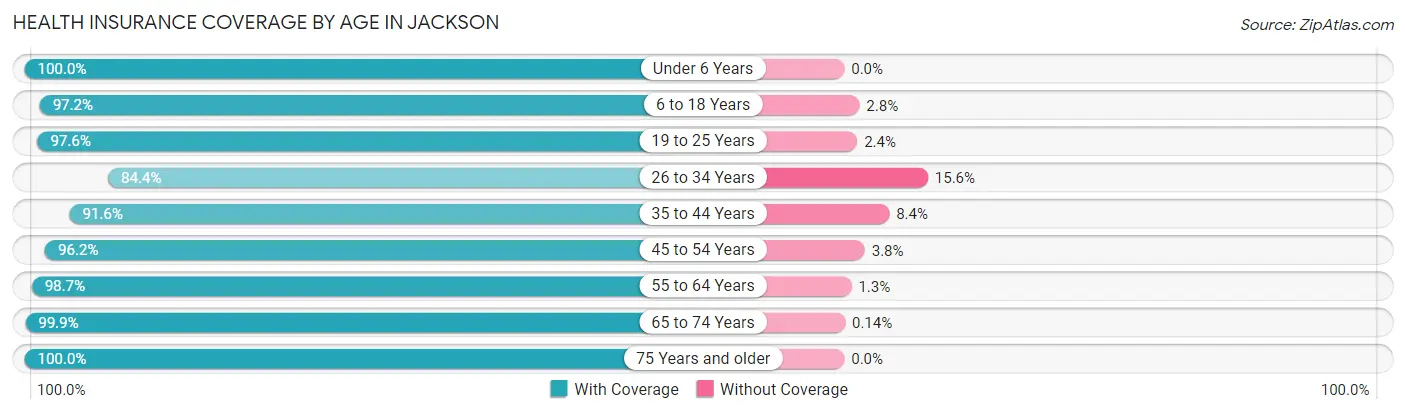
| Age Bracket | With Coverage | Without Coverage |
| Under 6 Years | 305 (100.0%) | 0 (0.0%) |
| 6 to 18 Years | 1,274 (97.2%) | 37 (2.8%) |
| 19 to 25 Years | 770 (97.6%) | 19 (2.4%) |
| 26 to 34 Years | 650 (84.4%) | 120 (15.6%) |
| 35 to 44 Years | 1,126 (91.6%) | 103 (8.4%) |
| 45 to 54 Years | 1,008 (96.2%) | 40 (3.8%) |
| 55 to 64 Years | 1,106 (98.7%) | 15 (1.3%) |
| 65 to 74 Years | 732 (99.9%) | 1 (0.1%) |
| 75 Years and older | 508 (100.0%) | 0 (0.0%) |
| Total | 7,479 (95.7%) | 335 (4.3%) |
Health Insurance Coverage by Citizenship Status in Jackson
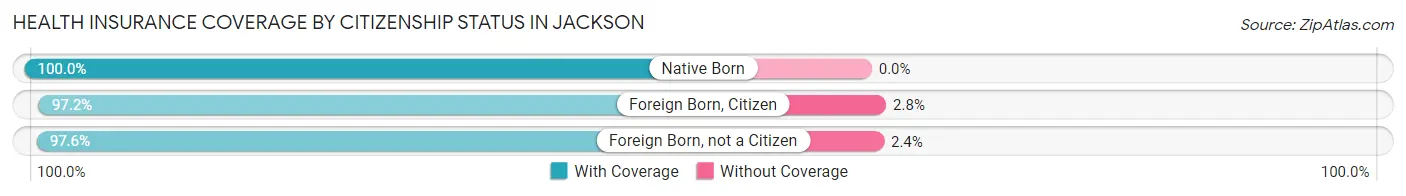
| Citizenship Status | With Coverage | Without Coverage |
| Native Born | 305 (100.0%) | 0 (0.0%) |
| Foreign Born, Citizen | 1,274 (97.2%) | 37 (2.8%) |
| Foreign Born, not a Citizen | 770 (97.6%) | 19 (2.4%) |
Health Insurance Coverage by Household Income in Jackson
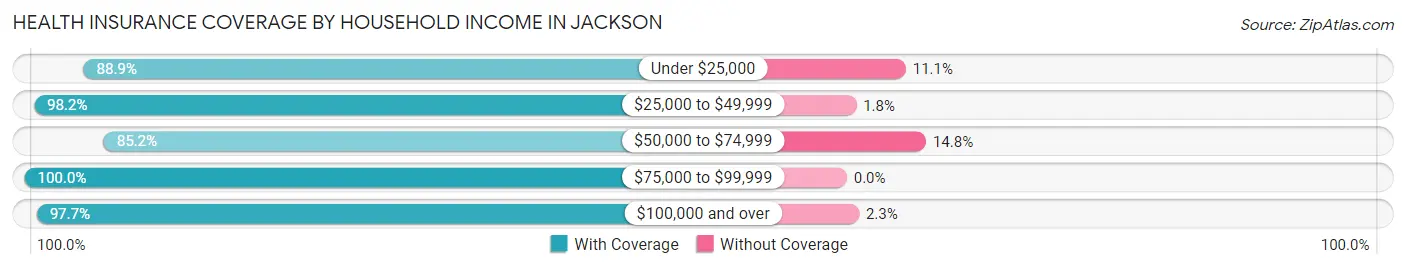
| Household Income | With Coverage | Without Coverage |
| Under $25,000 | 209 (88.9%) | 26 (11.1%) |
| $25,000 to $49,999 | 832 (98.2%) | 15 (1.8%) |
| $50,000 to $74,999 | 1,125 (85.2%) | 196 (14.8%) |
| $75,000 to $99,999 | 1,139 (100.0%) | 0 (0.0%) |
| $100,000 and over | 4,162 (97.7%) | 97 (2.3%) |
Public vs Private Health Insurance Coverage by Age in Jackson
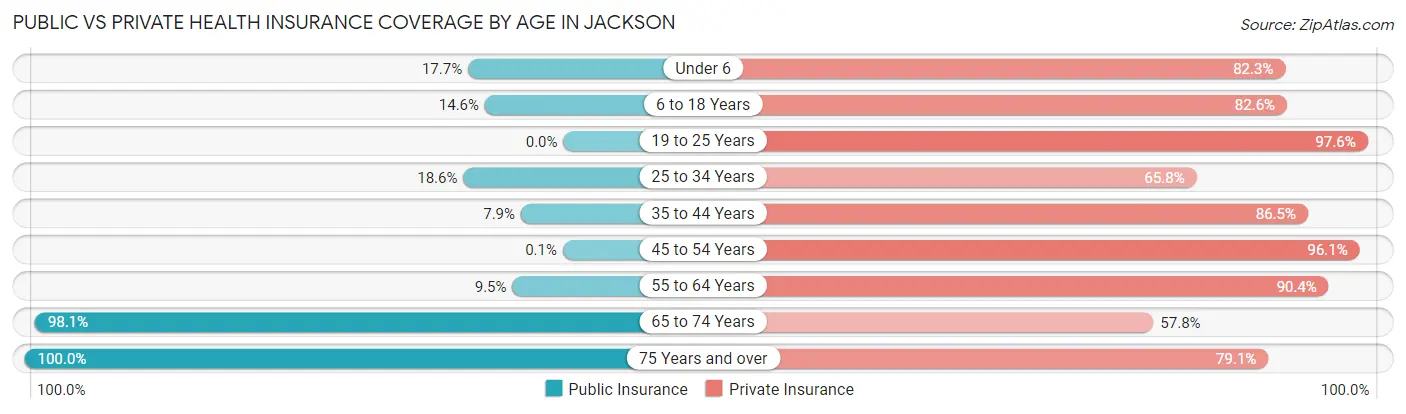
| Age Bracket | Public Insurance | Private Insurance |
| Under 6 | 54 (17.7%) | 251 (82.3%) |
| 6 to 18 Years | 191 (14.6%) | 1,083 (82.6%) |
| 19 to 25 Years | 0 (0.0%) | 770 (97.6%) |
| 25 to 34 Years | 143 (18.6%) | 507 (65.8%) |
| 35 to 44 Years | 97 (7.9%) | 1,063 (86.5%) |
| 45 to 54 Years | 1 (0.1%) | 1,007 (96.1%) |
| 55 to 64 Years | 106 (9.5%) | 1,013 (90.4%) |
| 65 to 74 Years | 719 (98.1%) | 424 (57.8%) |
| 75 Years and over | 508 (100.0%) | 402 (79.1%) |
| Total | 1,819 (23.3%) | 6,520 (83.4%) |
Disability Status by Sex by Age in Jackson
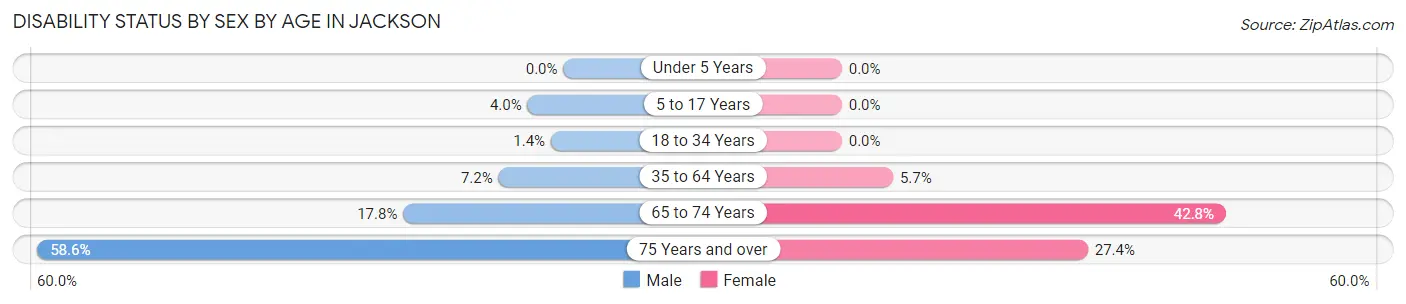
| Age Bracket | Male | Female |
| Under 5 Years | 0 (0.0%) | 0 (0.0%) |
| 5 to 17 Years | 30 (4.0%) | 0 (0.0%) |
| 18 to 34 Years | 12 (1.4%) | 0 (0.0%) |
| 35 to 64 Years | 120 (7.2%) | 99 (5.7%) |
| 65 to 74 Years | 69 (17.8%) | 148 (42.8%) |
| 75 Years and over | 133 (58.6%) | 77 (27.4%) |
Disability Class by Sex by Age in Jackson
Disability Class: Hearing Difficulty
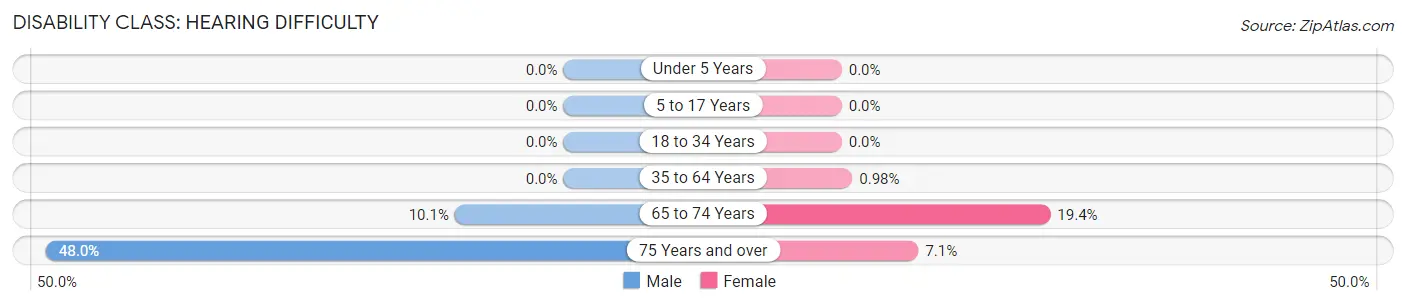
| Age Bracket | Male | Female |
| Under 5 Years | 0 (0.0%) | 0 (0.0%) |
| 5 to 17 Years | 0 (0.0%) | 0 (0.0%) |
| 18 to 34 Years | 0 (0.0%) | 0 (0.0%) |
| 35 to 64 Years | 0 (0.0%) | 17 (1.0%) |
| 65 to 74 Years | 39 (10.1%) | 67 (19.4%) |
| 75 Years and over | 109 (48.0%) | 20 (7.1%) |
Disability Class: Vision Difficulty
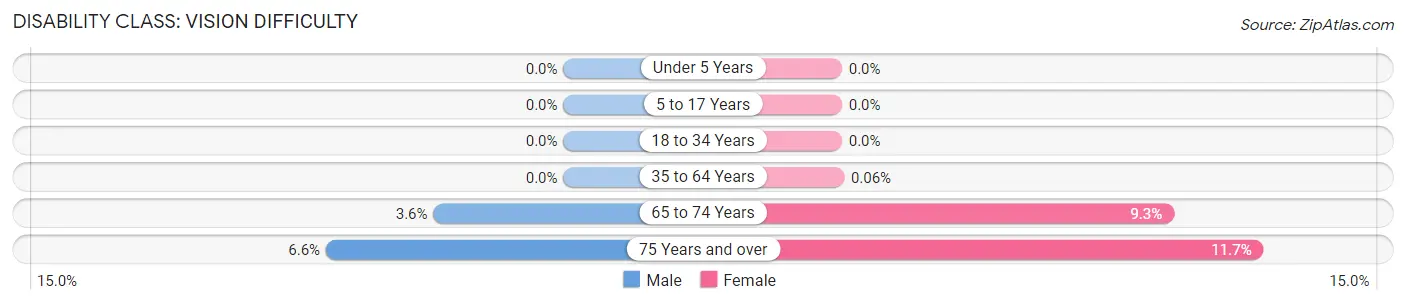
| Age Bracket | Male | Female |
| Under 5 Years | 0 (0.0%) | 0 (0.0%) |
| 5 to 17 Years | 0 (0.0%) | 0 (0.0%) |
| 18 to 34 Years | 0 (0.0%) | 0 (0.0%) |
| 35 to 64 Years | 0 (0.0%) | 1 (0.1%) |
| 65 to 74 Years | 14 (3.6%) | 32 (9.2%) |
| 75 Years and over | 15 (6.6%) | 33 (11.7%) |
Disability Class: Cognitive Difficulty
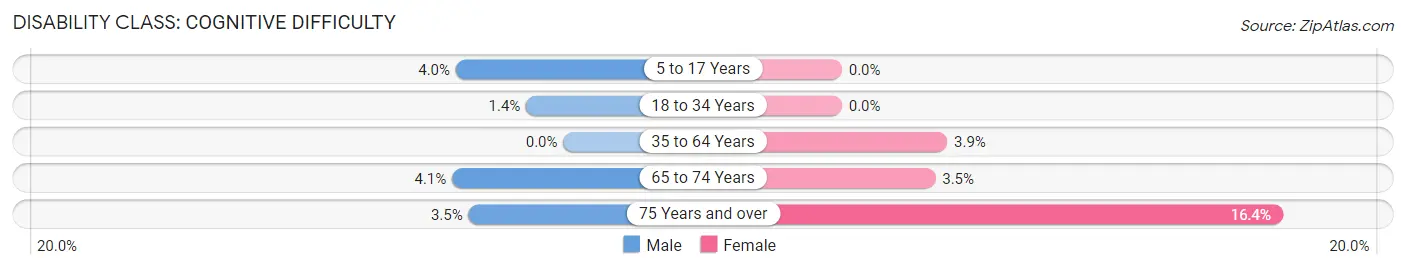
| Age Bracket | Male | Female |
| 5 to 17 Years | 30 (4.0%) | 0 (0.0%) |
| 18 to 34 Years | 12 (1.4%) | 0 (0.0%) |
| 35 to 64 Years | 0 (0.0%) | 68 (3.9%) |
| 65 to 74 Years | 16 (4.1%) | 12 (3.5%) |
| 75 Years and over | 8 (3.5%) | 46 (16.4%) |
Disability Class: Ambulatory Difficulty
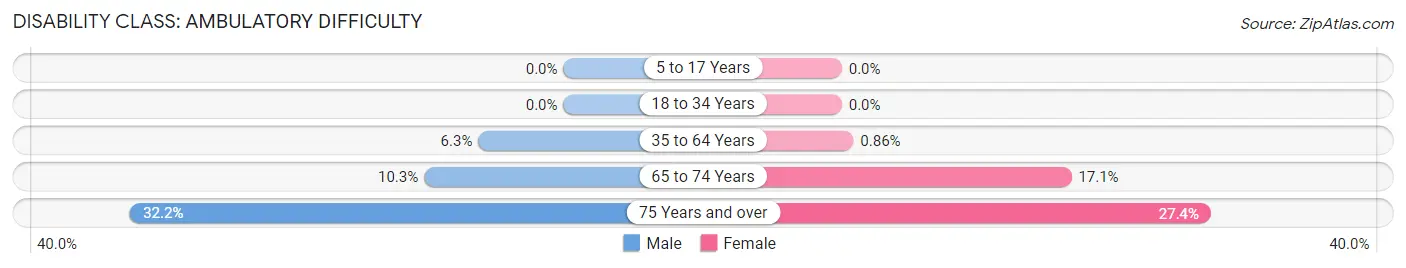
| Age Bracket | Male | Female |
| 5 to 17 Years | 0 (0.0%) | 0 (0.0%) |
| 18 to 34 Years | 0 (0.0%) | 0 (0.0%) |
| 35 to 64 Years | 105 (6.3%) | 15 (0.9%) |
| 65 to 74 Years | 40 (10.3%) | 59 (17.1%) |
| 75 Years and over | 73 (32.2%) | 77 (27.4%) |
Disability Class: Self-Care Difficulty
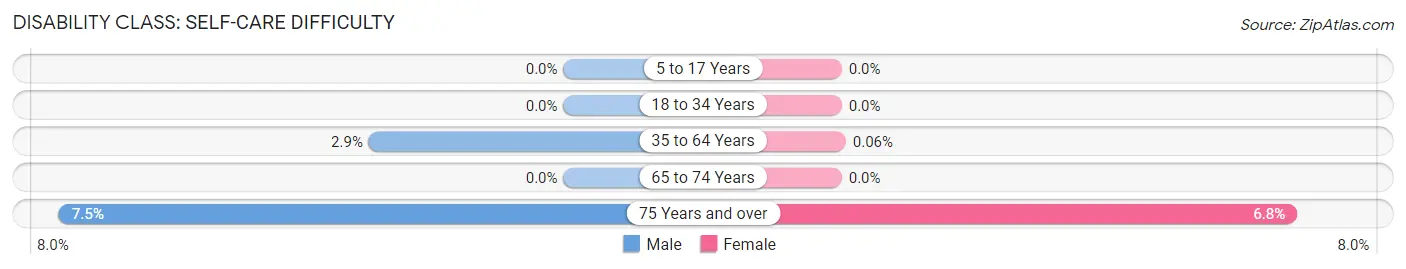
| Age Bracket | Male | Female |
| 5 to 17 Years | 0 (0.0%) | 0 (0.0%) |
| 18 to 34 Years | 0 (0.0%) | 0 (0.0%) |
| 35 to 64 Years | 48 (2.9%) | 1 (0.1%) |
| 65 to 74 Years | 0 (0.0%) | 0 (0.0%) |
| 75 Years and over | 17 (7.5%) | 19 (6.8%) |
Technology Access in Jackson
Computing Device Access in Jackson
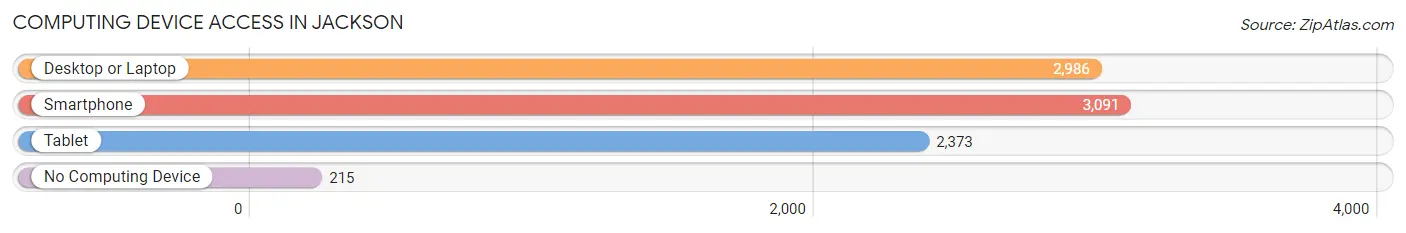
| Device Type | # Households | % Households |
| Desktop or Laptop | 2,986 | 85.2% |
| Smartphone | 3,091 | 88.2% |
| Tablet | 2,373 | 67.7% |
| No Computing Device | 215 | 6.1% |
| Total | 3,505 | 100.0% |
Internet Access in Jackson
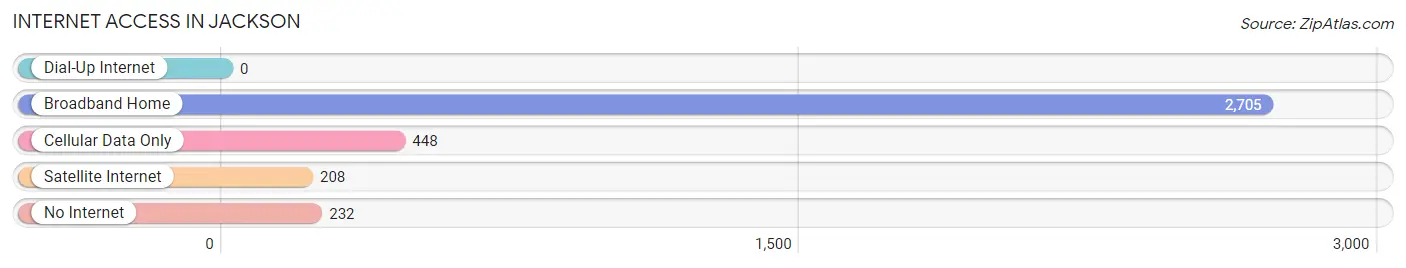
| Internet Type | # Households | % Households |
| Dial-Up Internet | 0 | 0.0% |
| Broadband Home | 2,705 | 77.2% |
| Cellular Data Only | 448 | 12.8% |
| Satellite Internet | 208 | 5.9% |
| No Internet | 232 | 6.6% |
| Total | 3,505 | 100.0% |
Jackson Summary
Jackson, Wisconsin is a small town located in Washington County, Wisconsin. It is situated on the banks of the Milwaukee River and is part of the Milwaukee metropolitan area. The town was founded in 1845 and has a population of approximately 4,000 people.
History
Jackson was founded in 1845 by a group of settlers from New York. The town was named after Andrew Jackson, the seventh president of the United States. The settlers were attracted to the area due to its fertile soil and abundant natural resources. The town quickly grew and by the late 1800s, it had become a thriving agricultural community.
In the early 1900s, Jackson began to experience a period of industrialization. The Milwaukee River was used to power several factories, including a paper mill, a flour mill, and a sawmill. The town also became a center for the production of bricks and tiles.
In the 1950s, Jackson began to experience a period of decline. Many of the factories closed and the population began to decline. However, in the late 1980s, the town began to experience a period of revitalization. The town was designated as a historic district and several new businesses opened.
Geography
Jackson is located in Washington County, Wisconsin. It is situated on the banks of the Milwaukee River and is part of the Milwaukee metropolitan area. The town is located approximately 25 miles north of Milwaukee and is bordered by the towns of Germantown, Richfield, and Slinger.
The town has a total area of 1.3 square miles, all of which is land. The terrain is mostly flat and the town is located at an elevation of 845 feet above sea level. The climate is humid continental, with cold winters and hot summers.
Economy
Jackson’s economy is largely based on agriculture and manufacturing. The town is home to several small businesses, including a grocery store, a hardware store, and a restaurant. The town also has a small industrial park, which is home to several light manufacturing businesses.
The town is also home to several tourist attractions, including the Jackson Historical Society Museum and the Jackson County Fairgrounds. The town also hosts several annual events, including the Jackson County Fair and the Jackson County Music Festival.
Demographics
As of the 2010 census, Jackson had a population of 4,000 people. The racial makeup of the town was 97.2% White, 0.7% African American, 0.3% Native American, 0.3% Asian, 0.2% from other races, and 1.5% from two or more races. Hispanic or Latino of any race were 1.2% of the population.
The median income for a household in Jackson was $50,000 and the median income for a family was $60,000. The per capita income for the town was $25,000. About 8.3% of families and 10.2% of the population were below the poverty line, including 14.3% of those under age 18 and 6.2% of those age 65 or over.
Jackson is a small town with a rich history and a vibrant economy. The town is home to several small businesses and tourist attractions, and is a great place to live and work. The town has a diverse population and a strong sense of community.
Common Questions
What is Per Capita Income in Jackson?
Per Capita income in Jackson is $45,384.
What is the Median Family Income in Jackson?
Median Family Income in Jackson is $102,312.
What is the Median Household income in Jackson?
Median Household Income in Jackson is $94,621.
What is Income or Wage Gap in Jackson?
Income or Wage Gap in Jackson is 22.1%.
Women in Jackson earn 77.9 cents for every dollar earned by a man.
What is Inequality or Gini Index in Jackson?
Inequality or Gini Index in Jackson is 0.33.
What is the Total Population of Jackson?
Total Population of Jackson is 7,814.
What is the Total Male Population of Jackson?
Total Male Population of Jackson is 3,969.
What is the Total Female Population of Jackson?
Total Female Population of Jackson is 3,845.
What is the Ratio of Males per 100 Females in Jackson?
There are 103.22 Males per 100 Females in Jackson.
What is the Ratio of Females per 100 Males in Jackson?
There are 96.88 Females per 100 Males in Jackson.
What is the Median Population Age in Jackson?
Median Population Age in Jackson is 41.4 Years.
What is the Average Family Size in Jackson
Average Family Size in Jackson is 2.7 People.
What is the Average Household Size in Jackson
Average Household Size in Jackson is 2.2 People.
How Large is the Labor Force in Jackson?
There are 4,781 People in the Labor Forcein in Jackson.
What is the Percentage of People in the Labor Force in Jackson?
73.9% of People are in the Labor Force in Jackson.
What is the Unemployment Rate in Jackson?
Unemployment Rate in Jackson is 5.9%.