Hixton, WI Map & Demographics
Hixton Map
Hixton Overview
$32,880
PER CAPITA INCOME
$95,288
AVG FAMILY INCOME
$83,750
AVG HOUSEHOLD INCOME
3.3%
WAGE / INCOME GAP [ % ]
96.7¢/ $1
WAGE / INCOME GAP [ $ ]
0.30
INEQUALITY / GINI INDEX
424
TOTAL POPULATION
243
MALE POPULATION
181
FEMALE POPULATION
134.25
MALES / 100 FEMALES
74.49
FEMALES / 100 MALES
50.1
MEDIAN AGE
3.0
AVG FAMILY SIZE
2.5
AVG HOUSEHOLD SIZE
288
LABOR FORCE [ PEOPLE ]
76.2%
PERCENT IN LABOR FORCE
8.7%
UNEMPLOYMENT RATE
Hixton Zip Codes
Hixton Area Codes
Income in Hixton
Income Overview in Hixton
Per Capita Income in Hixton is $32,880, while median incomes of families and households are $95,288 and $83,750 respectively.
| Characteristic | Number | Measure |
| Per Capita Income | 424 | $32,880 |
| Median Family Income | 123 | $95,288 |
| Mean Family Income | 123 | $91,737 |
| Median Household Income | 168 | $83,750 |
| Mean Household Income | 168 | $80,059 |
| Income Deficit | 123 | $0 |
| Wage / Income Gap (%) | 424 | 3.25% |
| Wage / Income Gap ($) | 424 | 96.75¢ per $1 |
| Gini / Inequality Index | 424 | 0.30 |
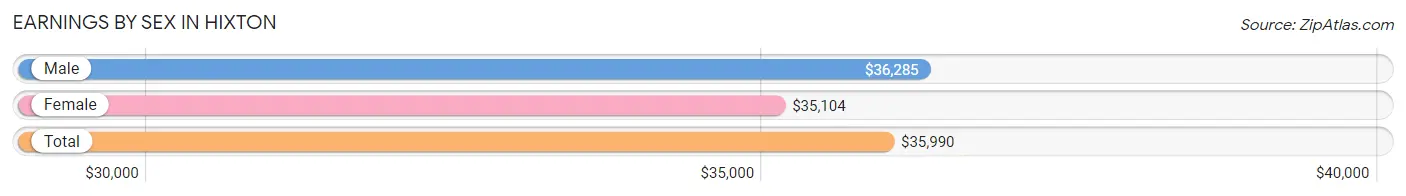
Earnings by Sex in Hixton
Average Earnings in Hixton are $35,990, $36,285 for men and $35,104 for women, a difference of 3.3%.
| Sex | Number | Average Earnings |
| Male | 183 (61.8%) | $36,285 |
| Female | 113 (38.2%) | $35,104 |
| Total | 296 (100.0%) | $35,990 |
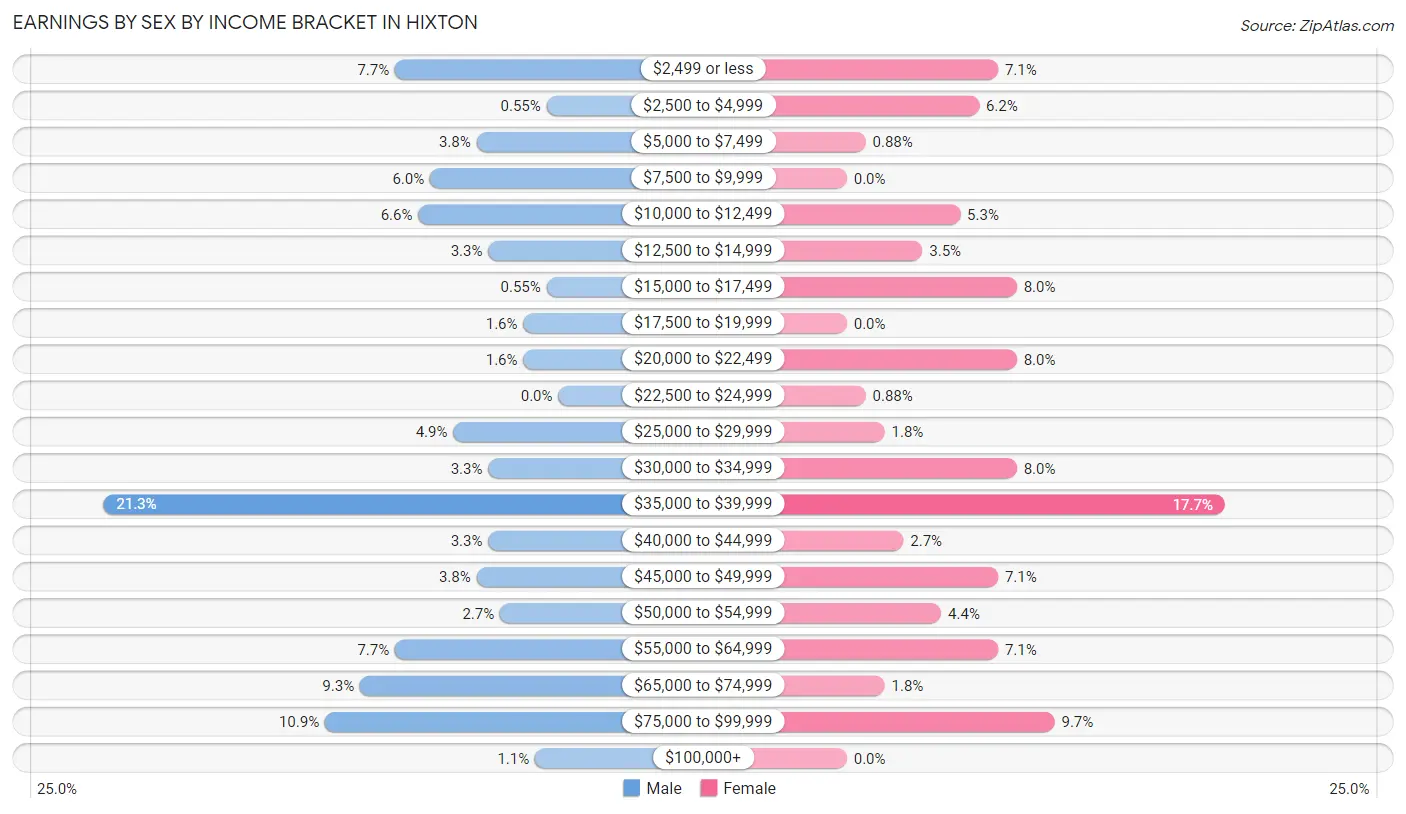
Earnings by Sex by Income Bracket in Hixton
The most common earnings brackets in Hixton are $35,000 to $39,999 for men (39 | 21.3%) and $35,000 to $39,999 for women (20 | 17.7%).
| Income | Male | Female |
| $2,499 or less | 14 (7.6%) | 8 (7.1%) |
| $2,500 to $4,999 | 1 (0.5%) | 7 (6.2%) |
| $5,000 to $7,499 | 7 (3.8%) | 1 (0.9%) |
| $7,500 to $9,999 | 11 (6.0%) | 0 (0.0%) |
| $10,000 to $12,499 | 12 (6.6%) | 6 (5.3%) |
| $12,500 to $14,999 | 6 (3.3%) | 4 (3.5%) |
| $15,000 to $17,499 | 1 (0.5%) | 9 (8.0%) |
| $17,500 to $19,999 | 3 (1.6%) | 0 (0.0%) |
| $20,000 to $22,499 | 3 (1.6%) | 9 (8.0%) |
| $22,500 to $24,999 | 0 (0.0%) | 1 (0.9%) |
| $25,000 to $29,999 | 9 (4.9%) | 2 (1.8%) |
| $30,000 to $34,999 | 6 (3.3%) | 9 (8.0%) |
| $35,000 to $39,999 | 39 (21.3%) | 20 (17.7%) |
| $40,000 to $44,999 | 6 (3.3%) | 3 (2.6%) |
| $45,000 to $49,999 | 7 (3.8%) | 8 (7.1%) |
| $50,000 to $54,999 | 5 (2.7%) | 5 (4.4%) |
| $55,000 to $64,999 | 14 (7.6%) | 8 (7.1%) |
| $65,000 to $74,999 | 17 (9.3%) | 2 (1.8%) |
| $75,000 to $99,999 | 20 (10.9%) | 11 (9.7%) |
| $100,000+ | 2 (1.1%) | 0 (0.0%) |
| Total | 183 (100.0%) | 113 (100.0%) |
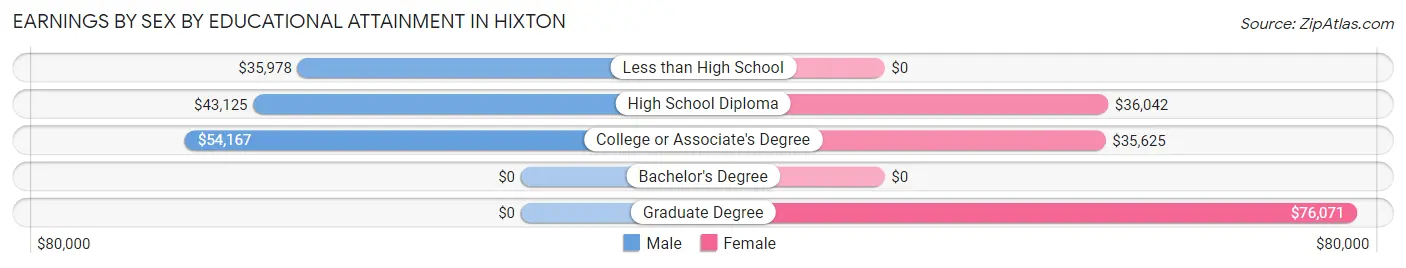
Earnings by Sex by Educational Attainment in Hixton
Average earnings in Hixton are $37,500 for men and $36,875 for women, a difference of 1.7%. Men with an educational attainment of college or associate's degree enjoy the highest average annual earnings of $54,167, while those with less than high school education earn the least with $35,978. Women with an educational attainment of graduate degree earn the most with the average annual earnings of $76,071, while those with college or associate's degree education have the smallest earnings of $35,625.
| Educational Attainment | Male Income | Female Income |
| Less than High School | $35,978 | $0 |
| High School Diploma | $43,125 | $36,042 |
| College or Associate's Degree | $54,167 | $35,625 |
| Bachelor's Degree | - | - |
| Graduate Degree | - | - |
| Total | $37,500 | $36,875 |
Family Income in Hixton
Family Income Brackets in Hixton
According to the Hixton family income data, there are 39 families falling into the $75,000 to $99,999 income range, which is the most common income bracket and makes up 31.7% of all families.
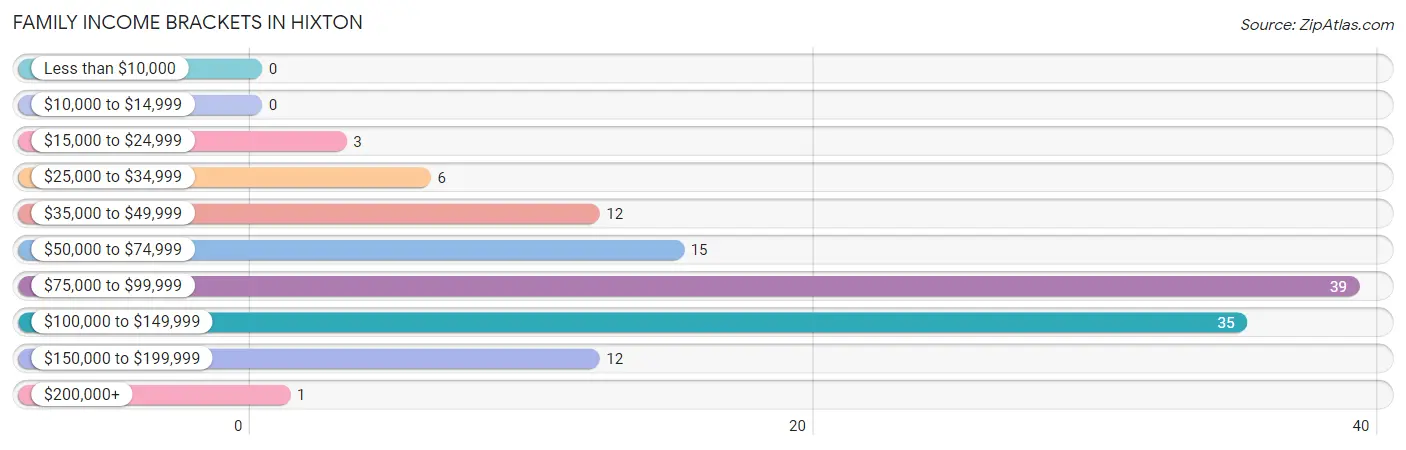
| Income Bracket | # Families | % Families |
| Less than $10,000 | 0 | 0.0% |
| $10,000 to $14,999 | 0 | 0.0% |
| $15,000 to $24,999 | 3 | 2.4% |
| $25,000 to $34,999 | 6 | 4.9% |
| $35,000 to $49,999 | 12 | 9.8% |
| $50,000 to $74,999 | 15 | 12.2% |
| $75,000 to $99,999 | 39 | 31.7% |
| $100,000 to $149,999 | 35 | 28.5% |
| $150,000 to $199,999 | 12 | 9.8% |
| $200,000+ | 1 | 0.8% |
Family Income by Famaliy Size in Hixton
4-person families (21 | 17.1%) account for the highest median family income in Hixton with $114,583 per family, while 2-person families (68 | 55.3%) have the highest median income of $47,500 per family member.
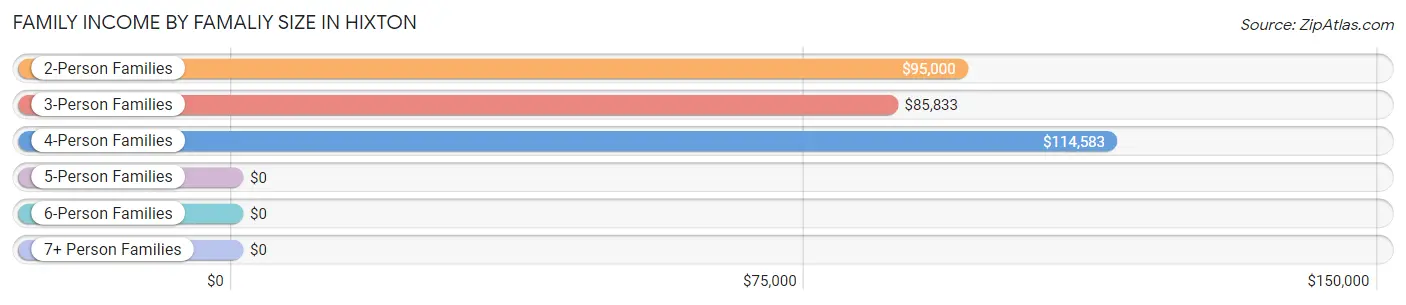
| Income Bracket | # Families | Median Income |
| 2-Person Families | 68 (55.3%) | $95,000 |
| 3-Person Families | 26 (21.1%) | $85,833 |
| 4-Person Families | 21 (17.1%) | $114,583 |
| 5-Person Families | 0 (0.0%) | $0 |
| 6-Person Families | 2 (1.6%) | $0 |
| 7+ Person Families | 6 (4.9%) | $0 |
| Total | 123 (100.0%) | $95,288 |
Family Income by Number of Earners in Hixton
The median family income in Hixton is $95,288, with families comprising 2 earners (50) having the highest median family income of $101,250, while families with no earners (12) have the lowest median family income of $43,333, accounting for 40.6% and 9.8% of families, respectively.
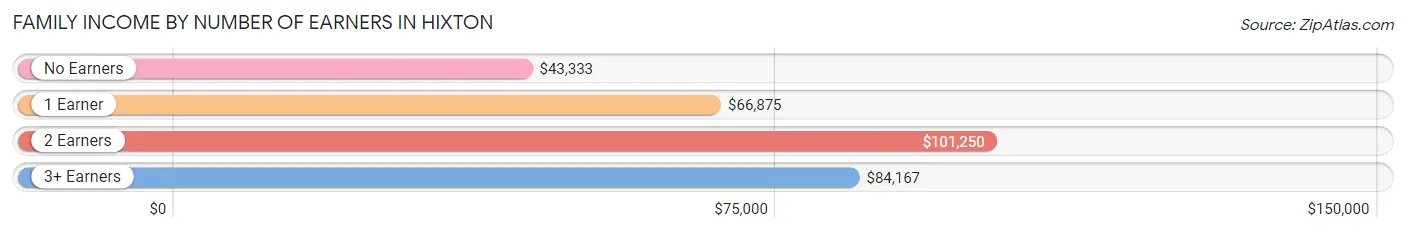
| Number of Earners | # Families | Median Income |
| No Earners | 12 (9.8%) | $43,333 |
| 1 Earner | 39 (31.7%) | $66,875 |
| 2 Earners | 50 (40.6%) | $101,250 |
| 3+ Earners | 22 (17.9%) | $84,167 |
| Total | 123 (100.0%) | $95,288 |
Household Income in Hixton
Household Income Brackets in Hixton
With 43 households falling in the category, the $75,000 to $99,999 income range is the most frequent in Hixton, accounting for 25.6% of all households. In contrast, only 1 households (0.6%) fall into the $200,000+ income bracket, making it the least populous group.
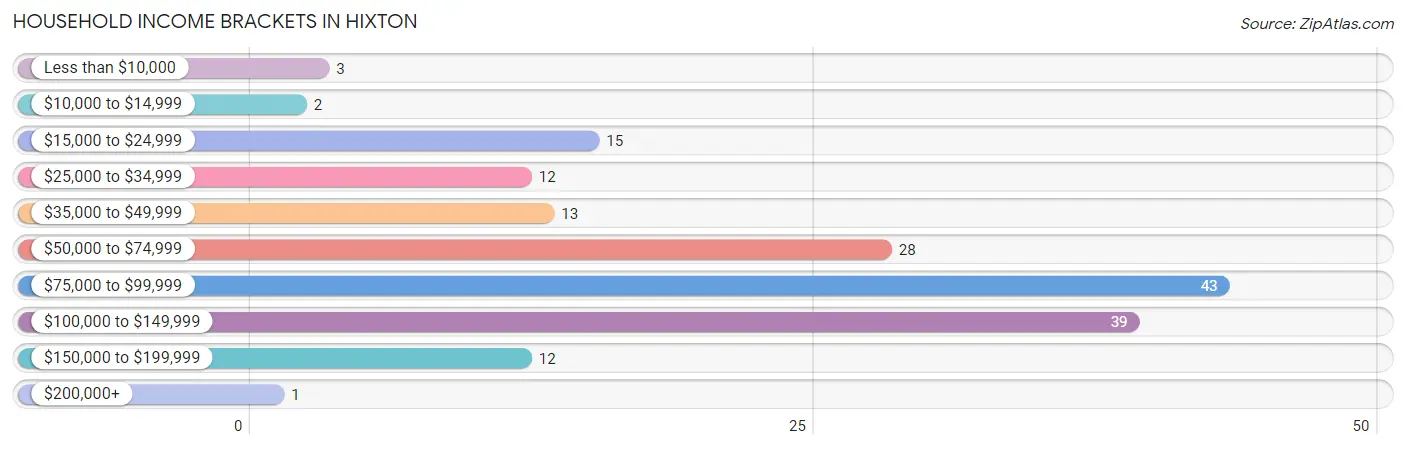
| Income Bracket | # Households | % Households |
| Less than $10,000 | 3 | 1.8% |
| $10,000 to $14,999 | 2 | 1.2% |
| $15,000 to $24,999 | 15 | 8.9% |
| $25,000 to $34,999 | 12 | 7.1% |
| $35,000 to $49,999 | 13 | 7.7% |
| $50,000 to $74,999 | 28 | 16.7% |
| $75,000 to $99,999 | 43 | 25.6% |
| $100,000 to $149,999 | 39 | 23.2% |
| $150,000 to $199,999 | 12 | 7.1% |
| $200,000+ | 1 | 0.6% |
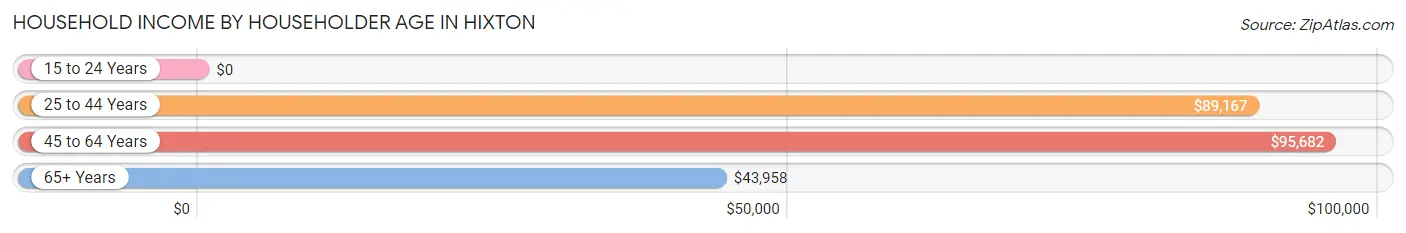
Household Income by Householder Age in Hixton
The median household income in Hixton is $83,750, with the highest median household income of $95,682 found in the 45 to 64 years age bracket for the primary householder. A total of 98 households (58.3%) fall into this category. Meanwhile, the 15 to 24 years age bracket for the primary householder has the lowest median household income of $0, with 3 households (1.8%) in this group.
| Income Bracket | # Households | Median Income |
| 15 to 24 Years | 3 (1.8%) | $0 |
| 25 to 44 Years | 32 (19.1%) | $89,167 |
| 45 to 64 Years | 98 (58.3%) | $95,682 |
| 65+ Years | 35 (20.8%) | $43,958 |
| Total | 168 (100.0%) | $83,750 |
Poverty in Hixton
Income Below Poverty by Sex and Age in Hixton
With 2.5% poverty level for males and 3.3% for females among the residents of Hixton, 55 to 64 year old males and 18 to 24 year old females are the most vulnerable to poverty, with 5 males (7.9%) and 3 females (20.0%) in their respective age groups living below the poverty level.
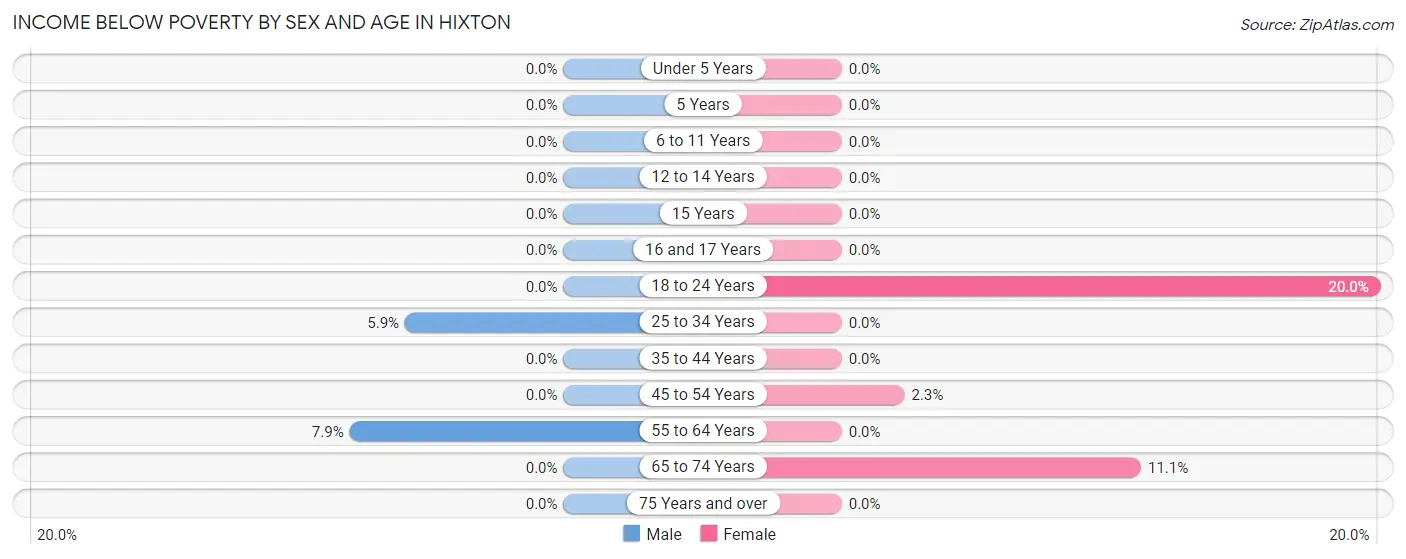
| Age Bracket | Male | Female |
| Under 5 Years | 0 (0.0%) | 0 (0.0%) |
| 5 Years | 0 (0.0%) | 0 (0.0%) |
| 6 to 11 Years | 0 (0.0%) | 0 (0.0%) |
| 12 to 14 Years | 0 (0.0%) | 0 (0.0%) |
| 15 Years | 0 (0.0%) | 0 (0.0%) |
| 16 and 17 Years | 0 (0.0%) | 0 (0.0%) |
| 18 to 24 Years | 0 (0.0%) | 3 (20.0%) |
| 25 to 34 Years | 1 (5.9%) | 0 (0.0%) |
| 35 to 44 Years | 0 (0.0%) | 0 (0.0%) |
| 45 to 54 Years | 0 (0.0%) | 1 (2.3%) |
| 55 to 64 Years | 5 (7.9%) | 0 (0.0%) |
| 65 to 74 Years | 0 (0.0%) | 2 (11.1%) |
| 75 Years and over | 0 (0.0%) | 0 (0.0%) |
| Total | 6 (2.5%) | 6 (3.3%) |
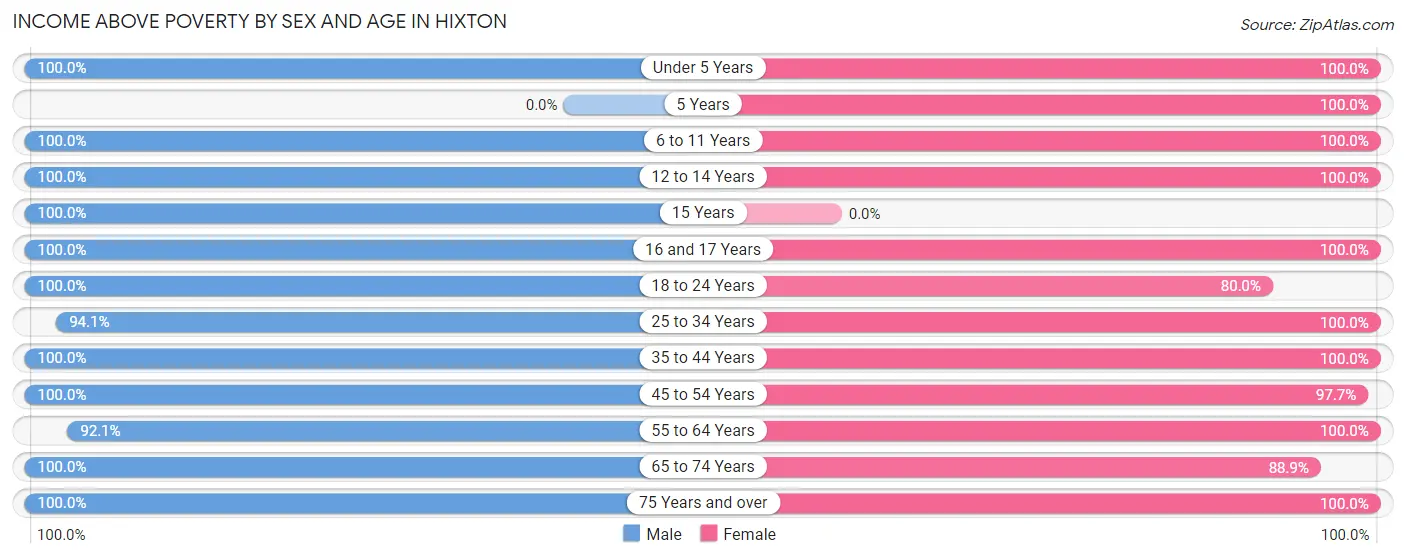
Income Above Poverty by Sex and Age in Hixton
According to the poverty statistics in Hixton, males aged under 5 years and females aged under 5 years are the age groups that are most secure financially, with 100.0% of males and 100.0% of females in these age groups living above the poverty line.
| Age Bracket | Male | Female |
| Under 5 Years | 6 (100.0%) | 9 (100.0%) |
| 5 Years | 0 (0.0%) | 3 (100.0%) |
| 6 to 11 Years | 3 (100.0%) | 8 (100.0%) |
| 12 to 14 Years | 10 (100.0%) | 4 (100.0%) |
| 15 Years | 3 (100.0%) | 0 (0.0%) |
| 16 and 17 Years | 16 (100.0%) | 2 (100.0%) |
| 18 to 24 Years | 31 (100.0%) | 12 (80.0%) |
| 25 to 34 Years | 16 (94.1%) | 18 (100.0%) |
| 35 to 44 Years | 10 (100.0%) | 16 (100.0%) |
| 45 to 54 Years | 62 (100.0%) | 42 (97.7%) |
| 55 to 64 Years | 58 (92.1%) | 31 (100.0%) |
| 65 to 74 Years | 17 (100.0%) | 16 (88.9%) |
| 75 Years and over | 5 (100.0%) | 14 (100.0%) |
| Total | 237 (97.5%) | 175 (96.7%) |
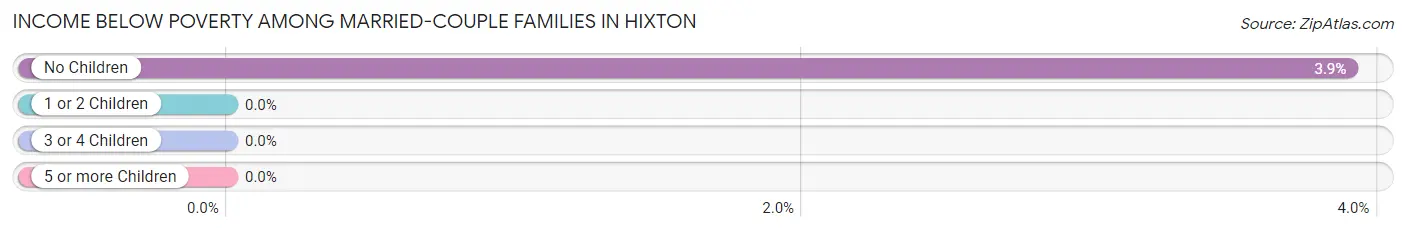
Income Below Poverty Among Married-Couple Families in Hixton
The poverty statistics for married-couple families in Hixton show that 2.8% or 3 of the total 108 families live below the poverty line. Families with no children have the highest poverty rate of 3.9%, comprising of 3 families. On the other hand, families with 1 or 2 children have the lowest poverty rate of 0.0%, which includes 0 families.
| Children | Above Poverty | Below Poverty |
| No Children | 74 (96.1%) | 3 (3.9%) |
| 1 or 2 Children | 29 (100.0%) | 0 (0.0%) |
| 3 or 4 Children | 2 (100.0%) | 0 (0.0%) |
| 5 or more Children | 0 (0.0%) | 0 (0.0%) |
| Total | 105 (97.2%) | 3 (2.8%) |
Income Below Poverty Among Single-Parent Households in Hixton
| Children | Single Father | Single Mother |
| No Children | 0 (0.0%) | 0 (0.0%) |
| 1 or 2 Children | 0 (0.0%) | 0 (0.0%) |
| 3 or 4 Children | 0 (0.0%) | 0 (0.0%) |
| 5 or more Children | 0 (0.0%) | 0 (0.0%) |
| Total | 0 (0.0%) | 0 (0.0%) |
Income Below Poverty Among Married-Couple vs Single-Parent Households in Hixton
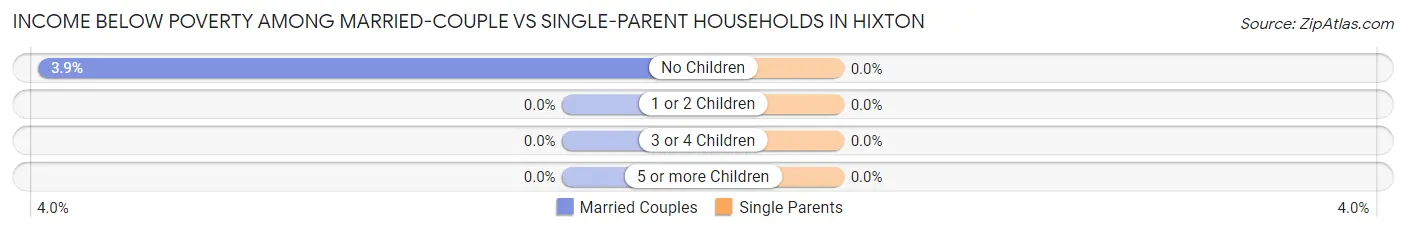
| Children | Married-Couple Families | Single-Parent Households |
| No Children | 3 (3.9%) | 0 (0.0%) |
| 1 or 2 Children | 0 (0.0%) | 0 (0.0%) |
| 3 or 4 Children | 0 (0.0%) | 0 (0.0%) |
| 5 or more Children | 0 (0.0%) | 0 (0.0%) |
| Total | 3 (2.8%) | 0 (0.0%) |
Race in Hixton
The most populous races in Hixton are White / Caucasian (416 | 98.1%), Asian (4 | 0.9%), and Native / Alaskan (3 | 0.7%).
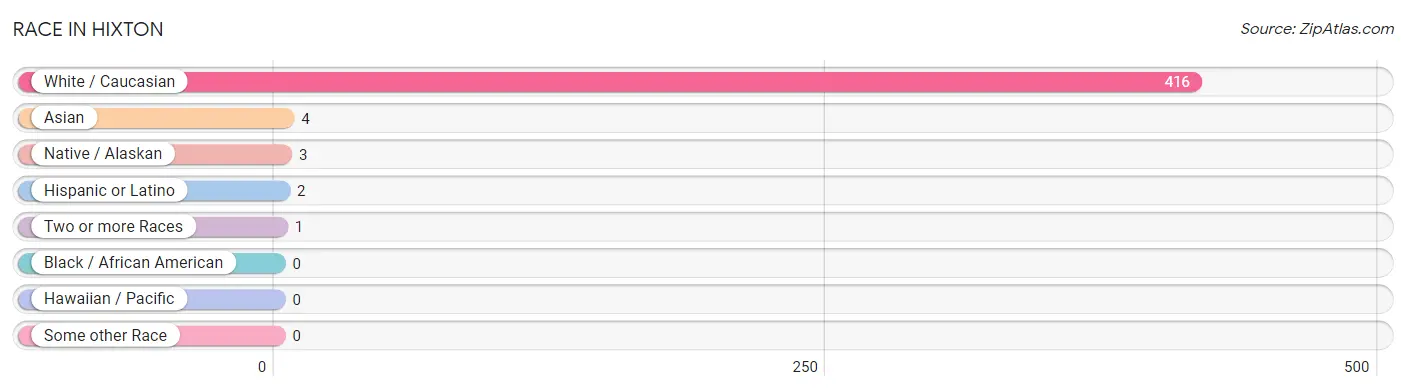
| Race | # Population | % Population |
| Asian | 4 | 0.9% |
| Black / African American | 0 | 0.0% |
| Hawaiian / Pacific | 0 | 0.0% |
| Hispanic or Latino | 2 | 0.5% |
| Native / Alaskan | 3 | 0.7% |
| White / Caucasian | 416 | 98.1% |
| Two or more Races | 1 | 0.2% |
| Some other Race | 0 | 0.0% |
| Total | 424 | 100.0% |
Ancestry in Hixton
The most populous ancestries reported in Hixton are German (157 | 37.0%), Norwegian (122 | 28.8%), American (65 | 15.3%), Irish (30 | 7.1%), and Polish (18 | 4.3%), together accounting for 92.5% of all Hixton residents.
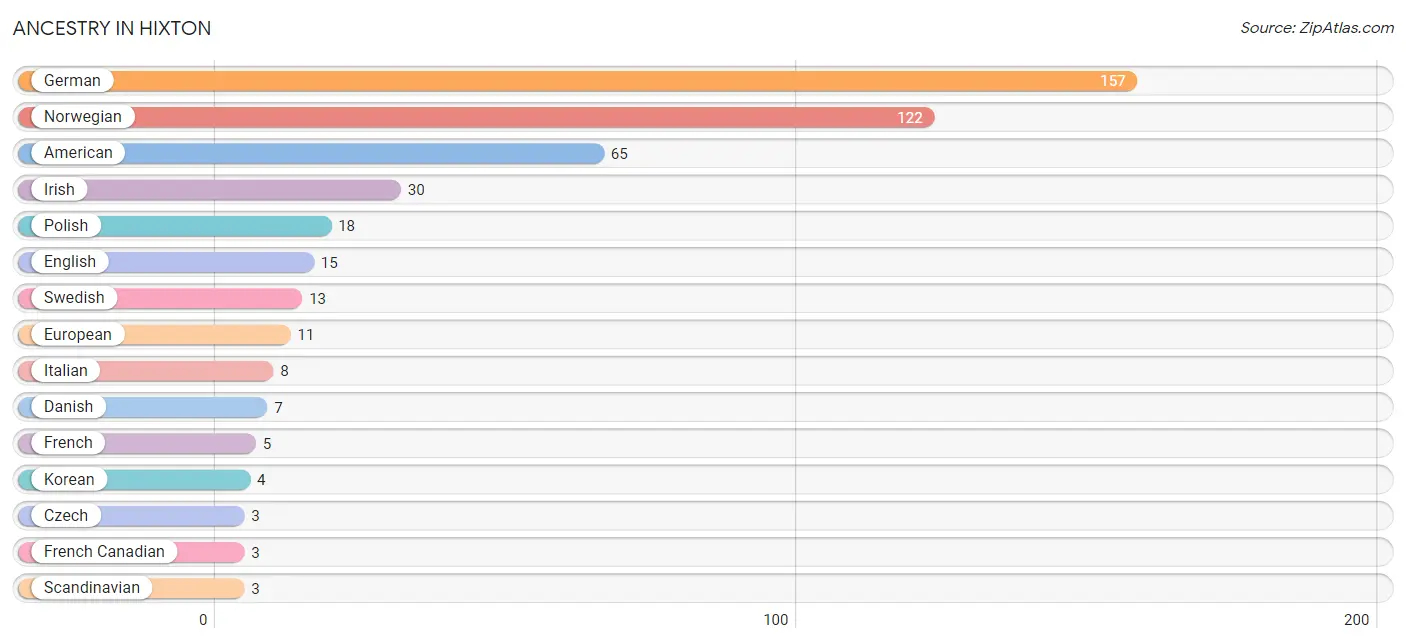
| Ancestry | # Population | % Population |
| American | 65 | 15.3% |
| British | 2 | 0.5% |
| Czech | 3 | 0.7% |
| Danish | 7 | 1.7% |
| English | 15 | 3.5% |
| European | 11 | 2.6% |
| Finnish | 2 | 0.5% |
| French | 5 | 1.2% |
| French Canadian | 3 | 0.7% |
| German | 157 | 37.0% |
| Irish | 30 | 7.1% |
| Italian | 8 | 1.9% |
| Korean | 4 | 0.9% |
| Mexican | 2 | 0.5% |
| Norwegian | 122 | 28.8% |
| Polish | 18 | 4.3% |
| Scandinavian | 3 | 0.7% |
| Swedish | 13 | 3.1% |
| Swiss | 2 | 0.5% |
| Welsh | 3 | 0.7% | View All 20 Rows |
Immigrants in Hixton
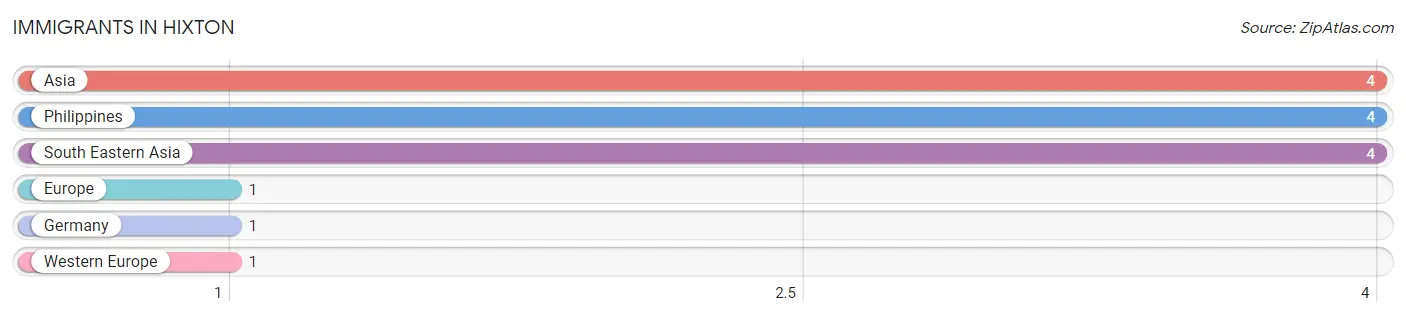
The most numerous immigrant groups reported in Hixton came from Asia (4 | 0.9%), Philippines (4 | 0.9%), South Eastern Asia (4 | 0.9%), Europe (1 | 0.2%), and Germany (1 | 0.2%), together accounting for 3.3% of all Hixton residents.
| Immigration Origin | # Population | % Population |
| Asia | 4 | 0.9% |
| Europe | 1 | 0.2% |
| Germany | 1 | 0.2% |
| Philippines | 4 | 0.9% |
| South Eastern Asia | 4 | 0.9% |
| Western Europe | 1 | 0.2% | View All 6 Rows |
Sex and Age in Hixton
Sex and Age in Hixton
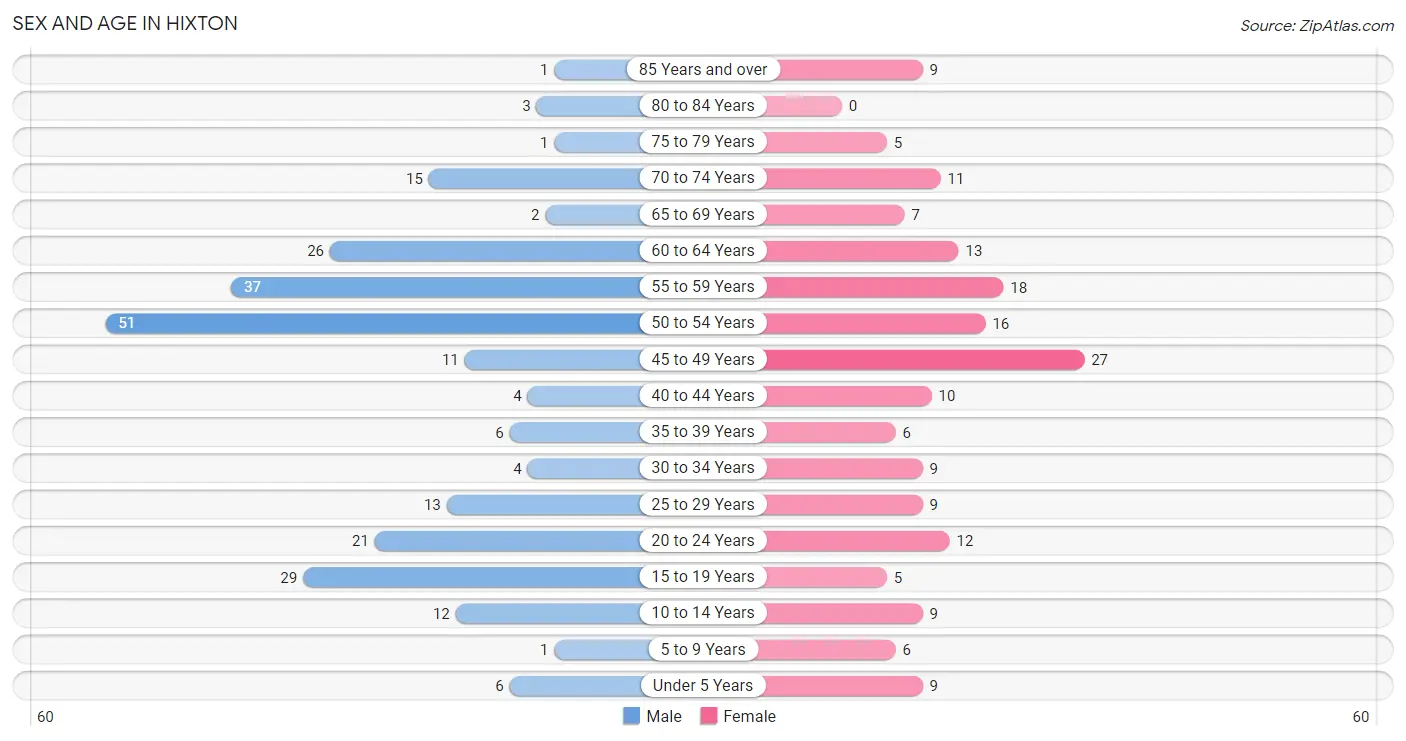
The most populous age groups in Hixton are 50 to 54 Years (51 | 21.0%) for men and 45 to 49 Years (27 | 14.9%) for women.
| Age Bracket | Male | Female |
| Under 5 Years | 6 (2.5%) | 9 (5.0%) |
| 5 to 9 Years | 1 (0.4%) | 6 (3.3%) |
| 10 to 14 Years | 12 (4.9%) | 9 (5.0%) |
| 15 to 19 Years | 29 (11.9%) | 5 (2.8%) |
| 20 to 24 Years | 21 (8.6%) | 12 (6.6%) |
| 25 to 29 Years | 13 (5.3%) | 9 (5.0%) |
| 30 to 34 Years | 4 (1.7%) | 9 (5.0%) |
| 35 to 39 Years | 6 (2.5%) | 6 (3.3%) |
| 40 to 44 Years | 4 (1.7%) | 10 (5.5%) |
| 45 to 49 Years | 11 (4.5%) | 27 (14.9%) |
| 50 to 54 Years | 51 (21.0%) | 16 (8.8%) |
| 55 to 59 Years | 37 (15.2%) | 18 (9.9%) |
| 60 to 64 Years | 26 (10.7%) | 13 (7.2%) |
| 65 to 69 Years | 2 (0.8%) | 7 (3.9%) |
| 70 to 74 Years | 15 (6.2%) | 11 (6.1%) |
| 75 to 79 Years | 1 (0.4%) | 5 (2.8%) |
| 80 to 84 Years | 3 (1.2%) | 0 (0.0%) |
| 85 Years and over | 1 (0.4%) | 9 (5.0%) |
| Total | 243 (100.0%) | 181 (100.0%) |
Families and Households in Hixton
Median Family Size in Hixton
The median family size in Hixton is 3.00 persons per family, with married-couple families (108 | 87.8%) accounting for the largest median family size of 3.07 persons per family. On the other hand, single male/father families (3 | 2.4%) represent the smallest median family size with 2.00 persons per family.
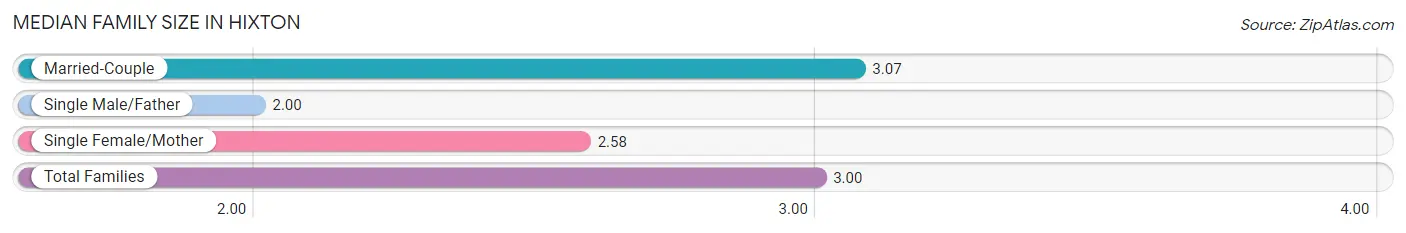
| Family Type | # Families | Family Size |
| Married-Couple | 108 (87.8%) | 3.07 |
| Single Male/Father | 3 (2.4%) | 2.00 |
| Single Female/Mother | 12 (9.8%) | 2.58 |
| Total Families | 123 (100.0%) | 3.00 |
Median Household Size in Hixton
The median household size in Hixton is 2.52 persons per household, with married-couple households (108 | 64.3%) accounting for the largest median household size of 3.1 persons per household. non-family households (45 | 26.8%) represent the smallest median household size with 1.11 persons per household.
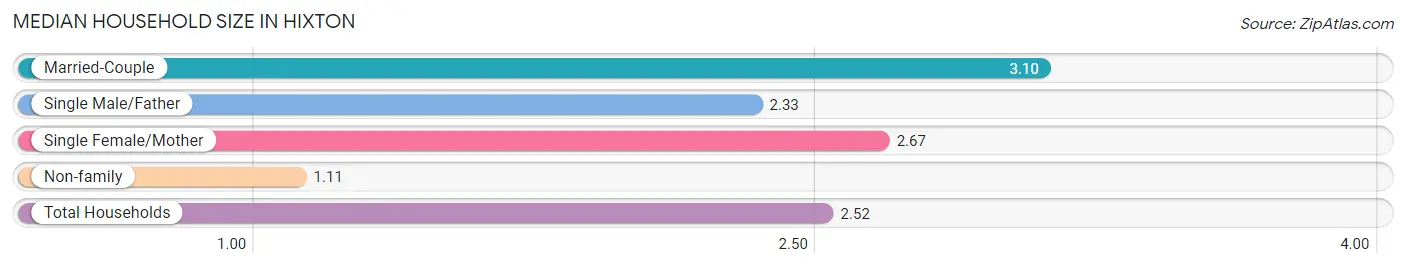
| Household Type | # Households | Household Size |
| Married-Couple | 108 (64.3%) | 3.10 |
| Single Male/Father | 3 (1.8%) | 2.33 |
| Single Female/Mother | 12 (7.1%) | 2.67 |
| Non-family | 45 (26.8%) | 1.11 |
| Total Households | 168 (100.0%) | 2.52 |
Household Size by Marriage Status in Hixton
Out of a total of 168 households in Hixton, 123 (73.2%) are family households, while 45 (26.8%) are nonfamily households. The most numerous type of family households are 2-person households, comprising 66, and the most common type of nonfamily households are 1-person households, comprising 38.
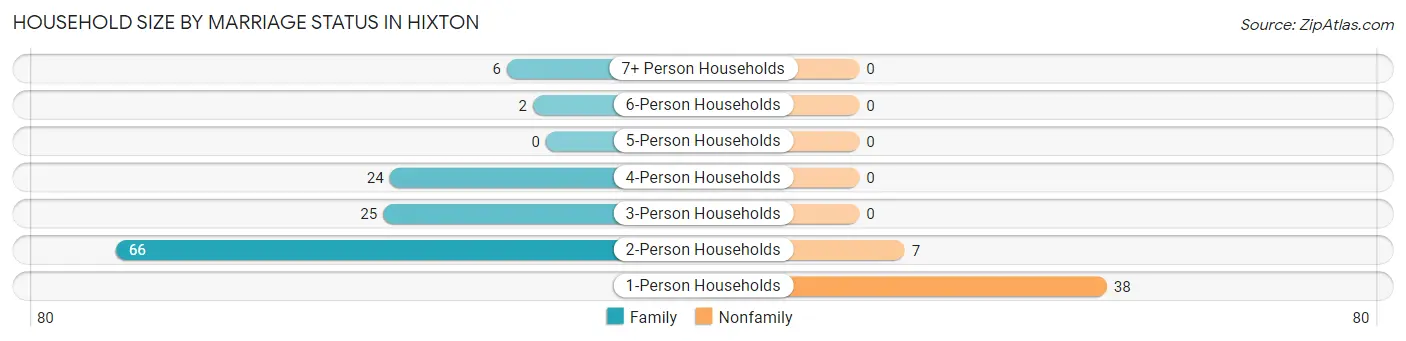
| Household Size | Family Households | Nonfamily Households |
| 1-Person Households | - | 38 (22.6%) |
| 2-Person Households | 66 (39.3%) | 7 (4.2%) |
| 3-Person Households | 25 (14.9%) | 0 (0.0%) |
| 4-Person Households | 24 (14.3%) | 0 (0.0%) |
| 5-Person Households | 0 (0.0%) | 0 (0.0%) |
| 6-Person Households | 2 (1.2%) | 0 (0.0%) |
| 7+ Person Households | 6 (3.6%) | 0 (0.0%) |
| Total | 123 (73.2%) | 45 (26.8%) |
Female Fertility in Hixton
Fertility by Age in Hixton
Average fertility rate in Hixton is 25.0 births per 1,000 women. Women in the age bracket of 35 to 50 years have the highest fertility rate with 45.0 births per 1,000 women. Women in the age bracket of 35 to 50 years acount for 100.0% of all women with births.
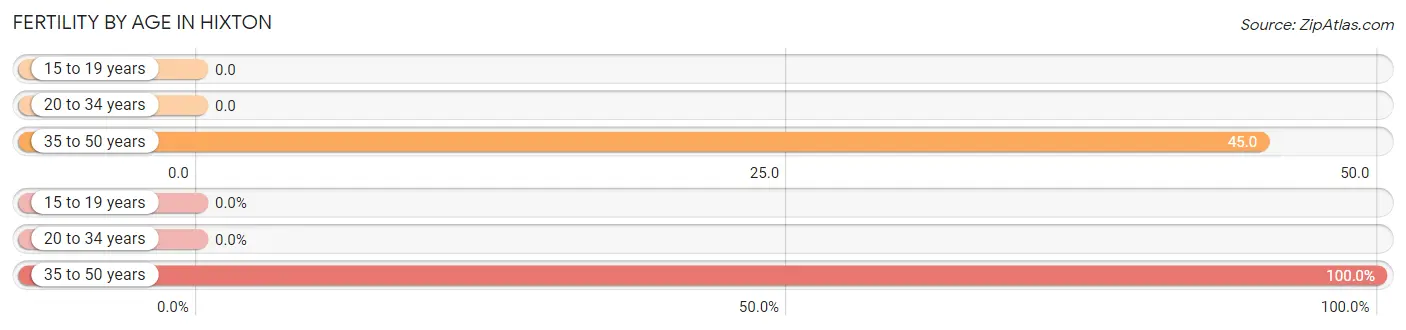
| Age Bracket | Women with Births | Births / 1,000 Women |
| 15 to 19 years | 0 (0.0%) | 0.0 |
| 20 to 34 years | 0 (0.0%) | 0.0 |
| 35 to 50 years | 2 (100.0%) | 45.0 |
| Total | 2 (100.0%) | 25.0 |
Fertility by Age by Marriage Status in Hixton
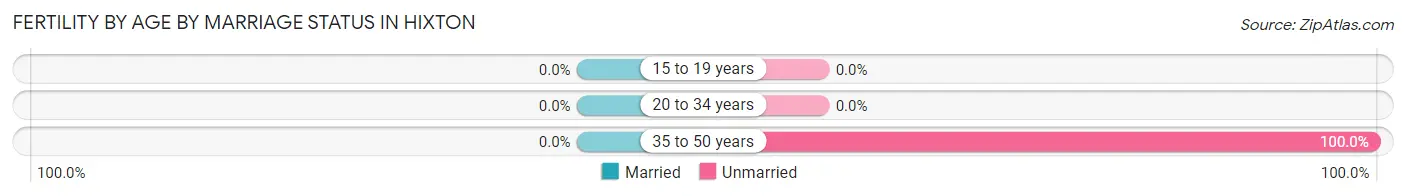
| Age Bracket | Married | Unmarried |
| 15 to 19 years | 0 (0.0%) | 0 (0.0%) |
| 20 to 34 years | 0 (0.0%) | 0 (0.0%) |
| 35 to 50 years | 0 (0.0%) | 2 (100.0%) |
| Total | 0 (0.0%) | 2 (100.0%) |
Fertility by Education in Hixton
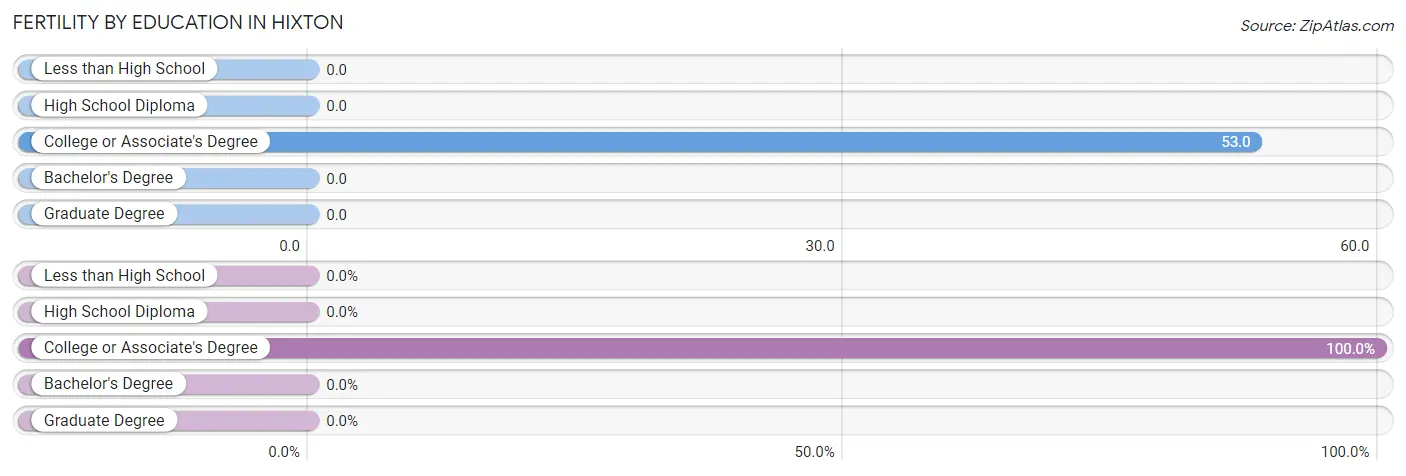
| Educational Attainment | Women with Births | Births / 1,000 Women |
| Less than High School | 0 (0.0%) | 0.0 |
| High School Diploma | 0 (0.0%) | 0.0 |
| College or Associate's Degree | 2 (100.0%) | 53.0 |
| Bachelor's Degree | 0 (0.0%) | 0.0 |
| Graduate Degree | 0 (0.0%) | 0.0 |
| Total | 2 (100.0%) | 25.0 |
Fertility by Education by Marriage Status in Hixton
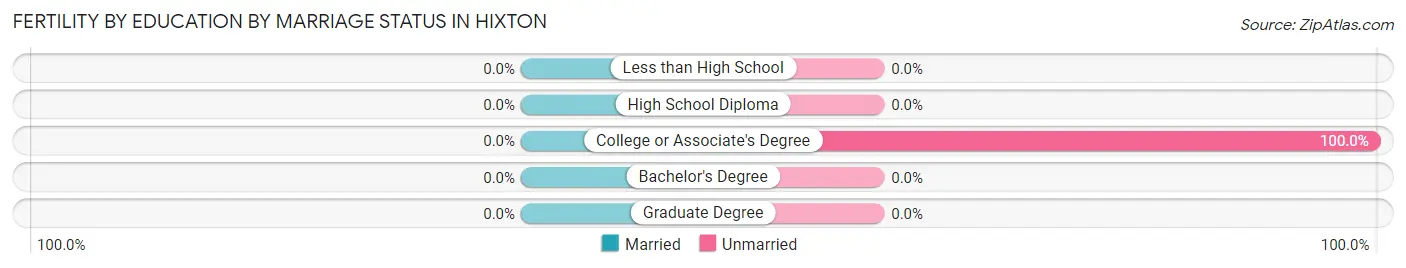
| Educational Attainment | Married | Unmarried |
| Less than High School | 0 (0.0%) | 0 (0.0%) |
| High School Diploma | 0 (0.0%) | 0 (0.0%) |
| College or Associate's Degree | 0 (0.0%) | 2 (100.0%) |
| Bachelor's Degree | 0 (0.0%) | 0 (0.0%) |
| Graduate Degree | 0 (0.0%) | 0 (0.0%) |
| Total | 0 (0.0%) | 2 (100.0%) |
Employment Characteristics in Hixton
Employment by Class of Employer in Hixton
Among the 260 employed individuals in Hixton, private company employees (182 | 70.0%), not-for-profit organizations (27 | 10.4%), and local government employees (26 | 10.0%) make up the most common classes of employment.
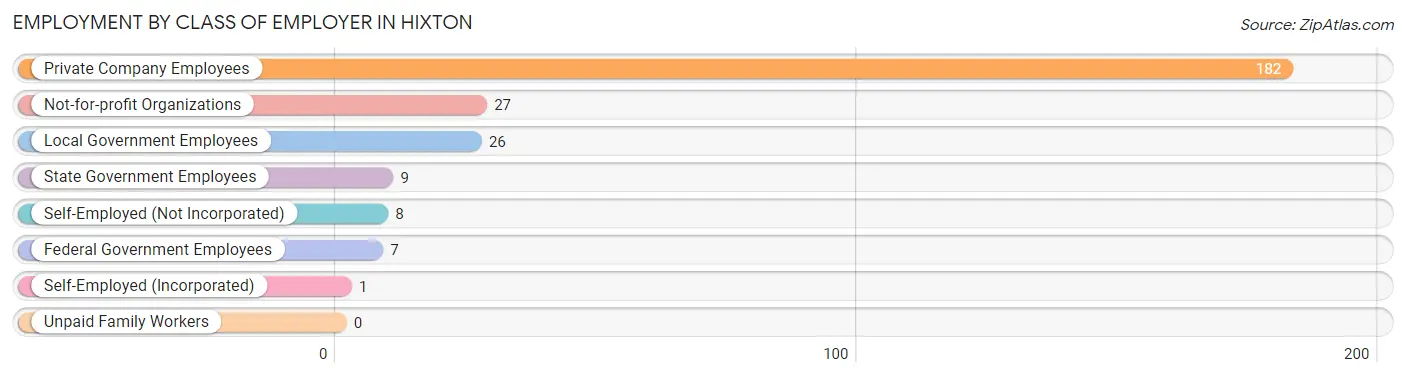
| Employer Class | # Employees | % Employees |
| Private Company Employees | 182 | 70.0% |
| Self-Employed (Incorporated) | 1 | 0.4% |
| Self-Employed (Not Incorporated) | 8 | 3.1% |
| Not-for-profit Organizations | 27 | 10.4% |
| Local Government Employees | 26 | 10.0% |
| State Government Employees | 9 | 3.5% |
| Federal Government Employees | 7 | 2.7% |
| Unpaid Family Workers | 0 | 0.0% |
| Total | 260 | 100.0% |
Employment Status by Age in Hixton
According to the labor force statistics for Hixton, out of the total population over 16 years of age (378), 76.2% or 288 individuals are in the labor force, with 8.7% or 25 of them unemployed. The age group with the highest labor force participation rate is 20 to 24 years, with 100.0% or 33 individuals in the labor force. Within the labor force, the 16 to 19 years age range has the highest percentage of unemployed individuals, with 68.8% or 11 of them being unemployed.
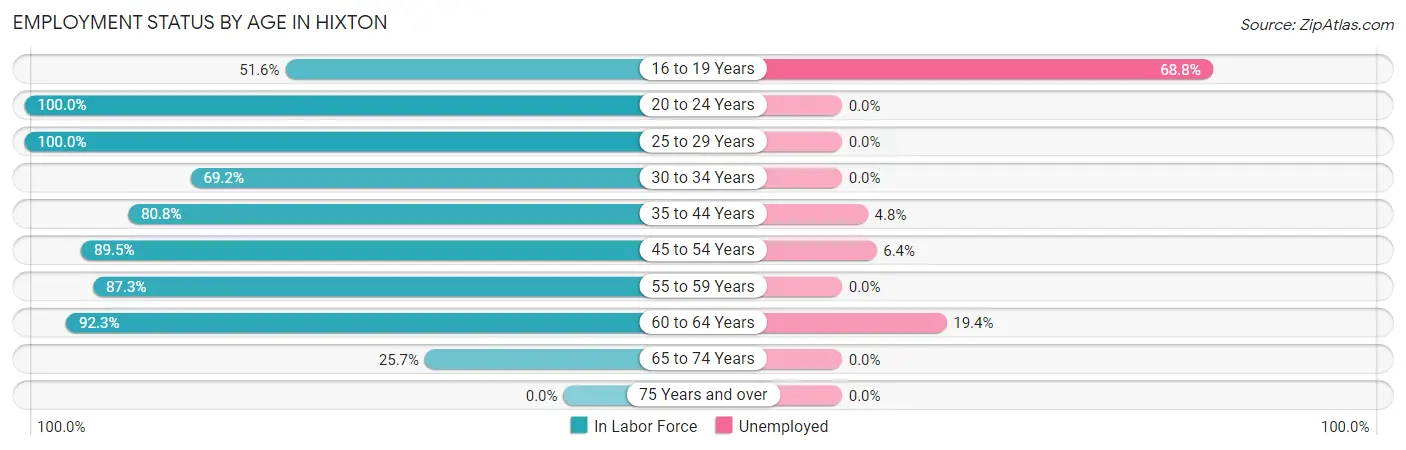
| Age Bracket | In Labor Force | Unemployed |
| 16 to 19 Years | 16 (51.6%) | 11 (68.8%) |
| 20 to 24 Years | 33 (100.0%) | 0 (0.0%) |
| 25 to 29 Years | 22 (100.0%) | 0 (0.0%) |
| 30 to 34 Years | 9 (69.2%) | 0 (0.0%) |
| 35 to 44 Years | 21 (80.8%) | 1 (4.8%) |
| 45 to 54 Years | 94 (89.5%) | 6 (6.4%) |
| 55 to 59 Years | 48 (87.3%) | 0 (0.0%) |
| 60 to 64 Years | 36 (92.3%) | 7 (19.4%) |
| 65 to 74 Years | 9 (25.7%) | 0 (0.0%) |
| 75 Years and over | 0 (0.0%) | 0 (0.0%) |
| Total | 288 (76.2%) | 25 (8.7%) |
Employment Status by Educational Attainment in Hixton
According to labor force statistics for Hixton, 88.5% of individuals (230) out of the total population between 25 and 64 years of age (260) are in the labor force, with 6.1% or 14 of them being unemployed. The group with the highest labor force participation rate are those with the educational attainment of bachelor's degree or higher, with 100.0% or 31 individuals in the labor force. Within the labor force, individuals with college / associate degree education have the highest percentage of unemployment, with 10.9% or 12 of them being unemployed.
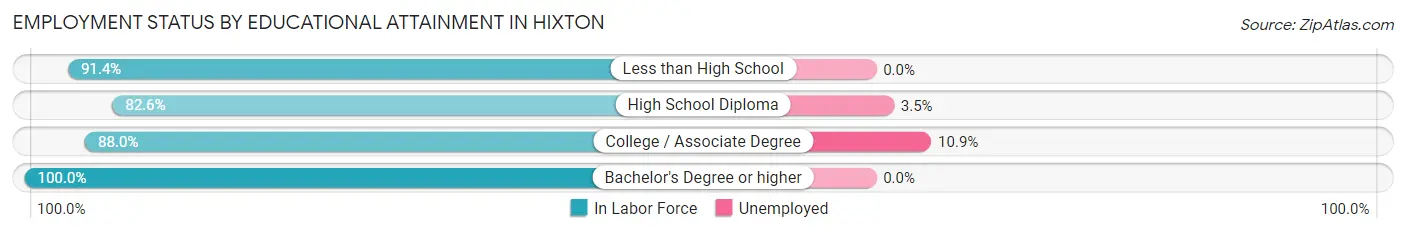
| Educational Attainment | In Labor Force | Unemployed |
| Less than High School | 32 (91.4%) | 0 (0.0%) |
| High School Diploma | 57 (82.6%) | 2 (3.5%) |
| College / Associate Degree | 110 (88.0%) | 14 (10.9%) |
| Bachelor's Degree or higher | 31 (100.0%) | 0 (0.0%) |
| Total | 230 (88.5%) | 16 (6.1%) |
Employment Occupations by Sex in Hixton
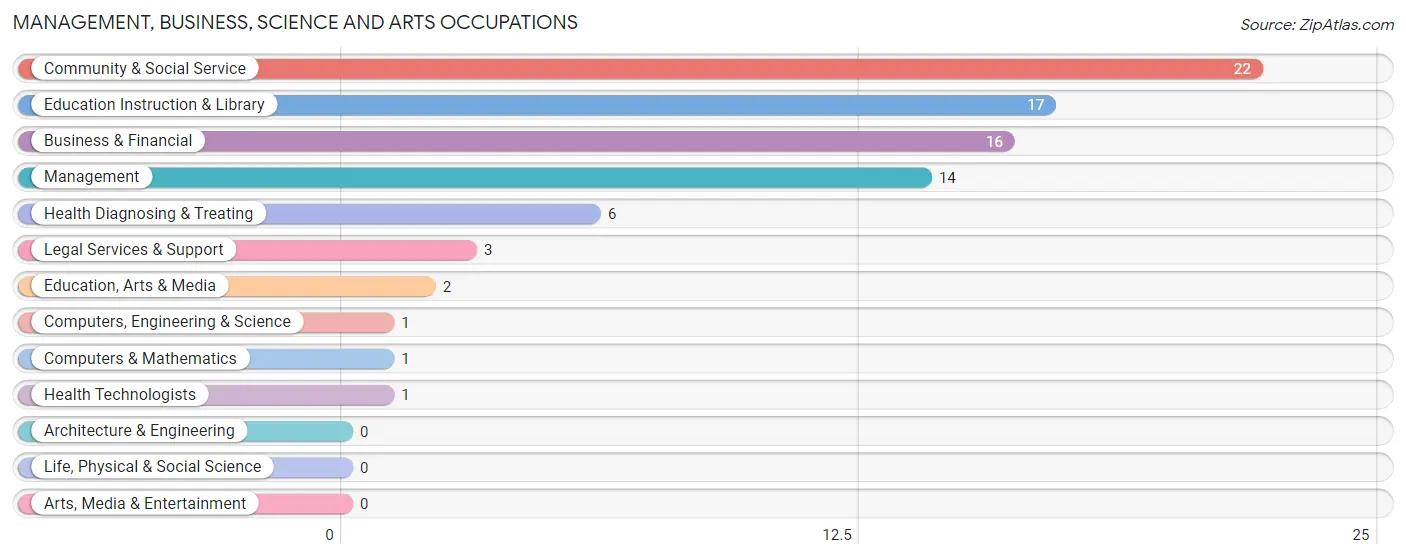
Management, Business, Science and Arts Occupations
The most common Management, Business, Science and Arts occupations in Hixton are Community & Social Service (22 | 8.4%), Education Instruction & Library (17 | 6.5%), Business & Financial (16 | 6.1%), Management (14 | 5.3%), and Health Diagnosing & Treating (6 | 2.3%).
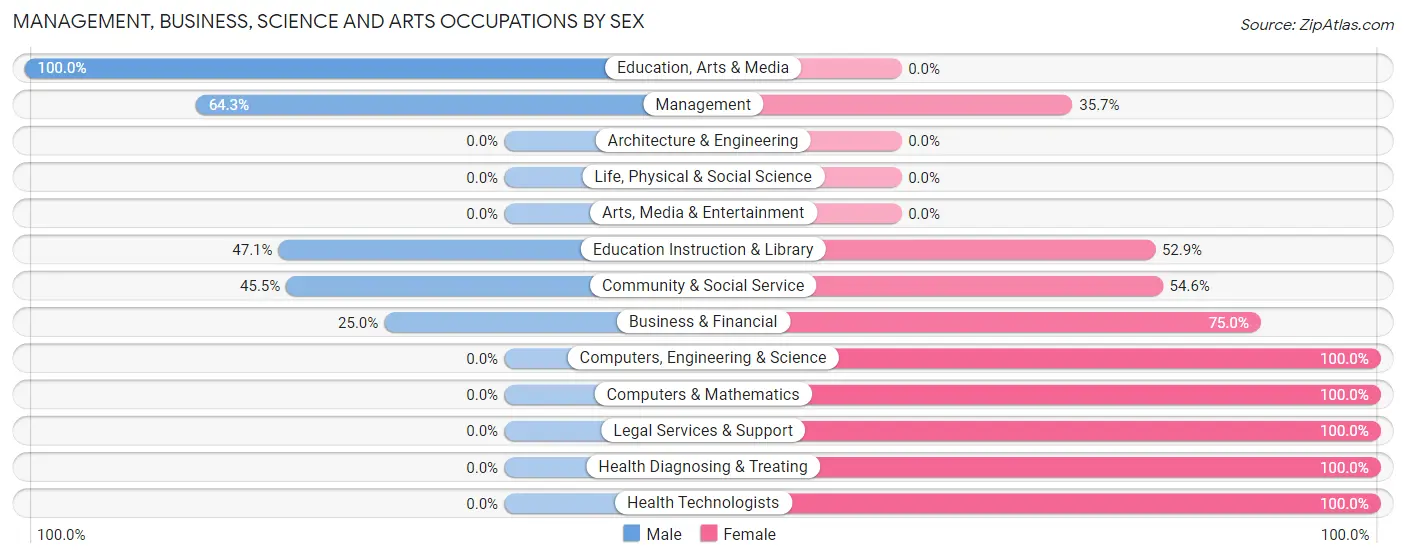
Management, Business, Science and Arts Occupations by Sex
Within the Management, Business, Science and Arts occupations in Hixton, the most male-oriented occupations are Education, Arts & Media (100.0%), Management (64.3%), and Education Instruction & Library (47.1%), while the most female-oriented occupations are Computers, Engineering & Science (100.0%), Computers & Mathematics (100.0%), and Legal Services & Support (100.0%).
| Occupation | Male | Female |
| Management | 9 (64.3%) | 5 (35.7%) |
| Business & Financial | 4 (25.0%) | 12 (75.0%) |
| Computers, Engineering & Science | 0 (0.0%) | 1 (100.0%) |
| Computers & Mathematics | 0 (0.0%) | 1 (100.0%) |
| Architecture & Engineering | 0 (0.0%) | 0 (0.0%) |
| Life, Physical & Social Science | 0 (0.0%) | 0 (0.0%) |
| Community & Social Service | 10 (45.5%) | 12 (54.5%) |
| Education, Arts & Media | 2 (100.0%) | 0 (0.0%) |
| Legal Services & Support | 0 (0.0%) | 3 (100.0%) |
| Education Instruction & Library | 8 (47.1%) | 9 (52.9%) |
| Arts, Media & Entertainment | 0 (0.0%) | 0 (0.0%) |
| Health Diagnosing & Treating | 0 (0.0%) | 6 (100.0%) |
| Health Technologists | 0 (0.0%) | 1 (100.0%) |
| Total (Category) | 23 (39.0%) | 36 (61.0%) |
| Total (Overall) | 158 (60.1%) | 105 (39.9%) |
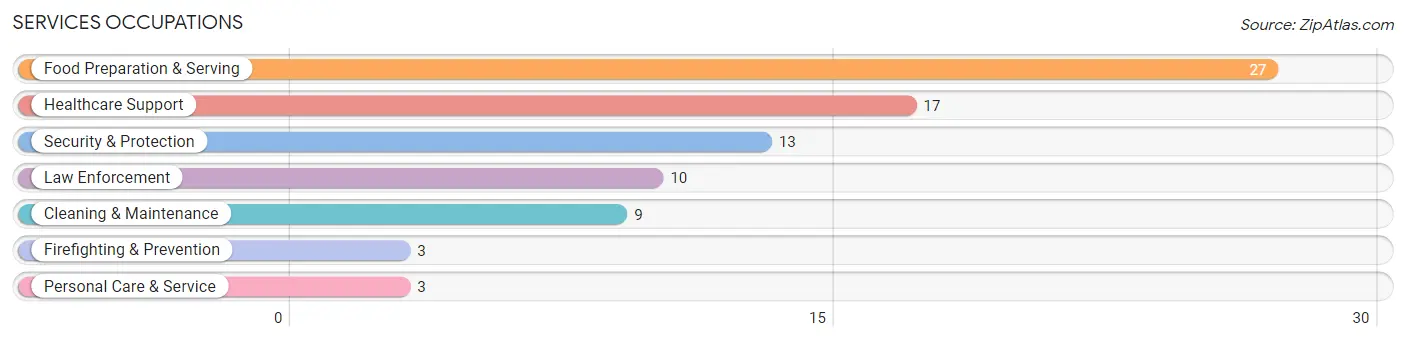
Services Occupations
The most common Services occupations in Hixton are Food Preparation & Serving (27 | 10.3%), Healthcare Support (17 | 6.5%), Security & Protection (13 | 4.9%), Law Enforcement (10 | 3.8%), and Cleaning & Maintenance (9 | 3.4%).
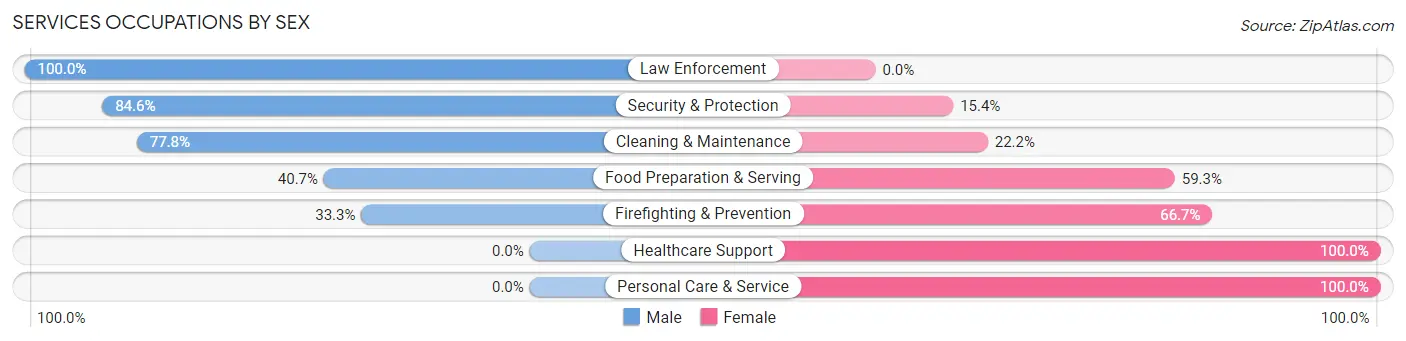
Services Occupations by Sex
Within the Services occupations in Hixton, the most male-oriented occupations are Law Enforcement (100.0%), Security & Protection (84.6%), and Cleaning & Maintenance (77.8%), while the most female-oriented occupations are Healthcare Support (100.0%), Personal Care & Service (100.0%), and Firefighting & Prevention (66.7%).
| Occupation | Male | Female |
| Healthcare Support | 0 (0.0%) | 17 (100.0%) |
| Security & Protection | 11 (84.6%) | 2 (15.4%) |
| Firefighting & Prevention | 1 (33.3%) | 2 (66.7%) |
| Law Enforcement | 10 (100.0%) | 0 (0.0%) |
| Food Preparation & Serving | 11 (40.7%) | 16 (59.3%) |
| Cleaning & Maintenance | 7 (77.8%) | 2 (22.2%) |
| Personal Care & Service | 0 (0.0%) | 3 (100.0%) |
| Total (Category) | 29 (42.0%) | 40 (58.0%) |
| Total (Overall) | 158 (60.1%) | 105 (39.9%) |
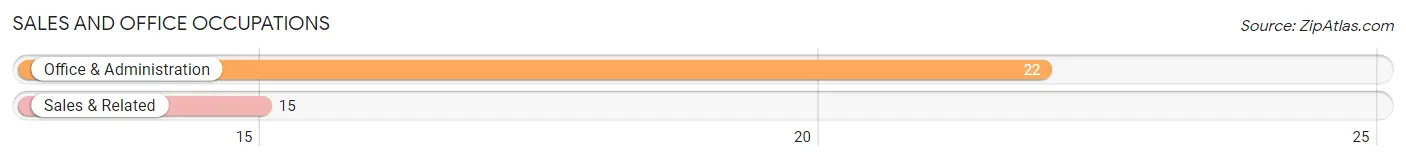
Sales and Office Occupations
The most common Sales and Office occupations in Hixton are Office & Administration (22 | 8.4%), and Sales & Related (15 | 5.7%).
Sales and Office Occupations by Sex
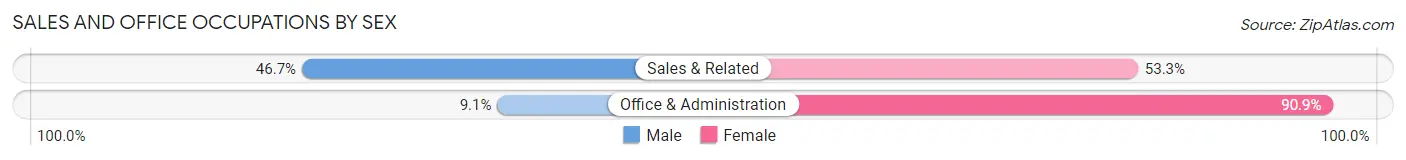
| Occupation | Male | Female |
| Sales & Related | 7 (46.7%) | 8 (53.3%) |
| Office & Administration | 2 (9.1%) | 20 (90.9%) |
| Total (Category) | 9 (24.3%) | 28 (75.7%) |
| Total (Overall) | 158 (60.1%) | 105 (39.9%) |
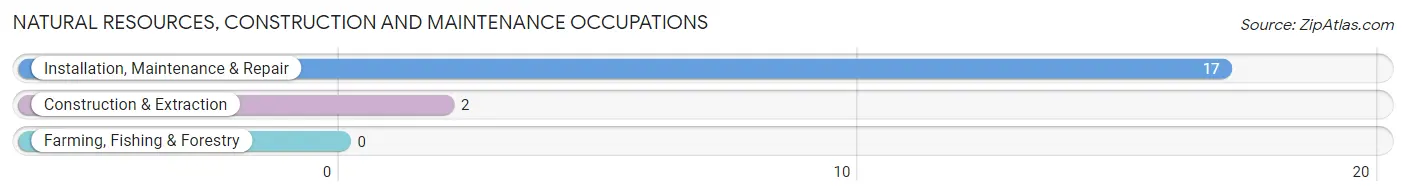
Natural Resources, Construction and Maintenance Occupations
The most common Natural Resources, Construction and Maintenance occupations in Hixton are Installation, Maintenance & Repair (17 | 6.5%), and Construction & Extraction (2 | 0.8%).
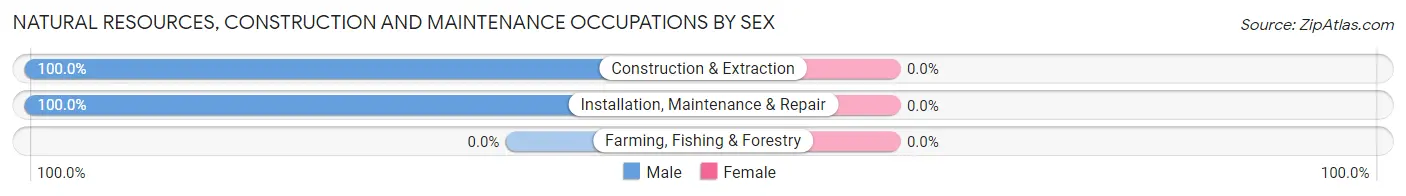
Natural Resources, Construction and Maintenance Occupations by Sex
| Occupation | Male | Female |
| Farming, Fishing & Forestry | 0 (0.0%) | 0 (0.0%) |
| Construction & Extraction | 2 (100.0%) | 0 (0.0%) |
| Installation, Maintenance & Repair | 17 (100.0%) | 0 (0.0%) |
| Total (Category) | 19 (100.0%) | 0 (0.0%) |
| Total (Overall) | 158 (60.1%) | 105 (39.9%) |
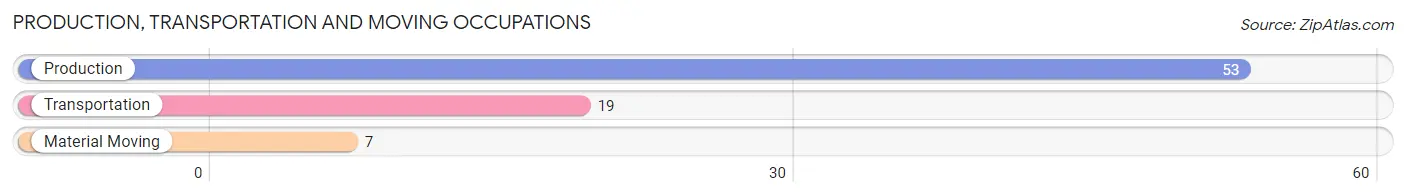
Production, Transportation and Moving Occupations
The most common Production, Transportation and Moving occupations in Hixton are Production (53 | 20.2%), Transportation (19 | 7.2%), and Material Moving (7 | 2.7%).
Production, Transportation and Moving Occupations by Sex
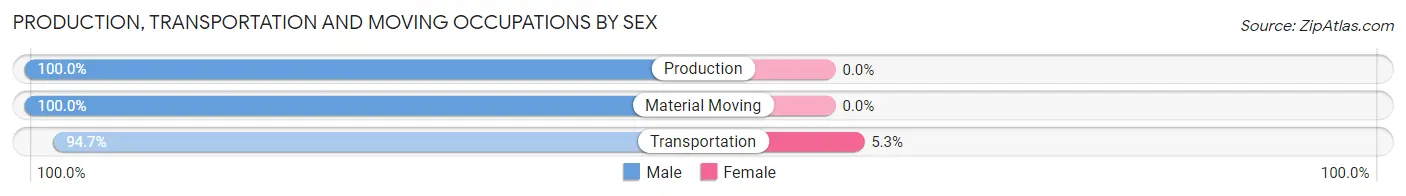
| Occupation | Male | Female |
| Production | 53 (100.0%) | 0 (0.0%) |
| Transportation | 18 (94.7%) | 1 (5.3%) |
| Material Moving | 7 (100.0%) | 0 (0.0%) |
| Total (Category) | 78 (98.7%) | 1 (1.3%) |
| Total (Overall) | 158 (60.1%) | 105 (39.9%) |
Employment Industries by Sex in Hixton
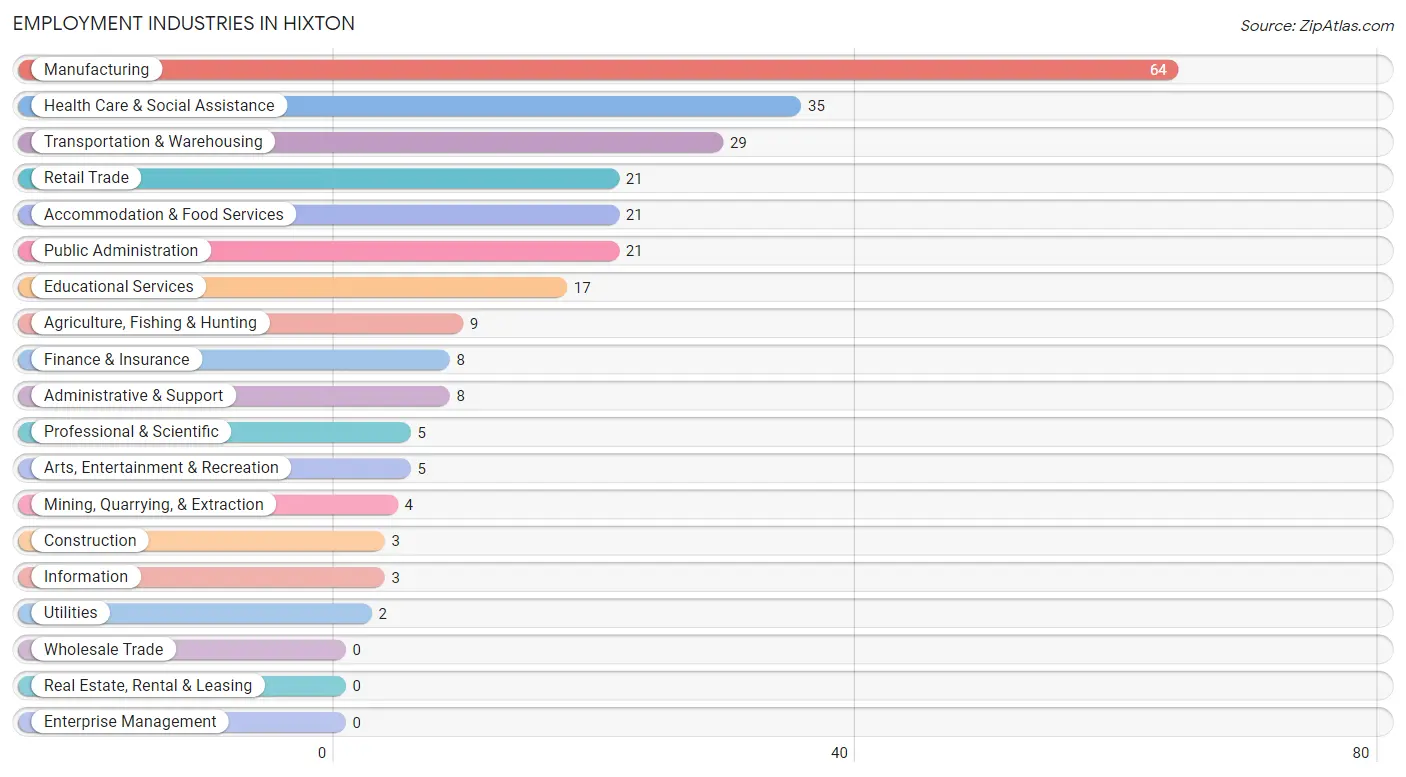
Employment Industries in Hixton
The major employment industries in Hixton include Manufacturing (64 | 24.3%), Health Care & Social Assistance (35 | 13.3%), Transportation & Warehousing (29 | 11.0%), Retail Trade (21 | 8.0%), and Accommodation & Food Services (21 | 8.0%).
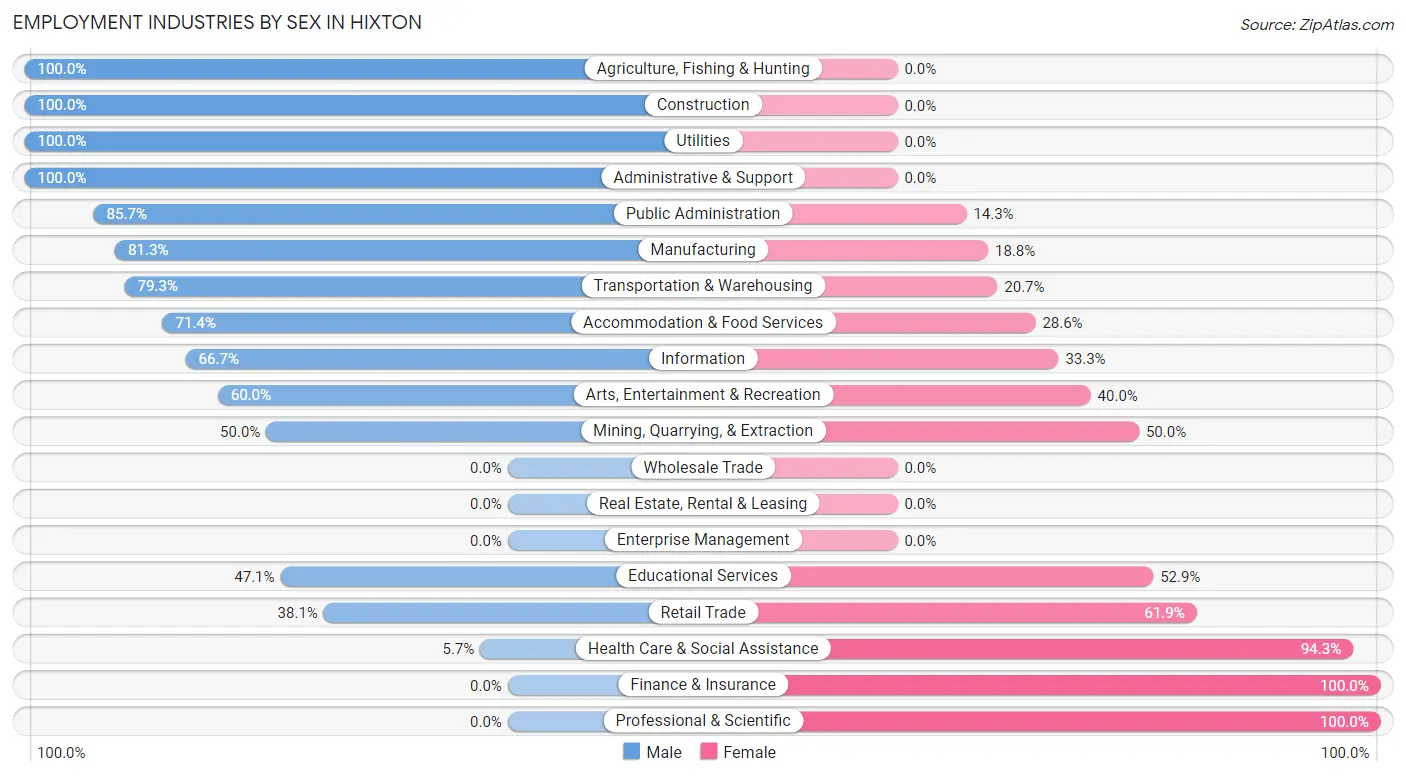
Employment Industries by Sex in Hixton
The Hixton industries that see more men than women are Agriculture, Fishing & Hunting (100.0%), Construction (100.0%), and Utilities (100.0%), whereas the industries that tend to have a higher number of women are Finance & Insurance (100.0%), Professional & Scientific (100.0%), and Health Care & Social Assistance (94.3%).
| Industry | Male | Female |
| Agriculture, Fishing & Hunting | 9 (100.0%) | 0 (0.0%) |
| Mining, Quarrying, & Extraction | 2 (50.0%) | 2 (50.0%) |
| Construction | 3 (100.0%) | 0 (0.0%) |
| Manufacturing | 52 (81.2%) | 12 (18.8%) |
| Wholesale Trade | 0 (0.0%) | 0 (0.0%) |
| Retail Trade | 8 (38.1%) | 13 (61.9%) |
| Transportation & Warehousing | 23 (79.3%) | 6 (20.7%) |
| Utilities | 2 (100.0%) | 0 (0.0%) |
| Information | 2 (66.7%) | 1 (33.3%) |
| Finance & Insurance | 0 (0.0%) | 8 (100.0%) |
| Real Estate, Rental & Leasing | 0 (0.0%) | 0 (0.0%) |
| Professional & Scientific | 0 (0.0%) | 5 (100.0%) |
| Enterprise Management | 0 (0.0%) | 0 (0.0%) |
| Administrative & Support | 8 (100.0%) | 0 (0.0%) |
| Educational Services | 8 (47.1%) | 9 (52.9%) |
| Health Care & Social Assistance | 2 (5.7%) | 33 (94.3%) |
| Arts, Entertainment & Recreation | 3 (60.0%) | 2 (40.0%) |
| Accommodation & Food Services | 15 (71.4%) | 6 (28.6%) |
| Public Administration | 18 (85.7%) | 3 (14.3%) |
| Total | 158 (60.1%) | 105 (39.9%) |
Education in Hixton
School Enrollment in Hixton
The most common levels of schooling among the 67 students in Hixton are high school (36 | 53.7%), middle school (9 | 13.4%), and college / undergraduate (7 | 10.4%).
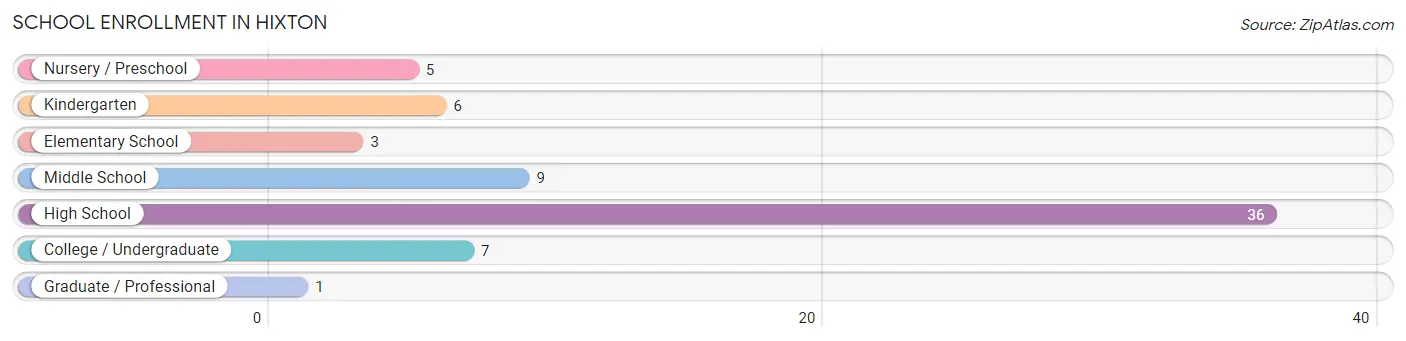
| School Level | # Students | % Students |
| Nursery / Preschool | 5 | 7.5% |
| Kindergarten | 6 | 9.0% |
| Elementary School | 3 | 4.5% |
| Middle School | 9 | 13.4% |
| High School | 36 | 53.7% |
| College / Undergraduate | 7 | 10.4% |
| Graduate / Professional | 1 | 1.5% |
| Total | 67 | 100.0% |
School Enrollment by Age by Funding Source in Hixton
Out of a total of 67 students who are enrolled in schools in Hixton, 11 (16.4%) attend a private institution, while the remaining 56 (83.6%) are enrolled in public schools. The age group of 15 to 17 year olds has the highest likelihood of being enrolled in private schools, with 7 (33.3% in the age bracket) enrolled. Conversely, the age group of 3 to 4 year olds has the lowest likelihood of being enrolled in a private school, with 5 (100.0% in the age bracket) attending a public institution.
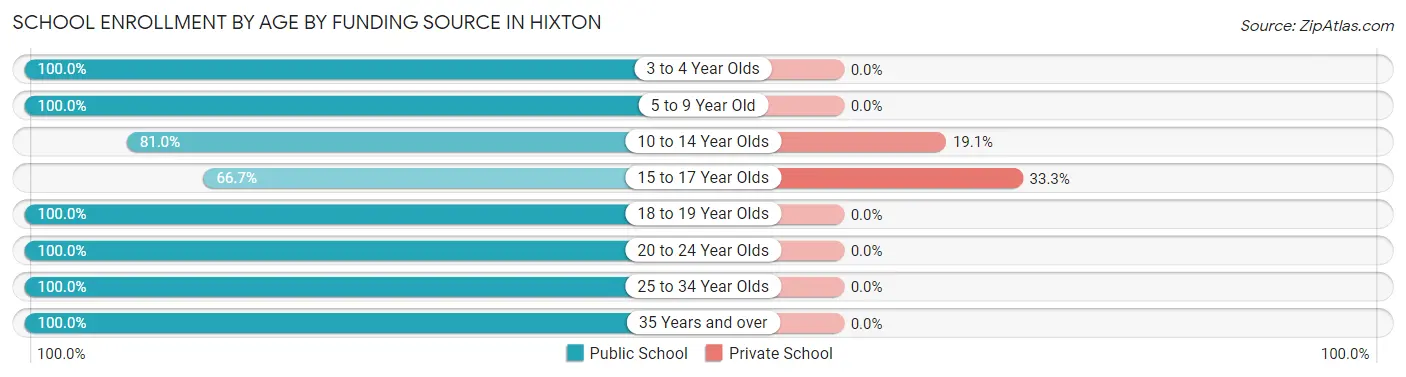
| Age Bracket | Public School | Private School |
| 3 to 4 Year Olds | 5 (100.0%) | 0 (0.0%) |
| 5 to 9 Year Old | 7 (100.0%) | 0 (0.0%) |
| 10 to 14 Year Olds | 17 (80.9%) | 4 (19.1%) |
| 15 to 17 Year Olds | 14 (66.7%) | 7 (33.3%) |
| 18 to 19 Year Olds | 6 (100.0%) | 0 (0.0%) |
| 20 to 24 Year Olds | 3 (100.0%) | 0 (0.0%) |
| 25 to 34 Year Olds | 2 (100.0%) | 0 (0.0%) |
| 35 Years and over | 2 (100.0%) | 0 (0.0%) |
| Total | 56 (83.6%) | 11 (16.4%) |
Educational Attainment by Field of Study in Hixton
Education (17 | 48.6%), arts & humanities (8 | 22.9%), business (7 | 20.0%), physical & health sciences (2 | 5.7%), and bio, nature & agricultural (1 | 2.9%) are the most common fields of study among 35 individuals in Hixton who have obtained a bachelor's degree or higher.
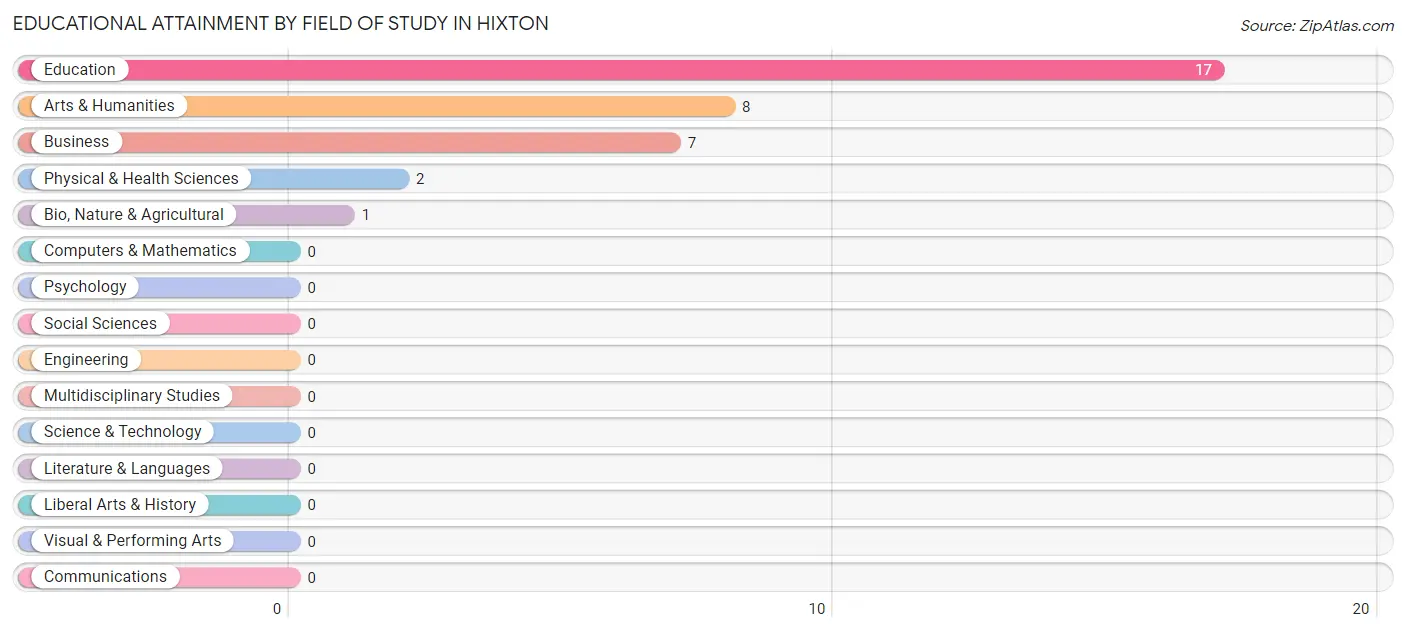
| Field of Study | # Graduates | % Graduates |
| Computers & Mathematics | 0 | 0.0% |
| Bio, Nature & Agricultural | 1 | 2.9% |
| Physical & Health Sciences | 2 | 5.7% |
| Psychology | 0 | 0.0% |
| Social Sciences | 0 | 0.0% |
| Engineering | 0 | 0.0% |
| Multidisciplinary Studies | 0 | 0.0% |
| Science & Technology | 0 | 0.0% |
| Business | 7 | 20.0% |
| Education | 17 | 48.6% |
| Literature & Languages | 0 | 0.0% |
| Liberal Arts & History | 0 | 0.0% |
| Visual & Performing Arts | 0 | 0.0% |
| Communications | 0 | 0.0% |
| Arts & Humanities | 8 | 22.9% |
| Total | 35 | 100.0% |
Transportation & Commute in Hixton
Vehicle Availability by Sex in Hixton
The most prevalent vehicle ownership categories in Hixton are males with 3 vehicles (64, accounting for 41.3%) and females with 3 vehicles (32, making up 61.0%).
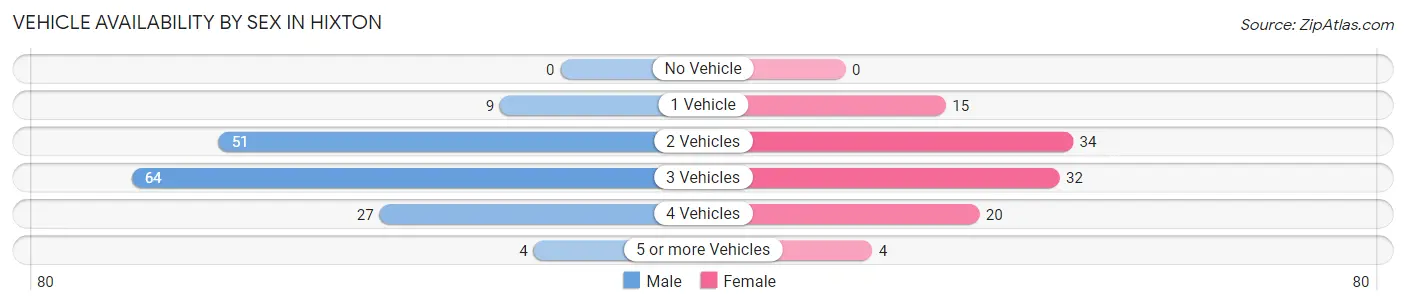
| Vehicles Available | Male | Female |
| No Vehicle | 0 (0.0%) | 0 (0.0%) |
| 1 Vehicle | 9 (5.8%) | 15 (14.3%) |
| 2 Vehicles | 51 (32.9%) | 34 (32.4%) |
| 3 Vehicles | 64 (41.3%) | 32 (30.5%) |
| 4 Vehicles | 27 (17.4%) | 20 (19.1%) |
| 5 or more Vehicles | 4 (2.6%) | 4 (3.8%) |
| Total | 155 (100.0%) | 105 (100.0%) |
Commute Time in Hixton
The most frequently occuring commute durations in Hixton are 15 to 19 minutes (86 commuters, 33.2%), 20 to 24 minutes (57 commuters, 22.0%), and 90 or more minutes (32 commuters, 12.4%).
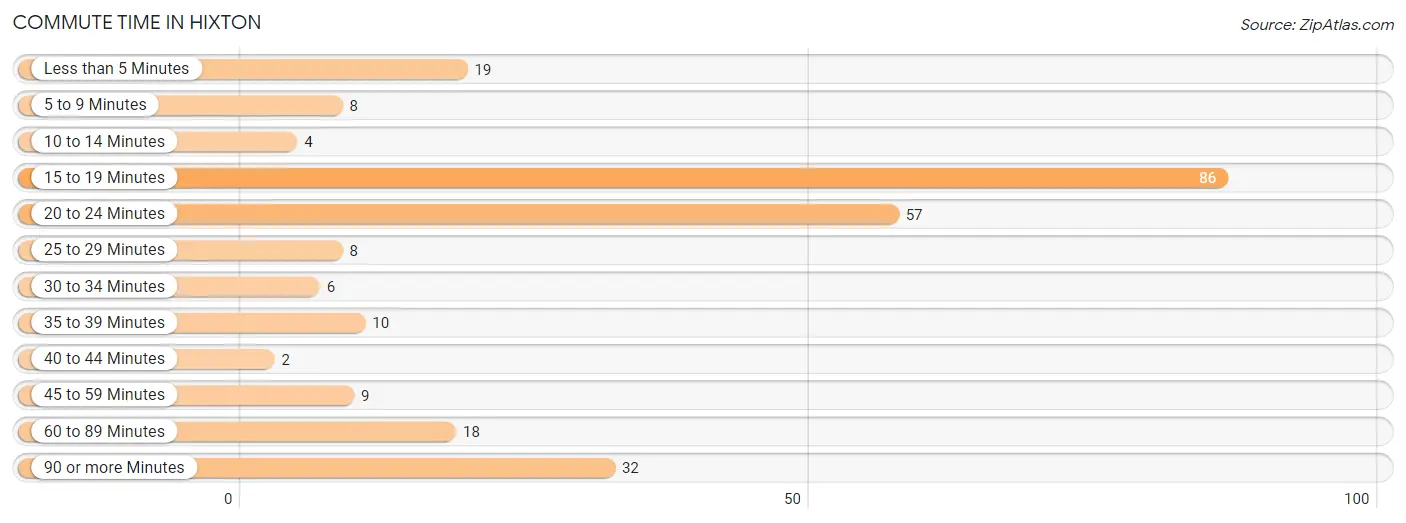
| Commute Time | # Commuters | % Commuters |
| Less than 5 Minutes | 19 | 7.3% |
| 5 to 9 Minutes | 8 | 3.1% |
| 10 to 14 Minutes | 4 | 1.5% |
| 15 to 19 Minutes | 86 | 33.2% |
| 20 to 24 Minutes | 57 | 22.0% |
| 25 to 29 Minutes | 8 | 3.1% |
| 30 to 34 Minutes | 6 | 2.3% |
| 35 to 39 Minutes | 10 | 3.9% |
| 40 to 44 Minutes | 2 | 0.8% |
| 45 to 59 Minutes | 9 | 3.5% |
| 60 to 89 Minutes | 18 | 7.0% |
| 90 or more Minutes | 32 | 12.4% |
Commute Time by Sex in Hixton
The most common commute times in Hixton are 15 to 19 minutes (56 commuters, 36.4%) for males and 20 to 24 minutes (44 commuters, 41.9%) for females.
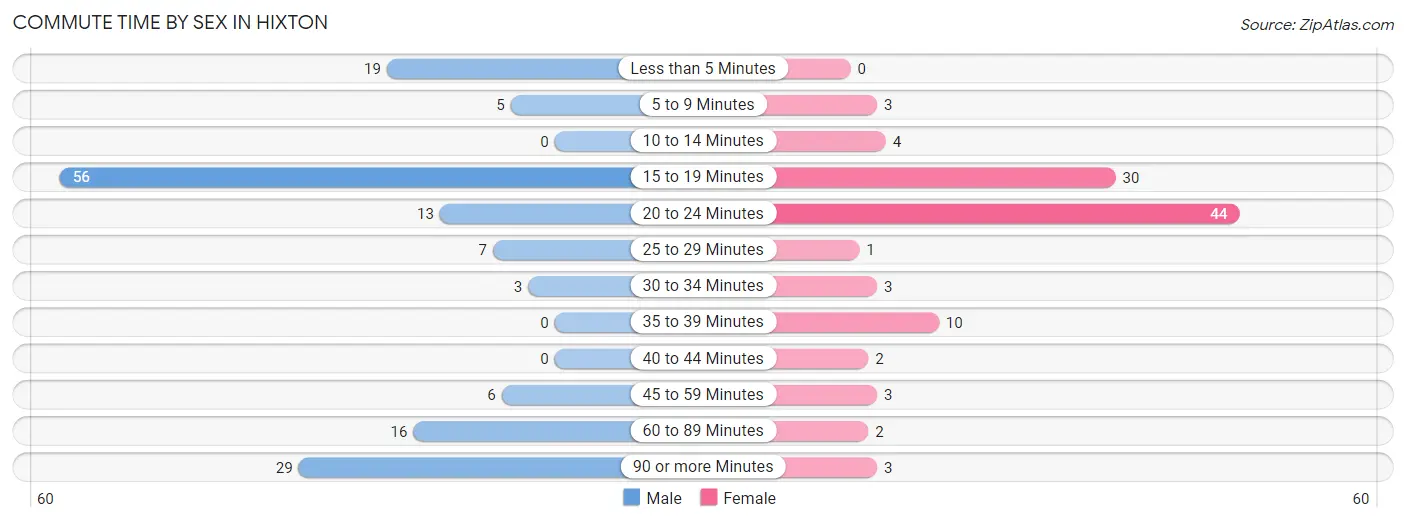
| Commute Time | Male | Female |
| Less than 5 Minutes | 19 (12.3%) | 0 (0.0%) |
| 5 to 9 Minutes | 5 (3.3%) | 3 (2.9%) |
| 10 to 14 Minutes | 0 (0.0%) | 4 (3.8%) |
| 15 to 19 Minutes | 56 (36.4%) | 30 (28.6%) |
| 20 to 24 Minutes | 13 (8.4%) | 44 (41.9%) |
| 25 to 29 Minutes | 7 (4.5%) | 1 (0.9%) |
| 30 to 34 Minutes | 3 (1.9%) | 3 (2.9%) |
| 35 to 39 Minutes | 0 (0.0%) | 10 (9.5%) |
| 40 to 44 Minutes | 0 (0.0%) | 2 (1.9%) |
| 45 to 59 Minutes | 6 (3.9%) | 3 (2.9%) |
| 60 to 89 Minutes | 16 (10.4%) | 2 (1.9%) |
| 90 or more Minutes | 29 (18.8%) | 3 (2.9%) |
Time of Departure to Work by Sex in Hixton
The most frequent times of departure to work in Hixton are 12:00 PM to 3:59 PM (47, 30.5%) for males and 12:00 PM to 3:59 PM (20, 19.1%) for females.
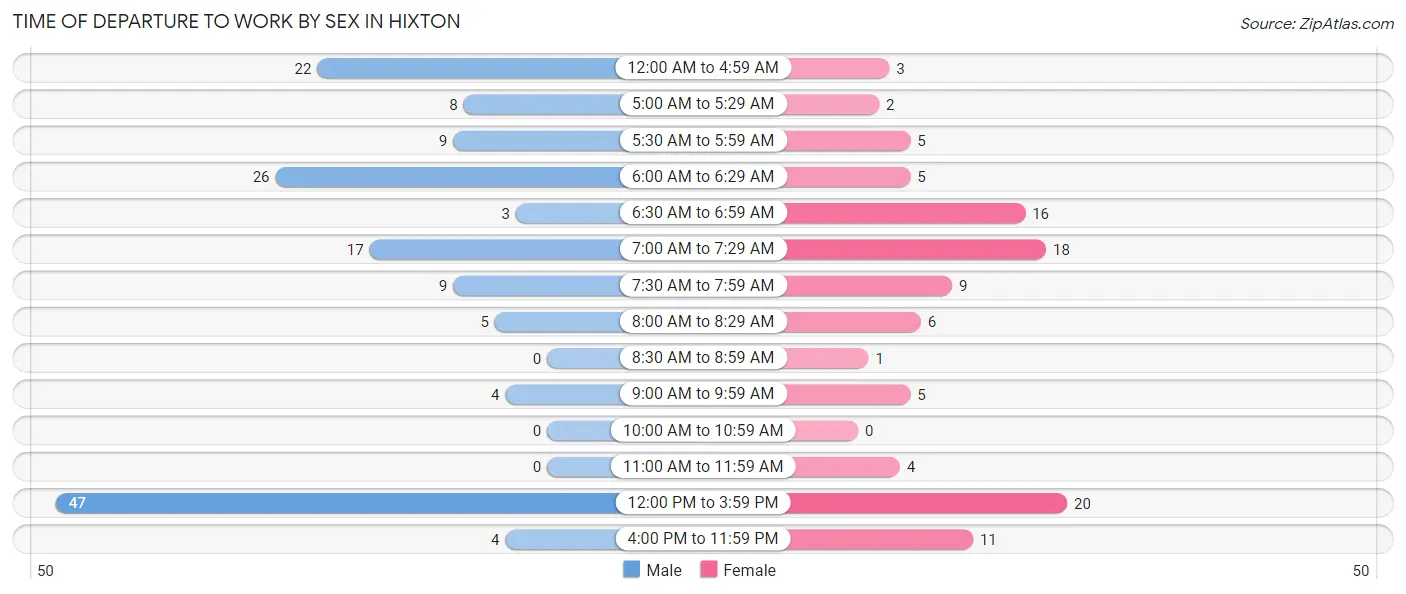
| Time of Departure | Male | Female |
| 12:00 AM to 4:59 AM | 22 (14.3%) | 3 (2.9%) |
| 5:00 AM to 5:29 AM | 8 (5.2%) | 2 (1.9%) |
| 5:30 AM to 5:59 AM | 9 (5.8%) | 5 (4.8%) |
| 6:00 AM to 6:29 AM | 26 (16.9%) | 5 (4.8%) |
| 6:30 AM to 6:59 AM | 3 (1.9%) | 16 (15.2%) |
| 7:00 AM to 7:29 AM | 17 (11.0%) | 18 (17.1%) |
| 7:30 AM to 7:59 AM | 9 (5.8%) | 9 (8.6%) |
| 8:00 AM to 8:29 AM | 5 (3.3%) | 6 (5.7%) |
| 8:30 AM to 8:59 AM | 0 (0.0%) | 1 (0.9%) |
| 9:00 AM to 9:59 AM | 4 (2.6%) | 5 (4.8%) |
| 10:00 AM to 10:59 AM | 0 (0.0%) | 0 (0.0%) |
| 11:00 AM to 11:59 AM | 0 (0.0%) | 4 (3.8%) |
| 12:00 PM to 3:59 PM | 47 (30.5%) | 20 (19.1%) |
| 4:00 PM to 11:59 PM | 4 (2.6%) | 11 (10.5%) |
| Total | 154 (100.0%) | 105 (100.0%) |
Housing Occupancy in Hixton
Occupancy by Ownership in Hixton
Of the total 168 dwellings in Hixton, owner-occupied units account for 138 (82.1%), while renter-occupied units make up 30 (17.9%).
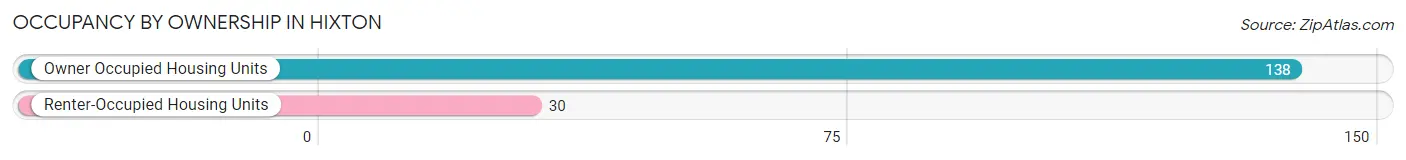
| Occupancy | # Housing Units | % Housing Units |
| Owner Occupied Housing Units | 138 | 82.1% |
| Renter-Occupied Housing Units | 30 | 17.9% |
| Total Occupied Housing Units | 168 | 100.0% |
Occupancy by Household Size in Hixton
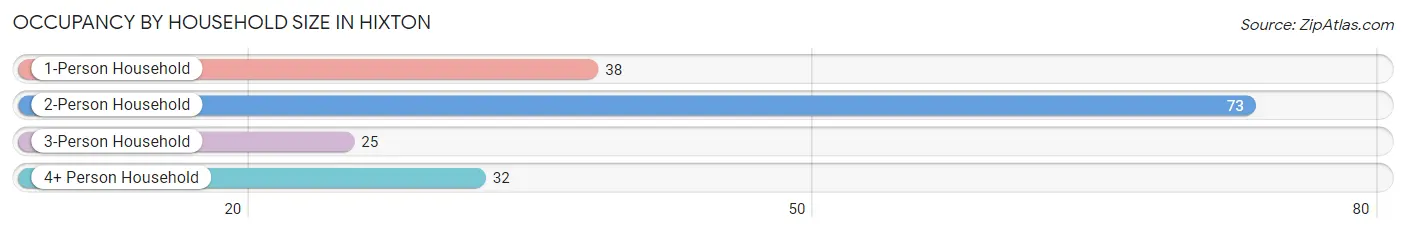
| Household Size | # Housing Units | % Housing Units |
| 1-Person Household | 38 | 22.6% |
| 2-Person Household | 73 | 43.4% |
| 3-Person Household | 25 | 14.9% |
| 4+ Person Household | 32 | 19.1% |
| Total Housing Units | 168 | 100.0% |
Occupancy by Ownership by Household Size in Hixton
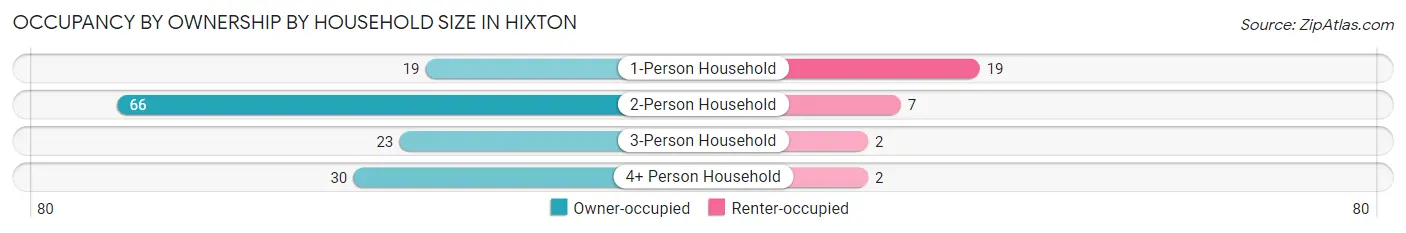
| Household Size | Owner-occupied | Renter-occupied |
| 1-Person Household | 19 (50.0%) | 19 (50.0%) |
| 2-Person Household | 66 (90.4%) | 7 (9.6%) |
| 3-Person Household | 23 (92.0%) | 2 (8.0%) |
| 4+ Person Household | 30 (93.8%) | 2 (6.2%) |
| Total Housing Units | 138 (82.1%) | 30 (17.9%) |
Occupancy by Educational Attainment in Hixton
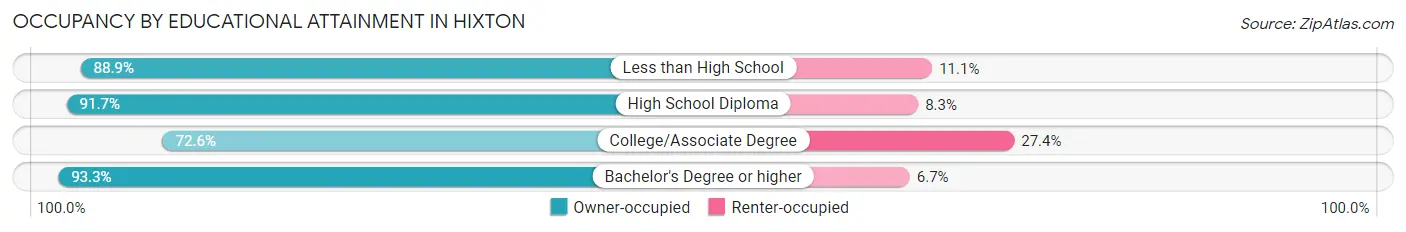
| Household Size | Owner-occupied | Renter-occupied |
| Less than High School | 8 (88.9%) | 1 (11.1%) |
| High School Diploma | 55 (91.7%) | 5 (8.3%) |
| College/Associate Degree | 61 (72.6%) | 23 (27.4%) |
| Bachelor's Degree or higher | 14 (93.3%) | 1 (6.7%) |
Occupancy by Age of Householder in Hixton
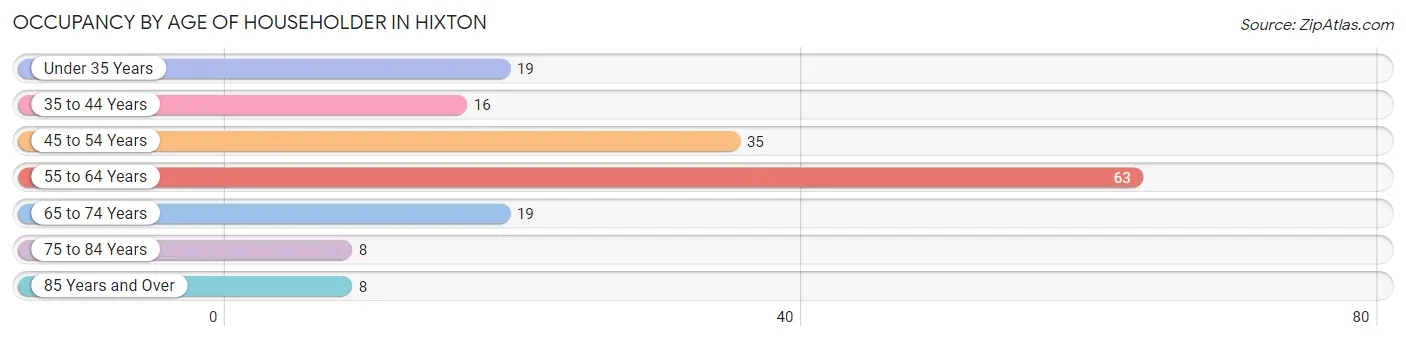
| Age Bracket | # Households | % Households |
| Under 35 Years | 19 | 11.3% |
| 35 to 44 Years | 16 | 9.5% |
| 45 to 54 Years | 35 | 20.8% |
| 55 to 64 Years | 63 | 37.5% |
| 65 to 74 Years | 19 | 11.3% |
| 75 to 84 Years | 8 | 4.8% |
| 85 Years and Over | 8 | 4.8% |
| Total | 168 | 100.0% |
Housing Finances in Hixton
Median Income by Occupancy in Hixton
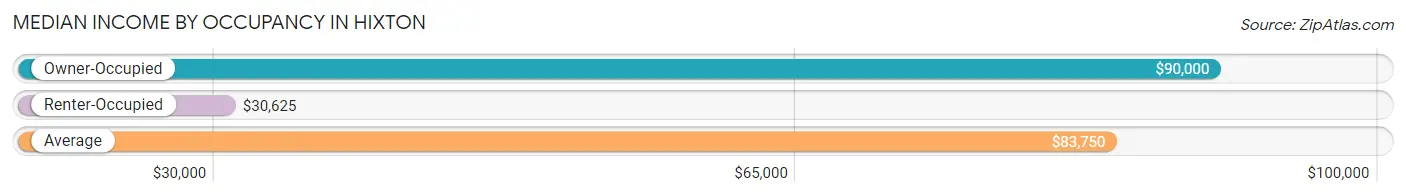
| Occupancy Type | # Households | Median Income |
| Owner-Occupied | 138 (82.1%) | $90,000 |
| Renter-Occupied | 30 (17.9%) | $30,625 |
| Average | 168 (100.0%) | $83,750 |
Occupancy by Householder Income Bracket in Hixton
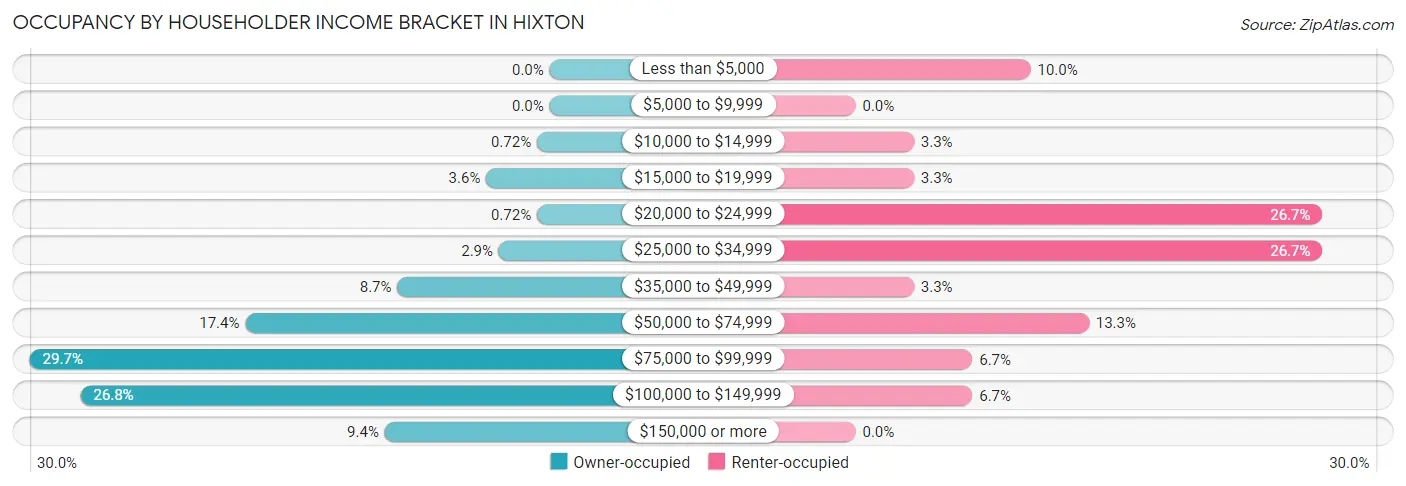
| Income Bracket | Owner-occupied | Renter-occupied |
| Less than $5,000 | 0 (0.0%) | 3 (10.0%) |
| $5,000 to $9,999 | 0 (0.0%) | 0 (0.0%) |
| $10,000 to $14,999 | 1 (0.7%) | 1 (3.3%) |
| $15,000 to $19,999 | 5 (3.6%) | 1 (3.3%) |
| $20,000 to $24,999 | 1 (0.7%) | 8 (26.7%) |
| $25,000 to $34,999 | 4 (2.9%) | 8 (26.7%) |
| $35,000 to $49,999 | 12 (8.7%) | 1 (3.3%) |
| $50,000 to $74,999 | 24 (17.4%) | 4 (13.3%) |
| $75,000 to $99,999 | 41 (29.7%) | 2 (6.7%) |
| $100,000 to $149,999 | 37 (26.8%) | 2 (6.7%) |
| $150,000 or more | 13 (9.4%) | 0 (0.0%) |
| Total | 138 (100.0%) | 30 (100.0%) |
Monthly Housing Cost Tiers in Hixton
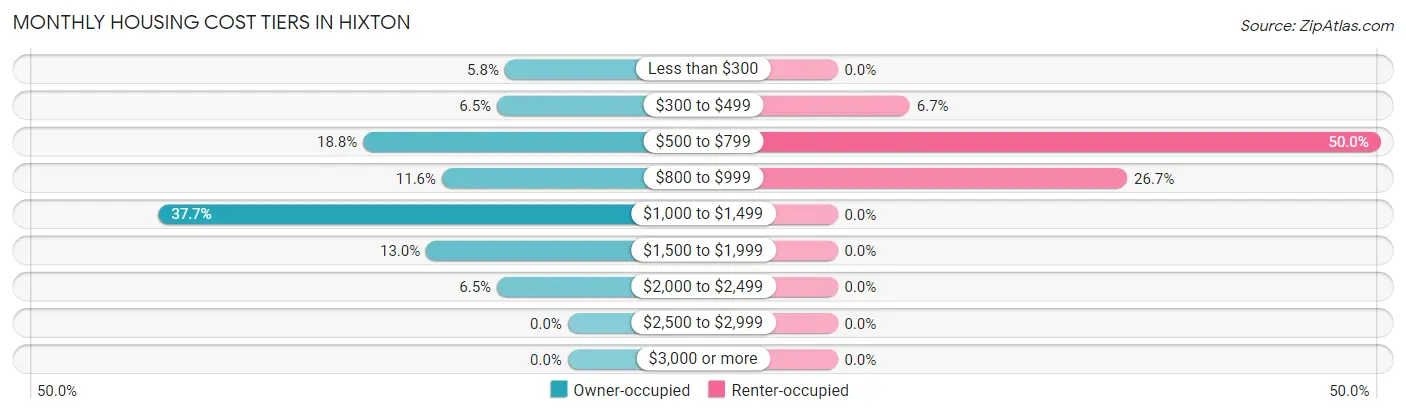
| Monthly Cost | Owner-occupied | Renter-occupied |
| Less than $300 | 8 (5.8%) | 0 (0.0%) |
| $300 to $499 | 9 (6.5%) | 2 (6.7%) |
| $500 to $799 | 26 (18.8%) | 15 (50.0%) |
| $800 to $999 | 16 (11.6%) | 8 (26.7%) |
| $1,000 to $1,499 | 52 (37.7%) | 0 (0.0%) |
| $1,500 to $1,999 | 18 (13.0%) | 0 (0.0%) |
| $2,000 to $2,499 | 9 (6.5%) | 0 (0.0%) |
| $2,500 to $2,999 | 0 (0.0%) | 0 (0.0%) |
| $3,000 or more | 0 (0.0%) | 0 (0.0%) |
| Total | 138 (100.0%) | 30 (100.0%) |
Physical Housing Characteristics in Hixton
Housing Structures in Hixton
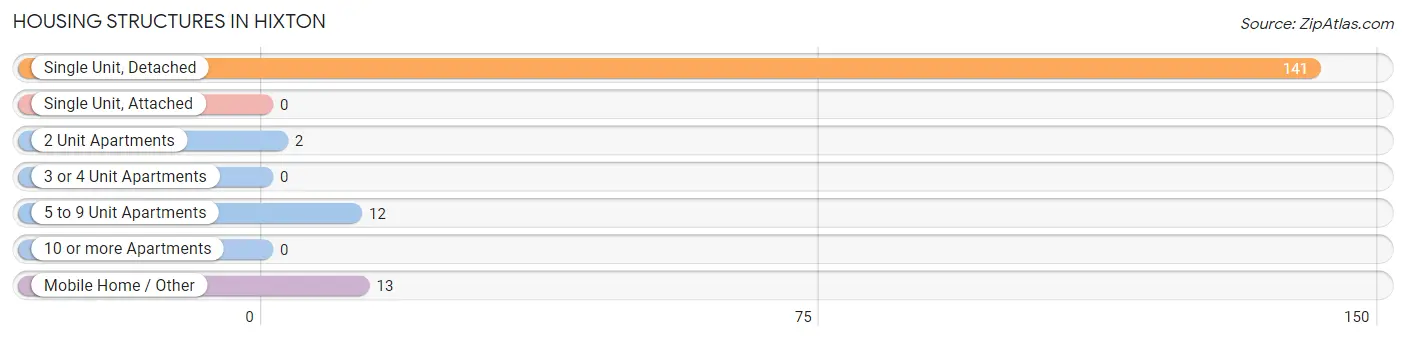
| Structure Type | # Housing Units | % Housing Units |
| Single Unit, Detached | 141 | 83.9% |
| Single Unit, Attached | 0 | 0.0% |
| 2 Unit Apartments | 2 | 1.2% |
| 3 or 4 Unit Apartments | 0 | 0.0% |
| 5 to 9 Unit Apartments | 12 | 7.1% |
| 10 or more Apartments | 0 | 0.0% |
| Mobile Home / Other | 13 | 7.7% |
| Total | 168 | 100.0% |
Housing Structures by Occupancy in Hixton
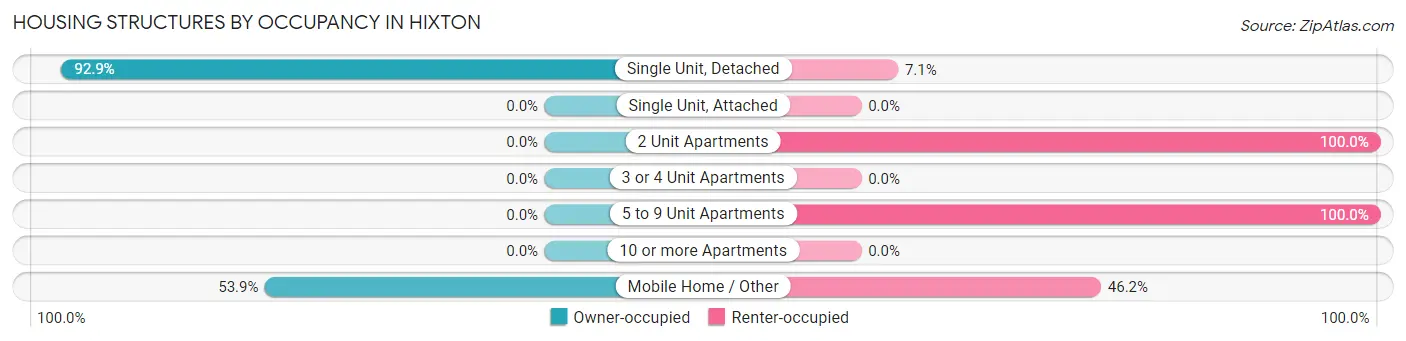
| Structure Type | Owner-occupied | Renter-occupied |
| Single Unit, Detached | 131 (92.9%) | 10 (7.1%) |
| Single Unit, Attached | 0 (0.0%) | 0 (0.0%) |
| 2 Unit Apartments | 0 (0.0%) | 2 (100.0%) |
| 3 or 4 Unit Apartments | 0 (0.0%) | 0 (0.0%) |
| 5 to 9 Unit Apartments | 0 (0.0%) | 12 (100.0%) |
| 10 or more Apartments | 0 (0.0%) | 0 (0.0%) |
| Mobile Home / Other | 7 (53.8%) | 6 (46.2%) |
| Total | 138 (82.1%) | 30 (17.9%) |
Housing Structures by Number of Rooms in Hixton
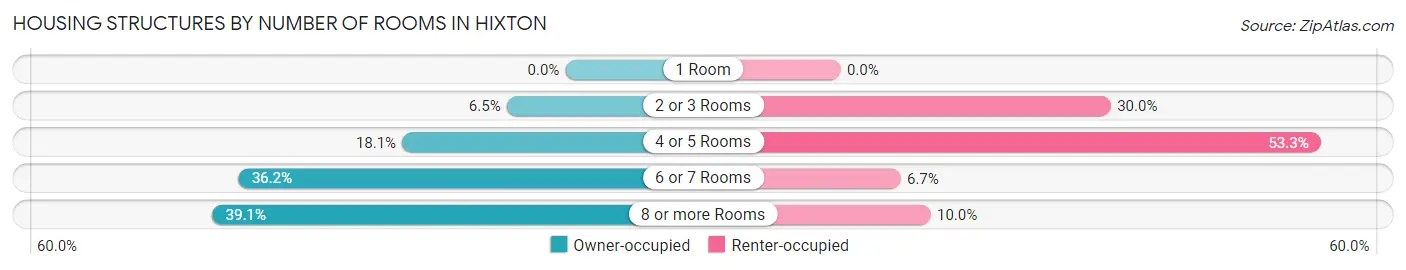
| Number of Rooms | Owner-occupied | Renter-occupied |
| 1 Room | 0 (0.0%) | 0 (0.0%) |
| 2 or 3 Rooms | 9 (6.5%) | 9 (30.0%) |
| 4 or 5 Rooms | 25 (18.1%) | 16 (53.3%) |
| 6 or 7 Rooms | 50 (36.2%) | 2 (6.7%) |
| 8 or more Rooms | 54 (39.1%) | 3 (10.0%) |
| Total | 138 (100.0%) | 30 (100.0%) |
Housing Structure by Heating Type in Hixton
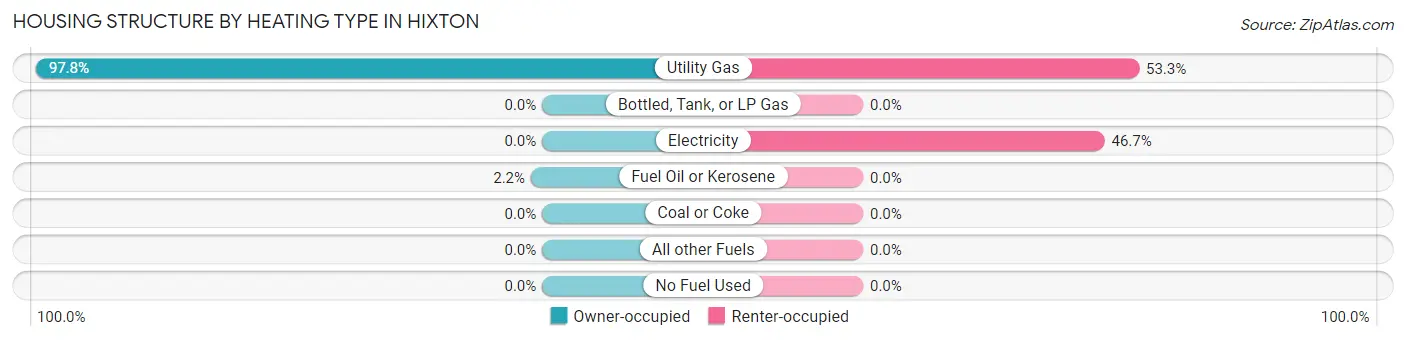
| Heating Type | Owner-occupied | Renter-occupied |
| Utility Gas | 135 (97.8%) | 16 (53.3%) |
| Bottled, Tank, or LP Gas | 0 (0.0%) | 0 (0.0%) |
| Electricity | 0 (0.0%) | 14 (46.7%) |
| Fuel Oil or Kerosene | 3 (2.2%) | 0 (0.0%) |
| Coal or Coke | 0 (0.0%) | 0 (0.0%) |
| All other Fuels | 0 (0.0%) | 0 (0.0%) |
| No Fuel Used | 0 (0.0%) | 0 (0.0%) |
| Total | 138 (100.0%) | 30 (100.0%) |
Household Vehicle Usage in Hixton
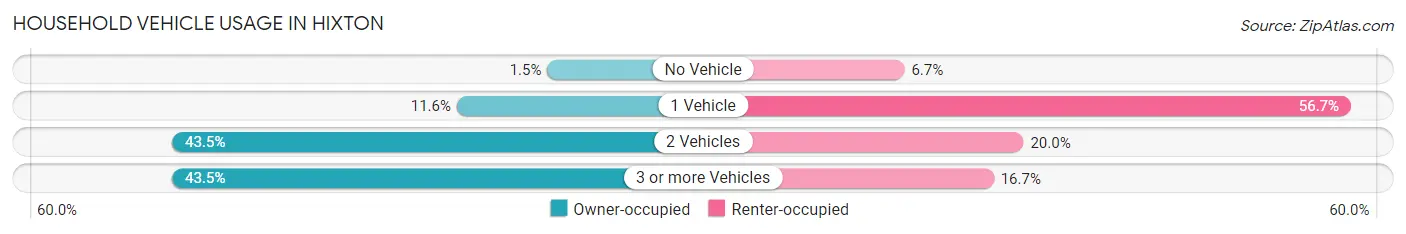
| Vehicles per Household | Owner-occupied | Renter-occupied |
| No Vehicle | 2 (1.5%) | 2 (6.7%) |
| 1 Vehicle | 16 (11.6%) | 17 (56.7%) |
| 2 Vehicles | 60 (43.5%) | 6 (20.0%) |
| 3 or more Vehicles | 60 (43.5%) | 5 (16.7%) |
| Total | 138 (100.0%) | 30 (100.0%) |
Real Estate & Mortgages in Hixton
Real Estate and Mortgage Overview in Hixton
| Characteristic | Without Mortgage | With Mortgage |
| Housing Units | 34 | 104 |
| Median Property Value | $115,600 | $158,100 |
| Median Household Income | $73,750 | $9 |
| Monthly Housing Costs | $550 | $0 |
| Real Estate Taxes | $2,063 | $4 |
Property Value by Mortgage Status in Hixton
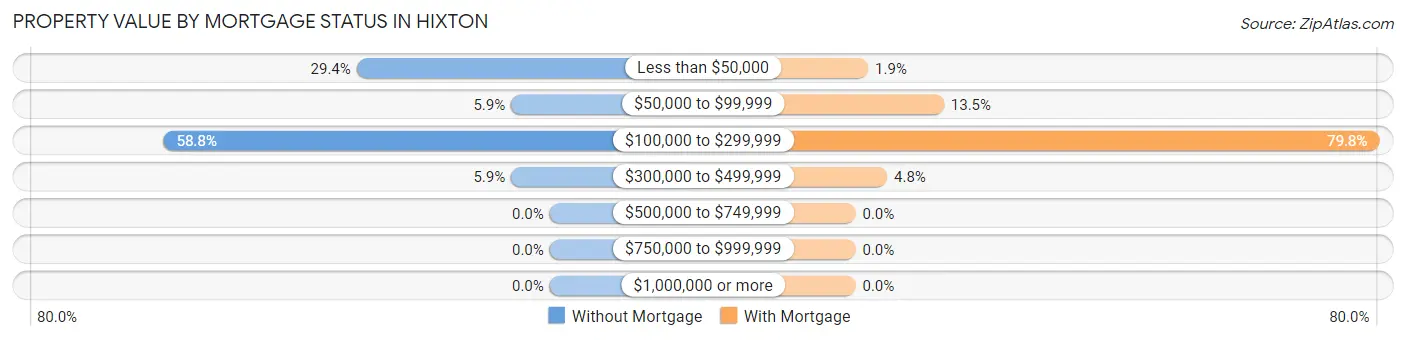
| Property Value | Without Mortgage | With Mortgage |
| Less than $50,000 | 10 (29.4%) | 2 (1.9%) |
| $50,000 to $99,999 | 2 (5.9%) | 14 (13.5%) |
| $100,000 to $299,999 | 20 (58.8%) | 83 (79.8%) |
| $300,000 to $499,999 | 2 (5.9%) | 5 (4.8%) |
| $500,000 to $749,999 | 0 (0.0%) | 0 (0.0%) |
| $750,000 to $999,999 | 0 (0.0%) | 0 (0.0%) |
| $1,000,000 or more | 0 (0.0%) | 0 (0.0%) |
| Total | 34 (100.0%) | 104 (100.0%) |
Household Income by Mortgage Status in Hixton
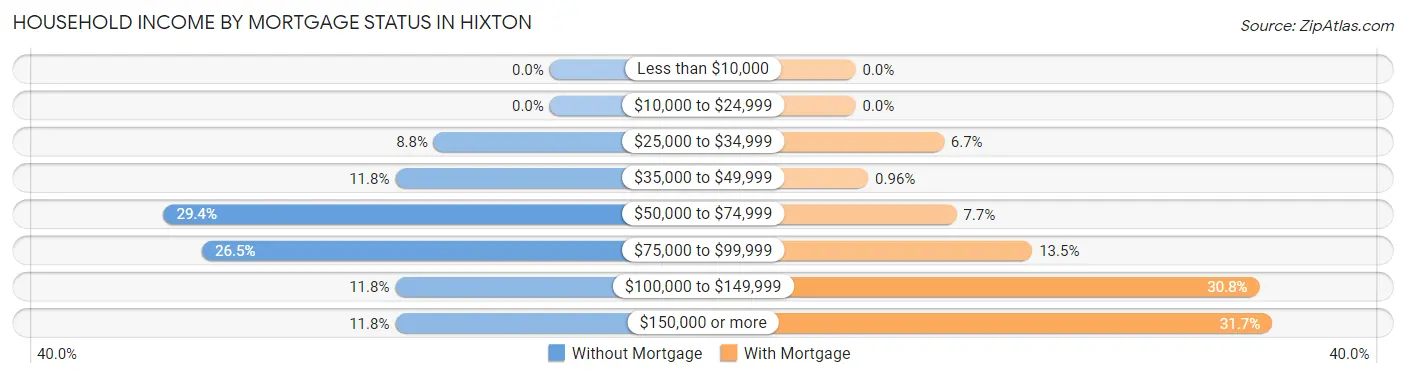
| Household Income | Without Mortgage | With Mortgage |
| Less than $10,000 | 0 (0.0%) | 0 (0.0%) |
| $10,000 to $24,999 | 0 (0.0%) | 0 (0.0%) |
| $25,000 to $34,999 | 3 (8.8%) | 7 (6.7%) |
| $35,000 to $49,999 | 4 (11.8%) | 1 (1.0%) |
| $50,000 to $74,999 | 10 (29.4%) | 8 (7.7%) |
| $75,000 to $99,999 | 9 (26.5%) | 14 (13.5%) |
| $100,000 to $149,999 | 4 (11.8%) | 32 (30.8%) |
| $150,000 or more | 4 (11.8%) | 33 (31.7%) |
| Total | 34 (100.0%) | 104 (100.0%) |
Property Value to Household Income Ratio in Hixton
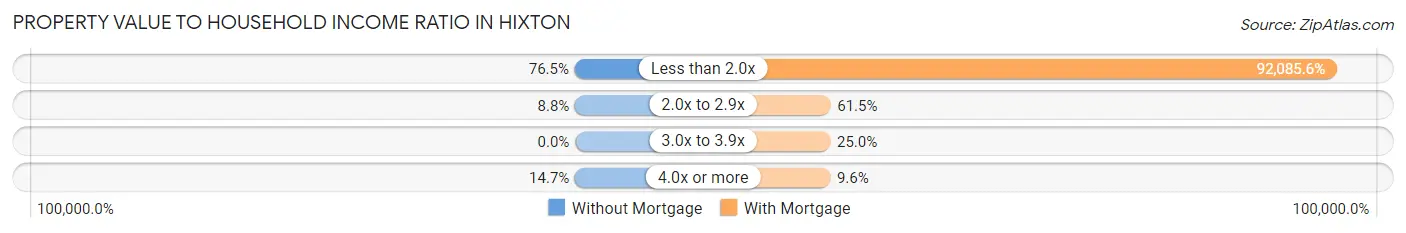
| Value-to-Income Ratio | Without Mortgage | With Mortgage |
| Less than 2.0x | 26 (76.5%) | 95,769 (92,085.6%) |
| 2.0x to 2.9x | 3 (8.8%) | 64 (61.5%) |
| 3.0x to 3.9x | 0 (0.0%) | 26 (25.0%) |
| 4.0x or more | 5 (14.7%) | 10 (9.6%) |
| Total | 34 (100.0%) | 104 (100.0%) |
Real Estate Taxes by Mortgage Status in Hixton
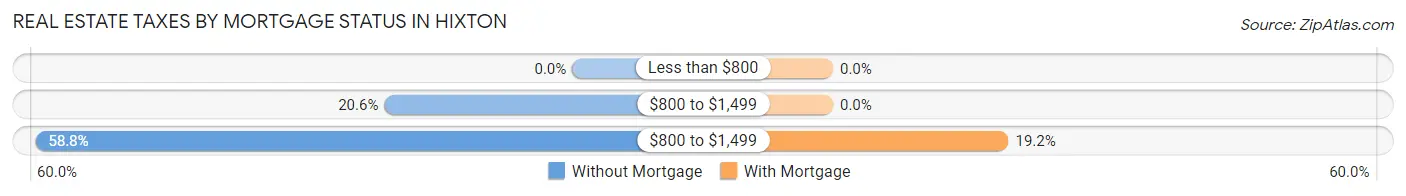
| Property Taxes | Without Mortgage | With Mortgage |
| Less than $800 | 0 (0.0%) | 0 (0.0%) |
| $800 to $1,499 | 7 (20.6%) | 0 (0.0%) |
| $800 to $1,499 | 20 (58.8%) | 20 (19.2%) |
| Total | 34 (100.0%) | 104 (100.0%) |
Health & Disability in Hixton
Health Insurance Coverage by Age in Hixton
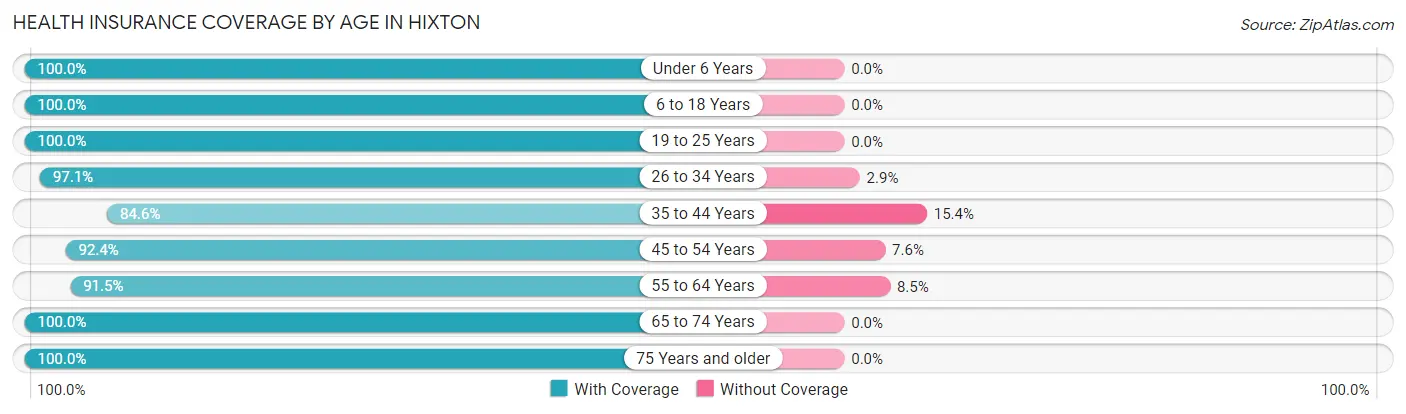
| Age Bracket | With Coverage | Without Coverage |
| Under 6 Years | 18 (100.0%) | 0 (0.0%) |
| 6 to 18 Years | 51 (100.0%) | 0 (0.0%) |
| 19 to 25 Years | 41 (100.0%) | 0 (0.0%) |
| 26 to 34 Years | 34 (97.1%) | 1 (2.9%) |
| 35 to 44 Years | 22 (84.6%) | 4 (15.4%) |
| 45 to 54 Years | 97 (92.4%) | 8 (7.6%) |
| 55 to 64 Years | 86 (91.5%) | 8 (8.5%) |
| 65 to 74 Years | 35 (100.0%) | 0 (0.0%) |
| 75 Years and older | 19 (100.0%) | 0 (0.0%) |
| Total | 403 (95.1%) | 21 (5.0%) |
Health Insurance Coverage by Citizenship Status in Hixton
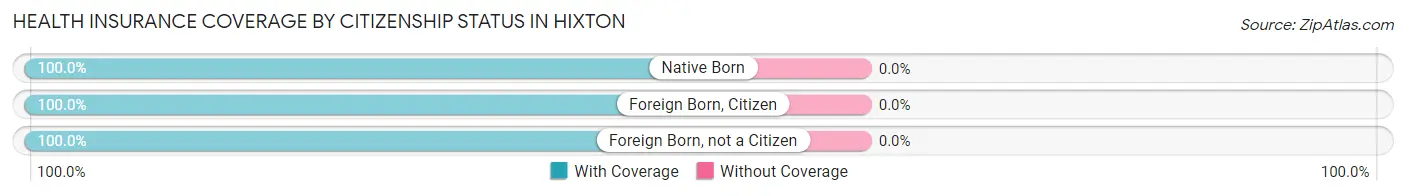
| Citizenship Status | With Coverage | Without Coverage |
| Native Born | 18 (100.0%) | 0 (0.0%) |
| Foreign Born, Citizen | 51 (100.0%) | 0 (0.0%) |
| Foreign Born, not a Citizen | 41 (100.0%) | 0 (0.0%) |
Health Insurance Coverage by Household Income in Hixton
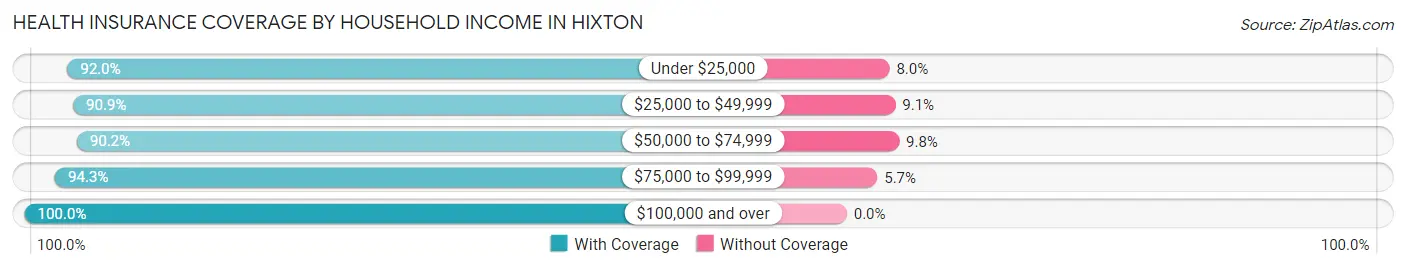
| Household Income | With Coverage | Without Coverage |
| Under $25,000 | 23 (92.0%) | 2 (8.0%) |
| $25,000 to $49,999 | 40 (90.9%) | 4 (9.1%) |
| $50,000 to $74,999 | 46 (90.2%) | 5 (9.8%) |
| $75,000 to $99,999 | 165 (94.3%) | 10 (5.7%) |
| $100,000 and over | 129 (100.0%) | 0 (0.0%) |
Public vs Private Health Insurance Coverage by Age in Hixton
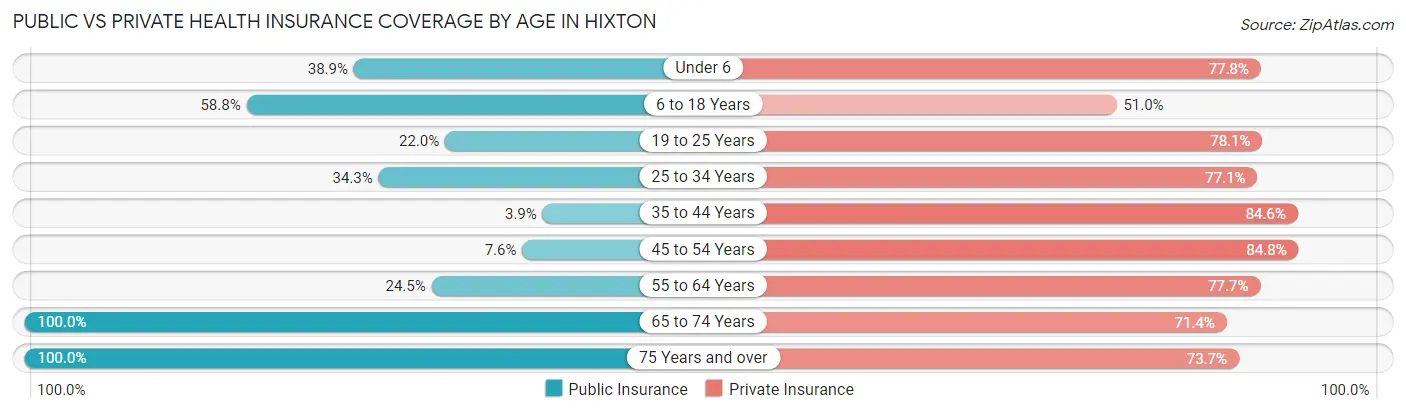
| Age Bracket | Public Insurance | Private Insurance |
| Under 6 | 7 (38.9%) | 14 (77.8%) |
| 6 to 18 Years | 30 (58.8%) | 26 (51.0%) |
| 19 to 25 Years | 9 (22.0%) | 32 (78.0%) |
| 25 to 34 Years | 12 (34.3%) | 27 (77.1%) |
| 35 to 44 Years | 1 (3.8%) | 22 (84.6%) |
| 45 to 54 Years | 8 (7.6%) | 89 (84.8%) |
| 55 to 64 Years | 23 (24.5%) | 73 (77.7%) |
| 65 to 74 Years | 35 (100.0%) | 25 (71.4%) |
| 75 Years and over | 19 (100.0%) | 14 (73.7%) |
| Total | 144 (34.0%) | 322 (75.9%) |
Disability Status by Sex by Age in Hixton
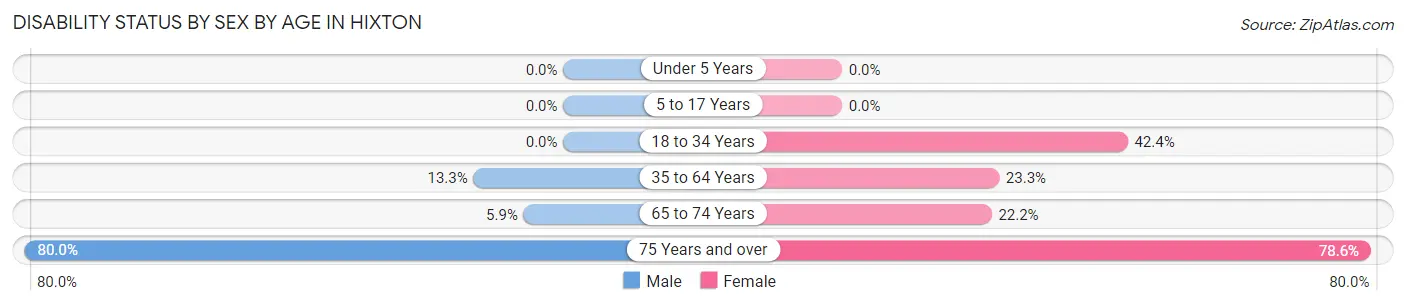
| Age Bracket | Male | Female |
| Under 5 Years | 0 (0.0%) | 0 (0.0%) |
| 5 to 17 Years | 0 (0.0%) | 0 (0.0%) |
| 18 to 34 Years | 0 (0.0%) | 14 (42.4%) |
| 35 to 64 Years | 18 (13.3%) | 21 (23.3%) |
| 65 to 74 Years | 1 (5.9%) | 4 (22.2%) |
| 75 Years and over | 4 (80.0%) | 11 (78.6%) |
Disability Class by Sex by Age in Hixton
Disability Class: Hearing Difficulty
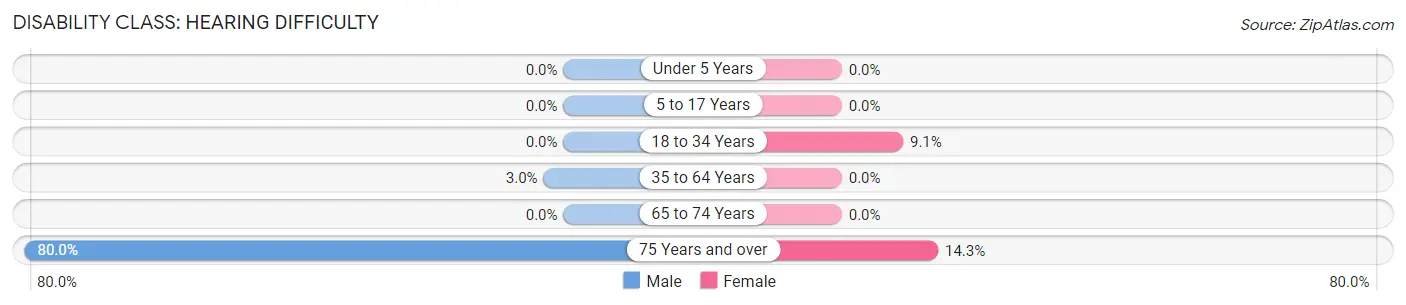
| Age Bracket | Male | Female |
| Under 5 Years | 0 (0.0%) | 0 (0.0%) |
| 5 to 17 Years | 0 (0.0%) | 0 (0.0%) |
| 18 to 34 Years | 0 (0.0%) | 3 (9.1%) |
| 35 to 64 Years | 4 (3.0%) | 0 (0.0%) |
| 65 to 74 Years | 0 (0.0%) | 0 (0.0%) |
| 75 Years and over | 4 (80.0%) | 2 (14.3%) |
Disability Class: Vision Difficulty
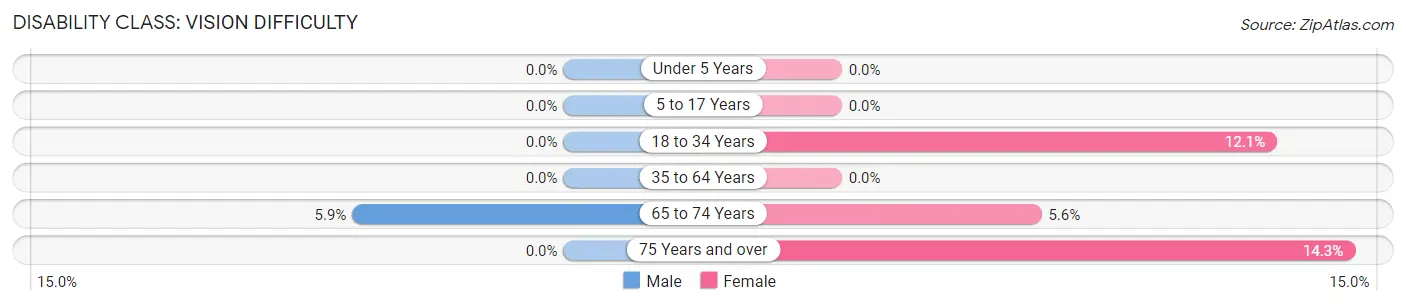
| Age Bracket | Male | Female |
| Under 5 Years | 0 (0.0%) | 0 (0.0%) |
| 5 to 17 Years | 0 (0.0%) | 0 (0.0%) |
| 18 to 34 Years | 0 (0.0%) | 4 (12.1%) |
| 35 to 64 Years | 0 (0.0%) | 0 (0.0%) |
| 65 to 74 Years | 1 (5.9%) | 1 (5.6%) |
| 75 Years and over | 0 (0.0%) | 2 (14.3%) |
Disability Class: Cognitive Difficulty
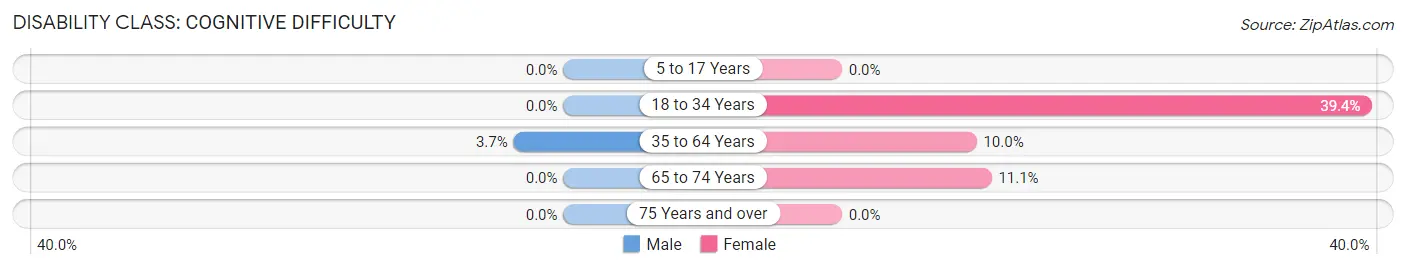
| Age Bracket | Male | Female |
| 5 to 17 Years | 0 (0.0%) | 0 (0.0%) |
| 18 to 34 Years | 0 (0.0%) | 13 (39.4%) |
| 35 to 64 Years | 5 (3.7%) | 9 (10.0%) |
| 65 to 74 Years | 0 (0.0%) | 2 (11.1%) |
| 75 Years and over | 0 (0.0%) | 0 (0.0%) |
Disability Class: Ambulatory Difficulty
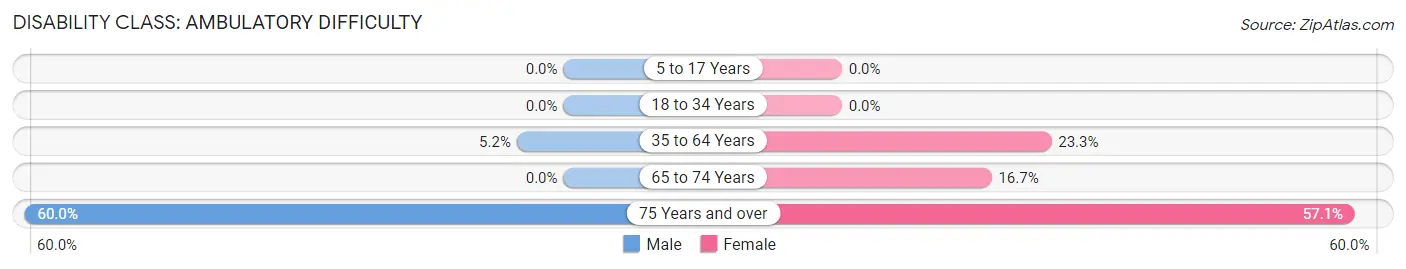
| Age Bracket | Male | Female |
| 5 to 17 Years | 0 (0.0%) | 0 (0.0%) |
| 18 to 34 Years | 0 (0.0%) | 0 (0.0%) |
| 35 to 64 Years | 7 (5.2%) | 21 (23.3%) |
| 65 to 74 Years | 0 (0.0%) | 3 (16.7%) |
| 75 Years and over | 3 (60.0%) | 8 (57.1%) |
Disability Class: Self-Care Difficulty
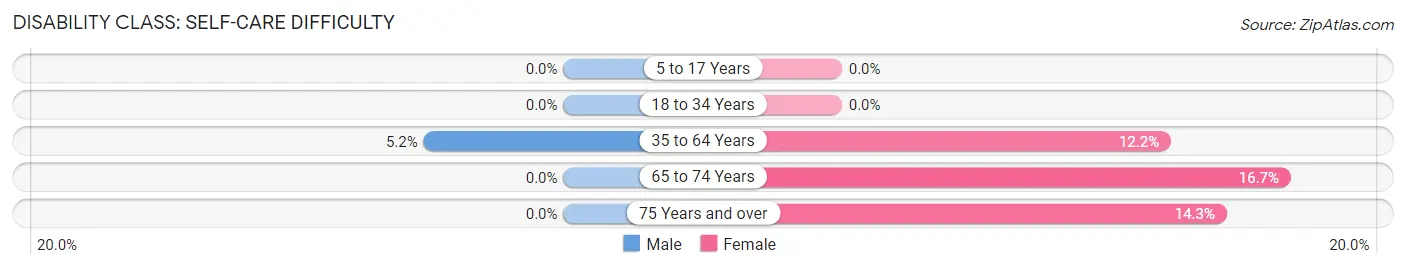
| Age Bracket | Male | Female |
| 5 to 17 Years | 0 (0.0%) | 0 (0.0%) |
| 18 to 34 Years | 0 (0.0%) | 0 (0.0%) |
| 35 to 64 Years | 7 (5.2%) | 11 (12.2%) |
| 65 to 74 Years | 0 (0.0%) | 3 (16.7%) |
| 75 Years and over | 0 (0.0%) | 2 (14.3%) |
Technology Access in Hixton
Computing Device Access in Hixton
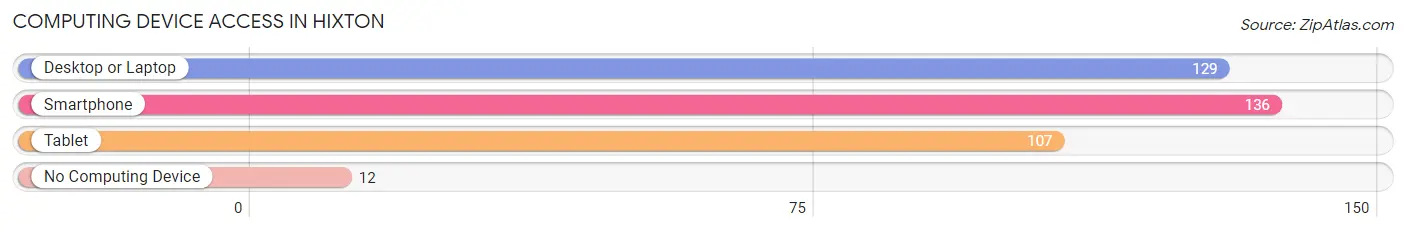
| Device Type | # Households | % Households |
| Desktop or Laptop | 129 | 76.8% |
| Smartphone | 136 | 80.9% |
| Tablet | 107 | 63.7% |
| No Computing Device | 12 | 7.1% |
| Total | 168 | 100.0% |
Internet Access in Hixton
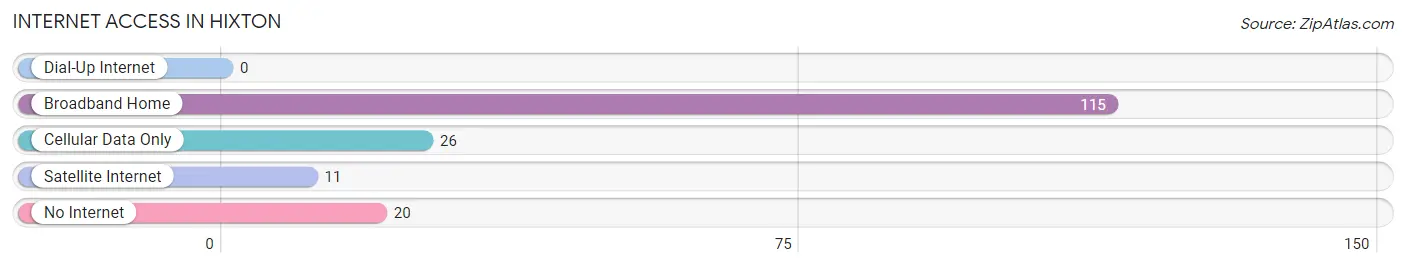
| Internet Type | # Households | % Households |
| Dial-Up Internet | 0 | 0.0% |
| Broadband Home | 115 | 68.4% |
| Cellular Data Only | 26 | 15.5% |
| Satellite Internet | 11 | 6.6% |
| No Internet | 20 | 11.9% |
| Total | 168 | 100.0% |
Hixton Summary
Hixton is a small unincorporated community located in Jackson County, Wisconsin, United States. It is situated along the Trempealeau River, approximately 10 miles east of Black River Falls. The population of Hixton was estimated to be around 200 in 2020.
History
Hixton was first settled in 1854 by a group of settlers from New York. The town was named after a local Native American chief, Hixton. The first post office was established in 1856. The town was incorporated in 1876 and the first school was built in 1877.
In the late 19th century, Hixton was a thriving agricultural community. The town was home to several sawmills, a grist mill, a creamery, and a cheese factory. The town also had a hotel, a general store, and a blacksmith shop.
Geography
Hixton is located in the western part of Jackson County, Wisconsin. It is situated along the Trempealeau River, approximately 10 miles east of Black River Falls. The town is surrounded by rolling hills and wooded areas. The terrain is mostly flat with some areas of higher elevation.
The climate in Hixton is generally mild, with cold winters and warm summers. The average annual temperature is around 50 degrees Fahrenheit. The average annual precipitation is around 35 inches.
Economy
The economy of Hixton is largely based on agriculture. The town is home to several dairy farms, as well as some beef and poultry farms. The town also has a few small businesses, including a gas station, a convenience store, and a restaurant.
Demographics
The population of Hixton was estimated to be around 200 in 2020. The racial makeup of the town is predominantly white, with a small percentage of African Americans and Native Americans. The median household income is around $45,000. The median age is around 40 years old. The town has a high rate of poverty, with around 25% of the population living below the poverty line.
Hixton is a small, rural community with a rich history and a strong sense of community. The town is home to a variety of businesses and organizations, and is a great place to live and work. The town is also home to a variety of recreational activities, including fishing, hunting, and camping.
Common Questions
What is Per Capita Income in Hixton?
Per Capita income in Hixton is $32,880.
What is the Median Family Income in Hixton?
Median Family Income in Hixton is $95,288.
What is the Median Household income in Hixton?
Median Household Income in Hixton is $83,750.
What is Income or Wage Gap in Hixton?
Income or Wage Gap in Hixton is 3.3%.
Women in Hixton earn 96.7 cents for every dollar earned by a man.
What is Inequality or Gini Index in Hixton?
Inequality or Gini Index in Hixton is 0.30.
What is the Total Population of Hixton?
Total Population of Hixton is 424.
What is the Total Male Population of Hixton?
Total Male Population of Hixton is 243.
What is the Total Female Population of Hixton?
Total Female Population of Hixton is 181.
What is the Ratio of Males per 100 Females in Hixton?
There are 134.25 Males per 100 Females in Hixton.
What is the Ratio of Females per 100 Males in Hixton?
There are 74.49 Females per 100 Males in Hixton.
What is the Median Population Age in Hixton?
Median Population Age in Hixton is 50.1 Years.
What is the Average Family Size in Hixton
Average Family Size in Hixton is 3.0 People.
What is the Average Household Size in Hixton
Average Household Size in Hixton is 2.5 People.
How Large is the Labor Force in Hixton?
There are 288 People in the Labor Forcein in Hixton.
What is the Percentage of People in the Labor Force in Hixton?
76.2% of People are in the Labor Force in Hixton.
What is the Unemployment Rate in Hixton?
Unemployment Rate in Hixton is 8.7%.