Highland, WI Map & Demographics
Highland Map

Highland Overview
$29,956
PER CAPITA INCOME
$85,682
AVG FAMILY INCOME
$62,083
AVG HOUSEHOLD INCOME
38.4%
WAGE / INCOME GAP [ % ]
61.6¢/ $1
WAGE / INCOME GAP [ $ ]
0.47
INEQUALITY / GINI INDEX
875
TOTAL POPULATION
456
MALE POPULATION
419
FEMALE POPULATION
108.83
MALES / 100 FEMALES
91.89
FEMALES / 100 MALES
43.8
MEDIAN AGE
2.9
AVG FAMILY SIZE
2.3
AVG HOUSEHOLD SIZE
443
LABOR FORCE [ PEOPLE ]
64.2%
PERCENT IN LABOR FORCE
Highland Zip Codes
Highland Area Codes
Income in Highland
Income Overview in Highland
Per Capita Income in Highland is $29,956, while median incomes of families and households are $85,682 and $62,083 respectively.
| Characteristic | Number | Measure |
| Per Capita Income | 875 | $29,956 |
| Median Family Income | 246 | $85,682 |
| Mean Family Income | 246 | $89,943 |
| Median Household Income | 370 | $62,083 |
| Mean Household Income | 370 | $68,780 |
| Income Deficit | 246 | $0 |
| Wage / Income Gap (%) | 875 | 38.44% |
| Wage / Income Gap ($) | 875 | 61.56¢ per $1 |
| Gini / Inequality Index | 875 | 0.47 |
Earnings by Sex in Highland
Average Earnings in Highland are $43,750, $55,893 for men and $34,408 for women, a difference of 38.4%.
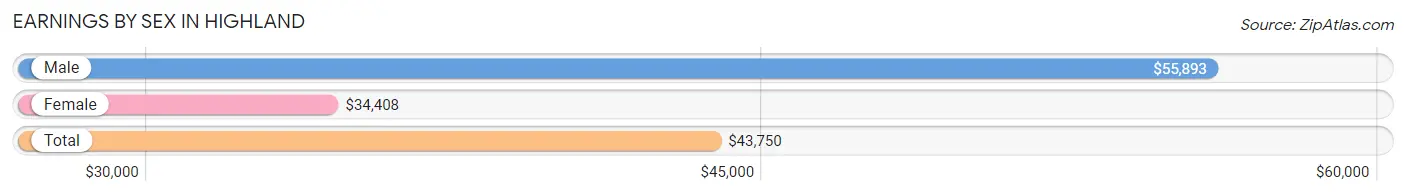
| Sex | Number | Average Earnings |
| Male | 230 (48.8%) | $55,893 |
| Female | 241 (51.2%) | $34,408 |
| Total | 471 (100.0%) | $43,750 |
Earnings by Sex by Income Bracket in Highland
The most common earnings brackets in Highland are $55,000 to $64,999 for men (49 | 21.3%) and $30,000 to $34,999 for women (30 | 12.4%).
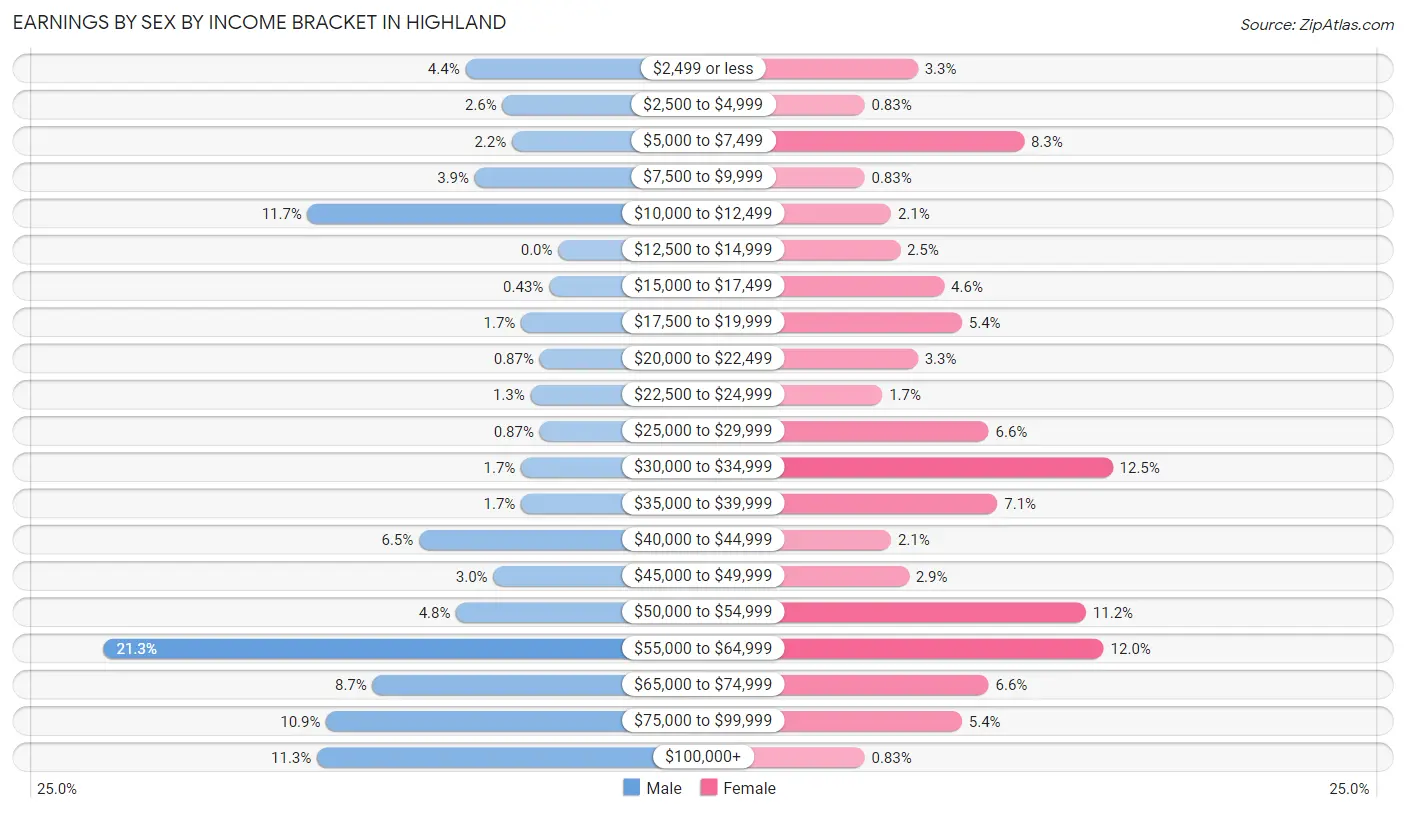
| Income | Male | Female |
| $2,499 or less | 10 (4.3%) | 8 (3.3%) |
| $2,500 to $4,999 | 6 (2.6%) | 2 (0.8%) |
| $5,000 to $7,499 | 5 (2.2%) | 20 (8.3%) |
| $7,500 to $9,999 | 9 (3.9%) | 2 (0.8%) |
| $10,000 to $12,499 | 27 (11.7%) | 5 (2.1%) |
| $12,500 to $14,999 | 0 (0.0%) | 6 (2.5%) |
| $15,000 to $17,499 | 1 (0.4%) | 11 (4.6%) |
| $17,500 to $19,999 | 4 (1.7%) | 13 (5.4%) |
| $20,000 to $22,499 | 2 (0.9%) | 8 (3.3%) |
| $22,500 to $24,999 | 3 (1.3%) | 4 (1.7%) |
| $25,000 to $29,999 | 2 (0.9%) | 16 (6.6%) |
| $30,000 to $34,999 | 4 (1.7%) | 30 (12.4%) |
| $35,000 to $39,999 | 4 (1.7%) | 17 (7.0%) |
| $40,000 to $44,999 | 15 (6.5%) | 5 (2.1%) |
| $45,000 to $49,999 | 7 (3.0%) | 7 (2.9%) |
| $50,000 to $54,999 | 11 (4.8%) | 27 (11.2%) |
| $55,000 to $64,999 | 49 (21.3%) | 29 (12.0%) |
| $65,000 to $74,999 | 20 (8.7%) | 16 (6.6%) |
| $75,000 to $99,999 | 25 (10.9%) | 13 (5.4%) |
| $100,000+ | 26 (11.3%) | 2 (0.8%) |
| Total | 230 (100.0%) | 241 (100.0%) |
Earnings by Sex by Educational Attainment in Highland
Average earnings in Highland are $58,000 for men and $37,115 for women, a difference of 36.0%. Men with an educational attainment of college or associate's degree enjoy the highest average annual earnings of $62,778, while those with bachelor's degree education earn the least with $55,417. Women with an educational attainment of graduate degree earn the most with the average annual earnings of $66,042, while those with high school diploma education have the smallest earnings of $33,611.
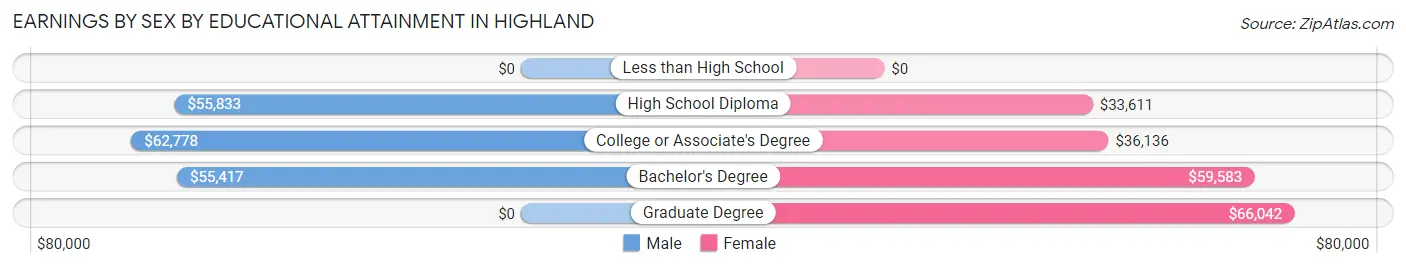
| Educational Attainment | Male Income | Female Income |
| Less than High School | - | - |
| High School Diploma | $55,833 | $33,611 |
| College or Associate's Degree | $62,778 | $36,136 |
| Bachelor's Degree | $55,417 | $59,583 |
| Graduate Degree | - | - |
| Total | $58,000 | $37,115 |
Family Income in Highland
Family Income Brackets in Highland
According to the Highland family income data, there are 62 families falling into the $75,000 to $99,999 income range, which is the most common income bracket and makes up 25.2% of all families. Conversely, the $10,000 to $14,999 income bracket is the least frequent group with only 7 families (2.9%) belonging to this category.
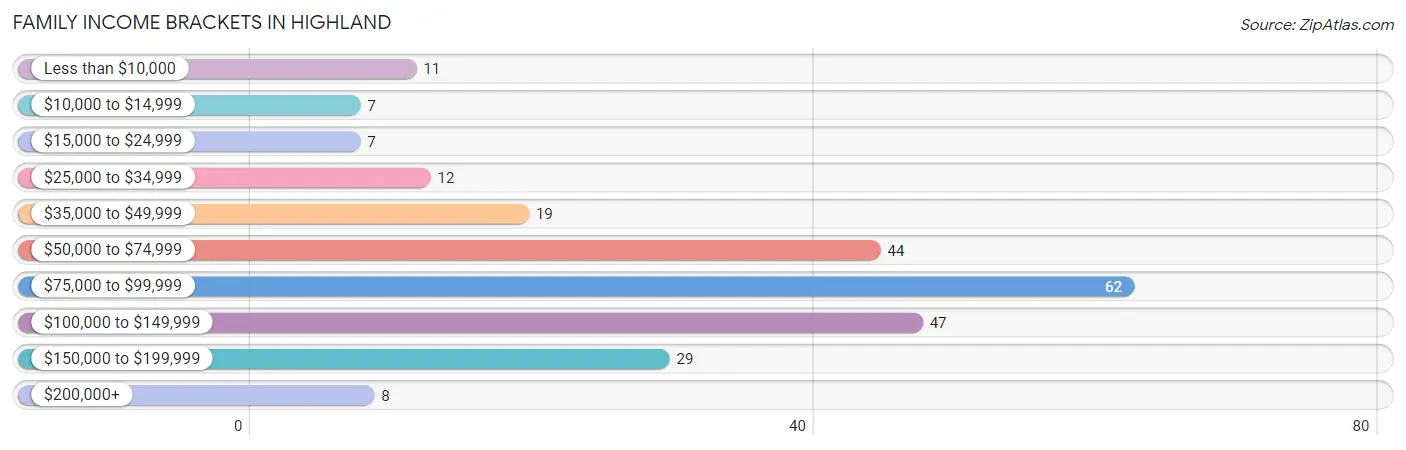
| Income Bracket | # Families | % Families |
| Less than $10,000 | 11 | 4.5% |
| $10,000 to $14,999 | 7 | 2.8% |
| $15,000 to $24,999 | 7 | 2.8% |
| $25,000 to $34,999 | 12 | 4.9% |
| $35,000 to $49,999 | 19 | 7.7% |
| $50,000 to $74,999 | 44 | 17.9% |
| $75,000 to $99,999 | 62 | 25.2% |
| $100,000 to $149,999 | 47 | 19.1% |
| $150,000 to $199,999 | 29 | 11.8% |
| $200,000+ | 8 | 3.3% |
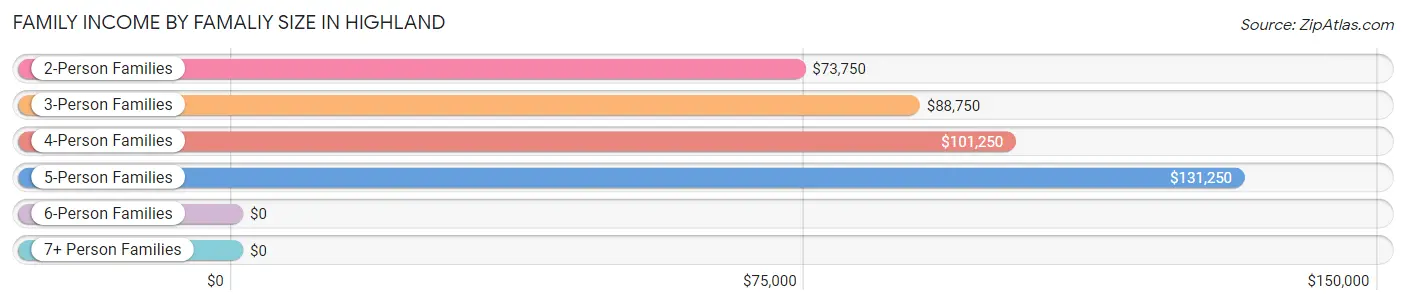
Family Income by Famaliy Size in Highland
5-person families (21 | 8.5%) account for the highest median family income in Highland with $131,250 per family, while 2-person families (138 | 56.1%) have the highest median income of $36,875 per family member.
| Income Bracket | # Families | Median Income |
| 2-Person Families | 138 (56.1%) | $73,750 |
| 3-Person Families | 49 (19.9%) | $88,750 |
| 4-Person Families | 30 (12.2%) | $101,250 |
| 5-Person Families | 21 (8.5%) | $131,250 |
| 6-Person Families | 6 (2.4%) | $0 |
| 7+ Person Families | 2 (0.8%) | $0 |
| Total | 246 (100.0%) | $85,682 |
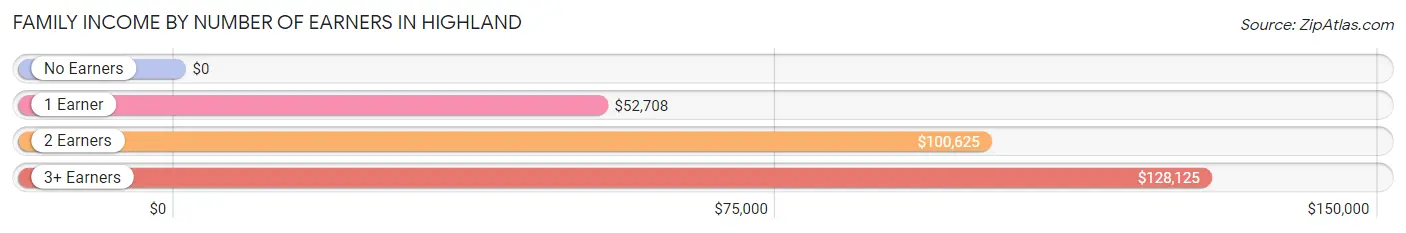
Family Income by Number of Earners in Highland
| Number of Earners | # Families | Median Income |
| No Earners | 23 (9.3%) | $0 |
| 1 Earner | 67 (27.2%) | $52,708 |
| 2 Earners | 140 (56.9%) | $100,625 |
| 3+ Earners | 16 (6.5%) | $128,125 |
| Total | 246 (100.0%) | $85,682 |
Household Income in Highland
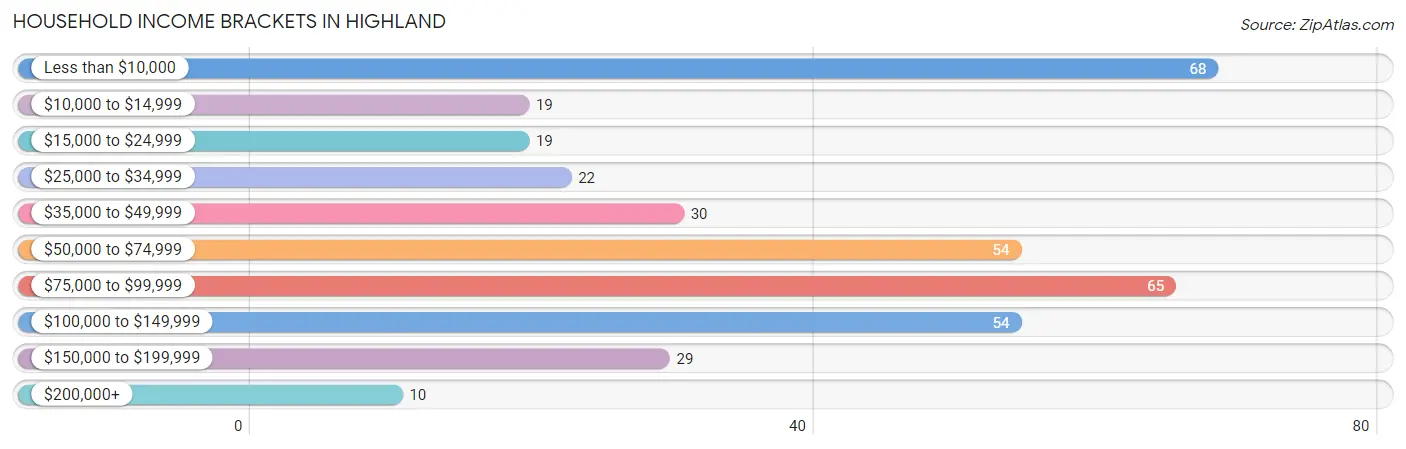
Household Income Brackets in Highland
With 68 households falling in the category, the less than $10,000 income range is the most frequent in Highland, accounting for 18.4% of all households. In contrast, only 10 households (2.7%) fall into the $200,000+ income bracket, making it the least populous group.
| Income Bracket | # Households | % Households |
| Less than $10,000 | 68 | 18.4% |
| $10,000 to $14,999 | 19 | 5.1% |
| $15,000 to $24,999 | 19 | 5.1% |
| $25,000 to $34,999 | 22 | 5.9% |
| $35,000 to $49,999 | 30 | 8.1% |
| $50,000 to $74,999 | 54 | 14.6% |
| $75,000 to $99,999 | 65 | 17.6% |
| $100,000 to $149,999 | 54 | 14.6% |
| $150,000 to $199,999 | 29 | 7.8% |
| $200,000+ | 10 | 2.7% |
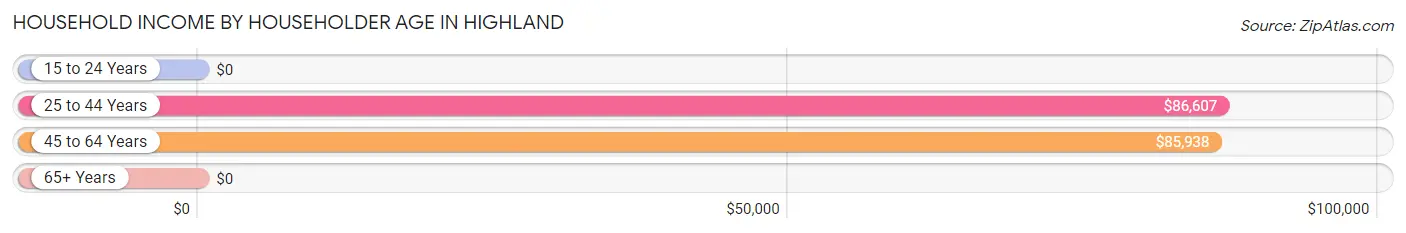
Household Income by Householder Age in Highland
The median household income in Highland is $62,083, with the highest median household income of $86,607 found in the 25 to 44 years age bracket for the primary householder. A total of 99 households (26.8%) fall into this category. Meanwhile, the 15 to 24 years age bracket for the primary householder has the lowest median household income of $0, with 6 households (1.6%) in this group.
| Income Bracket | # Households | Median Income |
| 15 to 24 Years | 6 (1.6%) | $0 |
| 25 to 44 Years | 99 (26.8%) | $86,607 |
| 45 to 64 Years | 131 (35.4%) | $85,938 |
| 65+ Years | 134 (36.2%) | $0 |
| Total | 370 (100.0%) | $62,083 |
Poverty in Highland
Income Below Poverty by Sex and Age in Highland
With 17.8% poverty level for males and 14.3% for females among the residents of Highland, 75 year old and over males and 18 to 24 year old females are the most vulnerable to poverty, with 46 males (63.9%) and 13 females (36.1%) in their respective age groups living below the poverty level.
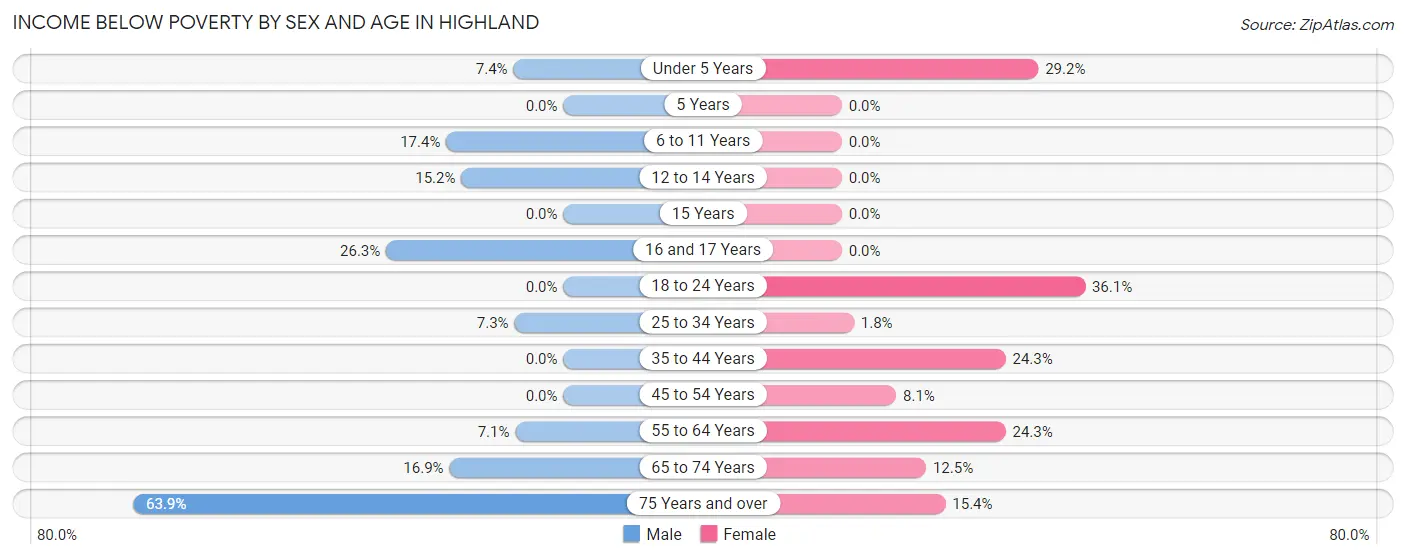
| Age Bracket | Male | Female |
| Under 5 Years | 2 (7.4%) | 7 (29.2%) |
| 5 Years | 0 (0.0%) | 0 (0.0%) |
| 6 to 11 Years | 4 (17.4%) | 0 (0.0%) |
| 12 to 14 Years | 5 (15.1%) | 0 (0.0%) |
| 15 Years | 0 (0.0%) | 0 (0.0%) |
| 16 and 17 Years | 5 (26.3%) | 0 (0.0%) |
| 18 to 24 Years | 0 (0.0%) | 13 (36.1%) |
| 25 to 34 Years | 4 (7.3%) | 1 (1.8%) |
| 35 to 44 Years | 0 (0.0%) | 9 (24.3%) |
| 45 to 54 Years | 0 (0.0%) | 5 (8.1%) |
| 55 to 64 Years | 4 (7.1%) | 18 (24.3%) |
| 65 to 74 Years | 11 (16.9%) | 5 (12.5%) |
| 75 Years and over | 46 (63.9%) | 2 (15.4%) |
| Total | 81 (17.8%) | 60 (14.3%) |
Income Above Poverty by Sex and Age in Highland
According to the poverty statistics in Highland, males aged 5 years and females aged 6 to 11 years are the age groups that are most secure financially, with 100.0% of males and 100.0% of females in these age groups living above the poverty line.
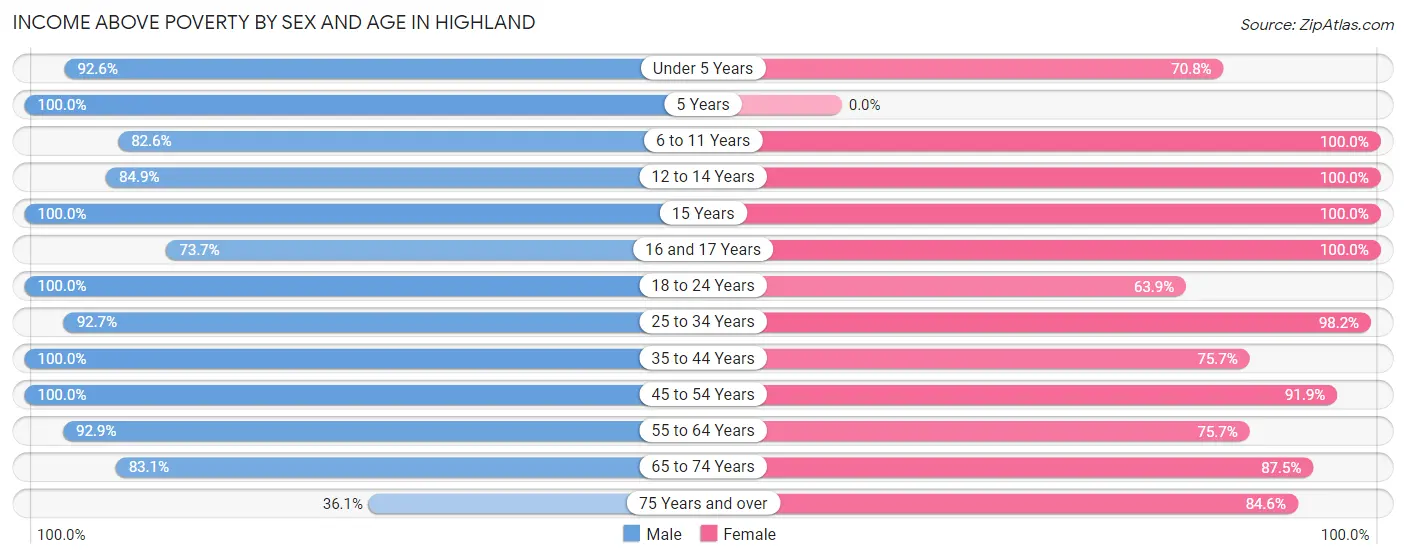
| Age Bracket | Male | Female |
| Under 5 Years | 25 (92.6%) | 17 (70.8%) |
| 5 Years | 2 (100.0%) | 0 (0.0%) |
| 6 to 11 Years | 19 (82.6%) | 56 (100.0%) |
| 12 to 14 Years | 28 (84.9%) | 14 (100.0%) |
| 15 Years | 4 (100.0%) | 2 (100.0%) |
| 16 and 17 Years | 14 (73.7%) | 5 (100.0%) |
| 18 to 24 Years | 25 (100.0%) | 23 (63.9%) |
| 25 to 34 Years | 51 (92.7%) | 55 (98.2%) |
| 35 to 44 Years | 41 (100.0%) | 28 (75.7%) |
| 45 to 54 Years | 34 (100.0%) | 57 (91.9%) |
| 55 to 64 Years | 52 (92.9%) | 56 (75.7%) |
| 65 to 74 Years | 54 (83.1%) | 35 (87.5%) |
| 75 Years and over | 26 (36.1%) | 11 (84.6%) |
| Total | 375 (82.2%) | 359 (85.7%) |
Income Below Poverty Among Married-Couple Families in Highland
The poverty statistics for married-couple families in Highland show that 3.3% or 6 of the total 184 families live below the poverty line. Families with no children have the highest poverty rate of 5.3%, comprising of 6 families. On the other hand, families with 1 or 2 children have the lowest poverty rate of 0.0%, which includes 0 families.
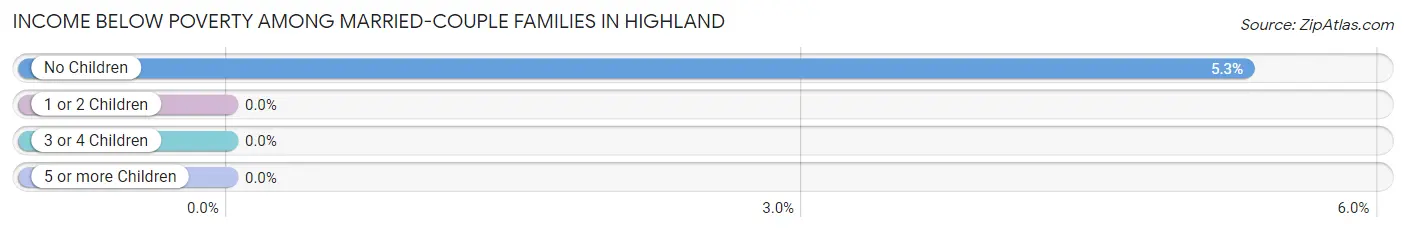
| Children | Above Poverty | Below Poverty |
| No Children | 107 (94.7%) | 6 (5.3%) |
| 1 or 2 Children | 45 (100.0%) | 0 (0.0%) |
| 3 or 4 Children | 24 (100.0%) | 0 (0.0%) |
| 5 or more Children | 2 (100.0%) | 0 (0.0%) |
| Total | 178 (96.7%) | 6 (3.3%) |
Income Below Poverty Among Single-Parent Households in Highland
According to the poverty data in Highland, 19.2% or 5 single-father households and 36.1% or 13 single-mother households are living below the poverty line. Among single-father households, those with 1 or 2 children have the highest poverty rate, with 5 households (38.5%) experiencing poverty. Likewise, among single-mother households, those with 3 or 4 children have the highest poverty rate, with 1 households (100.0%) falling below the poverty line.
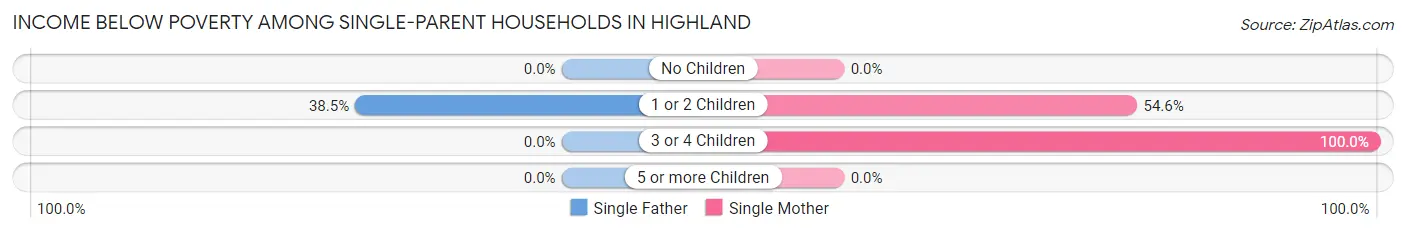
| Children | Single Father | Single Mother |
| No Children | 0 (0.0%) | 0 (0.0%) |
| 1 or 2 Children | 5 (38.5%) | 12 (54.5%) |
| 3 or 4 Children | 0 (0.0%) | 1 (100.0%) |
| 5 or more Children | 0 (0.0%) | 0 (0.0%) |
| Total | 5 (19.2%) | 13 (36.1%) |
Income Below Poverty Among Married-Couple vs Single-Parent Households in Highland
The poverty data for Highland shows that 6 of the married-couple family households (3.3%) and 18 of the single-parent households (29.0%) are living below the poverty level. Within the married-couple family households, those with no children have the highest poverty rate, with 6 households (5.3%) falling below the poverty line. Among the single-parent households, those with 3 or 4 children have the highest poverty rate, with 1 household (100.0%) living below poverty.
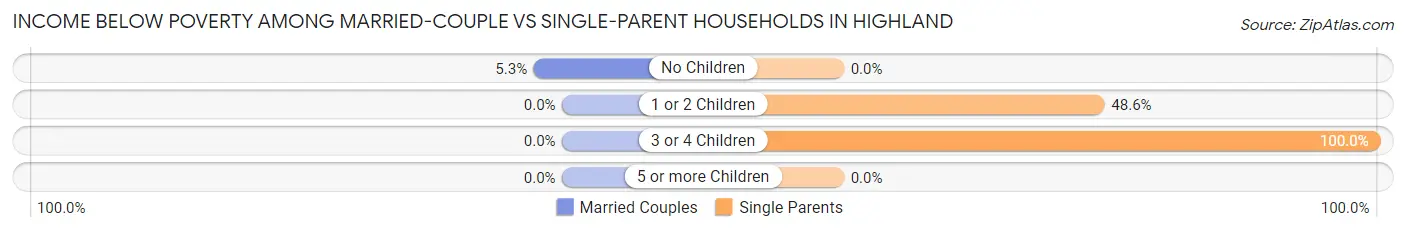
| Children | Married-Couple Families | Single-Parent Households |
| No Children | 6 (5.3%) | 0 (0.0%) |
| 1 or 2 Children | 0 (0.0%) | 17 (48.6%) |
| 3 or 4 Children | 0 (0.0%) | 1 (100.0%) |
| 5 or more Children | 0 (0.0%) | 0 (0.0%) |
| Total | 6 (3.3%) | 18 (29.0%) |
Race in Highland
The most populous races in Highland are White / Caucasian (856 | 97.8%), Black / African American (14 | 1.6%), and Asian (3 | 0.3%).
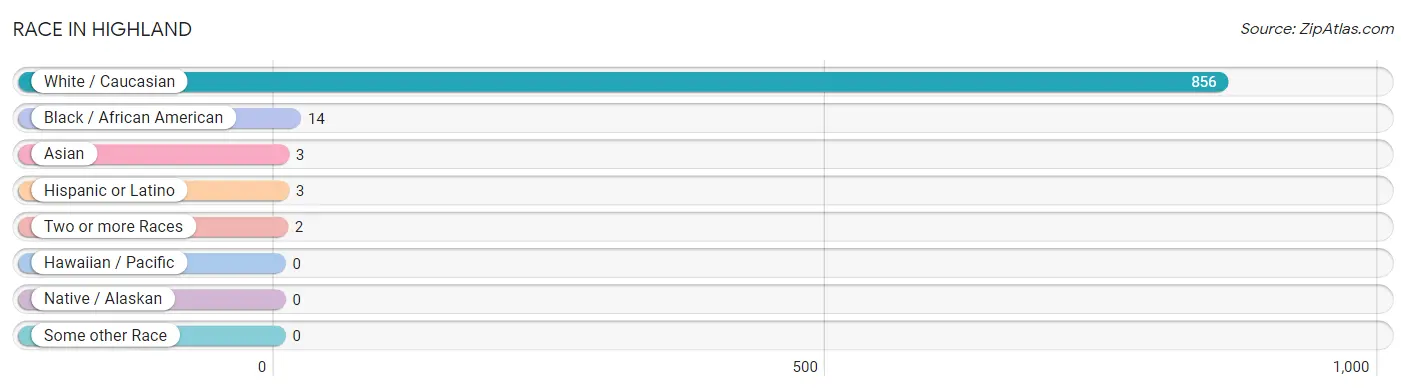
| Race | # Population | % Population |
| Asian | 3 | 0.3% |
| Black / African American | 14 | 1.6% |
| Hawaiian / Pacific | 0 | 0.0% |
| Hispanic or Latino | 3 | 0.3% |
| Native / Alaskan | 0 | 0.0% |
| White / Caucasian | 856 | 97.8% |
| Two or more Races | 2 | 0.2% |
| Some other Race | 0 | 0.0% |
| Total | 875 | 100.0% |
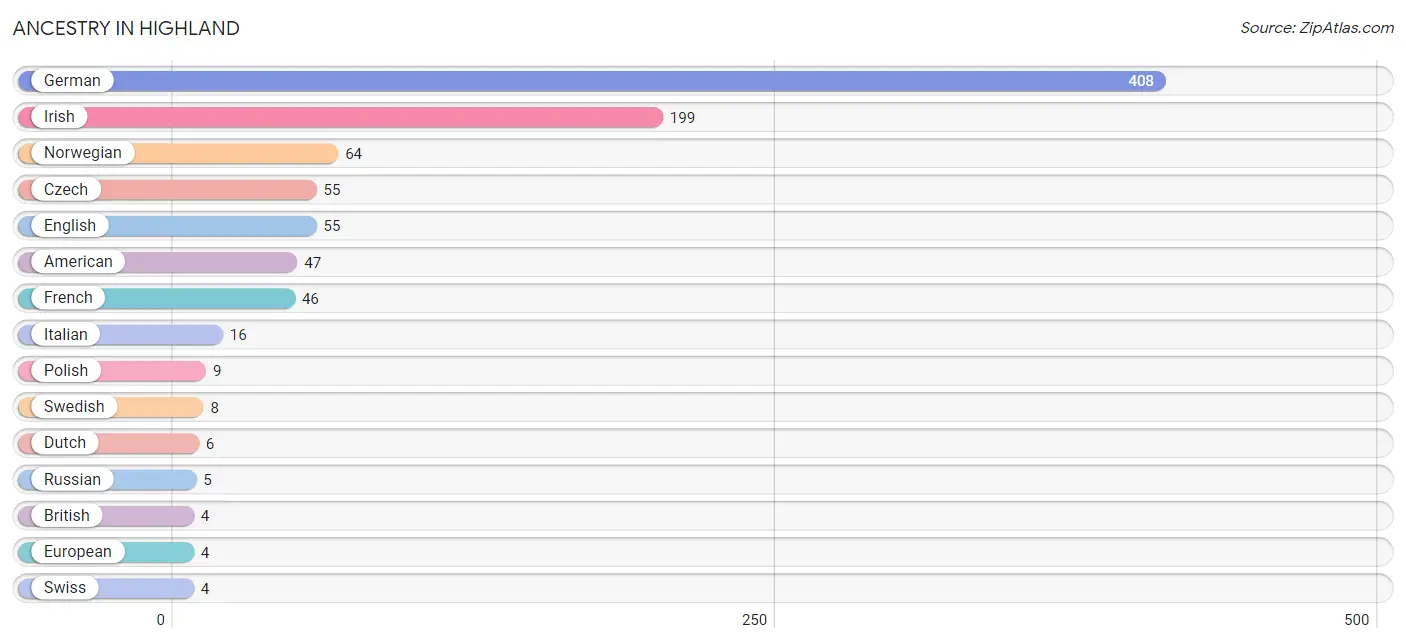
Ancestry in Highland
The most populous ancestries reported in Highland are German (408 | 46.6%), Irish (199 | 22.7%), Norwegian (64 | 7.3%), Czech (55 | 6.3%), and English (55 | 6.3%), together accounting for 89.3% of all Highland residents.
| Ancestry | # Population | % Population |
| American | 47 | 5.4% |
| Bangladeshi | 3 | 0.3% |
| Belgian | 2 | 0.2% |
| British | 4 | 0.5% |
| Czech | 55 | 6.3% |
| Danish | 2 | 0.2% |
| Dutch | 6 | 0.7% |
| English | 55 | 6.3% |
| European | 4 | 0.5% |
| Finnish | 1 | 0.1% |
| French | 46 | 5.3% |
| French Canadian | 3 | 0.3% |
| German | 408 | 46.6% |
| Hungarian | 2 | 0.2% |
| Irish | 199 | 22.7% |
| Italian | 16 | 1.8% |
| Lithuanian | 2 | 0.2% |
| Mexican | 3 | 0.3% |
| Norwegian | 64 | 7.3% |
| Polish | 9 | 1.0% |
| Russian | 5 | 0.6% |
| Scandinavian | 3 | 0.3% |
| Scotch-Irish | 1 | 0.1% |
| Scottish | 2 | 0.2% |
| Swedish | 8 | 0.9% |
| Swiss | 4 | 0.5% |
| Welsh | 2 | 0.2% | View All 27 Rows |
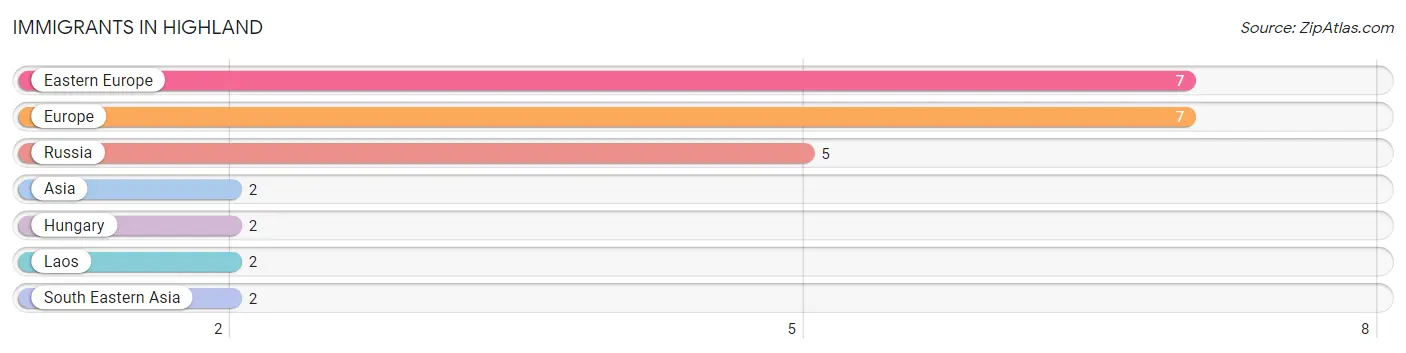
Immigrants in Highland
The most numerous immigrant groups reported in Highland came from Eastern Europe (7 | 0.8%), Europe (7 | 0.8%), Russia (5 | 0.6%), Asia (2 | 0.2%), and Hungary (2 | 0.2%), together accounting for 2.6% of all Highland residents.
| Immigration Origin | # Population | % Population |
| Asia | 2 | 0.2% |
| Eastern Europe | 7 | 0.8% |
| Europe | 7 | 0.8% |
| Hungary | 2 | 0.2% |
| Laos | 2 | 0.2% |
| Russia | 5 | 0.6% |
| South Eastern Asia | 2 | 0.2% | View All 7 Rows |
Sex and Age in Highland
Sex and Age in Highland
The most populous age groups in Highland are 85 Years and over (54 | 11.8%) for men and 55 to 59 Years (48 | 11.5%) for women.
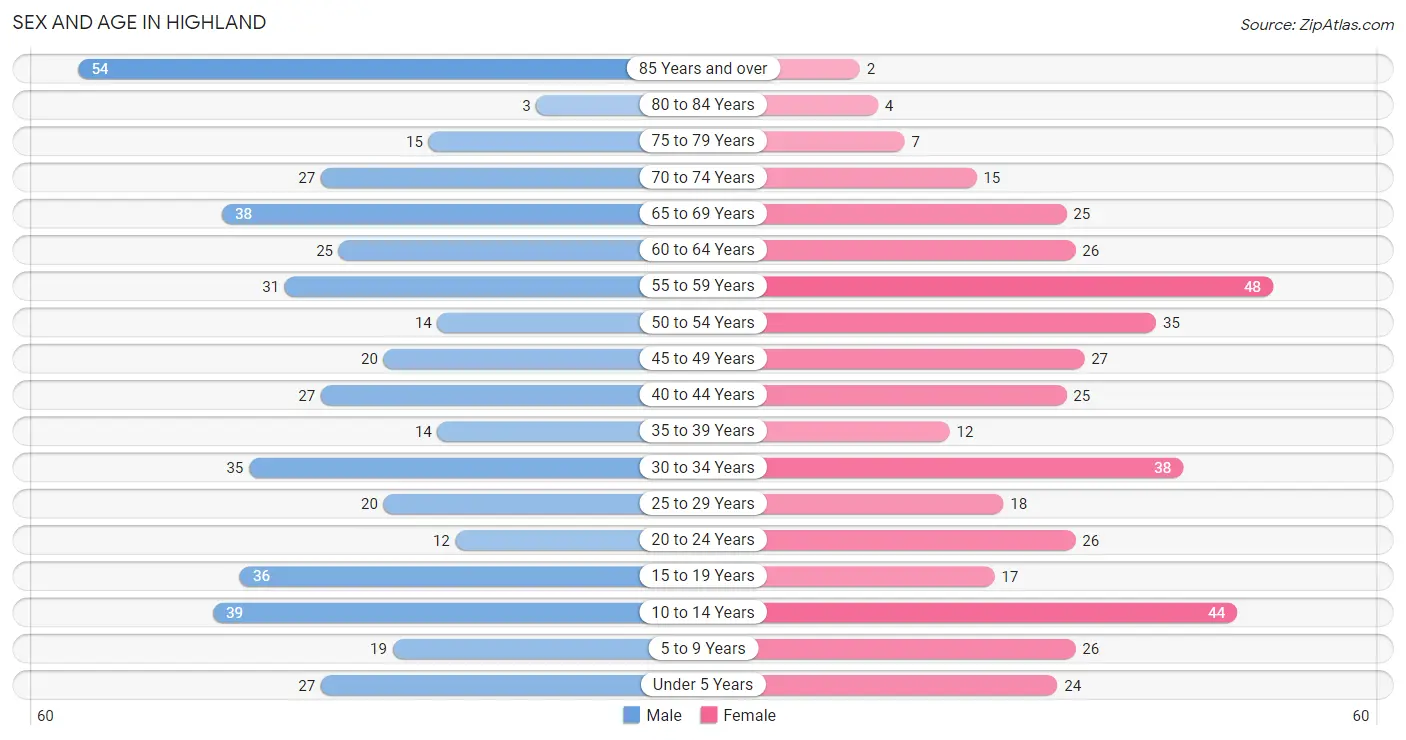
| Age Bracket | Male | Female |
| Under 5 Years | 27 (5.9%) | 24 (5.7%) |
| 5 to 9 Years | 19 (4.2%) | 26 (6.2%) |
| 10 to 14 Years | 39 (8.6%) | 44 (10.5%) |
| 15 to 19 Years | 36 (7.9%) | 17 (4.1%) |
| 20 to 24 Years | 12 (2.6%) | 26 (6.2%) |
| 25 to 29 Years | 20 (4.4%) | 18 (4.3%) |
| 30 to 34 Years | 35 (7.7%) | 38 (9.1%) |
| 35 to 39 Years | 14 (3.1%) | 12 (2.9%) |
| 40 to 44 Years | 27 (5.9%) | 25 (6.0%) |
| 45 to 49 Years | 20 (4.4%) | 27 (6.4%) |
| 50 to 54 Years | 14 (3.1%) | 35 (8.4%) |
| 55 to 59 Years | 31 (6.8%) | 48 (11.5%) |
| 60 to 64 Years | 25 (5.5%) | 26 (6.2%) |
| 65 to 69 Years | 38 (8.3%) | 25 (6.0%) |
| 70 to 74 Years | 27 (5.9%) | 15 (3.6%) |
| 75 to 79 Years | 15 (3.3%) | 7 (1.7%) |
| 80 to 84 Years | 3 (0.7%) | 4 (0.9%) |
| 85 Years and over | 54 (11.8%) | 2 (0.5%) |
| Total | 456 (100.0%) | 419 (100.0%) |
Families and Households in Highland
Median Family Size in Highland
The median family size in Highland is 2.93 persons per family, with married-couple families (184 | 74.8%) accounting for the largest median family size of 3.02 persons per family. On the other hand, single female/mother families (36 | 14.6%) represent the smallest median family size with 2.61 persons per family.
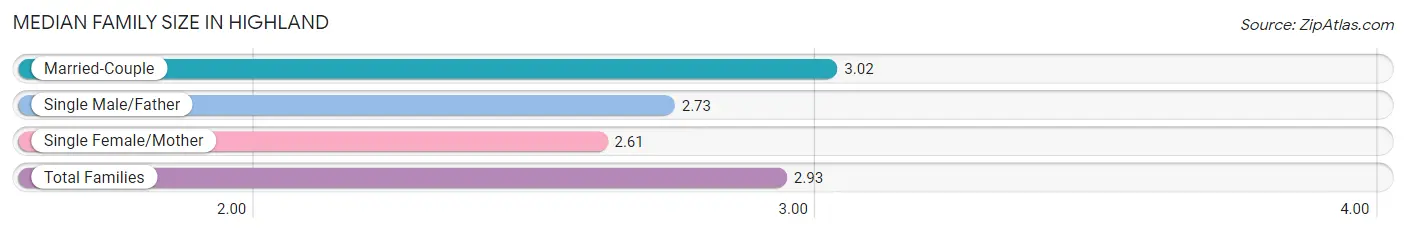
| Family Type | # Families | Family Size |
| Married-Couple | 184 (74.8%) | 3.02 |
| Single Male/Father | 26 (10.6%) | 2.73 |
| Single Female/Mother | 36 (14.6%) | 2.61 |
| Total Families | 246 (100.0%) | 2.93 |
Median Household Size in Highland
The median household size in Highland is 2.34 persons per household, with married-couple households (184 | 49.7%) accounting for the largest median household size of 3.03 persons per household. non-family households (124 | 33.5%) represent the smallest median household size with 1.02 persons per household.
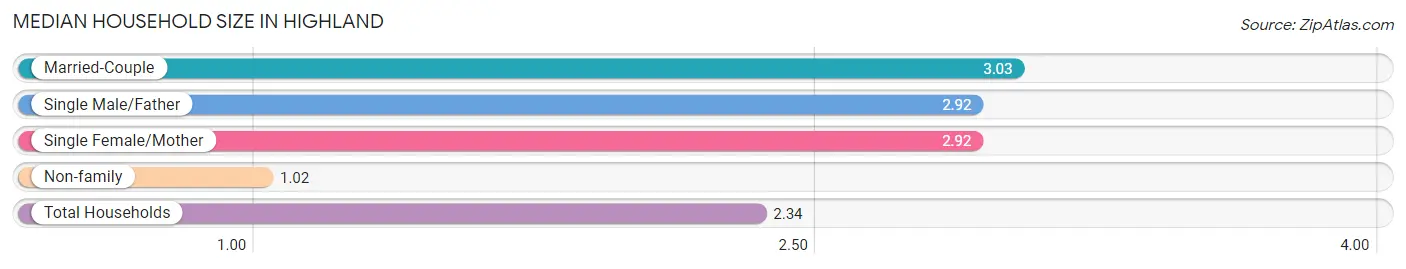
| Household Type | # Households | Household Size |
| Married-Couple | 184 (49.7%) | 3.03 |
| Single Male/Father | 26 (7.0%) | 2.92 |
| Single Female/Mother | 36 (9.7%) | 2.92 |
| Non-family | 124 (33.5%) | 1.02 |
| Total Households | 370 (100.0%) | 2.34 |
Household Size by Marriage Status in Highland
Out of a total of 370 households in Highland, 246 (66.5%) are family households, while 124 (33.5%) are nonfamily households. The most numerous type of family households are 2-person households, comprising 122, and the most common type of nonfamily households are 1-person households, comprising 122.
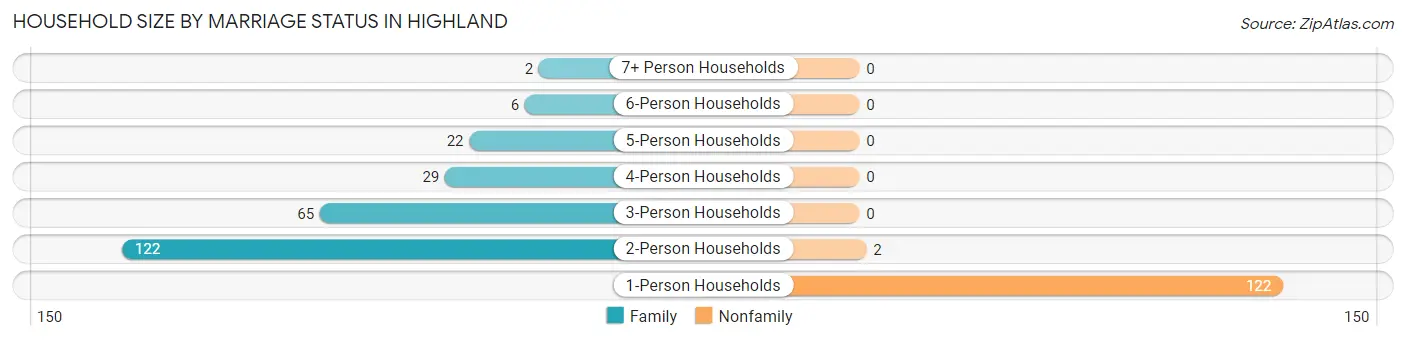
| Household Size | Family Households | Nonfamily Households |
| 1-Person Households | - | 122 (33.0%) |
| 2-Person Households | 122 (33.0%) | 2 (0.5%) |
| 3-Person Households | 65 (17.6%) | 0 (0.0%) |
| 4-Person Households | 29 (7.8%) | 0 (0.0%) |
| 5-Person Households | 22 (5.9%) | 0 (0.0%) |
| 6-Person Households | 6 (1.6%) | 0 (0.0%) |
| 7+ Person Households | 2 (0.5%) | 0 (0.0%) |
| Total | 246 (66.5%) | 124 (33.5%) |
Female Fertility in Highland
Fertility by Age in Highland
Average fertility rate in Highland is 76.0 births per 1,000 women. Women in the age bracket of 20 to 34 years have the highest fertility rate with 159.0 births per 1,000 women. Women in the age bracket of 20 to 34 years acount for 100.0% of all women with births.
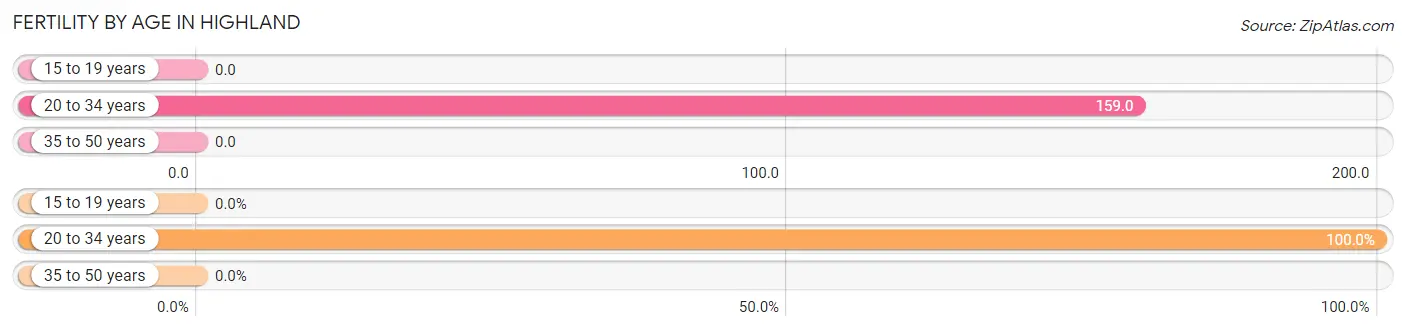
| Age Bracket | Women with Births | Births / 1,000 Women |
| 15 to 19 years | 0 (0.0%) | 0.0 |
| 20 to 34 years | 13 (100.0%) | 159.0 |
| 35 to 50 years | 0 (0.0%) | 0.0 |
| Total | 13 (100.0%) | 76.0 |
Fertility by Age by Marriage Status in Highland
69.2% of women with births (13) in Highland are married. The highest percentage of unmarried women with births falls into 20 to 34 years age bracket with 30.8% of them unmarried at the time of birth, while the lowest percentage of unmarried women with births belong to 20 to 34 years age bracket with 30.8% of them unmarried.
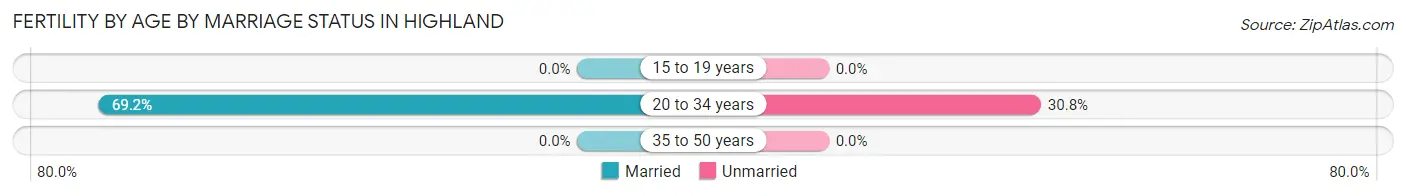
| Age Bracket | Married | Unmarried |
| 15 to 19 years | 0 (0.0%) | 0 (0.0%) |
| 20 to 34 years | 9 (69.2%) | 4 (30.8%) |
| 35 to 50 years | 0 (0.0%) | 0 (0.0%) |
| Total | 9 (69.2%) | 4 (30.8%) |
Fertility by Education in Highland
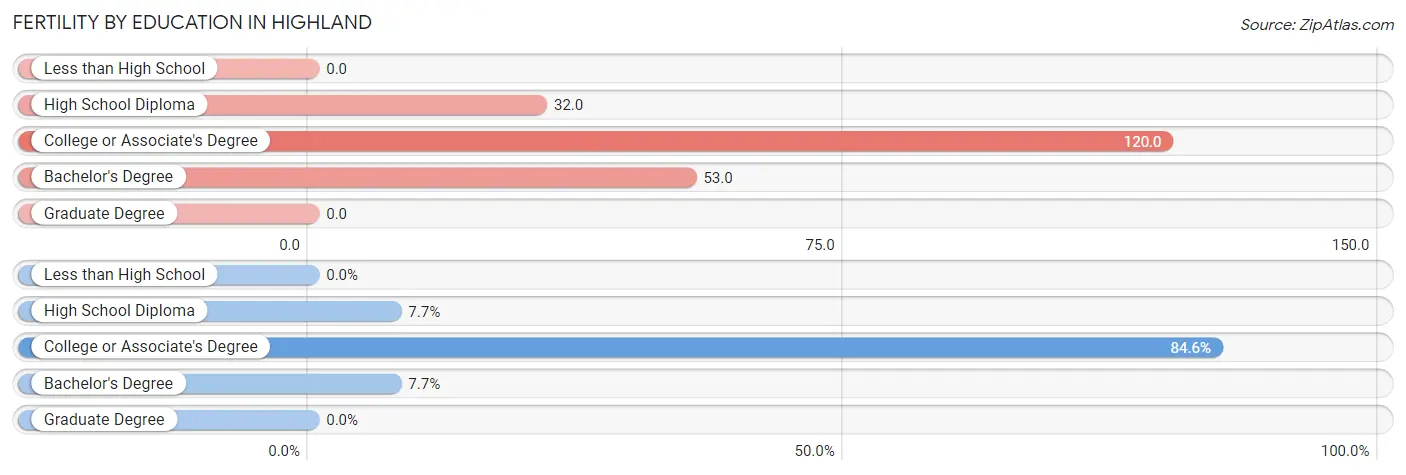
| Educational Attainment | Women with Births | Births / 1,000 Women |
| Less than High School | 0 (0.0%) | 0.0 |
| High School Diploma | 1 (7.7%) | 32.0 |
| College or Associate's Degree | 11 (84.6%) | 120.0 |
| Bachelor's Degree | 1 (7.7%) | 53.0 |
| Graduate Degree | 0 (0.0%) | 0.0 |
| Total | 13 (100.0%) | 76.0 |
Fertility by Education by Marriage Status in Highland
30.8% of women with births in Highland are unmarried. Women with the educational attainment of bachelor's degree are most likely to be married with 100.0% of them married at childbirth, while women with the educational attainment of high school diploma are least likely to be married with 100.0% of them unmarried at childbirth.
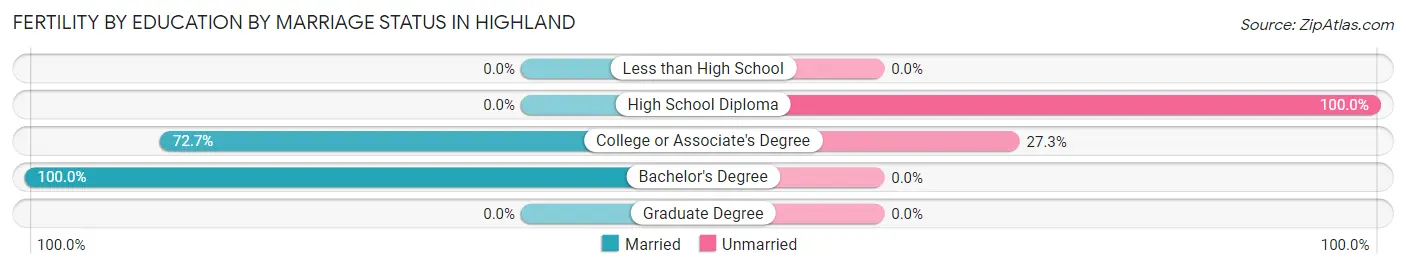
| Educational Attainment | Married | Unmarried |
| Less than High School | 0 (0.0%) | 0 (0.0%) |
| High School Diploma | 0 (0.0%) | 1 (100.0%) |
| College or Associate's Degree | 8 (72.7%) | 3 (27.3%) |
| Bachelor's Degree | 1 (100.0%) | 0 (0.0%) |
| Graduate Degree | 0 (0.0%) | 0 (0.0%) |
| Total | 9 (69.2%) | 4 (30.8%) |
Employment Characteristics in Highland
Employment by Class of Employer in Highland
Among the 433 employed individuals in Highland, private company employees (305 | 70.4%), local government employees (43 | 9.9%), and self-employed (not incorporated) (33 | 7.6%) make up the most common classes of employment.
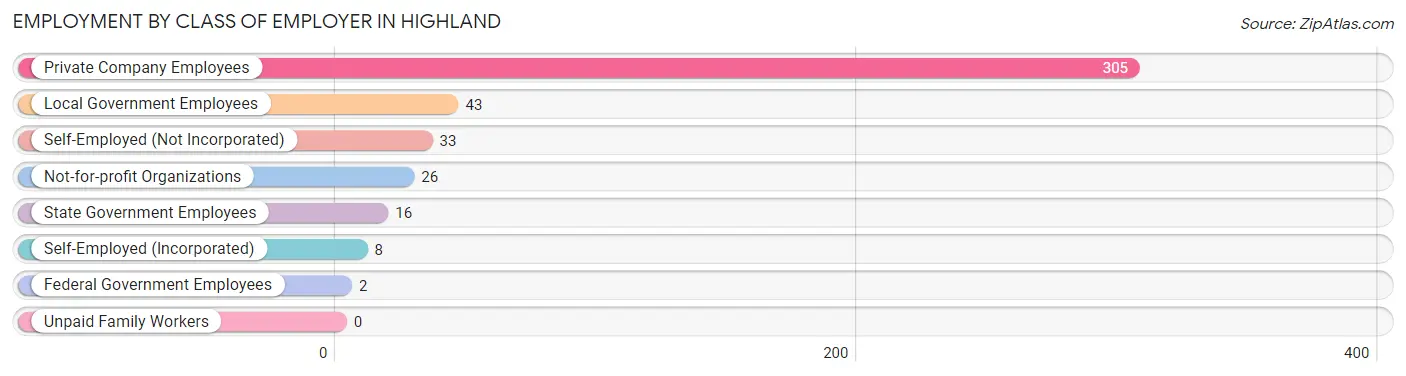
| Employer Class | # Employees | % Employees |
| Private Company Employees | 305 | 70.4% |
| Self-Employed (Incorporated) | 8 | 1.8% |
| Self-Employed (Not Incorporated) | 33 | 7.6% |
| Not-for-profit Organizations | 26 | 6.0% |
| Local Government Employees | 43 | 9.9% |
| State Government Employees | 16 | 3.7% |
| Federal Government Employees | 2 | 0.5% |
| Unpaid Family Workers | 0 | 0.0% |
| Total | 433 | 100.0% |
Employment Status by Age in Highland
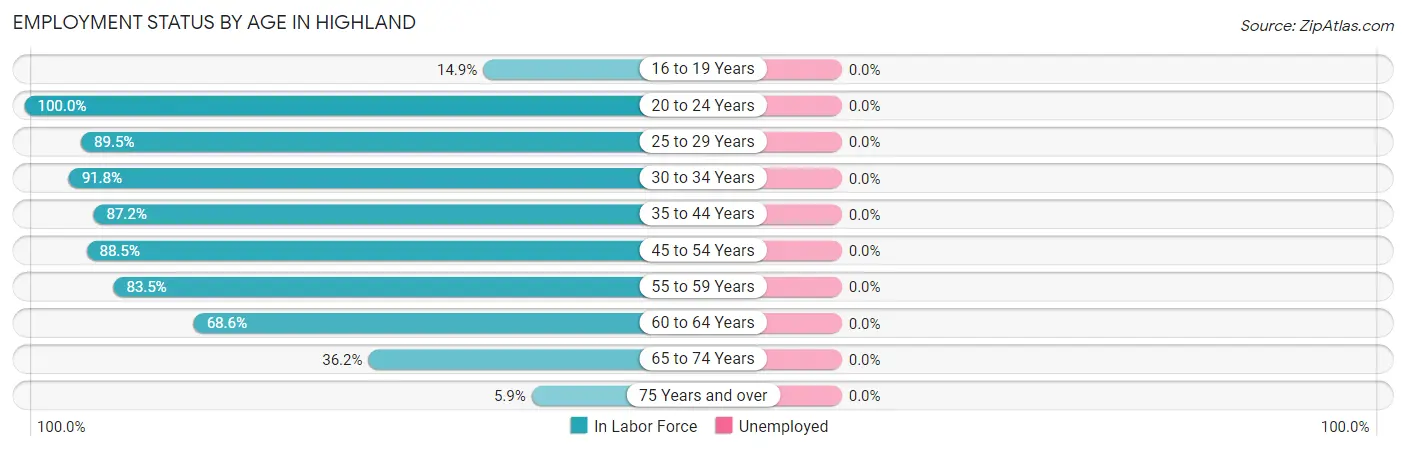
| Age Bracket | In Labor Force | Unemployed |
| 16 to 19 Years | 7 (14.9%) | 0 (0.0%) |
| 20 to 24 Years | 38 (100.0%) | 0 (0.0%) |
| 25 to 29 Years | 34 (89.5%) | 0 (0.0%) |
| 30 to 34 Years | 67 (91.8%) | 0 (0.0%) |
| 35 to 44 Years | 68 (87.2%) | 0 (0.0%) |
| 45 to 54 Years | 85 (88.5%) | 0 (0.0%) |
| 55 to 59 Years | 66 (83.5%) | 0 (0.0%) |
| 60 to 64 Years | 35 (68.6%) | 0 (0.0%) |
| 65 to 74 Years | 38 (36.2%) | 0 (0.0%) |
| 75 Years and over | 5 (5.9%) | 0 (0.0%) |
| Total | 443 (64.2%) | 0 (0.0%) |
Employment Status by Educational Attainment in Highland
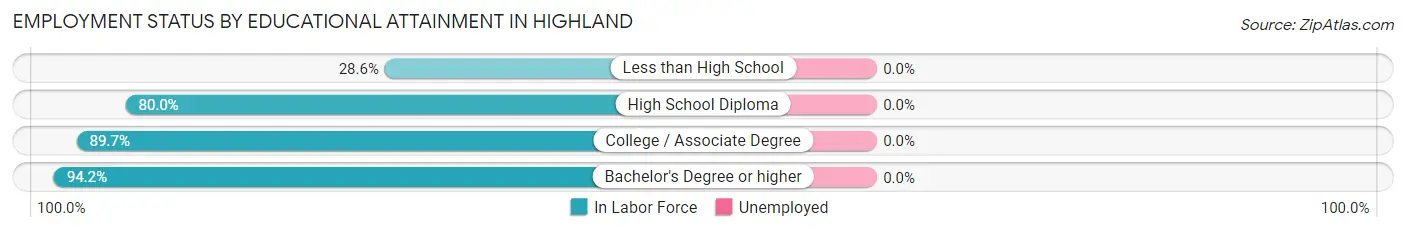
| Educational Attainment | In Labor Force | Unemployed |
| Less than High School | 2 (28.6%) | 0 (0.0%) |
| High School Diploma | 132 (80.0%) | 0 (0.0%) |
| College / Associate Degree | 156 (89.7%) | 0 (0.0%) |
| Bachelor's Degree or higher | 65 (94.2%) | 0 (0.0%) |
| Total | 355 (85.5%) | 0 (0.0%) |
Employment Occupations by Sex in Highland
Management, Business, Science and Arts Occupations
The most common Management, Business, Science and Arts occupations in Highland are Management (57 | 12.9%), Health Diagnosing & Treating (30 | 6.8%), Community & Social Service (29 | 6.6%), Business & Financial (22 | 5.0%), and Education Instruction & Library (19 | 4.3%).
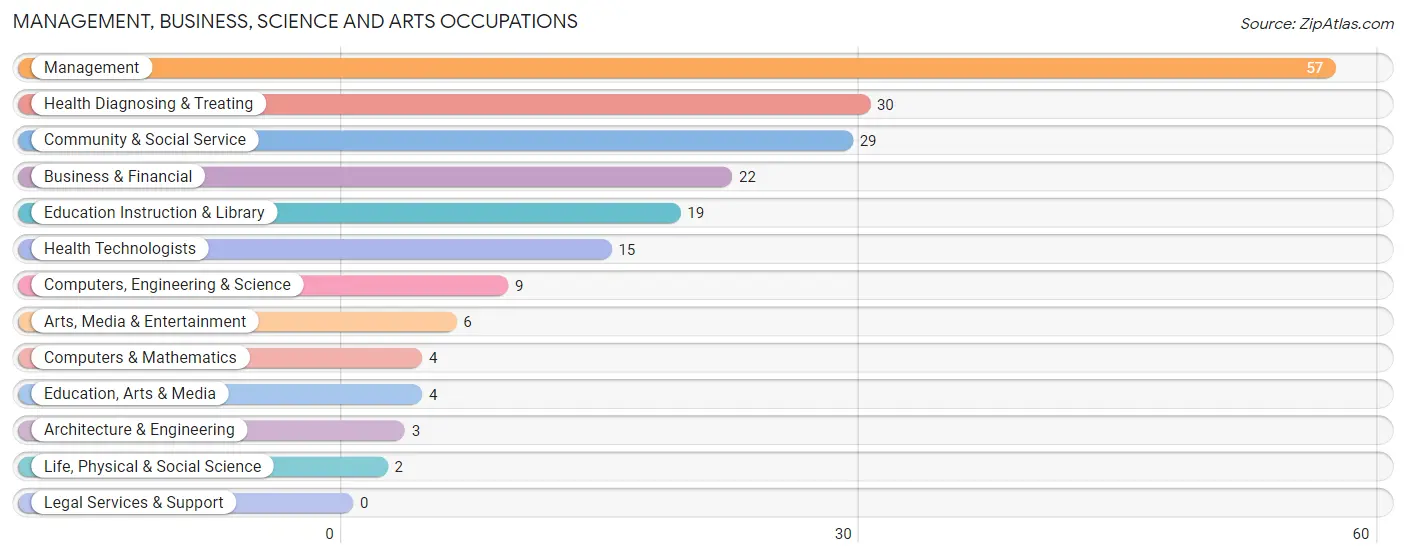
Management, Business, Science and Arts Occupations by Sex
Within the Management, Business, Science and Arts occupations in Highland, the most male-oriented occupations are Computers, Engineering & Science (100.0%), Computers & Mathematics (100.0%), and Architecture & Engineering (100.0%), while the most female-oriented occupations are Education Instruction & Library (100.0%), Health Technologists (100.0%), and Health Diagnosing & Treating (83.3%).
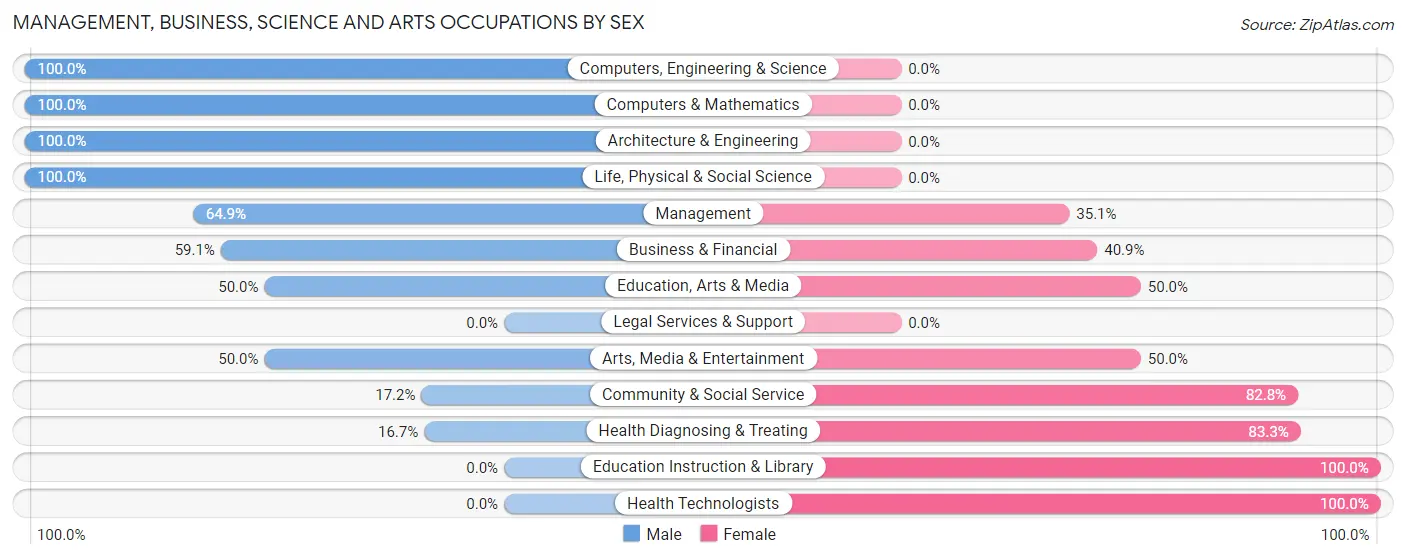
| Occupation | Male | Female |
| Management | 37 (64.9%) | 20 (35.1%) |
| Business & Financial | 13 (59.1%) | 9 (40.9%) |
| Computers, Engineering & Science | 9 (100.0%) | 0 (0.0%) |
| Computers & Mathematics | 4 (100.0%) | 0 (0.0%) |
| Architecture & Engineering | 3 (100.0%) | 0 (0.0%) |
| Life, Physical & Social Science | 2 (100.0%) | 0 (0.0%) |
| Community & Social Service | 5 (17.2%) | 24 (82.8%) |
| Education, Arts & Media | 2 (50.0%) | 2 (50.0%) |
| Legal Services & Support | 0 (0.0%) | 0 (0.0%) |
| Education Instruction & Library | 0 (0.0%) | 19 (100.0%) |
| Arts, Media & Entertainment | 3 (50.0%) | 3 (50.0%) |
| Health Diagnosing & Treating | 5 (16.7%) | 25 (83.3%) |
| Health Technologists | 0 (0.0%) | 15 (100.0%) |
| Total (Category) | 69 (46.9%) | 78 (53.1%) |
| Total (Overall) | 212 (47.9%) | 231 (52.1%) |
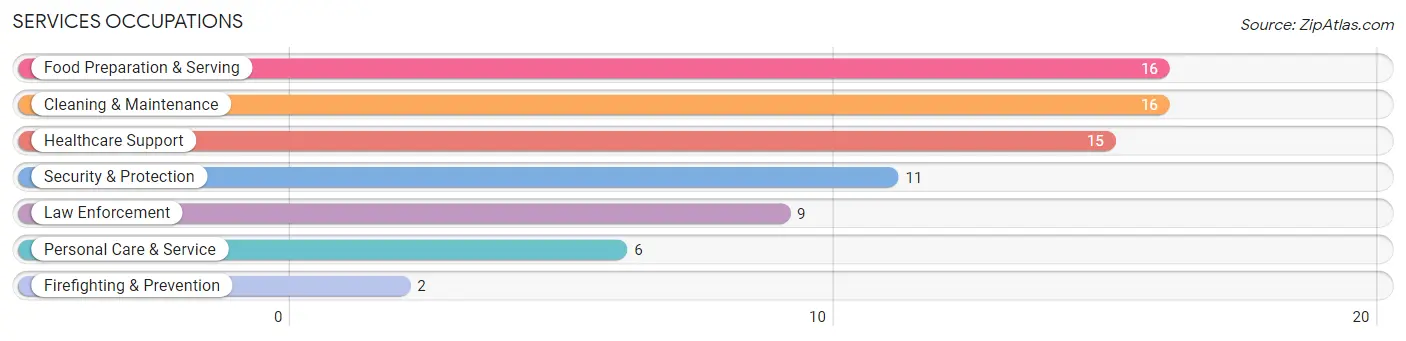
Services Occupations
The most common Services occupations in Highland are Food Preparation & Serving (16 | 3.6%), Cleaning & Maintenance (16 | 3.6%), Healthcare Support (15 | 3.4%), Security & Protection (11 | 2.5%), and Law Enforcement (9 | 2.0%).
Services Occupations by Sex
Within the Services occupations in Highland, the most male-oriented occupations are Security & Protection (100.0%), Firefighting & Prevention (100.0%), and Law Enforcement (100.0%), while the most female-oriented occupations are Food Preparation & Serving (100.0%), Personal Care & Service (100.0%), and Healthcare Support (86.7%).
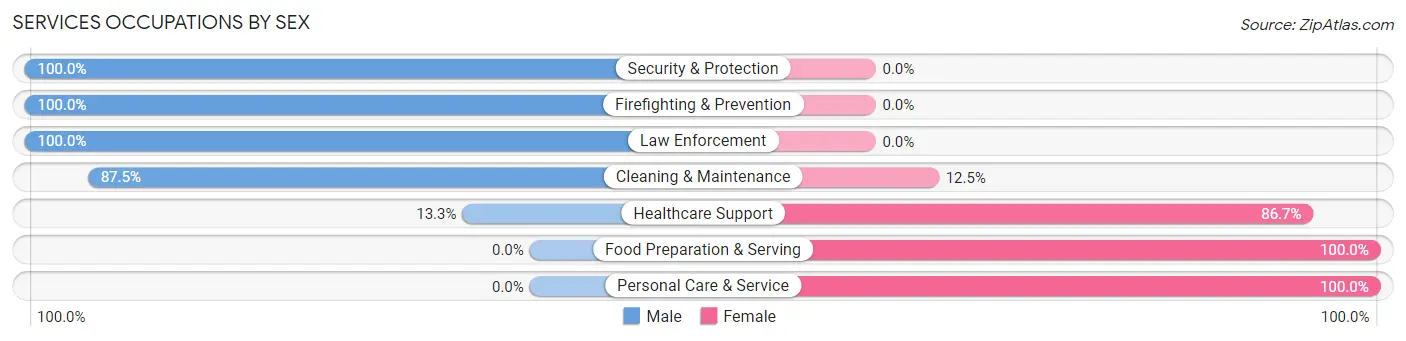
| Occupation | Male | Female |
| Healthcare Support | 2 (13.3%) | 13 (86.7%) |
| Security & Protection | 11 (100.0%) | 0 (0.0%) |
| Firefighting & Prevention | 2 (100.0%) | 0 (0.0%) |
| Law Enforcement | 9 (100.0%) | 0 (0.0%) |
| Food Preparation & Serving | 0 (0.0%) | 16 (100.0%) |
| Cleaning & Maintenance | 14 (87.5%) | 2 (12.5%) |
| Personal Care & Service | 0 (0.0%) | 6 (100.0%) |
| Total (Category) | 27 (42.2%) | 37 (57.8%) |
| Total (Overall) | 212 (47.9%) | 231 (52.1%) |
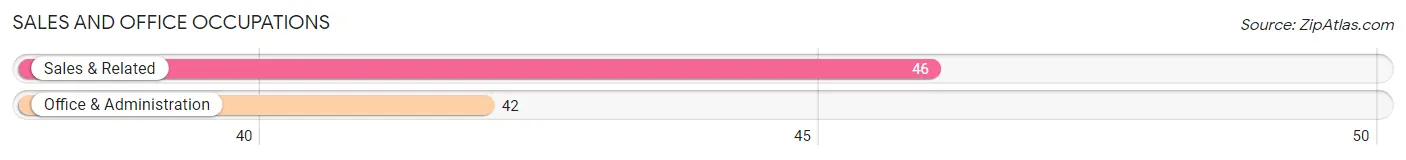
Sales and Office Occupations
The most common Sales and Office occupations in Highland are Sales & Related (46 | 10.4%), and Office & Administration (42 | 9.5%).
Sales and Office Occupations by Sex
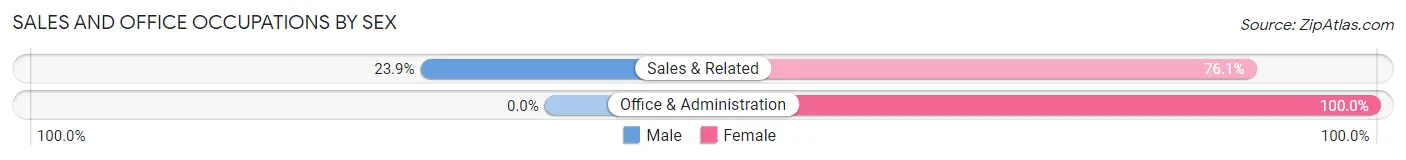
| Occupation | Male | Female |
| Sales & Related | 11 (23.9%) | 35 (76.1%) |
| Office & Administration | 0 (0.0%) | 42 (100.0%) |
| Total (Category) | 11 (12.5%) | 77 (87.5%) |
| Total (Overall) | 212 (47.9%) | 231 (52.1%) |
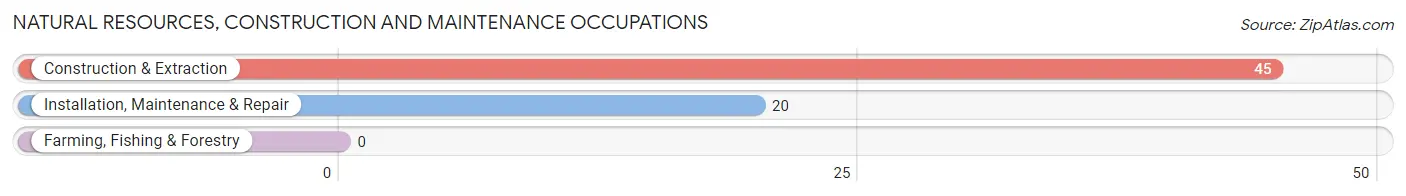
Natural Resources, Construction and Maintenance Occupations
The most common Natural Resources, Construction and Maintenance occupations in Highland are Construction & Extraction (45 | 10.2%), and Installation, Maintenance & Repair (20 | 4.5%).
Natural Resources, Construction and Maintenance Occupations by Sex
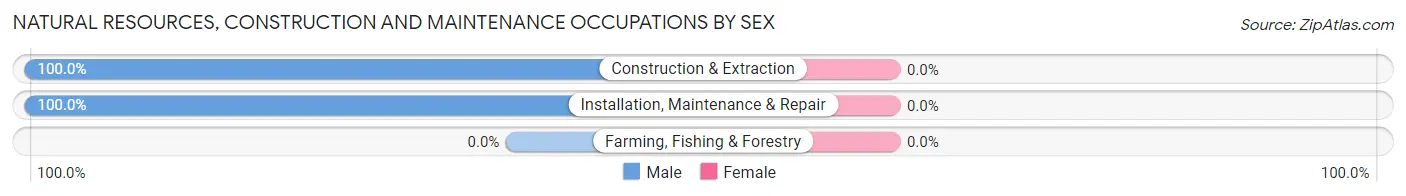
| Occupation | Male | Female |
| Farming, Fishing & Forestry | 0 (0.0%) | 0 (0.0%) |
| Construction & Extraction | 45 (100.0%) | 0 (0.0%) |
| Installation, Maintenance & Repair | 20 (100.0%) | 0 (0.0%) |
| Total (Category) | 65 (100.0%) | 0 (0.0%) |
| Total (Overall) | 212 (47.9%) | 231 (52.1%) |
Production, Transportation and Moving Occupations
The most common Production, Transportation and Moving occupations in Highland are Production (44 | 9.9%), Material Moving (19 | 4.3%), and Transportation (16 | 3.6%).
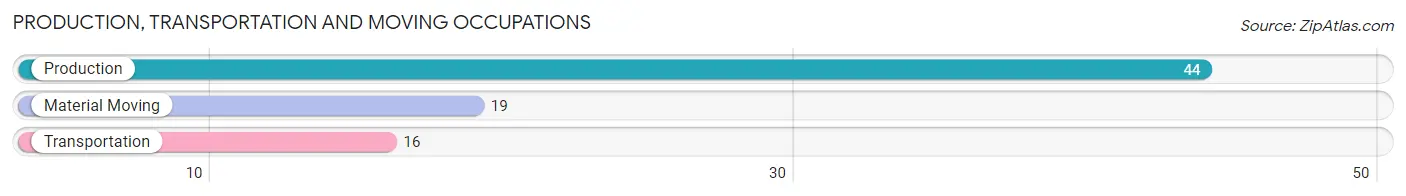
Production, Transportation and Moving Occupations by Sex
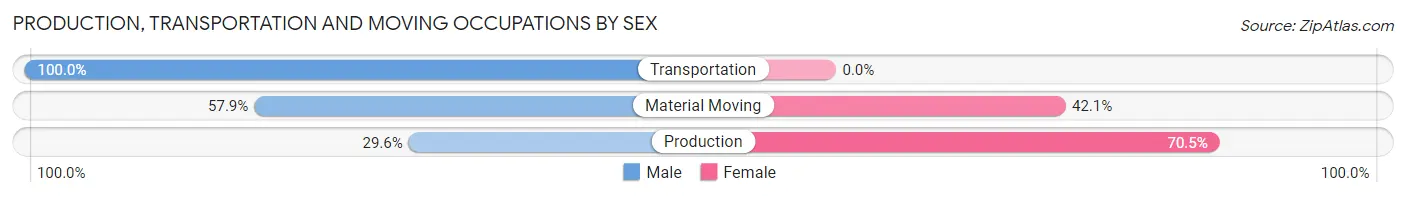
| Occupation | Male | Female |
| Production | 13 (29.5%) | 31 (70.5%) |
| Transportation | 16 (100.0%) | 0 (0.0%) |
| Material Moving | 11 (57.9%) | 8 (42.1%) |
| Total (Category) | 40 (50.6%) | 39 (49.4%) |
| Total (Overall) | 212 (47.9%) | 231 (52.1%) |
Employment Industries by Sex in Highland
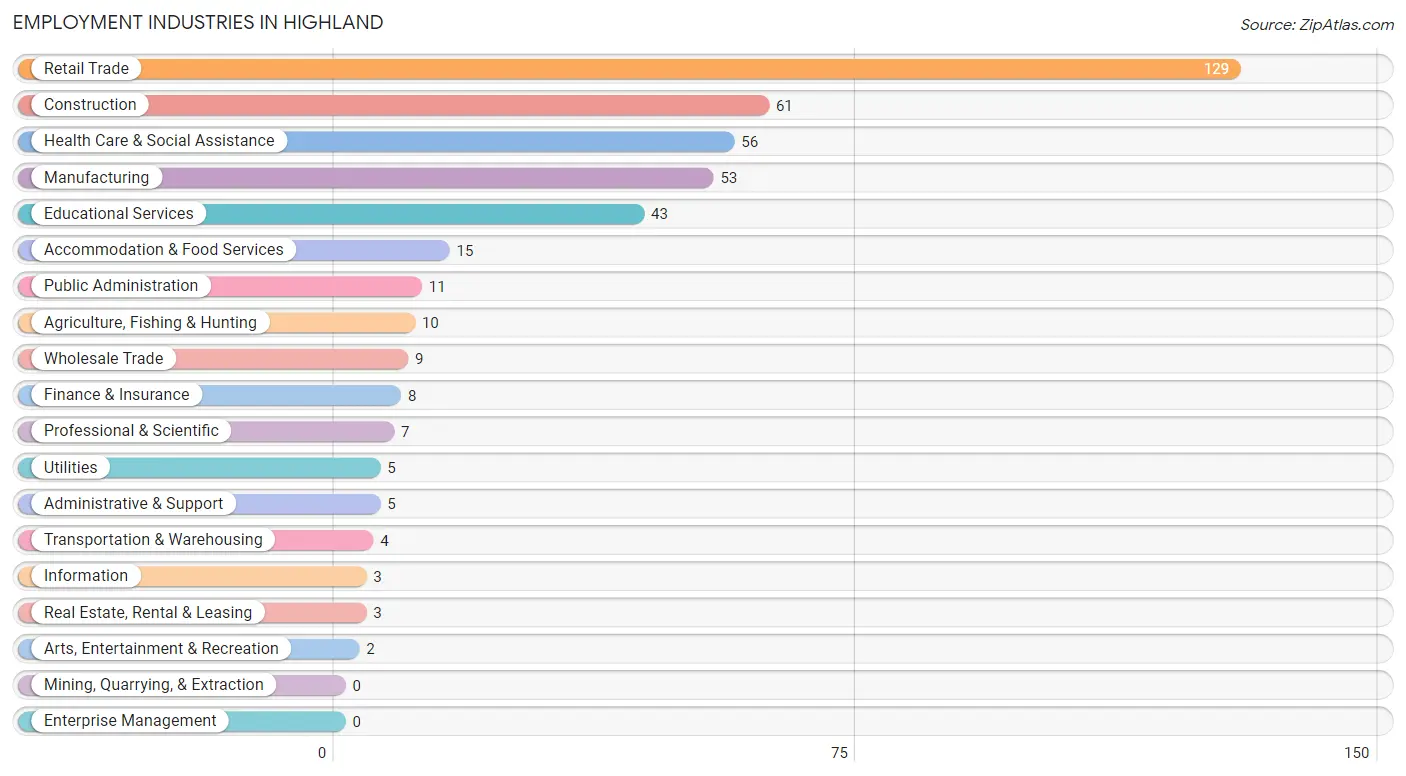
Employment Industries in Highland
The major employment industries in Highland include Retail Trade (129 | 29.1%), Construction (61 | 13.8%), Health Care & Social Assistance (56 | 12.6%), Manufacturing (53 | 12.0%), and Educational Services (43 | 9.7%).
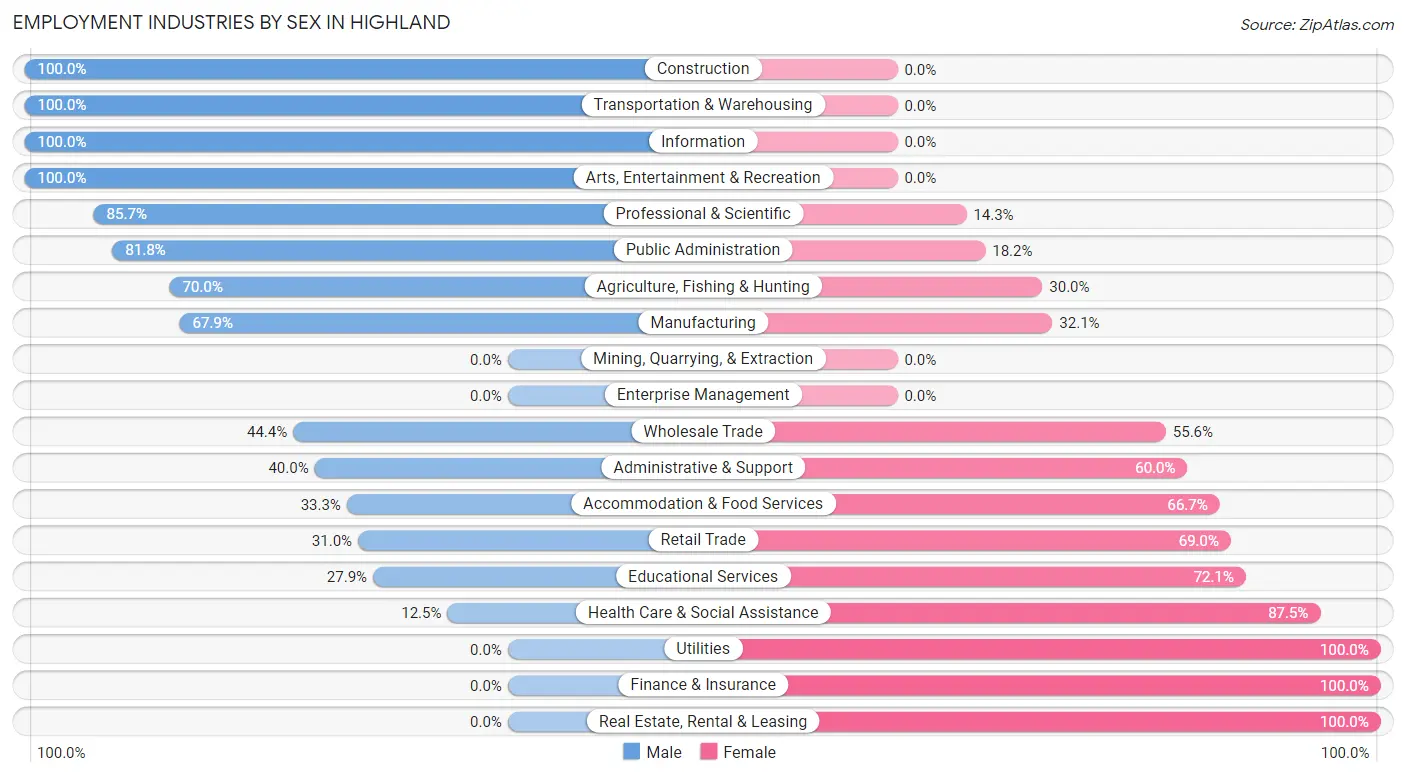
Employment Industries by Sex in Highland
The Highland industries that see more men than women are Construction (100.0%), Transportation & Warehousing (100.0%), and Information (100.0%), whereas the industries that tend to have a higher number of women are Utilities (100.0%), Finance & Insurance (100.0%), and Real Estate, Rental & Leasing (100.0%).
| Industry | Male | Female |
| Agriculture, Fishing & Hunting | 7 (70.0%) | 3 (30.0%) |
| Mining, Quarrying, & Extraction | 0 (0.0%) | 0 (0.0%) |
| Construction | 61 (100.0%) | 0 (0.0%) |
| Manufacturing | 36 (67.9%) | 17 (32.1%) |
| Wholesale Trade | 4 (44.4%) | 5 (55.6%) |
| Retail Trade | 40 (31.0%) | 89 (69.0%) |
| Transportation & Warehousing | 4 (100.0%) | 0 (0.0%) |
| Utilities | 0 (0.0%) | 5 (100.0%) |
| Information | 3 (100.0%) | 0 (0.0%) |
| Finance & Insurance | 0 (0.0%) | 8 (100.0%) |
| Real Estate, Rental & Leasing | 0 (0.0%) | 3 (100.0%) |
| Professional & Scientific | 6 (85.7%) | 1 (14.3%) |
| Enterprise Management | 0 (0.0%) | 0 (0.0%) |
| Administrative & Support | 2 (40.0%) | 3 (60.0%) |
| Educational Services | 12 (27.9%) | 31 (72.1%) |
| Health Care & Social Assistance | 7 (12.5%) | 49 (87.5%) |
| Arts, Entertainment & Recreation | 2 (100.0%) | 0 (0.0%) |
| Accommodation & Food Services | 5 (33.3%) | 10 (66.7%) |
| Public Administration | 9 (81.8%) | 2 (18.2%) |
| Total | 212 (47.9%) | 231 (52.1%) |
Education in Highland
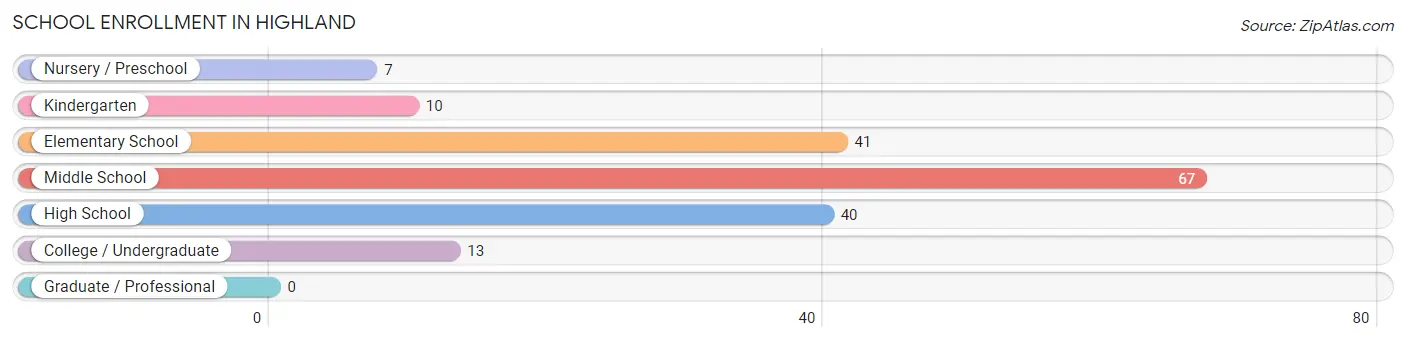
School Enrollment in Highland
The most common levels of schooling among the 178 students in Highland are middle school (67 | 37.6%), elementary school (41 | 23.0%), and high school (40 | 22.5%).
| School Level | # Students | % Students |
| Nursery / Preschool | 7 | 3.9% |
| Kindergarten | 10 | 5.6% |
| Elementary School | 41 | 23.0% |
| Middle School | 67 | 37.6% |
| High School | 40 | 22.5% |
| College / Undergraduate | 13 | 7.3% |
| Graduate / Professional | 0 | 0.0% |
| Total | 178 | 100.0% |
School Enrollment by Age by Funding Source in Highland
Out of a total of 178 students who are enrolled in schools in Highland, 7 (3.9%) attend a private institution, while the remaining 171 (96.1%) are enrolled in public schools. The age group of 3 to 4 year olds has the highest likelihood of being enrolled in private schools, with 2 (18.2% in the age bracket) enrolled. Conversely, the age group of 5 to 9 year old has the lowest likelihood of being enrolled in a private school, with 45 (100.0% in the age bracket) attending a public institution.
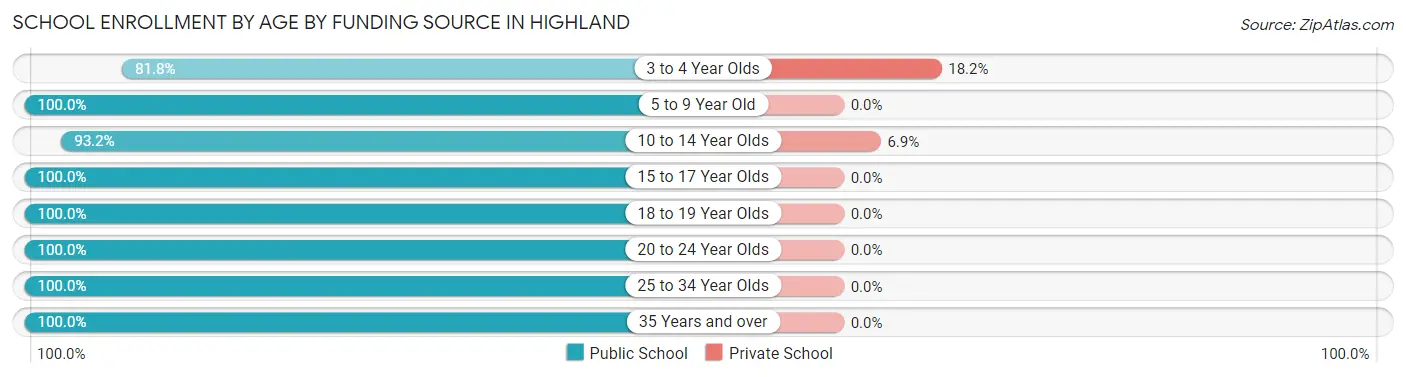
| Age Bracket | Public School | Private School |
| 3 to 4 Year Olds | 9 (81.8%) | 2 (18.2%) |
| 5 to 9 Year Old | 45 (100.0%) | 0 (0.0%) |
| 10 to 14 Year Olds | 68 (93.1%) | 5 (6.9%) |
| 15 to 17 Year Olds | 26 (100.0%) | 0 (0.0%) |
| 18 to 19 Year Olds | 13 (100.0%) | 0 (0.0%) |
| 20 to 24 Year Olds | 5 (100.0%) | 0 (0.0%) |
| 25 to 34 Year Olds | 2 (100.0%) | 0 (0.0%) |
| 35 Years and over | 3 (100.0%) | 0 (0.0%) |
| Total | 171 (96.1%) | 7 (3.9%) |
Educational Attainment by Field of Study in Highland
Education (31 | 30.1%), business (17 | 16.5%), arts & humanities (15 | 14.6%), science & technology (13 | 12.6%), and bio, nature & agricultural (10 | 9.7%) are the most common fields of study among 103 individuals in Highland who have obtained a bachelor's degree or higher.
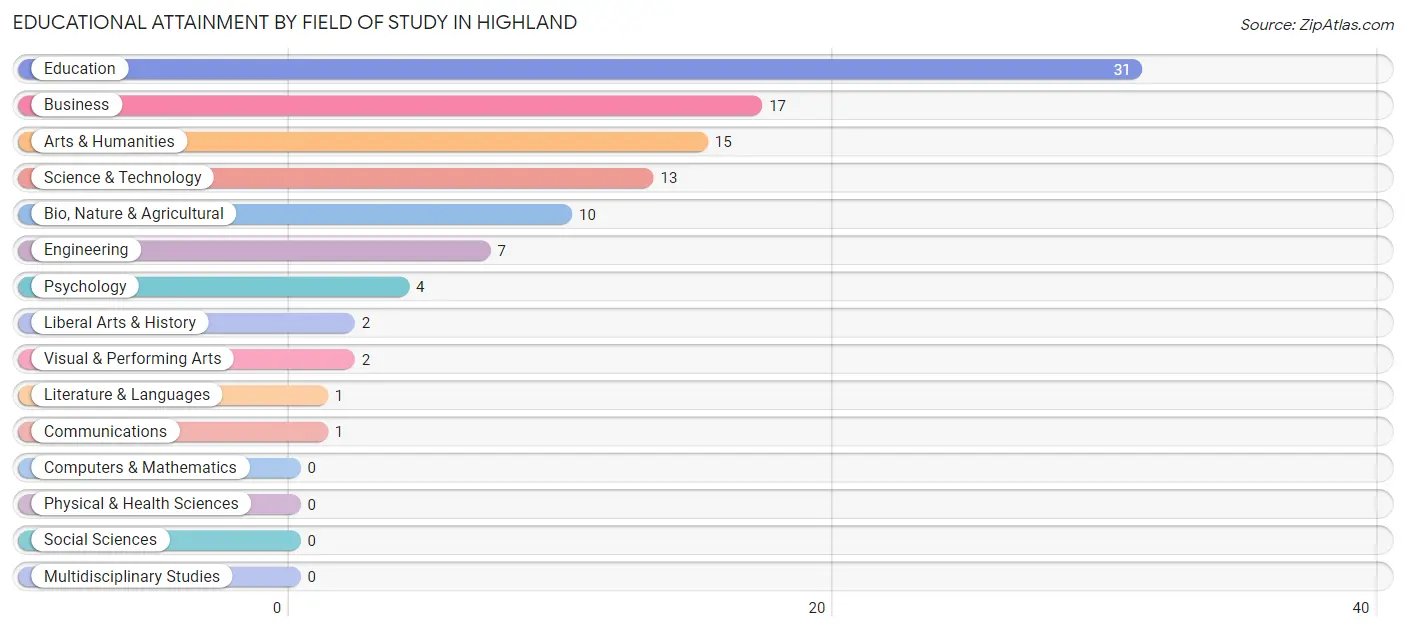
| Field of Study | # Graduates | % Graduates |
| Computers & Mathematics | 0 | 0.0% |
| Bio, Nature & Agricultural | 10 | 9.7% |
| Physical & Health Sciences | 0 | 0.0% |
| Psychology | 4 | 3.9% |
| Social Sciences | 0 | 0.0% |
| Engineering | 7 | 6.8% |
| Multidisciplinary Studies | 0 | 0.0% |
| Science & Technology | 13 | 12.6% |
| Business | 17 | 16.5% |
| Education | 31 | 30.1% |
| Literature & Languages | 1 | 1.0% |
| Liberal Arts & History | 2 | 1.9% |
| Visual & Performing Arts | 2 | 1.9% |
| Communications | 1 | 1.0% |
| Arts & Humanities | 15 | 14.6% |
| Total | 103 | 100.0% |
Transportation & Commute in Highland
Vehicle Availability by Sex in Highland
The most prevalent vehicle ownership categories in Highland are males with 2 vehicles (111, accounting for 53.4%) and females with 2 vehicles (95, making up 49.3%).
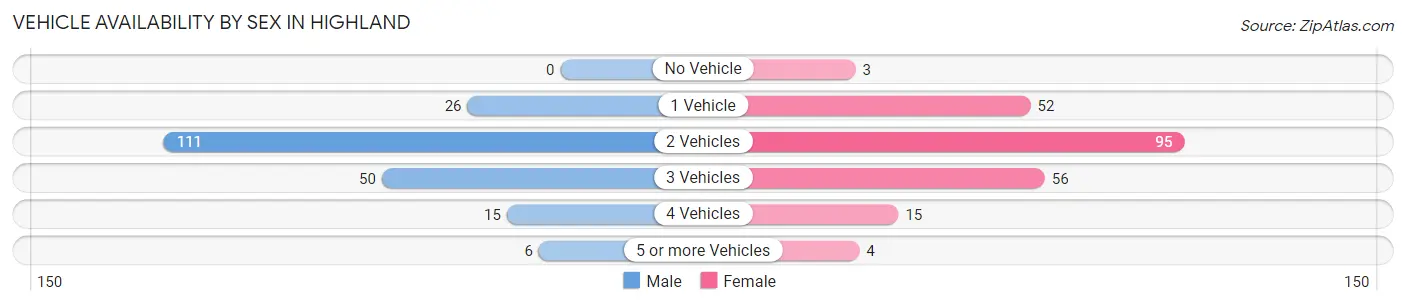
| Vehicles Available | Male | Female |
| No Vehicle | 0 (0.0%) | 3 (1.3%) |
| 1 Vehicle | 26 (12.5%) | 52 (23.1%) |
| 2 Vehicles | 111 (53.4%) | 95 (42.2%) |
| 3 Vehicles | 50 (24.0%) | 56 (24.9%) |
| 4 Vehicles | 15 (7.2%) | 15 (6.7%) |
| 5 or more Vehicles | 6 (2.9%) | 4 (1.8%) |
| Total | 208 (100.0%) | 225 (100.0%) |
Commute Time in Highland
The most frequently occuring commute durations in Highland are 30 to 34 minutes (56 commuters, 13.9%), 20 to 24 minutes (54 commuters, 13.4%), and 35 to 39 minutes (51 commuters, 12.6%).
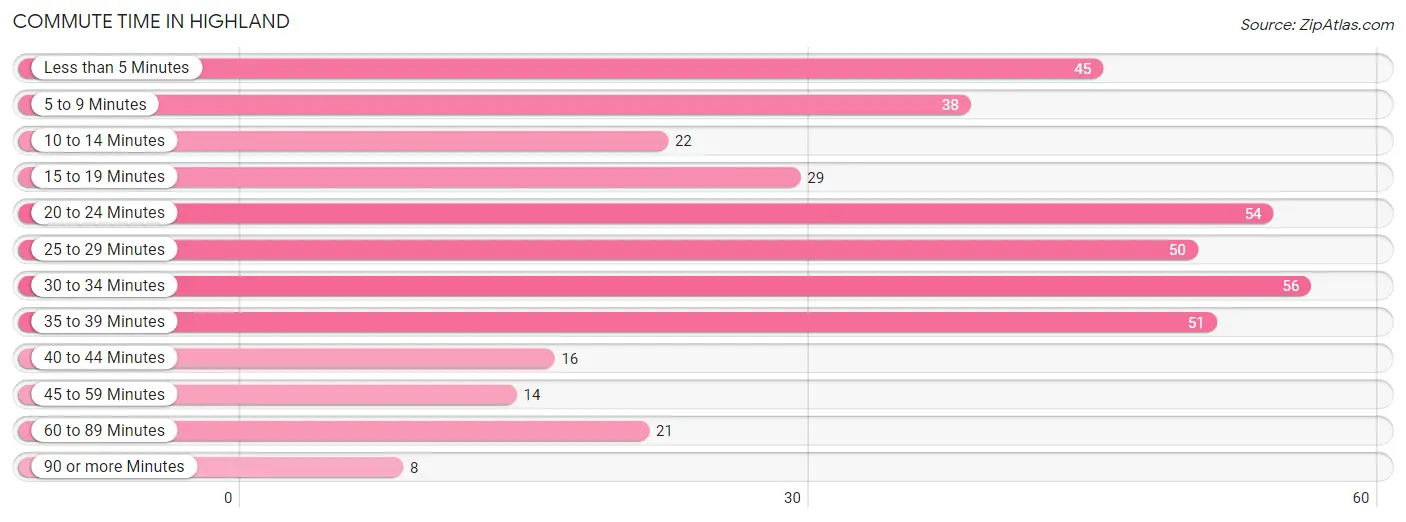
| Commute Time | # Commuters | % Commuters |
| Less than 5 Minutes | 45 | 11.1% |
| 5 to 9 Minutes | 38 | 9.4% |
| 10 to 14 Minutes | 22 | 5.4% |
| 15 to 19 Minutes | 29 | 7.2% |
| 20 to 24 Minutes | 54 | 13.4% |
| 25 to 29 Minutes | 50 | 12.4% |
| 30 to 34 Minutes | 56 | 13.9% |
| 35 to 39 Minutes | 51 | 12.6% |
| 40 to 44 Minutes | 16 | 4.0% |
| 45 to 59 Minutes | 14 | 3.5% |
| 60 to 89 Minutes | 21 | 5.2% |
| 90 or more Minutes | 8 | 2.0% |
Commute Time by Sex in Highland
The most common commute times in Highland are 35 to 39 minutes (45 commuters, 22.3%) for males and 25 to 29 minutes (32 commuters, 15.8%) for females.
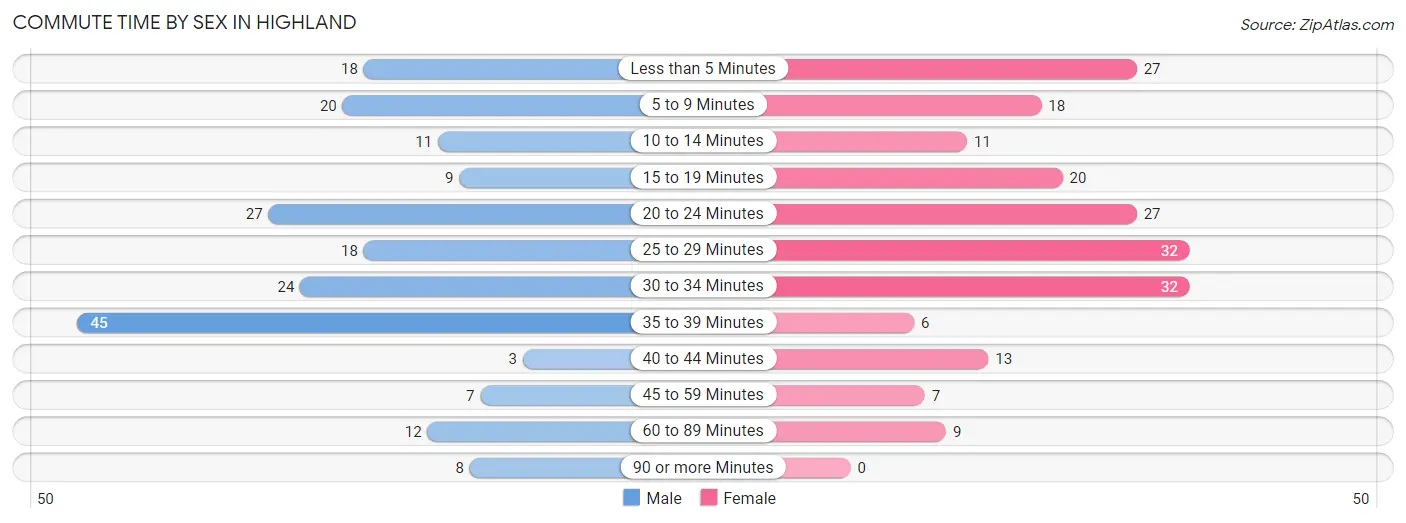
| Commute Time | Male | Female |
| Less than 5 Minutes | 18 (8.9%) | 27 (13.4%) |
| 5 to 9 Minutes | 20 (9.9%) | 18 (8.9%) |
| 10 to 14 Minutes | 11 (5.4%) | 11 (5.4%) |
| 15 to 19 Minutes | 9 (4.5%) | 20 (9.9%) |
| 20 to 24 Minutes | 27 (13.4%) | 27 (13.4%) |
| 25 to 29 Minutes | 18 (8.9%) | 32 (15.8%) |
| 30 to 34 Minutes | 24 (11.9%) | 32 (15.8%) |
| 35 to 39 Minutes | 45 (22.3%) | 6 (3.0%) |
| 40 to 44 Minutes | 3 (1.5%) | 13 (6.4%) |
| 45 to 59 Minutes | 7 (3.5%) | 7 (3.5%) |
| 60 to 89 Minutes | 12 (5.9%) | 9 (4.5%) |
| 90 or more Minutes | 8 (4.0%) | 0 (0.0%) |
Time of Departure to Work by Sex in Highland
The most frequent times of departure to work in Highland are 7:00 AM to 7:29 AM (55, 27.2%) for males and 7:30 AM to 7:59 AM (34, 16.8%) for females.
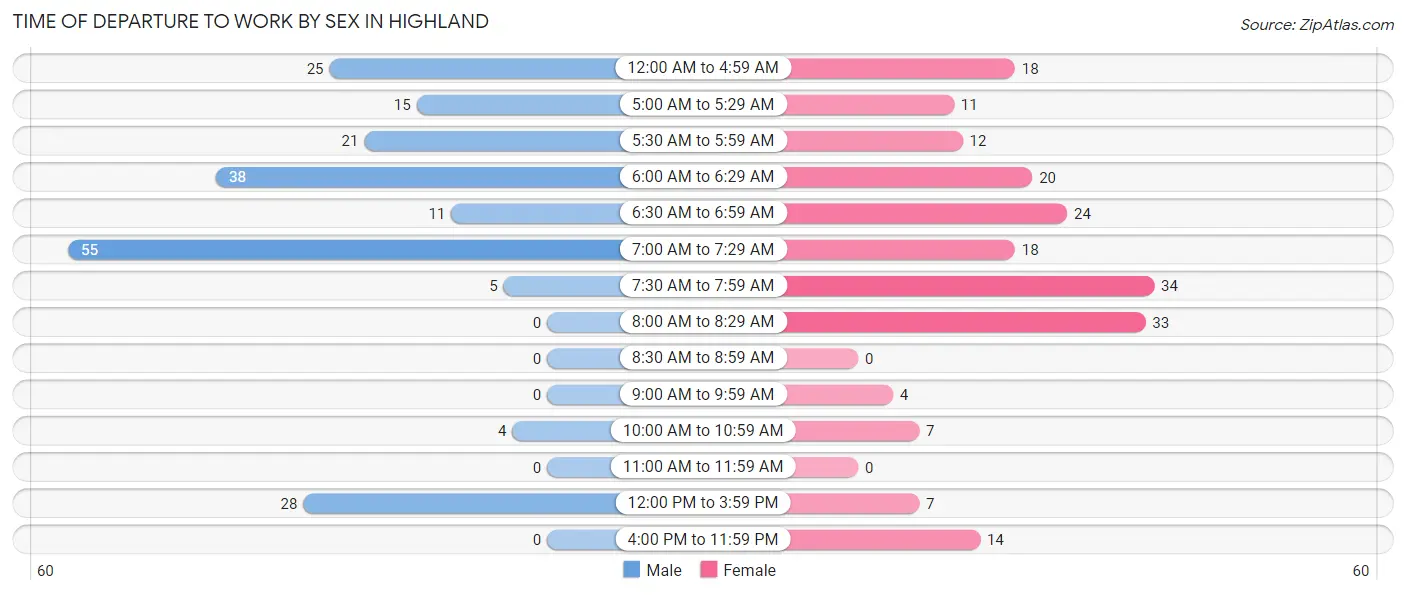
| Time of Departure | Male | Female |
| 12:00 AM to 4:59 AM | 25 (12.4%) | 18 (8.9%) |
| 5:00 AM to 5:29 AM | 15 (7.4%) | 11 (5.4%) |
| 5:30 AM to 5:59 AM | 21 (10.4%) | 12 (5.9%) |
| 6:00 AM to 6:29 AM | 38 (18.8%) | 20 (9.9%) |
| 6:30 AM to 6:59 AM | 11 (5.4%) | 24 (11.9%) |
| 7:00 AM to 7:29 AM | 55 (27.2%) | 18 (8.9%) |
| 7:30 AM to 7:59 AM | 5 (2.5%) | 34 (16.8%) |
| 8:00 AM to 8:29 AM | 0 (0.0%) | 33 (16.3%) |
| 8:30 AM to 8:59 AM | 0 (0.0%) | 0 (0.0%) |
| 9:00 AM to 9:59 AM | 0 (0.0%) | 4 (2.0%) |
| 10:00 AM to 10:59 AM | 4 (2.0%) | 7 (3.5%) |
| 11:00 AM to 11:59 AM | 0 (0.0%) | 0 (0.0%) |
| 12:00 PM to 3:59 PM | 28 (13.9%) | 7 (3.5%) |
| 4:00 PM to 11:59 PM | 0 (0.0%) | 14 (6.9%) |
| Total | 202 (100.0%) | 202 (100.0%) |
Housing Occupancy in Highland
Occupancy by Ownership in Highland
Of the total 370 dwellings in Highland, owner-occupied units account for 295 (79.7%), while renter-occupied units make up 75 (20.3%).
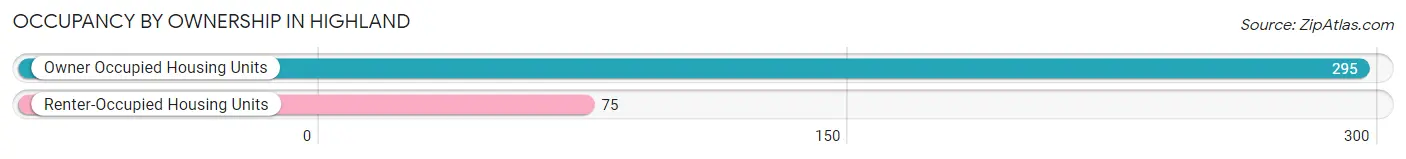
| Occupancy | # Housing Units | % Housing Units |
| Owner Occupied Housing Units | 295 | 79.7% |
| Renter-Occupied Housing Units | 75 | 20.3% |
| Total Occupied Housing Units | 370 | 100.0% |
Occupancy by Household Size in Highland
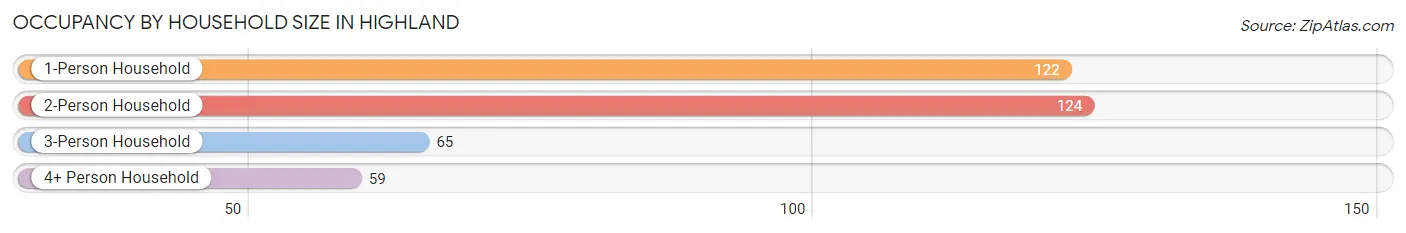
| Household Size | # Housing Units | % Housing Units |
| 1-Person Household | 122 | 33.0% |
| 2-Person Household | 124 | 33.5% |
| 3-Person Household | 65 | 17.6% |
| 4+ Person Household | 59 | 16.0% |
| Total Housing Units | 370 | 100.0% |
Occupancy by Ownership by Household Size in Highland
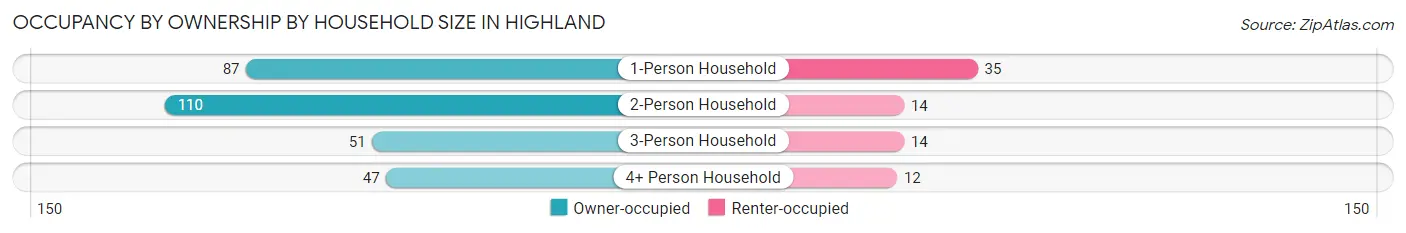
| Household Size | Owner-occupied | Renter-occupied |
| 1-Person Household | 87 (71.3%) | 35 (28.7%) |
| 2-Person Household | 110 (88.7%) | 14 (11.3%) |
| 3-Person Household | 51 (78.5%) | 14 (21.5%) |
| 4+ Person Household | 47 (79.7%) | 12 (20.3%) |
| Total Housing Units | 295 (79.7%) | 75 (20.3%) |
Occupancy by Educational Attainment in Highland
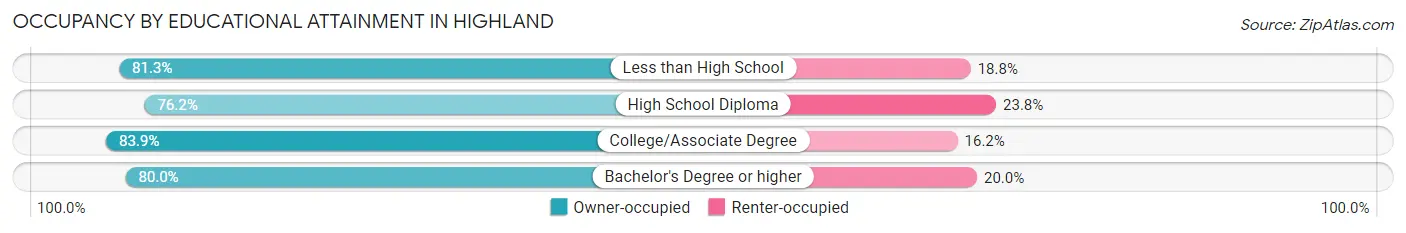
| Household Size | Owner-occupied | Renter-occupied |
| Less than High School | 13 (81.2%) | 3 (18.8%) |
| High School Diploma | 125 (76.2%) | 39 (23.8%) |
| College/Associate Degree | 109 (83.9%) | 21 (16.2%) |
| Bachelor's Degree or higher | 48 (80.0%) | 12 (20.0%) |
Occupancy by Age of Householder in Highland
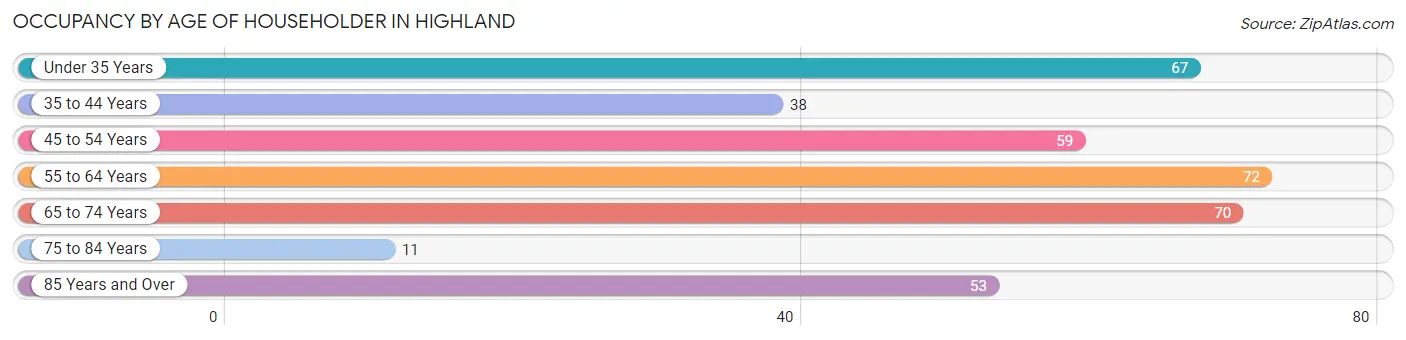
| Age Bracket | # Households | % Households |
| Under 35 Years | 67 | 18.1% |
| 35 to 44 Years | 38 | 10.3% |
| 45 to 54 Years | 59 | 16.0% |
| 55 to 64 Years | 72 | 19.5% |
| 65 to 74 Years | 70 | 18.9% |
| 75 to 84 Years | 11 | 3.0% |
| 85 Years and Over | 53 | 14.3% |
| Total | 370 | 100.0% |
Housing Finances in Highland
Median Income by Occupancy in Highland
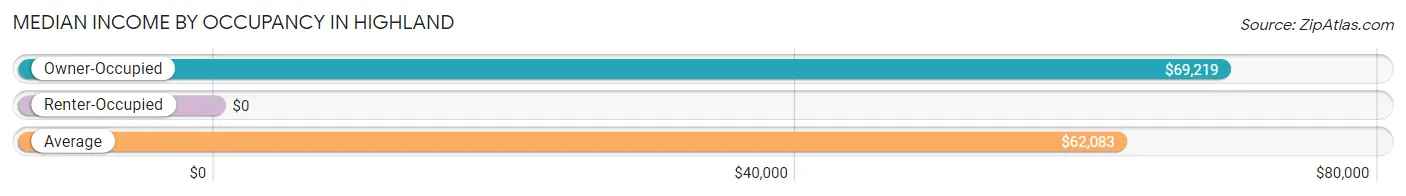
| Occupancy Type | # Households | Median Income |
| Owner-Occupied | 295 (79.7%) | $69,219 |
| Renter-Occupied | 75 (20.3%) | $0 |
| Average | 370 (100.0%) | $62,083 |
Occupancy by Householder Income Bracket in Highland
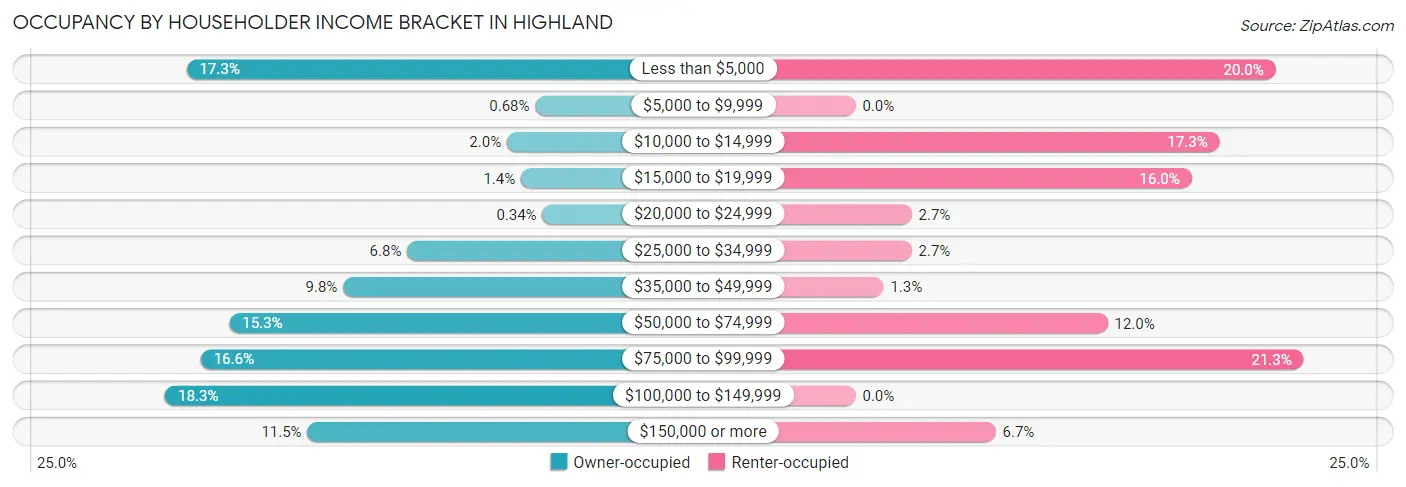
| Income Bracket | Owner-occupied | Renter-occupied |
| Less than $5,000 | 51 (17.3%) | 15 (20.0%) |
| $5,000 to $9,999 | 2 (0.7%) | 0 (0.0%) |
| $10,000 to $14,999 | 6 (2.0%) | 13 (17.3%) |
| $15,000 to $19,999 | 4 (1.4%) | 12 (16.0%) |
| $20,000 to $24,999 | 1 (0.3%) | 2 (2.7%) |
| $25,000 to $34,999 | 20 (6.8%) | 2 (2.7%) |
| $35,000 to $49,999 | 29 (9.8%) | 1 (1.3%) |
| $50,000 to $74,999 | 45 (15.2%) | 9 (12.0%) |
| $75,000 to $99,999 | 49 (16.6%) | 16 (21.3%) |
| $100,000 to $149,999 | 54 (18.3%) | 0 (0.0%) |
| $150,000 or more | 34 (11.5%) | 5 (6.7%) |
| Total | 295 (100.0%) | 75 (100.0%) |
Monthly Housing Cost Tiers in Highland
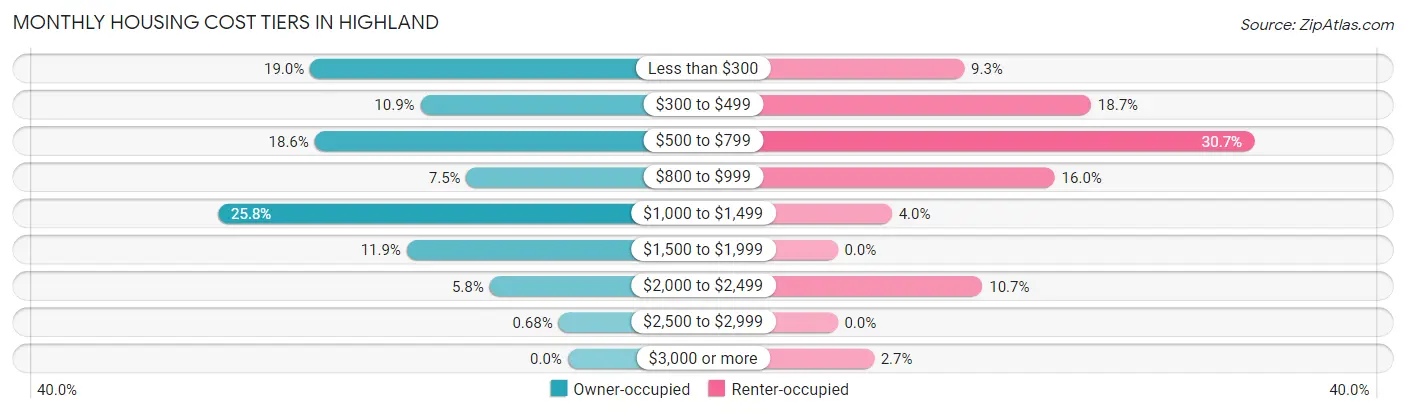
| Monthly Cost | Owner-occupied | Renter-occupied |
| Less than $300 | 56 (19.0%) | 7 (9.3%) |
| $300 to $499 | 32 (10.8%) | 14 (18.7%) |
| $500 to $799 | 55 (18.6%) | 23 (30.7%) |
| $800 to $999 | 22 (7.5%) | 12 (16.0%) |
| $1,000 to $1,499 | 76 (25.8%) | 3 (4.0%) |
| $1,500 to $1,999 | 35 (11.9%) | 0 (0.0%) |
| $2,000 to $2,499 | 17 (5.8%) | 8 (10.7%) |
| $2,500 to $2,999 | 2 (0.7%) | 0 (0.0%) |
| $3,000 or more | 0 (0.0%) | 2 (2.7%) |
| Total | 295 (100.0%) | 75 (100.0%) |
Physical Housing Characteristics in Highland
Housing Structures in Highland
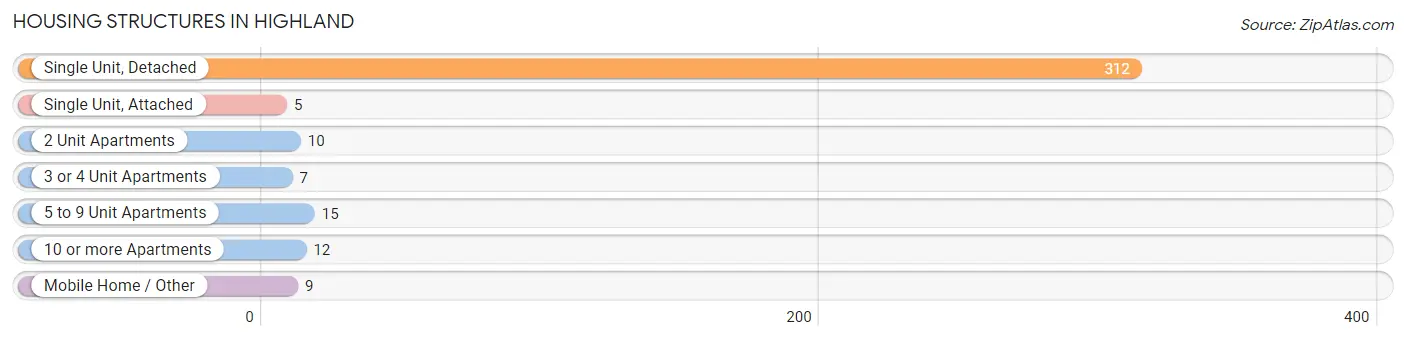
| Structure Type | # Housing Units | % Housing Units |
| Single Unit, Detached | 312 | 84.3% |
| Single Unit, Attached | 5 | 1.3% |
| 2 Unit Apartments | 10 | 2.7% |
| 3 or 4 Unit Apartments | 7 | 1.9% |
| 5 to 9 Unit Apartments | 15 | 4.1% |
| 10 or more Apartments | 12 | 3.2% |
| Mobile Home / Other | 9 | 2.4% |
| Total | 370 | 100.0% |
Housing Structures by Occupancy in Highland
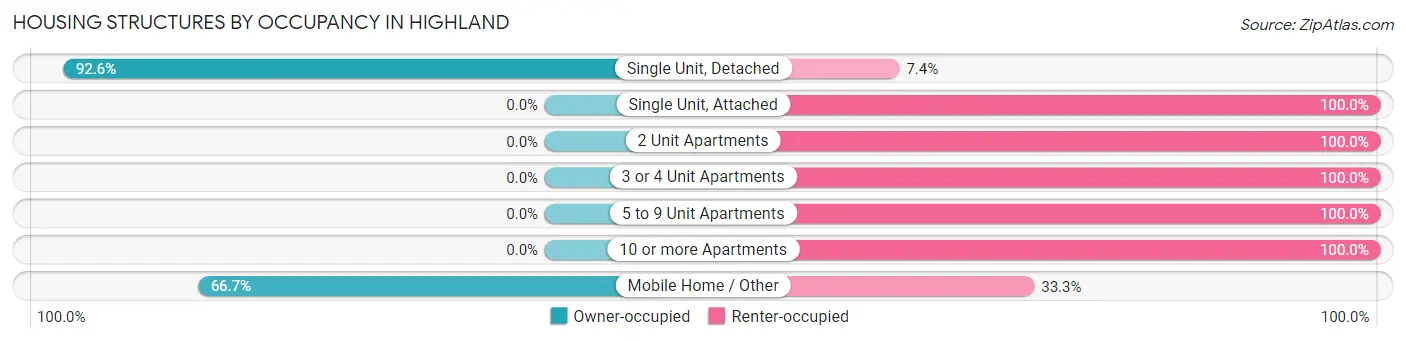
| Structure Type | Owner-occupied | Renter-occupied |
| Single Unit, Detached | 289 (92.6%) | 23 (7.4%) |
| Single Unit, Attached | 0 (0.0%) | 5 (100.0%) |
| 2 Unit Apartments | 0 (0.0%) | 10 (100.0%) |
| 3 or 4 Unit Apartments | 0 (0.0%) | 7 (100.0%) |
| 5 to 9 Unit Apartments | 0 (0.0%) | 15 (100.0%) |
| 10 or more Apartments | 0 (0.0%) | 12 (100.0%) |
| Mobile Home / Other | 6 (66.7%) | 3 (33.3%) |
| Total | 295 (79.7%) | 75 (20.3%) |
Housing Structures by Number of Rooms in Highland
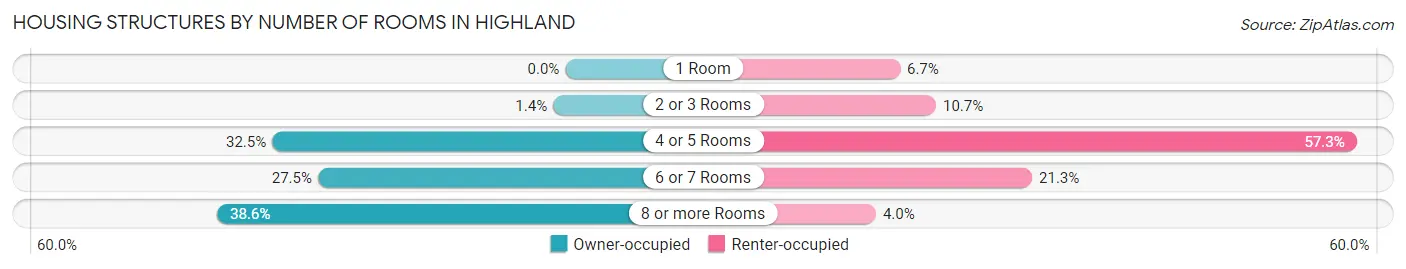
| Number of Rooms | Owner-occupied | Renter-occupied |
| 1 Room | 0 (0.0%) | 5 (6.7%) |
| 2 or 3 Rooms | 4 (1.4%) | 8 (10.7%) |
| 4 or 5 Rooms | 96 (32.5%) | 43 (57.3%) |
| 6 or 7 Rooms | 81 (27.5%) | 16 (21.3%) |
| 8 or more Rooms | 114 (38.6%) | 3 (4.0%) |
| Total | 295 (100.0%) | 75 (100.0%) |
Housing Structure by Heating Type in Highland
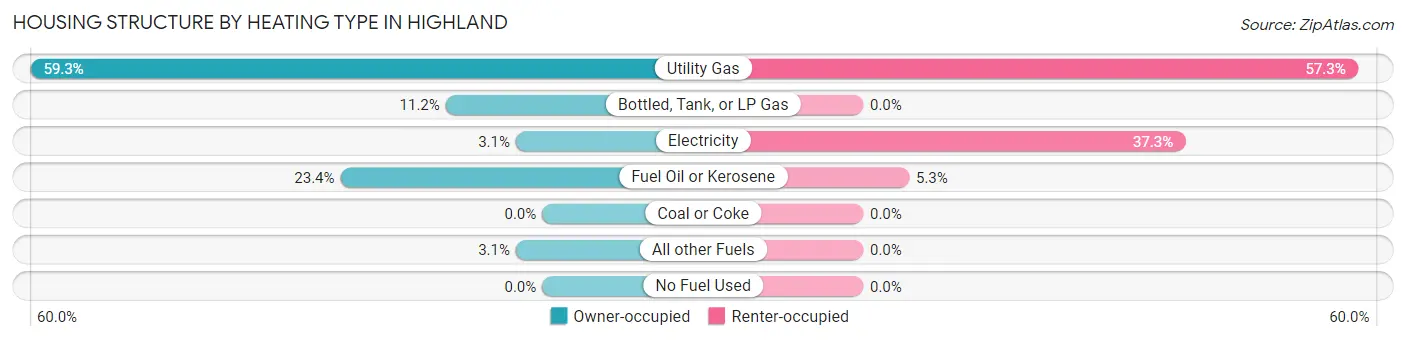
| Heating Type | Owner-occupied | Renter-occupied |
| Utility Gas | 175 (59.3%) | 43 (57.3%) |
| Bottled, Tank, or LP Gas | 33 (11.2%) | 0 (0.0%) |
| Electricity | 9 (3.0%) | 28 (37.3%) |
| Fuel Oil or Kerosene | 69 (23.4%) | 4 (5.3%) |
| Coal or Coke | 0 (0.0%) | 0 (0.0%) |
| All other Fuels | 9 (3.0%) | 0 (0.0%) |
| No Fuel Used | 0 (0.0%) | 0 (0.0%) |
| Total | 295 (100.0%) | 75 (100.0%) |
Household Vehicle Usage in Highland
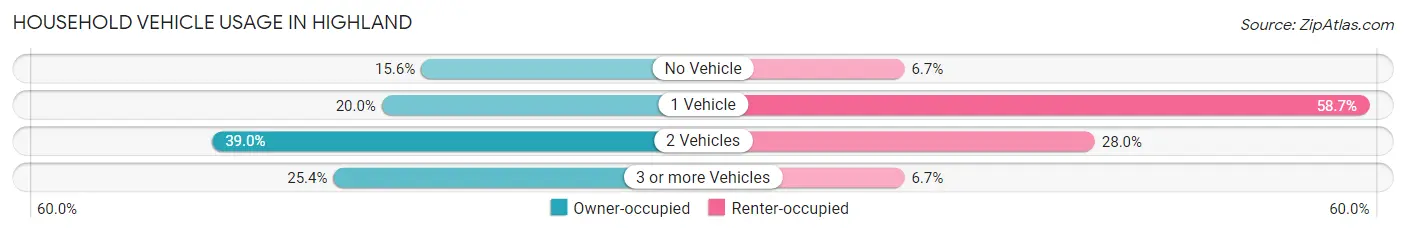
| Vehicles per Household | Owner-occupied | Renter-occupied |
| No Vehicle | 46 (15.6%) | 5 (6.7%) |
| 1 Vehicle | 59 (20.0%) | 44 (58.7%) |
| 2 Vehicles | 115 (39.0%) | 21 (28.0%) |
| 3 or more Vehicles | 75 (25.4%) | 5 (6.7%) |
| Total | 295 (100.0%) | 75 (100.0%) |
Real Estate & Mortgages in Highland
Real Estate and Mortgage Overview in Highland
| Characteristic | Without Mortgage | With Mortgage |
| Housing Units | 142 | 153 |
| Median Property Value | $86,900 | $155,900 |
| Median Household Income | $35,000 | $31 |
| Monthly Housing Costs | $379 | $0 |
| Real Estate Taxes | $1,800 | $0 |
Property Value by Mortgage Status in Highland
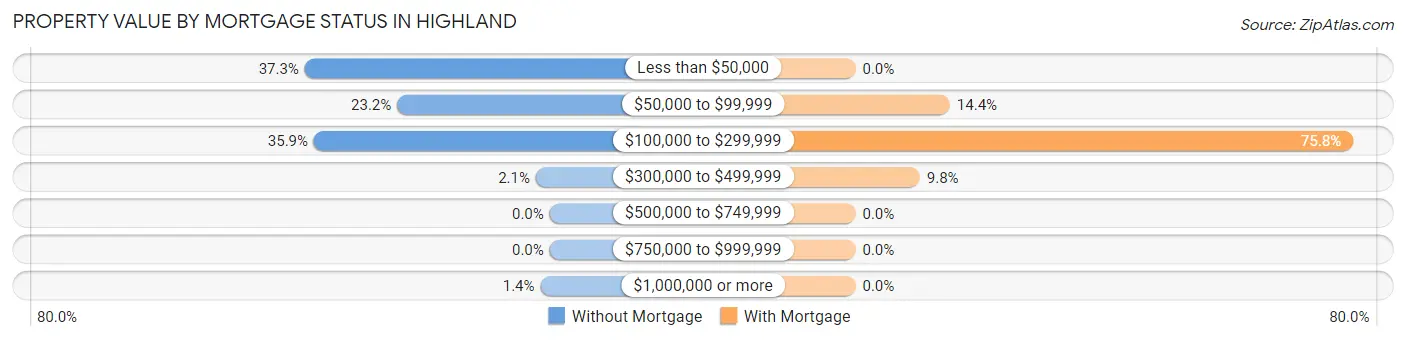
| Property Value | Without Mortgage | With Mortgage |
| Less than $50,000 | 53 (37.3%) | 0 (0.0%) |
| $50,000 to $99,999 | 33 (23.2%) | 22 (14.4%) |
| $100,000 to $299,999 | 51 (35.9%) | 116 (75.8%) |
| $300,000 to $499,999 | 3 (2.1%) | 15 (9.8%) |
| $500,000 to $749,999 | 0 (0.0%) | 0 (0.0%) |
| $750,000 to $999,999 | 0 (0.0%) | 0 (0.0%) |
| $1,000,000 or more | 2 (1.4%) | 0 (0.0%) |
| Total | 142 (100.0%) | 153 (100.0%) |
Household Income by Mortgage Status in Highland
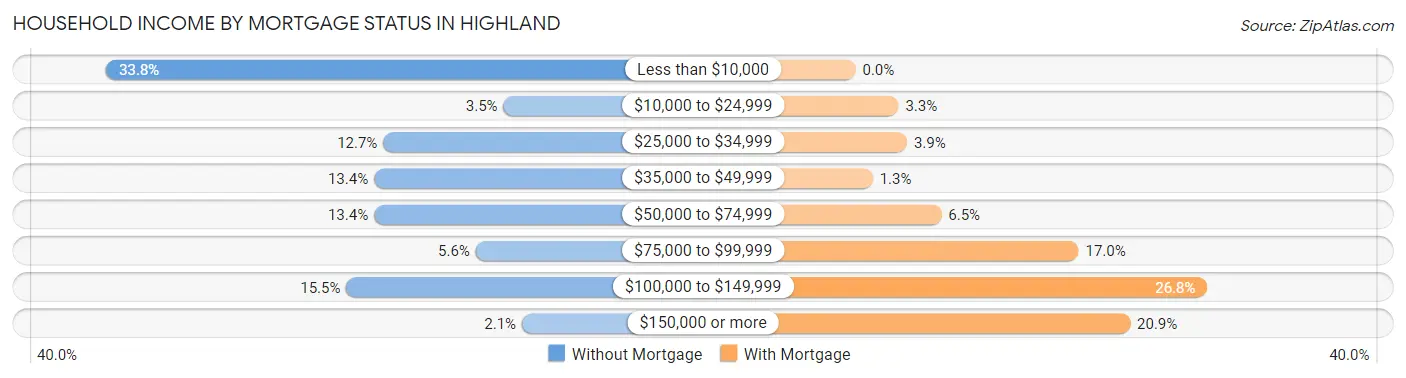
| Household Income | Without Mortgage | With Mortgage |
| Less than $10,000 | 48 (33.8%) | 0 (0.0%) |
| $10,000 to $24,999 | 5 (3.5%) | 5 (3.3%) |
| $25,000 to $34,999 | 18 (12.7%) | 6 (3.9%) |
| $35,000 to $49,999 | 19 (13.4%) | 2 (1.3%) |
| $50,000 to $74,999 | 19 (13.4%) | 10 (6.5%) |
| $75,000 to $99,999 | 8 (5.6%) | 26 (17.0%) |
| $100,000 to $149,999 | 22 (15.5%) | 41 (26.8%) |
| $150,000 or more | 3 (2.1%) | 32 (20.9%) |
| Total | 142 (100.0%) | 153 (100.0%) |
Property Value to Household Income Ratio in Highland
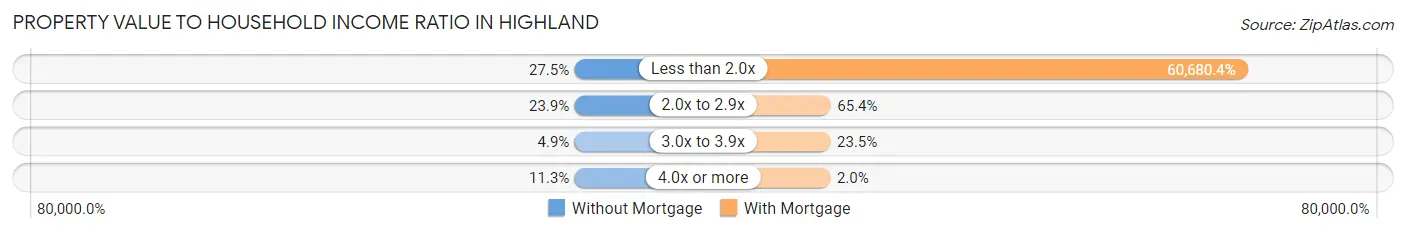
| Value-to-Income Ratio | Without Mortgage | With Mortgage |
| Less than 2.0x | 39 (27.5%) | 92,841 (60,680.4%) |
| 2.0x to 2.9x | 34 (23.9%) | 100 (65.4%) |
| 3.0x to 3.9x | 7 (4.9%) | 36 (23.5%) |
| 4.0x or more | 16 (11.3%) | 3 (2.0%) |
| Total | 142 (100.0%) | 153 (100.0%) |
Real Estate Taxes by Mortgage Status in Highland
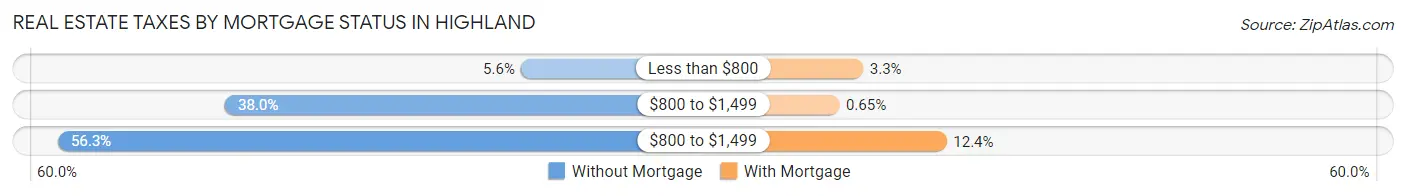
| Property Taxes | Without Mortgage | With Mortgage |
| Less than $800 | 8 (5.6%) | 5 (3.3%) |
| $800 to $1,499 | 54 (38.0%) | 1 (0.6%) |
| $800 to $1,499 | 80 (56.3%) | 19 (12.4%) |
| Total | 142 (100.0%) | 153 (100.0%) |
Health & Disability in Highland
Health Insurance Coverage by Age in Highland
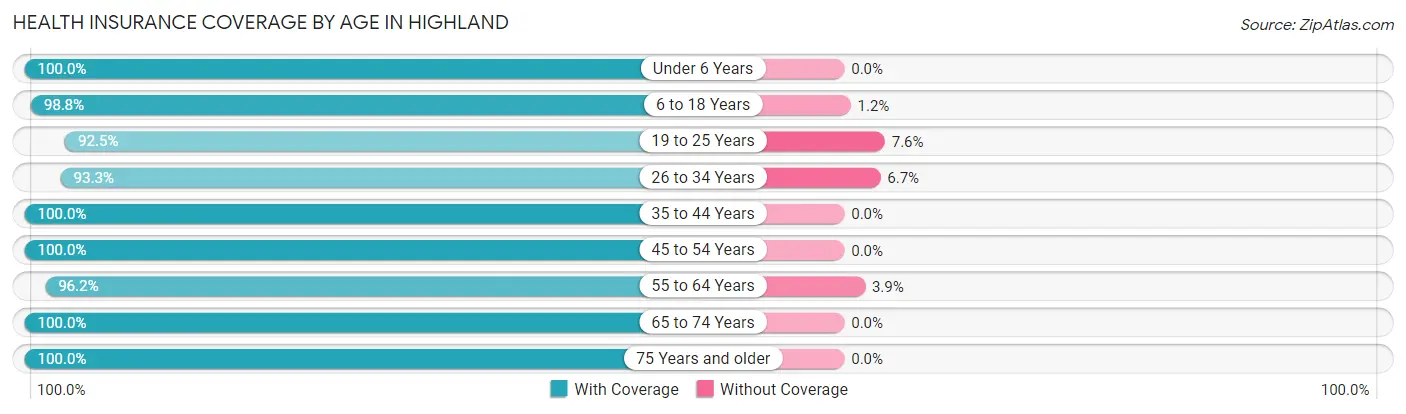
| Age Bracket | With Coverage | Without Coverage |
| Under 6 Years | 53 (100.0%) | 0 (0.0%) |
| 6 to 18 Years | 169 (98.8%) | 2 (1.2%) |
| 19 to 25 Years | 49 (92.4%) | 4 (7.5%) |
| 26 to 34 Years | 97 (93.3%) | 7 (6.7%) |
| 35 to 44 Years | 78 (100.0%) | 0 (0.0%) |
| 45 to 54 Years | 96 (100.0%) | 0 (0.0%) |
| 55 to 64 Years | 125 (96.2%) | 5 (3.8%) |
| 65 to 74 Years | 105 (100.0%) | 0 (0.0%) |
| 75 Years and older | 85 (100.0%) | 0 (0.0%) |
| Total | 857 (97.9%) | 18 (2.1%) |
Health Insurance Coverage by Citizenship Status in Highland
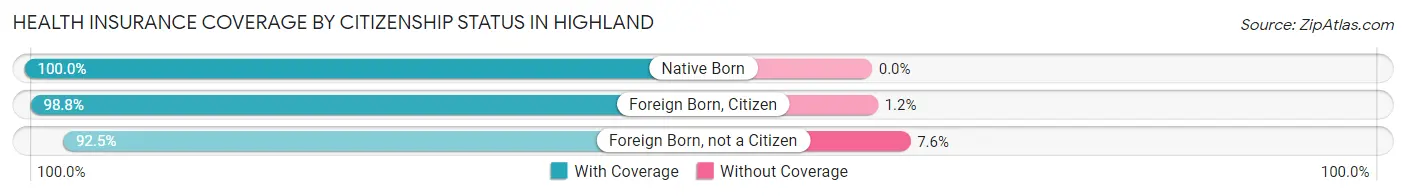
| Citizenship Status | With Coverage | Without Coverage |
| Native Born | 53 (100.0%) | 0 (0.0%) |
| Foreign Born, Citizen | 169 (98.8%) | 2 (1.2%) |
| Foreign Born, not a Citizen | 49 (92.4%) | 4 (7.5%) |
Health Insurance Coverage by Household Income in Highland
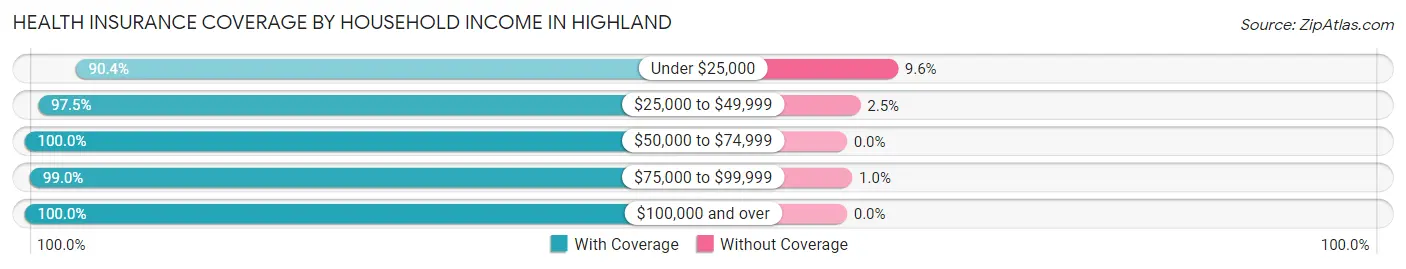
| Household Income | With Coverage | Without Coverage |
| Under $25,000 | 123 (90.4%) | 13 (9.6%) |
| $25,000 to $49,999 | 115 (97.5%) | 3 (2.5%) |
| $50,000 to $74,999 | 140 (100.0%) | 0 (0.0%) |
| $75,000 to $99,999 | 199 (99.0%) | 2 (1.0%) |
| $100,000 and over | 270 (100.0%) | 0 (0.0%) |
Public vs Private Health Insurance Coverage by Age in Highland
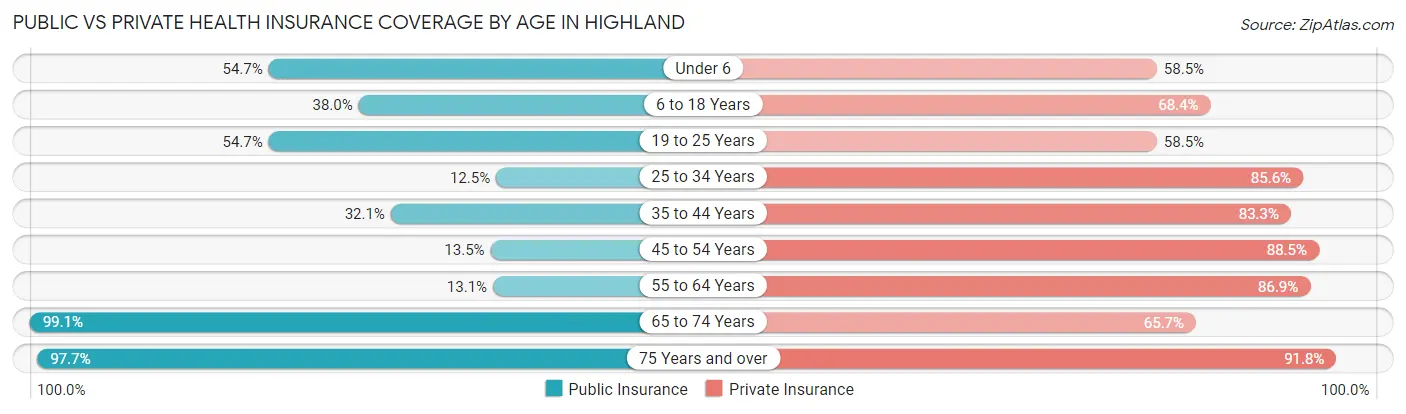
| Age Bracket | Public Insurance | Private Insurance |
| Under 6 | 29 (54.7%) | 31 (58.5%) |
| 6 to 18 Years | 65 (38.0%) | 117 (68.4%) |
| 19 to 25 Years | 29 (54.7%) | 31 (58.5%) |
| 25 to 34 Years | 13 (12.5%) | 89 (85.6%) |
| 35 to 44 Years | 25 (32.1%) | 65 (83.3%) |
| 45 to 54 Years | 13 (13.5%) | 85 (88.5%) |
| 55 to 64 Years | 17 (13.1%) | 113 (86.9%) |
| 65 to 74 Years | 104 (99.1%) | 69 (65.7%) |
| 75 Years and over | 83 (97.7%) | 78 (91.8%) |
| Total | 378 (43.2%) | 678 (77.5%) |
Disability Status by Sex by Age in Highland
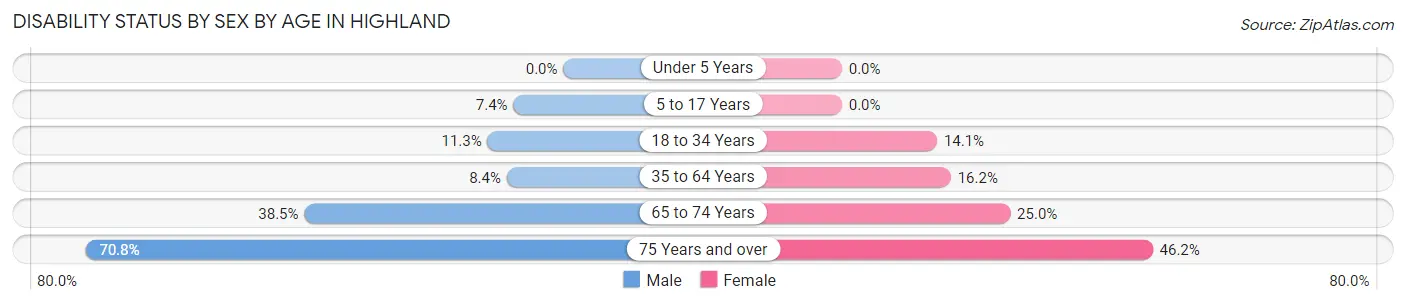
| Age Bracket | Male | Female |
| Under 5 Years | 0 (0.0%) | 0 (0.0%) |
| 5 to 17 Years | 6 (7.4%) | 0 (0.0%) |
| 18 to 34 Years | 9 (11.3%) | 13 (14.1%) |
| 35 to 64 Years | 11 (8.4%) | 28 (16.2%) |
| 65 to 74 Years | 25 (38.5%) | 10 (25.0%) |
| 75 Years and over | 51 (70.8%) | 6 (46.2%) |
Disability Class by Sex by Age in Highland
Disability Class: Hearing Difficulty
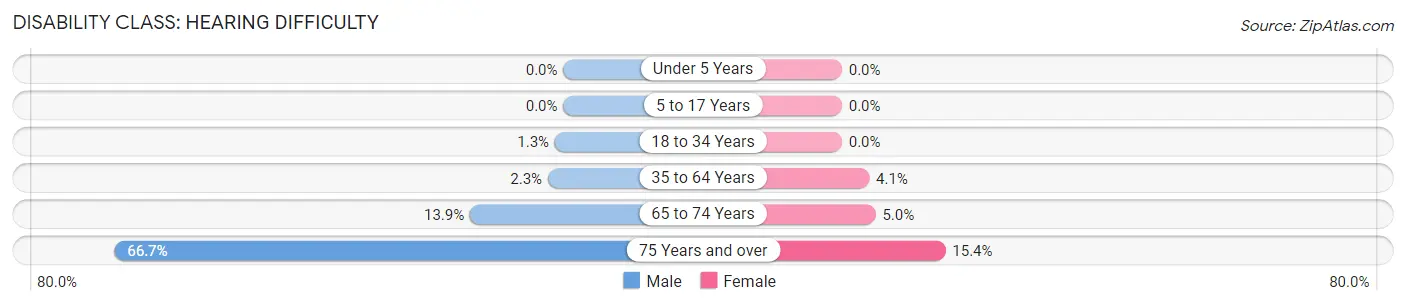
| Age Bracket | Male | Female |
| Under 5 Years | 0 (0.0%) | 0 (0.0%) |
| 5 to 17 Years | 0 (0.0%) | 0 (0.0%) |
| 18 to 34 Years | 1 (1.3%) | 0 (0.0%) |
| 35 to 64 Years | 3 (2.3%) | 7 (4.1%) |
| 65 to 74 Years | 9 (13.9%) | 2 (5.0%) |
| 75 Years and over | 48 (66.7%) | 2 (15.4%) |
Disability Class: Vision Difficulty
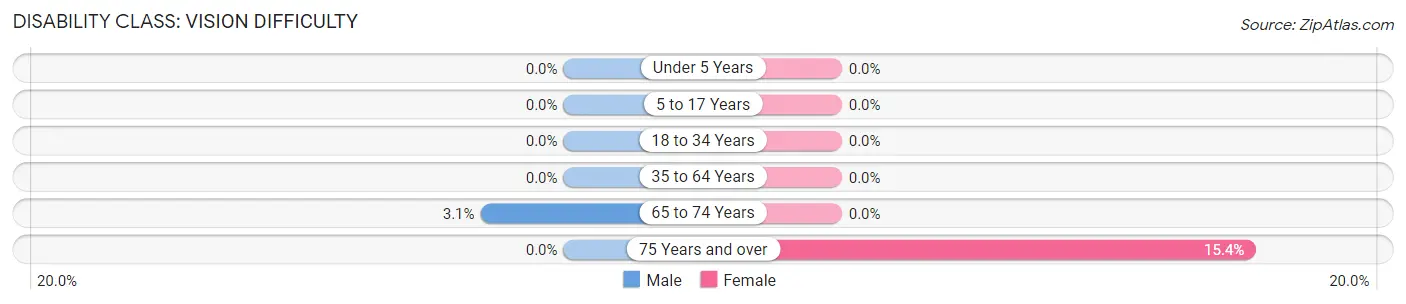
| Age Bracket | Male | Female |
| Under 5 Years | 0 (0.0%) | 0 (0.0%) |
| 5 to 17 Years | 0 (0.0%) | 0 (0.0%) |
| 18 to 34 Years | 0 (0.0%) | 0 (0.0%) |
| 35 to 64 Years | 0 (0.0%) | 0 (0.0%) |
| 65 to 74 Years | 2 (3.1%) | 0 (0.0%) |
| 75 Years and over | 0 (0.0%) | 2 (15.4%) |
Disability Class: Cognitive Difficulty
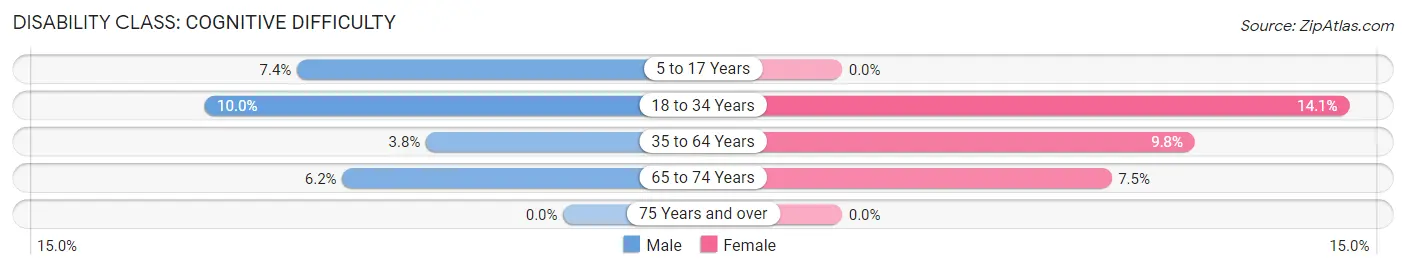
| Age Bracket | Male | Female |
| 5 to 17 Years | 6 (7.4%) | 0 (0.0%) |
| 18 to 34 Years | 8 (10.0%) | 13 (14.1%) |
| 35 to 64 Years | 5 (3.8%) | 17 (9.8%) |
| 65 to 74 Years | 4 (6.1%) | 3 (7.5%) |
| 75 Years and over | 0 (0.0%) | 0 (0.0%) |
Disability Class: Ambulatory Difficulty
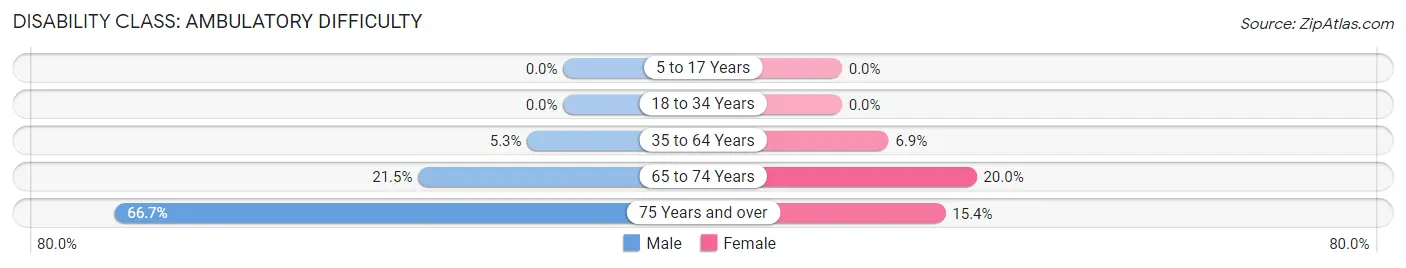
| Age Bracket | Male | Female |
| 5 to 17 Years | 0 (0.0%) | 0 (0.0%) |
| 18 to 34 Years | 0 (0.0%) | 0 (0.0%) |
| 35 to 64 Years | 7 (5.3%) | 12 (6.9%) |
| 65 to 74 Years | 14 (21.5%) | 8 (20.0%) |
| 75 Years and over | 48 (66.7%) | 2 (15.4%) |
Disability Class: Self-Care Difficulty
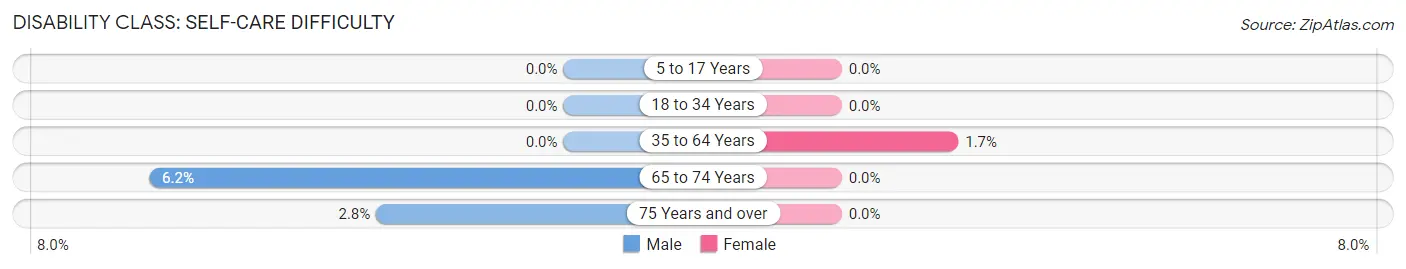
| Age Bracket | Male | Female |
| 5 to 17 Years | 0 (0.0%) | 0 (0.0%) |
| 18 to 34 Years | 0 (0.0%) | 0 (0.0%) |
| 35 to 64 Years | 0 (0.0%) | 3 (1.7%) |
| 65 to 74 Years | 4 (6.1%) | 0 (0.0%) |
| 75 Years and over | 2 (2.8%) | 0 (0.0%) |
Technology Access in Highland
Computing Device Access in Highland
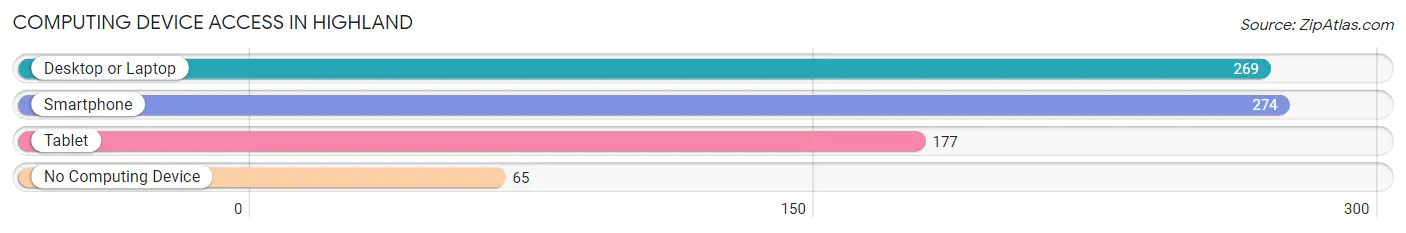
| Device Type | # Households | % Households |
| Desktop or Laptop | 269 | 72.7% |
| Smartphone | 274 | 74.1% |
| Tablet | 177 | 47.8% |
| No Computing Device | 65 | 17.6% |
| Total | 370 | 100.0% |
Internet Access in Highland
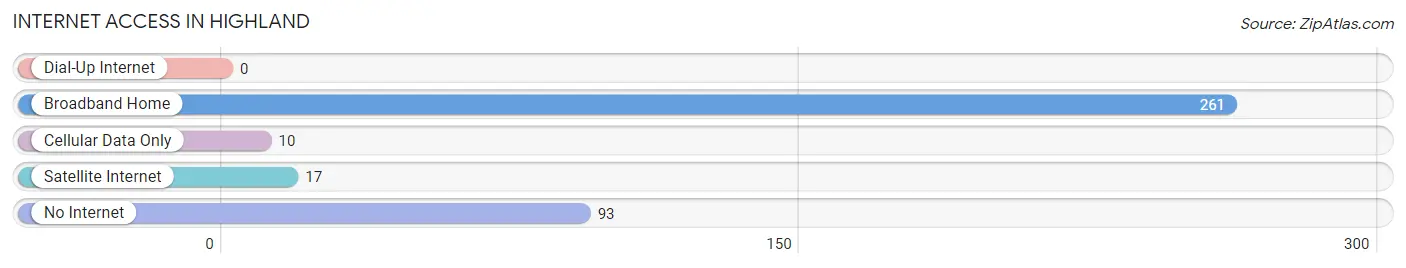
| Internet Type | # Households | % Households |
| Dial-Up Internet | 0 | 0.0% |
| Broadband Home | 261 | 70.5% |
| Cellular Data Only | 10 | 2.7% |
| Satellite Internet | 17 | 4.6% |
| No Internet | 93 | 25.1% |
| Total | 370 | 100.0% |
Highland Summary
Highland, Wisconsin is a small village located in the southwestern corner of Iowa County, Wisconsin. It is situated on the banks of the Wisconsin River, approximately 20 miles south of Madison. The village has a population of approximately 1,000 people and is part of the Madison Metropolitan Statistical Area.
History
Highland was first settled in 1845 by a group of settlers from New York. The village was originally known as “Highland Station” due to its location on the Wisconsin Central Railroad. The village was officially incorporated in 1876 and was named after the nearby Highland Park.
Geography
Highland is located in the southwestern corner of Iowa County, Wisconsin. It is situated on the banks of the Wisconsin River, approximately 20 miles south of Madison. The village is surrounded by rolling hills and is home to several small lakes, including Lake Koshkonong and Lake Wisconsin. The village is also located near the Wisconsin Dells, a popular tourist destination.
Economy
Highland’s economy is largely based on agriculture and tourism. The village is home to several small farms, which produce a variety of crops, including corn, soybeans, and hay. The village is also home to several small businesses, including restaurants, shops, and a local winery. Tourism is also an important part of the local economy, as the village is located near several popular tourist attractions, including the Wisconsin Dells and the Ho-Chunk Casino.
Demographics
As of the 2010 census, the population of Highland was 1,000 people. The racial makeup of the village was 97.2% White, 0.7% African American, 0.3% Native American, 0.2% Asian, 0.1% Pacific Islander, and 1.5% from other races. The median household income was $45,000, and the median family income was $50,000. The per capita income was $20,000.
Highland is a small village with a rich history and a vibrant economy. The village is home to several small businesses and farms, and is a popular tourist destination. The village is also home to a diverse population, with a variety of racial and ethnic backgrounds. Highland is a great place to live, work, and visit.
Common Questions
What is Per Capita Income in Highland?
Per Capita income in Highland is $29,956.
What is the Median Family Income in Highland?
Median Family Income in Highland is $85,682.
What is the Median Household income in Highland?
Median Household Income in Highland is $62,083.
What is Income or Wage Gap in Highland?
Income or Wage Gap in Highland is 38.4%.
Women in Highland earn 61.6 cents for every dollar earned by a man.
What is Inequality or Gini Index in Highland?
Inequality or Gini Index in Highland is 0.47.
What is the Total Population of Highland?
Total Population of Highland is 875.
What is the Total Male Population of Highland?
Total Male Population of Highland is 456.
What is the Total Female Population of Highland?
Total Female Population of Highland is 419.
What is the Ratio of Males per 100 Females in Highland?
There are 108.83 Males per 100 Females in Highland.
What is the Ratio of Females per 100 Males in Highland?
There are 91.89 Females per 100 Males in Highland.
What is the Median Population Age in Highland?
Median Population Age in Highland is 43.8 Years.
What is the Average Family Size in Highland
Average Family Size in Highland is 2.9 People.
What is the Average Household Size in Highland
Average Household Size in Highland is 2.3 People.
How Large is the Labor Force in Highland?
There are 443 People in the Labor Forcein in Highland.
What is the Percentage of People in the Labor Force in Highland?
64.2% of People are in the Labor Force in Highland.