Hancock, WI Map & Demographics
Hancock Map
Hancock Overview
$22,788
PER CAPITA INCOME
$45,000
AVG FAMILY INCOME
$45,931
AVG HOUSEHOLD INCOME
66.3%
WAGE / INCOME GAP [ % ]
33.7¢/ $1
WAGE / INCOME GAP [ $ ]
0.30
INEQUALITY / GINI INDEX
413
TOTAL POPULATION
220
MALE POPULATION
193
FEMALE POPULATION
113.99
MALES / 100 FEMALES
87.73
FEMALES / 100 MALES
44.9
MEDIAN AGE
2.8
AVG FAMILY SIZE
2.0
AVG HOUSEHOLD SIZE
158
LABOR FORCE [ PEOPLE ]
48.2%
PERCENT IN LABOR FORCE
10.8%
UNEMPLOYMENT RATE
Hancock Zip Codes
Hancock Area Codes
Income in Hancock
Income Overview in Hancock
Per Capita Income in Hancock is $22,788, while median incomes of families and households are $45,000 and $45,931 respectively.
| Characteristic | Number | Measure |
| Per Capita Income | 413 | $22,788 |
| Median Family Income | 104 | $45,000 |
| Mean Family Income | 104 | $52,567 |
| Median Household Income | 202 | $45,931 |
| Mean Household Income | 202 | $48,795 |
| Income Deficit | 104 | $0 |
| Wage / Income Gap (%) | 413 | 66.34% |
| Wage / Income Gap ($) | 413 | 33.66¢ per $1 |
| Gini / Inequality Index | 413 | 0.30 |
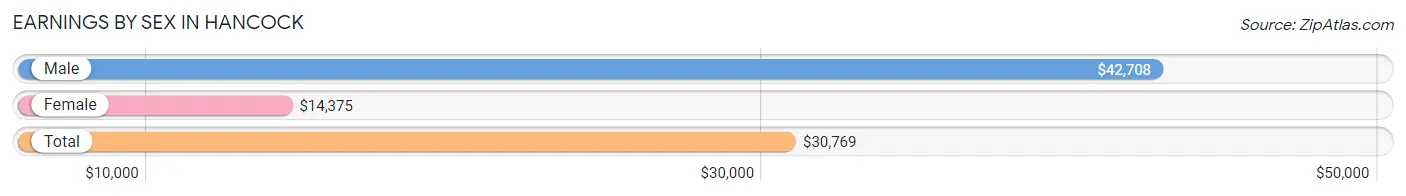
Earnings by Sex in Hancock
Average Earnings in Hancock are $30,769, $42,708 for men and $14,375 for women, a difference of 66.3%.
| Sex | Number | Average Earnings |
| Male | 85 (51.2%) | $42,708 |
| Female | 81 (48.8%) | $14,375 |
| Total | 166 (100.0%) | $30,769 |
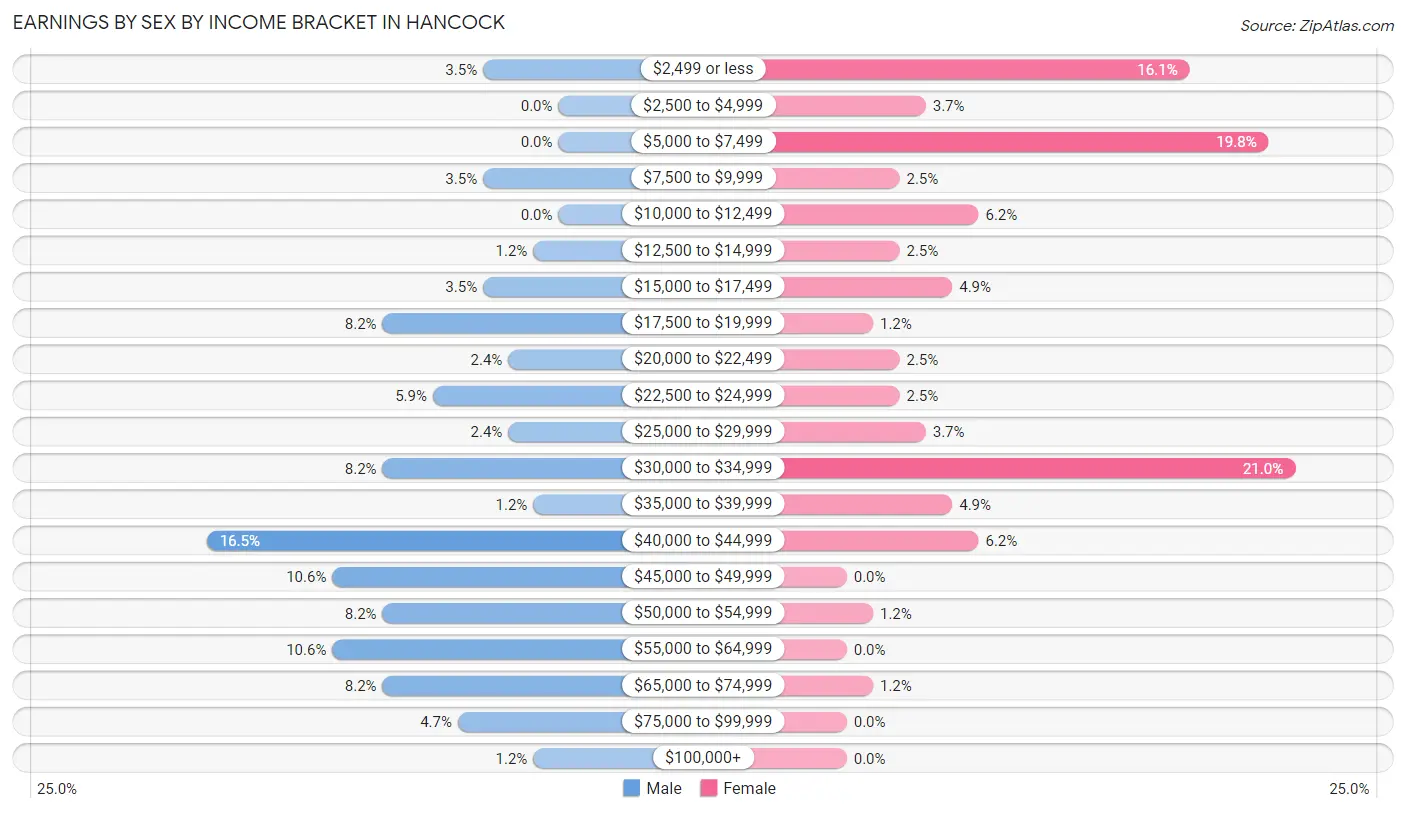
Earnings by Sex by Income Bracket in Hancock
The most common earnings brackets in Hancock are $40,000 to $44,999 for men (14 | 16.5%) and $30,000 to $34,999 for women (17 | 21.0%).
| Income | Male | Female |
| $2,499 or less | 3 (3.5%) | 13 (16.1%) |
| $2,500 to $4,999 | 0 (0.0%) | 3 (3.7%) |
| $5,000 to $7,499 | 0 (0.0%) | 16 (19.8%) |
| $7,500 to $9,999 | 3 (3.5%) | 2 (2.5%) |
| $10,000 to $12,499 | 0 (0.0%) | 5 (6.2%) |
| $12,500 to $14,999 | 1 (1.2%) | 2 (2.5%) |
| $15,000 to $17,499 | 3 (3.5%) | 4 (4.9%) |
| $17,500 to $19,999 | 7 (8.2%) | 1 (1.2%) |
| $20,000 to $22,499 | 2 (2.4%) | 2 (2.5%) |
| $22,500 to $24,999 | 5 (5.9%) | 2 (2.5%) |
| $25,000 to $29,999 | 2 (2.4%) | 3 (3.7%) |
| $30,000 to $34,999 | 7 (8.2%) | 17 (21.0%) |
| $35,000 to $39,999 | 1 (1.2%) | 4 (4.9%) |
| $40,000 to $44,999 | 14 (16.5%) | 5 (6.2%) |
| $45,000 to $49,999 | 9 (10.6%) | 0 (0.0%) |
| $50,000 to $54,999 | 7 (8.2%) | 1 (1.2%) |
| $55,000 to $64,999 | 9 (10.6%) | 0 (0.0%) |
| $65,000 to $74,999 | 7 (8.2%) | 1 (1.2%) |
| $75,000 to $99,999 | 4 (4.7%) | 0 (0.0%) |
| $100,000+ | 1 (1.2%) | 0 (0.0%) |
| Total | 85 (100.0%) | 81 (100.0%) |
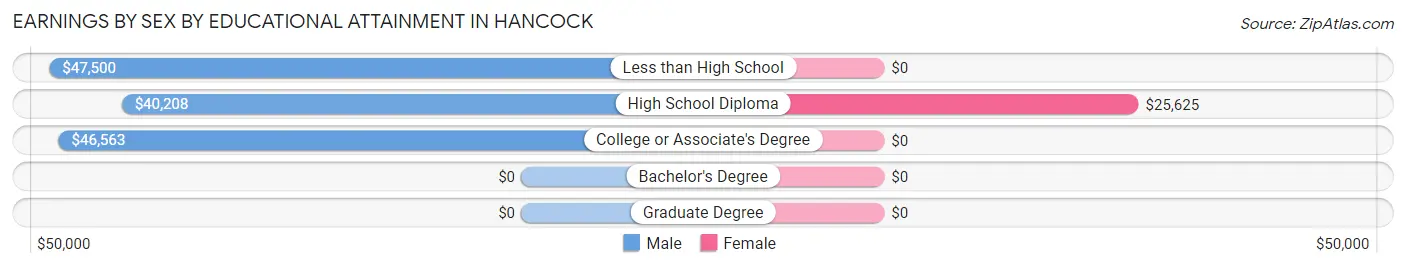
Earnings by Sex by Educational Attainment in Hancock
Average earnings in Hancock are $43,125 for men and $20,000 for women, a difference of 53.6%. Men with an educational attainment of less than high school enjoy the highest average annual earnings of $47,500, while those with high school diploma education earn the least with $40,208. Women with an educational attainment of high school diploma earn the most with the average annual earnings of $25,625, while those with high school diploma education have the smallest earnings of $25,625.
| Educational Attainment | Male Income | Female Income |
| Less than High School | $47,500 | $0 |
| High School Diploma | $40,208 | $25,625 |
| College or Associate's Degree | $46,563 | $0 |
| Bachelor's Degree | - | - |
| Graduate Degree | - | - |
| Total | $43,125 | $20,000 |
Family Income in Hancock
Family Income Brackets in Hancock
According to the Hancock family income data, there are 24 families falling into the $25,000 to $34,999 income range, which is the most common income bracket and makes up 23.1% of all families.
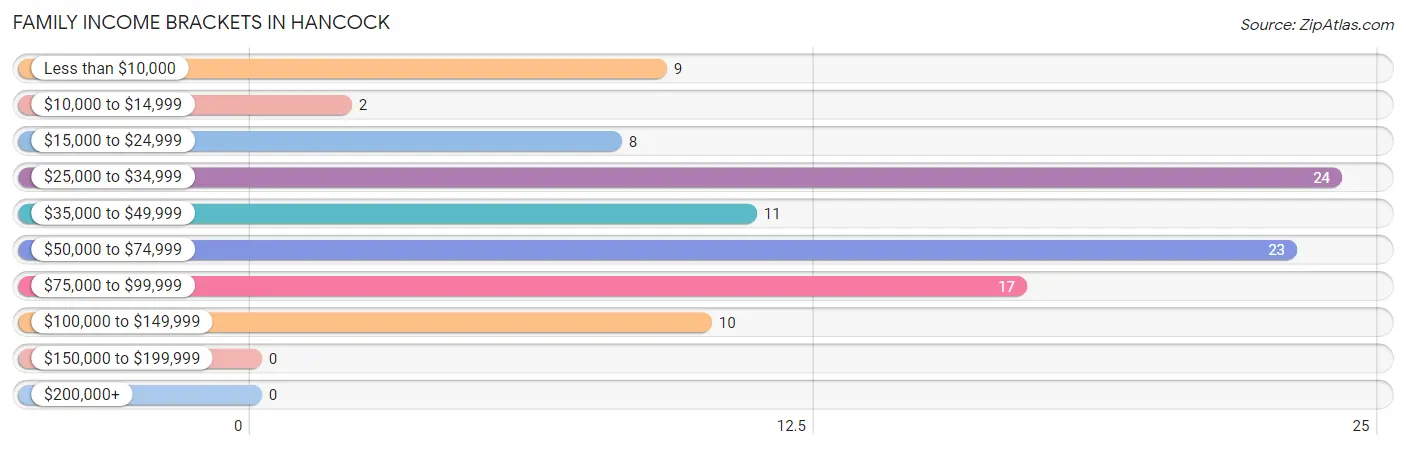
| Income Bracket | # Families | % Families |
| Less than $10,000 | 9 | 8.7% |
| $10,000 to $14,999 | 2 | 1.9% |
| $15,000 to $24,999 | 8 | 7.7% |
| $25,000 to $34,999 | 24 | 23.1% |
| $35,000 to $49,999 | 11 | 10.6% |
| $50,000 to $74,999 | 23 | 22.1% |
| $75,000 to $99,999 | 17 | 16.3% |
| $100,000 to $149,999 | 10 | 9.6% |
| $150,000 to $199,999 | 0 | 0.0% |
| $200,000+ | 0 | 0.0% |
Family Income by Famaliy Size in Hancock
3-person families (20 | 19.2%) account for the highest median family income in Hancock with $73,750 per family, while 3-person families (20 | 19.2%) have the highest median income of $24,583 per family member.
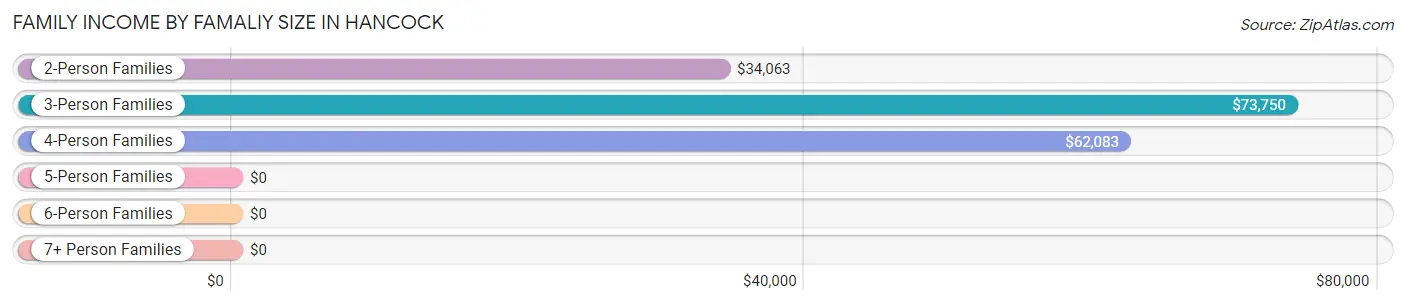
| Income Bracket | # Families | Median Income |
| 2-Person Families | 51 (49.0%) | $34,063 |
| 3-Person Families | 20 (19.2%) | $73,750 |
| 4-Person Families | 10 (9.6%) | $62,083 |
| 5-Person Families | 11 (10.6%) | $0 |
| 6-Person Families | 8 (7.7%) | $0 |
| 7+ Person Families | 4 (3.8%) | $0 |
| Total | 104 (100.0%) | $45,000 |
Family Income by Number of Earners in Hancock
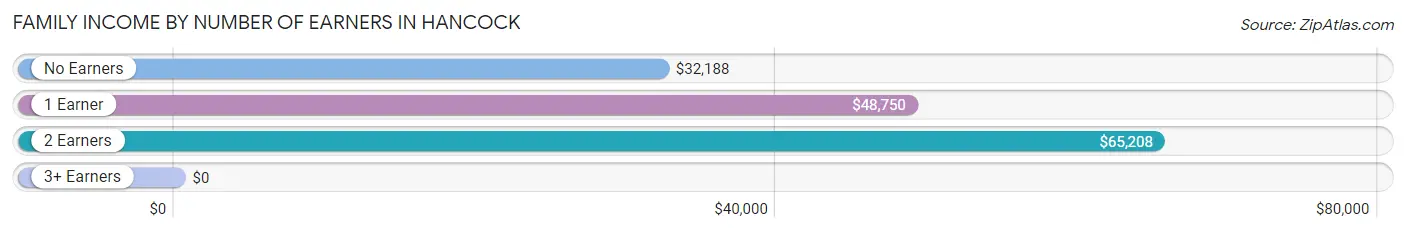
| Number of Earners | # Families | Median Income |
| No Earners | 19 (18.3%) | $32,188 |
| 1 Earner | 45 (43.3%) | $48,750 |
| 2 Earners | 35 (33.7%) | $65,208 |
| 3+ Earners | 5 (4.8%) | $0 |
| Total | 104 (100.0%) | $45,000 |
Household Income in Hancock
Household Income Brackets in Hancock
With 71 households falling in the category, the $35,000 to $49,999 income range is the most frequent in Hancock, accounting for 35.1% of all households.
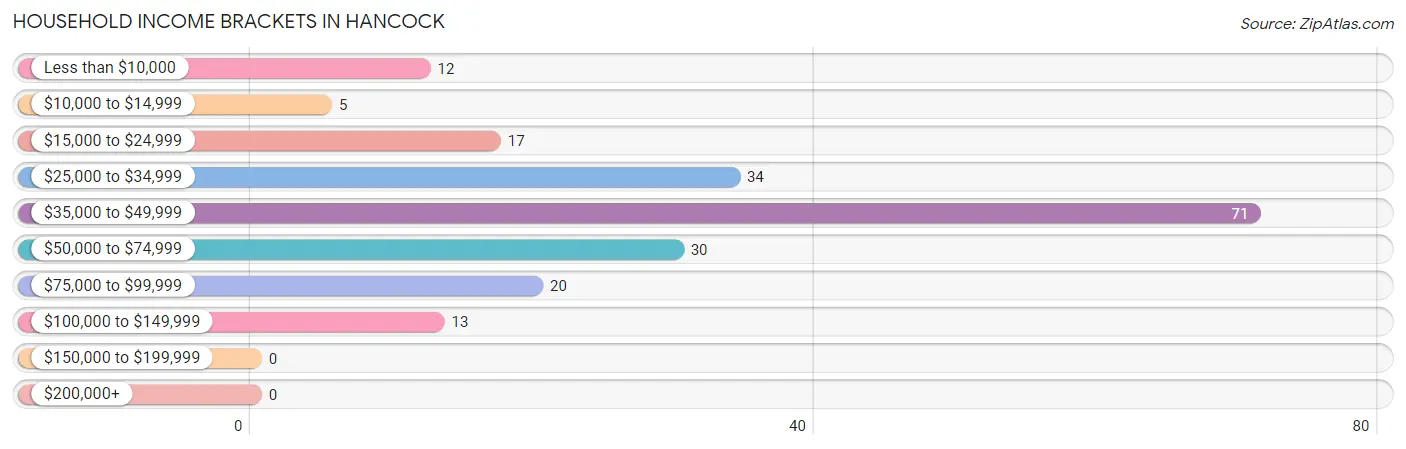
| Income Bracket | # Households | % Households |
| Less than $10,000 | 12 | 5.9% |
| $10,000 to $14,999 | 5 | 2.5% |
| $15,000 to $24,999 | 17 | 8.4% |
| $25,000 to $34,999 | 34 | 16.8% |
| $35,000 to $49,999 | 71 | 35.1% |
| $50,000 to $74,999 | 30 | 14.9% |
| $75,000 to $99,999 | 20 | 9.9% |
| $100,000 to $149,999 | 13 | 6.4% |
| $150,000 to $199,999 | 0 | 0.0% |
| $200,000+ | 0 | 0.0% |
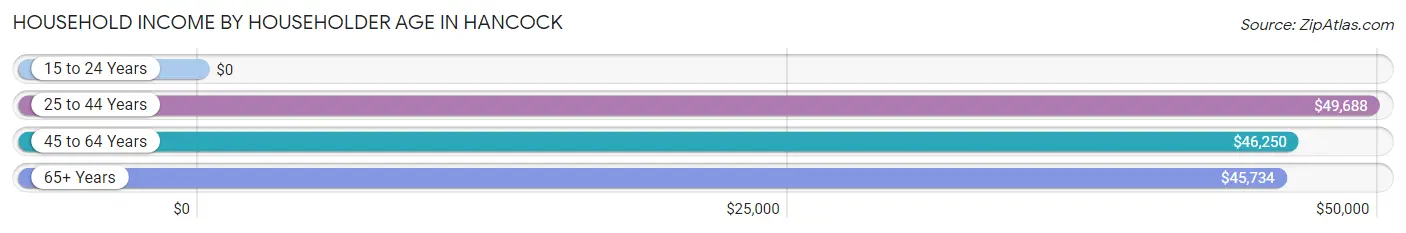
Household Income by Householder Age in Hancock
The median household income in Hancock is $45,931, with the highest median household income of $49,688 found in the 25 to 44 years age bracket for the primary householder. A total of 45 households (22.3%) fall into this category. Meanwhile, the 15 to 24 years age bracket for the primary householder has the lowest median household income of $0, with 7 households (3.5%) in this group.
| Income Bracket | # Households | Median Income |
| 15 to 24 Years | 7 (3.5%) | $0 |
| 25 to 44 Years | 45 (22.3%) | $49,688 |
| 45 to 64 Years | 65 (32.2%) | $46,250 |
| 65+ Years | 85 (42.1%) | $45,734 |
| Total | 202 (100.0%) | $45,931 |
Poverty in Hancock
Income Below Poverty by Sex and Age in Hancock
With 23.6% poverty level for males and 37.3% for females among the residents of Hancock, 16 and 17 year old males and 12 to 14 year old females are the most vulnerable to poverty, with 4 males (100.0%) and 1 females (100.0%) in their respective age groups living below the poverty level.
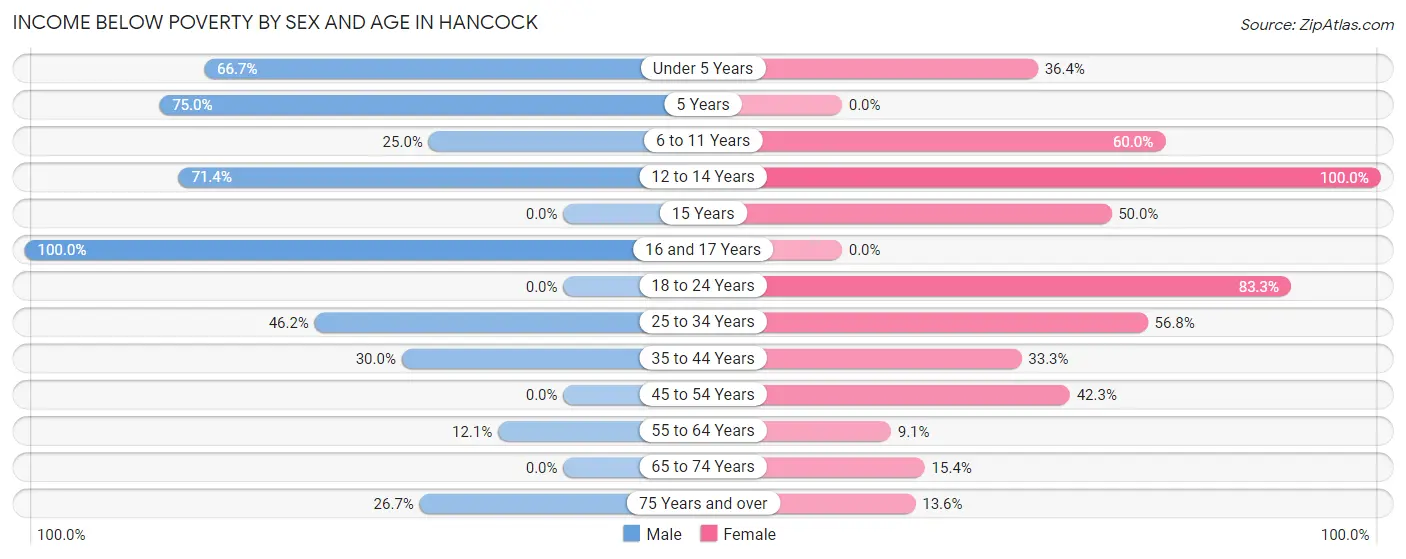
| Age Bracket | Male | Female |
| Under 5 Years | 6 (66.7%) | 4 (36.4%) |
| 5 Years | 3 (75.0%) | 0 (0.0%) |
| 6 to 11 Years | 5 (25.0%) | 12 (60.0%) |
| 12 to 14 Years | 10 (71.4%) | 1 (100.0%) |
| 15 Years | 0 (0.0%) | 1 (50.0%) |
| 16 and 17 Years | 4 (100.0%) | 0 (0.0%) |
| 18 to 24 Years | 0 (0.0%) | 10 (83.3%) |
| 25 to 34 Years | 6 (46.2%) | 21 (56.8%) |
| 35 to 44 Years | 9 (30.0%) | 4 (33.3%) |
| 45 to 54 Years | 0 (0.0%) | 11 (42.3%) |
| 55 to 64 Years | 4 (12.1%) | 3 (9.1%) |
| 65 to 74 Years | 0 (0.0%) | 2 (15.4%) |
| 75 Years and over | 4 (26.7%) | 3 (13.6%) |
| Total | 51 (23.6%) | 72 (37.3%) |
Income Above Poverty by Sex and Age in Hancock
According to the poverty statistics in Hancock, males aged 18 to 24 years and females aged 16 and 17 years are the age groups that are most secure financially, with 100.0% of males and 100.0% of females in these age groups living above the poverty line.
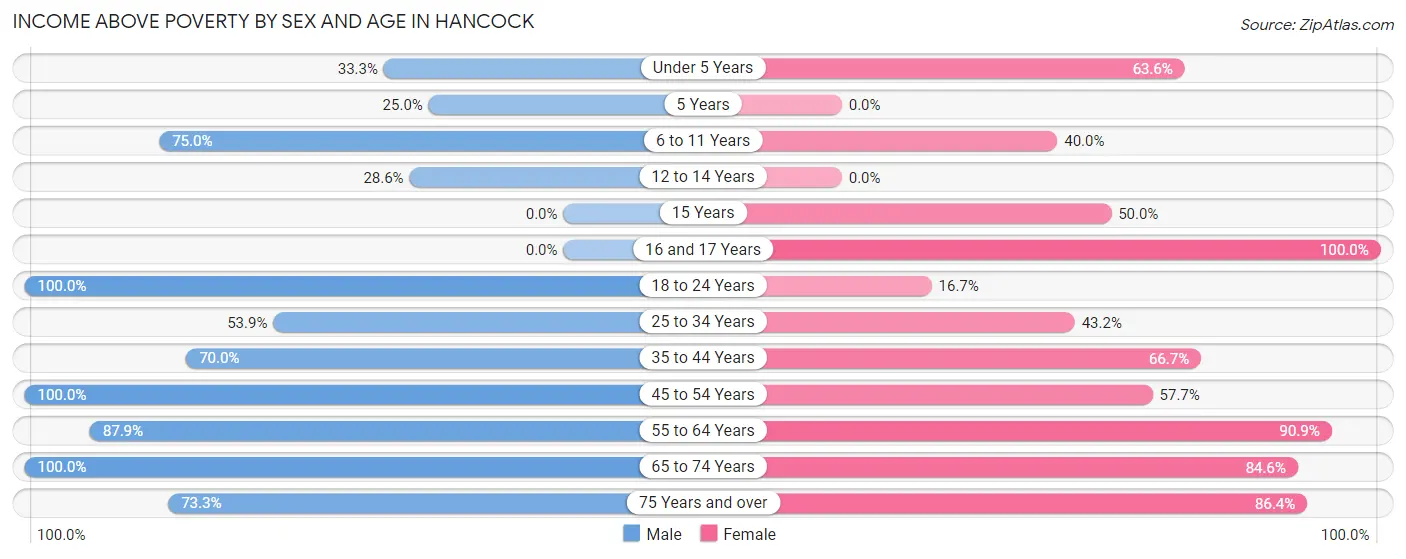
| Age Bracket | Male | Female |
| Under 5 Years | 3 (33.3%) | 7 (63.6%) |
| 5 Years | 1 (25.0%) | 0 (0.0%) |
| 6 to 11 Years | 15 (75.0%) | 8 (40.0%) |
| 12 to 14 Years | 4 (28.6%) | 0 (0.0%) |
| 15 Years | 0 (0.0%) | 1 (50.0%) |
| 16 and 17 Years | 0 (0.0%) | 4 (100.0%) |
| 18 to 24 Years | 10 (100.0%) | 2 (16.7%) |
| 25 to 34 Years | 7 (53.8%) | 16 (43.2%) |
| 35 to 44 Years | 21 (70.0%) | 8 (66.7%) |
| 45 to 54 Years | 11 (100.0%) | 15 (57.7%) |
| 55 to 64 Years | 29 (87.9%) | 30 (90.9%) |
| 65 to 74 Years | 53 (100.0%) | 11 (84.6%) |
| 75 Years and over | 11 (73.3%) | 19 (86.4%) |
| Total | 165 (76.4%) | 121 (62.7%) |
Income Below Poverty Among Married-Couple Families in Hancock
The poverty statistics for married-couple families in Hancock show that 16.9% or 12 of the total 71 families live below the poverty line. Families with 3 or 4 children have the highest poverty rate of 80.0%, comprising of 12 families. On the other hand, families with no children have the lowest poverty rate of 0.0%, which includes 0 families.
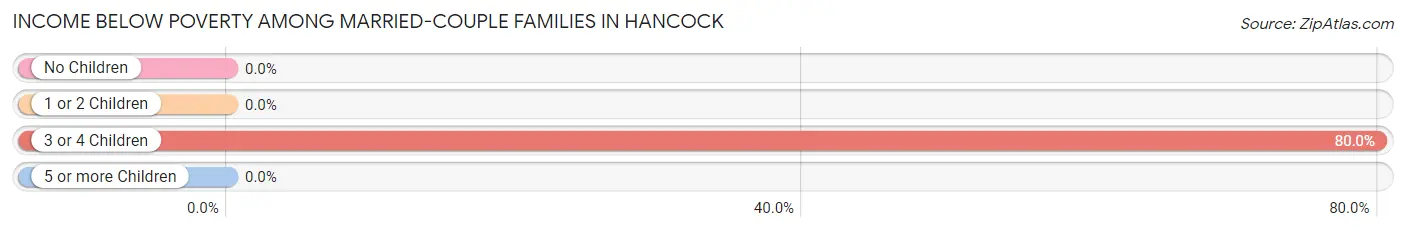
| Children | Above Poverty | Below Poverty |
| No Children | 47 (100.0%) | 0 (0.0%) |
| 1 or 2 Children | 9 (100.0%) | 0 (0.0%) |
| 3 or 4 Children | 3 (20.0%) | 12 (80.0%) |
| 5 or more Children | 0 (0.0%) | 0 (0.0%) |
| Total | 59 (83.1%) | 12 (16.9%) |
Income Below Poverty Among Single-Parent Households in Hancock
According to the poverty data in Hancock, 13.3% or 2 single-father households and 66.7% or 12 single-mother households are living below the poverty line. Among single-father households, those with 1 or 2 children have the highest poverty rate, with 2 households (28.6%) experiencing poverty. Likewise, among single-mother households, those with 3 or 4 children have the highest poverty rate, with 4 households (100.0%) falling below the poverty line.
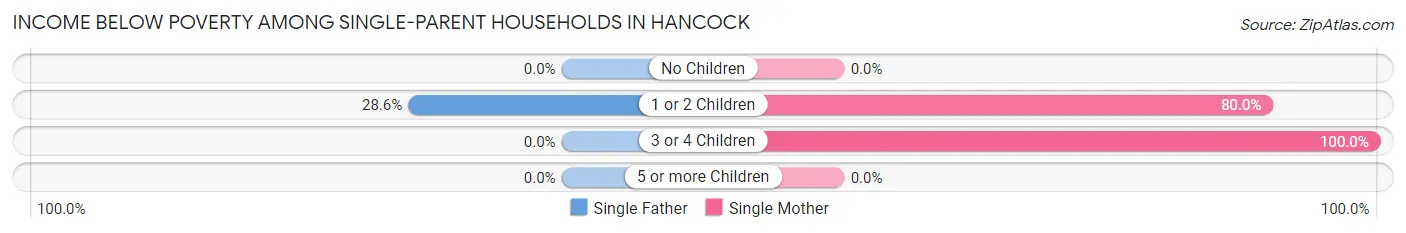
| Children | Single Father | Single Mother |
| No Children | 0 (0.0%) | 0 (0.0%) |
| 1 or 2 Children | 2 (28.6%) | 8 (80.0%) |
| 3 or 4 Children | 0 (0.0%) | 4 (100.0%) |
| 5 or more Children | 0 (0.0%) | 0 (0.0%) |
| Total | 2 (13.3%) | 12 (66.7%) |
Income Below Poverty Among Married-Couple vs Single-Parent Households in Hancock
The poverty data for Hancock shows that 12 of the married-couple family households (16.9%) and 14 of the single-parent households (42.4%) are living below the poverty level. Within the married-couple family households, those with 3 or 4 children have the highest poverty rate, with 12 households (80.0%) falling below the poverty line. Among the single-parent households, those with 1 or 2 children have the highest poverty rate, with 10 household (58.8%) living below poverty.
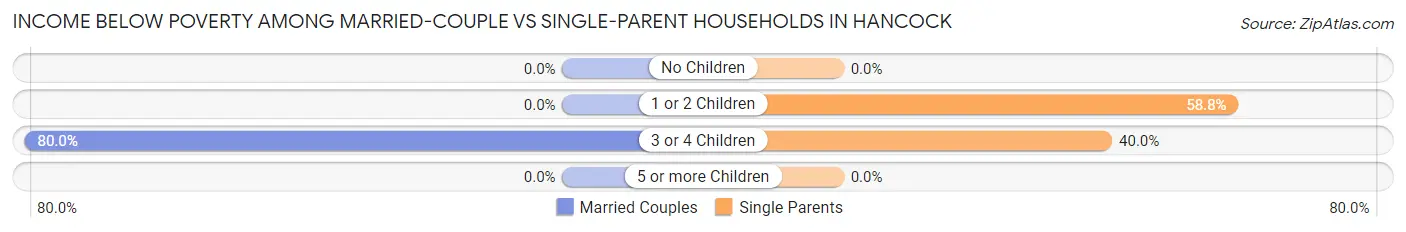
| Children | Married-Couple Families | Single-Parent Households |
| No Children | 0 (0.0%) | 0 (0.0%) |
| 1 or 2 Children | 0 (0.0%) | 10 (58.8%) |
| 3 or 4 Children | 12 (80.0%) | 4 (40.0%) |
| 5 or more Children | 0 (0.0%) | 0 (0.0%) |
| Total | 12 (16.9%) | 14 (42.4%) |
Race in Hancock
The most populous races in Hancock are White / Caucasian (373 | 90.3%), Hispanic or Latino (72 | 17.4%), and Two or more Races (21 | 5.1%).
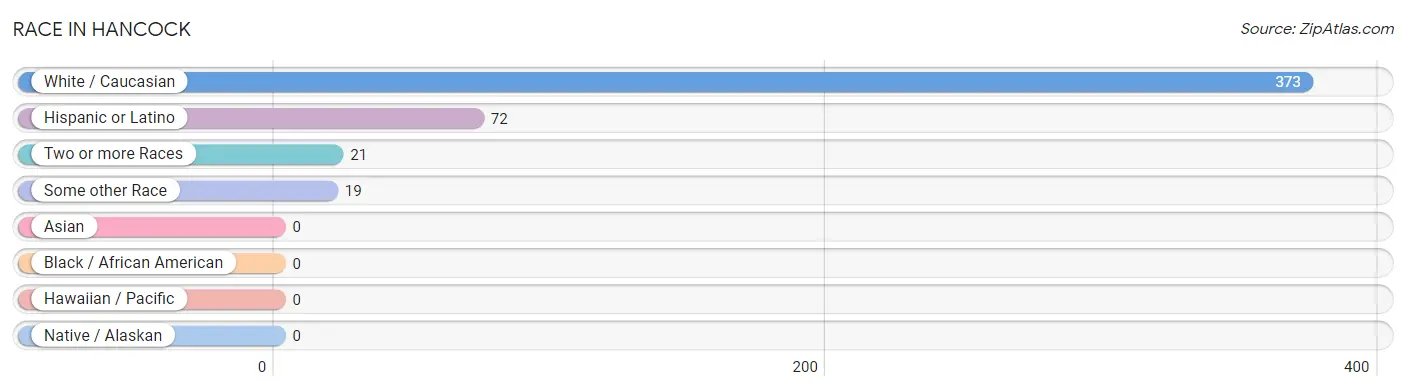
| Race | # Population | % Population |
| Asian | 0 | 0.0% |
| Black / African American | 0 | 0.0% |
| Hawaiian / Pacific | 0 | 0.0% |
| Hispanic or Latino | 72 | 17.4% |
| Native / Alaskan | 0 | 0.0% |
| White / Caucasian | 373 | 90.3% |
| Two or more Races | 21 | 5.1% |
| Some other Race | 19 | 4.6% |
| Total | 413 | 100.0% |
Ancestry in Hancock
The most populous ancestries reported in Hancock are German (209 | 50.6%), Mexican (49 | 11.9%), American (37 | 9.0%), Polish (36 | 8.7%), and Irish (32 | 7.7%), together accounting for 87.9% of all Hancock residents.
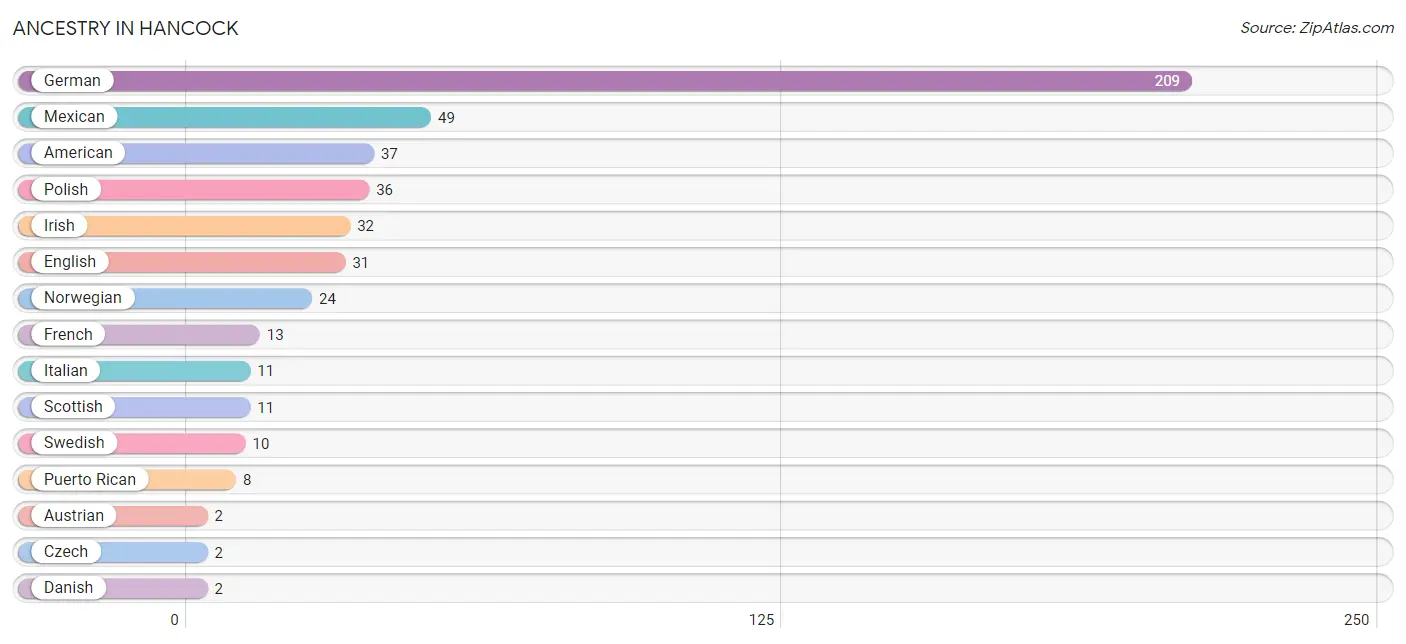
| Ancestry | # Population | % Population |
| American | 37 | 9.0% |
| Austrian | 2 | 0.5% |
| Cuban | 1 | 0.2% |
| Czech | 2 | 0.5% |
| Czechoslovakian | 1 | 0.2% |
| Danish | 2 | 0.5% |
| Dutch | 1 | 0.2% |
| English | 31 | 7.5% |
| French | 13 | 3.2% |
| French Canadian | 2 | 0.5% |
| German | 209 | 50.6% |
| Irish | 32 | 7.7% |
| Italian | 11 | 2.7% |
| Lithuanian | 2 | 0.5% |
| Mexican | 49 | 11.9% |
| Norwegian | 24 | 5.8% |
| Polish | 36 | 8.7% |
| Puerto Rican | 8 | 1.9% |
| Scottish | 11 | 2.7% |
| Swedish | 10 | 2.4% | View All 20 Rows |
Immigrants in Hancock
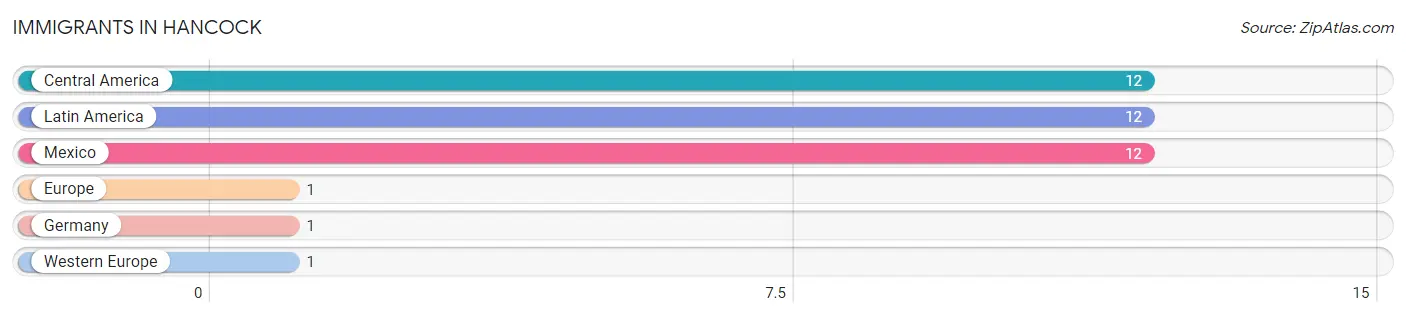
The most numerous immigrant groups reported in Hancock came from Central America (12 | 2.9%), Latin America (12 | 2.9%), Mexico (12 | 2.9%), Europe (1 | 0.2%), and Germany (1 | 0.2%), together accounting for 9.2% of all Hancock residents.
| Immigration Origin | # Population | % Population |
| Central America | 12 | 2.9% |
| Europe | 1 | 0.2% |
| Germany | 1 | 0.2% |
| Latin America | 12 | 2.9% |
| Mexico | 12 | 2.9% |
| Western Europe | 1 | 0.2% | View All 6 Rows |
Sex and Age in Hancock
Sex and Age in Hancock
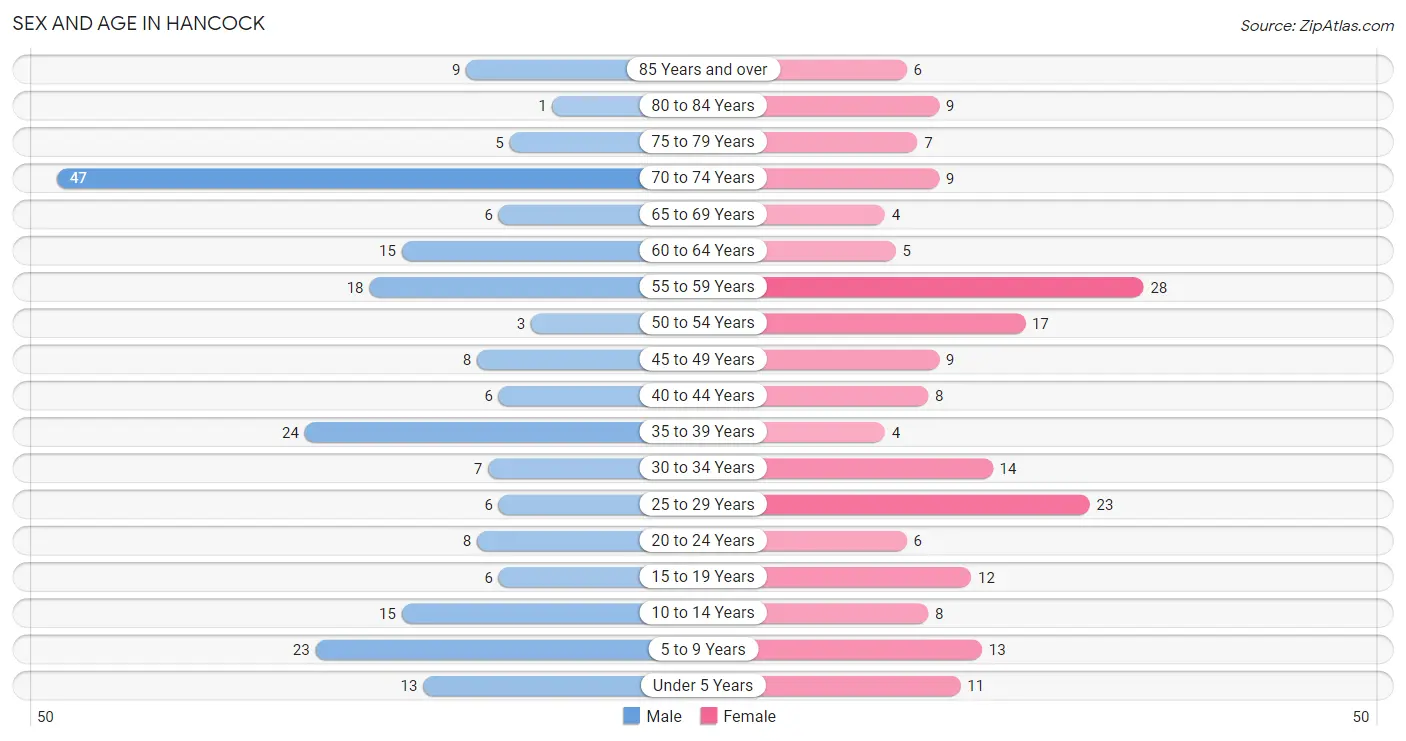
The most populous age groups in Hancock are 70 to 74 Years (47 | 21.4%) for men and 55 to 59 Years (28 | 14.5%) for women.
| Age Bracket | Male | Female |
| Under 5 Years | 13 (5.9%) | 11 (5.7%) |
| 5 to 9 Years | 23 (10.4%) | 13 (6.7%) |
| 10 to 14 Years | 15 (6.8%) | 8 (4.2%) |
| 15 to 19 Years | 6 (2.7%) | 12 (6.2%) |
| 20 to 24 Years | 8 (3.6%) | 6 (3.1%) |
| 25 to 29 Years | 6 (2.7%) | 23 (11.9%) |
| 30 to 34 Years | 7 (3.2%) | 14 (7.2%) |
| 35 to 39 Years | 24 (10.9%) | 4 (2.1%) |
| 40 to 44 Years | 6 (2.7%) | 8 (4.2%) |
| 45 to 49 Years | 8 (3.6%) | 9 (4.7%) |
| 50 to 54 Years | 3 (1.4%) | 17 (8.8%) |
| 55 to 59 Years | 18 (8.2%) | 28 (14.5%) |
| 60 to 64 Years | 15 (6.8%) | 5 (2.6%) |
| 65 to 69 Years | 6 (2.7%) | 4 (2.1%) |
| 70 to 74 Years | 47 (21.4%) | 9 (4.7%) |
| 75 to 79 Years | 5 (2.3%) | 7 (3.6%) |
| 80 to 84 Years | 1 (0.4%) | 9 (4.7%) |
| 85 Years and over | 9 (4.1%) | 6 (3.1%) |
| Total | 220 (100.0%) | 193 (100.0%) |
Families and Households in Hancock
Median Family Size in Hancock
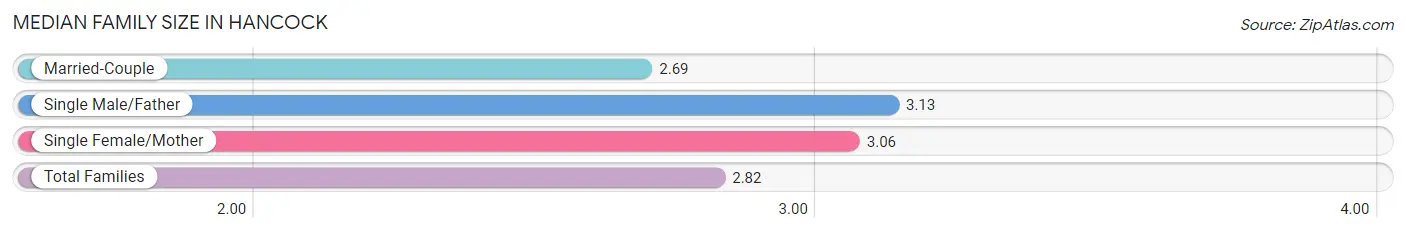
The median family size in Hancock is 2.82 persons per family, with single male/father families (15 | 14.4%) accounting for the largest median family size of 3.13 persons per family. On the other hand, married-couple families (71 | 68.3%) represent the smallest median family size with 2.69 persons per family.
| Family Type | # Families | Family Size |
| Married-Couple | 71 (68.3%) | 2.69 |
| Single Male/Father | 15 (14.4%) | 3.13 |
| Single Female/Mother | 18 (17.3%) | 3.06 |
| Total Families | 104 (100.0%) | 2.82 |
Median Household Size in Hancock
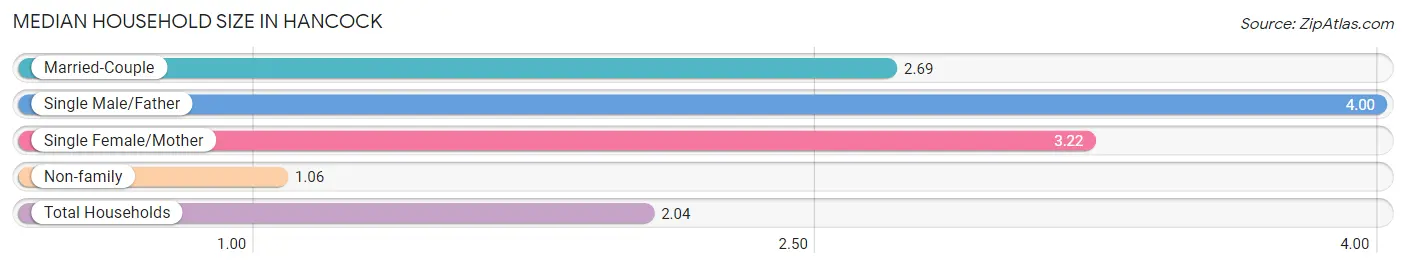
The median household size in Hancock is 2.04 persons per household, with single male/father households (15 | 7.4%) accounting for the largest median household size of 4 persons per household. non-family households (98 | 48.5%) represent the smallest median household size with 1.06 persons per household.
| Household Type | # Households | Household Size |
| Married-Couple | 71 (35.1%) | 2.69 |
| Single Male/Father | 15 (7.4%) | 4.00 |
| Single Female/Mother | 18 (8.9%) | 3.22 |
| Non-family | 98 (48.5%) | 1.06 |
| Total Households | 202 (100.0%) | 2.04 |
Household Size by Marriage Status in Hancock
Out of a total of 202 households in Hancock, 104 (51.5%) are family households, while 98 (48.5%) are nonfamily households. The most numerous type of family households are 2-person households, comprising 49, and the most common type of nonfamily households are 1-person households, comprising 91.
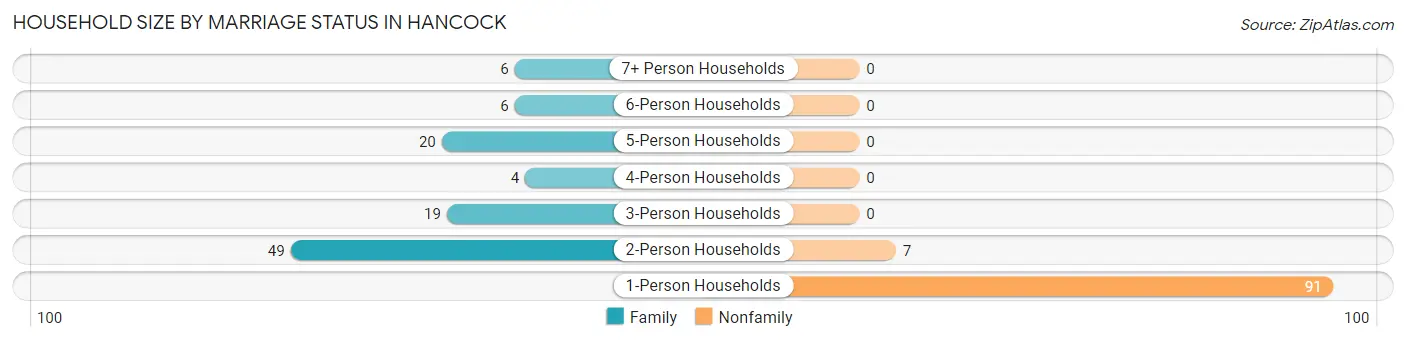
| Household Size | Family Households | Nonfamily Households |
| 1-Person Households | - | 91 (45.1%) |
| 2-Person Households | 49 (24.3%) | 7 (3.5%) |
| 3-Person Households | 19 (9.4%) | 0 (0.0%) |
| 4-Person Households | 4 (2.0%) | 0 (0.0%) |
| 5-Person Households | 20 (9.9%) | 0 (0.0%) |
| 6-Person Households | 6 (3.0%) | 0 (0.0%) |
| 7+ Person Households | 6 (3.0%) | 0 (0.0%) |
| Total | 104 (51.5%) | 98 (48.5%) |
Female Fertility in Hancock
Fertility by Age in Hancock
Average fertility rate in Hancock is 66.0 births per 1,000 women. Women in the age bracket of 20 to 34 years have the highest fertility rate with 116.0 births per 1,000 women. Women in the age bracket of 20 to 34 years acount for 100.0% of all women with births.
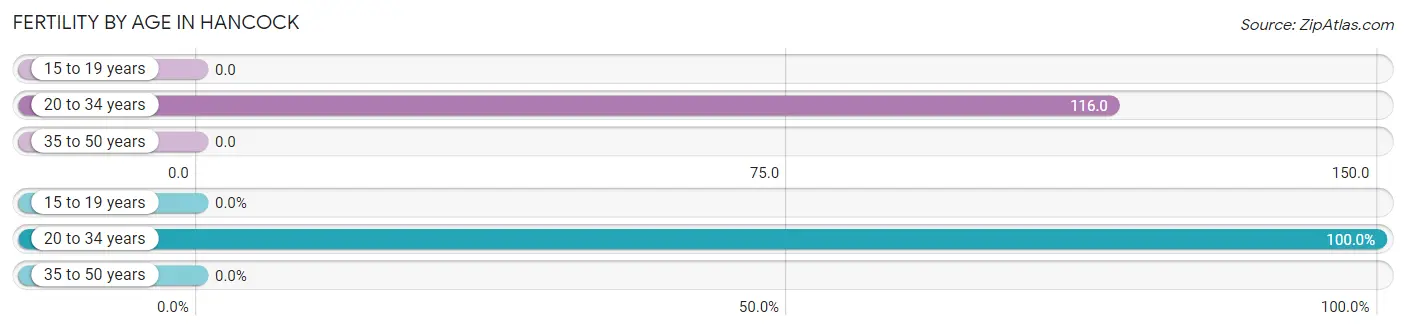
| Age Bracket | Women with Births | Births / 1,000 Women |
| 15 to 19 years | 0 (0.0%) | 0.0 |
| 20 to 34 years | 5 (100.0%) | 116.0 |
| 35 to 50 years | 0 (0.0%) | 0.0 |
| Total | 5 (100.0%) | 66.0 |
Fertility by Age by Marriage Status in Hancock
40.0% of women with births (5) in Hancock are married. The highest percentage of unmarried women with births falls into 20 to 34 years age bracket with 60.0% of them unmarried at the time of birth, while the lowest percentage of unmarried women with births belong to 20 to 34 years age bracket with 60.0% of them unmarried.
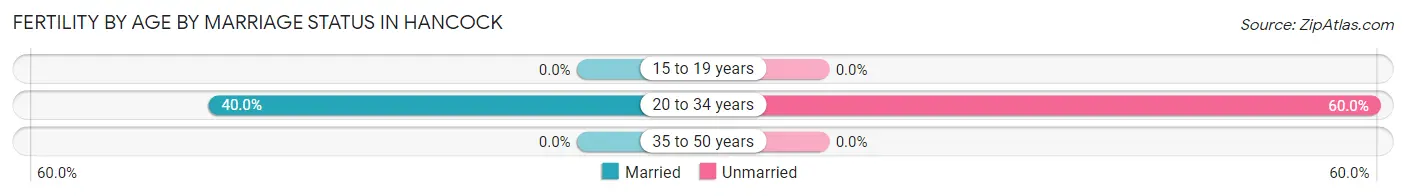
| Age Bracket | Married | Unmarried |
| 15 to 19 years | 0 (0.0%) | 0 (0.0%) |
| 20 to 34 years | 2 (40.0%) | 3 (60.0%) |
| 35 to 50 years | 0 (0.0%) | 0 (0.0%) |
| Total | 2 (40.0%) | 3 (60.0%) |
Fertility by Education in Hancock
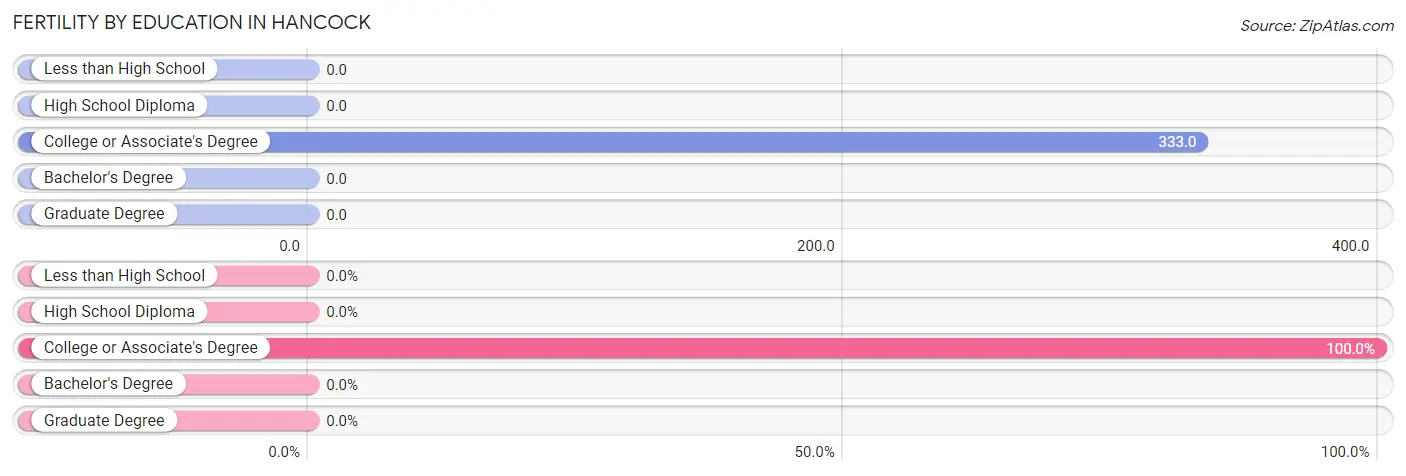
| Educational Attainment | Women with Births | Births / 1,000 Women |
| Less than High School | 0 (0.0%) | 0.0 |
| High School Diploma | 0 (0.0%) | 0.0 |
| College or Associate's Degree | 5 (100.0%) | 333.0 |
| Bachelor's Degree | 0 (0.0%) | 0.0 |
| Graduate Degree | 0 (0.0%) | 0.0 |
| Total | 5 (100.0%) | 66.0 |
Fertility by Education by Marriage Status in Hancock
60.0% of women with births in Hancock are unmarried. Women with the educational attainment of college or associate's degree are most likely to be married with 40.0% of them married at childbirth, while women with the educational attainment of college or associate's degree are least likely to be married with 60.0% of them unmarried at childbirth.
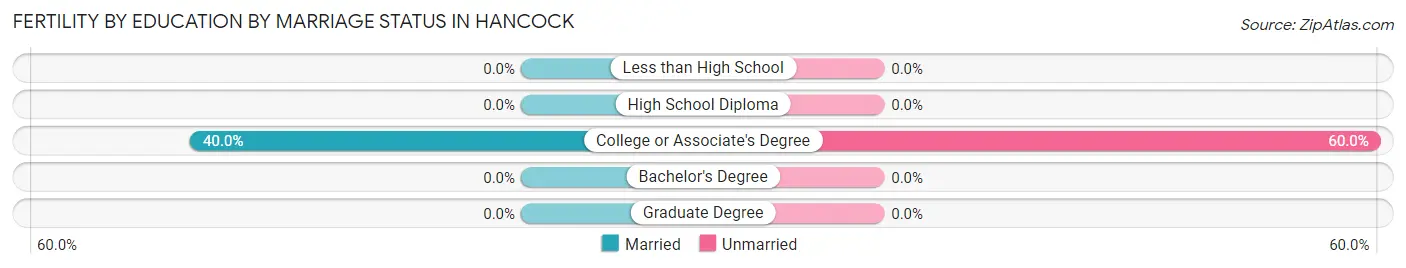
| Educational Attainment | Married | Unmarried |
| Less than High School | 0 (0.0%) | 0 (0.0%) |
| High School Diploma | 0 (0.0%) | 0 (0.0%) |
| College or Associate's Degree | 2 (40.0%) | 3 (60.0%) |
| Bachelor's Degree | 0 (0.0%) | 0 (0.0%) |
| Graduate Degree | 0 (0.0%) | 0 (0.0%) |
| Total | 2 (40.0%) | 3 (60.0%) |
Employment Characteristics in Hancock
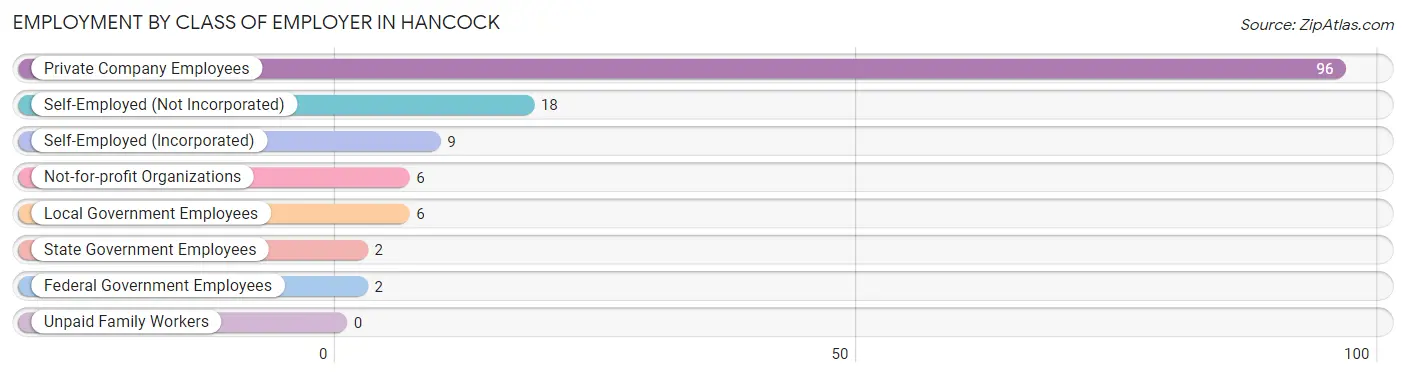
Employment by Class of Employer in Hancock
Among the 139 employed individuals in Hancock, private company employees (96 | 69.1%), self-employed (not incorporated) (18 | 13.0%), and self-employed (incorporated) (9 | 6.5%) make up the most common classes of employment.
| Employer Class | # Employees | % Employees |
| Private Company Employees | 96 | 69.1% |
| Self-Employed (Incorporated) | 9 | 6.5% |
| Self-Employed (Not Incorporated) | 18 | 13.0% |
| Not-for-profit Organizations | 6 | 4.3% |
| Local Government Employees | 6 | 4.3% |
| State Government Employees | 2 | 1.4% |
| Federal Government Employees | 2 | 1.4% |
| Unpaid Family Workers | 0 | 0.0% |
| Total | 139 | 100.0% |
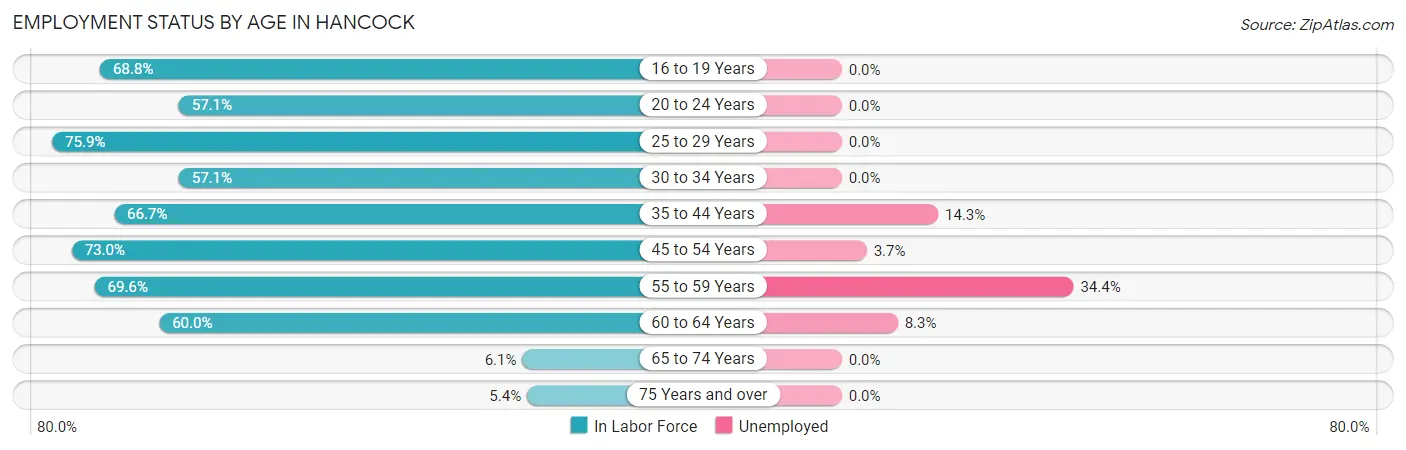
Employment Status by Age in Hancock
According to the labor force statistics for Hancock, out of the total population over 16 years of age (328), 48.2% or 158 individuals are in the labor force, with 10.8% or 17 of them unemployed. The age group with the highest labor force participation rate is 25 to 29 years, with 75.9% or 22 individuals in the labor force. Within the labor force, the 55 to 59 years age range has the highest percentage of unemployed individuals, with 34.4% or 11 of them being unemployed.
| Age Bracket | In Labor Force | Unemployed |
| 16 to 19 Years | 11 (68.8%) | 0 (0.0%) |
| 20 to 24 Years | 8 (57.1%) | 0 (0.0%) |
| 25 to 29 Years | 22 (75.9%) | 0 (0.0%) |
| 30 to 34 Years | 12 (57.1%) | 0 (0.0%) |
| 35 to 44 Years | 28 (66.7%) | 4 (14.3%) |
| 45 to 54 Years | 27 (73.0%) | 1 (3.7%) |
| 55 to 59 Years | 32 (69.6%) | 11 (34.4%) |
| 60 to 64 Years | 12 (60.0%) | 1 (8.3%) |
| 65 to 74 Years | 4 (6.1%) | 0 (0.0%) |
| 75 Years and over | 2 (5.4%) | 0 (0.0%) |
| Total | 158 (48.2%) | 17 (10.8%) |
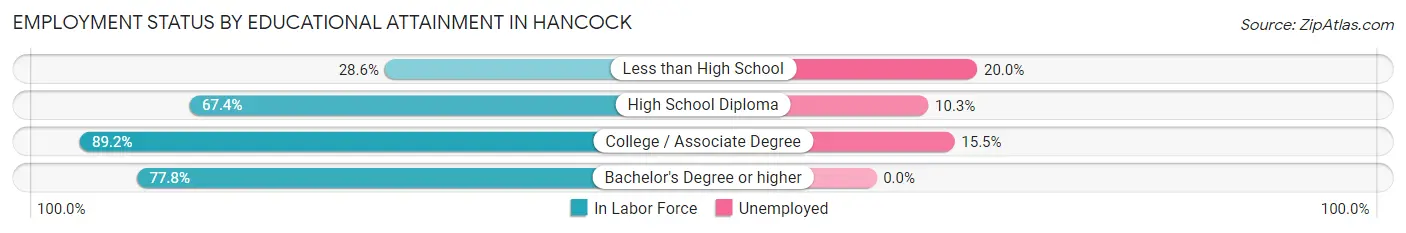
Employment Status by Educational Attainment in Hancock
According to labor force statistics for Hancock, 68.2% of individuals (133) out of the total population between 25 and 64 years of age (195) are in the labor force, with 12.8% or 17 of them being unemployed. The group with the highest labor force participation rate are those with the educational attainment of college / associate degree, with 89.2% or 58 individuals in the labor force. Within the labor force, individuals with less than high school education have the highest percentage of unemployment, with 20.0% or 2 of them being unemployed.
| Educational Attainment | In Labor Force | Unemployed |
| Less than High School | 10 (28.6%) | 7 (20.0%) |
| High School Diploma | 58 (67.4%) | 9 (10.3%) |
| College / Associate Degree | 58 (89.2%) | 10 (15.5%) |
| Bachelor's Degree or higher | 7 (77.8%) | 0 (0.0%) |
| Total | 133 (68.2%) | 25 (12.8%) |
Employment Occupations by Sex in Hancock
Management, Business, Science and Arts Occupations
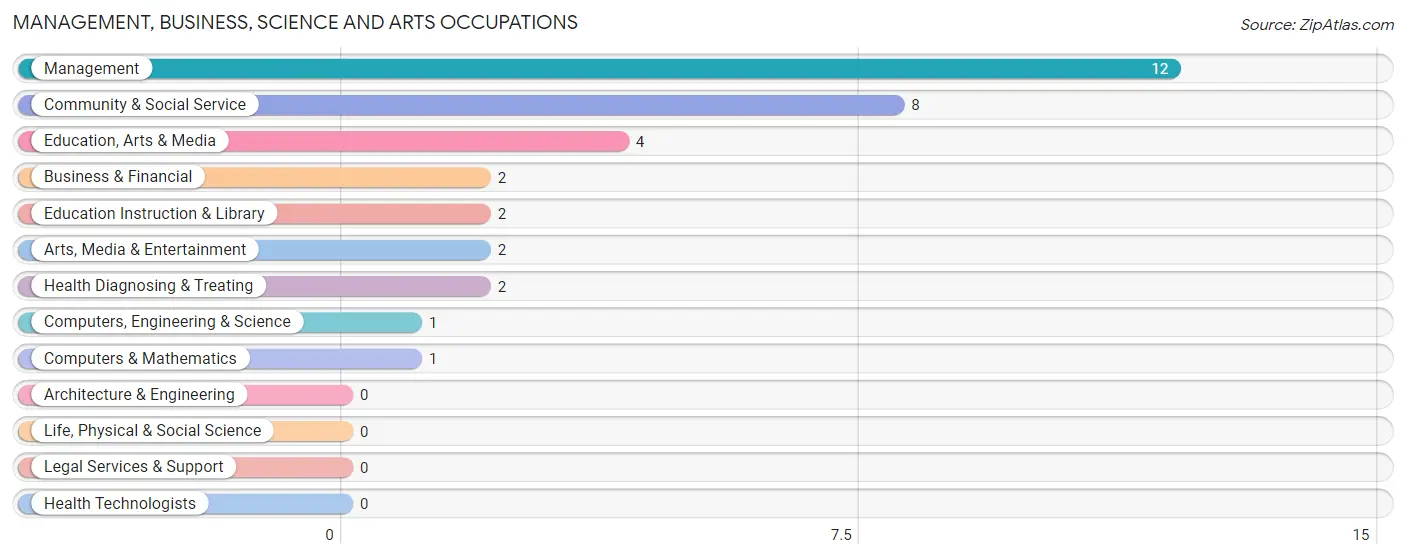
The most common Management, Business, Science and Arts occupations in Hancock are Management (12 | 8.5%), Community & Social Service (8 | 5.7%), Education, Arts & Media (4 | 2.8%), Business & Financial (2 | 1.4%), and Education Instruction & Library (2 | 1.4%).
Management, Business, Science and Arts Occupations by Sex
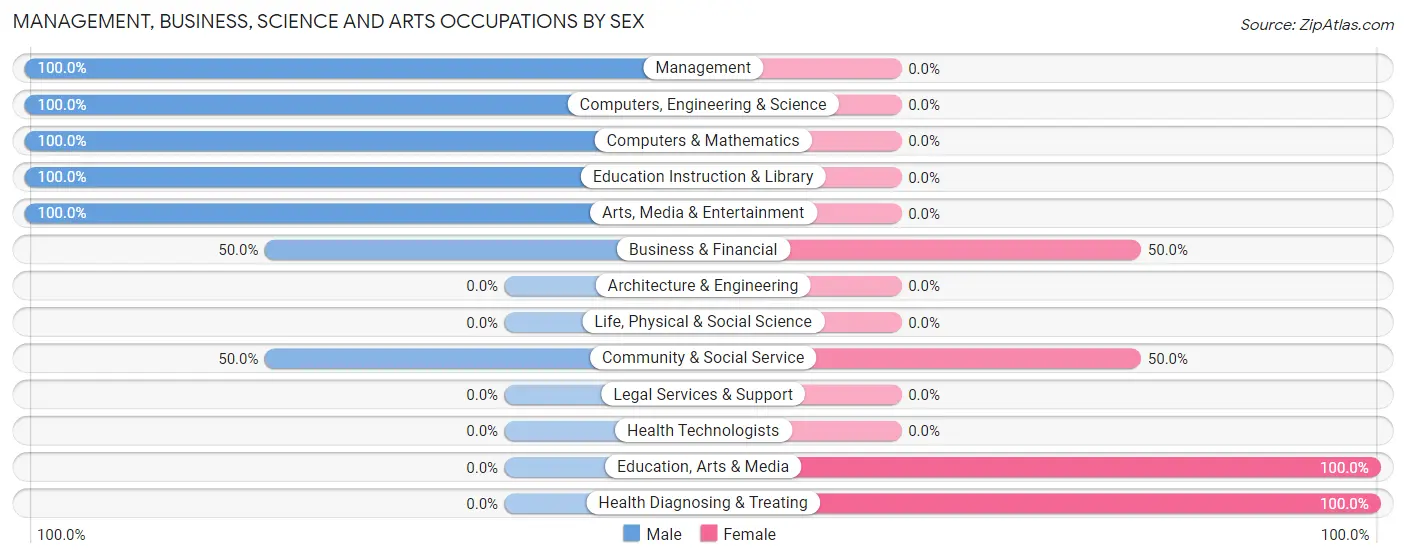
Within the Management, Business, Science and Arts occupations in Hancock, the most male-oriented occupations are Management (100.0%), Computers, Engineering & Science (100.0%), and Computers & Mathematics (100.0%), while the most female-oriented occupations are Education, Arts & Media (100.0%), Health Diagnosing & Treating (100.0%), and Business & Financial (50.0%).
| Occupation | Male | Female |
| Management | 12 (100.0%) | 0 (0.0%) |
| Business & Financial | 1 (50.0%) | 1 (50.0%) |
| Computers, Engineering & Science | 1 (100.0%) | 0 (0.0%) |
| Computers & Mathematics | 1 (100.0%) | 0 (0.0%) |
| Architecture & Engineering | 0 (0.0%) | 0 (0.0%) |
| Life, Physical & Social Science | 0 (0.0%) | 0 (0.0%) |
| Community & Social Service | 4 (50.0%) | 4 (50.0%) |
| Education, Arts & Media | 0 (0.0%) | 4 (100.0%) |
| Legal Services & Support | 0 (0.0%) | 0 (0.0%) |
| Education Instruction & Library | 2 (100.0%) | 0 (0.0%) |
| Arts, Media & Entertainment | 2 (100.0%) | 0 (0.0%) |
| Health Diagnosing & Treating | 0 (0.0%) | 2 (100.0%) |
| Health Technologists | 0 (0.0%) | 0 (0.0%) |
| Total (Category) | 18 (72.0%) | 7 (28.0%) |
| Total (Overall) | 74 (52.5%) | 67 (47.5%) |
Services Occupations
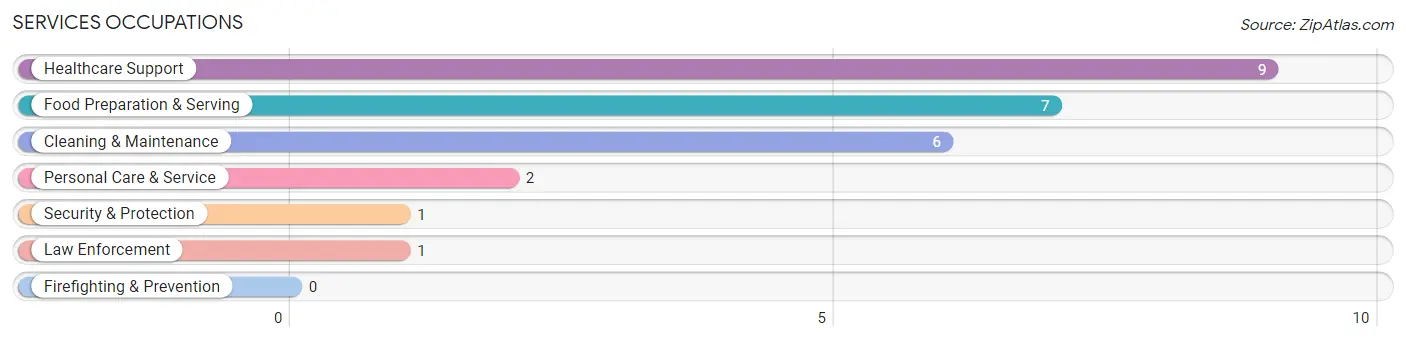
The most common Services occupations in Hancock are Healthcare Support (9 | 6.4%), Food Preparation & Serving (7 | 5.0%), Cleaning & Maintenance (6 | 4.3%), Personal Care & Service (2 | 1.4%), and Security & Protection (1 | 0.7%).
Services Occupations by Sex
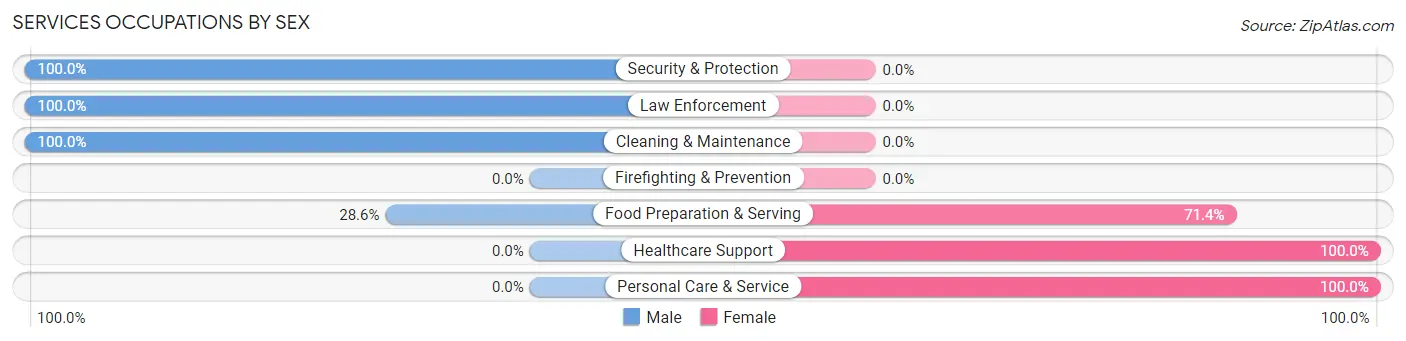
Within the Services occupations in Hancock, the most male-oriented occupations are Security & Protection (100.0%), Law Enforcement (100.0%), and Cleaning & Maintenance (100.0%), while the most female-oriented occupations are Healthcare Support (100.0%), Personal Care & Service (100.0%), and Food Preparation & Serving (71.4%).
| Occupation | Male | Female |
| Healthcare Support | 0 (0.0%) | 9 (100.0%) |
| Security & Protection | 1 (100.0%) | 0 (0.0%) |
| Firefighting & Prevention | 0 (0.0%) | 0 (0.0%) |
| Law Enforcement | 1 (100.0%) | 0 (0.0%) |
| Food Preparation & Serving | 2 (28.6%) | 5 (71.4%) |
| Cleaning & Maintenance | 6 (100.0%) | 0 (0.0%) |
| Personal Care & Service | 0 (0.0%) | 2 (100.0%) |
| Total (Category) | 9 (36.0%) | 16 (64.0%) |
| Total (Overall) | 74 (52.5%) | 67 (47.5%) |
Sales and Office Occupations
The most common Sales and Office occupations in Hancock are Office & Administration (27 | 19.2%), and Sales & Related (17 | 12.1%).
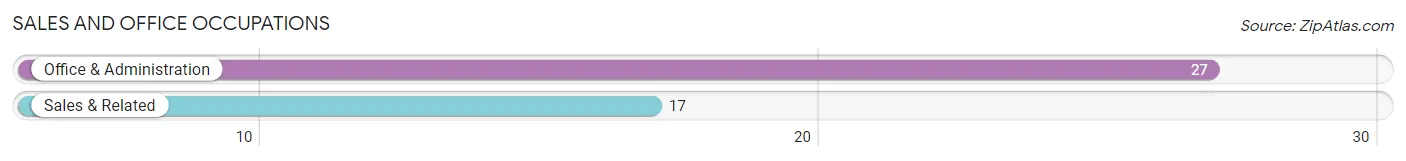
Sales and Office Occupations by Sex
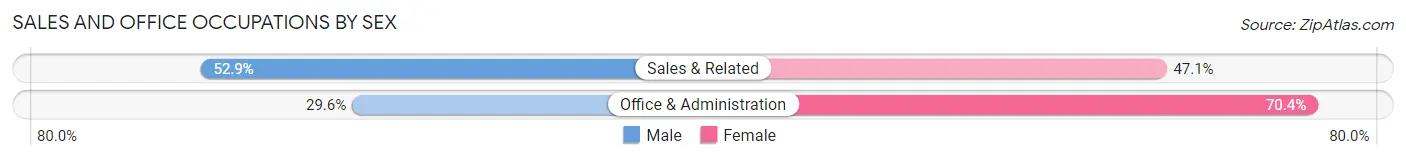
| Occupation | Male | Female |
| Sales & Related | 9 (52.9%) | 8 (47.1%) |
| Office & Administration | 8 (29.6%) | 19 (70.4%) |
| Total (Category) | 17 (38.6%) | 27 (61.4%) |
| Total (Overall) | 74 (52.5%) | 67 (47.5%) |
Natural Resources, Construction and Maintenance Occupations
The most common Natural Resources, Construction and Maintenance occupations in Hancock are Farming, Fishing & Forestry (17 | 12.1%), Construction & Extraction (4 | 2.8%), and Installation, Maintenance & Repair (4 | 2.8%).
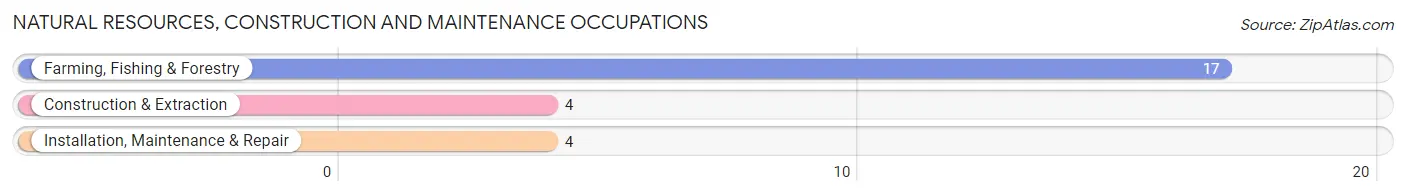
Natural Resources, Construction and Maintenance Occupations by Sex
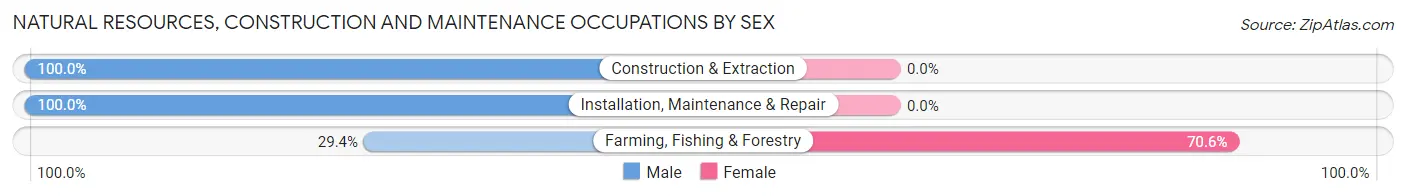
| Occupation | Male | Female |
| Farming, Fishing & Forestry | 5 (29.4%) | 12 (70.6%) |
| Construction & Extraction | 4 (100.0%) | 0 (0.0%) |
| Installation, Maintenance & Repair | 4 (100.0%) | 0 (0.0%) |
| Total (Category) | 13 (52.0%) | 12 (48.0%) |
| Total (Overall) | 74 (52.5%) | 67 (47.5%) |
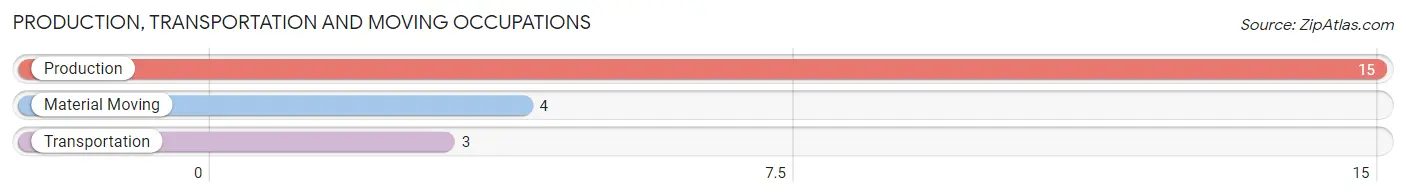
Production, Transportation and Moving Occupations
The most common Production, Transportation and Moving occupations in Hancock are Production (15 | 10.6%), Material Moving (4 | 2.8%), and Transportation (3 | 2.1%).
Production, Transportation and Moving Occupations by Sex
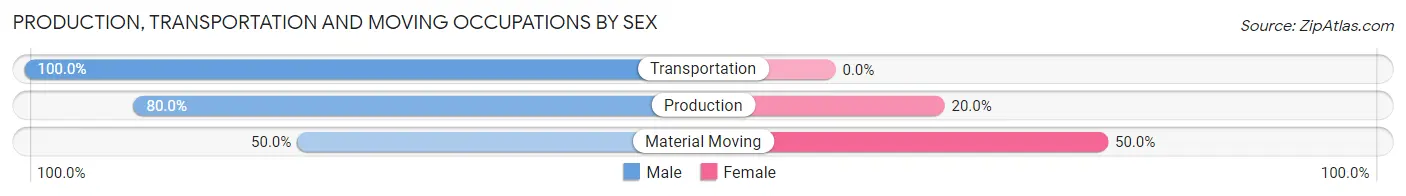
| Occupation | Male | Female |
| Production | 12 (80.0%) | 3 (20.0%) |
| Transportation | 3 (100.0%) | 0 (0.0%) |
| Material Moving | 2 (50.0%) | 2 (50.0%) |
| Total (Category) | 17 (77.3%) | 5 (22.7%) |
| Total (Overall) | 74 (52.5%) | 67 (47.5%) |
Employment Industries by Sex in Hancock
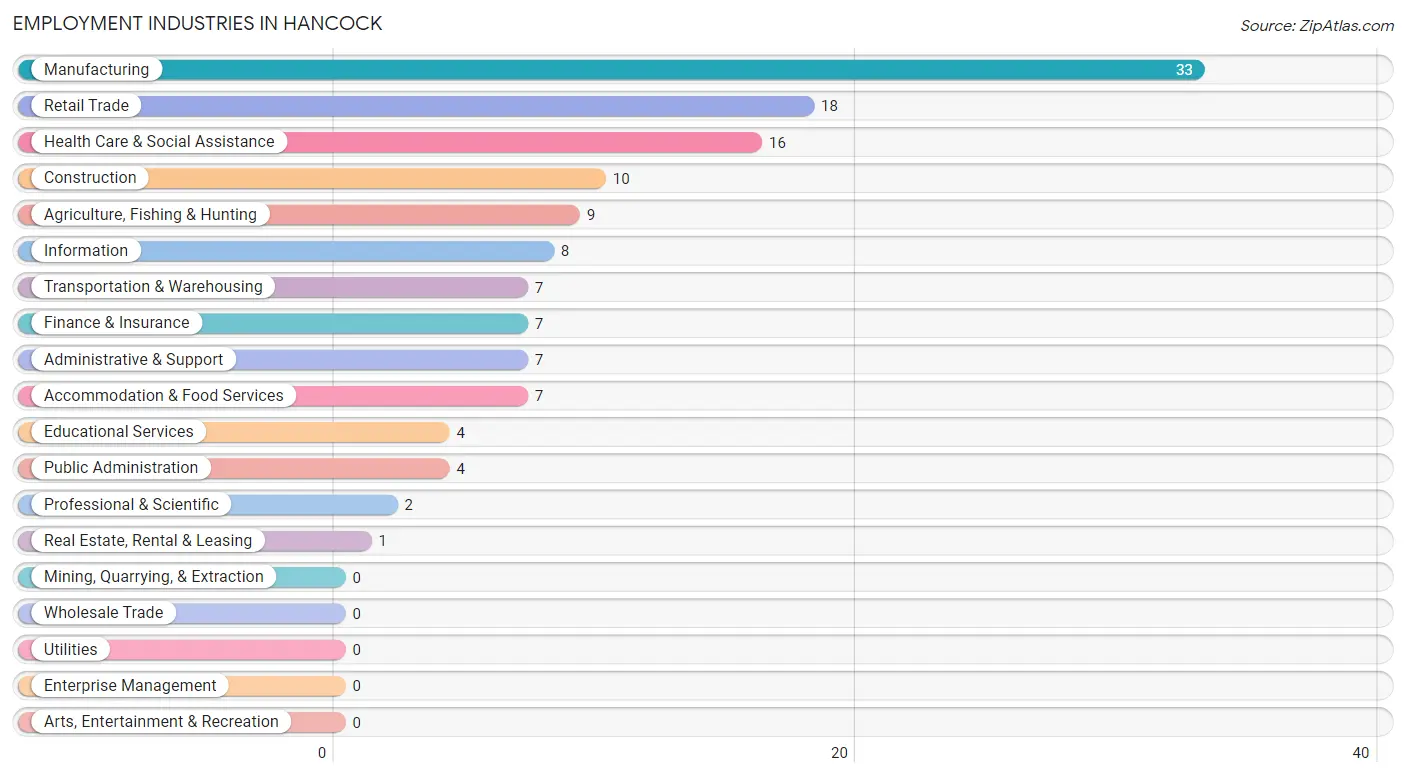
Employment Industries in Hancock
The major employment industries in Hancock include Manufacturing (33 | 23.4%), Retail Trade (18 | 12.8%), Health Care & Social Assistance (16 | 11.4%), Construction (10 | 7.1%), and Agriculture, Fishing & Hunting (9 | 6.4%).
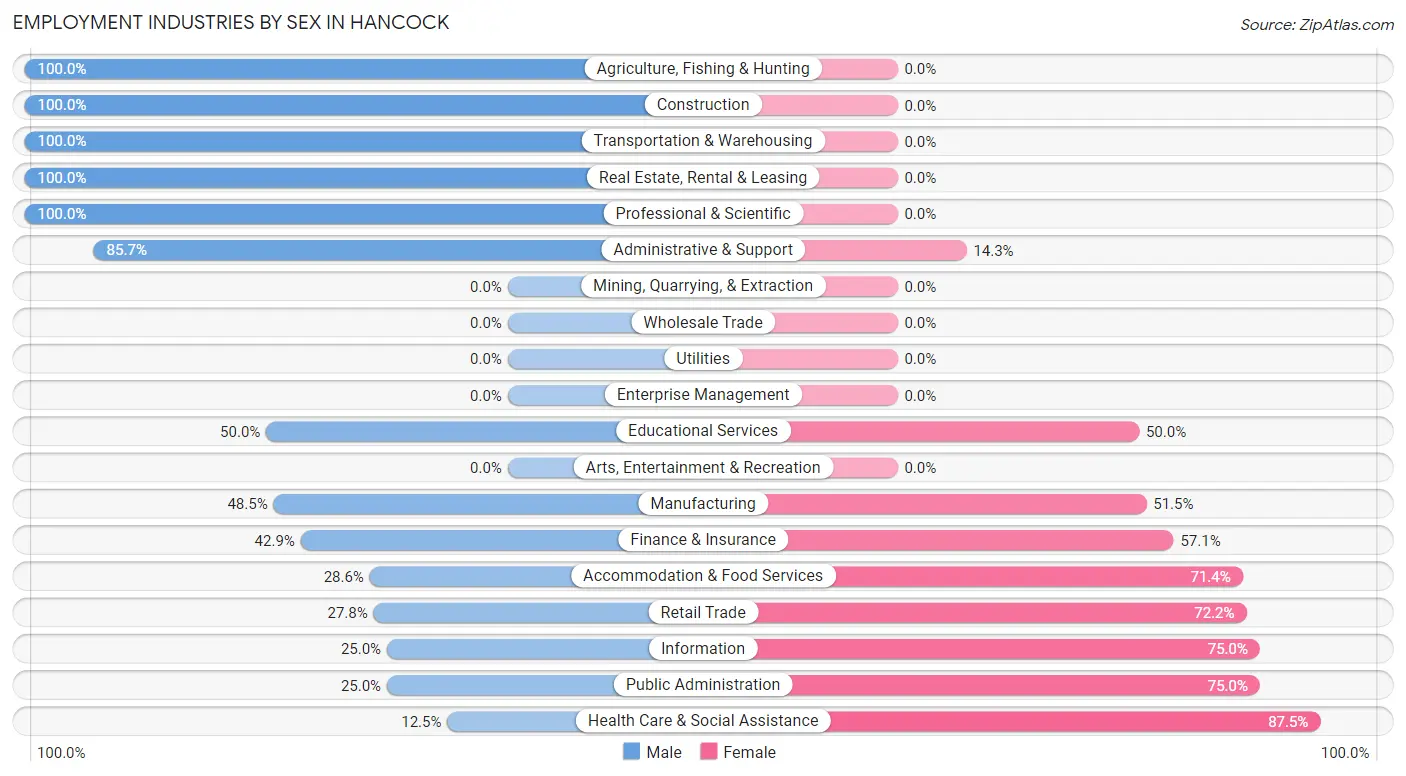
Employment Industries by Sex in Hancock
The Hancock industries that see more men than women are Agriculture, Fishing & Hunting (100.0%), Construction (100.0%), and Transportation & Warehousing (100.0%), whereas the industries that tend to have a higher number of women are Health Care & Social Assistance (87.5%), Information (75.0%), and Public Administration (75.0%).
| Industry | Male | Female |
| Agriculture, Fishing & Hunting | 9 (100.0%) | 0 (0.0%) |
| Mining, Quarrying, & Extraction | 0 (0.0%) | 0 (0.0%) |
| Construction | 10 (100.0%) | 0 (0.0%) |
| Manufacturing | 16 (48.5%) | 17 (51.5%) |
| Wholesale Trade | 0 (0.0%) | 0 (0.0%) |
| Retail Trade | 5 (27.8%) | 13 (72.2%) |
| Transportation & Warehousing | 7 (100.0%) | 0 (0.0%) |
| Utilities | 0 (0.0%) | 0 (0.0%) |
| Information | 2 (25.0%) | 6 (75.0%) |
| Finance & Insurance | 3 (42.9%) | 4 (57.1%) |
| Real Estate, Rental & Leasing | 1 (100.0%) | 0 (0.0%) |
| Professional & Scientific | 2 (100.0%) | 0 (0.0%) |
| Enterprise Management | 0 (0.0%) | 0 (0.0%) |
| Administrative & Support | 6 (85.7%) | 1 (14.3%) |
| Educational Services | 2 (50.0%) | 2 (50.0%) |
| Health Care & Social Assistance | 2 (12.5%) | 14 (87.5%) |
| Arts, Entertainment & Recreation | 0 (0.0%) | 0 (0.0%) |
| Accommodation & Food Services | 2 (28.6%) | 5 (71.4%) |
| Public Administration | 1 (25.0%) | 3 (75.0%) |
| Total | 74 (52.5%) | 67 (47.5%) |
Education in Hancock
School Enrollment in Hancock
The most common levels of schooling among the 74 students in Hancock are elementary school (25 | 33.8%), college / undergraduate (14 | 18.9%), and middle school (12 | 16.2%).
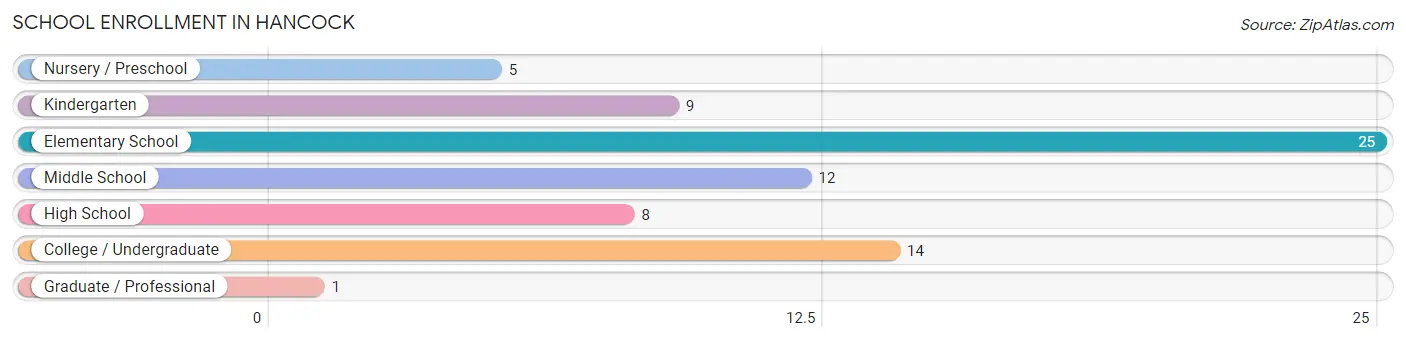
| School Level | # Students | % Students |
| Nursery / Preschool | 5 | 6.8% |
| Kindergarten | 9 | 12.2% |
| Elementary School | 25 | 33.8% |
| Middle School | 12 | 16.2% |
| High School | 8 | 10.8% |
| College / Undergraduate | 14 | 18.9% |
| Graduate / Professional | 1 | 1.3% |
| Total | 74 | 100.0% |
School Enrollment by Age by Funding Source in Hancock
Out of a total of 74 students who are enrolled in schools in Hancock, 4 (5.4%) attend a private institution, while the remaining 70 (94.6%) are enrolled in public schools. The age group of 3 to 4 year olds has the highest likelihood of being enrolled in private schools, with 2 (100.0% in the age bracket) enrolled. Conversely, the age group of 5 to 9 year old has the lowest likelihood of being enrolled in a private school, with 36 (100.0% in the age bracket) attending a public institution.
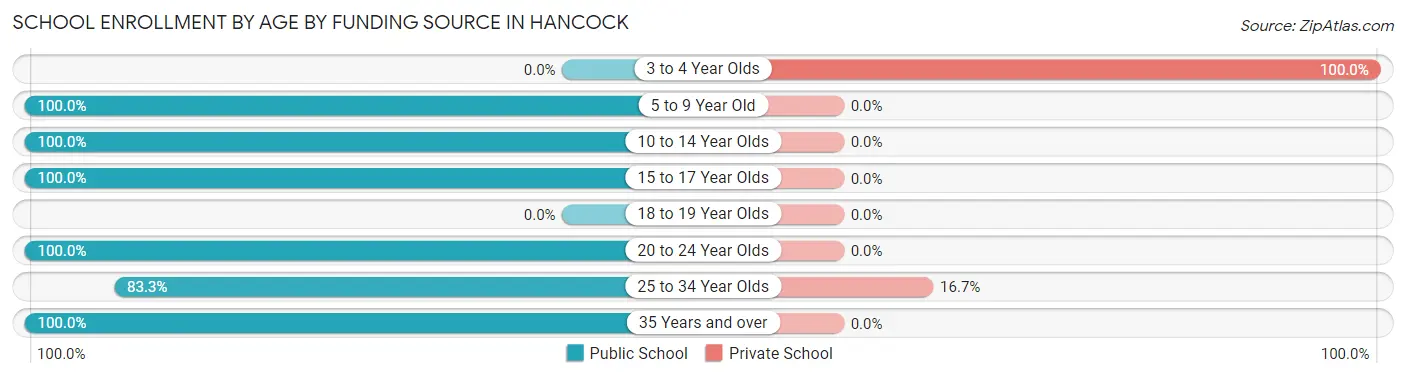
| Age Bracket | Public School | Private School |
| 3 to 4 Year Olds | 0 (0.0%) | 2 (100.0%) |
| 5 to 9 Year Old | 36 (100.0%) | 0 (0.0%) |
| 10 to 14 Year Olds | 15 (100.0%) | 0 (0.0%) |
| 15 to 17 Year Olds | 6 (100.0%) | 0 (0.0%) |
| 18 to 19 Year Olds | 0 (0.0%) | 0 (0.0%) |
| 20 to 24 Year Olds | 2 (100.0%) | 0 (0.0%) |
| 25 to 34 Year Olds | 10 (83.3%) | 2 (16.7%) |
| 35 Years and over | 1 (100.0%) | 0 (0.0%) |
| Total | 70 (94.6%) | 4 (5.4%) |
Educational Attainment by Field of Study in Hancock
Bio, nature & agricultural (4 | 20.0%), business (4 | 20.0%), computers & mathematics (3 | 15.0%), physical & health sciences (2 | 10.0%), and education (2 | 10.0%) are the most common fields of study among 20 individuals in Hancock who have obtained a bachelor's degree or higher.
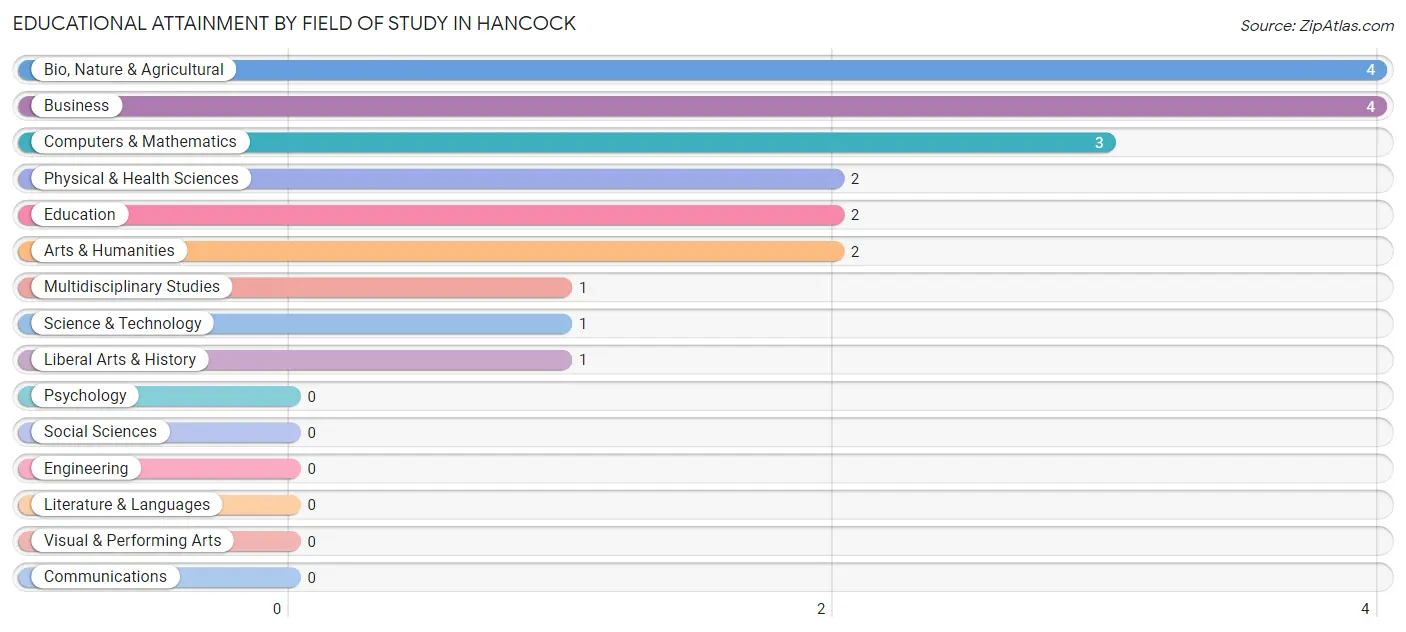
| Field of Study | # Graduates | % Graduates |
| Computers & Mathematics | 3 | 15.0% |
| Bio, Nature & Agricultural | 4 | 20.0% |
| Physical & Health Sciences | 2 | 10.0% |
| Psychology | 0 | 0.0% |
| Social Sciences | 0 | 0.0% |
| Engineering | 0 | 0.0% |
| Multidisciplinary Studies | 1 | 5.0% |
| Science & Technology | 1 | 5.0% |
| Business | 4 | 20.0% |
| Education | 2 | 10.0% |
| Literature & Languages | 0 | 0.0% |
| Liberal Arts & History | 1 | 5.0% |
| Visual & Performing Arts | 0 | 0.0% |
| Communications | 0 | 0.0% |
| Arts & Humanities | 2 | 10.0% |
| Total | 20 | 100.0% |
Transportation & Commute in Hancock
Vehicle Availability by Sex in Hancock
The most prevalent vehicle ownership categories in Hancock are males with 2 vehicles (37, accounting for 51.4%) and females with 2 vehicles (26, making up 55.2%).
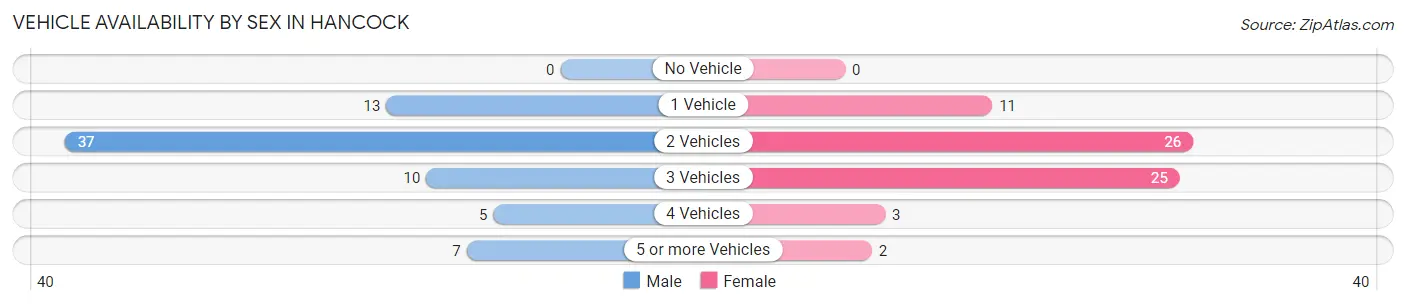
| Vehicles Available | Male | Female |
| No Vehicle | 0 (0.0%) | 0 (0.0%) |
| 1 Vehicle | 13 (18.1%) | 11 (16.4%) |
| 2 Vehicles | 37 (51.4%) | 26 (38.8%) |
| 3 Vehicles | 10 (13.9%) | 25 (37.3%) |
| 4 Vehicles | 5 (6.9%) | 3 (4.5%) |
| 5 or more Vehicles | 7 (9.7%) | 2 (3.0%) |
| Total | 72 (100.0%) | 67 (100.0%) |
Commute Time in Hancock
The most frequently occuring commute durations in Hancock are 15 to 19 minutes (27 commuters, 22.7%), 30 to 34 minutes (27 commuters, 22.7%), and less than 5 minutes (12 commuters, 10.1%).
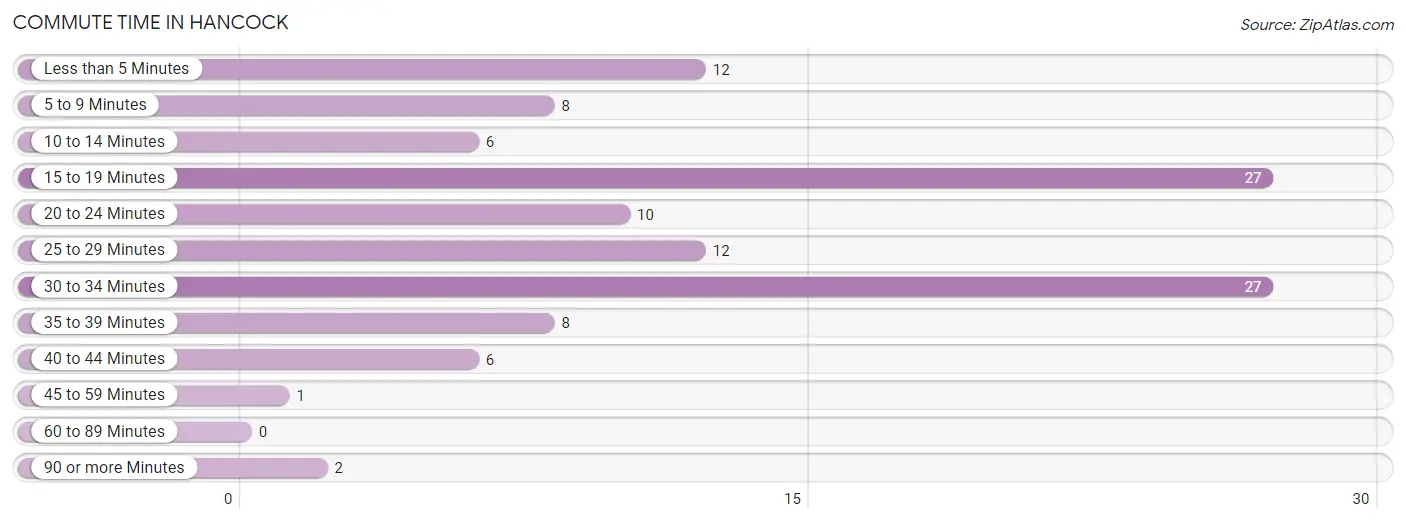
| Commute Time | # Commuters | % Commuters |
| Less than 5 Minutes | 12 | 10.1% |
| 5 to 9 Minutes | 8 | 6.7% |
| 10 to 14 Minutes | 6 | 5.0% |
| 15 to 19 Minutes | 27 | 22.7% |
| 20 to 24 Minutes | 10 | 8.4% |
| 25 to 29 Minutes | 12 | 10.1% |
| 30 to 34 Minutes | 27 | 22.7% |
| 35 to 39 Minutes | 8 | 6.7% |
| 40 to 44 Minutes | 6 | 5.0% |
| 45 to 59 Minutes | 1 | 0.8% |
| 60 to 89 Minutes | 0 | 0.0% |
| 90 or more Minutes | 2 | 1.7% |
Commute Time by Sex in Hancock
The most common commute times in Hancock are 15 to 19 minutes (11 commuters, 18.0%) for males and 30 to 34 minutes (17 commuters, 29.3%) for females.
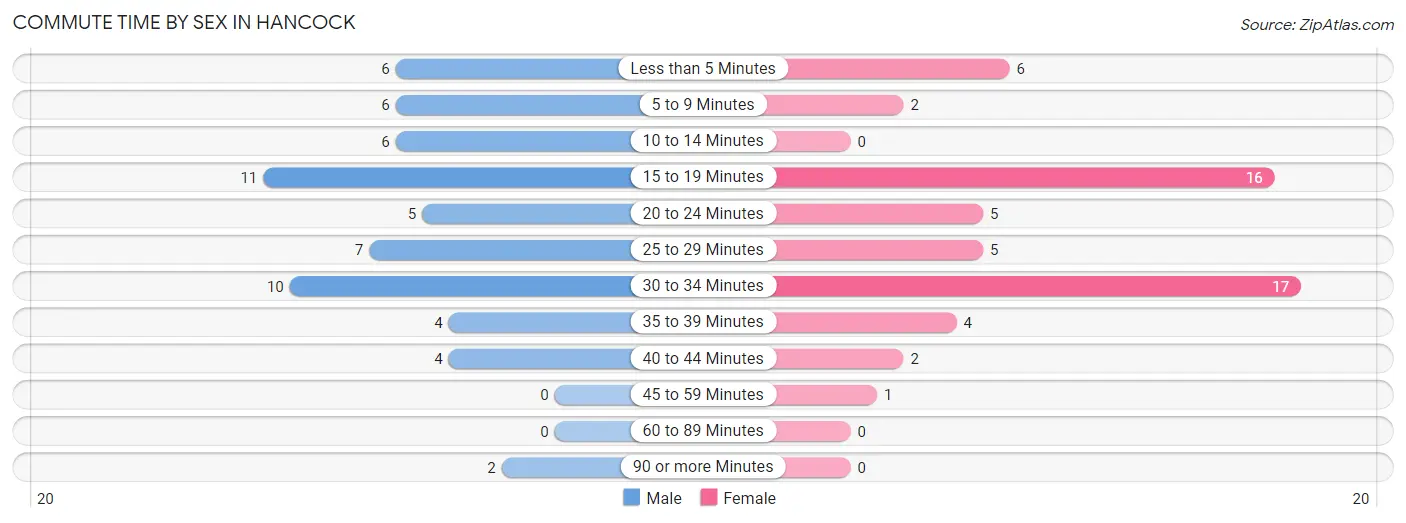
| Commute Time | Male | Female |
| Less than 5 Minutes | 6 (9.8%) | 6 (10.3%) |
| 5 to 9 Minutes | 6 (9.8%) | 2 (3.5%) |
| 10 to 14 Minutes | 6 (9.8%) | 0 (0.0%) |
| 15 to 19 Minutes | 11 (18.0%) | 16 (27.6%) |
| 20 to 24 Minutes | 5 (8.2%) | 5 (8.6%) |
| 25 to 29 Minutes | 7 (11.5%) | 5 (8.6%) |
| 30 to 34 Minutes | 10 (16.4%) | 17 (29.3%) |
| 35 to 39 Minutes | 4 (6.6%) | 4 (6.9%) |
| 40 to 44 Minutes | 4 (6.6%) | 2 (3.5%) |
| 45 to 59 Minutes | 0 (0.0%) | 1 (1.7%) |
| 60 to 89 Minutes | 0 (0.0%) | 0 (0.0%) |
| 90 or more Minutes | 2 (3.3%) | 0 (0.0%) |
Time of Departure to Work by Sex in Hancock
The most frequent times of departure to work in Hancock are 5:00 AM to 5:29 AM (12, 19.7%) for males and 7:00 AM to 7:29 AM (13, 22.4%) for females.
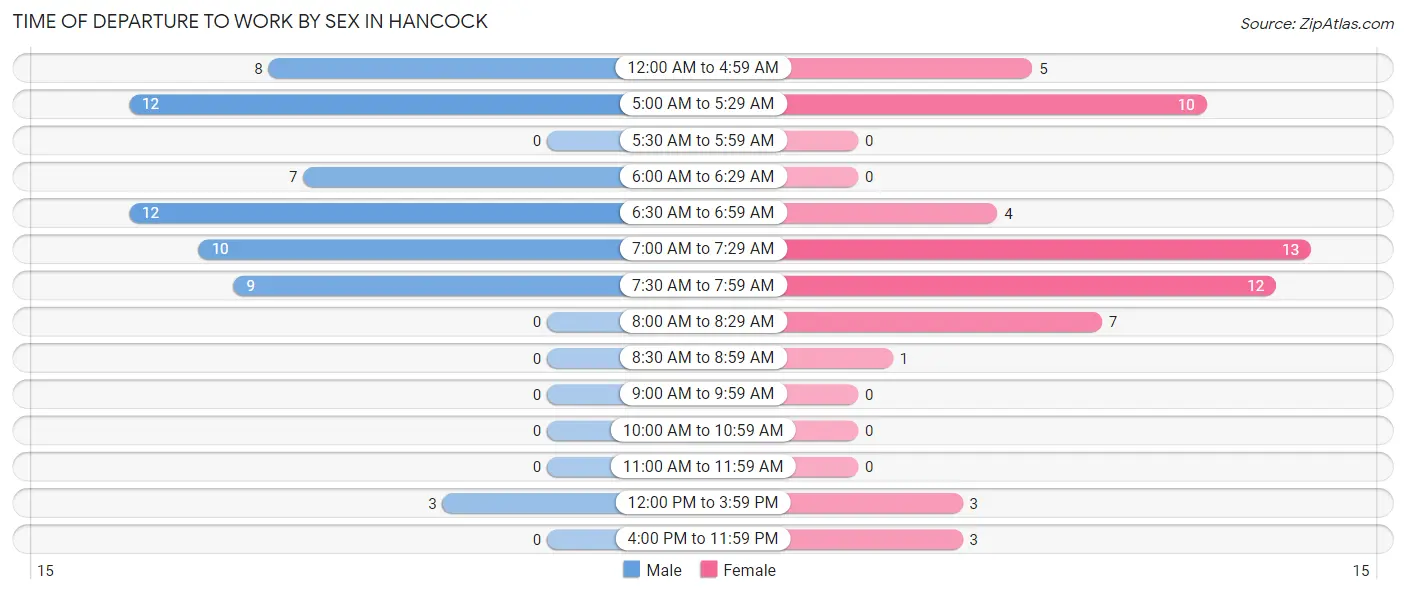
| Time of Departure | Male | Female |
| 12:00 AM to 4:59 AM | 8 (13.1%) | 5 (8.6%) |
| 5:00 AM to 5:29 AM | 12 (19.7%) | 10 (17.2%) |
| 5:30 AM to 5:59 AM | 0 (0.0%) | 0 (0.0%) |
| 6:00 AM to 6:29 AM | 7 (11.5%) | 0 (0.0%) |
| 6:30 AM to 6:59 AM | 12 (19.7%) | 4 (6.9%) |
| 7:00 AM to 7:29 AM | 10 (16.4%) | 13 (22.4%) |
| 7:30 AM to 7:59 AM | 9 (14.7%) | 12 (20.7%) |
| 8:00 AM to 8:29 AM | 0 (0.0%) | 7 (12.1%) |
| 8:30 AM to 8:59 AM | 0 (0.0%) | 1 (1.7%) |
| 9:00 AM to 9:59 AM | 0 (0.0%) | 0 (0.0%) |
| 10:00 AM to 10:59 AM | 0 (0.0%) | 0 (0.0%) |
| 11:00 AM to 11:59 AM | 0 (0.0%) | 0 (0.0%) |
| 12:00 PM to 3:59 PM | 3 (4.9%) | 3 (5.2%) |
| 4:00 PM to 11:59 PM | 0 (0.0%) | 3 (5.2%) |
| Total | 61 (100.0%) | 58 (100.0%) |
Housing Occupancy in Hancock
Occupancy by Ownership in Hancock
Of the total 202 dwellings in Hancock, owner-occupied units account for 151 (74.8%), while renter-occupied units make up 51 (25.3%).
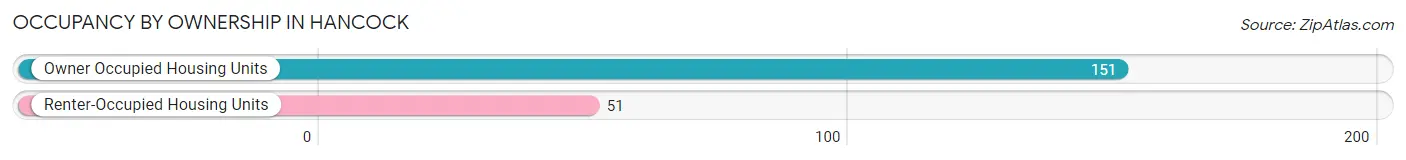
| Occupancy | # Housing Units | % Housing Units |
| Owner Occupied Housing Units | 151 | 74.8% |
| Renter-Occupied Housing Units | 51 | 25.3% |
| Total Occupied Housing Units | 202 | 100.0% |
Occupancy by Household Size in Hancock
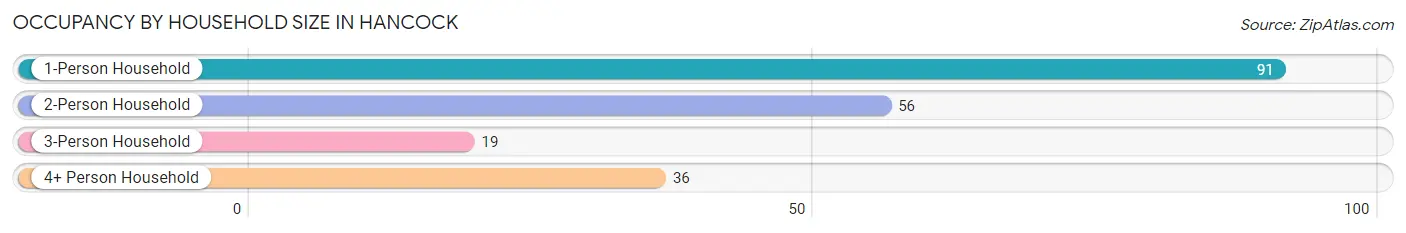
| Household Size | # Housing Units | % Housing Units |
| 1-Person Household | 91 | 45.1% |
| 2-Person Household | 56 | 27.7% |
| 3-Person Household | 19 | 9.4% |
| 4+ Person Household | 36 | 17.8% |
| Total Housing Units | 202 | 100.0% |
Occupancy by Ownership by Household Size in Hancock
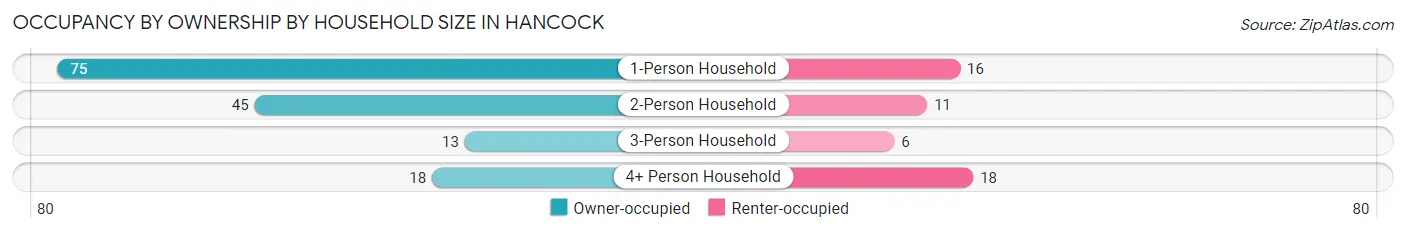
| Household Size | Owner-occupied | Renter-occupied |
| 1-Person Household | 75 (82.4%) | 16 (17.6%) |
| 2-Person Household | 45 (80.4%) | 11 (19.6%) |
| 3-Person Household | 13 (68.4%) | 6 (31.6%) |
| 4+ Person Household | 18 (50.0%) | 18 (50.0%) |
| Total Housing Units | 151 (74.8%) | 51 (25.3%) |
Occupancy by Educational Attainment in Hancock
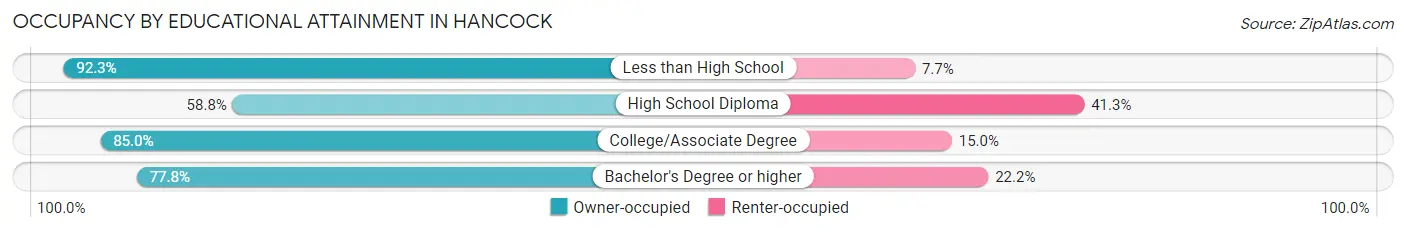
| Household Size | Owner-occupied | Renter-occupied |
| Less than High School | 12 (92.3%) | 1 (7.7%) |
| High School Diploma | 47 (58.8%) | 33 (41.2%) |
| College/Associate Degree | 85 (85.0%) | 15 (15.0%) |
| Bachelor's Degree or higher | 7 (77.8%) | 2 (22.2%) |
Occupancy by Age of Householder in Hancock
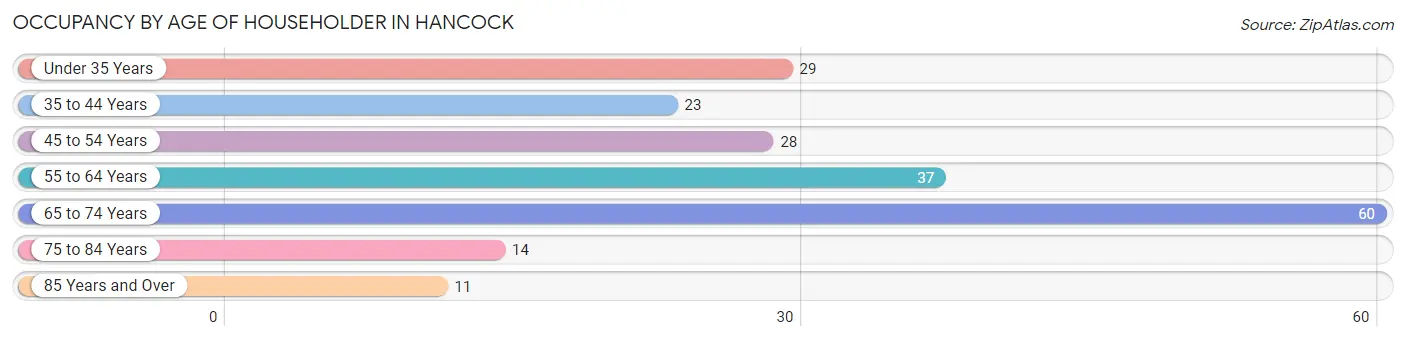
| Age Bracket | # Households | % Households |
| Under 35 Years | 29 | 14.4% |
| 35 to 44 Years | 23 | 11.4% |
| 45 to 54 Years | 28 | 13.9% |
| 55 to 64 Years | 37 | 18.3% |
| 65 to 74 Years | 60 | 29.7% |
| 75 to 84 Years | 14 | 6.9% |
| 85 Years and Over | 11 | 5.4% |
| Total | 202 | 100.0% |
Housing Finances in Hancock
Median Income by Occupancy in Hancock
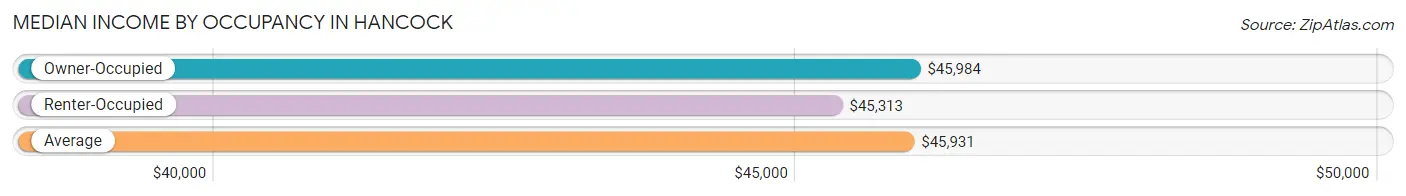
| Occupancy Type | # Households | Median Income |
| Owner-Occupied | 151 (74.8%) | $45,984 |
| Renter-Occupied | 51 (25.3%) | $45,313 |
| Average | 202 (100.0%) | $45,931 |
Occupancy by Householder Income Bracket in Hancock
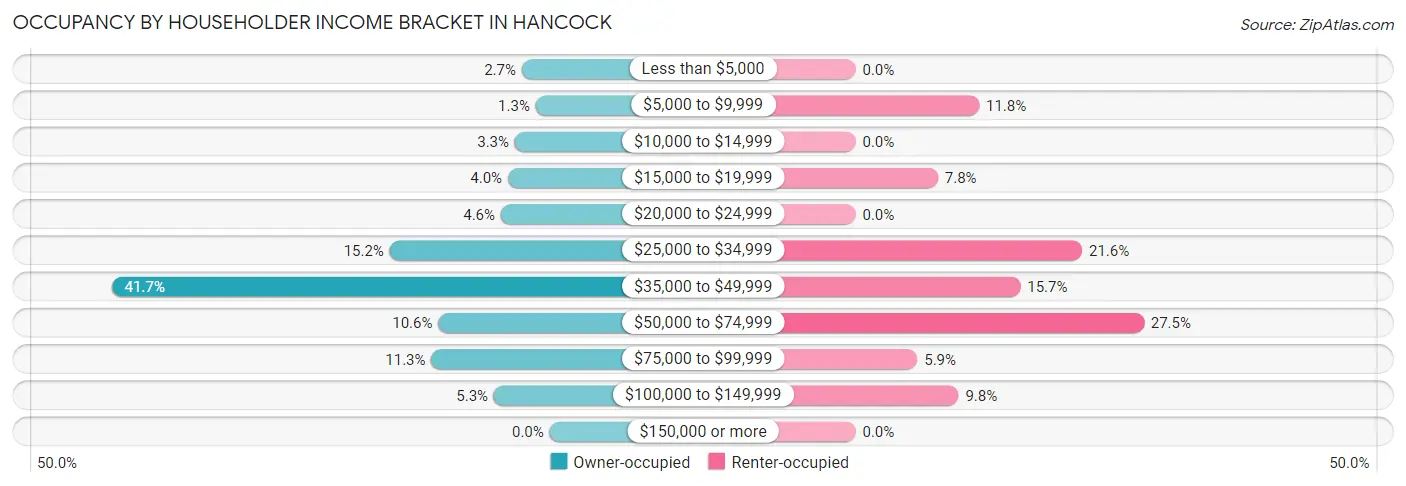
| Income Bracket | Owner-occupied | Renter-occupied |
| Less than $5,000 | 4 (2.6%) | 0 (0.0%) |
| $5,000 to $9,999 | 2 (1.3%) | 6 (11.8%) |
| $10,000 to $14,999 | 5 (3.3%) | 0 (0.0%) |
| $15,000 to $19,999 | 6 (4.0%) | 4 (7.8%) |
| $20,000 to $24,999 | 7 (4.6%) | 0 (0.0%) |
| $25,000 to $34,999 | 23 (15.2%) | 11 (21.6%) |
| $35,000 to $49,999 | 63 (41.7%) | 8 (15.7%) |
| $50,000 to $74,999 | 16 (10.6%) | 14 (27.5%) |
| $75,000 to $99,999 | 17 (11.3%) | 3 (5.9%) |
| $100,000 to $149,999 | 8 (5.3%) | 5 (9.8%) |
| $150,000 or more | 0 (0.0%) | 0 (0.0%) |
| Total | 151 (100.0%) | 51 (100.0%) |
Monthly Housing Cost Tiers in Hancock
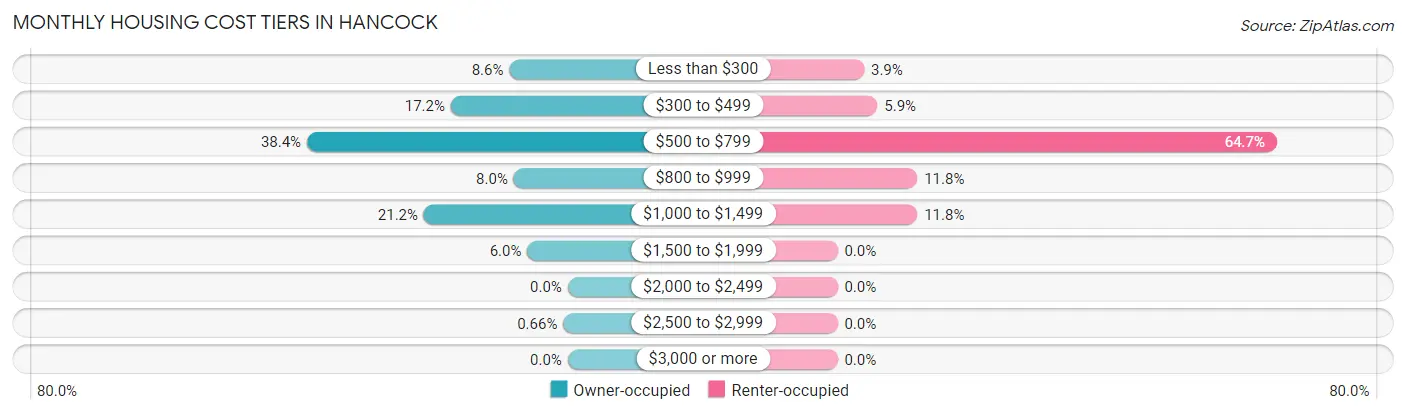
| Monthly Cost | Owner-occupied | Renter-occupied |
| Less than $300 | 13 (8.6%) | 2 (3.9%) |
| $300 to $499 | 26 (17.2%) | 3 (5.9%) |
| $500 to $799 | 58 (38.4%) | 33 (64.7%) |
| $800 to $999 | 12 (8.0%) | 6 (11.8%) |
| $1,000 to $1,499 | 32 (21.2%) | 6 (11.8%) |
| $1,500 to $1,999 | 9 (6.0%) | 0 (0.0%) |
| $2,000 to $2,499 | 0 (0.0%) | 0 (0.0%) |
| $2,500 to $2,999 | 1 (0.7%) | 0 (0.0%) |
| $3,000 or more | 0 (0.0%) | 0 (0.0%) |
| Total | 151 (100.0%) | 51 (100.0%) |
Physical Housing Characteristics in Hancock
Housing Structures in Hancock
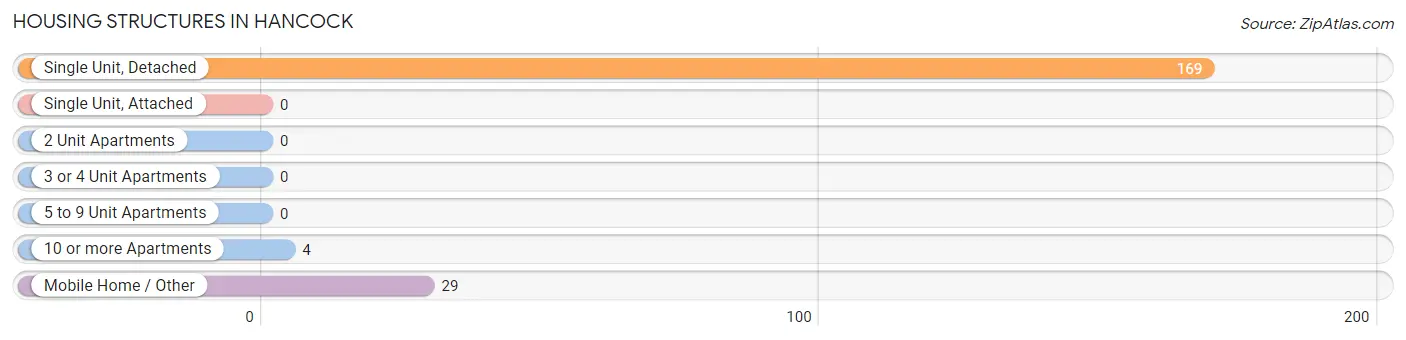
| Structure Type | # Housing Units | % Housing Units |
| Single Unit, Detached | 169 | 83.7% |
| Single Unit, Attached | 0 | 0.0% |
| 2 Unit Apartments | 0 | 0.0% |
| 3 or 4 Unit Apartments | 0 | 0.0% |
| 5 to 9 Unit Apartments | 0 | 0.0% |
| 10 or more Apartments | 4 | 2.0% |
| Mobile Home / Other | 29 | 14.4% |
| Total | 202 | 100.0% |
Housing Structures by Occupancy in Hancock
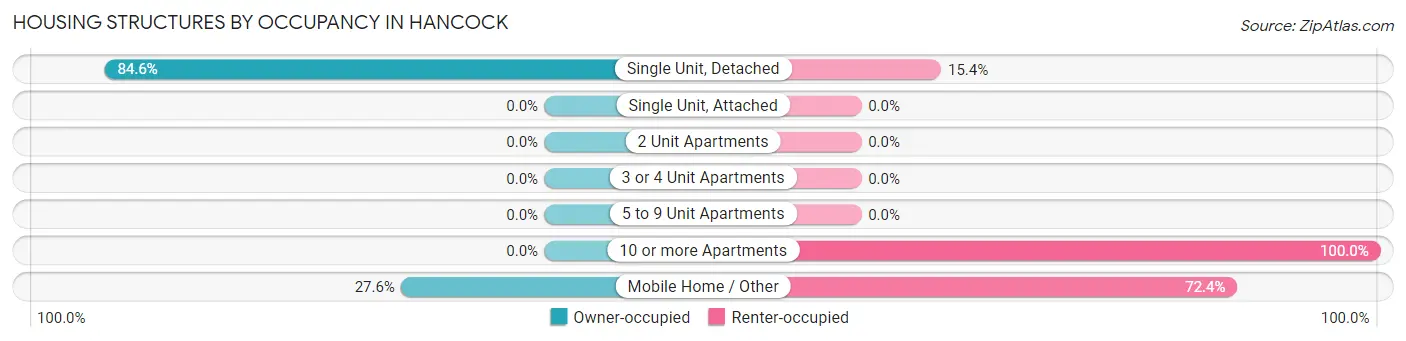
| Structure Type | Owner-occupied | Renter-occupied |
| Single Unit, Detached | 143 (84.6%) | 26 (15.4%) |
| Single Unit, Attached | 0 (0.0%) | 0 (0.0%) |
| 2 Unit Apartments | 0 (0.0%) | 0 (0.0%) |
| 3 or 4 Unit Apartments | 0 (0.0%) | 0 (0.0%) |
| 5 to 9 Unit Apartments | 0 (0.0%) | 0 (0.0%) |
| 10 or more Apartments | 0 (0.0%) | 4 (100.0%) |
| Mobile Home / Other | 8 (27.6%) | 21 (72.4%) |
| Total | 151 (74.8%) | 51 (25.3%) |
Housing Structures by Number of Rooms in Hancock
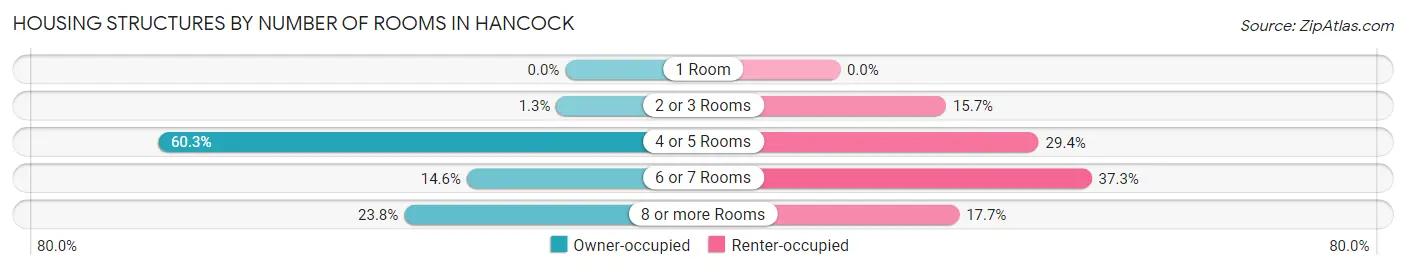
| Number of Rooms | Owner-occupied | Renter-occupied |
| 1 Room | 0 (0.0%) | 0 (0.0%) |
| 2 or 3 Rooms | 2 (1.3%) | 8 (15.7%) |
| 4 or 5 Rooms | 91 (60.3%) | 15 (29.4%) |
| 6 or 7 Rooms | 22 (14.6%) | 19 (37.2%) |
| 8 or more Rooms | 36 (23.8%) | 9 (17.6%) |
| Total | 151 (100.0%) | 51 (100.0%) |
Housing Structure by Heating Type in Hancock
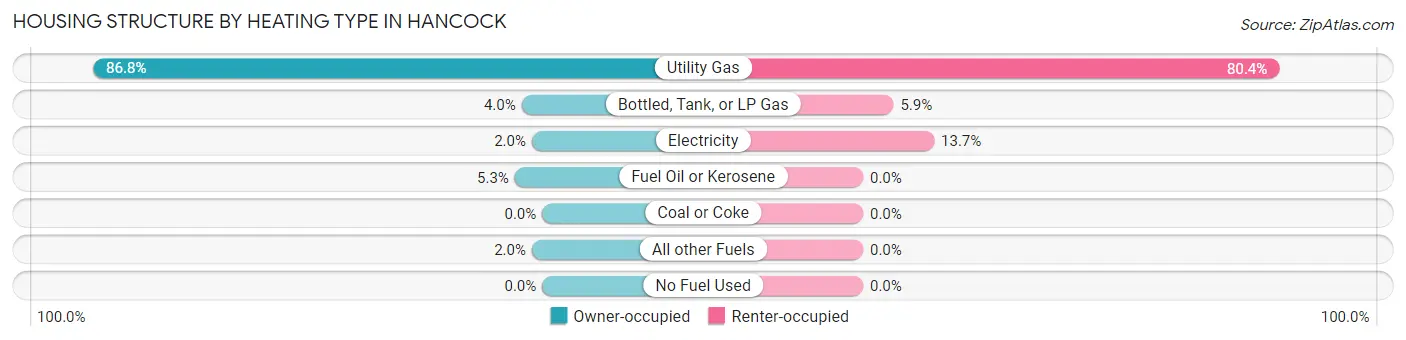
| Heating Type | Owner-occupied | Renter-occupied |
| Utility Gas | 131 (86.8%) | 41 (80.4%) |
| Bottled, Tank, or LP Gas | 6 (4.0%) | 3 (5.9%) |
| Electricity | 3 (2.0%) | 7 (13.7%) |
| Fuel Oil or Kerosene | 8 (5.3%) | 0 (0.0%) |
| Coal or Coke | 0 (0.0%) | 0 (0.0%) |
| All other Fuels | 3 (2.0%) | 0 (0.0%) |
| No Fuel Used | 0 (0.0%) | 0 (0.0%) |
| Total | 151 (100.0%) | 51 (100.0%) |
Household Vehicle Usage in Hancock
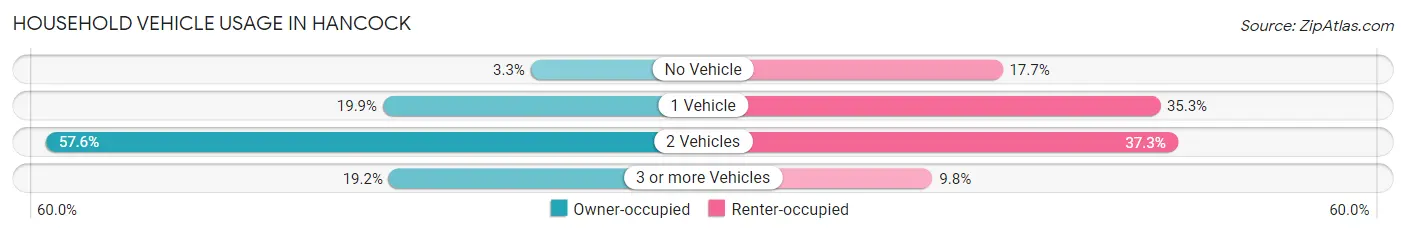
| Vehicles per Household | Owner-occupied | Renter-occupied |
| No Vehicle | 5 (3.3%) | 9 (17.6%) |
| 1 Vehicle | 30 (19.9%) | 18 (35.3%) |
| 2 Vehicles | 87 (57.6%) | 19 (37.2%) |
| 3 or more Vehicles | 29 (19.2%) | 5 (9.8%) |
| Total | 151 (100.0%) | 51 (100.0%) |
Real Estate & Mortgages in Hancock
Real Estate and Mortgage Overview in Hancock
| Characteristic | Without Mortgage | With Mortgage |
| Housing Units | 92 | 59 |
| Median Property Value | $178,300 | $118,100 |
| Median Household Income | $46,033 | $0 |
| Monthly Housing Costs | $516 | $0 |
| Real Estate Taxes | $3,043 | $0 |
Property Value by Mortgage Status in Hancock
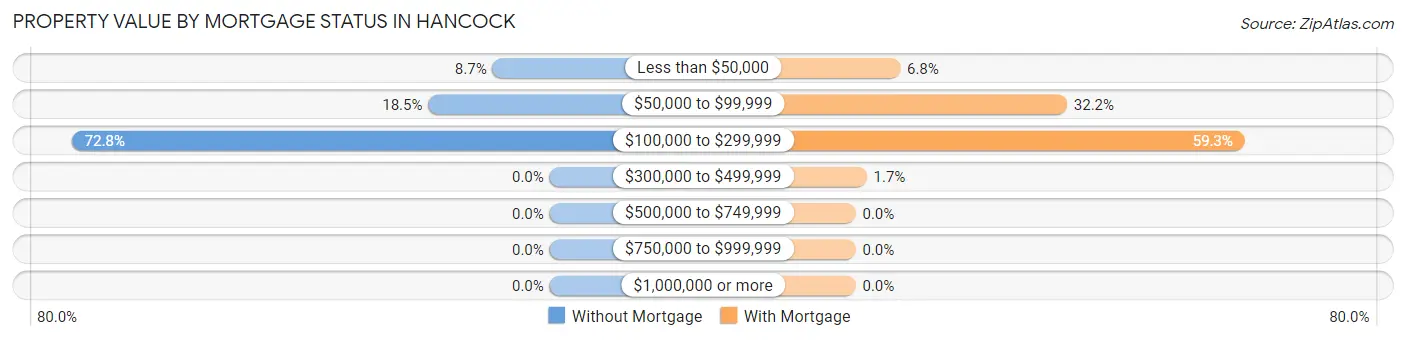
| Property Value | Without Mortgage | With Mortgage |
| Less than $50,000 | 8 (8.7%) | 4 (6.8%) |
| $50,000 to $99,999 | 17 (18.5%) | 19 (32.2%) |
| $100,000 to $299,999 | 67 (72.8%) | 35 (59.3%) |
| $300,000 to $499,999 | 0 (0.0%) | 1 (1.7%) |
| $500,000 to $749,999 | 0 (0.0%) | 0 (0.0%) |
| $750,000 to $999,999 | 0 (0.0%) | 0 (0.0%) |
| $1,000,000 or more | 0 (0.0%) | 0 (0.0%) |
| Total | 92 (100.0%) | 59 (100.0%) |
Household Income by Mortgage Status in Hancock
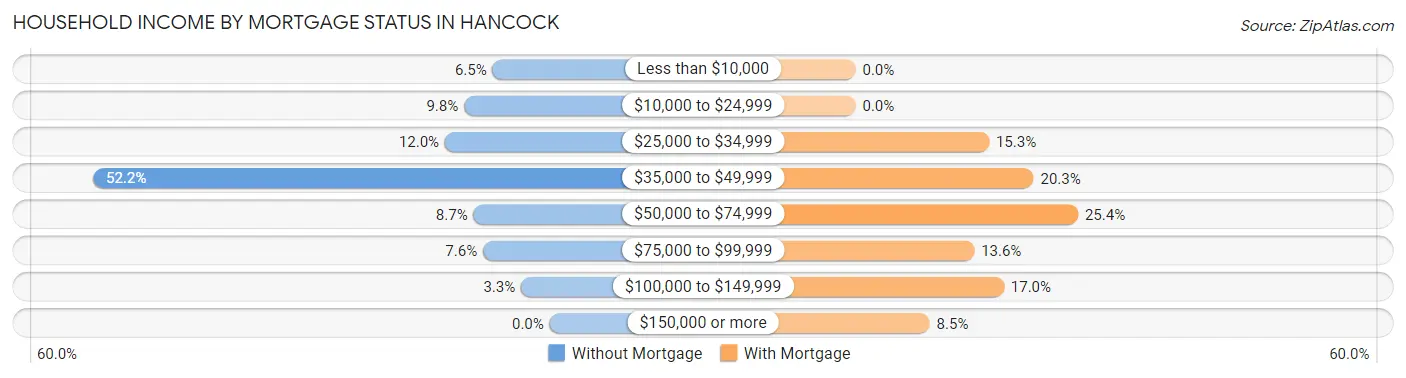
| Household Income | Without Mortgage | With Mortgage |
| Less than $10,000 | 6 (6.5%) | 0 (0.0%) |
| $10,000 to $24,999 | 9 (9.8%) | 0 (0.0%) |
| $25,000 to $34,999 | 11 (12.0%) | 9 (15.2%) |
| $35,000 to $49,999 | 48 (52.2%) | 12 (20.3%) |
| $50,000 to $74,999 | 8 (8.7%) | 15 (25.4%) |
| $75,000 to $99,999 | 7 (7.6%) | 8 (13.6%) |
| $100,000 to $149,999 | 3 (3.3%) | 10 (17.0%) |
| $150,000 or more | 0 (0.0%) | 5 (8.5%) |
| Total | 92 (100.0%) | 59 (100.0%) |
Property Value to Household Income Ratio in Hancock
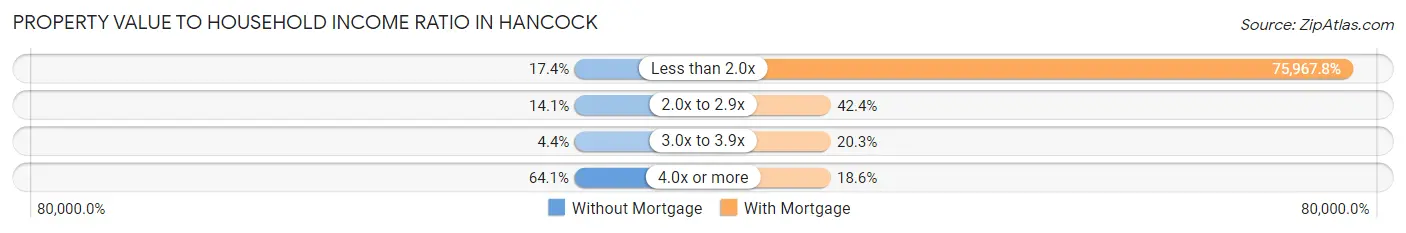
| Value-to-Income Ratio | Without Mortgage | With Mortgage |
| Less than 2.0x | 16 (17.4%) | 44,821 (75,967.8%) |
| 2.0x to 2.9x | 13 (14.1%) | 25 (42.4%) |
| 3.0x to 3.9x | 4 (4.3%) | 12 (20.3%) |
| 4.0x or more | 59 (64.1%) | 11 (18.6%) |
| Total | 92 (100.0%) | 59 (100.0%) |
Real Estate Taxes by Mortgage Status in Hancock
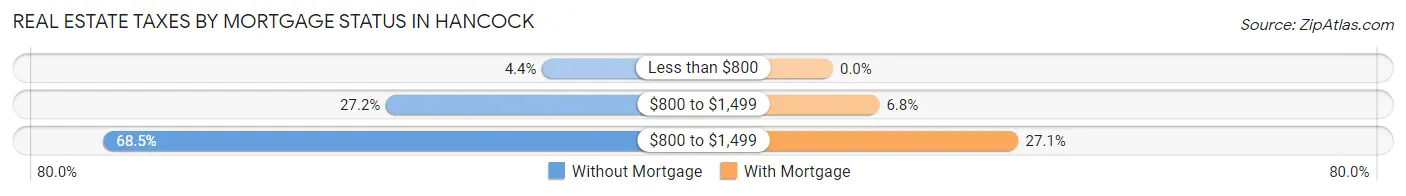
| Property Taxes | Without Mortgage | With Mortgage |
| Less than $800 | 4 (4.3%) | 0 (0.0%) |
| $800 to $1,499 | 25 (27.2%) | 4 (6.8%) |
| $800 to $1,499 | 63 (68.5%) | 16 (27.1%) |
| Total | 92 (100.0%) | 59 (100.0%) |
Health & Disability in Hancock
Health Insurance Coverage by Age in Hancock
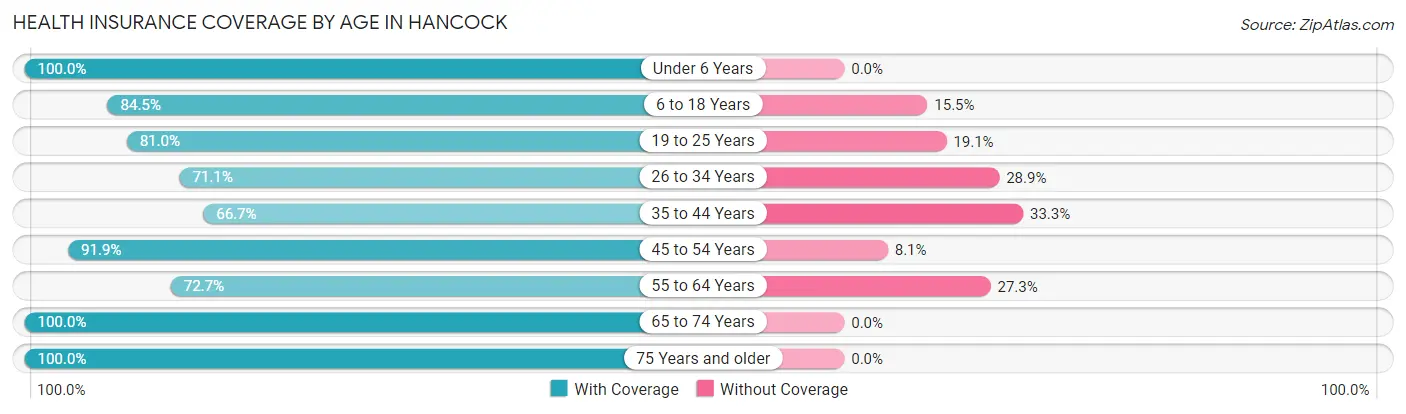
| Age Bracket | With Coverage | Without Coverage |
| Under 6 Years | 28 (100.0%) | 0 (0.0%) |
| 6 to 18 Years | 60 (84.5%) | 11 (15.5%) |
| 19 to 25 Years | 17 (80.9%) | 4 (19.1%) |
| 26 to 34 Years | 32 (71.1%) | 13 (28.9%) |
| 35 to 44 Years | 28 (66.7%) | 14 (33.3%) |
| 45 to 54 Years | 34 (91.9%) | 3 (8.1%) |
| 55 to 64 Years | 48 (72.7%) | 18 (27.3%) |
| 65 to 74 Years | 66 (100.0%) | 0 (0.0%) |
| 75 Years and older | 37 (100.0%) | 0 (0.0%) |
| Total | 350 (84.8%) | 63 (15.2%) |
Health Insurance Coverage by Citizenship Status in Hancock
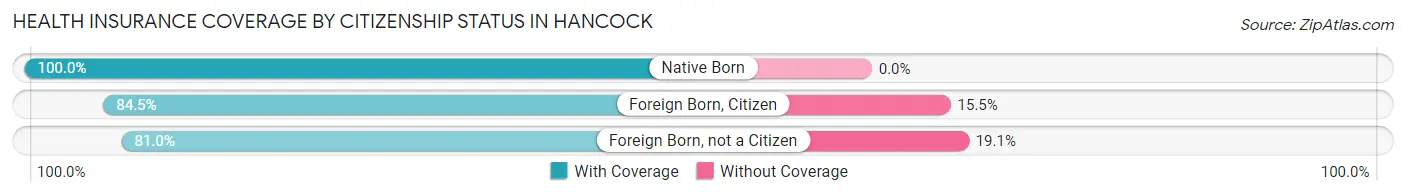
| Citizenship Status | With Coverage | Without Coverage |
| Native Born | 28 (100.0%) | 0 (0.0%) |
| Foreign Born, Citizen | 60 (84.5%) | 11 (15.5%) |
| Foreign Born, not a Citizen | 17 (80.9%) | 4 (19.1%) |
Health Insurance Coverage by Household Income in Hancock
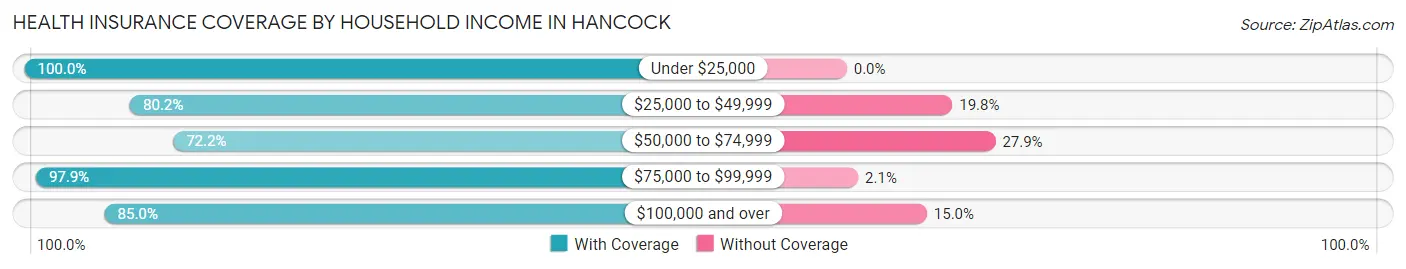
| Household Income | With Coverage | Without Coverage |
| Under $25,000 | 75 (100.0%) | 0 (0.0%) |
| $25,000 to $49,999 | 138 (80.2%) | 34 (19.8%) |
| $50,000 to $74,999 | 57 (72.2%) | 22 (27.9%) |
| $75,000 to $99,999 | 46 (97.9%) | 1 (2.1%) |
| $100,000 and over | 34 (85.0%) | 6 (15.0%) |
Public vs Private Health Insurance Coverage by Age in Hancock
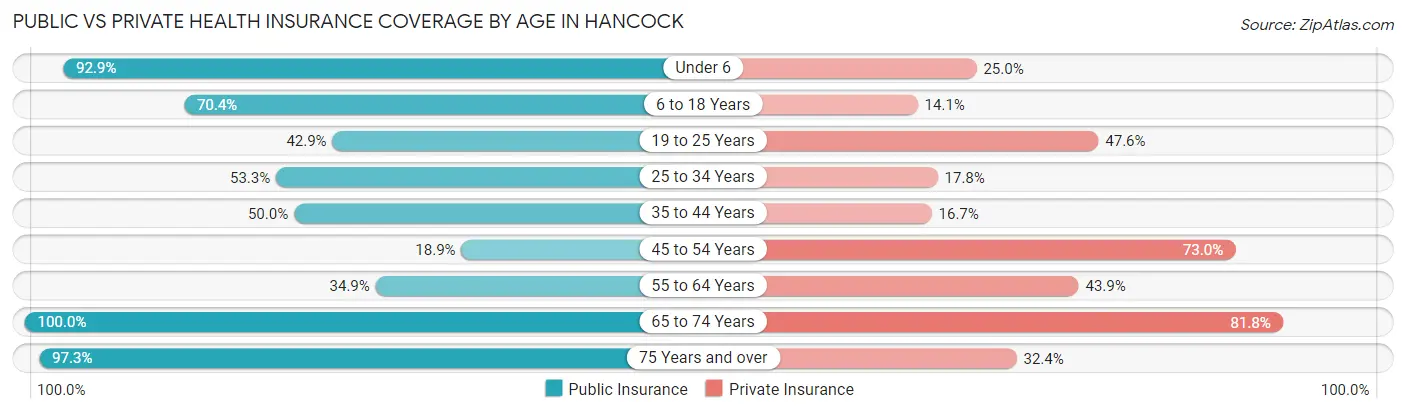
| Age Bracket | Public Insurance | Private Insurance |
| Under 6 | 26 (92.9%) | 7 (25.0%) |
| 6 to 18 Years | 50 (70.4%) | 10 (14.1%) |
| 19 to 25 Years | 9 (42.9%) | 10 (47.6%) |
| 25 to 34 Years | 24 (53.3%) | 8 (17.8%) |
| 35 to 44 Years | 21 (50.0%) | 7 (16.7%) |
| 45 to 54 Years | 7 (18.9%) | 27 (73.0%) |
| 55 to 64 Years | 23 (34.8%) | 29 (43.9%) |
| 65 to 74 Years | 66 (100.0%) | 54 (81.8%) |
| 75 Years and over | 36 (97.3%) | 12 (32.4%) |
| Total | 262 (63.4%) | 164 (39.7%) |
Disability Status by Sex by Age in Hancock
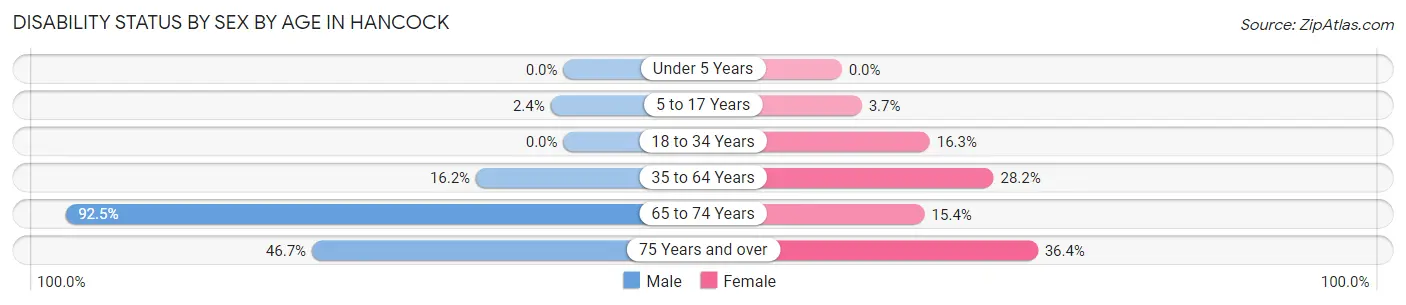
| Age Bracket | Male | Female |
| Under 5 Years | 0 (0.0%) | 0 (0.0%) |
| 5 to 17 Years | 1 (2.4%) | 1 (3.7%) |
| 18 to 34 Years | 0 (0.0%) | 8 (16.3%) |
| 35 to 64 Years | 12 (16.2%) | 20 (28.2%) |
| 65 to 74 Years | 49 (92.4%) | 2 (15.4%) |
| 75 Years and over | 7 (46.7%) | 8 (36.4%) |
Disability Class by Sex by Age in Hancock
Disability Class: Hearing Difficulty
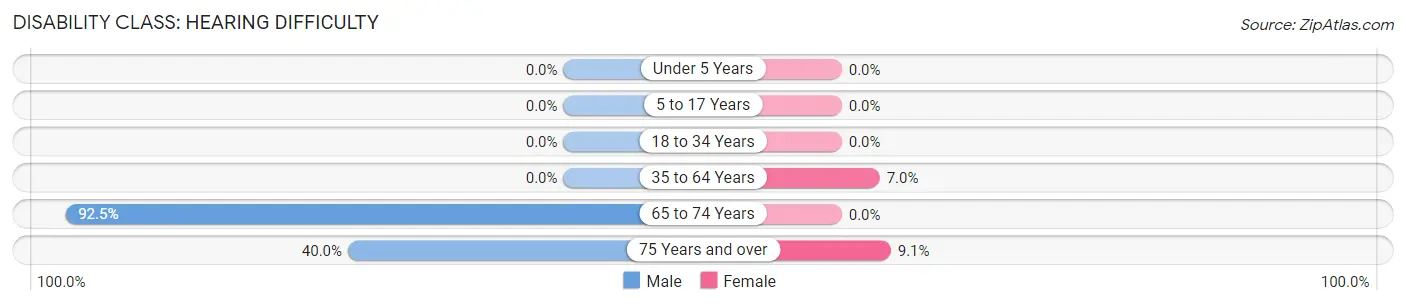
| Age Bracket | Male | Female |
| Under 5 Years | 0 (0.0%) | 0 (0.0%) |
| 5 to 17 Years | 0 (0.0%) | 0 (0.0%) |
| 18 to 34 Years | 0 (0.0%) | 0 (0.0%) |
| 35 to 64 Years | 0 (0.0%) | 5 (7.0%) |
| 65 to 74 Years | 49 (92.4%) | 0 (0.0%) |
| 75 Years and over | 6 (40.0%) | 2 (9.1%) |
Disability Class: Vision Difficulty
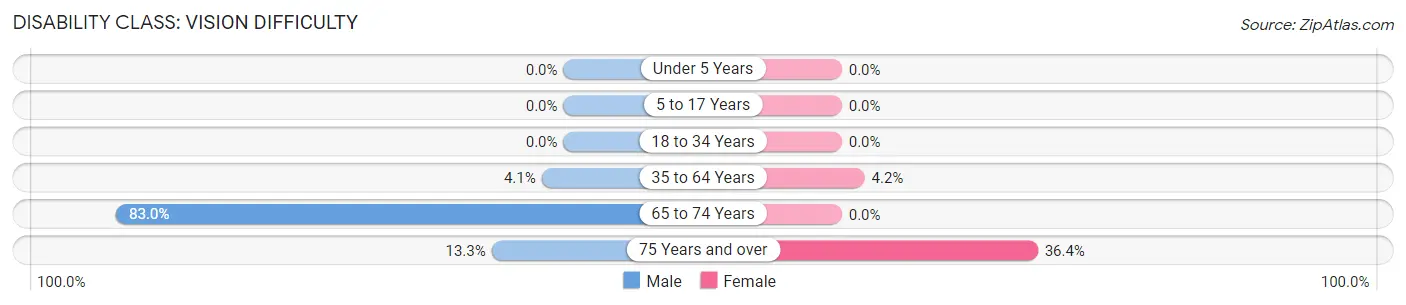
| Age Bracket | Male | Female |
| Under 5 Years | 0 (0.0%) | 0 (0.0%) |
| 5 to 17 Years | 0 (0.0%) | 0 (0.0%) |
| 18 to 34 Years | 0 (0.0%) | 0 (0.0%) |
| 35 to 64 Years | 3 (4.1%) | 3 (4.2%) |
| 65 to 74 Years | 44 (83.0%) | 0 (0.0%) |
| 75 Years and over | 2 (13.3%) | 8 (36.4%) |
Disability Class: Cognitive Difficulty
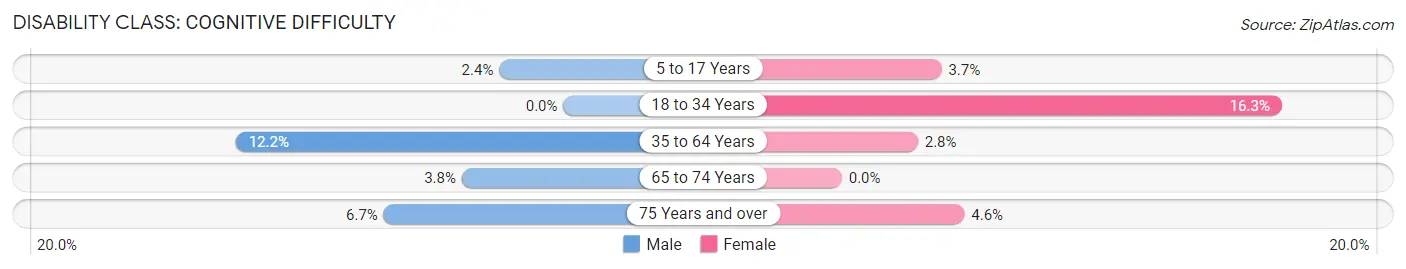
| Age Bracket | Male | Female |
| 5 to 17 Years | 1 (2.4%) | 1 (3.7%) |
| 18 to 34 Years | 0 (0.0%) | 8 (16.3%) |
| 35 to 64 Years | 9 (12.2%) | 2 (2.8%) |
| 65 to 74 Years | 2 (3.8%) | 0 (0.0%) |
| 75 Years and over | 1 (6.7%) | 1 (4.5%) |
Disability Class: Ambulatory Difficulty
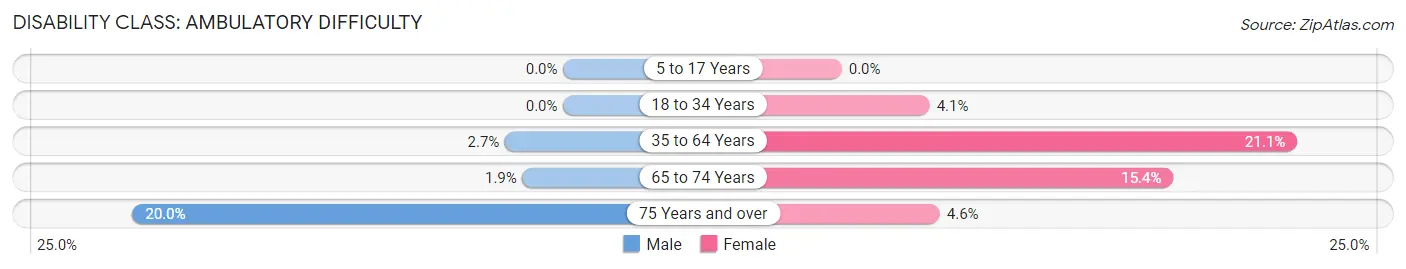
| Age Bracket | Male | Female |
| 5 to 17 Years | 0 (0.0%) | 0 (0.0%) |
| 18 to 34 Years | 0 (0.0%) | 2 (4.1%) |
| 35 to 64 Years | 2 (2.7%) | 15 (21.1%) |
| 65 to 74 Years | 1 (1.9%) | 2 (15.4%) |
| 75 Years and over | 3 (20.0%) | 1 (4.5%) |
Disability Class: Self-Care Difficulty
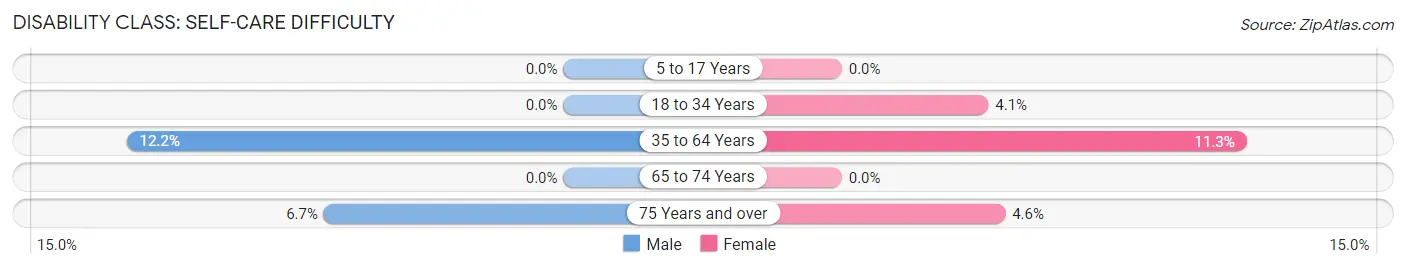
| Age Bracket | Male | Female |
| 5 to 17 Years | 0 (0.0%) | 0 (0.0%) |
| 18 to 34 Years | 0 (0.0%) | 2 (4.1%) |
| 35 to 64 Years | 9 (12.2%) | 8 (11.3%) |
| 65 to 74 Years | 0 (0.0%) | 0 (0.0%) |
| 75 Years and over | 1 (6.7%) | 1 (4.5%) |
Technology Access in Hancock
Computing Device Access in Hancock
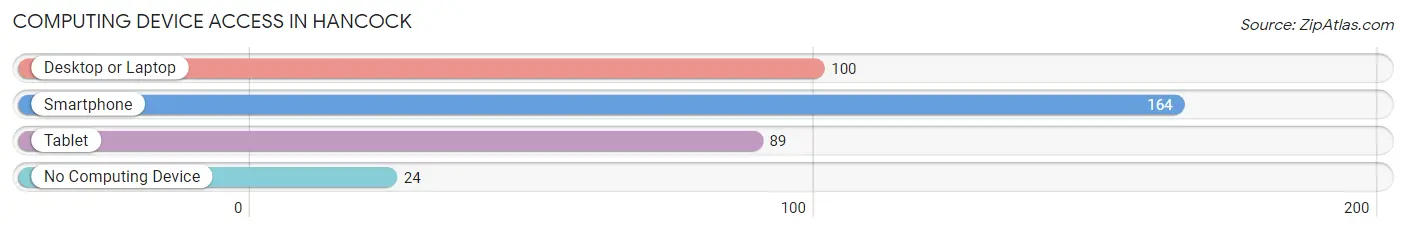
| Device Type | # Households | % Households |
| Desktop or Laptop | 100 | 49.5% |
| Smartphone | 164 | 81.2% |
| Tablet | 89 | 44.1% |
| No Computing Device | 24 | 11.9% |
| Total | 202 | 100.0% |
Internet Access in Hancock
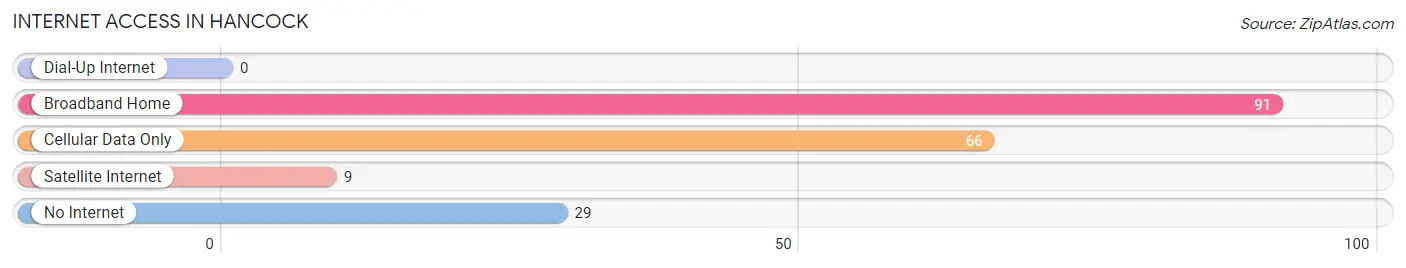
| Internet Type | # Households | % Households |
| Dial-Up Internet | 0 | 0.0% |
| Broadband Home | 91 | 45.1% |
| Cellular Data Only | 66 | 32.7% |
| Satellite Internet | 9 | 4.5% |
| No Internet | 29 | 14.4% |
| Total | 202 | 100.0% |
Hancock Summary
Hancock is a small town located in the state of Wisconsin, in the United States of America. It is situated in the northwest corner of the state, in the county of Waushara. The town has a population of around 1,000 people, and is located on the banks of the Fox River.
History
Hancock was first settled in 1848 by a group of settlers from New York. The town was named after John Hancock, a signer of the Declaration of Independence. The settlers were attracted to the area due to its abundance of natural resources, including timber and water. The town was officially incorporated in 1854.
In the late 19th century, Hancock was a thriving lumber town. The town was home to several sawmills, and the lumber industry was the main source of income for the town. The lumber industry declined in the early 20th century, and the town shifted its focus to agriculture.
Geography
Hancock is located in the northwest corner of Wisconsin, in the county of Waushara. The town is situated on the banks of the Fox River, and is surrounded by rolling hills and forests. The town is located approximately 30 miles from the city of Wausau, and is about an hour and a half drive from the state capital of Madison.
The climate in Hancock is typical of the Midwest, with cold winters and hot summers. The average temperature in the winter is around 20 degrees Fahrenheit, and the average temperature in the summer is around 70 degrees Fahrenheit.
Economy
The economy of Hancock is largely based on agriculture. The town is home to several dairy farms, as well as a number of vegetable and fruit farms. The town also has a small manufacturing sector, with several small businesses producing a variety of products.
The town also has a thriving tourism industry, with many visitors coming to the area to enjoy the natural beauty of the Fox River and the surrounding hills and forests. The town is also home to several small shops and restaurants, which cater to the needs of both locals and visitors.
Demographics
As of the 2010 census, the population of Hancock was 1,000 people. The town is predominantly white, with around 95% of the population being of European descent. The town also has a small Hispanic population, with around 4% of the population being of Hispanic or Latino origin.
The median household income in Hancock is around $45,000, and the median home value is around $150,000. The town has a low unemployment rate, with only around 4% of the population being unemployed. The town also has a low crime rate, with only around 1% of the population being victims of violent crime.
Conclusion
Hancock is a small town located in the northwest corner of Wisconsin. The town has a population of around 1,000 people, and is largely based on agriculture and tourism. The town has a low unemployment rate, and a low crime rate, making it a safe and prosperous place to live.
Common Questions
What is Per Capita Income in Hancock?
Per Capita income in Hancock is $22,788.
What is the Median Family Income in Hancock?
Median Family Income in Hancock is $45,000.
What is the Median Household income in Hancock?
Median Household Income in Hancock is $45,931.
What is Income or Wage Gap in Hancock?
Income or Wage Gap in Hancock is 66.3%.
Women in Hancock earn 33.7 cents for every dollar earned by a man.
What is Inequality or Gini Index in Hancock?
Inequality or Gini Index in Hancock is 0.30.
What is the Total Population of Hancock?
Total Population of Hancock is 413.
What is the Total Male Population of Hancock?
Total Male Population of Hancock is 220.
What is the Total Female Population of Hancock?
Total Female Population of Hancock is 193.
What is the Ratio of Males per 100 Females in Hancock?
There are 113.99 Males per 100 Females in Hancock.
What is the Ratio of Females per 100 Males in Hancock?
There are 87.73 Females per 100 Males in Hancock.
What is the Median Population Age in Hancock?
Median Population Age in Hancock is 44.9 Years.
What is the Average Family Size in Hancock
Average Family Size in Hancock is 2.8 People.
What is the Average Household Size in Hancock
Average Household Size in Hancock is 2.0 People.
How Large is the Labor Force in Hancock?
There are 158 People in the Labor Forcein in Hancock.
What is the Percentage of People in the Labor Force in Hancock?
48.2% of People are in the Labor Force in Hancock.
What is the Unemployment Rate in Hancock?
Unemployment Rate in Hancock is 10.8%.