Hager City, WI Map & Demographics
Hager City Map
Hager City Overview
$44,878
PER CAPITA INCOME
$100,000
AVG FAMILY INCOME
$99,545
AVG HOUSEHOLD INCOME
44.9%
WAGE / INCOME GAP [ % ]
55.1¢/ $1
WAGE / INCOME GAP [ $ ]
0.28
INEQUALITY / GINI INDEX
227
TOTAL POPULATION
121
MALE POPULATION
106
FEMALE POPULATION
114.15
MALES / 100 FEMALES
87.60
FEMALES / 100 MALES
48.2
MEDIAN AGE
2.4
AVG FAMILY SIZE
2.2
AVG HOUSEHOLD SIZE
142
LABOR FORCE [ PEOPLE ]
70.6%
PERCENT IN LABOR FORCE
2.1%
UNEMPLOYMENT RATE
Hager City Zip Codes
Hager City Area Codes
Income in Hager City
Income Overview in Hager City
Per Capita Income in Hager City is $44,878, while median incomes of families and households are $100,000 and $99,545 respectively.
| Characteristic | Number | Measure |
| Per Capita Income | 227 | $44,878 |
| Median Family Income | 78 | $100,000 |
| Mean Family Income | 78 | $99,277 |
| Median Household Income | 104 | $99,545 |
| Mean Household Income | 104 | $98,511 |
| Income Deficit | 78 | $0 |
| Wage / Income Gap (%) | 227 | 44.85% |
| Wage / Income Gap ($) | 227 | 55.15¢ per $1 |
| Gini / Inequality Index | 227 | 0.28 |
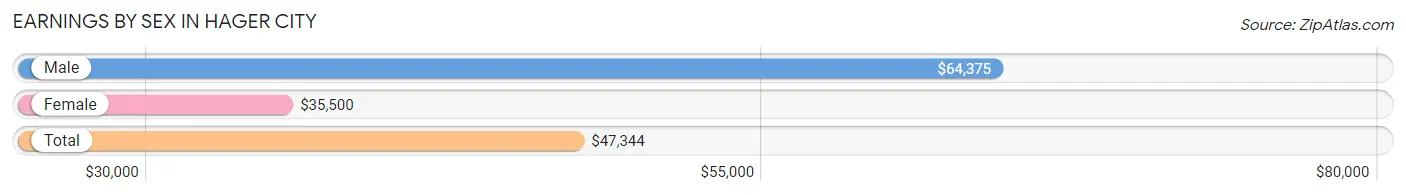
Earnings by Sex in Hager City
Average Earnings in Hager City are $47,344, $64,375 for men and $35,500 for women, a difference of 44.9%.
| Sex | Number | Average Earnings |
| Male | 79 (53.7%) | $64,375 |
| Female | 68 (46.3%) | $35,500 |
| Total | 147 (100.0%) | $47,344 |
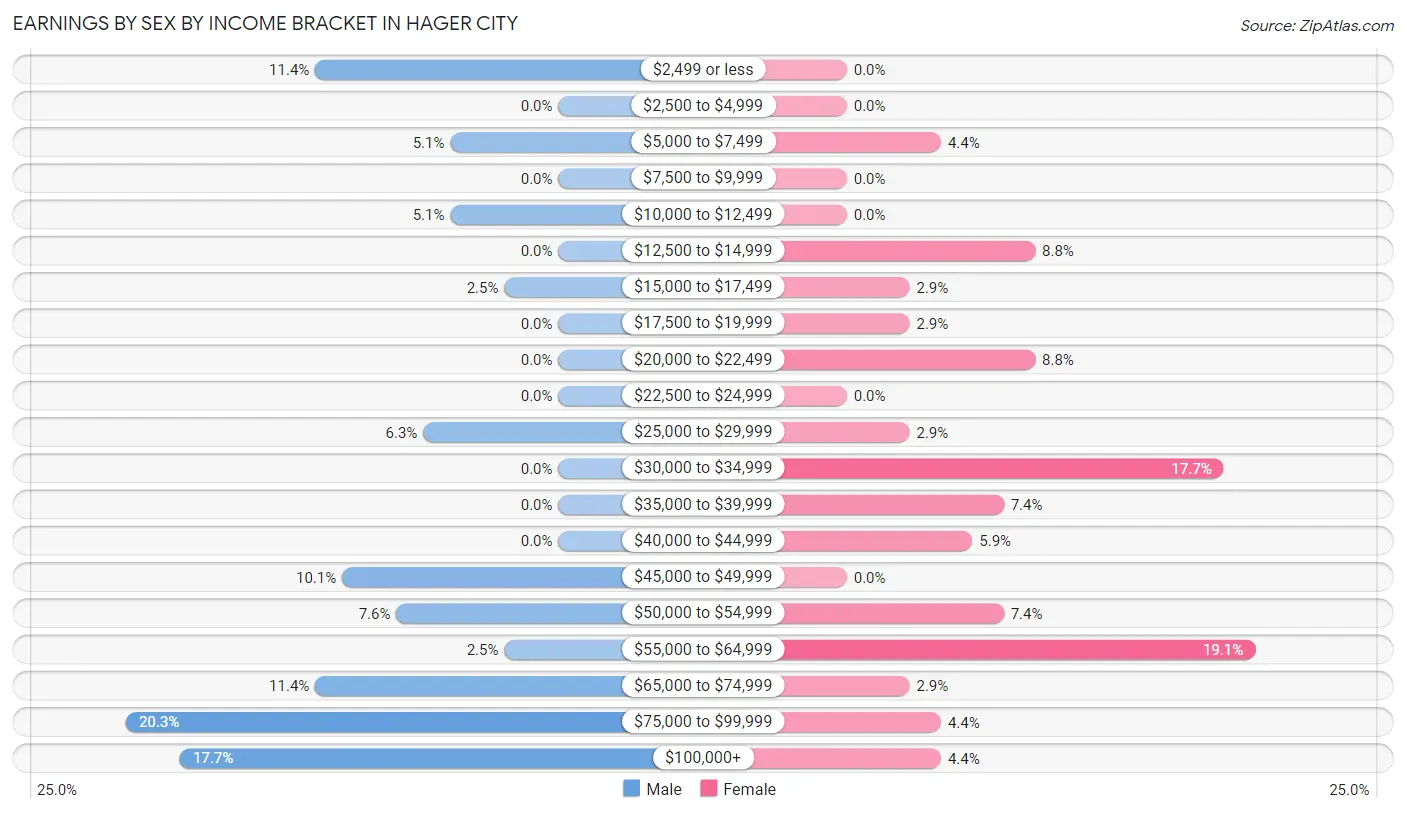
Earnings by Sex by Income Bracket in Hager City
The most common earnings brackets in Hager City are $75,000 to $99,999 for men (16 | 20.3%) and $55,000 to $64,999 for women (13 | 19.1%).
| Income | Male | Female |
| $2,499 or less | 9 (11.4%) | 0 (0.0%) |
| $2,500 to $4,999 | 0 (0.0%) | 0 (0.0%) |
| $5,000 to $7,499 | 4 (5.1%) | 3 (4.4%) |
| $7,500 to $9,999 | 0 (0.0%) | 0 (0.0%) |
| $10,000 to $12,499 | 4 (5.1%) | 0 (0.0%) |
| $12,500 to $14,999 | 0 (0.0%) | 6 (8.8%) |
| $15,000 to $17,499 | 2 (2.5%) | 2 (2.9%) |
| $17,500 to $19,999 | 0 (0.0%) | 2 (2.9%) |
| $20,000 to $22,499 | 0 (0.0%) | 6 (8.8%) |
| $22,500 to $24,999 | 0 (0.0%) | 0 (0.0%) |
| $25,000 to $29,999 | 5 (6.3%) | 2 (2.9%) |
| $30,000 to $34,999 | 0 (0.0%) | 12 (17.6%) |
| $35,000 to $39,999 | 0 (0.0%) | 5 (7.3%) |
| $40,000 to $44,999 | 0 (0.0%) | 4 (5.9%) |
| $45,000 to $49,999 | 8 (10.1%) | 0 (0.0%) |
| $50,000 to $54,999 | 6 (7.6%) | 5 (7.3%) |
| $55,000 to $64,999 | 2 (2.5%) | 13 (19.1%) |
| $65,000 to $74,999 | 9 (11.4%) | 2 (2.9%) |
| $75,000 to $99,999 | 16 (20.3%) | 3 (4.4%) |
| $100,000+ | 14 (17.7%) | 3 (4.4%) |
| Total | 79 (100.0%) | 68 (100.0%) |
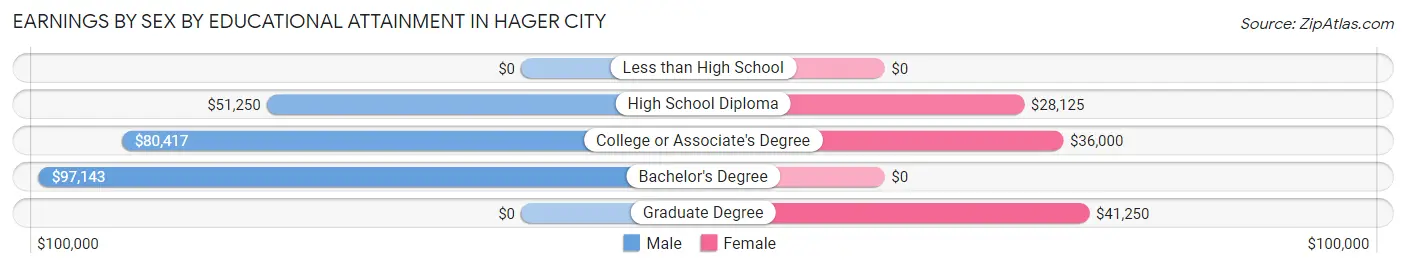
Earnings by Sex by Educational Attainment in Hager City
Average earnings in Hager City are $70,417 for men and $35,500 for women, a difference of 49.6%. Men with an educational attainment of bachelor's degree enjoy the highest average annual earnings of $97,143, while those with high school diploma education earn the least with $51,250. Women with an educational attainment of graduate degree earn the most with the average annual earnings of $41,250, while those with high school diploma education have the smallest earnings of $28,125.
| Educational Attainment | Male Income | Female Income |
| Less than High School | - | - |
| High School Diploma | $51,250 | $28,125 |
| College or Associate's Degree | $80,417 | $36,000 |
| Bachelor's Degree | $97,143 | $0 |
| Graduate Degree | - | - |
| Total | $70,417 | $35,500 |
Family Income in Hager City
Family Income Brackets in Hager City
According to the Hager City family income data, there are 27 families falling into the $100,000 to $149,999 income range, which is the most common income bracket and makes up 34.6% of all families.
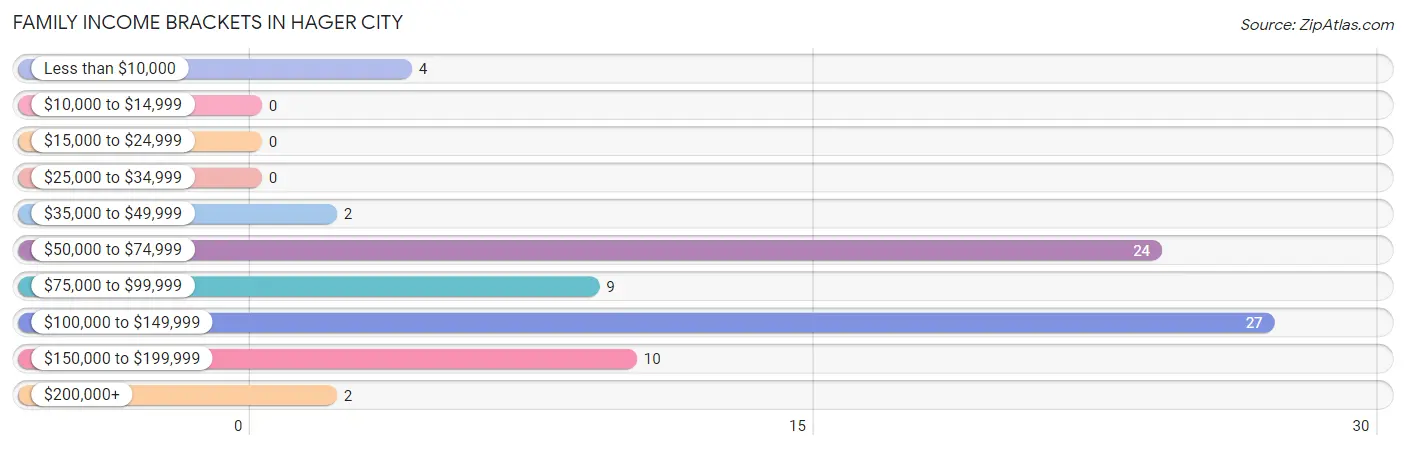
| Income Bracket | # Families | % Families |
| Less than $10,000 | 4 | 5.1% |
| $10,000 to $14,999 | 0 | 0.0% |
| $15,000 to $24,999 | 0 | 0.0% |
| $25,000 to $34,999 | 0 | 0.0% |
| $35,000 to $49,999 | 2 | 2.6% |
| $50,000 to $74,999 | 24 | 30.8% |
| $75,000 to $99,999 | 9 | 11.5% |
| $100,000 to $149,999 | 27 | 34.6% |
| $150,000 to $199,999 | 10 | 12.8% |
| $200,000+ | 2 | 2.6% |
Family Income by Famaliy Size in Hager City
3-person families (17 | 21.8%) account for the highest median family income in Hager City with $152,875 per family, while 3-person families (17 | 21.8%) have the highest median income of $50,958 per family member.
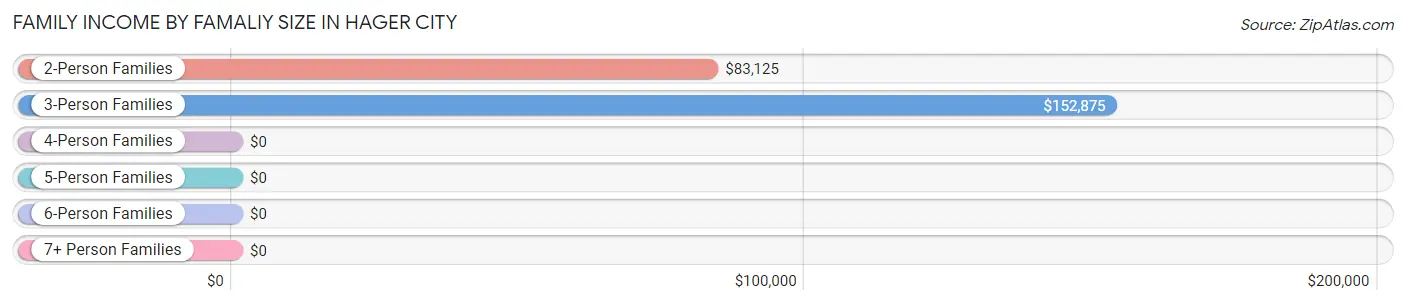
| Income Bracket | # Families | Median Income |
| 2-Person Families | 56 (71.8%) | $83,125 |
| 3-Person Families | 17 (21.8%) | $152,875 |
| 4-Person Families | 0 (0.0%) | $0 |
| 5-Person Families | 0 (0.0%) | $0 |
| 6-Person Families | 5 (6.4%) | $0 |
| 7+ Person Families | 0 (0.0%) | $0 |
| Total | 78 (100.0%) | $100,000 |
Family Income by Number of Earners in Hager City
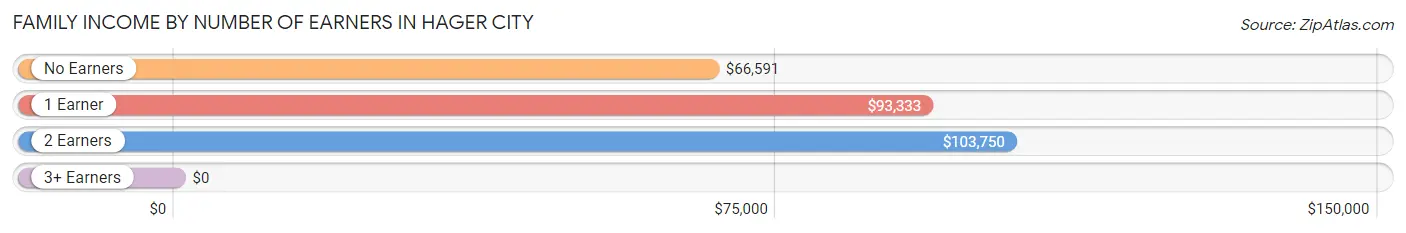
| Number of Earners | # Families | Median Income |
| No Earners | 16 (20.5%) | $66,591 |
| 1 Earner | 26 (33.3%) | $93,333 |
| 2 Earners | 26 (33.3%) | $103,750 |
| 3+ Earners | 10 (12.8%) | $0 |
| Total | 78 (100.0%) | $100,000 |
Household Income in Hager City
Household Income Brackets in Hager City
With 35 households falling in the category, the $100,000 to $149,999 income range is the most frequent in Hager City, accounting for 33.7% of all households.
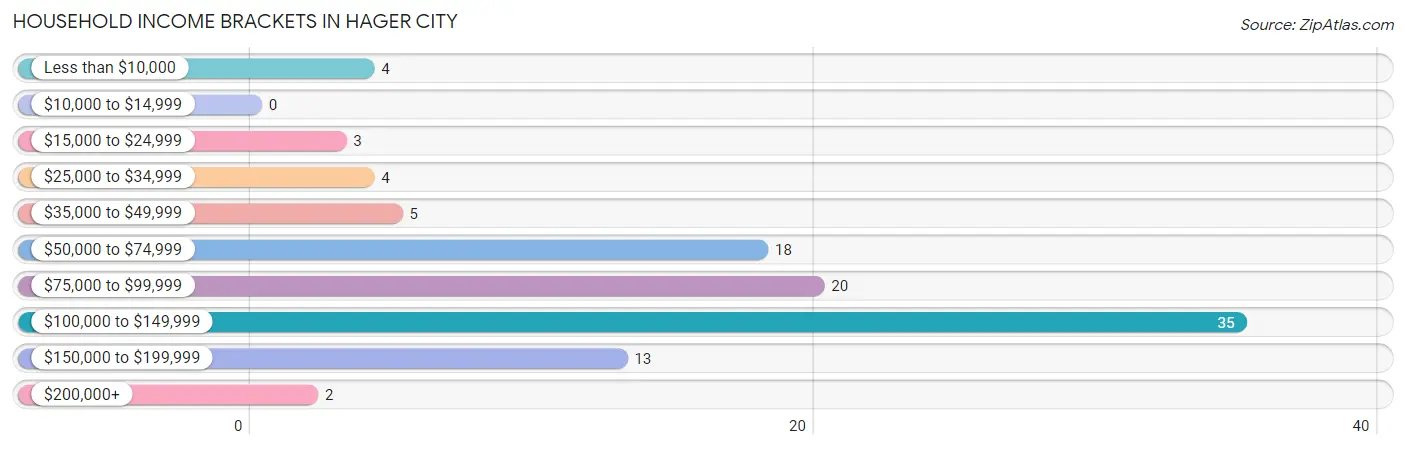
| Income Bracket | # Households | % Households |
| Less than $10,000 | 4 | 3.8% |
| $10,000 to $14,999 | 0 | 0.0% |
| $15,000 to $24,999 | 3 | 2.9% |
| $25,000 to $34,999 | 4 | 3.8% |
| $35,000 to $49,999 | 5 | 4.8% |
| $50,000 to $74,999 | 18 | 17.3% |
| $75,000 to $99,999 | 20 | 19.2% |
| $100,000 to $149,999 | 35 | 33.7% |
| $150,000 to $199,999 | 13 | 12.5% |
| $200,000+ | 2 | 1.9% |
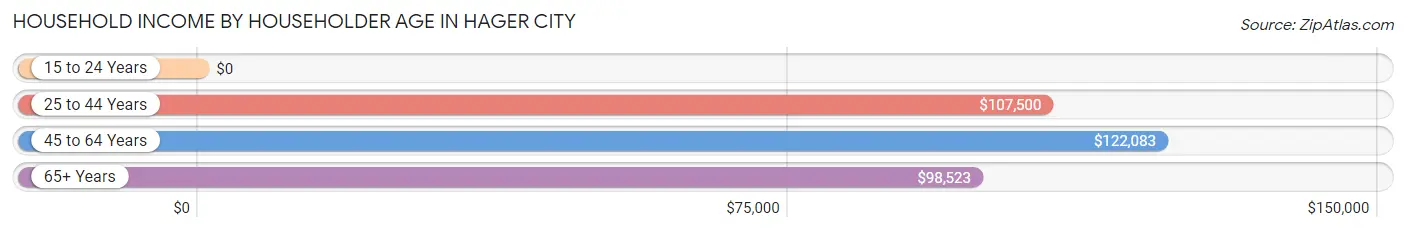
Household Income by Householder Age in Hager City
The median household income in Hager City is $99,545, with the highest median household income of $122,083 found in the 45 to 64 years age bracket for the primary householder. A total of 43 households (41.3%) fall into this category.
| Income Bracket | # Households | Median Income |
| 15 to 24 Years | 0 (0.0%) | $0 |
| 25 to 44 Years | 16 (15.4%) | $107,500 |
| 45 to 64 Years | 43 (41.3%) | $122,083 |
| 65+ Years | 45 (43.3%) | $98,523 |
| Total | 104 (100.0%) | $99,545 |
Poverty in Hager City
Income Below Poverty by Sex and Age in Hager City
With 2.5% poverty level for males and 11.3% for females among the residents of Hager City, 6 to 11 year old males and 25 to 34 year old females are the most vulnerable to poverty, with 2 males (100.0%) and 7 females (53.8%) in their respective age groups living below the poverty level.
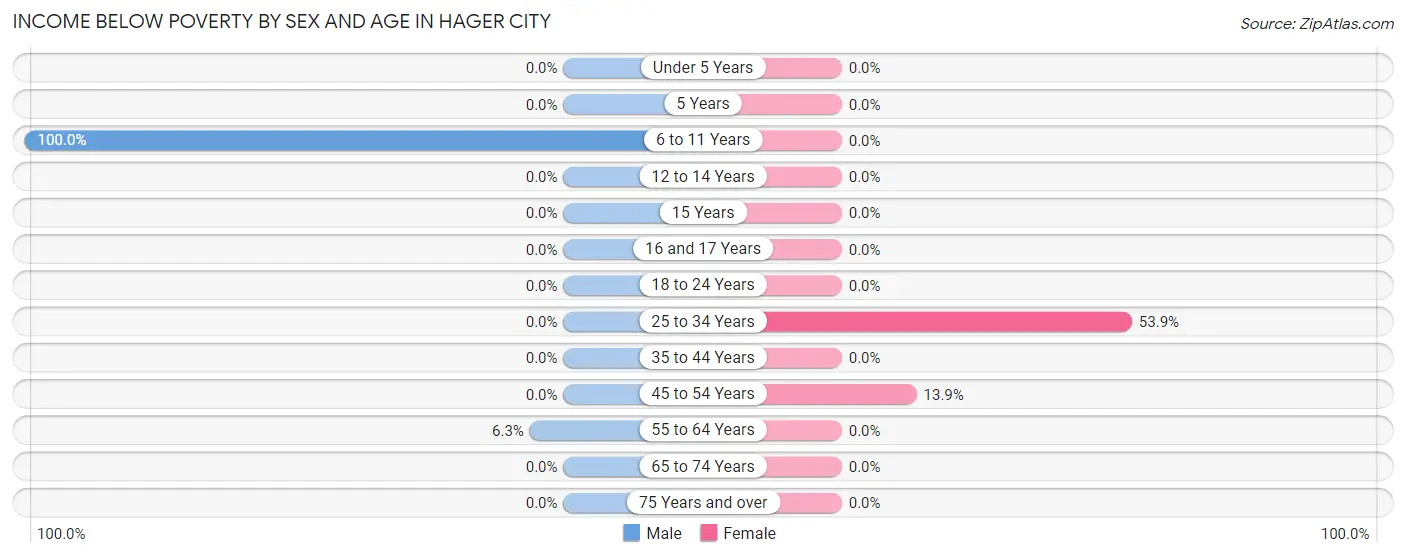
| Age Bracket | Male | Female |
| Under 5 Years | 0 (0.0%) | 0 (0.0%) |
| 5 Years | 0 (0.0%) | 0 (0.0%) |
| 6 to 11 Years | 2 (100.0%) | 0 (0.0%) |
| 12 to 14 Years | 0 (0.0%) | 0 (0.0%) |
| 15 Years | 0 (0.0%) | 0 (0.0%) |
| 16 and 17 Years | 0 (0.0%) | 0 (0.0%) |
| 18 to 24 Years | 0 (0.0%) | 0 (0.0%) |
| 25 to 34 Years | 0 (0.0%) | 7 (53.8%) |
| 35 to 44 Years | 0 (0.0%) | 0 (0.0%) |
| 45 to 54 Years | 0 (0.0%) | 5 (13.9%) |
| 55 to 64 Years | 1 (6.2%) | 0 (0.0%) |
| 65 to 74 Years | 0 (0.0%) | 0 (0.0%) |
| 75 Years and over | 0 (0.0%) | 0 (0.0%) |
| Total | 3 (2.5%) | 12 (11.3%) |
Income Above Poverty by Sex and Age in Hager City
According to the poverty statistics in Hager City, males aged under 5 years and females aged under 5 years are the age groups that are most secure financially, with 100.0% of males and 100.0% of females in these age groups living above the poverty line.
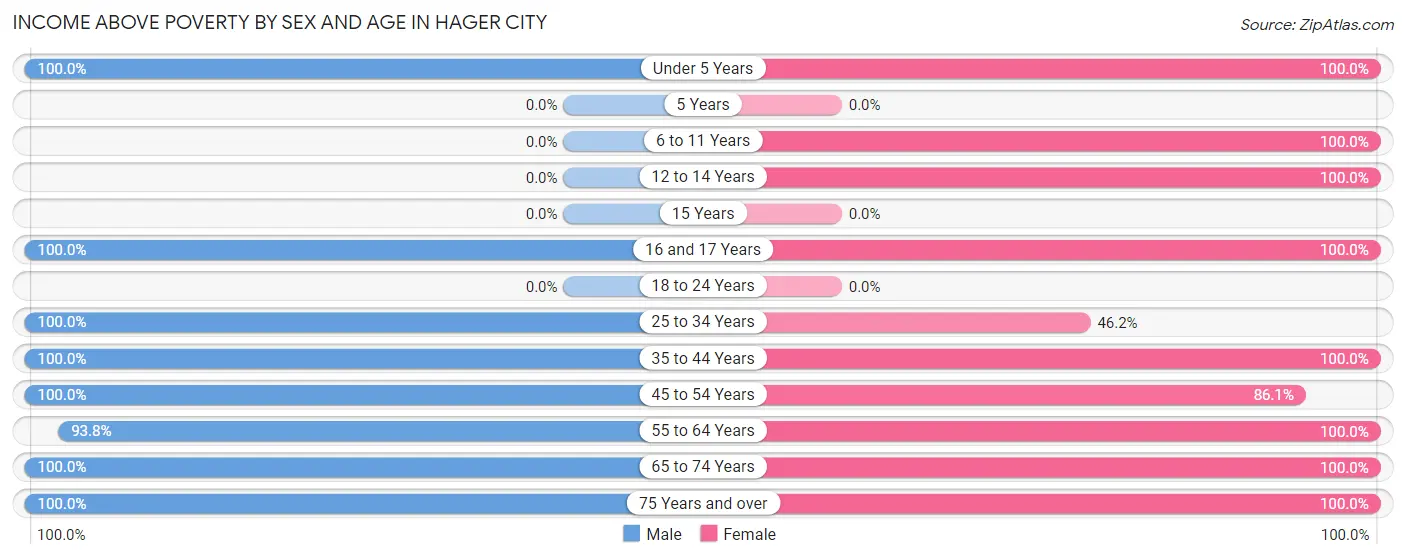
| Age Bracket | Male | Female |
| Under 5 Years | 6 (100.0%) | 6 (100.0%) |
| 5 Years | 0 (0.0%) | 0 (0.0%) |
| 6 to 11 Years | 0 (0.0%) | 7 (100.0%) |
| 12 to 14 Years | 0 (0.0%) | 5 (100.0%) |
| 15 Years | 0 (0.0%) | 0 (0.0%) |
| 16 and 17 Years | 9 (100.0%) | 6 (100.0%) |
| 18 to 24 Years | 0 (0.0%) | 0 (0.0%) |
| 25 to 34 Years | 15 (100.0%) | 6 (46.2%) |
| 35 to 44 Years | 18 (100.0%) | 12 (100.0%) |
| 45 to 54 Years | 15 (100.0%) | 31 (86.1%) |
| 55 to 64 Years | 15 (93.8%) | 10 (100.0%) |
| 65 to 74 Years | 29 (100.0%) | 9 (100.0%) |
| 75 Years and over | 11 (100.0%) | 2 (100.0%) |
| Total | 118 (97.5%) | 94 (88.7%) |
Income Below Poverty Among Married-Couple Families in Hager City
The poverty statistics for married-couple families in Hager City show that 2.1% or 1 of the total 48 families live below the poverty line. Families with no children have the highest poverty rate of 3.8%, comprising of 1 families. On the other hand, families with 1 or 2 children have the lowest poverty rate of 0.0%, which includes 0 families.
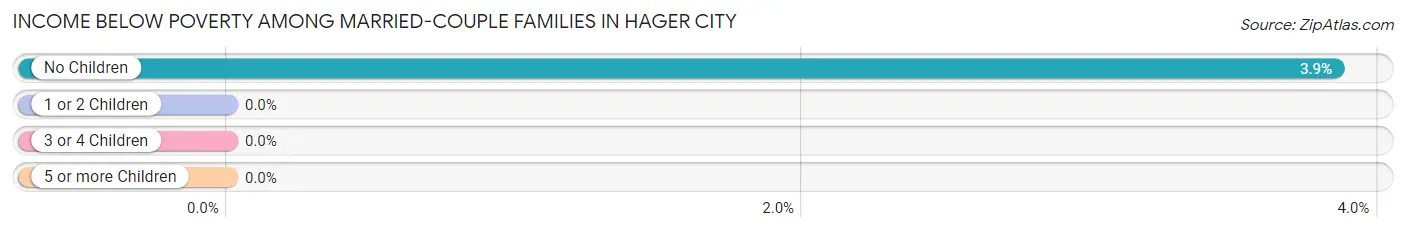
| Children | Above Poverty | Below Poverty |
| No Children | 25 (96.2%) | 1 (3.8%) |
| 1 or 2 Children | 19 (100.0%) | 0 (0.0%) |
| 3 or 4 Children | 3 (100.0%) | 0 (0.0%) |
| 5 or more Children | 0 (0.0%) | 0 (0.0%) |
| Total | 47 (97.9%) | 1 (2.1%) |
Income Below Poverty Among Single-Parent Households in Hager City
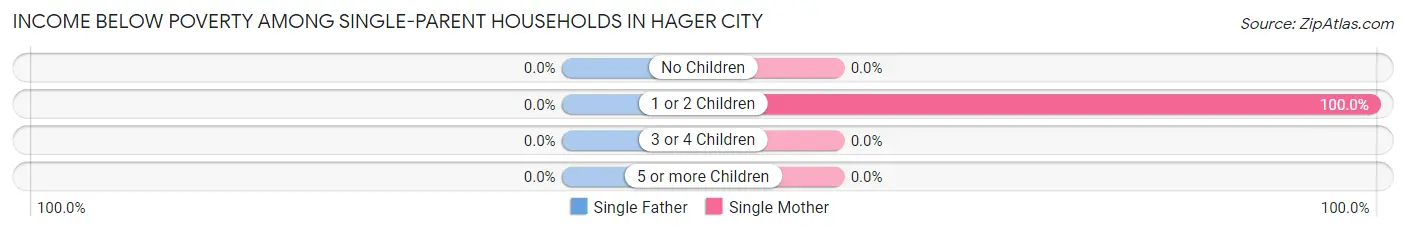
| Children | Single Father | Single Mother |
| No Children | 0 (0.0%) | 0 (0.0%) |
| 1 or 2 Children | 0 (0.0%) | 3 (100.0%) |
| 3 or 4 Children | 0 (0.0%) | 0 (0.0%) |
| 5 or more Children | 0 (0.0%) | 0 (0.0%) |
| Total | 0 (0.0%) | 3 (42.9%) |
Income Below Poverty Among Married-Couple vs Single-Parent Households in Hager City
The poverty data for Hager City shows that 1 of the married-couple family households (2.1%) and 3 of the single-parent households (10.0%) are living below the poverty level. Within the married-couple family households, those with no children have the highest poverty rate, with 1 households (3.8%) falling below the poverty line. Among the single-parent households, those with 1 or 2 children have the highest poverty rate, with 3 household (25.0%) living below poverty.
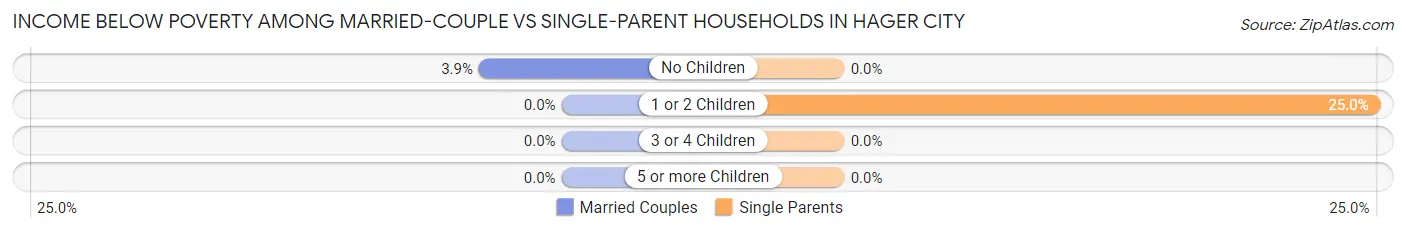
| Children | Married-Couple Families | Single-Parent Households |
| No Children | 1 (3.8%) | 0 (0.0%) |
| 1 or 2 Children | 0 (0.0%) | 3 (25.0%) |
| 3 or 4 Children | 0 (0.0%) | 0 (0.0%) |
| 5 or more Children | 0 (0.0%) | 0 (0.0%) |
| Total | 1 (2.1%) | 3 (10.0%) |
Race in Hager City
The most populous races in Hager City are White / Caucasian (216 | 95.2%), and Asian (11 | 4.9%).
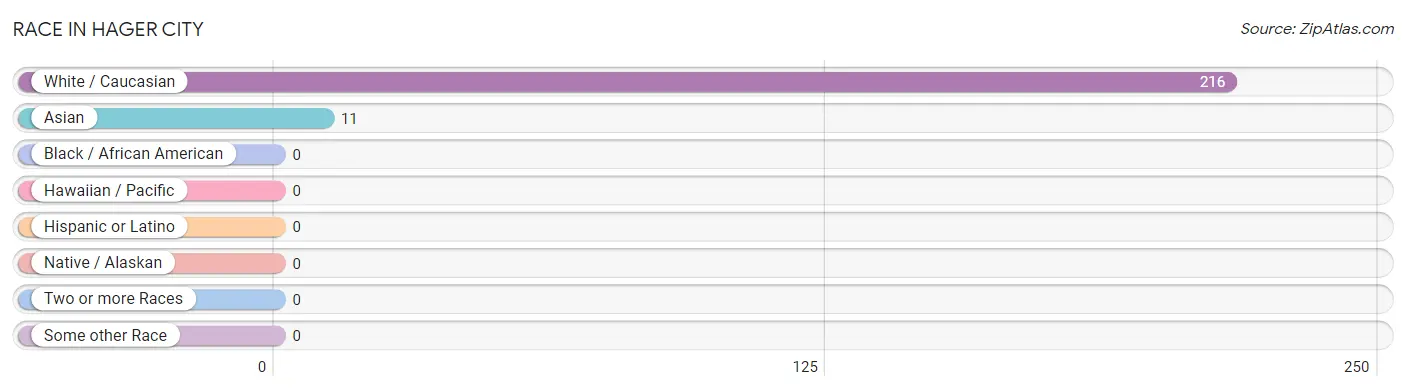
| Race | # Population | % Population |
| Asian | 11 | 4.9% |
| Black / African American | 0 | 0.0% |
| Hawaiian / Pacific | 0 | 0.0% |
| Hispanic or Latino | 0 | 0.0% |
| Native / Alaskan | 0 | 0.0% |
| White / Caucasian | 216 | 95.2% |
| Two or more Races | 0 | 0.0% |
| Some other Race | 0 | 0.0% |
| Total | 227 | 100.0% |
Ancestry in Hager City
The most populous ancestries reported in Hager City are German (101 | 44.5%), Norwegian (29 | 12.8%), Swedish (22 | 9.7%), Polish (20 | 8.8%), and Scandinavian (19 | 8.4%), together accounting for 84.1% of all Hager City residents.
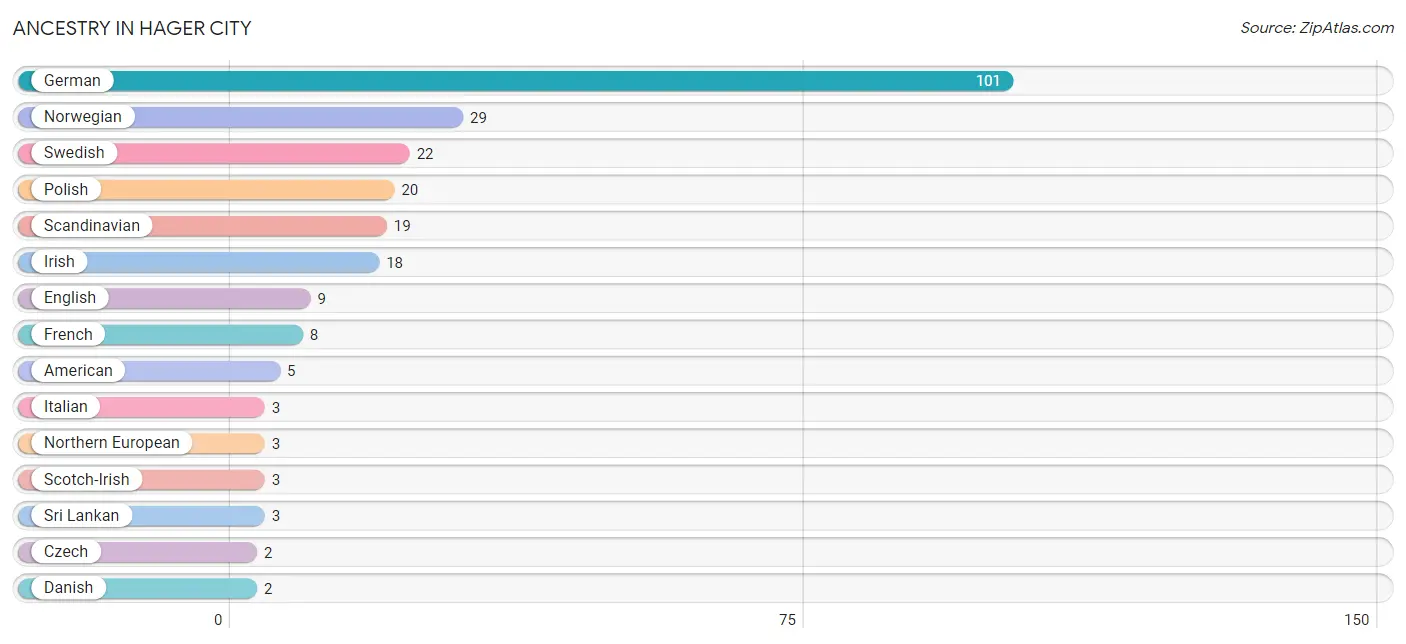
| Ancestry | # Population | % Population |
| American | 5 | 2.2% |
| Czech | 2 | 0.9% |
| Danish | 2 | 0.9% |
| English | 9 | 4.0% |
| Finnish | 2 | 0.9% |
| French | 8 | 3.5% |
| German | 101 | 44.5% |
| Irish | 18 | 7.9% |
| Italian | 3 | 1.3% |
| Northern European | 3 | 1.3% |
| Norwegian | 29 | 12.8% |
| Polish | 20 | 8.8% |
| Scandinavian | 19 | 8.4% |
| Scotch-Irish | 3 | 1.3% |
| Scottish | 2 | 0.9% |
| Sri Lankan | 3 | 1.3% |
| Swedish | 22 | 9.7% | View All 17 Rows |
Immigrants in Hager City
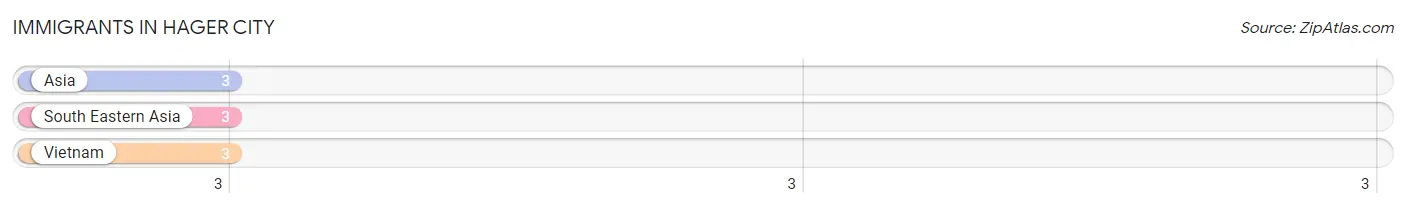
The most numerous immigrant groups reported in Hager City came from Asia (3 | 1.3%), South Eastern Asia (3 | 1.3%), and Vietnam (3 | 1.3%), together accounting for 4.0% of all Hager City residents.
| Immigration Origin | # Population | % Population |
| Asia | 3 | 1.3% |
| South Eastern Asia | 3 | 1.3% |
| Vietnam | 3 | 1.3% | View All 3 Rows |
Sex and Age in Hager City
Sex and Age in Hager City
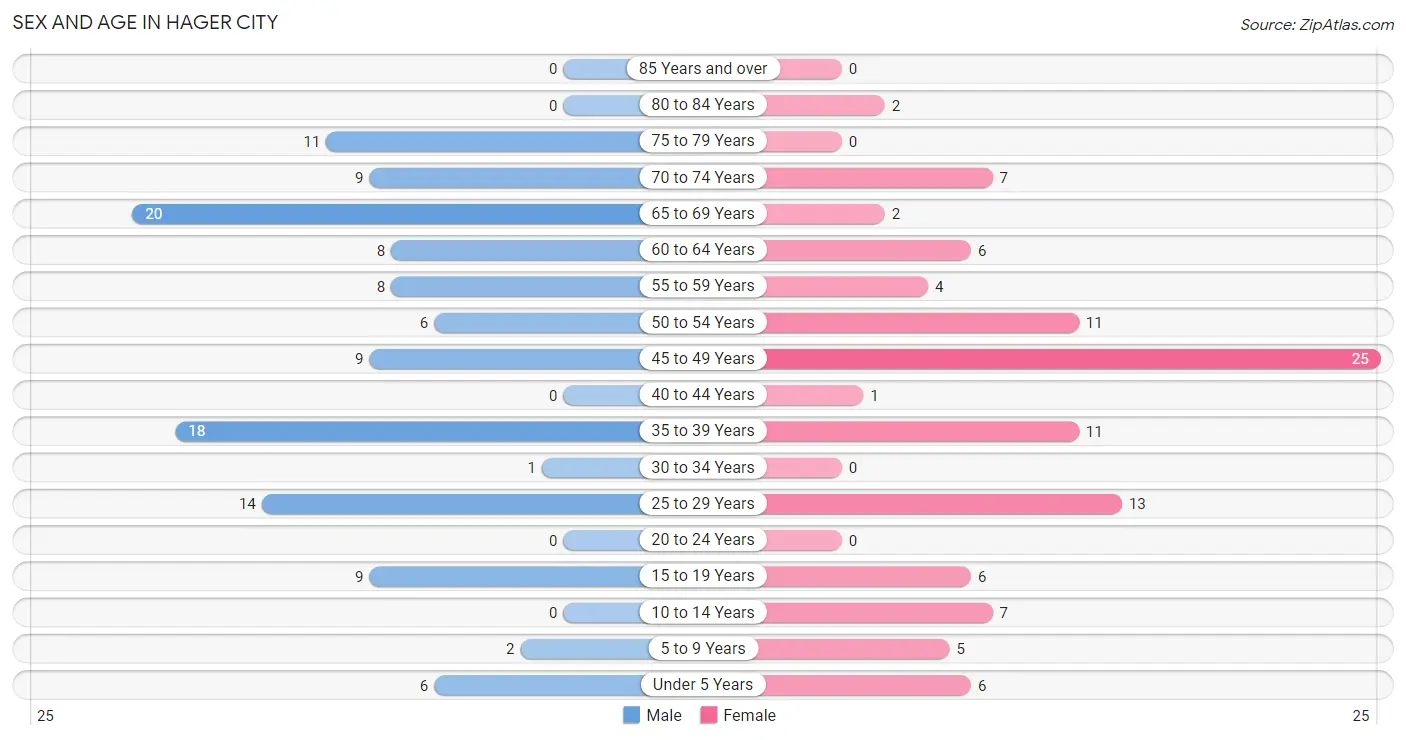
The most populous age groups in Hager City are 65 to 69 Years (20 | 16.5%) for men and 45 to 49 Years (25 | 23.6%) for women.
| Age Bracket | Male | Female |
| Under 5 Years | 6 (5.0%) | 6 (5.7%) |
| 5 to 9 Years | 2 (1.7%) | 5 (4.7%) |
| 10 to 14 Years | 0 (0.0%) | 7 (6.6%) |
| 15 to 19 Years | 9 (7.4%) | 6 (5.7%) |
| 20 to 24 Years | 0 (0.0%) | 0 (0.0%) |
| 25 to 29 Years | 14 (11.6%) | 13 (12.3%) |
| 30 to 34 Years | 1 (0.8%) | 0 (0.0%) |
| 35 to 39 Years | 18 (14.9%) | 11 (10.4%) |
| 40 to 44 Years | 0 (0.0%) | 1 (0.9%) |
| 45 to 49 Years | 9 (7.4%) | 25 (23.6%) |
| 50 to 54 Years | 6 (5.0%) | 11 (10.4%) |
| 55 to 59 Years | 8 (6.6%) | 4 (3.8%) |
| 60 to 64 Years | 8 (6.6%) | 6 (5.7%) |
| 65 to 69 Years | 20 (16.5%) | 2 (1.9%) |
| 70 to 74 Years | 9 (7.4%) | 7 (6.6%) |
| 75 to 79 Years | 11 (9.1%) | 0 (0.0%) |
| 80 to 84 Years | 0 (0.0%) | 2 (1.9%) |
| 85 Years and over | 0 (0.0%) | 0 (0.0%) |
| Total | 121 (100.0%) | 106 (100.0%) |
Families and Households in Hager City
Median Family Size in Hager City
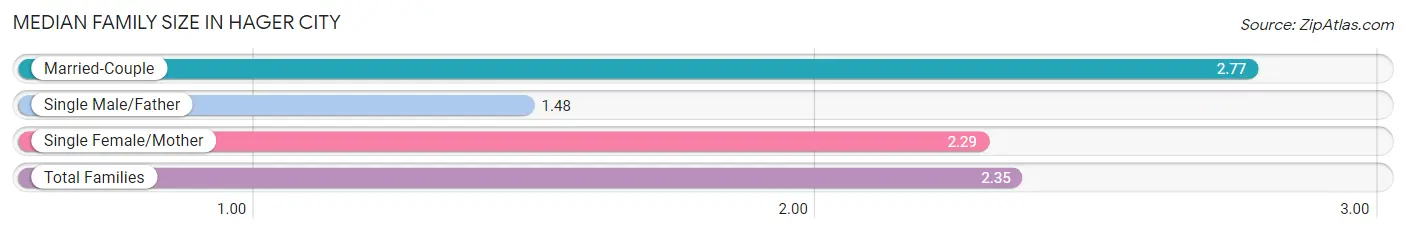
The median family size in Hager City is 2.35 persons per family, with married-couple families (48 | 61.5%) accounting for the largest median family size of 2.77 persons per family. On the other hand, single male/father families (23 | 29.5%) represent the smallest median family size with 1.48 persons per family.
| Family Type | # Families | Family Size |
| Married-Couple | 48 (61.5%) | 2.77 |
| Single Male/Father | 23 (29.5%) | 1.48 |
| Single Female/Mother | 7 (9.0%) | 2.29 |
| Total Families | 78 (100.0%) | 2.35 |
Median Household Size in Hager City
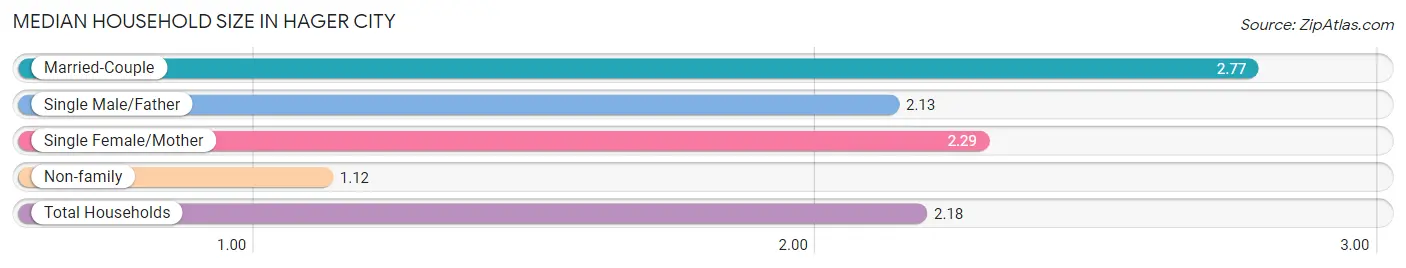
The median household size in Hager City is 2.18 persons per household, with married-couple households (48 | 46.2%) accounting for the largest median household size of 2.77 persons per household. non-family households (26 | 25.0%) represent the smallest median household size with 1.12 persons per household.
| Household Type | # Households | Household Size |
| Married-Couple | 48 (46.2%) | 2.77 |
| Single Male/Father | 23 (22.1%) | 2.13 |
| Single Female/Mother | 7 (6.7%) | 2.29 |
| Non-family | 26 (25.0%) | 1.12 |
| Total Households | 104 (100.0%) | 2.18 |
Household Size by Marriage Status in Hager City
Out of a total of 104 households in Hager City, 78 (75.0%) are family households, while 26 (25.0%) are nonfamily households. The most numerous type of family households are 3-person households, comprising 37, and the most common type of nonfamily households are 1-person households, comprising 23.
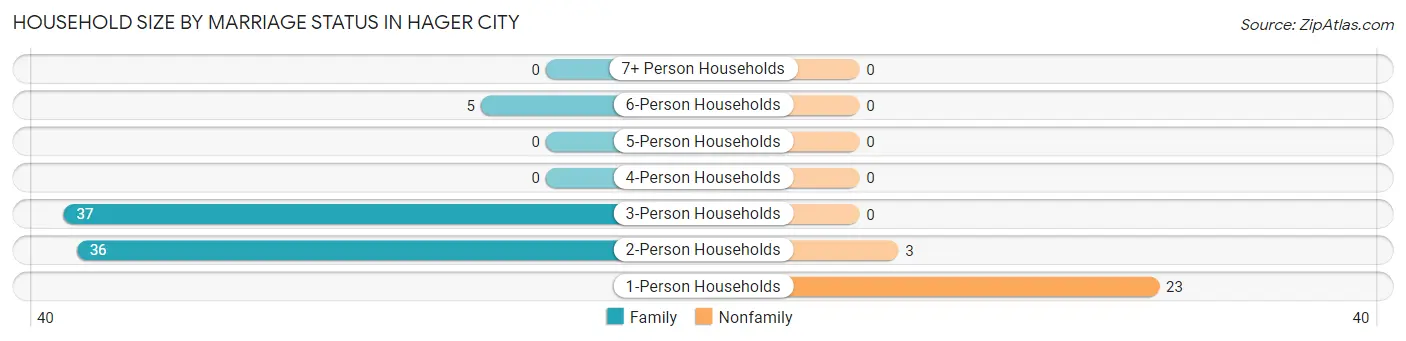
| Household Size | Family Households | Nonfamily Households |
| 1-Person Households | - | 23 (22.1%) |
| 2-Person Households | 36 (34.6%) | 3 (2.9%) |
| 3-Person Households | 37 (35.6%) | 0 (0.0%) |
| 4-Person Households | 0 (0.0%) | 0 (0.0%) |
| 5-Person Households | 0 (0.0%) | 0 (0.0%) |
| 6-Person Households | 5 (4.8%) | 0 (0.0%) |
| 7+ Person Households | 0 (0.0%) | 0 (0.0%) |
| Total | 78 (75.0%) | 26 (25.0%) |
Female Fertility in Hager City
Fertility by Age in Hager City
Average fertility rate in Hager City is 125.0 births per 1,000 women. Women in the age bracket of 20 to 34 years have the highest fertility rate with 538.0 births per 1,000 women. Women in the age bracket of 20 to 34 years acount for 100.0% of all women with births.
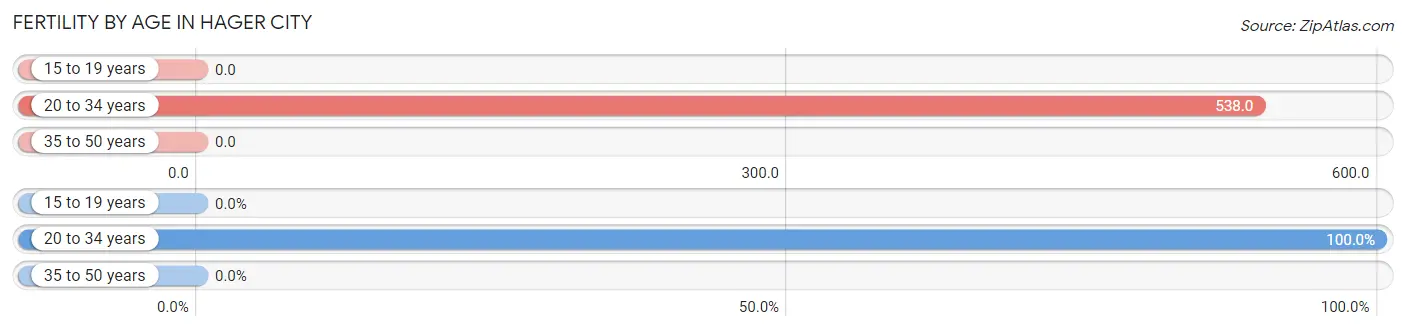
| Age Bracket | Women with Births | Births / 1,000 Women |
| 15 to 19 years | 0 (0.0%) | 0.0 |
| 20 to 34 years | 7 (100.0%) | 538.0 |
| 35 to 50 years | 0 (0.0%) | 0.0 |
| Total | 7 (100.0%) | 125.0 |
Fertility by Age by Marriage Status in Hager City
28.6% of women with births (7) in Hager City are married. The highest percentage of unmarried women with births falls into 20 to 34 years age bracket with 71.4% of them unmarried at the time of birth, while the lowest percentage of unmarried women with births belong to 20 to 34 years age bracket with 71.4% of them unmarried.

| Age Bracket | Married | Unmarried |
| 15 to 19 years | 0 (0.0%) | 0 (0.0%) |
| 20 to 34 years | 2 (28.6%) | 5 (71.4%) |
| 35 to 50 years | 0 (0.0%) | 0 (0.0%) |
| Total | 2 (28.6%) | 5 (71.4%) |
Fertility by Education in Hager City
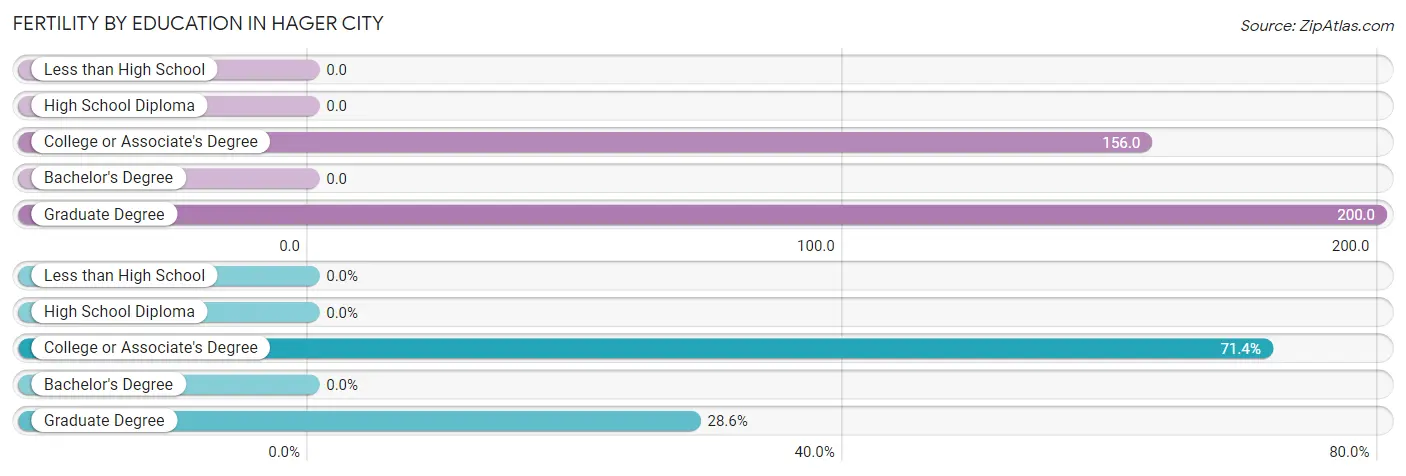
| Educational Attainment | Women with Births | Births / 1,000 Women |
| Less than High School | 0 (0.0%) | 0.0 |
| High School Diploma | 0 (0.0%) | 0.0 |
| College or Associate's Degree | 5 (71.4%) | 156.0 |
| Bachelor's Degree | 0 (0.0%) | 0.0 |
| Graduate Degree | 2 (28.6%) | 200.0 |
| Total | 7 (100.0%) | 125.0 |
Fertility by Education by Marriage Status in Hager City
71.4% of women with births in Hager City are unmarried. Women with the educational attainment of graduate degree are most likely to be married with 100.0% of them married at childbirth, while women with the educational attainment of college or associate's degree are least likely to be married with 100.0% of them unmarried at childbirth.
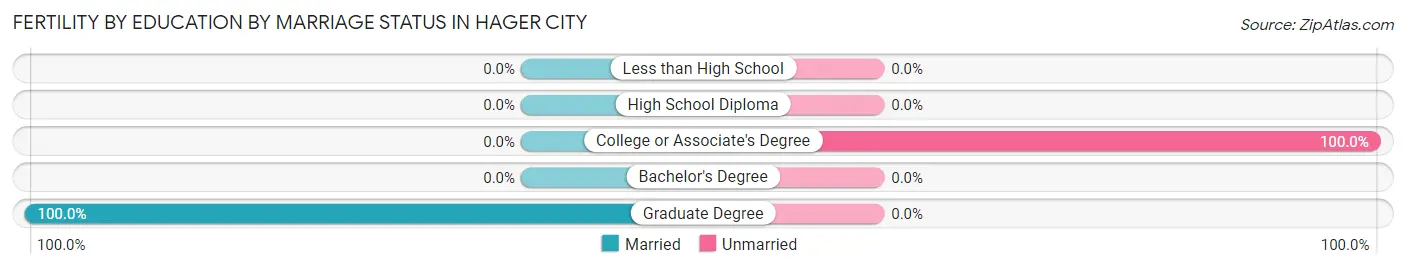
| Educational Attainment | Married | Unmarried |
| Less than High School | 0 (0.0%) | 0 (0.0%) |
| High School Diploma | 0 (0.0%) | 0 (0.0%) |
| College or Associate's Degree | 0 (0.0%) | 5 (100.0%) |
| Bachelor's Degree | 0 (0.0%) | 0 (0.0%) |
| Graduate Degree | 2 (100.0%) | 0 (0.0%) |
| Total | 2 (28.6%) | 5 (71.4%) |
Employment Characteristics in Hager City
Employment by Class of Employer in Hager City
Among the 139 employed individuals in Hager City, private company employees (119 | 85.6%), local government employees (8 | 5.8%), and state government employees (5 | 3.6%) make up the most common classes of employment.
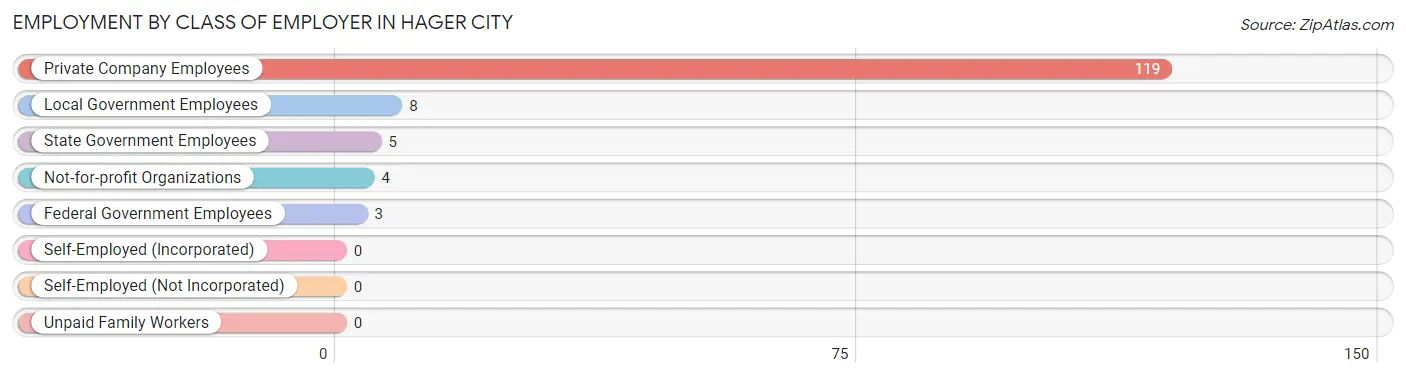
| Employer Class | # Employees | % Employees |
| Private Company Employees | 119 | 85.6% |
| Self-Employed (Incorporated) | 0 | 0.0% |
| Self-Employed (Not Incorporated) | 0 | 0.0% |
| Not-for-profit Organizations | 4 | 2.9% |
| Local Government Employees | 8 | 5.8% |
| State Government Employees | 5 | 3.6% |
| Federal Government Employees | 3 | 2.2% |
| Unpaid Family Workers | 0 | 0.0% |
| Total | 139 | 100.0% |
Employment Status by Age in Hager City
According to the labor force statistics for Hager City, out of the total population over 16 years of age (201), 70.6% or 142 individuals are in the labor force, with 2.1% or 3 of them unemployed. The age group with the highest labor force participation rate is 30 to 34 years, with 100.0% or 1 individuals in the labor force. Within the labor force, the 60 to 64 years age range has the highest percentage of unemployed individuals, with 7.1% or 1 of them being unemployed.
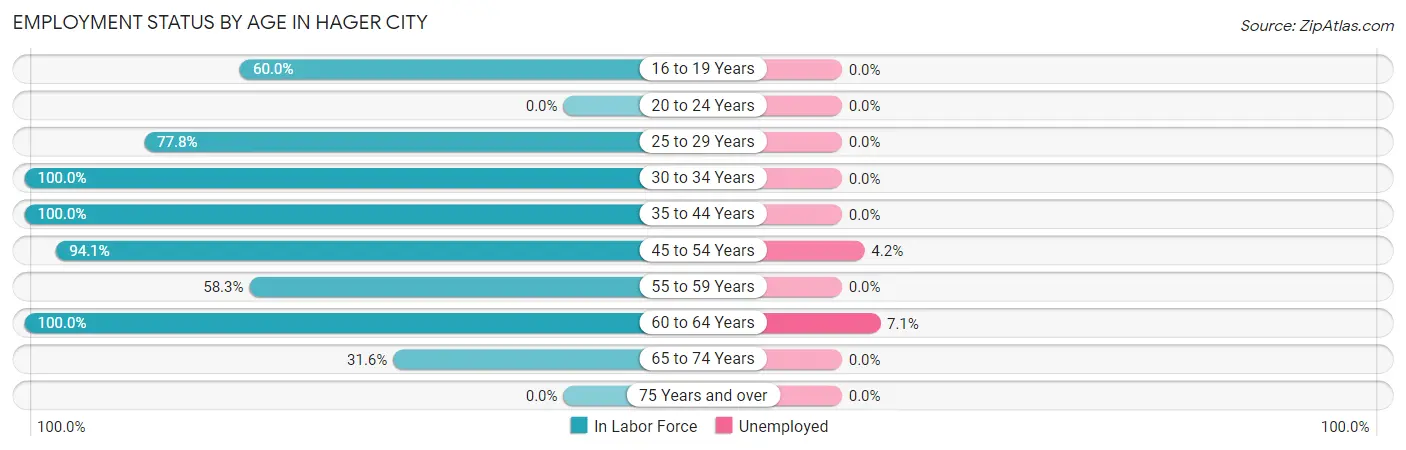
| Age Bracket | In Labor Force | Unemployed |
| 16 to 19 Years | 9 (60.0%) | 0 (0.0%) |
| 20 to 24 Years | 0 (0.0%) | 0 (0.0%) |
| 25 to 29 Years | 21 (77.8%) | 0 (0.0%) |
| 30 to 34 Years | 1 (100.0%) | 0 (0.0%) |
| 35 to 44 Years | 30 (100.0%) | 0 (0.0%) |
| 45 to 54 Years | 48 (94.1%) | 2 (4.2%) |
| 55 to 59 Years | 7 (58.3%) | 0 (0.0%) |
| 60 to 64 Years | 14 (100.0%) | 1 (7.1%) |
| 65 to 74 Years | 12 (31.6%) | 0 (0.0%) |
| 75 Years and over | 0 (0.0%) | 0 (0.0%) |
| Total | 142 (70.6%) | 3 (2.1%) |
Employment Status by Educational Attainment in Hager City
According to labor force statistics for Hager City, 89.6% of individuals (121) out of the total population between 25 and 64 years of age (135) are in the labor force, with 2.5% or 3 of them being unemployed. The group with the highest labor force participation rate are those with the educational attainment of less than high school, with 100.0% or 2 individuals in the labor force. Within the labor force, individuals with less than high school education have the highest percentage of unemployment, with 100.0% or 2 of them being unemployed.
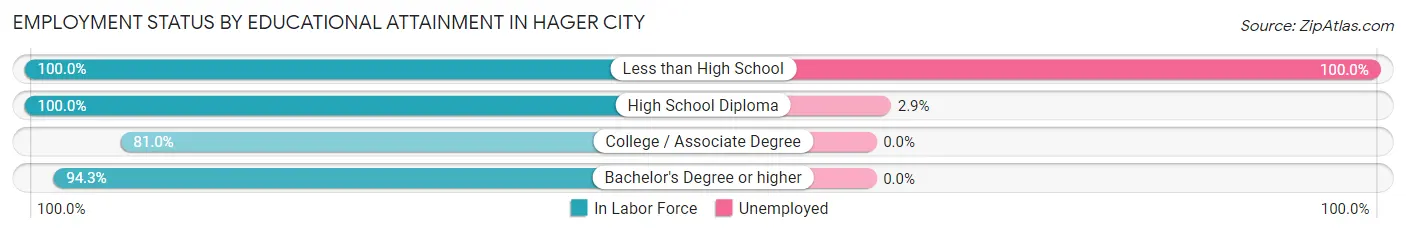
| Educational Attainment | In Labor Force | Unemployed |
| Less than High School | 2 (100.0%) | 2 (100.0%) |
| High School Diploma | 35 (100.0%) | 1 (2.9%) |
| College / Associate Degree | 51 (81.0%) | 0 (0.0%) |
| Bachelor's Degree or higher | 33 (94.3%) | 0 (0.0%) |
| Total | 121 (89.6%) | 3 (2.5%) |
Employment Occupations by Sex in Hager City
Management, Business, Science and Arts Occupations
The most common Management, Business, Science and Arts occupations in Hager City are Management (12 | 8.6%), Business & Financial (8 | 5.8%), Health Diagnosing & Treating (6 | 4.3%), Community & Social Service (4 | 2.9%), and Education, Arts & Media (2 | 1.4%).
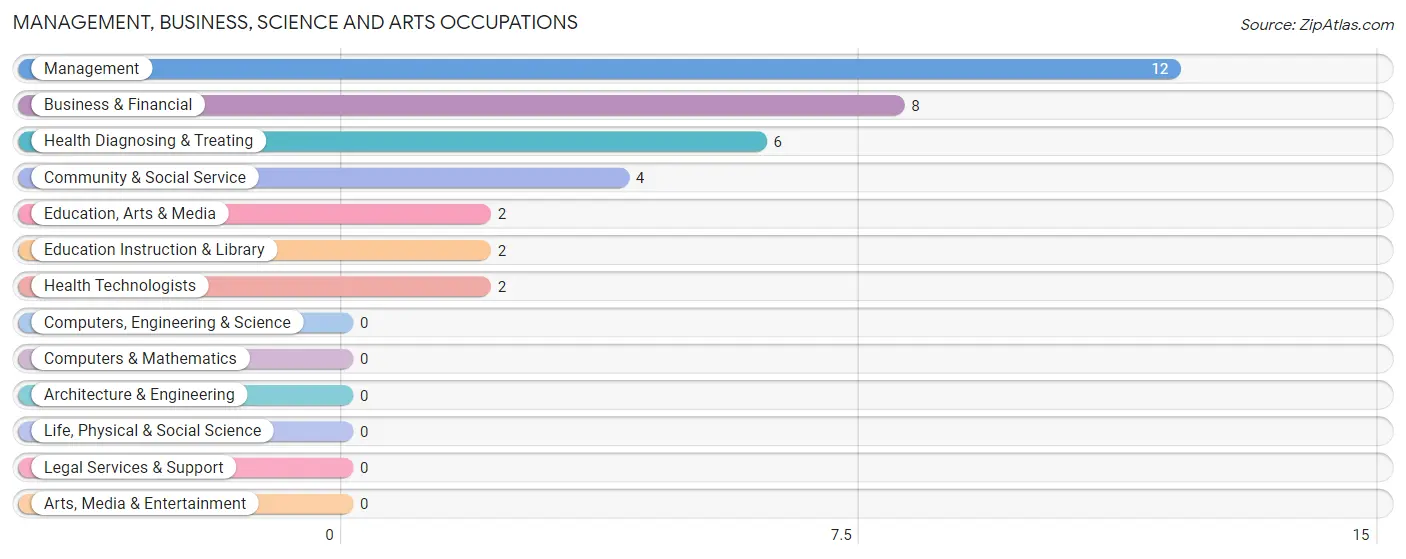
Management, Business, Science and Arts Occupations by Sex
Within the Management, Business, Science and Arts occupations in Hager City, the most male-oriented occupations are Management (75.0%), and Business & Financial (25.0%), while the most female-oriented occupations are Community & Social Service (100.0%), Education, Arts & Media (100.0%), and Education Instruction & Library (100.0%).
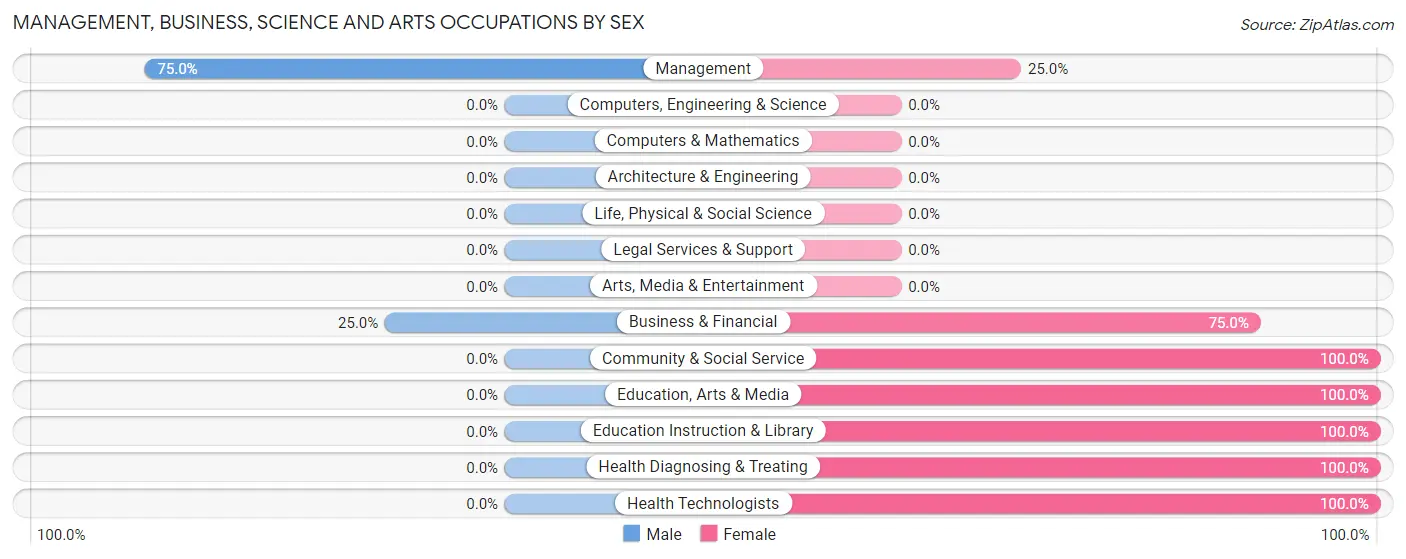
| Occupation | Male | Female |
| Management | 9 (75.0%) | 3 (25.0%) |
| Business & Financial | 2 (25.0%) | 6 (75.0%) |
| Computers, Engineering & Science | 0 (0.0%) | 0 (0.0%) |
| Computers & Mathematics | 0 (0.0%) | 0 (0.0%) |
| Architecture & Engineering | 0 (0.0%) | 0 (0.0%) |
| Life, Physical & Social Science | 0 (0.0%) | 0 (0.0%) |
| Community & Social Service | 0 (0.0%) | 4 (100.0%) |
| Education, Arts & Media | 0 (0.0%) | 2 (100.0%) |
| Legal Services & Support | 0 (0.0%) | 0 (0.0%) |
| Education Instruction & Library | 0 (0.0%) | 2 (100.0%) |
| Arts, Media & Entertainment | 0 (0.0%) | 0 (0.0%) |
| Health Diagnosing & Treating | 0 (0.0%) | 6 (100.0%) |
| Health Technologists | 0 (0.0%) | 2 (100.0%) |
| Total (Category) | 11 (36.7%) | 19 (63.3%) |
| Total (Overall) | 73 (52.5%) | 66 (47.5%) |
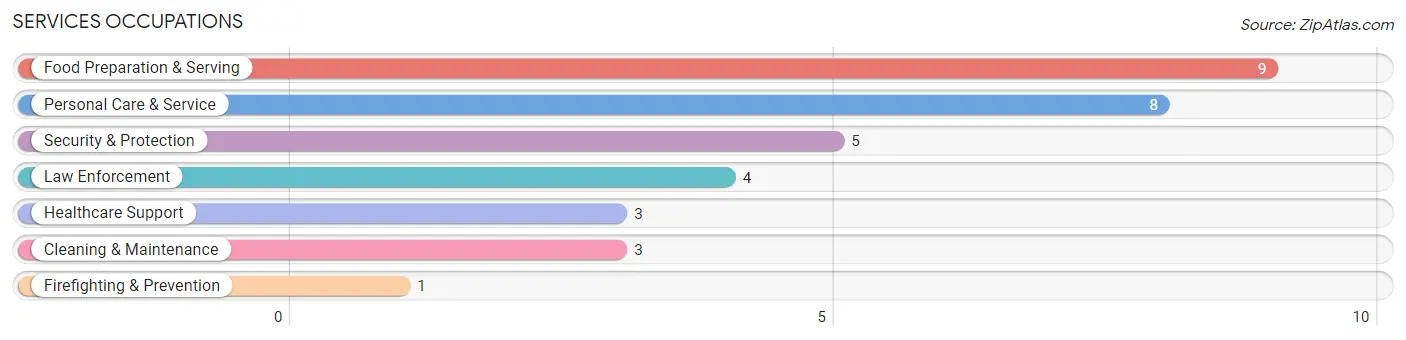
Services Occupations
The most common Services occupations in Hager City are Food Preparation & Serving (9 | 6.5%), Personal Care & Service (8 | 5.8%), Security & Protection (5 | 3.6%), Law Enforcement (4 | 2.9%), and Healthcare Support (3 | 2.2%).
Services Occupations by Sex
Within the Services occupations in Hager City, the most male-oriented occupations are Security & Protection (100.0%), Firefighting & Prevention (100.0%), and Law Enforcement (100.0%), while the most female-oriented occupations are Healthcare Support (100.0%), Personal Care & Service (100.0%), and Food Preparation & Serving (66.7%).
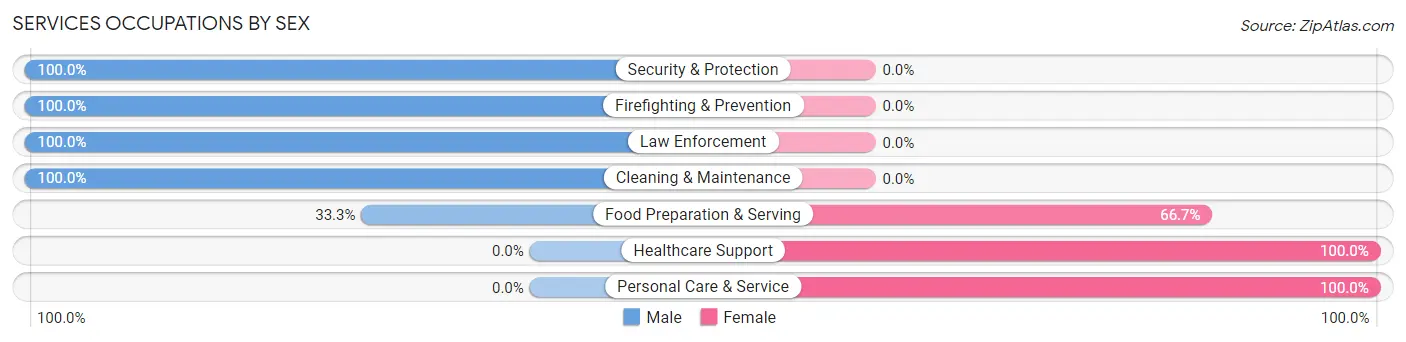
| Occupation | Male | Female |
| Healthcare Support | 0 (0.0%) | 3 (100.0%) |
| Security & Protection | 5 (100.0%) | 0 (0.0%) |
| Firefighting & Prevention | 1 (100.0%) | 0 (0.0%) |
| Law Enforcement | 4 (100.0%) | 0 (0.0%) |
| Food Preparation & Serving | 3 (33.3%) | 6 (66.7%) |
| Cleaning & Maintenance | 3 (100.0%) | 0 (0.0%) |
| Personal Care & Service | 0 (0.0%) | 8 (100.0%) |
| Total (Category) | 11 (39.3%) | 17 (60.7%) |
| Total (Overall) | 73 (52.5%) | 66 (47.5%) |
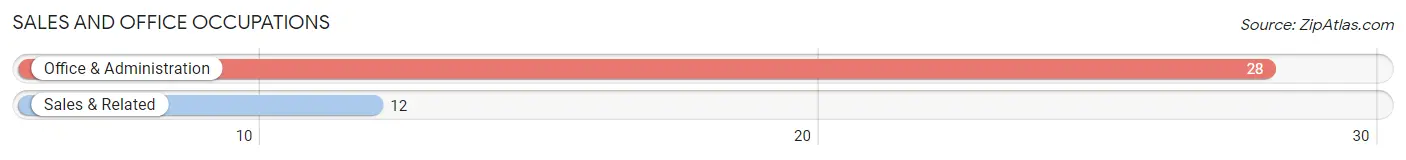
Sales and Office Occupations
The most common Sales and Office occupations in Hager City are Office & Administration (28 | 20.1%), and Sales & Related (12 | 8.6%).
Sales and Office Occupations by Sex
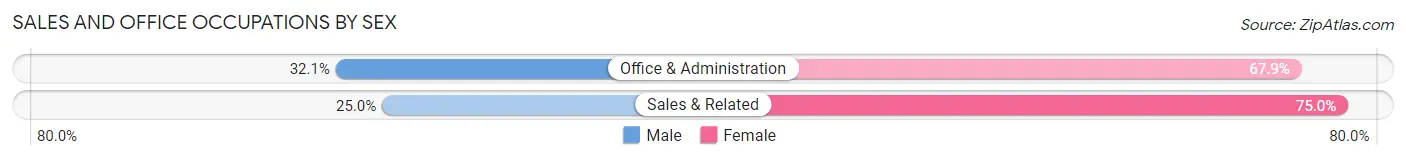
| Occupation | Male | Female |
| Sales & Related | 3 (25.0%) | 9 (75.0%) |
| Office & Administration | 9 (32.1%) | 19 (67.9%) |
| Total (Category) | 12 (30.0%) | 28 (70.0%) |
| Total (Overall) | 73 (52.5%) | 66 (47.5%) |
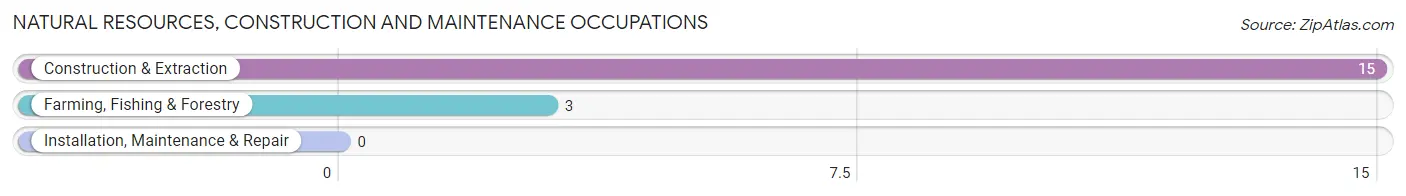
Natural Resources, Construction and Maintenance Occupations
The most common Natural Resources, Construction and Maintenance occupations in Hager City are Construction & Extraction (15 | 10.8%), and Farming, Fishing & Forestry (3 | 2.2%).
Natural Resources, Construction and Maintenance Occupations by Sex
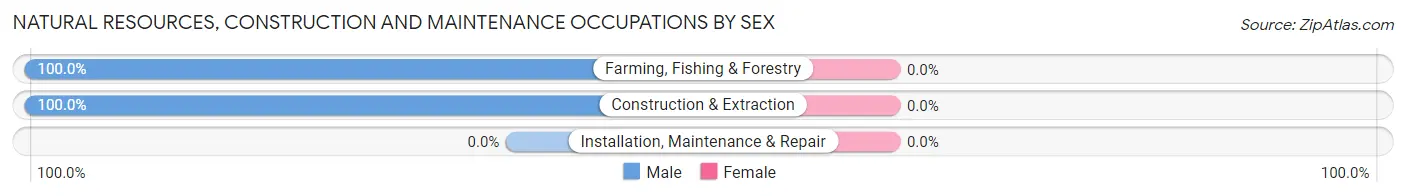
| Occupation | Male | Female |
| Farming, Fishing & Forestry | 3 (100.0%) | 0 (0.0%) |
| Construction & Extraction | 15 (100.0%) | 0 (0.0%) |
| Installation, Maintenance & Repair | 0 (0.0%) | 0 (0.0%) |
| Total (Category) | 18 (100.0%) | 0 (0.0%) |
| Total (Overall) | 73 (52.5%) | 66 (47.5%) |
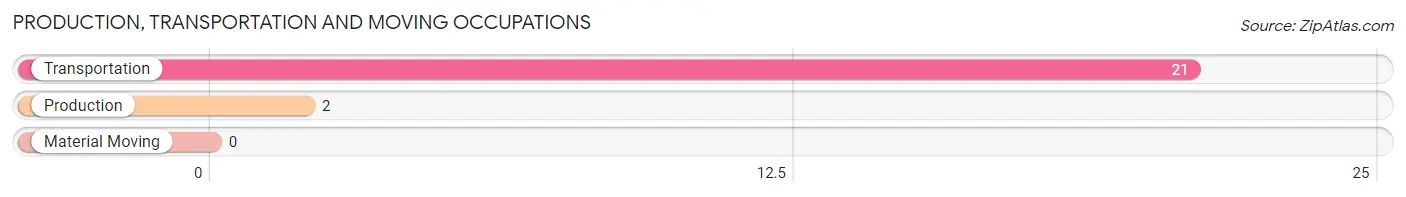
Production, Transportation and Moving Occupations
The most common Production, Transportation and Moving occupations in Hager City are Transportation (21 | 15.1%), and Production (2 | 1.4%).
Production, Transportation and Moving Occupations by Sex
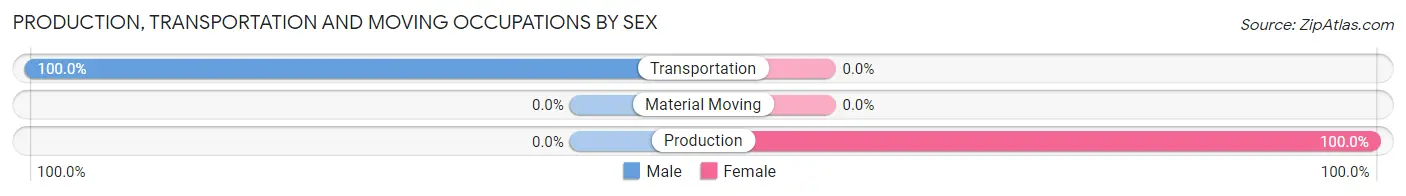
| Occupation | Male | Female |
| Production | 0 (0.0%) | 2 (100.0%) |
| Transportation | 21 (100.0%) | 0 (0.0%) |
| Material Moving | 0 (0.0%) | 0 (0.0%) |
| Total (Category) | 21 (91.3%) | 2 (8.7%) |
| Total (Overall) | 73 (52.5%) | 66 (47.5%) |
Employment Industries by Sex in Hager City
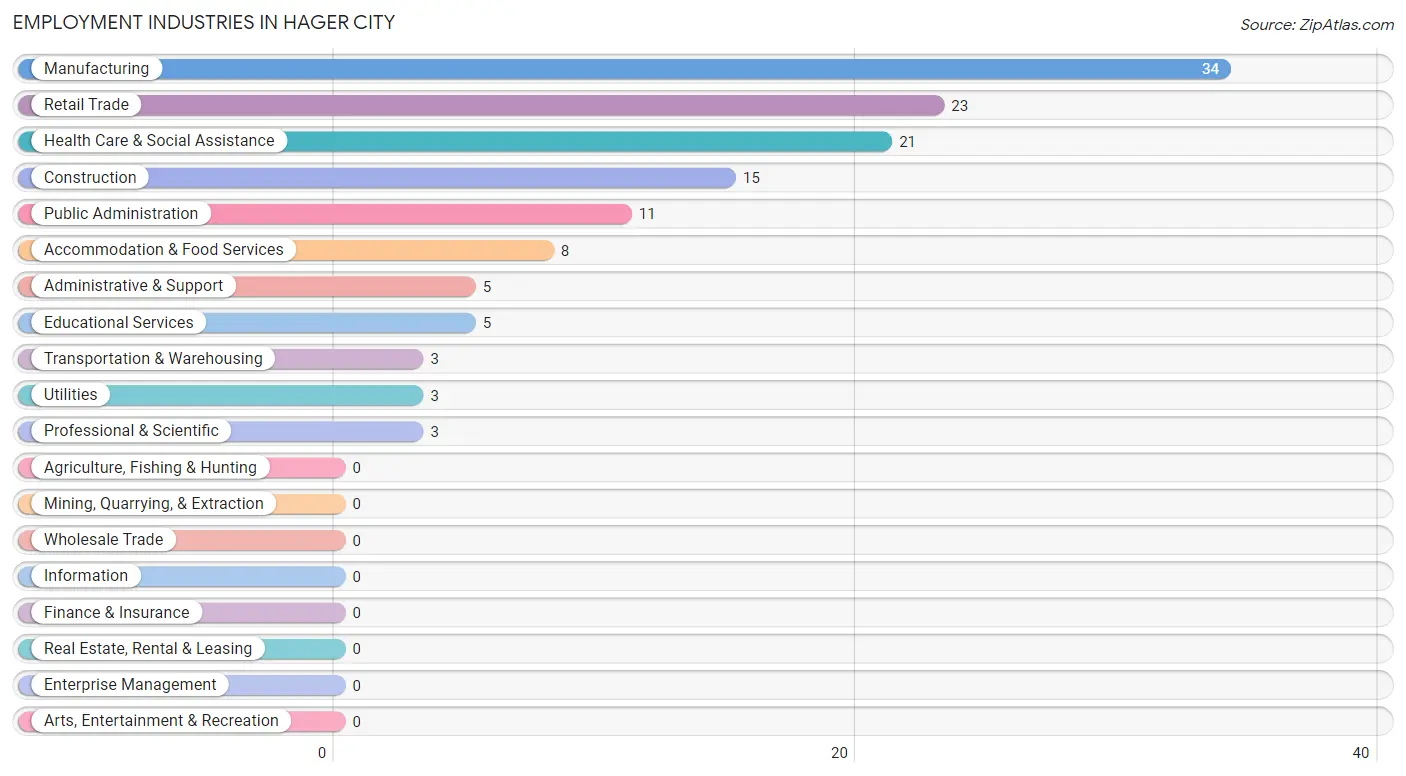
Employment Industries in Hager City
The major employment industries in Hager City include Manufacturing (34 | 24.5%), Retail Trade (23 | 16.6%), Health Care & Social Assistance (21 | 15.1%), Construction (15 | 10.8%), and Public Administration (11 | 7.9%).
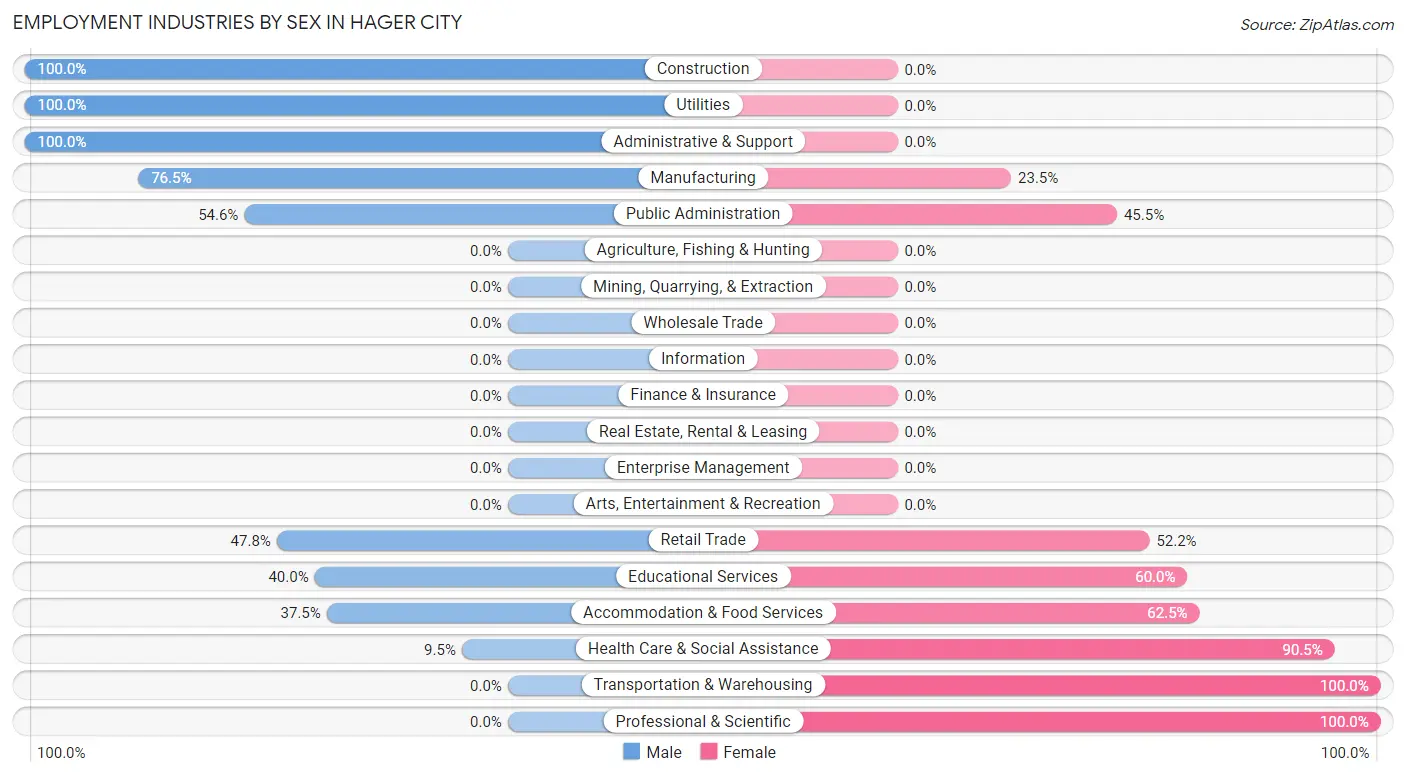
Employment Industries by Sex in Hager City
The Hager City industries that see more men than women are Construction (100.0%), Utilities (100.0%), and Administrative & Support (100.0%), whereas the industries that tend to have a higher number of women are Transportation & Warehousing (100.0%), Professional & Scientific (100.0%), and Health Care & Social Assistance (90.5%).
| Industry | Male | Female |
| Agriculture, Fishing & Hunting | 0 (0.0%) | 0 (0.0%) |
| Mining, Quarrying, & Extraction | 0 (0.0%) | 0 (0.0%) |
| Construction | 15 (100.0%) | 0 (0.0%) |
| Manufacturing | 26 (76.5%) | 8 (23.5%) |
| Wholesale Trade | 0 (0.0%) | 0 (0.0%) |
| Retail Trade | 11 (47.8%) | 12 (52.2%) |
| Transportation & Warehousing | 0 (0.0%) | 3 (100.0%) |
| Utilities | 3 (100.0%) | 0 (0.0%) |
| Information | 0 (0.0%) | 0 (0.0%) |
| Finance & Insurance | 0 (0.0%) | 0 (0.0%) |
| Real Estate, Rental & Leasing | 0 (0.0%) | 0 (0.0%) |
| Professional & Scientific | 0 (0.0%) | 3 (100.0%) |
| Enterprise Management | 0 (0.0%) | 0 (0.0%) |
| Administrative & Support | 5 (100.0%) | 0 (0.0%) |
| Educational Services | 2 (40.0%) | 3 (60.0%) |
| Health Care & Social Assistance | 2 (9.5%) | 19 (90.5%) |
| Arts, Entertainment & Recreation | 0 (0.0%) | 0 (0.0%) |
| Accommodation & Food Services | 3 (37.5%) | 5 (62.5%) |
| Public Administration | 6 (54.5%) | 5 (45.5%) |
| Total | 73 (52.5%) | 66 (47.5%) |
Education in Hager City
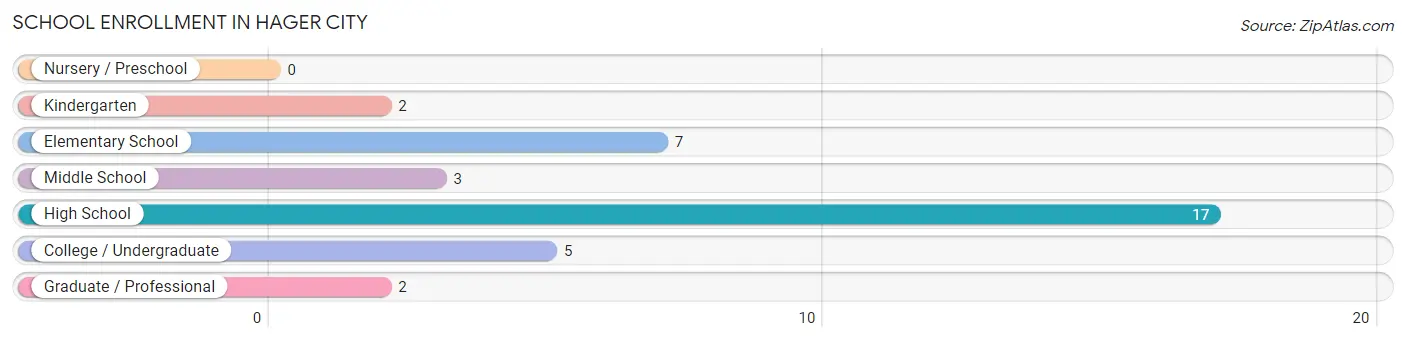
School Enrollment in Hager City
The most common levels of schooling among the 36 students in Hager City are high school (17 | 47.2%), elementary school (7 | 19.4%), and college / undergraduate (5 | 13.9%).
| School Level | # Students | % Students |
| Nursery / Preschool | 0 | 0.0% |
| Kindergarten | 2 | 5.6% |
| Elementary School | 7 | 19.4% |
| Middle School | 3 | 8.3% |
| High School | 17 | 47.2% |
| College / Undergraduate | 5 | 13.9% |
| Graduate / Professional | 2 | 5.6% |
| Total | 36 | 100.0% |
School Enrollment by Age by Funding Source in Hager City
Out of a total of 36 students who are enrolled in schools in Hager City, 2 (5.6%) attend a private institution, while the remaining 34 (94.4%) are enrolled in public schools. The age group of 25 to 34 year olds has the highest likelihood of being enrolled in private schools, with 2 (28.6% in the age bracket) enrolled. Conversely, the age group of 5 to 9 year old has the lowest likelihood of being enrolled in a private school, with 7 (100.0% in the age bracket) attending a public institution.
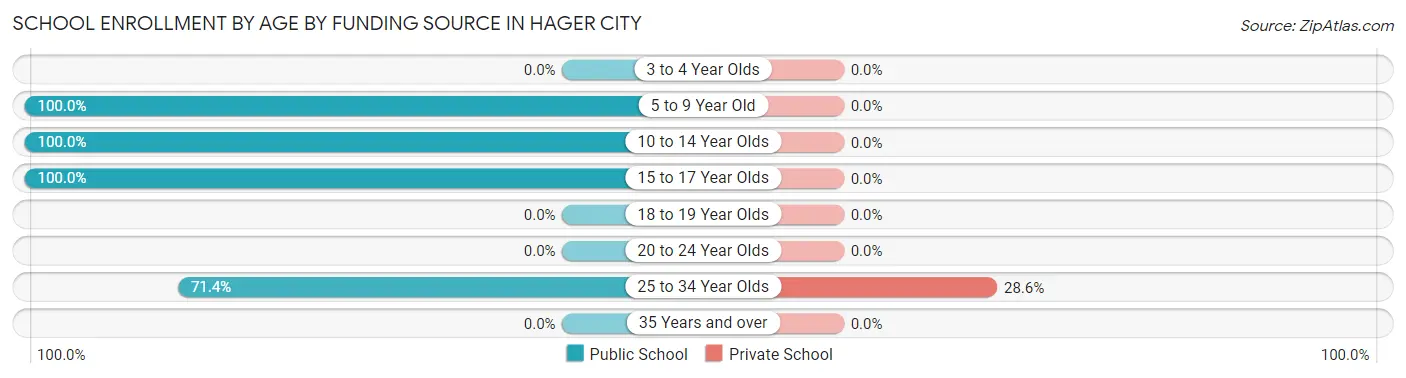
| Age Bracket | Public School | Private School |
| 3 to 4 Year Olds | 0 (0.0%) | 0 (0.0%) |
| 5 to 9 Year Old | 7 (100.0%) | 0 (0.0%) |
| 10 to 14 Year Olds | 7 (100.0%) | 0 (0.0%) |
| 15 to 17 Year Olds | 15 (100.0%) | 0 (0.0%) |
| 18 to 19 Year Olds | 0 (0.0%) | 0 (0.0%) |
| 20 to 24 Year Olds | 0 (0.0%) | 0 (0.0%) |
| 25 to 34 Year Olds | 5 (71.4%) | 2 (28.6%) |
| 35 Years and over | 0 (0.0%) | 0 (0.0%) |
| Total | 34 (94.4%) | 2 (5.6%) |
Educational Attainment by Field of Study in Hager City
Business (19 | 34.5%), bio, nature & agricultural (8 | 14.5%), visual & performing arts (8 | 14.5%), computers & mathematics (6 | 10.9%), and science & technology (4 | 7.3%) are the most common fields of study among 55 individuals in Hager City who have obtained a bachelor's degree or higher.
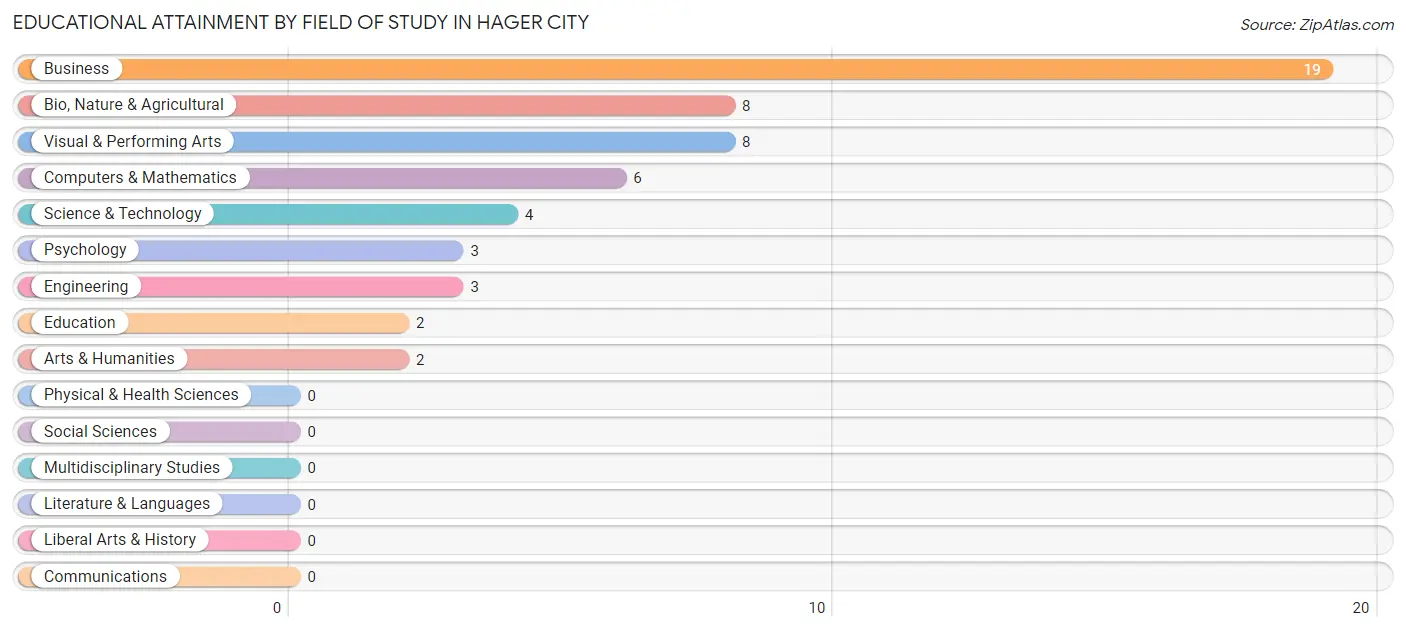
| Field of Study | # Graduates | % Graduates |
| Computers & Mathematics | 6 | 10.9% |
| Bio, Nature & Agricultural | 8 | 14.5% |
| Physical & Health Sciences | 0 | 0.0% |
| Psychology | 3 | 5.4% |
| Social Sciences | 0 | 0.0% |
| Engineering | 3 | 5.4% |
| Multidisciplinary Studies | 0 | 0.0% |
| Science & Technology | 4 | 7.3% |
| Business | 19 | 34.5% |
| Education | 2 | 3.6% |
| Literature & Languages | 0 | 0.0% |
| Liberal Arts & History | 0 | 0.0% |
| Visual & Performing Arts | 8 | 14.5% |
| Communications | 0 | 0.0% |
| Arts & Humanities | 2 | 3.6% |
| Total | 55 | 100.0% |
Transportation & Commute in Hager City
Vehicle Availability by Sex in Hager City
The most prevalent vehicle ownership categories in Hager City are males with 2 vehicles (27, accounting for 37.0%) and females with 2 vehicles (20, making up 40.9%).
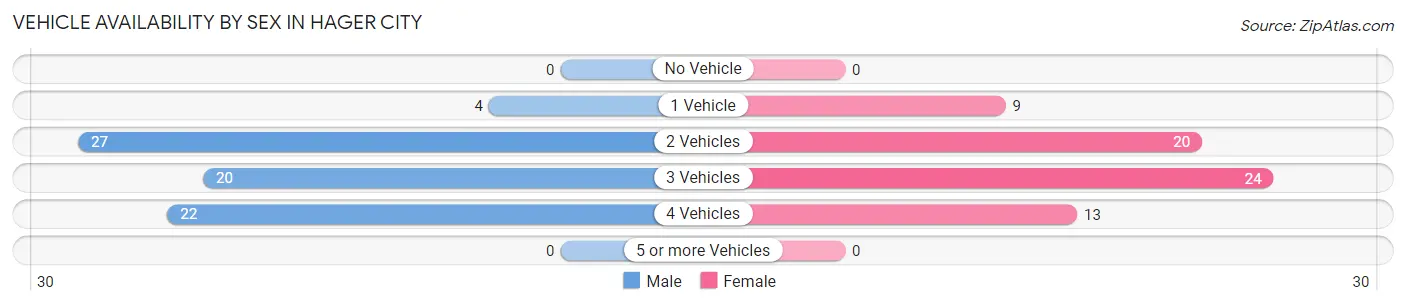
| Vehicles Available | Male | Female |
| No Vehicle | 0 (0.0%) | 0 (0.0%) |
| 1 Vehicle | 4 (5.5%) | 9 (13.6%) |
| 2 Vehicles | 27 (37.0%) | 20 (30.3%) |
| 3 Vehicles | 20 (27.4%) | 24 (36.4%) |
| 4 Vehicles | 22 (30.1%) | 13 (19.7%) |
| 5 or more Vehicles | 0 (0.0%) | 0 (0.0%) |
| Total | 73 (100.0%) | 66 (100.0%) |
Commute Time in Hager City
The most frequently occuring commute durations in Hager City are 10 to 14 minutes (22 commuters, 17.2%), 20 to 24 minutes (22 commuters, 17.2%), and 30 to 34 minutes (22 commuters, 17.2%).
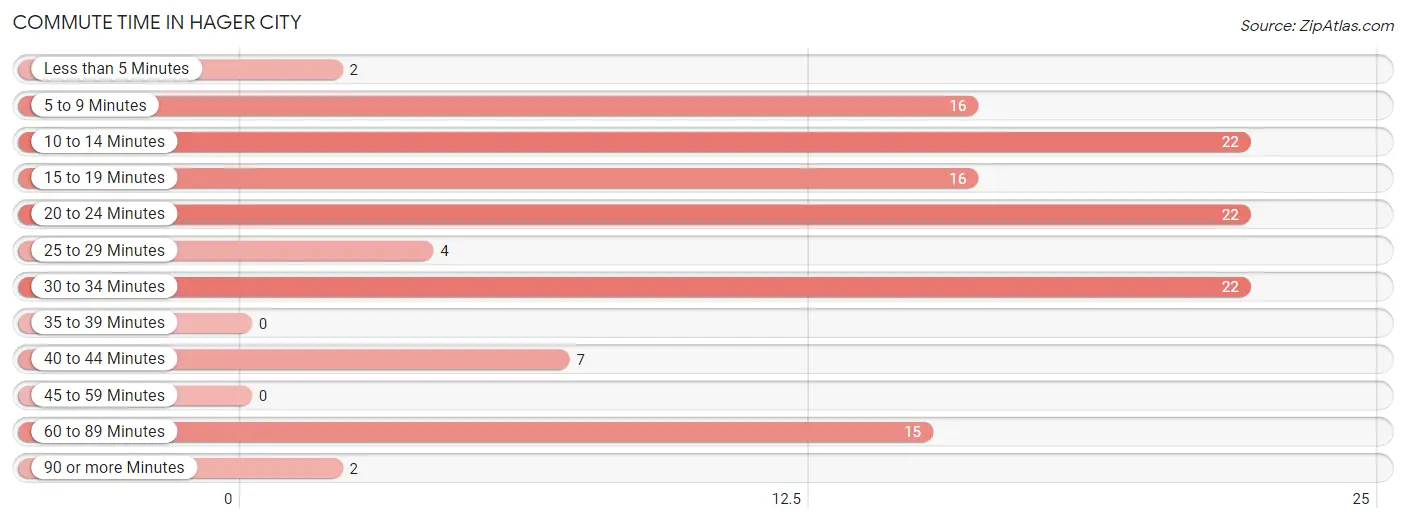
| Commute Time | # Commuters | % Commuters |
| Less than 5 Minutes | 2 | 1.6% |
| 5 to 9 Minutes | 16 | 12.5% |
| 10 to 14 Minutes | 22 | 17.2% |
| 15 to 19 Minutes | 16 | 12.5% |
| 20 to 24 Minutes | 22 | 17.2% |
| 25 to 29 Minutes | 4 | 3.1% |
| 30 to 34 Minutes | 22 | 17.2% |
| 35 to 39 Minutes | 0 | 0.0% |
| 40 to 44 Minutes | 7 | 5.5% |
| 45 to 59 Minutes | 0 | 0.0% |
| 60 to 89 Minutes | 15 | 11.7% |
| 90 or more Minutes | 2 | 1.6% |
Commute Time by Sex in Hager City
The most common commute times in Hager City are 30 to 34 minutes (17 commuters, 23.3%) for males and 15 to 19 minutes (14 commuters, 25.5%) for females.
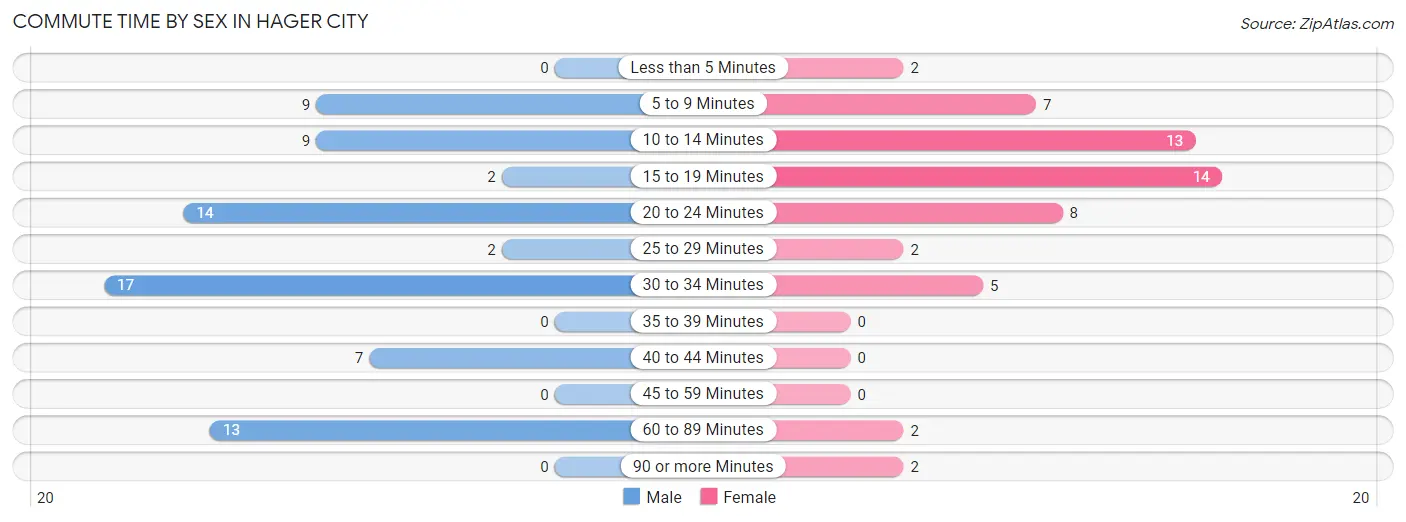
| Commute Time | Male | Female |
| Less than 5 Minutes | 0 (0.0%) | 2 (3.6%) |
| 5 to 9 Minutes | 9 (12.3%) | 7 (12.7%) |
| 10 to 14 Minutes | 9 (12.3%) | 13 (23.6%) |
| 15 to 19 Minutes | 2 (2.7%) | 14 (25.5%) |
| 20 to 24 Minutes | 14 (19.2%) | 8 (14.5%) |
| 25 to 29 Minutes | 2 (2.7%) | 2 (3.6%) |
| 30 to 34 Minutes | 17 (23.3%) | 5 (9.1%) |
| 35 to 39 Minutes | 0 (0.0%) | 0 (0.0%) |
| 40 to 44 Minutes | 7 (9.6%) | 0 (0.0%) |
| 45 to 59 Minutes | 0 (0.0%) | 0 (0.0%) |
| 60 to 89 Minutes | 13 (17.8%) | 2 (3.6%) |
| 90 or more Minutes | 0 (0.0%) | 2 (3.6%) |
Time of Departure to Work by Sex in Hager City
The most frequent times of departure to work in Hager City are 7:00 AM to 7:29 AM (15, 20.5%) for males and 6:30 AM to 6:59 AM (13, 23.6%) for females.
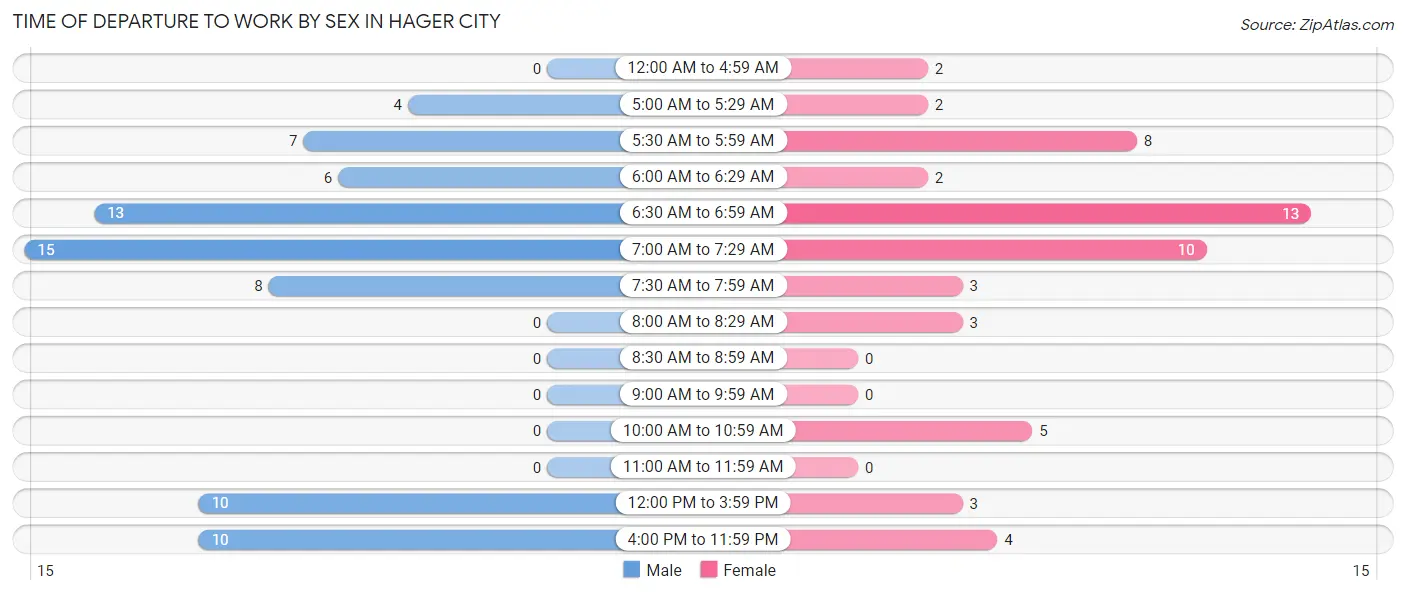
| Time of Departure | Male | Female |
| 12:00 AM to 4:59 AM | 0 (0.0%) | 2 (3.6%) |
| 5:00 AM to 5:29 AM | 4 (5.5%) | 2 (3.6%) |
| 5:30 AM to 5:59 AM | 7 (9.6%) | 8 (14.5%) |
| 6:00 AM to 6:29 AM | 6 (8.2%) | 2 (3.6%) |
| 6:30 AM to 6:59 AM | 13 (17.8%) | 13 (23.6%) |
| 7:00 AM to 7:29 AM | 15 (20.5%) | 10 (18.2%) |
| 7:30 AM to 7:59 AM | 8 (11.0%) | 3 (5.4%) |
| 8:00 AM to 8:29 AM | 0 (0.0%) | 3 (5.4%) |
| 8:30 AM to 8:59 AM | 0 (0.0%) | 0 (0.0%) |
| 9:00 AM to 9:59 AM | 0 (0.0%) | 0 (0.0%) |
| 10:00 AM to 10:59 AM | 0 (0.0%) | 5 (9.1%) |
| 11:00 AM to 11:59 AM | 0 (0.0%) | 0 (0.0%) |
| 12:00 PM to 3:59 PM | 10 (13.7%) | 3 (5.4%) |
| 4:00 PM to 11:59 PM | 10 (13.7%) | 4 (7.3%) |
| Total | 73 (100.0%) | 55 (100.0%) |
Housing Occupancy in Hager City
Occupancy by Ownership in Hager City
Of the total 104 dwellings in Hager City, owner-occupied units account for 87 (83.7%), while renter-occupied units make up 17 (16.4%).
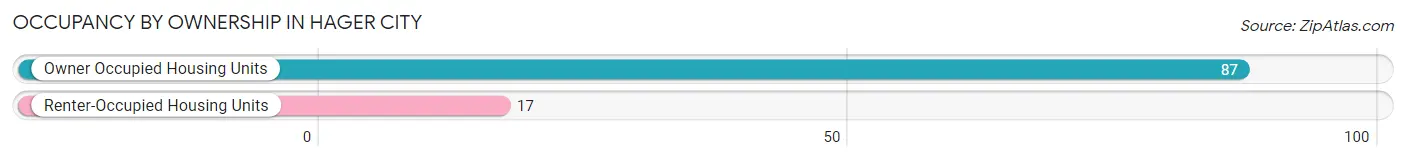
| Occupancy | # Housing Units | % Housing Units |
| Owner Occupied Housing Units | 87 | 83.7% |
| Renter-Occupied Housing Units | 17 | 16.4% |
| Total Occupied Housing Units | 104 | 100.0% |
Occupancy by Household Size in Hager City
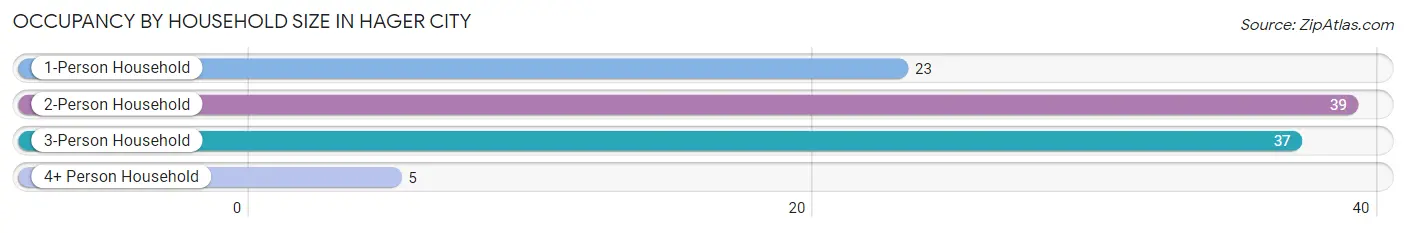
| Household Size | # Housing Units | % Housing Units |
| 1-Person Household | 23 | 22.1% |
| 2-Person Household | 39 | 37.5% |
| 3-Person Household | 37 | 35.6% |
| 4+ Person Household | 5 | 4.8% |
| Total Housing Units | 104 | 100.0% |
Occupancy by Ownership by Household Size in Hager City
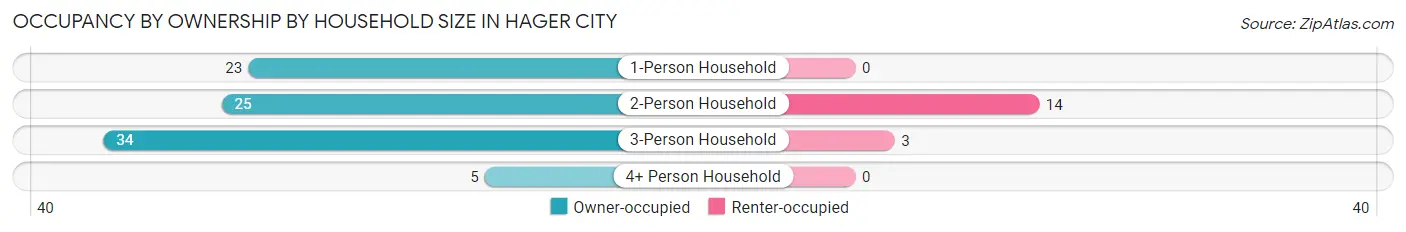
| Household Size | Owner-occupied | Renter-occupied |
| 1-Person Household | 23 (100.0%) | 0 (0.0%) |
| 2-Person Household | 25 (64.1%) | 14 (35.9%) |
| 3-Person Household | 34 (91.9%) | 3 (8.1%) |
| 4+ Person Household | 5 (100.0%) | 0 (0.0%) |
| Total Housing Units | 87 (83.7%) | 17 (16.4%) |
Occupancy by Educational Attainment in Hager City
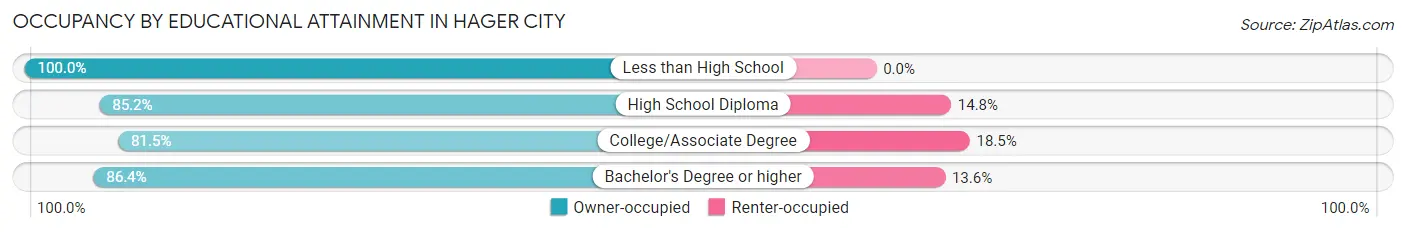
| Household Size | Owner-occupied | Renter-occupied |
| Less than High School | 1 (100.0%) | 0 (0.0%) |
| High School Diploma | 23 (85.2%) | 4 (14.8%) |
| College/Associate Degree | 44 (81.5%) | 10 (18.5%) |
| Bachelor's Degree or higher | 19 (86.4%) | 3 (13.6%) |
Occupancy by Age of Householder in Hager City
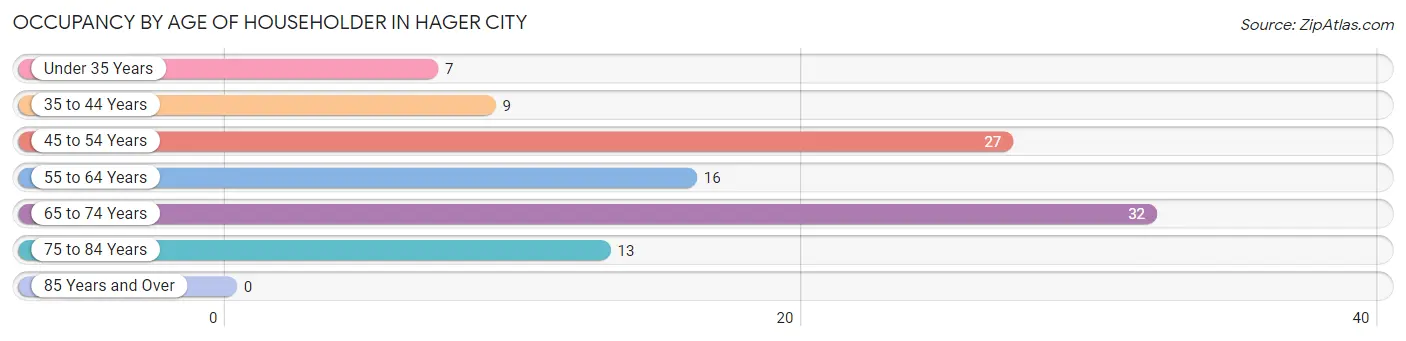
| Age Bracket | # Households | % Households |
| Under 35 Years | 7 | 6.7% |
| 35 to 44 Years | 9 | 8.6% |
| 45 to 54 Years | 27 | 26.0% |
| 55 to 64 Years | 16 | 15.4% |
| 65 to 74 Years | 32 | 30.8% |
| 75 to 84 Years | 13 | 12.5% |
| 85 Years and Over | 0 | 0.0% |
| Total | 104 | 100.0% |
Housing Finances in Hager City
Median Income by Occupancy in Hager City
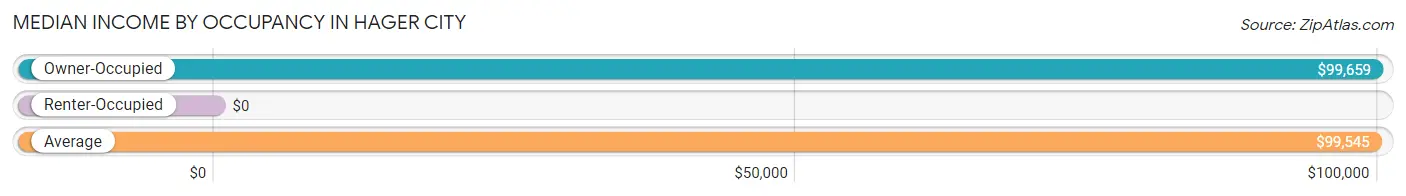
| Occupancy Type | # Households | Median Income |
| Owner-Occupied | 87 (83.7%) | $99,659 |
| Renter-Occupied | 17 (16.4%) | $0 |
| Average | 104 (100.0%) | $99,545 |
Occupancy by Householder Income Bracket in Hager City
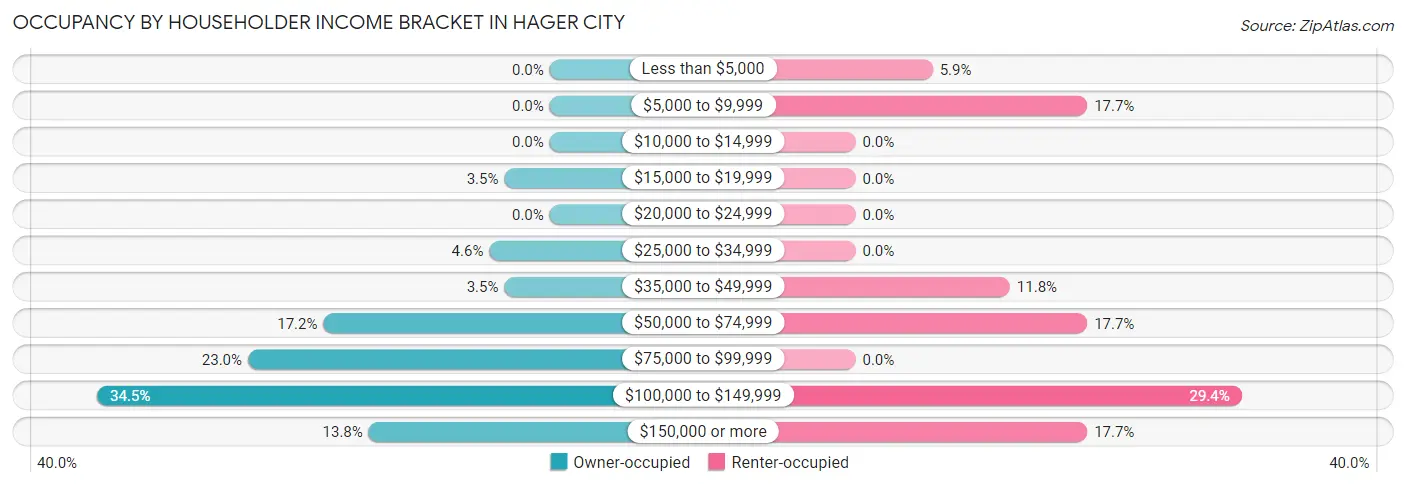
| Income Bracket | Owner-occupied | Renter-occupied |
| Less than $5,000 | 0 (0.0%) | 1 (5.9%) |
| $5,000 to $9,999 | 0 (0.0%) | 3 (17.6%) |
| $10,000 to $14,999 | 0 (0.0%) | 0 (0.0%) |
| $15,000 to $19,999 | 3 (3.5%) | 0 (0.0%) |
| $20,000 to $24,999 | 0 (0.0%) | 0 (0.0%) |
| $25,000 to $34,999 | 4 (4.6%) | 0 (0.0%) |
| $35,000 to $49,999 | 3 (3.5%) | 2 (11.8%) |
| $50,000 to $74,999 | 15 (17.2%) | 3 (17.6%) |
| $75,000 to $99,999 | 20 (23.0%) | 0 (0.0%) |
| $100,000 to $149,999 | 30 (34.5%) | 5 (29.4%) |
| $150,000 or more | 12 (13.8%) | 3 (17.6%) |
| Total | 87 (100.0%) | 17 (100.0%) |
Monthly Housing Cost Tiers in Hager City
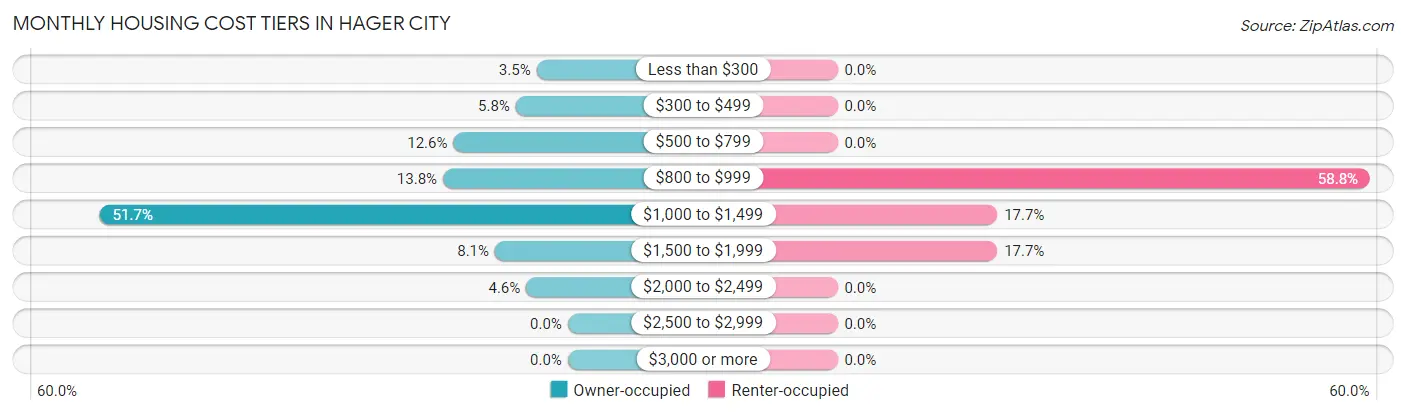
| Monthly Cost | Owner-occupied | Renter-occupied |
| Less than $300 | 3 (3.5%) | 0 (0.0%) |
| $300 to $499 | 5 (5.8%) | 0 (0.0%) |
| $500 to $799 | 11 (12.6%) | 0 (0.0%) |
| $800 to $999 | 12 (13.8%) | 10 (58.8%) |
| $1,000 to $1,499 | 45 (51.7%) | 3 (17.6%) |
| $1,500 to $1,999 | 7 (8.1%) | 3 (17.6%) |
| $2,000 to $2,499 | 4 (4.6%) | 0 (0.0%) |
| $2,500 to $2,999 | 0 (0.0%) | 0 (0.0%) |
| $3,000 or more | 0 (0.0%) | 0 (0.0%) |
| Total | 87 (100.0%) | 17 (100.0%) |
Physical Housing Characteristics in Hager City
Housing Structures in Hager City

| Structure Type | # Housing Units | % Housing Units |
| Single Unit, Detached | 90 | 86.5% |
| Single Unit, Attached | 5 | 4.8% |
| 2 Unit Apartments | 6 | 5.8% |
| 3 or 4 Unit Apartments | 3 | 2.9% |
| 5 to 9 Unit Apartments | 0 | 0.0% |
| 10 or more Apartments | 0 | 0.0% |
| Mobile Home / Other | 0 | 0.0% |
| Total | 104 | 100.0% |
Housing Structures by Occupancy in Hager City
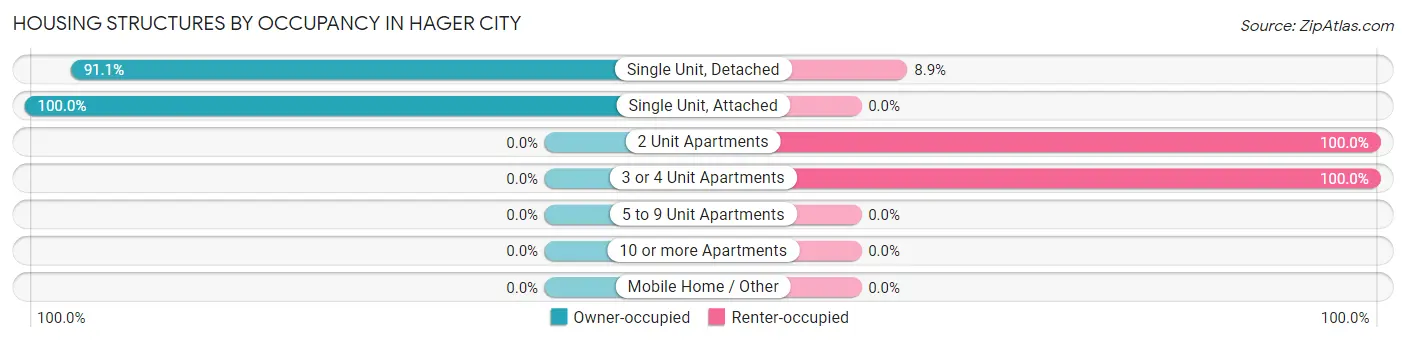
| Structure Type | Owner-occupied | Renter-occupied |
| Single Unit, Detached | 82 (91.1%) | 8 (8.9%) |
| Single Unit, Attached | 5 (100.0%) | 0 (0.0%) |
| 2 Unit Apartments | 0 (0.0%) | 6 (100.0%) |
| 3 or 4 Unit Apartments | 0 (0.0%) | 3 (100.0%) |
| 5 to 9 Unit Apartments | 0 (0.0%) | 0 (0.0%) |
| 10 or more Apartments | 0 (0.0%) | 0 (0.0%) |
| Mobile Home / Other | 0 (0.0%) | 0 (0.0%) |
| Total | 87 (83.7%) | 17 (16.4%) |
Housing Structures by Number of Rooms in Hager City
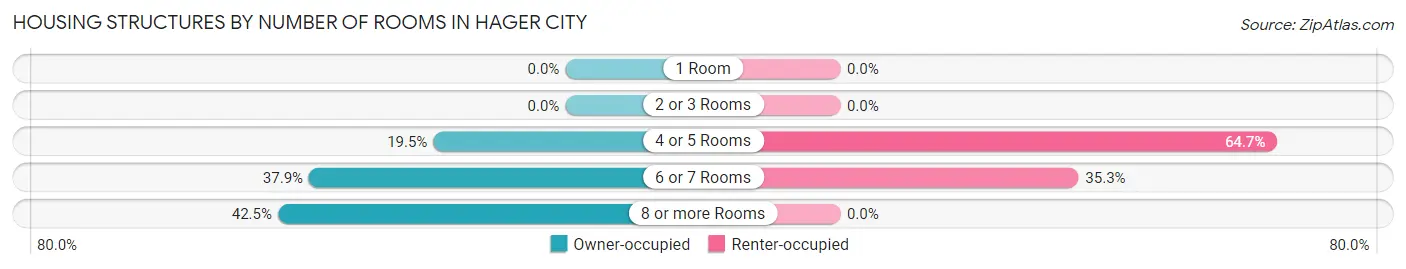
| Number of Rooms | Owner-occupied | Renter-occupied |
| 1 Room | 0 (0.0%) | 0 (0.0%) |
| 2 or 3 Rooms | 0 (0.0%) | 0 (0.0%) |
| 4 or 5 Rooms | 17 (19.5%) | 11 (64.7%) |
| 6 or 7 Rooms | 33 (37.9%) | 6 (35.3%) |
| 8 or more Rooms | 37 (42.5%) | 0 (0.0%) |
| Total | 87 (100.0%) | 17 (100.0%) |
Housing Structure by Heating Type in Hager City
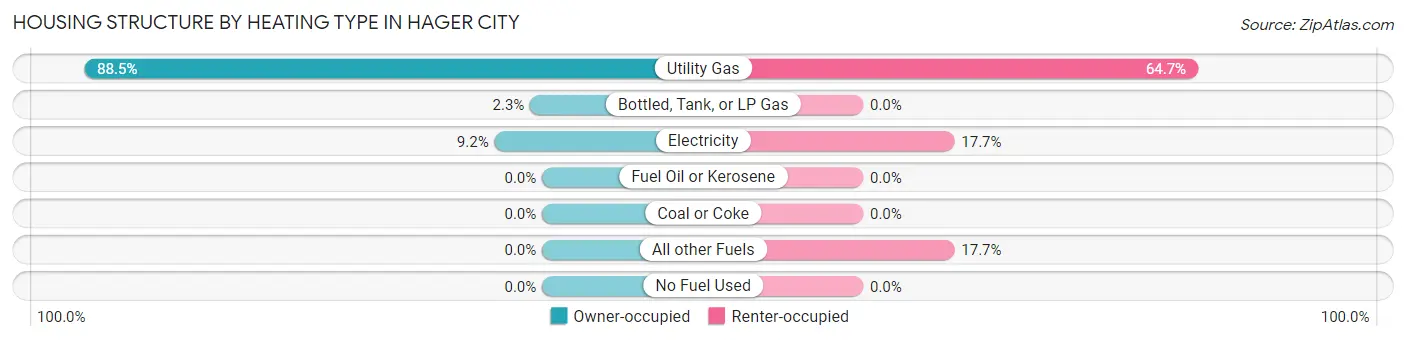
| Heating Type | Owner-occupied | Renter-occupied |
| Utility Gas | 77 (88.5%) | 11 (64.7%) |
| Bottled, Tank, or LP Gas | 2 (2.3%) | 0 (0.0%) |
| Electricity | 8 (9.2%) | 3 (17.6%) |
| Fuel Oil or Kerosene | 0 (0.0%) | 0 (0.0%) |
| Coal or Coke | 0 (0.0%) | 0 (0.0%) |
| All other Fuels | 0 (0.0%) | 3 (17.6%) |
| No Fuel Used | 0 (0.0%) | 0 (0.0%) |
| Total | 87 (100.0%) | 17 (100.0%) |
Household Vehicle Usage in Hager City
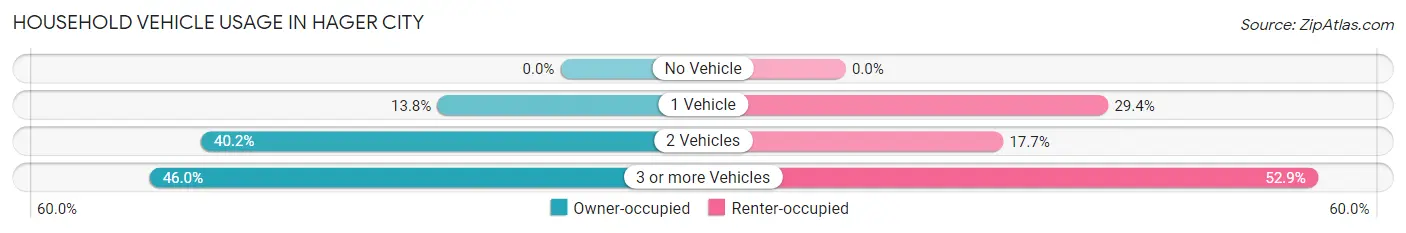
| Vehicles per Household | Owner-occupied | Renter-occupied |
| No Vehicle | 0 (0.0%) | 0 (0.0%) |
| 1 Vehicle | 12 (13.8%) | 5 (29.4%) |
| 2 Vehicles | 35 (40.2%) | 3 (17.6%) |
| 3 or more Vehicles | 40 (46.0%) | 9 (52.9%) |
| Total | 87 (100.0%) | 17 (100.0%) |
Real Estate & Mortgages in Hager City
Real Estate and Mortgage Overview in Hager City
| Characteristic | Without Mortgage | With Mortgage |
| Housing Units | 22 | 65 |
| Median Property Value | $250,000 | $225,000 |
| Median Household Income | $66,667 | $12 |
| Monthly Housing Costs | $633 | $0 |
| Real Estate Taxes | $5,341 | $0 |
Property Value by Mortgage Status in Hager City
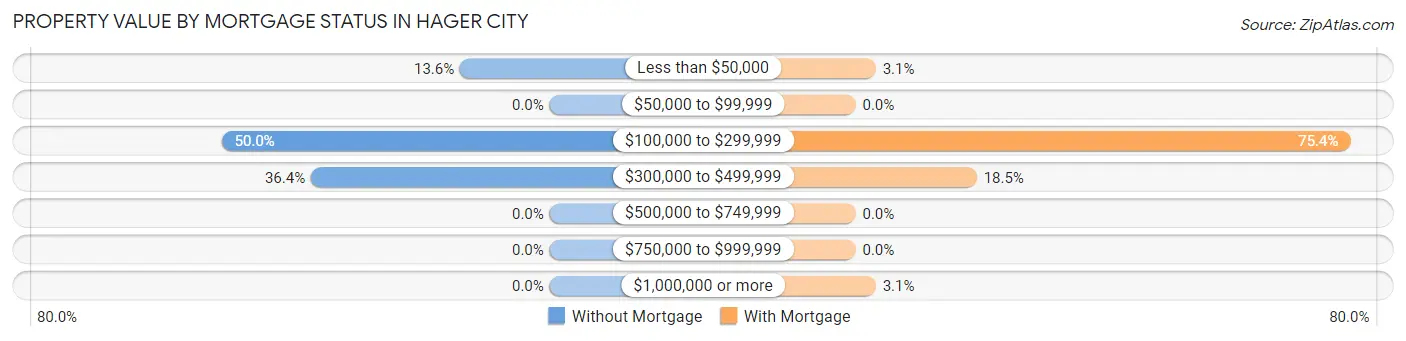
| Property Value | Without Mortgage | With Mortgage |
| Less than $50,000 | 3 (13.6%) | 2 (3.1%) |
| $50,000 to $99,999 | 0 (0.0%) | 0 (0.0%) |
| $100,000 to $299,999 | 11 (50.0%) | 49 (75.4%) |
| $300,000 to $499,999 | 8 (36.4%) | 12 (18.5%) |
| $500,000 to $749,999 | 0 (0.0%) | 0 (0.0%) |
| $750,000 to $999,999 | 0 (0.0%) | 0 (0.0%) |
| $1,000,000 or more | 0 (0.0%) | 2 (3.1%) |
| Total | 22 (100.0%) | 65 (100.0%) |
Household Income by Mortgage Status in Hager City
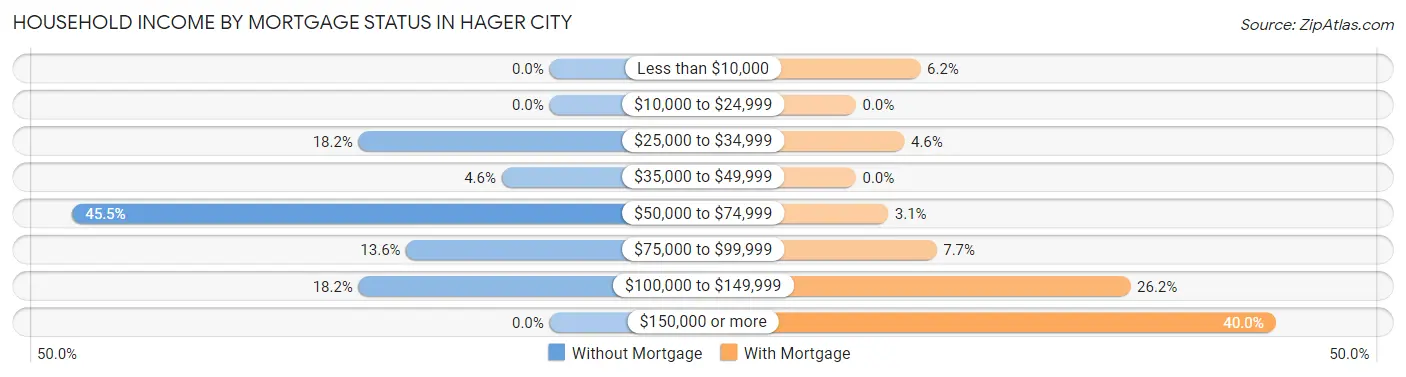
| Household Income | Without Mortgage | With Mortgage |
| Less than $10,000 | 0 (0.0%) | 4 (6.1%) |
| $10,000 to $24,999 | 0 (0.0%) | 0 (0.0%) |
| $25,000 to $34,999 | 4 (18.2%) | 3 (4.6%) |
| $35,000 to $49,999 | 1 (4.5%) | 0 (0.0%) |
| $50,000 to $74,999 | 10 (45.5%) | 2 (3.1%) |
| $75,000 to $99,999 | 3 (13.6%) | 5 (7.7%) |
| $100,000 to $149,999 | 4 (18.2%) | 17 (26.2%) |
| $150,000 or more | 0 (0.0%) | 26 (40.0%) |
| Total | 22 (100.0%) | 65 (100.0%) |
Property Value to Household Income Ratio in Hager City
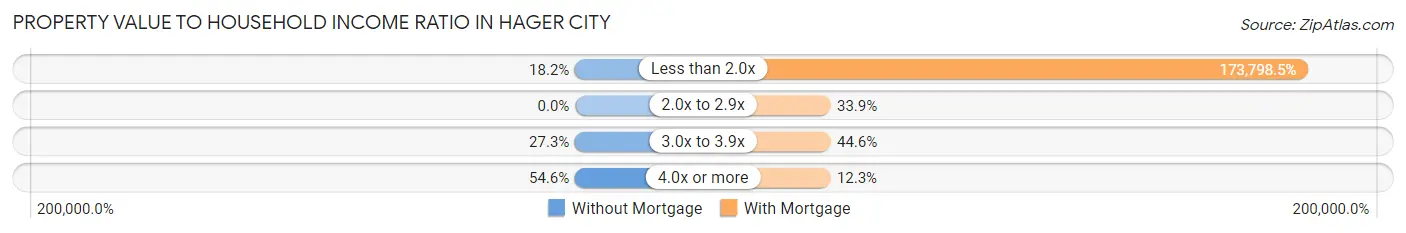
| Value-to-Income Ratio | Without Mortgage | With Mortgage |
| Less than 2.0x | 4 (18.2%) | 112,969 (173,798.5%) |
| 2.0x to 2.9x | 0 (0.0%) | 22 (33.9%) |
| 3.0x to 3.9x | 6 (27.3%) | 29 (44.6%) |
| 4.0x or more | 12 (54.5%) | 8 (12.3%) |
| Total | 22 (100.0%) | 65 (100.0%) |
Real Estate Taxes by Mortgage Status in Hager City
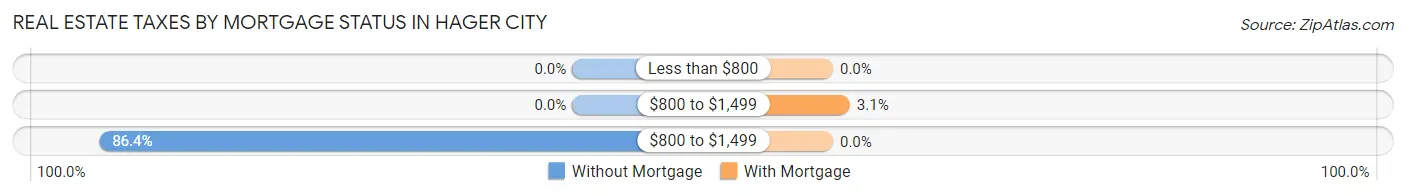
| Property Taxes | Without Mortgage | With Mortgage |
| Less than $800 | 0 (0.0%) | 0 (0.0%) |
| $800 to $1,499 | 0 (0.0%) | 2 (3.1%) |
| $800 to $1,499 | 19 (86.4%) | 0 (0.0%) |
| Total | 22 (100.0%) | 65 (100.0%) |
Health & Disability in Hager City
Health Insurance Coverage by Age in Hager City
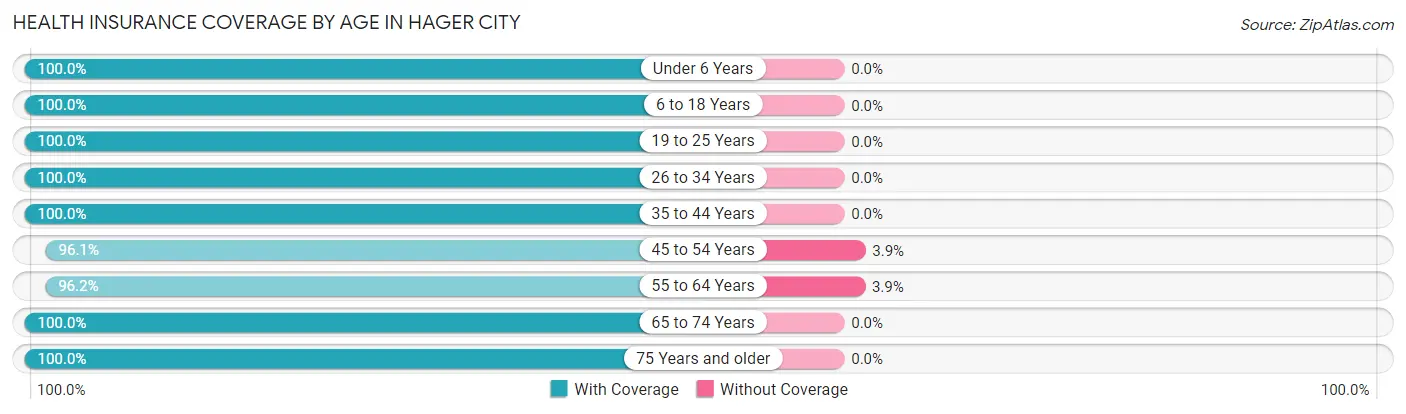
| Age Bracket | With Coverage | Without Coverage |
| Under 6 Years | 12 (100.0%) | 0 (0.0%) |
| 6 to 18 Years | 29 (100.0%) | 0 (0.0%) |
| 19 to 25 Years | 7 (100.0%) | 0 (0.0%) |
| 26 to 34 Years | 21 (100.0%) | 0 (0.0%) |
| 35 to 44 Years | 30 (100.0%) | 0 (0.0%) |
| 45 to 54 Years | 49 (96.1%) | 2 (3.9%) |
| 55 to 64 Years | 25 (96.2%) | 1 (3.8%) |
| 65 to 74 Years | 38 (100.0%) | 0 (0.0%) |
| 75 Years and older | 13 (100.0%) | 0 (0.0%) |
| Total | 224 (98.7%) | 3 (1.3%) |
Health Insurance Coverage by Citizenship Status in Hager City
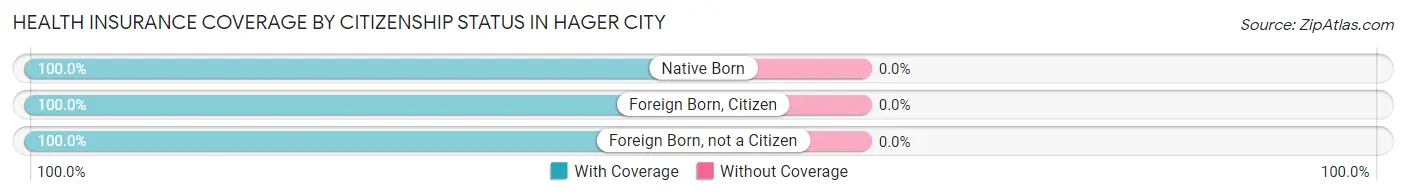
| Citizenship Status | With Coverage | Without Coverage |
| Native Born | 12 (100.0%) | 0 (0.0%) |
| Foreign Born, Citizen | 29 (100.0%) | 0 (0.0%) |
| Foreign Born, not a Citizen | 7 (100.0%) | 0 (0.0%) |
Health Insurance Coverage by Household Income in Hager City
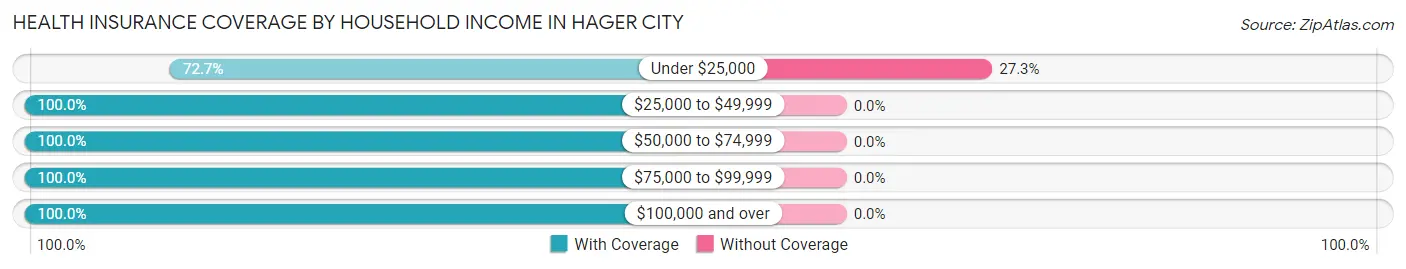
| Household Income | With Coverage | Without Coverage |
| Under $25,000 | 8 (72.7%) | 3 (27.3%) |
| $25,000 to $49,999 | 13 (100.0%) | 0 (0.0%) |
| $50,000 to $74,999 | 43 (100.0%) | 0 (0.0%) |
| $75,000 to $99,999 | 42 (100.0%) | 0 (0.0%) |
| $100,000 and over | 118 (100.0%) | 0 (0.0%) |
Public vs Private Health Insurance Coverage by Age in Hager City
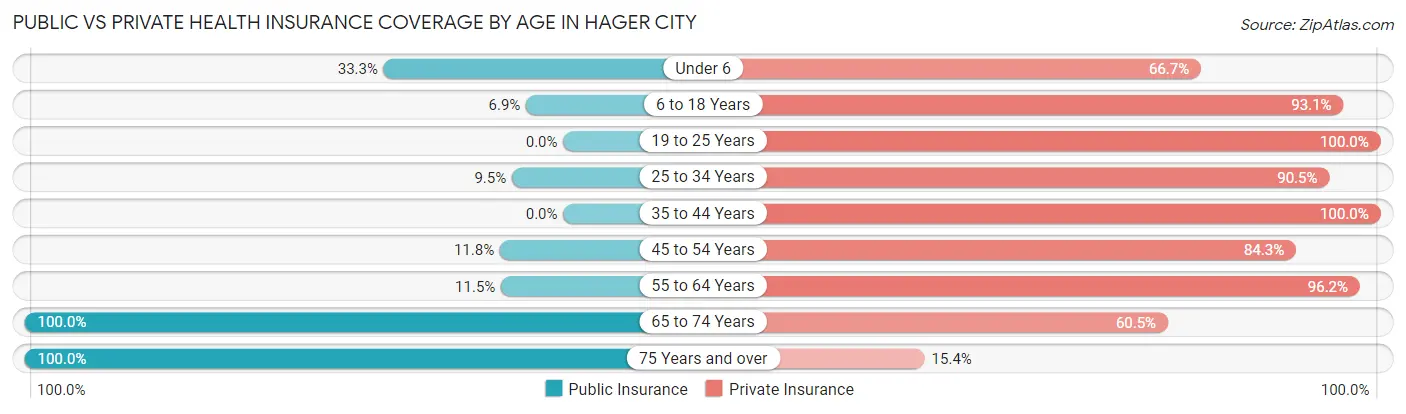
| Age Bracket | Public Insurance | Private Insurance |
| Under 6 | 4 (33.3%) | 8 (66.7%) |
| 6 to 18 Years | 2 (6.9%) | 27 (93.1%) |
| 19 to 25 Years | 0 (0.0%) | 7 (100.0%) |
| 25 to 34 Years | 2 (9.5%) | 19 (90.5%) |
| 35 to 44 Years | 0 (0.0%) | 30 (100.0%) |
| 45 to 54 Years | 6 (11.8%) | 43 (84.3%) |
| 55 to 64 Years | 3 (11.5%) | 25 (96.2%) |
| 65 to 74 Years | 38 (100.0%) | 23 (60.5%) |
| 75 Years and over | 13 (100.0%) | 2 (15.4%) |
| Total | 68 (30.0%) | 184 (81.1%) |
Disability Status by Sex by Age in Hager City
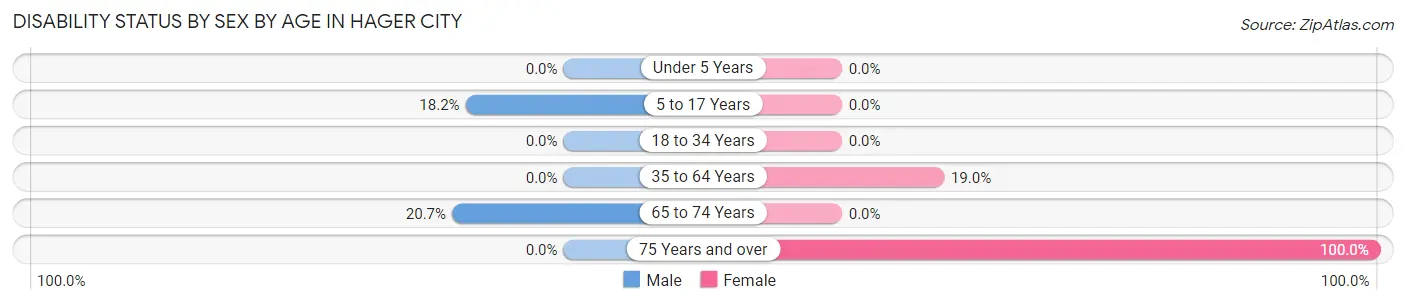
| Age Bracket | Male | Female |
| Under 5 Years | 0 (0.0%) | 0 (0.0%) |
| 5 to 17 Years | 2 (18.2%) | 0 (0.0%) |
| 18 to 34 Years | 0 (0.0%) | 0 (0.0%) |
| 35 to 64 Years | 0 (0.0%) | 11 (19.0%) |
| 65 to 74 Years | 6 (20.7%) | 0 (0.0%) |
| 75 Years and over | 0 (0.0%) | 2 (100.0%) |
Disability Class by Sex by Age in Hager City
Disability Class: Hearing Difficulty
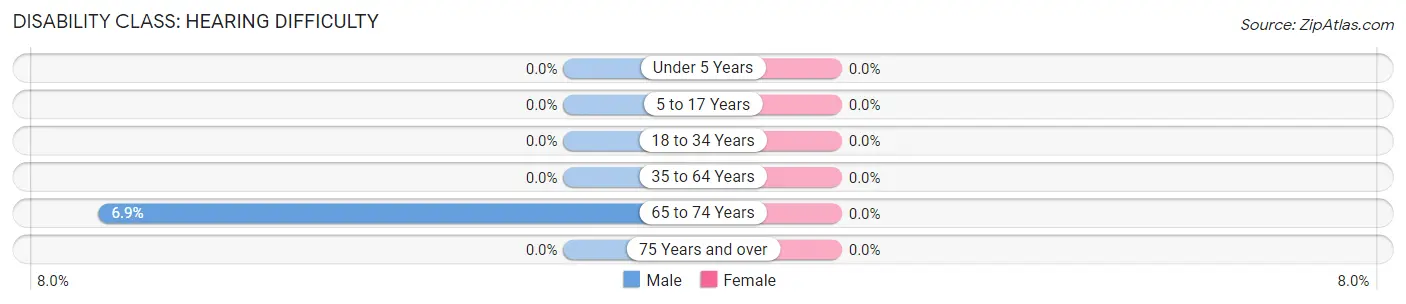
| Age Bracket | Male | Female |
| Under 5 Years | 0 (0.0%) | 0 (0.0%) |
| 5 to 17 Years | 0 (0.0%) | 0 (0.0%) |
| 18 to 34 Years | 0 (0.0%) | 0 (0.0%) |
| 35 to 64 Years | 0 (0.0%) | 0 (0.0%) |
| 65 to 74 Years | 2 (6.9%) | 0 (0.0%) |
| 75 Years and over | 0 (0.0%) | 0 (0.0%) |
Disability Class: Vision Difficulty
| Age Bracket | Male | Female |
| Under 5 Years | 0 (0.0%) | 0 (0.0%) |
| 5 to 17 Years | 0 (0.0%) | 0 (0.0%) |
| 18 to 34 Years | 0 (0.0%) | 0 (0.0%) |
| 35 to 64 Years | 0 (0.0%) | 0 (0.0%) |
| 65 to 74 Years | 0 (0.0%) | 0 (0.0%) |
| 75 Years and over | 0 (0.0%) | 0 (0.0%) |
Disability Class: Cognitive Difficulty
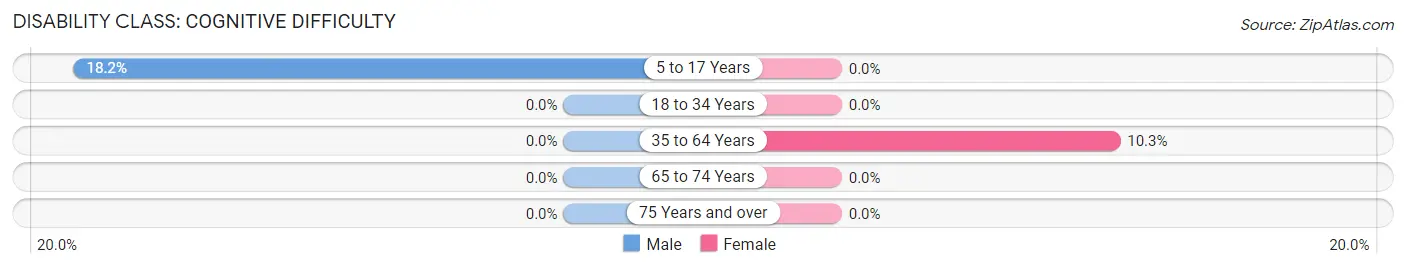
| Age Bracket | Male | Female |
| 5 to 17 Years | 2 (18.2%) | 0 (0.0%) |
| 18 to 34 Years | 0 (0.0%) | 0 (0.0%) |
| 35 to 64 Years | 0 (0.0%) | 6 (10.3%) |
| 65 to 74 Years | 0 (0.0%) | 0 (0.0%) |
| 75 Years and over | 0 (0.0%) | 0 (0.0%) |
Disability Class: Ambulatory Difficulty
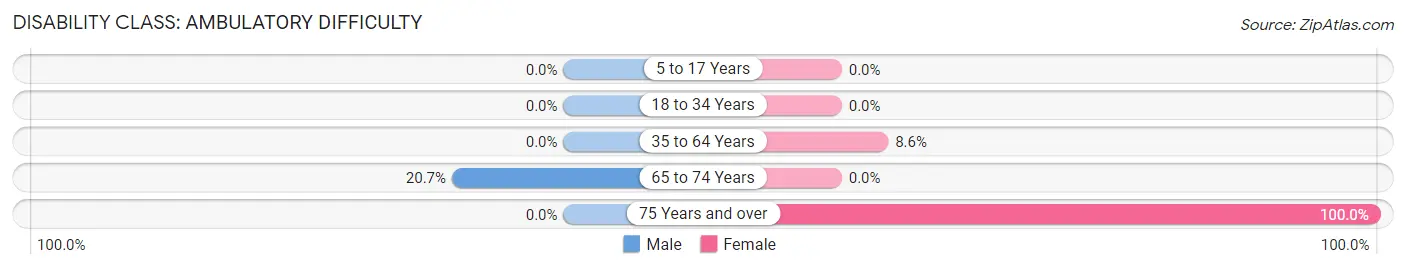
| Age Bracket | Male | Female |
| 5 to 17 Years | 0 (0.0%) | 0 (0.0%) |
| 18 to 34 Years | 0 (0.0%) | 0 (0.0%) |
| 35 to 64 Years | 0 (0.0%) | 5 (8.6%) |
| 65 to 74 Years | 6 (20.7%) | 0 (0.0%) |
| 75 Years and over | 0 (0.0%) | 2 (100.0%) |
Disability Class: Self-Care Difficulty
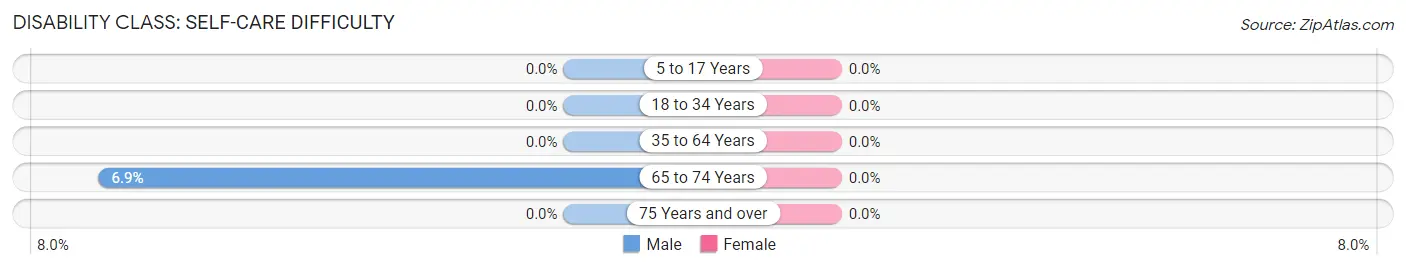
| Age Bracket | Male | Female |
| 5 to 17 Years | 0 (0.0%) | 0 (0.0%) |
| 18 to 34 Years | 0 (0.0%) | 0 (0.0%) |
| 35 to 64 Years | 0 (0.0%) | 0 (0.0%) |
| 65 to 74 Years | 2 (6.9%) | 0 (0.0%) |
| 75 Years and over | 0 (0.0%) | 0 (0.0%) |
Technology Access in Hager City
Computing Device Access in Hager City
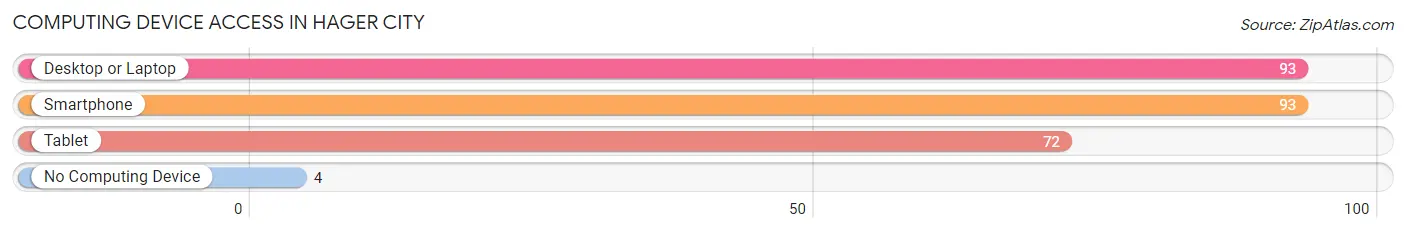
| Device Type | # Households | % Households |
| Desktop or Laptop | 93 | 89.4% |
| Smartphone | 93 | 89.4% |
| Tablet | 72 | 69.2% |
| No Computing Device | 4 | 3.8% |
| Total | 104 | 100.0% |
Internet Access in Hager City
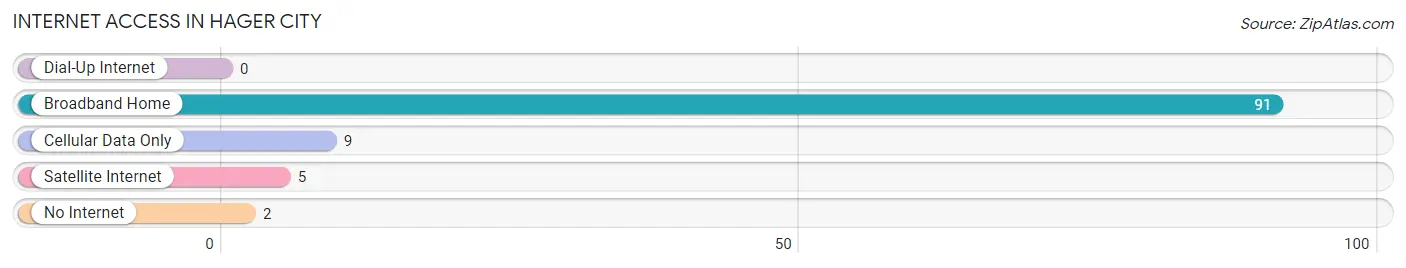
| Internet Type | # Households | % Households |
| Dial-Up Internet | 0 | 0.0% |
| Broadband Home | 91 | 87.5% |
| Cellular Data Only | 9 | 8.6% |
| Satellite Internet | 5 | 4.8% |
| No Internet | 2 | 1.9% |
| Total | 104 | 100.0% |
Hager City Summary
Hager City is a small unincorporated community located in Pierce County, Wisconsin, United States. It is situated on the Wisconsin side of the Mississippi River, directly across from Red Wing, Minnesota. The population of Hager City was estimated to be around 1,000 in 2020.
History
Hager City was founded in 1854 by William Hager, a German immigrant who had settled in the area. He named the town after himself and it quickly became a popular destination for travelers and settlers. The town was incorporated in 1856 and soon became a hub for the lumber industry. The town was also home to a number of businesses, including a hotel, a general store, a blacksmith shop, and a sawmill.
In the late 19th century, Hager City was a popular destination for steamboat travelers. The town was also home to a number of saloons and gambling halls, which attracted many visitors. In the early 20th century, the town began to decline as the lumber industry moved away and the steamboat traffic decreased.
Geography
Hager City is located in western Wisconsin, on the Wisconsin side of the Mississippi River. It is situated directly across from Red Wing, Minnesota. The town is located in the Driftless Area, a region of the Upper Midwest that was not glaciated during the last ice age. The area is characterized by rolling hills, deep valleys, and steep bluffs.
The town is located in the Kinnickinnic River Valley, which is a popular destination for outdoor recreation. The Kinnickinnic River is a popular destination for fishing, canoeing, and kayaking. The area is also home to a number of parks and trails, including the Kinnickinnic State Park and the Great River Trail.
Economy
Hager City is a small, rural community with a limited economy. The town is home to a number of small businesses, including a grocery store, a hardware store, and a few restaurants. The town is also home to a number of small manufacturing businesses, including a furniture factory and a woodworking shop.
The town is also home to a number of tourist attractions, including the Great River Trail and the Kinnickinnic State Park. The town is also home to a number of wineries and breweries, which attract visitors from all over the region.
Demographics
Hager City is a small, rural community with a population of around 1,000 people. The town is predominantly white, with a small Hispanic population. The median household income in the town is around $50,000, and the median home value is around $150,000. The town has a low unemployment rate and a high rate of homeownership.
Conclusion
Hager City is a small, rural community located in western Wisconsin. The town was founded in 1854 and was once a hub for the lumber industry. Today, the town is home to a number of small businesses and tourist attractions. The town has a population of around 1,000 people and a median household income of around $50,000. The town is predominantly white, with a small Hispanic population. The town has a low unemployment rate and a high rate of homeownership.
Common Questions
What is Per Capita Income in Hager City?
Per Capita income in Hager City is $44,878.
What is the Median Family Income in Hager City?
Median Family Income in Hager City is $100,000.
What is the Median Household income in Hager City?
Median Household Income in Hager City is $99,545.
What is Income or Wage Gap in Hager City?
Income or Wage Gap in Hager City is 44.9%.
Women in Hager City earn 55.1 cents for every dollar earned by a man.
What is Inequality or Gini Index in Hager City?
Inequality or Gini Index in Hager City is 0.28.
What is the Total Population of Hager City?
Total Population of Hager City is 227.
What is the Total Male Population of Hager City?
Total Male Population of Hager City is 121.
What is the Total Female Population of Hager City?
Total Female Population of Hager City is 106.
What is the Ratio of Males per 100 Females in Hager City?
There are 114.15 Males per 100 Females in Hager City.
What is the Ratio of Females per 100 Males in Hager City?
There are 87.60 Females per 100 Males in Hager City.
What is the Median Population Age in Hager City?
Median Population Age in Hager City is 48.2 Years.
What is the Average Family Size in Hager City
Average Family Size in Hager City is 2.4 People.
What is the Average Household Size in Hager City
Average Household Size in Hager City is 2.2 People.
How Large is the Labor Force in Hager City?
There are 142 People in the Labor Forcein in Hager City.
What is the Percentage of People in the Labor Force in Hager City?
70.6% of People are in the Labor Force in Hager City.
What is the Unemployment Rate in Hager City?
Unemployment Rate in Hager City is 2.1%.