Green Lake, WI Map & Demographics
Green Lake Map
Green Lake Overview
$42,086
PER CAPITA INCOME
$92,917
AVG FAMILY INCOME
$51,367
AVG HOUSEHOLD INCOME
34.3%
WAGE / INCOME GAP [ % ]
65.7¢/ $1
WAGE / INCOME GAP [ $ ]
$11,142
FAMILY INCOME DEFICIT
0.46
INEQUALITY / GINI INDEX
1,000
TOTAL POPULATION
488
MALE POPULATION
512
FEMALE POPULATION
95.31
MALES / 100 FEMALES
104.92
FEMALES / 100 MALES
46.9
MEDIAN AGE
2.4
AVG FAMILY SIZE
1.7
AVG HOUSEHOLD SIZE
477
LABOR FORCE [ PEOPLE ]
55.5%
PERCENT IN LABOR FORCE
4.0%
UNEMPLOYMENT RATE
Green Lake Zip Codes
Green Lake Area Codes
Income in Green Lake
Income Overview in Green Lake
Per Capita Income in Green Lake is $42,086, while median incomes of families and households are $92,917 and $51,367 respectively.
| Characteristic | Number | Measure |
| Per Capita Income | 1,000 | $42,086 |
| Median Family Income | 242 | $92,917 |
| Mean Family Income | 242 | $101,149 |
| Median Household Income | 510 | $51,367 |
| Mean Household Income | 510 | $80,478 |
| Income Deficit | 242 | $11,142 |
| Wage / Income Gap (%) | 1,000 | 34.31% |
| Wage / Income Gap ($) | 1,000 | 65.69¢ per $1 |
| Gini / Inequality Index | 1,000 | 0.46 |
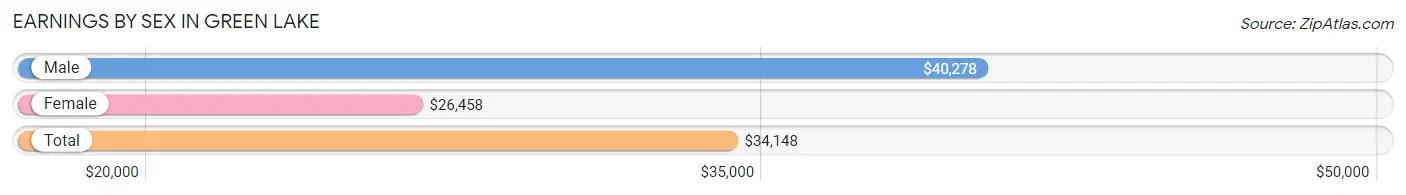
Earnings by Sex in Green Lake
Average Earnings in Green Lake are $34,148, $40,278 for men and $26,458 for women, a difference of 34.3%.
| Sex | Number | Average Earnings |
| Male | 312 (54.4%) | $40,278 |
| Female | 261 (45.6%) | $26,458 |
| Total | 573 (100.0%) | $34,148 |
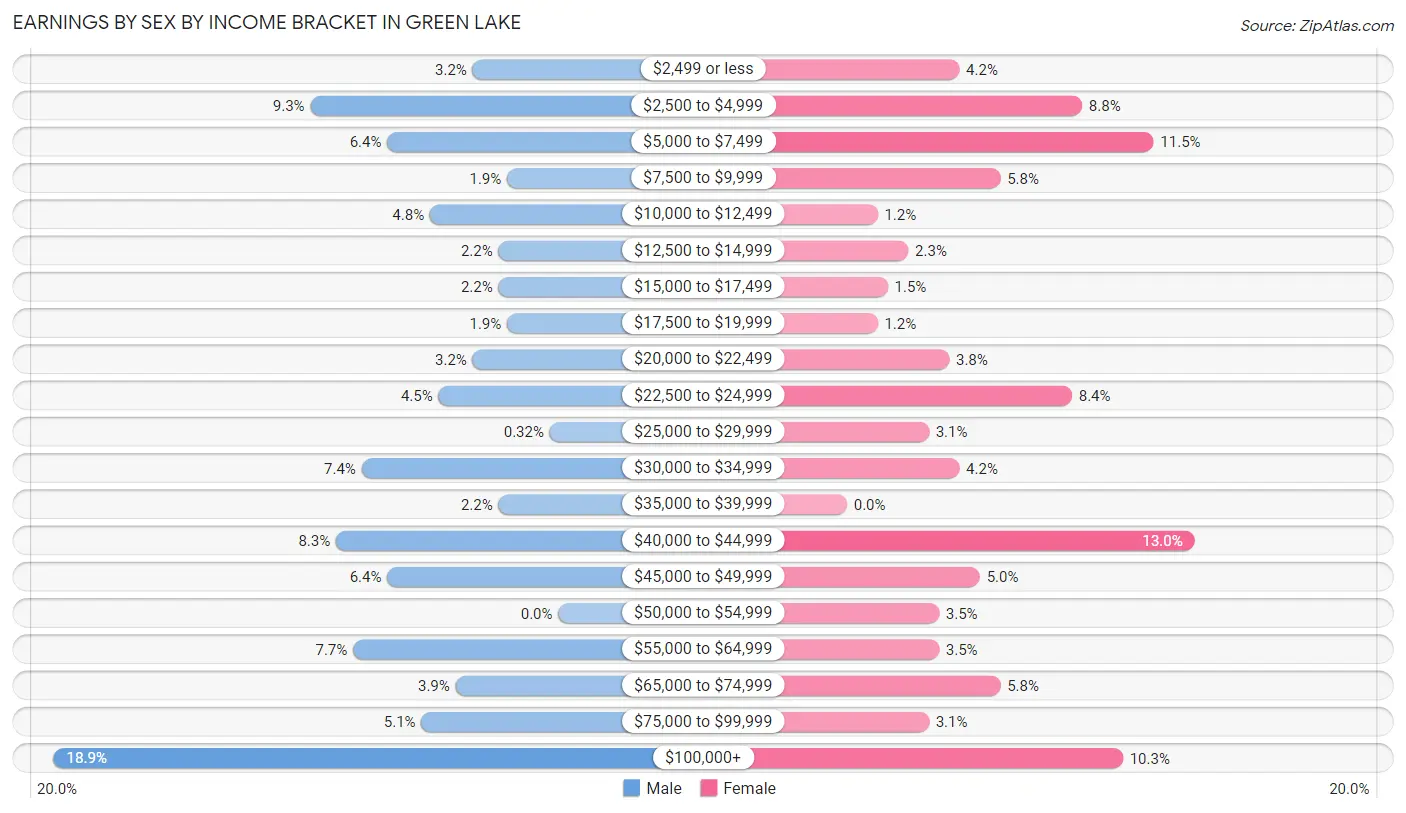
Earnings by Sex by Income Bracket in Green Lake
The most common earnings brackets in Green Lake are $100,000+ for men (59 | 18.9%) and $40,000 to $44,999 for women (34 | 13.0%).
| Income | Male | Female |
| $2,499 or less | 10 (3.2%) | 11 (4.2%) |
| $2,500 to $4,999 | 29 (9.3%) | 23 (8.8%) |
| $5,000 to $7,499 | 20 (6.4%) | 30 (11.5%) |
| $7,500 to $9,999 | 6 (1.9%) | 15 (5.8%) |
| $10,000 to $12,499 | 15 (4.8%) | 3 (1.1%) |
| $12,500 to $14,999 | 7 (2.2%) | 6 (2.3%) |
| $15,000 to $17,499 | 7 (2.2%) | 4 (1.5%) |
| $17,500 to $19,999 | 6 (1.9%) | 3 (1.1%) |
| $20,000 to $22,499 | 10 (3.2%) | 10 (3.8%) |
| $22,500 to $24,999 | 14 (4.5%) | 22 (8.4%) |
| $25,000 to $29,999 | 1 (0.3%) | 8 (3.1%) |
| $30,000 to $34,999 | 23 (7.4%) | 11 (4.2%) |
| $35,000 to $39,999 | 7 (2.2%) | 0 (0.0%) |
| $40,000 to $44,999 | 26 (8.3%) | 34 (13.0%) |
| $45,000 to $49,999 | 20 (6.4%) | 13 (5.0%) |
| $50,000 to $54,999 | 0 (0.0%) | 9 (3.5%) |
| $55,000 to $64,999 | 24 (7.7%) | 9 (3.5%) |
| $65,000 to $74,999 | 12 (3.8%) | 15 (5.8%) |
| $75,000 to $99,999 | 16 (5.1%) | 8 (3.1%) |
| $100,000+ | 59 (18.9%) | 27 (10.3%) |
| Total | 312 (100.0%) | 261 (100.0%) |
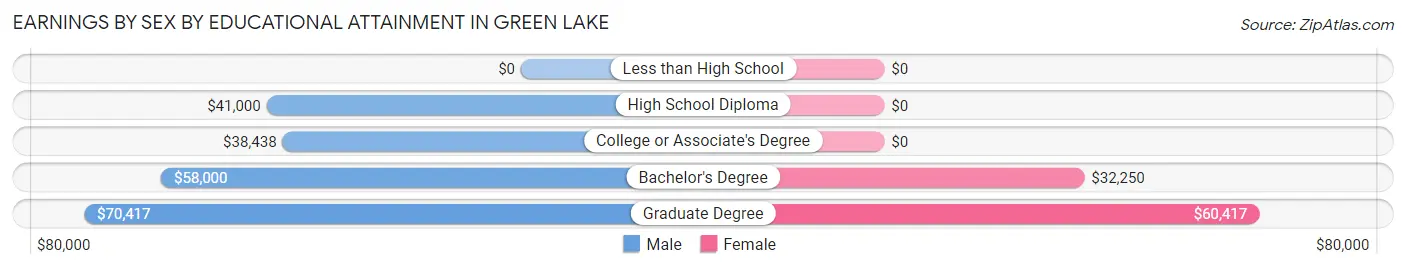
Earnings by Sex by Educational Attainment in Green Lake
Average earnings in Green Lake are $43,897 for men and $32,361 for women, a difference of 26.3%. Men with an educational attainment of graduate degree enjoy the highest average annual earnings of $70,417, while those with college or associate's degree education earn the least with $38,438. Women with an educational attainment of graduate degree earn the most with the average annual earnings of $60,417, while those with bachelor's degree education have the smallest earnings of $32,250.
| Educational Attainment | Male Income | Female Income |
| Less than High School | - | - |
| High School Diploma | $41,000 | $0 |
| College or Associate's Degree | $38,438 | $0 |
| Bachelor's Degree | $58,000 | $32,250 |
| Graduate Degree | $70,417 | $60,417 |
| Total | $43,897 | $32,361 |
Family Income in Green Lake
Family Income Brackets in Green Lake
According to the Green Lake family income data, there are 79 families falling into the $100,000 to $149,999 income range, which is the most common income bracket and makes up 32.6% of all families. Conversely, the $15,000 to $24,999 income bracket is the least frequent group with only 5 families (2.1%) belonging to this category.
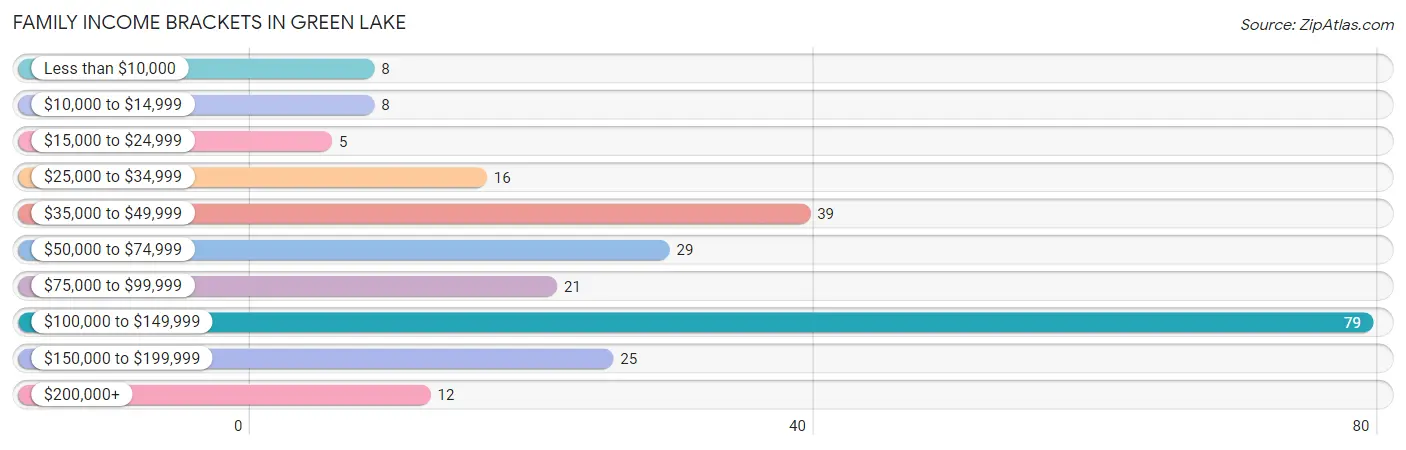
| Income Bracket | # Families | % Families |
| Less than $10,000 | 8 | 3.3% |
| $10,000 to $14,999 | 8 | 3.3% |
| $15,000 to $24,999 | 5 | 2.1% |
| $25,000 to $34,999 | 16 | 6.6% |
| $35,000 to $49,999 | 39 | 16.1% |
| $50,000 to $74,999 | 29 | 12.0% |
| $75,000 to $99,999 | 21 | 8.7% |
| $100,000 to $149,999 | 79 | 32.6% |
| $150,000 to $199,999 | 25 | 10.3% |
| $200,000+ | 12 | 5.0% |
Family Income by Famaliy Size in Green Lake
2-person families (152 | 62.8%) account for the highest median family income in Green Lake with $113,750 per family, while 2-person families (152 | 62.8%) have the highest median income of $56,875 per family member.
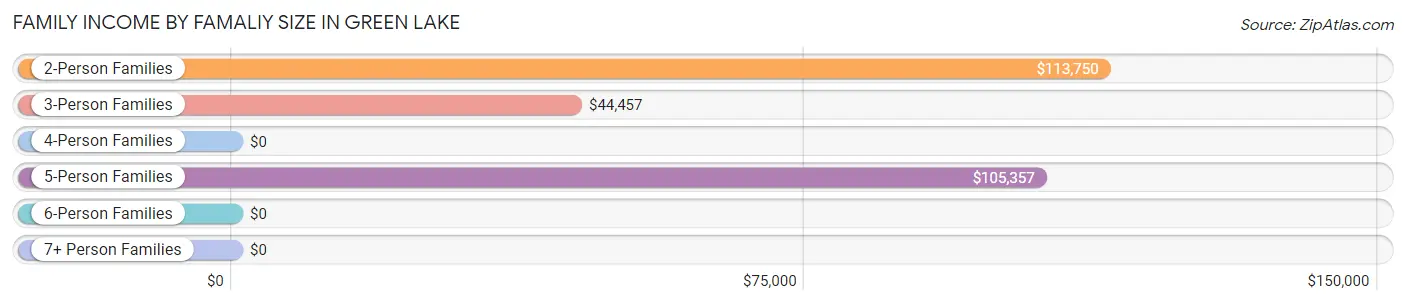
| Income Bracket | # Families | Median Income |
| 2-Person Families | 152 (62.8%) | $113,750 |
| 3-Person Families | 64 (26.5%) | $44,457 |
| 4-Person Families | 14 (5.8%) | $0 |
| 5-Person Families | 12 (5.0%) | $105,357 |
| 6-Person Families | 0 (0.0%) | $0 |
| 7+ Person Families | 0 (0.0%) | $0 |
| Total | 242 (100.0%) | $92,917 |
Family Income by Number of Earners in Green Lake
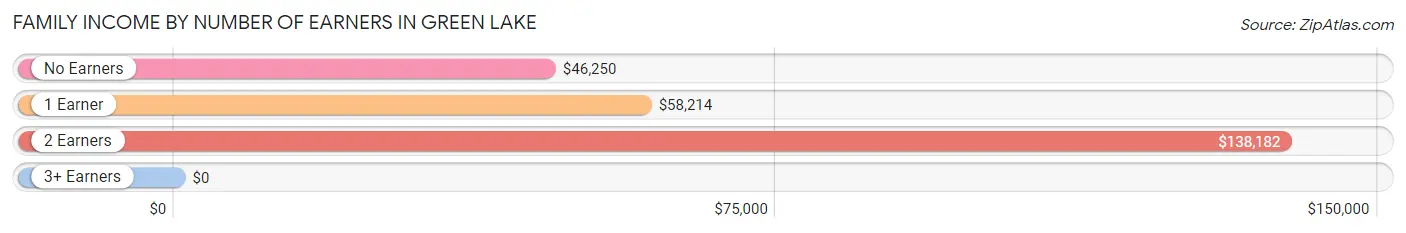
| Number of Earners | # Families | Median Income |
| No Earners | 18 (7.4%) | $46,250 |
| 1 Earner | 124 (51.2%) | $58,214 |
| 2 Earners | 96 (39.7%) | $138,182 |
| 3+ Earners | 4 (1.7%) | $0 |
| Total | 242 (100.0%) | $92,917 |
Household Income in Green Lake
Household Income Brackets in Green Lake
With 118 households falling in the category, the $50,000 to $74,999 income range is the most frequent in Green Lake, accounting for 23.1% of all households. In contrast, only 17 households (3.3%) fall into the $10,000 to $14,999 income bracket, making it the least populous group.
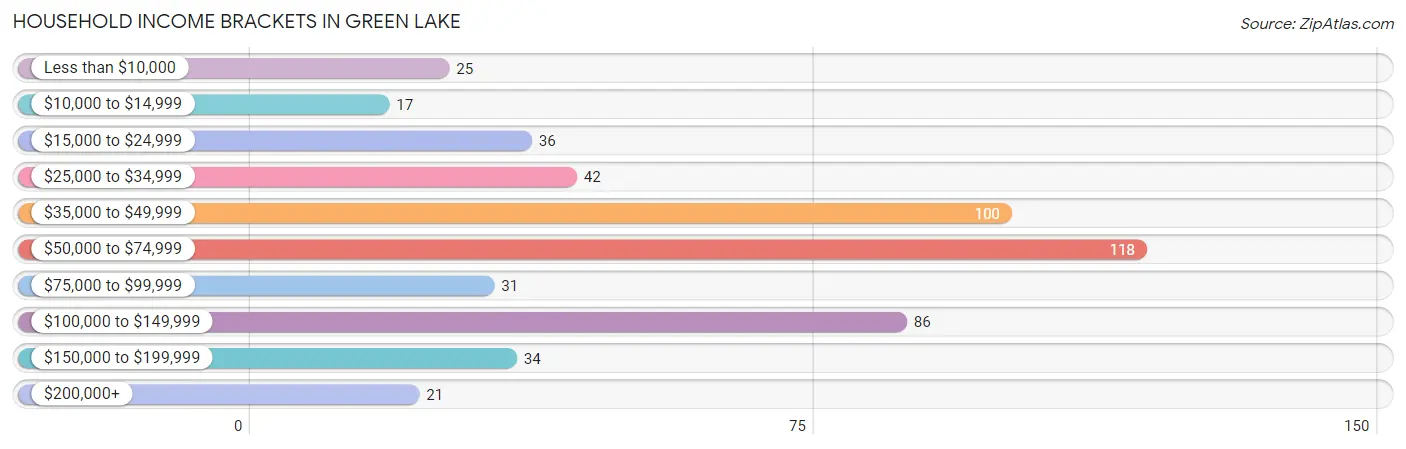
| Income Bracket | # Households | % Households |
| Less than $10,000 | 25 | 4.9% |
| $10,000 to $14,999 | 17 | 3.3% |
| $15,000 to $24,999 | 36 | 7.1% |
| $25,000 to $34,999 | 42 | 8.2% |
| $35,000 to $49,999 | 100 | 19.6% |
| $50,000 to $74,999 | 118 | 23.1% |
| $75,000 to $99,999 | 31 | 6.1% |
| $100,000 to $149,999 | 86 | 16.9% |
| $150,000 to $199,999 | 34 | 6.7% |
| $200,000+ | 21 | 4.1% |
Household Income by Householder Age in Green Lake
The median household income in Green Lake is $51,367, with the highest median household income of $52,344 found in the 45 to 64 years age bracket for the primary householder. A total of 143 households (28.0%) fall into this category. Meanwhile, the 15 to 24 years age bracket for the primary householder has the lowest median household income of $0, with 1 households (0.2%) in this group.
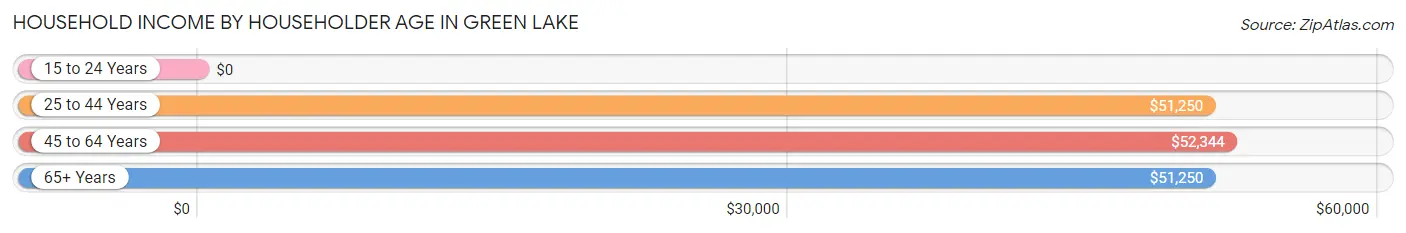
| Income Bracket | # Households | Median Income |
| 15 to 24 Years | 1 (0.2%) | $0 |
| 25 to 44 Years | 148 (29.0%) | $51,250 |
| 45 to 64 Years | 143 (28.0%) | $52,344 |
| 65+ Years | 218 (42.7%) | $51,250 |
| Total | 510 (100.0%) | $51,367 |
Poverty in Green Lake
Income Below Poverty by Sex and Age in Green Lake
With 8.1% poverty level for males and 13.0% for females among the residents of Green Lake, 5 year old males and under 5 year old females are the most vulnerable to poverty, with 7 males (63.6%) and 8 females (100.0%) in their respective age groups living below the poverty level.
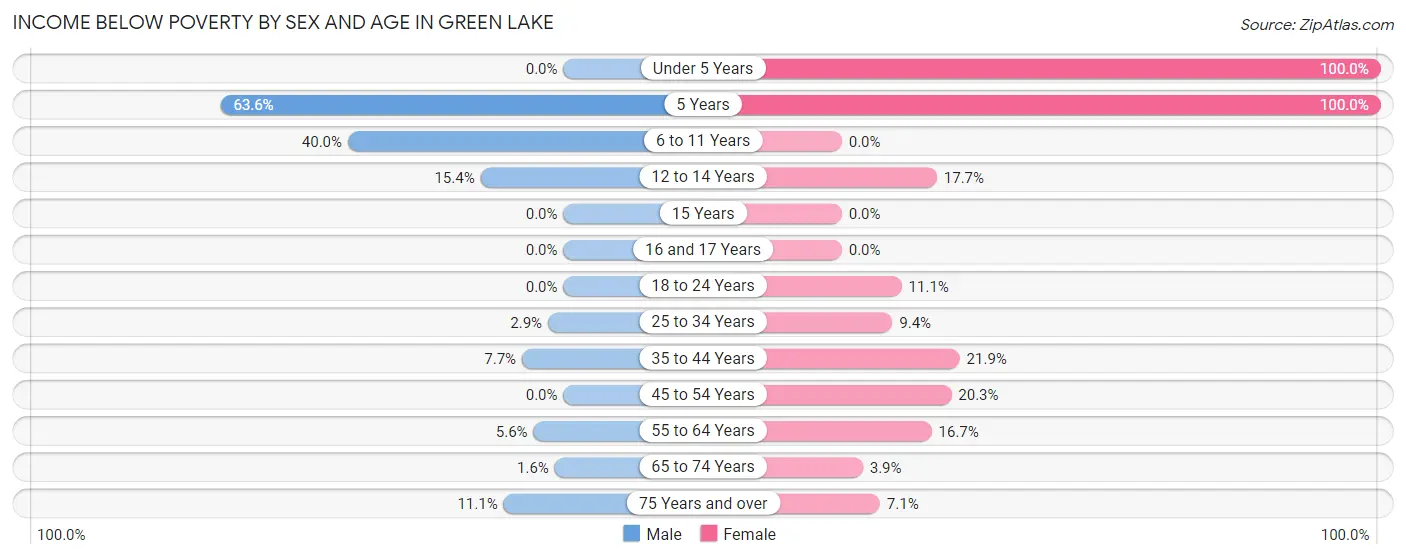
| Age Bracket | Male | Female |
| Under 5 Years | 0 (0.0%) | 8 (100.0%) |
| 5 Years | 7 (63.6%) | 3 (100.0%) |
| 6 to 11 Years | 6 (40.0%) | 0 (0.0%) |
| 12 to 14 Years | 4 (15.4%) | 3 (17.6%) |
| 15 Years | 0 (0.0%) | 0 (0.0%) |
| 16 and 17 Years | 0 (0.0%) | 0 (0.0%) |
| 18 to 24 Years | 0 (0.0%) | 1 (11.1%) |
| 25 to 34 Years | 2 (2.9%) | 6 (9.4%) |
| 35 to 44 Years | 5 (7.7%) | 7 (21.9%) |
| 45 to 54 Years | 0 (0.0%) | 12 (20.3%) |
| 55 to 64 Years | 4 (5.6%) | 12 (16.7%) |
| 65 to 74 Years | 1 (1.6%) | 3 (3.9%) |
| 75 Years and over | 4 (11.1%) | 7 (7.1%) |
| Total | 33 (8.1%) | 62 (13.0%) |
Income Above Poverty by Sex and Age in Green Lake
According to the poverty statistics in Green Lake, males aged under 5 years and females aged 6 to 11 years are the age groups that are most secure financially, with 100.0% of males and 100.0% of females in these age groups living above the poverty line.
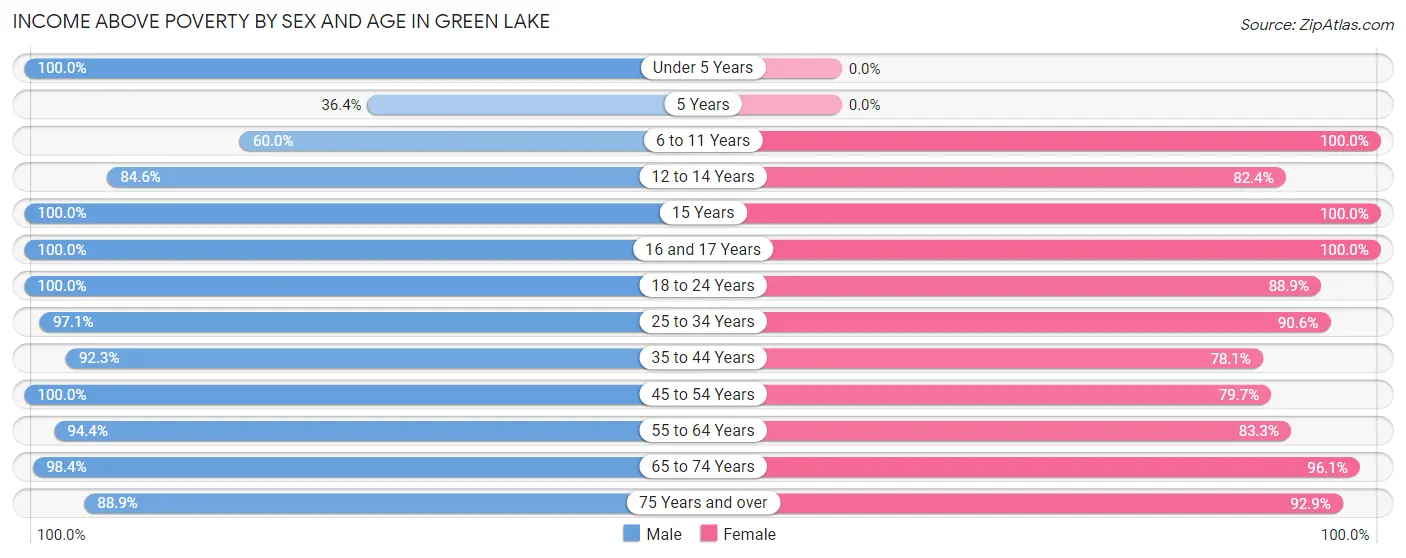
| Age Bracket | Male | Female |
| Under 5 Years | 22 (100.0%) | 0 (0.0%) |
| 5 Years | 4 (36.4%) | 0 (0.0%) |
| 6 to 11 Years | 9 (60.0%) | 31 (100.0%) |
| 12 to 14 Years | 22 (84.6%) | 14 (82.4%) |
| 15 Years | 3 (100.0%) | 3 (100.0%) |
| 16 and 17 Years | 3 (100.0%) | 3 (100.0%) |
| 18 to 24 Years | 2 (100.0%) | 8 (88.9%) |
| 25 to 34 Years | 68 (97.1%) | 58 (90.6%) |
| 35 to 44 Years | 60 (92.3%) | 25 (78.1%) |
| 45 to 54 Years | 21 (100.0%) | 47 (79.7%) |
| 55 to 64 Years | 68 (94.4%) | 60 (83.3%) |
| 65 to 74 Years | 61 (98.4%) | 74 (96.1%) |
| 75 Years and over | 32 (88.9%) | 92 (92.9%) |
| Total | 375 (91.9%) | 415 (87.0%) |
Income Below Poverty Among Married-Couple Families in Green Lake
The poverty statistics for married-couple families in Green Lake show that 3.9% or 6 of the total 153 families live below the poverty line. Families with no children have the highest poverty rate of 5.2%, comprising of 6 families. On the other hand, families with 1 or 2 children have the lowest poverty rate of 0.0%, which includes 0 families.
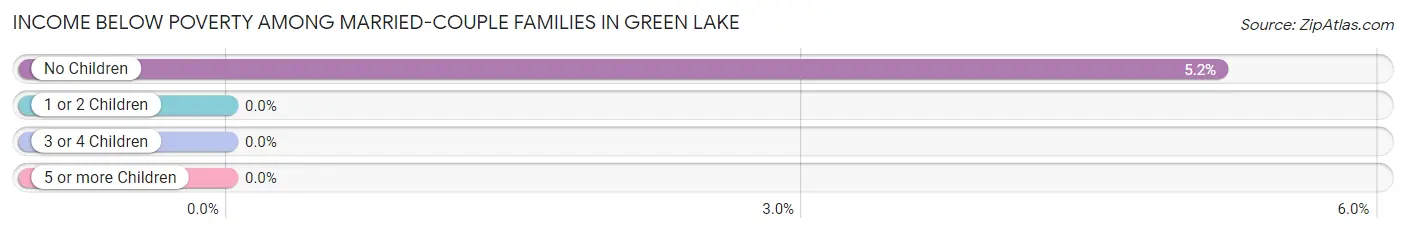
| Children | Above Poverty | Below Poverty |
| No Children | 110 (94.8%) | 6 (5.2%) |
| 1 or 2 Children | 28 (100.0%) | 0 (0.0%) |
| 3 or 4 Children | 9 (100.0%) | 0 (0.0%) |
| 5 or more Children | 0 (0.0%) | 0 (0.0%) |
| Total | 147 (96.1%) | 6 (3.9%) |
Income Below Poverty Among Single-Parent Households in Green Lake
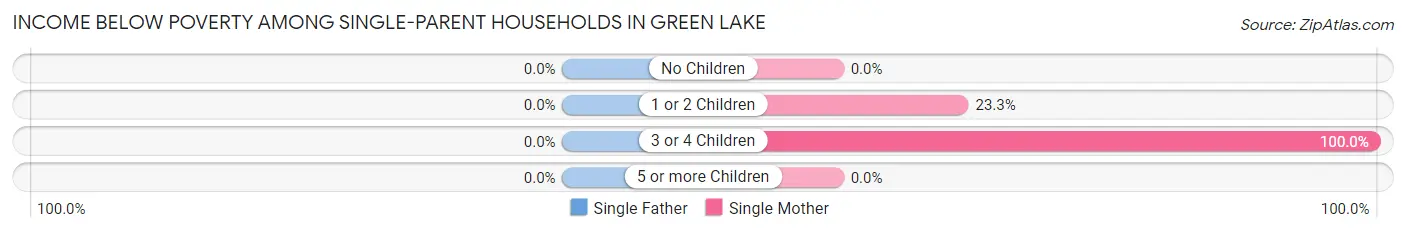
| Children | Single Father | Single Mother |
| No Children | 0 (0.0%) | 0 (0.0%) |
| 1 or 2 Children | 0 (0.0%) | 10 (23.3%) |
| 3 or 4 Children | 0 (0.0%) | 3 (100.0%) |
| 5 or more Children | 0 (0.0%) | 0 (0.0%) |
| Total | 0 (0.0%) | 13 (20.0%) |
Income Below Poverty Among Married-Couple vs Single-Parent Households in Green Lake
The poverty data for Green Lake shows that 6 of the married-couple family households (3.9%) and 13 of the single-parent households (14.6%) are living below the poverty level. Within the married-couple family households, those with no children have the highest poverty rate, with 6 households (5.2%) falling below the poverty line. Among the single-parent households, those with 3 or 4 children have the highest poverty rate, with 3 household (100.0%) living below poverty.
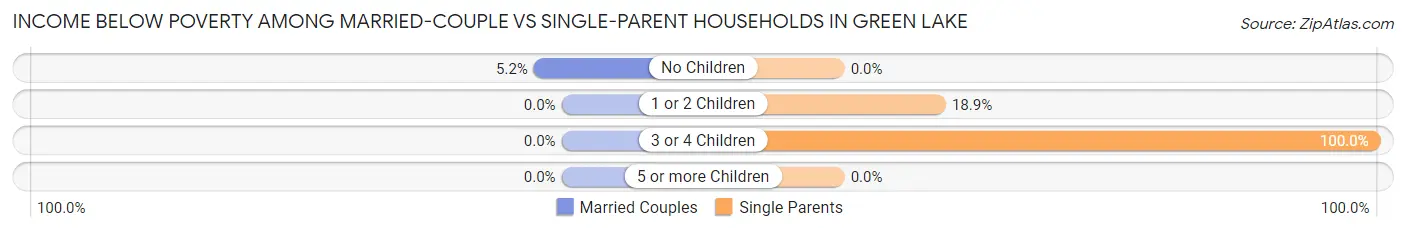
| Children | Married-Couple Families | Single-Parent Households |
| No Children | 6 (5.2%) | 0 (0.0%) |
| 1 or 2 Children | 0 (0.0%) | 10 (18.9%) |
| 3 or 4 Children | 0 (0.0%) | 3 (100.0%) |
| 5 or more Children | 0 (0.0%) | 0 (0.0%) |
| Total | 6 (3.9%) | 13 (14.6%) |
Race in Green Lake
The most populous races in Green Lake are White / Caucasian (945 | 94.5%), Black / African American (25 | 2.5%), and Native / Alaskan (12 | 1.2%).
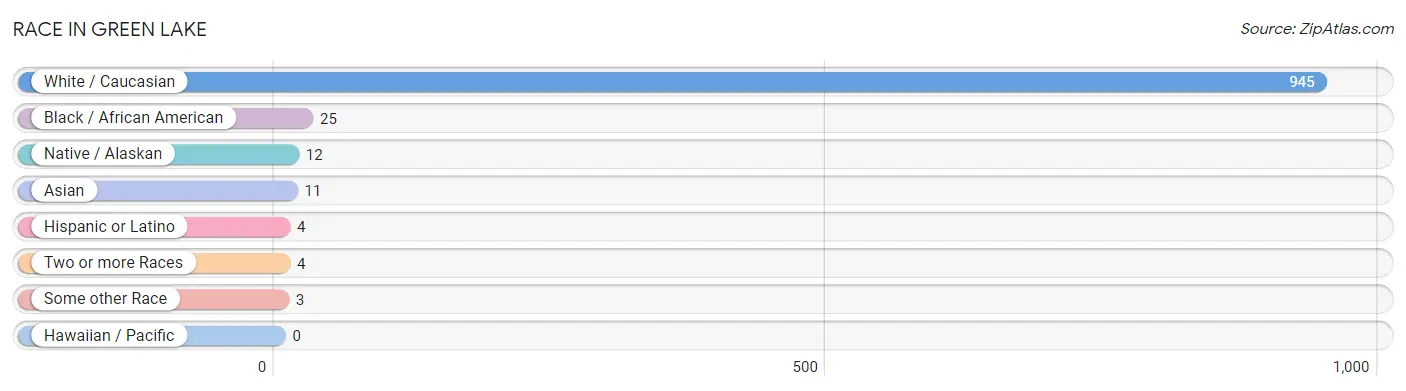
| Race | # Population | % Population |
| Asian | 11 | 1.1% |
| Black / African American | 25 | 2.5% |
| Hawaiian / Pacific | 0 | 0.0% |
| Hispanic or Latino | 4 | 0.4% |
| Native / Alaskan | 12 | 1.2% |
| White / Caucasian | 945 | 94.5% |
| Two or more Races | 4 | 0.4% |
| Some other Race | 3 | 0.3% |
| Total | 1,000 | 100.0% |
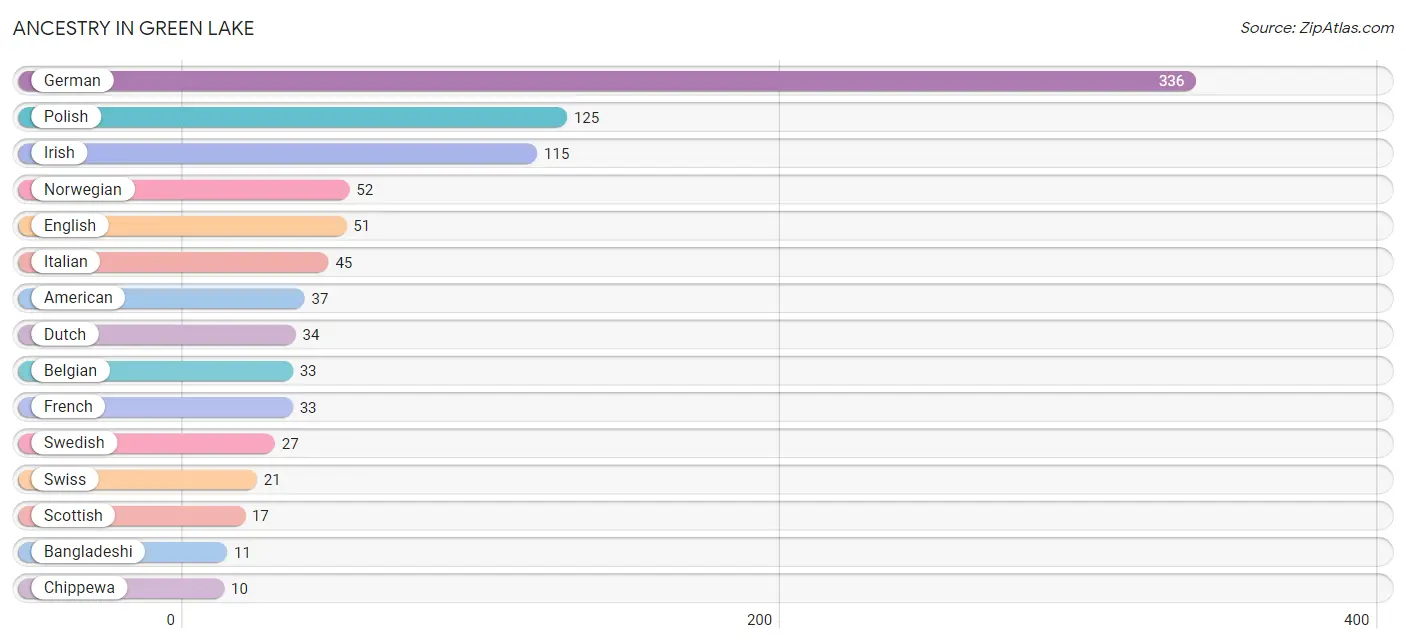
Ancestry in Green Lake
The most populous ancestries reported in Green Lake are German (336 | 33.6%), Polish (125 | 12.5%), Irish (115 | 11.5%), Norwegian (52 | 5.2%), and English (51 | 5.1%), together accounting for 67.9% of all Green Lake residents.
| Ancestry | # Population | % Population |
| American | 37 | 3.7% |
| Arab | 6 | 0.6% |
| Austrian | 3 | 0.3% |
| Bangladeshi | 11 | 1.1% |
| Belgian | 33 | 3.3% |
| Chippewa | 10 | 1.0% |
| Croatian | 4 | 0.4% |
| Cuban | 1 | 0.1% |
| Czech | 1 | 0.1% |
| Czechoslovakian | 8 | 0.8% |
| Danish | 2 | 0.2% |
| Dutch | 34 | 3.4% |
| English | 51 | 5.1% |
| European | 6 | 0.6% |
| Finnish | 2 | 0.2% |
| French | 33 | 3.3% |
| French Canadian | 8 | 0.8% |
| German | 336 | 33.6% |
| Irish | 115 | 11.5% |
| Italian | 45 | 4.5% |
| Lebanese | 6 | 0.6% |
| Luxembourger | 10 | 1.0% |
| Menominee | 2 | 0.2% |
| Mexican | 1 | 0.1% |
| Norwegian | 52 | 5.2% |
| Polish | 125 | 12.5% |
| Portuguese | 9 | 0.9% |
| Puerto Rican | 2 | 0.2% |
| Scandinavian | 8 | 0.8% |
| Scotch-Irish | 9 | 0.9% |
| Scottish | 17 | 1.7% |
| Slavic | 3 | 0.3% |
| Soviet Union | 4 | 0.4% |
| Swedish | 27 | 2.7% |
| Swiss | 21 | 2.1% |
| Welsh | 4 | 0.4% |
| Yugoslavian | 3 | 0.3% | View All 37 Rows |
Immigrants in Green Lake
The most numerous immigrant groups reported in Green Lake came from Europe (14 | 1.4%), Western Europe (12 | 1.2%), Asia (11 | 1.1%), Belgium (11 | 1.1%), and South Eastern Asia (11 | 1.1%), together accounting for 5.9% of all Green Lake residents.
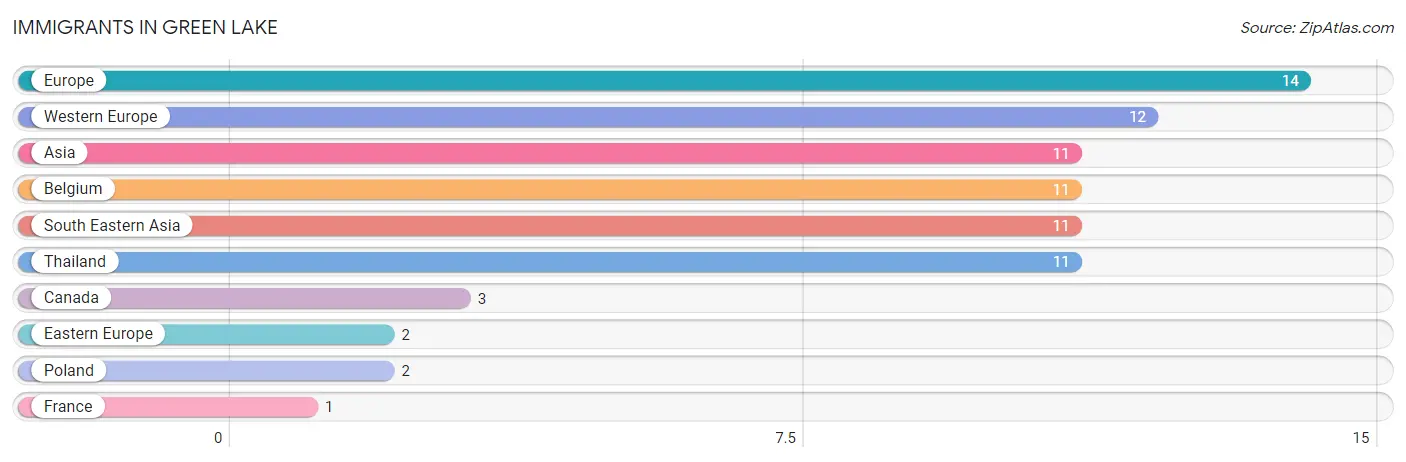
| Immigration Origin | # Population | % Population |
| Asia | 11 | 1.1% |
| Belgium | 11 | 1.1% |
| Canada | 3 | 0.3% |
| Eastern Europe | 2 | 0.2% |
| Europe | 14 | 1.4% |
| France | 1 | 0.1% |
| Poland | 2 | 0.2% |
| South Eastern Asia | 11 | 1.1% |
| Thailand | 11 | 1.1% |
| Western Europe | 12 | 1.2% | View All 10 Rows |
Sex and Age in Green Lake
Sex and Age in Green Lake
The most populous age groups in Green Lake are 60 to 64 Years (55 | 11.3%) for men and 75 to 79 Years (73 | 14.3%) for women.
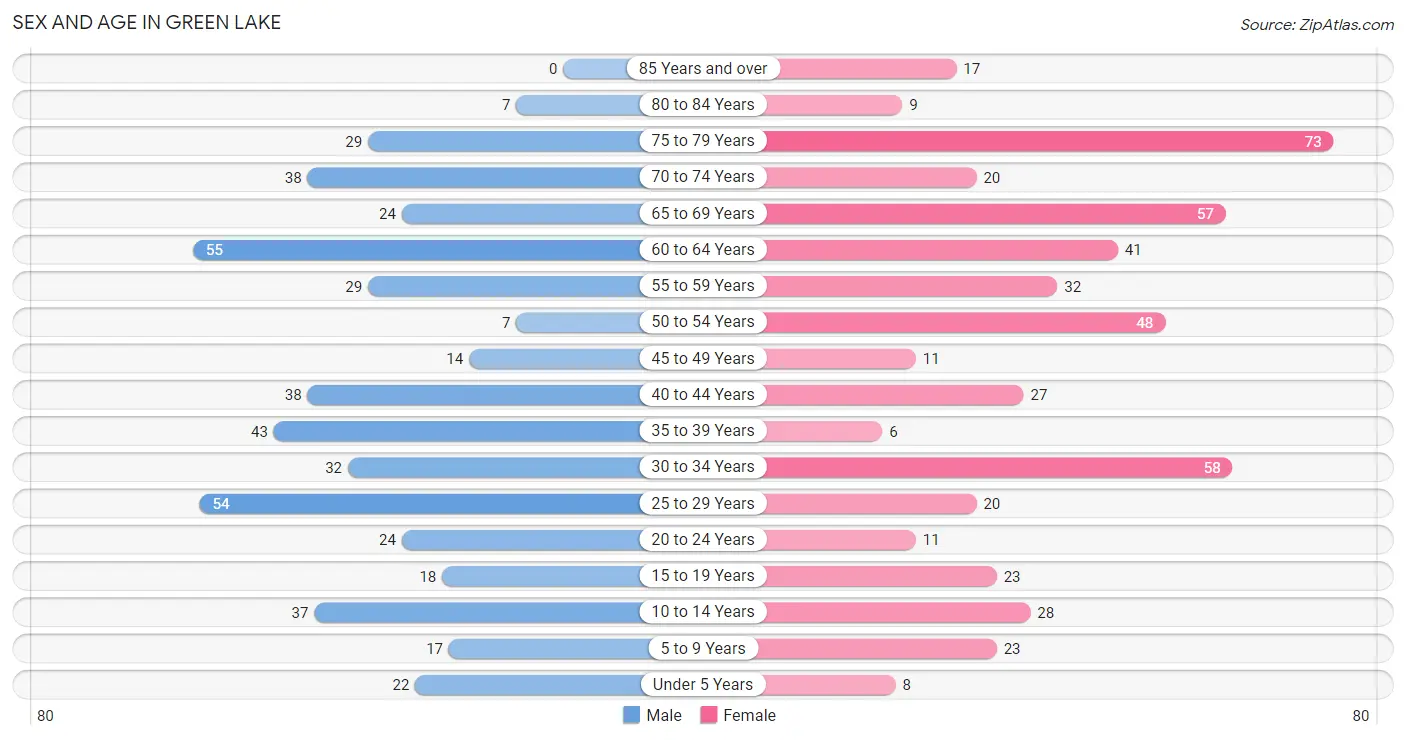
| Age Bracket | Male | Female |
| Under 5 Years | 22 (4.5%) | 8 (1.6%) |
| 5 to 9 Years | 17 (3.5%) | 23 (4.5%) |
| 10 to 14 Years | 37 (7.6%) | 28 (5.5%) |
| 15 to 19 Years | 18 (3.7%) | 23 (4.5%) |
| 20 to 24 Years | 24 (4.9%) | 11 (2.1%) |
| 25 to 29 Years | 54 (11.1%) | 20 (3.9%) |
| 30 to 34 Years | 32 (6.6%) | 58 (11.3%) |
| 35 to 39 Years | 43 (8.8%) | 6 (1.2%) |
| 40 to 44 Years | 38 (7.8%) | 27 (5.3%) |
| 45 to 49 Years | 14 (2.9%) | 11 (2.1%) |
| 50 to 54 Years | 7 (1.4%) | 48 (9.4%) |
| 55 to 59 Years | 29 (5.9%) | 32 (6.2%) |
| 60 to 64 Years | 55 (11.3%) | 41 (8.0%) |
| 65 to 69 Years | 24 (4.9%) | 57 (11.1%) |
| 70 to 74 Years | 38 (7.8%) | 20 (3.9%) |
| 75 to 79 Years | 29 (5.9%) | 73 (14.3%) |
| 80 to 84 Years | 7 (1.4%) | 9 (1.8%) |
| 85 Years and over | 0 (0.0%) | 17 (3.3%) |
| Total | 488 (100.0%) | 512 (100.0%) |
Families and Households in Green Lake
Median Family Size in Green Lake
The median family size in Green Lake is 2.40 persons per family, with married-couple families (153 | 63.2%) accounting for the largest median family size of 2.51 persons per family. On the other hand, single male/father families (24 | 9.9%) represent the smallest median family size with 1.96 persons per family.
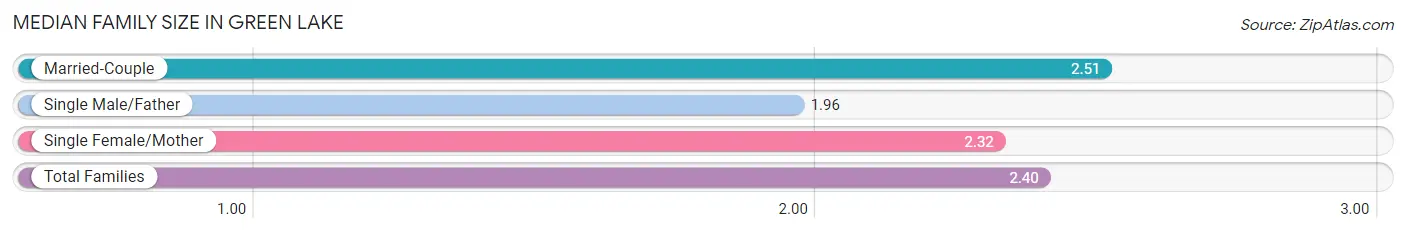
| Family Type | # Families | Family Size |
| Married-Couple | 153 (63.2%) | 2.51 |
| Single Male/Father | 24 (9.9%) | 1.96 |
| Single Female/Mother | 65 (26.9%) | 2.32 |
| Total Families | 242 (100.0%) | 2.40 |
Median Household Size in Green Lake
The median household size in Green Lake is 1.74 persons per household, with single female/mother households (65 | 12.8%) accounting for the largest median household size of 2.58 persons per household. non-family households (268 | 52.5%) represent the smallest median household size with 1.06 persons per household.
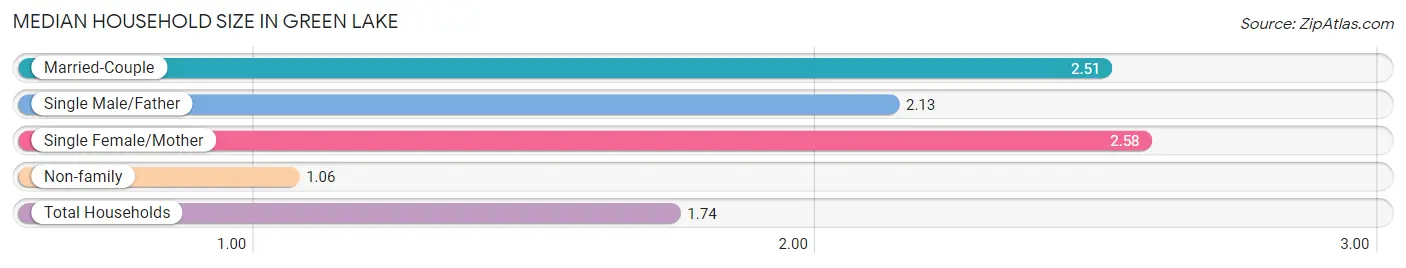
| Household Type | # Households | Household Size |
| Married-Couple | 153 (30.0%) | 2.51 |
| Single Male/Father | 24 (4.7%) | 2.13 |
| Single Female/Mother | 65 (12.8%) | 2.58 |
| Non-family | 268 (52.5%) | 1.06 |
| Total Households | 510 (100.0%) | 1.74 |
Household Size by Marriage Status in Green Lake
Out of a total of 510 households in Green Lake, 242 (47.4%) are family households, while 268 (52.5%) are nonfamily households. The most numerous type of family households are 2-person households, comprising 149, and the most common type of nonfamily households are 1-person households, comprising 253.
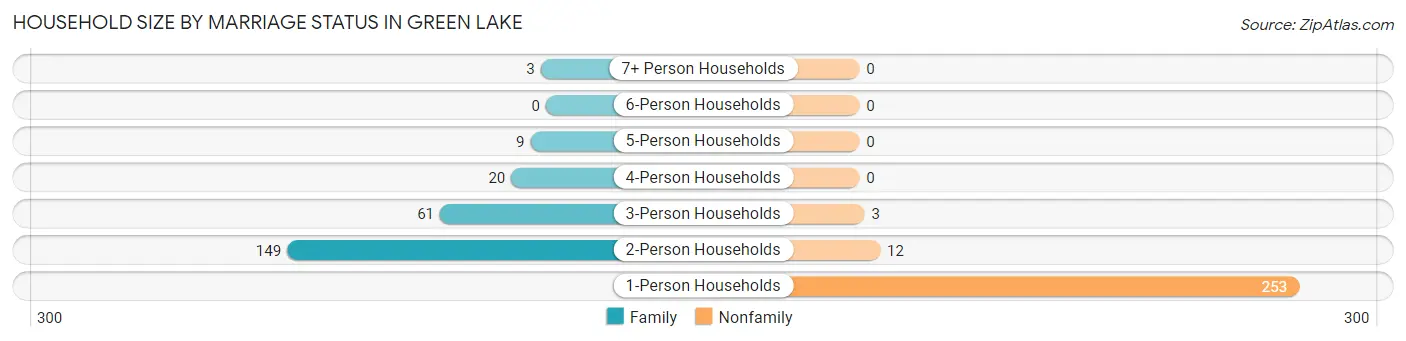
| Household Size | Family Households | Nonfamily Households |
| 1-Person Households | - | 253 (49.6%) |
| 2-Person Households | 149 (29.2%) | 12 (2.4%) |
| 3-Person Households | 61 (12.0%) | 3 (0.6%) |
| 4-Person Households | 20 (3.9%) | 0 (0.0%) |
| 5-Person Households | 9 (1.8%) | 0 (0.0%) |
| 6-Person Households | 0 (0.0%) | 0 (0.0%) |
| 7+ Person Households | 3 (0.6%) | 0 (0.0%) |
| Total | 242 (47.4%) | 268 (52.5%) |
Female Fertility in Green Lake
Fertility by Age in Green Lake
Average fertility rate in Green Lake is 63.0 births per 1,000 women. Women in the age bracket of 20 to 34 years have the highest fertility rate with 112.0 births per 1,000 women. Women in the age bracket of 20 to 34 years acount for 100.0% of all women with births.
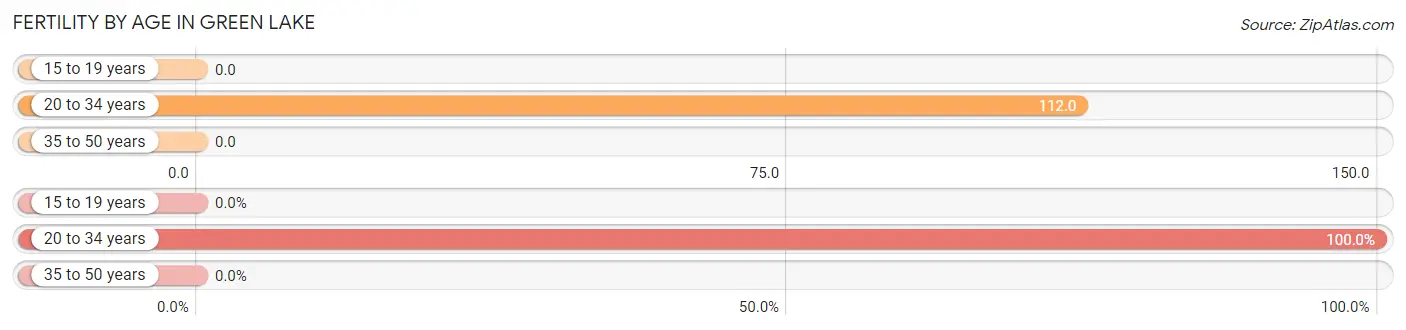
| Age Bracket | Women with Births | Births / 1,000 Women |
| 15 to 19 years | 0 (0.0%) | 0.0 |
| 20 to 34 years | 10 (100.0%) | 112.0 |
| 35 to 50 years | 0 (0.0%) | 0.0 |
| Total | 10 (100.0%) | 63.0 |
Fertility by Age by Marriage Status in Green Lake
90.0% of women with births (10) in Green Lake are married. The highest percentage of unmarried women with births falls into 20 to 34 years age bracket with 10.0% of them unmarried at the time of birth, while the lowest percentage of unmarried women with births belong to 20 to 34 years age bracket with 10.0% of them unmarried.
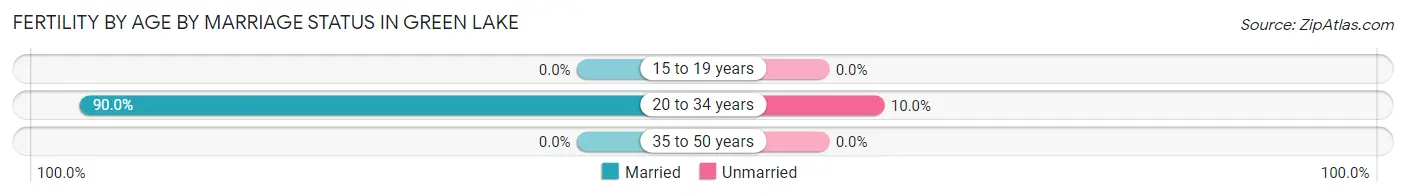
| Age Bracket | Married | Unmarried |
| 15 to 19 years | 0 (0.0%) | 0 (0.0%) |
| 20 to 34 years | 9 (90.0%) | 1 (10.0%) |
| 35 to 50 years | 0 (0.0%) | 0 (0.0%) |
| Total | 9 (90.0%) | 1 (10.0%) |
Fertility by Education in Green Lake
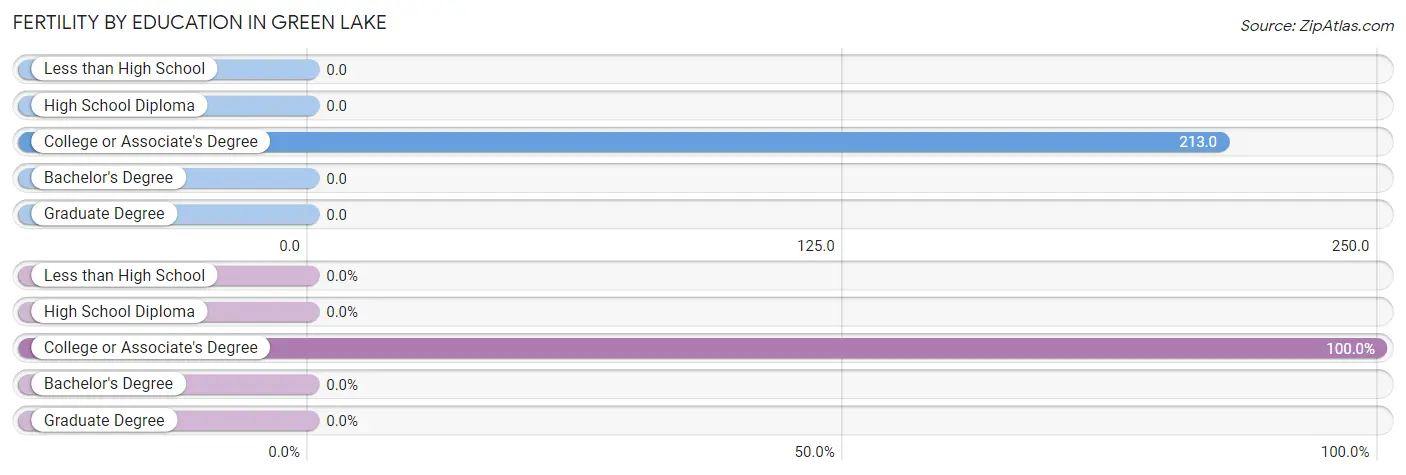
| Educational Attainment | Women with Births | Births / 1,000 Women |
| Less than High School | 0 (0.0%) | 0.0 |
| High School Diploma | 0 (0.0%) | 0.0 |
| College or Associate's Degree | 10 (100.0%) | 213.0 |
| Bachelor's Degree | 0 (0.0%) | 0.0 |
| Graduate Degree | 0 (0.0%) | 0.0 |
| Total | 10 (100.0%) | 63.0 |
Fertility by Education by Marriage Status in Green Lake
10.0% of women with births in Green Lake are unmarried. Women with the educational attainment of college or associate's degree are most likely to be married with 90.0% of them married at childbirth, while women with the educational attainment of college or associate's degree are least likely to be married with 10.0% of them unmarried at childbirth.
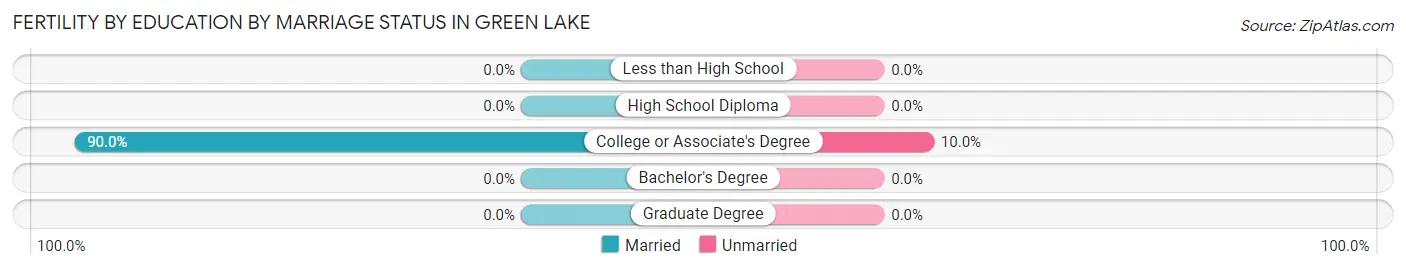
| Educational Attainment | Married | Unmarried |
| Less than High School | 0 (0.0%) | 0 (0.0%) |
| High School Diploma | 0 (0.0%) | 0 (0.0%) |
| College or Associate's Degree | 9 (90.0%) | 1 (10.0%) |
| Bachelor's Degree | 0 (0.0%) | 0 (0.0%) |
| Graduate Degree | 0 (0.0%) | 0 (0.0%) |
| Total | 9 (90.0%) | 1 (10.0%) |
Employment Characteristics in Green Lake
Employment by Class of Employer in Green Lake
Among the 449 employed individuals in Green Lake, private company employees (316 | 70.4%), not-for-profit organizations (51 | 11.4%), and self-employed (incorporated) (32 | 7.1%) make up the most common classes of employment.
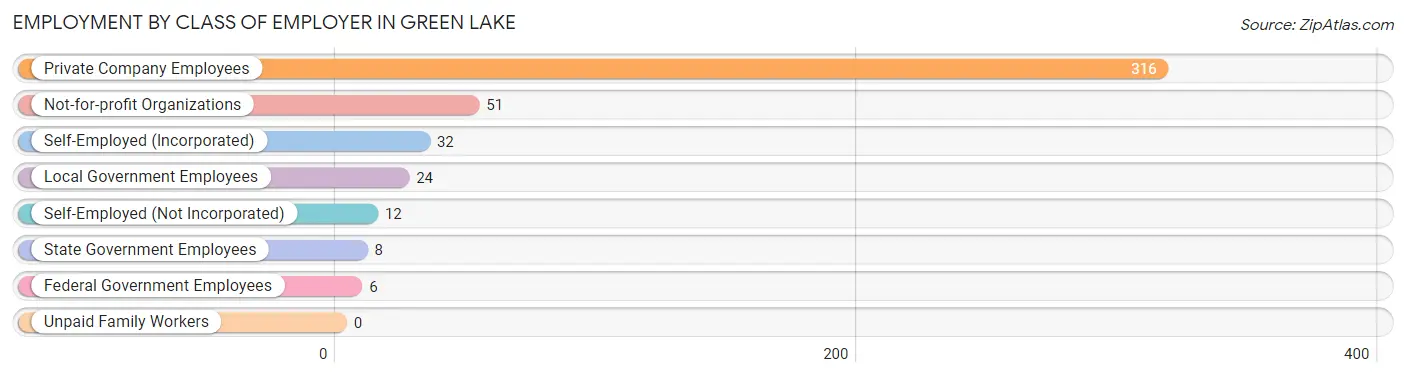
| Employer Class | # Employees | % Employees |
| Private Company Employees | 316 | 70.4% |
| Self-Employed (Incorporated) | 32 | 7.1% |
| Self-Employed (Not Incorporated) | 12 | 2.7% |
| Not-for-profit Organizations | 51 | 11.4% |
| Local Government Employees | 24 | 5.3% |
| State Government Employees | 8 | 1.8% |
| Federal Government Employees | 6 | 1.3% |
| Unpaid Family Workers | 0 | 0.0% |
| Total | 449 | 100.0% |
Employment Status by Age in Green Lake
According to the labor force statistics for Green Lake, out of the total population over 16 years of age (859), 55.5% or 477 individuals are in the labor force, with 4.0% or 19 of them unemployed. The age group with the highest labor force participation rate is 55 to 59 years, with 85.2% or 52 individuals in the labor force. Within the labor force, the 65 to 74 years age range has the highest percentage of unemployed individuals, with 7.8% or 5 of them being unemployed.
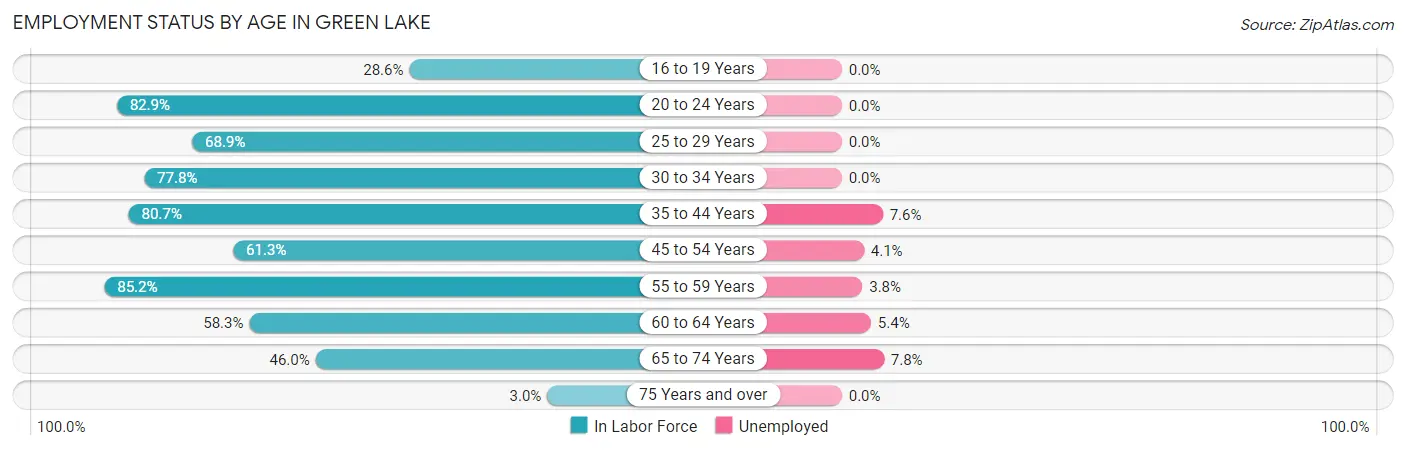
| Age Bracket | In Labor Force | Unemployed |
| 16 to 19 Years | 10 (28.6%) | 0 (0.0%) |
| 20 to 24 Years | 29 (82.9%) | 0 (0.0%) |
| 25 to 29 Years | 51 (68.9%) | 0 (0.0%) |
| 30 to 34 Years | 70 (77.8%) | 0 (0.0%) |
| 35 to 44 Years | 92 (80.7%) | 7 (7.6%) |
| 45 to 54 Years | 49 (61.3%) | 2 (4.1%) |
| 55 to 59 Years | 52 (85.2%) | 2 (3.8%) |
| 60 to 64 Years | 56 (58.3%) | 3 (5.4%) |
| 65 to 74 Years | 64 (46.0%) | 5 (7.8%) |
| 75 Years and over | 4 (3.0%) | 0 (0.0%) |
| Total | 477 (55.5%) | 19 (4.0%) |
Employment Status by Educational Attainment in Green Lake
According to labor force statistics for Green Lake, 71.8% of individuals (370) out of the total population between 25 and 64 years of age (515) are in the labor force, with 3.8% or 14 of them being unemployed. The group with the highest labor force participation rate are those with the educational attainment of bachelor's degree or higher, with 78.2% or 154 individuals in the labor force. Within the labor force, individuals with high school diploma education have the highest percentage of unemployment, with 11.4% or 9 of them being unemployed.
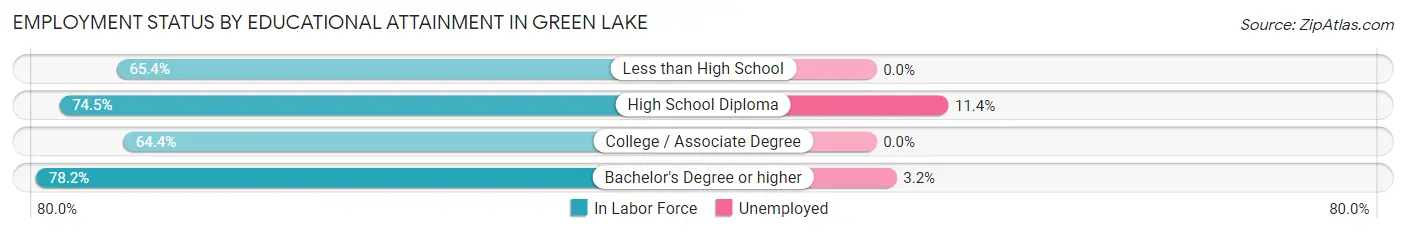
| Educational Attainment | In Labor Force | Unemployed |
| Less than High School | 34 (65.4%) | 0 (0.0%) |
| High School Diploma | 79 (74.5%) | 12 (11.4%) |
| College / Associate Degree | 103 (64.4%) | 0 (0.0%) |
| Bachelor's Degree or higher | 154 (78.2%) | 6 (3.2%) |
| Total | 370 (71.8%) | 20 (3.8%) |
Employment Occupations by Sex in Green Lake
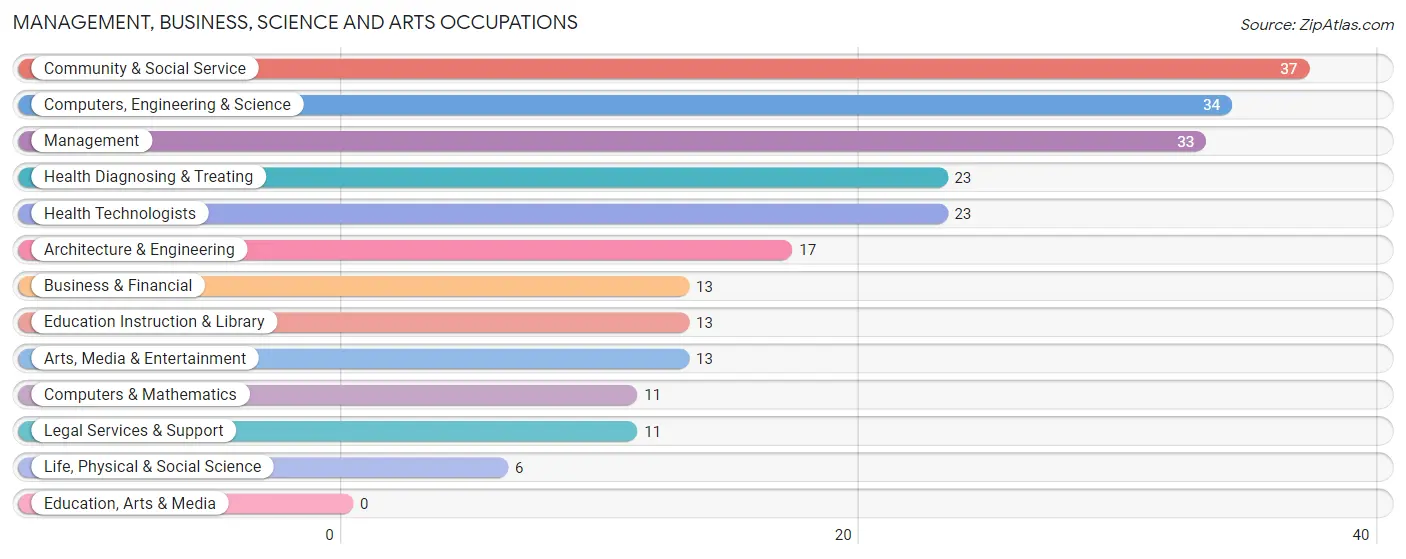
Management, Business, Science and Arts Occupations
The most common Management, Business, Science and Arts occupations in Green Lake are Community & Social Service (37 | 8.1%), Computers, Engineering & Science (34 | 7.4%), Management (33 | 7.2%), Health Diagnosing & Treating (23 | 5.0%), and Health Technologists (23 | 5.0%).
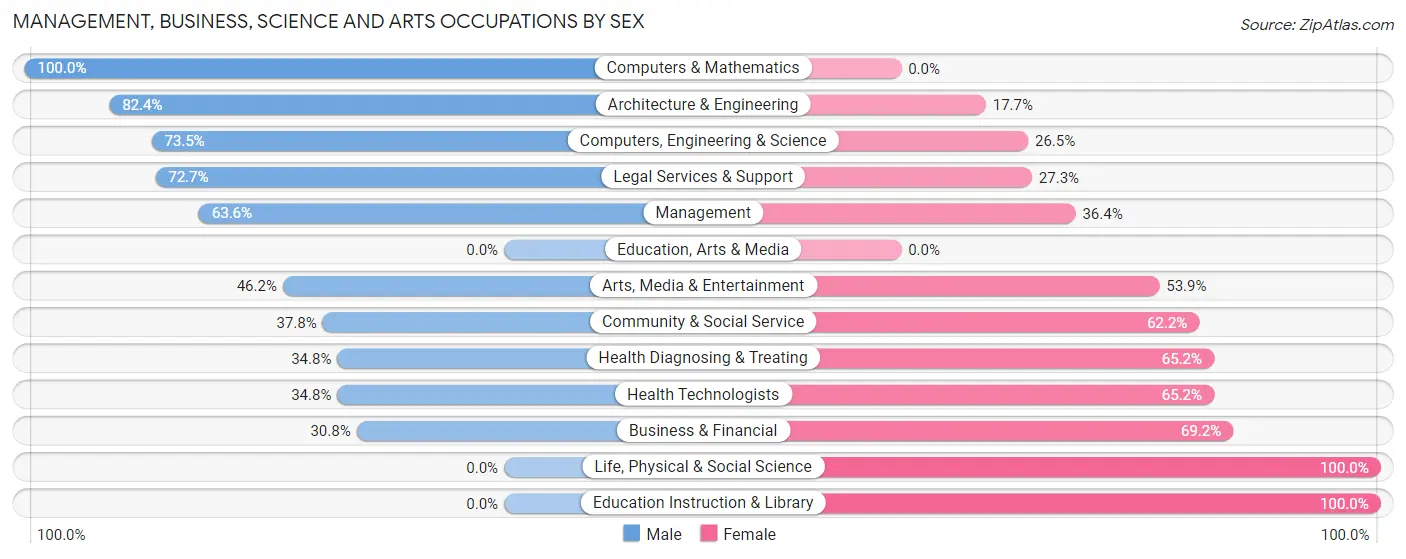
Management, Business, Science and Arts Occupations by Sex
Within the Management, Business, Science and Arts occupations in Green Lake, the most male-oriented occupations are Computers & Mathematics (100.0%), Architecture & Engineering (82.4%), and Computers, Engineering & Science (73.5%), while the most female-oriented occupations are Life, Physical & Social Science (100.0%), Education Instruction & Library (100.0%), and Business & Financial (69.2%).
| Occupation | Male | Female |
| Management | 21 (63.6%) | 12 (36.4%) |
| Business & Financial | 4 (30.8%) | 9 (69.2%) |
| Computers, Engineering & Science | 25 (73.5%) | 9 (26.5%) |
| Computers & Mathematics | 11 (100.0%) | 0 (0.0%) |
| Architecture & Engineering | 14 (82.4%) | 3 (17.6%) |
| Life, Physical & Social Science | 0 (0.0%) | 6 (100.0%) |
| Community & Social Service | 14 (37.8%) | 23 (62.2%) |
| Education, Arts & Media | 0 (0.0%) | 0 (0.0%) |
| Legal Services & Support | 8 (72.7%) | 3 (27.3%) |
| Education Instruction & Library | 0 (0.0%) | 13 (100.0%) |
| Arts, Media & Entertainment | 6 (46.2%) | 7 (53.8%) |
| Health Diagnosing & Treating | 8 (34.8%) | 15 (65.2%) |
| Health Technologists | 8 (34.8%) | 15 (65.2%) |
| Total (Category) | 72 (51.4%) | 68 (48.6%) |
| Total (Overall) | 244 (53.3%) | 214 (46.7%) |
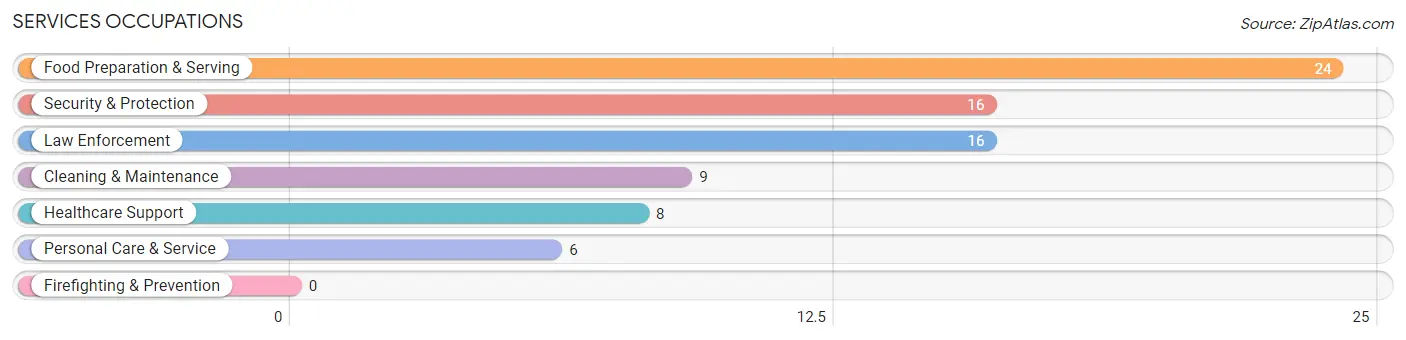
Services Occupations
The most common Services occupations in Green Lake are Food Preparation & Serving (24 | 5.2%), Security & Protection (16 | 3.5%), Law Enforcement (16 | 3.5%), Cleaning & Maintenance (9 | 2.0%), and Healthcare Support (8 | 1.8%).
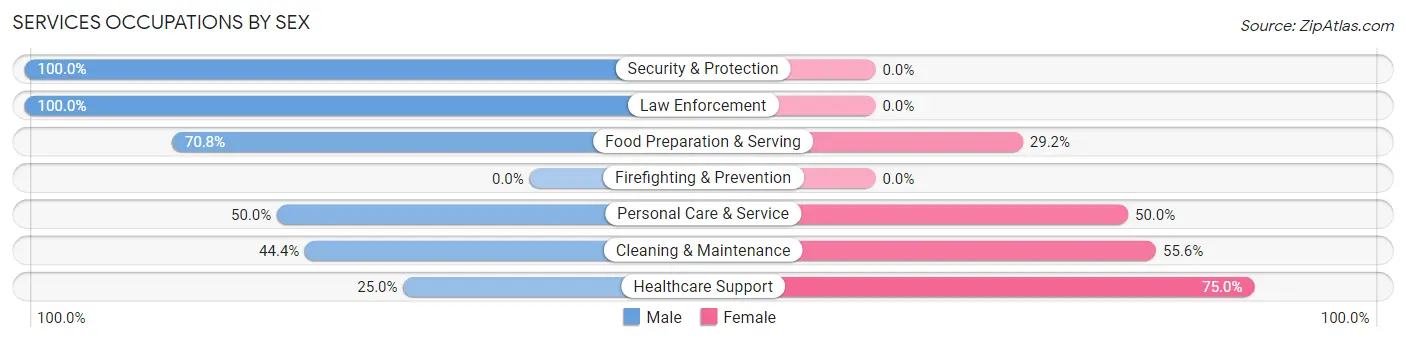
Services Occupations by Sex
Within the Services occupations in Green Lake, the most male-oriented occupations are Security & Protection (100.0%), Law Enforcement (100.0%), and Food Preparation & Serving (70.8%), while the most female-oriented occupations are Healthcare Support (75.0%), Cleaning & Maintenance (55.6%), and Personal Care & Service (50.0%).
| Occupation | Male | Female |
| Healthcare Support | 2 (25.0%) | 6 (75.0%) |
| Security & Protection | 16 (100.0%) | 0 (0.0%) |
| Firefighting & Prevention | 0 (0.0%) | 0 (0.0%) |
| Law Enforcement | 16 (100.0%) | 0 (0.0%) |
| Food Preparation & Serving | 17 (70.8%) | 7 (29.2%) |
| Cleaning & Maintenance | 4 (44.4%) | 5 (55.6%) |
| Personal Care & Service | 3 (50.0%) | 3 (50.0%) |
| Total (Category) | 42 (66.7%) | 21 (33.3%) |
| Total (Overall) | 244 (53.3%) | 214 (46.7%) |
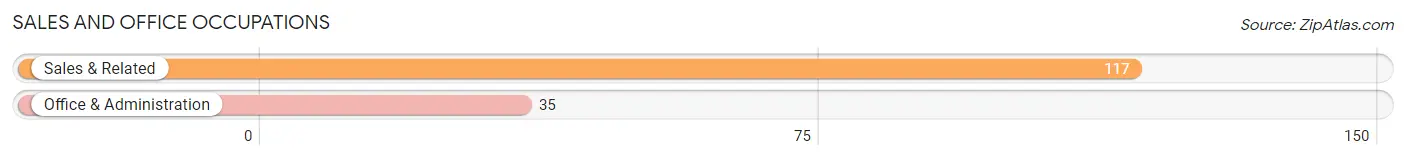
Sales and Office Occupations
The most common Sales and Office occupations in Green Lake are Sales & Related (117 | 25.6%), and Office & Administration (35 | 7.6%).
Sales and Office Occupations by Sex
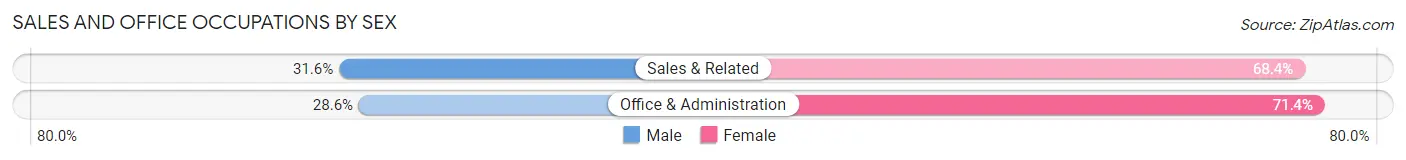
| Occupation | Male | Female |
| Sales & Related | 37 (31.6%) | 80 (68.4%) |
| Office & Administration | 10 (28.6%) | 25 (71.4%) |
| Total (Category) | 47 (30.9%) | 105 (69.1%) |
| Total (Overall) | 244 (53.3%) | 214 (46.7%) |
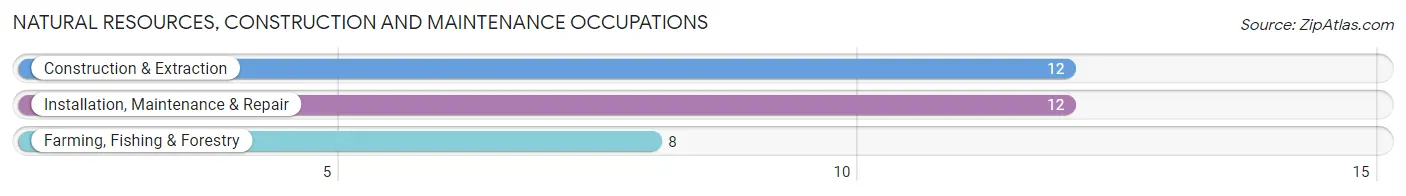
Natural Resources, Construction and Maintenance Occupations
The most common Natural Resources, Construction and Maintenance occupations in Green Lake are Construction & Extraction (12 | 2.6%), Installation, Maintenance & Repair (12 | 2.6%), and Farming, Fishing & Forestry (8 | 1.8%).
Natural Resources, Construction and Maintenance Occupations by Sex
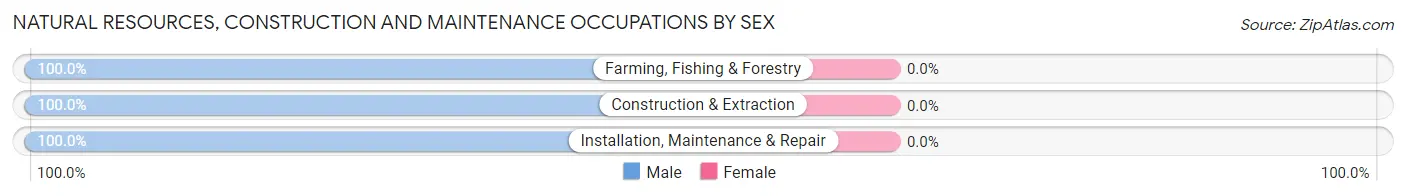
| Occupation | Male | Female |
| Farming, Fishing & Forestry | 8 (100.0%) | 0 (0.0%) |
| Construction & Extraction | 12 (100.0%) | 0 (0.0%) |
| Installation, Maintenance & Repair | 12 (100.0%) | 0 (0.0%) |
| Total (Category) | 32 (100.0%) | 0 (0.0%) |
| Total (Overall) | 244 (53.3%) | 214 (46.7%) |
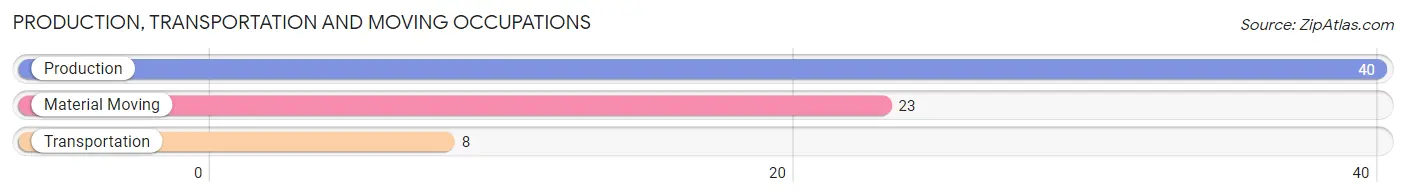
Production, Transportation and Moving Occupations
The most common Production, Transportation and Moving occupations in Green Lake are Production (40 | 8.7%), Material Moving (23 | 5.0%), and Transportation (8 | 1.8%).
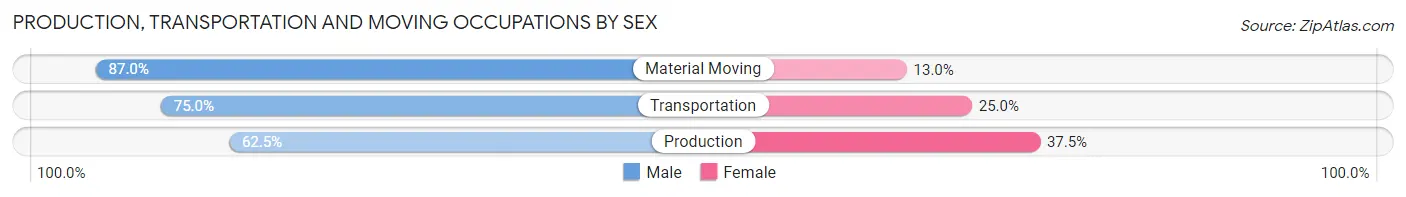
Production, Transportation and Moving Occupations by Sex
| Occupation | Male | Female |
| Production | 25 (62.5%) | 15 (37.5%) |
| Transportation | 6 (75.0%) | 2 (25.0%) |
| Material Moving | 20 (87.0%) | 3 (13.0%) |
| Total (Category) | 51 (71.8%) | 20 (28.2%) |
| Total (Overall) | 244 (53.3%) | 214 (46.7%) |
Employment Industries by Sex in Green Lake
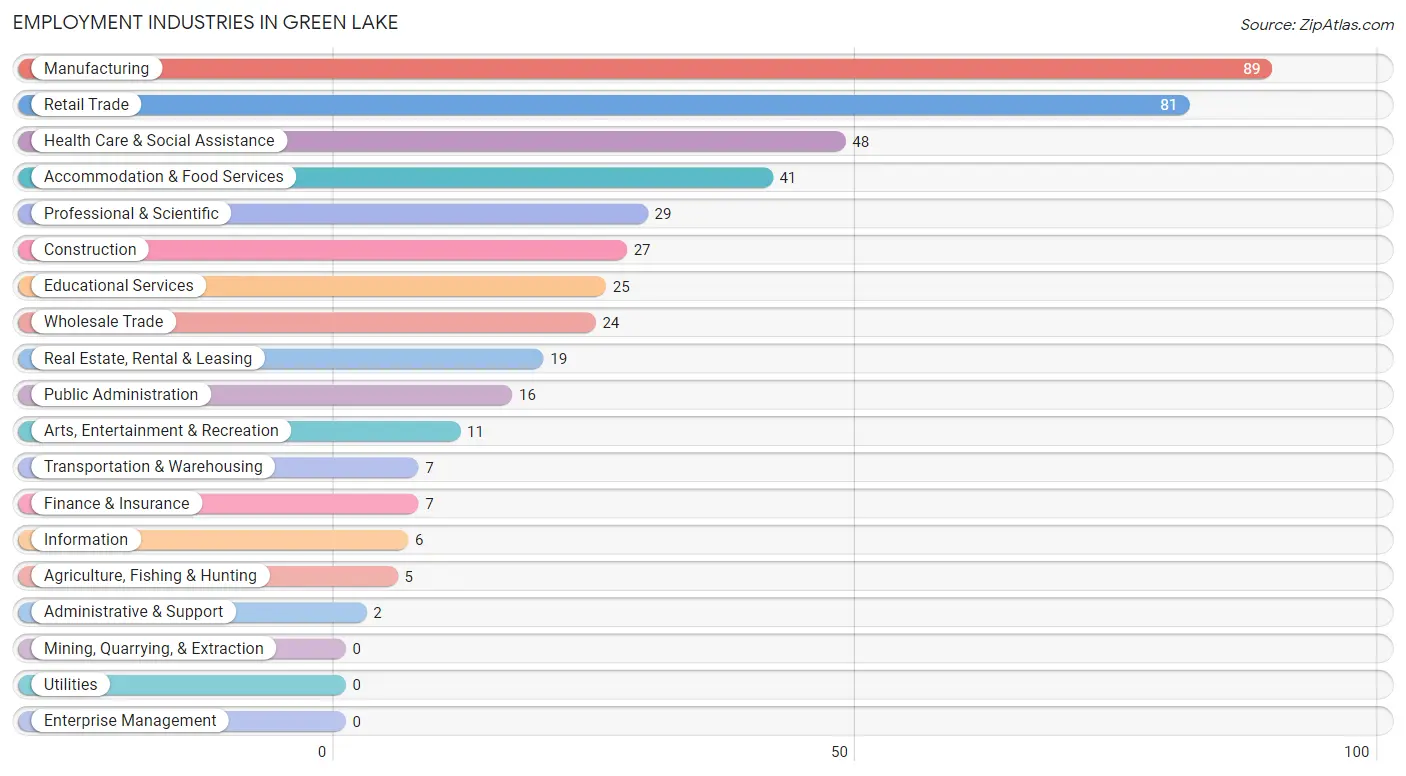
Employment Industries in Green Lake
The major employment industries in Green Lake include Manufacturing (89 | 19.4%), Retail Trade (81 | 17.7%), Health Care & Social Assistance (48 | 10.5%), Accommodation & Food Services (41 | 8.9%), and Professional & Scientific (29 | 6.3%).
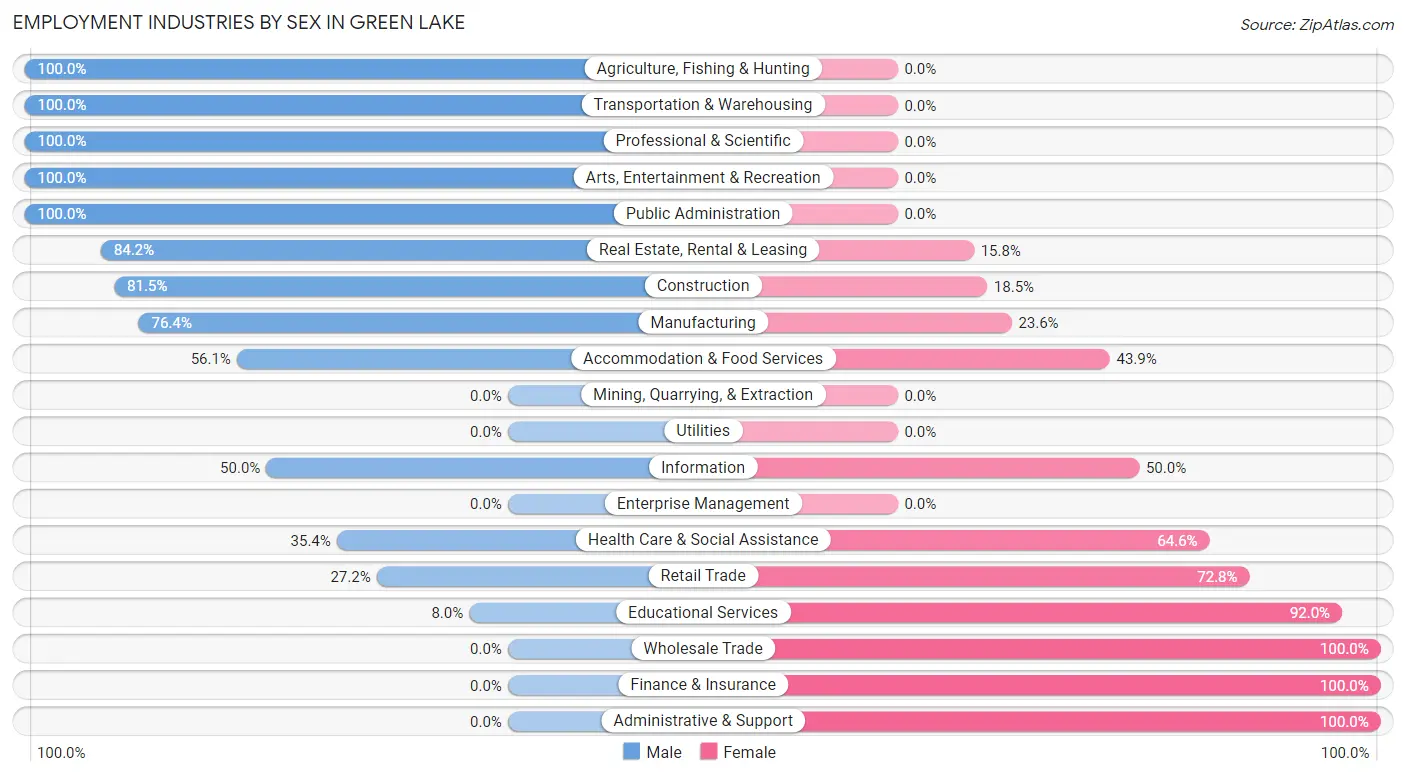
Employment Industries by Sex in Green Lake
The Green Lake industries that see more men than women are Agriculture, Fishing & Hunting (100.0%), Transportation & Warehousing (100.0%), and Professional & Scientific (100.0%), whereas the industries that tend to have a higher number of women are Wholesale Trade (100.0%), Finance & Insurance (100.0%), and Administrative & Support (100.0%).
| Industry | Male | Female |
| Agriculture, Fishing & Hunting | 5 (100.0%) | 0 (0.0%) |
| Mining, Quarrying, & Extraction | 0 (0.0%) | 0 (0.0%) |
| Construction | 22 (81.5%) | 5 (18.5%) |
| Manufacturing | 68 (76.4%) | 21 (23.6%) |
| Wholesale Trade | 0 (0.0%) | 24 (100.0%) |
| Retail Trade | 22 (27.2%) | 59 (72.8%) |
| Transportation & Warehousing | 7 (100.0%) | 0 (0.0%) |
| Utilities | 0 (0.0%) | 0 (0.0%) |
| Information | 3 (50.0%) | 3 (50.0%) |
| Finance & Insurance | 0 (0.0%) | 7 (100.0%) |
| Real Estate, Rental & Leasing | 16 (84.2%) | 3 (15.8%) |
| Professional & Scientific | 29 (100.0%) | 0 (0.0%) |
| Enterprise Management | 0 (0.0%) | 0 (0.0%) |
| Administrative & Support | 0 (0.0%) | 2 (100.0%) |
| Educational Services | 2 (8.0%) | 23 (92.0%) |
| Health Care & Social Assistance | 17 (35.4%) | 31 (64.6%) |
| Arts, Entertainment & Recreation | 11 (100.0%) | 0 (0.0%) |
| Accommodation & Food Services | 23 (56.1%) | 18 (43.9%) |
| Public Administration | 16 (100.0%) | 0 (0.0%) |
| Total | 244 (53.3%) | 214 (46.7%) |
Education in Green Lake
School Enrollment in Green Lake
The most common levels of schooling among the 195 students in Green Lake are college / undergraduate (68 | 34.9%), middle school (44 | 22.6%), and elementary school (43 | 22.1%).
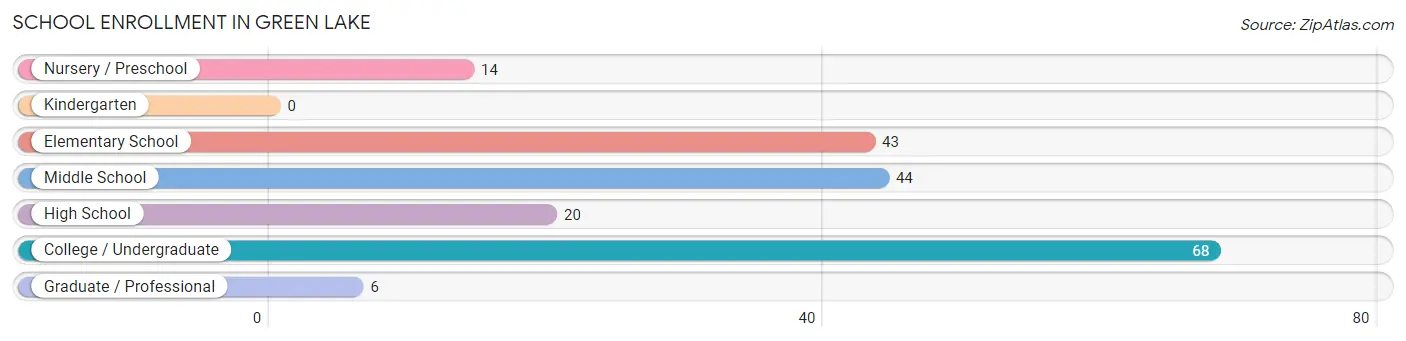
| School Level | # Students | % Students |
| Nursery / Preschool | 14 | 7.2% |
| Kindergarten | 0 | 0.0% |
| Elementary School | 43 | 22.1% |
| Middle School | 44 | 22.6% |
| High School | 20 | 10.3% |
| College / Undergraduate | 68 | 34.9% |
| Graduate / Professional | 6 | 3.1% |
| Total | 195 | 100.0% |
School Enrollment by Age by Funding Source in Green Lake
Out of a total of 195 students who are enrolled in schools in Green Lake, 62 (31.8%) attend a private institution, while the remaining 133 (68.2%) are enrolled in public schools. The age group of 35 years and over has the highest likelihood of being enrolled in private schools, with 3 (100.0% in the age bracket) enrolled. Conversely, the age group of 15 to 17 year olds has the lowest likelihood of being enrolled in a private school, with 12 (100.0% in the age bracket) attending a public institution.

| Age Bracket | Public School | Private School |
| 3 to 4 Year Olds | 0 (0.0%) | 0 (0.0%) |
| 5 to 9 Year Old | 38 (95.0%) | 2 (5.0%) |
| 10 to 14 Year Olds | 51 (78.5%) | 14 (21.5%) |
| 15 to 17 Year Olds | 12 (100.0%) | 0 (0.0%) |
| 18 to 19 Year Olds | 16 (64.0%) | 9 (36.0%) |
| 20 to 24 Year Olds | 10 (34.5%) | 19 (65.5%) |
| 25 to 34 Year Olds | 6 (28.6%) | 15 (71.4%) |
| 35 Years and over | 0 (0.0%) | 3 (100.0%) |
| Total | 133 (68.2%) | 62 (31.8%) |
Educational Attainment by Field of Study in Green Lake
Business (70 | 23.7%), education (68 | 23.1%), communications (24 | 8.1%), bio, nature & agricultural (22 | 7.5%), and arts & humanities (21 | 7.1%) are the most common fields of study among 295 individuals in Green Lake who have obtained a bachelor's degree or higher.
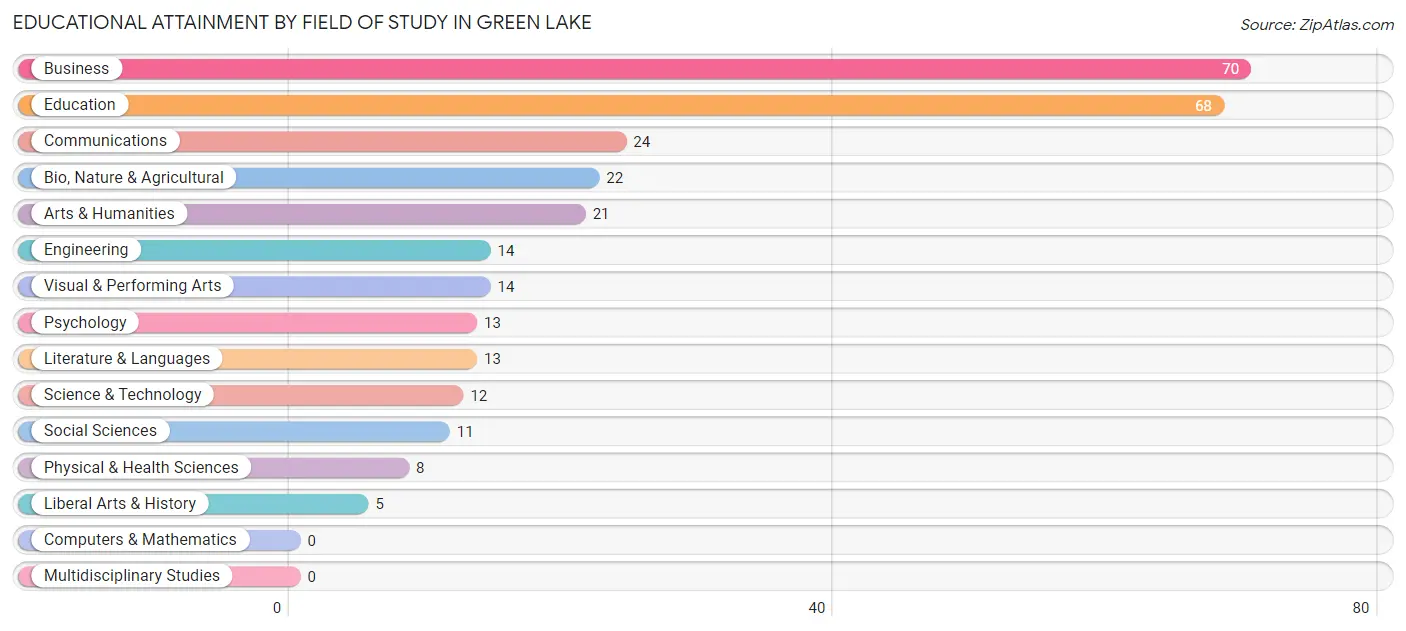
| Field of Study | # Graduates | % Graduates |
| Computers & Mathematics | 0 | 0.0% |
| Bio, Nature & Agricultural | 22 | 7.5% |
| Physical & Health Sciences | 8 | 2.7% |
| Psychology | 13 | 4.4% |
| Social Sciences | 11 | 3.7% |
| Engineering | 14 | 4.8% |
| Multidisciplinary Studies | 0 | 0.0% |
| Science & Technology | 12 | 4.1% |
| Business | 70 | 23.7% |
| Education | 68 | 23.1% |
| Literature & Languages | 13 | 4.4% |
| Liberal Arts & History | 5 | 1.7% |
| Visual & Performing Arts | 14 | 4.8% |
| Communications | 24 | 8.1% |
| Arts & Humanities | 21 | 7.1% |
| Total | 295 | 100.0% |
Transportation & Commute in Green Lake
Vehicle Availability by Sex in Green Lake
The most prevalent vehicle ownership categories in Green Lake are males with 2 vehicles (105, accounting for 46.9%) and females with 2 vehicles (115, making up 51.5%).
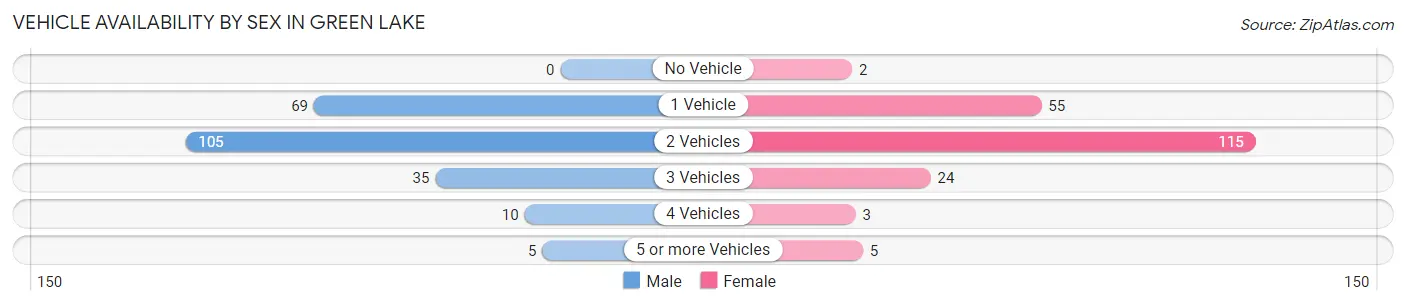
| Vehicles Available | Male | Female |
| No Vehicle | 0 (0.0%) | 2 (1.0%) |
| 1 Vehicle | 69 (30.8%) | 55 (27.0%) |
| 2 Vehicles | 105 (46.9%) | 115 (56.4%) |
| 3 Vehicles | 35 (15.6%) | 24 (11.8%) |
| 4 Vehicles | 10 (4.5%) | 3 (1.5%) |
| 5 or more Vehicles | 5 (2.2%) | 5 (2.5%) |
| Total | 224 (100.0%) | 204 (100.0%) |
Commute Time in Green Lake
The most frequently occuring commute durations in Green Lake are 15 to 19 minutes (93 commuters, 25.5%), 5 to 9 minutes (84 commuters, 23.0%), and 60 to 89 minutes (37 commuters, 10.1%).
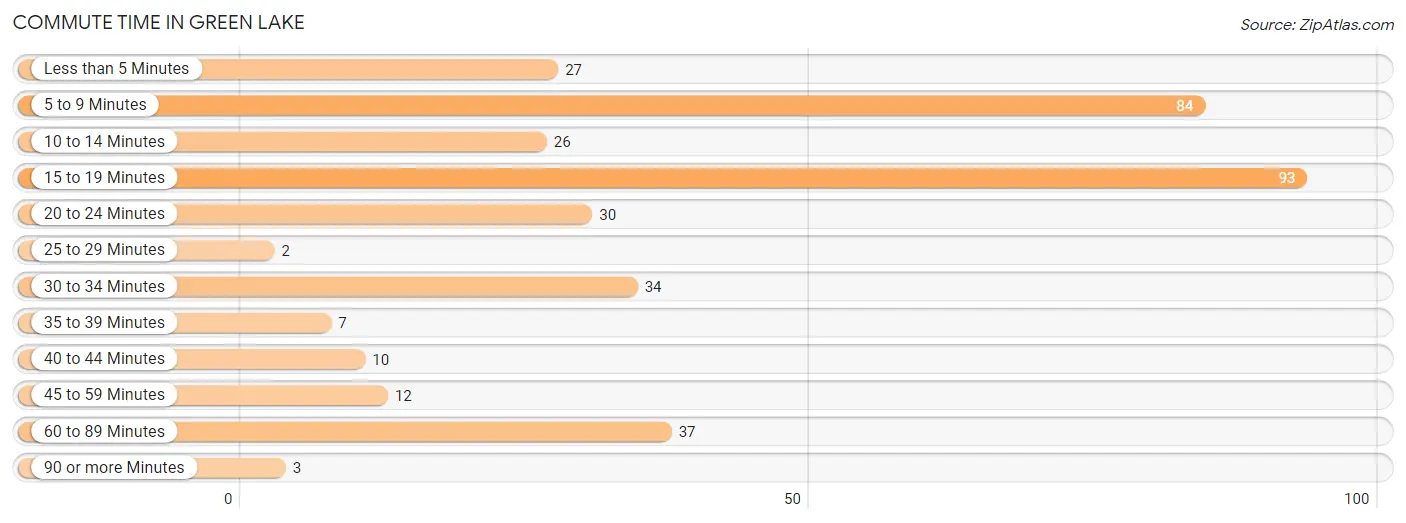
| Commute Time | # Commuters | % Commuters |
| Less than 5 Minutes | 27 | 7.4% |
| 5 to 9 Minutes | 84 | 23.0% |
| 10 to 14 Minutes | 26 | 7.1% |
| 15 to 19 Minutes | 93 | 25.5% |
| 20 to 24 Minutes | 30 | 8.2% |
| 25 to 29 Minutes | 2 | 0.5% |
| 30 to 34 Minutes | 34 | 9.3% |
| 35 to 39 Minutes | 7 | 1.9% |
| 40 to 44 Minutes | 10 | 2.7% |
| 45 to 59 Minutes | 12 | 3.3% |
| 60 to 89 Minutes | 37 | 10.1% |
| 90 or more Minutes | 3 | 0.8% |
Commute Time by Sex in Green Lake
The most common commute times in Green Lake are 15 to 19 minutes (65 commuters, 31.2%) for males and 5 to 9 minutes (54 commuters, 34.4%) for females.
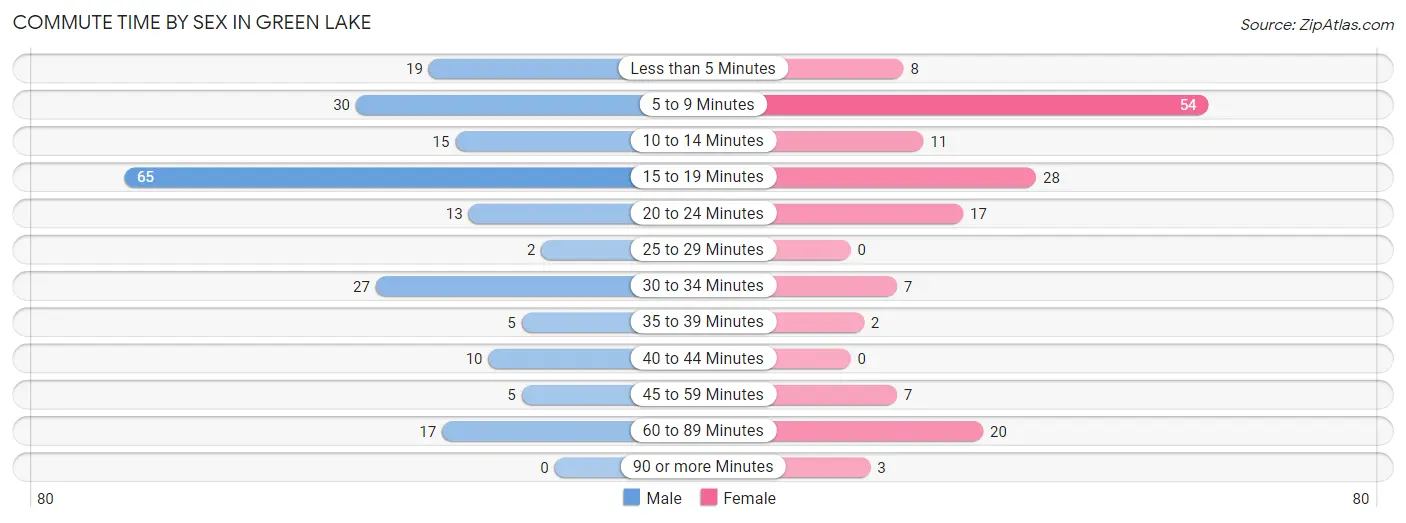
| Commute Time | Male | Female |
| Less than 5 Minutes | 19 (9.1%) | 8 (5.1%) |
| 5 to 9 Minutes | 30 (14.4%) | 54 (34.4%) |
| 10 to 14 Minutes | 15 (7.2%) | 11 (7.0%) |
| 15 to 19 Minutes | 65 (31.2%) | 28 (17.8%) |
| 20 to 24 Minutes | 13 (6.2%) | 17 (10.8%) |
| 25 to 29 Minutes | 2 (1.0%) | 0 (0.0%) |
| 30 to 34 Minutes | 27 (13.0%) | 7 (4.5%) |
| 35 to 39 Minutes | 5 (2.4%) | 2 (1.3%) |
| 40 to 44 Minutes | 10 (4.8%) | 0 (0.0%) |
| 45 to 59 Minutes | 5 (2.4%) | 7 (4.5%) |
| 60 to 89 Minutes | 17 (8.2%) | 20 (12.7%) |
| 90 or more Minutes | 0 (0.0%) | 3 (1.9%) |
Time of Departure to Work by Sex in Green Lake
The most frequent times of departure to work in Green Lake are 7:30 AM to 7:59 AM (38, 18.3%) for males and 8:00 AM to 8:29 AM (32, 20.4%) for females.
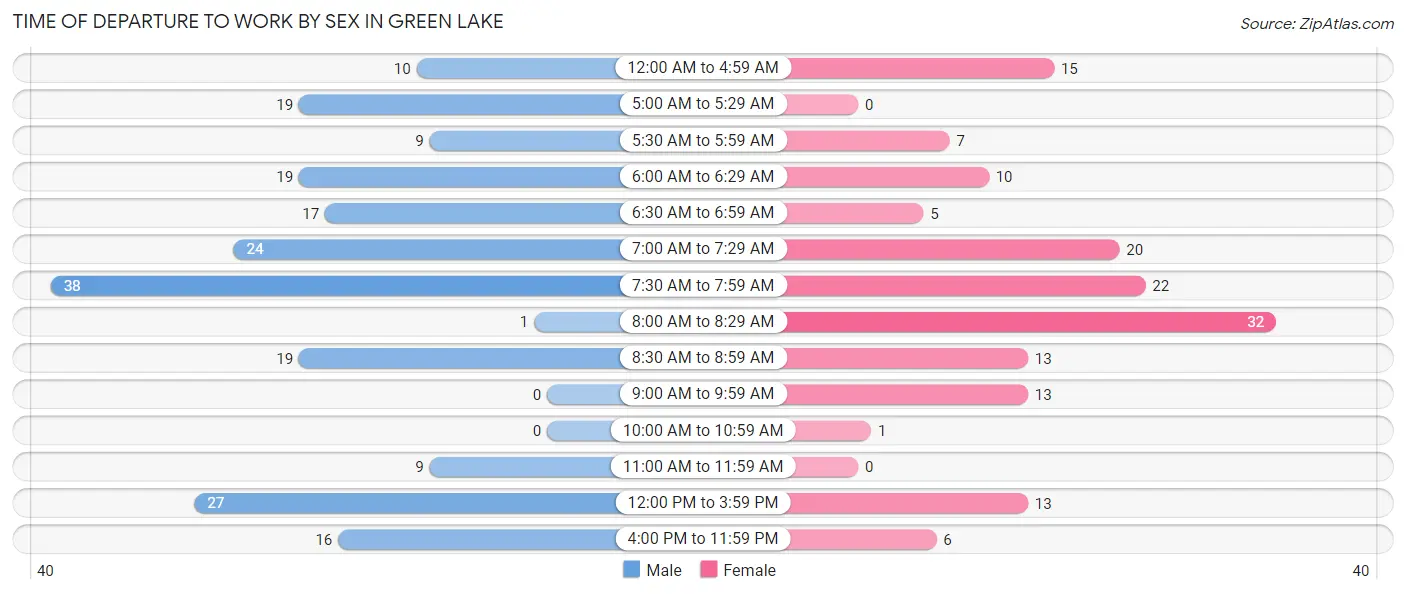
| Time of Departure | Male | Female |
| 12:00 AM to 4:59 AM | 10 (4.8%) | 15 (9.6%) |
| 5:00 AM to 5:29 AM | 19 (9.1%) | 0 (0.0%) |
| 5:30 AM to 5:59 AM | 9 (4.3%) | 7 (4.5%) |
| 6:00 AM to 6:29 AM | 19 (9.1%) | 10 (6.4%) |
| 6:30 AM to 6:59 AM | 17 (8.2%) | 5 (3.2%) |
| 7:00 AM to 7:29 AM | 24 (11.5%) | 20 (12.7%) |
| 7:30 AM to 7:59 AM | 38 (18.3%) | 22 (14.0%) |
| 8:00 AM to 8:29 AM | 1 (0.5%) | 32 (20.4%) |
| 8:30 AM to 8:59 AM | 19 (9.1%) | 13 (8.3%) |
| 9:00 AM to 9:59 AM | 0 (0.0%) | 13 (8.3%) |
| 10:00 AM to 10:59 AM | 0 (0.0%) | 1 (0.6%) |
| 11:00 AM to 11:59 AM | 9 (4.3%) | 0 (0.0%) |
| 12:00 PM to 3:59 PM | 27 (13.0%) | 13 (8.3%) |
| 4:00 PM to 11:59 PM | 16 (7.7%) | 6 (3.8%) |
| Total | 208 (100.0%) | 157 (100.0%) |
Housing Occupancy in Green Lake
Occupancy by Ownership in Green Lake
Of the total 510 dwellings in Green Lake, owner-occupied units account for 338 (66.3%), while renter-occupied units make up 172 (33.7%).
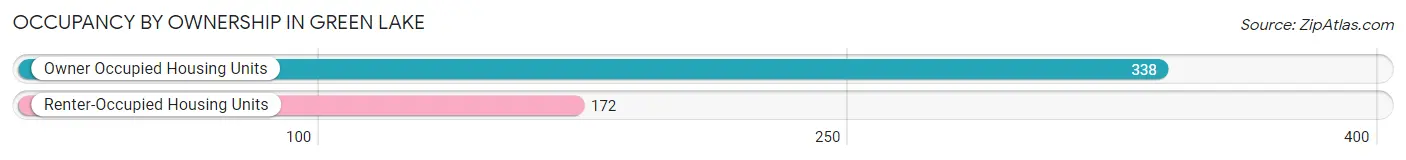
| Occupancy | # Housing Units | % Housing Units |
| Owner Occupied Housing Units | 338 | 66.3% |
| Renter-Occupied Housing Units | 172 | 33.7% |
| Total Occupied Housing Units | 510 | 100.0% |
Occupancy by Household Size in Green Lake
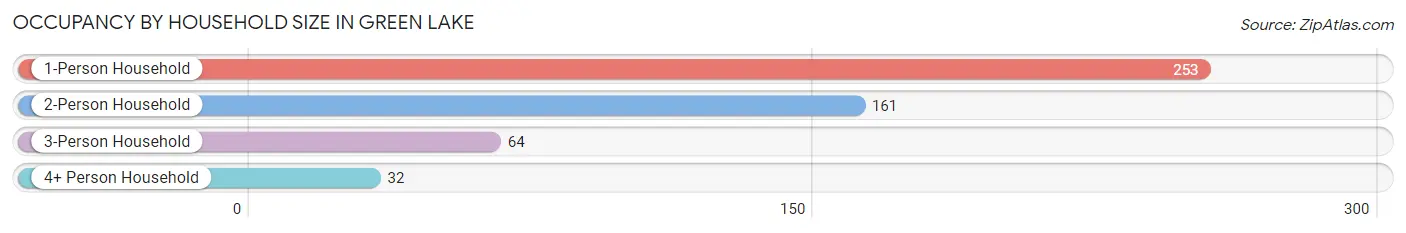
| Household Size | # Housing Units | % Housing Units |
| 1-Person Household | 253 | 49.6% |
| 2-Person Household | 161 | 31.6% |
| 3-Person Household | 64 | 12.6% |
| 4+ Person Household | 32 | 6.3% |
| Total Housing Units | 510 | 100.0% |
Occupancy by Ownership by Household Size in Green Lake
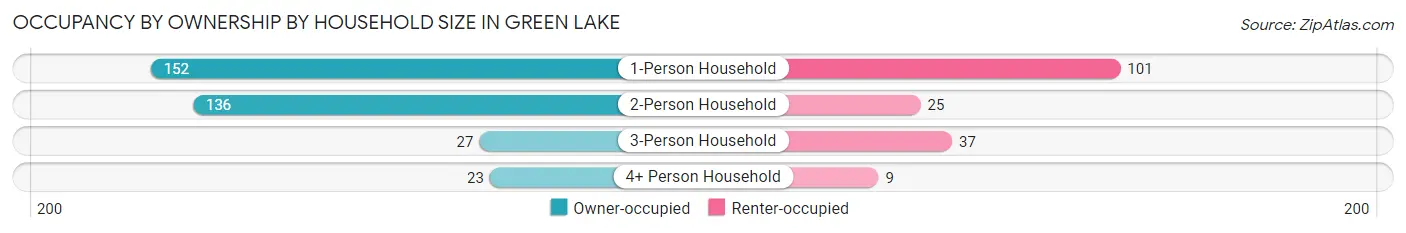
| Household Size | Owner-occupied | Renter-occupied |
| 1-Person Household | 152 (60.1%) | 101 (39.9%) |
| 2-Person Household | 136 (84.5%) | 25 (15.5%) |
| 3-Person Household | 27 (42.2%) | 37 (57.8%) |
| 4+ Person Household | 23 (71.9%) | 9 (28.1%) |
| Total Housing Units | 338 (66.3%) | 172 (33.7%) |
Occupancy by Educational Attainment in Green Lake
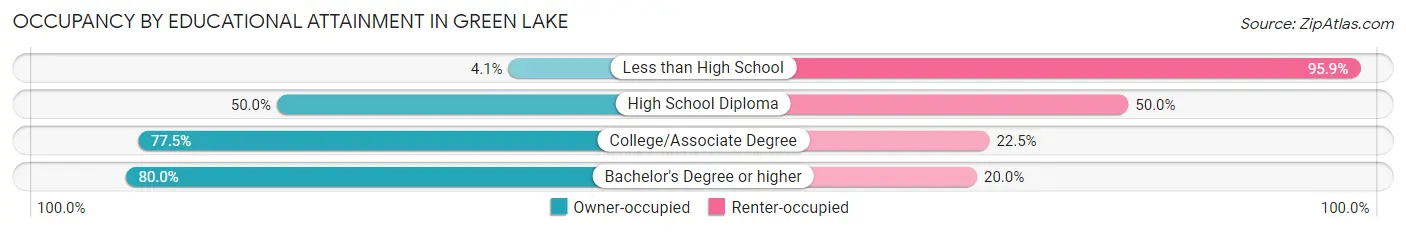
| Household Size | Owner-occupied | Renter-occupied |
| Less than High School | 2 (4.1%) | 47 (95.9%) |
| High School Diploma | 47 (50.0%) | 47 (50.0%) |
| College/Associate Degree | 145 (77.5%) | 42 (22.5%) |
| Bachelor's Degree or higher | 144 (80.0%) | 36 (20.0%) |
Occupancy by Age of Householder in Green Lake
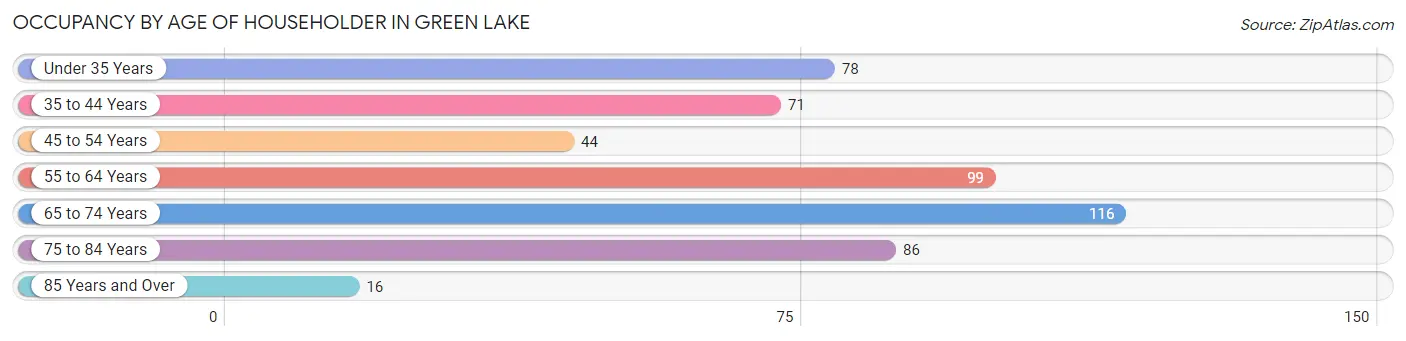
| Age Bracket | # Households | % Households |
| Under 35 Years | 78 | 15.3% |
| 35 to 44 Years | 71 | 13.9% |
| 45 to 54 Years | 44 | 8.6% |
| 55 to 64 Years | 99 | 19.4% |
| 65 to 74 Years | 116 | 22.8% |
| 75 to 84 Years | 86 | 16.9% |
| 85 Years and Over | 16 | 3.1% |
| Total | 510 | 100.0% |
Housing Finances in Green Lake
Median Income by Occupancy in Green Lake
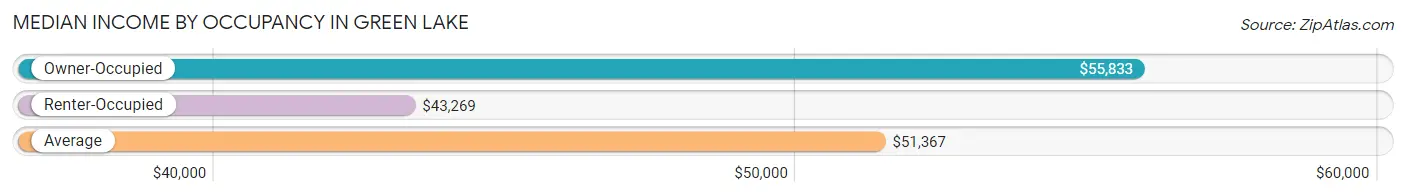
| Occupancy Type | # Households | Median Income |
| Owner-Occupied | 338 (66.3%) | $55,833 |
| Renter-Occupied | 172 (33.7%) | $43,269 |
| Average | 510 (100.0%) | $51,367 |
Occupancy by Householder Income Bracket in Green Lake
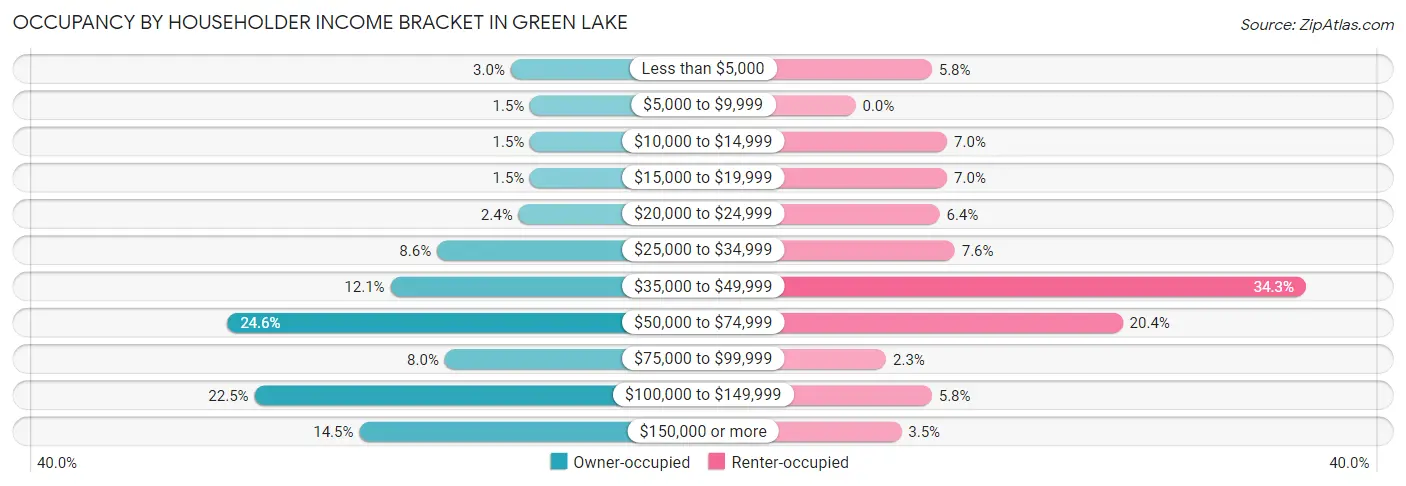
| Income Bracket | Owner-occupied | Renter-occupied |
| Less than $5,000 | 10 (3.0%) | 10 (5.8%) |
| $5,000 to $9,999 | 5 (1.5%) | 0 (0.0%) |
| $10,000 to $14,999 | 5 (1.5%) | 12 (7.0%) |
| $15,000 to $19,999 | 5 (1.5%) | 12 (7.0%) |
| $20,000 to $24,999 | 8 (2.4%) | 11 (6.4%) |
| $25,000 to $34,999 | 29 (8.6%) | 13 (7.6%) |
| $35,000 to $49,999 | 41 (12.1%) | 59 (34.3%) |
| $50,000 to $74,999 | 83 (24.6%) | 35 (20.3%) |
| $75,000 to $99,999 | 27 (8.0%) | 4 (2.3%) |
| $100,000 to $149,999 | 76 (22.5%) | 10 (5.8%) |
| $150,000 or more | 49 (14.5%) | 6 (3.5%) |
| Total | 338 (100.0%) | 172 (100.0%) |
Monthly Housing Cost Tiers in Green Lake
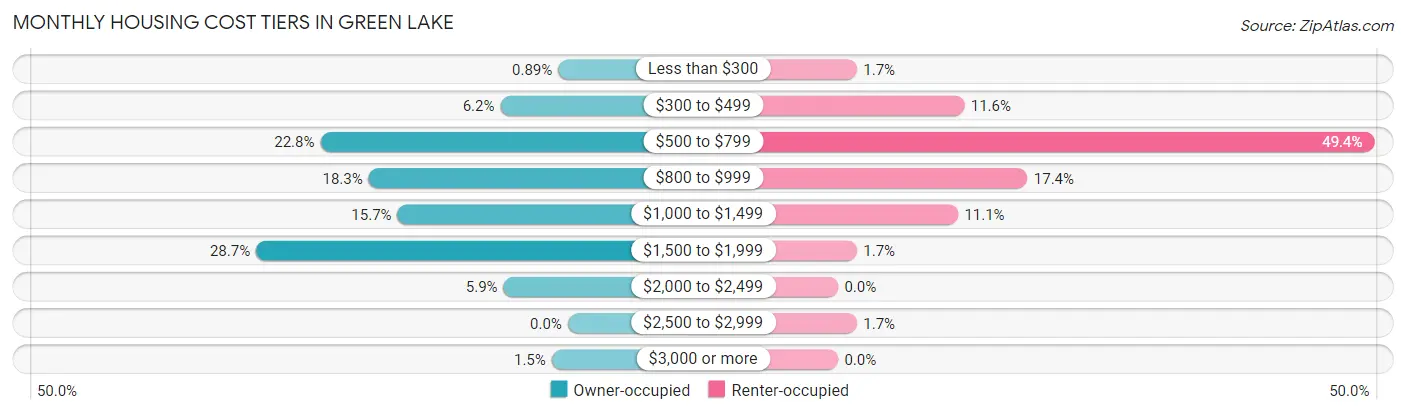
| Monthly Cost | Owner-occupied | Renter-occupied |
| Less than $300 | 3 (0.9%) | 3 (1.7%) |
| $300 to $499 | 21 (6.2%) | 20 (11.6%) |
| $500 to $799 | 77 (22.8%) | 85 (49.4%) |
| $800 to $999 | 62 (18.3%) | 30 (17.4%) |
| $1,000 to $1,499 | 53 (15.7%) | 19 (11.1%) |
| $1,500 to $1,999 | 97 (28.7%) | 3 (1.7%) |
| $2,000 to $2,499 | 20 (5.9%) | 0 (0.0%) |
| $2,500 to $2,999 | 0 (0.0%) | 3 (1.7%) |
| $3,000 or more | 5 (1.5%) | 0 (0.0%) |
| Total | 338 (100.0%) | 172 (100.0%) |
Physical Housing Characteristics in Green Lake
Housing Structures in Green Lake
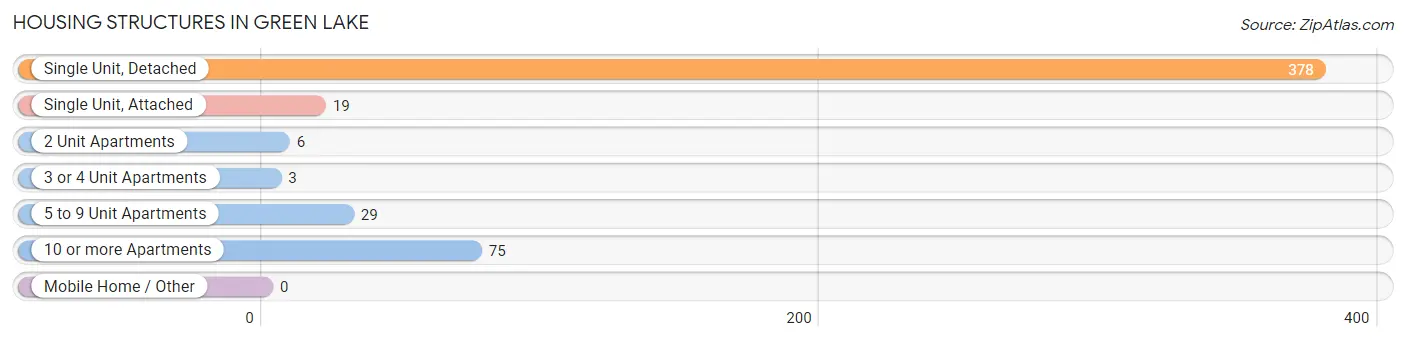
| Structure Type | # Housing Units | % Housing Units |
| Single Unit, Detached | 378 | 74.1% |
| Single Unit, Attached | 19 | 3.7% |
| 2 Unit Apartments | 6 | 1.2% |
| 3 or 4 Unit Apartments | 3 | 0.6% |
| 5 to 9 Unit Apartments | 29 | 5.7% |
| 10 or more Apartments | 75 | 14.7% |
| Mobile Home / Other | 0 | 0.0% |
| Total | 510 | 100.0% |
Housing Structures by Occupancy in Green Lake
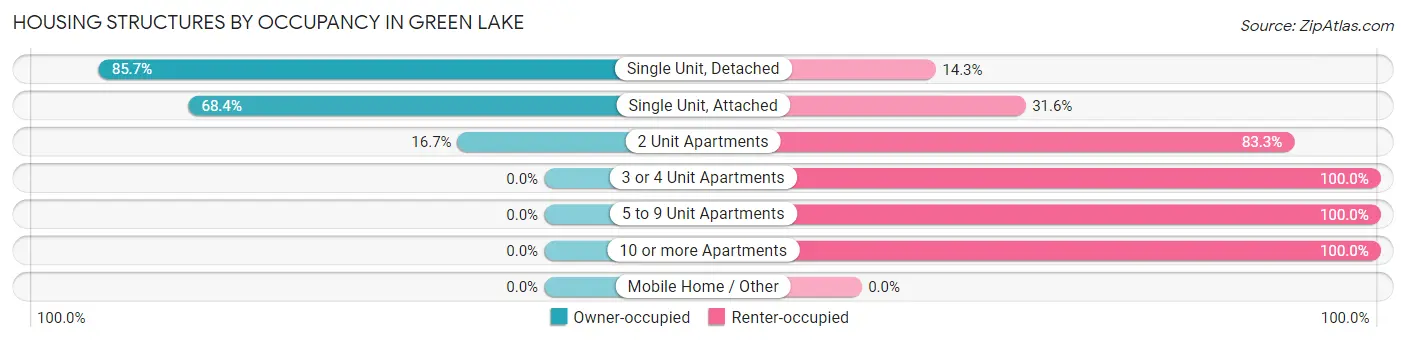
| Structure Type | Owner-occupied | Renter-occupied |
| Single Unit, Detached | 324 (85.7%) | 54 (14.3%) |
| Single Unit, Attached | 13 (68.4%) | 6 (31.6%) |
| 2 Unit Apartments | 1 (16.7%) | 5 (83.3%) |
| 3 or 4 Unit Apartments | 0 (0.0%) | 3 (100.0%) |
| 5 to 9 Unit Apartments | 0 (0.0%) | 29 (100.0%) |
| 10 or more Apartments | 0 (0.0%) | 75 (100.0%) |
| Mobile Home / Other | 0 (0.0%) | 0 (0.0%) |
| Total | 338 (66.3%) | 172 (33.7%) |
Housing Structures by Number of Rooms in Green Lake
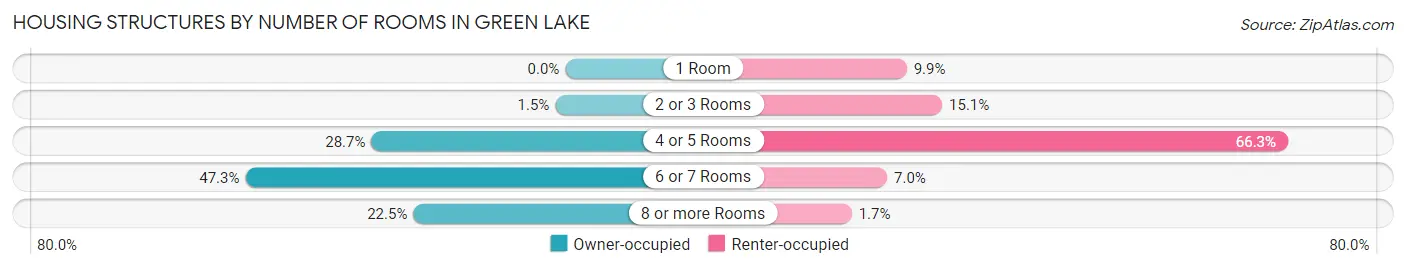
| Number of Rooms | Owner-occupied | Renter-occupied |
| 1 Room | 0 (0.0%) | 17 (9.9%) |
| 2 or 3 Rooms | 5 (1.5%) | 26 (15.1%) |
| 4 or 5 Rooms | 97 (28.7%) | 114 (66.3%) |
| 6 or 7 Rooms | 160 (47.3%) | 12 (7.0%) |
| 8 or more Rooms | 76 (22.5%) | 3 (1.7%) |
| Total | 338 (100.0%) | 172 (100.0%) |
Housing Structure by Heating Type in Green Lake
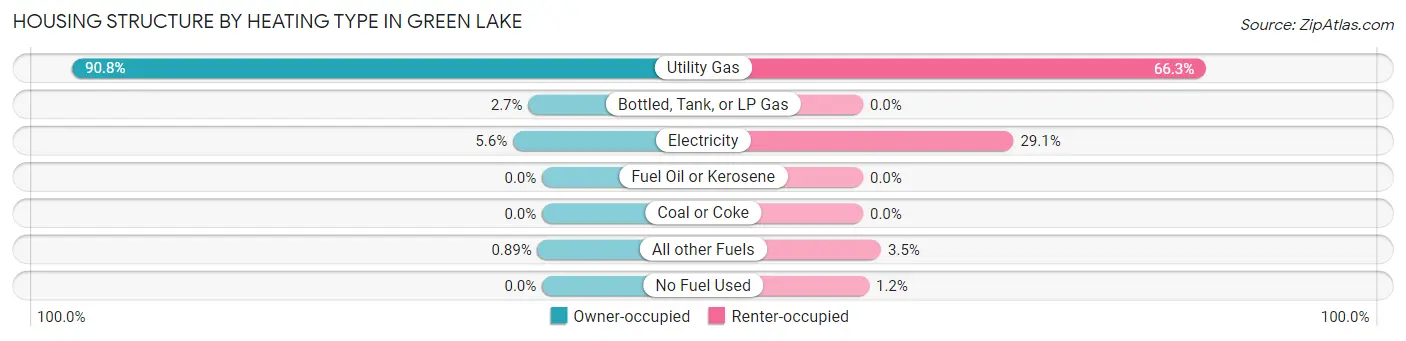
| Heating Type | Owner-occupied | Renter-occupied |
| Utility Gas | 307 (90.8%) | 114 (66.3%) |
| Bottled, Tank, or LP Gas | 9 (2.7%) | 0 (0.0%) |
| Electricity | 19 (5.6%) | 50 (29.1%) |
| Fuel Oil or Kerosene | 0 (0.0%) | 0 (0.0%) |
| Coal or Coke | 0 (0.0%) | 0 (0.0%) |
| All other Fuels | 3 (0.9%) | 6 (3.5%) |
| No Fuel Used | 0 (0.0%) | 2 (1.2%) |
| Total | 338 (100.0%) | 172 (100.0%) |
Household Vehicle Usage in Green Lake
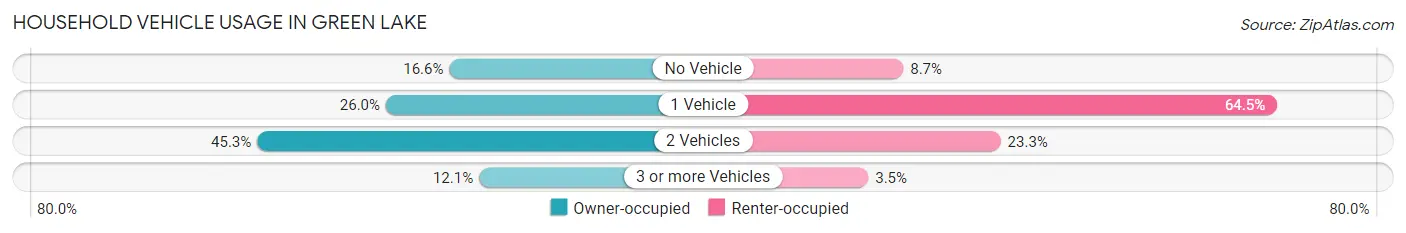
| Vehicles per Household | Owner-occupied | Renter-occupied |
| No Vehicle | 56 (16.6%) | 15 (8.7%) |
| 1 Vehicle | 88 (26.0%) | 111 (64.5%) |
| 2 Vehicles | 153 (45.3%) | 40 (23.3%) |
| 3 or more Vehicles | 41 (12.1%) | 6 (3.5%) |
| Total | 338 (100.0%) | 172 (100.0%) |
Real Estate & Mortgages in Green Lake
Real Estate and Mortgage Overview in Green Lake
| Characteristic | Without Mortgage | With Mortgage |
| Housing Units | 110 | 228 |
| Median Property Value | $226,300 | $163,900 |
| Median Household Income | $61,875 | $32 |
| Monthly Housing Costs | $642 | $5 |
| Real Estate Taxes | $2,782 | $0 |
Property Value by Mortgage Status in Green Lake
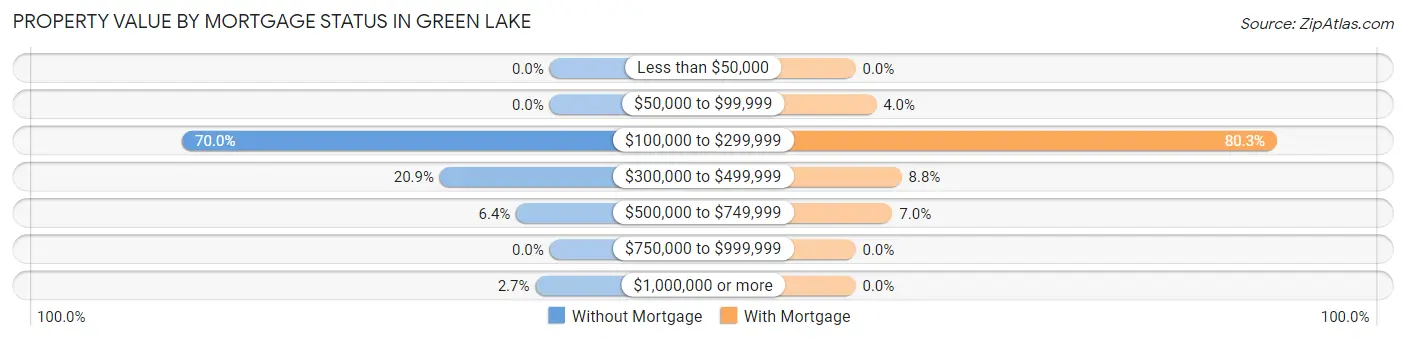
| Property Value | Without Mortgage | With Mortgage |
| Less than $50,000 | 0 (0.0%) | 0 (0.0%) |
| $50,000 to $99,999 | 0 (0.0%) | 9 (4.0%) |
| $100,000 to $299,999 | 77 (70.0%) | 183 (80.3%) |
| $300,000 to $499,999 | 23 (20.9%) | 20 (8.8%) |
| $500,000 to $749,999 | 7 (6.4%) | 16 (7.0%) |
| $750,000 to $999,999 | 0 (0.0%) | 0 (0.0%) |
| $1,000,000 or more | 3 (2.7%) | 0 (0.0%) |
| Total | 110 (100.0%) | 228 (100.0%) |
Household Income by Mortgage Status in Green Lake
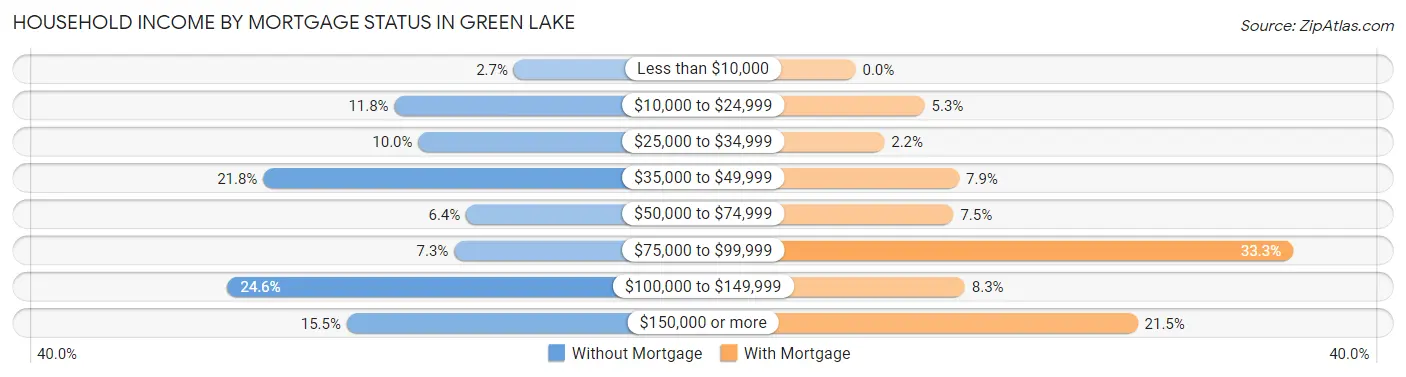
| Household Income | Without Mortgage | With Mortgage |
| Less than $10,000 | 3 (2.7%) | 0 (0.0%) |
| $10,000 to $24,999 | 13 (11.8%) | 12 (5.3%) |
| $25,000 to $34,999 | 11 (10.0%) | 5 (2.2%) |
| $35,000 to $49,999 | 24 (21.8%) | 18 (7.9%) |
| $50,000 to $74,999 | 7 (6.4%) | 17 (7.5%) |
| $75,000 to $99,999 | 8 (7.3%) | 76 (33.3%) |
| $100,000 to $149,999 | 27 (24.5%) | 19 (8.3%) |
| $150,000 or more | 17 (15.4%) | 49 (21.5%) |
| Total | 110 (100.0%) | 228 (100.0%) |
Property Value to Household Income Ratio in Green Lake
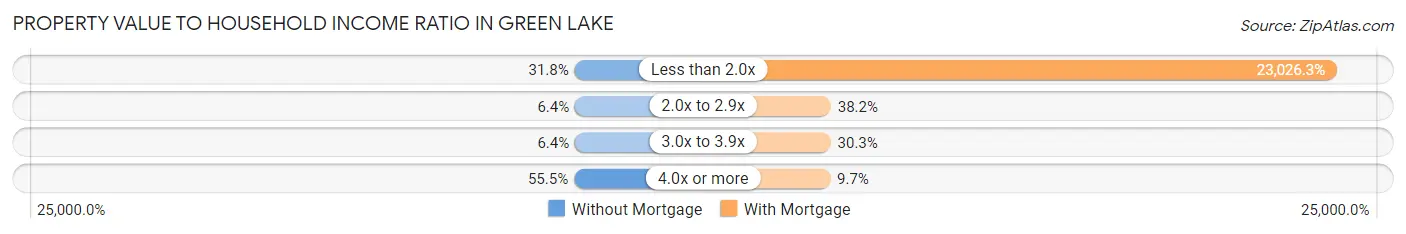
| Value-to-Income Ratio | Without Mortgage | With Mortgage |
| Less than 2.0x | 35 (31.8%) | 52,500 (23,026.3%) |
| 2.0x to 2.9x | 7 (6.4%) | 87 (38.2%) |
| 3.0x to 3.9x | 7 (6.4%) | 69 (30.3%) |
| 4.0x or more | 61 (55.4%) | 22 (9.7%) |
| Total | 110 (100.0%) | 228 (100.0%) |
Real Estate Taxes by Mortgage Status in Green Lake
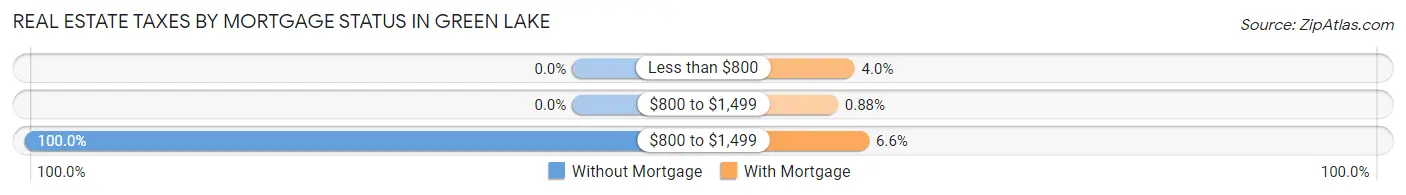
| Property Taxes | Without Mortgage | With Mortgage |
| Less than $800 | 0 (0.0%) | 9 (4.0%) |
| $800 to $1,499 | 0 (0.0%) | 2 (0.9%) |
| $800 to $1,499 | 110 (100.0%) | 15 (6.6%) |
| Total | 110 (100.0%) | 228 (100.0%) |
Health & Disability in Green Lake
Health Insurance Coverage by Age in Green Lake
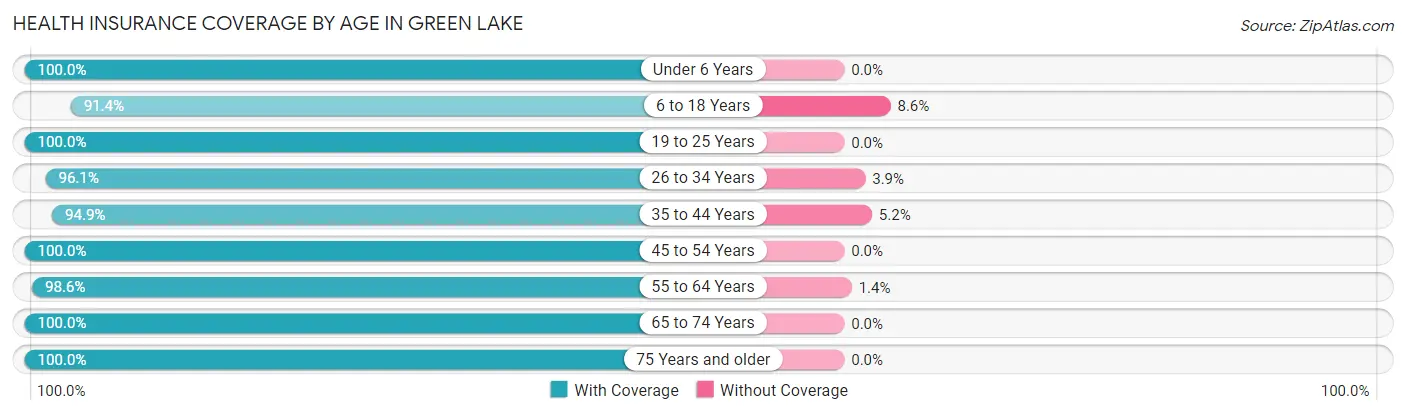
| Age Bracket | With Coverage | Without Coverage |
| Under 6 Years | 44 (100.0%) | 0 (0.0%) |
| 6 to 18 Years | 106 (91.4%) | 10 (8.6%) |
| 19 to 25 Years | 52 (100.0%) | 0 (0.0%) |
| 26 to 34 Years | 123 (96.1%) | 5 (3.9%) |
| 35 to 44 Years | 92 (94.9%) | 5 (5.1%) |
| 45 to 54 Years | 80 (100.0%) | 0 (0.0%) |
| 55 to 64 Years | 142 (98.6%) | 2 (1.4%) |
| 65 to 74 Years | 139 (100.0%) | 0 (0.0%) |
| 75 Years and older | 135 (100.0%) | 0 (0.0%) |
| Total | 913 (97.7%) | 22 (2.4%) |
Health Insurance Coverage by Citizenship Status in Green Lake
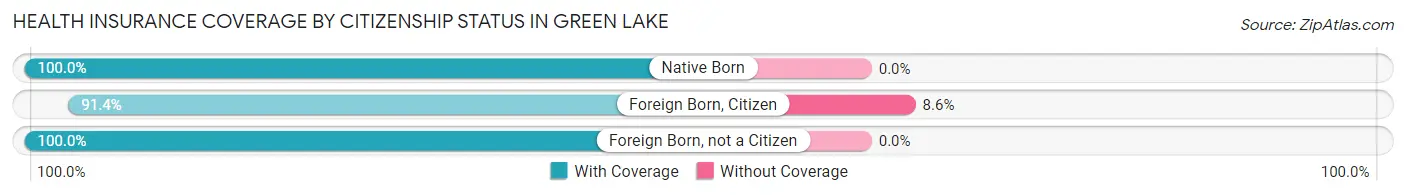
| Citizenship Status | With Coverage | Without Coverage |
| Native Born | 44 (100.0%) | 0 (0.0%) |
| Foreign Born, Citizen | 106 (91.4%) | 10 (8.6%) |
| Foreign Born, not a Citizen | 52 (100.0%) | 0 (0.0%) |
Health Insurance Coverage by Household Income in Green Lake
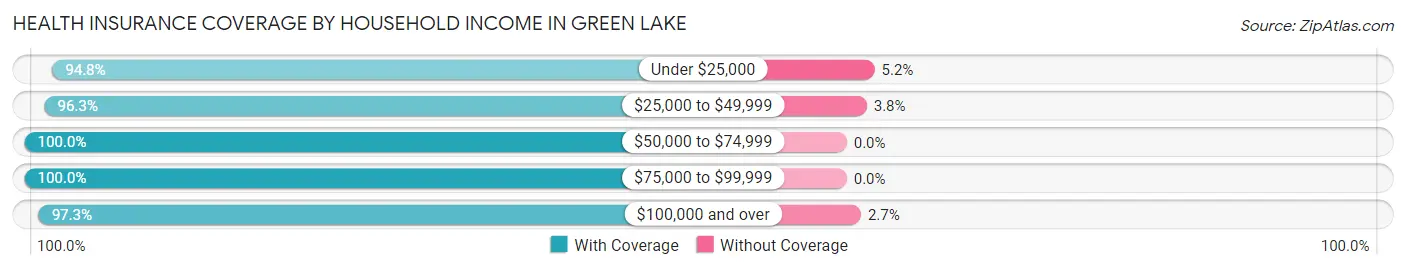
| Household Income | With Coverage | Without Coverage |
| Under $25,000 | 91 (94.8%) | 5 (5.2%) |
| $25,000 to $49,999 | 231 (96.3%) | 9 (3.7%) |
| $50,000 to $74,999 | 163 (100.0%) | 0 (0.0%) |
| $75,000 to $99,999 | 87 (100.0%) | 0 (0.0%) |
| $100,000 and over | 293 (97.3%) | 8 (2.7%) |
Public vs Private Health Insurance Coverage by Age in Green Lake
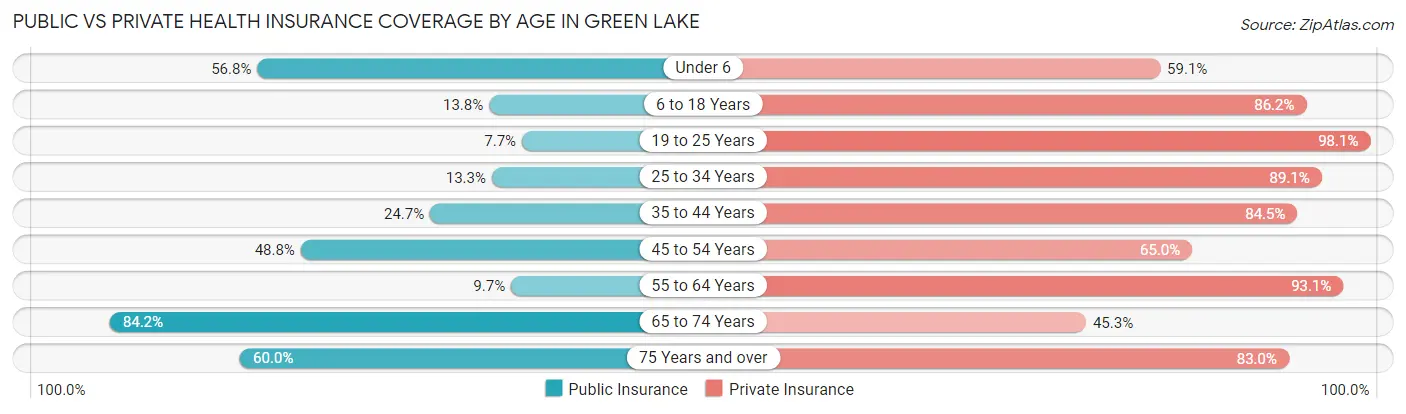
| Age Bracket | Public Insurance | Private Insurance |
| Under 6 | 25 (56.8%) | 26 (59.1%) |
| 6 to 18 Years | 16 (13.8%) | 100 (86.2%) |
| 19 to 25 Years | 4 (7.7%) | 51 (98.1%) |
| 25 to 34 Years | 17 (13.3%) | 114 (89.1%) |
| 35 to 44 Years | 24 (24.7%) | 82 (84.5%) |
| 45 to 54 Years | 39 (48.7%) | 52 (65.0%) |
| 55 to 64 Years | 14 (9.7%) | 134 (93.1%) |
| 65 to 74 Years | 117 (84.2%) | 63 (45.3%) |
| 75 Years and over | 81 (60.0%) | 112 (83.0%) |
| Total | 337 (36.0%) | 734 (78.5%) |
Disability Status by Sex by Age in Green Lake
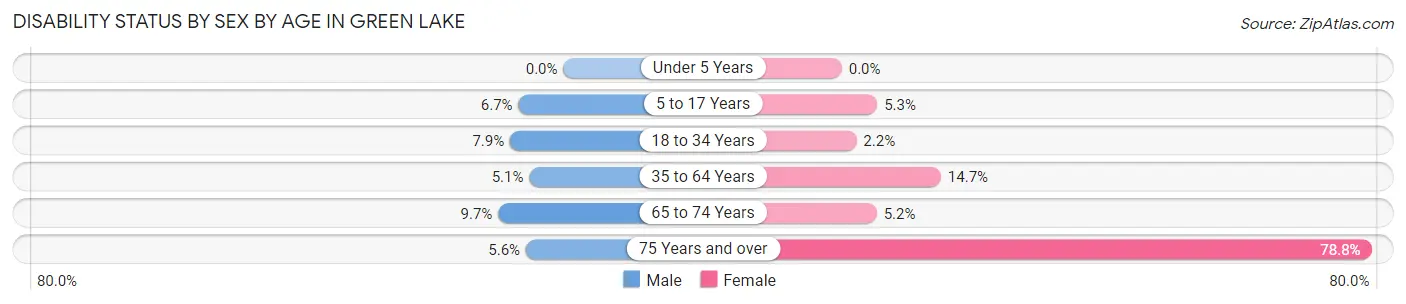
| Age Bracket | Male | Female |
| Under 5 Years | 0 (0.0%) | 0 (0.0%) |
| 5 to 17 Years | 4 (6.7%) | 3 (5.3%) |
| 18 to 34 Years | 8 (7.9%) | 2 (2.2%) |
| 35 to 64 Years | 8 (5.1%) | 24 (14.7%) |
| 65 to 74 Years | 6 (9.7%) | 4 (5.2%) |
| 75 Years and over | 2 (5.6%) | 78 (78.8%) |
Disability Class by Sex by Age in Green Lake
Disability Class: Hearing Difficulty
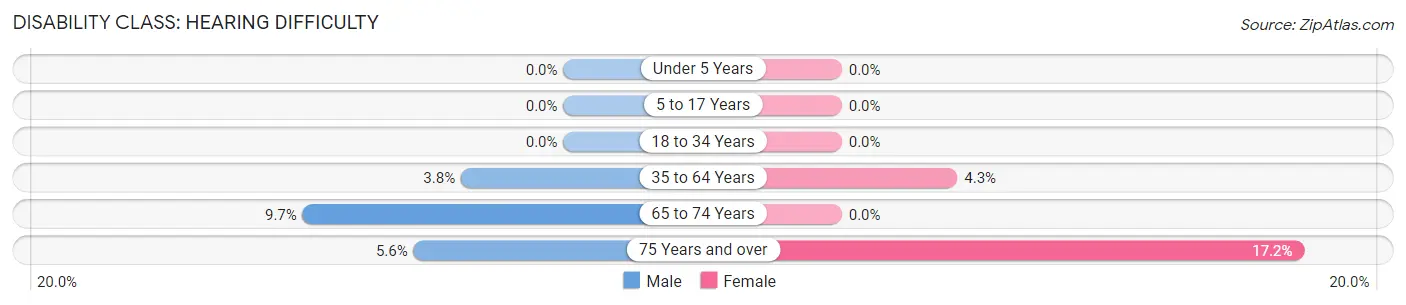
| Age Bracket | Male | Female |
| Under 5 Years | 0 (0.0%) | 0 (0.0%) |
| 5 to 17 Years | 0 (0.0%) | 0 (0.0%) |
| 18 to 34 Years | 0 (0.0%) | 0 (0.0%) |
| 35 to 64 Years | 6 (3.8%) | 7 (4.3%) |
| 65 to 74 Years | 6 (9.7%) | 0 (0.0%) |
| 75 Years and over | 2 (5.6%) | 17 (17.2%) |
Disability Class: Vision Difficulty
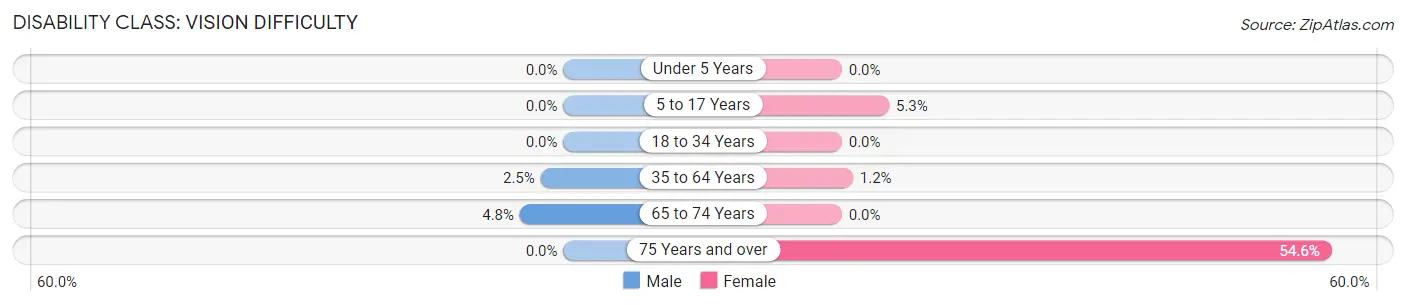
| Age Bracket | Male | Female |
| Under 5 Years | 0 (0.0%) | 0 (0.0%) |
| 5 to 17 Years | 0 (0.0%) | 3 (5.3%) |
| 18 to 34 Years | 0 (0.0%) | 0 (0.0%) |
| 35 to 64 Years | 4 (2.5%) | 2 (1.2%) |
| 65 to 74 Years | 3 (4.8%) | 0 (0.0%) |
| 75 Years and over | 0 (0.0%) | 54 (54.5%) |
Disability Class: Cognitive Difficulty
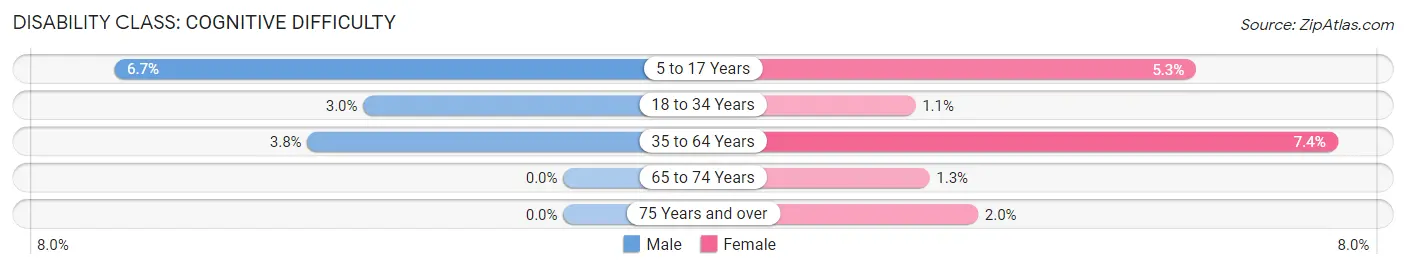
| Age Bracket | Male | Female |
| 5 to 17 Years | 4 (6.7%) | 3 (5.3%) |
| 18 to 34 Years | 3 (3.0%) | 1 (1.1%) |
| 35 to 64 Years | 6 (3.8%) | 12 (7.4%) |
| 65 to 74 Years | 0 (0.0%) | 1 (1.3%) |
| 75 Years and over | 0 (0.0%) | 2 (2.0%) |
Disability Class: Ambulatory Difficulty
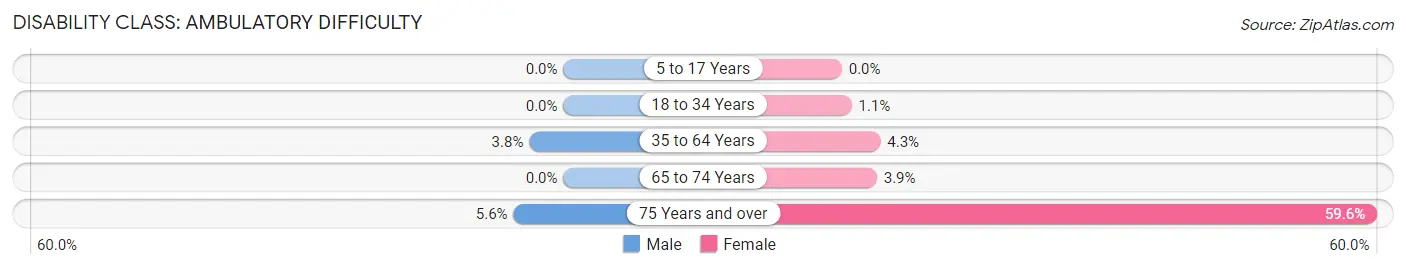
| Age Bracket | Male | Female |
| 5 to 17 Years | 0 (0.0%) | 0 (0.0%) |
| 18 to 34 Years | 0 (0.0%) | 1 (1.1%) |
| 35 to 64 Years | 6 (3.8%) | 7 (4.3%) |
| 65 to 74 Years | 0 (0.0%) | 3 (3.9%) |
| 75 Years and over | 2 (5.6%) | 59 (59.6%) |
Disability Class: Self-Care Difficulty
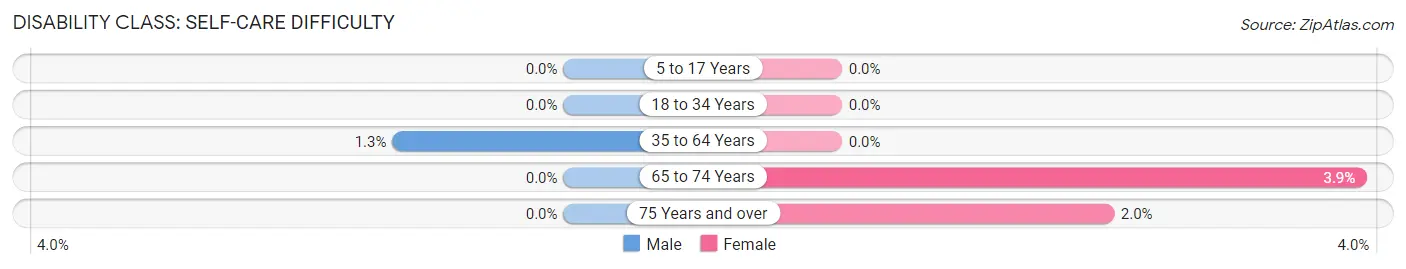
| Age Bracket | Male | Female |
| 5 to 17 Years | 0 (0.0%) | 0 (0.0%) |
| 18 to 34 Years | 0 (0.0%) | 0 (0.0%) |
| 35 to 64 Years | 2 (1.3%) | 0 (0.0%) |
| 65 to 74 Years | 0 (0.0%) | 3 (3.9%) |
| 75 Years and over | 0 (0.0%) | 2 (2.0%) |
Technology Access in Green Lake
Computing Device Access in Green Lake
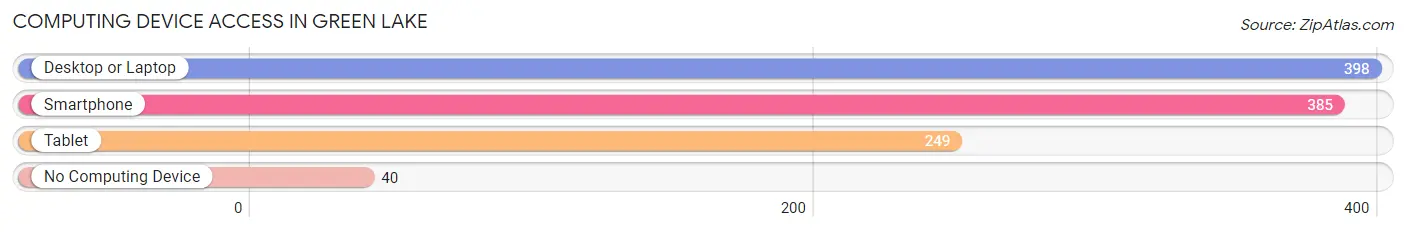
| Device Type | # Households | % Households |
| Desktop or Laptop | 398 | 78.0% |
| Smartphone | 385 | 75.5% |
| Tablet | 249 | 48.8% |
| No Computing Device | 40 | 7.8% |
| Total | 510 | 100.0% |
Internet Access in Green Lake
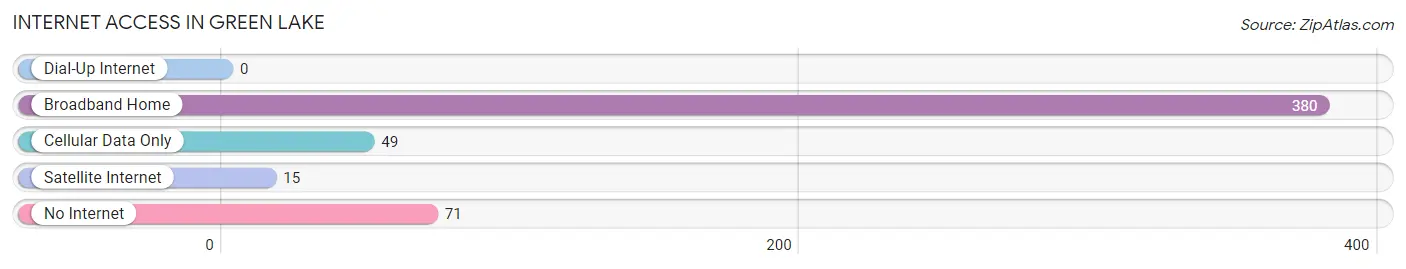
| Internet Type | # Households | % Households |
| Dial-Up Internet | 0 | 0.0% |
| Broadband Home | 380 | 74.5% |
| Cellular Data Only | 49 | 9.6% |
| Satellite Internet | 15 | 2.9% |
| No Internet | 71 | 13.9% |
| Total | 510 | 100.0% |
Green Lake Summary
Green Lake, Wisconsin is a small town located in Green Lake County, Wisconsin. It is situated on the south shore of Green Lake, the deepest natural inland lake in the state. The town has a population of 1,039 people, according to the 2010 census.
History
Green Lake was first settled in 1837 by a group of settlers from New York. The town was originally called “Little Green Lake” and was later changed to “Green Lake” in 1845. The town was officially incorporated in 1848.
The town was originally a farming community, but in the late 19th century, it became a popular tourist destination. The first hotel was built in 1872 and the first golf course was built in 1891. The town also became a popular destination for fishing and boating.
In the early 20th century, the town began to develop into a resort community. The first resort, the Green Lake Hotel, was built in 1906. The hotel was a popular destination for wealthy families from Chicago and Milwaukee.
In the 1950s, the town began to develop into a retirement community. The population of the town has remained relatively stable since then.
Geography
Green Lake is located in the south-central part of Wisconsin, about 50 miles northwest of Milwaukee. The town is situated on the south shore of Green Lake, the deepest natural inland lake in the state. The lake is approximately 6,000 acres in size and has a maximum depth of 237 feet.
The town is surrounded by rolling hills and is located in the Central Plain region of Wisconsin. The climate is humid continental, with cold winters and warm summers.
Economy
Green Lake’s economy is largely based on tourism and retirement. The town is a popular destination for fishing, boating, golfing, and other outdoor activities. The town also has several resorts and hotels that cater to tourists and retirees.
The town also has several small businesses, including restaurants, retail stores, and service businesses. The town is also home to several manufacturing companies, including a paper mill and a furniture factory.
Demographics
According to the 2010 census, the population of Green Lake was 1,039 people. The population is predominantly white (97.2%), with small percentages of African American (0.7%), Asian (0.3%), and Hispanic (0.8%) residents.
The median household income in Green Lake is $45,938, and the median age is 44. The town has a higher-than-average percentage of people over the age of 65 (25.3%).
Conclusion
Green Lake, Wisconsin is a small town located on the south shore of Green Lake, the deepest natural inland lake in the state. The town has a population of 1,039 people, according to the 2010 census. The town’s economy is largely based on tourism and retirement, and the town is a popular destination for fishing, boating, golfing, and other outdoor activities. The population is predominantly white, with small percentages of African American, Asian, and Hispanic residents.
Common Questions
What is Per Capita Income in Green Lake?
Per Capita income in Green Lake is $42,086.
What is the Median Family Income in Green Lake?
Median Family Income in Green Lake is $92,917.
What is the Median Household income in Green Lake?
Median Household Income in Green Lake is $51,367.
What is Income or Wage Gap in Green Lake?
Income or Wage Gap in Green Lake is 34.3%.
Women in Green Lake earn 65.7 cents for every dollar earned by a man.
What is Family Income Deficit in Green Lake?
Family Income Deficit in Green Lake is $11,142.
Families that are below poverty line in Green Lake earn $11,142 less on average than the poverty threshold level.
What is Inequality or Gini Index in Green Lake?
Inequality or Gini Index in Green Lake is 0.46.
What is the Total Population of Green Lake?
Total Population of Green Lake is 1,000.
What is the Total Male Population of Green Lake?
Total Male Population of Green Lake is 488.
What is the Total Female Population of Green Lake?
Total Female Population of Green Lake is 512.
What is the Ratio of Males per 100 Females in Green Lake?
There are 95.31 Males per 100 Females in Green Lake.
What is the Ratio of Females per 100 Males in Green Lake?
There are 104.92 Females per 100 Males in Green Lake.
What is the Median Population Age in Green Lake?
Median Population Age in Green Lake is 46.9 Years.
What is the Average Family Size in Green Lake
Average Family Size in Green Lake is 2.4 People.
What is the Average Household Size in Green Lake
Average Household Size in Green Lake is 1.7 People.
How Large is the Labor Force in Green Lake?
There are 477 People in the Labor Forcein in Green Lake.
What is the Percentage of People in the Labor Force in Green Lake?
55.5% of People are in the Labor Force in Green Lake.
What is the Unemployment Rate in Green Lake?
Unemployment Rate in Green Lake is 4.0%.