Grand View, WI Map & Demographics
Grand View Map
Grand View Overview
$26,925
PER CAPITA INCOME
$57,361
AVG FAMILY INCOME
$55,556
AVG HOUSEHOLD INCOME
12.1%
WAGE / INCOME GAP [ % ]
87.9¢/ $1
WAGE / INCOME GAP [ $ ]
0.41
INEQUALITY / GINI INDEX
102
TOTAL POPULATION
44
MALE POPULATION
58
FEMALE POPULATION
75.86
MALES / 100 FEMALES
131.82
FEMALES / 100 MALES
63.6
MEDIAN AGE
2.5
AVG FAMILY SIZE
1.9
AVG HOUSEHOLD SIZE
32
LABOR FORCE [ PEOPLE ]
36.0%
PERCENT IN LABOR FORCE
Grand View Zip Codes
Grand View Area Codes
Income in Grand View
Income Overview in Grand View
Per Capita Income in Grand View is $26,925, while median incomes of families and households are $57,361 and $55,556 respectively.
| Characteristic | Number | Measure |
| Per Capita Income | 102 | $26,925 |
| Median Family Income | 33 | $57,361 |
| Mean Family Income | 33 | $72,824 |
| Median Household Income | 54 | $55,556 |
| Mean Household Income | 54 | $54,667 |
| Income Deficit | 33 | $0 |
| Wage / Income Gap (%) | 102 | 12.12% |
| Wage / Income Gap ($) | 102 | 87.88¢ per $1 |
| Gini / Inequality Index | 102 | 0.41 |
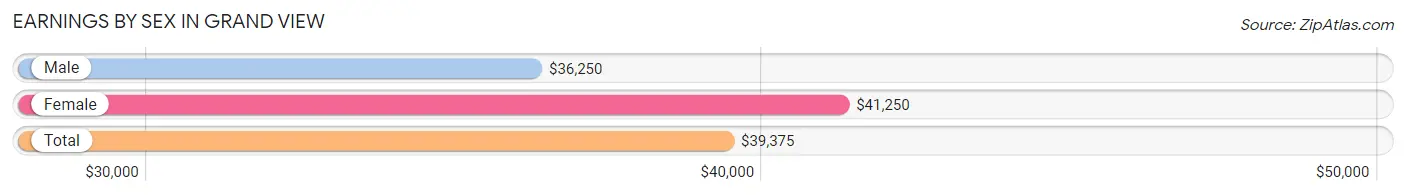
Earnings by Sex in Grand View
Average Earnings in Grand View are $39,375, $36,250 for men and $41,250 for women, a difference of 12.1%.
| Sex | Number | Average Earnings |
| Male | 14 (42.4%) | $36,250 |
| Female | 19 (57.6%) | $41,250 |
| Total | 33 (100.0%) | $39,375 |
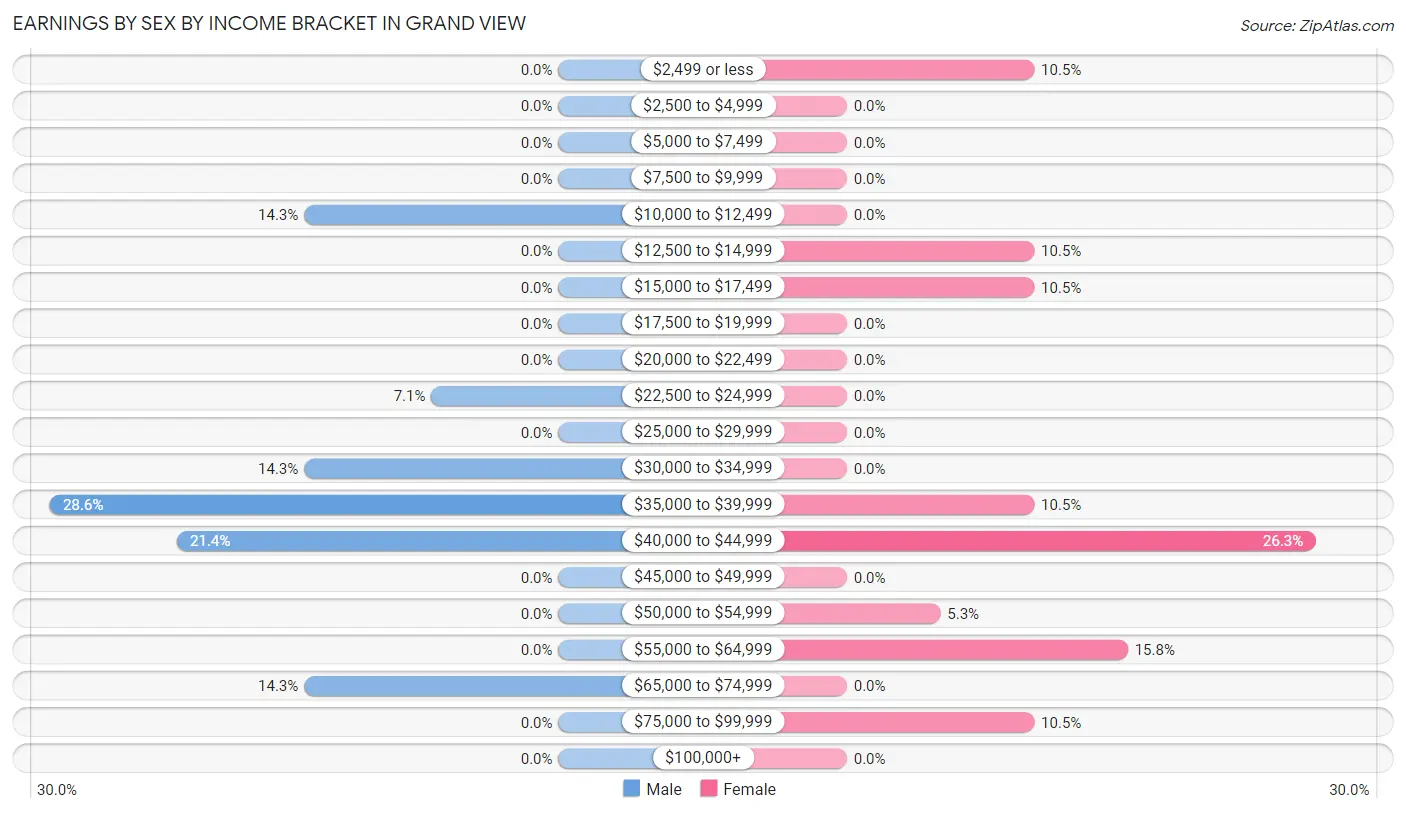
Earnings by Sex by Income Bracket in Grand View
The most common earnings brackets in Grand View are $35,000 to $39,999 for men (4 | 28.6%) and $40,000 to $44,999 for women (5 | 26.3%).
| Income | Male | Female |
| $2,499 or less | 0 (0.0%) | 2 (10.5%) |
| $2,500 to $4,999 | 0 (0.0%) | 0 (0.0%) |
| $5,000 to $7,499 | 0 (0.0%) | 0 (0.0%) |
| $7,500 to $9,999 | 0 (0.0%) | 0 (0.0%) |
| $10,000 to $12,499 | 2 (14.3%) | 0 (0.0%) |
| $12,500 to $14,999 | 0 (0.0%) | 2 (10.5%) |
| $15,000 to $17,499 | 0 (0.0%) | 2 (10.5%) |
| $17,500 to $19,999 | 0 (0.0%) | 0 (0.0%) |
| $20,000 to $22,499 | 0 (0.0%) | 0 (0.0%) |
| $22,500 to $24,999 | 1 (7.1%) | 0 (0.0%) |
| $25,000 to $29,999 | 0 (0.0%) | 0 (0.0%) |
| $30,000 to $34,999 | 2 (14.3%) | 0 (0.0%) |
| $35,000 to $39,999 | 4 (28.6%) | 2 (10.5%) |
| $40,000 to $44,999 | 3 (21.4%) | 5 (26.3%) |
| $45,000 to $49,999 | 0 (0.0%) | 0 (0.0%) |
| $50,000 to $54,999 | 0 (0.0%) | 1 (5.3%) |
| $55,000 to $64,999 | 0 (0.0%) | 3 (15.8%) |
| $65,000 to $74,999 | 2 (14.3%) | 0 (0.0%) |
| $75,000 to $99,999 | 0 (0.0%) | 2 (10.5%) |
| $100,000+ | 0 (0.0%) | 0 (0.0%) |
| Total | 14 (100.0%) | 19 (100.0%) |
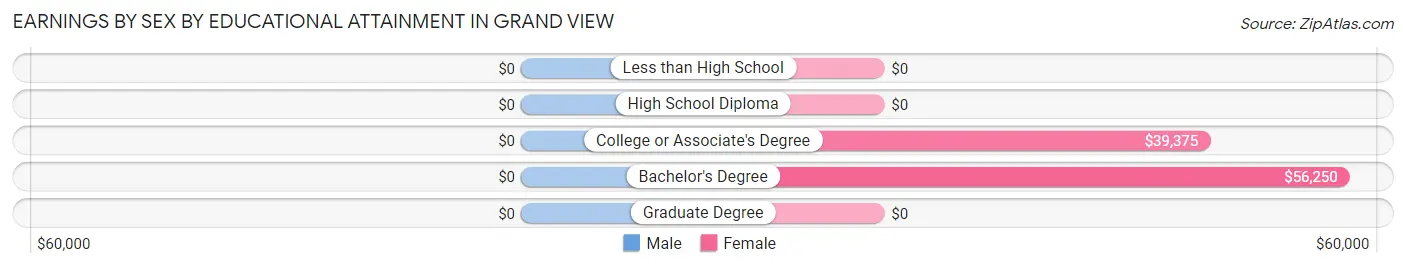
Earnings by Sex by Educational Attainment in Grand View
| Educational Attainment | Male Income | Female Income |
| Less than High School | - | - |
| High School Diploma | - | - |
| College or Associate's Degree | - | - |
| Bachelor's Degree | - | - |
| Graduate Degree | - | - |
| Total | $36,250 | $42,083 |
Family Income in Grand View
Family Income Brackets in Grand View
According to the Grand View family income data, there are 11 families falling into the $50,000 to $74,999 income range, which is the most common income bracket and makes up 33.3% of all families.
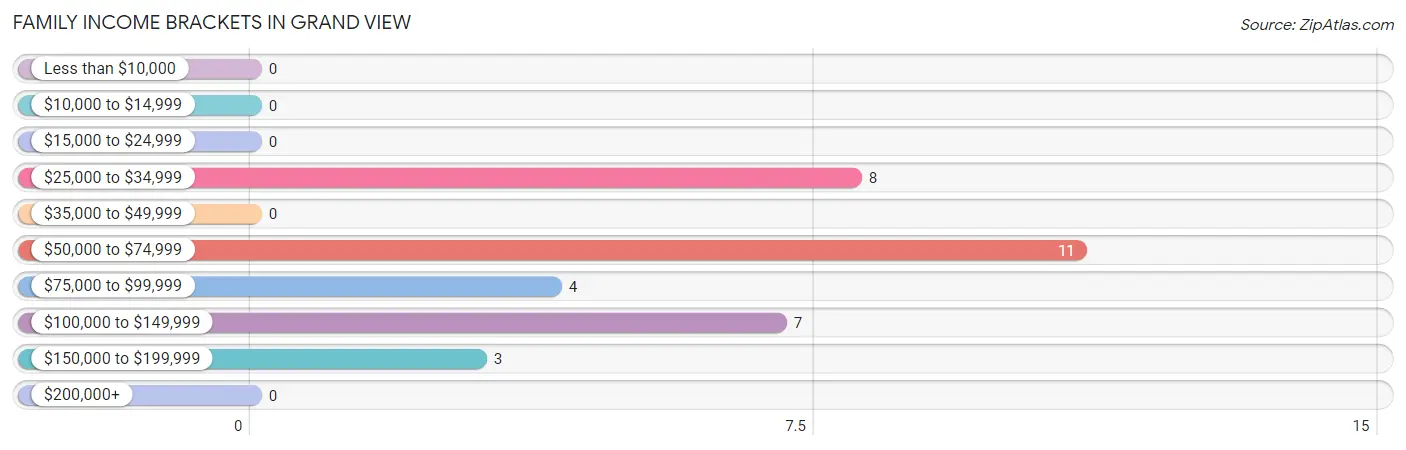
| Income Bracket | # Families | % Families |
| Less than $10,000 | 0 | 0.0% |
| $10,000 to $14,999 | 0 | 0.0% |
| $15,000 to $24,999 | 0 | 0.0% |
| $25,000 to $34,999 | 8 | 24.2% |
| $35,000 to $49,999 | 0 | 0.0% |
| $50,000 to $74,999 | 11 | 33.3% |
| $75,000 to $99,999 | 4 | 12.1% |
| $100,000 to $149,999 | 7 | 21.2% |
| $150,000 to $199,999 | 3 | 9.1% |
| $200,000+ | 0 | 0.0% |
Family Income by Famaliy Size in Grand View
4-person families (7 | 21.2%) account for the highest median family income in Grand View with $76,875 per family, while 4-person families (7 | 21.2%) have the highest median income of $19,219 per family member.
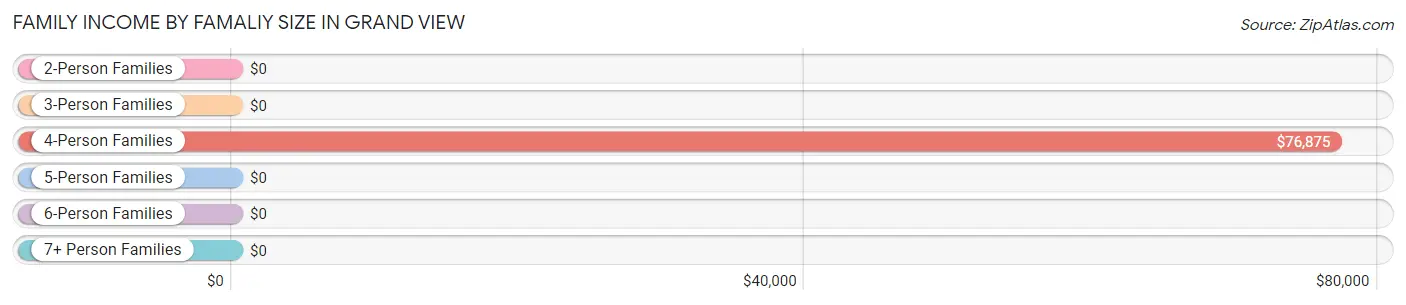
| Income Bracket | # Families | Median Income |
| 2-Person Families | 19 (57.6%) | $0 |
| 3-Person Families | 7 (21.2%) | $0 |
| 4-Person Families | 7 (21.2%) | $76,875 |
| 5-Person Families | 0 (0.0%) | $0 |
| 6-Person Families | 0 (0.0%) | $0 |
| 7+ Person Families | 0 (0.0%) | $0 |
| Total | 33 (100.0%) | $57,361 |
Family Income by Number of Earners in Grand View
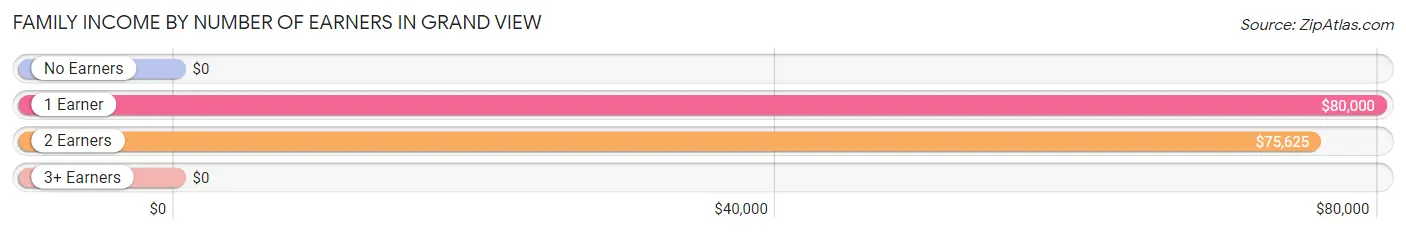
| Number of Earners | # Families | Median Income |
| No Earners | 8 (24.2%) | $0 |
| 1 Earner | 18 (54.5%) | $80,000 |
| 2 Earners | 5 (15.1%) | $75,625 |
| 3+ Earners | 2 (6.1%) | $0 |
| Total | 33 (100.0%) | $57,361 |
Household Income in Grand View
Household Income Brackets in Grand View
With 13 households falling in the category, the $50,000 to $74,999 income range is the most frequent in Grand View, accounting for 24.1% of all households.
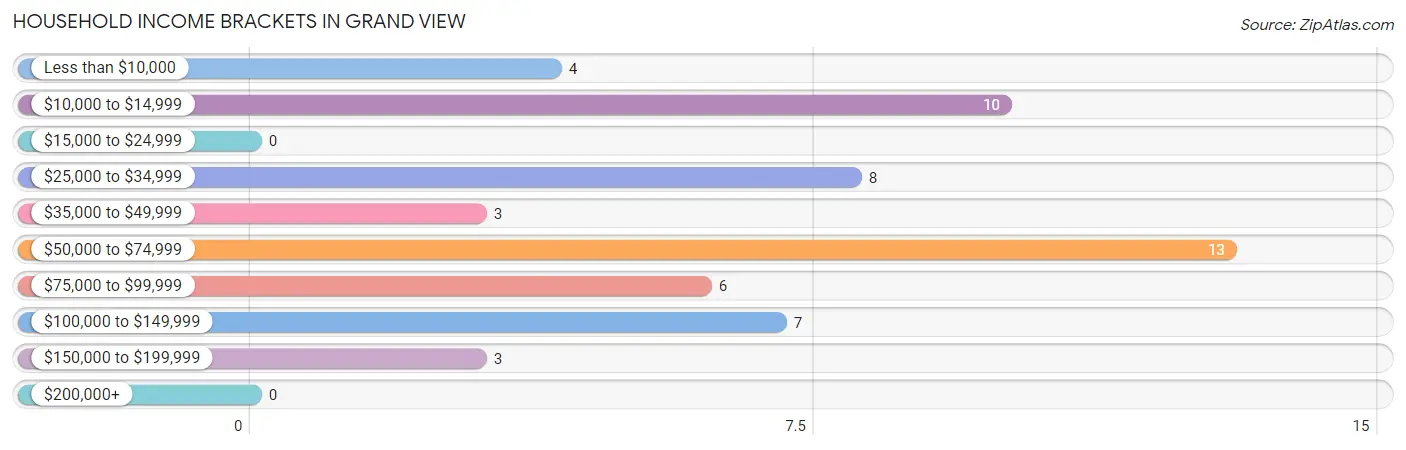
| Income Bracket | # Households | % Households |
| Less than $10,000 | 4 | 7.4% |
| $10,000 to $14,999 | 10 | 18.5% |
| $15,000 to $24,999 | 0 | 0.0% |
| $25,000 to $34,999 | 8 | 14.8% |
| $35,000 to $49,999 | 3 | 5.6% |
| $50,000 to $74,999 | 13 | 24.1% |
| $75,000 to $99,999 | 6 | 11.1% |
| $100,000 to $149,999 | 7 | 13.0% |
| $150,000 to $199,999 | 3 | 5.6% |
| $200,000+ | 0 | 0.0% |
Household Income by Householder Age in Grand View
The median household income in Grand View is $55,556, with the highest median household income of $76,875 found in the 25 to 44 years age bracket for the primary householder. A total of 7 households (13.0%) fall into this category.
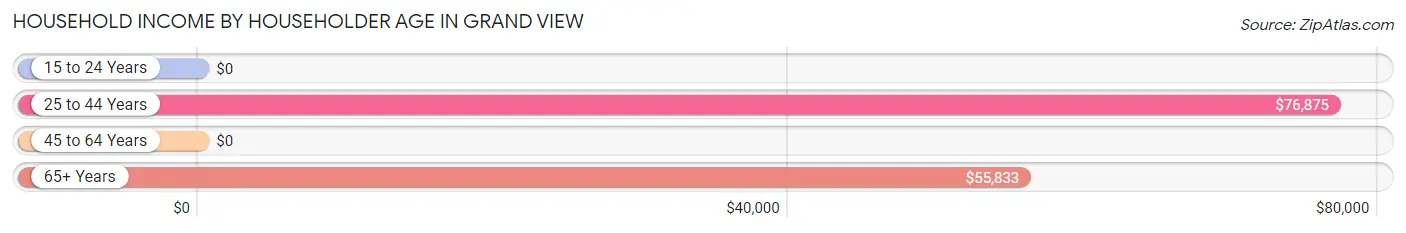
| Income Bracket | # Households | Median Income |
| 15 to 24 Years | 0 (0.0%) | $0 |
| 25 to 44 Years | 7 (13.0%) | $76,875 |
| 45 to 64 Years | 15 (27.8%) | $0 |
| 65+ Years | 32 (59.3%) | $55,833 |
| Total | 54 (100.0%) | $55,556 |
Poverty in Grand View
Income Below Poverty by Sex and Age in Grand View
With 18.2% poverty level for males and 24.1% for females among the residents of Grand View, 12 to 14 year old males and 55 to 64 year old females are the most vulnerable to poverty, with 2 males (66.7%) and 6 females (66.7%) in their respective age groups living below the poverty level.
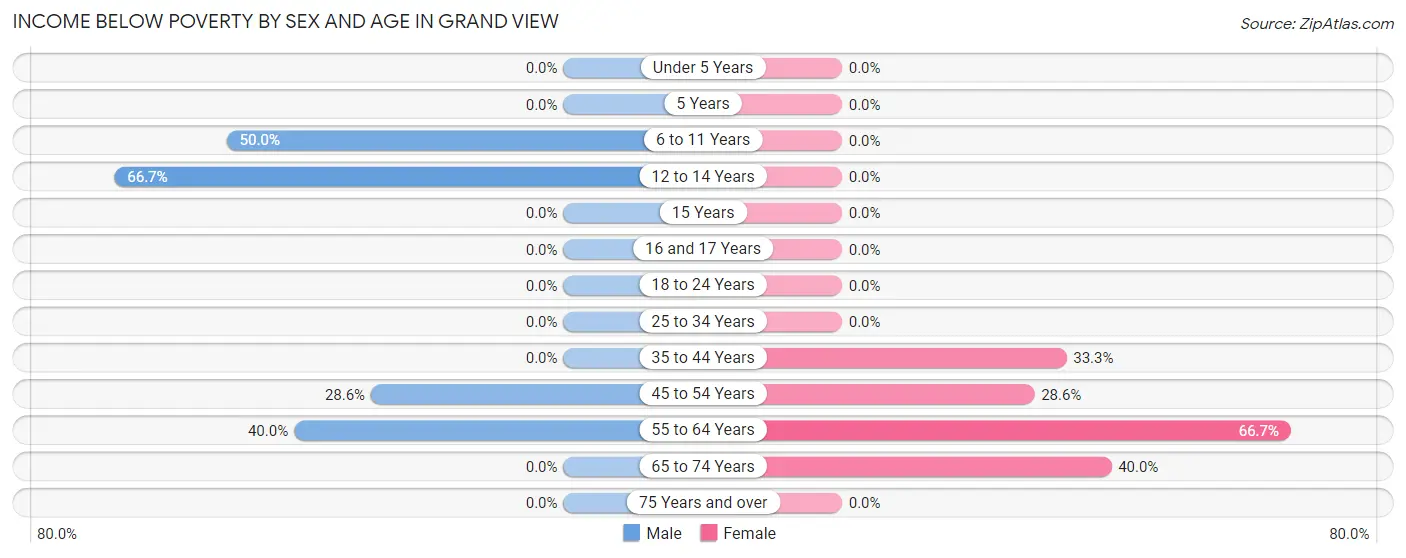
| Age Bracket | Male | Female |
| Under 5 Years | 0 (0.0%) | 0 (0.0%) |
| 5 Years | 0 (0.0%) | 0 (0.0%) |
| 6 to 11 Years | 2 (50.0%) | 0 (0.0%) |
| 12 to 14 Years | 2 (66.7%) | 0 (0.0%) |
| 15 Years | 0 (0.0%) | 0 (0.0%) |
| 16 and 17 Years | 0 (0.0%) | 0 (0.0%) |
| 18 to 24 Years | 0 (0.0%) | 0 (0.0%) |
| 25 to 34 Years | 0 (0.0%) | 0 (0.0%) |
| 35 to 44 Years | 0 (0.0%) | 2 (33.3%) |
| 45 to 54 Years | 2 (28.6%) | 2 (28.6%) |
| 55 to 64 Years | 2 (40.0%) | 6 (66.7%) |
| 65 to 74 Years | 0 (0.0%) | 4 (40.0%) |
| 75 Years and over | 0 (0.0%) | 0 (0.0%) |
| Total | 8 (18.2%) | 14 (24.1%) |
Income Above Poverty by Sex and Age in Grand View
According to the poverty statistics in Grand View, males aged 25 to 34 years and females aged 5 years are the age groups that are most secure financially, with 100.0% of males and 100.0% of females in these age groups living above the poverty line.
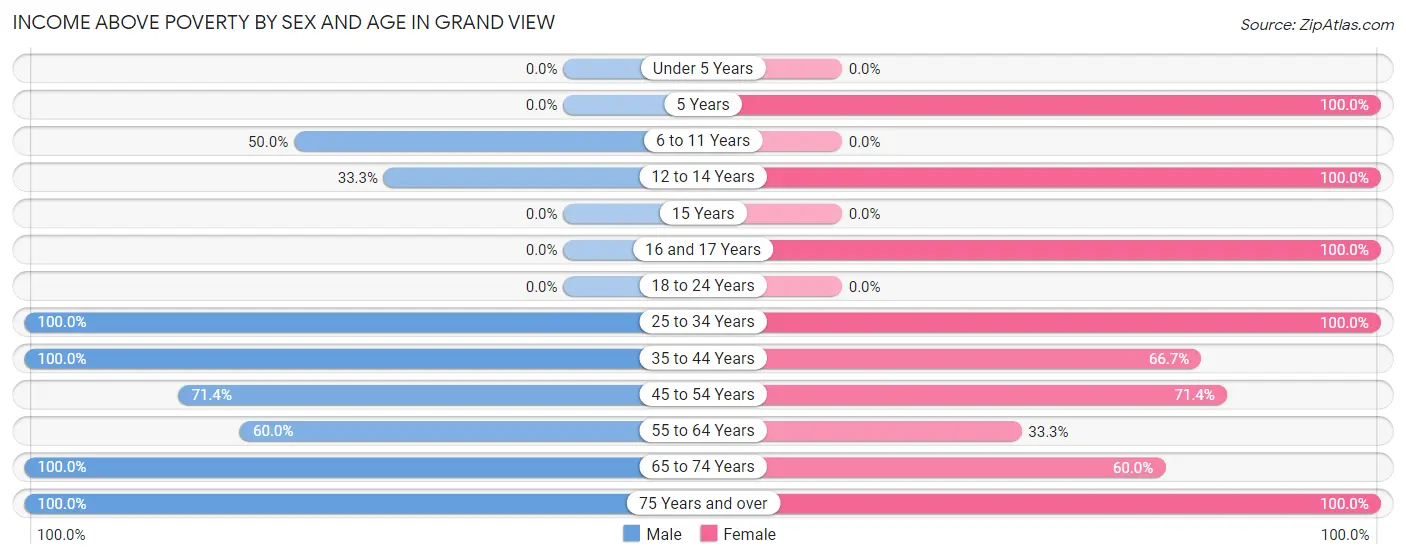
| Age Bracket | Male | Female |
| Under 5 Years | 0 (0.0%) | 0 (0.0%) |
| 5 Years | 0 (0.0%) | 2 (100.0%) |
| 6 to 11 Years | 2 (50.0%) | 0 (0.0%) |
| 12 to 14 Years | 1 (33.3%) | 4 (100.0%) |
| 15 Years | 0 (0.0%) | 0 (0.0%) |
| 16 and 17 Years | 0 (0.0%) | 2 (100.0%) |
| 18 to 24 Years | 0 (0.0%) | 0 (0.0%) |
| 25 to 34 Years | 2 (100.0%) | 1 (100.0%) |
| 35 to 44 Years | 3 (100.0%) | 4 (66.7%) |
| 45 to 54 Years | 5 (71.4%) | 5 (71.4%) |
| 55 to 64 Years | 3 (60.0%) | 3 (33.3%) |
| 65 to 74 Years | 7 (100.0%) | 6 (60.0%) |
| 75 Years and over | 13 (100.0%) | 17 (100.0%) |
| Total | 36 (81.8%) | 44 (75.9%) |
Income Below Poverty Among Married-Couple Families in Grand View
The poverty statistics for married-couple families in Grand View show that 8.0% or 2 of the total 25 families live below the poverty line. Families with 1 or 2 children have the highest poverty rate of 28.6%, comprising of 2 families. On the other hand, families with no children have the lowest poverty rate of 0.0%, which includes 0 families.
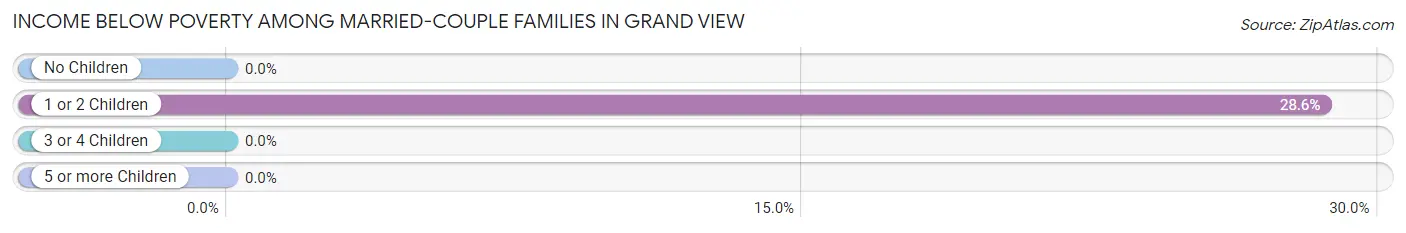
| Children | Above Poverty | Below Poverty |
| No Children | 18 (100.0%) | 0 (0.0%) |
| 1 or 2 Children | 5 (71.4%) | 2 (28.6%) |
| 3 or 4 Children | 0 (0.0%) | 0 (0.0%) |
| 5 or more Children | 0 (0.0%) | 0 (0.0%) |
| Total | 23 (92.0%) | 2 (8.0%) |
Income Below Poverty Among Single-Parent Households in Grand View
| Children | Single Father | Single Mother |
| No Children | 0 (0.0%) | 0 (0.0%) |
| 1 or 2 Children | 0 (0.0%) | 0 (0.0%) |
| 3 or 4 Children | 0 (0.0%) | 0 (0.0%) |
| 5 or more Children | 0 (0.0%) | 0 (0.0%) |
| Total | 0 (0.0%) | 0 (0.0%) |
Income Below Poverty Among Married-Couple vs Single-Parent Households in Grand View
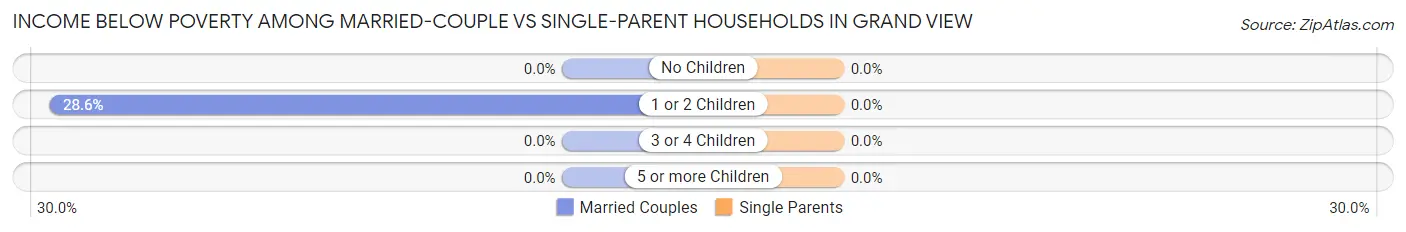
| Children | Married-Couple Families | Single-Parent Households |
| No Children | 0 (0.0%) | 0 (0.0%) |
| 1 or 2 Children | 2 (28.6%) | 0 (0.0%) |
| 3 or 4 Children | 0 (0.0%) | 0 (0.0%) |
| 5 or more Children | 0 (0.0%) | 0 (0.0%) |
| Total | 2 (8.0%) | 0 (0.0%) |
Race in Grand View
The most populous races in Grand View are White / Caucasian (92 | 90.2%), Two or more Races (10 | 9.8%), and Hispanic or Latino (5 | 4.9%).
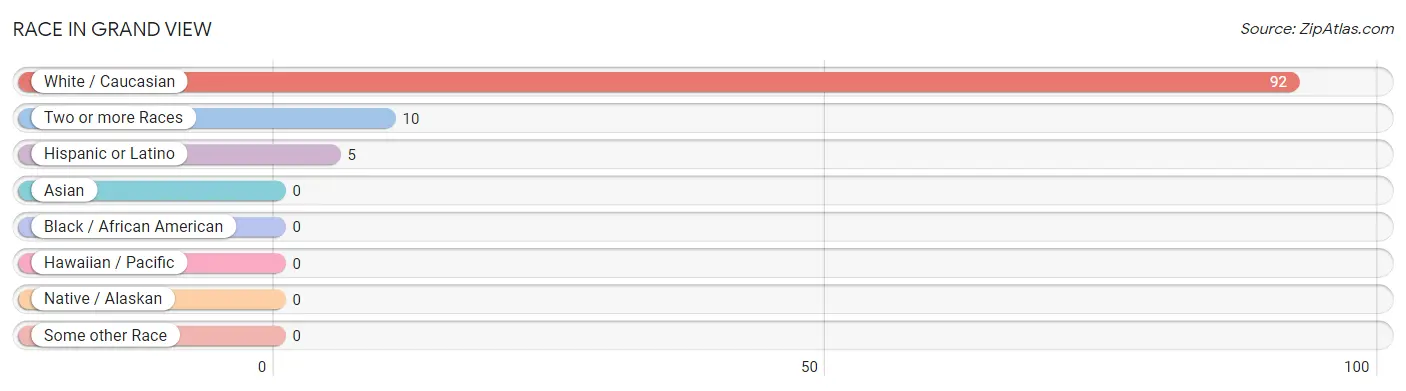
| Race | # Population | % Population |
| Asian | 0 | 0.0% |
| Black / African American | 0 | 0.0% |
| Hawaiian / Pacific | 0 | 0.0% |
| Hispanic or Latino | 5 | 4.9% |
| Native / Alaskan | 0 | 0.0% |
| White / Caucasian | 92 | 90.2% |
| Two or more Races | 10 | 9.8% |
| Some other Race | 0 | 0.0% |
| Total | 102 | 100.0% |
Ancestry in Grand View
The most populous ancestries reported in Grand View are German (35 | 34.3%), Norwegian (25 | 24.5%), Swedish (19 | 18.6%), English (17 | 16.7%), and Irish (12 | 11.8%), together accounting for 105.9% of all Grand View residents.
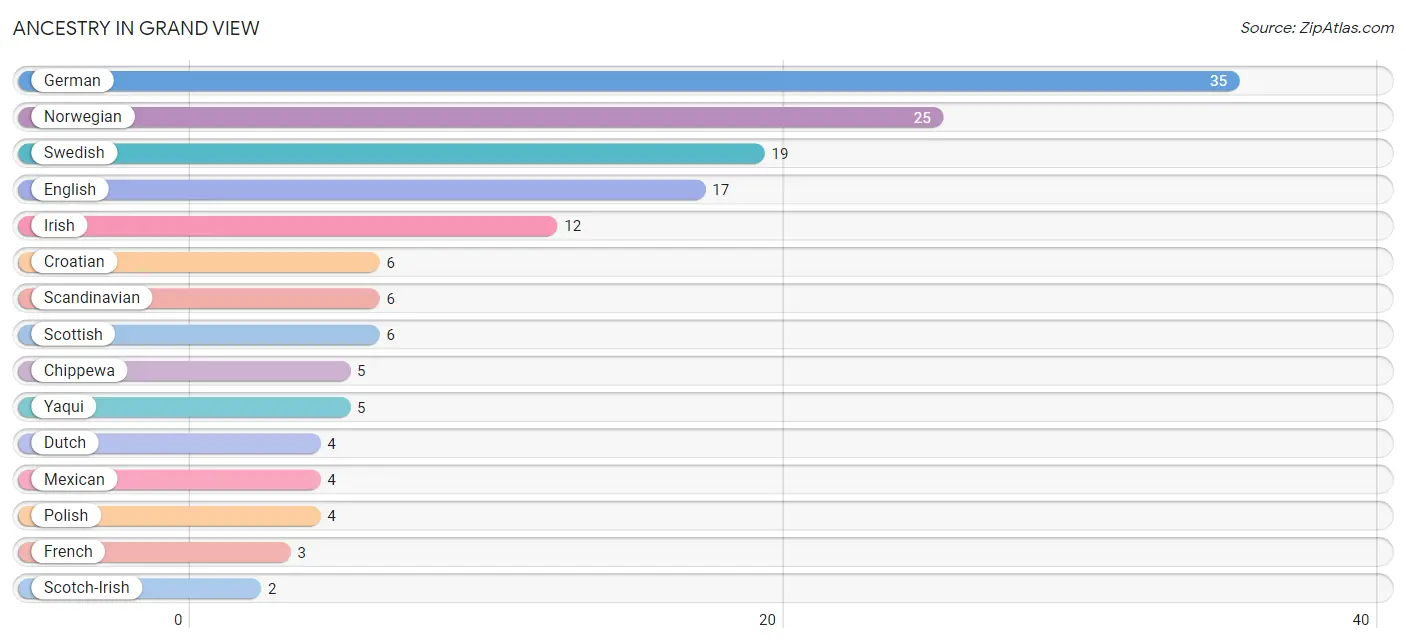
| Ancestry | # Population | % Population |
| Chippewa | 5 | 4.9% |
| Croatian | 6 | 5.9% |
| Dutch | 4 | 3.9% |
| English | 17 | 16.7% |
| French | 3 | 2.9% |
| German | 35 | 34.3% |
| Irish | 12 | 11.8% |
| Mexican | 4 | 3.9% |
| Norwegian | 25 | 24.5% |
| Polish | 4 | 3.9% |
| Scandinavian | 6 | 5.9% |
| Scotch-Irish | 2 | 2.0% |
| Scottish | 6 | 5.9% |
| Spaniard | 1 | 1.0% |
| Swedish | 19 | 18.6% |
| Yaqui | 5 | 4.9% | View All 16 Rows |
Immigrants in Grand View
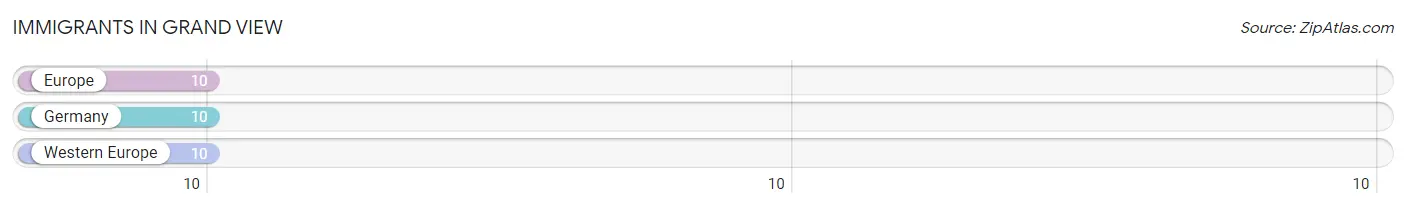
The most numerous immigrant groups reported in Grand View came from Europe (10 | 9.8%), Germany (10 | 9.8%), and Western Europe (10 | 9.8%), together accounting for 29.4% of all Grand View residents.
| Immigration Origin | # Population | % Population |
| Europe | 10 | 9.8% |
| Germany | 10 | 9.8% |
| Western Europe | 10 | 9.8% | View All 3 Rows |
Sex and Age in Grand View
Sex and Age in Grand View
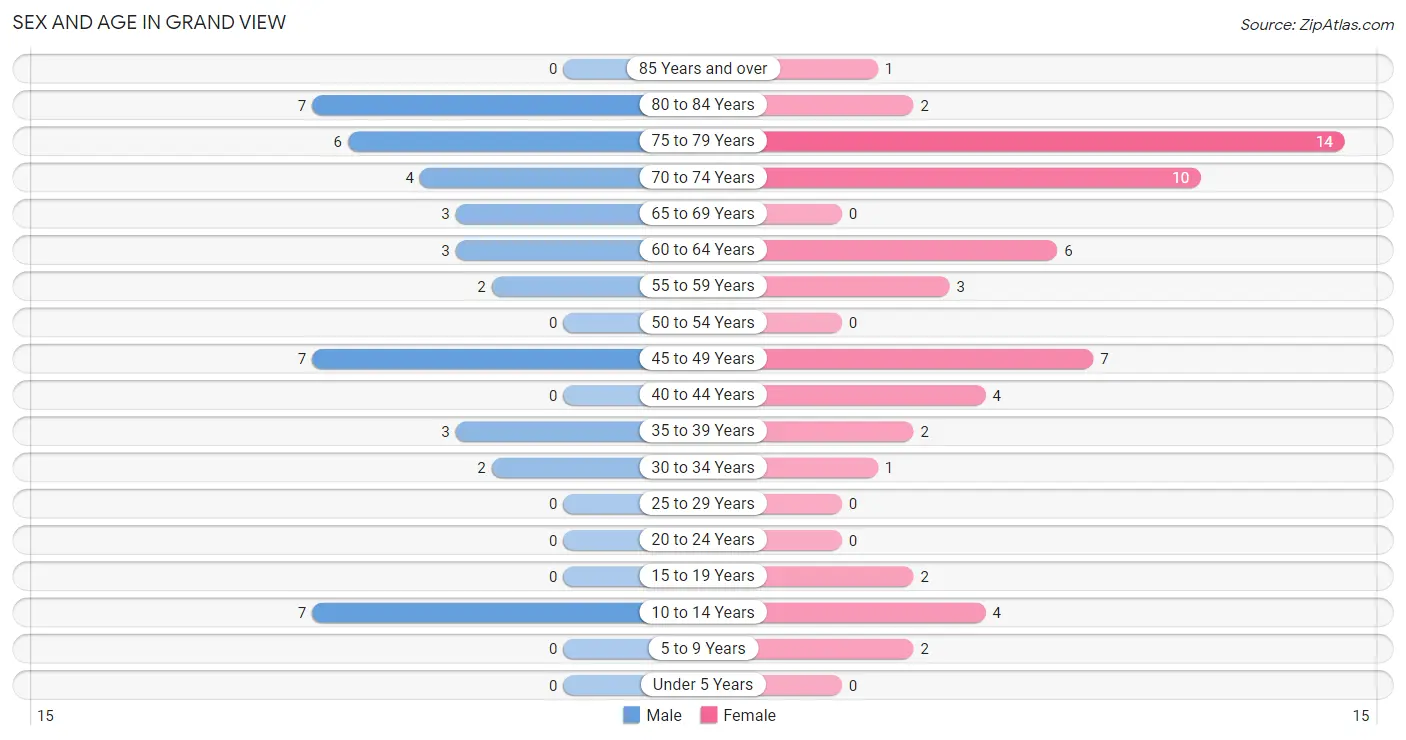
The most populous age groups in Grand View are 10 to 14 Years (7 | 15.9%) for men and 75 to 79 Years (14 | 24.1%) for women.
| Age Bracket | Male | Female |
| Under 5 Years | 0 (0.0%) | 0 (0.0%) |
| 5 to 9 Years | 0 (0.0%) | 2 (3.5%) |
| 10 to 14 Years | 7 (15.9%) | 4 (6.9%) |
| 15 to 19 Years | 0 (0.0%) | 2 (3.5%) |
| 20 to 24 Years | 0 (0.0%) | 0 (0.0%) |
| 25 to 29 Years | 0 (0.0%) | 0 (0.0%) |
| 30 to 34 Years | 2 (4.5%) | 1 (1.7%) |
| 35 to 39 Years | 3 (6.8%) | 2 (3.5%) |
| 40 to 44 Years | 0 (0.0%) | 4 (6.9%) |
| 45 to 49 Years | 7 (15.9%) | 7 (12.1%) |
| 50 to 54 Years | 0 (0.0%) | 0 (0.0%) |
| 55 to 59 Years | 2 (4.5%) | 3 (5.2%) |
| 60 to 64 Years | 3 (6.8%) | 6 (10.3%) |
| 65 to 69 Years | 3 (6.8%) | 0 (0.0%) |
| 70 to 74 Years | 4 (9.1%) | 10 (17.2%) |
| 75 to 79 Years | 6 (13.6%) | 14 (24.1%) |
| 80 to 84 Years | 7 (15.9%) | 2 (3.5%) |
| 85 Years and over | 0 (0.0%) | 1 (1.7%) |
| Total | 44 (100.0%) | 58 (100.0%) |
Families and Households in Grand View
Median Family Size in Grand View
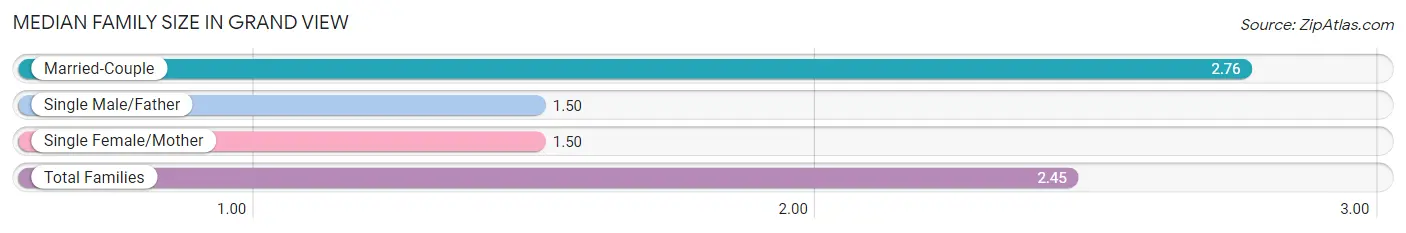
The median family size in Grand View is 2.45 persons per family, with married-couple families (25 | 75.8%) accounting for the largest median family size of 2.76 persons per family. On the other hand, single male/father families (2 | 6.1%) represent the smallest median family size with 1.50 persons per family.
| Family Type | # Families | Family Size |
| Married-Couple | 25 (75.8%) | 2.76 |
| Single Male/Father | 2 (6.1%) | 1.50 |
| Single Female/Mother | 6 (18.2%) | 1.50 |
| Total Families | 33 (100.0%) | 2.45 |
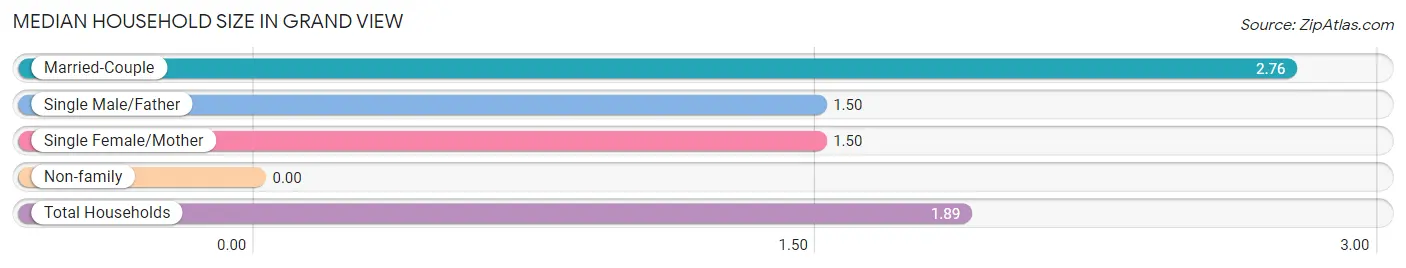
Median Household Size in Grand View
| Household Type | # Households | Household Size |
| Married-Couple | 25 (46.3%) | 2.76 |
| Single Male/Father | 2 (3.7%) | 1.50 |
| Single Female/Mother | 6 (11.1%) | 1.50 |
| Non-family | 21 (38.9%) | - |
| Total Households | 54 (100.0%) | 1.89 |
Household Size by Marriage Status in Grand View
Out of a total of 54 households in Grand View, 33 (61.1%) are family households, while 21 (38.9%) are nonfamily households. The most numerous type of family households are 2-person households, comprising 19, and the most common type of nonfamily households are 1-person households, comprising 21.
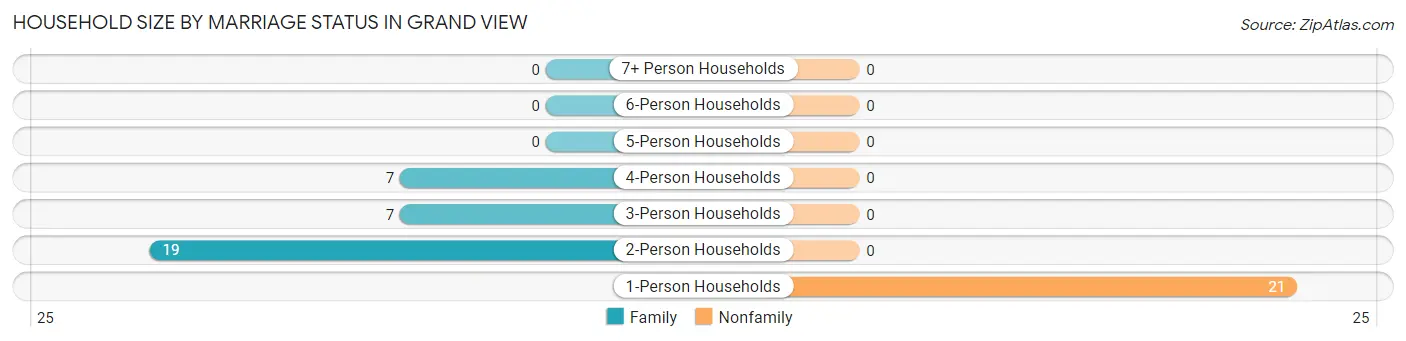
| Household Size | Family Households | Nonfamily Households |
| 1-Person Households | - | 21 (38.9%) |
| 2-Person Households | 19 (35.2%) | 0 (0.0%) |
| 3-Person Households | 7 (13.0%) | 0 (0.0%) |
| 4-Person Households | 7 (13.0%) | 0 (0.0%) |
| 5-Person Households | 0 (0.0%) | 0 (0.0%) |
| 6-Person Households | 0 (0.0%) | 0 (0.0%) |
| 7+ Person Households | 0 (0.0%) | 0 (0.0%) |
| Total | 33 (61.1%) | 21 (38.9%) |
Female Fertility in Grand View
Fertility by Age in Grand View
| Age Bracket | Women with Births | Births / 1,000 Women |
| 15 to 19 years | 0 (0.0%) | 0.0 |
| 20 to 34 years | 0 (0.0%) | 0.0 |
| 35 to 50 years | 0 (0.0%) | 0.0 |
| Total | 0 (0.0%) | 0.0 |
Fertility by Age by Marriage Status in Grand View
| Age Bracket | Married | Unmarried |
| 15 to 19 years | 0 (0.0%) | 0 (0.0%) |
| 20 to 34 years | 0 (0.0%) | 0 (0.0%) |
| 35 to 50 years | 0 (0.0%) | 0 (0.0%) |
| Total | 0 (0.0%) | 0 (0.0%) |
Fertility by Education in Grand View
| Educational Attainment | Women with Births | Births / 1,000 Women |
| Less than High School | 0 (0.0%) | 0.0 |
| High School Diploma | 0 (0.0%) | 0.0 |
| College or Associate's Degree | 0 (0.0%) | 0.0 |
| Bachelor's Degree | 0 (0.0%) | 0.0 |
| Graduate Degree | 0 (0.0%) | 0.0 |
| Total | 0 (0.0%) | 0.0 |
Fertility by Education by Marriage Status in Grand View
| Educational Attainment | Married | Unmarried |
| Less than High School | 0 (0.0%) | 0 (0.0%) |
| High School Diploma | 0 (0.0%) | 0 (0.0%) |
| College or Associate's Degree | 0 (0.0%) | 0 (0.0%) |
| Bachelor's Degree | 0 (0.0%) | 0 (0.0%) |
| Graduate Degree | 0 (0.0%) | 0 (0.0%) |
| Total | 0 (0.0%) | 0 (0.0%) |
Employment Characteristics in Grand View
Employment by Class of Employer in Grand View
Among the 32 employed individuals in Grand View, private company employees (22 | 68.8%), self-employed (not incorporated) (4 | 12.5%), and local government employees (3 | 9.4%) make up the most common classes of employment.
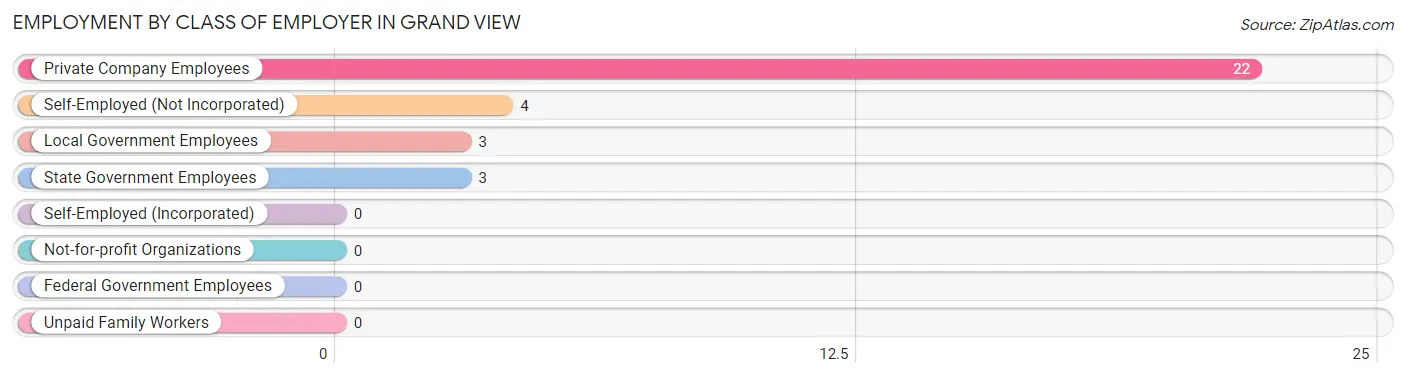
| Employer Class | # Employees | % Employees |
| Private Company Employees | 22 | 68.8% |
| Self-Employed (Incorporated) | 0 | 0.0% |
| Self-Employed (Not Incorporated) | 4 | 12.5% |
| Not-for-profit Organizations | 0 | 0.0% |
| Local Government Employees | 3 | 9.4% |
| State Government Employees | 3 | 9.4% |
| Federal Government Employees | 0 | 0.0% |
| Unpaid Family Workers | 0 | 0.0% |
| Total | 32 | 100.0% |
Employment Status by Age in Grand View
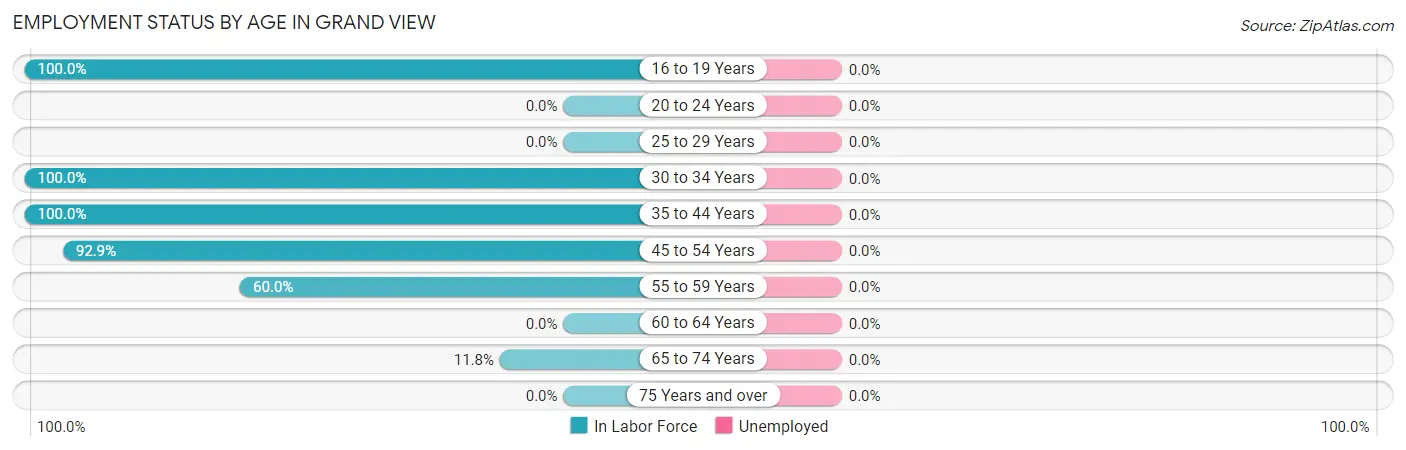
| Age Bracket | In Labor Force | Unemployed |
| 16 to 19 Years | 2 (100.0%) | 0 (0.0%) |
| 20 to 24 Years | 0 (0.0%) | 0 (0.0%) |
| 25 to 29 Years | 0 (0.0%) | 0 (0.0%) |
| 30 to 34 Years | 3 (100.0%) | 0 (0.0%) |
| 35 to 44 Years | 9 (100.0%) | 0 (0.0%) |
| 45 to 54 Years | 13 (92.9%) | 0 (0.0%) |
| 55 to 59 Years | 3 (60.0%) | 0 (0.0%) |
| 60 to 64 Years | 0 (0.0%) | 0 (0.0%) |
| 65 to 74 Years | 2 (11.8%) | 0 (0.0%) |
| 75 Years and over | 0 (0.0%) | 0 (0.0%) |
| Total | 32 (36.0%) | 0 (0.0%) |
Employment Status by Educational Attainment in Grand View
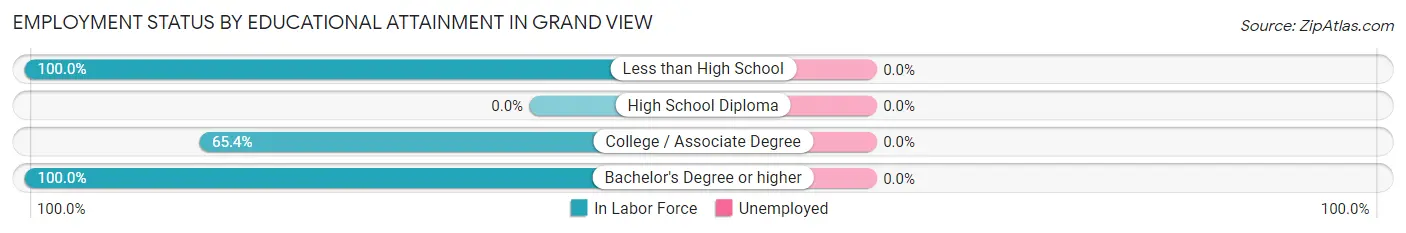
| Educational Attainment | In Labor Force | Unemployed |
| Less than High School | 5 (100.0%) | 0 (0.0%) |
| High School Diploma | 0 (0.0%) | 0 (0.0%) |
| College / Associate Degree | 17 (65.4%) | 0 (0.0%) |
| Bachelor's Degree or higher | 6 (100.0%) | 0 (0.0%) |
| Total | 28 (70.0%) | 0 (0.0%) |
Employment Occupations by Sex in Grand View
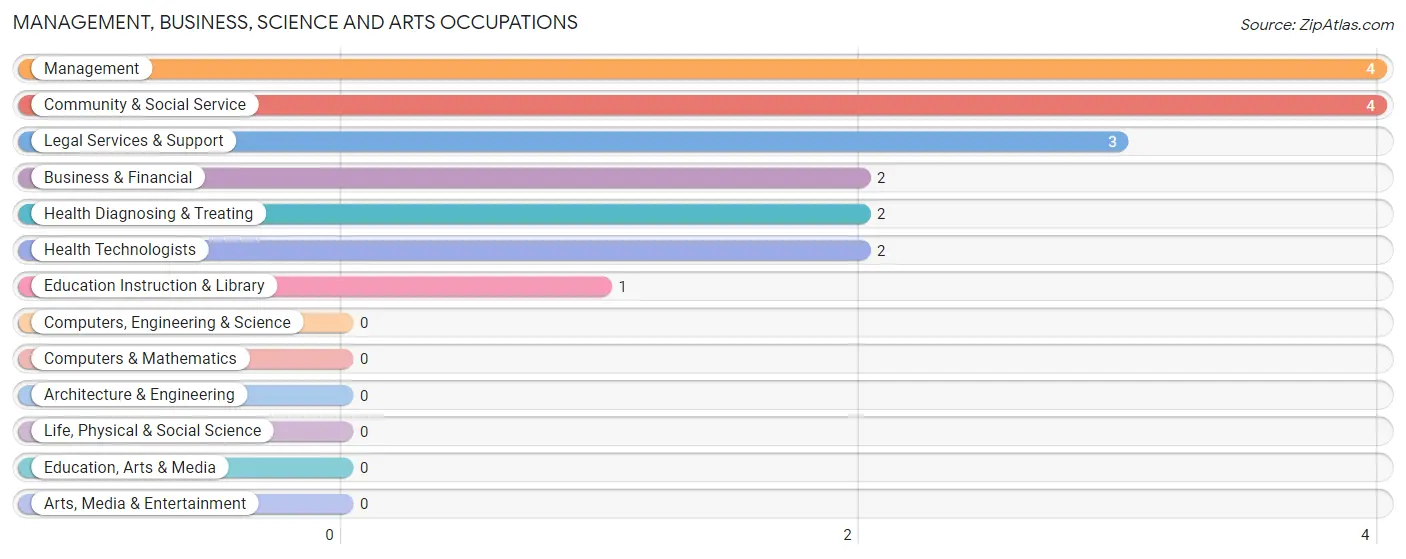
Management, Business, Science and Arts Occupations
The most common Management, Business, Science and Arts occupations in Grand View are Management (4 | 12.5%), Community & Social Service (4 | 12.5%), Legal Services & Support (3 | 9.4%), Business & Financial (2 | 6.2%), and Health Diagnosing & Treating (2 | 6.2%).
Management, Business, Science and Arts Occupations by Sex
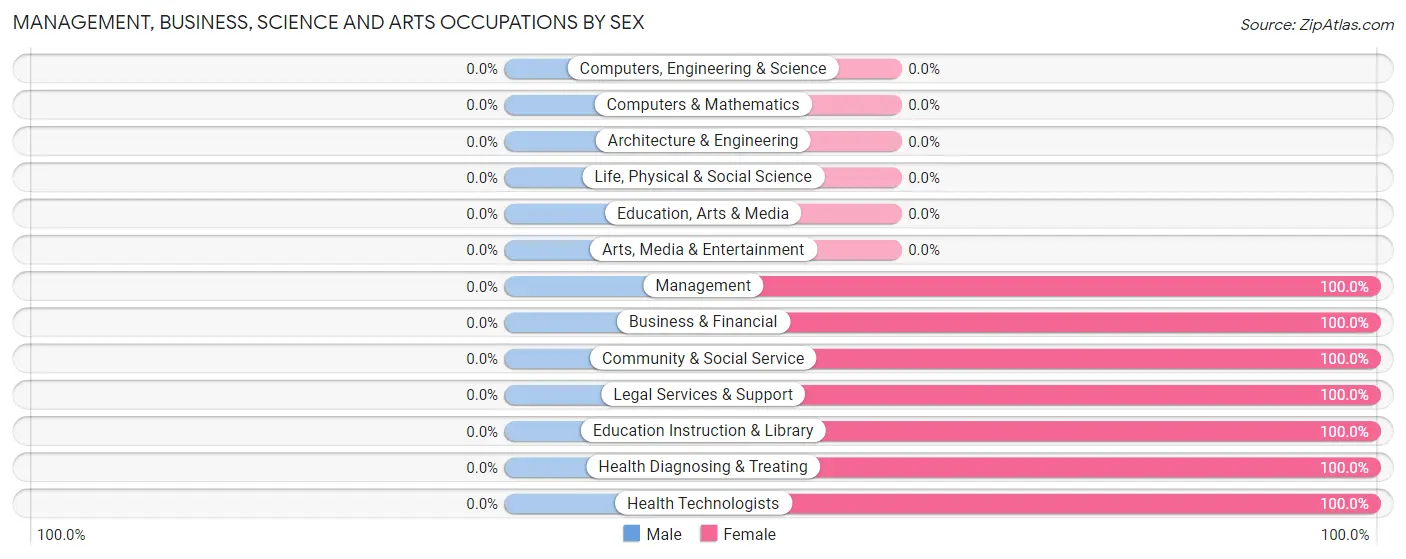
| Occupation | Male | Female |
| Management | 0 (0.0%) | 4 (100.0%) |
| Business & Financial | 0 (0.0%) | 2 (100.0%) |
| Computers, Engineering & Science | 0 (0.0%) | 0 (0.0%) |
| Computers & Mathematics | 0 (0.0%) | 0 (0.0%) |
| Architecture & Engineering | 0 (0.0%) | 0 (0.0%) |
| Life, Physical & Social Science | 0 (0.0%) | 0 (0.0%) |
| Community & Social Service | 0 (0.0%) | 4 (100.0%) |
| Education, Arts & Media | 0 (0.0%) | 0 (0.0%) |
| Legal Services & Support | 0 (0.0%) | 3 (100.0%) |
| Education Instruction & Library | 0 (0.0%) | 1 (100.0%) |
| Arts, Media & Entertainment | 0 (0.0%) | 0 (0.0%) |
| Health Diagnosing & Treating | 0 (0.0%) | 2 (100.0%) |
| Health Technologists | 0 (0.0%) | 2 (100.0%) |
| Total (Category) | 0 (0.0%) | 12 (100.0%) |
| Total (Overall) | 13 (40.6%) | 19 (59.4%) |
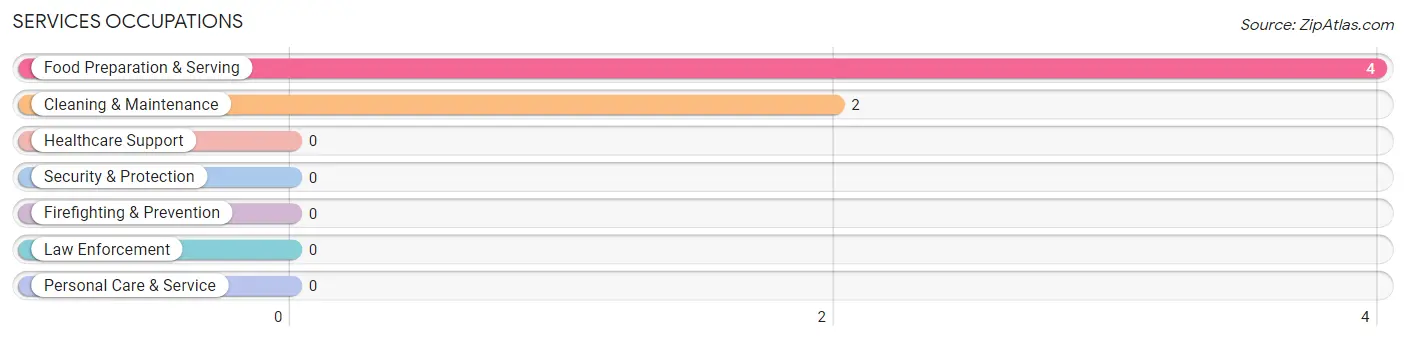
Services Occupations
The most common Services occupations in Grand View are Food Preparation & Serving (4 | 12.5%), and Cleaning & Maintenance (2 | 6.2%).
Services Occupations by Sex
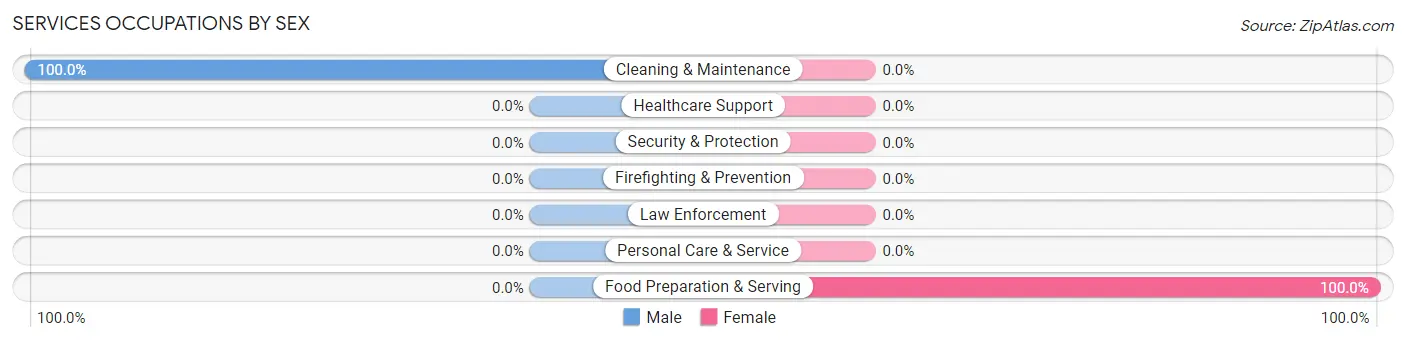
| Occupation | Male | Female |
| Healthcare Support | 0 (0.0%) | 0 (0.0%) |
| Security & Protection | 0 (0.0%) | 0 (0.0%) |
| Firefighting & Prevention | 0 (0.0%) | 0 (0.0%) |
| Law Enforcement | 0 (0.0%) | 0 (0.0%) |
| Food Preparation & Serving | 0 (0.0%) | 4 (100.0%) |
| Cleaning & Maintenance | 2 (100.0%) | 0 (0.0%) |
| Personal Care & Service | 0 (0.0%) | 0 (0.0%) |
| Total (Category) | 2 (33.3%) | 4 (66.7%) |
| Total (Overall) | 13 (40.6%) | 19 (59.4%) |
Sales and Office Occupations
The most common Sales and Office occupations in Grand View are , and Office & Administration (3 | 9.4%).

Sales and Office Occupations by Sex

| Occupation | Male | Female |
| Sales & Related | 0 (0.0%) | 0 (0.0%) |
| Office & Administration | 0 (0.0%) | 3 (100.0%) |
| Total (Category) | 0 (0.0%) | 3 (100.0%) |
| Total (Overall) | 13 (40.6%) | 19 (59.4%) |
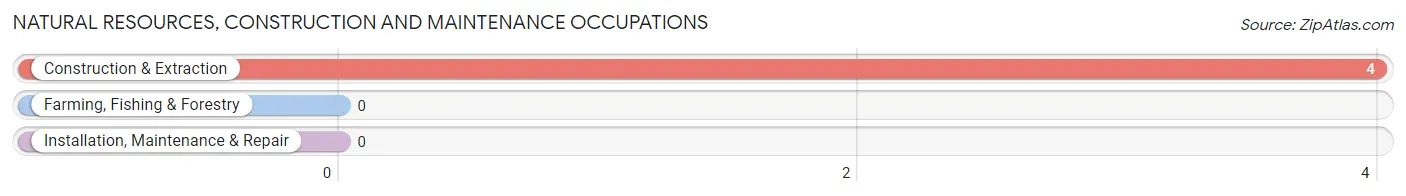
Natural Resources, Construction and Maintenance Occupations
The most common Natural Resources, Construction and Maintenance occupations in Grand View are , and Construction & Extraction (4 | 12.5%).
Natural Resources, Construction and Maintenance Occupations by Sex
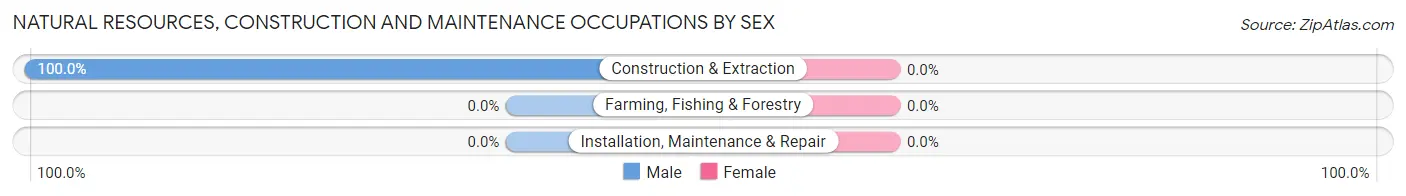
| Occupation | Male | Female |
| Farming, Fishing & Forestry | 0 (0.0%) | 0 (0.0%) |
| Construction & Extraction | 4 (100.0%) | 0 (0.0%) |
| Installation, Maintenance & Repair | 0 (0.0%) | 0 (0.0%) |
| Total (Category) | 4 (100.0%) | 0 (0.0%) |
| Total (Overall) | 13 (40.6%) | 19 (59.4%) |
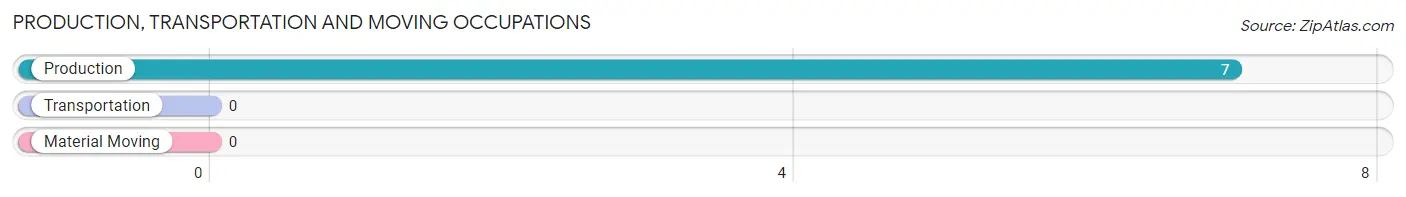
Production, Transportation and Moving Occupations
The most common Production, Transportation and Moving occupations in Grand View are , and Production (7 | 21.9%).
Production, Transportation and Moving Occupations by Sex
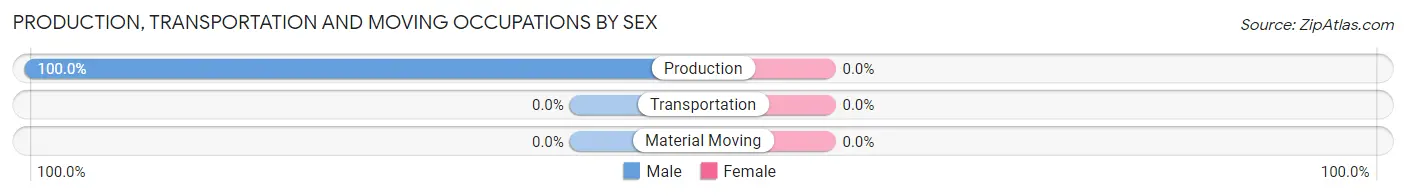
| Occupation | Male | Female |
| Production | 7 (100.0%) | 0 (0.0%) |
| Transportation | 0 (0.0%) | 0 (0.0%) |
| Material Moving | 0 (0.0%) | 0 (0.0%) |
| Total (Category) | 7 (100.0%) | 0 (0.0%) |
| Total (Overall) | 13 (40.6%) | 19 (59.4%) |
Employment Industries by Sex in Grand View
Employment Industries in Grand View
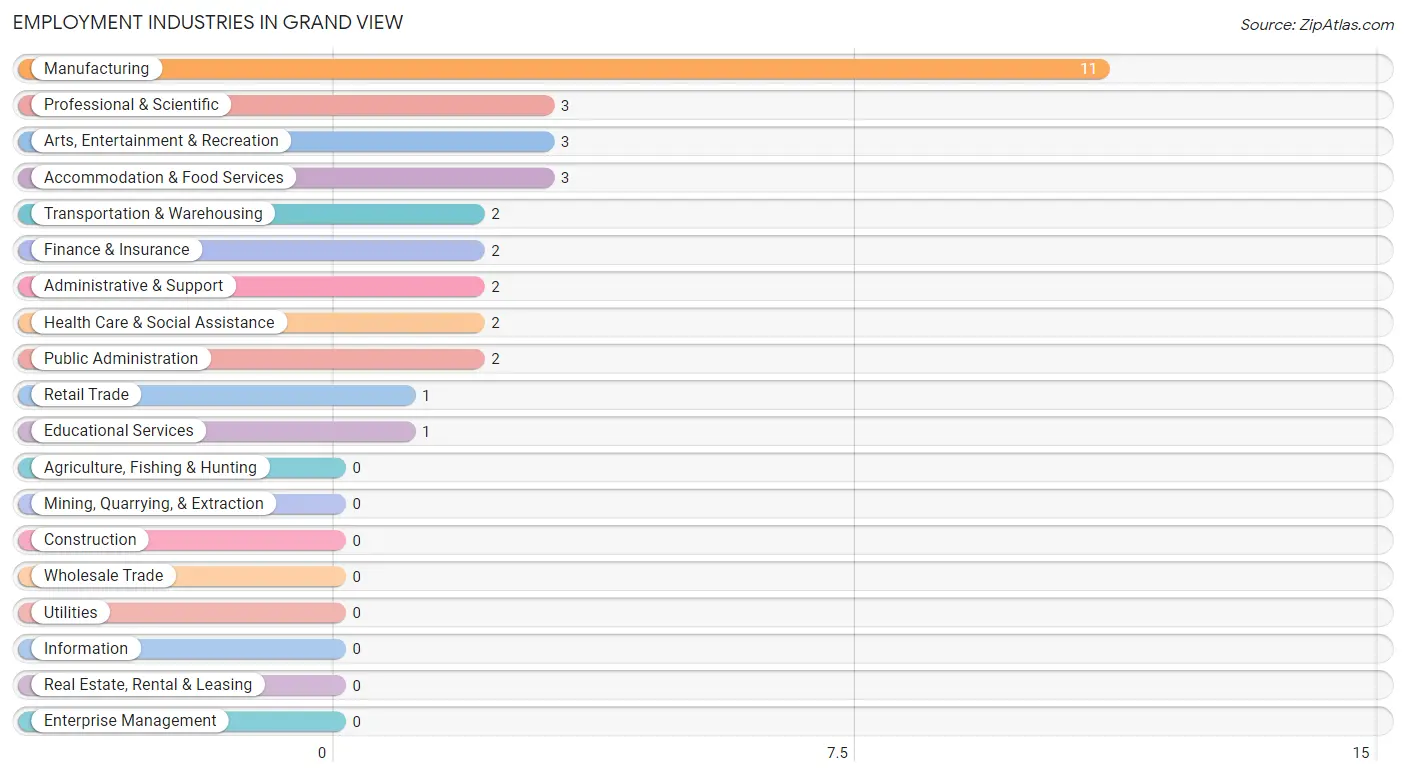
The major employment industries in Grand View include Manufacturing (11 | 34.4%), Professional & Scientific (3 | 9.4%), Arts, Entertainment & Recreation (3 | 9.4%), Accommodation & Food Services (3 | 9.4%), and Transportation & Warehousing (2 | 6.2%).
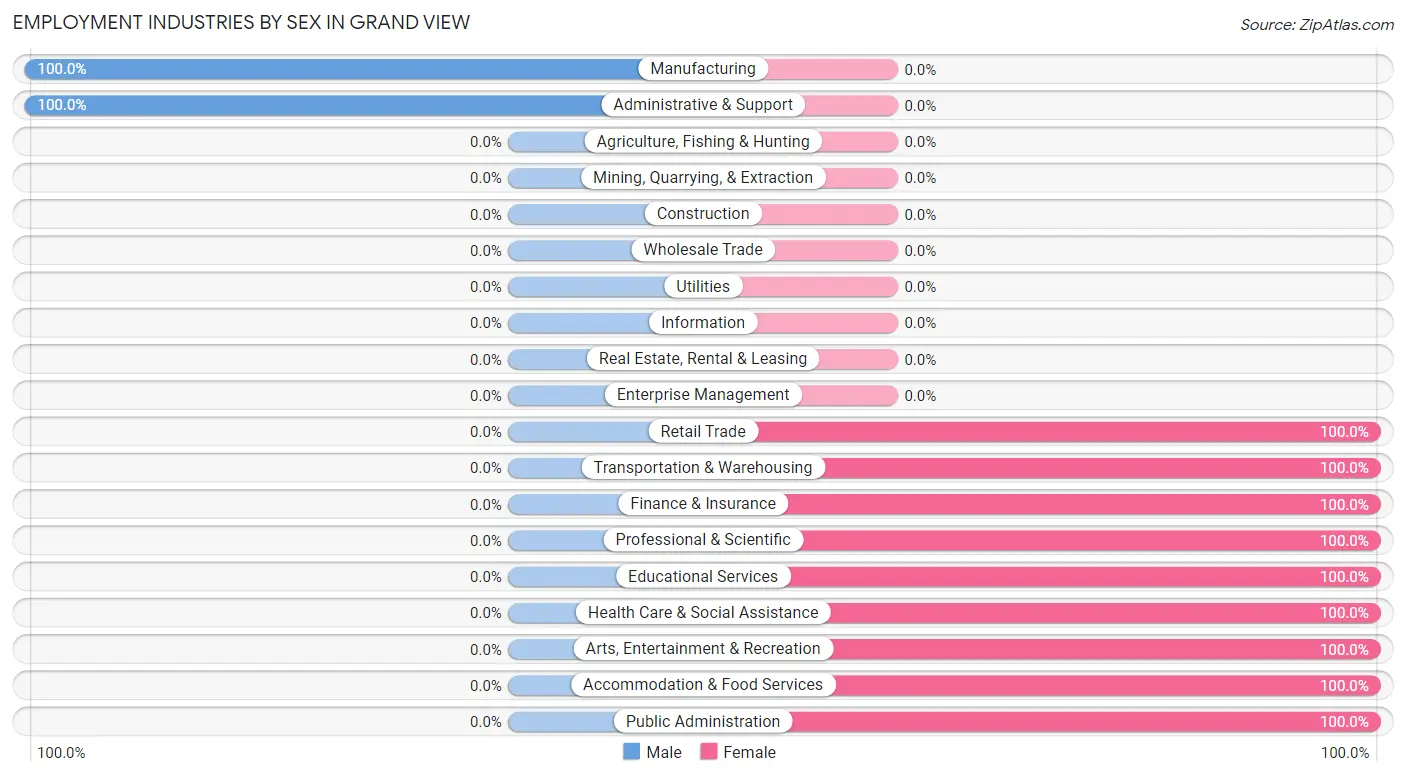
Employment Industries by Sex in Grand View
The Grand View industries that see more men than women are Manufacturing (100.0%), and Administrative & Support (100.0%), whereas the industries that tend to have a higher number of women are Retail Trade (100.0%), Transportation & Warehousing (100.0%), and Finance & Insurance (100.0%).
| Industry | Male | Female |
| Agriculture, Fishing & Hunting | 0 (0.0%) | 0 (0.0%) |
| Mining, Quarrying, & Extraction | 0 (0.0%) | 0 (0.0%) |
| Construction | 0 (0.0%) | 0 (0.0%) |
| Manufacturing | 11 (100.0%) | 0 (0.0%) |
| Wholesale Trade | 0 (0.0%) | 0 (0.0%) |
| Retail Trade | 0 (0.0%) | 1 (100.0%) |
| Transportation & Warehousing | 0 (0.0%) | 2 (100.0%) |
| Utilities | 0 (0.0%) | 0 (0.0%) |
| Information | 0 (0.0%) | 0 (0.0%) |
| Finance & Insurance | 0 (0.0%) | 2 (100.0%) |
| Real Estate, Rental & Leasing | 0 (0.0%) | 0 (0.0%) |
| Professional & Scientific | 0 (0.0%) | 3 (100.0%) |
| Enterprise Management | 0 (0.0%) | 0 (0.0%) |
| Administrative & Support | 2 (100.0%) | 0 (0.0%) |
| Educational Services | 0 (0.0%) | 1 (100.0%) |
| Health Care & Social Assistance | 0 (0.0%) | 2 (100.0%) |
| Arts, Entertainment & Recreation | 0 (0.0%) | 3 (100.0%) |
| Accommodation & Food Services | 0 (0.0%) | 3 (100.0%) |
| Public Administration | 0 (0.0%) | 2 (100.0%) |
| Total | 13 (40.6%) | 19 (59.4%) |
Education in Grand View
School Enrollment in Grand View
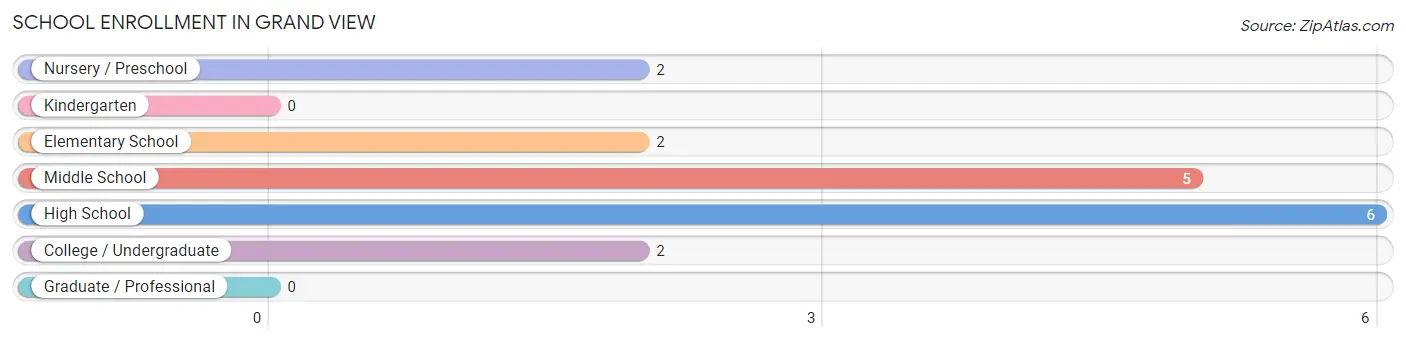
The most common levels of schooling among the 17 students in Grand View are high school (6 | 35.3%), middle school (5 | 29.4%), and nursery / preschool (2 | 11.8%).
| School Level | # Students | % Students |
| Nursery / Preschool | 2 | 11.8% |
| Kindergarten | 0 | 0.0% |
| Elementary School | 2 | 11.8% |
| Middle School | 5 | 29.4% |
| High School | 6 | 35.3% |
| College / Undergraduate | 2 | 11.8% |
| Graduate / Professional | 0 | 0.0% |
| Total | 17 | 100.0% |
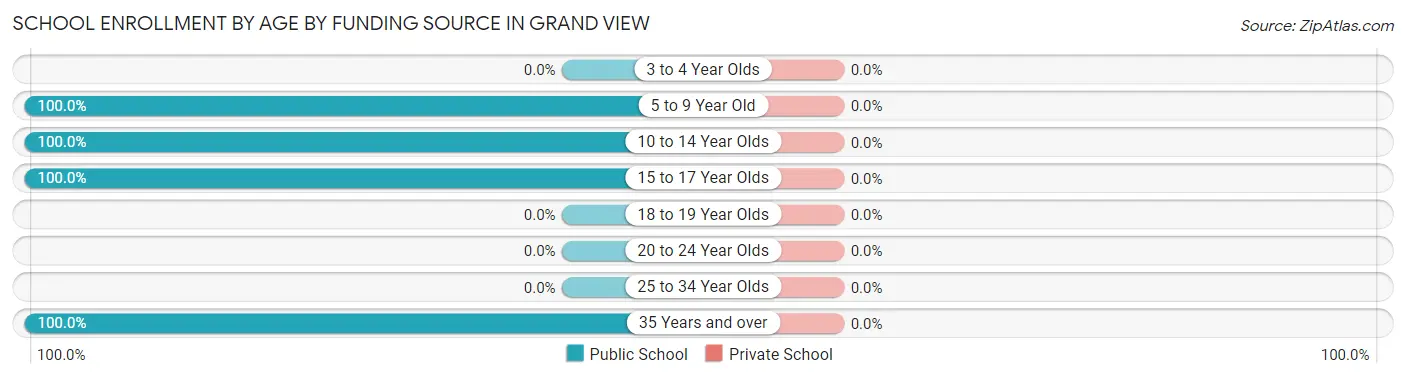
School Enrollment by Age by Funding Source in Grand View
| Age Bracket | Public School | Private School |
| 3 to 4 Year Olds | 0 (0.0%) | 0 (0.0%) |
| 5 to 9 Year Old | 2 (100.0%) | 0 (0.0%) |
| 10 to 14 Year Olds | 11 (100.0%) | 0 (0.0%) |
| 15 to 17 Year Olds | 2 (100.0%) | 0 (0.0%) |
| 18 to 19 Year Olds | 0 (0.0%) | 0 (0.0%) |
| 20 to 24 Year Olds | 0 (0.0%) | 0 (0.0%) |
| 25 to 34 Year Olds | 0 (0.0%) | 0 (0.0%) |
| 35 Years and over | 2 (100.0%) | 0 (0.0%) |
| Total | 17 (100.0%) | 0 (0.0%) |
Educational Attainment by Field of Study in Grand View
Education (6 | 42.9%), bio, nature & agricultural (2 | 14.3%), psychology (2 | 14.3%), science & technology (2 | 14.3%), and business (2 | 14.3%) are the most common fields of study among 14 individuals in Grand View who have obtained a bachelor's degree or higher.
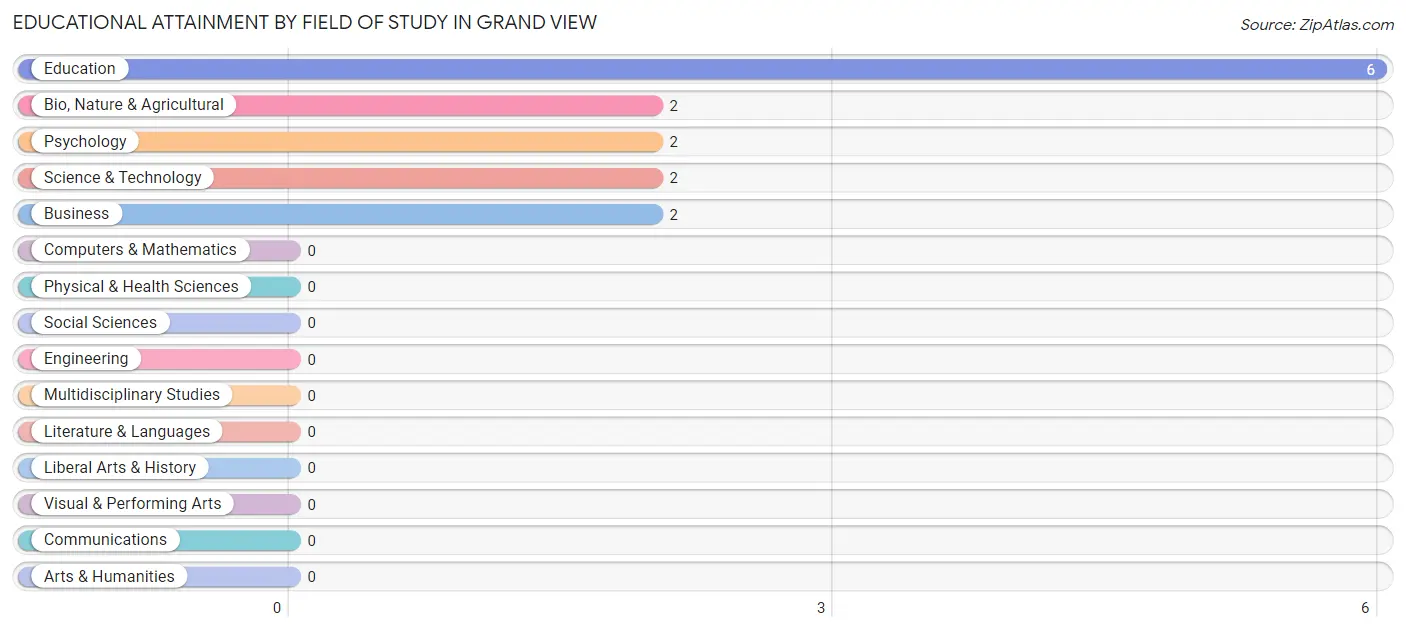
| Field of Study | # Graduates | % Graduates |
| Computers & Mathematics | 0 | 0.0% |
| Bio, Nature & Agricultural | 2 | 14.3% |
| Physical & Health Sciences | 0 | 0.0% |
| Psychology | 2 | 14.3% |
| Social Sciences | 0 | 0.0% |
| Engineering | 0 | 0.0% |
| Multidisciplinary Studies | 0 | 0.0% |
| Science & Technology | 2 | 14.3% |
| Business | 2 | 14.3% |
| Education | 6 | 42.9% |
| Literature & Languages | 0 | 0.0% |
| Liberal Arts & History | 0 | 0.0% |
| Visual & Performing Arts | 0 | 0.0% |
| Communications | 0 | 0.0% |
| Arts & Humanities | 0 | 0.0% |
| Total | 14 | 100.0% |
Transportation & Commute in Grand View
Vehicle Availability by Sex in Grand View
The most prevalent vehicle ownership categories in Grand View are males with 3 vehicles (7, accounting for 53.8%) and females with 3 vehicles (6, making up 36.8%).
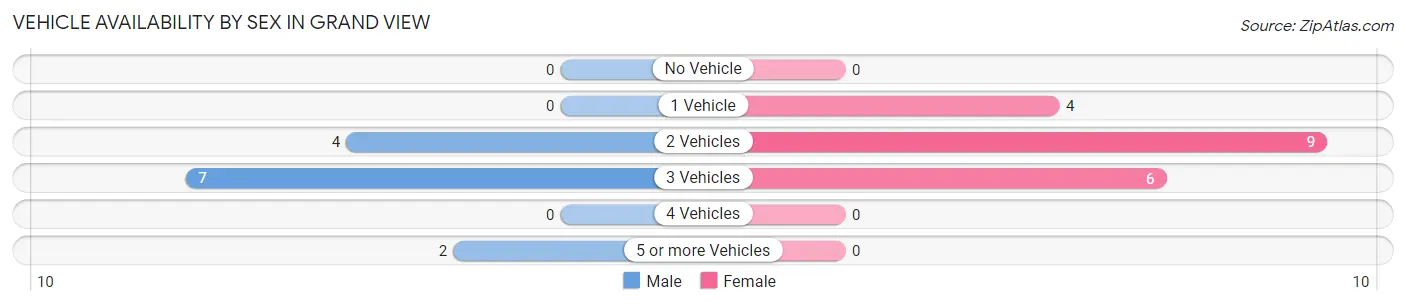
| Vehicles Available | Male | Female |
| No Vehicle | 0 (0.0%) | 0 (0.0%) |
| 1 Vehicle | 0 (0.0%) | 4 (21.0%) |
| 2 Vehicles | 4 (30.8%) | 9 (47.4%) |
| 3 Vehicles | 7 (53.8%) | 6 (31.6%) |
| 4 Vehicles | 0 (0.0%) | 0 (0.0%) |
| 5 or more Vehicles | 2 (15.4%) | 0 (0.0%) |
| Total | 13 (100.0%) | 19 (100.0%) |
Commute Time in Grand View
The most frequently occuring commute durations in Grand View are 30 to 34 minutes (14 commuters, 50.0%), 45 to 59 minutes (4 commuters, 14.3%), and 5 to 9 minutes (3 commuters, 10.7%).
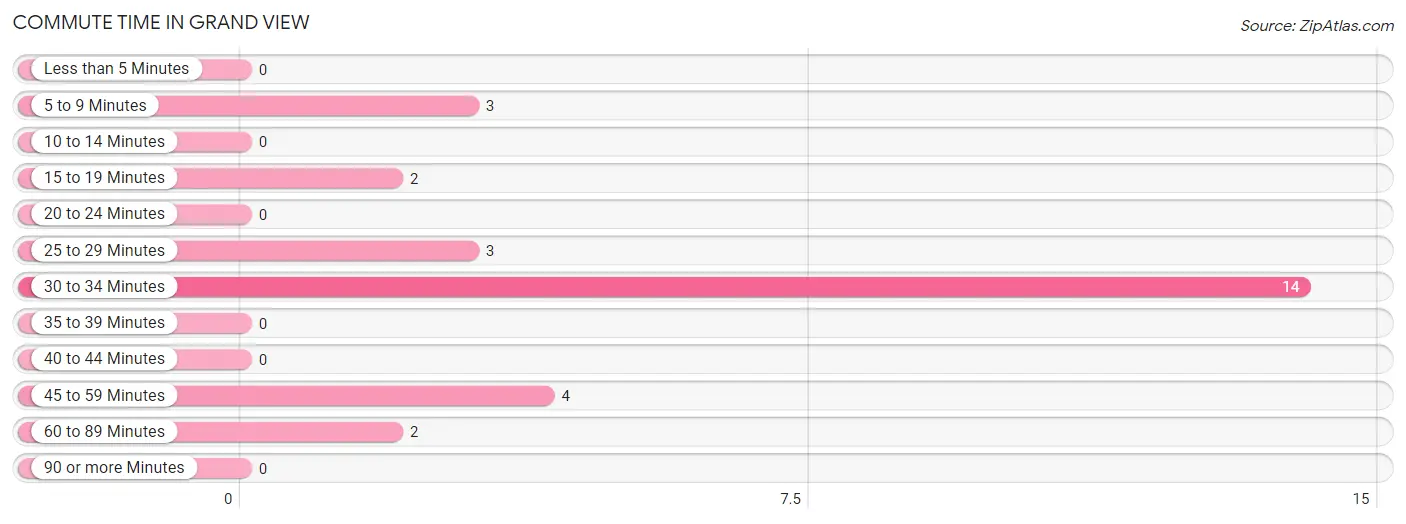
| Commute Time | # Commuters | % Commuters |
| Less than 5 Minutes | 0 | 0.0% |
| 5 to 9 Minutes | 3 | 10.7% |
| 10 to 14 Minutes | 0 | 0.0% |
| 15 to 19 Minutes | 2 | 7.1% |
| 20 to 24 Minutes | 0 | 0.0% |
| 25 to 29 Minutes | 3 | 10.7% |
| 30 to 34 Minutes | 14 | 50.0% |
| 35 to 39 Minutes | 0 | 0.0% |
| 40 to 44 Minutes | 0 | 0.0% |
| 45 to 59 Minutes | 4 | 14.3% |
| 60 to 89 Minutes | 2 | 7.1% |
| 90 or more Minutes | 0 | 0.0% |
Commute Time by Sex in Grand View
The most common commute times in Grand View are 30 to 34 minutes (5 commuters, 55.6%) for males and 30 to 34 minutes (9 commuters, 47.4%) for females.
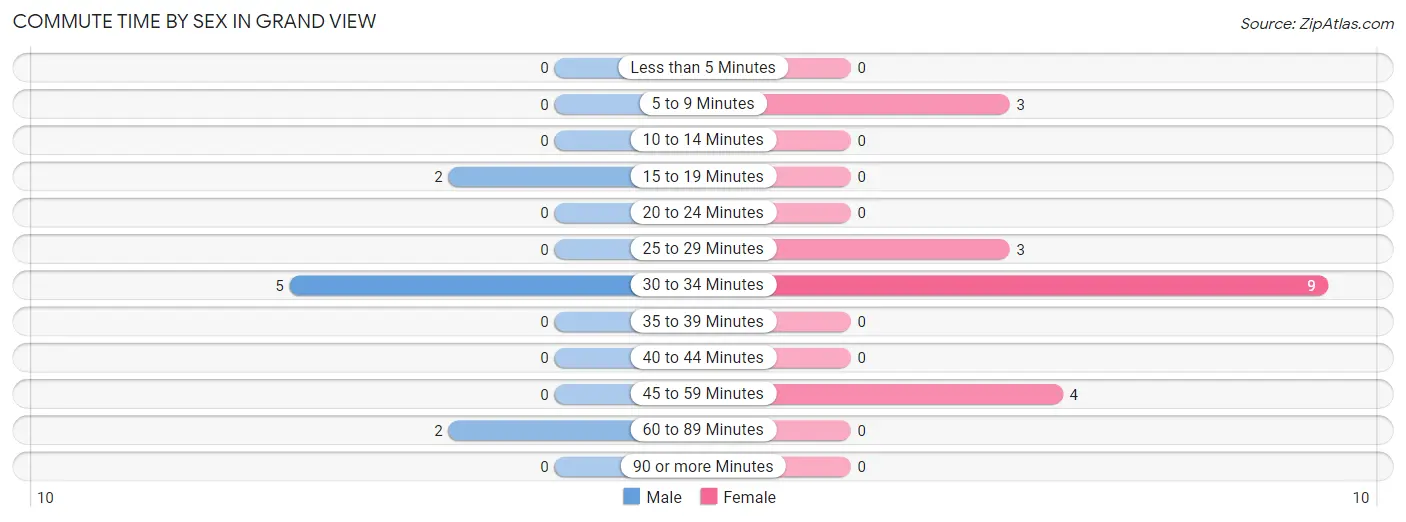
| Commute Time | Male | Female |
| Less than 5 Minutes | 0 (0.0%) | 0 (0.0%) |
| 5 to 9 Minutes | 0 (0.0%) | 3 (15.8%) |
| 10 to 14 Minutes | 0 (0.0%) | 0 (0.0%) |
| 15 to 19 Minutes | 2 (22.2%) | 0 (0.0%) |
| 20 to 24 Minutes | 0 (0.0%) | 0 (0.0%) |
| 25 to 29 Minutes | 0 (0.0%) | 3 (15.8%) |
| 30 to 34 Minutes | 5 (55.6%) | 9 (47.4%) |
| 35 to 39 Minutes | 0 (0.0%) | 0 (0.0%) |
| 40 to 44 Minutes | 0 (0.0%) | 0 (0.0%) |
| 45 to 59 Minutes | 0 (0.0%) | 4 (21.0%) |
| 60 to 89 Minutes | 2 (22.2%) | 0 (0.0%) |
| 90 or more Minutes | 0 (0.0%) | 0 (0.0%) |
Time of Departure to Work by Sex in Grand View
The most frequent times of departure to work in Grand View are 12:00 PM to 3:59 PM (3, 33.3%) for males and 7:00 AM to 7:29 AM (8, 42.1%) for females.
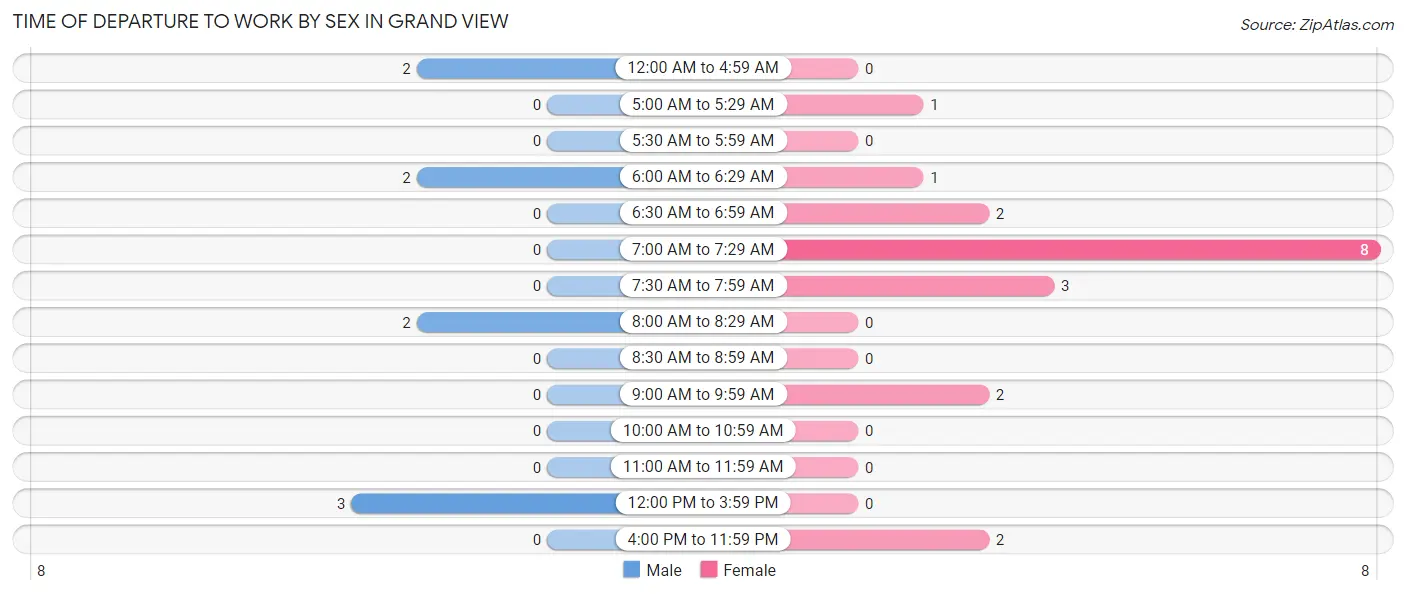
| Time of Departure | Male | Female |
| 12:00 AM to 4:59 AM | 2 (22.2%) | 0 (0.0%) |
| 5:00 AM to 5:29 AM | 0 (0.0%) | 1 (5.3%) |
| 5:30 AM to 5:59 AM | 0 (0.0%) | 0 (0.0%) |
| 6:00 AM to 6:29 AM | 2 (22.2%) | 1 (5.3%) |
| 6:30 AM to 6:59 AM | 0 (0.0%) | 2 (10.5%) |
| 7:00 AM to 7:29 AM | 0 (0.0%) | 8 (42.1%) |
| 7:30 AM to 7:59 AM | 0 (0.0%) | 3 (15.8%) |
| 8:00 AM to 8:29 AM | 2 (22.2%) | 0 (0.0%) |
| 8:30 AM to 8:59 AM | 0 (0.0%) | 0 (0.0%) |
| 9:00 AM to 9:59 AM | 0 (0.0%) | 2 (10.5%) |
| 10:00 AM to 10:59 AM | 0 (0.0%) | 0 (0.0%) |
| 11:00 AM to 11:59 AM | 0 (0.0%) | 0 (0.0%) |
| 12:00 PM to 3:59 PM | 3 (33.3%) | 0 (0.0%) |
| 4:00 PM to 11:59 PM | 0 (0.0%) | 2 (10.5%) |
| Total | 9 (100.0%) | 19 (100.0%) |
Housing Occupancy in Grand View
Occupancy by Ownership in Grand View
Of the total 54 dwellings in Grand View, owner-occupied units account for 52 (96.3%), while renter-occupied units make up 2 (3.7%).
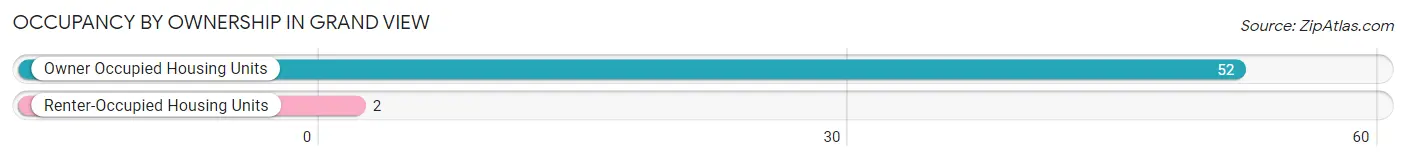
| Occupancy | # Housing Units | % Housing Units |
| Owner Occupied Housing Units | 52 | 96.3% |
| Renter-Occupied Housing Units | 2 | 3.7% |
| Total Occupied Housing Units | 54 | 100.0% |
Occupancy by Household Size in Grand View
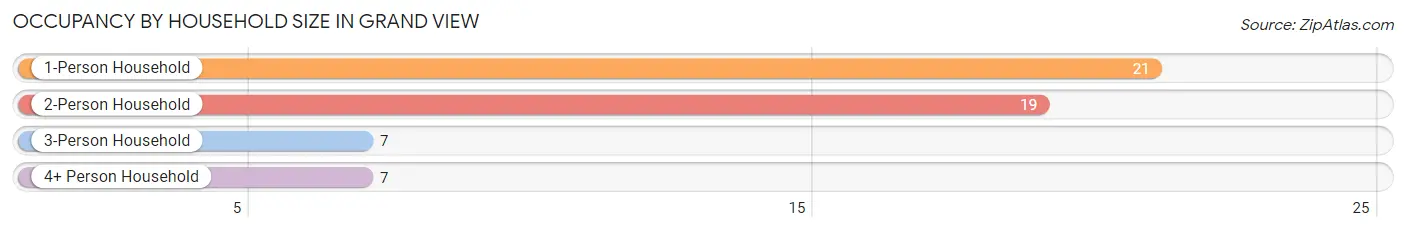
| Household Size | # Housing Units | % Housing Units |
| 1-Person Household | 21 | 38.9% |
| 2-Person Household | 19 | 35.2% |
| 3-Person Household | 7 | 13.0% |
| 4+ Person Household | 7 | 13.0% |
| Total Housing Units | 54 | 100.0% |
Occupancy by Ownership by Household Size in Grand View
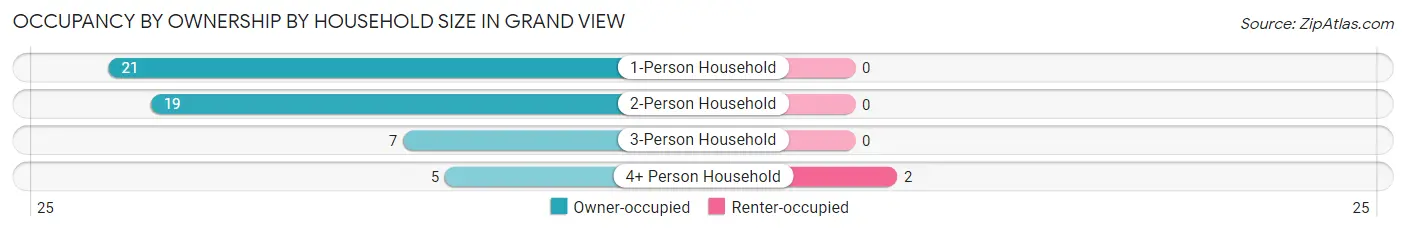
| Household Size | Owner-occupied | Renter-occupied |
| 1-Person Household | 21 (100.0%) | 0 (0.0%) |
| 2-Person Household | 19 (100.0%) | 0 (0.0%) |
| 3-Person Household | 7 (100.0%) | 0 (0.0%) |
| 4+ Person Household | 5 (71.4%) | 2 (28.6%) |
| Total Housing Units | 52 (96.3%) | 2 (3.7%) |
Occupancy by Educational Attainment in Grand View
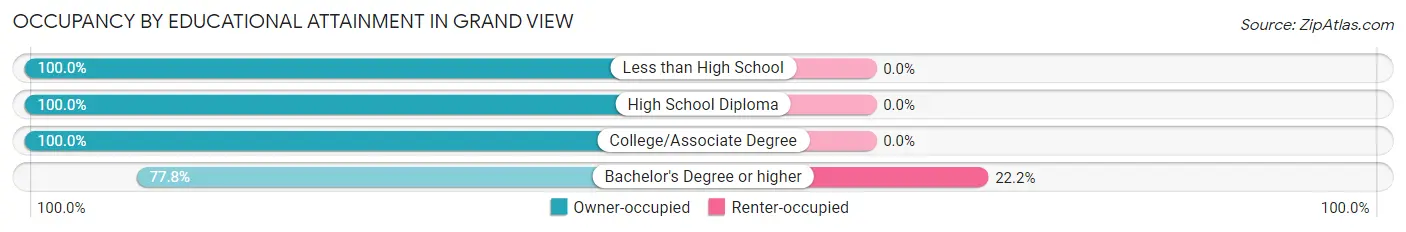
| Household Size | Owner-occupied | Renter-occupied |
| Less than High School | 7 (100.0%) | 0 (0.0%) |
| High School Diploma | 11 (100.0%) | 0 (0.0%) |
| College/Associate Degree | 27 (100.0%) | 0 (0.0%) |
| Bachelor's Degree or higher | 7 (77.8%) | 2 (22.2%) |
Occupancy by Age of Householder in Grand View
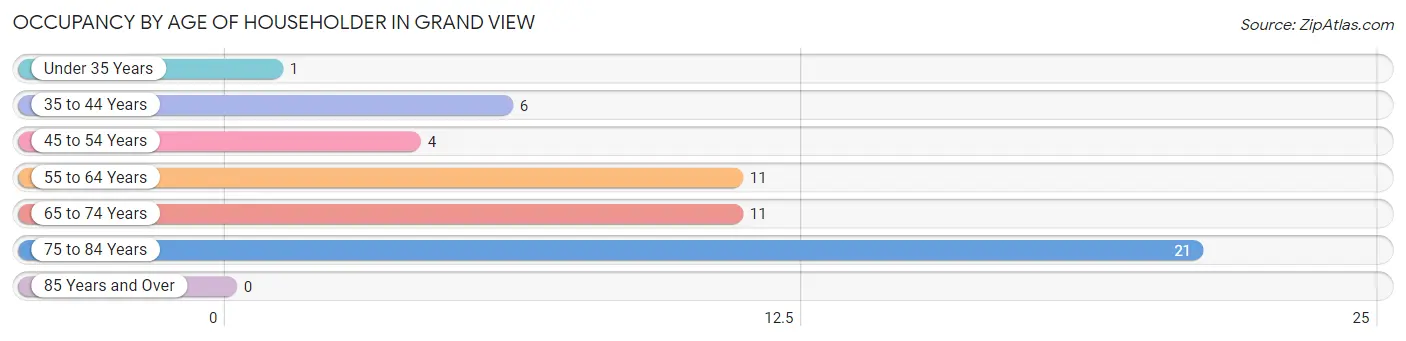
| Age Bracket | # Households | % Households |
| Under 35 Years | 1 | 1.8% |
| 35 to 44 Years | 6 | 11.1% |
| 45 to 54 Years | 4 | 7.4% |
| 55 to 64 Years | 11 | 20.4% |
| 65 to 74 Years | 11 | 20.4% |
| 75 to 84 Years | 21 | 38.9% |
| 85 Years and Over | 0 | 0.0% |
| Total | 54 | 100.0% |
Housing Finances in Grand View
Median Income by Occupancy in Grand View
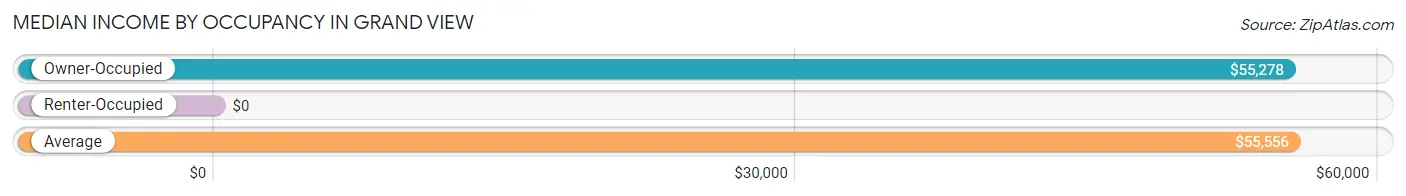
| Occupancy Type | # Households | Median Income |
| Owner-Occupied | 52 (96.3%) | $55,278 |
| Renter-Occupied | 2 (3.7%) | $0 |
| Average | 54 (100.0%) | $55,556 |
Occupancy by Householder Income Bracket in Grand View
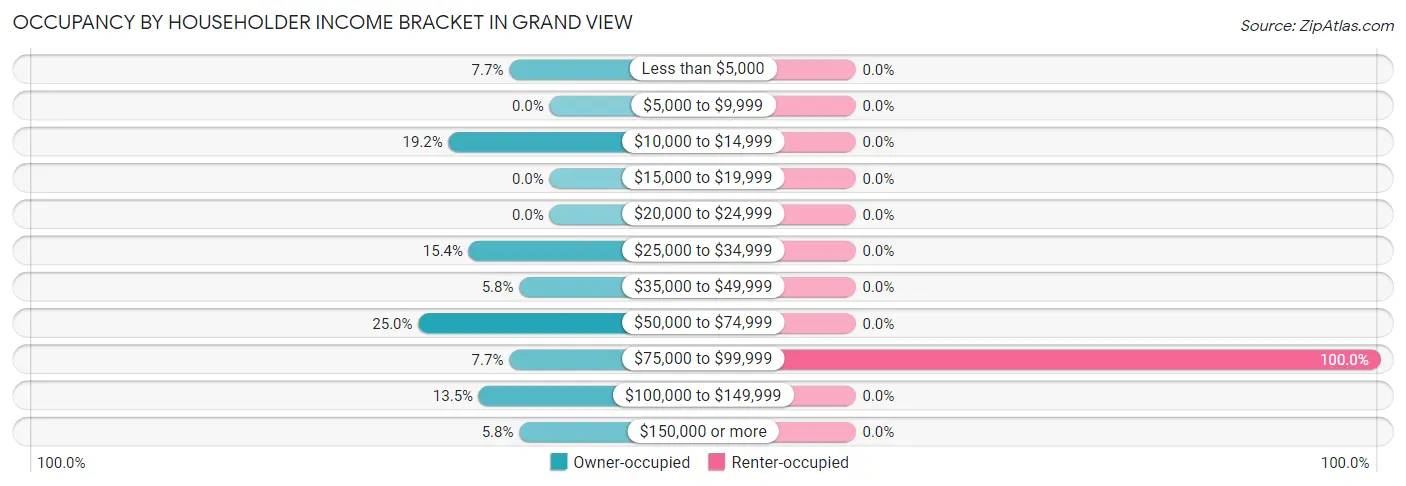
| Income Bracket | Owner-occupied | Renter-occupied |
| Less than $5,000 | 4 (7.7%) | 0 (0.0%) |
| $5,000 to $9,999 | 0 (0.0%) | 0 (0.0%) |
| $10,000 to $14,999 | 10 (19.2%) | 0 (0.0%) |
| $15,000 to $19,999 | 0 (0.0%) | 0 (0.0%) |
| $20,000 to $24,999 | 0 (0.0%) | 0 (0.0%) |
| $25,000 to $34,999 | 8 (15.4%) | 0 (0.0%) |
| $35,000 to $49,999 | 3 (5.8%) | 0 (0.0%) |
| $50,000 to $74,999 | 13 (25.0%) | 0 (0.0%) |
| $75,000 to $99,999 | 4 (7.7%) | 2 (100.0%) |
| $100,000 to $149,999 | 7 (13.5%) | 0 (0.0%) |
| $150,000 or more | 3 (5.8%) | 0 (0.0%) |
| Total | 52 (100.0%) | 2 (100.0%) |
Monthly Housing Cost Tiers in Grand View
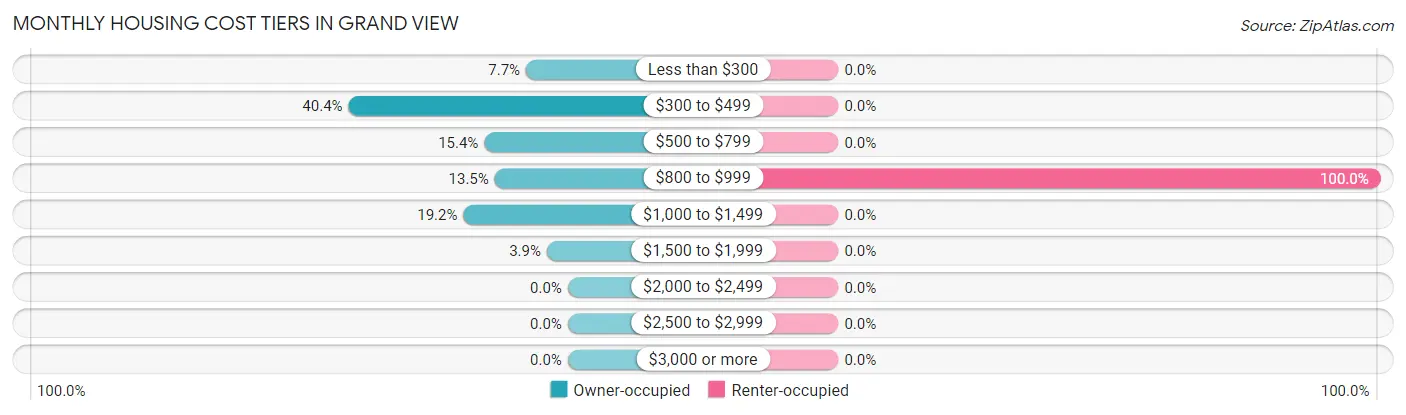
| Monthly Cost | Owner-occupied | Renter-occupied |
| Less than $300 | 4 (7.7%) | 0 (0.0%) |
| $300 to $499 | 21 (40.4%) | 0 (0.0%) |
| $500 to $799 | 8 (15.4%) | 0 (0.0%) |
| $800 to $999 | 7 (13.5%) | 2 (100.0%) |
| $1,000 to $1,499 | 10 (19.2%) | 0 (0.0%) |
| $1,500 to $1,999 | 2 (3.8%) | 0 (0.0%) |
| $2,000 to $2,499 | 0 (0.0%) | 0 (0.0%) |
| $2,500 to $2,999 | 0 (0.0%) | 0 (0.0%) |
| $3,000 or more | 0 (0.0%) | 0 (0.0%) |
| Total | 52 (100.0%) | 2 (100.0%) |
Physical Housing Characteristics in Grand View
Housing Structures in Grand View
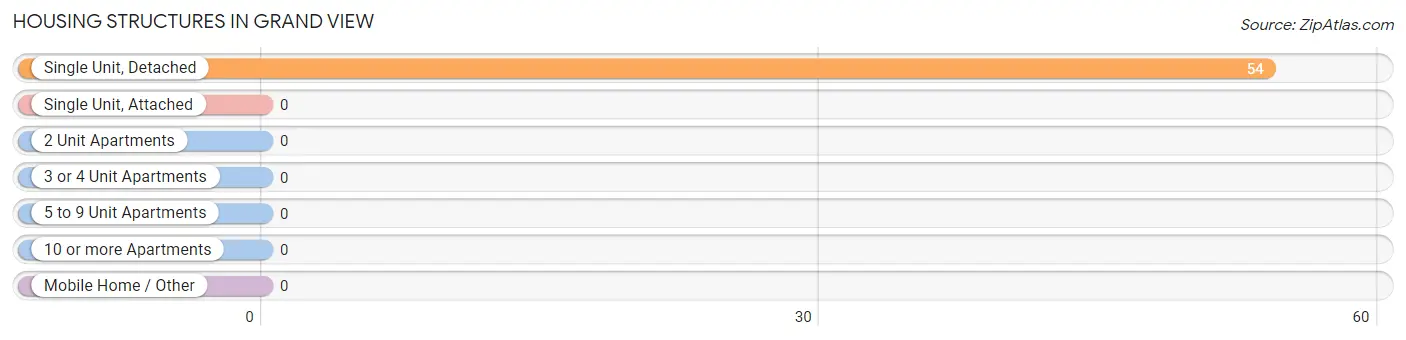
| Structure Type | # Housing Units | % Housing Units |
| Single Unit, Detached | 54 | 100.0% |
| Single Unit, Attached | 0 | 0.0% |
| 2 Unit Apartments | 0 | 0.0% |
| 3 or 4 Unit Apartments | 0 | 0.0% |
| 5 to 9 Unit Apartments | 0 | 0.0% |
| 10 or more Apartments | 0 | 0.0% |
| Mobile Home / Other | 0 | 0.0% |
| Total | 54 | 100.0% |
Housing Structures by Occupancy in Grand View
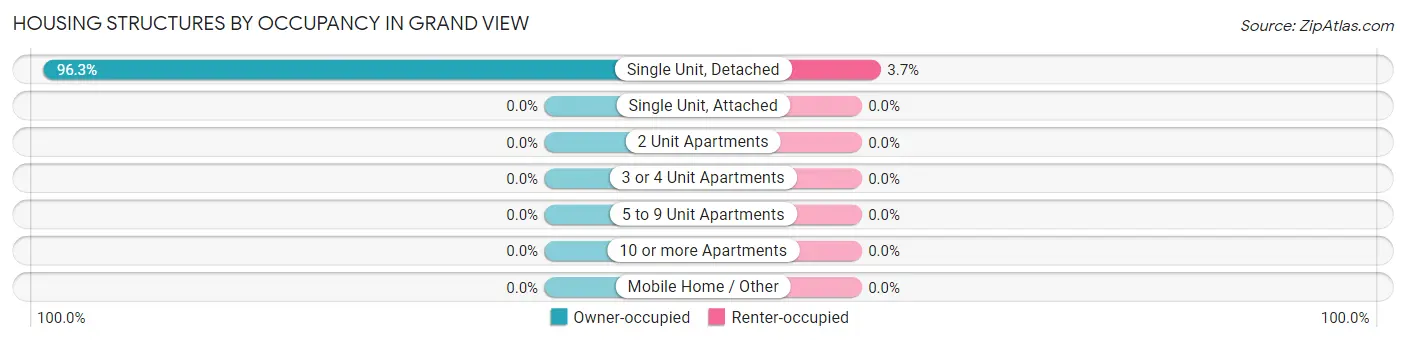
| Structure Type | Owner-occupied | Renter-occupied |
| Single Unit, Detached | 52 (96.3%) | 2 (3.7%) |
| Single Unit, Attached | 0 (0.0%) | 0 (0.0%) |
| 2 Unit Apartments | 0 (0.0%) | 0 (0.0%) |
| 3 or 4 Unit Apartments | 0 (0.0%) | 0 (0.0%) |
| 5 to 9 Unit Apartments | 0 (0.0%) | 0 (0.0%) |
| 10 or more Apartments | 0 (0.0%) | 0 (0.0%) |
| Mobile Home / Other | 0 (0.0%) | 0 (0.0%) |
| Total | 52 (96.3%) | 2 (3.7%) |
Housing Structures by Number of Rooms in Grand View
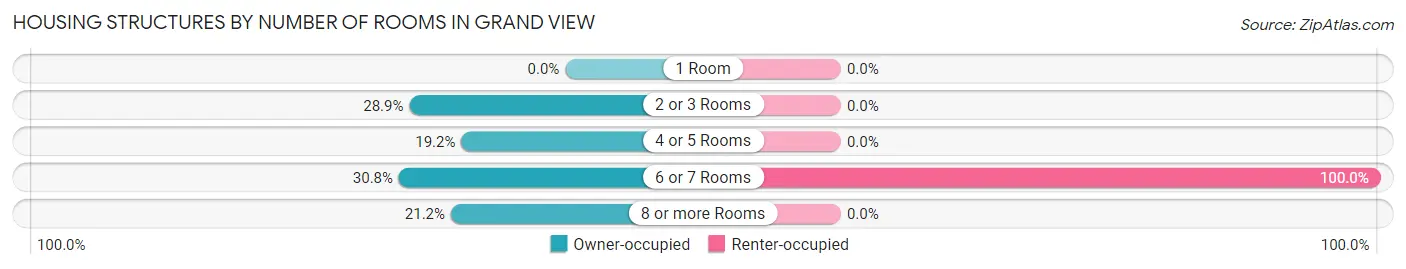
| Number of Rooms | Owner-occupied | Renter-occupied |
| 1 Room | 0 (0.0%) | 0 (0.0%) |
| 2 or 3 Rooms | 15 (28.8%) | 0 (0.0%) |
| 4 or 5 Rooms | 10 (19.2%) | 0 (0.0%) |
| 6 or 7 Rooms | 16 (30.8%) | 2 (100.0%) |
| 8 or more Rooms | 11 (21.1%) | 0 (0.0%) |
| Total | 52 (100.0%) | 2 (100.0%) |
Housing Structure by Heating Type in Grand View
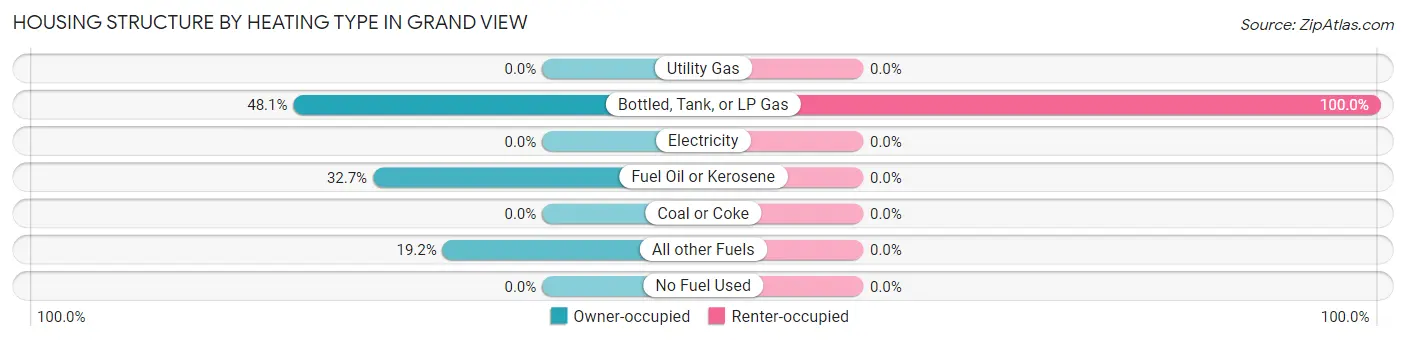
| Heating Type | Owner-occupied | Renter-occupied |
| Utility Gas | 0 (0.0%) | 0 (0.0%) |
| Bottled, Tank, or LP Gas | 25 (48.1%) | 2 (100.0%) |
| Electricity | 0 (0.0%) | 0 (0.0%) |
| Fuel Oil or Kerosene | 17 (32.7%) | 0 (0.0%) |
| Coal or Coke | 0 (0.0%) | 0 (0.0%) |
| All other Fuels | 10 (19.2%) | 0 (0.0%) |
| No Fuel Used | 0 (0.0%) | 0 (0.0%) |
| Total | 52 (100.0%) | 2 (100.0%) |
Household Vehicle Usage in Grand View
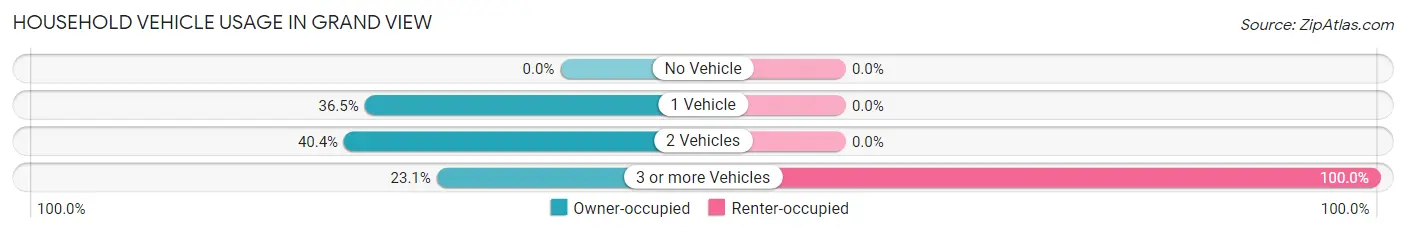
| Vehicles per Household | Owner-occupied | Renter-occupied |
| No Vehicle | 0 (0.0%) | 0 (0.0%) |
| 1 Vehicle | 19 (36.5%) | 0 (0.0%) |
| 2 Vehicles | 21 (40.4%) | 0 (0.0%) |
| 3 or more Vehicles | 12 (23.1%) | 2 (100.0%) |
| Total | 52 (100.0%) | 2 (100.0%) |
Real Estate & Mortgages in Grand View
Real Estate and Mortgage Overview in Grand View
| Characteristic | Without Mortgage | With Mortgage |
| Housing Units | 27 | 25 |
| Median Property Value | - | - |
| Median Household Income | $55,179 | $0 |
| Monthly Housing Costs | $375 | $0 |
| Real Estate Taxes | $950 | $0 |
Property Value by Mortgage Status in Grand View
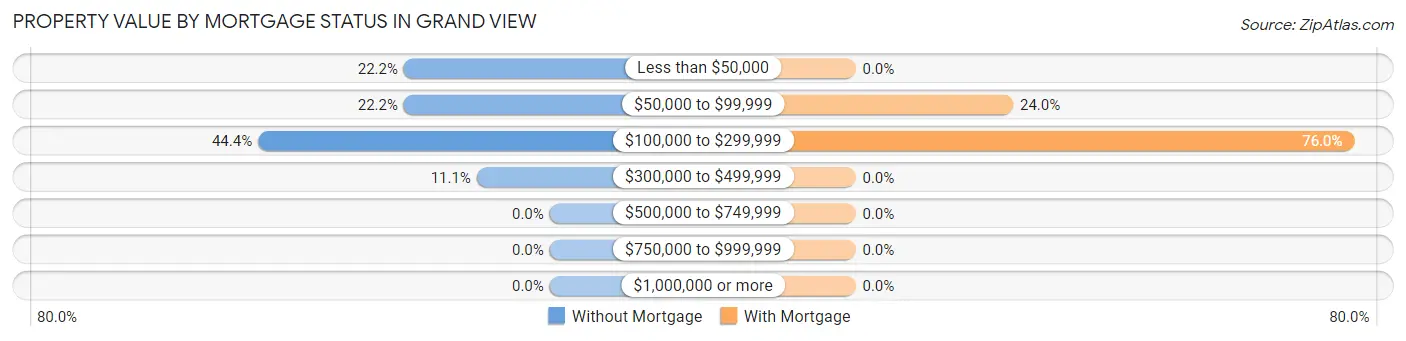
| Property Value | Without Mortgage | With Mortgage |
| Less than $50,000 | 6 (22.2%) | 0 (0.0%) |
| $50,000 to $99,999 | 6 (22.2%) | 6 (24.0%) |
| $100,000 to $299,999 | 12 (44.4%) | 19 (76.0%) |
| $300,000 to $499,999 | 3 (11.1%) | 0 (0.0%) |
| $500,000 to $749,999 | 0 (0.0%) | 0 (0.0%) |
| $750,000 to $999,999 | 0 (0.0%) | 0 (0.0%) |
| $1,000,000 or more | 0 (0.0%) | 0 (0.0%) |
| Total | 27 (100.0%) | 25 (100.0%) |
Household Income by Mortgage Status in Grand View
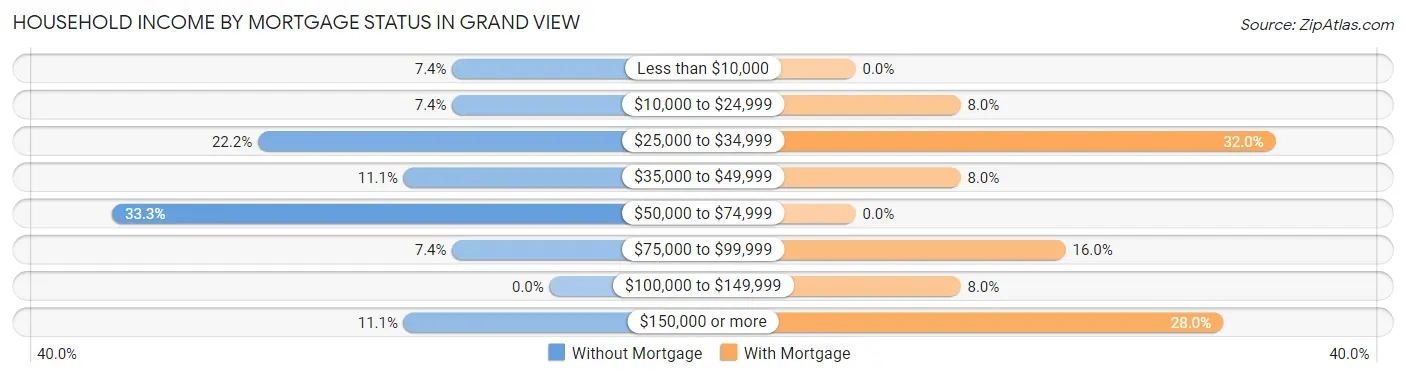
| Household Income | Without Mortgage | With Mortgage |
| Less than $10,000 | 2 (7.4%) | 0 (0.0%) |
| $10,000 to $24,999 | 2 (7.4%) | 2 (8.0%) |
| $25,000 to $34,999 | 6 (22.2%) | 8 (32.0%) |
| $35,000 to $49,999 | 3 (11.1%) | 2 (8.0%) |
| $50,000 to $74,999 | 9 (33.3%) | 0 (0.0%) |
| $75,000 to $99,999 | 2 (7.4%) | 4 (16.0%) |
| $100,000 to $149,999 | 0 (0.0%) | 2 (8.0%) |
| $150,000 or more | 3 (11.1%) | 7 (28.0%) |
| Total | 27 (100.0%) | 25 (100.0%) |
Property Value to Household Income Ratio in Grand View
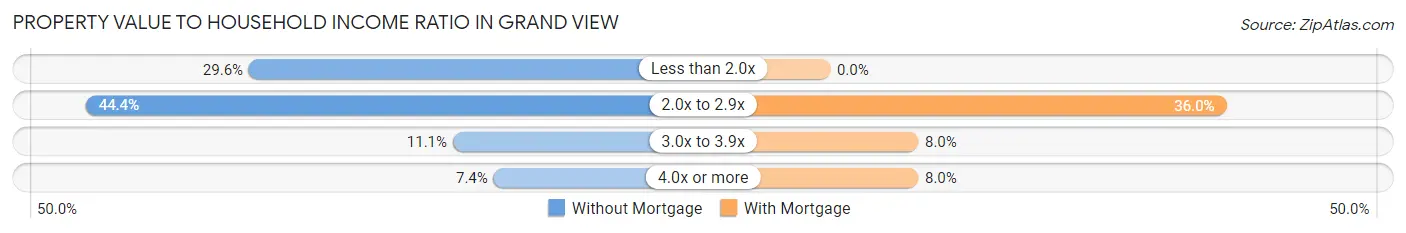
| Value-to-Income Ratio | Without Mortgage | With Mortgage |
| Less than 2.0x | 8 (29.6%) | 0 (0.0%) |
| 2.0x to 2.9x | 12 (44.4%) | 9 (36.0%) |
| 3.0x to 3.9x | 3 (11.1%) | 2 (8.0%) |
| 4.0x or more | 2 (7.4%) | 2 (8.0%) |
| Total | 27 (100.0%) | 25 (100.0%) |
Real Estate Taxes by Mortgage Status in Grand View
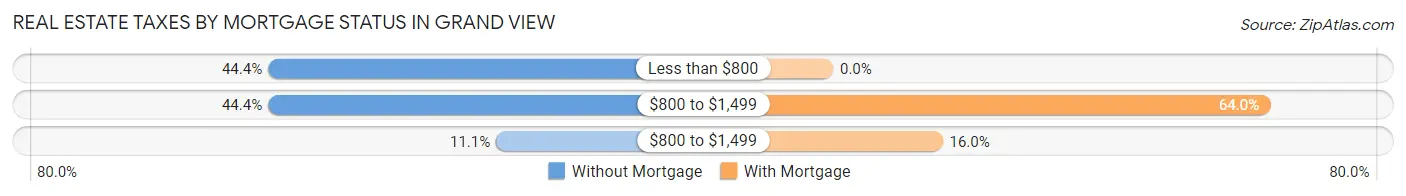
| Property Taxes | Without Mortgage | With Mortgage |
| Less than $800 | 12 (44.4%) | 0 (0.0%) |
| $800 to $1,499 | 12 (44.4%) | 16 (64.0%) |
| $800 to $1,499 | 3 (11.1%) | 4 (16.0%) |
| Total | 27 (100.0%) | 25 (100.0%) |
Health & Disability in Grand View
Health Insurance Coverage by Age in Grand View
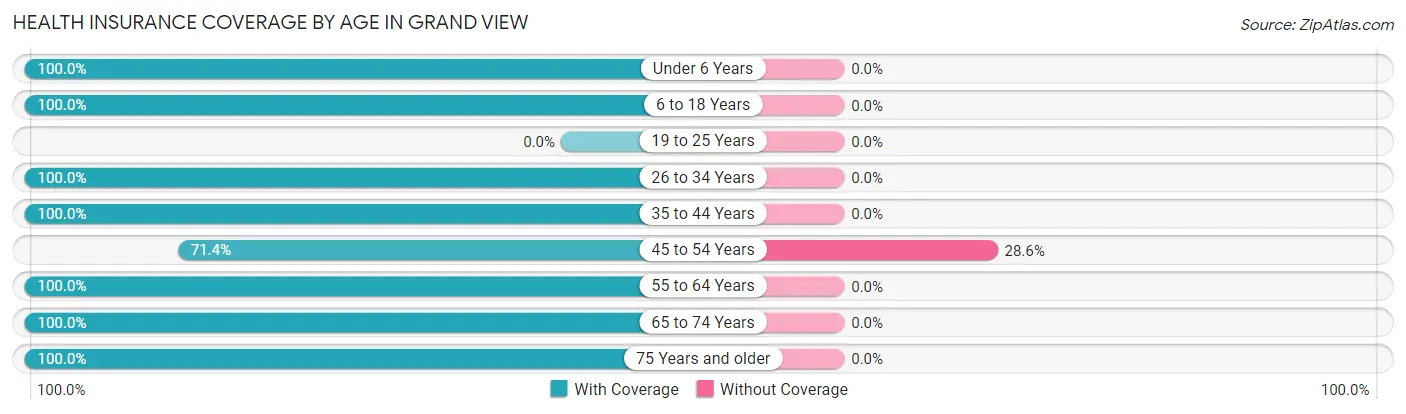
| Age Bracket | With Coverage | Without Coverage |
| Under 6 Years | 2 (100.0%) | 0 (0.0%) |
| 6 to 18 Years | 13 (100.0%) | 0 (0.0%) |
| 19 to 25 Years | 0 (0.0%) | 0 (0.0%) |
| 26 to 34 Years | 3 (100.0%) | 0 (0.0%) |
| 35 to 44 Years | 9 (100.0%) | 0 (0.0%) |
| 45 to 54 Years | 10 (71.4%) | 4 (28.6%) |
| 55 to 64 Years | 14 (100.0%) | 0 (0.0%) |
| 65 to 74 Years | 17 (100.0%) | 0 (0.0%) |
| 75 Years and older | 30 (100.0%) | 0 (0.0%) |
| Total | 98 (96.1%) | 4 (3.9%) |
Health Insurance Coverage by Citizenship Status in Grand View

| Citizenship Status | With Coverage | Without Coverage |
| Native Born | 2 (100.0%) | 0 (0.0%) |
| Foreign Born, Citizen | 13 (100.0%) | 0 (0.0%) |
| Foreign Born, not a Citizen | 0 (0.0%) | 0 (0.0%) |
Health Insurance Coverage by Household Income in Grand View
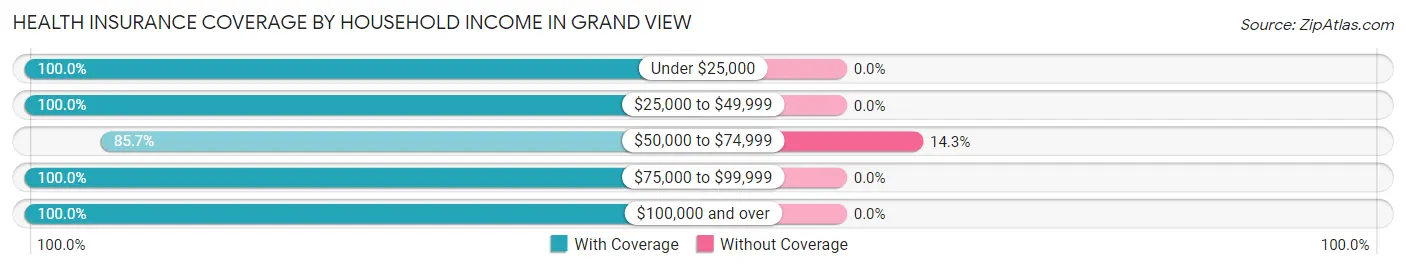
| Household Income | With Coverage | Without Coverage |
| Under $25,000 | 14 (100.0%) | 0 (0.0%) |
| $25,000 to $49,999 | 21 (100.0%) | 0 (0.0%) |
| $50,000 to $74,999 | 24 (85.7%) | 4 (14.3%) |
| $75,000 to $99,999 | 17 (100.0%) | 0 (0.0%) |
| $100,000 and over | 22 (100.0%) | 0 (0.0%) |
Public vs Private Health Insurance Coverage by Age in Grand View
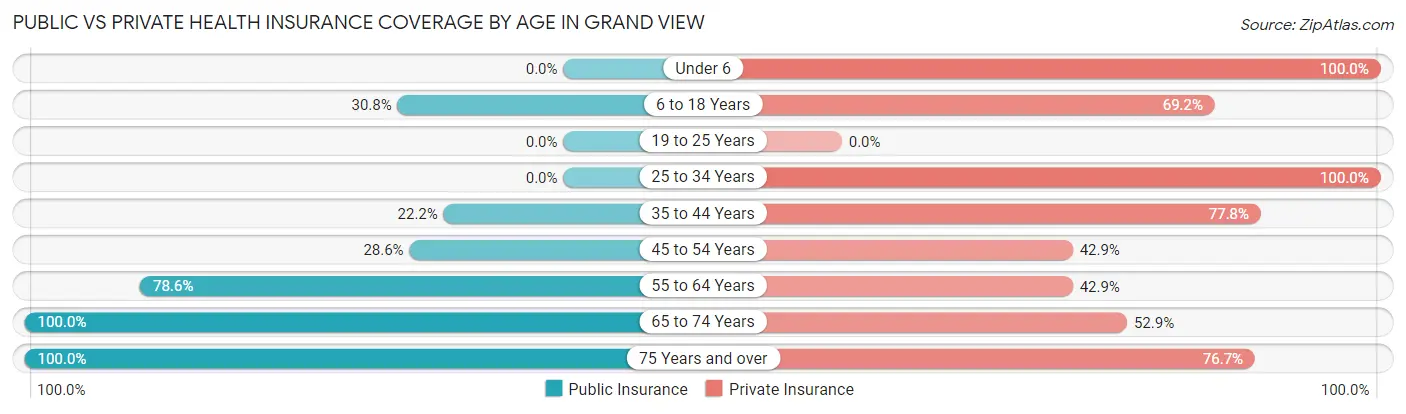
| Age Bracket | Public Insurance | Private Insurance |
| Under 6 | 0 (0.0%) | 2 (100.0%) |
| 6 to 18 Years | 4 (30.8%) | 9 (69.2%) |
| 19 to 25 Years | 0 (0.0%) | 0 (0.0%) |
| 25 to 34 Years | 0 (0.0%) | 3 (100.0%) |
| 35 to 44 Years | 2 (22.2%) | 7 (77.8%) |
| 45 to 54 Years | 4 (28.6%) | 6 (42.9%) |
| 55 to 64 Years | 11 (78.6%) | 6 (42.9%) |
| 65 to 74 Years | 17 (100.0%) | 9 (52.9%) |
| 75 Years and over | 30 (100.0%) | 23 (76.7%) |
| Total | 68 (66.7%) | 65 (63.7%) |
Disability Status by Sex by Age in Grand View
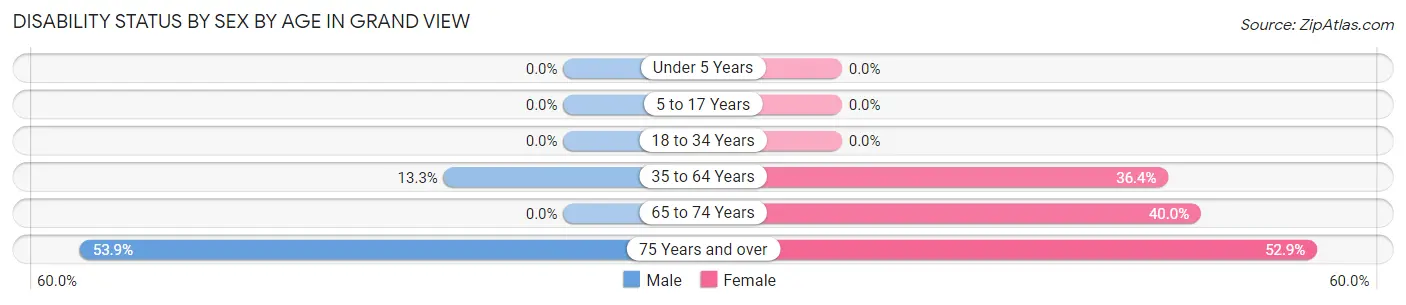
| Age Bracket | Male | Female |
| Under 5 Years | 0 (0.0%) | 0 (0.0%) |
| 5 to 17 Years | 0 (0.0%) | 0 (0.0%) |
| 18 to 34 Years | 0 (0.0%) | 0 (0.0%) |
| 35 to 64 Years | 2 (13.3%) | 8 (36.4%) |
| 65 to 74 Years | 0 (0.0%) | 4 (40.0%) |
| 75 Years and over | 7 (53.8%) | 9 (52.9%) |
Disability Class by Sex by Age in Grand View
Disability Class: Hearing Difficulty
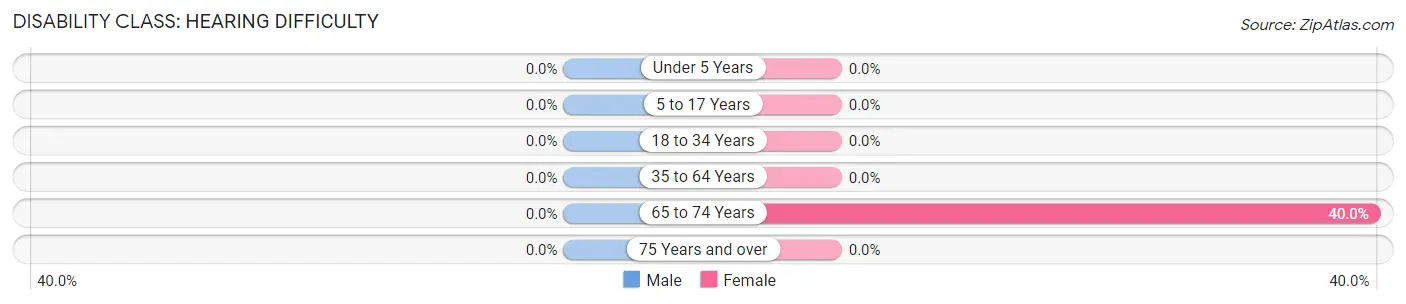
| Age Bracket | Male | Female |
| Under 5 Years | 0 (0.0%) | 0 (0.0%) |
| 5 to 17 Years | 0 (0.0%) | 0 (0.0%) |
| 18 to 34 Years | 0 (0.0%) | 0 (0.0%) |
| 35 to 64 Years | 0 (0.0%) | 0 (0.0%) |
| 65 to 74 Years | 0 (0.0%) | 4 (40.0%) |
| 75 Years and over | 0 (0.0%) | 0 (0.0%) |
Disability Class: Vision Difficulty
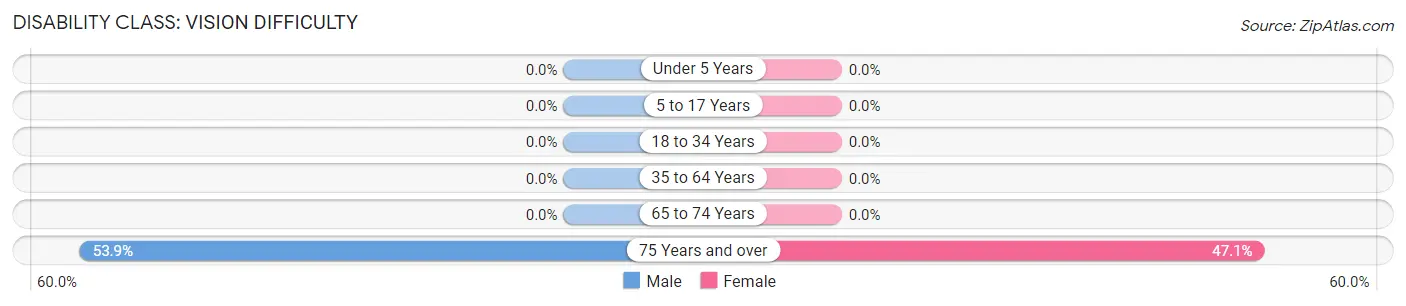
| Age Bracket | Male | Female |
| Under 5 Years | 0 (0.0%) | 0 (0.0%) |
| 5 to 17 Years | 0 (0.0%) | 0 (0.0%) |
| 18 to 34 Years | 0 (0.0%) | 0 (0.0%) |
| 35 to 64 Years | 0 (0.0%) | 0 (0.0%) |
| 65 to 74 Years | 0 (0.0%) | 0 (0.0%) |
| 75 Years and over | 7 (53.8%) | 8 (47.1%) |
Disability Class: Cognitive Difficulty
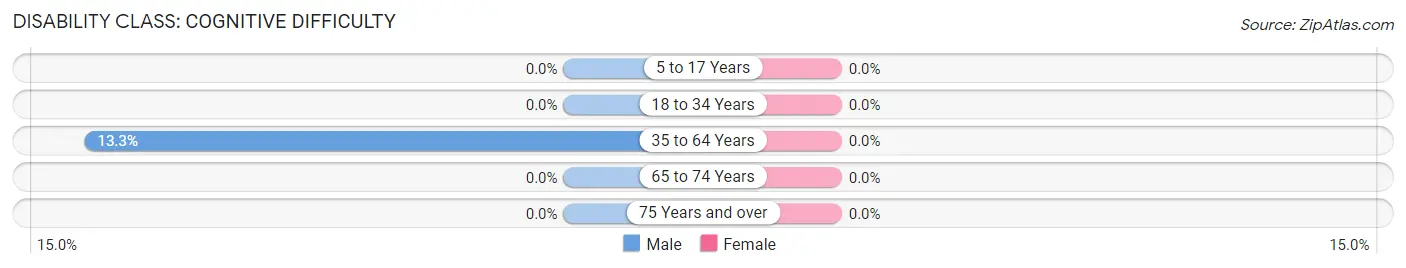
| Age Bracket | Male | Female |
| 5 to 17 Years | 0 (0.0%) | 0 (0.0%) |
| 18 to 34 Years | 0 (0.0%) | 0 (0.0%) |
| 35 to 64 Years | 2 (13.3%) | 0 (0.0%) |
| 65 to 74 Years | 0 (0.0%) | 0 (0.0%) |
| 75 Years and over | 0 (0.0%) | 0 (0.0%) |
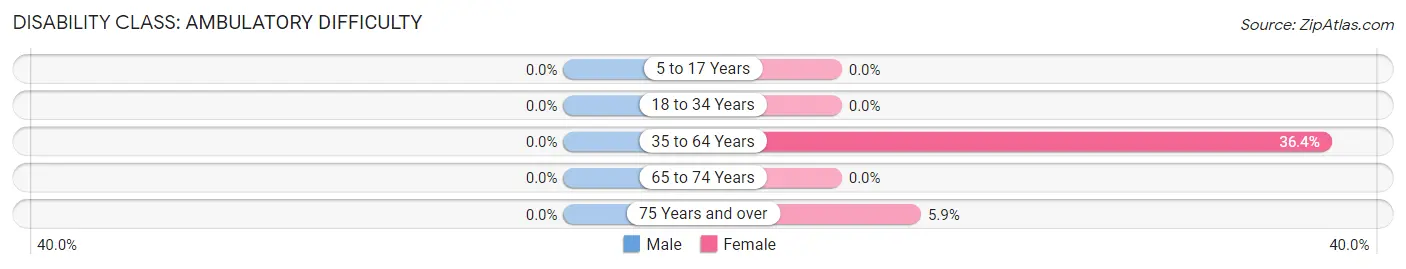
Disability Class: Ambulatory Difficulty
| Age Bracket | Male | Female |
| 5 to 17 Years | 0 (0.0%) | 0 (0.0%) |
| 18 to 34 Years | 0 (0.0%) | 0 (0.0%) |
| 35 to 64 Years | 0 (0.0%) | 8 (36.4%) |
| 65 to 74 Years | 0 (0.0%) | 0 (0.0%) |
| 75 Years and over | 0 (0.0%) | 1 (5.9%) |
Disability Class: Self-Care Difficulty
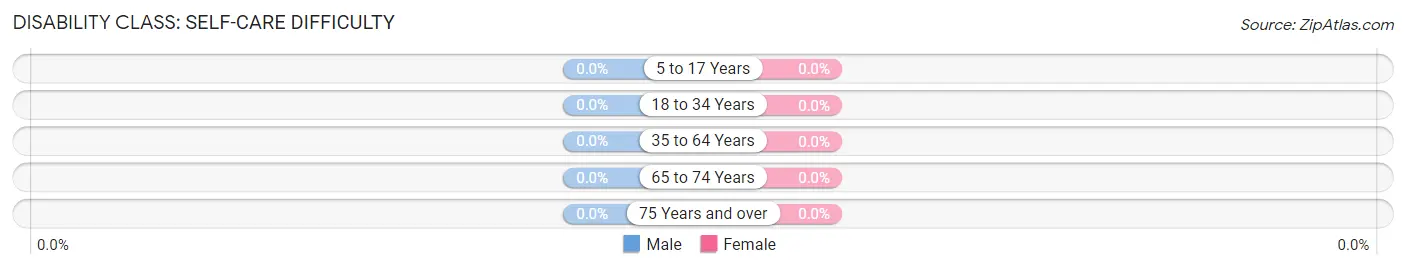
| Age Bracket | Male | Female |
| 5 to 17 Years | 0 (0.0%) | 0 (0.0%) |
| 18 to 34 Years | 0 (0.0%) | 0 (0.0%) |
| 35 to 64 Years | 0 (0.0%) | 0 (0.0%) |
| 65 to 74 Years | 0 (0.0%) | 0 (0.0%) |
| 75 Years and over | 0 (0.0%) | 0 (0.0%) |
Technology Access in Grand View
Computing Device Access in Grand View
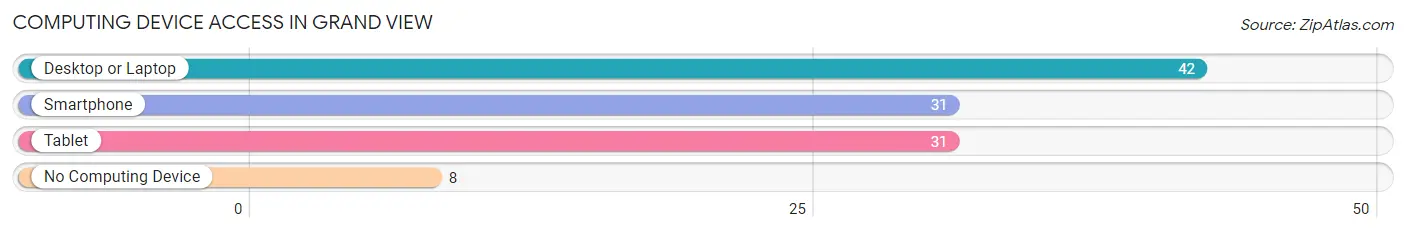
| Device Type | # Households | % Households |
| Desktop or Laptop | 42 | 77.8% |
| Smartphone | 31 | 57.4% |
| Tablet | 31 | 57.4% |
| No Computing Device | 8 | 14.8% |
| Total | 54 | 100.0% |
Internet Access in Grand View
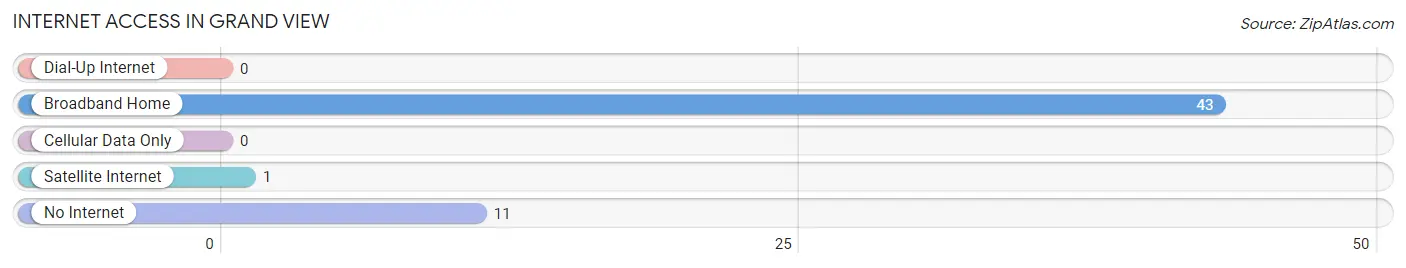
| Internet Type | # Households | % Households |
| Dial-Up Internet | 0 | 0.0% |
| Broadband Home | 43 | 79.6% |
| Cellular Data Only | 0 | 0.0% |
| Satellite Internet | 1 | 1.8% |
| No Internet | 11 | 20.4% |
| Total | 54 | 100.0% |
Grand View Summary
Grand View, Wisconsin is a small village located in the northwest corner of Washburn County, Wisconsin. It is situated on the banks of the Chippewa River, and is surrounded by the towns of Minong, Spooner, and Shell Lake. The village has a population of approximately 1,000 people, and is a popular destination for outdoor recreation and tourism.
History
Grand View was first settled in the late 1800s by a group of Norwegian immigrants. The village was originally known as “Grand View Settlement”, and was named for the beautiful views of the Chippewa River and surrounding countryside. The first post office was established in 1891, and the village was officially incorporated in 1895.
In the early 1900s, Grand View was a thriving logging and farming community. The village was home to several sawmills, a grist mill, and a creamery. The village also had a general store, a blacksmith shop, and a hotel.
In the 1950s, the village began to decline as the logging industry moved away from the area. The village was revitalized in the 1970s when it became a popular destination for outdoor recreation and tourism. Today, Grand View is a popular destination for fishing, camping, and boating.
Geography
Grand View is located in the northwest corner of Washburn County, Wisconsin. It is situated on the banks of the Chippewa River, and is surrounded by the towns of Minong, Spooner, and Shell Lake. The village has a total area of 0.8 square miles, all of which is land.
The village is located in a heavily forested area, and is home to a variety of wildlife. The Chippewa River is a popular destination for fishing, boating, and canoeing. The village is also home to several parks, including Grand View Park, which offers a variety of outdoor activities.
Economy
The economy of Grand View is largely based on tourism and outdoor recreation. The village is home to several resorts and campgrounds, which attract visitors from all over the region. The village is also home to several restaurants, bars, and shops, which cater to the needs of visitors and locals alike.
The village is also home to several small businesses, including a lumber yard, a hardware store, and a grocery store. The village is also home to a post office, a bank, and a library.
Demographics
As of the 2010 census, the population of Grand View was 1,000 people. The racial makeup of the village was 97.2% White, 0.7% African American, 0.3% Native American, 0.3% Asian, 0.1% Pacific Islander, and 1.5% from other races. Hispanic or Latino of any race were 1.5% of the population.
The median household income in Grand View was $41,250, and the median family income was $48,750. The per capita income for the village was $20,945. About 8.3% of families and 10.2% of the population were below the poverty line, including 14.3% of those under age 18 and 6.3% of those age 65 or over.
Common Questions
What is Per Capita Income in Grand View?
Per Capita income in Grand View is $26,925.
What is the Median Family Income in Grand View?
Median Family Income in Grand View is $57,361.
What is the Median Household income in Grand View?
Median Household Income in Grand View is $55,556.
What is Income or Wage Gap in Grand View?
Income or Wage Gap in Grand View is 12.1%.
Women in Grand View earn 87.9 cents for every dollar earned by a man.
What is Inequality or Gini Index in Grand View?
Inequality or Gini Index in Grand View is 0.41.
What is the Total Population of Grand View?
Total Population of Grand View is 102.
What is the Total Male Population of Grand View?
Total Male Population of Grand View is 44.
What is the Total Female Population of Grand View?
Total Female Population of Grand View is 58.
What is the Ratio of Males per 100 Females in Grand View?
There are 75.86 Males per 100 Females in Grand View.
What is the Ratio of Females per 100 Males in Grand View?
There are 131.82 Females per 100 Males in Grand View.
What is the Median Population Age in Grand View?
Median Population Age in Grand View is 63.6 Years.
What is the Average Family Size in Grand View
Average Family Size in Grand View is 2.5 People.
What is the Average Household Size in Grand View
Average Household Size in Grand View is 1.9 People.
How Large is the Labor Force in Grand View?
There are 32 People in the Labor Forcein in Grand View.
What is the Percentage of People in the Labor Force in Grand View?
36.0% of People are in the Labor Force in Grand View.