Grand Marsh, WI Map & Demographics
Grand Marsh Map
Grand Marsh Overview
$31,718
PER CAPITA INCOME
18.1%
WAGE / INCOME GAP [ % ]
81.9¢/ $1
WAGE / INCOME GAP [ $ ]
0.46
INEQUALITY / GINI INDEX
131
TOTAL POPULATION
82
MALE POPULATION
49
FEMALE POPULATION
167.35
MALES / 100 FEMALES
59.76
FEMALES / 100 MALES
43.6
MEDIAN AGE
4.8
AVG FAMILY SIZE
2.9
AVG HOUSEHOLD SIZE
68
LABOR FORCE [ PEOPLE ]
66.0%
PERCENT IN LABOR FORCE
Grand Marsh Zip Codes
Income in Grand Marsh
Income Overview in Grand Marsh
| Characteristic | Number | Measure |
| Per Capita Income | 131 | $31,718 |
| Median Family Income | 18 | $0 |
| Mean Family Income | 18 | $67,994 |
| Median Household Income | 45 | $0 |
| Mean Household Income | 45 | $74,249 |
| Income Deficit | 18 | $0 |
| Wage / Income Gap (%) | 131 | 18.07% |
| Wage / Income Gap ($) | 131 | 81.93¢ per $1 |
| Gini / Inequality Index | 131 | 0.46 |
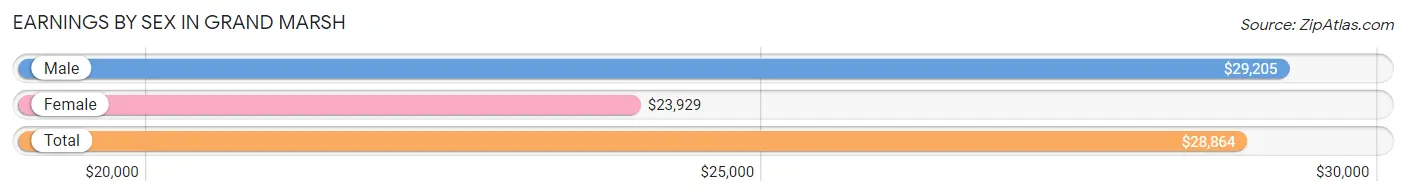
Earnings by Sex in Grand Marsh
Average Earnings in Grand Marsh are $28,864, $29,205 for men and $23,929 for women, a difference of 18.1%.
| Sex | Number | Average Earnings |
| Male | 52 (65.0%) | $29,205 |
| Female | 28 (35.0%) | $23,929 |
| Total | 80 (100.0%) | $28,864 |
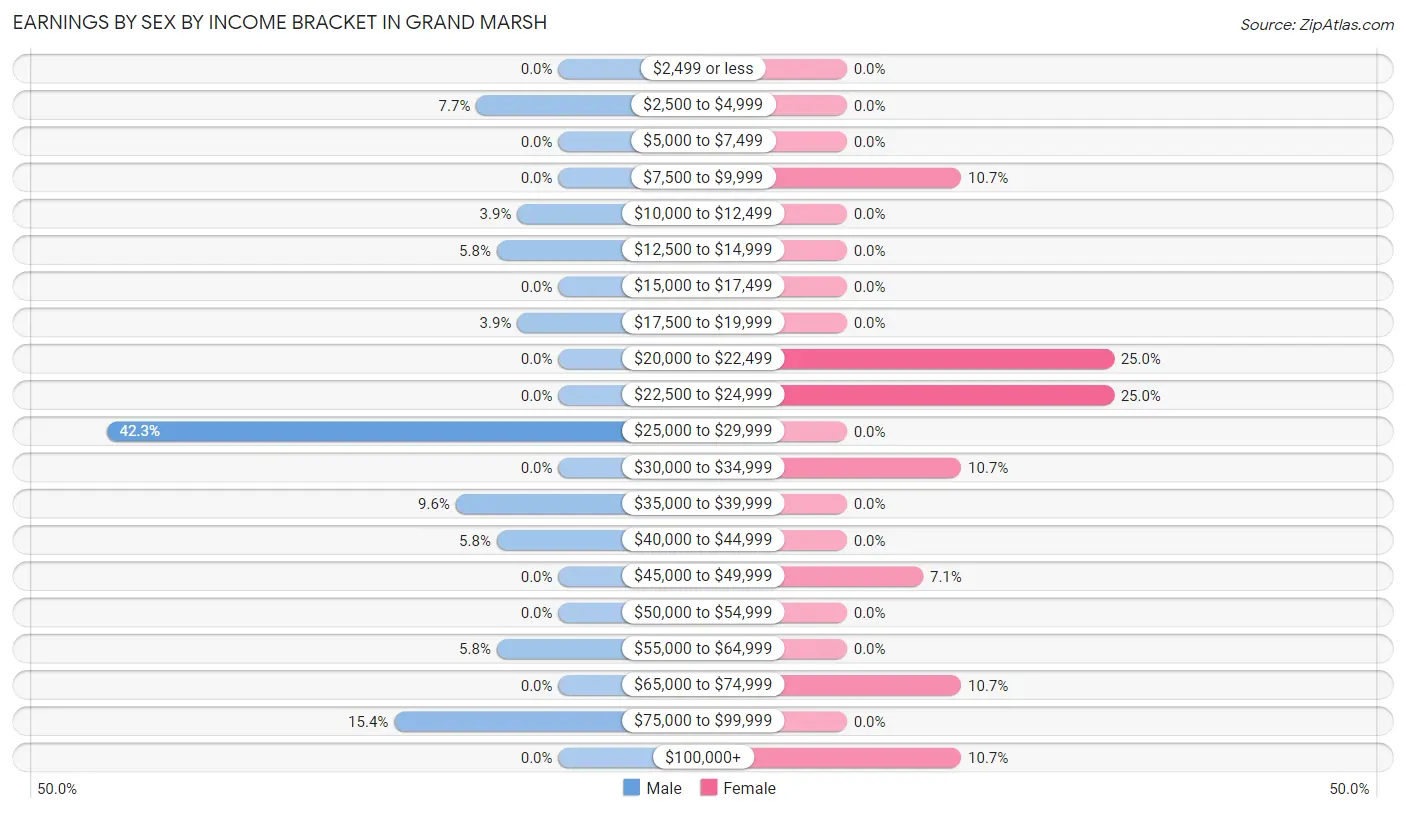
Earnings by Sex by Income Bracket in Grand Marsh
The most common earnings brackets in Grand Marsh are $25,000 to $29,999 for men (22 | 42.3%) and $20,000 to $22,499 for women (7 | 25.0%).
| Income | Male | Female |
| $2,499 or less | 0 (0.0%) | 0 (0.0%) |
| $2,500 to $4,999 | 4 (7.7%) | 0 (0.0%) |
| $5,000 to $7,499 | 0 (0.0%) | 0 (0.0%) |
| $7,500 to $9,999 | 0 (0.0%) | 3 (10.7%) |
| $10,000 to $12,499 | 2 (3.8%) | 0 (0.0%) |
| $12,500 to $14,999 | 3 (5.8%) | 0 (0.0%) |
| $15,000 to $17,499 | 0 (0.0%) | 0 (0.0%) |
| $17,500 to $19,999 | 2 (3.8%) | 0 (0.0%) |
| $20,000 to $22,499 | 0 (0.0%) | 7 (25.0%) |
| $22,500 to $24,999 | 0 (0.0%) | 7 (25.0%) |
| $25,000 to $29,999 | 22 (42.3%) | 0 (0.0%) |
| $30,000 to $34,999 | 0 (0.0%) | 3 (10.7%) |
| $35,000 to $39,999 | 5 (9.6%) | 0 (0.0%) |
| $40,000 to $44,999 | 3 (5.8%) | 0 (0.0%) |
| $45,000 to $49,999 | 0 (0.0%) | 2 (7.1%) |
| $50,000 to $54,999 | 0 (0.0%) | 0 (0.0%) |
| $55,000 to $64,999 | 3 (5.8%) | 0 (0.0%) |
| $65,000 to $74,999 | 0 (0.0%) | 3 (10.7%) |
| $75,000 to $99,999 | 8 (15.4%) | 0 (0.0%) |
| $100,000+ | 0 (0.0%) | 3 (10.7%) |
| Total | 52 (100.0%) | 28 (100.0%) |
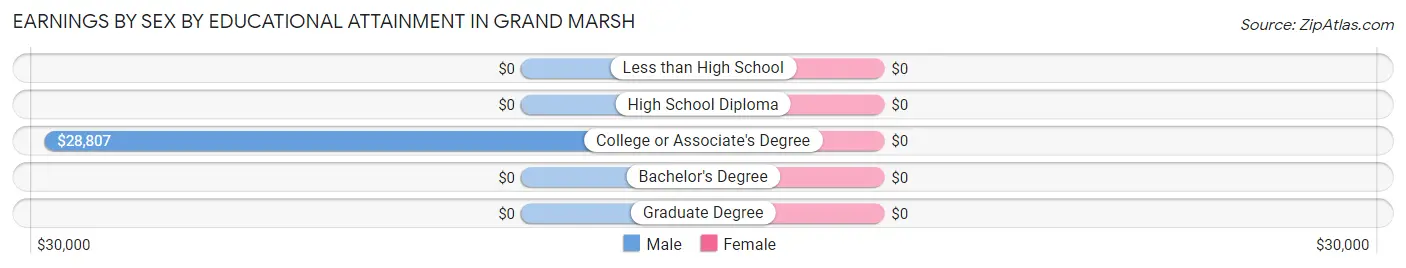
Earnings by Sex by Educational Attainment in Grand Marsh
| Educational Attainment | Male Income | Female Income |
| Less than High School | - | - |
| High School Diploma | - | - |
| College or Associate's Degree | $28,807 | $0 |
| Bachelor's Degree | - | - |
| Graduate Degree | - | - |
| Total | $29,432 | $23,929 |
Family Income in Grand Marsh
Family Income Brackets in Grand Marsh
According to the Grand Marsh family income data, there are 8 families falling into the $10,000 to $14,999 income range, which is the most common income bracket and makes up 44.4% of all families.
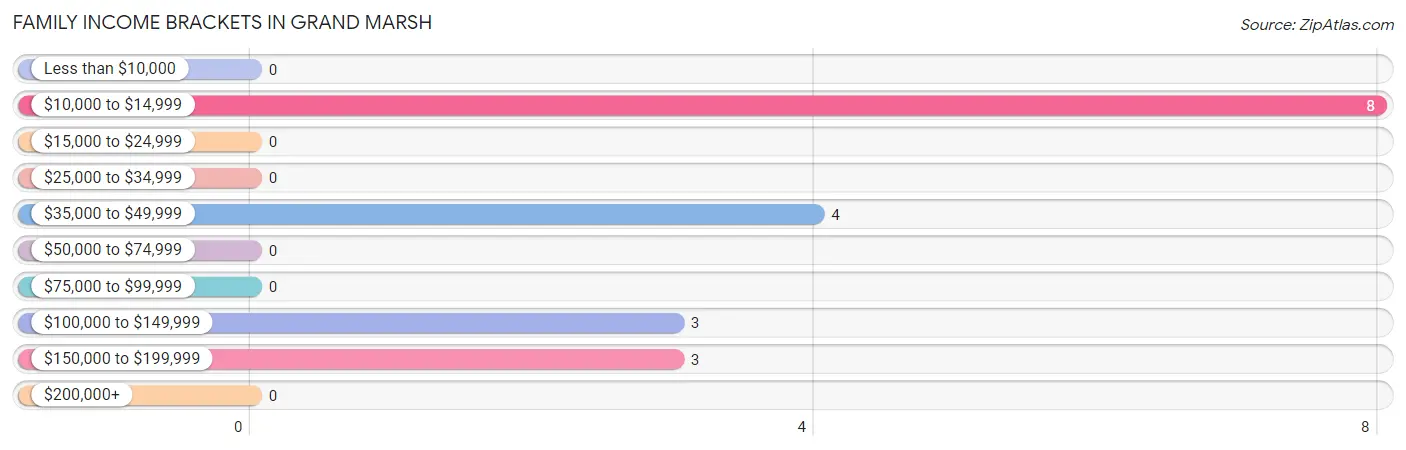
| Income Bracket | # Families | % Families |
| Less than $10,000 | 0 | 0.0% |
| $10,000 to $14,999 | 8 | 44.4% |
| $15,000 to $24,999 | 0 | 0.0% |
| $25,000 to $34,999 | 0 | 0.0% |
| $35,000 to $49,999 | 4 | 22.2% |
| $50,000 to $74,999 | 0 | 0.0% |
| $75,000 to $99,999 | 0 | 0.0% |
| $100,000 to $149,999 | 3 | 16.7% |
| $150,000 to $199,999 | 3 | 16.7% |
| $200,000+ | 0 | 0.0% |
Family Income by Famaliy Size in Grand Marsh
| Income Bracket | # Families | Median Income |
| 2-Person Families | 11 (61.1%) | $0 |
| 3-Person Families | 3 (16.7%) | $0 |
| 4-Person Families | 0 (0.0%) | $0 |
| 5-Person Families | 4 (22.2%) | $0 |
| 6-Person Families | 0 (0.0%) | $0 |
| 7+ Person Families | 0 (0.0%) | $0 |
| Total | 18 (100.0%) | $0 |
Family Income by Number of Earners in Grand Marsh
| Number of Earners | # Families | Median Income |
| No Earners | 8 (44.4%) | $0 |
| 1 Earner | 4 (22.2%) | $0 |
| 2 Earners | 3 (16.7%) | $0 |
| 3+ Earners | 3 (16.7%) | $0 |
| Total | 18 (100.0%) | $0 |
Household Income in Grand Marsh
Household Income Brackets in Grand Marsh
With 10 households falling in the category, the $100,000 to $149,999 income range is the most frequent in Grand Marsh, accounting for 22.2% of all households.
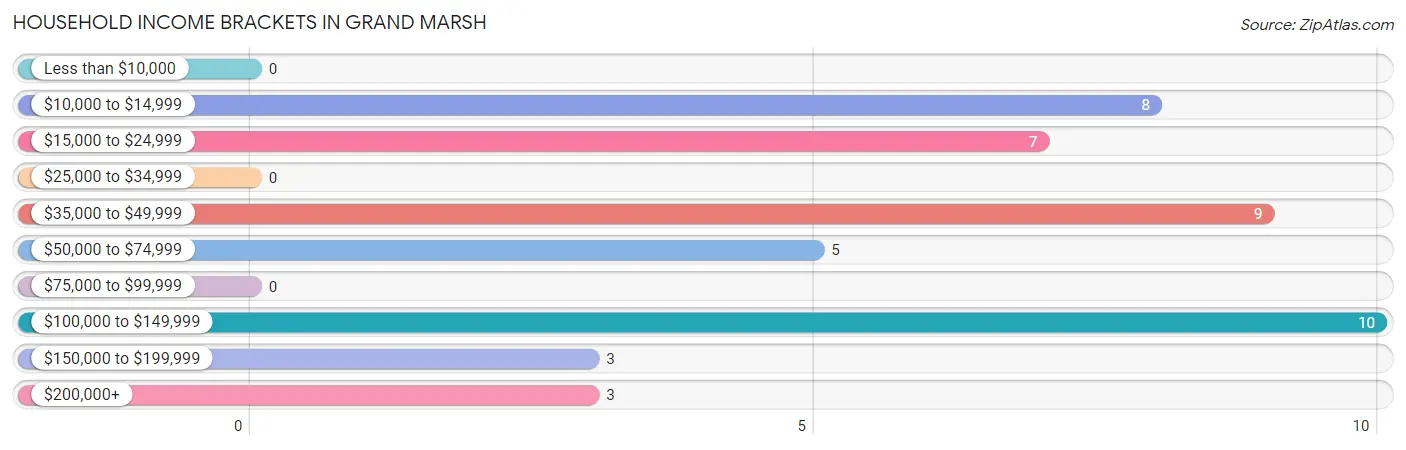
| Income Bracket | # Households | % Households |
| Less than $10,000 | 0 | 0.0% |
| $10,000 to $14,999 | 8 | 17.8% |
| $15,000 to $24,999 | 7 | 15.6% |
| $25,000 to $34,999 | 0 | 0.0% |
| $35,000 to $49,999 | 9 | 20.0% |
| $50,000 to $74,999 | 5 | 11.1% |
| $75,000 to $99,999 | 0 | 0.0% |
| $100,000 to $149,999 | 10 | 22.2% |
| $150,000 to $199,999 | 3 | 6.7% |
| $200,000+ | 3 | 6.7% |
Household Income by Householder Age in Grand Marsh
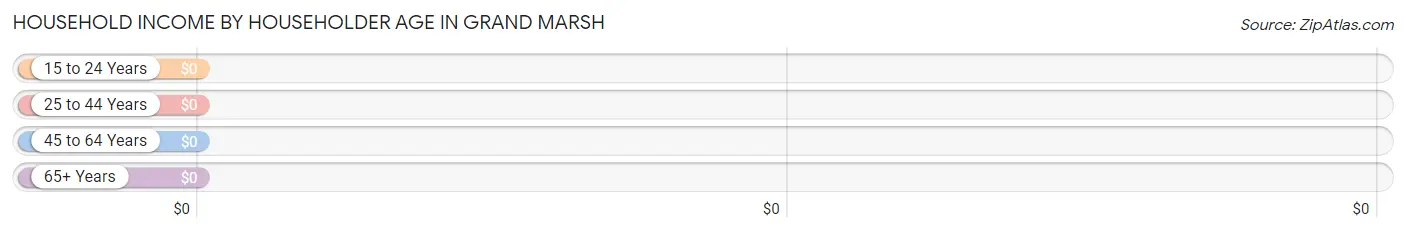
| Income Bracket | # Households | Median Income |
| 15 to 24 Years | 0 (0.0%) | $0 |
| 25 to 44 Years | 9 (20.0%) | $0 |
| 45 to 64 Years | 27 (60.0%) | $0 |
| 65+ Years | 9 (20.0%) | $0 |
| Total | 45 (100.0%) | $0 |
Poverty in Grand Marsh
Income Below Poverty by Sex and Age in Grand Marsh
With 13.4% poverty level for males and 16.3% for females among the residents of Grand Marsh, 25 to 34 year old males and 55 to 64 year old females are the most vulnerable to poverty, with 2 males (100.0%) and 8 females (32.0%) in their respective age groups living below the poverty level.
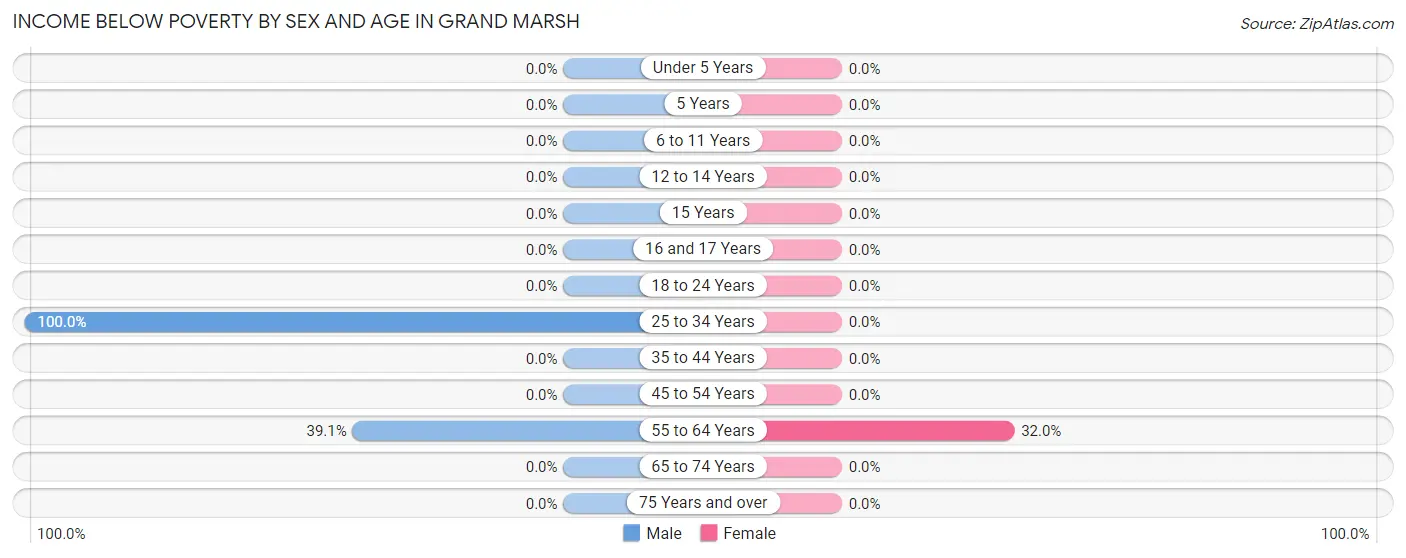
| Age Bracket | Male | Female |
| Under 5 Years | 0 (0.0%) | 0 (0.0%) |
| 5 Years | 0 (0.0%) | 0 (0.0%) |
| 6 to 11 Years | 0 (0.0%) | 0 (0.0%) |
| 12 to 14 Years | 0 (0.0%) | 0 (0.0%) |
| 15 Years | 0 (0.0%) | 0 (0.0%) |
| 16 and 17 Years | 0 (0.0%) | 0 (0.0%) |
| 18 to 24 Years | 0 (0.0%) | 0 (0.0%) |
| 25 to 34 Years | 2 (100.0%) | 0 (0.0%) |
| 35 to 44 Years | 0 (0.0%) | 0 (0.0%) |
| 45 to 54 Years | 0 (0.0%) | 0 (0.0%) |
| 55 to 64 Years | 9 (39.1%) | 8 (32.0%) |
| 65 to 74 Years | 0 (0.0%) | 0 (0.0%) |
| 75 Years and over | 0 (0.0%) | 0 (0.0%) |
| Total | 11 (13.4%) | 8 (16.3%) |
Income Above Poverty by Sex and Age in Grand Marsh
According to the poverty statistics in Grand Marsh, males aged under 5 years and females aged under 5 years are the age groups that are most secure financially, with 100.0% of males and 100.0% of females in these age groups living above the poverty line.
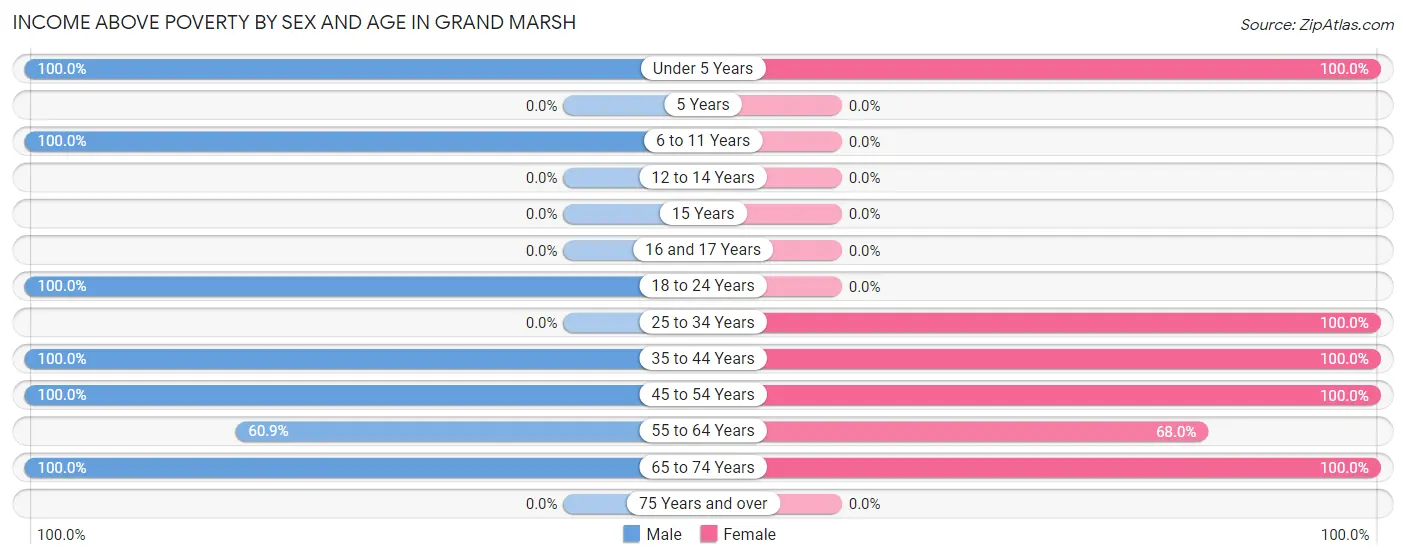
| Age Bracket | Male | Female |
| Under 5 Years | 9 (100.0%) | 9 (100.0%) |
| 5 Years | 0 (0.0%) | 0 (0.0%) |
| 6 to 11 Years | 10 (100.0%) | 0 (0.0%) |
| 12 to 14 Years | 0 (0.0%) | 0 (0.0%) |
| 15 Years | 0 (0.0%) | 0 (0.0%) |
| 16 and 17 Years | 0 (0.0%) | 0 (0.0%) |
| 18 to 24 Years | 4 (100.0%) | 0 (0.0%) |
| 25 to 34 Years | 0 (0.0%) | 6 (100.0%) |
| 35 to 44 Years | 25 (100.0%) | 3 (100.0%) |
| 45 to 54 Years | 3 (100.0%) | 3 (100.0%) |
| 55 to 64 Years | 14 (60.9%) | 17 (68.0%) |
| 65 to 74 Years | 6 (100.0%) | 3 (100.0%) |
| 75 Years and over | 0 (0.0%) | 0 (0.0%) |
| Total | 71 (86.6%) | 41 (83.7%) |
Income Below Poverty Among Married-Couple Families in Grand Marsh
The poverty statistics for married-couple families in Grand Marsh show that 44.4% or 8 of the total 18 families live below the poverty line. Families with no children have the highest poverty rate of 57.1%, comprising of 8 families. On the other hand, families with 3 or 4 children have the lowest poverty rate of 0.0%, which includes 0 families.
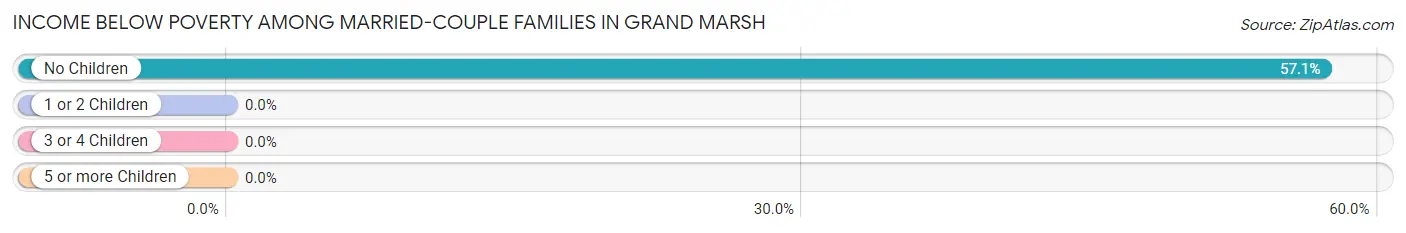
| Children | Above Poverty | Below Poverty |
| No Children | 6 (42.9%) | 8 (57.1%) |
| 1 or 2 Children | 0 (0.0%) | 0 (0.0%) |
| 3 or 4 Children | 4 (100.0%) | 0 (0.0%) |
| 5 or more Children | 0 (0.0%) | 0 (0.0%) |
| Total | 10 (55.6%) | 8 (44.4%) |
Income Below Poverty Among Single-Parent Households in Grand Marsh
| Children | Single Father | Single Mother |
| No Children | 0 (0.0%) | 0 (0.0%) |
| 1 or 2 Children | 0 (0.0%) | 0 (0.0%) |
| 3 or 4 Children | 0 (0.0%) | 0 (0.0%) |
| 5 or more Children | 0 (0.0%) | 0 (0.0%) |
| Total | 0 (0.0%) | 0 (0.0%) |
Income Below Poverty Among Married-Couple vs Single-Parent Households in Grand Marsh
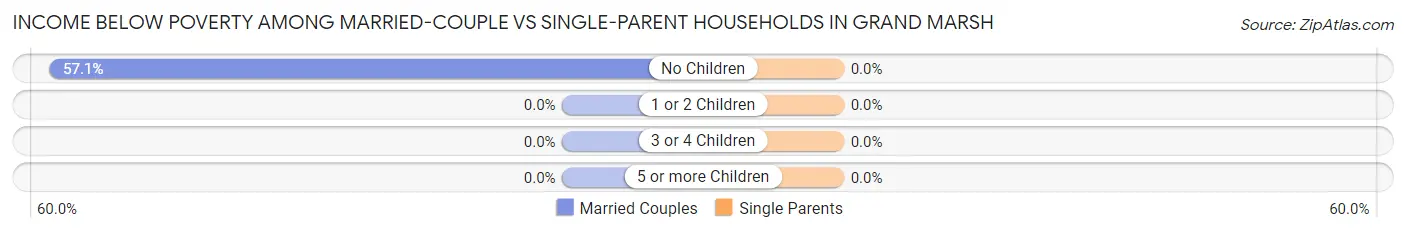
| Children | Married-Couple Families | Single-Parent Households |
| No Children | 8 (57.1%) | 0 (0.0%) |
| 1 or 2 Children | 0 (0.0%) | 0 (0.0%) |
| 3 or 4 Children | 0 (0.0%) | 0 (0.0%) |
| 5 or more Children | 0 (0.0%) | 0 (0.0%) |
| Total | 8 (44.4%) | 0 (0.0%) |
Race in Grand Marsh
The most populous races in Grand Marsh are White / Caucasian (131 | 100.0%), and Hispanic or Latino (53 | 40.5%).
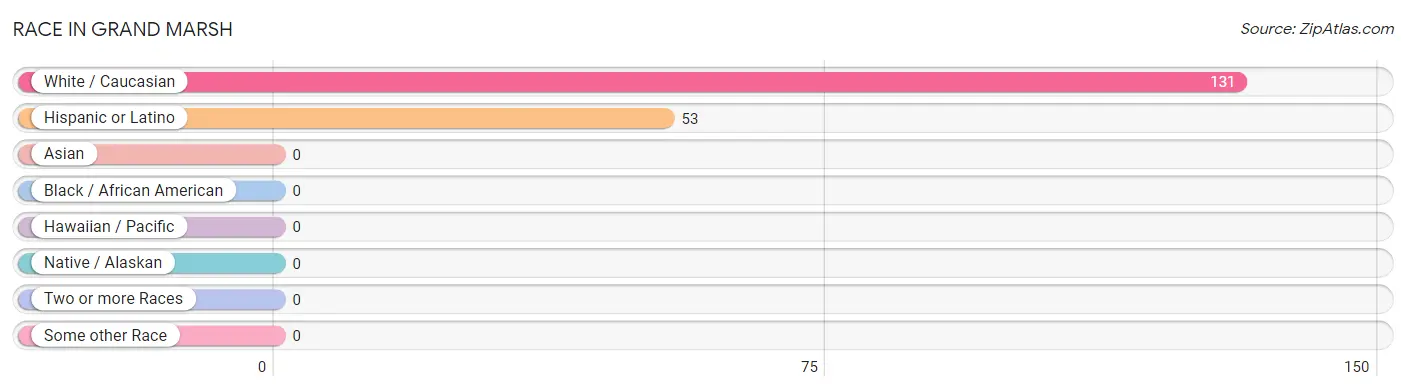
| Race | # Population | % Population |
| Asian | 0 | 0.0% |
| Black / African American | 0 | 0.0% |
| Hawaiian / Pacific | 0 | 0.0% |
| Hispanic or Latino | 53 | 40.5% |
| Native / Alaskan | 0 | 0.0% |
| White / Caucasian | 131 | 100.0% |
| Two or more Races | 0 | 0.0% |
| Some other Race | 0 | 0.0% |
| Total | 131 | 100.0% |
Ancestry in Grand Marsh
The most populous ancestries reported in Grand Marsh are Mexican (50 | 38.2%), Polish (21 | 16.0%), German (15 | 11.5%), English (8 | 6.1%), and Portuguese (8 | 6.1%), together accounting for 77.9% of all Grand Marsh residents.
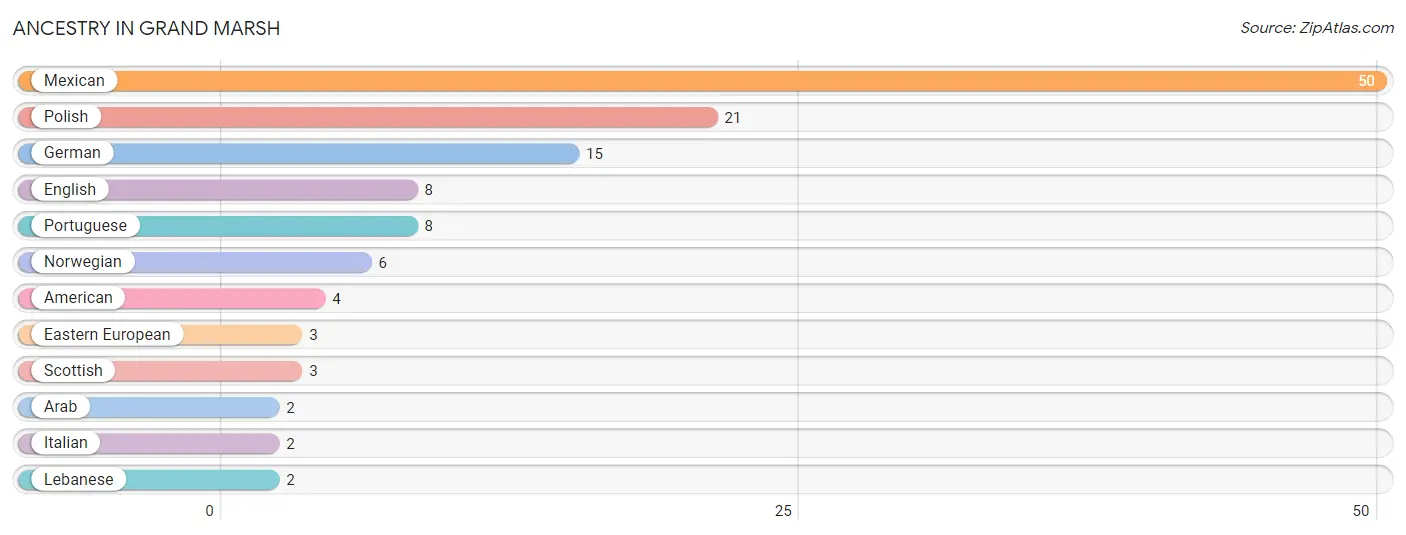
| Ancestry | # Population | % Population |
| American | 4 | 3.0% |
| Arab | 2 | 1.5% |
| Eastern European | 3 | 2.3% |
| English | 8 | 6.1% |
| German | 15 | 11.5% |
| Italian | 2 | 1.5% |
| Lebanese | 2 | 1.5% |
| Mexican | 50 | 38.2% |
| Norwegian | 6 | 4.6% |
| Polish | 21 | 16.0% |
| Portuguese | 8 | 6.1% |
| Scottish | 3 | 2.3% | View All 12 Rows |
Immigrants in Grand Marsh
The most numerous immigrant groups reported in Grand Marsh came from Central America (22 | 16.8%), Latin America (22 | 16.8%), and Mexico (22 | 16.8%), together accounting for 50.4% of all Grand Marsh residents.
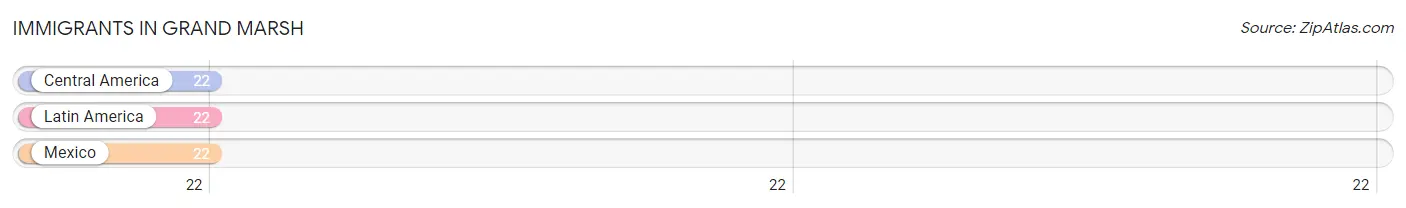
| Immigration Origin | # Population | % Population |
| Central America | 22 | 16.8% |
| Latin America | 22 | 16.8% |
| Mexico | 22 | 16.8% | View All 3 Rows |
Sex and Age in Grand Marsh
Sex and Age in Grand Marsh
The most populous age groups in Grand Marsh are 60 to 64 Years (23 | 28.1%) for men and 60 to 64 Years (17 | 34.7%) for women.
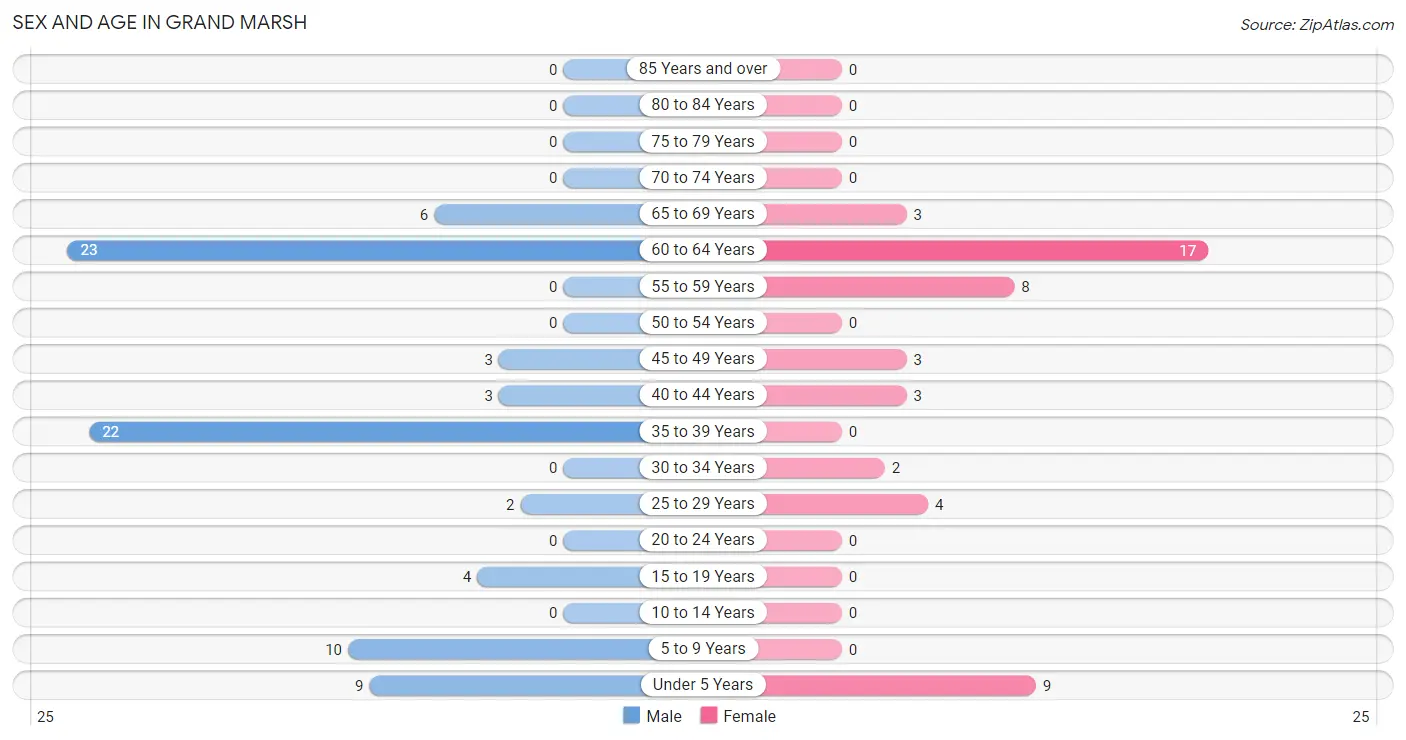
| Age Bracket | Male | Female |
| Under 5 Years | 9 (11.0%) | 9 (18.4%) |
| 5 to 9 Years | 10 (12.2%) | 0 (0.0%) |
| 10 to 14 Years | 0 (0.0%) | 0 (0.0%) |
| 15 to 19 Years | 4 (4.9%) | 0 (0.0%) |
| 20 to 24 Years | 0 (0.0%) | 0 (0.0%) |
| 25 to 29 Years | 2 (2.4%) | 4 (8.2%) |
| 30 to 34 Years | 0 (0.0%) | 2 (4.1%) |
| 35 to 39 Years | 22 (26.8%) | 0 (0.0%) |
| 40 to 44 Years | 3 (3.7%) | 3 (6.1%) |
| 45 to 49 Years | 3 (3.7%) | 3 (6.1%) |
| 50 to 54 Years | 0 (0.0%) | 0 (0.0%) |
| 55 to 59 Years | 0 (0.0%) | 8 (16.3%) |
| 60 to 64 Years | 23 (28.1%) | 17 (34.7%) |
| 65 to 69 Years | 6 (7.3%) | 3 (6.1%) |
| 70 to 74 Years | 0 (0.0%) | 0 (0.0%) |
| 75 to 79 Years | 0 (0.0%) | 0 (0.0%) |
| 80 to 84 Years | 0 (0.0%) | 0 (0.0%) |
| 85 Years and over | 0 (0.0%) | 0 (0.0%) |
| Total | 82 (100.0%) | 49 (100.0%) |
Families and Households in Grand Marsh
Median Family Size in Grand Marsh
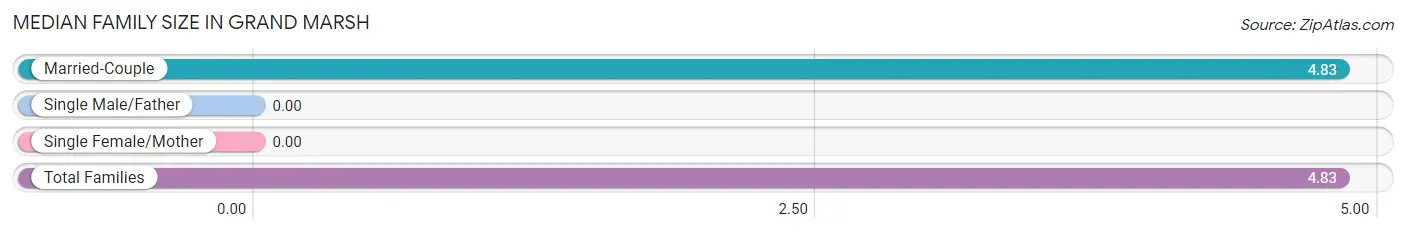
| Family Type | # Families | Family Size |
| Married-Couple | 18 (100.0%) | 4.83 |
| Single Male/Father | 0 (0.0%) | - |
| Single Female/Mother | 0 (0.0%) | - |
| Total Families | 18 (100.0%) | 4.83 |
Median Household Size in Grand Marsh
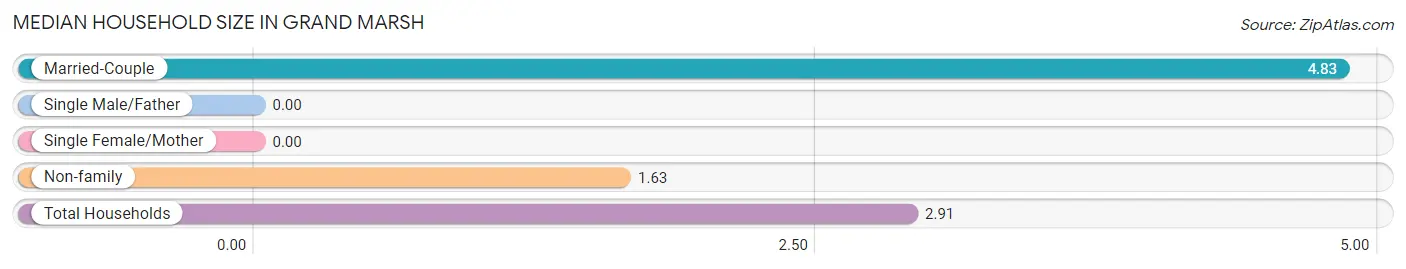
| Household Type | # Households | Household Size |
| Married-Couple | 18 (40.0%) | 4.83 |
| Single Male/Father | 0 (0.0%) | - |
| Single Female/Mother | 0 (0.0%) | - |
| Non-family | 27 (60.0%) | 1.63 |
| Total Households | 45 (100.0%) | 2.91 |
Household Size by Marriage Status in Grand Marsh
Out of a total of 45 households in Grand Marsh, 18 (40.0%) are family households, while 27 (60.0%) are nonfamily households. The most numerous type of family households are 2-person households, comprising 11, and the most common type of nonfamily households are 1-person households, comprising 12.
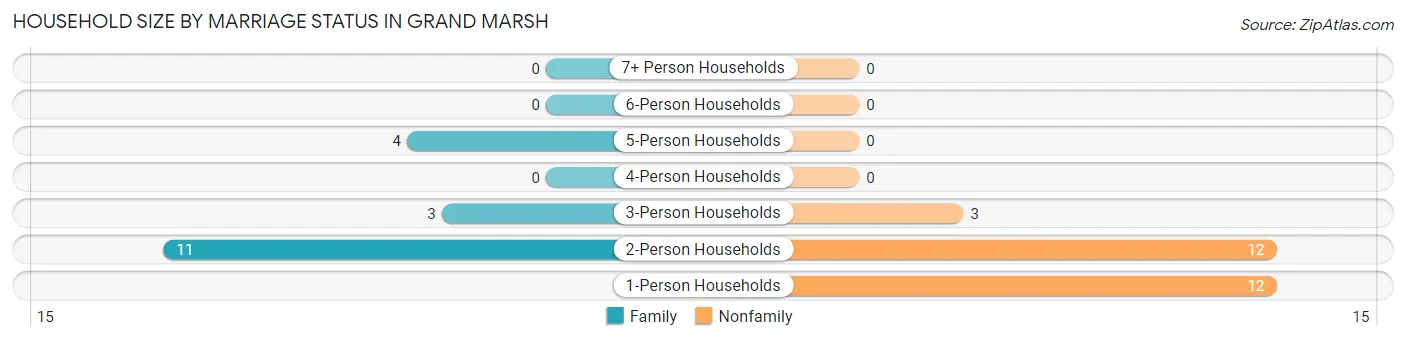
| Household Size | Family Households | Nonfamily Households |
| 1-Person Households | - | 12 (26.7%) |
| 2-Person Households | 11 (24.4%) | 12 (26.7%) |
| 3-Person Households | 3 (6.7%) | 3 (6.7%) |
| 4-Person Households | 0 (0.0%) | 0 (0.0%) |
| 5-Person Households | 4 (8.9%) | 0 (0.0%) |
| 6-Person Households | 0 (0.0%) | 0 (0.0%) |
| 7+ Person Households | 0 (0.0%) | 0 (0.0%) |
| Total | 18 (40.0%) | 27 (60.0%) |
Female Fertility in Grand Marsh
Fertility by Age in Grand Marsh
| Age Bracket | Women with Births | Births / 1,000 Women |
| 15 to 19 years | 0 (0.0%) | 0.0 |
| 20 to 34 years | 0 (0.0%) | 0.0 |
| 35 to 50 years | 0 (0.0%) | 0.0 |
| Total | 0 (0.0%) | 0.0 |
Fertility by Age by Marriage Status in Grand Marsh
| Age Bracket | Married | Unmarried |
| 15 to 19 years | 0 (0.0%) | 0 (0.0%) |
| 20 to 34 years | 0 (0.0%) | 0 (0.0%) |
| 35 to 50 years | 0 (0.0%) | 0 (0.0%) |
| Total | 0 (0.0%) | 0 (0.0%) |
Fertility by Education in Grand Marsh
| Educational Attainment | Women with Births | Births / 1,000 Women |
| Less than High School | 0 (0.0%) | 0.0 |
| High School Diploma | 0 (0.0%) | 0.0 |
| College or Associate's Degree | 0 (0.0%) | 0.0 |
| Bachelor's Degree | 0 (0.0%) | 0.0 |
| Graduate Degree | 0 (0.0%) | 0.0 |
| Total | 0 (0.0%) | 0.0 |
Fertility by Education by Marriage Status in Grand Marsh
| Educational Attainment | Married | Unmarried |
| Less than High School | 0 (0.0%) | 0 (0.0%) |
| High School Diploma | 0 (0.0%) | 0 (0.0%) |
| College or Associate's Degree | 0 (0.0%) | 0 (0.0%) |
| Bachelor's Degree | 0 (0.0%) | 0 (0.0%) |
| Graduate Degree | 0 (0.0%) | 0 (0.0%) |
| Total | 0 (0.0%) | 0 (0.0%) |
Employment Characteristics in Grand Marsh
Employment by Class of Employer in Grand Marsh
Among the 66 employed individuals in Grand Marsh, private company employees (42 | 63.6%), not-for-profit organizations (15 | 22.7%), and self-employed (incorporated) (3 | 4.5%) make up the most common classes of employment.
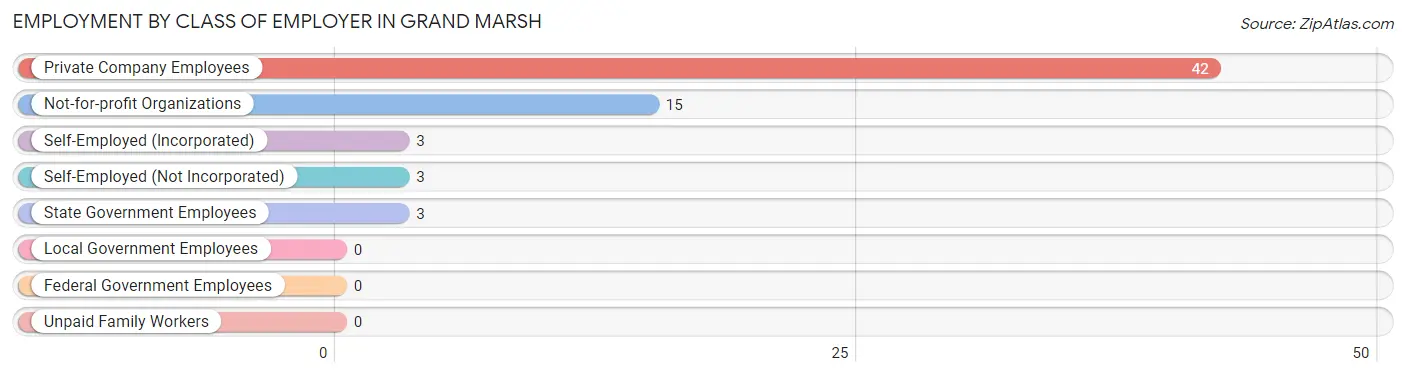
| Employer Class | # Employees | % Employees |
| Private Company Employees | 42 | 63.6% |
| Self-Employed (Incorporated) | 3 | 4.5% |
| Self-Employed (Not Incorporated) | 3 | 4.5% |
| Not-for-profit Organizations | 15 | 22.7% |
| Local Government Employees | 0 | 0.0% |
| State Government Employees | 3 | 4.5% |
| Federal Government Employees | 0 | 0.0% |
| Unpaid Family Workers | 0 | 0.0% |
| Total | 66 | 100.0% |
Employment Status by Age in Grand Marsh
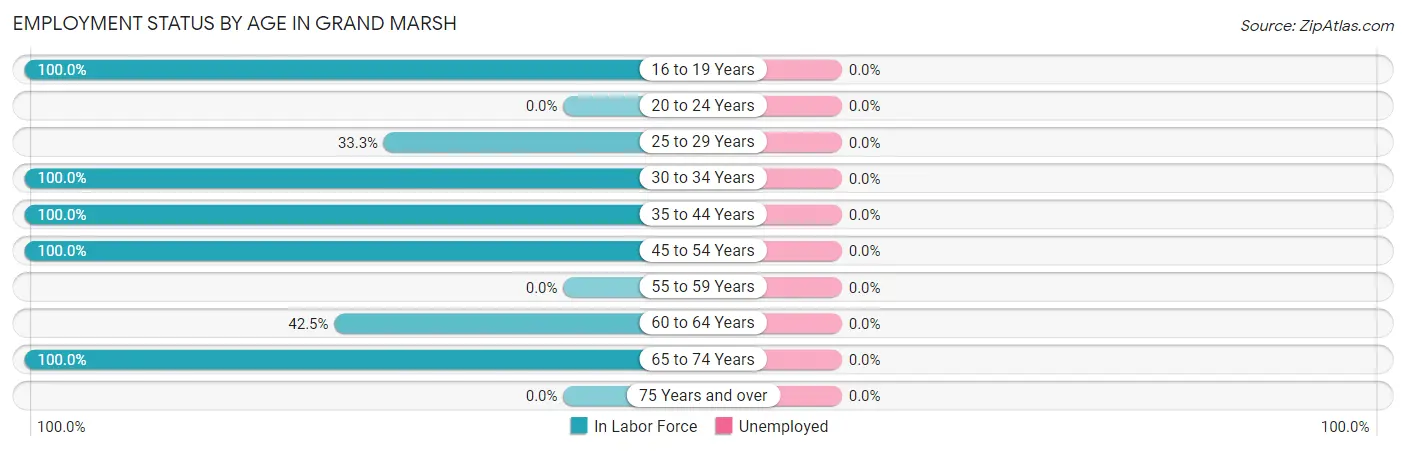
| Age Bracket | In Labor Force | Unemployed |
| 16 to 19 Years | 4 (100.0%) | 0 (0.0%) |
| 20 to 24 Years | 0 (0.0%) | 0 (0.0%) |
| 25 to 29 Years | 2 (33.3%) | 0 (0.0%) |
| 30 to 34 Years | 2 (100.0%) | 0 (0.0%) |
| 35 to 44 Years | 28 (100.0%) | 0 (0.0%) |
| 45 to 54 Years | 6 (100.0%) | 0 (0.0%) |
| 55 to 59 Years | 0 (0.0%) | 0 (0.0%) |
| 60 to 64 Years | 17 (42.5%) | 0 (0.0%) |
| 65 to 74 Years | 9 (100.0%) | 0 (0.0%) |
| 75 Years and over | 0 (0.0%) | 0 (0.0%) |
| Total | 68 (66.0%) | 0 (0.0%) |
Employment Status by Educational Attainment in Grand Marsh
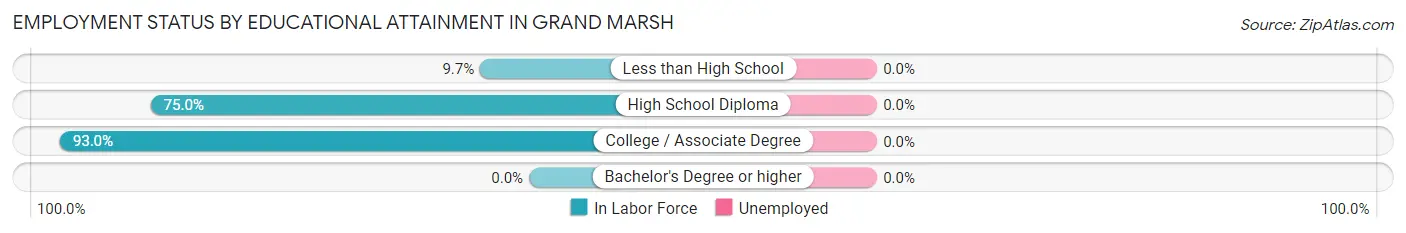
| Educational Attainment | In Labor Force | Unemployed |
| Less than High School | 3 (9.7%) | 0 (0.0%) |
| High School Diploma | 12 (75.0%) | 0 (0.0%) |
| College / Associate Degree | 40 (93.0%) | 0 (0.0%) |
| Bachelor's Degree or higher | 0 (0.0%) | 0 (0.0%) |
| Total | 55 (61.1%) | 0 (0.0%) |
Employment Occupations by Sex in Grand Marsh
Management, Business, Science and Arts Occupations
The most common Management, Business, Science and Arts occupations in Grand Marsh are Community & Social Service (7 | 10.3%), and Education Instruction & Library (7 | 10.3%).
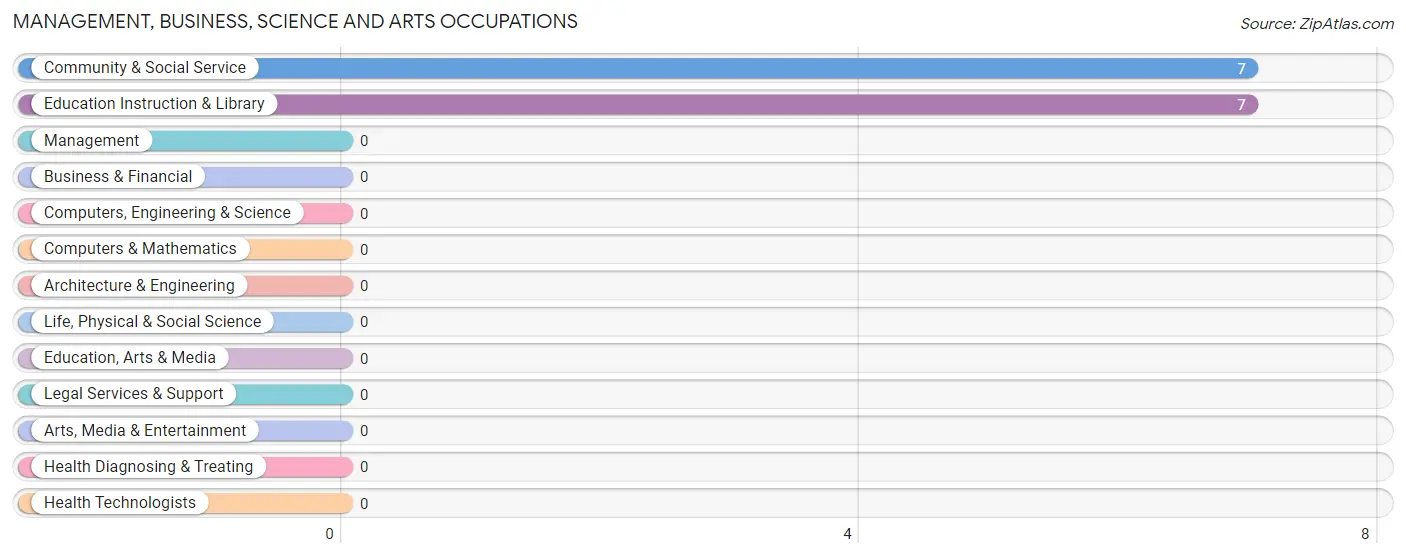
Management, Business, Science and Arts Occupations by Sex
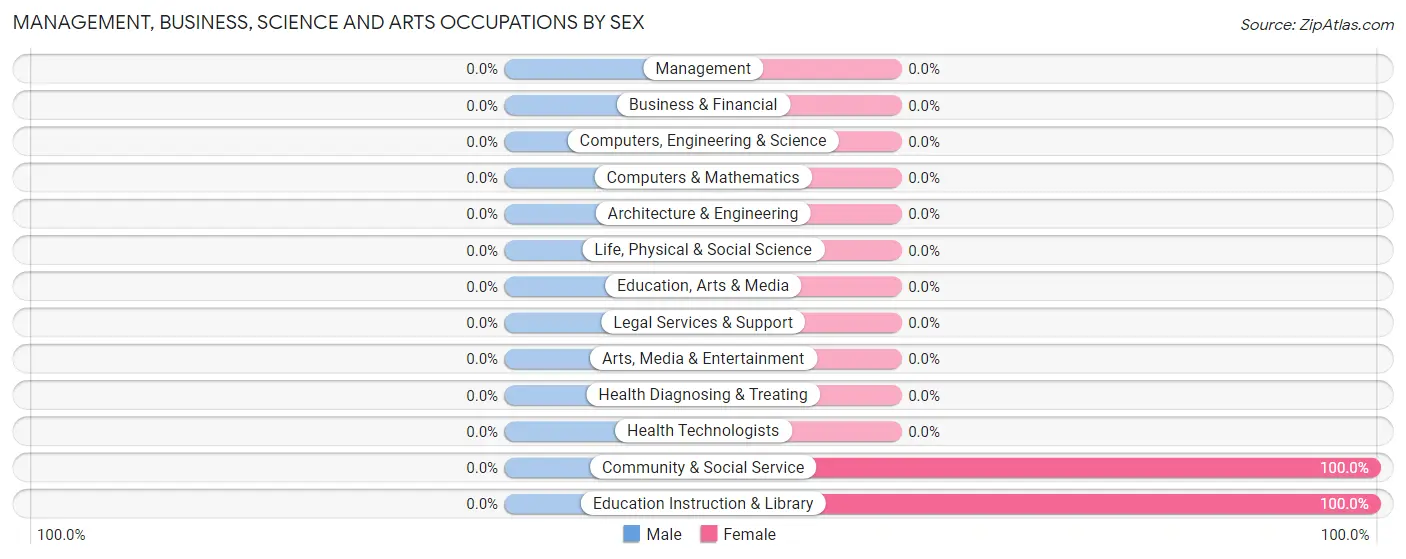
| Occupation | Male | Female |
| Management | 0 (0.0%) | 0 (0.0%) |
| Business & Financial | 0 (0.0%) | 0 (0.0%) |
| Computers, Engineering & Science | 0 (0.0%) | 0 (0.0%) |
| Computers & Mathematics | 0 (0.0%) | 0 (0.0%) |
| Architecture & Engineering | 0 (0.0%) | 0 (0.0%) |
| Life, Physical & Social Science | 0 (0.0%) | 0 (0.0%) |
| Community & Social Service | 0 (0.0%) | 7 (100.0%) |
| Education, Arts & Media | 0 (0.0%) | 0 (0.0%) |
| Legal Services & Support | 0 (0.0%) | 0 (0.0%) |
| Education Instruction & Library | 0 (0.0%) | 7 (100.0%) |
| Arts, Media & Entertainment | 0 (0.0%) | 0 (0.0%) |
| Health Diagnosing & Treating | 0 (0.0%) | 0 (0.0%) |
| Health Technologists | 0 (0.0%) | 0 (0.0%) |
| Total (Category) | 0 (0.0%) | 7 (100.0%) |
| Total (Overall) | 50 (73.5%) | 18 (26.5%) |
Services Occupations
The most common Services occupations in Grand Marsh are , and Healthcare Support (3 | 4.4%).
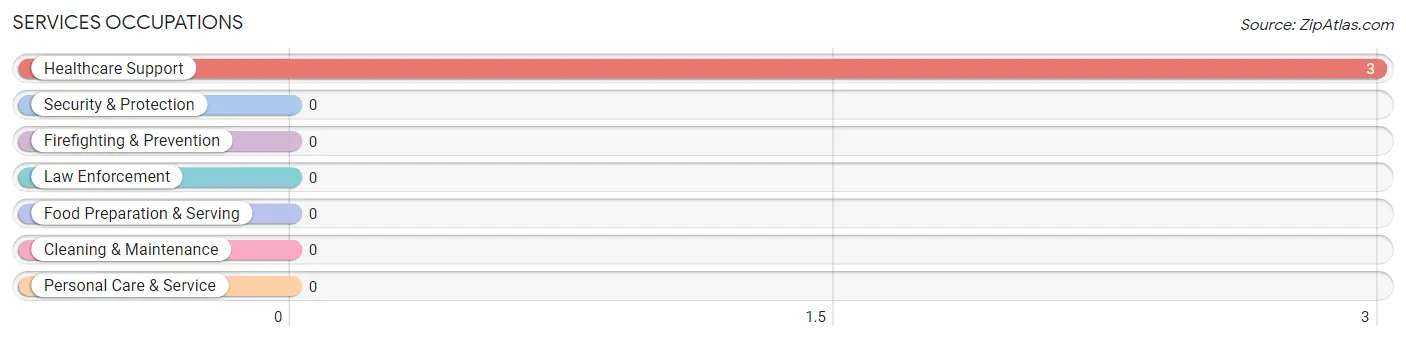
Services Occupations by Sex
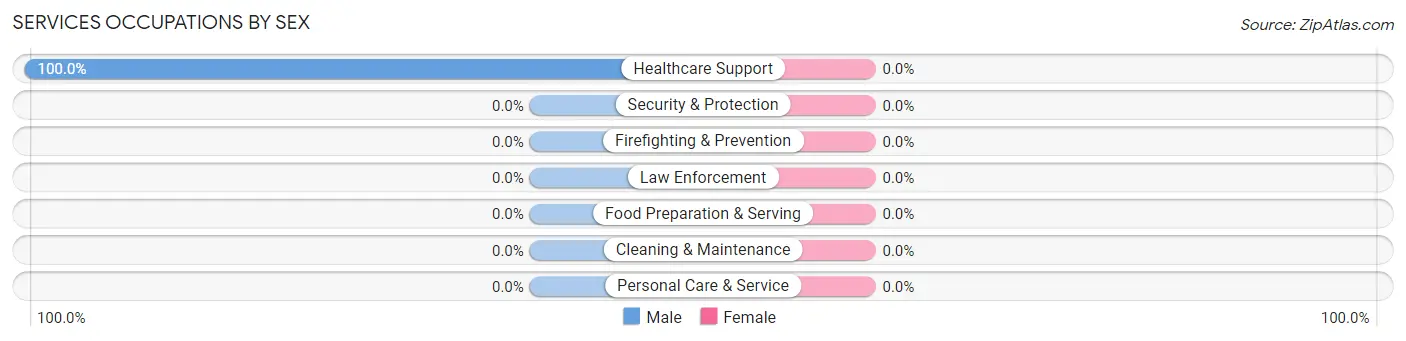
| Occupation | Male | Female |
| Healthcare Support | 3 (100.0%) | 0 (0.0%) |
| Security & Protection | 0 (0.0%) | 0 (0.0%) |
| Firefighting & Prevention | 0 (0.0%) | 0 (0.0%) |
| Law Enforcement | 0 (0.0%) | 0 (0.0%) |
| Food Preparation & Serving | 0 (0.0%) | 0 (0.0%) |
| Cleaning & Maintenance | 0 (0.0%) | 0 (0.0%) |
| Personal Care & Service | 0 (0.0%) | 0 (0.0%) |
| Total (Category) | 3 (100.0%) | 0 (0.0%) |
| Total (Overall) | 50 (73.5%) | 18 (26.5%) |
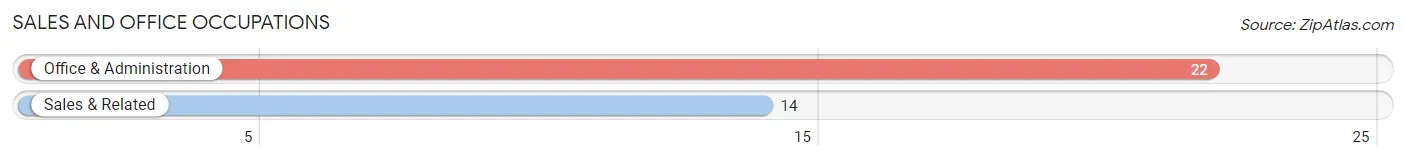
Sales and Office Occupations
The most common Sales and Office occupations in Grand Marsh are Office & Administration (22 | 32.4%), and Sales & Related (14 | 20.6%).
Sales and Office Occupations by Sex
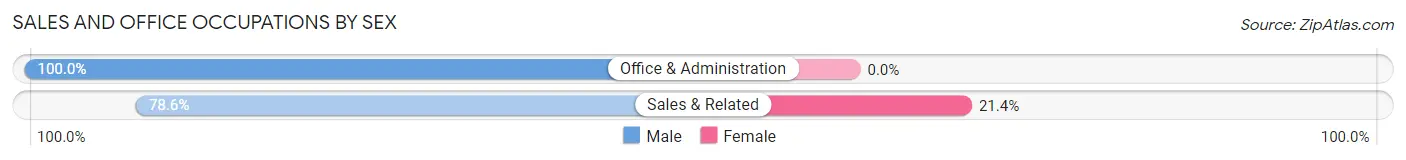
| Occupation | Male | Female |
| Sales & Related | 11 (78.6%) | 3 (21.4%) |
| Office & Administration | 22 (100.0%) | 0 (0.0%) |
| Total (Category) | 33 (91.7%) | 3 (8.3%) |
| Total (Overall) | 50 (73.5%) | 18 (26.5%) |
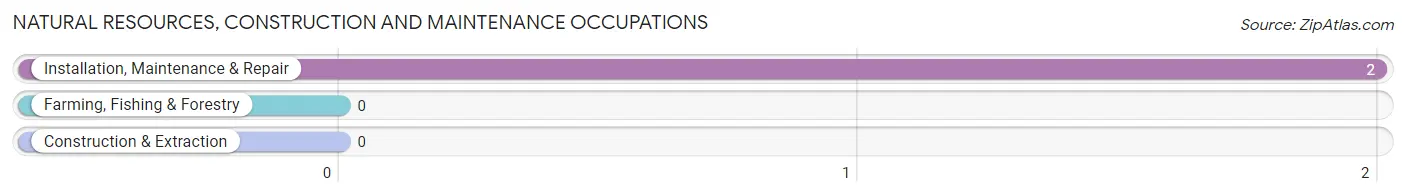
Natural Resources, Construction and Maintenance Occupations
The most common Natural Resources, Construction and Maintenance occupations in Grand Marsh are , and Installation, Maintenance & Repair (2 | 2.9%).
Natural Resources, Construction and Maintenance Occupations by Sex
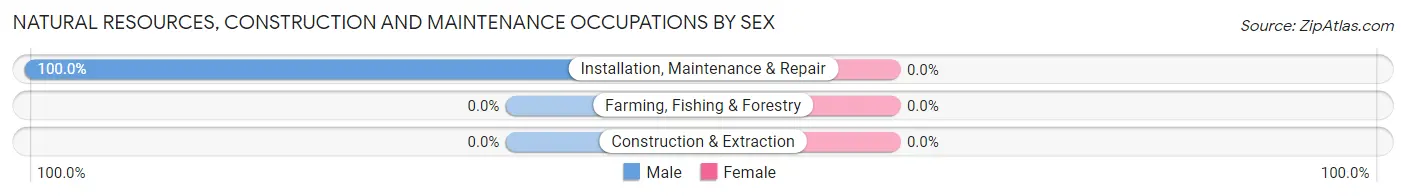
| Occupation | Male | Female |
| Farming, Fishing & Forestry | 0 (0.0%) | 0 (0.0%) |
| Construction & Extraction | 0 (0.0%) | 0 (0.0%) |
| Installation, Maintenance & Repair | 2 (100.0%) | 0 (0.0%) |
| Total (Category) | 2 (100.0%) | 0 (0.0%) |
| Total (Overall) | 50 (73.5%) | 18 (26.5%) |
Production, Transportation and Moving Occupations
The most common Production, Transportation and Moving occupations in Grand Marsh are Transportation (13 | 19.1%), Production (4 | 5.9%), and Material Moving (3 | 4.4%).
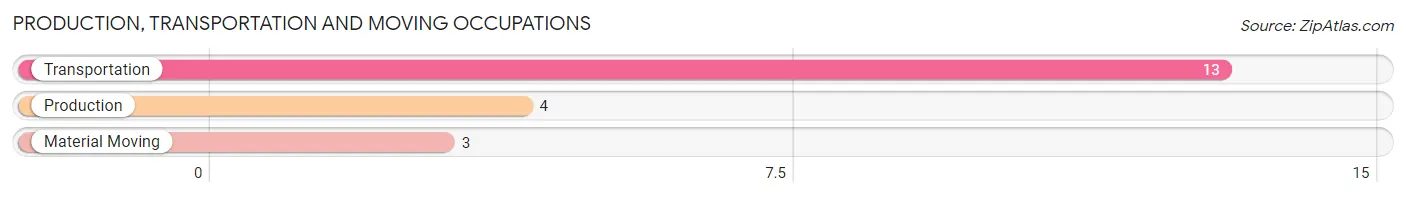
Production, Transportation and Moving Occupations by Sex
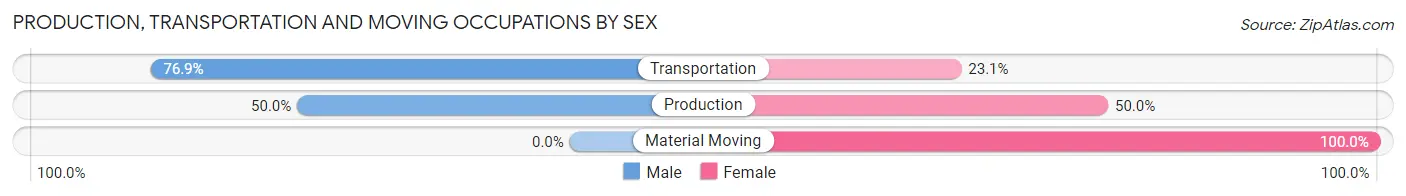
| Occupation | Male | Female |
| Production | 2 (50.0%) | 2 (50.0%) |
| Transportation | 10 (76.9%) | 3 (23.1%) |
| Material Moving | 0 (0.0%) | 3 (100.0%) |
| Total (Category) | 12 (60.0%) | 8 (40.0%) |
| Total (Overall) | 50 (73.5%) | 18 (26.5%) |
Employment Industries by Sex in Grand Marsh
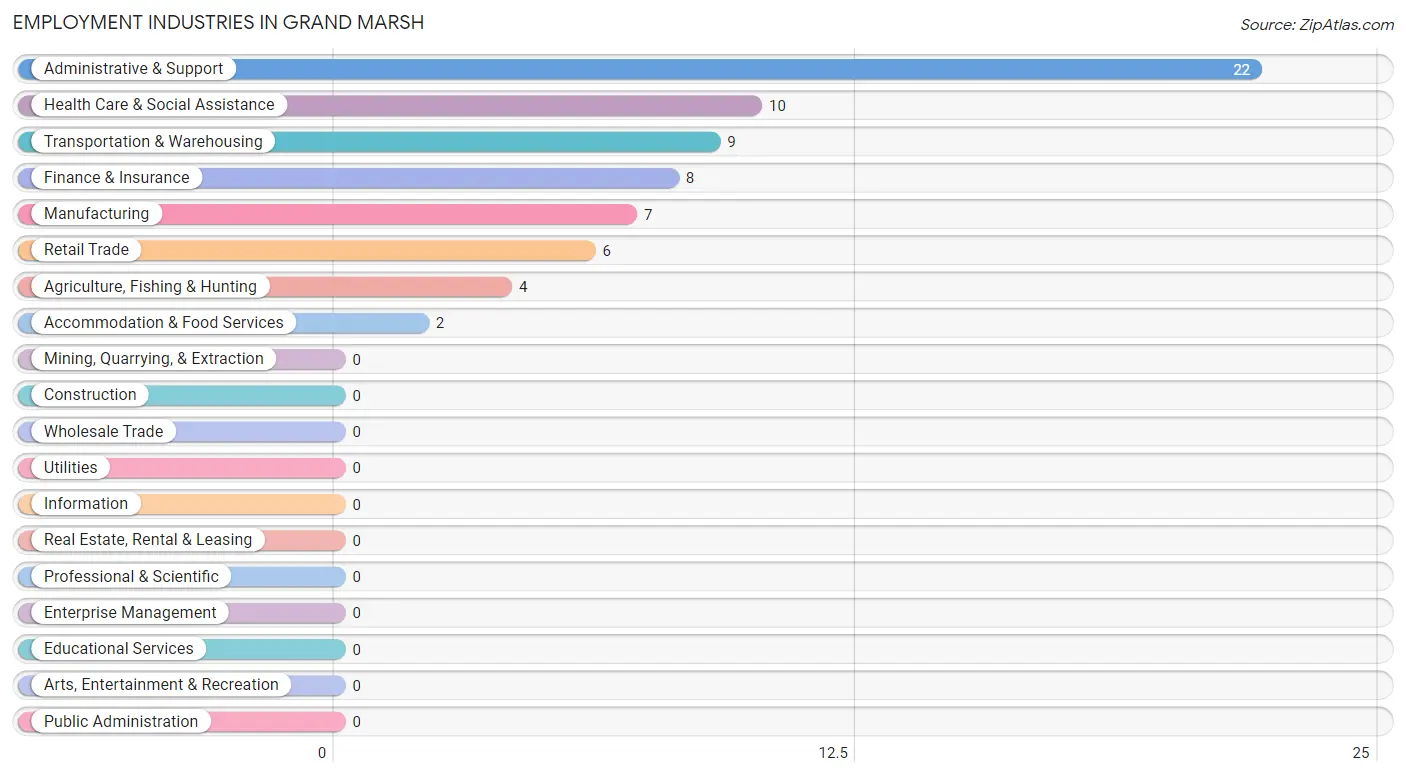
Employment Industries in Grand Marsh
The major employment industries in Grand Marsh include Administrative & Support (22 | 32.4%), Health Care & Social Assistance (10 | 14.7%), Transportation & Warehousing (9 | 13.2%), Finance & Insurance (8 | 11.8%), and Manufacturing (7 | 10.3%).
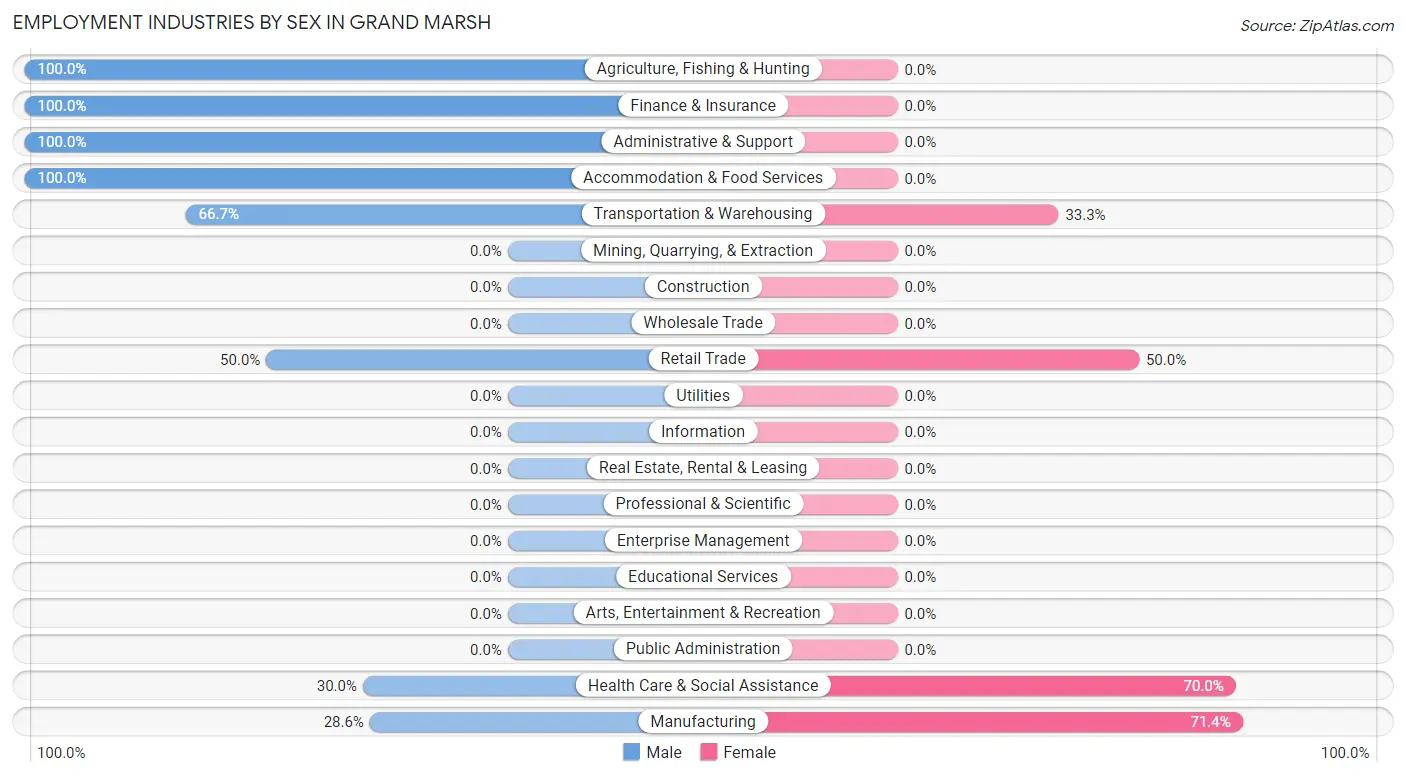
Employment Industries by Sex in Grand Marsh
The Grand Marsh industries that see more men than women are Agriculture, Fishing & Hunting (100.0%), Finance & Insurance (100.0%), and Administrative & Support (100.0%), whereas the industries that tend to have a higher number of women are Manufacturing (71.4%), Health Care & Social Assistance (70.0%), and Retail Trade (50.0%).
| Industry | Male | Female |
| Agriculture, Fishing & Hunting | 4 (100.0%) | 0 (0.0%) |
| Mining, Quarrying, & Extraction | 0 (0.0%) | 0 (0.0%) |
| Construction | 0 (0.0%) | 0 (0.0%) |
| Manufacturing | 2 (28.6%) | 5 (71.4%) |
| Wholesale Trade | 0 (0.0%) | 0 (0.0%) |
| Retail Trade | 3 (50.0%) | 3 (50.0%) |
| Transportation & Warehousing | 6 (66.7%) | 3 (33.3%) |
| Utilities | 0 (0.0%) | 0 (0.0%) |
| Information | 0 (0.0%) | 0 (0.0%) |
| Finance & Insurance | 8 (100.0%) | 0 (0.0%) |
| Real Estate, Rental & Leasing | 0 (0.0%) | 0 (0.0%) |
| Professional & Scientific | 0 (0.0%) | 0 (0.0%) |
| Enterprise Management | 0 (0.0%) | 0 (0.0%) |
| Administrative & Support | 22 (100.0%) | 0 (0.0%) |
| Educational Services | 0 (0.0%) | 0 (0.0%) |
| Health Care & Social Assistance | 3 (30.0%) | 7 (70.0%) |
| Arts, Entertainment & Recreation | 0 (0.0%) | 0 (0.0%) |
| Accommodation & Food Services | 2 (100.0%) | 0 (0.0%) |
| Public Administration | 0 (0.0%) | 0 (0.0%) |
| Total | 50 (73.5%) | 18 (26.5%) |
Education in Grand Marsh
School Enrollment in Grand Marsh
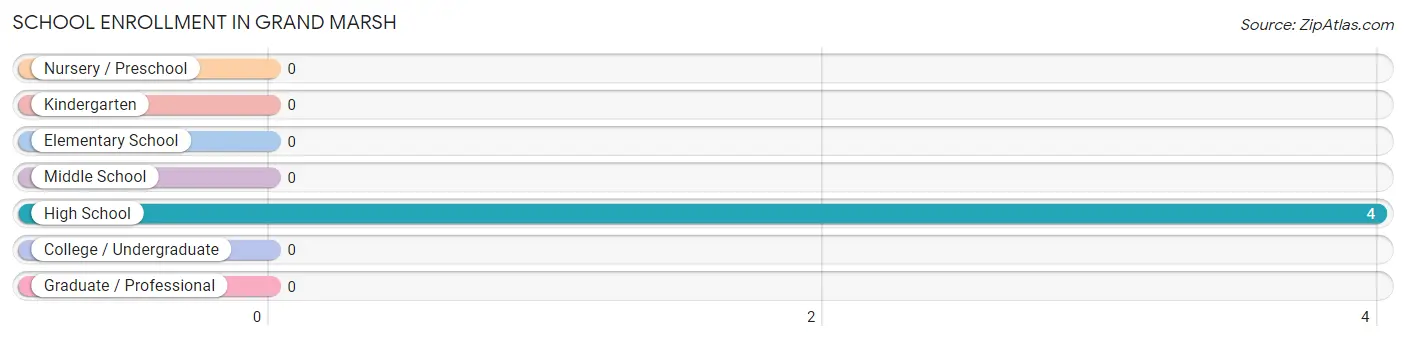
| School Level | # Students | % Students |
| Nursery / Preschool | 0 | 0.0% |
| Kindergarten | 0 | 0.0% |
| Elementary School | 0 | 0.0% |
| Middle School | 0 | 0.0% |
| High School | 4 | 100.0% |
| College / Undergraduate | 0 | 0.0% |
| Graduate / Professional | 0 | 0.0% |
| Total | 4 | 100.0% |
School Enrollment by Age by Funding Source in Grand Marsh
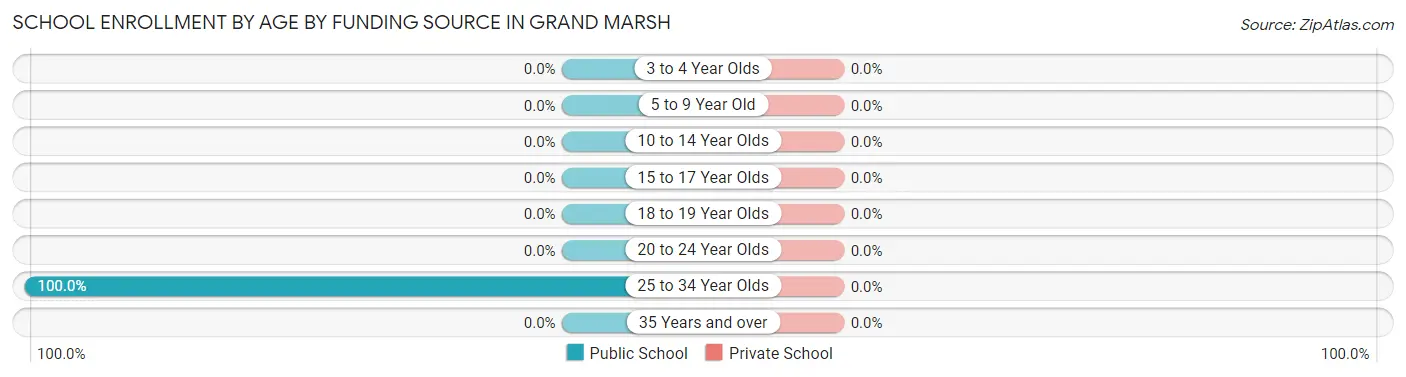
| Age Bracket | Public School | Private School |
| 3 to 4 Year Olds | 0 (0.0%) | 0 (0.0%) |
| 5 to 9 Year Old | 0 (0.0%) | 0 (0.0%) |
| 10 to 14 Year Olds | 0 (0.0%) | 0 (0.0%) |
| 15 to 17 Year Olds | 0 (0.0%) | 0 (0.0%) |
| 18 to 19 Year Olds | 0 (0.0%) | 0 (0.0%) |
| 20 to 24 Year Olds | 0 (0.0%) | 0 (0.0%) |
| 25 to 34 Year Olds | 4 (100.0%) | 0 (0.0%) |
| 35 Years and over | 0 (0.0%) | 0 (0.0%) |
| Total | 4 (100.0%) | 0 (0.0%) |
Educational Attainment by Field of Study in Grand Marsh
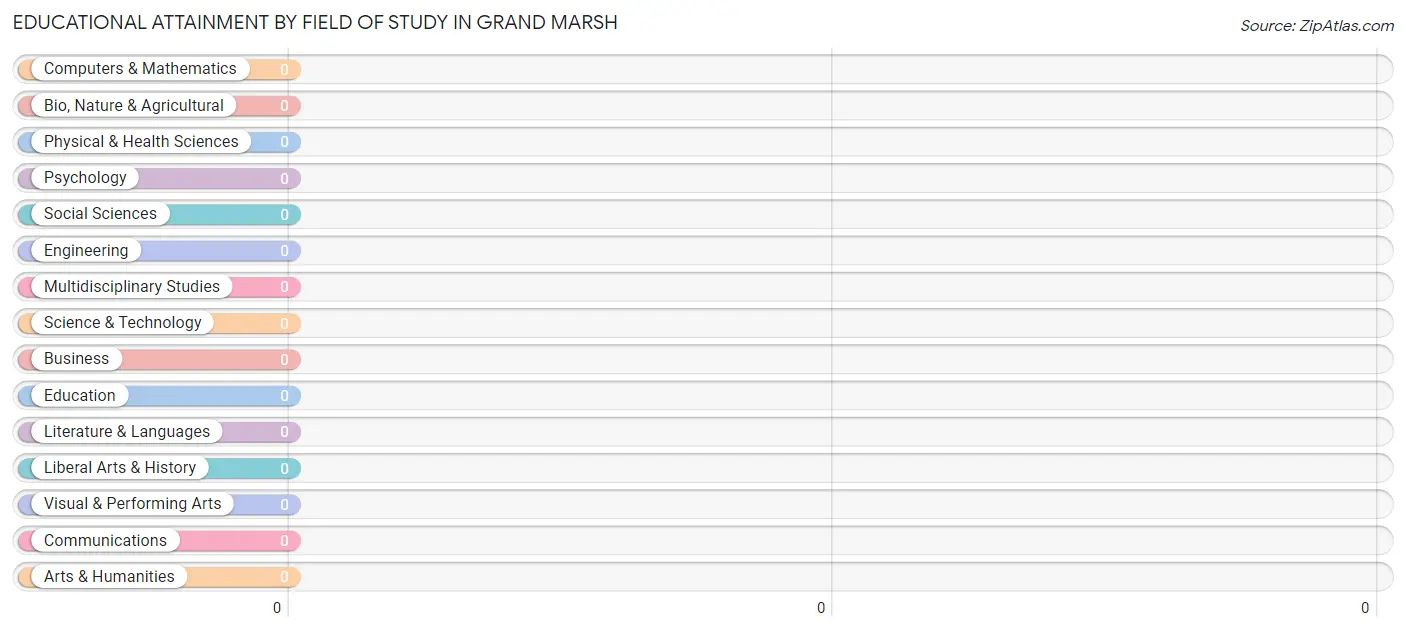
| Field of Study | # Graduates | % Graduates |
| Computers & Mathematics | 0 | 0.0% |
| Bio, Nature & Agricultural | 0 | 0.0% |
| Physical & Health Sciences | 0 | 0.0% |
| Psychology | 0 | 0.0% |
| Social Sciences | 0 | 0.0% |
| Engineering | 0 | 0.0% |
| Multidisciplinary Studies | 0 | 0.0% |
| Science & Technology | 0 | 0.0% |
| Business | 0 | 0.0% |
| Education | 0 | 0.0% |
| Literature & Languages | 0 | 0.0% |
| Liberal Arts & History | 0 | 0.0% |
| Visual & Performing Arts | 0 | 0.0% |
| Communications | 0 | 0.0% |
| Arts & Humanities | 0 | 0.0% |
| Total | 0 | 0.0% |
Transportation & Commute in Grand Marsh
Vehicle Availability by Sex in Grand Marsh
The most prevalent vehicle ownership categories in Grand Marsh are males with 3 vehicles (25, accounting for 52.1%) and females with 3 vehicles (0, making up 138.9%).
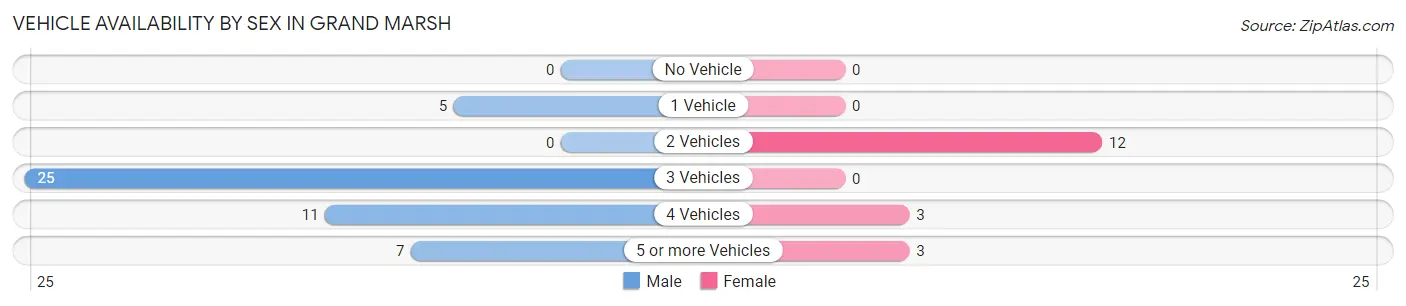
| Vehicles Available | Male | Female |
| No Vehicle | 0 (0.0%) | 0 (0.0%) |
| 1 Vehicle | 5 (10.4%) | 0 (0.0%) |
| 2 Vehicles | 0 (0.0%) | 12 (66.7%) |
| 3 Vehicles | 25 (52.1%) | 0 (0.0%) |
| 4 Vehicles | 11 (22.9%) | 3 (16.7%) |
| 5 or more Vehicles | 7 (14.6%) | 3 (16.7%) |
| Total | 48 (100.0%) | 18 (100.0%) |
Commute Time in Grand Marsh
The most frequently occuring commute durations in Grand Marsh are 40 to 44 minutes (34 commuters, 51.5%), 15 to 19 minutes (10 commuters, 15.1%), and 10 to 14 minutes (7 commuters, 10.6%).
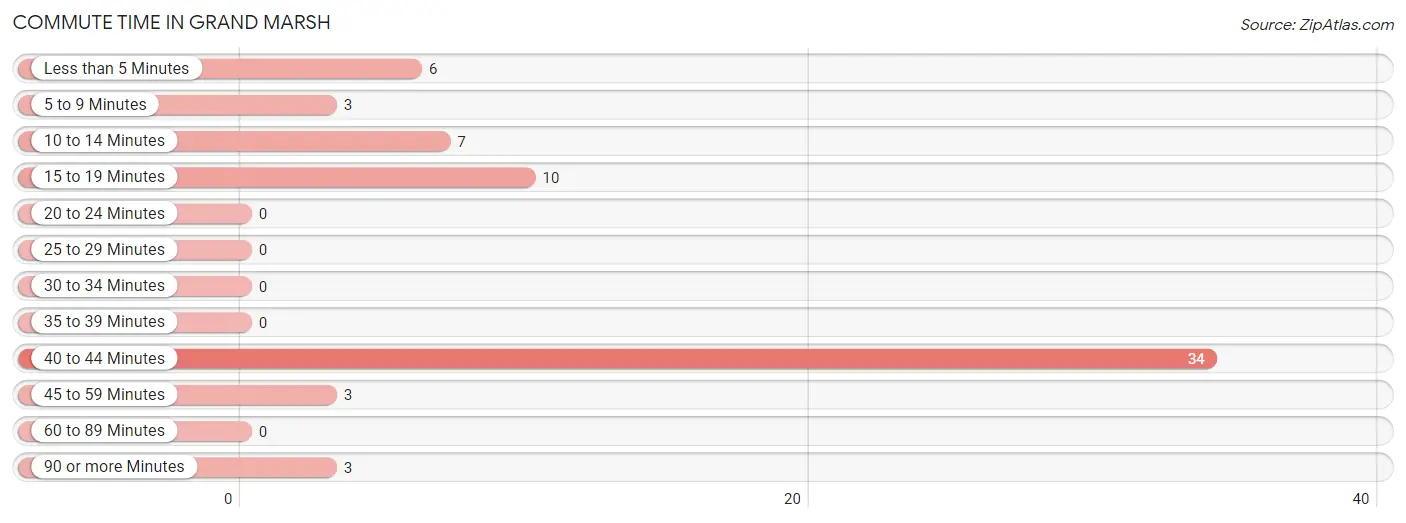
| Commute Time | # Commuters | % Commuters |
| Less than 5 Minutes | 6 | 9.1% |
| 5 to 9 Minutes | 3 | 4.5% |
| 10 to 14 Minutes | 7 | 10.6% |
| 15 to 19 Minutes | 10 | 15.1% |
| 20 to 24 Minutes | 0 | 0.0% |
| 25 to 29 Minutes | 0 | 0.0% |
| 30 to 34 Minutes | 0 | 0.0% |
| 35 to 39 Minutes | 0 | 0.0% |
| 40 to 44 Minutes | 34 | 51.5% |
| 45 to 59 Minutes | 3 | 4.5% |
| 60 to 89 Minutes | 0 | 0.0% |
| 90 or more Minutes | 3 | 4.5% |
Commute Time by Sex in Grand Marsh
The most common commute times in Grand Marsh are 40 to 44 minutes (32 commuters, 66.7%) for males and 10 to 14 minutes (7 commuters, 38.9%) for females.
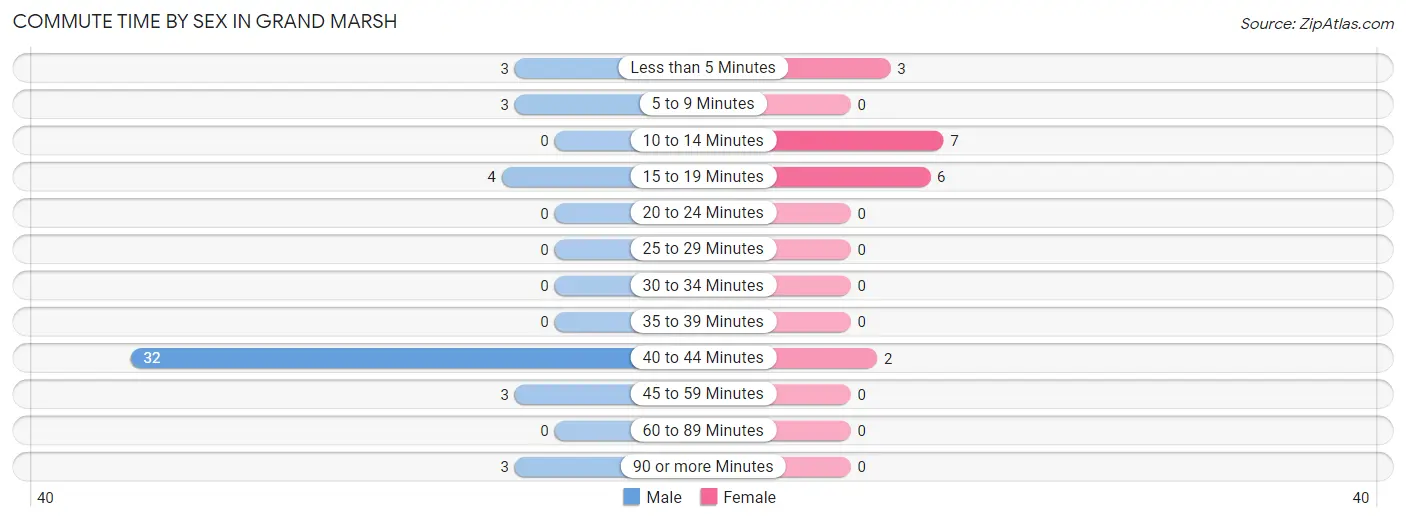
| Commute Time | Male | Female |
| Less than 5 Minutes | 3 (6.2%) | 3 (16.7%) |
| 5 to 9 Minutes | 3 (6.2%) | 0 (0.0%) |
| 10 to 14 Minutes | 0 (0.0%) | 7 (38.9%) |
| 15 to 19 Minutes | 4 (8.3%) | 6 (33.3%) |
| 20 to 24 Minutes | 0 (0.0%) | 0 (0.0%) |
| 25 to 29 Minutes | 0 (0.0%) | 0 (0.0%) |
| 30 to 34 Minutes | 0 (0.0%) | 0 (0.0%) |
| 35 to 39 Minutes | 0 (0.0%) | 0 (0.0%) |
| 40 to 44 Minutes | 32 (66.7%) | 2 (11.1%) |
| 45 to 59 Minutes | 3 (6.2%) | 0 (0.0%) |
| 60 to 89 Minutes | 0 (0.0%) | 0 (0.0%) |
| 90 or more Minutes | 3 (6.2%) | 0 (0.0%) |
Time of Departure to Work by Sex in Grand Marsh
The most frequent times of departure to work in Grand Marsh are 5:00 AM to 5:29 AM (28, 58.3%) for males and 6:30 AM to 6:59 AM (7, 38.9%) for females.
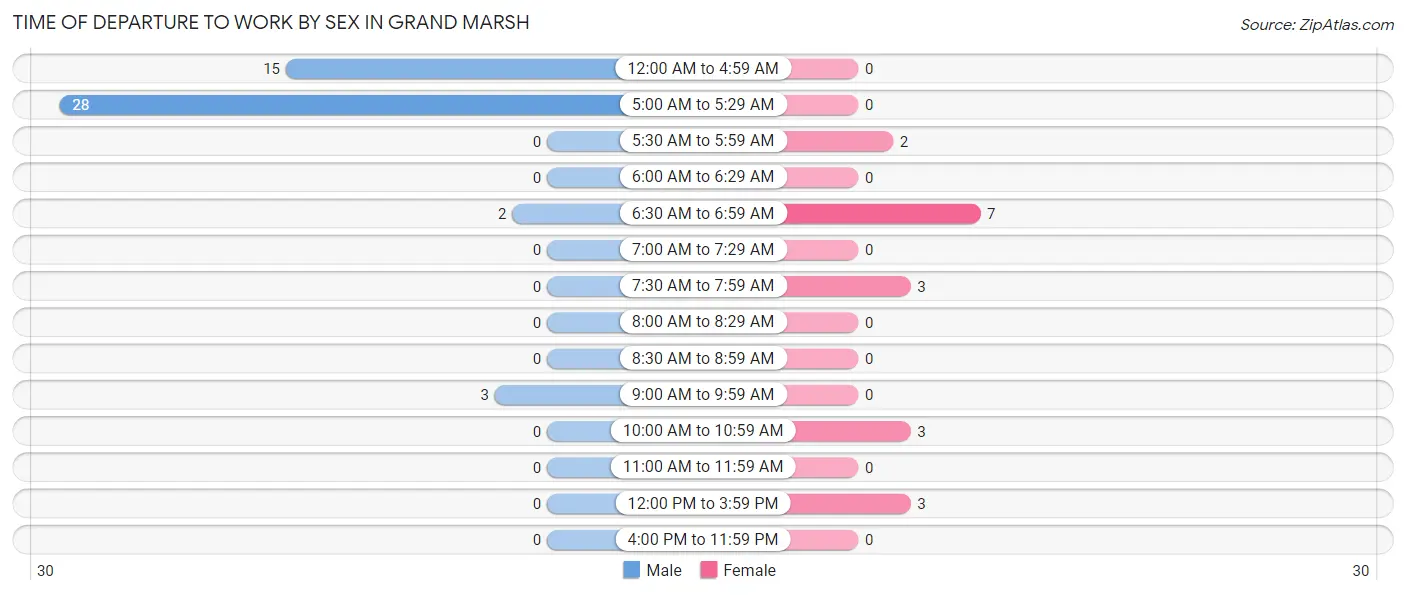
| Time of Departure | Male | Female |
| 12:00 AM to 4:59 AM | 15 (31.2%) | 0 (0.0%) |
| 5:00 AM to 5:29 AM | 28 (58.3%) | 0 (0.0%) |
| 5:30 AM to 5:59 AM | 0 (0.0%) | 2 (11.1%) |
| 6:00 AM to 6:29 AM | 0 (0.0%) | 0 (0.0%) |
| 6:30 AM to 6:59 AM | 2 (4.2%) | 7 (38.9%) |
| 7:00 AM to 7:29 AM | 0 (0.0%) | 0 (0.0%) |
| 7:30 AM to 7:59 AM | 0 (0.0%) | 3 (16.7%) |
| 8:00 AM to 8:29 AM | 0 (0.0%) | 0 (0.0%) |
| 8:30 AM to 8:59 AM | 0 (0.0%) | 0 (0.0%) |
| 9:00 AM to 9:59 AM | 3 (6.2%) | 0 (0.0%) |
| 10:00 AM to 10:59 AM | 0 (0.0%) | 3 (16.7%) |
| 11:00 AM to 11:59 AM | 0 (0.0%) | 0 (0.0%) |
| 12:00 PM to 3:59 PM | 0 (0.0%) | 3 (16.7%) |
| 4:00 PM to 11:59 PM | 0 (0.0%) | 0 (0.0%) |
| Total | 48 (100.0%) | 18 (100.0%) |
Housing Occupancy in Grand Marsh
Occupancy by Ownership in Grand Marsh
Of the total 45 dwellings in Grand Marsh, owner-occupied units account for 45 (100.0%), while renter-occupied units make up 0 (0.0%).
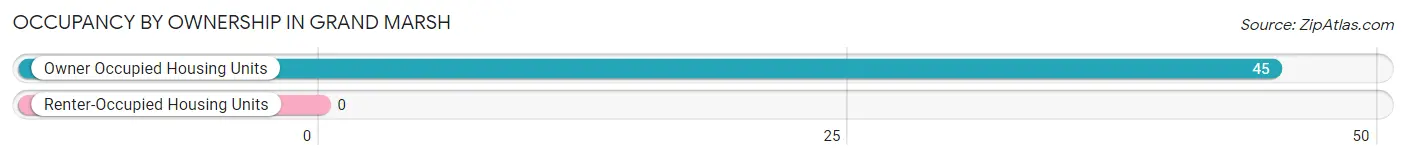
| Occupancy | # Housing Units | % Housing Units |
| Owner Occupied Housing Units | 45 | 100.0% |
| Renter-Occupied Housing Units | 0 | 0.0% |
| Total Occupied Housing Units | 45 | 100.0% |
Occupancy by Household Size in Grand Marsh
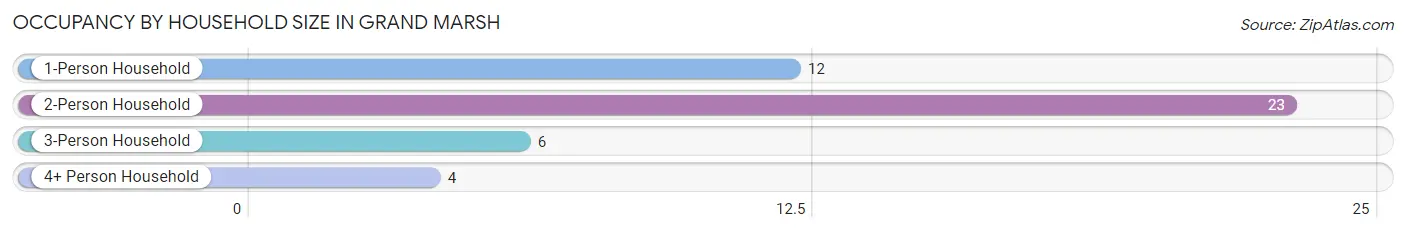
| Household Size | # Housing Units | % Housing Units |
| 1-Person Household | 12 | 26.7% |
| 2-Person Household | 23 | 51.1% |
| 3-Person Household | 6 | 13.3% |
| 4+ Person Household | 4 | 8.9% |
| Total Housing Units | 45 | 100.0% |
Occupancy by Ownership by Household Size in Grand Marsh
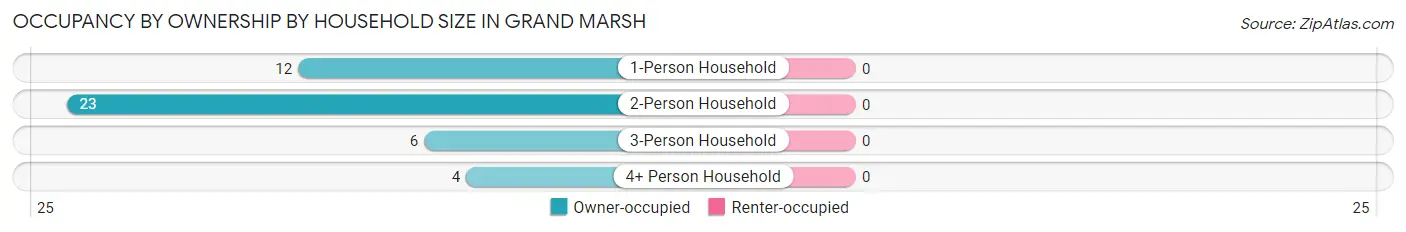
| Household Size | Owner-occupied | Renter-occupied |
| 1-Person Household | 12 (100.0%) | 0 (0.0%) |
| 2-Person Household | 23 (100.0%) | 0 (0.0%) |
| 3-Person Household | 6 (100.0%) | 0 (0.0%) |
| 4+ Person Household | 4 (100.0%) | 0 (0.0%) |
| Total Housing Units | 45 (100.0%) | 0 (0.0%) |
Occupancy by Educational Attainment in Grand Marsh
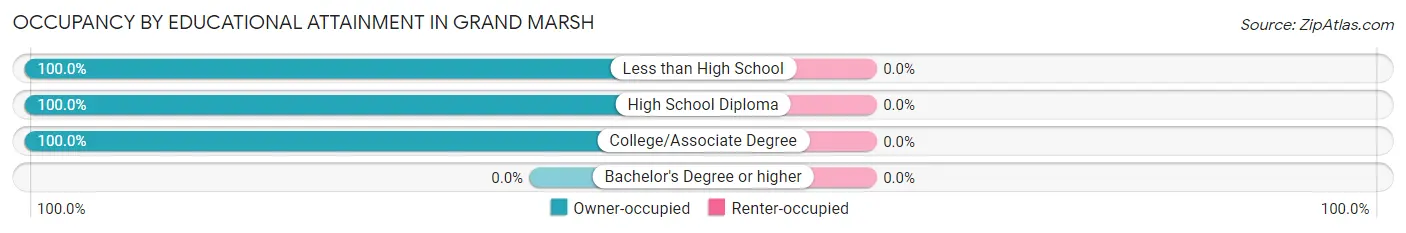
| Household Size | Owner-occupied | Renter-occupied |
| Less than High School | 19 (100.0%) | 0 (0.0%) |
| High School Diploma | 4 (100.0%) | 0 (0.0%) |
| College/Associate Degree | 22 (100.0%) | 0 (0.0%) |
| Bachelor's Degree or higher | 0 (0.0%) | 0 (0.0%) |
Occupancy by Age of Householder in Grand Marsh
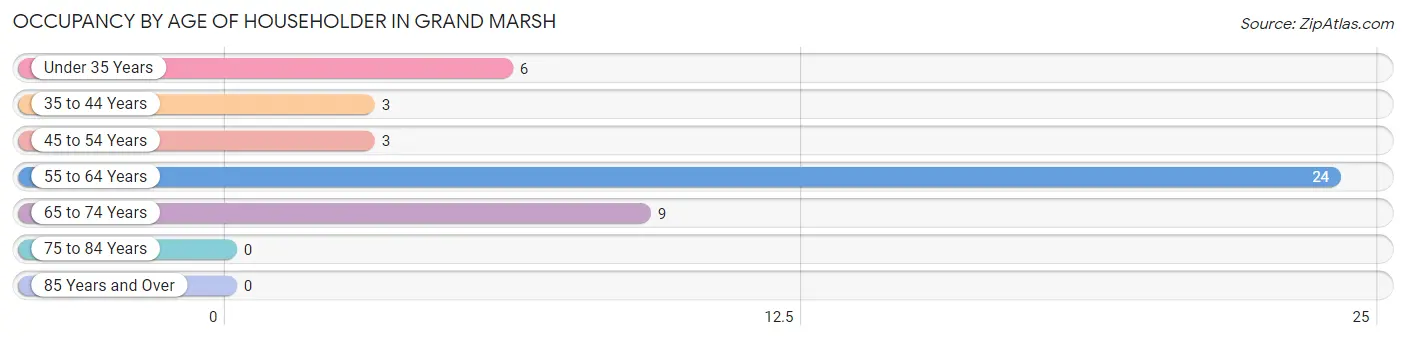
| Age Bracket | # Households | % Households |
| Under 35 Years | 6 | 13.3% |
| 35 to 44 Years | 3 | 6.7% |
| 45 to 54 Years | 3 | 6.7% |
| 55 to 64 Years | 24 | 53.3% |
| 65 to 74 Years | 9 | 20.0% |
| 75 to 84 Years | 0 | 0.0% |
| 85 Years and Over | 0 | 0.0% |
| Total | 45 | 100.0% |
Housing Finances in Grand Marsh
Median Income by Occupancy in Grand Marsh
| Occupancy Type | # Households | Median Income |
| Owner-Occupied | 45 (100.0%) | $0 |
| Renter-Occupied | 0 (0.0%) | $0 |
| Average | 45 (100.0%) | $0 |
Occupancy by Householder Income Bracket in Grand Marsh
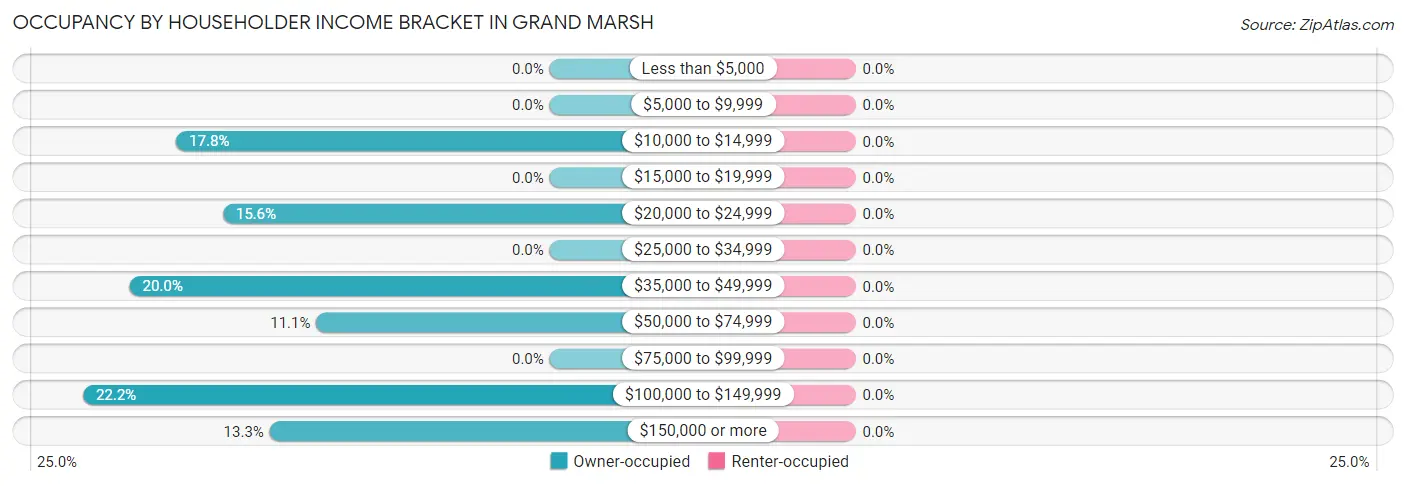
| Income Bracket | Owner-occupied | Renter-occupied |
| Less than $5,000 | 0 (0.0%) | 0 (0.0%) |
| $5,000 to $9,999 | 0 (0.0%) | 0 (0.0%) |
| $10,000 to $14,999 | 8 (17.8%) | 0 (0.0%) |
| $15,000 to $19,999 | 0 (0.0%) | 0 (0.0%) |
| $20,000 to $24,999 | 7 (15.6%) | 0 (0.0%) |
| $25,000 to $34,999 | 0 (0.0%) | 0 (0.0%) |
| $35,000 to $49,999 | 9 (20.0%) | 0 (0.0%) |
| $50,000 to $74,999 | 5 (11.1%) | 0 (0.0%) |
| $75,000 to $99,999 | 0 (0.0%) | 0 (0.0%) |
| $100,000 to $149,999 | 10 (22.2%) | 0 (0.0%) |
| $150,000 or more | 6 (13.3%) | 0 (0.0%) |
| Total | 45 (100.0%) | 0 (0.0%) |
Monthly Housing Cost Tiers in Grand Marsh
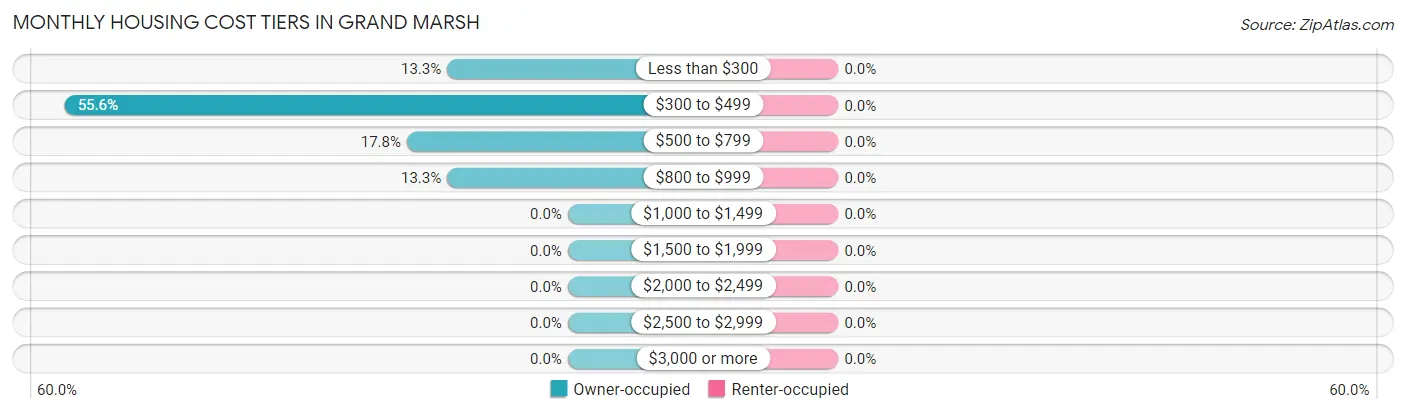
| Monthly Cost | Owner-occupied | Renter-occupied |
| Less than $300 | 6 (13.3%) | 0 (0.0%) |
| $300 to $499 | 25 (55.6%) | 0 (0.0%) |
| $500 to $799 | 8 (17.8%) | 0 (0.0%) |
| $800 to $999 | 6 (13.3%) | 0 (0.0%) |
| $1,000 to $1,499 | 0 (0.0%) | 0 (0.0%) |
| $1,500 to $1,999 | 0 (0.0%) | 0 (0.0%) |
| $2,000 to $2,499 | 0 (0.0%) | 0 (0.0%) |
| $2,500 to $2,999 | 0 (0.0%) | 0 (0.0%) |
| $3,000 or more | 0 (0.0%) | 0 (0.0%) |
| Total | 45 (100.0%) | 0 (0.0%) |
Physical Housing Characteristics in Grand Marsh
Housing Structures in Grand Marsh
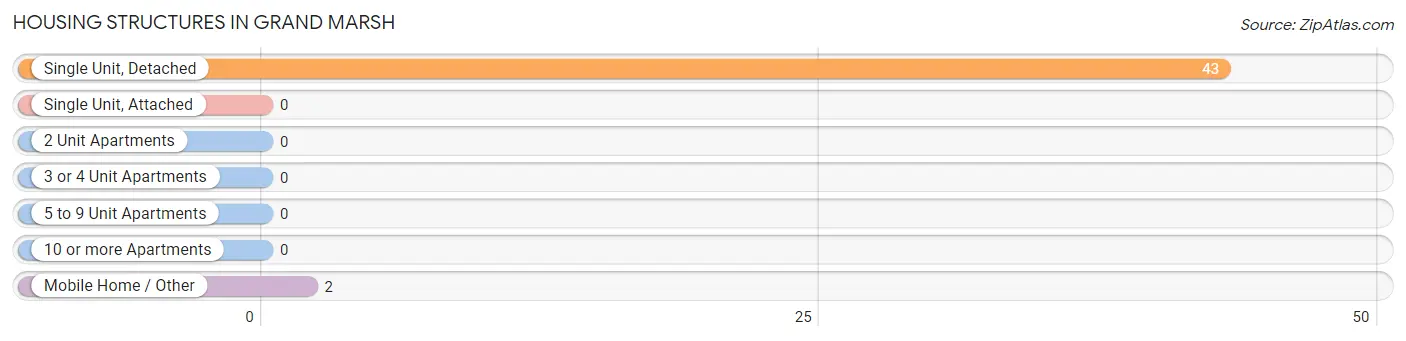
| Structure Type | # Housing Units | % Housing Units |
| Single Unit, Detached | 43 | 95.6% |
| Single Unit, Attached | 0 | 0.0% |
| 2 Unit Apartments | 0 | 0.0% |
| 3 or 4 Unit Apartments | 0 | 0.0% |
| 5 to 9 Unit Apartments | 0 | 0.0% |
| 10 or more Apartments | 0 | 0.0% |
| Mobile Home / Other | 2 | 4.4% |
| Total | 45 | 100.0% |
Housing Structures by Occupancy in Grand Marsh
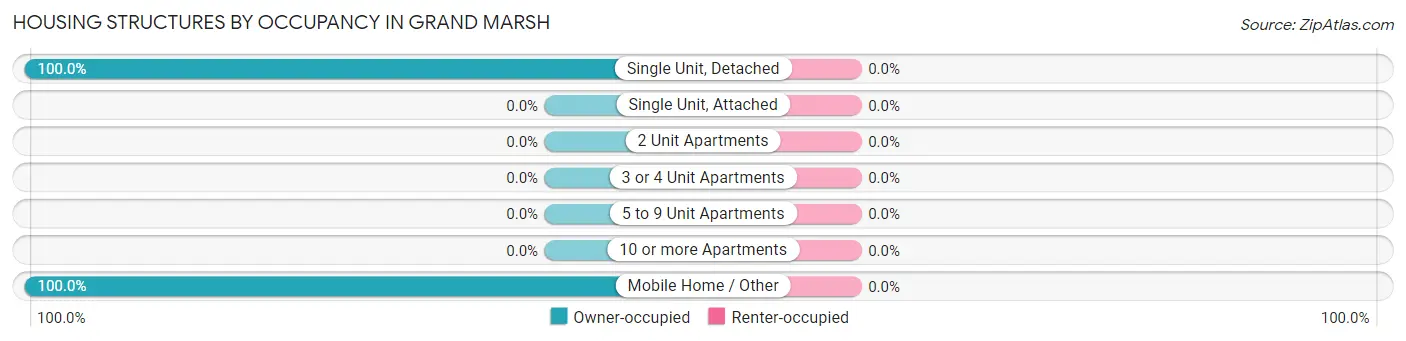
| Structure Type | Owner-occupied | Renter-occupied |
| Single Unit, Detached | 43 (100.0%) | 0 (0.0%) |
| Single Unit, Attached | 0 (0.0%) | 0 (0.0%) |
| 2 Unit Apartments | 0 (0.0%) | 0 (0.0%) |
| 3 or 4 Unit Apartments | 0 (0.0%) | 0 (0.0%) |
| 5 to 9 Unit Apartments | 0 (0.0%) | 0 (0.0%) |
| 10 or more Apartments | 0 (0.0%) | 0 (0.0%) |
| Mobile Home / Other | 2 (100.0%) | 0 (0.0%) |
| Total | 45 (100.0%) | 0 (0.0%) |
Housing Structures by Number of Rooms in Grand Marsh
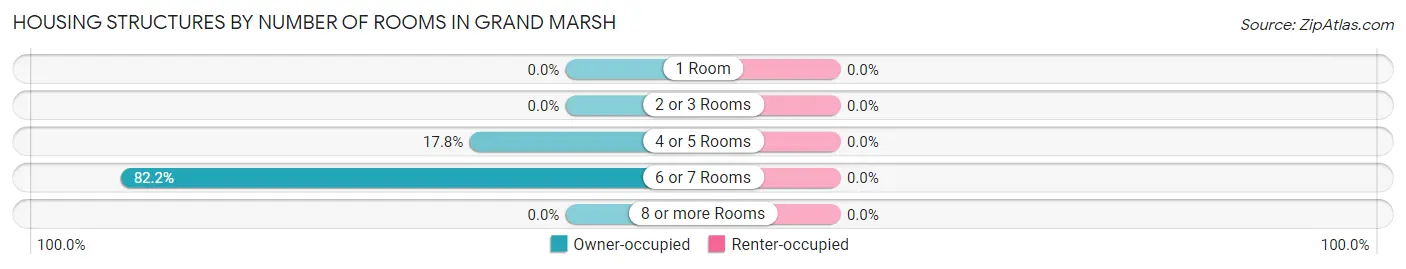
| Number of Rooms | Owner-occupied | Renter-occupied |
| 1 Room | 0 (0.0%) | 0 (0.0%) |
| 2 or 3 Rooms | 0 (0.0%) | 0 (0.0%) |
| 4 or 5 Rooms | 8 (17.8%) | 0 (0.0%) |
| 6 or 7 Rooms | 37 (82.2%) | 0 (0.0%) |
| 8 or more Rooms | 0 (0.0%) | 0 (0.0%) |
| Total | 45 (100.0%) | 0 (0.0%) |
Housing Structure by Heating Type in Grand Marsh
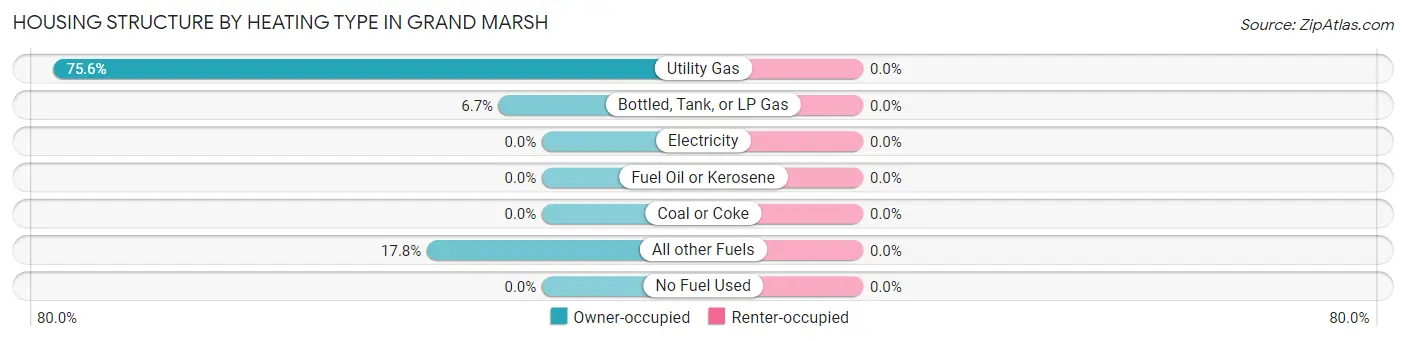
| Heating Type | Owner-occupied | Renter-occupied |
| Utility Gas | 34 (75.6%) | 0 (0.0%) |
| Bottled, Tank, or LP Gas | 3 (6.7%) | 0 (0.0%) |
| Electricity | 0 (0.0%) | 0 (0.0%) |
| Fuel Oil or Kerosene | 0 (0.0%) | 0 (0.0%) |
| Coal or Coke | 0 (0.0%) | 0 (0.0%) |
| All other Fuels | 8 (17.8%) | 0 (0.0%) |
| No Fuel Used | 0 (0.0%) | 0 (0.0%) |
| Total | 45 (100.0%) | 0 (0.0%) |
Household Vehicle Usage in Grand Marsh
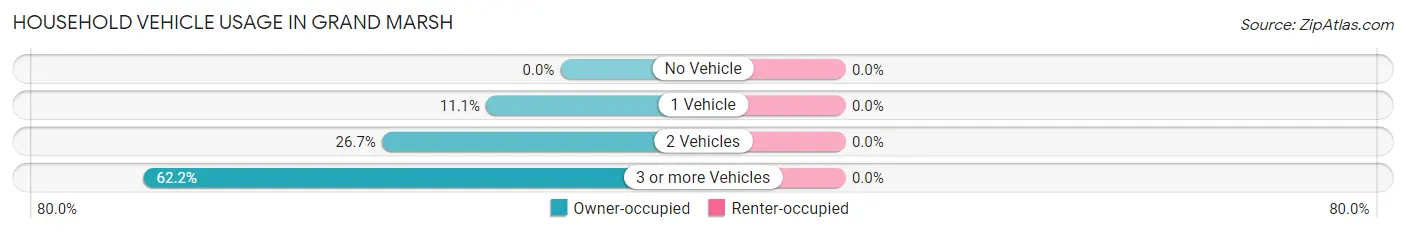
| Vehicles per Household | Owner-occupied | Renter-occupied |
| No Vehicle | 0 (0.0%) | 0 (0.0%) |
| 1 Vehicle | 5 (11.1%) | 0 (0.0%) |
| 2 Vehicles | 12 (26.7%) | 0 (0.0%) |
| 3 or more Vehicles | 28 (62.2%) | 0 (0.0%) |
| Total | 45 (100.0%) | 0 (0.0%) |
Real Estate & Mortgages in Grand Marsh
Real Estate and Mortgage Overview in Grand Marsh
| Characteristic | Without Mortgage | With Mortgage |
| Housing Units | 15 | 30 |
| Median Property Value | - | - |
| Median Household Income | - | - |
| Monthly Housing Costs | $375 | $0 |
| Real Estate Taxes | $967 | $0 |
Property Value by Mortgage Status in Grand Marsh
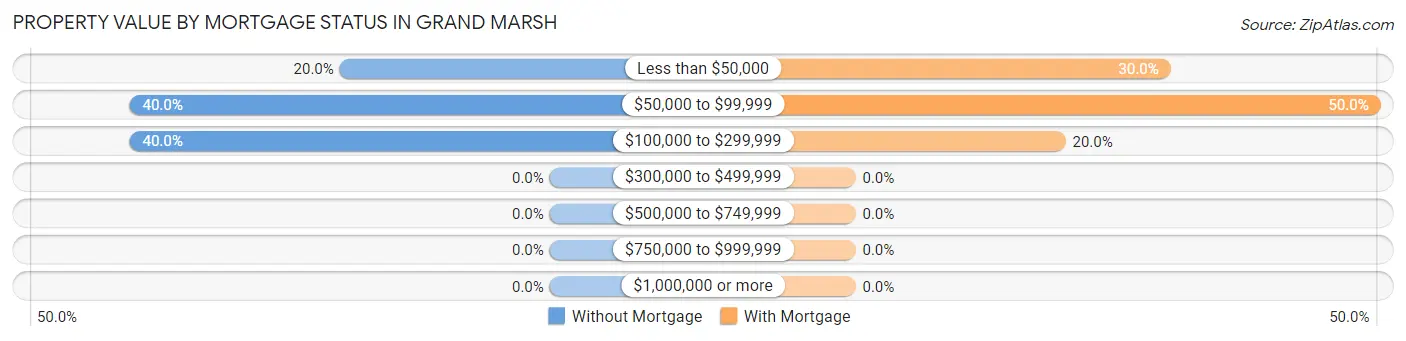
| Property Value | Without Mortgage | With Mortgage |
| Less than $50,000 | 3 (20.0%) | 9 (30.0%) |
| $50,000 to $99,999 | 6 (40.0%) | 15 (50.0%) |
| $100,000 to $299,999 | 6 (40.0%) | 6 (20.0%) |
| $300,000 to $499,999 | 0 (0.0%) | 0 (0.0%) |
| $500,000 to $749,999 | 0 (0.0%) | 0 (0.0%) |
| $750,000 to $999,999 | 0 (0.0%) | 0 (0.0%) |
| $1,000,000 or more | 0 (0.0%) | 0 (0.0%) |
| Total | 15 (100.0%) | 30 (100.0%) |
Household Income by Mortgage Status in Grand Marsh
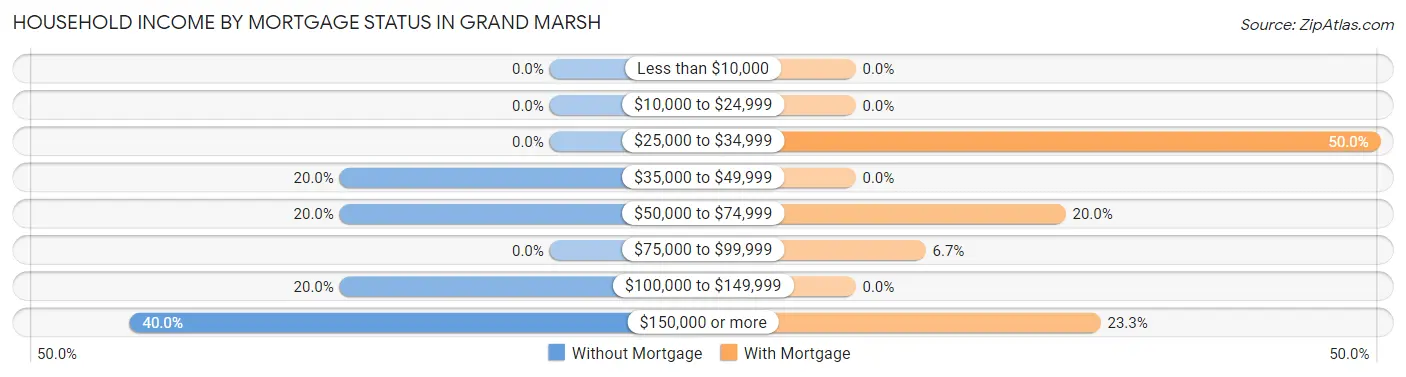
| Household Income | Without Mortgage | With Mortgage |
| Less than $10,000 | 0 (0.0%) | 0 (0.0%) |
| $10,000 to $24,999 | 0 (0.0%) | 0 (0.0%) |
| $25,000 to $34,999 | 0 (0.0%) | 15 (50.0%) |
| $35,000 to $49,999 | 3 (20.0%) | 0 (0.0%) |
| $50,000 to $74,999 | 3 (20.0%) | 6 (20.0%) |
| $75,000 to $99,999 | 0 (0.0%) | 2 (6.7%) |
| $100,000 to $149,999 | 3 (20.0%) | 0 (0.0%) |
| $150,000 or more | 6 (40.0%) | 7 (23.3%) |
| Total | 15 (100.0%) | 30 (100.0%) |
Property Value to Household Income Ratio in Grand Marsh
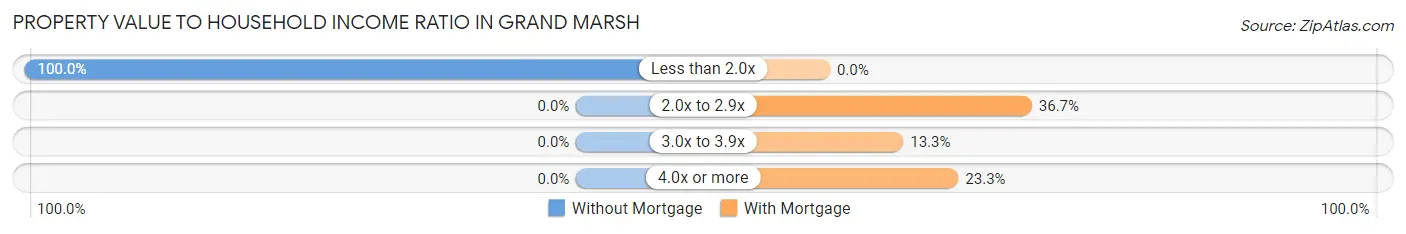
| Value-to-Income Ratio | Without Mortgage | With Mortgage |
| Less than 2.0x | 15 (100.0%) | 0 (0.0%) |
| 2.0x to 2.9x | 0 (0.0%) | 11 (36.7%) |
| 3.0x to 3.9x | 0 (0.0%) | 4 (13.3%) |
| 4.0x or more | 0 (0.0%) | 7 (23.3%) |
| Total | 15 (100.0%) | 30 (100.0%) |
Real Estate Taxes by Mortgage Status in Grand Marsh
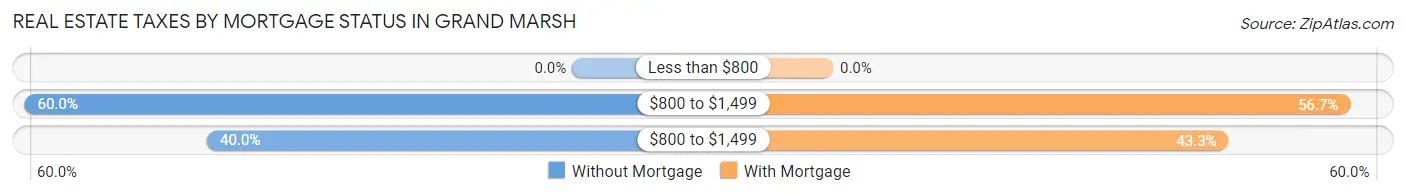
| Property Taxes | Without Mortgage | With Mortgage |
| Less than $800 | 0 (0.0%) | 0 (0.0%) |
| $800 to $1,499 | 9 (60.0%) | 17 (56.7%) |
| $800 to $1,499 | 6 (40.0%) | 13 (43.3%) |
| Total | 15 (100.0%) | 30 (100.0%) |
Health & Disability in Grand Marsh
Health Insurance Coverage by Age in Grand Marsh
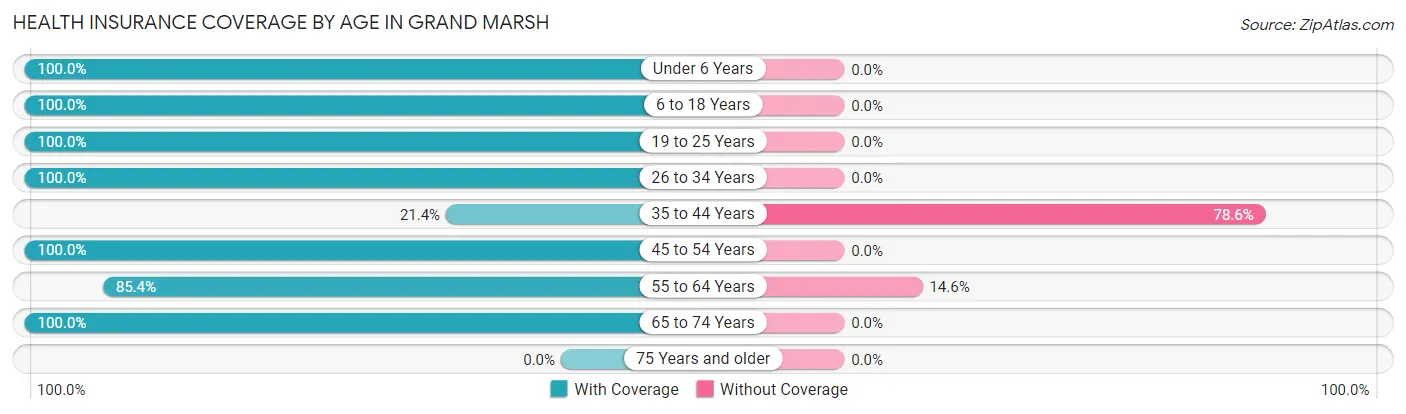
| Age Bracket | With Coverage | Without Coverage |
| Under 6 Years | 18 (100.0%) | 0 (0.0%) |
| 6 to 18 Years | 10 (100.0%) | 0 (0.0%) |
| 19 to 25 Years | 4 (100.0%) | 0 (0.0%) |
| 26 to 34 Years | 8 (100.0%) | 0 (0.0%) |
| 35 to 44 Years | 6 (21.4%) | 22 (78.6%) |
| 45 to 54 Years | 6 (100.0%) | 0 (0.0%) |
| 55 to 64 Years | 41 (85.4%) | 7 (14.6%) |
| 65 to 74 Years | 9 (100.0%) | 0 (0.0%) |
| 75 Years and older | 0 (0.0%) | 0 (0.0%) |
| Total | 102 (77.9%) | 29 (22.1%) |
Health Insurance Coverage by Citizenship Status in Grand Marsh
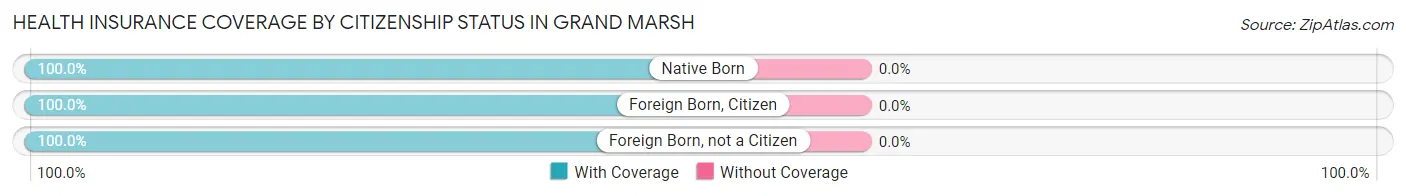
| Citizenship Status | With Coverage | Without Coverage |
| Native Born | 18 (100.0%) | 0 (0.0%) |
| Foreign Born, Citizen | 10 (100.0%) | 0 (0.0%) |
| Foreign Born, not a Citizen | 4 (100.0%) | 0 (0.0%) |
Health Insurance Coverage by Household Income in Grand Marsh
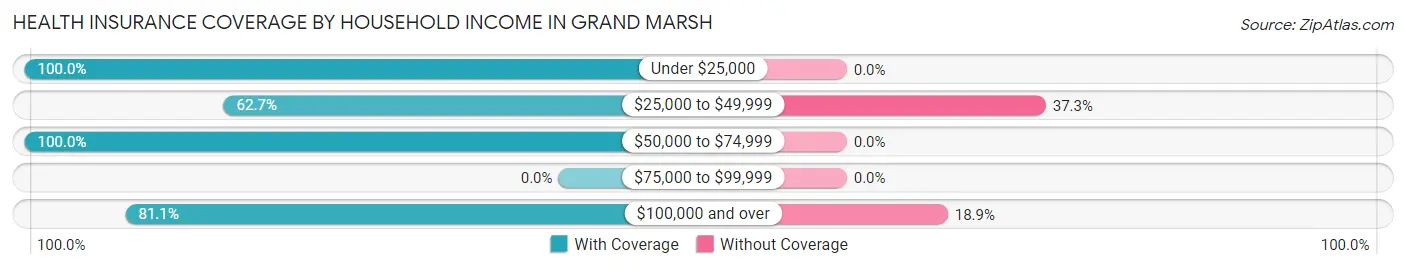
| Household Income | With Coverage | Without Coverage |
| Under $25,000 | 24 (100.0%) | 0 (0.0%) |
| $25,000 to $49,999 | 37 (62.7%) | 22 (37.3%) |
| $50,000 to $74,999 | 11 (100.0%) | 0 (0.0%) |
| $75,000 to $99,999 | 0 (0.0%) | 0 (0.0%) |
| $100,000 and over | 30 (81.1%) | 7 (18.9%) |
Public vs Private Health Insurance Coverage by Age in Grand Marsh
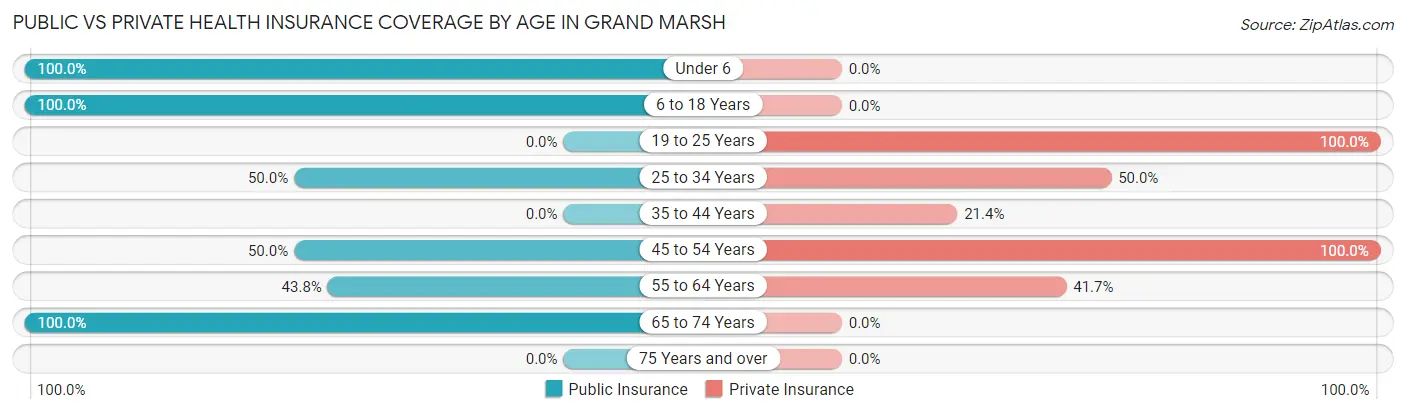
| Age Bracket | Public Insurance | Private Insurance |
| Under 6 | 18 (100.0%) | 0 (0.0%) |
| 6 to 18 Years | 10 (100.0%) | 0 (0.0%) |
| 19 to 25 Years | 0 (0.0%) | 4 (100.0%) |
| 25 to 34 Years | 4 (50.0%) | 4 (50.0%) |
| 35 to 44 Years | 0 (0.0%) | 6 (21.4%) |
| 45 to 54 Years | 3 (50.0%) | 6 (100.0%) |
| 55 to 64 Years | 21 (43.8%) | 20 (41.7%) |
| 65 to 74 Years | 9 (100.0%) | 0 (0.0%) |
| 75 Years and over | 0 (0.0%) | 0 (0.0%) |
| Total | 65 (49.6%) | 40 (30.5%) |
Disability Status by Sex by Age in Grand Marsh
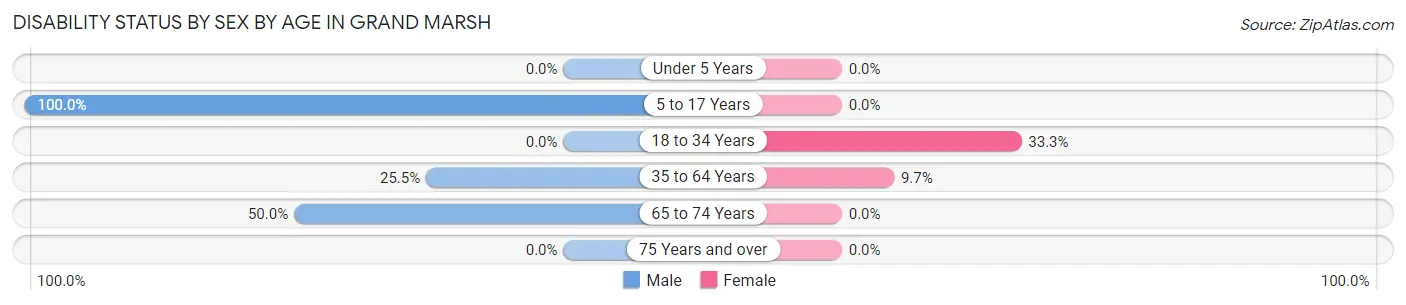
| Age Bracket | Male | Female |
| Under 5 Years | 0 (0.0%) | 0 (0.0%) |
| 5 to 17 Years | 10 (100.0%) | 0 (0.0%) |
| 18 to 34 Years | 0 (0.0%) | 2 (33.3%) |
| 35 to 64 Years | 13 (25.5%) | 3 (9.7%) |
| 65 to 74 Years | 3 (50.0%) | 0 (0.0%) |
| 75 Years and over | 0 (0.0%) | 0 (0.0%) |
Disability Class by Sex by Age in Grand Marsh
Disability Class: Hearing Difficulty
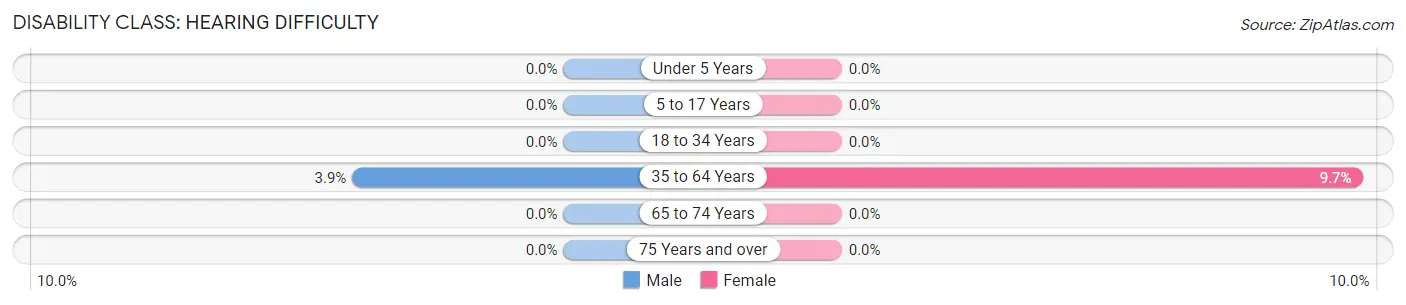
| Age Bracket | Male | Female |
| Under 5 Years | 0 (0.0%) | 0 (0.0%) |
| 5 to 17 Years | 0 (0.0%) | 0 (0.0%) |
| 18 to 34 Years | 0 (0.0%) | 0 (0.0%) |
| 35 to 64 Years | 2 (3.9%) | 3 (9.7%) |
| 65 to 74 Years | 0 (0.0%) | 0 (0.0%) |
| 75 Years and over | 0 (0.0%) | 0 (0.0%) |
Disability Class: Vision Difficulty
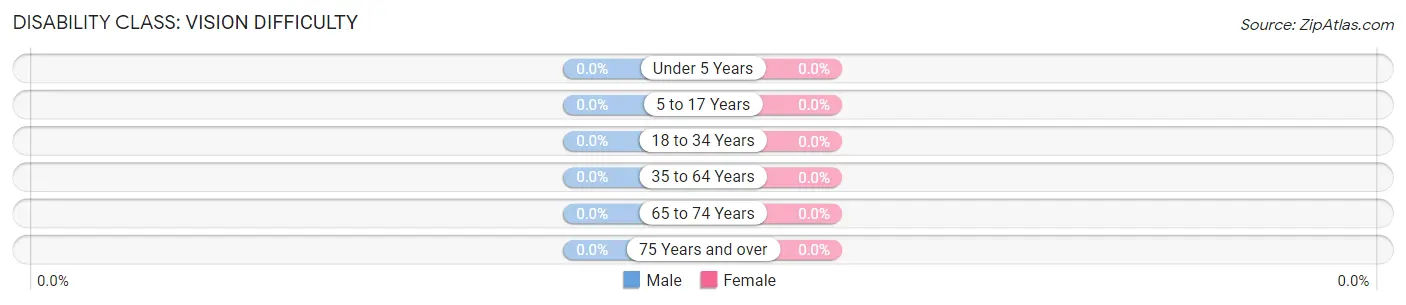
| Age Bracket | Male | Female |
| Under 5 Years | 0 (0.0%) | 0 (0.0%) |
| 5 to 17 Years | 0 (0.0%) | 0 (0.0%) |
| 18 to 34 Years | 0 (0.0%) | 0 (0.0%) |
| 35 to 64 Years | 0 (0.0%) | 0 (0.0%) |
| 65 to 74 Years | 0 (0.0%) | 0 (0.0%) |
| 75 Years and over | 0 (0.0%) | 0 (0.0%) |
Disability Class: Cognitive Difficulty
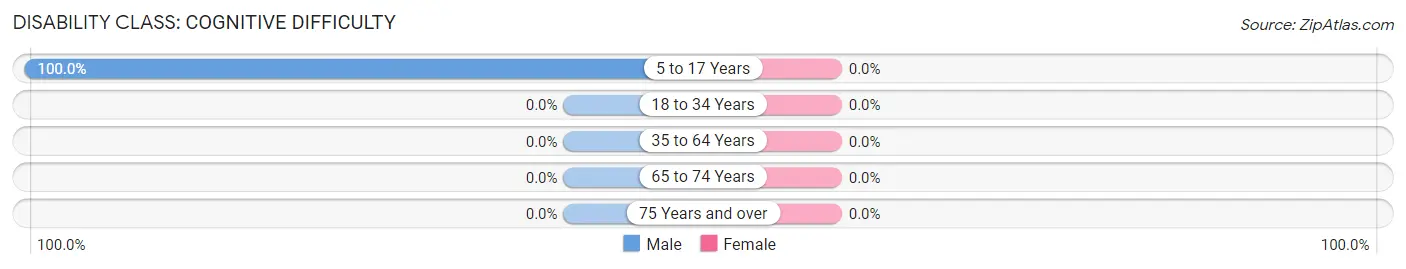
| Age Bracket | Male | Female |
| 5 to 17 Years | 10 (100.0%) | 0 (0.0%) |
| 18 to 34 Years | 0 (0.0%) | 0 (0.0%) |
| 35 to 64 Years | 0 (0.0%) | 0 (0.0%) |
| 65 to 74 Years | 0 (0.0%) | 0 (0.0%) |
| 75 Years and over | 0 (0.0%) | 0 (0.0%) |
Disability Class: Ambulatory Difficulty
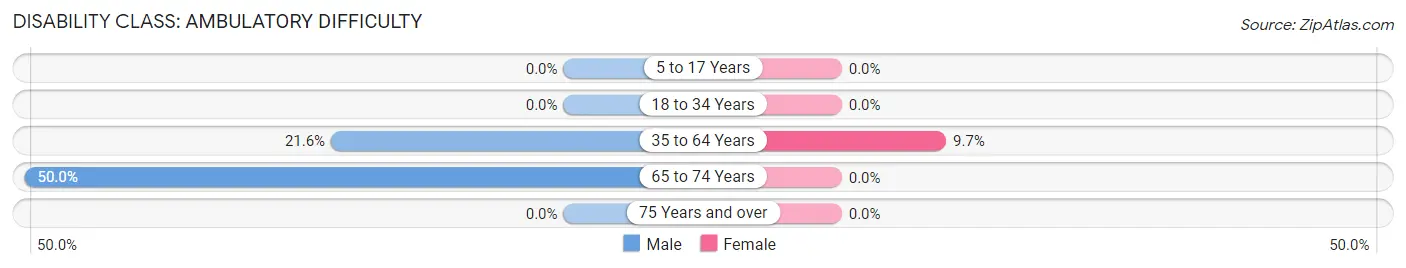
| Age Bracket | Male | Female |
| 5 to 17 Years | 0 (0.0%) | 0 (0.0%) |
| 18 to 34 Years | 0 (0.0%) | 0 (0.0%) |
| 35 to 64 Years | 11 (21.6%) | 3 (9.7%) |
| 65 to 74 Years | 3 (50.0%) | 0 (0.0%) |
| 75 Years and over | 0 (0.0%) | 0 (0.0%) |
Disability Class: Self-Care Difficulty
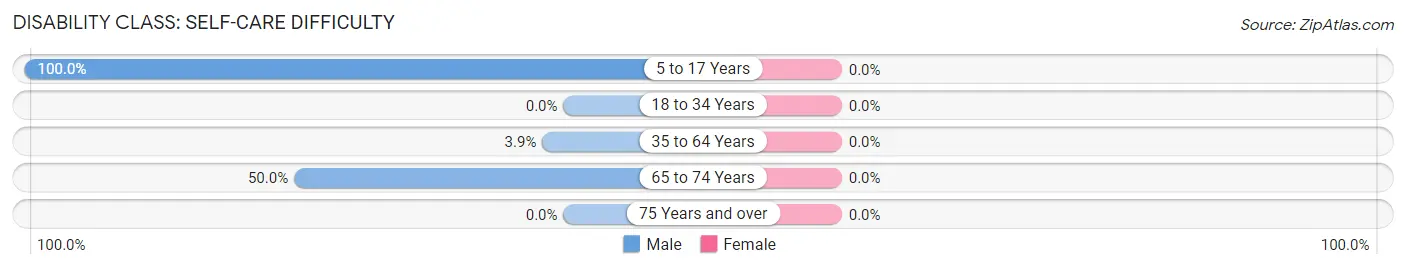
| Age Bracket | Male | Female |
| 5 to 17 Years | 10 (100.0%) | 0 (0.0%) |
| 18 to 34 Years | 0 (0.0%) | 0 (0.0%) |
| 35 to 64 Years | 2 (3.9%) | 0 (0.0%) |
| 65 to 74 Years | 3 (50.0%) | 0 (0.0%) |
| 75 Years and over | 0 (0.0%) | 0 (0.0%) |
Technology Access in Grand Marsh
Computing Device Access in Grand Marsh
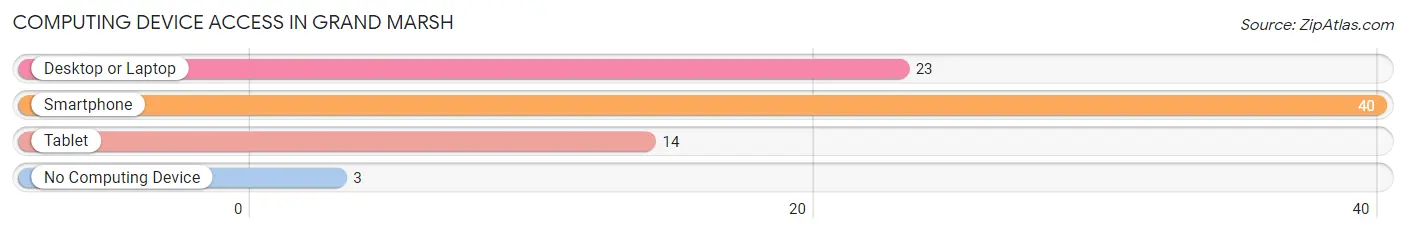
| Device Type | # Households | % Households |
| Desktop or Laptop | 23 | 51.1% |
| Smartphone | 40 | 88.9% |
| Tablet | 14 | 31.1% |
| No Computing Device | 3 | 6.7% |
| Total | 45 | 100.0% |
Internet Access in Grand Marsh
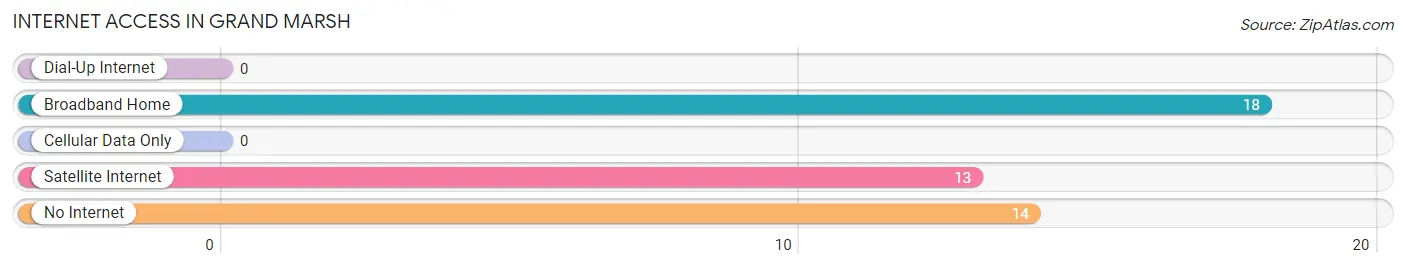
| Internet Type | # Households | % Households |
| Dial-Up Internet | 0 | 0.0% |
| Broadband Home | 18 | 40.0% |
| Cellular Data Only | 0 | 0.0% |
| Satellite Internet | 13 | 28.9% |
| No Internet | 14 | 31.1% |
| Total | 45 | 100.0% |
Grand Marsh Summary
Grand Marsh is a small town located in Adams County, Wisconsin. It is situated on the banks of the Wisconsin River, about 25 miles east of Wisconsin Dells. The town was founded in 1854 and has a population of about 500 people.
Geography
Grand Marsh is located in the Central Sands region of Wisconsin, which is characterized by sandy soils and rolling hills. The town is situated on the banks of the Wisconsin River, which is a major tributary of the Mississippi River. The town is surrounded by farmland and is home to several small lakes, including Lake Petenwell and Castle Rock Lake. The town is also home to the Grand Marsh State Wildlife Area, which is a popular destination for bird watching and other outdoor activities.
Economy
The economy of Grand Marsh is largely based on agriculture. The town is home to several dairy farms, as well as a number of vegetable and fruit farms. The town is also home to several small businesses, including a grocery store, a hardware store, and a few restaurants.
Demographics
As of the 2010 census, the population of Grand Marsh was 498 people. The racial makeup of the town was 97.2% White, 0.2% African American, 0.2% Native American, 0.4% Asian, 0.2% from other races, and 1.9% from two or more races. Hispanic or Latino of any race were 0.8% of the population.
The median income for a household in Grand Marsh was $41,250, and the median income for a family was $45,000. The per capita income for the town was $19,845. About 8.2% of families and 10.2% of the population were below the poverty line, including 14.3% of those under age 18 and none of those age 65 or over.
Conclusion
Grand Marsh is a small town located in Adams County, Wisconsin. It is situated on the banks of the Wisconsin River and is home to about 500 people. The town is largely agricultural, with several dairy farms, vegetable and fruit farms, and small businesses. The population of Grand Marsh is predominantly white, with a median income of $41,250 for a household and $45,000 for a family. Despite its small size, Grand Marsh is a vibrant community with a rich history and a bright future.
Common Questions
What is Per Capita Income in Grand Marsh?
Per Capita income in Grand Marsh is $31,718.
What is Income or Wage Gap in Grand Marsh?
Income or Wage Gap in Grand Marsh is 18.1%.
Women in Grand Marsh earn 81.9 cents for every dollar earned by a man.
What is Inequality or Gini Index in Grand Marsh?
Inequality or Gini Index in Grand Marsh is 0.46.
What is the Total Population of Grand Marsh?
Total Population of Grand Marsh is 131.
What is the Total Male Population of Grand Marsh?
Total Male Population of Grand Marsh is 82.
What is the Total Female Population of Grand Marsh?
Total Female Population of Grand Marsh is 49.
What is the Ratio of Males per 100 Females in Grand Marsh?
There are 167.35 Males per 100 Females in Grand Marsh.
What is the Ratio of Females per 100 Males in Grand Marsh?
There are 59.76 Females per 100 Males in Grand Marsh.
What is the Median Population Age in Grand Marsh?
Median Population Age in Grand Marsh is 43.6 Years.
What is the Average Family Size in Grand Marsh
Average Family Size in Grand Marsh is 4.8 People.
What is the Average Household Size in Grand Marsh
Average Household Size in Grand Marsh is 2.9 People.
How Large is the Labor Force in Grand Marsh?
There are 68 People in the Labor Forcein in Grand Marsh.
What is the Percentage of People in the Labor Force in Grand Marsh?
66.0% of People are in the Labor Force in Grand Marsh.