Glenbeulah, WI Map & Demographics
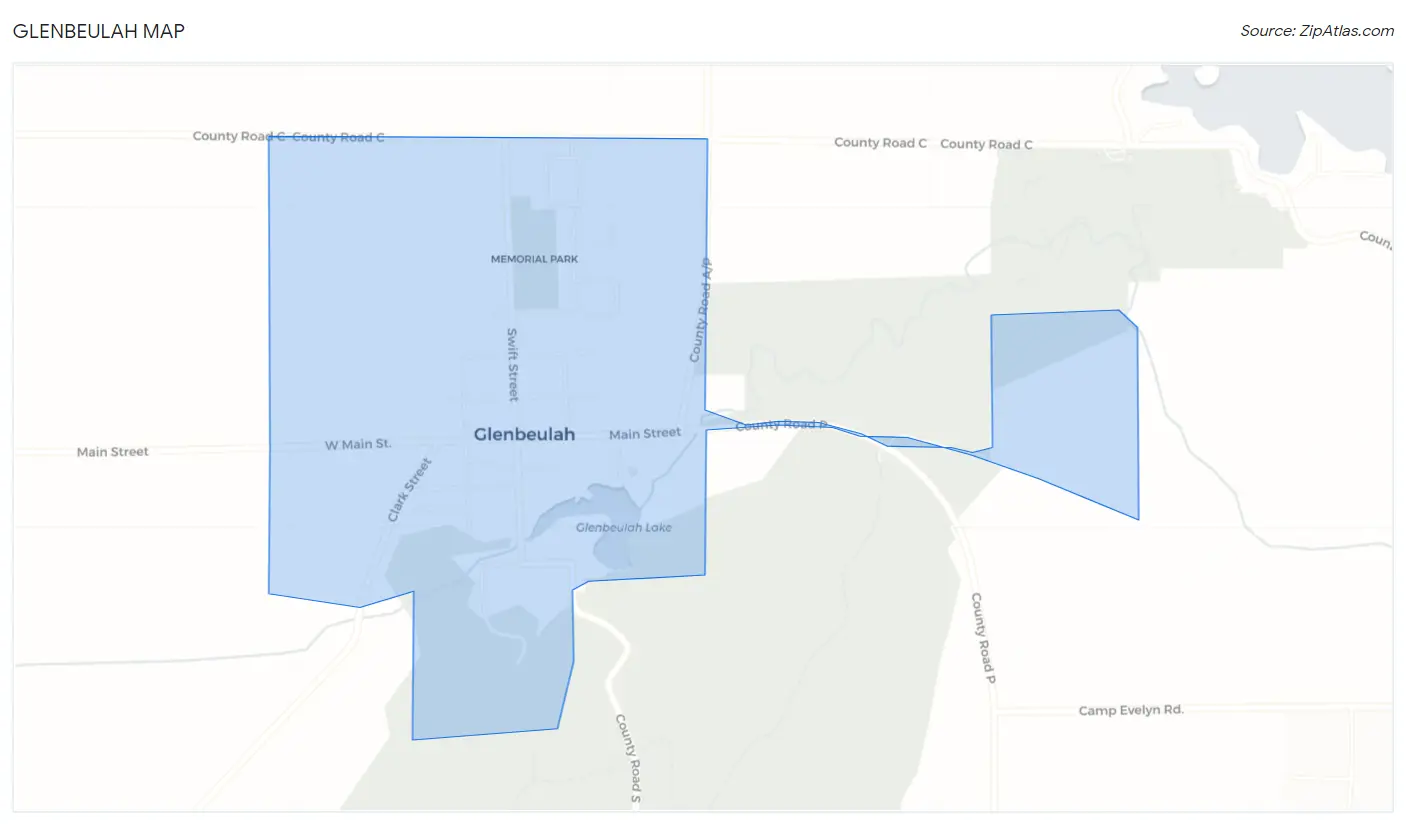
Glenbeulah Map
Glenbeulah Overview
$41,704
PER CAPITA INCOME
$120,625
AVG FAMILY INCOME
$82,188
AVG HOUSEHOLD INCOME
10.9%
WAGE / INCOME GAP [ % ]
89.1¢/ $1
WAGE / INCOME GAP [ $ ]
0.35
INEQUALITY / GINI INDEX
409
TOTAL POPULATION
213
MALE POPULATION
196
FEMALE POPULATION
108.67
MALES / 100 FEMALES
92.02
FEMALES / 100 MALES
45.3
MEDIAN AGE
2.7
AVG FAMILY SIZE
2.2
AVG HOUSEHOLD SIZE
270
LABOR FORCE [ PEOPLE ]
78.0%
PERCENT IN LABOR FORCE
0.4%
UNEMPLOYMENT RATE
Glenbeulah Zip Codes
Glenbeulah Area Codes
Income in Glenbeulah
Income Overview in Glenbeulah
Per Capita Income in Glenbeulah is $41,704, while median incomes of families and households are $120,625 and $82,188 respectively.
| Characteristic | Number | Measure |
| Per Capita Income | 409 | $41,704 |
| Median Family Income | 117 | $120,625 |
| Mean Family Income | 117 | $113,985 |
| Median Household Income | 189 | $82,188 |
| Mean Household Income | 189 | $90,811 |
| Income Deficit | 117 | $0 |
| Wage / Income Gap (%) | 409 | 10.86% |
| Wage / Income Gap ($) | 409 | 89.14¢ per $1 |
| Gini / Inequality Index | 409 | 0.35 |
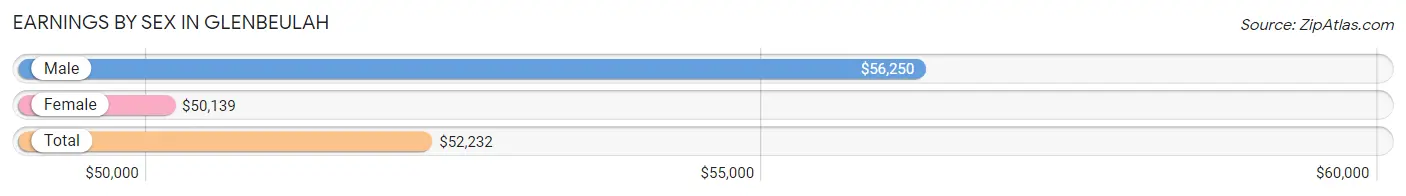
Earnings by Sex in Glenbeulah
Average Earnings in Glenbeulah are $52,232, $56,250 for men and $50,139 for women, a difference of 10.9%.
| Sex | Number | Average Earnings |
| Male | 144 (52.7%) | $56,250 |
| Female | 129 (47.2%) | $50,139 |
| Total | 273 (100.0%) | $52,232 |
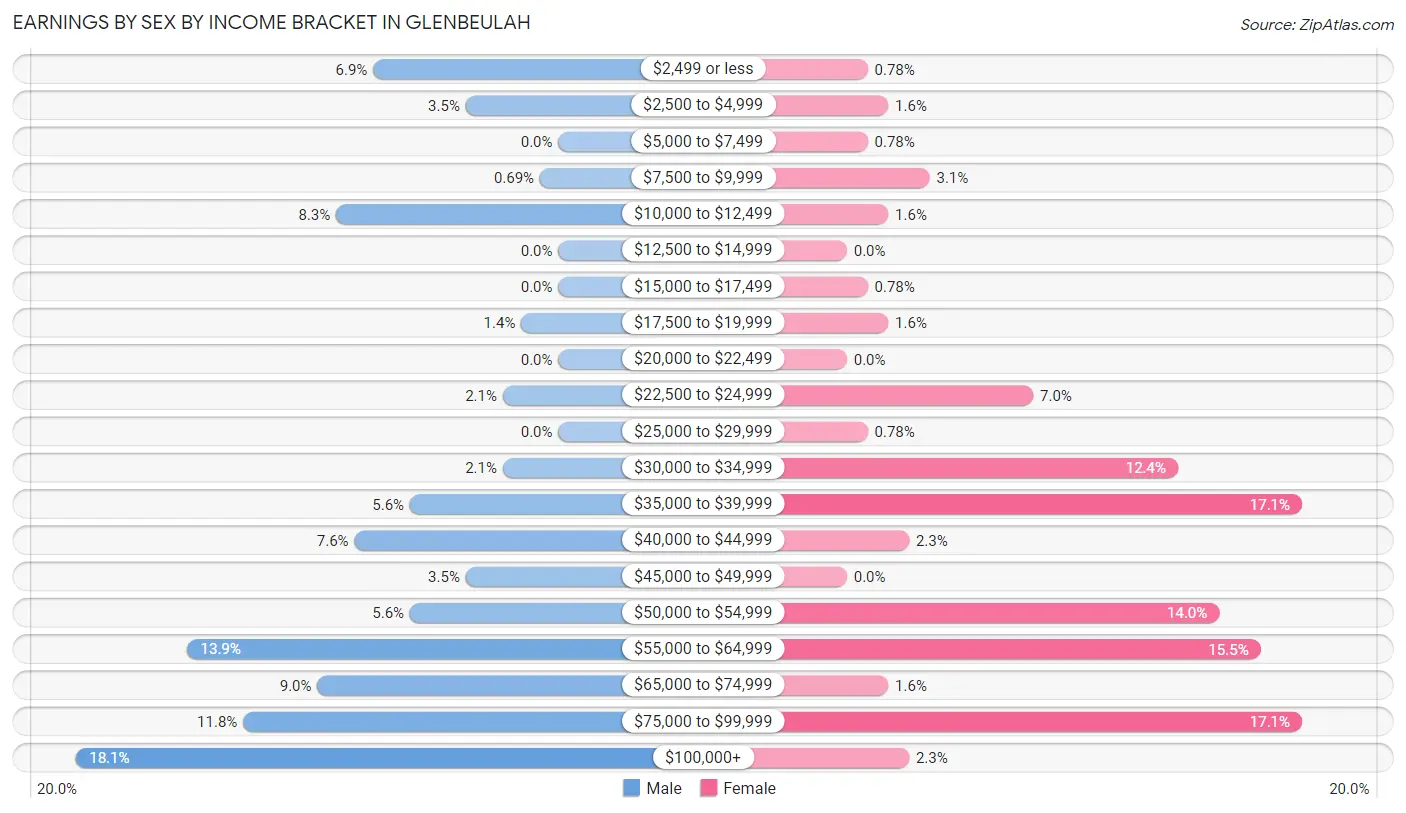
Earnings by Sex by Income Bracket in Glenbeulah
The most common earnings brackets in Glenbeulah are $100,000+ for men (26 | 18.1%) and $35,000 to $39,999 for women (22 | 17.1%).
| Income | Male | Female |
| $2,499 or less | 10 (6.9%) | 1 (0.8%) |
| $2,500 to $4,999 | 5 (3.5%) | 2 (1.5%) |
| $5,000 to $7,499 | 0 (0.0%) | 1 (0.8%) |
| $7,500 to $9,999 | 1 (0.7%) | 4 (3.1%) |
| $10,000 to $12,499 | 12 (8.3%) | 2 (1.5%) |
| $12,500 to $14,999 | 0 (0.0%) | 0 (0.0%) |
| $15,000 to $17,499 | 0 (0.0%) | 1 (0.8%) |
| $17,500 to $19,999 | 2 (1.4%) | 2 (1.5%) |
| $20,000 to $22,499 | 0 (0.0%) | 0 (0.0%) |
| $22,500 to $24,999 | 3 (2.1%) | 9 (7.0%) |
| $25,000 to $29,999 | 0 (0.0%) | 1 (0.8%) |
| $30,000 to $34,999 | 3 (2.1%) | 16 (12.4%) |
| $35,000 to $39,999 | 8 (5.6%) | 22 (17.1%) |
| $40,000 to $44,999 | 11 (7.6%) | 3 (2.3%) |
| $45,000 to $49,999 | 5 (3.5%) | 0 (0.0%) |
| $50,000 to $54,999 | 8 (5.6%) | 18 (14.0%) |
| $55,000 to $64,999 | 20 (13.9%) | 20 (15.5%) |
| $65,000 to $74,999 | 13 (9.0%) | 2 (1.5%) |
| $75,000 to $99,999 | 17 (11.8%) | 22 (17.1%) |
| $100,000+ | 26 (18.1%) | 3 (2.3%) |
| Total | 144 (100.0%) | 129 (100.0%) |
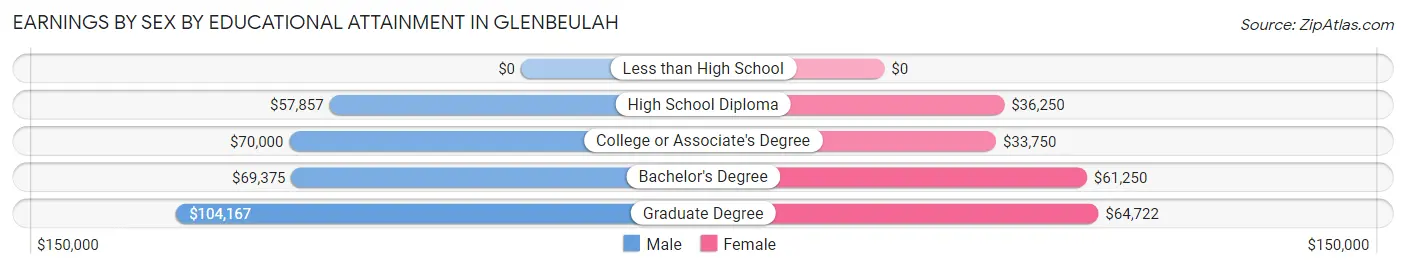
Earnings by Sex by Educational Attainment in Glenbeulah
Average earnings in Glenbeulah are $62,917 for men and $50,139 for women, a difference of 20.3%. Men with an educational attainment of graduate degree enjoy the highest average annual earnings of $104,167, while those with high school diploma education earn the least with $57,857. Women with an educational attainment of graduate degree earn the most with the average annual earnings of $64,722, while those with college or associate's degree education have the smallest earnings of $33,750.
| Educational Attainment | Male Income | Female Income |
| Less than High School | - | - |
| High School Diploma | $57,857 | $36,250 |
| College or Associate's Degree | $70,000 | $33,750 |
| Bachelor's Degree | $69,375 | $61,250 |
| Graduate Degree | $104,167 | $64,722 |
| Total | $62,917 | $50,139 |
Family Income in Glenbeulah
Family Income Brackets in Glenbeulah
According to the Glenbeulah family income data, there are 52 families falling into the $100,000 to $149,999 income range, which is the most common income bracket and makes up 44.4% of all families.
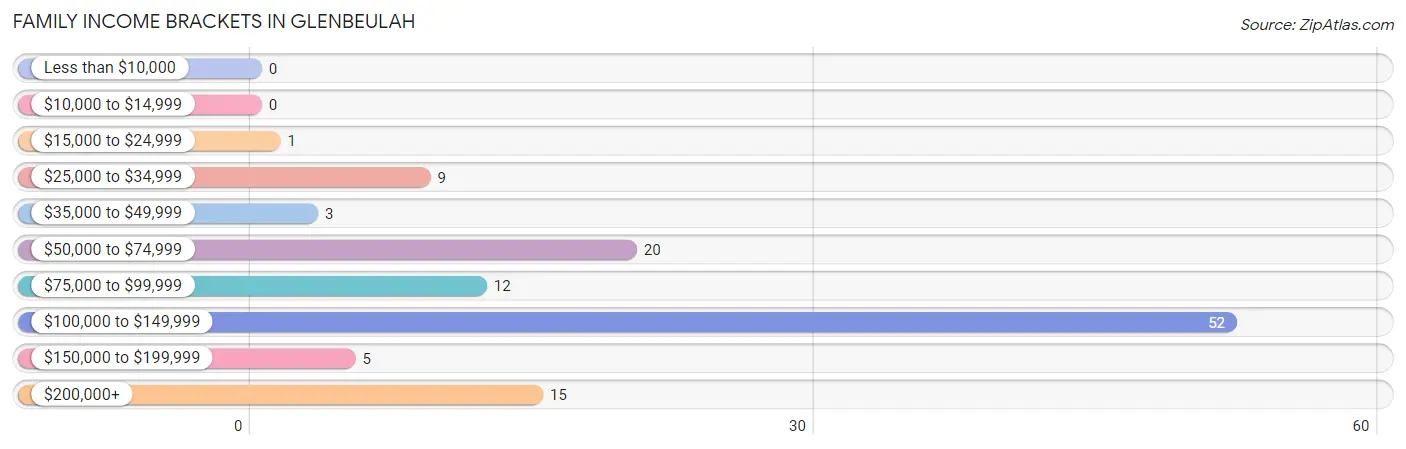
| Income Bracket | # Families | % Families |
| Less than $10,000 | 0 | 0.0% |
| $10,000 to $14,999 | 0 | 0.0% |
| $15,000 to $24,999 | 1 | 0.9% |
| $25,000 to $34,999 | 9 | 7.7% |
| $35,000 to $49,999 | 3 | 2.6% |
| $50,000 to $74,999 | 20 | 17.1% |
| $75,000 to $99,999 | 12 | 10.3% |
| $100,000 to $149,999 | 52 | 44.4% |
| $150,000 to $199,999 | 5 | 4.3% |
| $200,000+ | 15 | 12.8% |
Family Income by Famaliy Size in Glenbeulah
4-person families (9 | 7.7%) account for the highest median family income in Glenbeulah with $141,250 per family, while 2-person families (77 | 65.8%) have the highest median income of $48,438 per family member.
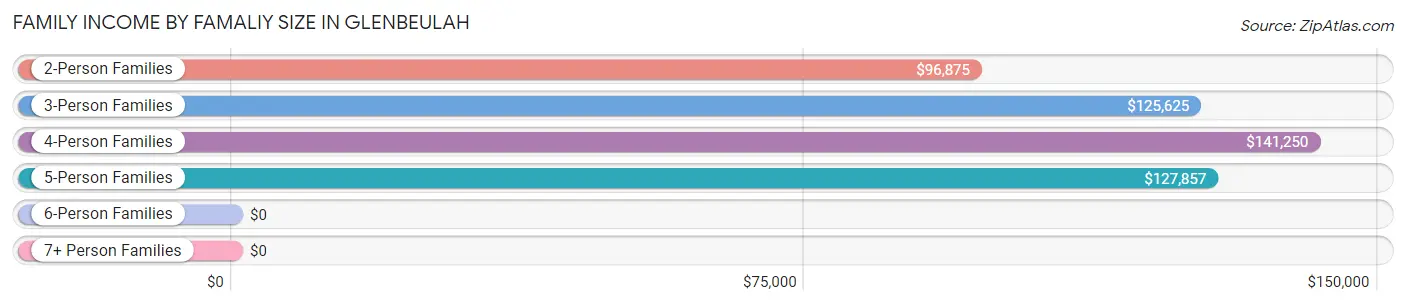
| Income Bracket | # Families | Median Income |
| 2-Person Families | 77 (65.8%) | $96,875 |
| 3-Person Families | 15 (12.8%) | $125,625 |
| 4-Person Families | 9 (7.7%) | $141,250 |
| 5-Person Families | 16 (13.7%) | $127,857 |
| 6-Person Families | 0 (0.0%) | $0 |
| 7+ Person Families | 0 (0.0%) | $0 |
| Total | 117 (100.0%) | $120,625 |
Family Income by Number of Earners in Glenbeulah
The median family income in Glenbeulah is $120,625, with families comprising 3+ earners (13) having the highest median family income of $128,438, while families with no earners (12) have the lowest median family income of $29,375, accounting for 11.1% and 10.3% of families, respectively.
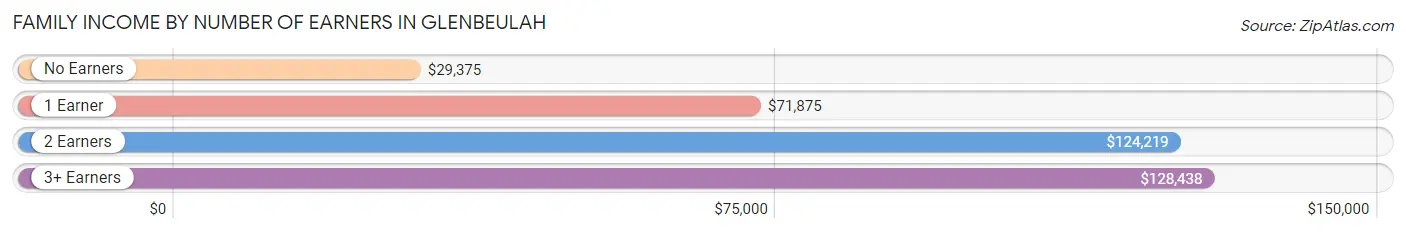
| Number of Earners | # Families | Median Income |
| No Earners | 12 (10.3%) | $29,375 |
| 1 Earner | 27 (23.1%) | $71,875 |
| 2 Earners | 65 (55.6%) | $124,219 |
| 3+ Earners | 13 (11.1%) | $128,438 |
| Total | 117 (100.0%) | $120,625 |
Household Income in Glenbeulah
Household Income Brackets in Glenbeulah
With 60 households falling in the category, the $100,000 to $149,999 income range is the most frequent in Glenbeulah, accounting for 31.8% of all households. In contrast, only 7 households (3.7%) fall into the less than $10,000 income bracket, making it the least populous group.
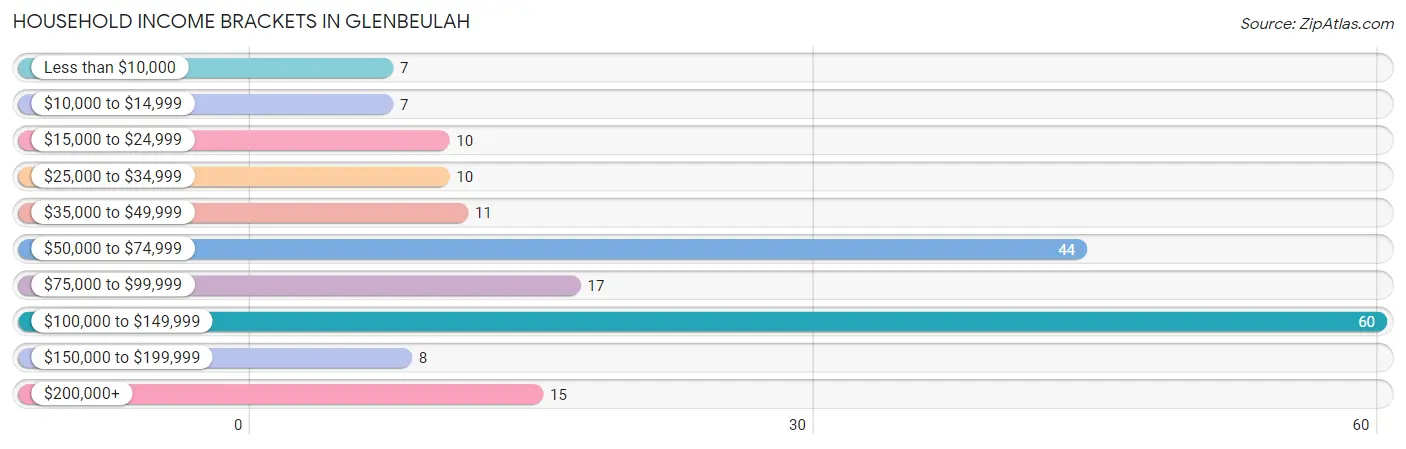
| Income Bracket | # Households | % Households |
| Less than $10,000 | 7 | 3.7% |
| $10,000 to $14,999 | 7 | 3.7% |
| $15,000 to $24,999 | 10 | 5.3% |
| $25,000 to $34,999 | 10 | 5.3% |
| $35,000 to $49,999 | 11 | 5.8% |
| $50,000 to $74,999 | 44 | 23.3% |
| $75,000 to $99,999 | 17 | 9.0% |
| $100,000 to $149,999 | 60 | 31.7% |
| $150,000 to $199,999 | 8 | 4.2% |
| $200,000+ | 15 | 7.9% |
Household Income by Householder Age in Glenbeulah
The median household income in Glenbeulah is $82,188, with the highest median household income of $112,500 found in the 25 to 44 years age bracket for the primary householder. A total of 58 households (30.7%) fall into this category. Meanwhile, the 15 to 24 years age bracket for the primary householder has the lowest median household income of $0, with 3 households (1.6%) in this group.
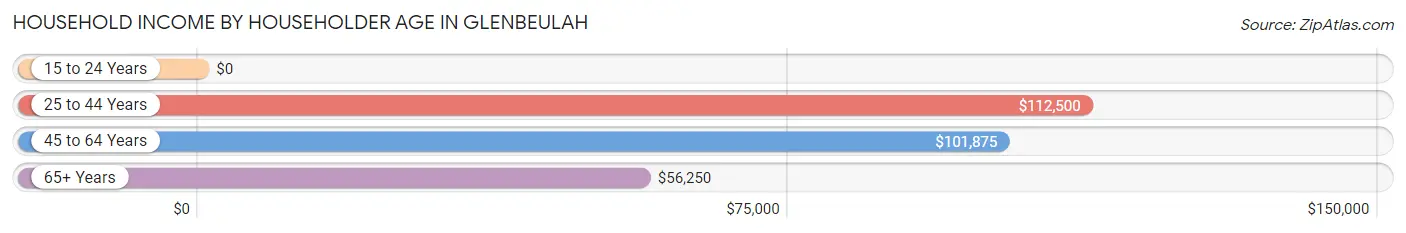
| Income Bracket | # Households | Median Income |
| 15 to 24 Years | 3 (1.6%) | $0 |
| 25 to 44 Years | 58 (30.7%) | $112,500 |
| 45 to 64 Years | 79 (41.8%) | $101,875 |
| 65+ Years | 49 (25.9%) | $56,250 |
| Total | 189 (100.0%) | $82,188 |
Poverty in Glenbeulah
Income Below Poverty by Sex and Age in Glenbeulah
With 5.6% poverty level for males and 2.7% for females among the residents of Glenbeulah, 75 year old and over males and 75 year old and over females are the most vulnerable to poverty, with 1 males (16.7%) and 2 females (8.3%) in their respective age groups living below the poverty level.
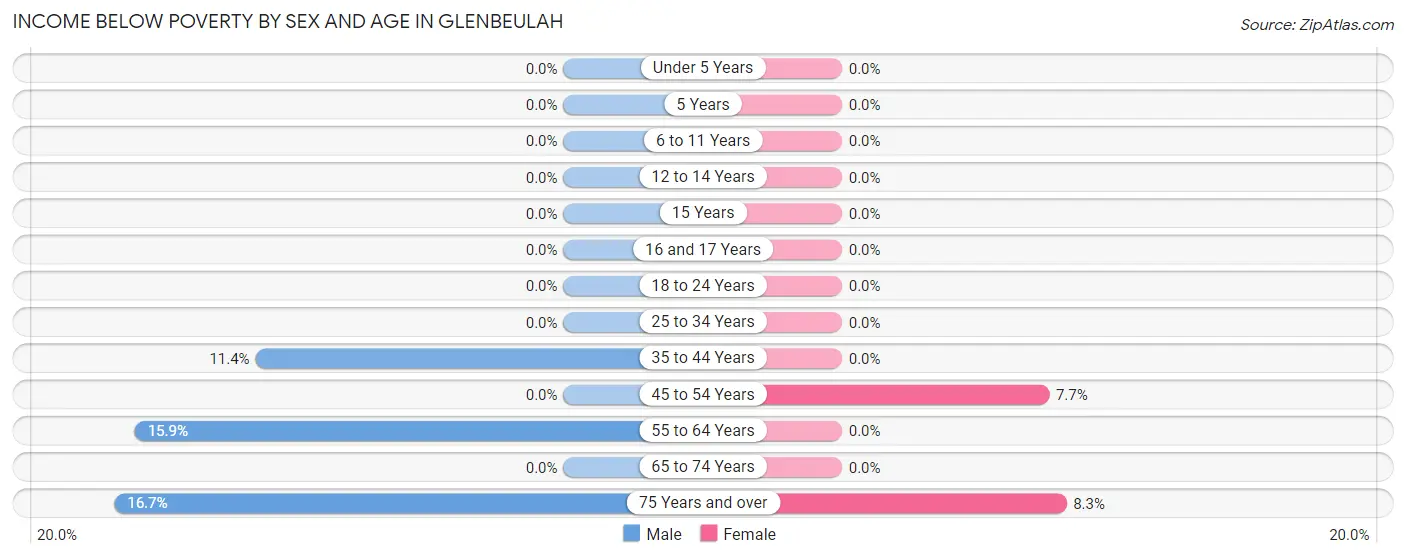
| Age Bracket | Male | Female |
| Under 5 Years | 0 (0.0%) | 0 (0.0%) |
| 5 Years | 0 (0.0%) | 0 (0.0%) |
| 6 to 11 Years | 0 (0.0%) | 0 (0.0%) |
| 12 to 14 Years | 0 (0.0%) | 0 (0.0%) |
| 15 Years | 0 (0.0%) | 0 (0.0%) |
| 16 and 17 Years | 0 (0.0%) | 0 (0.0%) |
| 18 to 24 Years | 0 (0.0%) | 0 (0.0%) |
| 25 to 34 Years | 0 (0.0%) | 0 (0.0%) |
| 35 to 44 Years | 4 (11.4%) | 0 (0.0%) |
| 45 to 54 Years | 0 (0.0%) | 3 (7.7%) |
| 55 to 64 Years | 7 (15.9%) | 0 (0.0%) |
| 65 to 74 Years | 0 (0.0%) | 0 (0.0%) |
| 75 Years and over | 1 (16.7%) | 2 (8.3%) |
| Total | 12 (5.6%) | 5 (2.7%) |
Income Above Poverty by Sex and Age in Glenbeulah
According to the poverty statistics in Glenbeulah, males aged under 5 years and females aged under 5 years are the age groups that are most secure financially, with 100.0% of males and 100.0% of females in these age groups living above the poverty line.
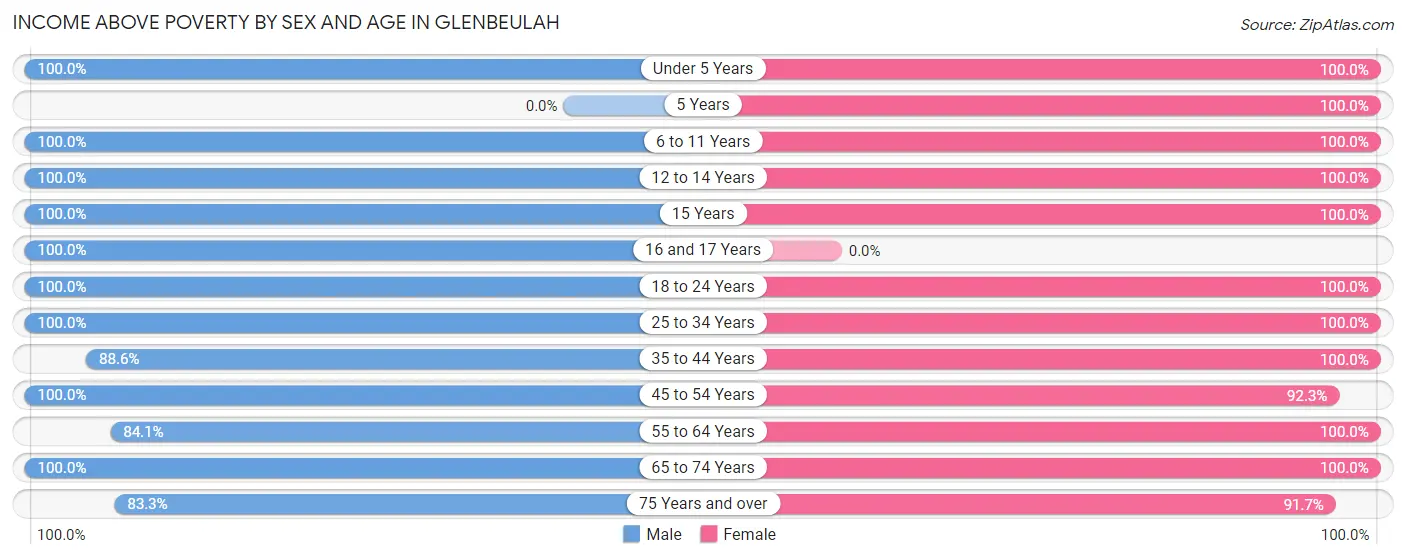
| Age Bracket | Male | Female |
| Under 5 Years | 15 (100.0%) | 9 (100.0%) |
| 5 Years | 0 (0.0%) | 2 (100.0%) |
| 6 to 11 Years | 6 (100.0%) | 5 (100.0%) |
| 12 to 14 Years | 7 (100.0%) | 2 (100.0%) |
| 15 Years | 3 (100.0%) | 3 (100.0%) |
| 16 and 17 Years | 7 (100.0%) | 0 (0.0%) |
| 18 to 24 Years | 20 (100.0%) | 2 (100.0%) |
| 25 to 34 Years | 23 (100.0%) | 29 (100.0%) |
| 35 to 44 Years | 31 (88.6%) | 24 (100.0%) |
| 45 to 54 Years | 28 (100.0%) | 36 (92.3%) |
| 55 to 64 Years | 37 (84.1%) | 22 (100.0%) |
| 65 to 74 Years | 19 (100.0%) | 24 (100.0%) |
| 75 Years and over | 5 (83.3%) | 22 (91.7%) |
| Total | 201 (94.4%) | 180 (97.3%) |
Income Below Poverty Among Married-Couple Families in Glenbeulah
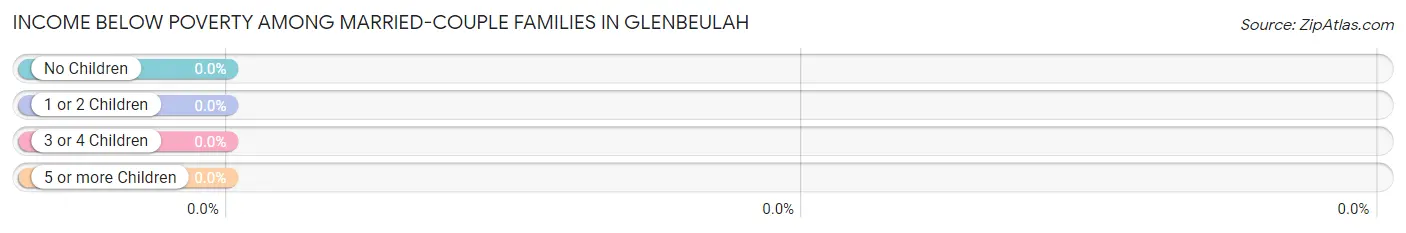
| Children | Above Poverty | Below Poverty |
| No Children | 72 (100.0%) | 0 (0.0%) |
| 1 or 2 Children | 28 (100.0%) | 0 (0.0%) |
| 3 or 4 Children | 7 (100.0%) | 0 (0.0%) |
| 5 or more Children | 0 (0.0%) | 0 (0.0%) |
| Total | 107 (100.0%) | 0 (0.0%) |
Income Below Poverty Among Single-Parent Households in Glenbeulah
| Children | Single Father | Single Mother |
| No Children | 0 (0.0%) | 0 (0.0%) |
| 1 or 2 Children | 0 (0.0%) | 0 (0.0%) |
| 3 or 4 Children | 0 (0.0%) | 0 (0.0%) |
| 5 or more Children | 0 (0.0%) | 0 (0.0%) |
| Total | 0 (0.0%) | 0 (0.0%) |
Income Below Poverty Among Married-Couple vs Single-Parent Households in Glenbeulah
| Children | Married-Couple Families | Single-Parent Households |
| No Children | 0 (0.0%) | 0 (0.0%) |
| 1 or 2 Children | 0 (0.0%) | 0 (0.0%) |
| 3 or 4 Children | 0 (0.0%) | 0 (0.0%) |
| 5 or more Children | 0 (0.0%) | 0 (0.0%) |
| Total | 0 (0.0%) | 0 (0.0%) |
Race in Glenbeulah
The most populous races in Glenbeulah are White / Caucasian (400 | 97.8%), Two or more Races (6 | 1.5%), and Hawaiian / Pacific (3 | 0.7%).
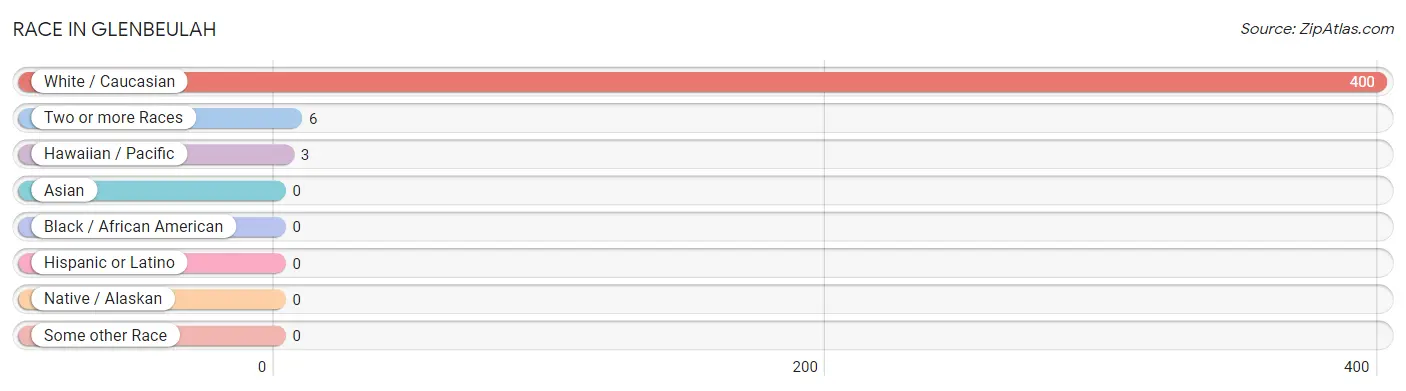
| Race | # Population | % Population |
| Asian | 0 | 0.0% |
| Black / African American | 0 | 0.0% |
| Hawaiian / Pacific | 3 | 0.7% |
| Hispanic or Latino | 0 | 0.0% |
| Native / Alaskan | 0 | 0.0% |
| White / Caucasian | 400 | 97.8% |
| Two or more Races | 6 | 1.5% |
| Some other Race | 0 | 0.0% |
| Total | 409 | 100.0% |
Ancestry in Glenbeulah
The most populous ancestries reported in Glenbeulah are German (310 | 75.8%), Irish (48 | 11.7%), English (39 | 9.5%), Norwegian (28 | 6.9%), and Danish (20 | 4.9%), together accounting for 108.8% of all Glenbeulah residents.
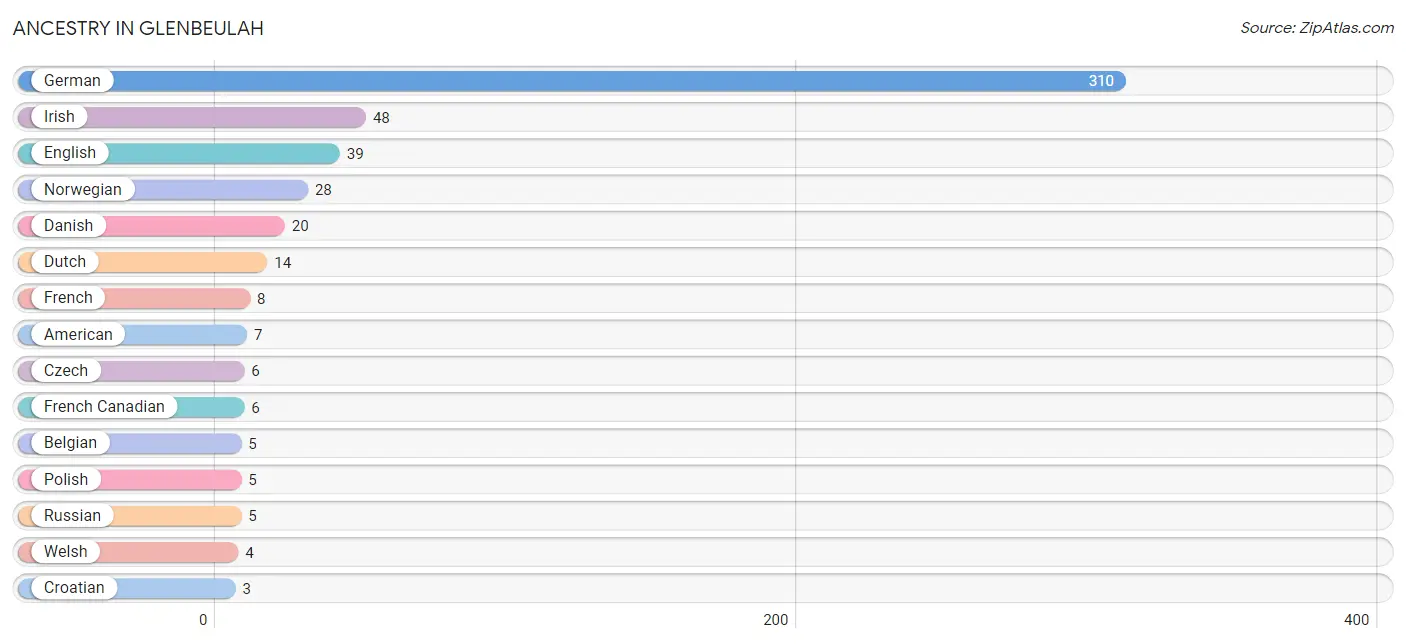
| Ancestry | # Population | % Population |
| American | 7 | 1.7% |
| Belgian | 5 | 1.2% |
| Croatian | 3 | 0.7% |
| Czech | 6 | 1.5% |
| Danish | 20 | 4.9% |
| Dutch | 14 | 3.4% |
| English | 39 | 9.5% |
| French | 8 | 2.0% |
| French Canadian | 6 | 1.5% |
| German | 310 | 75.8% |
| Irish | 48 | 11.7% |
| Italian | 3 | 0.7% |
| Luxembourger | 1 | 0.2% |
| Native Hawaiian | 3 | 0.7% |
| Norwegian | 28 | 6.9% |
| Polish | 5 | 1.2% |
| Russian | 5 | 1.2% |
| Scotch-Irish | 2 | 0.5% |
| Scottish | 3 | 0.7% |
| Swedish | 1 | 0.2% |
| Ukrainian | 2 | 0.5% |
| Welsh | 4 | 1.0% | View All 22 Rows |
Immigrants in Glenbeulah
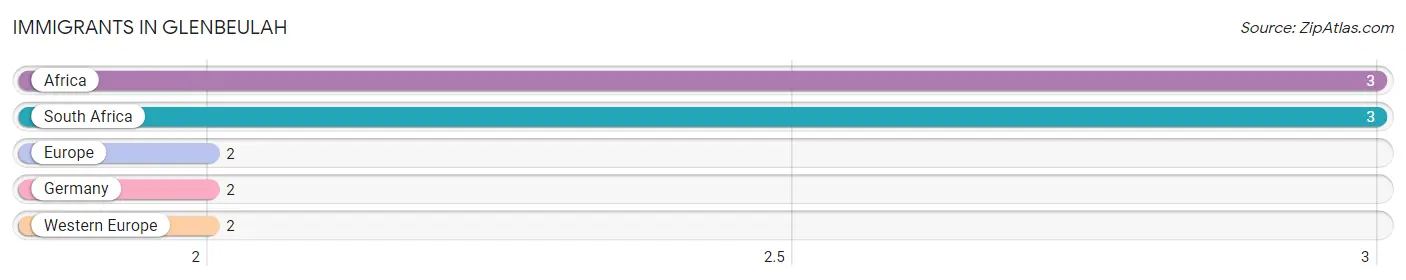
The most numerous immigrant groups reported in Glenbeulah came from Africa (3 | 0.7%), South Africa (3 | 0.7%), Europe (2 | 0.5%), Germany (2 | 0.5%), and Western Europe (2 | 0.5%), together accounting for 2.9% of all Glenbeulah residents.
| Immigration Origin | # Population | % Population |
| Africa | 3 | 0.7% |
| Europe | 2 | 0.5% |
| Germany | 2 | 0.5% |
| South Africa | 3 | 0.7% |
| Western Europe | 2 | 0.5% | View All 5 Rows |
Sex and Age in Glenbeulah
Sex and Age in Glenbeulah
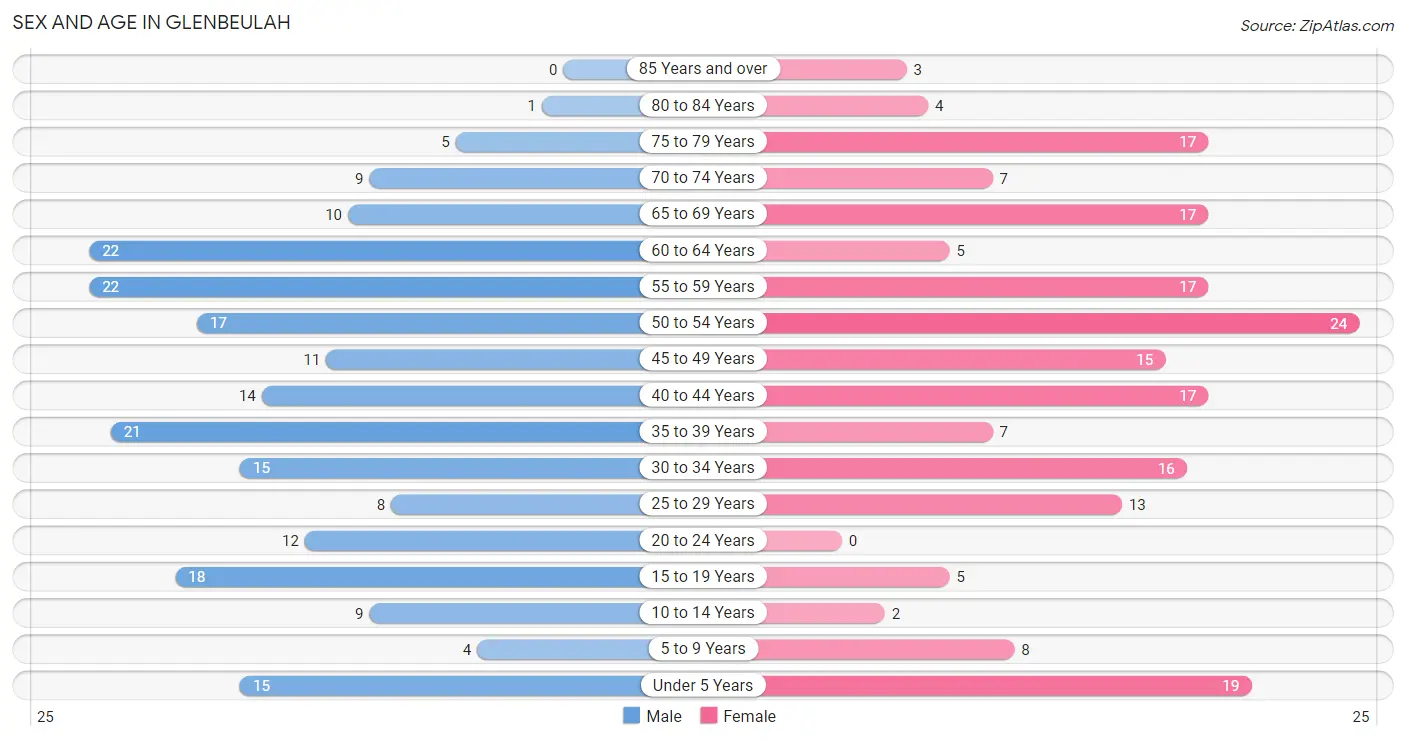
The most populous age groups in Glenbeulah are 55 to 59 Years (22 | 10.3%) for men and 50 to 54 Years (24 | 12.2%) for women.
| Age Bracket | Male | Female |
| Under 5 Years | 15 (7.0%) | 19 (9.7%) |
| 5 to 9 Years | 4 (1.9%) | 8 (4.1%) |
| 10 to 14 Years | 9 (4.2%) | 2 (1.0%) |
| 15 to 19 Years | 18 (8.5%) | 5 (2.5%) |
| 20 to 24 Years | 12 (5.6%) | 0 (0.0%) |
| 25 to 29 Years | 8 (3.8%) | 13 (6.6%) |
| 30 to 34 Years | 15 (7.0%) | 16 (8.2%) |
| 35 to 39 Years | 21 (9.9%) | 7 (3.6%) |
| 40 to 44 Years | 14 (6.6%) | 17 (8.7%) |
| 45 to 49 Years | 11 (5.2%) | 15 (7.6%) |
| 50 to 54 Years | 17 (8.0%) | 24 (12.2%) |
| 55 to 59 Years | 22 (10.3%) | 17 (8.7%) |
| 60 to 64 Years | 22 (10.3%) | 5 (2.5%) |
| 65 to 69 Years | 10 (4.7%) | 17 (8.7%) |
| 70 to 74 Years | 9 (4.2%) | 7 (3.6%) |
| 75 to 79 Years | 5 (2.4%) | 17 (8.7%) |
| 80 to 84 Years | 1 (0.5%) | 4 (2.0%) |
| 85 Years and over | 0 (0.0%) | 3 (1.5%) |
| Total | 213 (100.0%) | 196 (100.0%) |
Families and Households in Glenbeulah
Median Family Size in Glenbeulah
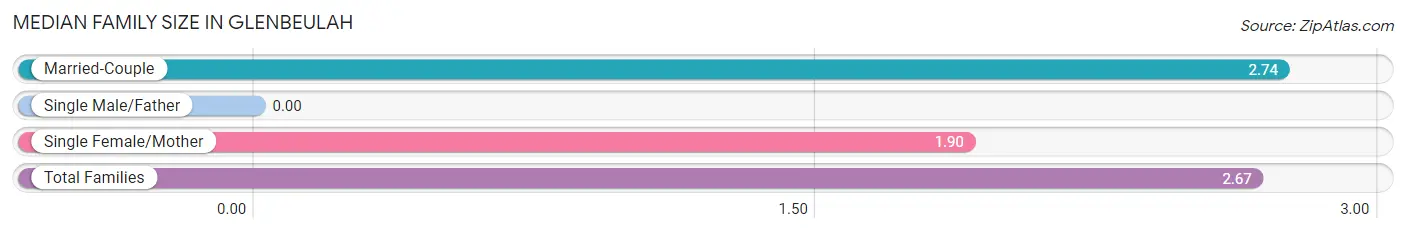
| Family Type | # Families | Family Size |
| Married-Couple | 107 (91.4%) | 2.74 |
| Single Male/Father | 0 (0.0%) | - |
| Single Female/Mother | 10 (8.6%) | 1.90 |
| Total Families | 117 (100.0%) | 2.67 |
Median Household Size in Glenbeulah
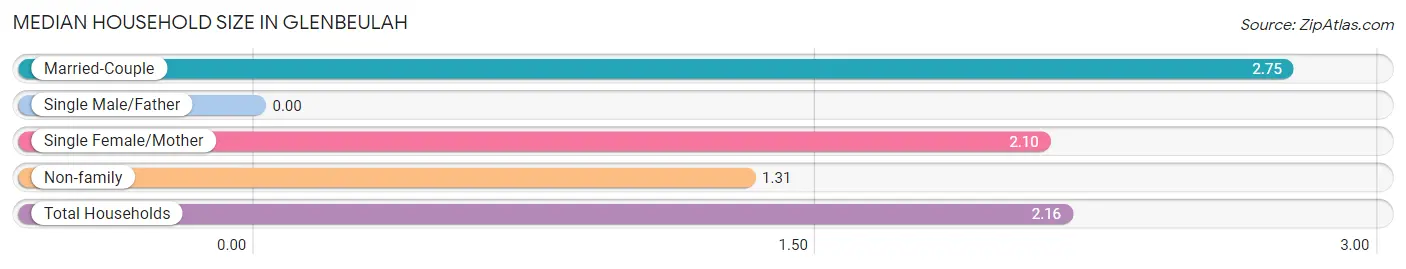
| Household Type | # Households | Household Size |
| Married-Couple | 107 (56.6%) | 2.75 |
| Single Male/Father | 0 (0.0%) | - |
| Single Female/Mother | 10 (5.3%) | 2.10 |
| Non-family | 72 (38.1%) | 1.31 |
| Total Households | 189 (100.0%) | 2.16 |
Household Size by Marriage Status in Glenbeulah
Out of a total of 189 households in Glenbeulah, 117 (61.9%) are family households, while 72 (38.1%) are nonfamily households. The most numerous type of family households are 2-person households, comprising 75, and the most common type of nonfamily households are 1-person households, comprising 54.
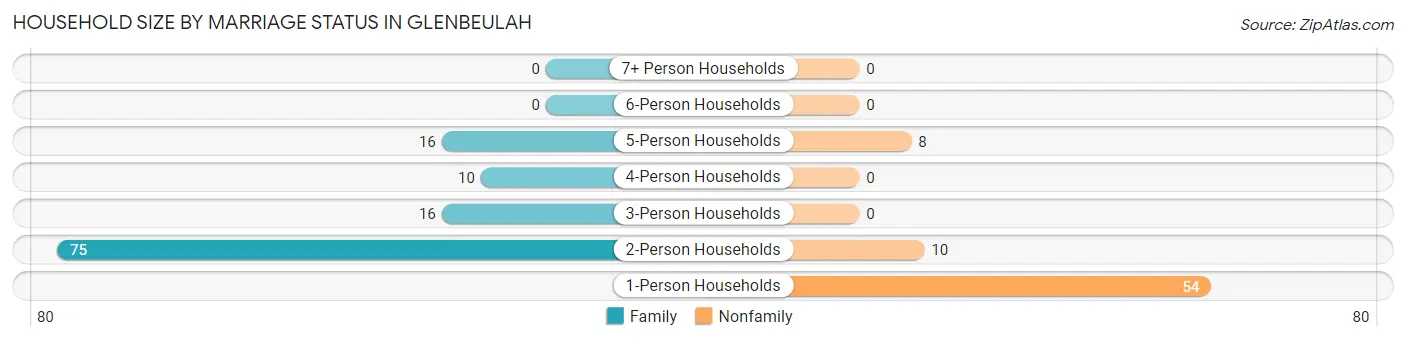
| Household Size | Family Households | Nonfamily Households |
| 1-Person Households | - | 54 (28.6%) |
| 2-Person Households | 75 (39.7%) | 10 (5.3%) |
| 3-Person Households | 16 (8.5%) | 0 (0.0%) |
| 4-Person Households | 10 (5.3%) | 0 (0.0%) |
| 5-Person Households | 16 (8.5%) | 8 (4.2%) |
| 6-Person Households | 0 (0.0%) | 0 (0.0%) |
| 7+ Person Households | 0 (0.0%) | 0 (0.0%) |
| Total | 117 (61.9%) | 72 (38.1%) |
Female Fertility in Glenbeulah
Fertility by Age in Glenbeulah
Average fertility rate in Glenbeulah is 123.0 births per 1,000 women. Women in the age bracket of 20 to 34 years have the highest fertility rate with 241.0 births per 1,000 women. Women in the age bracket of 20 to 34 years acount for 77.8% of all women with births.
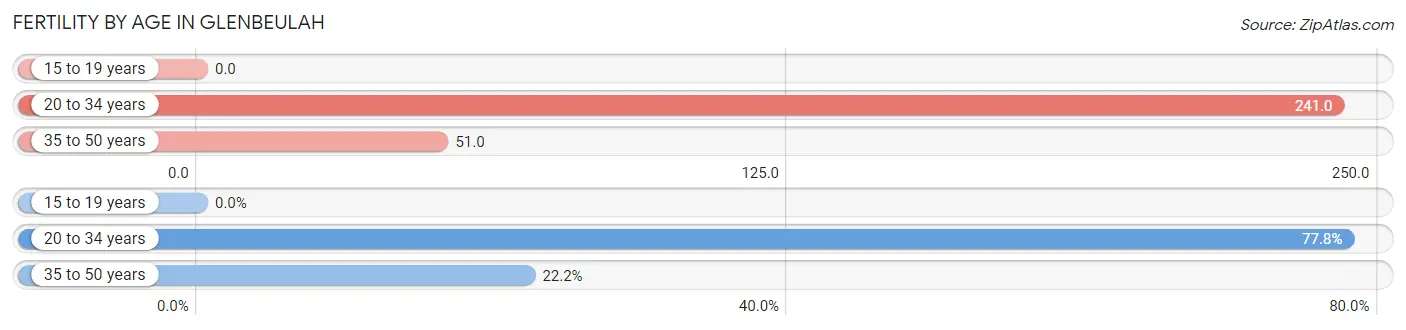
| Age Bracket | Women with Births | Births / 1,000 Women |
| 15 to 19 years | 0 (0.0%) | 0.0 |
| 20 to 34 years | 7 (77.8%) | 241.0 |
| 35 to 50 years | 2 (22.2%) | 51.0 |
| Total | 9 (100.0%) | 123.0 |
Fertility by Age by Marriage Status in Glenbeulah
77.8% of women with births (9) in Glenbeulah are married. The highest percentage of unmarried women with births falls into 20 to 34 years age bracket with 28.6% of them unmarried at the time of birth, while the lowest percentage of unmarried women with births belong to 35 to 50 years age bracket with 0.0% of them unmarried.
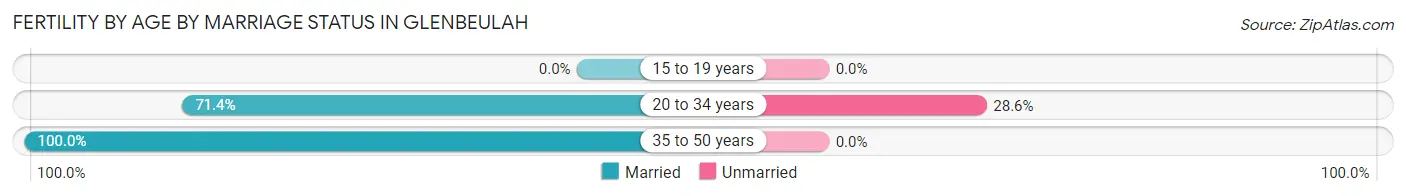
| Age Bracket | Married | Unmarried |
| 15 to 19 years | 0 (0.0%) | 0 (0.0%) |
| 20 to 34 years | 5 (71.4%) | 2 (28.6%) |
| 35 to 50 years | 2 (100.0%) | 0 (0.0%) |
| Total | 7 (77.8%) | 2 (22.2%) |
Fertility by Education in Glenbeulah
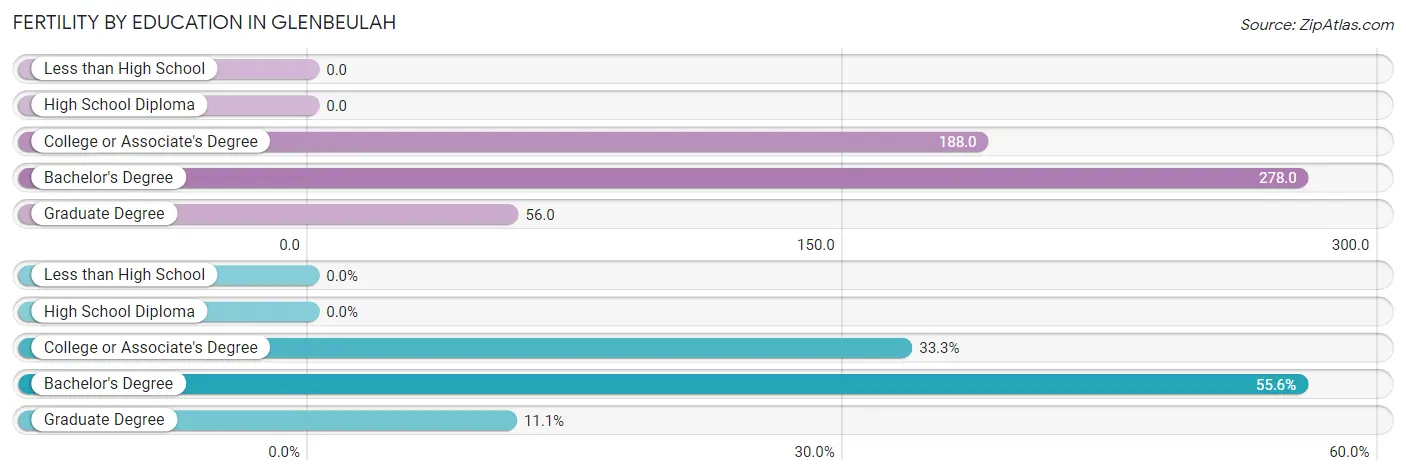
| Educational Attainment | Women with Births | Births / 1,000 Women |
| Less than High School | 0 (0.0%) | 0.0 |
| High School Diploma | 0 (0.0%) | 0.0 |
| College or Associate's Degree | 3 (33.3%) | 188.0 |
| Bachelor's Degree | 5 (55.6%) | 278.0 |
| Graduate Degree | 1 (11.1%) | 56.0 |
| Total | 9 (100.0%) | 123.0 |
Fertility by Education by Marriage Status in Glenbeulah
22.2% of women with births in Glenbeulah are unmarried. Women with the educational attainment of bachelor's degree are most likely to be married with 100.0% of them married at childbirth, while women with the educational attainment of college or associate's degree are least likely to be married with 66.7% of them unmarried at childbirth.
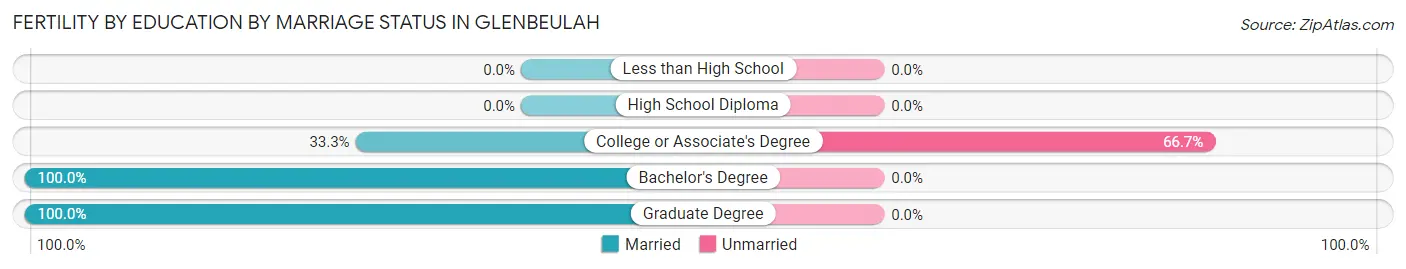
| Educational Attainment | Married | Unmarried |
| Less than High School | 0 (0.0%) | 0 (0.0%) |
| High School Diploma | 0 (0.0%) | 0 (0.0%) |
| College or Associate's Degree | 1 (33.3%) | 2 (66.7%) |
| Bachelor's Degree | 5 (100.0%) | 0 (0.0%) |
| Graduate Degree | 1 (100.0%) | 0 (0.0%) |
| Total | 7 (77.8%) | 2 (22.2%) |
Employment Characteristics in Glenbeulah
Employment by Class of Employer in Glenbeulah
Among the 267 employed individuals in Glenbeulah, private company employees (174 | 65.2%), not-for-profit organizations (45 | 16.9%), and local government employees (26 | 9.7%) make up the most common classes of employment.
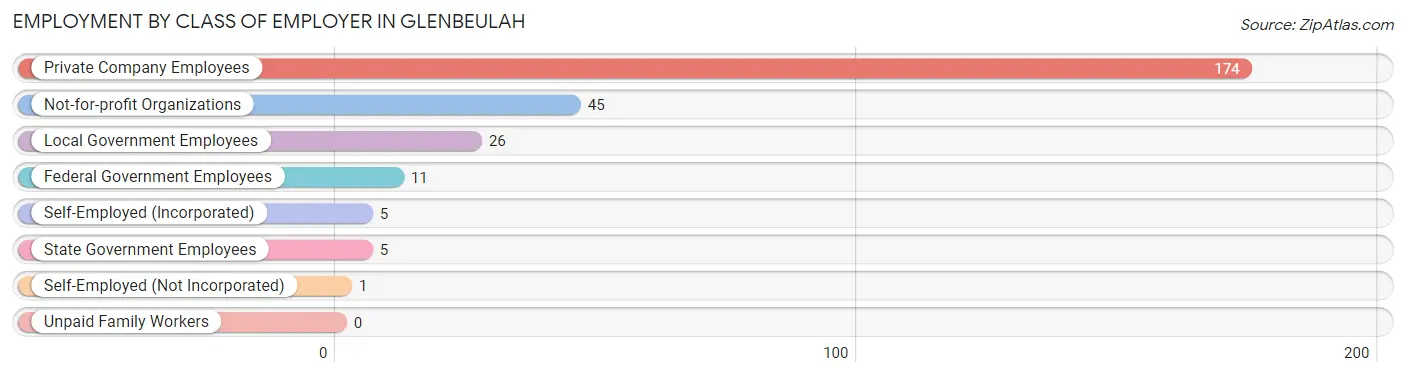
| Employer Class | # Employees | % Employees |
| Private Company Employees | 174 | 65.2% |
| Self-Employed (Incorporated) | 5 | 1.9% |
| Self-Employed (Not Incorporated) | 1 | 0.4% |
| Not-for-profit Organizations | 45 | 16.9% |
| Local Government Employees | 26 | 9.7% |
| State Government Employees | 5 | 1.9% |
| Federal Government Employees | 11 | 4.1% |
| Unpaid Family Workers | 0 | 0.0% |
| Total | 267 | 100.0% |
Employment Status by Age in Glenbeulah
According to the labor force statistics for Glenbeulah, out of the total population over 16 years of age (346), 78.0% or 270 individuals are in the labor force, with 0.4% or 1 of them unemployed. The age group with the highest labor force participation rate is 20 to 24 years, with 100.0% or 12 individuals in the labor force. Within the labor force, the 35 to 44 years age range has the highest percentage of unemployed individuals, with 1.8% or 1 of them being unemployed.
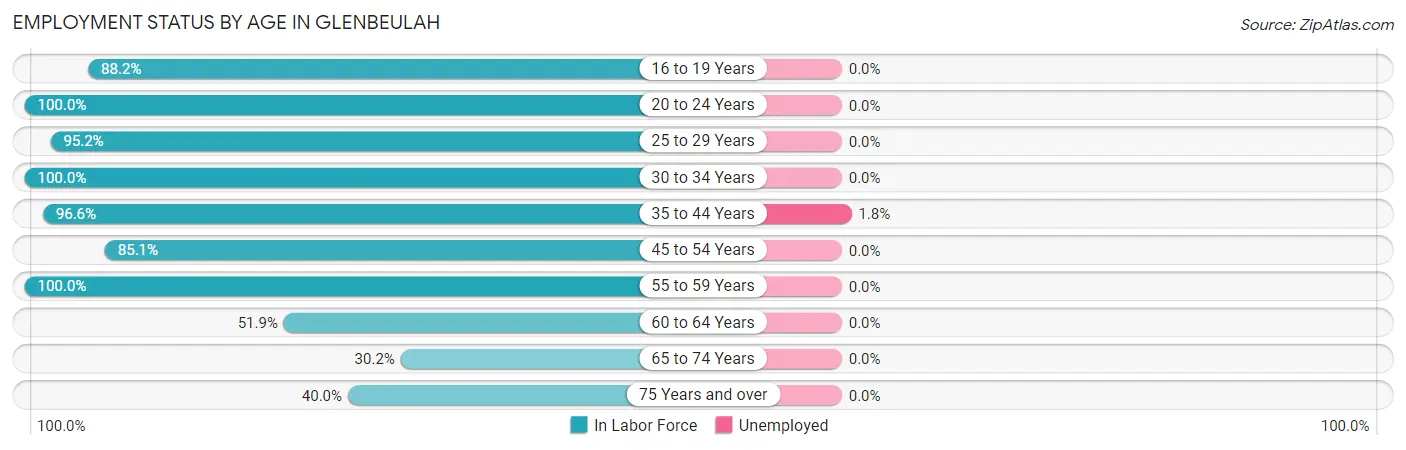
| Age Bracket | In Labor Force | Unemployed |
| 16 to 19 Years | 15 (88.2%) | 0 (0.0%) |
| 20 to 24 Years | 12 (100.0%) | 0 (0.0%) |
| 25 to 29 Years | 20 (95.2%) | 0 (0.0%) |
| 30 to 34 Years | 31 (100.0%) | 0 (0.0%) |
| 35 to 44 Years | 57 (96.6%) | 1 (1.8%) |
| 45 to 54 Years | 57 (85.1%) | 0 (0.0%) |
| 55 to 59 Years | 39 (100.0%) | 0 (0.0%) |
| 60 to 64 Years | 14 (51.9%) | 0 (0.0%) |
| 65 to 74 Years | 13 (30.2%) | 0 (0.0%) |
| 75 Years and over | 12 (40.0%) | 0 (0.0%) |
| Total | 270 (78.0%) | 1 (0.4%) |
Employment Status by Educational Attainment in Glenbeulah
According to labor force statistics for Glenbeulah, 89.3% of individuals (218) out of the total population between 25 and 64 years of age (244) are in the labor force, with 0.5% or 1 of them being unemployed. The group with the highest labor force participation rate are those with the educational attainment of bachelor's degree or higher, with 96.3% or 79 individuals in the labor force. Within the labor force, individuals with high school diploma education have the highest percentage of unemployment, with 1.7% or 1 of them being unemployed.
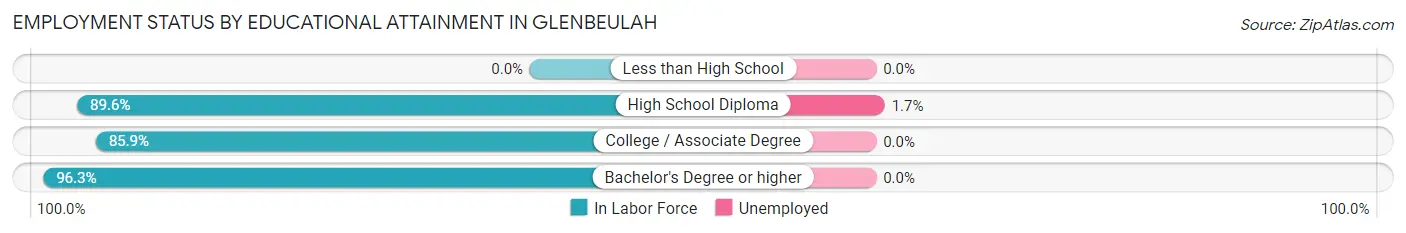
| Educational Attainment | In Labor Force | Unemployed |
| Less than High School | 0 (0.0%) | 0 (0.0%) |
| High School Diploma | 60 (89.6%) | 1 (1.7%) |
| College / Associate Degree | 79 (85.9%) | 0 (0.0%) |
| Bachelor's Degree or higher | 79 (96.3%) | 0 (0.0%) |
| Total | 218 (89.3%) | 1 (0.5%) |
Employment Occupations by Sex in Glenbeulah
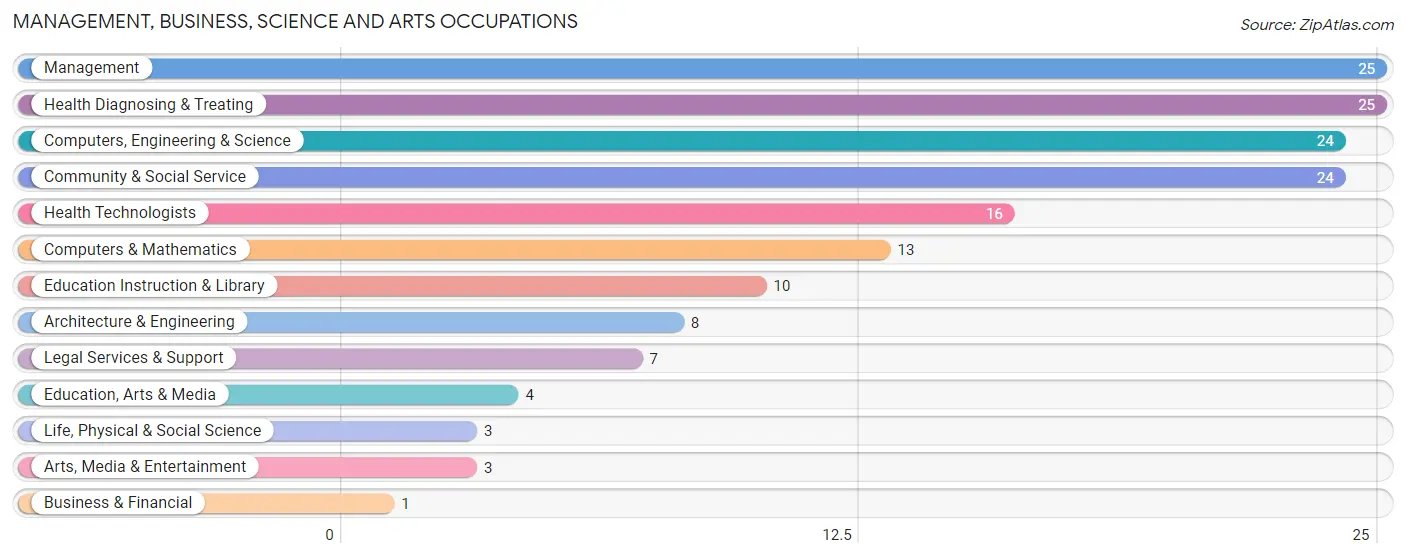
Management, Business, Science and Arts Occupations
The most common Management, Business, Science and Arts occupations in Glenbeulah are Management (25 | 9.3%), Health Diagnosing & Treating (25 | 9.3%), Computers, Engineering & Science (24 | 8.9%), Community & Social Service (24 | 8.9%), and Health Technologists (16 | 5.9%).
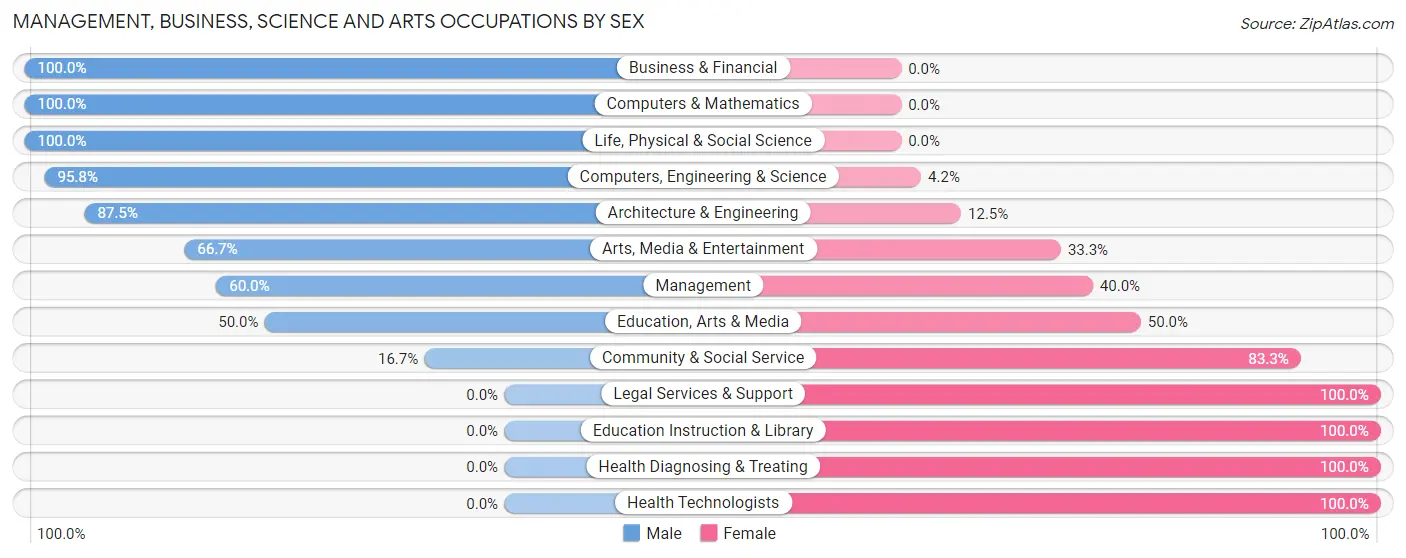
Management, Business, Science and Arts Occupations by Sex
Within the Management, Business, Science and Arts occupations in Glenbeulah, the most male-oriented occupations are Business & Financial (100.0%), Computers & Mathematics (100.0%), and Life, Physical & Social Science (100.0%), while the most female-oriented occupations are Legal Services & Support (100.0%), Education Instruction & Library (100.0%), and Health Diagnosing & Treating (100.0%).
| Occupation | Male | Female |
| Management | 15 (60.0%) | 10 (40.0%) |
| Business & Financial | 1 (100.0%) | 0 (0.0%) |
| Computers, Engineering & Science | 23 (95.8%) | 1 (4.2%) |
| Computers & Mathematics | 13 (100.0%) | 0 (0.0%) |
| Architecture & Engineering | 7 (87.5%) | 1 (12.5%) |
| Life, Physical & Social Science | 3 (100.0%) | 0 (0.0%) |
| Community & Social Service | 4 (16.7%) | 20 (83.3%) |
| Education, Arts & Media | 2 (50.0%) | 2 (50.0%) |
| Legal Services & Support | 0 (0.0%) | 7 (100.0%) |
| Education Instruction & Library | 0 (0.0%) | 10 (100.0%) |
| Arts, Media & Entertainment | 2 (66.7%) | 1 (33.3%) |
| Health Diagnosing & Treating | 0 (0.0%) | 25 (100.0%) |
| Health Technologists | 0 (0.0%) | 16 (100.0%) |
| Total (Category) | 43 (43.4%) | 56 (56.6%) |
| Total (Overall) | 143 (53.2%) | 126 (46.8%) |
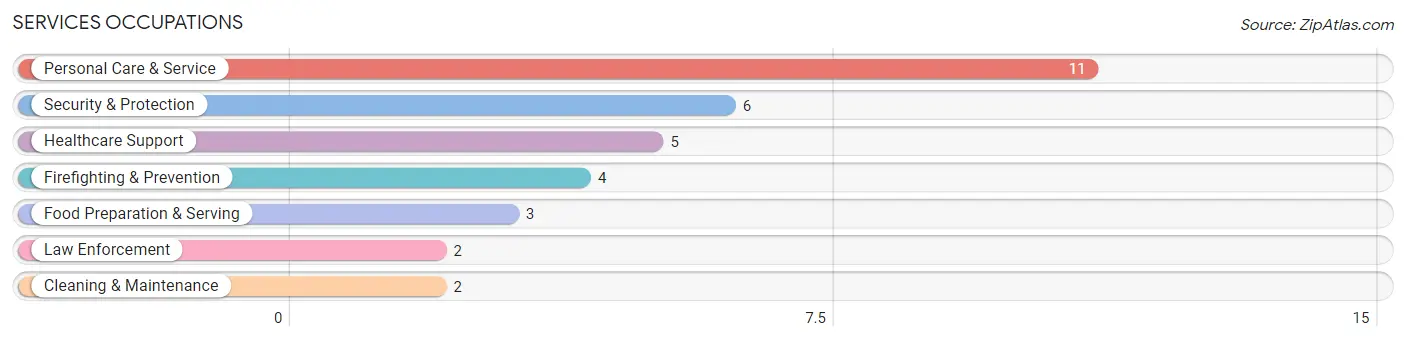
Services Occupations
The most common Services occupations in Glenbeulah are Personal Care & Service (11 | 4.1%), Security & Protection (6 | 2.2%), Healthcare Support (5 | 1.9%), Firefighting & Prevention (4 | 1.5%), and Food Preparation & Serving (3 | 1.1%).
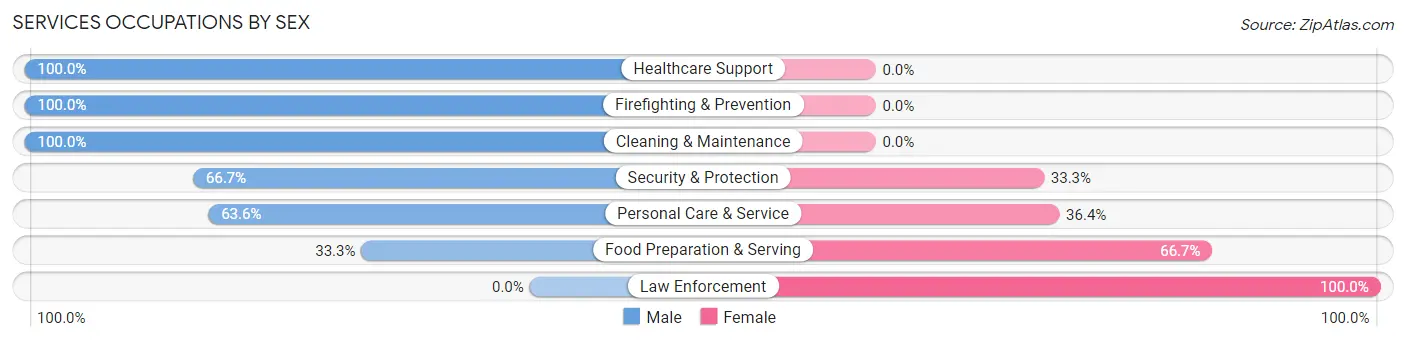
Services Occupations by Sex
Within the Services occupations in Glenbeulah, the most male-oriented occupations are Healthcare Support (100.0%), Firefighting & Prevention (100.0%), and Cleaning & Maintenance (100.0%), while the most female-oriented occupations are Law Enforcement (100.0%), Food Preparation & Serving (66.7%), and Personal Care & Service (36.4%).
| Occupation | Male | Female |
| Healthcare Support | 5 (100.0%) | 0 (0.0%) |
| Security & Protection | 4 (66.7%) | 2 (33.3%) |
| Firefighting & Prevention | 4 (100.0%) | 0 (0.0%) |
| Law Enforcement | 0 (0.0%) | 2 (100.0%) |
| Food Preparation & Serving | 1 (33.3%) | 2 (66.7%) |
| Cleaning & Maintenance | 2 (100.0%) | 0 (0.0%) |
| Personal Care & Service | 7 (63.6%) | 4 (36.4%) |
| Total (Category) | 19 (70.4%) | 8 (29.6%) |
| Total (Overall) | 143 (53.2%) | 126 (46.8%) |
Sales and Office Occupations
The most common Sales and Office occupations in Glenbeulah are Office & Administration (33 | 12.3%), and Sales & Related (20 | 7.4%).
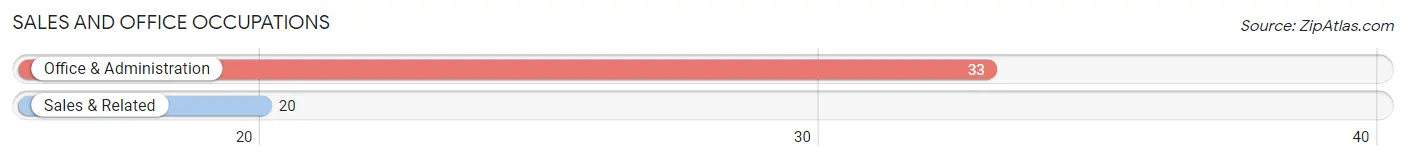
Sales and Office Occupations by Sex
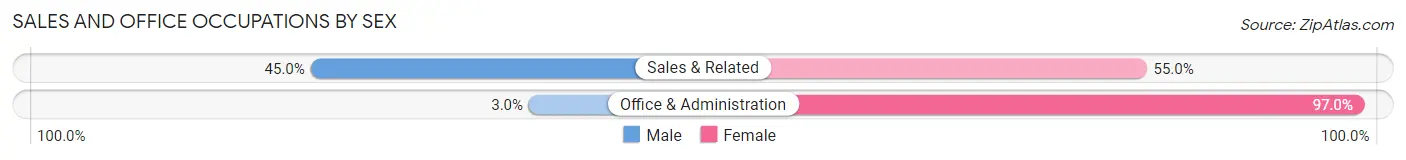
| Occupation | Male | Female |
| Sales & Related | 9 (45.0%) | 11 (55.0%) |
| Office & Administration | 1 (3.0%) | 32 (97.0%) |
| Total (Category) | 10 (18.9%) | 43 (81.1%) |
| Total (Overall) | 143 (53.2%) | 126 (46.8%) |
Natural Resources, Construction and Maintenance Occupations
The most common Natural Resources, Construction and Maintenance occupations in Glenbeulah are Installation, Maintenance & Repair (10 | 3.7%), Construction & Extraction (4 | 1.5%), and Farming, Fishing & Forestry (2 | 0.7%).
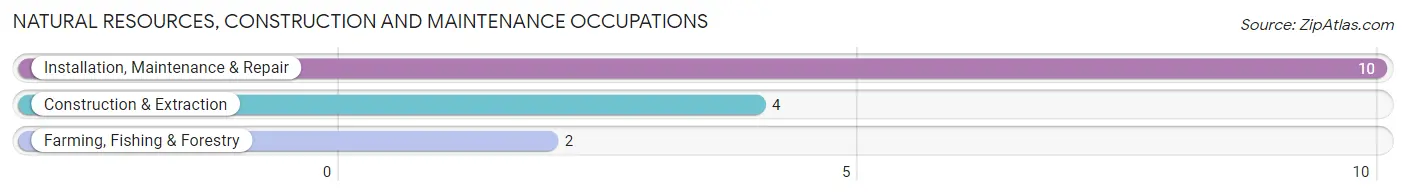
Natural Resources, Construction and Maintenance Occupations by Sex
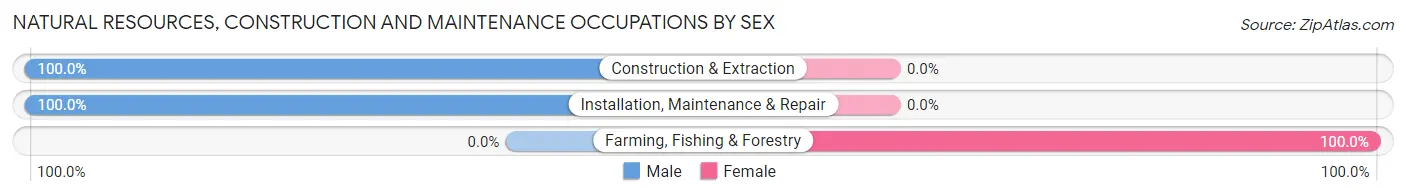
| Occupation | Male | Female |
| Farming, Fishing & Forestry | 0 (0.0%) | 2 (100.0%) |
| Construction & Extraction | 4 (100.0%) | 0 (0.0%) |
| Installation, Maintenance & Repair | 10 (100.0%) | 0 (0.0%) |
| Total (Category) | 14 (87.5%) | 2 (12.5%) |
| Total (Overall) | 143 (53.2%) | 126 (46.8%) |
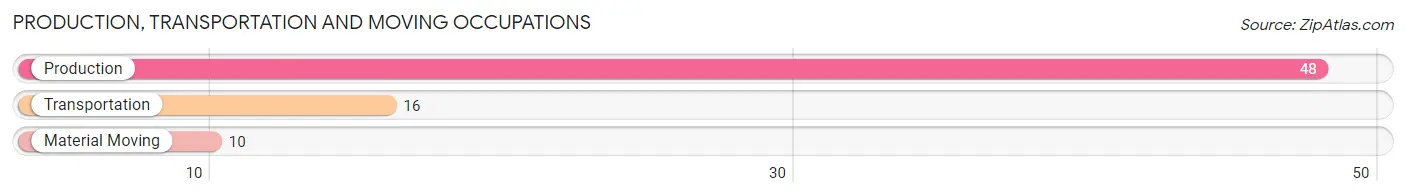
Production, Transportation and Moving Occupations
The most common Production, Transportation and Moving occupations in Glenbeulah are Production (48 | 17.8%), Transportation (16 | 5.9%), and Material Moving (10 | 3.7%).
Production, Transportation and Moving Occupations by Sex
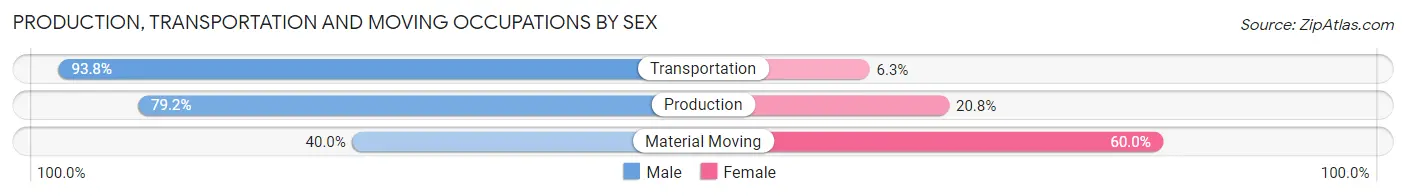
| Occupation | Male | Female |
| Production | 38 (79.2%) | 10 (20.8%) |
| Transportation | 15 (93.8%) | 1 (6.2%) |
| Material Moving | 4 (40.0%) | 6 (60.0%) |
| Total (Category) | 57 (77.0%) | 17 (23.0%) |
| Total (Overall) | 143 (53.2%) | 126 (46.8%) |
Employment Industries by Sex in Glenbeulah
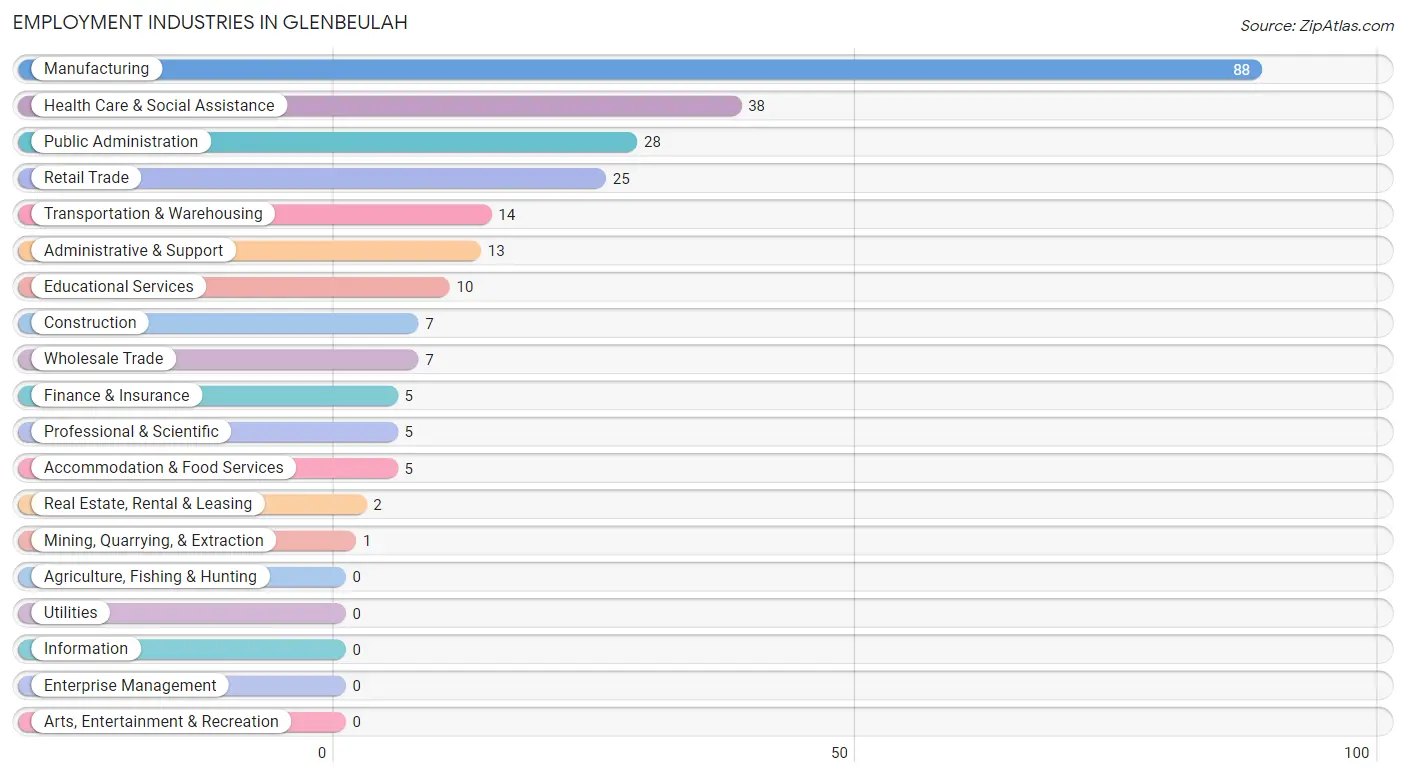
Employment Industries in Glenbeulah
The major employment industries in Glenbeulah include Manufacturing (88 | 32.7%), Health Care & Social Assistance (38 | 14.1%), Public Administration (28 | 10.4%), Retail Trade (25 | 9.3%), and Transportation & Warehousing (14 | 5.2%).
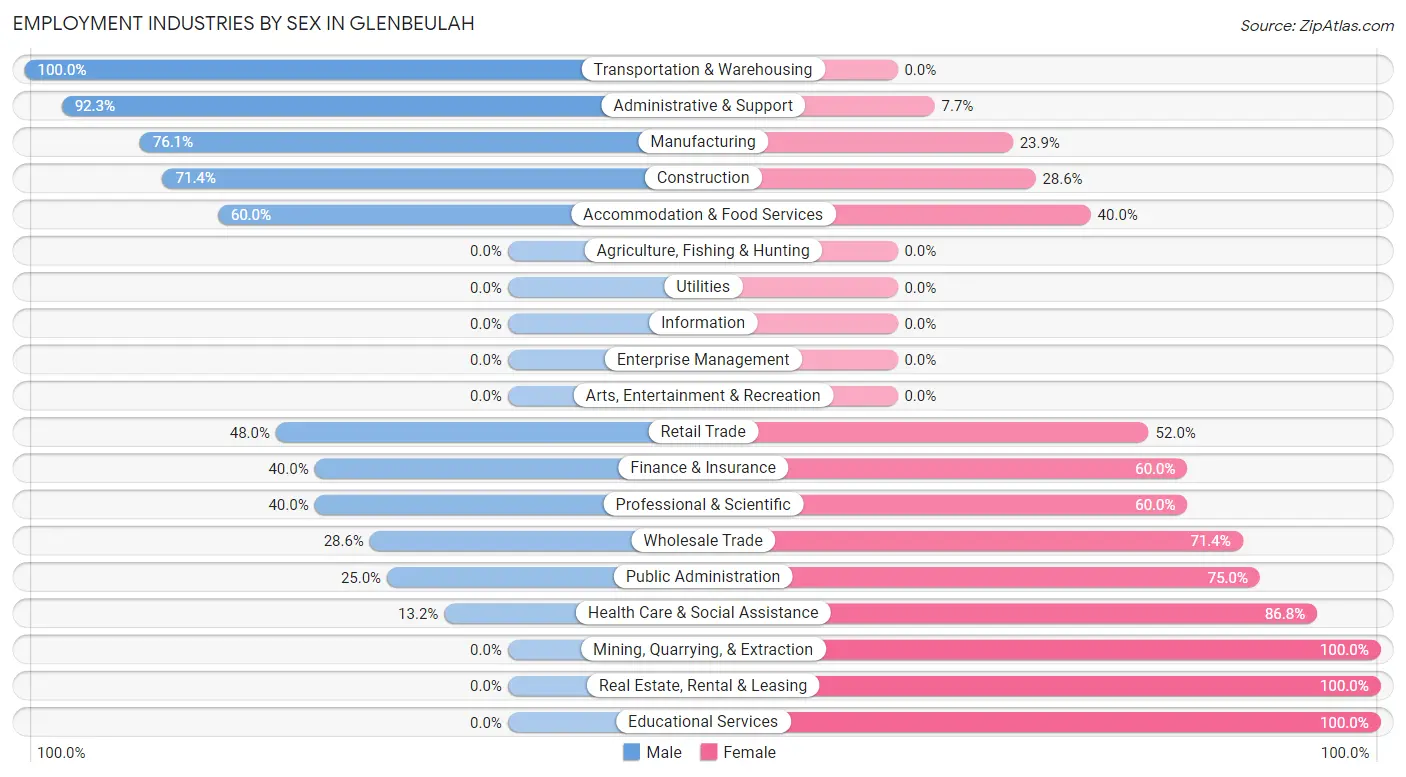
Employment Industries by Sex in Glenbeulah
The Glenbeulah industries that see more men than women are Transportation & Warehousing (100.0%), Administrative & Support (92.3%), and Manufacturing (76.1%), whereas the industries that tend to have a higher number of women are Mining, Quarrying, & Extraction (100.0%), Real Estate, Rental & Leasing (100.0%), and Educational Services (100.0%).
| Industry | Male | Female |
| Agriculture, Fishing & Hunting | 0 (0.0%) | 0 (0.0%) |
| Mining, Quarrying, & Extraction | 0 (0.0%) | 1 (100.0%) |
| Construction | 5 (71.4%) | 2 (28.6%) |
| Manufacturing | 67 (76.1%) | 21 (23.9%) |
| Wholesale Trade | 2 (28.6%) | 5 (71.4%) |
| Retail Trade | 12 (48.0%) | 13 (52.0%) |
| Transportation & Warehousing | 14 (100.0%) | 0 (0.0%) |
| Utilities | 0 (0.0%) | 0 (0.0%) |
| Information | 0 (0.0%) | 0 (0.0%) |
| Finance & Insurance | 2 (40.0%) | 3 (60.0%) |
| Real Estate, Rental & Leasing | 0 (0.0%) | 2 (100.0%) |
| Professional & Scientific | 2 (40.0%) | 3 (60.0%) |
| Enterprise Management | 0 (0.0%) | 0 (0.0%) |
| Administrative & Support | 12 (92.3%) | 1 (7.7%) |
| Educational Services | 0 (0.0%) | 10 (100.0%) |
| Health Care & Social Assistance | 5 (13.2%) | 33 (86.8%) |
| Arts, Entertainment & Recreation | 0 (0.0%) | 0 (0.0%) |
| Accommodation & Food Services | 3 (60.0%) | 2 (40.0%) |
| Public Administration | 7 (25.0%) | 21 (75.0%) |
| Total | 143 (53.2%) | 126 (46.8%) |
Education in Glenbeulah
School Enrollment in Glenbeulah
The most common levels of schooling among the 62 students in Glenbeulah are high school (16 | 25.8%), college / undergraduate (11 | 17.7%), and elementary school (10 | 16.1%).
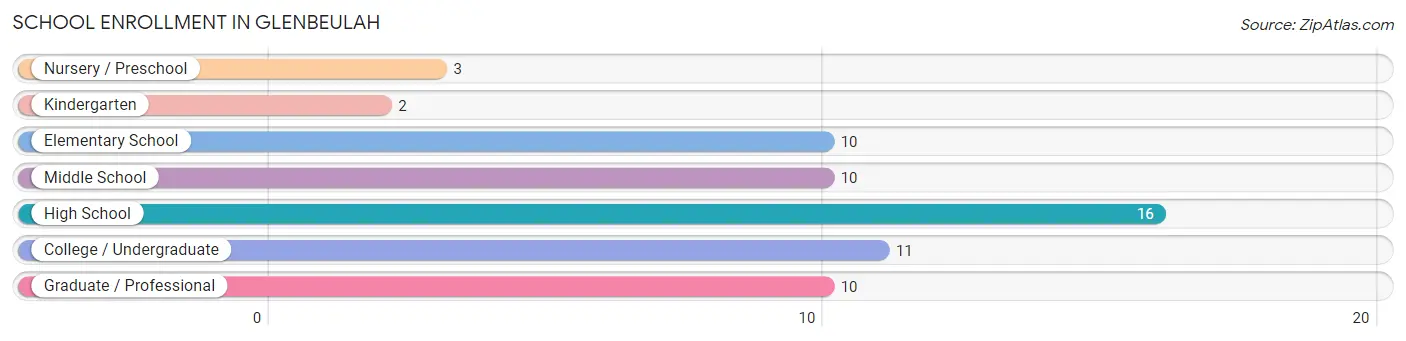
| School Level | # Students | % Students |
| Nursery / Preschool | 3 | 4.8% |
| Kindergarten | 2 | 3.2% |
| Elementary School | 10 | 16.1% |
| Middle School | 10 | 16.1% |
| High School | 16 | 25.8% |
| College / Undergraduate | 11 | 17.7% |
| Graduate / Professional | 10 | 16.1% |
| Total | 62 | 100.0% |
School Enrollment by Age by Funding Source in Glenbeulah
Out of a total of 62 students who are enrolled in schools in Glenbeulah, 5 (8.1%) attend a private institution, while the remaining 57 (91.9%) are enrolled in public schools. The age group of 25 to 34 year olds has the highest likelihood of being enrolled in private schools, with 1 (100.0% in the age bracket) enrolled. Conversely, the age group of 3 to 4 year olds has the lowest likelihood of being enrolled in a private school, with 3 (100.0% in the age bracket) attending a public institution.
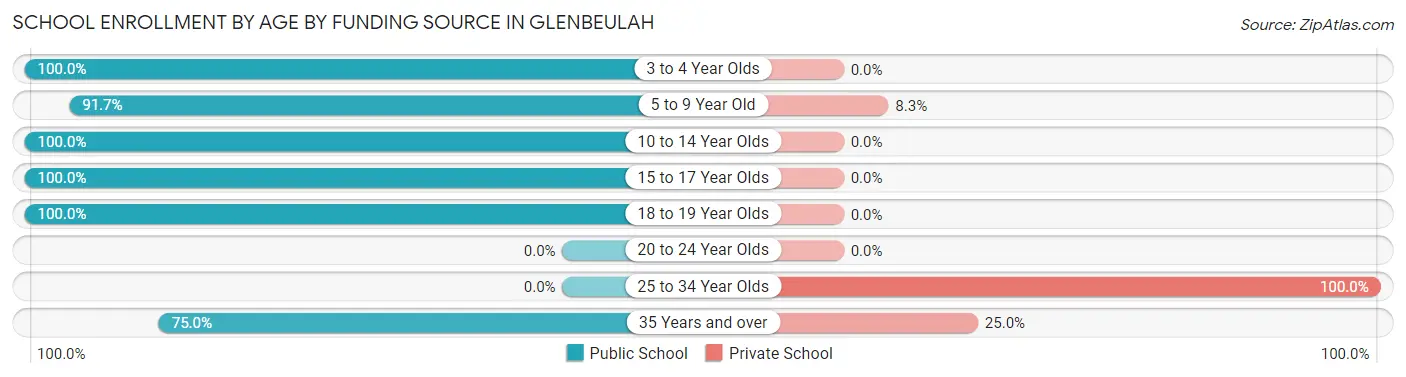
| Age Bracket | Public School | Private School |
| 3 to 4 Year Olds | 3 (100.0%) | 0 (0.0%) |
| 5 to 9 Year Old | 11 (91.7%) | 1 (8.3%) |
| 10 to 14 Year Olds | 11 (100.0%) | 0 (0.0%) |
| 15 to 17 Year Olds | 13 (100.0%) | 0 (0.0%) |
| 18 to 19 Year Olds | 10 (100.0%) | 0 (0.0%) |
| 20 to 24 Year Olds | 0 (0.0%) | 0 (0.0%) |
| 25 to 34 Year Olds | 0 (0.0%) | 1 (100.0%) |
| 35 Years and over | 9 (75.0%) | 3 (25.0%) |
| Total | 57 (91.9%) | 5 (8.1%) |
Educational Attainment by Field of Study in Glenbeulah
Science & technology (17 | 16.4%), education (15 | 14.4%), liberal arts & history (14 | 13.5%), business (13 | 12.5%), and communications (12 | 11.5%) are the most common fields of study among 104 individuals in Glenbeulah who have obtained a bachelor's degree or higher.
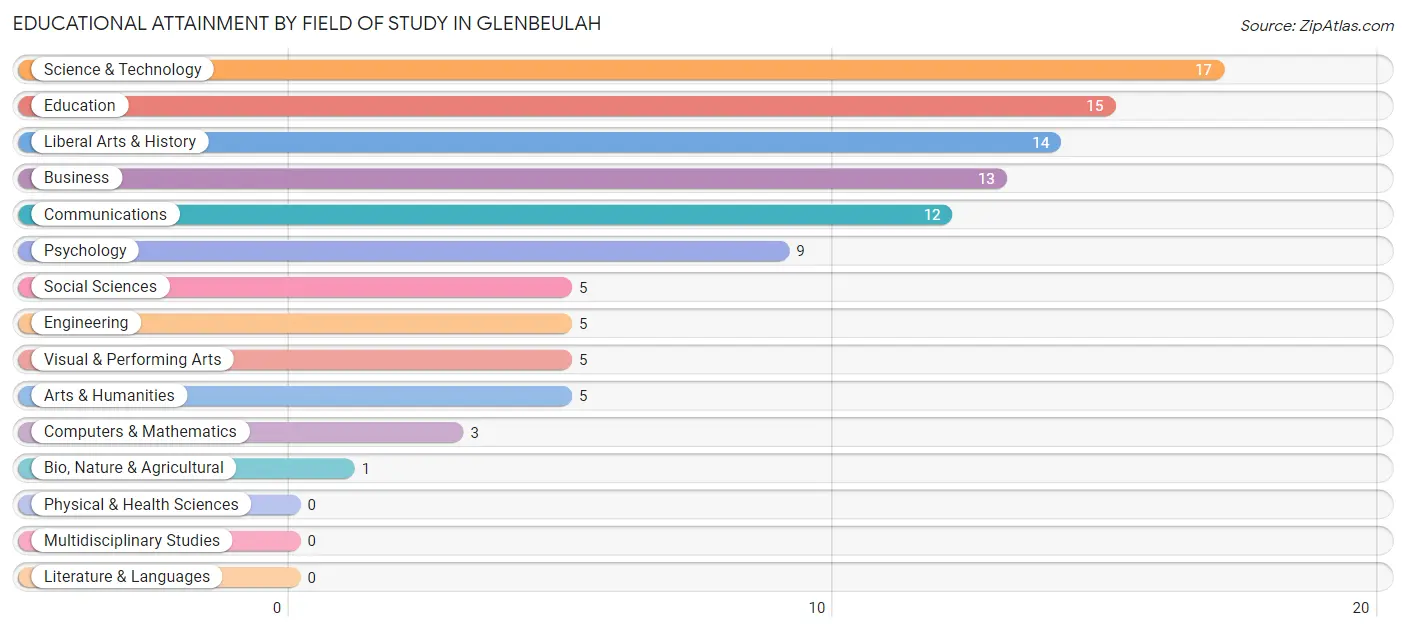
| Field of Study | # Graduates | % Graduates |
| Computers & Mathematics | 3 | 2.9% |
| Bio, Nature & Agricultural | 1 | 1.0% |
| Physical & Health Sciences | 0 | 0.0% |
| Psychology | 9 | 8.6% |
| Social Sciences | 5 | 4.8% |
| Engineering | 5 | 4.8% |
| Multidisciplinary Studies | 0 | 0.0% |
| Science & Technology | 17 | 16.4% |
| Business | 13 | 12.5% |
| Education | 15 | 14.4% |
| Literature & Languages | 0 | 0.0% |
| Liberal Arts & History | 14 | 13.5% |
| Visual & Performing Arts | 5 | 4.8% |
| Communications | 12 | 11.5% |
| Arts & Humanities | 5 | 4.8% |
| Total | 104 | 100.0% |
Transportation & Commute in Glenbeulah
Vehicle Availability by Sex in Glenbeulah
The most prevalent vehicle ownership categories in Glenbeulah are males with 2 vehicles (66, accounting for 46.2%) and females with 2 vehicles (63, making up 53.2%).
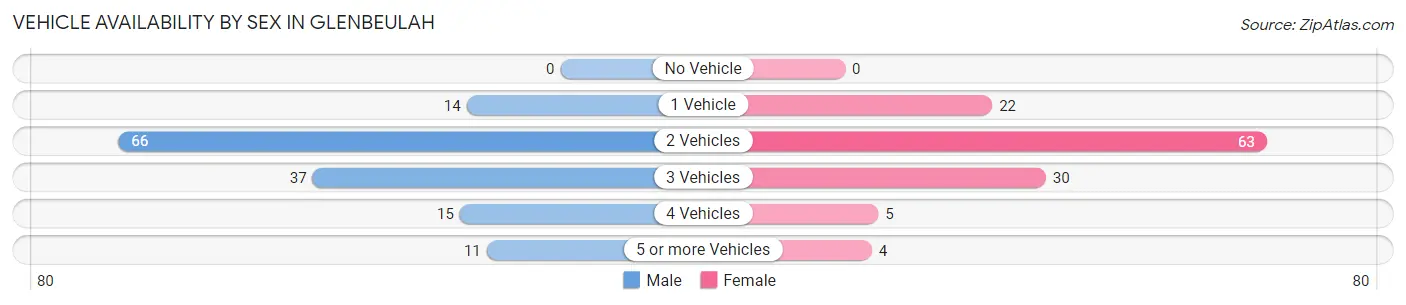
| Vehicles Available | Male | Female |
| No Vehicle | 0 (0.0%) | 0 (0.0%) |
| 1 Vehicle | 14 (9.8%) | 22 (17.7%) |
| 2 Vehicles | 66 (46.2%) | 63 (50.8%) |
| 3 Vehicles | 37 (25.9%) | 30 (24.2%) |
| 4 Vehicles | 15 (10.5%) | 5 (4.0%) |
| 5 or more Vehicles | 11 (7.7%) | 4 (3.2%) |
| Total | 143 (100.0%) | 124 (100.0%) |
Commute Time in Glenbeulah
The most frequently occuring commute durations in Glenbeulah are 10 to 14 minutes (57 commuters, 22.5%), 20 to 24 minutes (35 commuters, 13.8%), and 25 to 29 minutes (28 commuters, 11.1%).
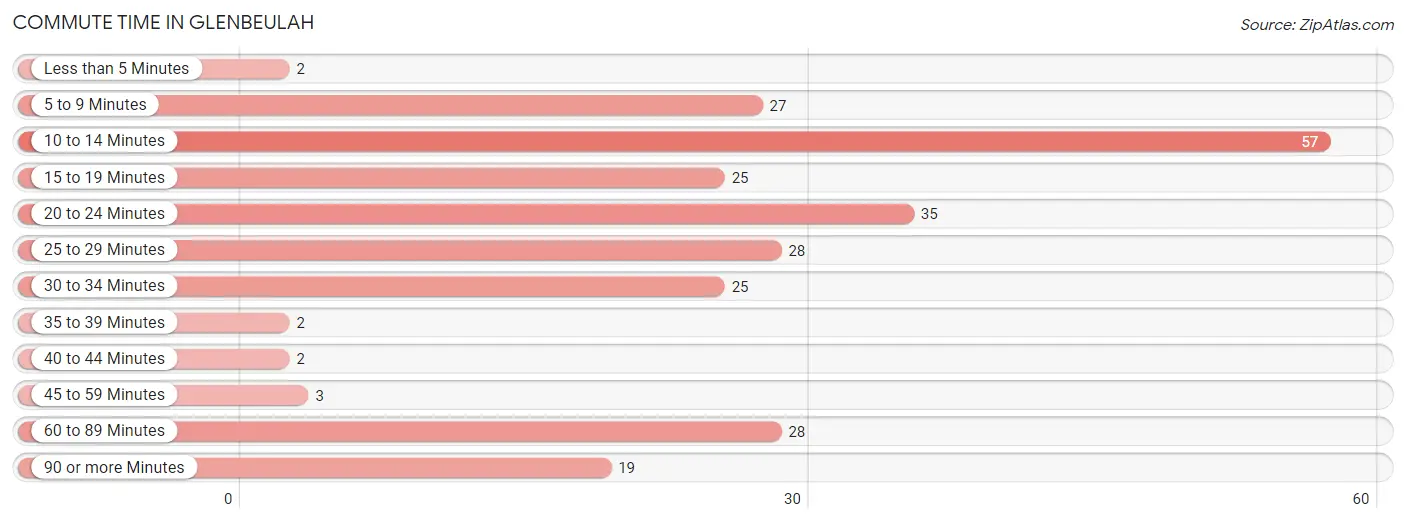
| Commute Time | # Commuters | % Commuters |
| Less than 5 Minutes | 2 | 0.8% |
| 5 to 9 Minutes | 27 | 10.7% |
| 10 to 14 Minutes | 57 | 22.5% |
| 15 to 19 Minutes | 25 | 9.9% |
| 20 to 24 Minutes | 35 | 13.8% |
| 25 to 29 Minutes | 28 | 11.1% |
| 30 to 34 Minutes | 25 | 9.9% |
| 35 to 39 Minutes | 2 | 0.8% |
| 40 to 44 Minutes | 2 | 0.8% |
| 45 to 59 Minutes | 3 | 1.2% |
| 60 to 89 Minutes | 28 | 11.1% |
| 90 or more Minutes | 19 | 7.5% |
Commute Time by Sex in Glenbeulah
The most common commute times in Glenbeulah are 10 to 14 minutes (33 commuters, 24.6%) for males and 10 to 14 minutes (24 commuters, 20.2%) for females.
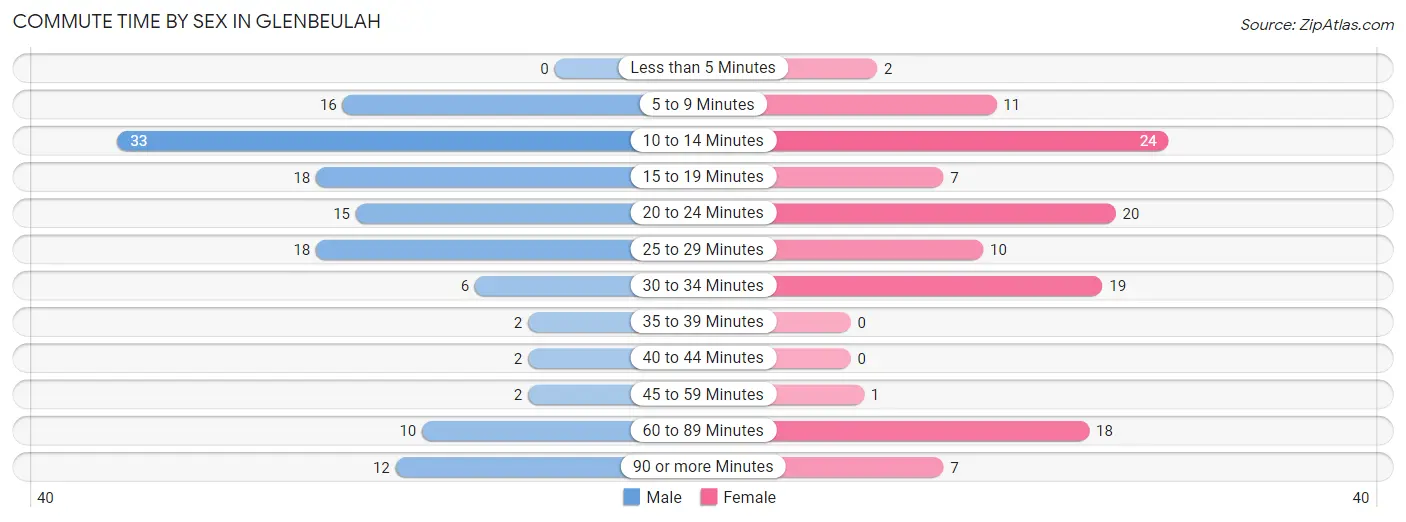
| Commute Time | Male | Female |
| Less than 5 Minutes | 0 (0.0%) | 2 (1.7%) |
| 5 to 9 Minutes | 16 (11.9%) | 11 (9.2%) |
| 10 to 14 Minutes | 33 (24.6%) | 24 (20.2%) |
| 15 to 19 Minutes | 18 (13.4%) | 7 (5.9%) |
| 20 to 24 Minutes | 15 (11.2%) | 20 (16.8%) |
| 25 to 29 Minutes | 18 (13.4%) | 10 (8.4%) |
| 30 to 34 Minutes | 6 (4.5%) | 19 (16.0%) |
| 35 to 39 Minutes | 2 (1.5%) | 0 (0.0%) |
| 40 to 44 Minutes | 2 (1.5%) | 0 (0.0%) |
| 45 to 59 Minutes | 2 (1.5%) | 1 (0.8%) |
| 60 to 89 Minutes | 10 (7.5%) | 18 (15.1%) |
| 90 or more Minutes | 12 (9.0%) | 7 (5.9%) |
Time of Departure to Work by Sex in Glenbeulah
The most frequent times of departure to work in Glenbeulah are 6:00 AM to 6:29 AM (20, 14.9%) for males and 7:00 AM to 7:29 AM (30, 25.2%) for females.
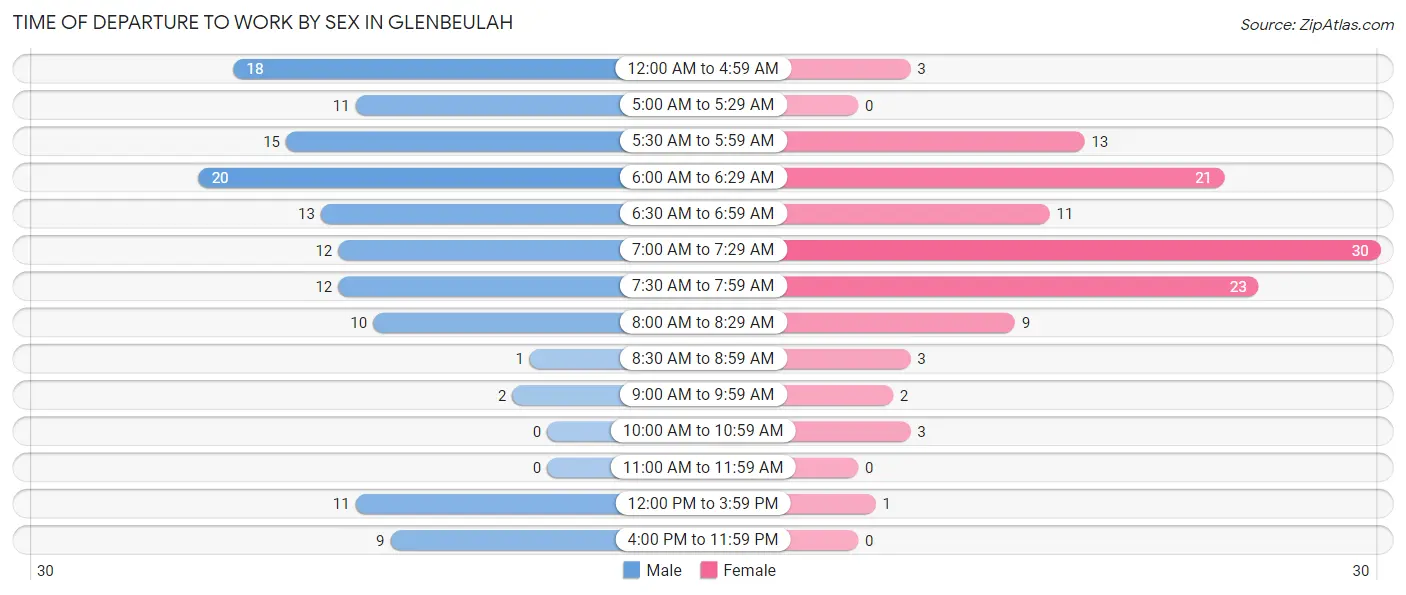
| Time of Departure | Male | Female |
| 12:00 AM to 4:59 AM | 18 (13.4%) | 3 (2.5%) |
| 5:00 AM to 5:29 AM | 11 (8.2%) | 0 (0.0%) |
| 5:30 AM to 5:59 AM | 15 (11.2%) | 13 (10.9%) |
| 6:00 AM to 6:29 AM | 20 (14.9%) | 21 (17.6%) |
| 6:30 AM to 6:59 AM | 13 (9.7%) | 11 (9.2%) |
| 7:00 AM to 7:29 AM | 12 (9.0%) | 30 (25.2%) |
| 7:30 AM to 7:59 AM | 12 (9.0%) | 23 (19.3%) |
| 8:00 AM to 8:29 AM | 10 (7.5%) | 9 (7.6%) |
| 8:30 AM to 8:59 AM | 1 (0.7%) | 3 (2.5%) |
| 9:00 AM to 9:59 AM | 2 (1.5%) | 2 (1.7%) |
| 10:00 AM to 10:59 AM | 0 (0.0%) | 3 (2.5%) |
| 11:00 AM to 11:59 AM | 0 (0.0%) | 0 (0.0%) |
| 12:00 PM to 3:59 PM | 11 (8.2%) | 1 (0.8%) |
| 4:00 PM to 11:59 PM | 9 (6.7%) | 0 (0.0%) |
| Total | 134 (100.0%) | 119 (100.0%) |
Housing Occupancy in Glenbeulah
Occupancy by Ownership in Glenbeulah
Of the total 189 dwellings in Glenbeulah, owner-occupied units account for 161 (85.2%), while renter-occupied units make up 28 (14.8%).
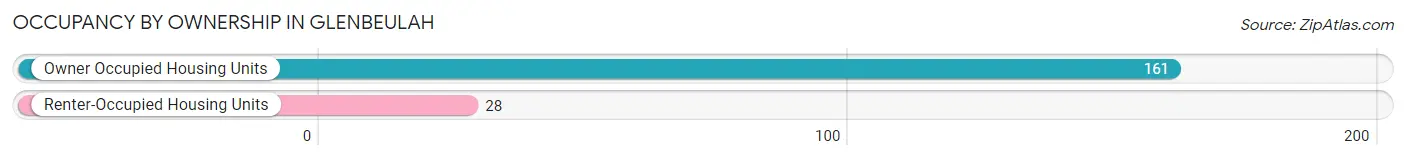
| Occupancy | # Housing Units | % Housing Units |
| Owner Occupied Housing Units | 161 | 85.2% |
| Renter-Occupied Housing Units | 28 | 14.8% |
| Total Occupied Housing Units | 189 | 100.0% |
Occupancy by Household Size in Glenbeulah
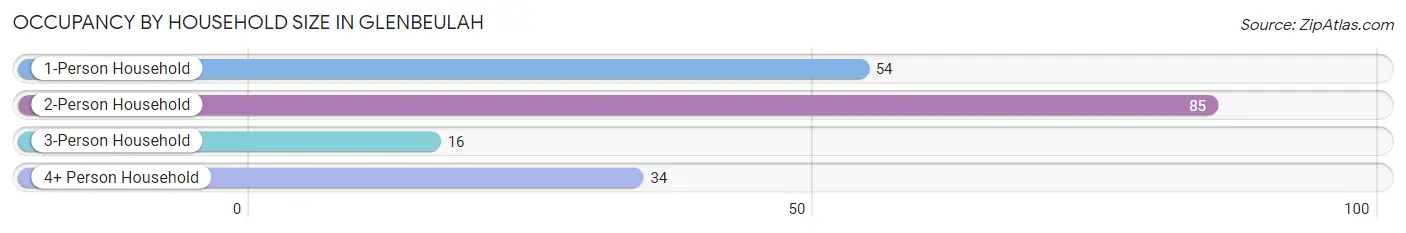
| Household Size | # Housing Units | % Housing Units |
| 1-Person Household | 54 | 28.6% |
| 2-Person Household | 85 | 45.0% |
| 3-Person Household | 16 | 8.5% |
| 4+ Person Household | 34 | 18.0% |
| Total Housing Units | 189 | 100.0% |
Occupancy by Ownership by Household Size in Glenbeulah
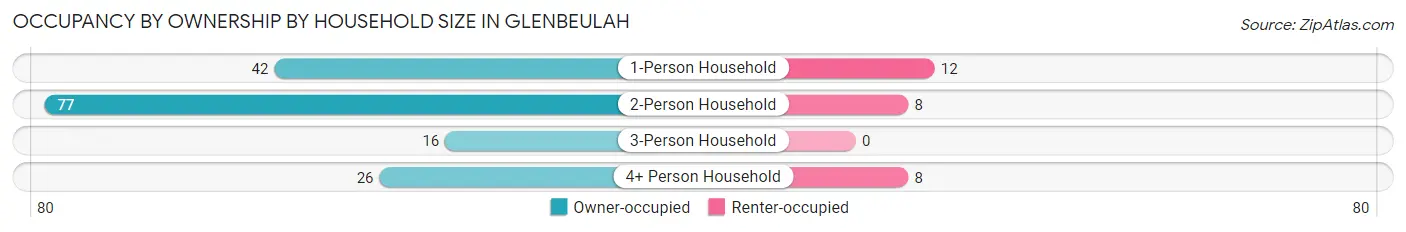
| Household Size | Owner-occupied | Renter-occupied |
| 1-Person Household | 42 (77.8%) | 12 (22.2%) |
| 2-Person Household | 77 (90.6%) | 8 (9.4%) |
| 3-Person Household | 16 (100.0%) | 0 (0.0%) |
| 4+ Person Household | 26 (76.5%) | 8 (23.5%) |
| Total Housing Units | 161 (85.2%) | 28 (14.8%) |
Occupancy by Educational Attainment in Glenbeulah
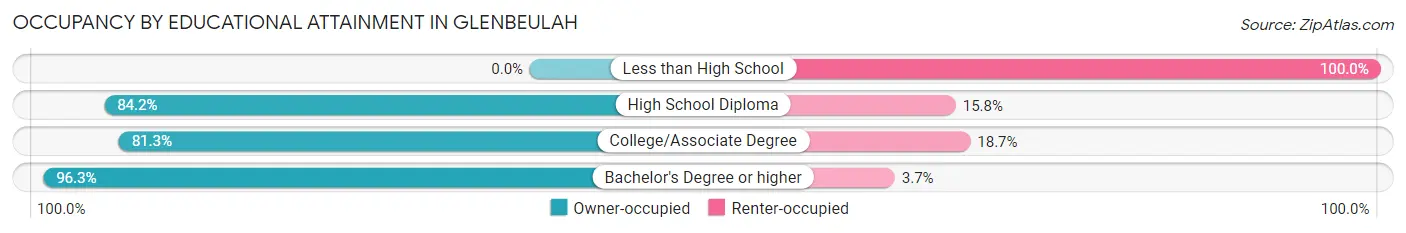
| Household Size | Owner-occupied | Renter-occupied |
| Less than High School | 0 (0.0%) | 3 (100.0%) |
| High School Diploma | 48 (84.2%) | 9 (15.8%) |
| College/Associate Degree | 61 (81.3%) | 14 (18.7%) |
| Bachelor's Degree or higher | 52 (96.3%) | 2 (3.7%) |
Occupancy by Age of Householder in Glenbeulah
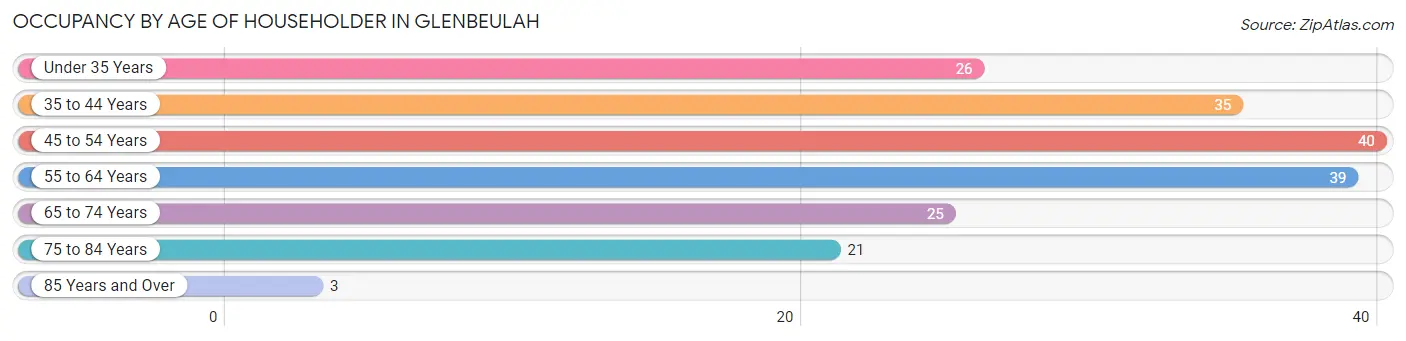
| Age Bracket | # Households | % Households |
| Under 35 Years | 26 | 13.8% |
| 35 to 44 Years | 35 | 18.5% |
| 45 to 54 Years | 40 | 21.2% |
| 55 to 64 Years | 39 | 20.6% |
| 65 to 74 Years | 25 | 13.2% |
| 75 to 84 Years | 21 | 11.1% |
| 85 Years and Over | 3 | 1.6% |
| Total | 189 | 100.0% |
Housing Finances in Glenbeulah
Median Income by Occupancy in Glenbeulah
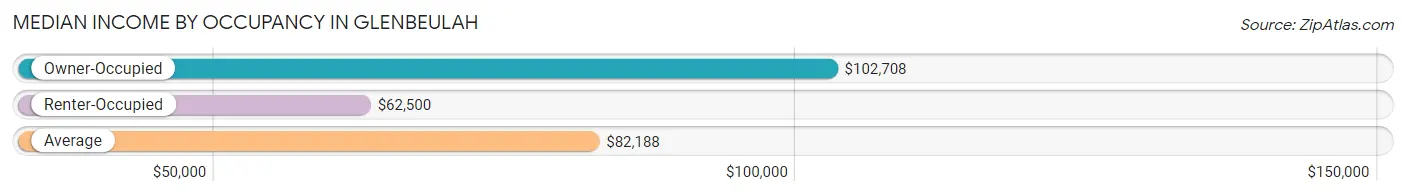
| Occupancy Type | # Households | Median Income |
| Owner-Occupied | 161 (85.2%) | $102,708 |
| Renter-Occupied | 28 (14.8%) | $62,500 |
| Average | 189 (100.0%) | $82,188 |
Occupancy by Householder Income Bracket in Glenbeulah
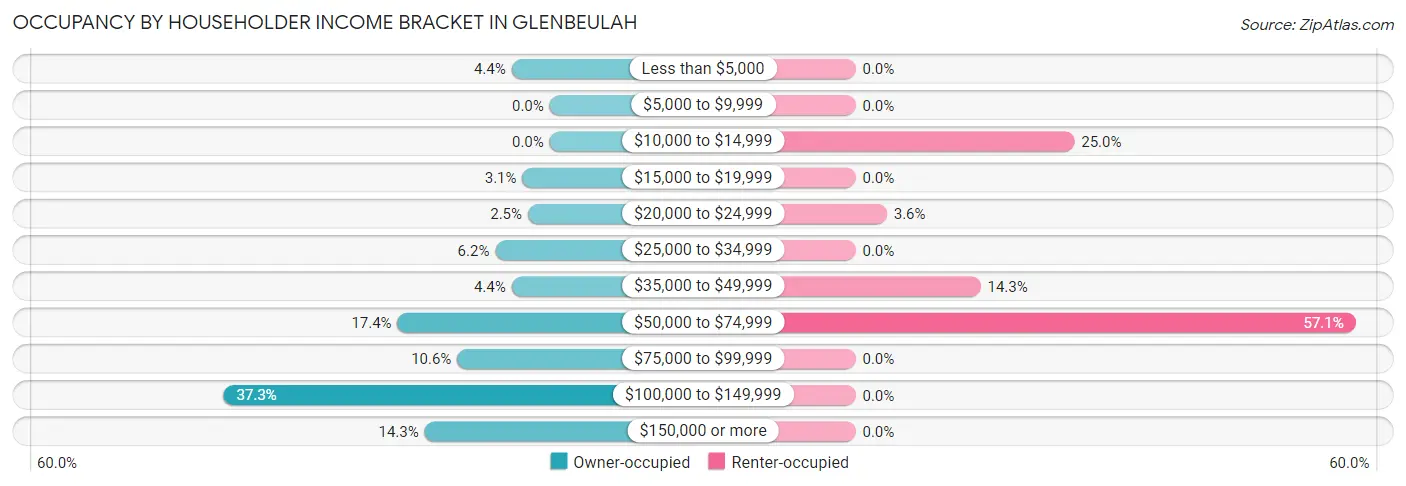
| Income Bracket | Owner-occupied | Renter-occupied |
| Less than $5,000 | 7 (4.3%) | 0 (0.0%) |
| $5,000 to $9,999 | 0 (0.0%) | 0 (0.0%) |
| $10,000 to $14,999 | 0 (0.0%) | 7 (25.0%) |
| $15,000 to $19,999 | 5 (3.1%) | 0 (0.0%) |
| $20,000 to $24,999 | 4 (2.5%) | 1 (3.6%) |
| $25,000 to $34,999 | 10 (6.2%) | 0 (0.0%) |
| $35,000 to $49,999 | 7 (4.3%) | 4 (14.3%) |
| $50,000 to $74,999 | 28 (17.4%) | 16 (57.1%) |
| $75,000 to $99,999 | 17 (10.6%) | 0 (0.0%) |
| $100,000 to $149,999 | 60 (37.3%) | 0 (0.0%) |
| $150,000 or more | 23 (14.3%) | 0 (0.0%) |
| Total | 161 (100.0%) | 28 (100.0%) |
Monthly Housing Cost Tiers in Glenbeulah
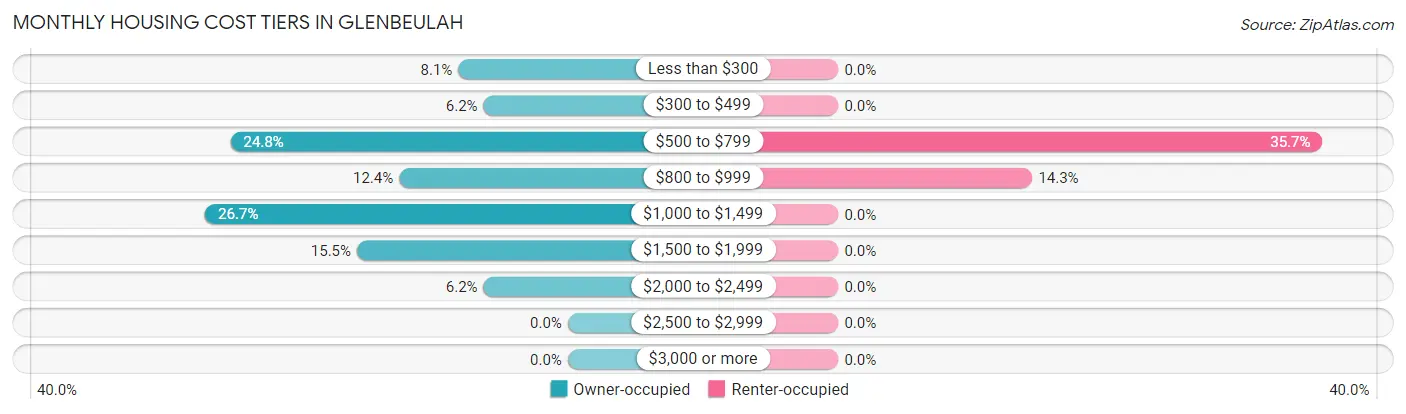
| Monthly Cost | Owner-occupied | Renter-occupied |
| Less than $300 | 13 (8.1%) | 0 (0.0%) |
| $300 to $499 | 10 (6.2%) | 0 (0.0%) |
| $500 to $799 | 40 (24.8%) | 10 (35.7%) |
| $800 to $999 | 20 (12.4%) | 4 (14.3%) |
| $1,000 to $1,499 | 43 (26.7%) | 0 (0.0%) |
| $1,500 to $1,999 | 25 (15.5%) | 0 (0.0%) |
| $2,000 to $2,499 | 10 (6.2%) | 0 (0.0%) |
| $2,500 to $2,999 | 0 (0.0%) | 0 (0.0%) |
| $3,000 or more | 0 (0.0%) | 0 (0.0%) |
| Total | 161 (100.0%) | 28 (100.0%) |
Physical Housing Characteristics in Glenbeulah
Housing Structures in Glenbeulah
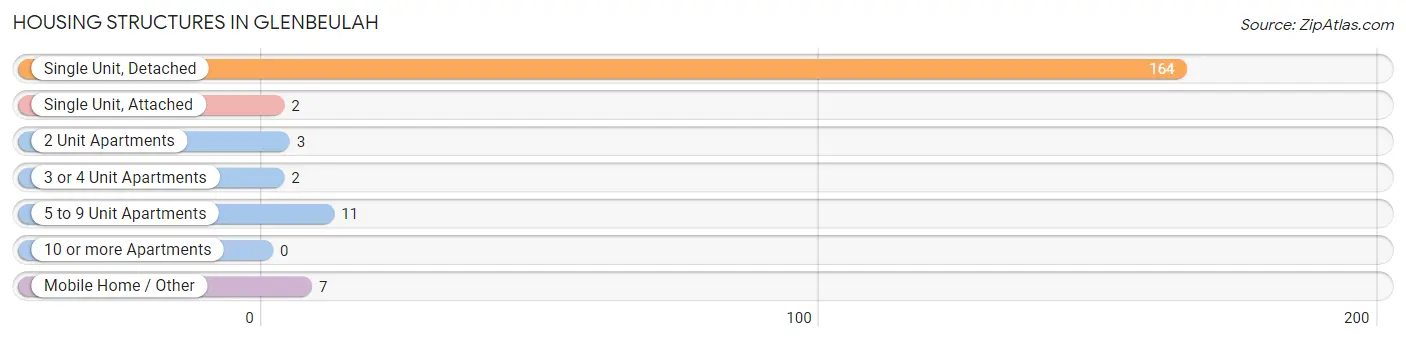
| Structure Type | # Housing Units | % Housing Units |
| Single Unit, Detached | 164 | 86.8% |
| Single Unit, Attached | 2 | 1.1% |
| 2 Unit Apartments | 3 | 1.6% |
| 3 or 4 Unit Apartments | 2 | 1.1% |
| 5 to 9 Unit Apartments | 11 | 5.8% |
| 10 or more Apartments | 0 | 0.0% |
| Mobile Home / Other | 7 | 3.7% |
| Total | 189 | 100.0% |
Housing Structures by Occupancy in Glenbeulah
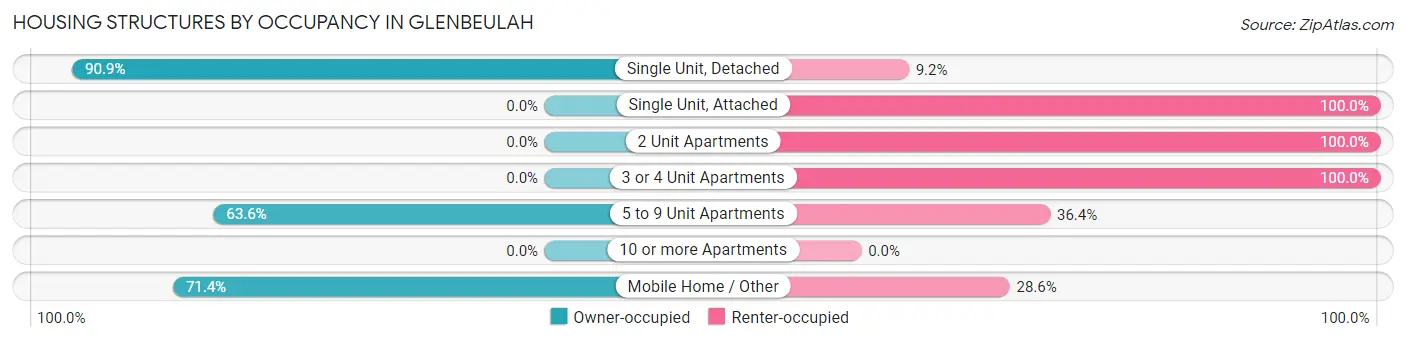
| Structure Type | Owner-occupied | Renter-occupied |
| Single Unit, Detached | 149 (90.8%) | 15 (9.1%) |
| Single Unit, Attached | 0 (0.0%) | 2 (100.0%) |
| 2 Unit Apartments | 0 (0.0%) | 3 (100.0%) |
| 3 or 4 Unit Apartments | 0 (0.0%) | 2 (100.0%) |
| 5 to 9 Unit Apartments | 7 (63.6%) | 4 (36.4%) |
| 10 or more Apartments | 0 (0.0%) | 0 (0.0%) |
| Mobile Home / Other | 5 (71.4%) | 2 (28.6%) |
| Total | 161 (85.2%) | 28 (14.8%) |
Housing Structures by Number of Rooms in Glenbeulah
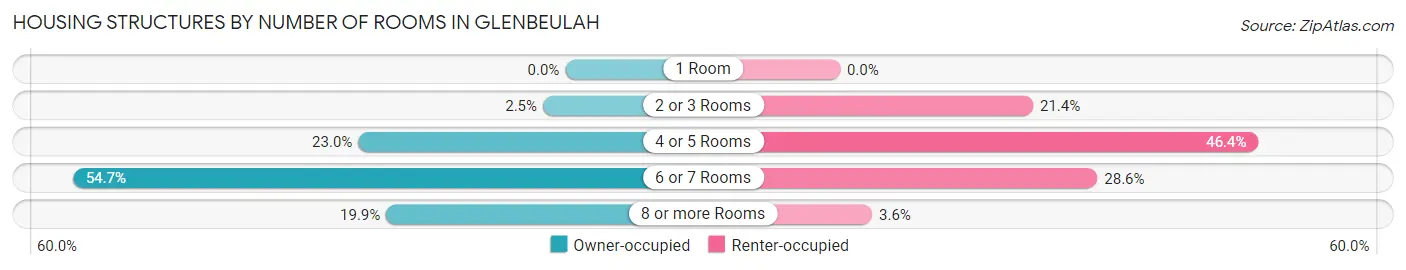
| Number of Rooms | Owner-occupied | Renter-occupied |
| 1 Room | 0 (0.0%) | 0 (0.0%) |
| 2 or 3 Rooms | 4 (2.5%) | 6 (21.4%) |
| 4 or 5 Rooms | 37 (23.0%) | 13 (46.4%) |
| 6 or 7 Rooms | 88 (54.7%) | 8 (28.6%) |
| 8 or more Rooms | 32 (19.9%) | 1 (3.6%) |
| Total | 161 (100.0%) | 28 (100.0%) |
Housing Structure by Heating Type in Glenbeulah
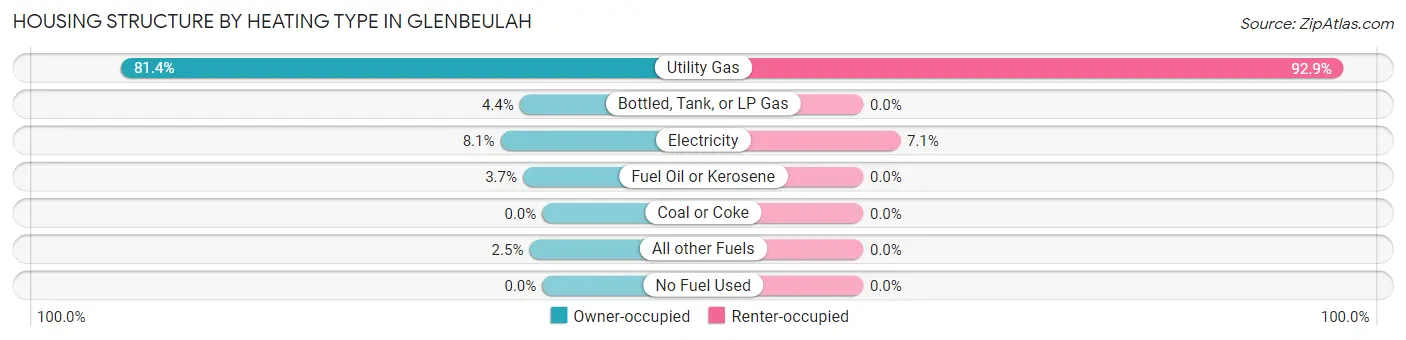
| Heating Type | Owner-occupied | Renter-occupied |
| Utility Gas | 131 (81.4%) | 26 (92.9%) |
| Bottled, Tank, or LP Gas | 7 (4.3%) | 0 (0.0%) |
| Electricity | 13 (8.1%) | 2 (7.1%) |
| Fuel Oil or Kerosene | 6 (3.7%) | 0 (0.0%) |
| Coal or Coke | 0 (0.0%) | 0 (0.0%) |
| All other Fuels | 4 (2.5%) | 0 (0.0%) |
| No Fuel Used | 0 (0.0%) | 0 (0.0%) |
| Total | 161 (100.0%) | 28 (100.0%) |
Household Vehicle Usage in Glenbeulah
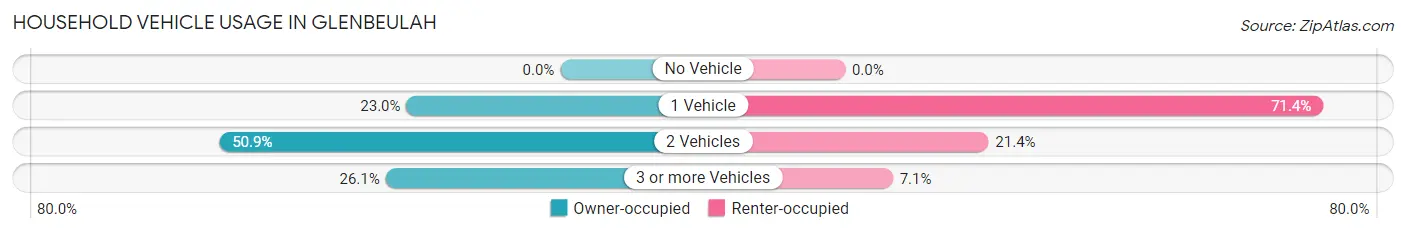
| Vehicles per Household | Owner-occupied | Renter-occupied |
| No Vehicle | 0 (0.0%) | 0 (0.0%) |
| 1 Vehicle | 37 (23.0%) | 20 (71.4%) |
| 2 Vehicles | 82 (50.9%) | 6 (21.4%) |
| 3 or more Vehicles | 42 (26.1%) | 2 (7.1%) |
| Total | 161 (100.0%) | 28 (100.0%) |
Real Estate & Mortgages in Glenbeulah
Real Estate and Mortgage Overview in Glenbeulah
| Characteristic | Without Mortgage | With Mortgage |
| Housing Units | 59 | 102 |
| Median Property Value | $155,200 | $154,500 |
| Median Household Income | - | - |
| Monthly Housing Costs | $546 | $0 |
| Real Estate Taxes | $2,132 | $0 |
Property Value by Mortgage Status in Glenbeulah
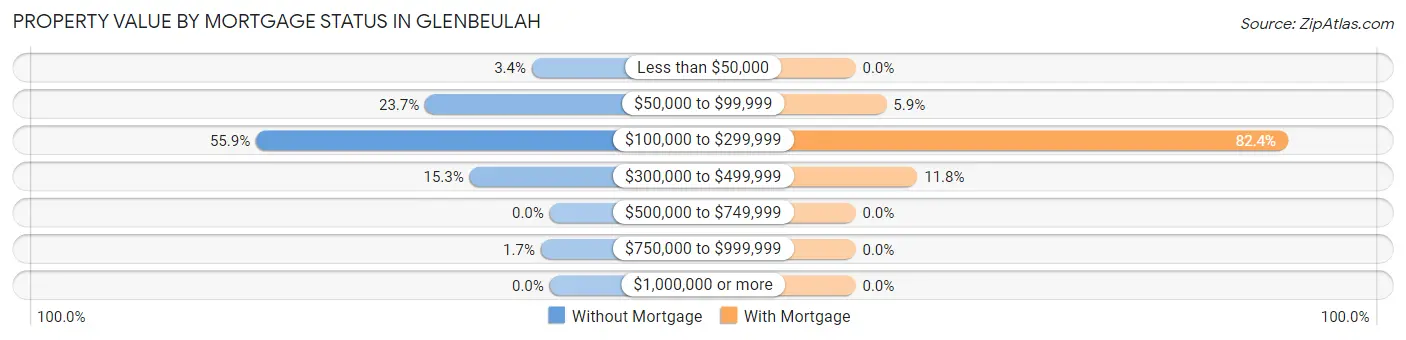
| Property Value | Without Mortgage | With Mortgage |
| Less than $50,000 | 2 (3.4%) | 0 (0.0%) |
| $50,000 to $99,999 | 14 (23.7%) | 6 (5.9%) |
| $100,000 to $299,999 | 33 (55.9%) | 84 (82.4%) |
| $300,000 to $499,999 | 9 (15.2%) | 12 (11.8%) |
| $500,000 to $749,999 | 0 (0.0%) | 0 (0.0%) |
| $750,000 to $999,999 | 1 (1.7%) | 0 (0.0%) |
| $1,000,000 or more | 0 (0.0%) | 0 (0.0%) |
| Total | 59 (100.0%) | 102 (100.0%) |
Household Income by Mortgage Status in Glenbeulah
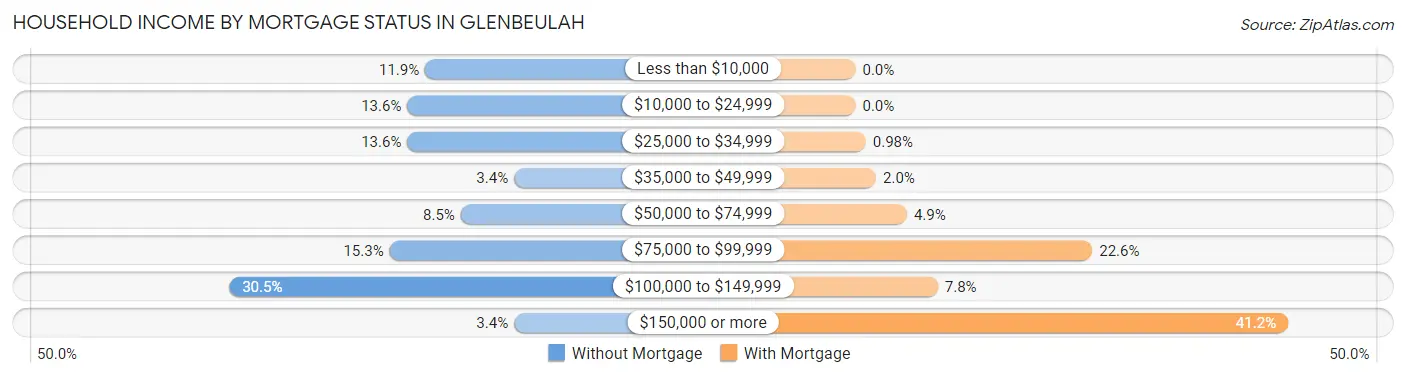
| Household Income | Without Mortgage | With Mortgage |
| Less than $10,000 | 7 (11.9%) | 0 (0.0%) |
| $10,000 to $24,999 | 8 (13.6%) | 0 (0.0%) |
| $25,000 to $34,999 | 8 (13.6%) | 1 (1.0%) |
| $35,000 to $49,999 | 2 (3.4%) | 2 (2.0%) |
| $50,000 to $74,999 | 5 (8.5%) | 5 (4.9%) |
| $75,000 to $99,999 | 9 (15.2%) | 23 (22.6%) |
| $100,000 to $149,999 | 18 (30.5%) | 8 (7.8%) |
| $150,000 or more | 2 (3.4%) | 42 (41.2%) |
| Total | 59 (100.0%) | 102 (100.0%) |
Property Value to Household Income Ratio in Glenbeulah
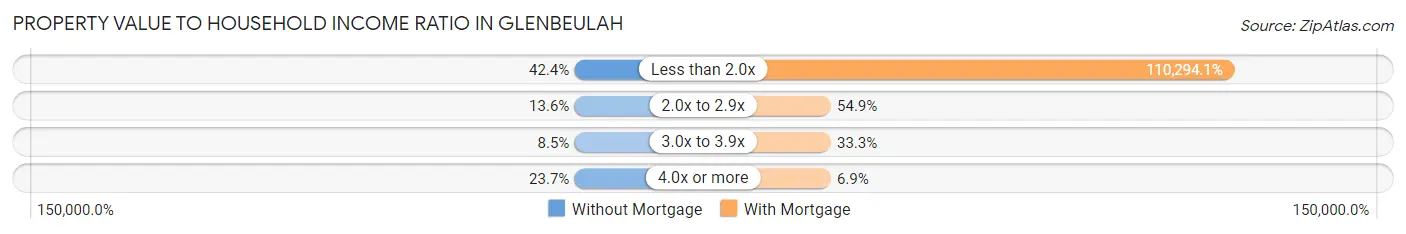
| Value-to-Income Ratio | Without Mortgage | With Mortgage |
| Less than 2.0x | 25 (42.4%) | 112,500 (110,294.1%) |
| 2.0x to 2.9x | 8 (13.6%) | 56 (54.9%) |
| 3.0x to 3.9x | 5 (8.5%) | 34 (33.3%) |
| 4.0x or more | 14 (23.7%) | 7 (6.9%) |
| Total | 59 (100.0%) | 102 (100.0%) |
Real Estate Taxes by Mortgage Status in Glenbeulah
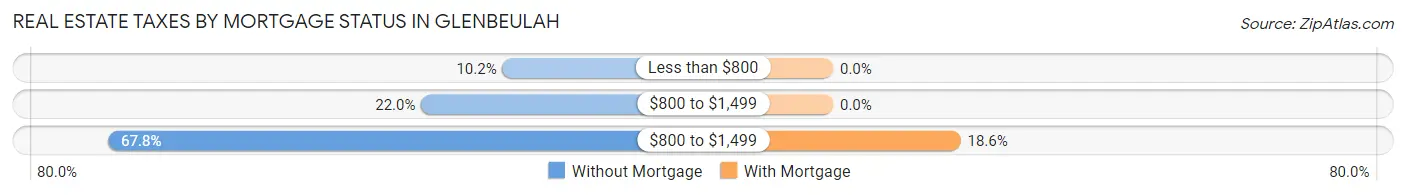
| Property Taxes | Without Mortgage | With Mortgage |
| Less than $800 | 6 (10.2%) | 0 (0.0%) |
| $800 to $1,499 | 13 (22.0%) | 0 (0.0%) |
| $800 to $1,499 | 40 (67.8%) | 19 (18.6%) |
| Total | 59 (100.0%) | 102 (100.0%) |
Health & Disability in Glenbeulah
Health Insurance Coverage by Age in Glenbeulah
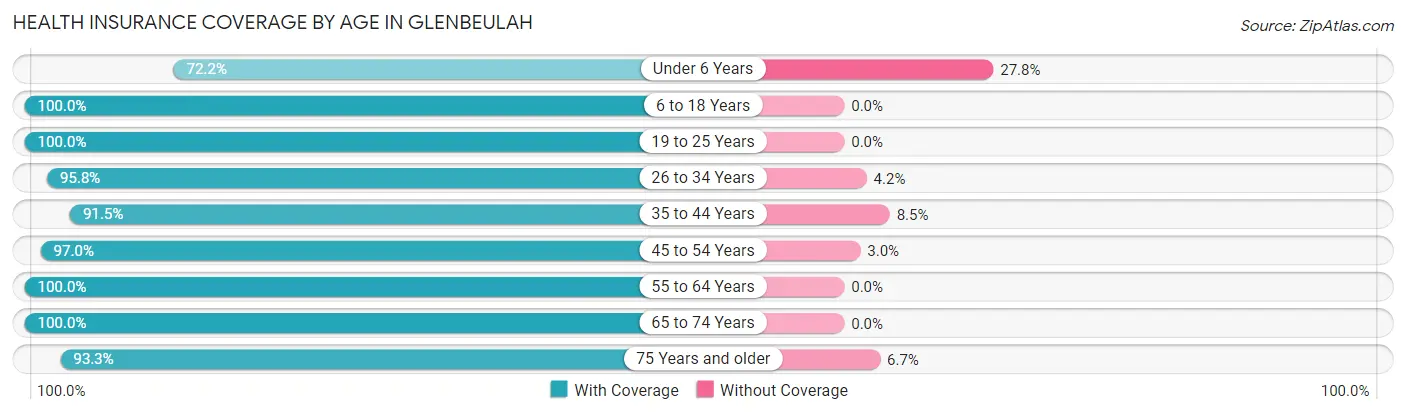
| Age Bracket | With Coverage | Without Coverage |
| Under 6 Years | 26 (72.2%) | 10 (27.8%) |
| 6 to 18 Years | 40 (100.0%) | 0 (0.0%) |
| 19 to 25 Years | 20 (100.0%) | 0 (0.0%) |
| 26 to 34 Years | 46 (95.8%) | 2 (4.2%) |
| 35 to 44 Years | 54 (91.5%) | 5 (8.5%) |
| 45 to 54 Years | 65 (97.0%) | 2 (3.0%) |
| 55 to 64 Years | 66 (100.0%) | 0 (0.0%) |
| 65 to 74 Years | 43 (100.0%) | 0 (0.0%) |
| 75 Years and older | 28 (93.3%) | 2 (6.7%) |
| Total | 388 (94.9%) | 21 (5.1%) |
Health Insurance Coverage by Citizenship Status in Glenbeulah
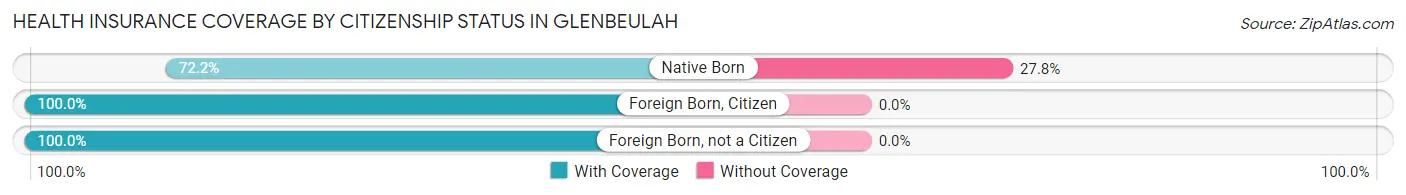
| Citizenship Status | With Coverage | Without Coverage |
| Native Born | 26 (72.2%) | 10 (27.8%) |
| Foreign Born, Citizen | 40 (100.0%) | 0 (0.0%) |
| Foreign Born, not a Citizen | 20 (100.0%) | 0 (0.0%) |
Health Insurance Coverage by Household Income in Glenbeulah
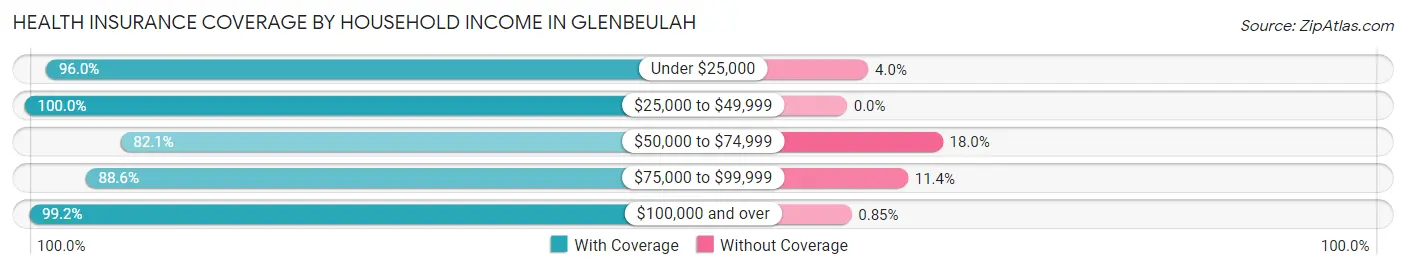
| Household Income | With Coverage | Without Coverage |
| Under $25,000 | 24 (96.0%) | 1 (4.0%) |
| $25,000 to $49,999 | 35 (100.0%) | 0 (0.0%) |
| $50,000 to $74,999 | 64 (82.1%) | 14 (17.9%) |
| $75,000 to $99,999 | 31 (88.6%) | 4 (11.4%) |
| $100,000 and over | 234 (99.2%) | 2 (0.9%) |
Public vs Private Health Insurance Coverage by Age in Glenbeulah
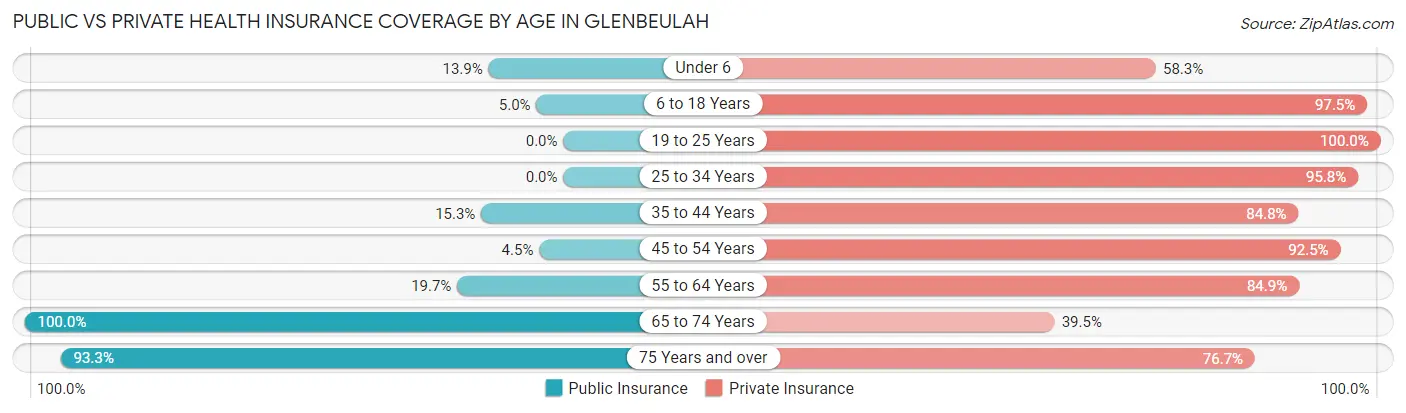
| Age Bracket | Public Insurance | Private Insurance |
| Under 6 | 5 (13.9%) | 21 (58.3%) |
| 6 to 18 Years | 2 (5.0%) | 39 (97.5%) |
| 19 to 25 Years | 0 (0.0%) | 20 (100.0%) |
| 25 to 34 Years | 0 (0.0%) | 46 (95.8%) |
| 35 to 44 Years | 9 (15.2%) | 50 (84.8%) |
| 45 to 54 Years | 3 (4.5%) | 62 (92.5%) |
| 55 to 64 Years | 13 (19.7%) | 56 (84.9%) |
| 65 to 74 Years | 43 (100.0%) | 17 (39.5%) |
| 75 Years and over | 28 (93.3%) | 23 (76.7%) |
| Total | 103 (25.2%) | 334 (81.7%) |
Disability Status by Sex by Age in Glenbeulah
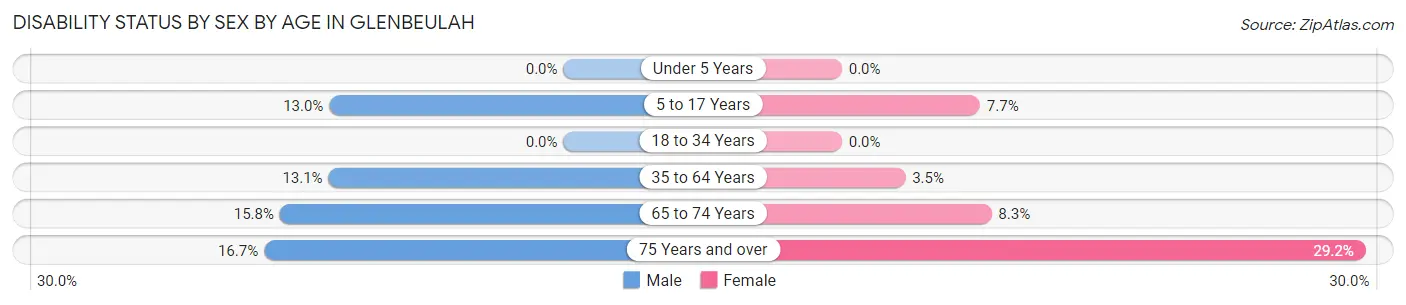
| Age Bracket | Male | Female |
| Under 5 Years | 0 (0.0%) | 0 (0.0%) |
| 5 to 17 Years | 3 (13.0%) | 1 (7.7%) |
| 18 to 34 Years | 0 (0.0%) | 0 (0.0%) |
| 35 to 64 Years | 14 (13.1%) | 3 (3.5%) |
| 65 to 74 Years | 3 (15.8%) | 2 (8.3%) |
| 75 Years and over | 1 (16.7%) | 7 (29.2%) |
Disability Class by Sex by Age in Glenbeulah
Disability Class: Hearing Difficulty
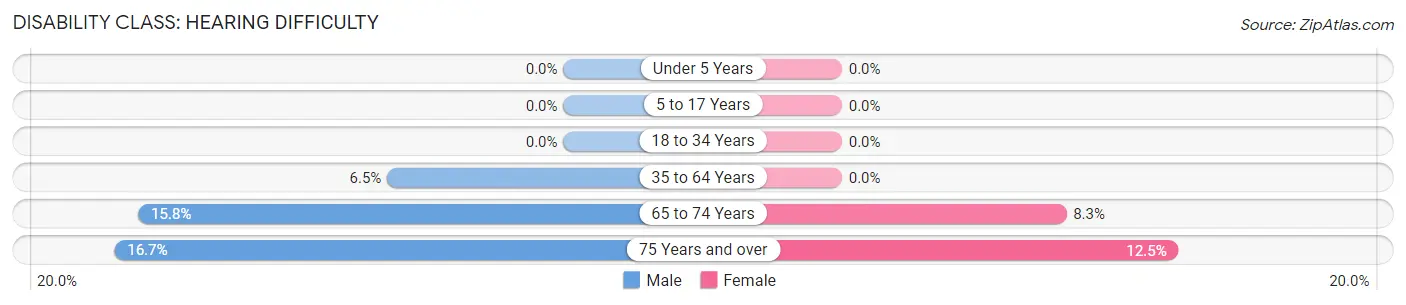
| Age Bracket | Male | Female |
| Under 5 Years | 0 (0.0%) | 0 (0.0%) |
| 5 to 17 Years | 0 (0.0%) | 0 (0.0%) |
| 18 to 34 Years | 0 (0.0%) | 0 (0.0%) |
| 35 to 64 Years | 7 (6.5%) | 0 (0.0%) |
| 65 to 74 Years | 3 (15.8%) | 2 (8.3%) |
| 75 Years and over | 1 (16.7%) | 3 (12.5%) |
Disability Class: Vision Difficulty
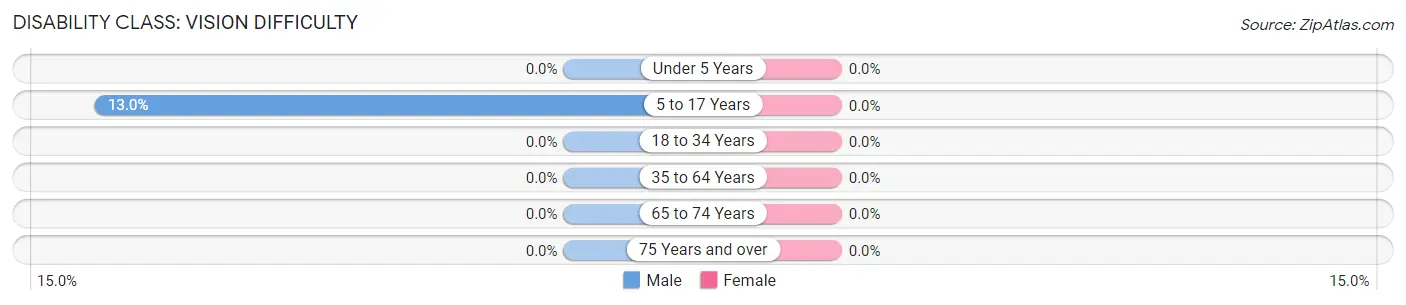
| Age Bracket | Male | Female |
| Under 5 Years | 0 (0.0%) | 0 (0.0%) |
| 5 to 17 Years | 3 (13.0%) | 0 (0.0%) |
| 18 to 34 Years | 0 (0.0%) | 0 (0.0%) |
| 35 to 64 Years | 0 (0.0%) | 0 (0.0%) |
| 65 to 74 Years | 0 (0.0%) | 0 (0.0%) |
| 75 Years and over | 0 (0.0%) | 0 (0.0%) |
Disability Class: Cognitive Difficulty
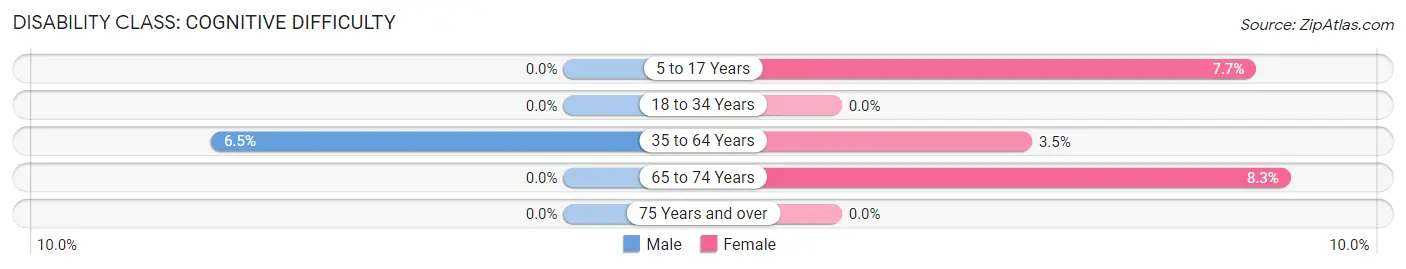
| Age Bracket | Male | Female |
| 5 to 17 Years | 0 (0.0%) | 1 (7.7%) |
| 18 to 34 Years | 0 (0.0%) | 0 (0.0%) |
| 35 to 64 Years | 7 (6.5%) | 3 (3.5%) |
| 65 to 74 Years | 0 (0.0%) | 2 (8.3%) |
| 75 Years and over | 0 (0.0%) | 0 (0.0%) |
Disability Class: Ambulatory Difficulty
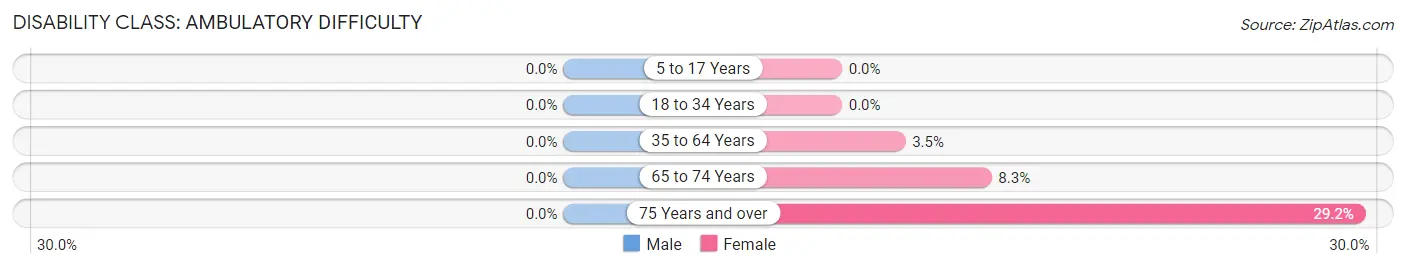
| Age Bracket | Male | Female |
| 5 to 17 Years | 0 (0.0%) | 0 (0.0%) |
| 18 to 34 Years | 0 (0.0%) | 0 (0.0%) |
| 35 to 64 Years | 0 (0.0%) | 3 (3.5%) |
| 65 to 74 Years | 0 (0.0%) | 2 (8.3%) |
| 75 Years and over | 0 (0.0%) | 7 (29.2%) |
Disability Class: Self-Care Difficulty
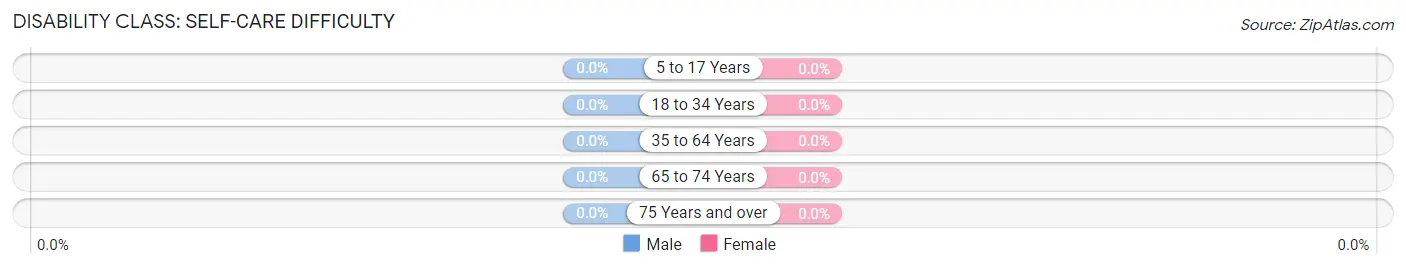
| Age Bracket | Male | Female |
| 5 to 17 Years | 0 (0.0%) | 0 (0.0%) |
| 18 to 34 Years | 0 (0.0%) | 0 (0.0%) |
| 35 to 64 Years | 0 (0.0%) | 0 (0.0%) |
| 65 to 74 Years | 0 (0.0%) | 0 (0.0%) |
| 75 Years and over | 0 (0.0%) | 0 (0.0%) |
Technology Access in Glenbeulah
Computing Device Access in Glenbeulah
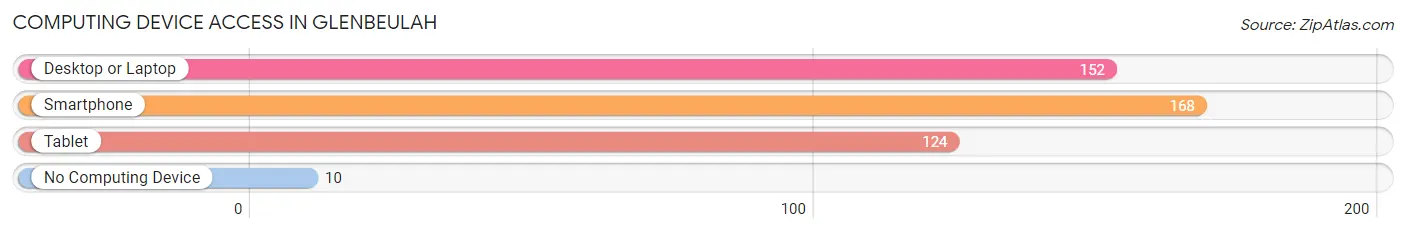
| Device Type | # Households | % Households |
| Desktop or Laptop | 152 | 80.4% |
| Smartphone | 168 | 88.9% |
| Tablet | 124 | 65.6% |
| No Computing Device | 10 | 5.3% |
| Total | 189 | 100.0% |
Internet Access in Glenbeulah
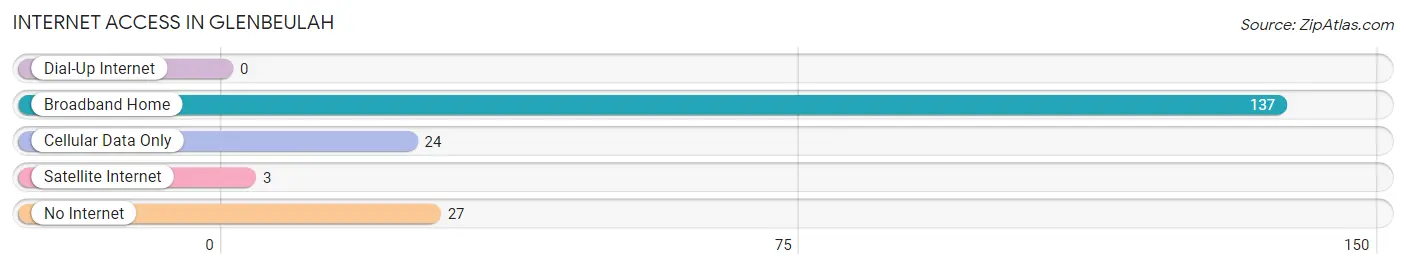
| Internet Type | # Households | % Households |
| Dial-Up Internet | 0 | 0.0% |
| Broadband Home | 137 | 72.5% |
| Cellular Data Only | 24 | 12.7% |
| Satellite Internet | 3 | 1.6% |
| No Internet | 27 | 14.3% |
| Total | 189 | 100.0% |
Glenbeulah Summary
Glenbeulah, Wisconsin is a small village located in Sheboygan County, Wisconsin. It is situated on the Sheboygan River, about 25 miles north of Sheboygan and about 40 miles south of Green Bay. The village has a population of about 1,000 people and is part of the Plymouth School District.
History
Glenbeulah was founded in 1845 by a group of German immigrants who had come to the area in search of a better life. The village was originally known as “Glenbeulah”, which is derived from the Gaelic words “glen” meaning “valley” and “beulah” meaning “beautiful”. The village was officially incorporated in 1876.
In the late 19th century, Glenbeulah was a thriving agricultural community. The village was home to several cheese factories, a creamery, a flour mill, and a sawmill. The village also had a blacksmith, a general store, and a post office.
In the early 20th century, the village began to decline as the agricultural industry shifted away from the area. The village’s population decreased from a peak of 1,500 in 1910 to just over 1,000 in 2000.
Geography
Glenbeulah is located in the Sheboygan River Valley, which is part of the Kettle Moraine region of Wisconsin. The village is situated on the banks of the Sheboygan River, which flows through the village and is a popular spot for fishing and canoeing. The village is surrounded by rolling hills and is home to several small lakes, including Lake Glenbeulah and Lake Puckaway.
The village is located about 25 miles north of Sheboygan and about 40 miles south of Green Bay. The nearest major cities are Milwaukee, which is about 90 miles to the south, and Madison, which is about 100 miles to the west.
Economy
The economy of Glenbeulah is largely based on agriculture and tourism. The village is home to several small farms, which produce a variety of crops, including corn, soybeans, and hay. The village is also home to several small businesses, including a grocery store, a hardware store, and a restaurant.
The village is also a popular tourist destination, as it is located near several popular attractions, including the Kettle Moraine State Forest, the Sheboygan River, and the Elkhart Lake. The village is also home to several festivals and events, including the annual Glenbeulah Cheese Festival and the Glenbeulah Summer Festival.
Demographics
As of the 2010 census, the population of Glenbeulah was 1,039. The racial makeup of the village was 97.3% White, 0.7% African American, 0.3% Native American, 0.3% Asian, 0.2% from other races, and 1.4% from two or more races. Hispanic or Latino of any race were 1.2% of the population.
The median household income in Glenbeulah was $45,938, and the median family income was $51,250. The per capita income for the village was $20,945. About 8.3% of families and 10.2% of the population were below the poverty line, including 14.3% of those under age 18 and 5.2% of those age 65 or over.
Common Questions
What is Per Capita Income in Glenbeulah?
Per Capita income in Glenbeulah is $41,704.
What is the Median Family Income in Glenbeulah?
Median Family Income in Glenbeulah is $120,625.
What is the Median Household income in Glenbeulah?
Median Household Income in Glenbeulah is $82,188.
What is Income or Wage Gap in Glenbeulah?
Income or Wage Gap in Glenbeulah is 10.9%.
Women in Glenbeulah earn 89.1 cents for every dollar earned by a man.
What is Inequality or Gini Index in Glenbeulah?
Inequality or Gini Index in Glenbeulah is 0.35.
What is the Total Population of Glenbeulah?
Total Population of Glenbeulah is 409.
What is the Total Male Population of Glenbeulah?
Total Male Population of Glenbeulah is 213.
What is the Total Female Population of Glenbeulah?
Total Female Population of Glenbeulah is 196.
What is the Ratio of Males per 100 Females in Glenbeulah?
There are 108.67 Males per 100 Females in Glenbeulah.
What is the Ratio of Females per 100 Males in Glenbeulah?
There are 92.02 Females per 100 Males in Glenbeulah.
What is the Median Population Age in Glenbeulah?
Median Population Age in Glenbeulah is 45.3 Years.
What is the Average Family Size in Glenbeulah
Average Family Size in Glenbeulah is 2.7 People.
What is the Average Household Size in Glenbeulah
Average Household Size in Glenbeulah is 2.2 People.
How Large is the Labor Force in Glenbeulah?
There are 270 People in the Labor Forcein in Glenbeulah.
What is the Percentage of People in the Labor Force in Glenbeulah?
78.0% of People are in the Labor Force in Glenbeulah.
What is the Unemployment Rate in Glenbeulah?
Unemployment Rate in Glenbeulah is 0.4%.