Gillett, WI Map & Demographics
Gillett Map
Gillett Overview
$23,079
PER CAPITA INCOME
$52,500
AVG FAMILY INCOME
$51,944
AVG HOUSEHOLD INCOME
41.6%
WAGE / INCOME GAP [ % ]
58.4¢/ $1
WAGE / INCOME GAP [ $ ]
0.34
INEQUALITY / GINI INDEX
1,324
TOTAL POPULATION
662
MALE POPULATION
662
FEMALE POPULATION
100.00
MALES / 100 FEMALES
100.00
FEMALES / 100 MALES
33.9
MEDIAN AGE
2.9
AVG FAMILY SIZE
2.5
AVG HOUSEHOLD SIZE
656
LABOR FORCE [ PEOPLE ]
66.5%
PERCENT IN LABOR FORCE
3.5%
UNEMPLOYMENT RATE
Gillett Zip Codes
Gillett Area Codes
Income in Gillett
Income Overview in Gillett
Per Capita Income in Gillett is $23,079, while median incomes of families and households are $52,500 and $51,944 respectively.
| Characteristic | Number | Measure |
| Per Capita Income | 1,324 | $23,079 |
| Median Family Income | 360 | $52,500 |
| Mean Family Income | 360 | $59,604 |
| Median Household Income | 526 | $51,944 |
| Mean Household Income | 526 | $56,428 |
| Income Deficit | 360 | $0 |
| Wage / Income Gap (%) | 1,324 | 41.64% |
| Wage / Income Gap ($) | 1,324 | 58.36¢ per $1 |
| Gini / Inequality Index | 1,324 | 0.34 |
Earnings by Sex in Gillett
Average Earnings in Gillett are $29,125, $41,339 for men and $24,125 for women, a difference of 41.6%.
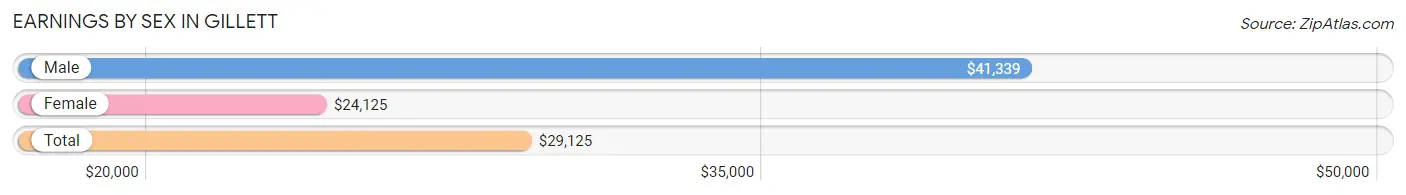
| Sex | Number | Average Earnings |
| Male | 339 (51.8%) | $41,339 |
| Female | 315 (48.2%) | $24,125 |
| Total | 654 (100.0%) | $29,125 |
Earnings by Sex by Income Bracket in Gillett
The most common earnings brackets in Gillett are $2,499 or less for men (77 | 22.7%) and $12,500 to $14,999 for women (68 | 21.6%).
| Income | Male | Female |
| $2,499 or less | 77 (22.7%) | 17 (5.4%) |
| $2,500 to $4,999 | 2 (0.6%) | 8 (2.5%) |
| $5,000 to $7,499 | 18 (5.3%) | 9 (2.9%) |
| $7,500 to $9,999 | 1 (0.3%) | 4 (1.3%) |
| $10,000 to $12,499 | 6 (1.8%) | 3 (0.9%) |
| $12,500 to $14,999 | 9 (2.6%) | 68 (21.6%) |
| $15,000 to $17,499 | 0 (0.0%) | 9 (2.9%) |
| $17,500 to $19,999 | 0 (0.0%) | 18 (5.7%) |
| $20,000 to $22,499 | 10 (2.9%) | 15 (4.8%) |
| $22,500 to $24,999 | 22 (6.5%) | 10 (3.2%) |
| $25,000 to $29,999 | 8 (2.4%) | 20 (6.4%) |
| $30,000 to $34,999 | 0 (0.0%) | 50 (15.9%) |
| $35,000 to $39,999 | 9 (2.6%) | 26 (8.3%) |
| $40,000 to $44,999 | 30 (8.8%) | 24 (7.6%) |
| $45,000 to $49,999 | 7 (2.1%) | 4 (1.3%) |
| $50,000 to $54,999 | 39 (11.5%) | 9 (2.9%) |
| $55,000 to $64,999 | 25 (7.4%) | 7 (2.2%) |
| $65,000 to $74,999 | 31 (9.1%) | 9 (2.9%) |
| $75,000 to $99,999 | 43 (12.7%) | 5 (1.6%) |
| $100,000+ | 2 (0.6%) | 0 (0.0%) |
| Total | 339 (100.0%) | 315 (100.0%) |
Earnings by Sex by Educational Attainment in Gillett
Average earnings in Gillett are $52,098 for men and $26,042 for women, a difference of 50.0%. Men with an educational attainment of bachelor's degree enjoy the highest average annual earnings of $64,318, while those with less than high school education earn the least with $23,958. Women with an educational attainment of graduate degree earn the most with the average annual earnings of $59,688, while those with less than high school education have the smallest earnings of $21,071.
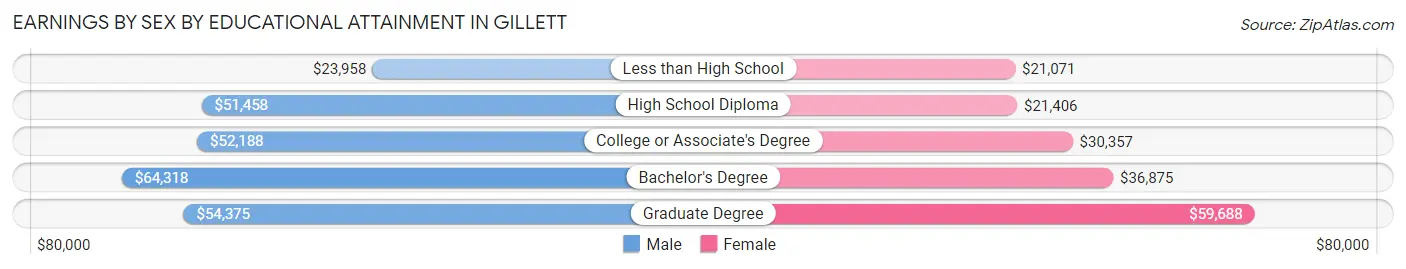
| Educational Attainment | Male Income | Female Income |
| Less than High School | $23,958 | $21,071 |
| High School Diploma | $51,458 | $21,406 |
| College or Associate's Degree | $52,188 | $30,357 |
| Bachelor's Degree | $64,318 | $36,875 |
| Graduate Degree | $54,375 | $59,688 |
| Total | $52,098 | $26,042 |
Family Income in Gillett
Family Income Brackets in Gillett
According to the Gillett family income data, there are 90 families falling into the $25,000 to $34,999 income range, which is the most common income bracket and makes up 25.0% of all families.
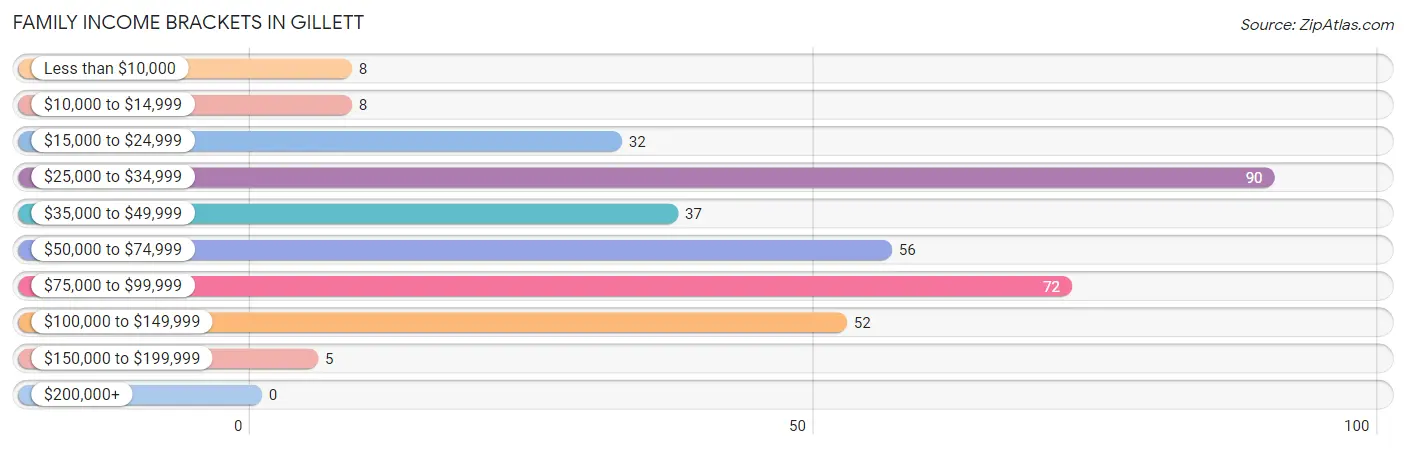
| Income Bracket | # Families | % Families |
| Less than $10,000 | 8 | 2.2% |
| $10,000 to $14,999 | 8 | 2.2% |
| $15,000 to $24,999 | 32 | 8.9% |
| $25,000 to $34,999 | 90 | 25.0% |
| $35,000 to $49,999 | 37 | 10.3% |
| $50,000 to $74,999 | 56 | 15.6% |
| $75,000 to $99,999 | 72 | 20.0% |
| $100,000 to $149,999 | 52 | 14.4% |
| $150,000 to $199,999 | 5 | 1.4% |
| $200,000+ | 0 | 0.0% |
Family Income by Famaliy Size in Gillett
4-person families (58 | 16.1%) account for the highest median family income in Gillett with $87,500 per family, while 3-person families (70 | 19.4%) have the highest median income of $22,917 per family member.
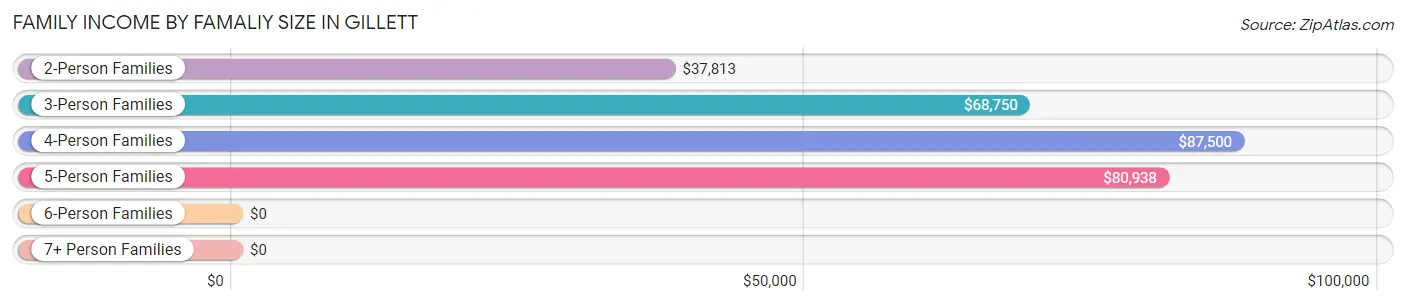
| Income Bracket | # Families | Median Income |
| 2-Person Families | 207 (57.5%) | $37,813 |
| 3-Person Families | 70 (19.4%) | $68,750 |
| 4-Person Families | 58 (16.1%) | $87,500 |
| 5-Person Families | 25 (6.9%) | $80,938 |
| 6-Person Families | 0 (0.0%) | $0 |
| 7+ Person Families | 0 (0.0%) | $0 |
| Total | 360 (100.0%) | $52,500 |
Family Income by Number of Earners in Gillett
The median family income in Gillett is $52,500, with families comprising 3+ earners (8) having the highest median family income of $129,167, while families with no earners (66) have the lowest median family income of $34,167, accounting for 2.2% and 18.3% of families, respectively.
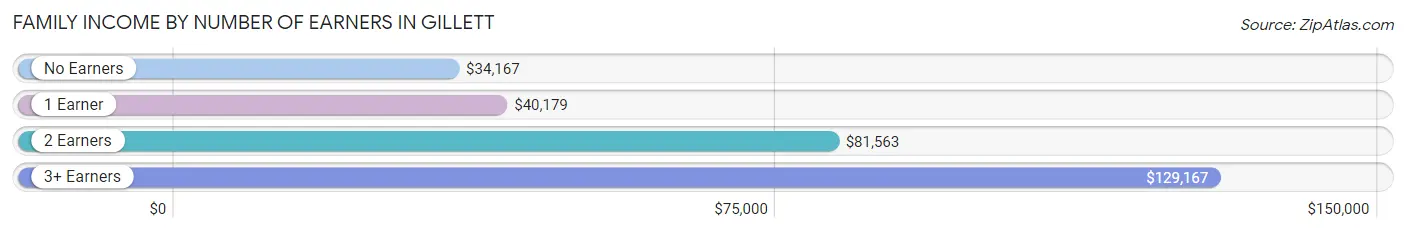
| Number of Earners | # Families | Median Income |
| No Earners | 66 (18.3%) | $34,167 |
| 1 Earner | 110 (30.6%) | $40,179 |
| 2 Earners | 176 (48.9%) | $81,563 |
| 3+ Earners | 8 (2.2%) | $129,167 |
| Total | 360 (100.0%) | $52,500 |
Household Income in Gillett
Household Income Brackets in Gillett
With 123 households falling in the category, the $25,000 to $34,999 income range is the most frequent in Gillett, accounting for 23.4% of all households.
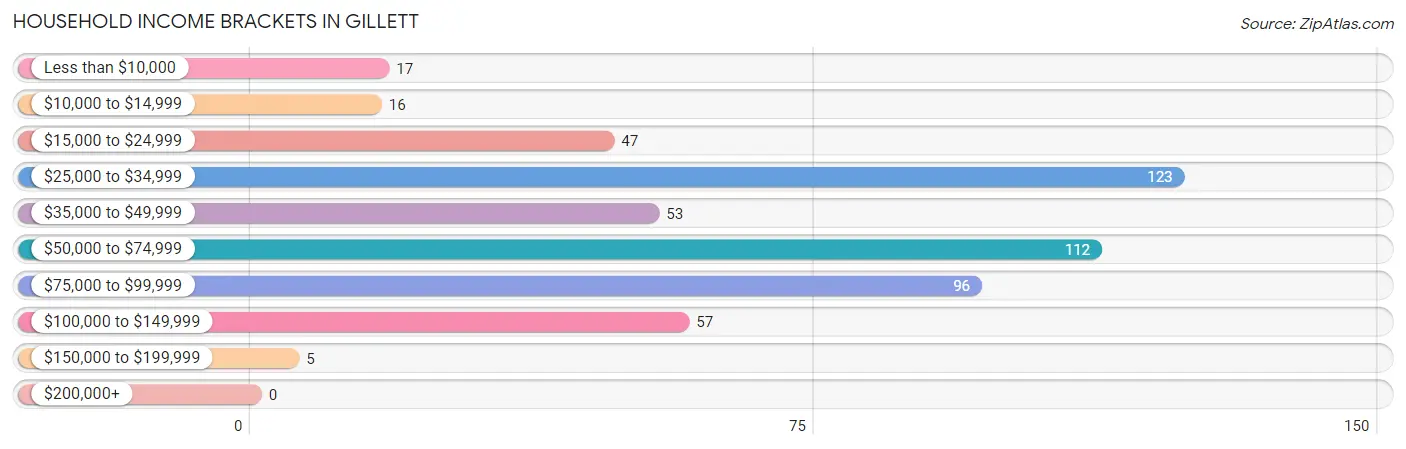
| Income Bracket | # Households | % Households |
| Less than $10,000 | 17 | 3.2% |
| $10,000 to $14,999 | 16 | 3.0% |
| $15,000 to $24,999 | 47 | 8.9% |
| $25,000 to $34,999 | 123 | 23.4% |
| $35,000 to $49,999 | 53 | 10.1% |
| $50,000 to $74,999 | 112 | 21.3% |
| $75,000 to $99,999 | 96 | 18.3% |
| $100,000 to $149,999 | 57 | 10.8% |
| $150,000 to $199,999 | 5 | 1.0% |
| $200,000+ | 0 | 0.0% |
Household Income by Householder Age in Gillett
The median household income in Gillett is $51,944, with the highest median household income of $60,179 found in the 25 to 44 years age bracket for the primary householder. A total of 185 households (35.2%) fall into this category. Meanwhile, the 15 to 24 years age bracket for the primary householder has the lowest median household income of $0, with 20 households (3.8%) in this group.
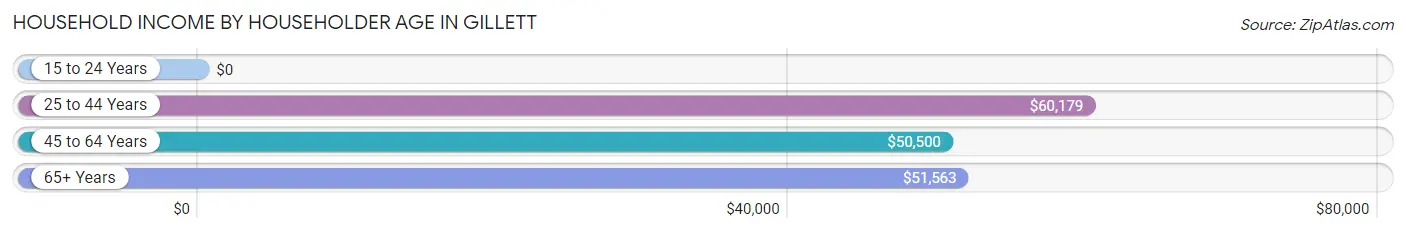
| Income Bracket | # Households | Median Income |
| 15 to 24 Years | 20 (3.8%) | $0 |
| 25 to 44 Years | 185 (35.2%) | $60,179 |
| 45 to 64 Years | 228 (43.3%) | $50,500 |
| 65+ Years | 93 (17.7%) | $51,563 |
| Total | 526 (100.0%) | $51,944 |
Poverty in Gillett
Income Below Poverty by Sex and Age in Gillett
With 13.3% poverty level for males and 9.2% for females among the residents of Gillett, 12 to 14 year old males and 16 and 17 year old females are the most vulnerable to poverty, with 12 males (50.0%) and 7 females (43.8%) in their respective age groups living below the poverty level.
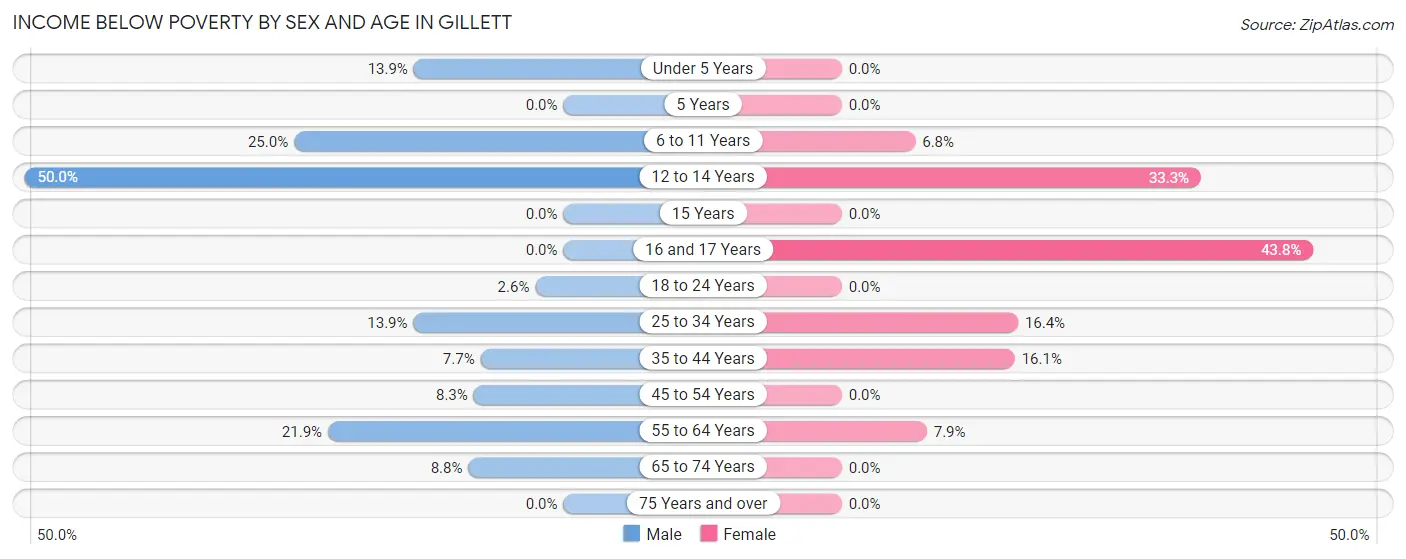
| Age Bracket | Male | Female |
| Under 5 Years | 5 (13.9%) | 0 (0.0%) |
| 5 Years | 0 (0.0%) | 0 (0.0%) |
| 6 to 11 Years | 16 (25.0%) | 6 (6.8%) |
| 12 to 14 Years | 12 (50.0%) | 7 (33.3%) |
| 15 Years | 0 (0.0%) | 0 (0.0%) |
| 16 and 17 Years | 0 (0.0%) | 7 (43.8%) |
| 18 to 24 Years | 3 (2.6%) | 0 (0.0%) |
| 25 to 34 Years | 11 (13.9%) | 17 (16.4%) |
| 35 to 44 Years | 4 (7.7%) | 13 (16.1%) |
| 45 to 54 Years | 4 (8.3%) | 0 (0.0%) |
| 55 to 64 Years | 26 (21.8%) | 9 (7.9%) |
| 65 to 74 Years | 3 (8.8%) | 0 (0.0%) |
| 75 Years and over | 0 (0.0%) | 0 (0.0%) |
| Total | 84 (13.3%) | 59 (9.2%) |
Income Above Poverty by Sex and Age in Gillett
According to the poverty statistics in Gillett, males aged 15 years and females aged under 5 years are the age groups that are most secure financially, with 100.0% of males and 100.0% of females in these age groups living above the poverty line.
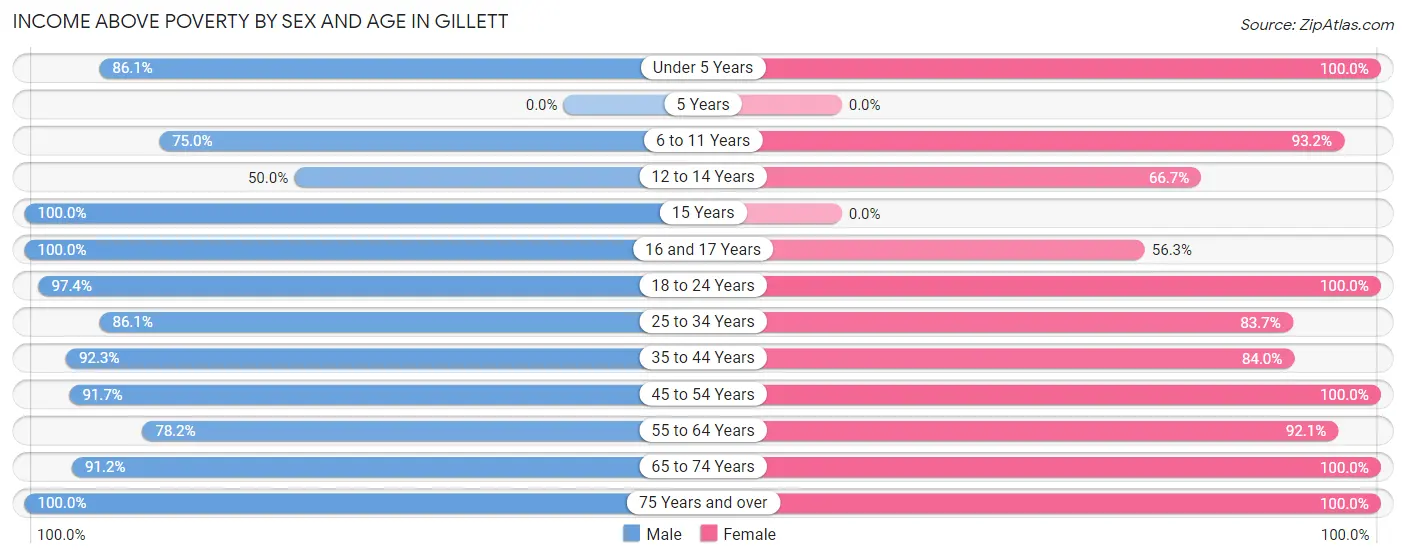
| Age Bracket | Male | Female |
| Under 5 Years | 31 (86.1%) | 70 (100.0%) |
| 5 Years | 0 (0.0%) | 0 (0.0%) |
| 6 to 11 Years | 48 (75.0%) | 82 (93.2%) |
| 12 to 14 Years | 12 (50.0%) | 14 (66.7%) |
| 15 Years | 15 (100.0%) | 0 (0.0%) |
| 16 and 17 Years | 17 (100.0%) | 9 (56.2%) |
| 18 to 24 Years | 112 (97.4%) | 17 (100.0%) |
| 25 to 34 Years | 68 (86.1%) | 87 (83.7%) |
| 35 to 44 Years | 48 (92.3%) | 68 (84.0%) |
| 45 to 54 Years | 44 (91.7%) | 44 (100.0%) |
| 55 to 64 Years | 93 (78.1%) | 105 (92.1%) |
| 65 to 74 Years | 31 (91.2%) | 37 (100.0%) |
| 75 Years and over | 27 (100.0%) | 49 (100.0%) |
| Total | 546 (86.7%) | 582 (90.8%) |
Income Below Poverty Among Married-Couple Families in Gillett
The poverty statistics for married-couple families in Gillett show that 5.9% or 12 of the total 203 families live below the poverty line. Families with 3 or 4 children have the highest poverty rate of 26.3%, comprising of 5 families. On the other hand, families with no children have the lowest poverty rate of 0.0%, which includes 0 families.
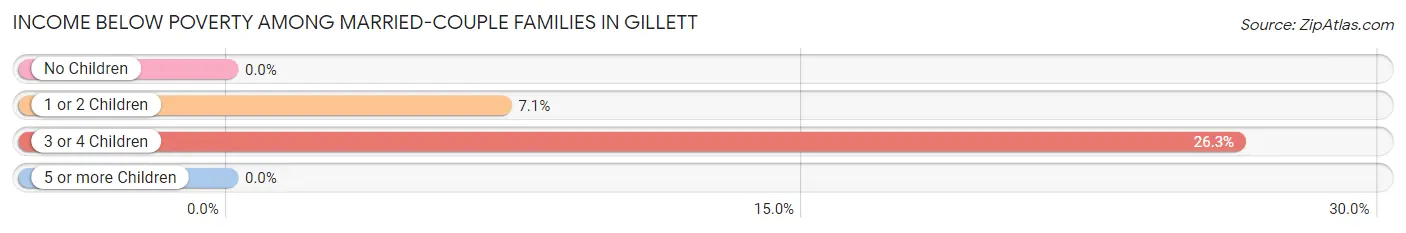
| Children | Above Poverty | Below Poverty |
| No Children | 86 (100.0%) | 0 (0.0%) |
| 1 or 2 Children | 91 (92.9%) | 7 (7.1%) |
| 3 or 4 Children | 14 (73.7%) | 5 (26.3%) |
| 5 or more Children | 0 (0.0%) | 0 (0.0%) |
| Total | 191 (94.1%) | 12 (5.9%) |
Income Below Poverty Among Single-Parent Households in Gillett
According to the poverty data in Gillett, 25.5% or 13 single-father households and 15.1% or 16 single-mother households are living below the poverty line. Among single-father households, those with 1 or 2 children have the highest poverty rate, with 13 households (35.1%) experiencing poverty. Likewise, among single-mother households, those with 1 or 2 children have the highest poverty rate, with 13 households (38.2%) falling below the poverty line.
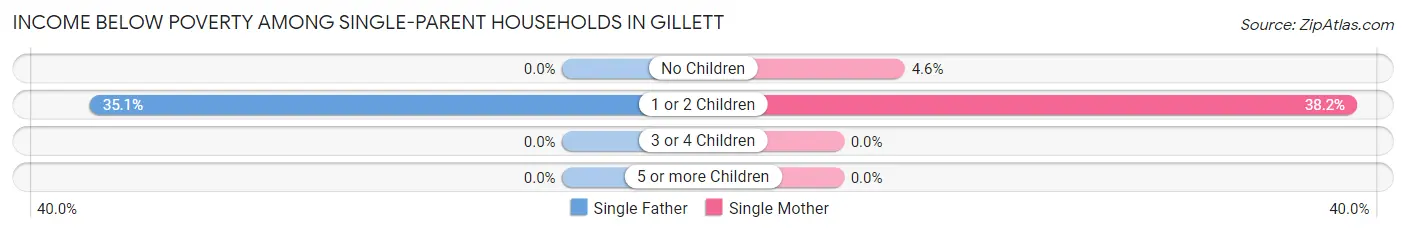
| Children | Single Father | Single Mother |
| No Children | 0 (0.0%) | 3 (4.5%) |
| 1 or 2 Children | 13 (35.1%) | 13 (38.2%) |
| 3 or 4 Children | 0 (0.0%) | 0 (0.0%) |
| 5 or more Children | 0 (0.0%) | 0 (0.0%) |
| Total | 13 (25.5%) | 16 (15.1%) |
Income Below Poverty Among Married-Couple vs Single-Parent Households in Gillett
The poverty data for Gillett shows that 12 of the married-couple family households (5.9%) and 29 of the single-parent households (18.5%) are living below the poverty level. Within the married-couple family households, those with 3 or 4 children have the highest poverty rate, with 5 households (26.3%) falling below the poverty line. Among the single-parent households, those with 1 or 2 children have the highest poverty rate, with 26 household (36.6%) living below poverty.
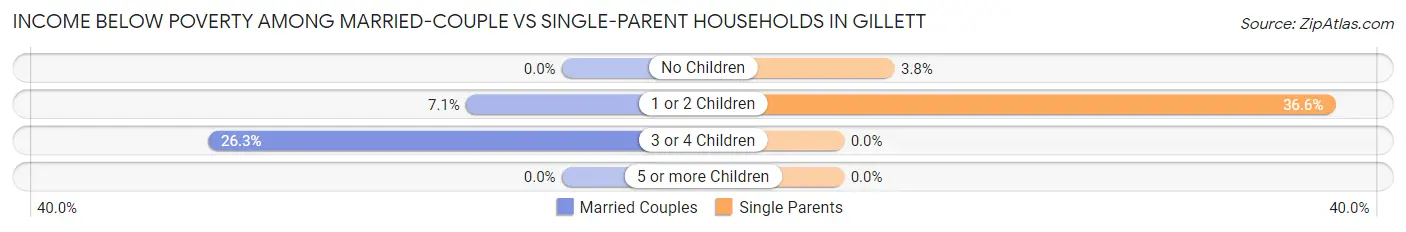
| Children | Married-Couple Families | Single-Parent Households |
| No Children | 0 (0.0%) | 3 (3.7%) |
| 1 or 2 Children | 7 (7.1%) | 26 (36.6%) |
| 3 or 4 Children | 5 (26.3%) | 0 (0.0%) |
| 5 or more Children | 0 (0.0%) | 0 (0.0%) |
| Total | 12 (5.9%) | 29 (18.5%) |
Race in Gillett
The most populous races in Gillett are White / Caucasian (1,216 | 91.8%), Hispanic or Latino (116 | 8.8%), and Native / Alaskan (78 | 5.9%).
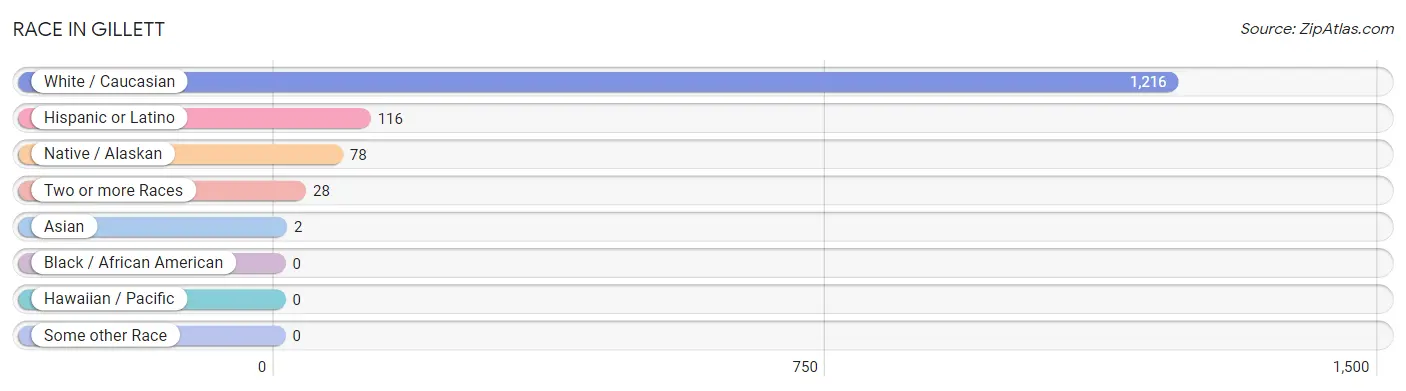
| Race | # Population | % Population |
| Asian | 2 | 0.2% |
| Black / African American | 0 | 0.0% |
| Hawaiian / Pacific | 0 | 0.0% |
| Hispanic or Latino | 116 | 8.8% |
| Native / Alaskan | 78 | 5.9% |
| White / Caucasian | 1,216 | 91.8% |
| Two or more Races | 28 | 2.1% |
| Some other Race | 0 | 0.0% |
| Total | 1,324 | 100.0% |
Ancestry in Gillett
The most populous ancestries reported in Gillett are German (468 | 35.3%), Polish (169 | 12.8%), American (147 | 11.1%), Irish (136 | 10.3%), and Central American (80 | 6.0%), together accounting for 75.5% of all Gillett residents.
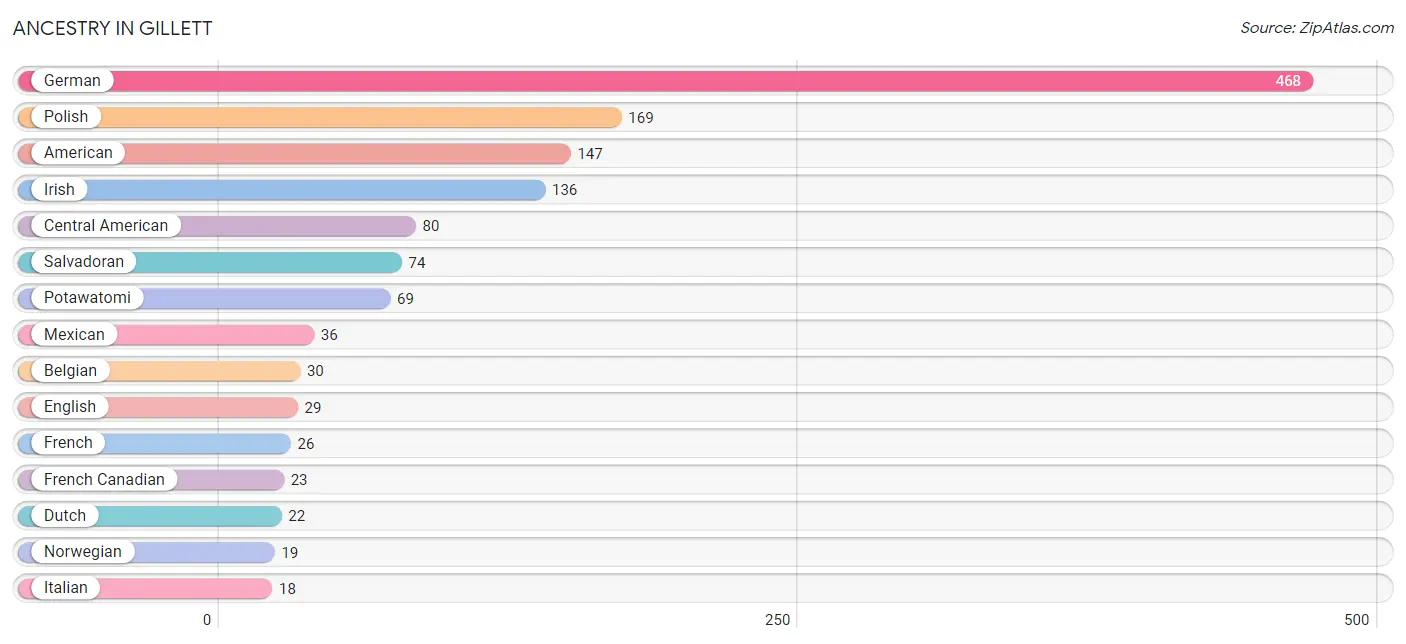
| Ancestry | # Population | % Population |
| American | 147 | 11.1% |
| Armenian | 14 | 1.1% |
| Belgian | 30 | 2.3% |
| Central American | 80 | 6.0% |
| Czech | 7 | 0.5% |
| Czechoslovakian | 3 | 0.2% |
| Danish | 16 | 1.2% |
| Dutch | 22 | 1.7% |
| English | 29 | 2.2% |
| European | 7 | 0.5% |
| Finnish | 4 | 0.3% |
| French | 26 | 2.0% |
| French Canadian | 23 | 1.7% |
| German | 468 | 35.3% |
| Honduran | 6 | 0.4% |
| Indonesian | 2 | 0.2% |
| Irish | 136 | 10.3% |
| Iroquois | 4 | 0.3% |
| Israeli | 3 | 0.2% |
| Italian | 18 | 1.4% |
| Lithuanian | 5 | 0.4% |
| Menominee | 3 | 0.2% |
| Mexican | 36 | 2.7% |
| Norwegian | 19 | 1.4% |
| Polish | 169 | 12.8% |
| Potawatomi | 69 | 5.2% |
| Russian | 7 | 0.5% |
| Salvadoran | 74 | 5.6% |
| Scotch-Irish | 7 | 0.5% |
| Swedish | 16 | 1.2% |
| Swiss | 3 | 0.2% |
| Welsh | 10 | 0.8% | View All 32 Rows |
Immigrants in Gillett
The most numerous immigrant groups reported in Gillett came from Central America (9 | 0.7%), Latin America (9 | 0.7%), Mexico (9 | 0.7%), Europe (7 | 0.5%), and Germany (4 | 0.3%), together accounting for 2.9% of all Gillett residents.
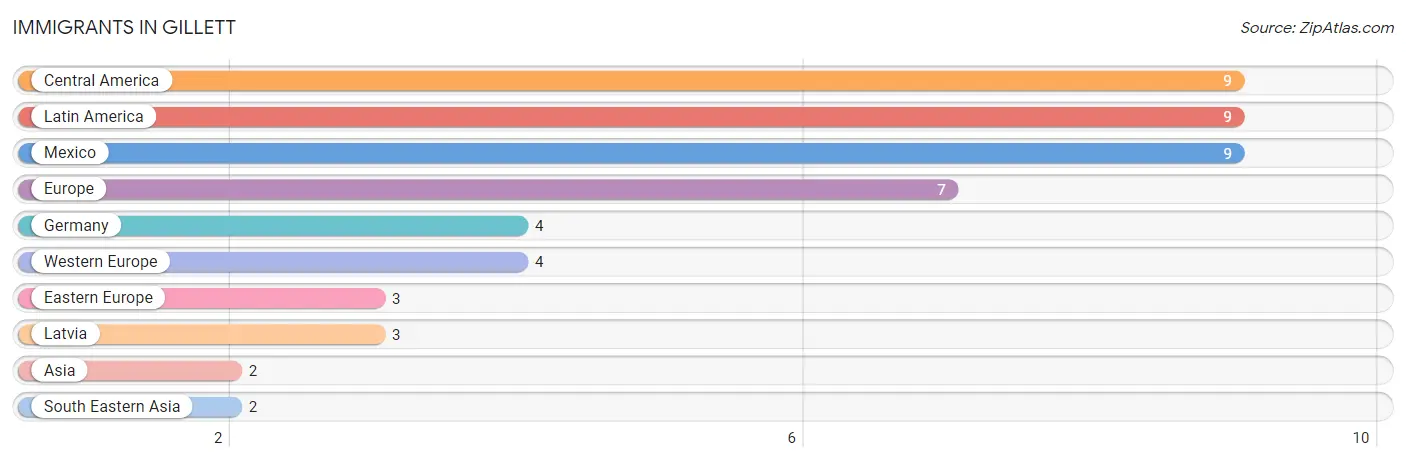
| Immigration Origin | # Population | % Population |
| Asia | 2 | 0.2% |
| Central America | 9 | 0.7% |
| Eastern Europe | 3 | 0.2% |
| Europe | 7 | 0.5% |
| Germany | 4 | 0.3% |
| Latin America | 9 | 0.7% |
| Latvia | 3 | 0.2% |
| Mexico | 9 | 0.7% |
| South Eastern Asia | 2 | 0.2% |
| Western Europe | 4 | 0.3% | View All 10 Rows |
Sex and Age in Gillett
Sex and Age in Gillett
The most populous age groups in Gillett are 20 to 24 Years (115 | 17.4%) for men and 30 to 34 Years (80 | 12.1%) for women.
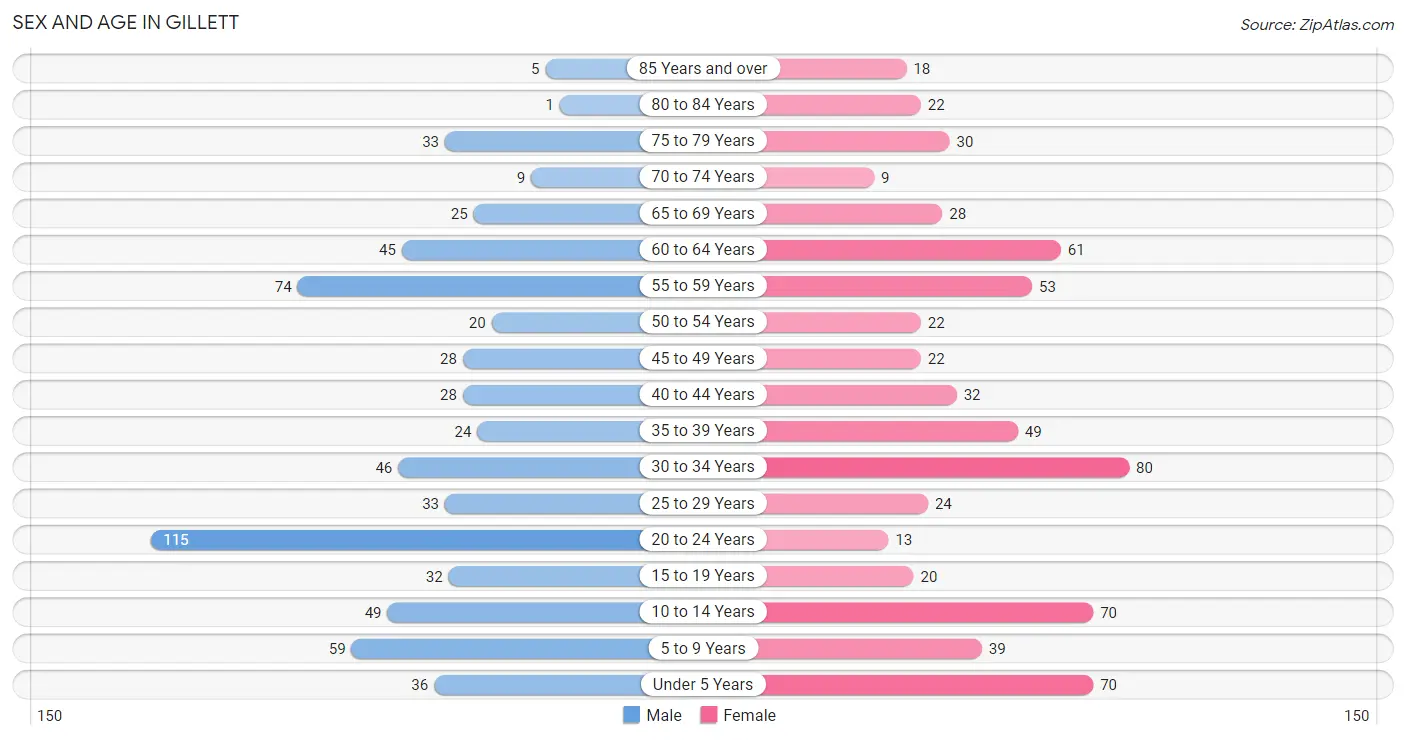
| Age Bracket | Male | Female |
| Under 5 Years | 36 (5.4%) | 70 (10.6%) |
| 5 to 9 Years | 59 (8.9%) | 39 (5.9%) |
| 10 to 14 Years | 49 (7.4%) | 70 (10.6%) |
| 15 to 19 Years | 32 (4.8%) | 20 (3.0%) |
| 20 to 24 Years | 115 (17.4%) | 13 (2.0%) |
| 25 to 29 Years | 33 (5.0%) | 24 (3.6%) |
| 30 to 34 Years | 46 (7.0%) | 80 (12.1%) |
| 35 to 39 Years | 24 (3.6%) | 49 (7.4%) |
| 40 to 44 Years | 28 (4.2%) | 32 (4.8%) |
| 45 to 49 Years | 28 (4.2%) | 22 (3.3%) |
| 50 to 54 Years | 20 (3.0%) | 22 (3.3%) |
| 55 to 59 Years | 74 (11.2%) | 53 (8.0%) |
| 60 to 64 Years | 45 (6.8%) | 61 (9.2%) |
| 65 to 69 Years | 25 (3.8%) | 28 (4.2%) |
| 70 to 74 Years | 9 (1.4%) | 9 (1.4%) |
| 75 to 79 Years | 33 (5.0%) | 30 (4.5%) |
| 80 to 84 Years | 1 (0.2%) | 22 (3.3%) |
| 85 Years and over | 5 (0.8%) | 18 (2.7%) |
| Total | 662 (100.0%) | 662 (100.0%) |
Families and Households in Gillett
Median Family Size in Gillett
The median family size in Gillett is 2.94 persons per family, with married-couple families (203 | 56.4%) accounting for the largest median family size of 3.22 persons per family. On the other hand, single male/father families (51 | 14.2%) represent the smallest median family size with 2.08 persons per family.
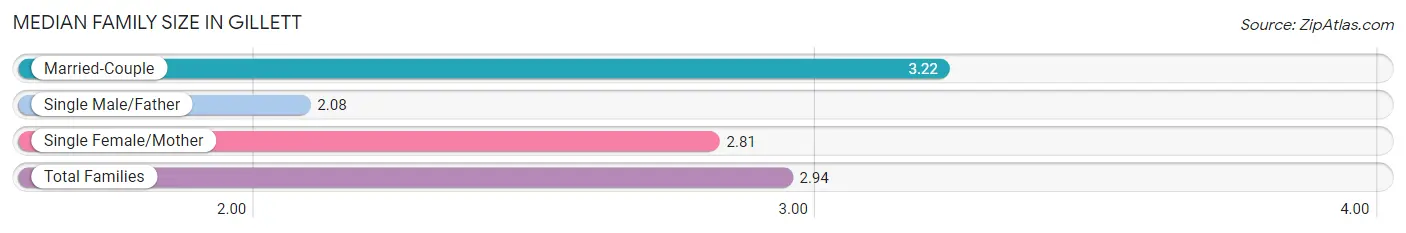
| Family Type | # Families | Family Size |
| Married-Couple | 203 (56.4%) | 3.22 |
| Single Male/Father | 51 (14.2%) | 2.08 |
| Single Female/Mother | 106 (29.4%) | 2.81 |
| Total Families | 360 (100.0%) | 2.94 |
Median Household Size in Gillett
The median household size in Gillett is 2.45 persons per household, with married-couple households (203 | 38.6%) accounting for the largest median household size of 3.22 persons per household. non-family households (166 | 31.6%) represent the smallest median household size with 1.23 persons per household.
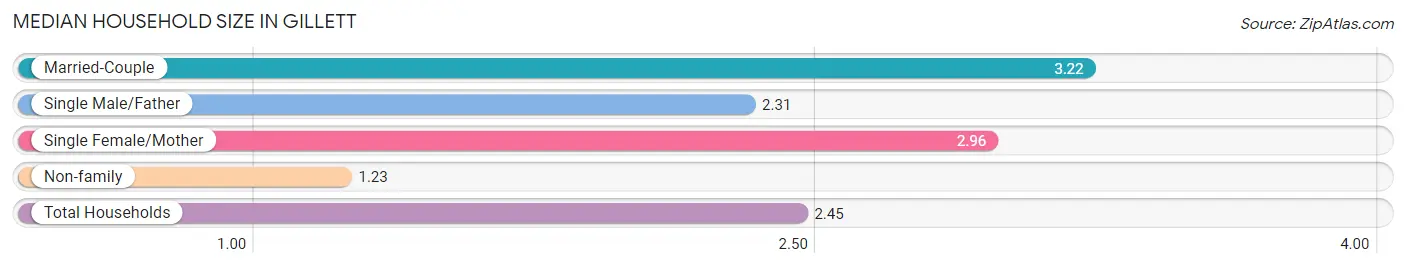
| Household Type | # Households | Household Size |
| Married-Couple | 203 (38.6%) | 3.22 |
| Single Male/Father | 51 (9.7%) | 2.31 |
| Single Female/Mother | 106 (20.2%) | 2.96 |
| Non-family | 166 (31.6%) | 1.23 |
| Total Households | 526 (100.0%) | 2.45 |
Household Size by Marriage Status in Gillett
Out of a total of 526 households in Gillett, 360 (68.4%) are family households, while 166 (31.6%) are nonfamily households. The most numerous type of family households are 2-person households, comprising 191, and the most common type of nonfamily households are 1-person households, comprising 144.
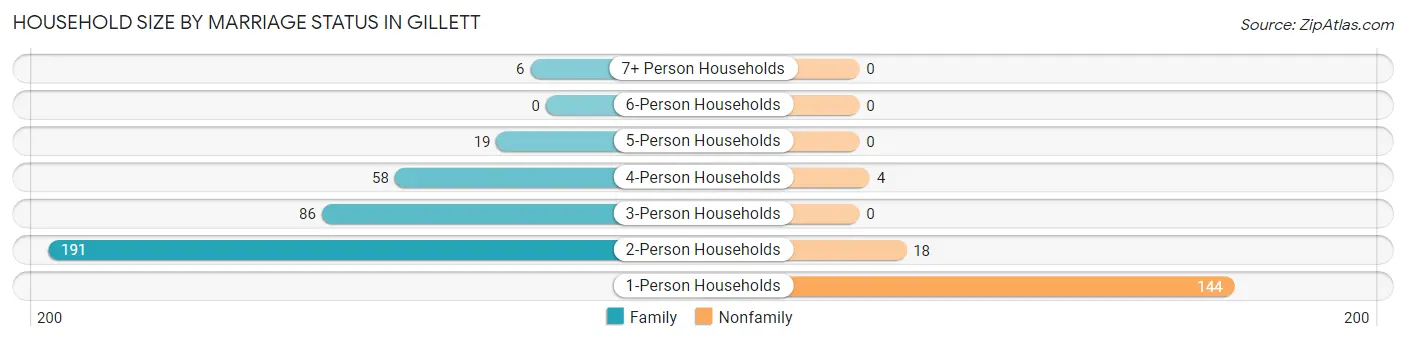
| Household Size | Family Households | Nonfamily Households |
| 1-Person Households | - | 144 (27.4%) |
| 2-Person Households | 191 (36.3%) | 18 (3.4%) |
| 3-Person Households | 86 (16.4%) | 0 (0.0%) |
| 4-Person Households | 58 (11.0%) | 4 (0.8%) |
| 5-Person Households | 19 (3.6%) | 0 (0.0%) |
| 6-Person Households | 0 (0.0%) | 0 (0.0%) |
| 7+ Person Households | 6 (1.1%) | 0 (0.0%) |
| Total | 360 (68.4%) | 166 (31.6%) |
Female Fertility in Gillett
Fertility by Age in Gillett
Average fertility rate in Gillett is 21.0 births per 1,000 women. Women in the age bracket of 20 to 34 years have the highest fertility rate with 43.0 births per 1,000 women. Women in the age bracket of 20 to 34 years acount for 100.0% of all women with births.
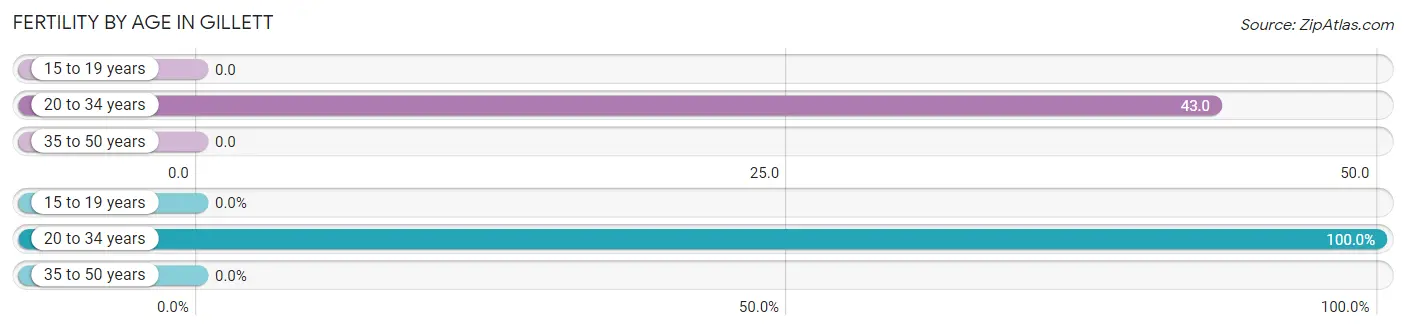
| Age Bracket | Women with Births | Births / 1,000 Women |
| 15 to 19 years | 0 (0.0%) | 0.0 |
| 20 to 34 years | 5 (100.0%) | 43.0 |
| 35 to 50 years | 0 (0.0%) | 0.0 |
| Total | 5 (100.0%) | 21.0 |
Fertility by Age by Marriage Status in Gillett
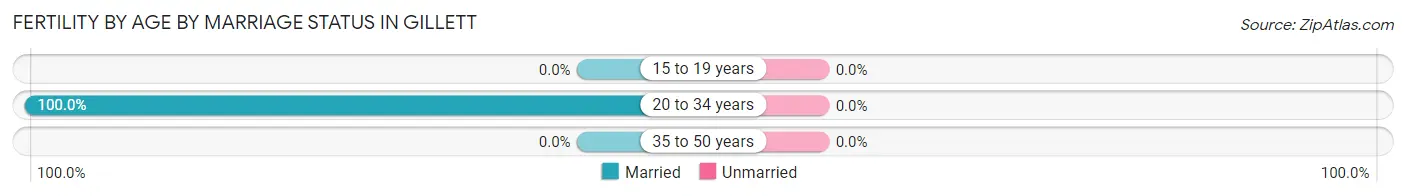
| Age Bracket | Married | Unmarried |
| 15 to 19 years | 0 (0.0%) | 0 (0.0%) |
| 20 to 34 years | 5 (100.0%) | 0 (0.0%) |
| 35 to 50 years | 0 (0.0%) | 0 (0.0%) |
| Total | 5 (100.0%) | 0 (0.0%) |
Fertility by Education in Gillett
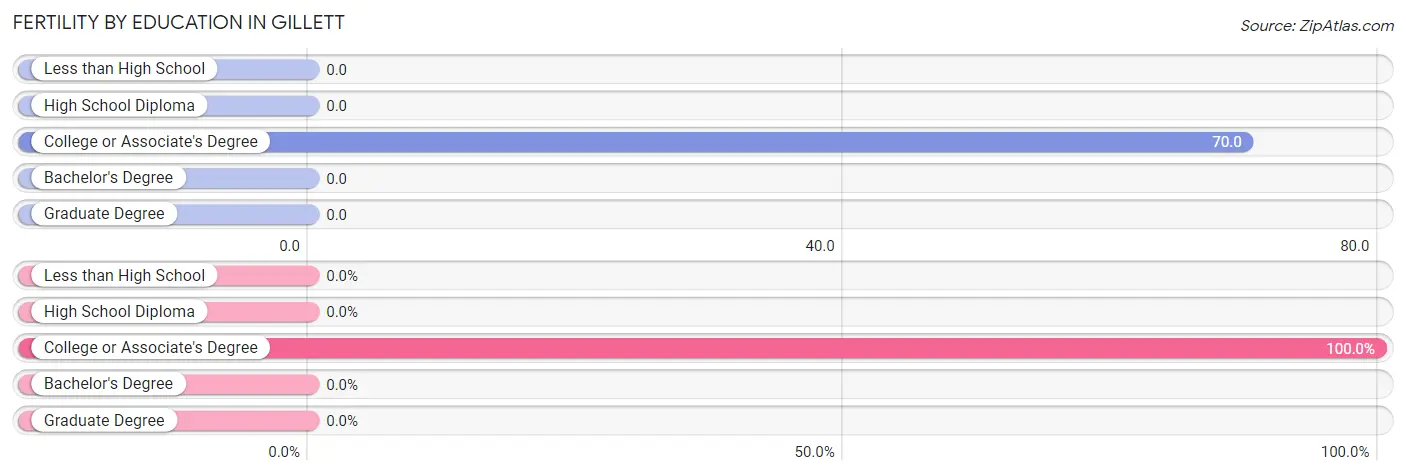
| Educational Attainment | Women with Births | Births / 1,000 Women |
| Less than High School | 0 (0.0%) | 0.0 |
| High School Diploma | 0 (0.0%) | 0.0 |
| College or Associate's Degree | 5 (100.0%) | 70.0 |
| Bachelor's Degree | 0 (0.0%) | 0.0 |
| Graduate Degree | 0 (0.0%) | 0.0 |
| Total | 5 (100.0%) | 21.0 |
Fertility by Education by Marriage Status in Gillett
| Educational Attainment | Married | Unmarried |
| Less than High School | 0 (0.0%) | 0 (0.0%) |
| High School Diploma | 0 (0.0%) | 0 (0.0%) |
| College or Associate's Degree | 5 (100.0%) | 0 (0.0%) |
| Bachelor's Degree | 0 (0.0%) | 0 (0.0%) |
| Graduate Degree | 0 (0.0%) | 0 (0.0%) |
| Total | 5 (100.0%) | 0 (0.0%) |
Employment Characteristics in Gillett
Employment by Class of Employer in Gillett
Among the 630 employed individuals in Gillett, private company employees (495 | 78.6%), local government employees (60 | 9.5%), and self-employed (not incorporated) (22 | 3.5%) make up the most common classes of employment.
| Employer Class | # Employees | % Employees |
| Private Company Employees | 495 | 78.6% |
| Self-Employed (Incorporated) | 12 | 1.9% |
| Self-Employed (Not Incorporated) | 22 | 3.5% |
| Not-for-profit Organizations | 20 | 3.2% |
| Local Government Employees | 60 | 9.5% |
| State Government Employees | 5 | 0.8% |
| Federal Government Employees | 16 | 2.5% |
| Unpaid Family Workers | 0 | 0.0% |
| Total | 630 | 100.0% |
Employment Status by Age in Gillett
According to the labor force statistics for Gillett, out of the total population over 16 years of age (986), 66.5% or 656 individuals are in the labor force, with 3.5% or 23 of them unemployed. The age group with the highest labor force participation rate is 30 to 34 years, with 97.6% or 123 individuals in the labor force. Within the labor force, the 20 to 24 years age range has the highest percentage of unemployed individuals, with 6.0% or 7 of them being unemployed.
| Age Bracket | In Labor Force | Unemployed |
| 16 to 19 Years | 14 (37.8%) | 0 (0.0%) |
| 20 to 24 Years | 117 (91.4%) | 7 (6.0%) |
| 25 to 29 Years | 53 (93.0%) | 0 (0.0%) |
| 30 to 34 Years | 123 (97.6%) | 7 (5.7%) |
| 35 to 44 Years | 115 (86.5%) | 4 (3.5%) |
| 45 to 54 Years | 83 (90.2%) | 5 (6.0%) |
| 55 to 59 Years | 72 (56.7%) | 0 (0.0%) |
| 60 to 64 Years | 55 (51.9%) | 0 (0.0%) |
| 65 to 74 Years | 18 (25.4%) | 0 (0.0%) |
| 75 Years and over | 6 (5.5%) | 0 (0.0%) |
| Total | 656 (66.5%) | 23 (3.5%) |
Employment Status by Educational Attainment in Gillett
According to labor force statistics for Gillett, 78.2% of individuals (501) out of the total population between 25 and 64 years of age (641) are in the labor force, with 3.2% or 16 of them being unemployed. The group with the highest labor force participation rate are those with the educational attainment of bachelor's degree or higher, with 88.2% or 67 individuals in the labor force. Within the labor force, individuals with less than high school education have the highest percentage of unemployment, with 16.7% or 5 of them being unemployed.
| Educational Attainment | In Labor Force | Unemployed |
| Less than High School | 30 (39.0%) | 13 (16.7%) |
| High School Diploma | 246 (79.9%) | 5 (1.6%) |
| College / Associate Degree | 158 (87.8%) | 6 (3.2%) |
| Bachelor's Degree or higher | 67 (88.2%) | 2 (3.0%) |
| Total | 501 (78.2%) | 21 (3.2%) |
Employment Occupations by Sex in Gillett
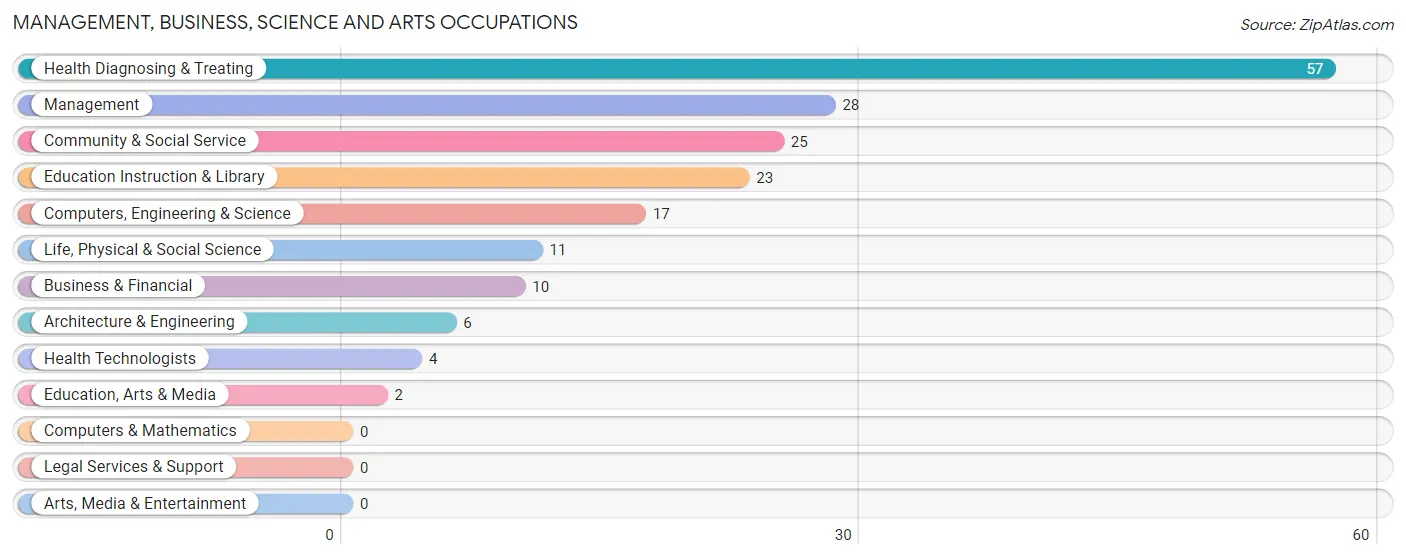
Management, Business, Science and Arts Occupations
The most common Management, Business, Science and Arts occupations in Gillett are Health Diagnosing & Treating (57 | 9.0%), Management (28 | 4.4%), Community & Social Service (25 | 4.0%), Education Instruction & Library (23 | 3.6%), and Computers, Engineering & Science (17 | 2.7%).
Management, Business, Science and Arts Occupations by Sex
Within the Management, Business, Science and Arts occupations in Gillett, the most male-oriented occupations are Architecture & Engineering (100.0%), Education, Arts & Media (100.0%), and Management (92.9%), while the most female-oriented occupations are Health Technologists (100.0%), Health Diagnosing & Treating (94.7%), and Education Instruction & Library (87.0%).
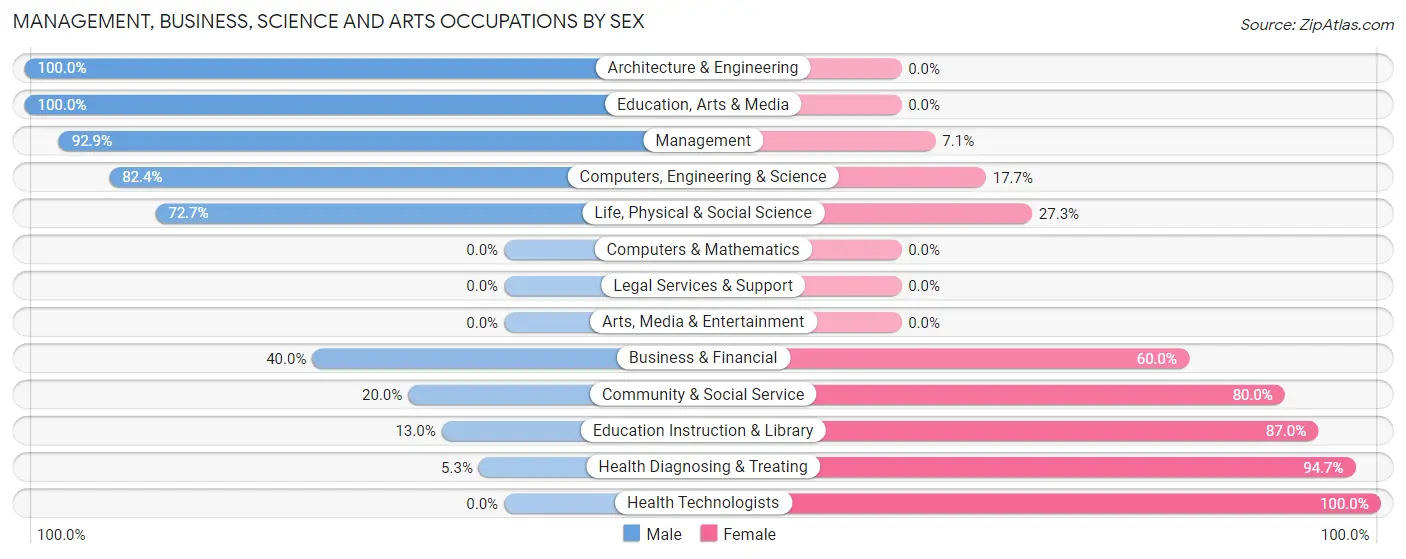
| Occupation | Male | Female |
| Management | 26 (92.9%) | 2 (7.1%) |
| Business & Financial | 4 (40.0%) | 6 (60.0%) |
| Computers, Engineering & Science | 14 (82.4%) | 3 (17.6%) |
| Computers & Mathematics | 0 (0.0%) | 0 (0.0%) |
| Architecture & Engineering | 6 (100.0%) | 0 (0.0%) |
| Life, Physical & Social Science | 8 (72.7%) | 3 (27.3%) |
| Community & Social Service | 5 (20.0%) | 20 (80.0%) |
| Education, Arts & Media | 2 (100.0%) | 0 (0.0%) |
| Legal Services & Support | 0 (0.0%) | 0 (0.0%) |
| Education Instruction & Library | 3 (13.0%) | 20 (87.0%) |
| Arts, Media & Entertainment | 0 (0.0%) | 0 (0.0%) |
| Health Diagnosing & Treating | 3 (5.3%) | 54 (94.7%) |
| Health Technologists | 0 (0.0%) | 4 (100.0%) |
| Total (Category) | 52 (38.0%) | 85 (62.0%) |
| Total (Overall) | 323 (51.0%) | 310 (49.0%) |
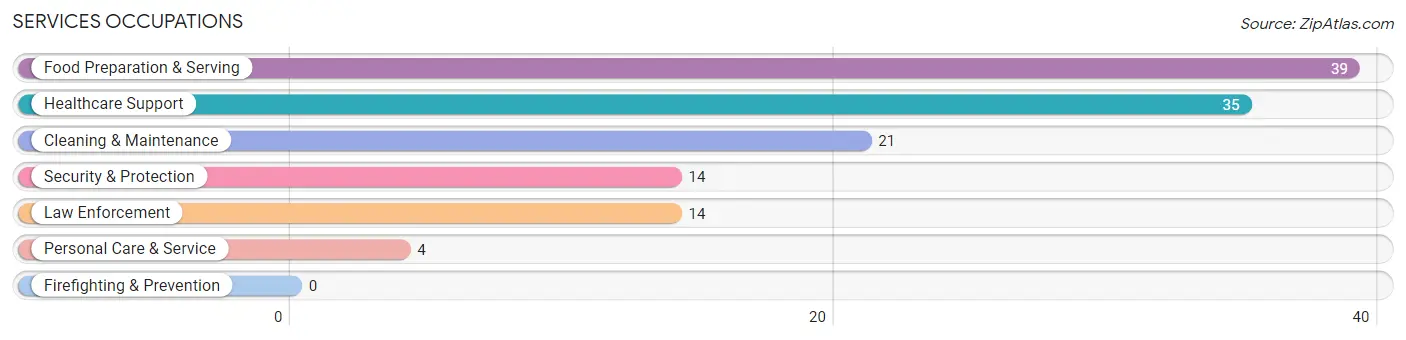
Services Occupations
The most common Services occupations in Gillett are Food Preparation & Serving (39 | 6.2%), Healthcare Support (35 | 5.5%), Cleaning & Maintenance (21 | 3.3%), Security & Protection (14 | 2.2%), and Law Enforcement (14 | 2.2%).
Services Occupations by Sex
Within the Services occupations in Gillett, the most male-oriented occupations are Security & Protection (57.1%), Law Enforcement (57.1%), and Cleaning & Maintenance (19.1%), while the most female-oriented occupations are Food Preparation & Serving (100.0%), Personal Care & Service (100.0%), and Healthcare Support (88.6%).
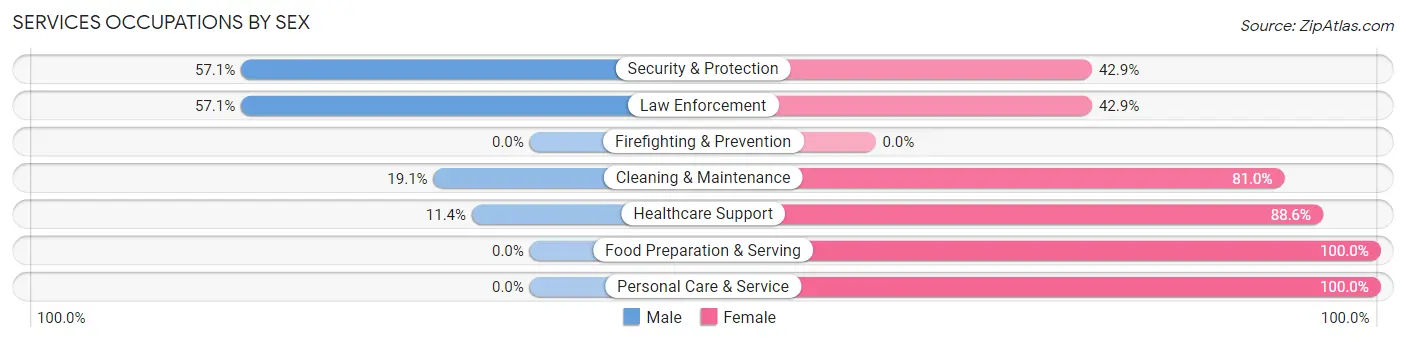
| Occupation | Male | Female |
| Healthcare Support | 4 (11.4%) | 31 (88.6%) |
| Security & Protection | 8 (57.1%) | 6 (42.9%) |
| Firefighting & Prevention | 0 (0.0%) | 0 (0.0%) |
| Law Enforcement | 8 (57.1%) | 6 (42.9%) |
| Food Preparation & Serving | 0 (0.0%) | 39 (100.0%) |
| Cleaning & Maintenance | 4 (19.1%) | 17 (80.9%) |
| Personal Care & Service | 0 (0.0%) | 4 (100.0%) |
| Total (Category) | 16 (14.2%) | 97 (85.8%) |
| Total (Overall) | 323 (51.0%) | 310 (49.0%) |
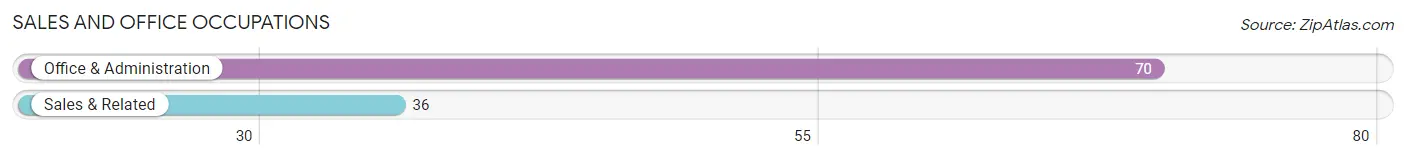
Sales and Office Occupations
The most common Sales and Office occupations in Gillett are Office & Administration (70 | 11.1%), and Sales & Related (36 | 5.7%).
Sales and Office Occupations by Sex
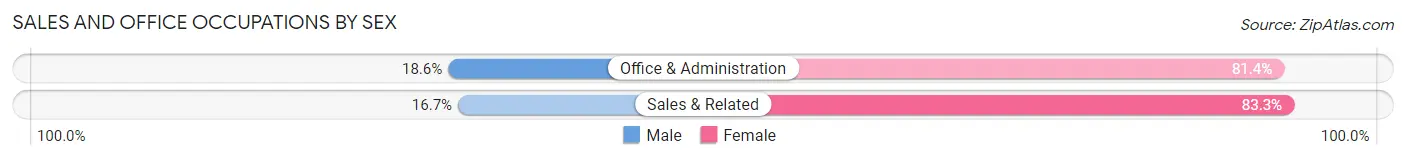
| Occupation | Male | Female |
| Sales & Related | 6 (16.7%) | 30 (83.3%) |
| Office & Administration | 13 (18.6%) | 57 (81.4%) |
| Total (Category) | 19 (17.9%) | 87 (82.1%) |
| Total (Overall) | 323 (51.0%) | 310 (49.0%) |
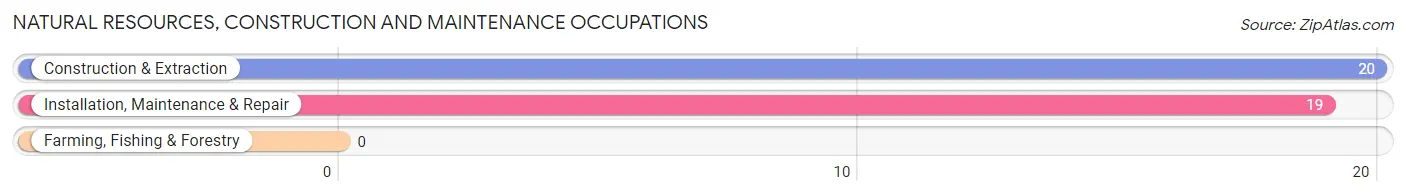
Natural Resources, Construction and Maintenance Occupations
The most common Natural Resources, Construction and Maintenance occupations in Gillett are Construction & Extraction (20 | 3.2%), and Installation, Maintenance & Repair (19 | 3.0%).
Natural Resources, Construction and Maintenance Occupations by Sex
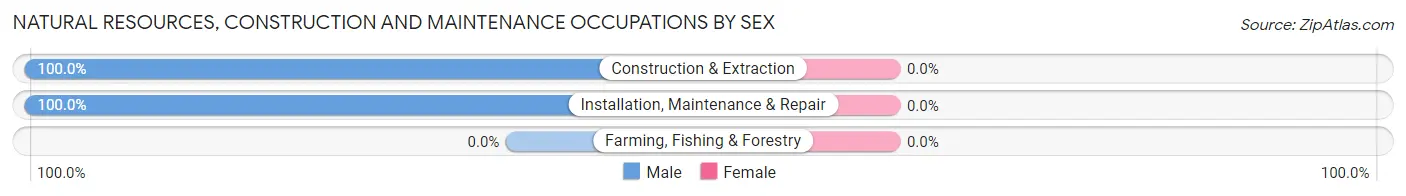
| Occupation | Male | Female |
| Farming, Fishing & Forestry | 0 (0.0%) | 0 (0.0%) |
| Construction & Extraction | 20 (100.0%) | 0 (0.0%) |
| Installation, Maintenance & Repair | 19 (100.0%) | 0 (0.0%) |
| Total (Category) | 39 (100.0%) | 0 (0.0%) |
| Total (Overall) | 323 (51.0%) | 310 (49.0%) |
Production, Transportation and Moving Occupations
The most common Production, Transportation and Moving occupations in Gillett are Production (118 | 18.6%), Material Moving (103 | 16.3%), and Transportation (17 | 2.7%).
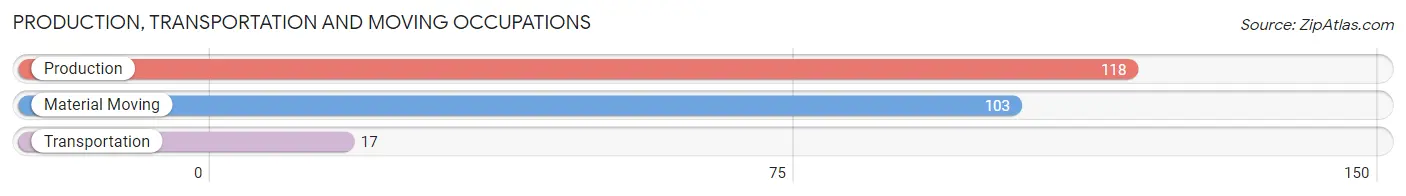
Production, Transportation and Moving Occupations by Sex
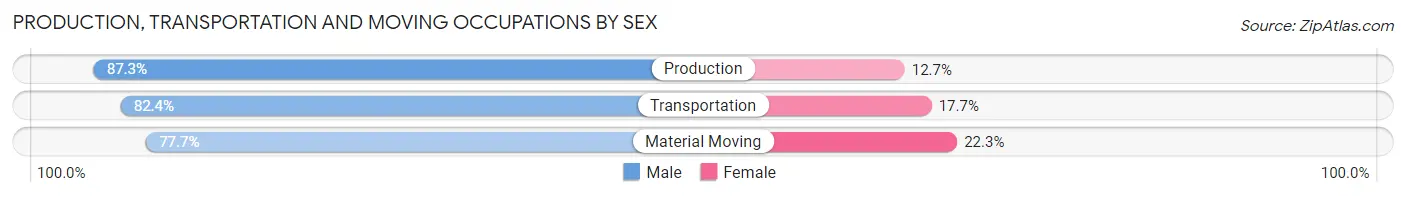
| Occupation | Male | Female |
| Production | 103 (87.3%) | 15 (12.7%) |
| Transportation | 14 (82.4%) | 3 (17.6%) |
| Material Moving | 80 (77.7%) | 23 (22.3%) |
| Total (Category) | 197 (82.8%) | 41 (17.2%) |
| Total (Overall) | 323 (51.0%) | 310 (49.0%) |
Employment Industries by Sex in Gillett
Employment Industries in Gillett
The major employment industries in Gillett include Manufacturing (178 | 28.1%), Retail Trade (118 | 18.6%), Health Care & Social Assistance (109 | 17.2%), Public Administration (44 | 7.0%), and Accommodation & Food Services (42 | 6.6%).
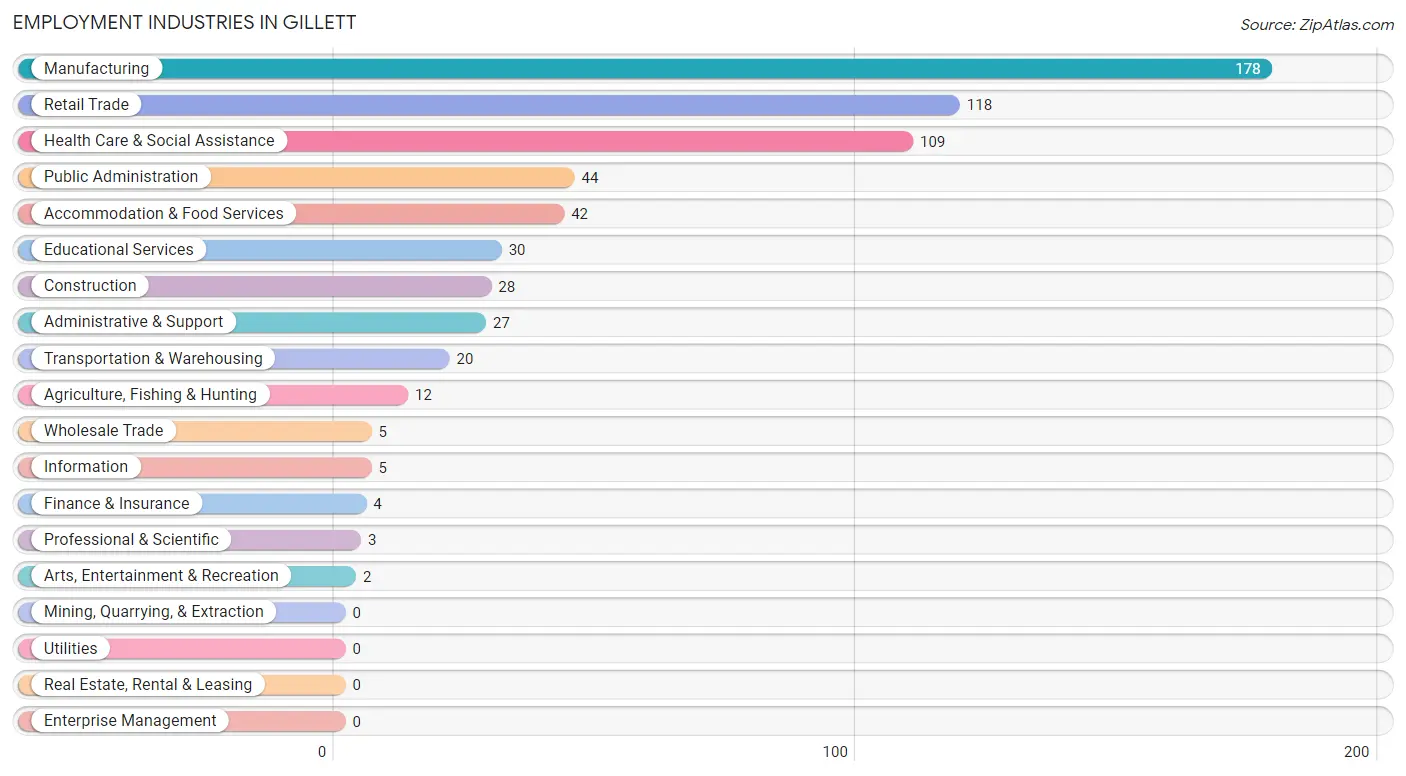
Employment Industries by Sex in Gillett
The Gillett industries that see more men than women are Wholesale Trade (100.0%), Professional & Scientific (100.0%), and Construction (85.7%), whereas the industries that tend to have a higher number of women are Finance & Insurance (100.0%), Arts, Entertainment & Recreation (100.0%), and Accommodation & Food Services (100.0%).
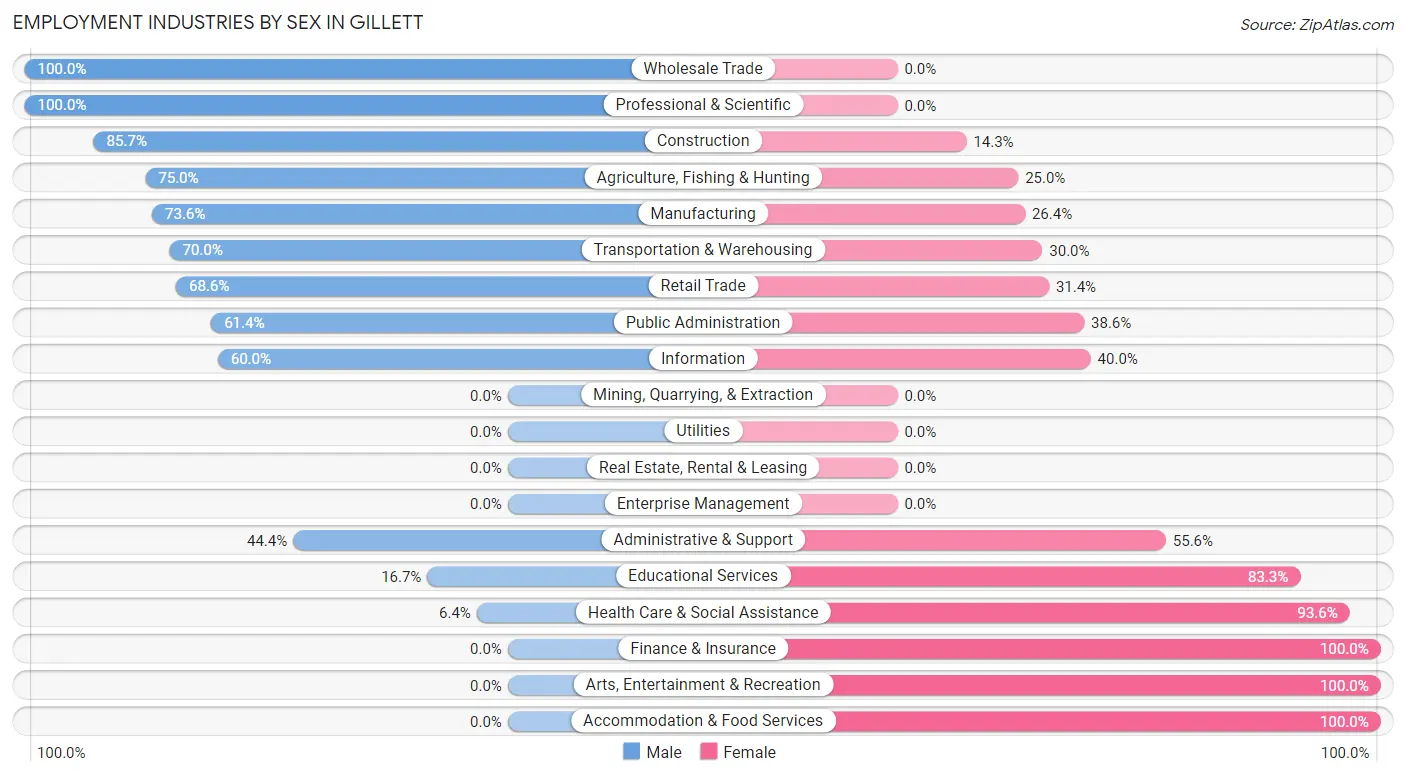
| Industry | Male | Female |
| Agriculture, Fishing & Hunting | 9 (75.0%) | 3 (25.0%) |
| Mining, Quarrying, & Extraction | 0 (0.0%) | 0 (0.0%) |
| Construction | 24 (85.7%) | 4 (14.3%) |
| Manufacturing | 131 (73.6%) | 47 (26.4%) |
| Wholesale Trade | 5 (100.0%) | 0 (0.0%) |
| Retail Trade | 81 (68.6%) | 37 (31.4%) |
| Transportation & Warehousing | 14 (70.0%) | 6 (30.0%) |
| Utilities | 0 (0.0%) | 0 (0.0%) |
| Information | 3 (60.0%) | 2 (40.0%) |
| Finance & Insurance | 0 (0.0%) | 4 (100.0%) |
| Real Estate, Rental & Leasing | 0 (0.0%) | 0 (0.0%) |
| Professional & Scientific | 3 (100.0%) | 0 (0.0%) |
| Enterprise Management | 0 (0.0%) | 0 (0.0%) |
| Administrative & Support | 12 (44.4%) | 15 (55.6%) |
| Educational Services | 5 (16.7%) | 25 (83.3%) |
| Health Care & Social Assistance | 7 (6.4%) | 102 (93.6%) |
| Arts, Entertainment & Recreation | 0 (0.0%) | 2 (100.0%) |
| Accommodation & Food Services | 0 (0.0%) | 42 (100.0%) |
| Public Administration | 27 (61.4%) | 17 (38.6%) |
| Total | 323 (51.0%) | 310 (49.0%) |
Education in Gillett
School Enrollment in Gillett
The most common levels of schooling among the 285 students in Gillett are middle school (106 | 37.2%), elementary school (97 | 34.0%), and high school (53 | 18.6%).
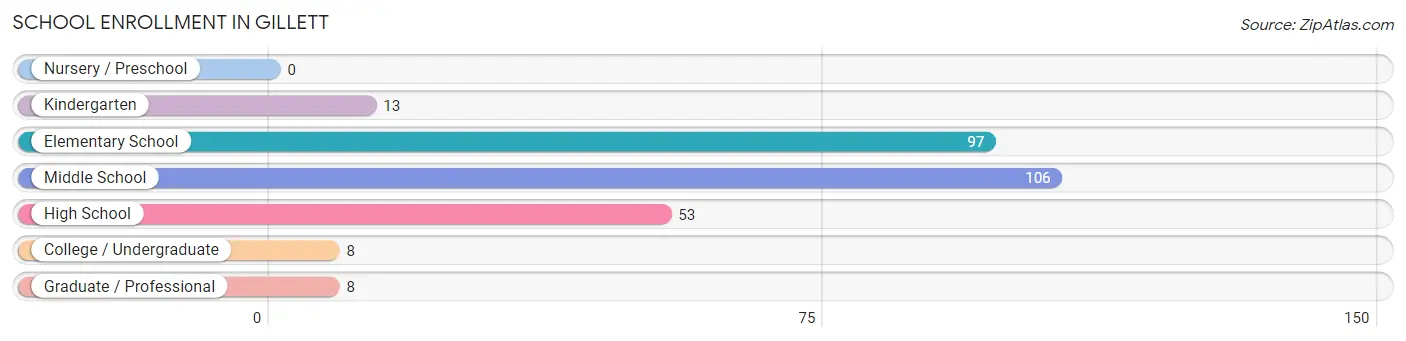
| School Level | # Students | % Students |
| Nursery / Preschool | 0 | 0.0% |
| Kindergarten | 13 | 4.6% |
| Elementary School | 97 | 34.0% |
| Middle School | 106 | 37.2% |
| High School | 53 | 18.6% |
| College / Undergraduate | 8 | 2.8% |
| Graduate / Professional | 8 | 2.8% |
| Total | 285 | 100.0% |
School Enrollment by Age by Funding Source in Gillett
Out of a total of 285 students who are enrolled in schools in Gillett, 22 (7.7%) attend a private institution, while the remaining 263 (92.3%) are enrolled in public schools. The age group of 5 to 9 year old has the highest likelihood of being enrolled in private schools, with 18 (18.4% in the age bracket) enrolled. Conversely, the age group of 15 to 17 year olds has the lowest likelihood of being enrolled in a private school, with 48 (100.0% in the age bracket) attending a public institution.
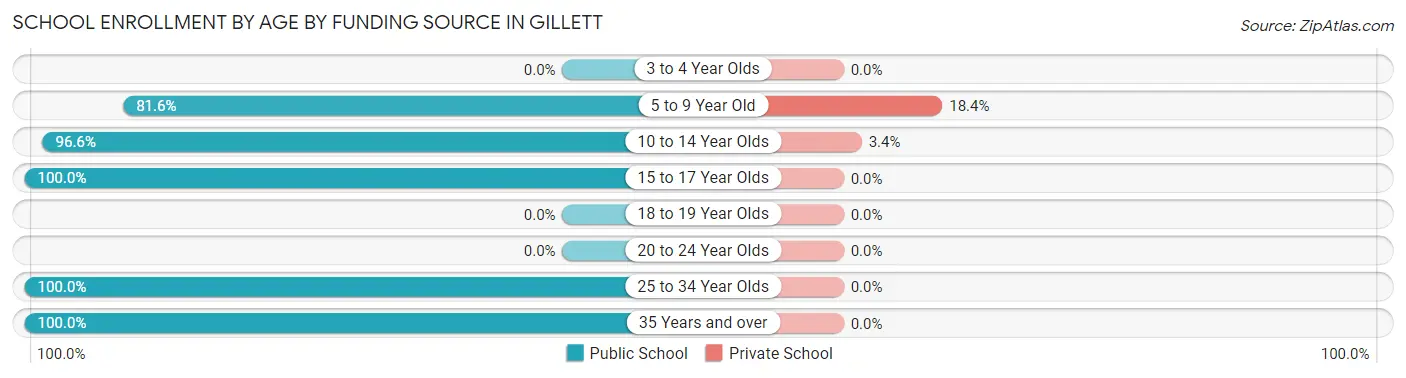
| Age Bracket | Public School | Private School |
| 3 to 4 Year Olds | 0 (0.0%) | 0 (0.0%) |
| 5 to 9 Year Old | 80 (81.6%) | 18 (18.4%) |
| 10 to 14 Year Olds | 115 (96.6%) | 4 (3.4%) |
| 15 to 17 Year Olds | 48 (100.0%) | 0 (0.0%) |
| 18 to 19 Year Olds | 0 (0.0%) | 0 (0.0%) |
| 20 to 24 Year Olds | 0 (0.0%) | 0 (0.0%) |
| 25 to 34 Year Olds | 10 (100.0%) | 0 (0.0%) |
| 35 Years and over | 10 (100.0%) | 0 (0.0%) |
| Total | 263 (92.3%) | 22 (7.7%) |
Educational Attainment by Field of Study in Gillett
Education (27 | 27.3%), bio, nature & agricultural (19 | 19.2%), business (13 | 13.1%), science & technology (10 | 10.1%), and computers & mathematics (9 | 9.1%) are the most common fields of study among 99 individuals in Gillett who have obtained a bachelor's degree or higher.
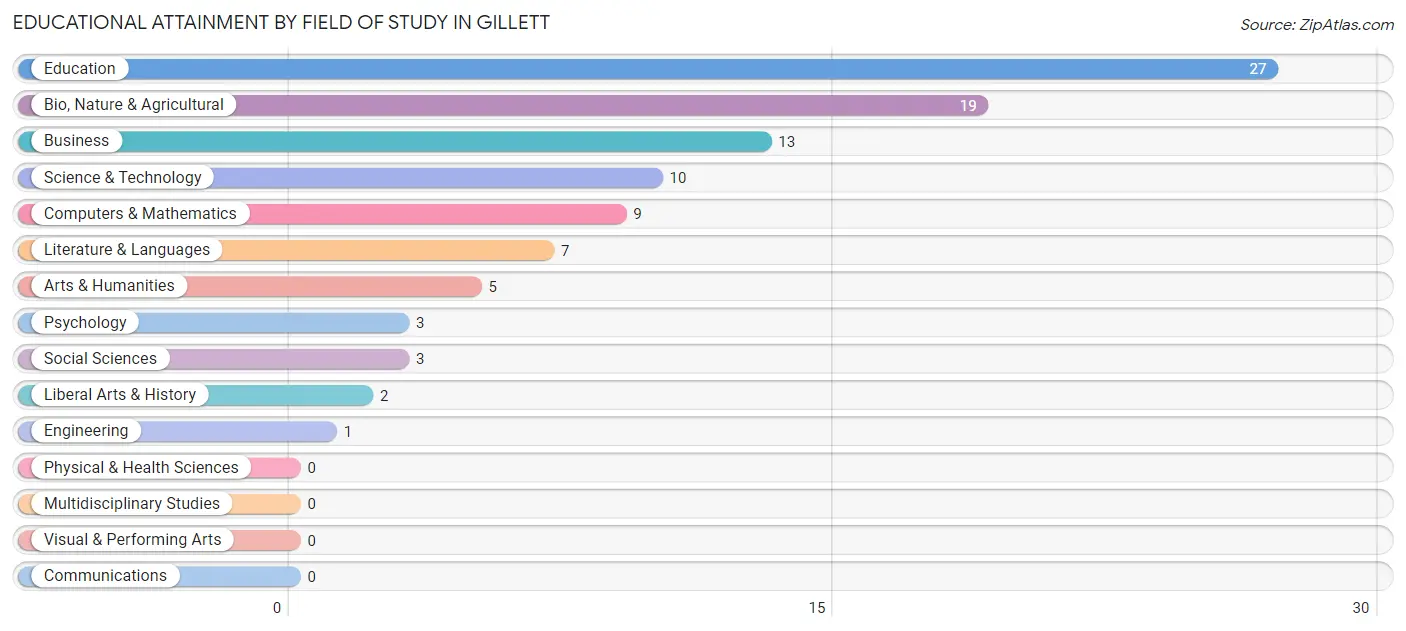
| Field of Study | # Graduates | % Graduates |
| Computers & Mathematics | 9 | 9.1% |
| Bio, Nature & Agricultural | 19 | 19.2% |
| Physical & Health Sciences | 0 | 0.0% |
| Psychology | 3 | 3.0% |
| Social Sciences | 3 | 3.0% |
| Engineering | 1 | 1.0% |
| Multidisciplinary Studies | 0 | 0.0% |
| Science & Technology | 10 | 10.1% |
| Business | 13 | 13.1% |
| Education | 27 | 27.3% |
| Literature & Languages | 7 | 7.1% |
| Liberal Arts & History | 2 | 2.0% |
| Visual & Performing Arts | 0 | 0.0% |
| Communications | 0 | 0.0% |
| Arts & Humanities | 5 | 5.1% |
| Total | 99 | 100.0% |
Transportation & Commute in Gillett
Vehicle Availability by Sex in Gillett
The most prevalent vehicle ownership categories in Gillett are males with 2 vehicles (109, accounting for 34.1%) and females with 2 vehicles (89, making up 35.2%).
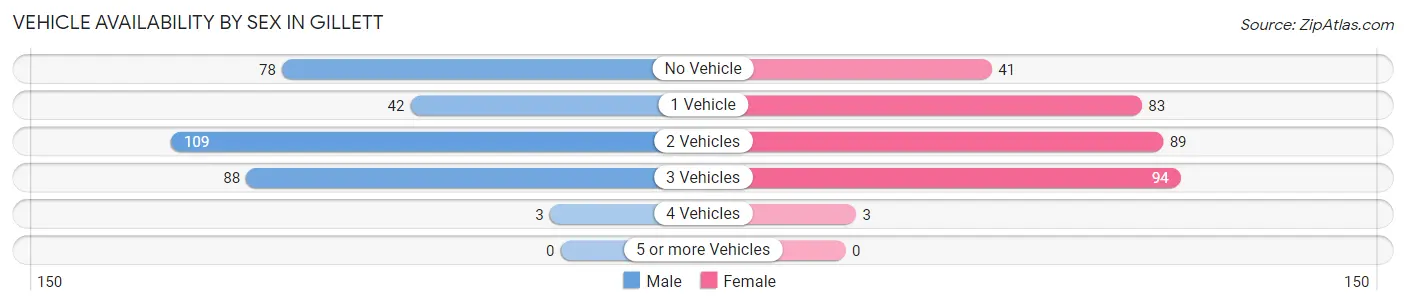
| Vehicles Available | Male | Female |
| No Vehicle | 78 (24.4%) | 41 (13.2%) |
| 1 Vehicle | 42 (13.1%) | 83 (26.8%) |
| 2 Vehicles | 109 (34.1%) | 89 (28.7%) |
| 3 Vehicles | 88 (27.5%) | 94 (30.3%) |
| 4 Vehicles | 3 (0.9%) | 3 (1.0%) |
| 5 or more Vehicles | 0 (0.0%) | 0 (0.0%) |
| Total | 320 (100.0%) | 310 (100.0%) |
Commute Time in Gillett
The most frequently occuring commute durations in Gillett are 30 to 34 minutes (143 commuters, 25.0%), less than 5 minutes (105 commuters, 18.4%), and 20 to 24 minutes (79 commuters, 13.8%).
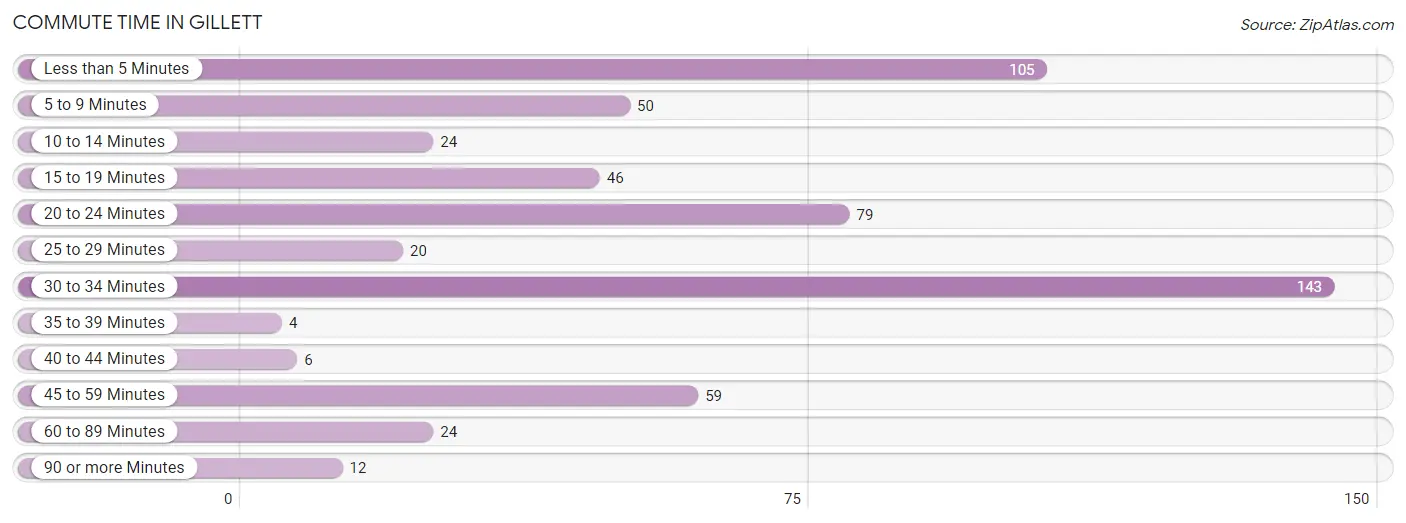
| Commute Time | # Commuters | % Commuters |
| Less than 5 Minutes | 105 | 18.4% |
| 5 to 9 Minutes | 50 | 8.7% |
| 10 to 14 Minutes | 24 | 4.2% |
| 15 to 19 Minutes | 46 | 8.0% |
| 20 to 24 Minutes | 79 | 13.8% |
| 25 to 29 Minutes | 20 | 3.5% |
| 30 to 34 Minutes | 143 | 25.0% |
| 35 to 39 Minutes | 4 | 0.7% |
| 40 to 44 Minutes | 6 | 1.1% |
| 45 to 59 Minutes | 59 | 10.3% |
| 60 to 89 Minutes | 24 | 4.2% |
| 90 or more Minutes | 12 | 2.1% |
Commute Time by Sex in Gillett
The most common commute times in Gillett are 30 to 34 minutes (104 commuters, 32.8%) for males and less than 5 minutes (62 commuters, 24.3%) for females.
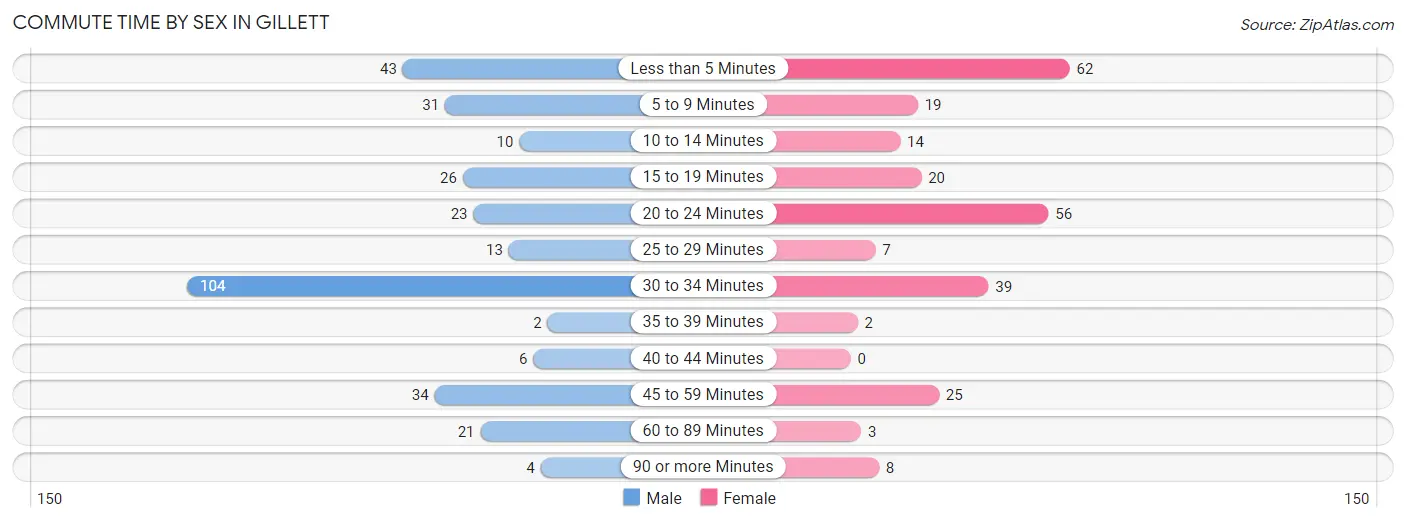
| Commute Time | Male | Female |
| Less than 5 Minutes | 43 (13.6%) | 62 (24.3%) |
| 5 to 9 Minutes | 31 (9.8%) | 19 (7.4%) |
| 10 to 14 Minutes | 10 (3.2%) | 14 (5.5%) |
| 15 to 19 Minutes | 26 (8.2%) | 20 (7.8%) |
| 20 to 24 Minutes | 23 (7.3%) | 56 (22.0%) |
| 25 to 29 Minutes | 13 (4.1%) | 7 (2.8%) |
| 30 to 34 Minutes | 104 (32.8%) | 39 (15.3%) |
| 35 to 39 Minutes | 2 (0.6%) | 2 (0.8%) |
| 40 to 44 Minutes | 6 (1.9%) | 0 (0.0%) |
| 45 to 59 Minutes | 34 (10.7%) | 25 (9.8%) |
| 60 to 89 Minutes | 21 (6.6%) | 3 (1.2%) |
| 90 or more Minutes | 4 (1.3%) | 8 (3.1%) |
Time of Departure to Work by Sex in Gillett
The most frequent times of departure to work in Gillett are 7:00 AM to 7:29 AM (109, 34.4%) for males and 7:30 AM to 7:59 AM (51, 20.0%) for females.
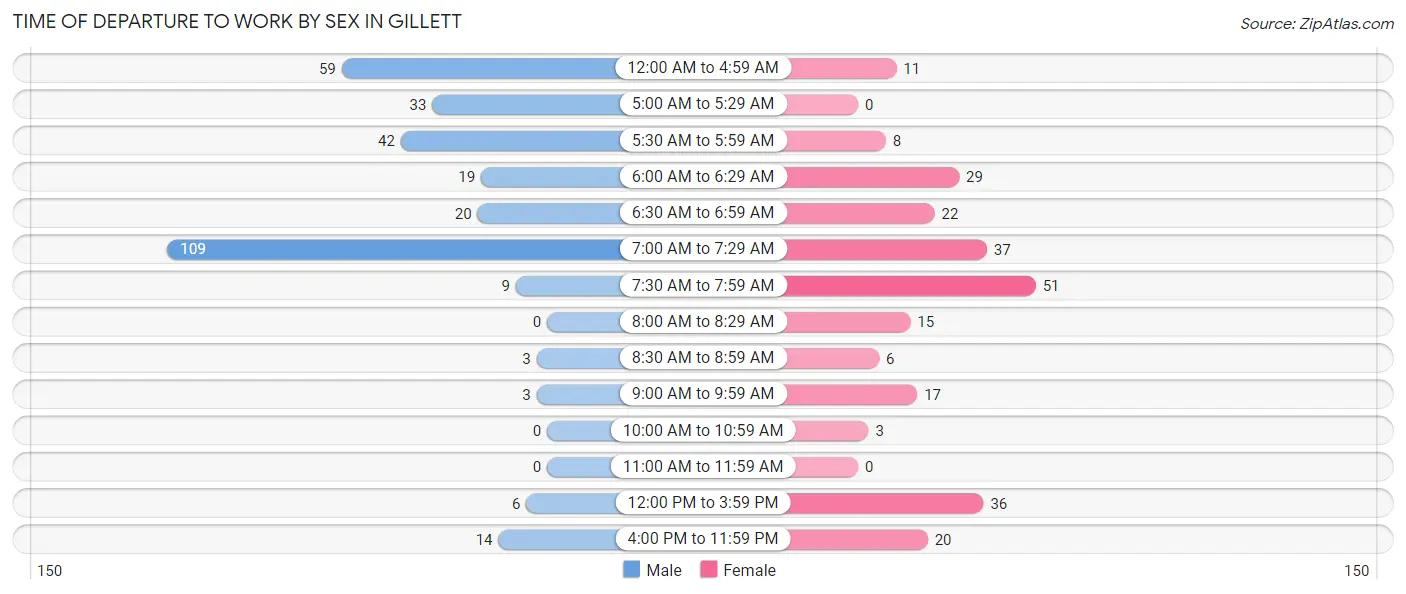
| Time of Departure | Male | Female |
| 12:00 AM to 4:59 AM | 59 (18.6%) | 11 (4.3%) |
| 5:00 AM to 5:29 AM | 33 (10.4%) | 0 (0.0%) |
| 5:30 AM to 5:59 AM | 42 (13.3%) | 8 (3.1%) |
| 6:00 AM to 6:29 AM | 19 (6.0%) | 29 (11.4%) |
| 6:30 AM to 6:59 AM | 20 (6.3%) | 22 (8.6%) |
| 7:00 AM to 7:29 AM | 109 (34.4%) | 37 (14.5%) |
| 7:30 AM to 7:59 AM | 9 (2.8%) | 51 (20.0%) |
| 8:00 AM to 8:29 AM | 0 (0.0%) | 15 (5.9%) |
| 8:30 AM to 8:59 AM | 3 (0.9%) | 6 (2.4%) |
| 9:00 AM to 9:59 AM | 3 (0.9%) | 17 (6.7%) |
| 10:00 AM to 10:59 AM | 0 (0.0%) | 3 (1.2%) |
| 11:00 AM to 11:59 AM | 0 (0.0%) | 0 (0.0%) |
| 12:00 PM to 3:59 PM | 6 (1.9%) | 36 (14.1%) |
| 4:00 PM to 11:59 PM | 14 (4.4%) | 20 (7.8%) |
| Total | 317 (100.0%) | 255 (100.0%) |
Housing Occupancy in Gillett
Occupancy by Ownership in Gillett
Of the total 526 dwellings in Gillett, owner-occupied units account for 403 (76.6%), while renter-occupied units make up 123 (23.4%).
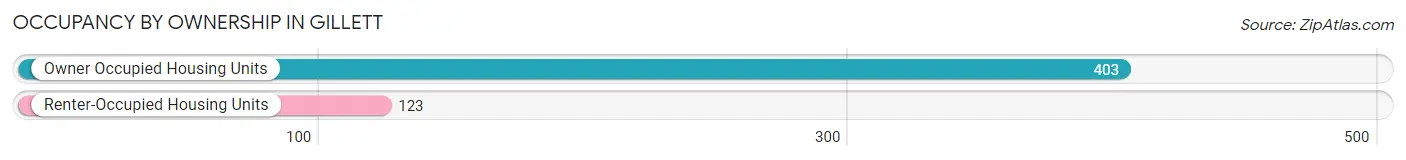
| Occupancy | # Housing Units | % Housing Units |
| Owner Occupied Housing Units | 403 | 76.6% |
| Renter-Occupied Housing Units | 123 | 23.4% |
| Total Occupied Housing Units | 526 | 100.0% |
Occupancy by Household Size in Gillett
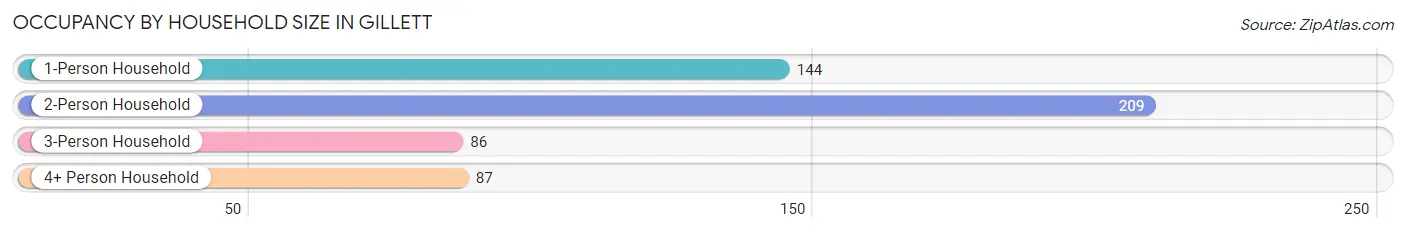
| Household Size | # Housing Units | % Housing Units |
| 1-Person Household | 144 | 27.4% |
| 2-Person Household | 209 | 39.7% |
| 3-Person Household | 86 | 16.4% |
| 4+ Person Household | 87 | 16.5% |
| Total Housing Units | 526 | 100.0% |
Occupancy by Ownership by Household Size in Gillett
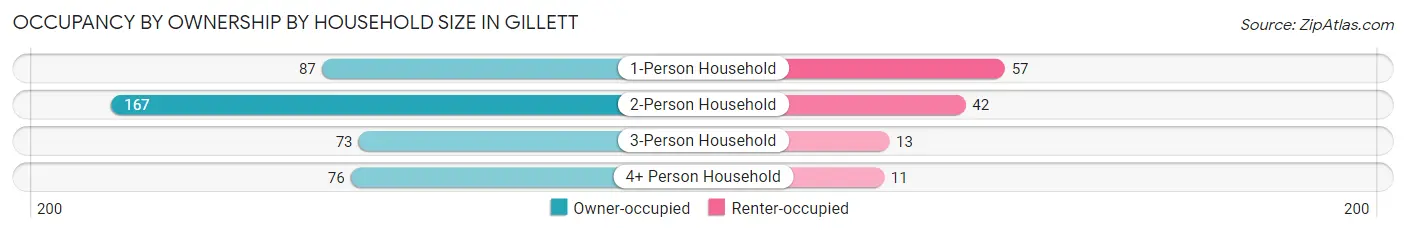
| Household Size | Owner-occupied | Renter-occupied |
| 1-Person Household | 87 (60.4%) | 57 (39.6%) |
| 2-Person Household | 167 (79.9%) | 42 (20.1%) |
| 3-Person Household | 73 (84.9%) | 13 (15.1%) |
| 4+ Person Household | 76 (87.4%) | 11 (12.6%) |
| Total Housing Units | 403 (76.6%) | 123 (23.4%) |
Occupancy by Educational Attainment in Gillett
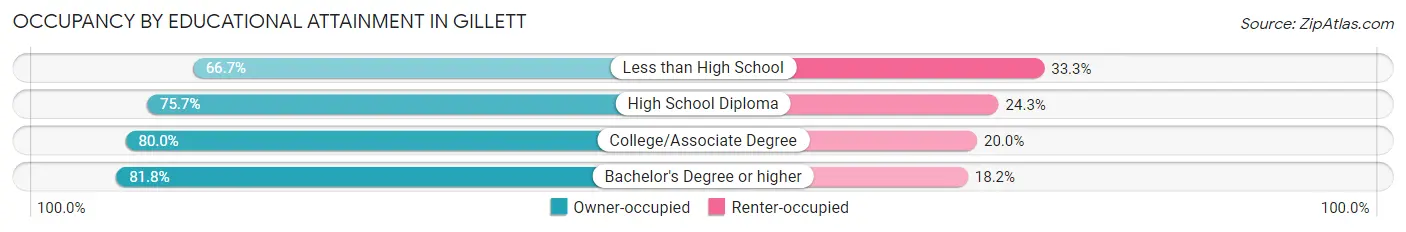
| Household Size | Owner-occupied | Renter-occupied |
| Less than High School | 42 (66.7%) | 21 (33.3%) |
| High School Diploma | 184 (75.7%) | 59 (24.3%) |
| College/Associate Degree | 132 (80.0%) | 33 (20.0%) |
| Bachelor's Degree or higher | 45 (81.8%) | 10 (18.2%) |
Occupancy by Age of Householder in Gillett
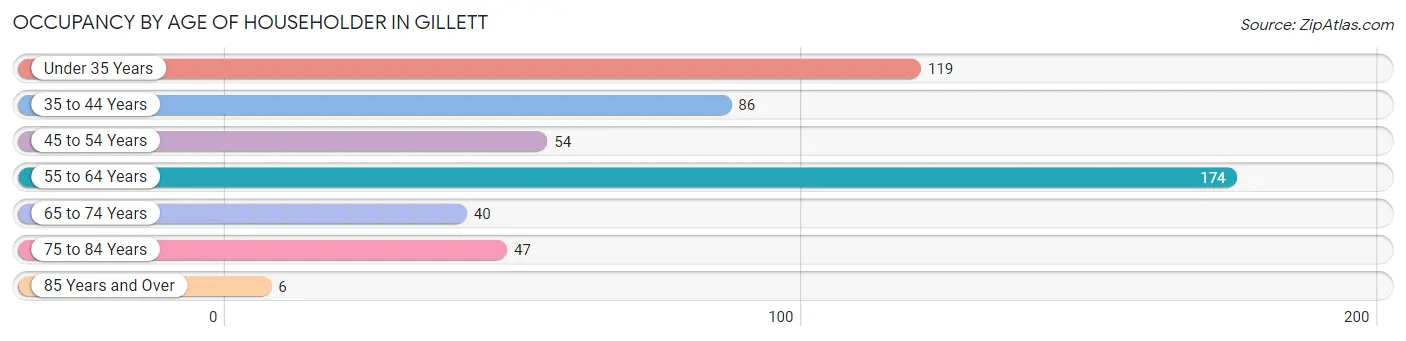
| Age Bracket | # Households | % Households |
| Under 35 Years | 119 | 22.6% |
| 35 to 44 Years | 86 | 16.4% |
| 45 to 54 Years | 54 | 10.3% |
| 55 to 64 Years | 174 | 33.1% |
| 65 to 74 Years | 40 | 7.6% |
| 75 to 84 Years | 47 | 8.9% |
| 85 Years and Over | 6 | 1.1% |
| Total | 526 | 100.0% |
Housing Finances in Gillett
Median Income by Occupancy in Gillett
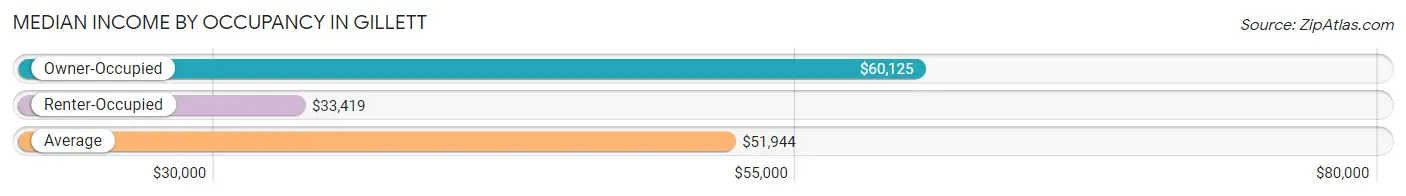
| Occupancy Type | # Households | Median Income |
| Owner-Occupied | 403 (76.6%) | $60,125 |
| Renter-Occupied | 123 (23.4%) | $33,419 |
| Average | 526 (100.0%) | $51,944 |
Occupancy by Householder Income Bracket in Gillett
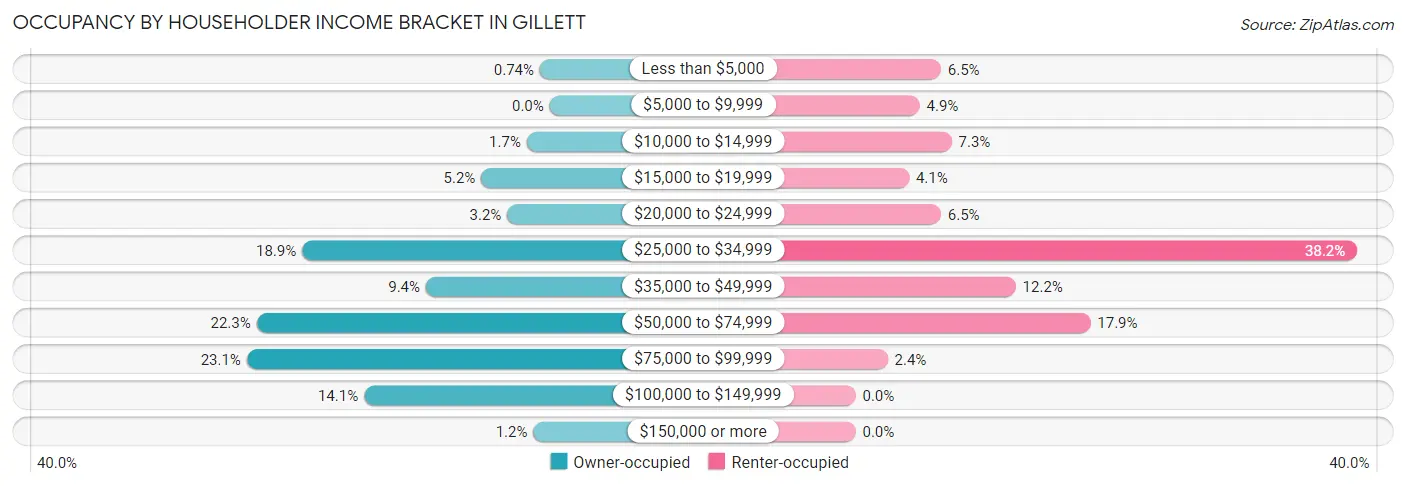
| Income Bracket | Owner-occupied | Renter-occupied |
| Less than $5,000 | 3 (0.7%) | 8 (6.5%) |
| $5,000 to $9,999 | 0 (0.0%) | 6 (4.9%) |
| $10,000 to $14,999 | 7 (1.7%) | 9 (7.3%) |
| $15,000 to $19,999 | 21 (5.2%) | 5 (4.1%) |
| $20,000 to $24,999 | 13 (3.2%) | 8 (6.5%) |
| $25,000 to $34,999 | 76 (18.9%) | 47 (38.2%) |
| $35,000 to $49,999 | 38 (9.4%) | 15 (12.2%) |
| $50,000 to $74,999 | 90 (22.3%) | 22 (17.9%) |
| $75,000 to $99,999 | 93 (23.1%) | 3 (2.4%) |
| $100,000 to $149,999 | 57 (14.1%) | 0 (0.0%) |
| $150,000 or more | 5 (1.2%) | 0 (0.0%) |
| Total | 403 (100.0%) | 123 (100.0%) |
Monthly Housing Cost Tiers in Gillett
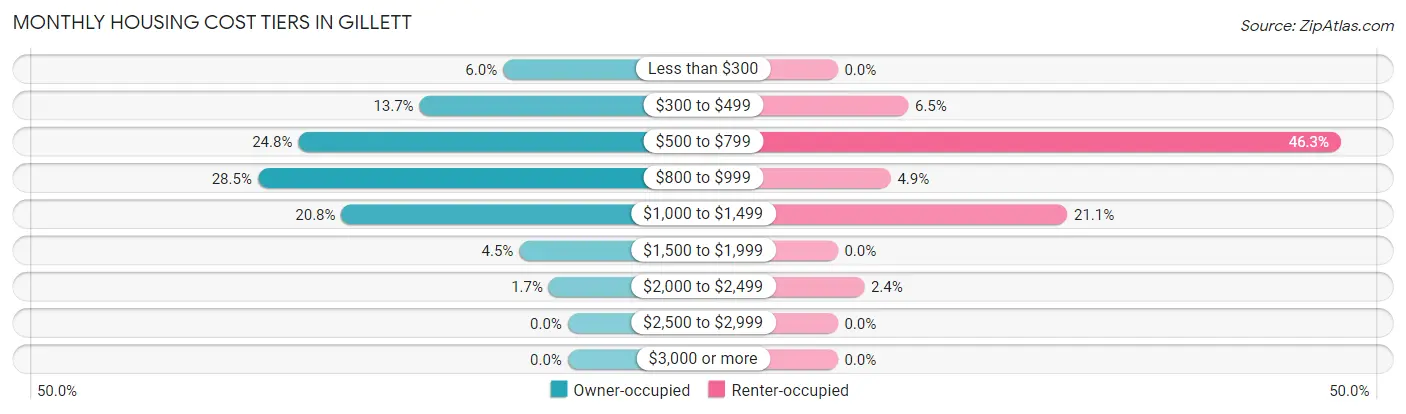
| Monthly Cost | Owner-occupied | Renter-occupied |
| Less than $300 | 24 (6.0%) | 0 (0.0%) |
| $300 to $499 | 55 (13.7%) | 8 (6.5%) |
| $500 to $799 | 100 (24.8%) | 57 (46.3%) |
| $800 to $999 | 115 (28.5%) | 6 (4.9%) |
| $1,000 to $1,499 | 84 (20.8%) | 26 (21.1%) |
| $1,500 to $1,999 | 18 (4.5%) | 0 (0.0%) |
| $2,000 to $2,499 | 7 (1.7%) | 3 (2.4%) |
| $2,500 to $2,999 | 0 (0.0%) | 0 (0.0%) |
| $3,000 or more | 0 (0.0%) | 0 (0.0%) |
| Total | 403 (100.0%) | 123 (100.0%) |
Physical Housing Characteristics in Gillett
Housing Structures in Gillett
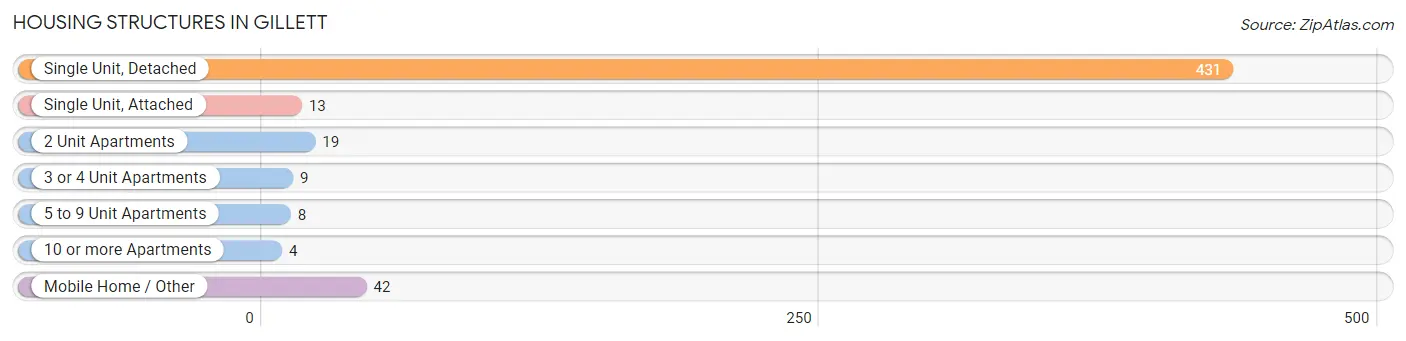
| Structure Type | # Housing Units | % Housing Units |
| Single Unit, Detached | 431 | 81.9% |
| Single Unit, Attached | 13 | 2.5% |
| 2 Unit Apartments | 19 | 3.6% |
| 3 or 4 Unit Apartments | 9 | 1.7% |
| 5 to 9 Unit Apartments | 8 | 1.5% |
| 10 or more Apartments | 4 | 0.8% |
| Mobile Home / Other | 42 | 8.0% |
| Total | 526 | 100.0% |
Housing Structures by Occupancy in Gillett
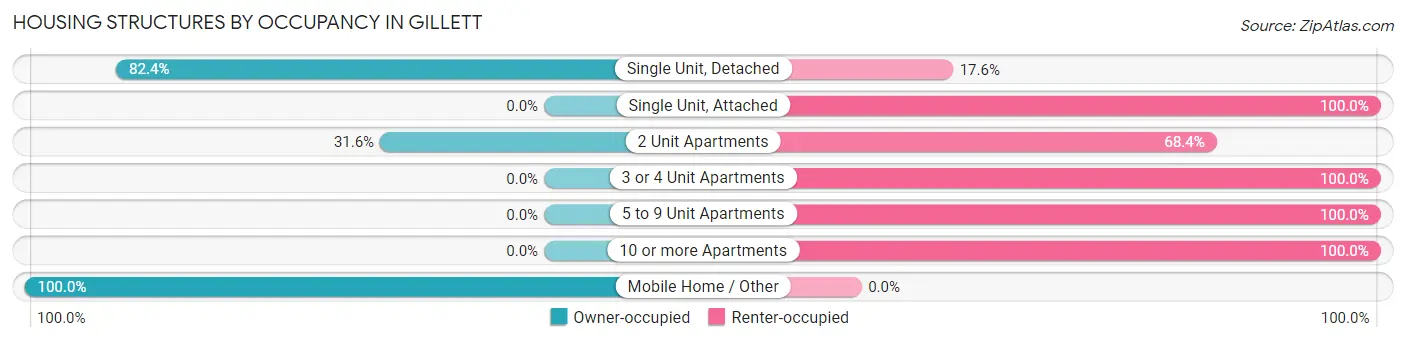
| Structure Type | Owner-occupied | Renter-occupied |
| Single Unit, Detached | 355 (82.4%) | 76 (17.6%) |
| Single Unit, Attached | 0 (0.0%) | 13 (100.0%) |
| 2 Unit Apartments | 6 (31.6%) | 13 (68.4%) |
| 3 or 4 Unit Apartments | 0 (0.0%) | 9 (100.0%) |
| 5 to 9 Unit Apartments | 0 (0.0%) | 8 (100.0%) |
| 10 or more Apartments | 0 (0.0%) | 4 (100.0%) |
| Mobile Home / Other | 42 (100.0%) | 0 (0.0%) |
| Total | 403 (76.6%) | 123 (23.4%) |
Housing Structures by Number of Rooms in Gillett
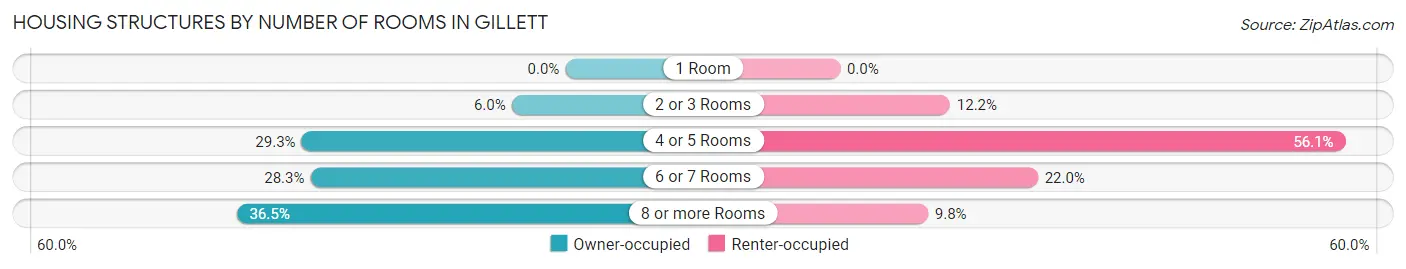
| Number of Rooms | Owner-occupied | Renter-occupied |
| 1 Room | 0 (0.0%) | 0 (0.0%) |
| 2 or 3 Rooms | 24 (6.0%) | 15 (12.2%) |
| 4 or 5 Rooms | 118 (29.3%) | 69 (56.1%) |
| 6 or 7 Rooms | 114 (28.3%) | 27 (22.0%) |
| 8 or more Rooms | 147 (36.5%) | 12 (9.8%) |
| Total | 403 (100.0%) | 123 (100.0%) |
Housing Structure by Heating Type in Gillett
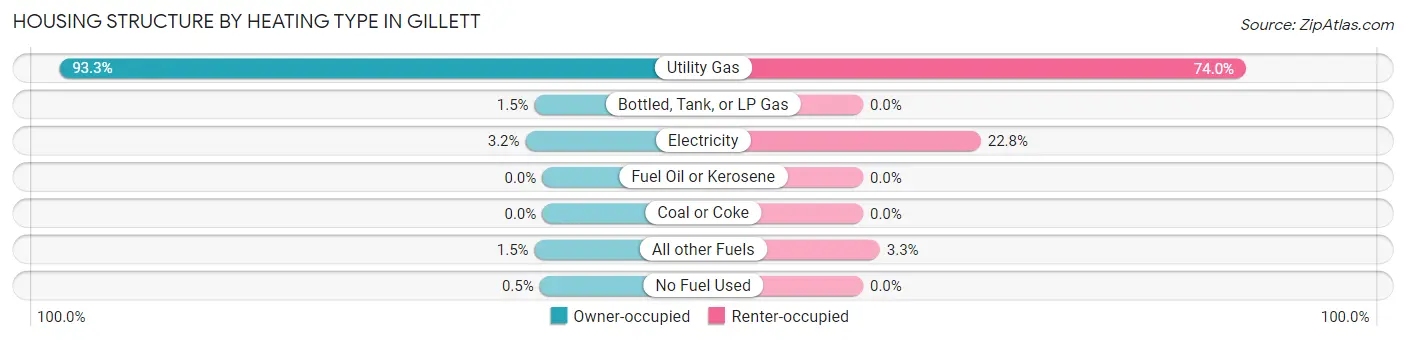
| Heating Type | Owner-occupied | Renter-occupied |
| Utility Gas | 376 (93.3%) | 91 (74.0%) |
| Bottled, Tank, or LP Gas | 6 (1.5%) | 0 (0.0%) |
| Electricity | 13 (3.2%) | 28 (22.8%) |
| Fuel Oil or Kerosene | 0 (0.0%) | 0 (0.0%) |
| Coal or Coke | 0 (0.0%) | 0 (0.0%) |
| All other Fuels | 6 (1.5%) | 4 (3.3%) |
| No Fuel Used | 2 (0.5%) | 0 (0.0%) |
| Total | 403 (100.0%) | 123 (100.0%) |
Household Vehicle Usage in Gillett
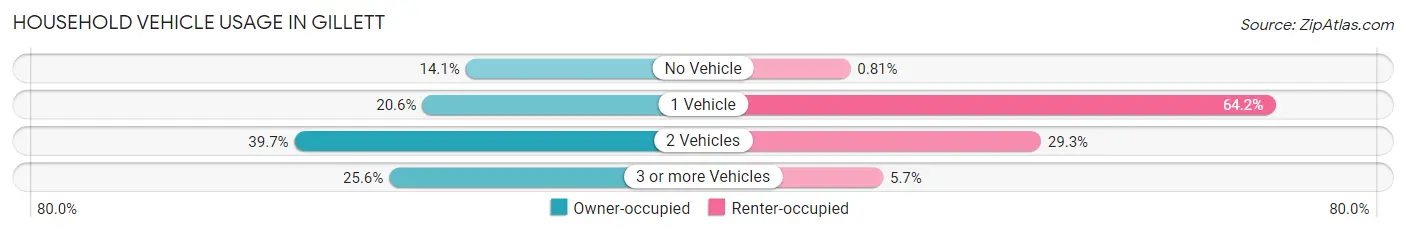
| Vehicles per Household | Owner-occupied | Renter-occupied |
| No Vehicle | 57 (14.1%) | 1 (0.8%) |
| 1 Vehicle | 83 (20.6%) | 79 (64.2%) |
| 2 Vehicles | 160 (39.7%) | 36 (29.3%) |
| 3 or more Vehicles | 103 (25.6%) | 7 (5.7%) |
| Total | 403 (100.0%) | 123 (100.0%) |
Real Estate & Mortgages in Gillett
Real Estate and Mortgage Overview in Gillett
| Characteristic | Without Mortgage | With Mortgage |
| Housing Units | 183 | 220 |
| Median Property Value | $83,500 | $99,200 |
| Median Household Income | $40,417 | $0 |
| Monthly Housing Costs | $546 | $0 |
| Real Estate Taxes | $1,753 | $5 |
Property Value by Mortgage Status in Gillett
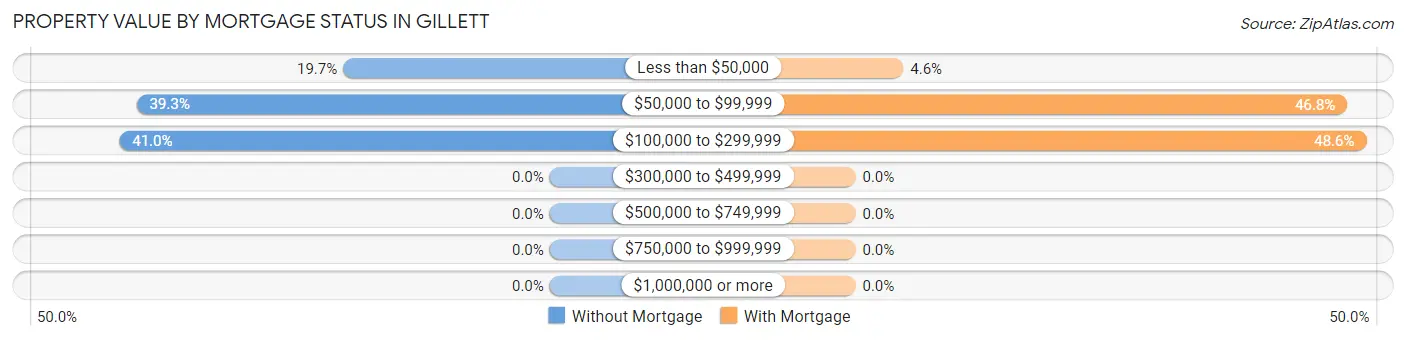
| Property Value | Without Mortgage | With Mortgage |
| Less than $50,000 | 36 (19.7%) | 10 (4.5%) |
| $50,000 to $99,999 | 72 (39.3%) | 103 (46.8%) |
| $100,000 to $299,999 | 75 (41.0%) | 107 (48.6%) |
| $300,000 to $499,999 | 0 (0.0%) | 0 (0.0%) |
| $500,000 to $749,999 | 0 (0.0%) | 0 (0.0%) |
| $750,000 to $999,999 | 0 (0.0%) | 0 (0.0%) |
| $1,000,000 or more | 0 (0.0%) | 0 (0.0%) |
| Total | 183 (100.0%) | 220 (100.0%) |
Household Income by Mortgage Status in Gillett
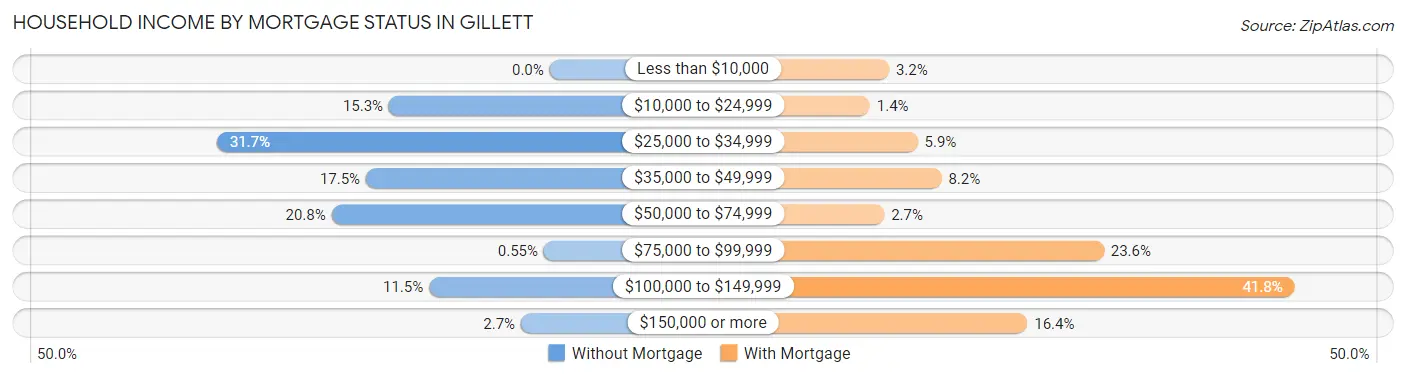
| Household Income | Without Mortgage | With Mortgage |
| Less than $10,000 | 0 (0.0%) | 7 (3.2%) |
| $10,000 to $24,999 | 28 (15.3%) | 3 (1.4%) |
| $25,000 to $34,999 | 58 (31.7%) | 13 (5.9%) |
| $35,000 to $49,999 | 32 (17.5%) | 18 (8.2%) |
| $50,000 to $74,999 | 38 (20.8%) | 6 (2.7%) |
| $75,000 to $99,999 | 1 (0.5%) | 52 (23.6%) |
| $100,000 to $149,999 | 21 (11.5%) | 92 (41.8%) |
| $150,000 or more | 5 (2.7%) | 36 (16.4%) |
| Total | 183 (100.0%) | 220 (100.0%) |
Property Value to Household Income Ratio in Gillett
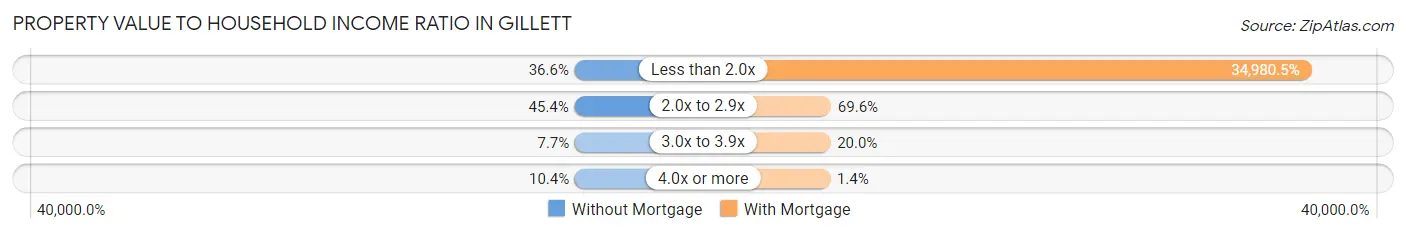
| Value-to-Income Ratio | Without Mortgage | With Mortgage |
| Less than 2.0x | 67 (36.6%) | 76,957 (34,980.5%) |
| 2.0x to 2.9x | 83 (45.4%) | 153 (69.6%) |
| 3.0x to 3.9x | 14 (7.6%) | 44 (20.0%) |
| 4.0x or more | 19 (10.4%) | 3 (1.4%) |
| Total | 183 (100.0%) | 220 (100.0%) |
Real Estate Taxes by Mortgage Status in Gillett
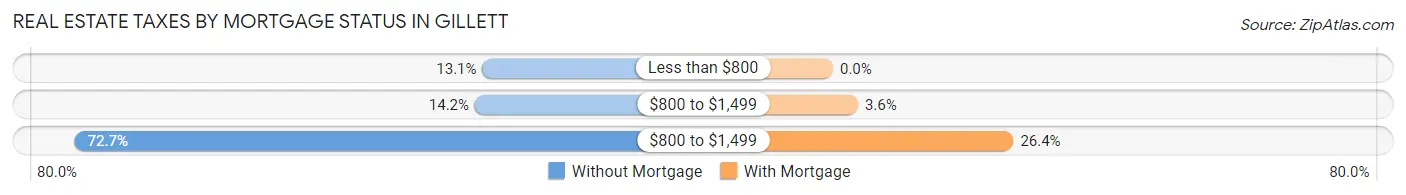
| Property Taxes | Without Mortgage | With Mortgage |
| Less than $800 | 24 (13.1%) | 0 (0.0%) |
| $800 to $1,499 | 26 (14.2%) | 8 (3.6%) |
| $800 to $1,499 | 133 (72.7%) | 58 (26.4%) |
| Total | 183 (100.0%) | 220 (100.0%) |
Health & Disability in Gillett
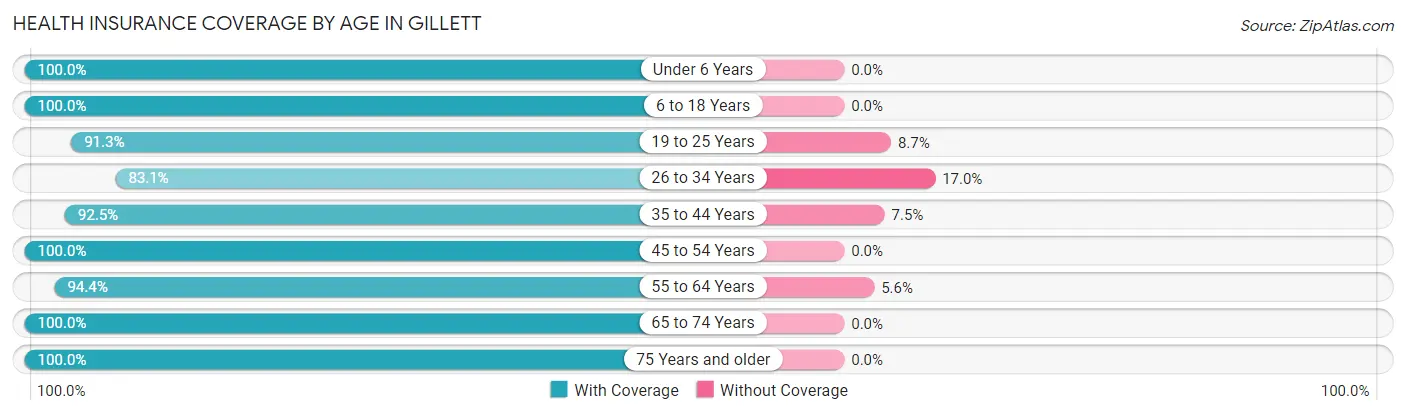
Health Insurance Coverage by Age in Gillett
| Age Bracket | With Coverage | Without Coverage |
| Under 6 Years | 106 (100.0%) | 0 (0.0%) |
| 6 to 18 Years | 265 (100.0%) | 0 (0.0%) |
| 19 to 25 Years | 126 (91.3%) | 12 (8.7%) |
| 26 to 34 Years | 147 (83.1%) | 30 (17.0%) |
| 35 to 44 Years | 123 (92.5%) | 10 (7.5%) |
| 45 to 54 Years | 92 (100.0%) | 0 (0.0%) |
| 55 to 64 Years | 220 (94.4%) | 13 (5.6%) |
| 65 to 74 Years | 71 (100.0%) | 0 (0.0%) |
| 75 Years and older | 76 (100.0%) | 0 (0.0%) |
| Total | 1,226 (95.0%) | 65 (5.0%) |
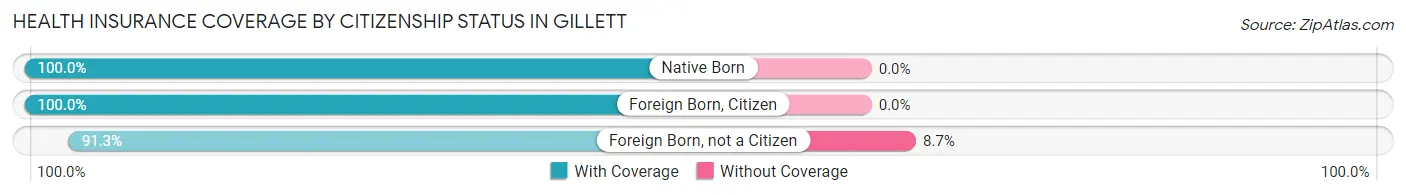
Health Insurance Coverage by Citizenship Status in Gillett
| Citizenship Status | With Coverage | Without Coverage |
| Native Born | 106 (100.0%) | 0 (0.0%) |
| Foreign Born, Citizen | 265 (100.0%) | 0 (0.0%) |
| Foreign Born, not a Citizen | 126 (91.3%) | 12 (8.7%) |
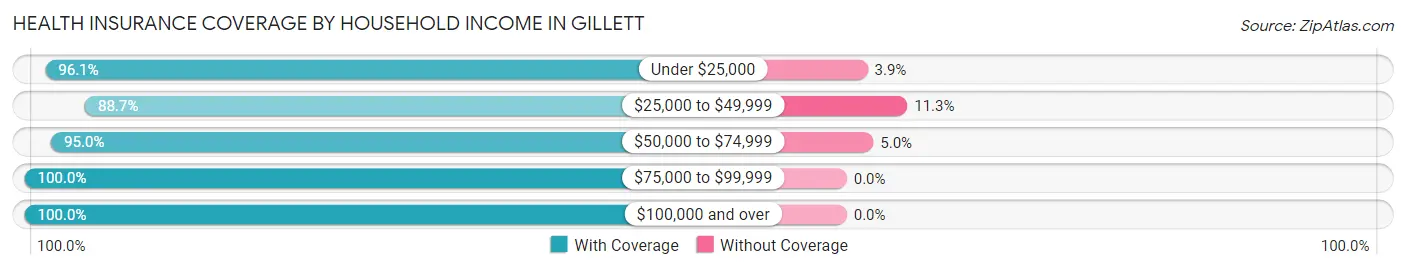
Health Insurance Coverage by Household Income in Gillett
| Household Income | With Coverage | Without Coverage |
| Under $25,000 | 148 (96.1%) | 6 (3.9%) |
| $25,000 to $49,999 | 344 (88.7%) | 44 (11.3%) |
| $50,000 to $74,999 | 287 (95.0%) | 15 (5.0%) |
| $75,000 to $99,999 | 289 (100.0%) | 0 (0.0%) |
| $100,000 and over | 158 (100.0%) | 0 (0.0%) |
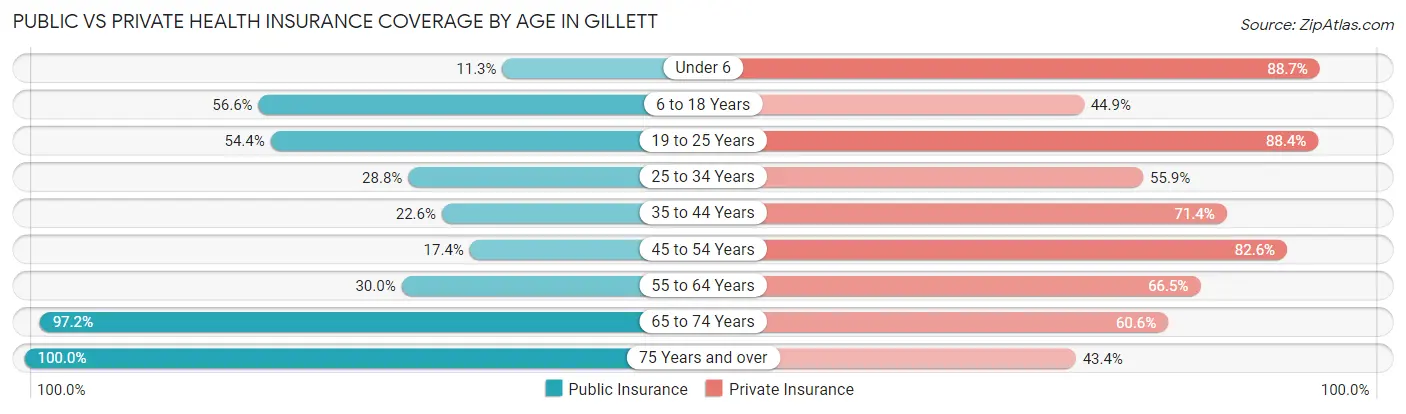
Public vs Private Health Insurance Coverage by Age in Gillett
| Age Bracket | Public Insurance | Private Insurance |
| Under 6 | 12 (11.3%) | 94 (88.7%) |
| 6 to 18 Years | 150 (56.6%) | 119 (44.9%) |
| 19 to 25 Years | 75 (54.3%) | 122 (88.4%) |
| 25 to 34 Years | 51 (28.8%) | 99 (55.9%) |
| 35 to 44 Years | 30 (22.6%) | 95 (71.4%) |
| 45 to 54 Years | 16 (17.4%) | 76 (82.6%) |
| 55 to 64 Years | 70 (30.0%) | 155 (66.5%) |
| 65 to 74 Years | 69 (97.2%) | 43 (60.6%) |
| 75 Years and over | 76 (100.0%) | 33 (43.4%) |
| Total | 549 (42.5%) | 836 (64.8%) |
Disability Status by Sex by Age in Gillett
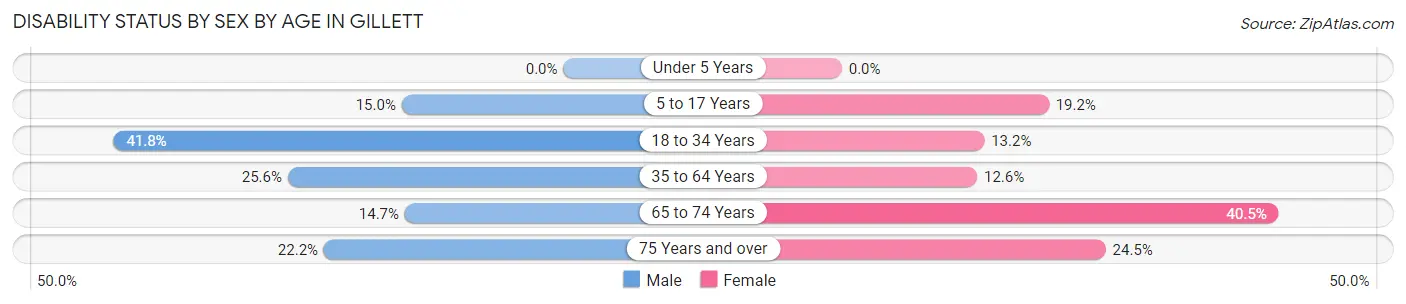
| Age Bracket | Male | Female |
| Under 5 Years | 0 (0.0%) | 0 (0.0%) |
| 5 to 17 Years | 21 (15.0%) | 24 (19.2%) |
| 18 to 34 Years | 81 (41.7%) | 16 (13.2%) |
| 35 to 64 Years | 56 (25.6%) | 30 (12.6%) |
| 65 to 74 Years | 5 (14.7%) | 15 (40.5%) |
| 75 Years and over | 6 (22.2%) | 12 (24.5%) |
Disability Class by Sex by Age in Gillett
Disability Class: Hearing Difficulty
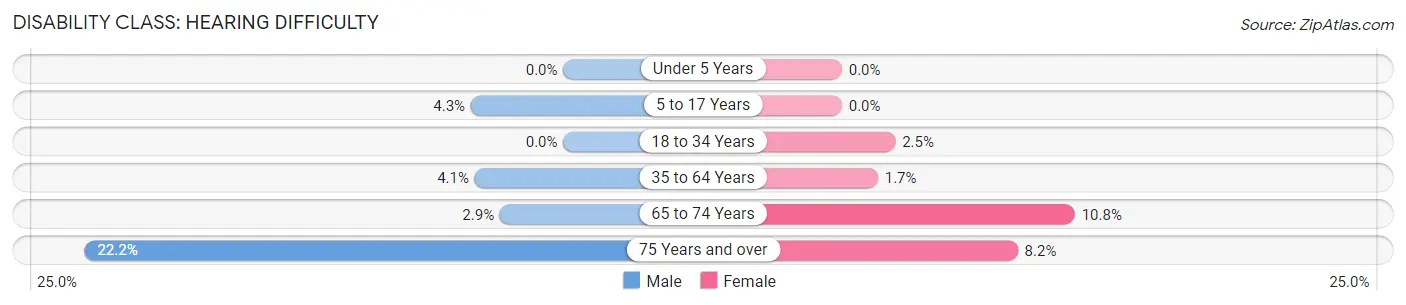
| Age Bracket | Male | Female |
| Under 5 Years | 0 (0.0%) | 0 (0.0%) |
| 5 to 17 Years | 6 (4.3%) | 0 (0.0%) |
| 18 to 34 Years | 0 (0.0%) | 3 (2.5%) |
| 35 to 64 Years | 9 (4.1%) | 4 (1.7%) |
| 65 to 74 Years | 1 (2.9%) | 4 (10.8%) |
| 75 Years and over | 6 (22.2%) | 4 (8.2%) |
Disability Class: Vision Difficulty
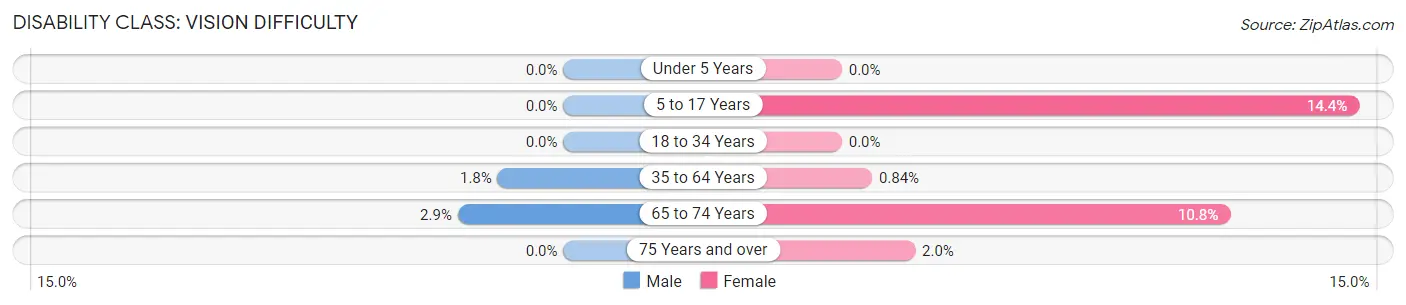
| Age Bracket | Male | Female |
| Under 5 Years | 0 (0.0%) | 0 (0.0%) |
| 5 to 17 Years | 0 (0.0%) | 18 (14.4%) |
| 18 to 34 Years | 0 (0.0%) | 0 (0.0%) |
| 35 to 64 Years | 4 (1.8%) | 2 (0.8%) |
| 65 to 74 Years | 1 (2.9%) | 4 (10.8%) |
| 75 Years and over | 0 (0.0%) | 1 (2.0%) |
Disability Class: Cognitive Difficulty
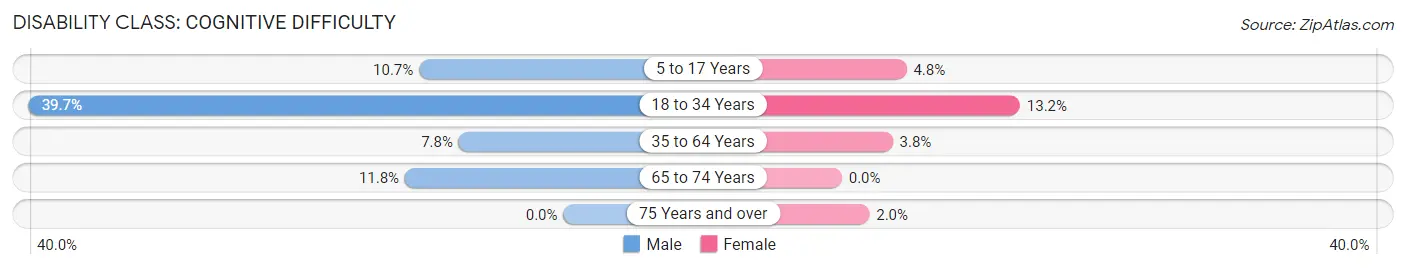
| Age Bracket | Male | Female |
| 5 to 17 Years | 15 (10.7%) | 6 (4.8%) |
| 18 to 34 Years | 77 (39.7%) | 16 (13.2%) |
| 35 to 64 Years | 17 (7.8%) | 9 (3.8%) |
| 65 to 74 Years | 4 (11.8%) | 0 (0.0%) |
| 75 Years and over | 0 (0.0%) | 1 (2.0%) |
Disability Class: Ambulatory Difficulty
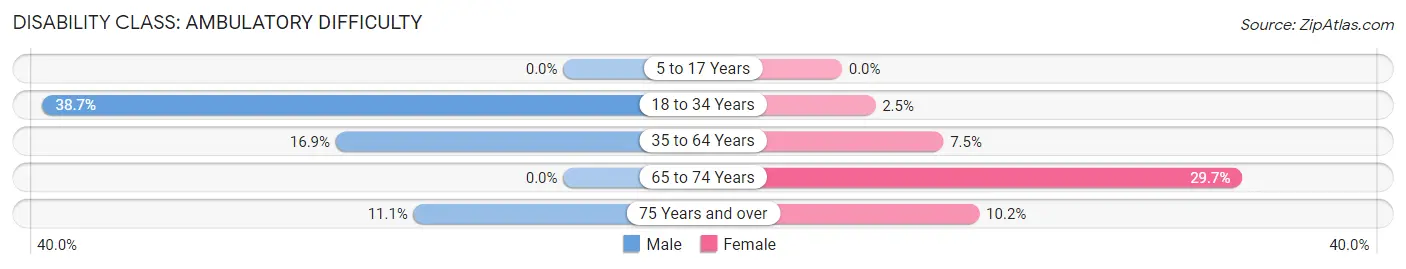
| Age Bracket | Male | Female |
| 5 to 17 Years | 0 (0.0%) | 0 (0.0%) |
| 18 to 34 Years | 75 (38.7%) | 3 (2.5%) |
| 35 to 64 Years | 37 (16.9%) | 18 (7.5%) |
| 65 to 74 Years | 0 (0.0%) | 11 (29.7%) |
| 75 Years and over | 3 (11.1%) | 5 (10.2%) |
Disability Class: Self-Care Difficulty
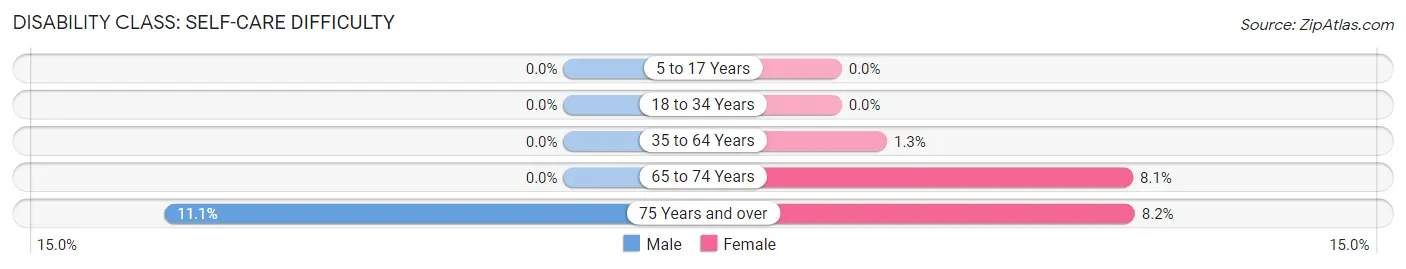
| Age Bracket | Male | Female |
| 5 to 17 Years | 0 (0.0%) | 0 (0.0%) |
| 18 to 34 Years | 0 (0.0%) | 0 (0.0%) |
| 35 to 64 Years | 0 (0.0%) | 3 (1.3%) |
| 65 to 74 Years | 0 (0.0%) | 3 (8.1%) |
| 75 Years and over | 3 (11.1%) | 4 (8.2%) |
Technology Access in Gillett
Computing Device Access in Gillett
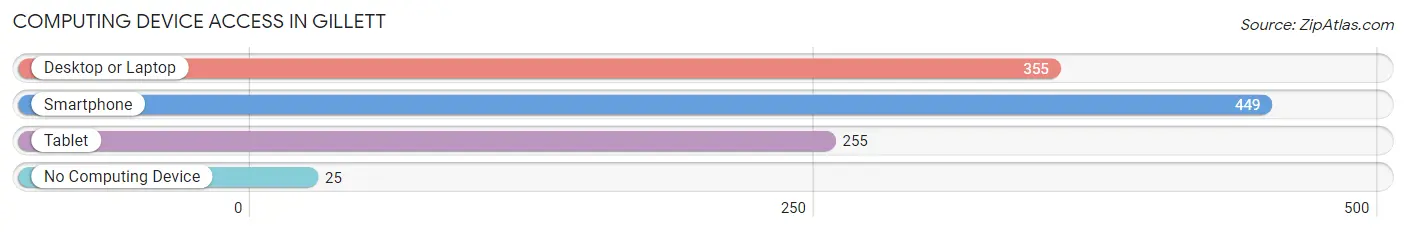
| Device Type | # Households | % Households |
| Desktop or Laptop | 355 | 67.5% |
| Smartphone | 449 | 85.4% |
| Tablet | 255 | 48.5% |
| No Computing Device | 25 | 4.8% |
| Total | 526 | 100.0% |
Internet Access in Gillett
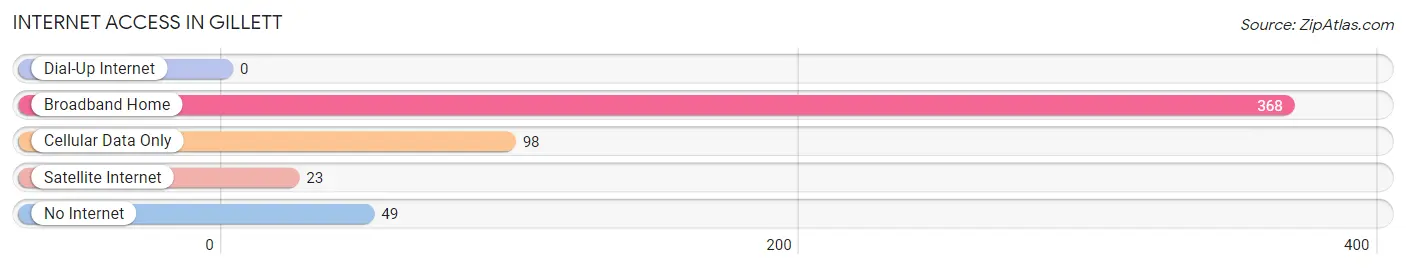
| Internet Type | # Households | % Households |
| Dial-Up Internet | 0 | 0.0% |
| Broadband Home | 368 | 70.0% |
| Cellular Data Only | 98 | 18.6% |
| Satellite Internet | 23 | 4.4% |
| No Internet | 49 | 9.3% |
| Total | 526 | 100.0% |
Gillett Summary
Gillett, Wisconsin is a small city located in Oconto County, Wisconsin. It is situated on the banks of the Oconto River, and is part of the Green Bay Metropolitan Statistical Area. The city has a population of 1,845 as of the 2010 census, and is the county seat of Oconto County.
History
Gillett was founded in 1872 by William Gillett, a lumberman from Maine. He purchased land along the Oconto River and built a sawmill, which became the center of the town. The town was incorporated in 1883, and the first mayor was William Gillett.
The town grew rapidly in the late 19th century, and by the early 20th century, it had become a major lumbering center. The lumber industry was the main source of employment for the town, and it was also a major shipping point for the region.
In the early 20th century, Gillett also became a center for the dairy industry. The town was home to several cheese factories, and it was also the site of the first cheese factory in the state of Wisconsin.
Geography
Gillett is located in Oconto County, Wisconsin, at the intersection of US Highway 45 and Wisconsin Highway 32. The city is situated on the banks of the Oconto River, and is part of the Green Bay Metropolitan Statistical Area.
The city has a total area of 2.2 square miles, all of which is land. The terrain is mostly flat, with some rolling hills in the area.
Economy
The economy of Gillett is largely based on agriculture and tourism. The city is home to several dairy farms, and it is also a popular destination for outdoor recreation.
The city is home to several small businesses, including restaurants, retail stores, and service providers. The city is also home to a number of manufacturing companies, including a paper mill and a wood products plant.
Demographics
As of the 2010 census, the population of Gillett was 1,845. The racial makeup of the city was 97.2% White, 0.3% African American, 0.3% Native American, 0.3% Asian, 0.2% from other races, and 1.9% from two or more races. Hispanic or Latino of any race were 1.2% of the population.
The median household income in Gillett was $41,250, and the median family income was $50,000. The per capita income for the city was $20,845. About 11.2% of families and 14.2% of the population were below the poverty line, including 18.2% of those under age 18 and 8.3% of those age 65 or over.
The population of Gillett is largely made up of people of German, Irish, and Polish descent. The city is also home to a small Native American population. The city is served by the Gillett School District, which includes two elementary schools, one middle school, and one high school.
Common Questions
What is Per Capita Income in Gillett?
Per Capita income in Gillett is $23,079.
What is the Median Family Income in Gillett?
Median Family Income in Gillett is $52,500.
What is the Median Household income in Gillett?
Median Household Income in Gillett is $51,944.
What is Income or Wage Gap in Gillett?
Income or Wage Gap in Gillett is 41.6%.
Women in Gillett earn 58.4 cents for every dollar earned by a man.
What is Inequality or Gini Index in Gillett?
Inequality or Gini Index in Gillett is 0.34.
What is the Total Population of Gillett?
Total Population of Gillett is 1,324.
What is the Total Male Population of Gillett?
Total Male Population of Gillett is 662.
What is the Total Female Population of Gillett?
Total Female Population of Gillett is 662.
What is the Ratio of Males per 100 Females in Gillett?
There are 100.00 Males per 100 Females in Gillett.
What is the Ratio of Females per 100 Males in Gillett?
There are 100.00 Females per 100 Males in Gillett.
What is the Median Population Age in Gillett?
Median Population Age in Gillett is 33.9 Years.
What is the Average Family Size in Gillett
Average Family Size in Gillett is 2.9 People.
What is the Average Household Size in Gillett
Average Household Size in Gillett is 2.5 People.
How Large is the Labor Force in Gillett?
There are 656 People in the Labor Forcein in Gillett.
What is the Percentage of People in the Labor Force in Gillett?
66.5% of People are in the Labor Force in Gillett.
What is the Unemployment Rate in Gillett?
Unemployment Rate in Gillett is 3.5%.