Francis Creek, WI Map & Demographics
Francis Creek Map
Francis Creek Overview
$35,028
PER CAPITA INCOME
$93,494
AVG FAMILY INCOME
$81,667
AVG HOUSEHOLD INCOME
43.4%
WAGE / INCOME GAP [ % ]
56.6¢/ $1
WAGE / INCOME GAP [ $ ]
0.39
INEQUALITY / GINI INDEX
687
TOTAL POPULATION
285
MALE POPULATION
402
FEMALE POPULATION
70.90
MALES / 100 FEMALES
141.05
FEMALES / 100 MALES
57.3
MEDIAN AGE
2.1
AVG FAMILY SIZE
1.8
AVG HOUSEHOLD SIZE
258
LABOR FORCE [ PEOPLE ]
44.9%
PERCENT IN LABOR FORCE
1.2%
UNEMPLOYMENT RATE
Francis Creek Zip Codes
Francis Creek Area Codes
Income in Francis Creek
Income Overview in Francis Creek
Per Capita Income in Francis Creek is $35,028, while median incomes of families and households are $93,494 and $81,667 respectively.
| Characteristic | Number | Measure |
| Per Capita Income | 687 | $35,028 |
| Median Family Income | 246 | $93,494 |
| Mean Family Income | 246 | $95,917 |
| Median Household Income | 384 | $81,667 |
| Mean Household Income | 384 | $77,716 |
| Income Deficit | 246 | $0 |
| Wage / Income Gap (%) | 687 | 43.40% |
| Wage / Income Gap ($) | 687 | 56.60¢ per $1 |
| Gini / Inequality Index | 687 | 0.39 |
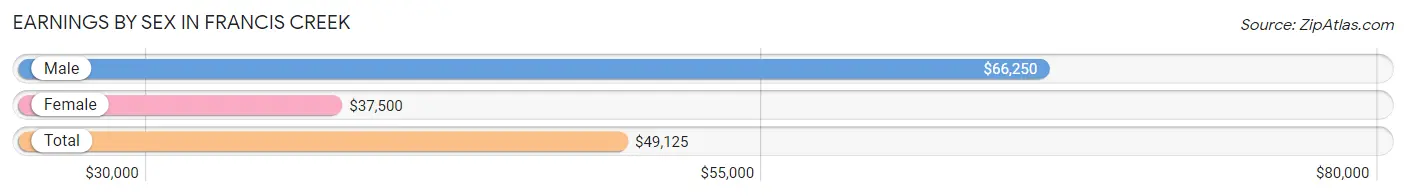
Earnings by Sex in Francis Creek
Average Earnings in Francis Creek are $49,125, $66,250 for men and $37,500 for women, a difference of 43.4%.
| Sex | Number | Average Earnings |
| Male | 125 (45.1%) | $66,250 |
| Female | 152 (54.9%) | $37,500 |
| Total | 277 (100.0%) | $49,125 |
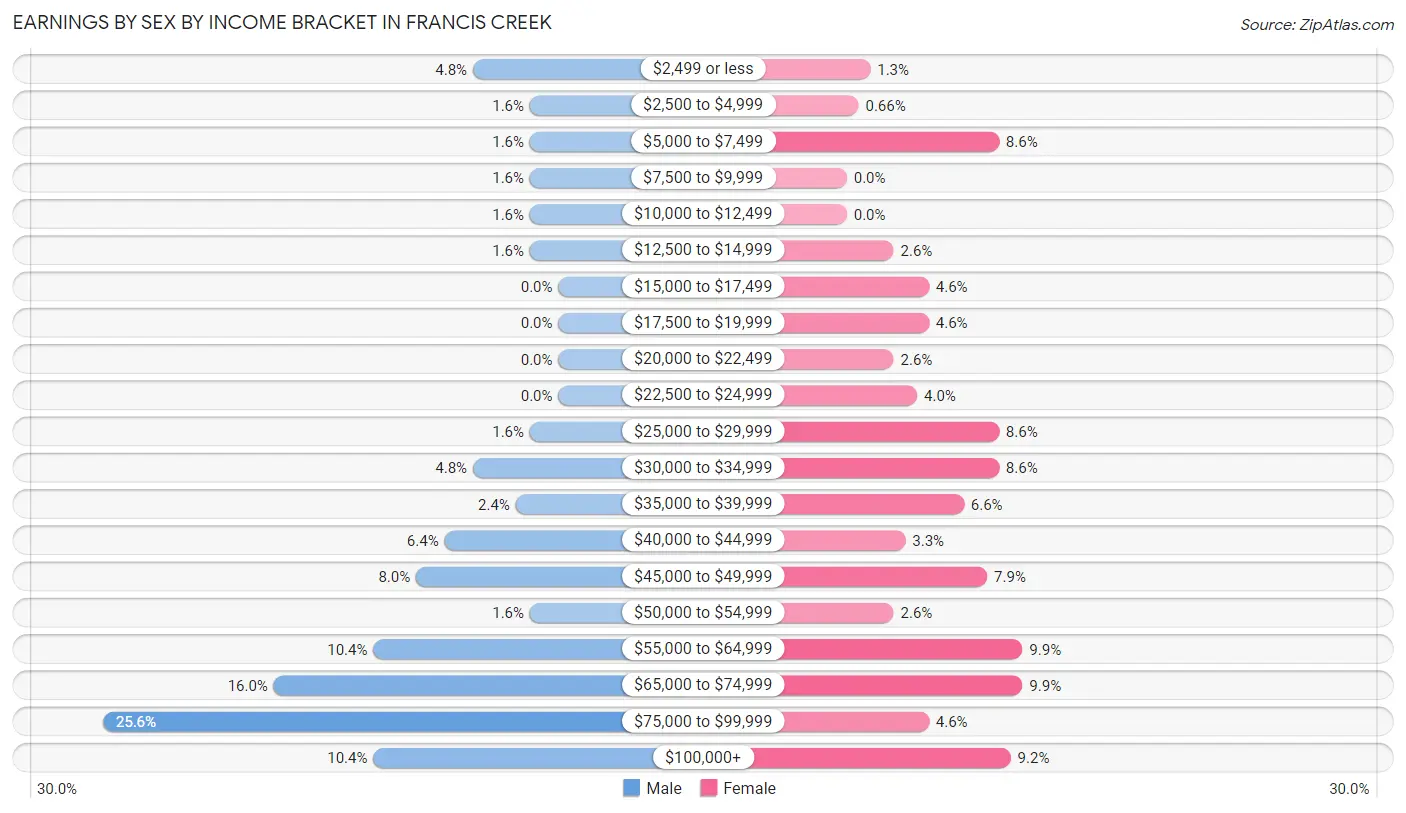
Earnings by Sex by Income Bracket in Francis Creek
The most common earnings brackets in Francis Creek are $75,000 to $99,999 for men (32 | 25.6%) and $55,000 to $64,999 for women (15 | 9.9%).
| Income | Male | Female |
| $2,499 or less | 6 (4.8%) | 2 (1.3%) |
| $2,500 to $4,999 | 2 (1.6%) | 1 (0.7%) |
| $5,000 to $7,499 | 2 (1.6%) | 13 (8.6%) |
| $7,500 to $9,999 | 2 (1.6%) | 0 (0.0%) |
| $10,000 to $12,499 | 2 (1.6%) | 0 (0.0%) |
| $12,500 to $14,999 | 2 (1.6%) | 4 (2.6%) |
| $15,000 to $17,499 | 0 (0.0%) | 7 (4.6%) |
| $17,500 to $19,999 | 0 (0.0%) | 7 (4.6%) |
| $20,000 to $22,499 | 0 (0.0%) | 4 (2.6%) |
| $22,500 to $24,999 | 0 (0.0%) | 6 (4.0%) |
| $25,000 to $29,999 | 2 (1.6%) | 13 (8.6%) |
| $30,000 to $34,999 | 6 (4.8%) | 13 (8.6%) |
| $35,000 to $39,999 | 3 (2.4%) | 10 (6.6%) |
| $40,000 to $44,999 | 8 (6.4%) | 5 (3.3%) |
| $45,000 to $49,999 | 10 (8.0%) | 12 (7.9%) |
| $50,000 to $54,999 | 2 (1.6%) | 4 (2.6%) |
| $55,000 to $64,999 | 13 (10.4%) | 15 (9.9%) |
| $65,000 to $74,999 | 20 (16.0%) | 15 (9.9%) |
| $75,000 to $99,999 | 32 (25.6%) | 7 (4.6%) |
| $100,000+ | 13 (10.4%) | 14 (9.2%) |
| Total | 125 (100.0%) | 152 (100.0%) |
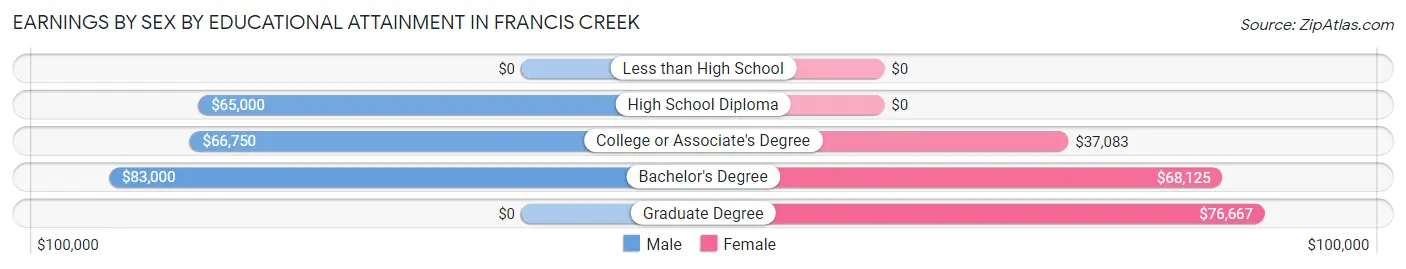
Earnings by Sex by Educational Attainment in Francis Creek
Average earnings in Francis Creek are $71,094 for men and $44,000 for women, a difference of 38.1%. Men with an educational attainment of bachelor's degree enjoy the highest average annual earnings of $83,000, while those with high school diploma education earn the least with $65,000. Women with an educational attainment of graduate degree earn the most with the average annual earnings of $76,667, while those with college or associate's degree education have the smallest earnings of $37,083.
| Educational Attainment | Male Income | Female Income |
| Less than High School | - | - |
| High School Diploma | $65,000 | $0 |
| College or Associate's Degree | $66,750 | $37,083 |
| Bachelor's Degree | $83,000 | $68,125 |
| Graduate Degree | - | - |
| Total | $71,094 | $44,000 |
Family Income in Francis Creek
Family Income Brackets in Francis Creek
According to the Francis Creek family income data, there are 113 families falling into the $75,000 to $99,999 income range, which is the most common income bracket and makes up 45.9% of all families.
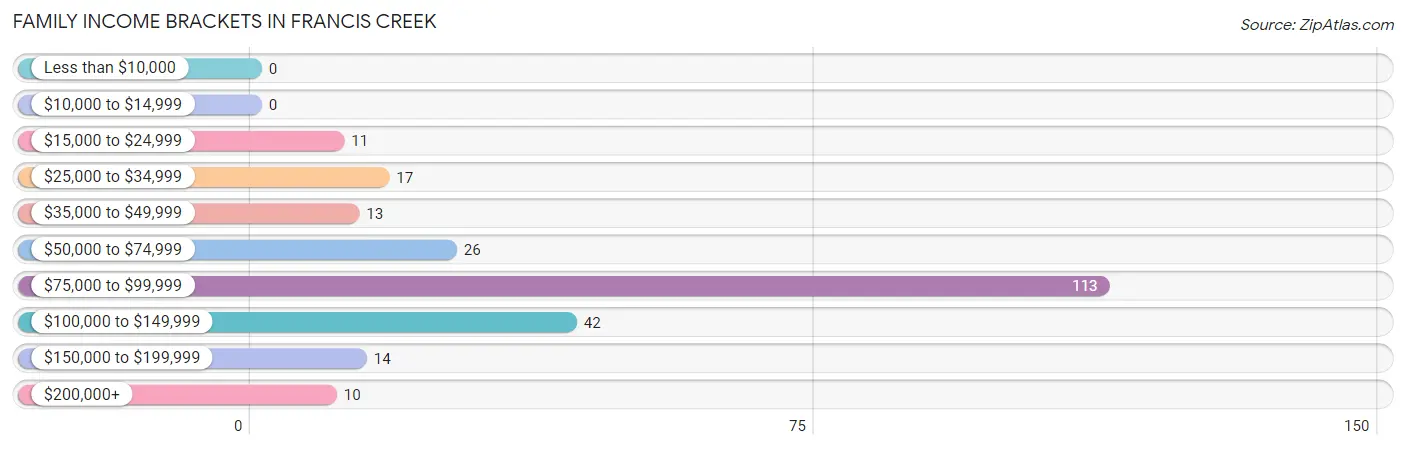
| Income Bracket | # Families | % Families |
| Less than $10,000 | 0 | 0.0% |
| $10,000 to $14,999 | 0 | 0.0% |
| $15,000 to $24,999 | 11 | 4.5% |
| $25,000 to $34,999 | 17 | 6.9% |
| $35,000 to $49,999 | 13 | 5.3% |
| $50,000 to $74,999 | 26 | 10.6% |
| $75,000 to $99,999 | 113 | 45.9% |
| $100,000 to $149,999 | 42 | 17.1% |
| $150,000 to $199,999 | 14 | 5.7% |
| $200,000+ | 10 | 4.1% |
Family Income by Famaliy Size in Francis Creek
4-person families (33 | 13.4%) account for the highest median family income in Francis Creek with $124,375 per family, while 2-person families (179 | 72.8%) have the highest median income of $46,577 per family member.
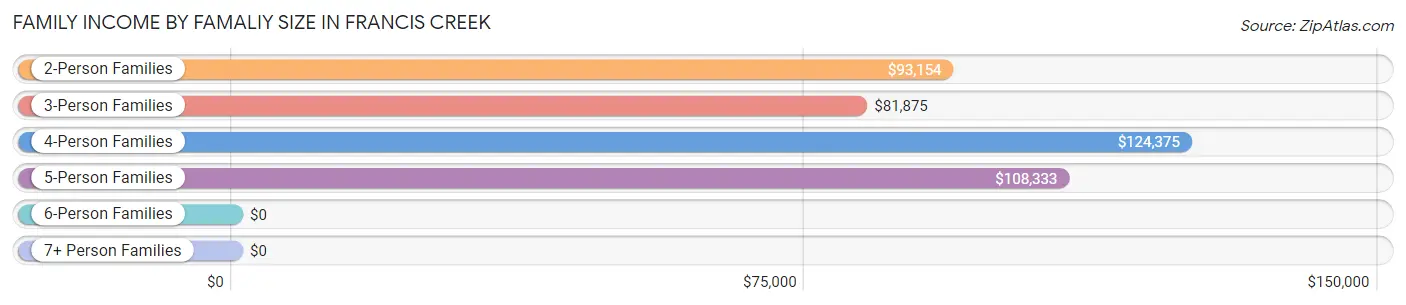
| Income Bracket | # Families | Median Income |
| 2-Person Families | 179 (72.8%) | $93,154 |
| 3-Person Families | 23 (9.3%) | $81,875 |
| 4-Person Families | 33 (13.4%) | $124,375 |
| 5-Person Families | 10 (4.1%) | $108,333 |
| 6-Person Families | 0 (0.0%) | $0 |
| 7+ Person Families | 1 (0.4%) | $0 |
| Total | 246 (100.0%) | $93,494 |
Family Income by Number of Earners in Francis Creek
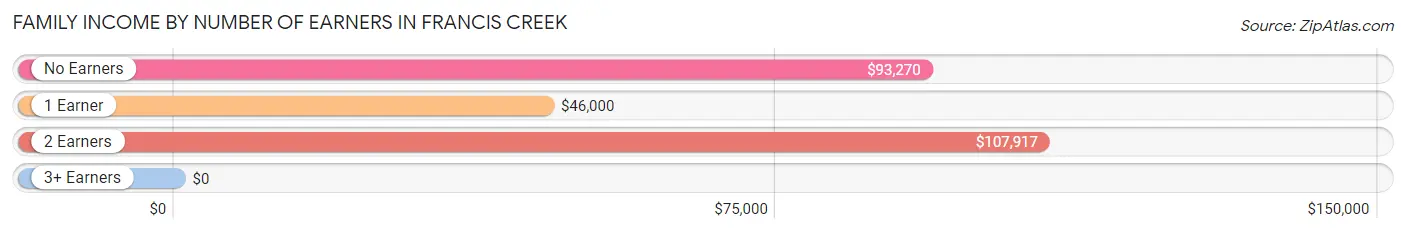
| Number of Earners | # Families | Median Income |
| No Earners | 125 (50.8%) | $93,270 |
| 1 Earner | 32 (13.0%) | $46,000 |
| 2 Earners | 79 (32.1%) | $107,917 |
| 3+ Earners | 10 (4.1%) | $0 |
| Total | 246 (100.0%) | $93,494 |
Household Income in Francis Creek
Household Income Brackets in Francis Creek
With 120 households falling in the category, the $75,000 to $99,999 income range is the most frequent in Francis Creek, accounting for 31.2% of all households. In contrast, only 7 households (1.8%) fall into the $10,000 to $14,999 income bracket, making it the least populous group.
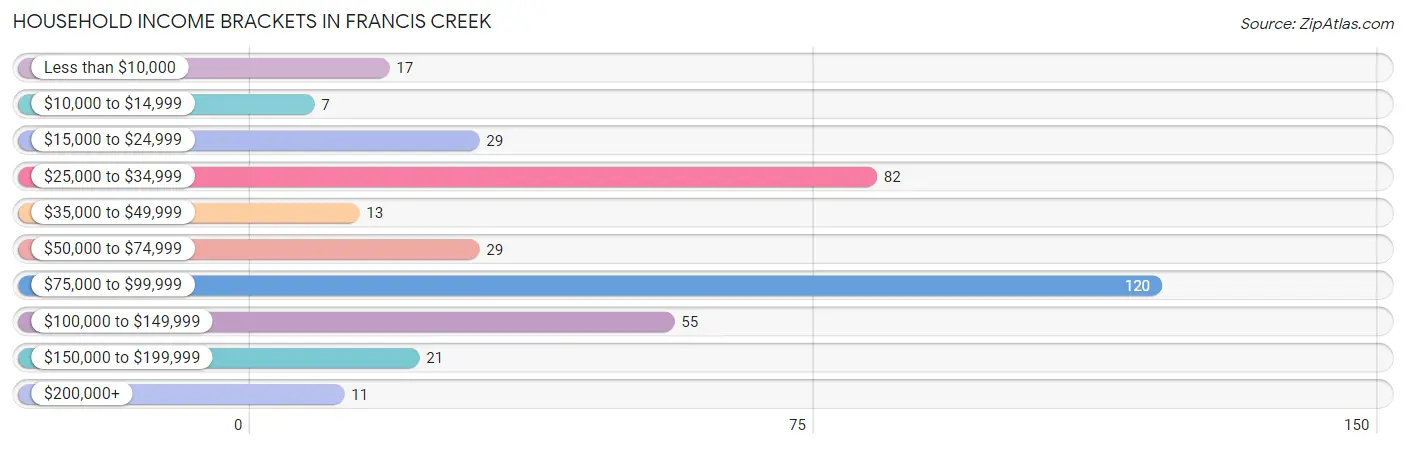
| Income Bracket | # Households | % Households |
| Less than $10,000 | 17 | 4.4% |
| $10,000 to $14,999 | 7 | 1.8% |
| $15,000 to $24,999 | 29 | 7.6% |
| $25,000 to $34,999 | 82 | 21.4% |
| $35,000 to $49,999 | 13 | 3.4% |
| $50,000 to $74,999 | 29 | 7.6% |
| $75,000 to $99,999 | 120 | 31.3% |
| $100,000 to $149,999 | 55 | 14.3% |
| $150,000 to $199,999 | 21 | 5.5% |
| $200,000+ | 11 | 2.9% |
Household Income by Householder Age in Francis Creek
The median household income in Francis Creek is $81,667, with the highest median household income of $103,611 found in the 25 to 44 years age bracket for the primary householder. A total of 70 households (18.2%) fall into this category. Meanwhile, the 15 to 24 years age bracket for the primary householder has the lowest median household income of $0, with 10 households (2.6%) in this group.
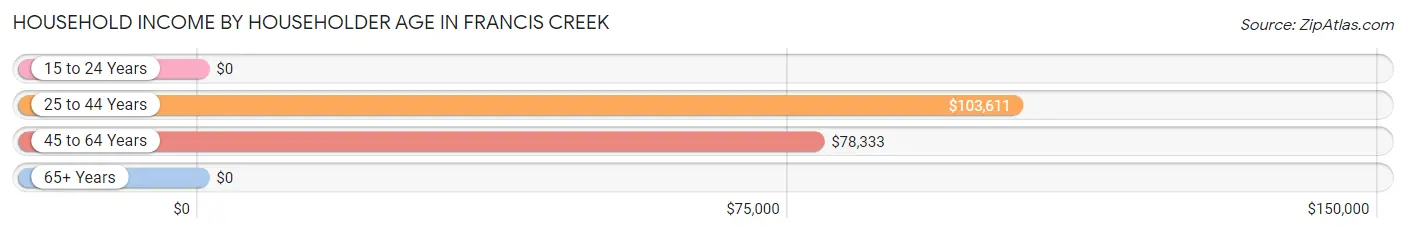
| Income Bracket | # Households | Median Income |
| 15 to 24 Years | 10 (2.6%) | $0 |
| 25 to 44 Years | 70 (18.2%) | $103,611 |
| 45 to 64 Years | 88 (22.9%) | $78,333 |
| 65+ Years | 216 (56.2%) | $0 |
| Total | 384 (100.0%) | $81,667 |
Poverty in Francis Creek
Income Below Poverty by Sex and Age in Francis Creek
With 6.0% poverty level for males and 7.2% for females among the residents of Francis Creek, 15 year old males and 18 to 24 year old females are the most vulnerable to poverty, with 5 males (38.5%) and 4 females (28.6%) in their respective age groups living below the poverty level.
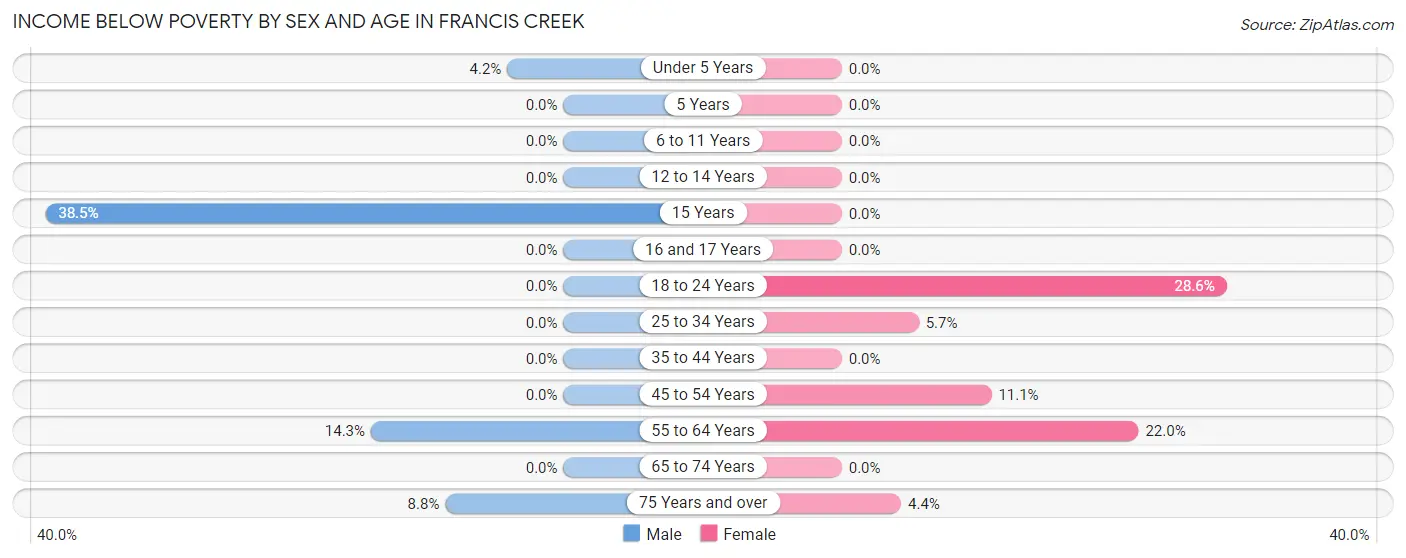
| Age Bracket | Male | Female |
| Under 5 Years | 1 (4.2%) | 0 (0.0%) |
| 5 Years | 0 (0.0%) | 0 (0.0%) |
| 6 to 11 Years | 0 (0.0%) | 0 (0.0%) |
| 12 to 14 Years | 0 (0.0%) | 0 (0.0%) |
| 15 Years | 5 (38.5%) | 0 (0.0%) |
| 16 and 17 Years | 0 (0.0%) | 0 (0.0%) |
| 18 to 24 Years | 0 (0.0%) | 4 (28.6%) |
| 25 to 34 Years | 0 (0.0%) | 2 (5.7%) |
| 35 to 44 Years | 0 (0.0%) | 0 (0.0%) |
| 45 to 54 Years | 0 (0.0%) | 2 (11.1%) |
| 55 to 64 Years | 6 (14.3%) | 13 (22.0%) |
| 65 to 74 Years | 0 (0.0%) | 0 (0.0%) |
| 75 Years and over | 5 (8.8%) | 7 (4.4%) |
| Total | 17 (6.0%) | 28 (7.2%) |
Income Above Poverty by Sex and Age in Francis Creek
According to the poverty statistics in Francis Creek, males aged 5 years and females aged under 5 years are the age groups that are most secure financially, with 100.0% of males and 100.0% of females in these age groups living above the poverty line.
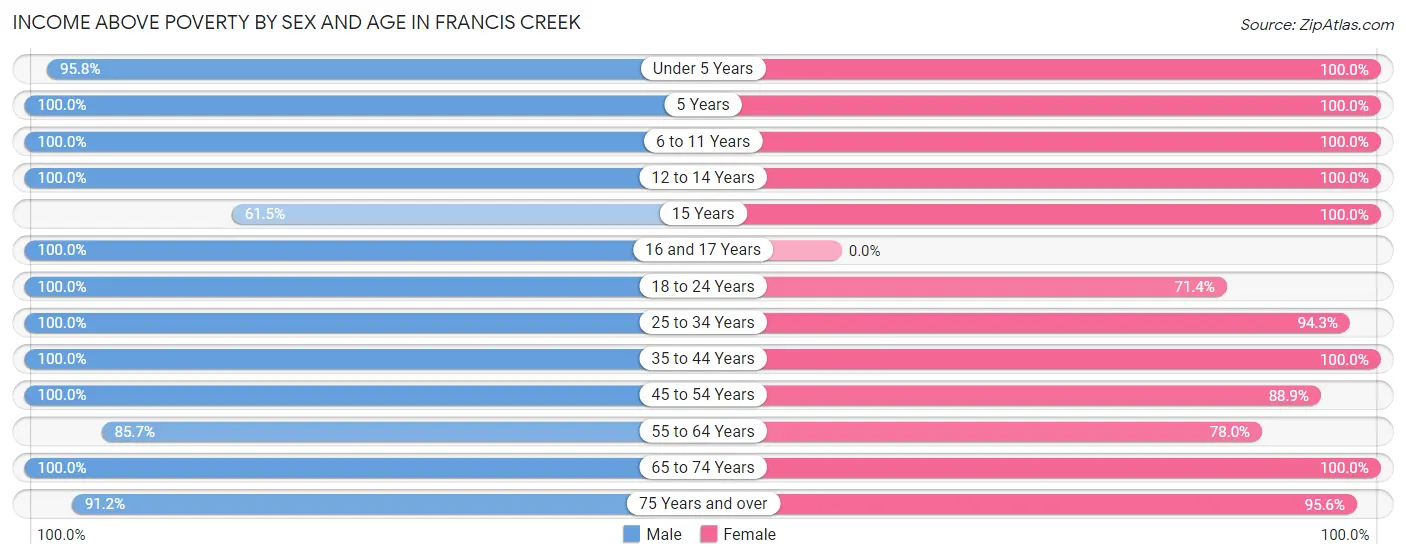
| Age Bracket | Male | Female |
| Under 5 Years | 23 (95.8%) | 12 (100.0%) |
| 5 Years | 2 (100.0%) | 2 (100.0%) |
| 6 to 11 Years | 12 (100.0%) | 14 (100.0%) |
| 12 to 14 Years | 6 (100.0%) | 13 (100.0%) |
| 15 Years | 8 (61.5%) | 2 (100.0%) |
| 16 and 17 Years | 9 (100.0%) | 0 (0.0%) |
| 18 to 24 Years | 10 (100.0%) | 10 (71.4%) |
| 25 to 34 Years | 27 (100.0%) | 33 (94.3%) |
| 35 to 44 Years | 29 (100.0%) | 38 (100.0%) |
| 45 to 54 Years | 30 (100.0%) | 16 (88.9%) |
| 55 to 64 Years | 36 (85.7%) | 46 (78.0%) |
| 65 to 74 Years | 24 (100.0%) | 24 (100.0%) |
| 75 Years and over | 52 (91.2%) | 152 (95.6%) |
| Total | 268 (94.0%) | 362 (92.8%) |
Income Below Poverty Among Married-Couple Families in Francis Creek
The poverty statistics for married-couple families in Francis Creek show that 2.2% or 5 of the total 225 families live below the poverty line. Families with no children have the highest poverty rate of 2.9%, comprising of 5 families. On the other hand, families with 1 or 2 children have the lowest poverty rate of 0.0%, which includes 0 families.
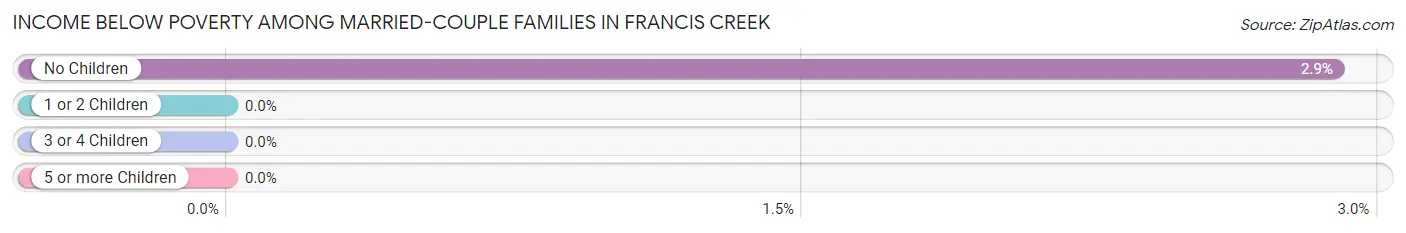
| Children | Above Poverty | Below Poverty |
| No Children | 168 (97.1%) | 5 (2.9%) |
| 1 or 2 Children | 41 (100.0%) | 0 (0.0%) |
| 3 or 4 Children | 10 (100.0%) | 0 (0.0%) |
| 5 or more Children | 1 (100.0%) | 0 (0.0%) |
| Total | 220 (97.8%) | 5 (2.2%) |
Income Below Poverty Among Single-Parent Households in Francis Creek
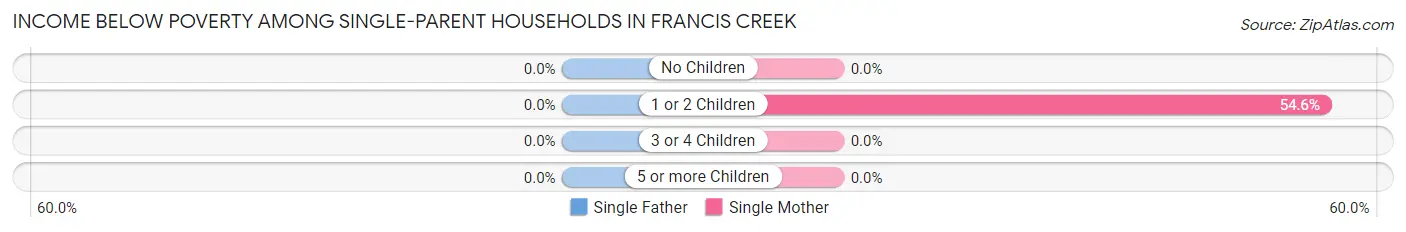
| Children | Single Father | Single Mother |
| No Children | 0 (0.0%) | 0 (0.0%) |
| 1 or 2 Children | 0 (0.0%) | 6 (54.5%) |
| 3 or 4 Children | 0 (0.0%) | 0 (0.0%) |
| 5 or more Children | 0 (0.0%) | 0 (0.0%) |
| Total | 0 (0.0%) | 6 (46.2%) |
Income Below Poverty Among Married-Couple vs Single-Parent Households in Francis Creek
The poverty data for Francis Creek shows that 5 of the married-couple family households (2.2%) and 6 of the single-parent households (28.6%) are living below the poverty level. Within the married-couple family households, those with no children have the highest poverty rate, with 5 households (2.9%) falling below the poverty line. Among the single-parent households, those with 1 or 2 children have the highest poverty rate, with 6 household (35.3%) living below poverty.
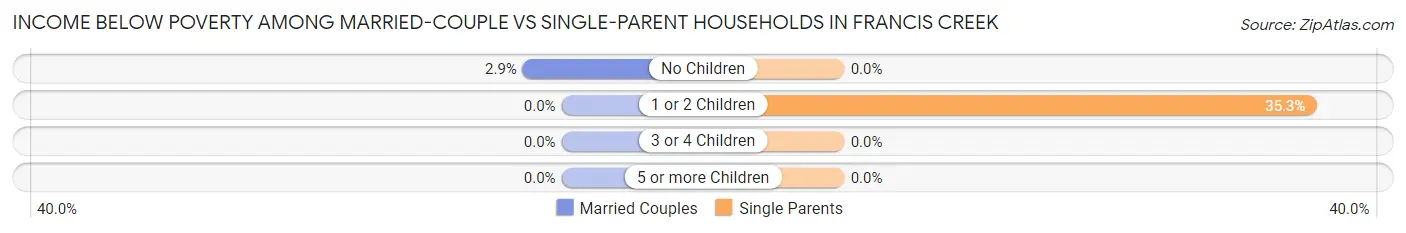
| Children | Married-Couple Families | Single-Parent Households |
| No Children | 5 (2.9%) | 0 (0.0%) |
| 1 or 2 Children | 0 (0.0%) | 6 (35.3%) |
| 3 or 4 Children | 0 (0.0%) | 0 (0.0%) |
| 5 or more Children | 0 (0.0%) | 0 (0.0%) |
| Total | 5 (2.2%) | 6 (28.6%) |
Race in Francis Creek
The most populous races in Francis Creek are White / Caucasian (665 | 96.8%), Asian (17 | 2.5%), and Hispanic or Latino (12 | 1.8%).
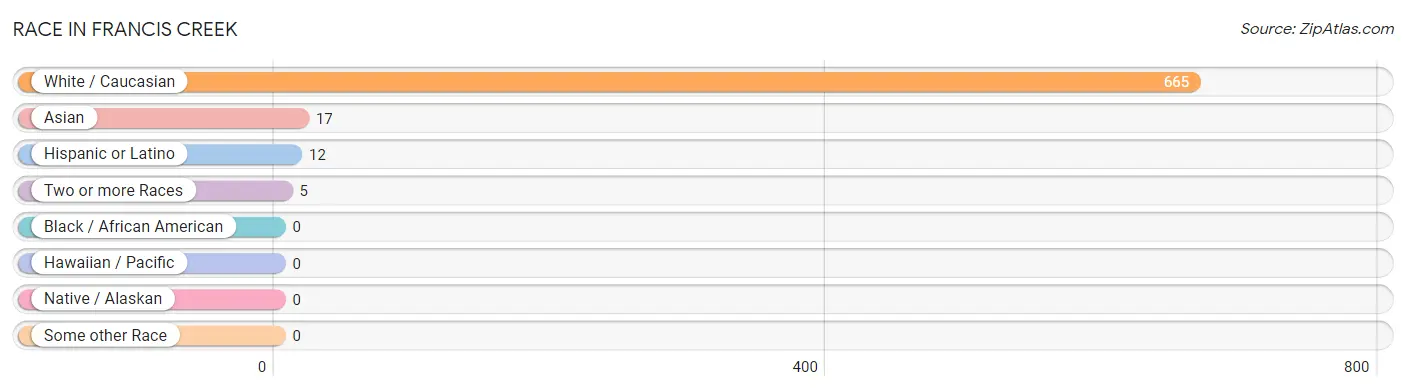
| Race | # Population | % Population |
| Asian | 17 | 2.5% |
| Black / African American | 0 | 0.0% |
| Hawaiian / Pacific | 0 | 0.0% |
| Hispanic or Latino | 12 | 1.8% |
| Native / Alaskan | 0 | 0.0% |
| White / Caucasian | 665 | 96.8% |
| Two or more Races | 5 | 0.7% |
| Some other Race | 0 | 0.0% |
| Total | 687 | 100.0% |
Ancestry in Francis Creek
The most populous ancestries reported in Francis Creek are German (360 | 52.4%), Czech (108 | 15.7%), American (58 | 8.4%), Polish (48 | 7.0%), and Irish (43 | 6.3%), together accounting for 89.8% of all Francis Creek residents.
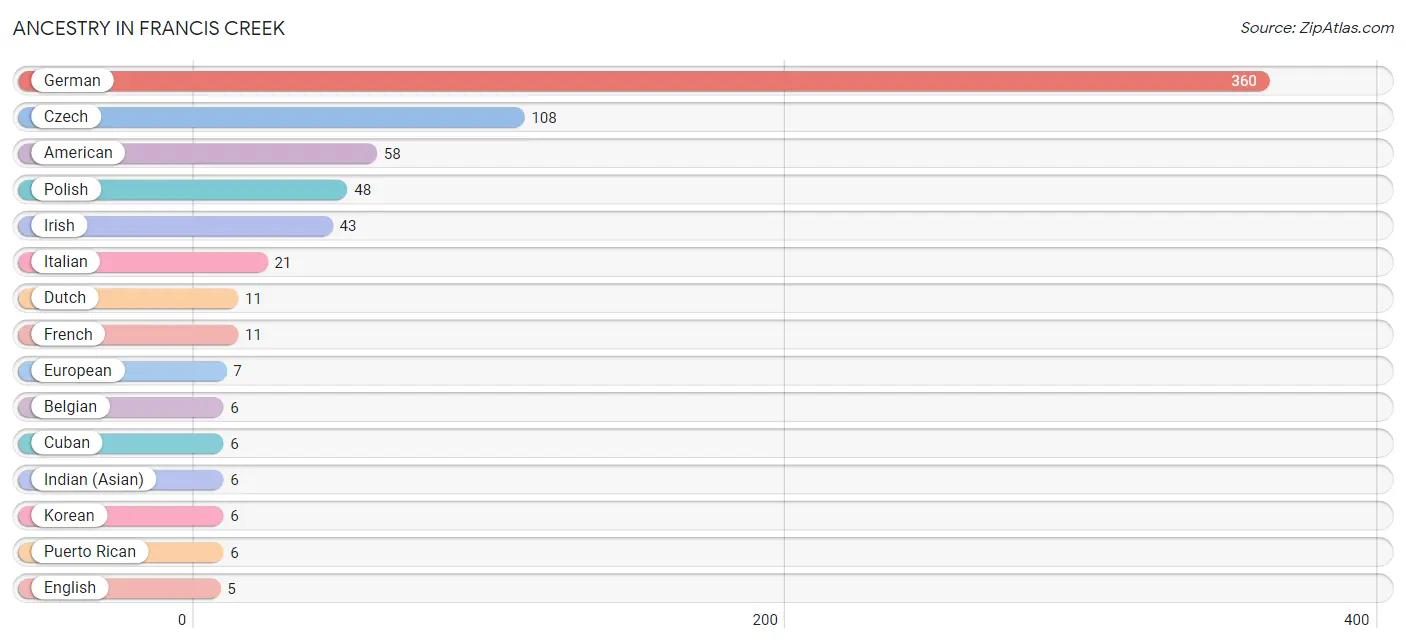
| Ancestry | # Population | % Population |
| American | 58 | 8.4% |
| Arab | 2 | 0.3% |
| Austrian | 2 | 0.3% |
| Belgian | 6 | 0.9% |
| Cuban | 6 | 0.9% |
| Czech | 108 | 15.7% |
| Czechoslovakian | 1 | 0.2% |
| Dutch | 11 | 1.6% |
| Eastern European | 3 | 0.4% |
| English | 5 | 0.7% |
| European | 7 | 1.0% |
| French | 11 | 1.6% |
| French Canadian | 4 | 0.6% |
| German | 360 | 52.4% |
| Greek | 2 | 0.3% |
| Indian (Asian) | 6 | 0.9% |
| Irish | 43 | 6.3% |
| Italian | 21 | 3.1% |
| Korean | 6 | 0.9% |
| Lebanese | 2 | 0.3% |
| Malaysian | 2 | 0.3% |
| Norwegian | 3 | 0.4% |
| Polish | 48 | 7.0% |
| Puerto Rican | 6 | 0.9% |
| Russian | 2 | 0.3% |
| Slovene | 2 | 0.3% |
| Sri Lankan | 3 | 0.4% | View All 27 Rows |
Immigrants in Francis Creek
The most numerous immigrant groups reported in Francis Creek came from Europe (4 | 0.6%), Eastern Europe (2 | 0.3%), Germany (2 | 0.3%), Hungary (2 | 0.3%), and Western Europe (2 | 0.3%), together accounting for 1.7% of all Francis Creek residents.
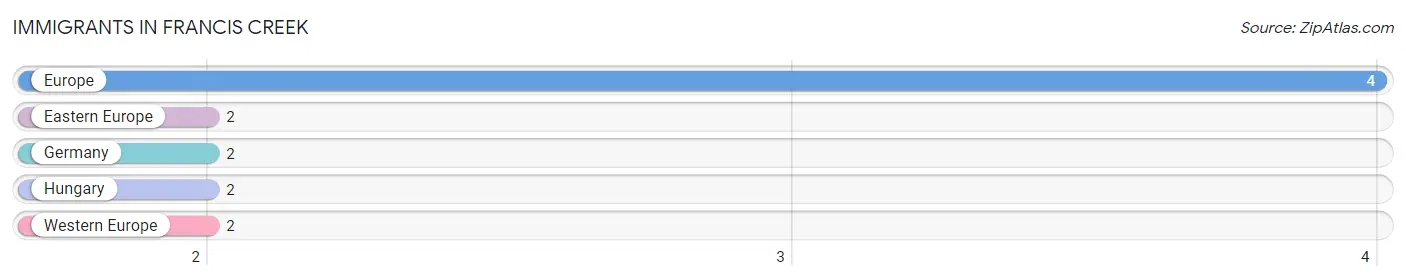
| Immigration Origin | # Population | % Population |
| Eastern Europe | 2 | 0.3% |
| Europe | 4 | 0.6% |
| Germany | 2 | 0.3% |
| Hungary | 2 | 0.3% |
| Western Europe | 2 | 0.3% | View All 5 Rows |
Sex and Age in Francis Creek
Sex and Age in Francis Creek
The most populous age groups in Francis Creek are 80 to 84 Years (38 | 13.3%) for men and 75 to 79 Years (103 | 25.6%) for women.
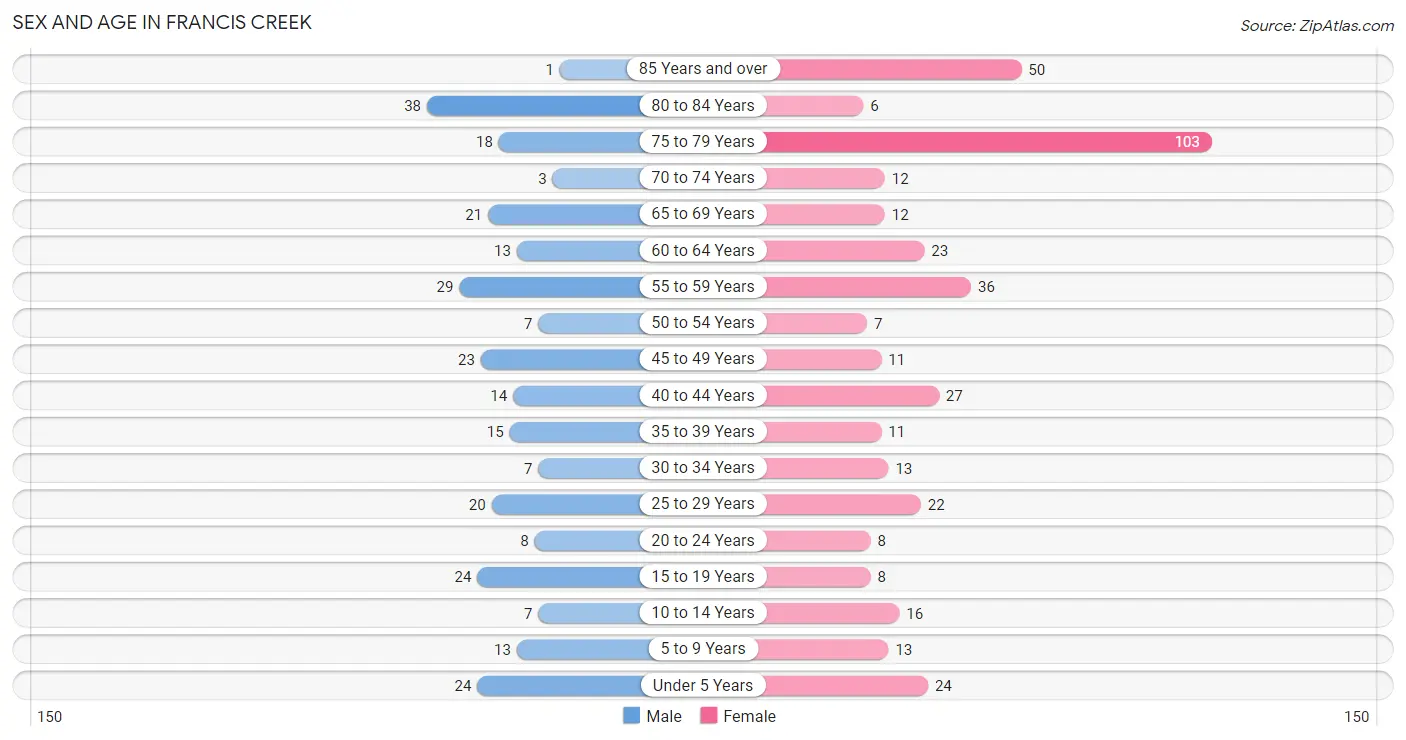
| Age Bracket | Male | Female |
| Under 5 Years | 24 (8.4%) | 24 (6.0%) |
| 5 to 9 Years | 13 (4.6%) | 13 (3.2%) |
| 10 to 14 Years | 7 (2.5%) | 16 (4.0%) |
| 15 to 19 Years | 24 (8.4%) | 8 (2.0%) |
| 20 to 24 Years | 8 (2.8%) | 8 (2.0%) |
| 25 to 29 Years | 20 (7.0%) | 22 (5.5%) |
| 30 to 34 Years | 7 (2.5%) | 13 (3.2%) |
| 35 to 39 Years | 15 (5.3%) | 11 (2.7%) |
| 40 to 44 Years | 14 (4.9%) | 27 (6.7%) |
| 45 to 49 Years | 23 (8.1%) | 11 (2.7%) |
| 50 to 54 Years | 7 (2.5%) | 7 (1.7%) |
| 55 to 59 Years | 29 (10.2%) | 36 (9.0%) |
| 60 to 64 Years | 13 (4.6%) | 23 (5.7%) |
| 65 to 69 Years | 21 (7.4%) | 12 (3.0%) |
| 70 to 74 Years | 3 (1.1%) | 12 (3.0%) |
| 75 to 79 Years | 18 (6.3%) | 103 (25.6%) |
| 80 to 84 Years | 38 (13.3%) | 6 (1.5%) |
| 85 Years and over | 1 (0.4%) | 50 (12.4%) |
| Total | 285 (100.0%) | 402 (100.0%) |
Families and Households in Francis Creek
Median Family Size in Francis Creek
The median family size in Francis Creek is 2.10 persons per family, with single male/father families (8 | 3.3%) accounting for the largest median family size of 2.5 persons per family. On the other hand, single female/mother families (13 | 5.3%) represent the smallest median family size with 1.85 persons per family.
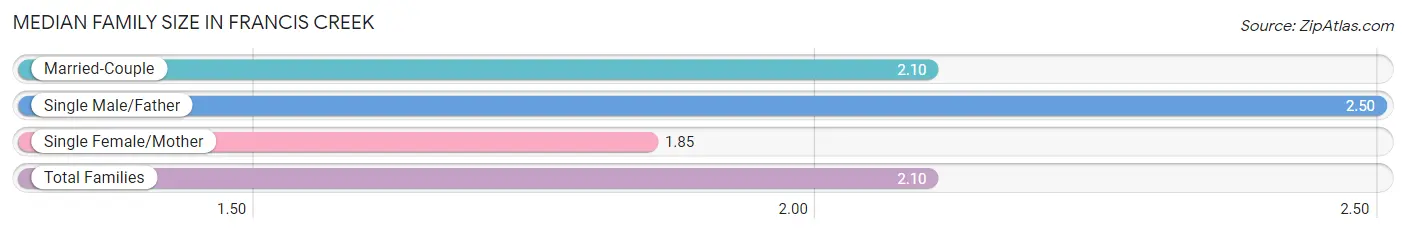
| Family Type | # Families | Family Size |
| Married-Couple | 225 (91.5%) | 2.10 |
| Single Male/Father | 8 (3.3%) | 2.50 |
| Single Female/Mother | 13 (5.3%) | 1.85 |
| Total Families | 246 (100.0%) | 2.10 |
Median Household Size in Francis Creek
The median household size in Francis Creek is 1.79 persons per household, with single male/father households (8 | 2.1%) accounting for the largest median household size of 3.38 persons per household. non-family households (138 | 35.9%) represent the smallest median household size with 1.18 persons per household.
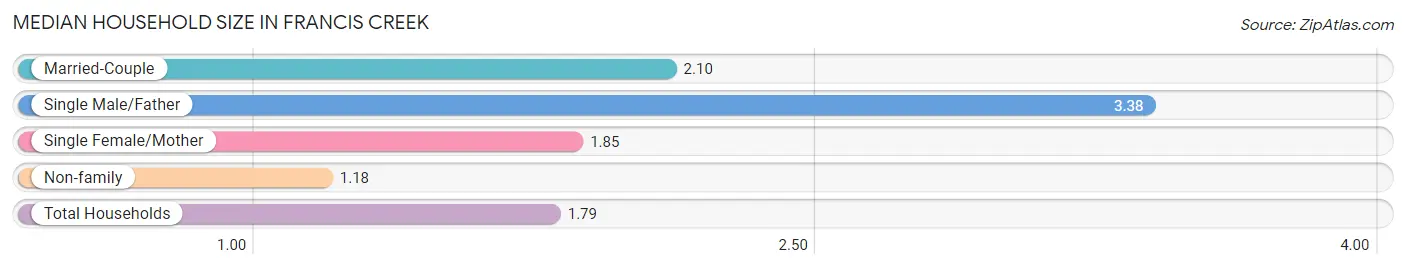
| Household Type | # Households | Household Size |
| Married-Couple | 225 (58.6%) | 2.10 |
| Single Male/Father | 8 (2.1%) | 3.38 |
| Single Female/Mother | 13 (3.4%) | 1.85 |
| Non-family | 138 (35.9%) | 1.18 |
| Total Households | 384 (100.0%) | 1.79 |
Household Size by Marriage Status in Francis Creek
Out of a total of 384 households in Francis Creek, 246 (64.1%) are family households, while 138 (35.9%) are nonfamily households. The most numerous type of family households are 2-person households, comprising 177, and the most common type of nonfamily households are 1-person households, comprising 124.
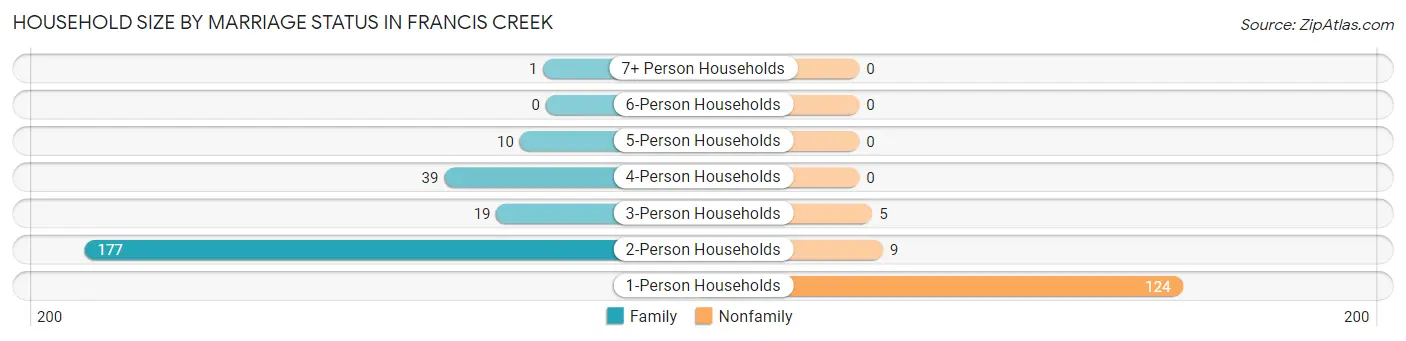
| Household Size | Family Households | Nonfamily Households |
| 1-Person Households | - | 124 (32.3%) |
| 2-Person Households | 177 (46.1%) | 9 (2.3%) |
| 3-Person Households | 19 (5.0%) | 5 (1.3%) |
| 4-Person Households | 39 (10.2%) | 0 (0.0%) |
| 5-Person Households | 10 (2.6%) | 0 (0.0%) |
| 6-Person Households | 0 (0.0%) | 0 (0.0%) |
| 7+ Person Households | 1 (0.3%) | 0 (0.0%) |
| Total | 246 (64.1%) | 138 (35.9%) |
Female Fertility in Francis Creek
Fertility by Age in Francis Creek
Average fertility rate in Francis Creek is 100.0 births per 1,000 women. Women in the age bracket of 20 to 34 years have the highest fertility rate with 163.0 births per 1,000 women. Women in the age bracket of 20 to 34 years acount for 70.0% of all women with births.
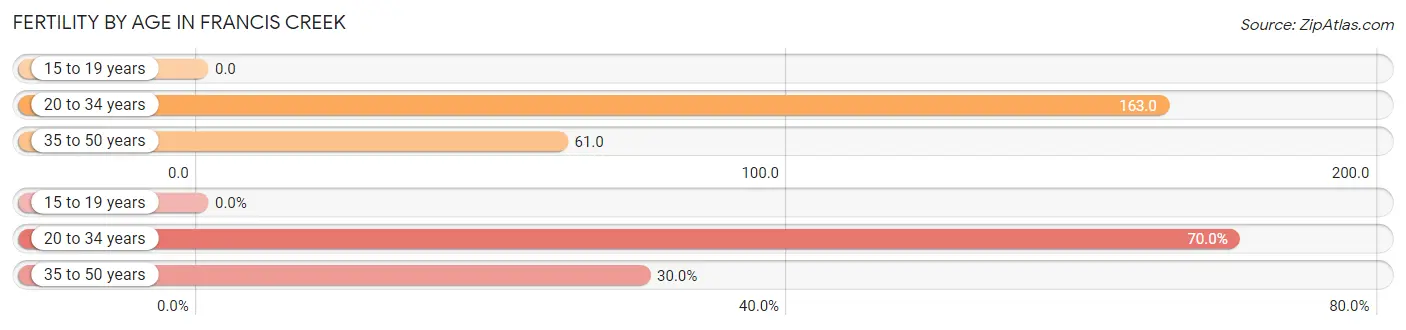
| Age Bracket | Women with Births | Births / 1,000 Women |
| 15 to 19 years | 0 (0.0%) | 0.0 |
| 20 to 34 years | 7 (70.0%) | 163.0 |
| 35 to 50 years | 3 (30.0%) | 61.0 |
| Total | 10 (100.0%) | 100.0 |
Fertility by Age by Marriage Status in Francis Creek
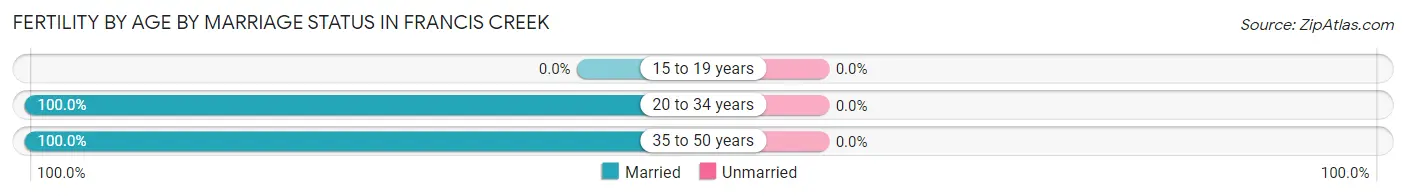
| Age Bracket | Married | Unmarried |
| 15 to 19 years | 0 (0.0%) | 0 (0.0%) |
| 20 to 34 years | 7 (100.0%) | 0 (0.0%) |
| 35 to 50 years | 3 (100.0%) | 0 (0.0%) |
| Total | 10 (100.0%) | 0 (0.0%) |
Fertility by Education in Francis Creek
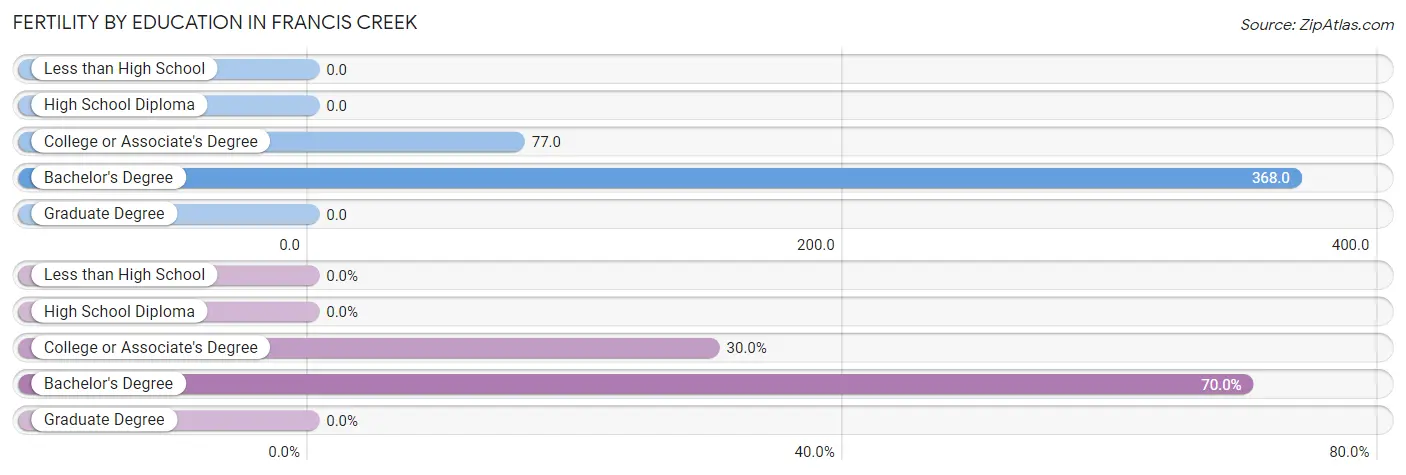
| Educational Attainment | Women with Births | Births / 1,000 Women |
| Less than High School | 0 (0.0%) | 0.0 |
| High School Diploma | 0 (0.0%) | 0.0 |
| College or Associate's Degree | 3 (30.0%) | 77.0 |
| Bachelor's Degree | 7 (70.0%) | 368.0 |
| Graduate Degree | 0 (0.0%) | 0.0 |
| Total | 10 (100.0%) | 100.0 |
Fertility by Education by Marriage Status in Francis Creek
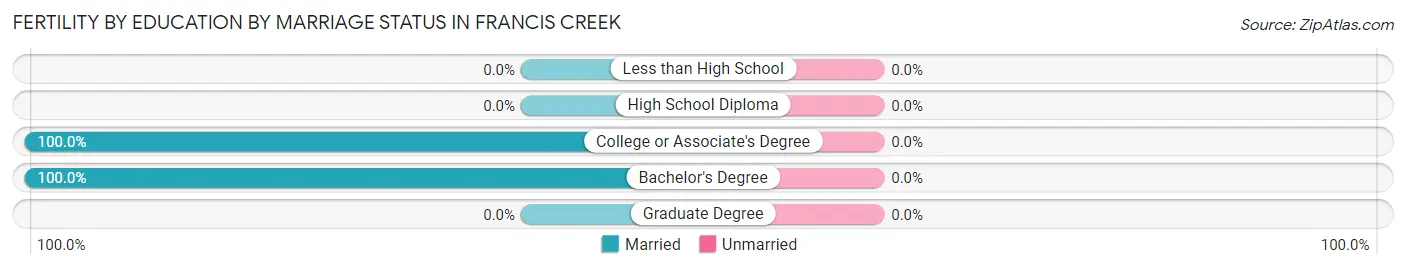
| Educational Attainment | Married | Unmarried |
| Less than High School | 0 (0.0%) | 0 (0.0%) |
| High School Diploma | 0 (0.0%) | 0 (0.0%) |
| College or Associate's Degree | 3 (100.0%) | 0 (0.0%) |
| Bachelor's Degree | 7 (100.0%) | 0 (0.0%) |
| Graduate Degree | 0 (0.0%) | 0 (0.0%) |
| Total | 10 (100.0%) | 0 (0.0%) |
Employment Characteristics in Francis Creek
Employment by Class of Employer in Francis Creek
Among the 244 employed individuals in Francis Creek, private company employees (177 | 72.5%), local government employees (31 | 12.7%), and not-for-profit organizations (11 | 4.5%) make up the most common classes of employment.
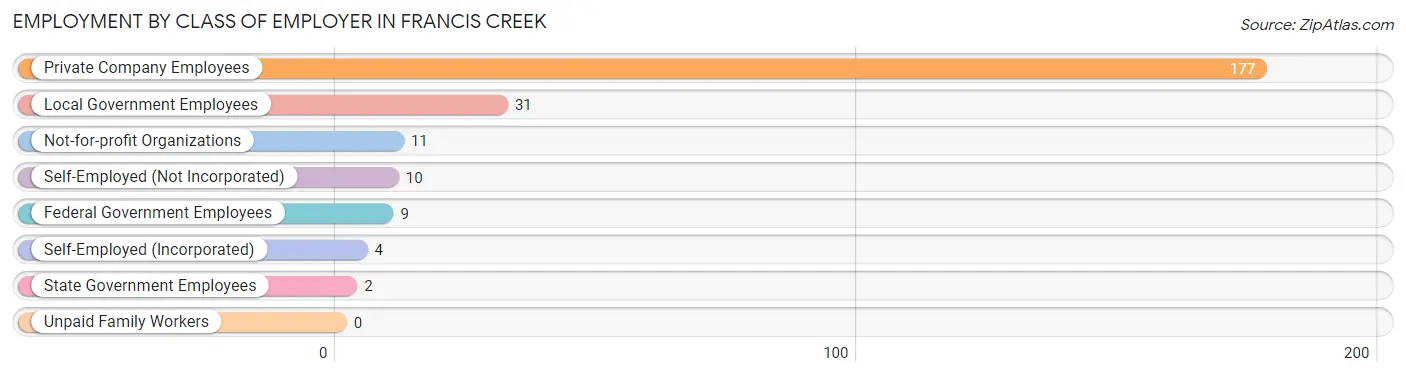
| Employer Class | # Employees | % Employees |
| Private Company Employees | 177 | 72.5% |
| Self-Employed (Incorporated) | 4 | 1.6% |
| Self-Employed (Not Incorporated) | 10 | 4.1% |
| Not-for-profit Organizations | 11 | 4.5% |
| Local Government Employees | 31 | 12.7% |
| State Government Employees | 2 | 0.8% |
| Federal Government Employees | 9 | 3.7% |
| Unpaid Family Workers | 0 | 0.0% |
| Total | 244 | 100.0% |
Employment Status by Age in Francis Creek
According to the labor force statistics for Francis Creek, out of the total population over 16 years of age (575), 44.9% or 258 individuals are in the labor force, with 1.2% or 3 of them unemployed. The age group with the highest labor force participation rate is 20 to 24 years, with 100.0% or 16 individuals in the labor force. Within the labor force, the 55 to 59 years age range has the highest percentage of unemployed individuals, with 5.4% or 3 of them being unemployed.
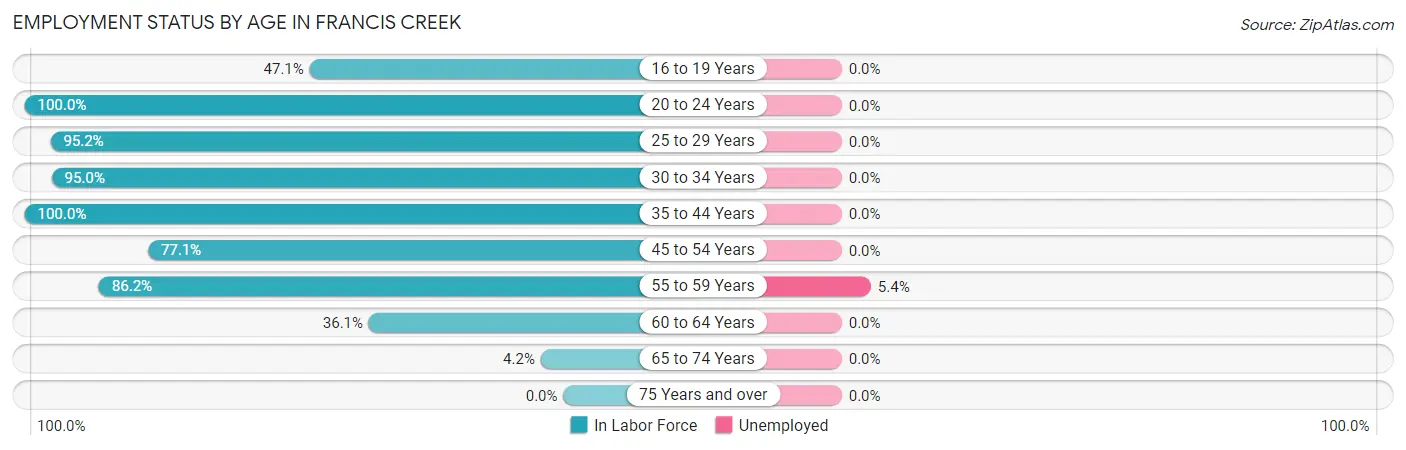
| Age Bracket | In Labor Force | Unemployed |
| 16 to 19 Years | 8 (47.1%) | 0 (0.0%) |
| 20 to 24 Years | 16 (100.0%) | 0 (0.0%) |
| 25 to 29 Years | 40 (95.2%) | 0 (0.0%) |
| 30 to 34 Years | 19 (95.0%) | 0 (0.0%) |
| 35 to 44 Years | 67 (100.0%) | 0 (0.0%) |
| 45 to 54 Years | 37 (77.1%) | 0 (0.0%) |
| 55 to 59 Years | 56 (86.2%) | 3 (5.4%) |
| 60 to 64 Years | 13 (36.1%) | 0 (0.0%) |
| 65 to 74 Years | 2 (4.2%) | 0 (0.0%) |
| 75 Years and over | 0 (0.0%) | 0 (0.0%) |
| Total | 258 (44.9%) | 3 (1.2%) |
Employment Status by Educational Attainment in Francis Creek
According to labor force statistics for Francis Creek, 83.5% of individuals (232) out of the total population between 25 and 64 years of age (278) are in the labor force, with 1.3% or 3 of them being unemployed. The group with the highest labor force participation rate are those with the educational attainment of bachelor's degree or higher, with 89.5% or 51 individuals in the labor force. Within the labor force, individuals with college / associate degree education have the highest percentage of unemployment, with 3.0% or 3 of them being unemployed.
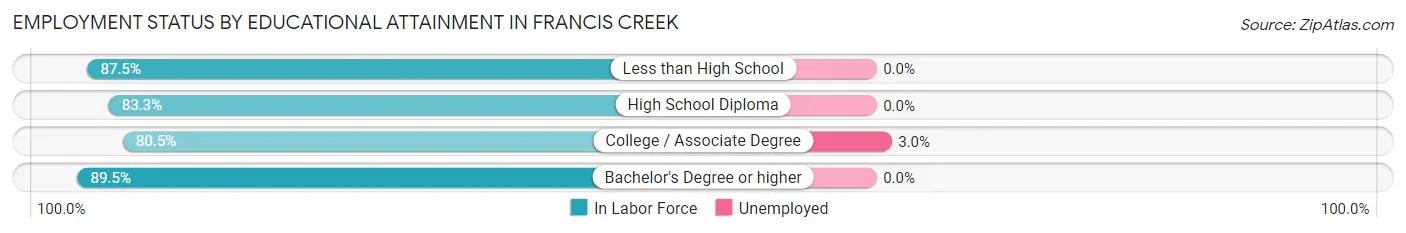
| Educational Attainment | In Labor Force | Unemployed |
| Less than High School | 7 (87.5%) | 0 (0.0%) |
| High School Diploma | 75 (83.3%) | 0 (0.0%) |
| College / Associate Degree | 99 (80.5%) | 4 (3.0%) |
| Bachelor's Degree or higher | 51 (89.5%) | 0 (0.0%) |
| Total | 232 (83.5%) | 4 (1.3%) |
Employment Occupations by Sex in Francis Creek
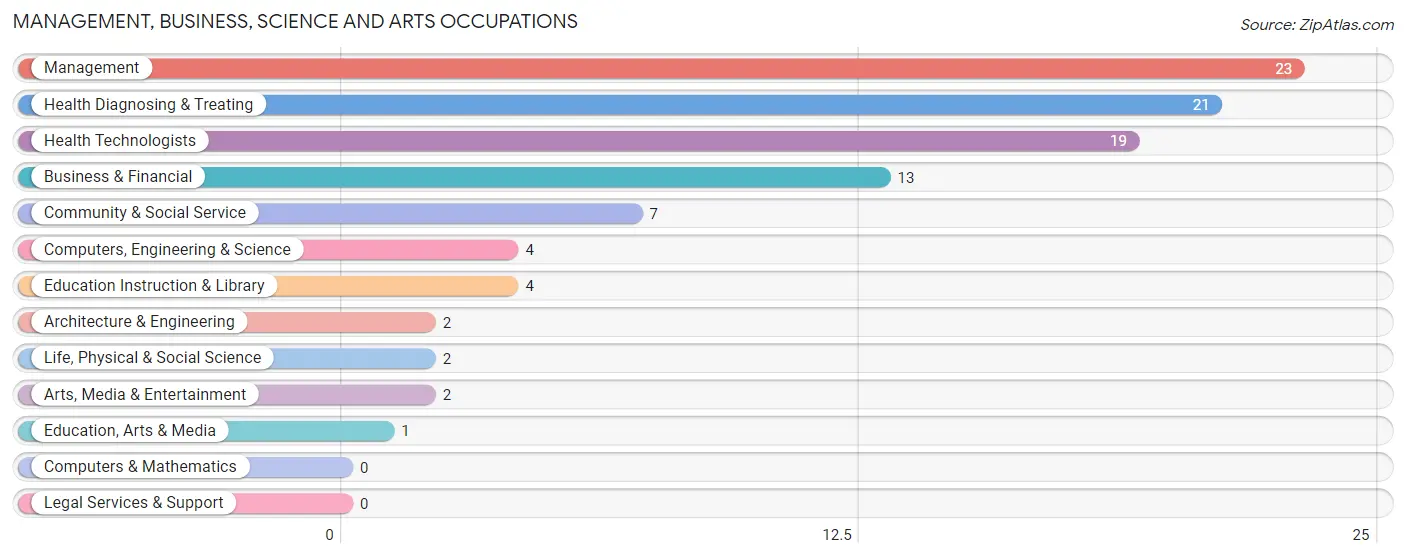
Management, Business, Science and Arts Occupations
The most common Management, Business, Science and Arts occupations in Francis Creek are Management (23 | 9.0%), Health Diagnosing & Treating (21 | 8.2%), Health Technologists (19 | 7.4%), Business & Financial (13 | 5.1%), and Community & Social Service (7 | 2.8%).
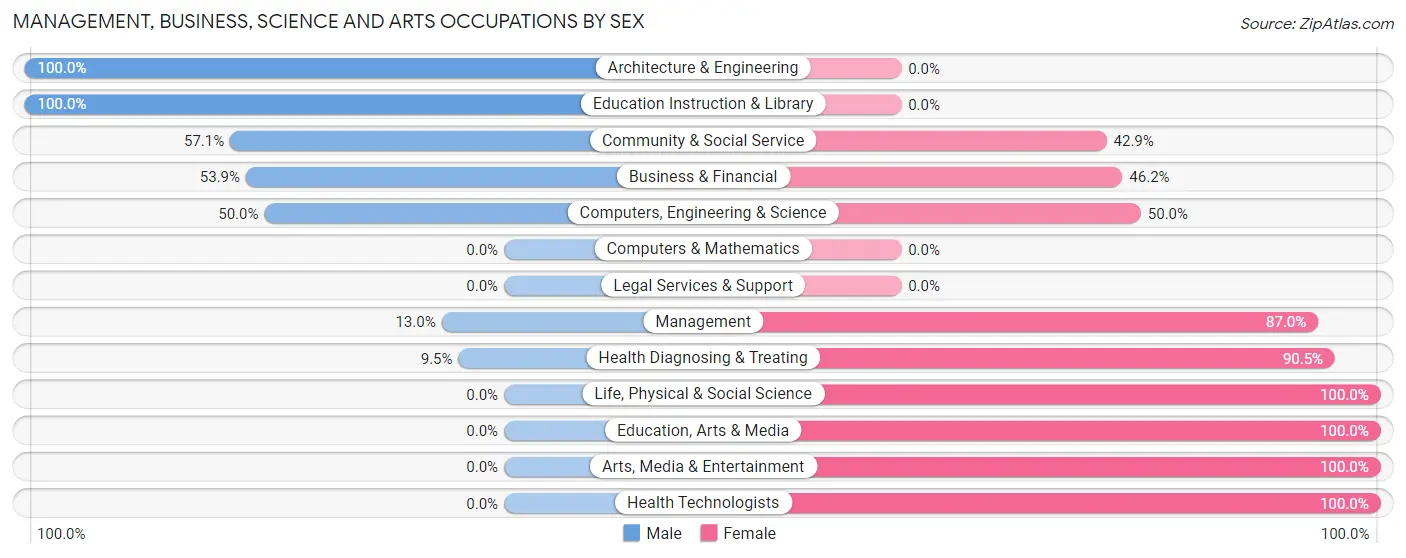
Management, Business, Science and Arts Occupations by Sex
Within the Management, Business, Science and Arts occupations in Francis Creek, the most male-oriented occupations are Architecture & Engineering (100.0%), Education Instruction & Library (100.0%), and Community & Social Service (57.1%), while the most female-oriented occupations are Life, Physical & Social Science (100.0%), Education, Arts & Media (100.0%), and Arts, Media & Entertainment (100.0%).
| Occupation | Male | Female |
| Management | 3 (13.0%) | 20 (87.0%) |
| Business & Financial | 7 (53.8%) | 6 (46.2%) |
| Computers, Engineering & Science | 2 (50.0%) | 2 (50.0%) |
| Computers & Mathematics | 0 (0.0%) | 0 (0.0%) |
| Architecture & Engineering | 2 (100.0%) | 0 (0.0%) |
| Life, Physical & Social Science | 0 (0.0%) | 2 (100.0%) |
| Community & Social Service | 4 (57.1%) | 3 (42.9%) |
| Education, Arts & Media | 0 (0.0%) | 1 (100.0%) |
| Legal Services & Support | 0 (0.0%) | 0 (0.0%) |
| Education Instruction & Library | 4 (100.0%) | 0 (0.0%) |
| Arts, Media & Entertainment | 0 (0.0%) | 2 (100.0%) |
| Health Diagnosing & Treating | 2 (9.5%) | 19 (90.5%) |
| Health Technologists | 0 (0.0%) | 19 (100.0%) |
| Total (Category) | 18 (26.5%) | 50 (73.5%) |
| Total (Overall) | 113 (44.3%) | 142 (55.7%) |
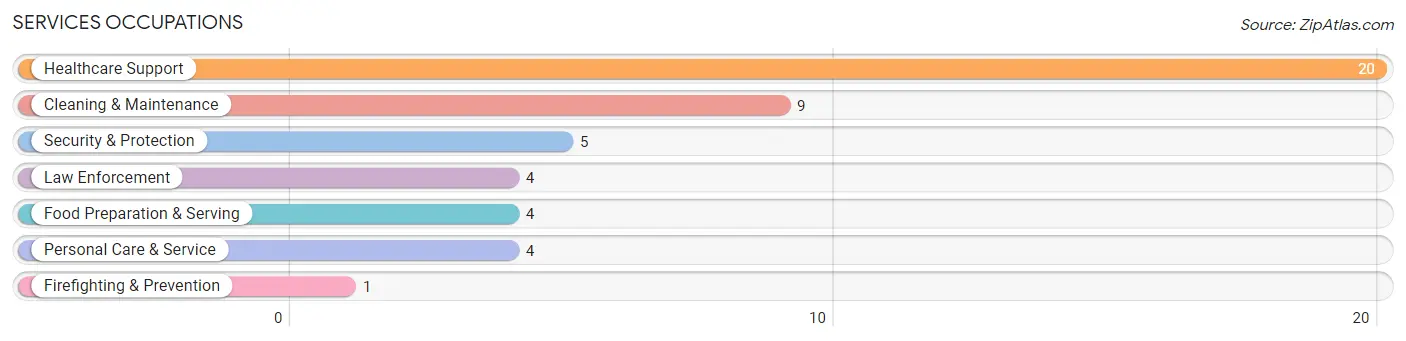
Services Occupations
The most common Services occupations in Francis Creek are Healthcare Support (20 | 7.8%), Cleaning & Maintenance (9 | 3.5%), Security & Protection (5 | 2.0%), Law Enforcement (4 | 1.6%), and Food Preparation & Serving (4 | 1.6%).
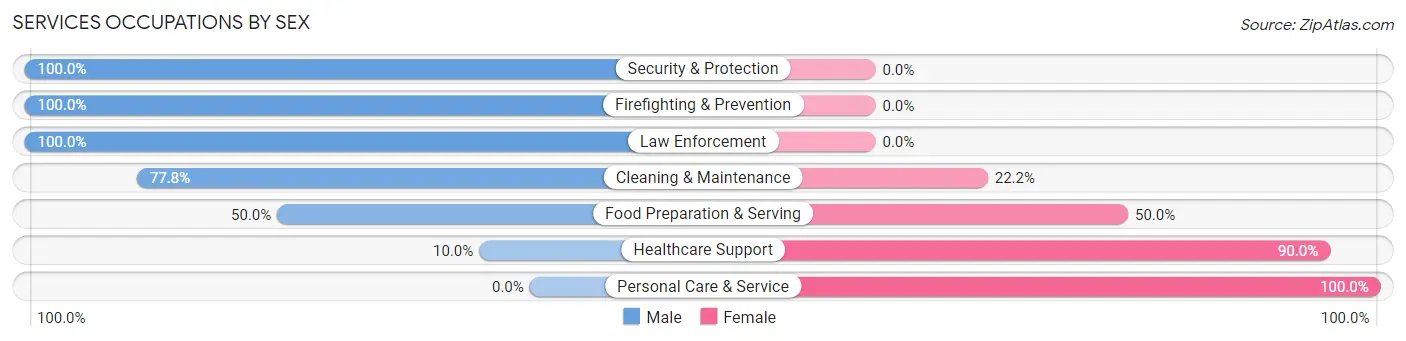
Services Occupations by Sex
Within the Services occupations in Francis Creek, the most male-oriented occupations are Security & Protection (100.0%), Firefighting & Prevention (100.0%), and Law Enforcement (100.0%), while the most female-oriented occupations are Personal Care & Service (100.0%), Healthcare Support (90.0%), and Food Preparation & Serving (50.0%).
| Occupation | Male | Female |
| Healthcare Support | 2 (10.0%) | 18 (90.0%) |
| Security & Protection | 5 (100.0%) | 0 (0.0%) |
| Firefighting & Prevention | 1 (100.0%) | 0 (0.0%) |
| Law Enforcement | 4 (100.0%) | 0 (0.0%) |
| Food Preparation & Serving | 2 (50.0%) | 2 (50.0%) |
| Cleaning & Maintenance | 7 (77.8%) | 2 (22.2%) |
| Personal Care & Service | 0 (0.0%) | 4 (100.0%) |
| Total (Category) | 16 (38.1%) | 26 (61.9%) |
| Total (Overall) | 113 (44.3%) | 142 (55.7%) |
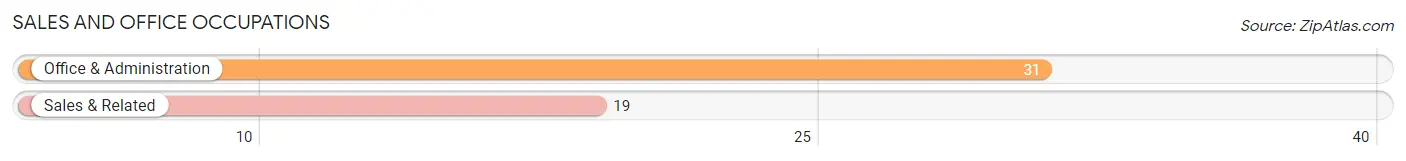
Sales and Office Occupations
The most common Sales and Office occupations in Francis Creek are Office & Administration (31 | 12.2%), and Sales & Related (19 | 7.4%).
Sales and Office Occupations by Sex
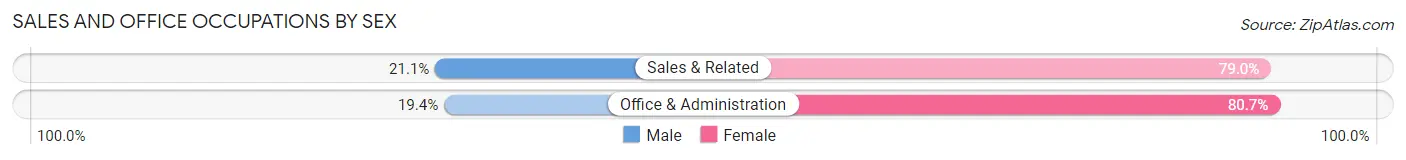
| Occupation | Male | Female |
| Sales & Related | 4 (21.0%) | 15 (78.9%) |
| Office & Administration | 6 (19.4%) | 25 (80.6%) |
| Total (Category) | 10 (20.0%) | 40 (80.0%) |
| Total (Overall) | 113 (44.3%) | 142 (55.7%) |
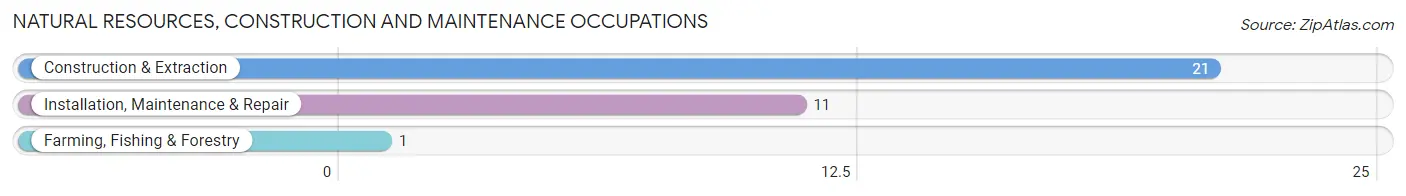
Natural Resources, Construction and Maintenance Occupations
The most common Natural Resources, Construction and Maintenance occupations in Francis Creek are Construction & Extraction (21 | 8.2%), Installation, Maintenance & Repair (11 | 4.3%), and Farming, Fishing & Forestry (1 | 0.4%).
Natural Resources, Construction and Maintenance Occupations by Sex
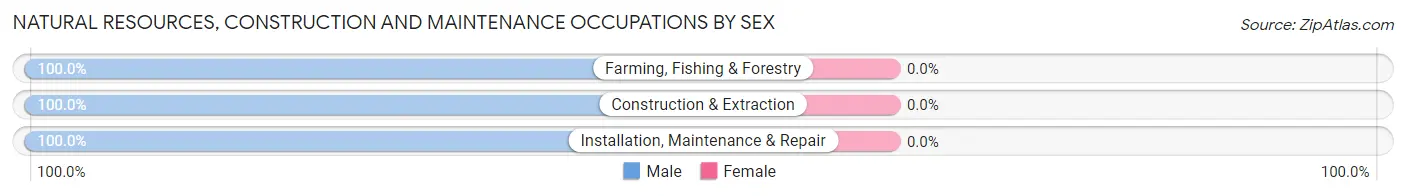
| Occupation | Male | Female |
| Farming, Fishing & Forestry | 1 (100.0%) | 0 (0.0%) |
| Construction & Extraction | 21 (100.0%) | 0 (0.0%) |
| Installation, Maintenance & Repair | 11 (100.0%) | 0 (0.0%) |
| Total (Category) | 33 (100.0%) | 0 (0.0%) |
| Total (Overall) | 113 (44.3%) | 142 (55.7%) |
Production, Transportation and Moving Occupations
The most common Production, Transportation and Moving occupations in Francis Creek are Production (45 | 17.6%), and Transportation (17 | 6.7%).
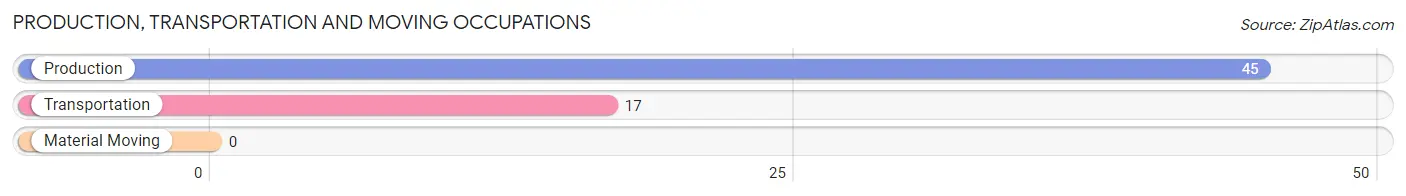
Production, Transportation and Moving Occupations by Sex
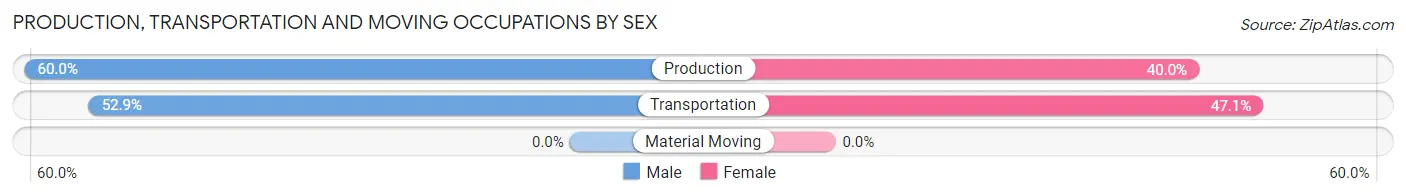
| Occupation | Male | Female |
| Production | 27 (60.0%) | 18 (40.0%) |
| Transportation | 9 (52.9%) | 8 (47.1%) |
| Material Moving | 0 (0.0%) | 0 (0.0%) |
| Total (Category) | 36 (58.1%) | 26 (41.9%) |
| Total (Overall) | 113 (44.3%) | 142 (55.7%) |
Employment Industries by Sex in Francis Creek
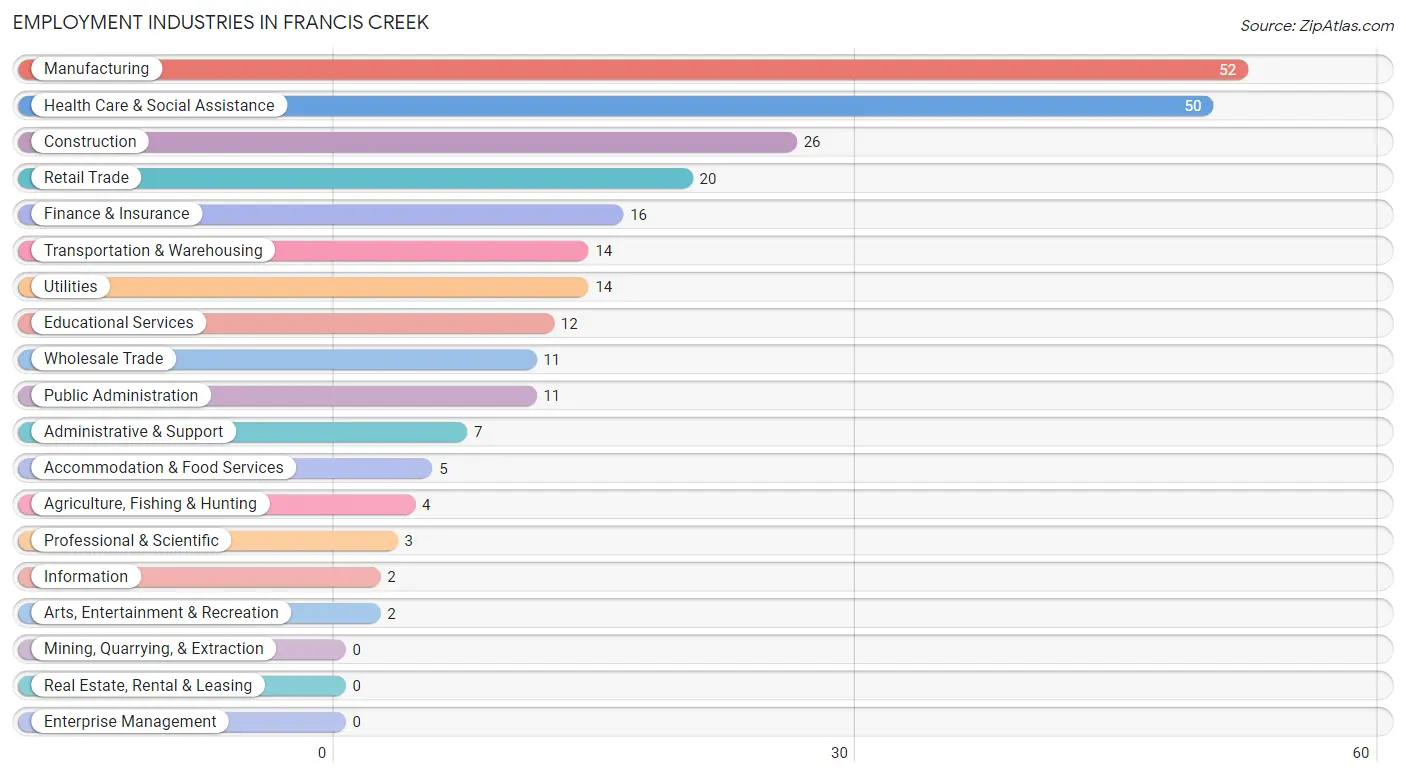
Employment Industries in Francis Creek
The major employment industries in Francis Creek include Manufacturing (52 | 20.4%), Health Care & Social Assistance (50 | 19.6%), Construction (26 | 10.2%), Retail Trade (20 | 7.8%), and Finance & Insurance (16 | 6.3%).
Employment Industries by Sex in Francis Creek
The Francis Creek industries that see more men than women are Professional & Scientific (100.0%), Arts, Entertainment & Recreation (100.0%), and Construction (92.3%), whereas the industries that tend to have a higher number of women are Agriculture, Fishing & Hunting (100.0%), Information (100.0%), and Health Care & Social Assistance (96.0%).
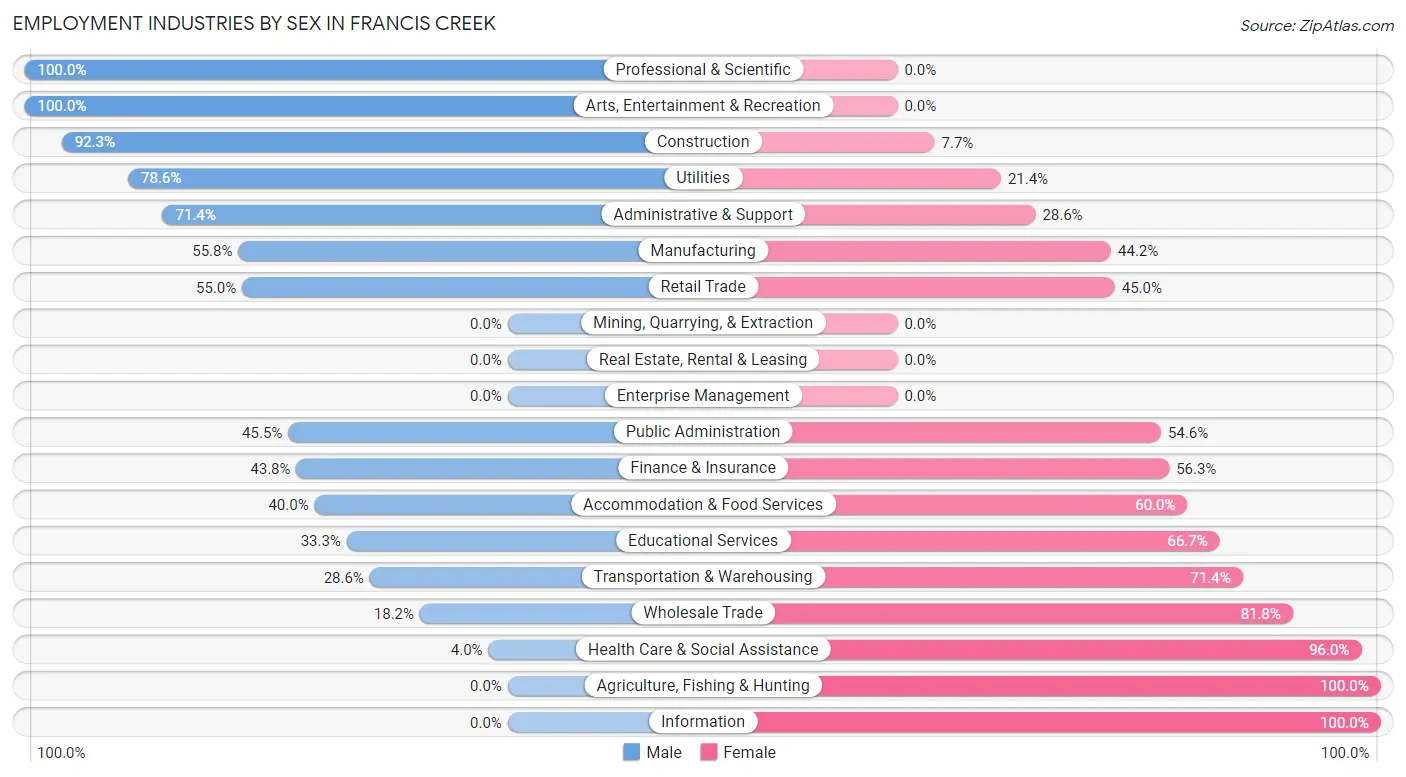
| Industry | Male | Female |
| Agriculture, Fishing & Hunting | 0 (0.0%) | 4 (100.0%) |
| Mining, Quarrying, & Extraction | 0 (0.0%) | 0 (0.0%) |
| Construction | 24 (92.3%) | 2 (7.7%) |
| Manufacturing | 29 (55.8%) | 23 (44.2%) |
| Wholesale Trade | 2 (18.2%) | 9 (81.8%) |
| Retail Trade | 11 (55.0%) | 9 (45.0%) |
| Transportation & Warehousing | 4 (28.6%) | 10 (71.4%) |
| Utilities | 11 (78.6%) | 3 (21.4%) |
| Information | 0 (0.0%) | 2 (100.0%) |
| Finance & Insurance | 7 (43.8%) | 9 (56.2%) |
| Real Estate, Rental & Leasing | 0 (0.0%) | 0 (0.0%) |
| Professional & Scientific | 3 (100.0%) | 0 (0.0%) |
| Enterprise Management | 0 (0.0%) | 0 (0.0%) |
| Administrative & Support | 5 (71.4%) | 2 (28.6%) |
| Educational Services | 4 (33.3%) | 8 (66.7%) |
| Health Care & Social Assistance | 2 (4.0%) | 48 (96.0%) |
| Arts, Entertainment & Recreation | 2 (100.0%) | 0 (0.0%) |
| Accommodation & Food Services | 2 (40.0%) | 3 (60.0%) |
| Public Administration | 5 (45.5%) | 6 (54.5%) |
| Total | 113 (44.3%) | 142 (55.7%) |
Education in Francis Creek
School Enrollment in Francis Creek
The most common levels of schooling among the 100 students in Francis Creek are high school (28 | 28.0%), elementary school (22 | 22.0%), and college / undergraduate (22 | 22.0%).
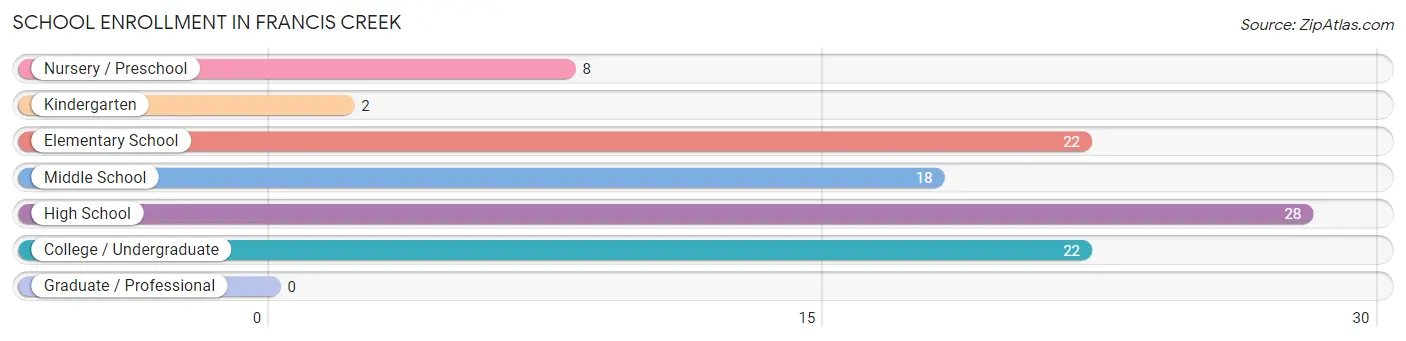
| School Level | # Students | % Students |
| Nursery / Preschool | 8 | 8.0% |
| Kindergarten | 2 | 2.0% |
| Elementary School | 22 | 22.0% |
| Middle School | 18 | 18.0% |
| High School | 28 | 28.0% |
| College / Undergraduate | 22 | 22.0% |
| Graduate / Professional | 0 | 0.0% |
| Total | 100 | 100.0% |
School Enrollment by Age by Funding Source in Francis Creek
Out of a total of 100 students who are enrolled in schools in Francis Creek, 21 (21.0%) attend a private institution, while the remaining 79 (79.0%) are enrolled in public schools. The age group of 35 years and over has the highest likelihood of being enrolled in private schools, with 2 (100.0% in the age bracket) enrolled. Conversely, the age group of 15 to 17 year olds has the lowest likelihood of being enrolled in a private school, with 21 (100.0% in the age bracket) attending a public institution.
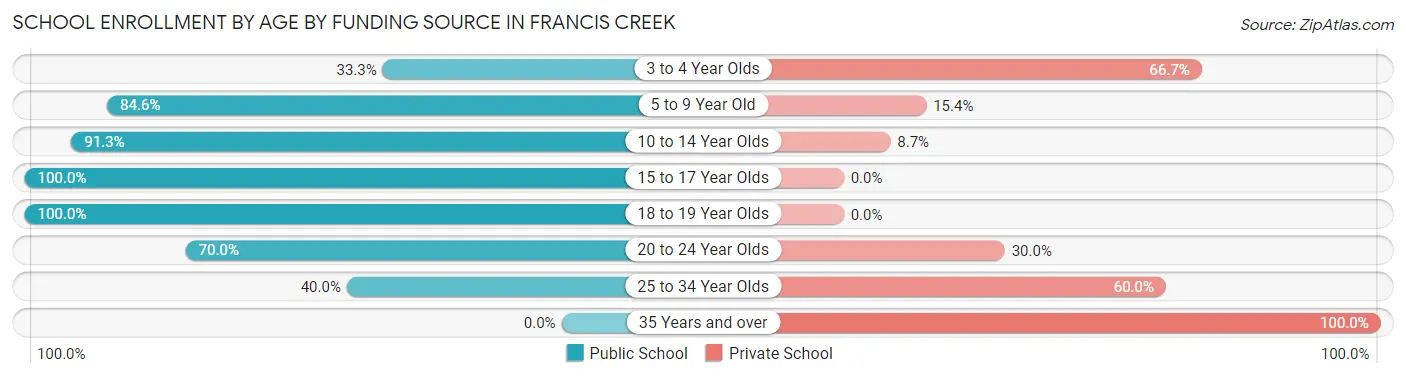
| Age Bracket | Public School | Private School |
| 3 to 4 Year Olds | 2 (33.3%) | 4 (66.7%) |
| 5 to 9 Year Old | 22 (84.6%) | 4 (15.4%) |
| 10 to 14 Year Olds | 21 (91.3%) | 2 (8.7%) |
| 15 to 17 Year Olds | 21 (100.0%) | 0 (0.0%) |
| 18 to 19 Year Olds | 2 (100.0%) | 0 (0.0%) |
| 20 to 24 Year Olds | 7 (70.0%) | 3 (30.0%) |
| 25 to 34 Year Olds | 4 (40.0%) | 6 (60.0%) |
| 35 Years and over | 0 (0.0%) | 2 (100.0%) |
| Total | 79 (79.0%) | 21 (21.0%) |
Educational Attainment by Field of Study in Francis Creek
Education (23 | 31.1%), science & technology (13 | 17.6%), business (12 | 16.2%), bio, nature & agricultural (7 | 9.5%), and arts & humanities (6 | 8.1%) are the most common fields of study among 74 individuals in Francis Creek who have obtained a bachelor's degree or higher.
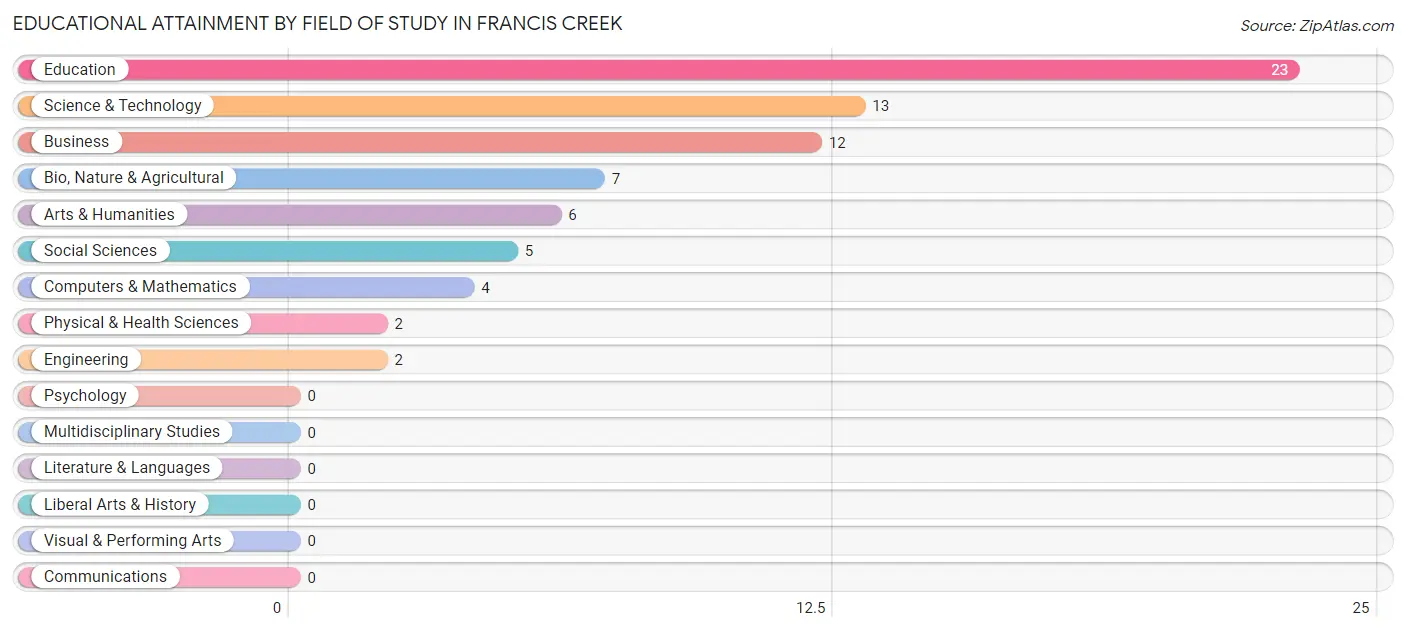
| Field of Study | # Graduates | % Graduates |
| Computers & Mathematics | 4 | 5.4% |
| Bio, Nature & Agricultural | 7 | 9.5% |
| Physical & Health Sciences | 2 | 2.7% |
| Psychology | 0 | 0.0% |
| Social Sciences | 5 | 6.8% |
| Engineering | 2 | 2.7% |
| Multidisciplinary Studies | 0 | 0.0% |
| Science & Technology | 13 | 17.6% |
| Business | 12 | 16.2% |
| Education | 23 | 31.1% |
| Literature & Languages | 0 | 0.0% |
| Liberal Arts & History | 0 | 0.0% |
| Visual & Performing Arts | 0 | 0.0% |
| Communications | 0 | 0.0% |
| Arts & Humanities | 6 | 8.1% |
| Total | 74 | 100.0% |
Transportation & Commute in Francis Creek
Vehicle Availability by Sex in Francis Creek
The most prevalent vehicle ownership categories in Francis Creek are males with 2 vehicles (68, accounting for 60.2%) and females with 2 vehicles (73, making up 51.9%).
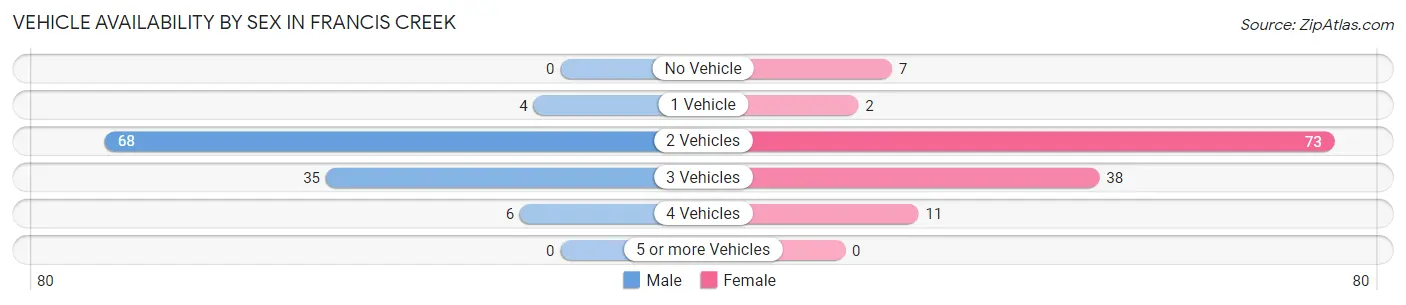
| Vehicles Available | Male | Female |
| No Vehicle | 0 (0.0%) | 7 (5.3%) |
| 1 Vehicle | 4 (3.5%) | 2 (1.5%) |
| 2 Vehicles | 68 (60.2%) | 73 (55.7%) |
| 3 Vehicles | 35 (31.0%) | 38 (29.0%) |
| 4 Vehicles | 6 (5.3%) | 11 (8.4%) |
| 5 or more Vehicles | 0 (0.0%) | 0 (0.0%) |
| Total | 113 (100.0%) | 131 (100.0%) |
Commute Time in Francis Creek
The most frequently occuring commute durations in Francis Creek are 15 to 19 minutes (56 commuters, 24.1%), 10 to 14 minutes (44 commuters, 19.0%), and 20 to 24 minutes (31 commuters, 13.4%).
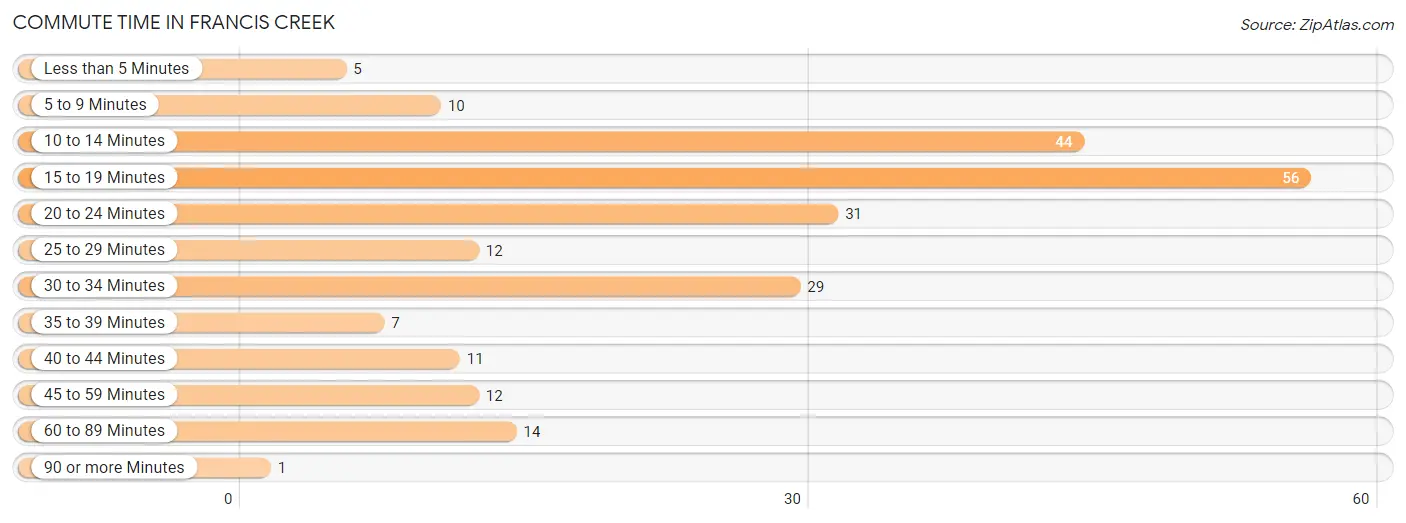
| Commute Time | # Commuters | % Commuters |
| Less than 5 Minutes | 5 | 2.2% |
| 5 to 9 Minutes | 10 | 4.3% |
| 10 to 14 Minutes | 44 | 19.0% |
| 15 to 19 Minutes | 56 | 24.1% |
| 20 to 24 Minutes | 31 | 13.4% |
| 25 to 29 Minutes | 12 | 5.2% |
| 30 to 34 Minutes | 29 | 12.5% |
| 35 to 39 Minutes | 7 | 3.0% |
| 40 to 44 Minutes | 11 | 4.7% |
| 45 to 59 Minutes | 12 | 5.2% |
| 60 to 89 Minutes | 14 | 6.0% |
| 90 or more Minutes | 1 | 0.4% |
Commute Time by Sex in Francis Creek
The most common commute times in Francis Creek are 15 to 19 minutes (28 commuters, 25.2%) for males and 15 to 19 minutes (28 commuters, 23.1%) for females.
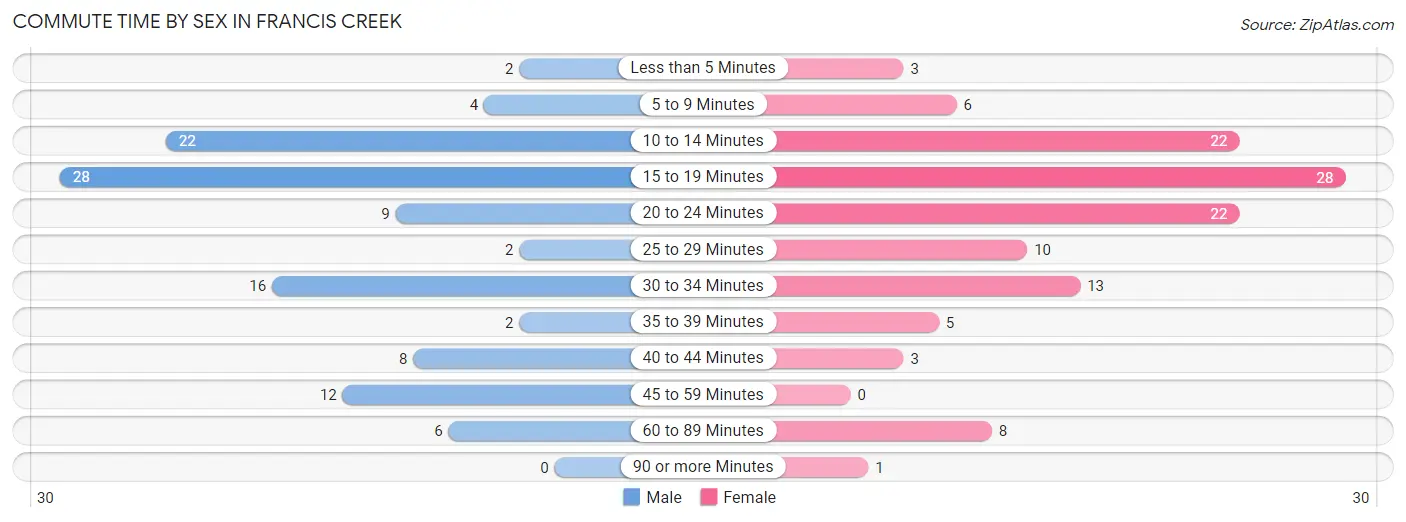
| Commute Time | Male | Female |
| Less than 5 Minutes | 2 (1.8%) | 3 (2.5%) |
| 5 to 9 Minutes | 4 (3.6%) | 6 (5.0%) |
| 10 to 14 Minutes | 22 (19.8%) | 22 (18.2%) |
| 15 to 19 Minutes | 28 (25.2%) | 28 (23.1%) |
| 20 to 24 Minutes | 9 (8.1%) | 22 (18.2%) |
| 25 to 29 Minutes | 2 (1.8%) | 10 (8.3%) |
| 30 to 34 Minutes | 16 (14.4%) | 13 (10.7%) |
| 35 to 39 Minutes | 2 (1.8%) | 5 (4.1%) |
| 40 to 44 Minutes | 8 (7.2%) | 3 (2.5%) |
| 45 to 59 Minutes | 12 (10.8%) | 0 (0.0%) |
| 60 to 89 Minutes | 6 (5.4%) | 8 (6.6%) |
| 90 or more Minutes | 0 (0.0%) | 1 (0.8%) |
Time of Departure to Work by Sex in Francis Creek
The most frequent times of departure to work in Francis Creek are 6:00 AM to 6:29 AM (24, 21.6%) for males and 7:00 AM to 7:29 AM (33, 27.3%) for females.
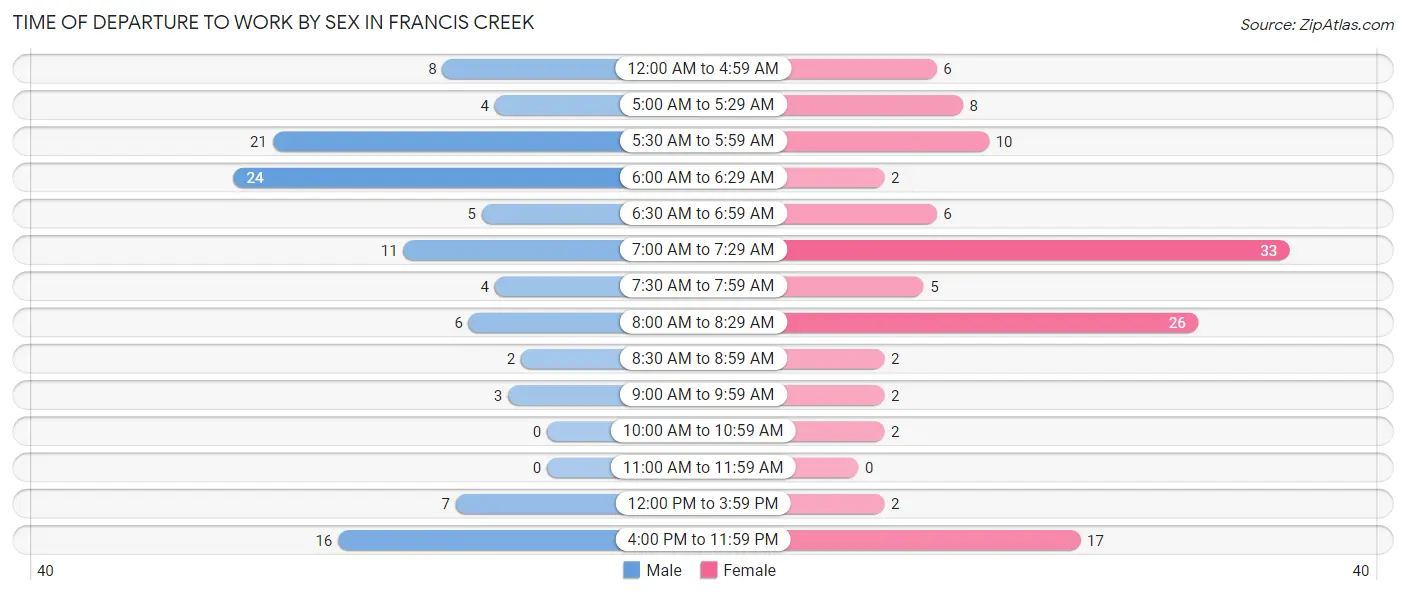
| Time of Departure | Male | Female |
| 12:00 AM to 4:59 AM | 8 (7.2%) | 6 (5.0%) |
| 5:00 AM to 5:29 AM | 4 (3.6%) | 8 (6.6%) |
| 5:30 AM to 5:59 AM | 21 (18.9%) | 10 (8.3%) |
| 6:00 AM to 6:29 AM | 24 (21.6%) | 2 (1.7%) |
| 6:30 AM to 6:59 AM | 5 (4.5%) | 6 (5.0%) |
| 7:00 AM to 7:29 AM | 11 (9.9%) | 33 (27.3%) |
| 7:30 AM to 7:59 AM | 4 (3.6%) | 5 (4.1%) |
| 8:00 AM to 8:29 AM | 6 (5.4%) | 26 (21.5%) |
| 8:30 AM to 8:59 AM | 2 (1.8%) | 2 (1.7%) |
| 9:00 AM to 9:59 AM | 3 (2.7%) | 2 (1.7%) |
| 10:00 AM to 10:59 AM | 0 (0.0%) | 2 (1.7%) |
| 11:00 AM to 11:59 AM | 0 (0.0%) | 0 (0.0%) |
| 12:00 PM to 3:59 PM | 7 (6.3%) | 2 (1.7%) |
| 4:00 PM to 11:59 PM | 16 (14.4%) | 17 (14.1%) |
| Total | 111 (100.0%) | 121 (100.0%) |
Housing Occupancy in Francis Creek
Occupancy by Ownership in Francis Creek
Of the total 384 dwellings in Francis Creek, owner-occupied units account for 331 (86.2%), while renter-occupied units make up 53 (13.8%).
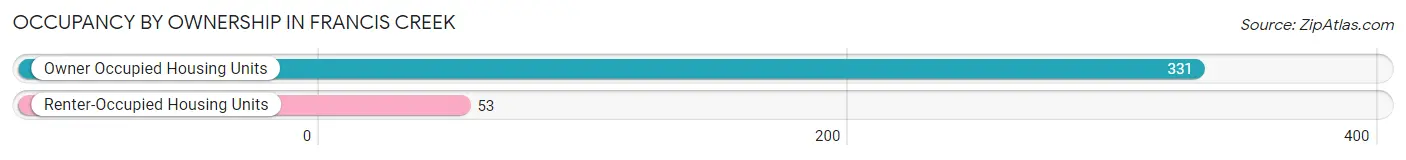
| Occupancy | # Housing Units | % Housing Units |
| Owner Occupied Housing Units | 331 | 86.2% |
| Renter-Occupied Housing Units | 53 | 13.8% |
| Total Occupied Housing Units | 384 | 100.0% |
Occupancy by Household Size in Francis Creek
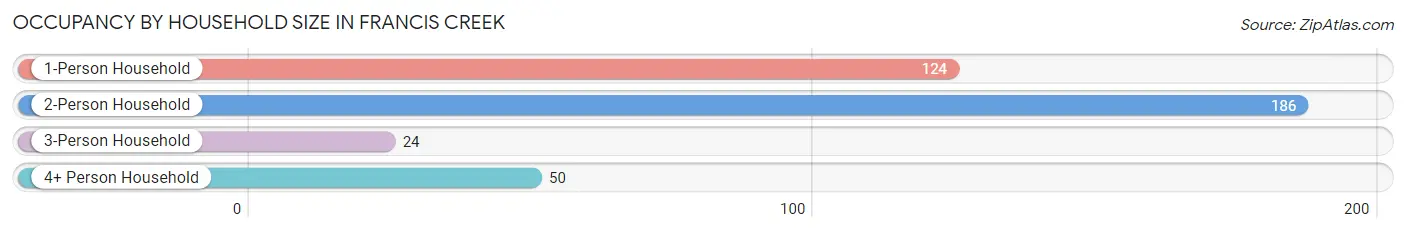
| Household Size | # Housing Units | % Housing Units |
| 1-Person Household | 124 | 32.3% |
| 2-Person Household | 186 | 48.4% |
| 3-Person Household | 24 | 6.2% |
| 4+ Person Household | 50 | 13.0% |
| Total Housing Units | 384 | 100.0% |
Occupancy by Ownership by Household Size in Francis Creek
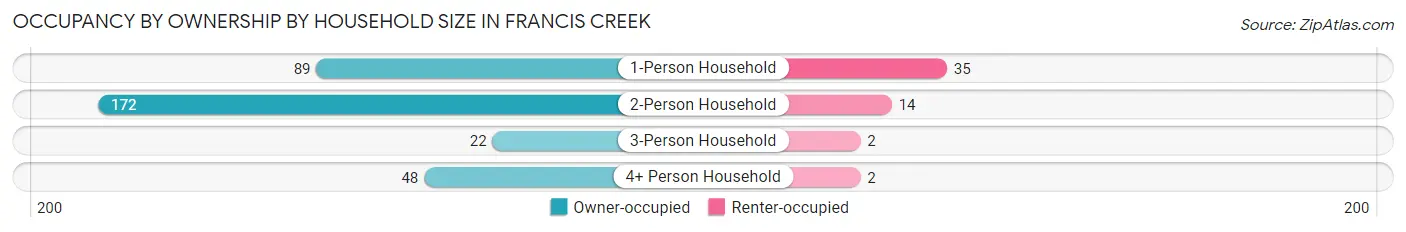
| Household Size | Owner-occupied | Renter-occupied |
| 1-Person Household | 89 (71.8%) | 35 (28.2%) |
| 2-Person Household | 172 (92.5%) | 14 (7.5%) |
| 3-Person Household | 22 (91.7%) | 2 (8.3%) |
| 4+ Person Household | 48 (96.0%) | 2 (4.0%) |
| Total Housing Units | 331 (86.2%) | 53 (13.8%) |
Occupancy by Educational Attainment in Francis Creek
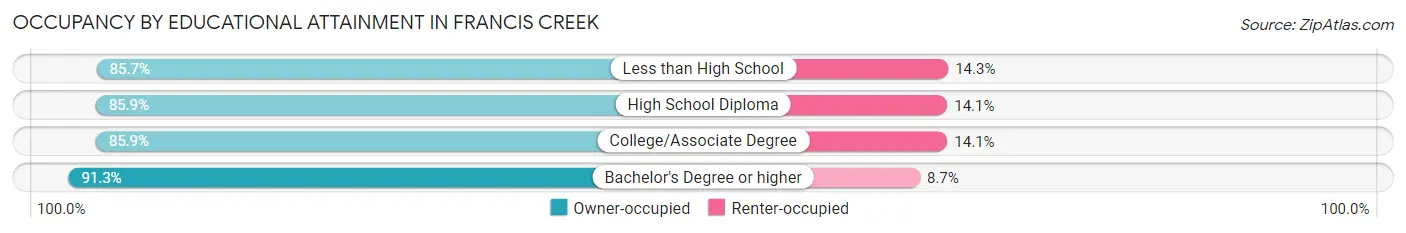
| Household Size | Owner-occupied | Renter-occupied |
| Less than High School | 30 (85.7%) | 5 (14.3%) |
| High School Diploma | 207 (85.9%) | 34 (14.1%) |
| College/Associate Degree | 73 (85.9%) | 12 (14.1%) |
| Bachelor's Degree or higher | 21 (91.3%) | 2 (8.7%) |
Occupancy by Age of Householder in Francis Creek
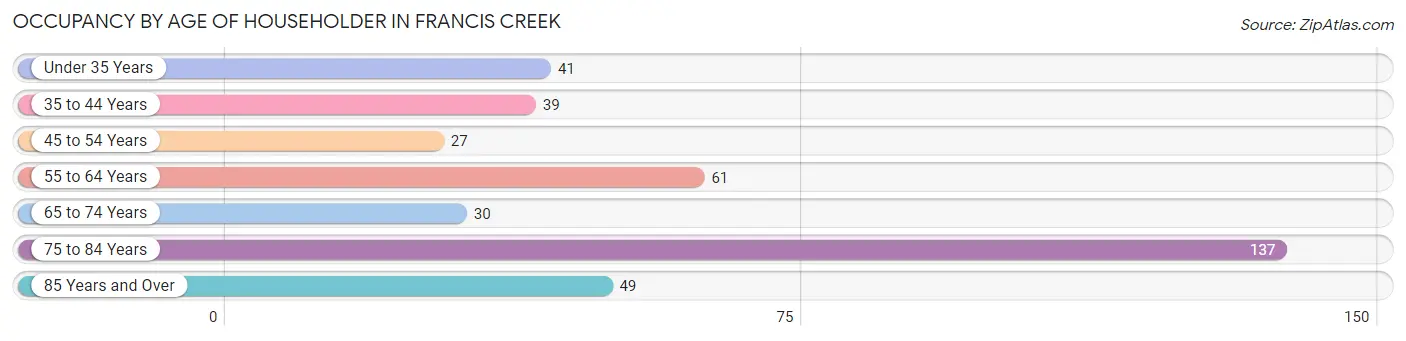
| Age Bracket | # Households | % Households |
| Under 35 Years | 41 | 10.7% |
| 35 to 44 Years | 39 | 10.2% |
| 45 to 54 Years | 27 | 7.0% |
| 55 to 64 Years | 61 | 15.9% |
| 65 to 74 Years | 30 | 7.8% |
| 75 to 84 Years | 137 | 35.7% |
| 85 Years and Over | 49 | 12.8% |
| Total | 384 | 100.0% |
Housing Finances in Francis Creek
Median Income by Occupancy in Francis Creek
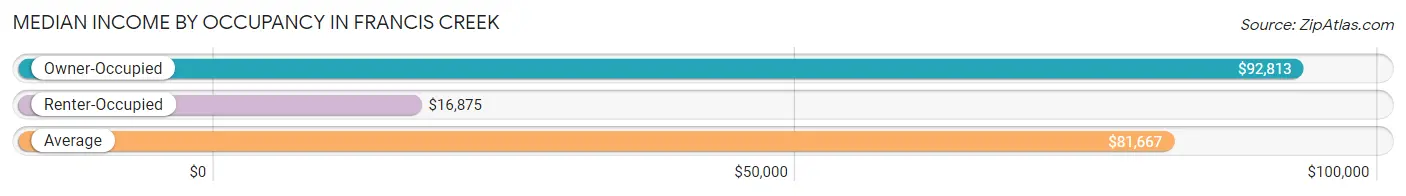
| Occupancy Type | # Households | Median Income |
| Owner-Occupied | 331 (86.2%) | $92,813 |
| Renter-Occupied | 53 (13.8%) | $16,875 |
| Average | 384 (100.0%) | $81,667 |
Occupancy by Householder Income Bracket in Francis Creek
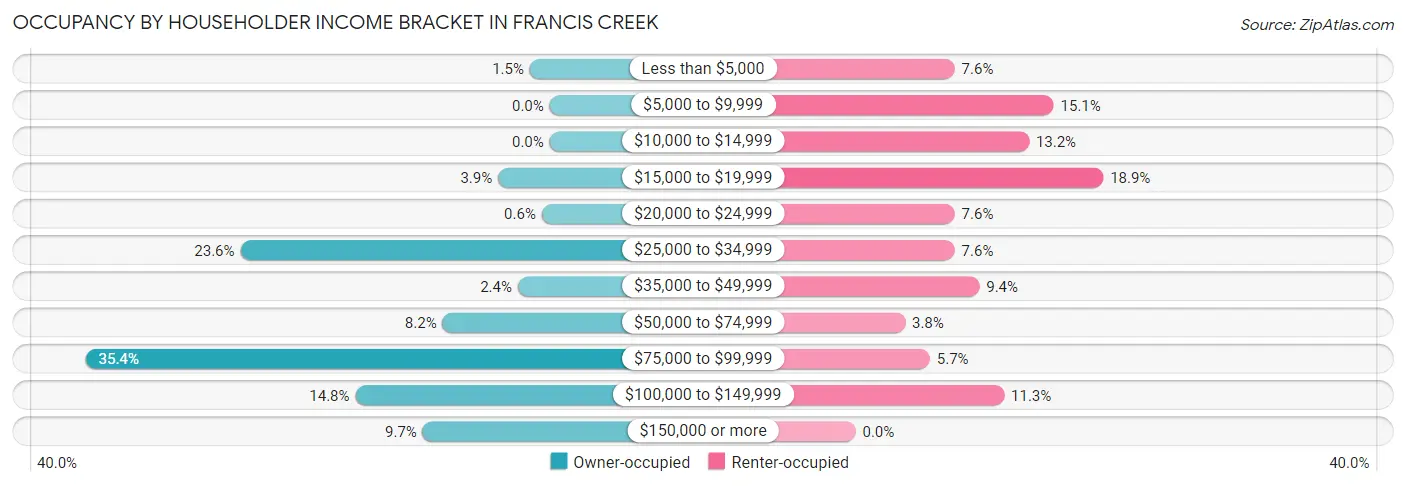
| Income Bracket | Owner-occupied | Renter-occupied |
| Less than $5,000 | 5 (1.5%) | 4 (7.5%) |
| $5,000 to $9,999 | 0 (0.0%) | 8 (15.1%) |
| $10,000 to $14,999 | 0 (0.0%) | 7 (13.2%) |
| $15,000 to $19,999 | 13 (3.9%) | 10 (18.9%) |
| $20,000 to $24,999 | 2 (0.6%) | 4 (7.5%) |
| $25,000 to $34,999 | 78 (23.6%) | 4 (7.5%) |
| $35,000 to $49,999 | 8 (2.4%) | 5 (9.4%) |
| $50,000 to $74,999 | 27 (8.2%) | 2 (3.8%) |
| $75,000 to $99,999 | 117 (35.3%) | 3 (5.7%) |
| $100,000 to $149,999 | 49 (14.8%) | 6 (11.3%) |
| $150,000 or more | 32 (9.7%) | 0 (0.0%) |
| Total | 331 (100.0%) | 53 (100.0%) |
Monthly Housing Cost Tiers in Francis Creek
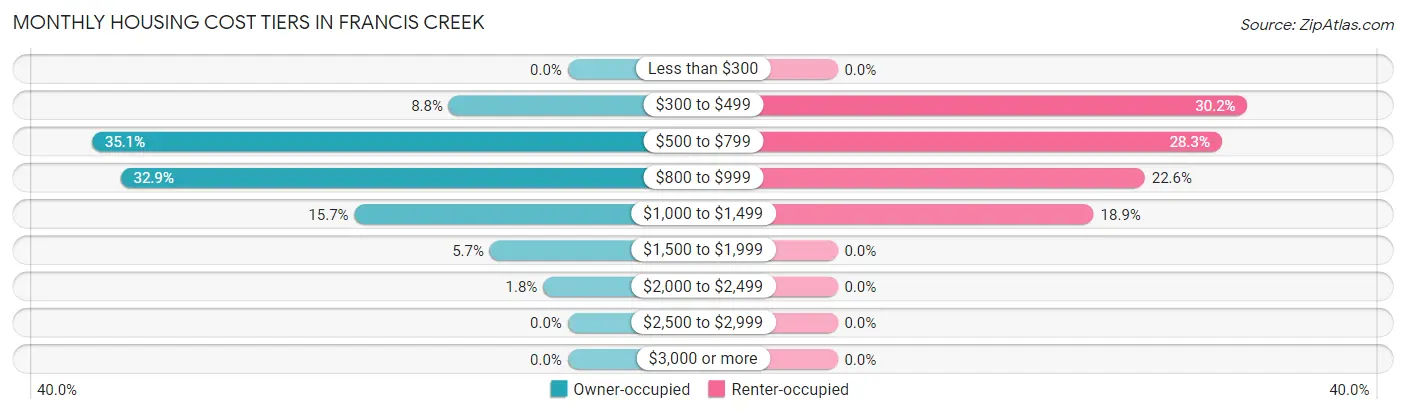
| Monthly Cost | Owner-occupied | Renter-occupied |
| Less than $300 | 0 (0.0%) | 0 (0.0%) |
| $300 to $499 | 29 (8.8%) | 16 (30.2%) |
| $500 to $799 | 116 (35.0%) | 15 (28.3%) |
| $800 to $999 | 109 (32.9%) | 12 (22.6%) |
| $1,000 to $1,499 | 52 (15.7%) | 10 (18.9%) |
| $1,500 to $1,999 | 19 (5.7%) | 0 (0.0%) |
| $2,000 to $2,499 | 6 (1.8%) | 0 (0.0%) |
| $2,500 to $2,999 | 0 (0.0%) | 0 (0.0%) |
| $3,000 or more | 0 (0.0%) | 0 (0.0%) |
| Total | 331 (100.0%) | 53 (100.0%) |
Physical Housing Characteristics in Francis Creek
Housing Structures in Francis Creek
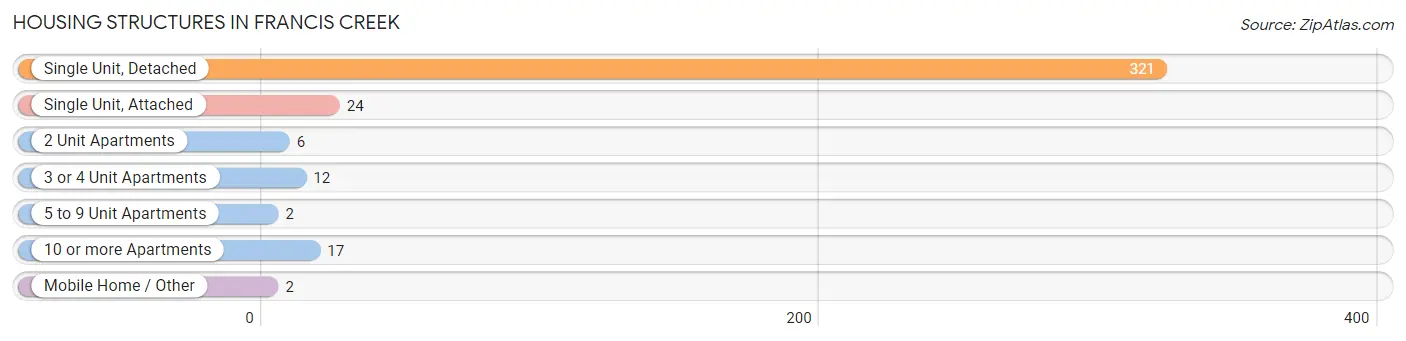
| Structure Type | # Housing Units | % Housing Units |
| Single Unit, Detached | 321 | 83.6% |
| Single Unit, Attached | 24 | 6.2% |
| 2 Unit Apartments | 6 | 1.6% |
| 3 or 4 Unit Apartments | 12 | 3.1% |
| 5 to 9 Unit Apartments | 2 | 0.5% |
| 10 or more Apartments | 17 | 4.4% |
| Mobile Home / Other | 2 | 0.5% |
| Total | 384 | 100.0% |
Housing Structures by Occupancy in Francis Creek
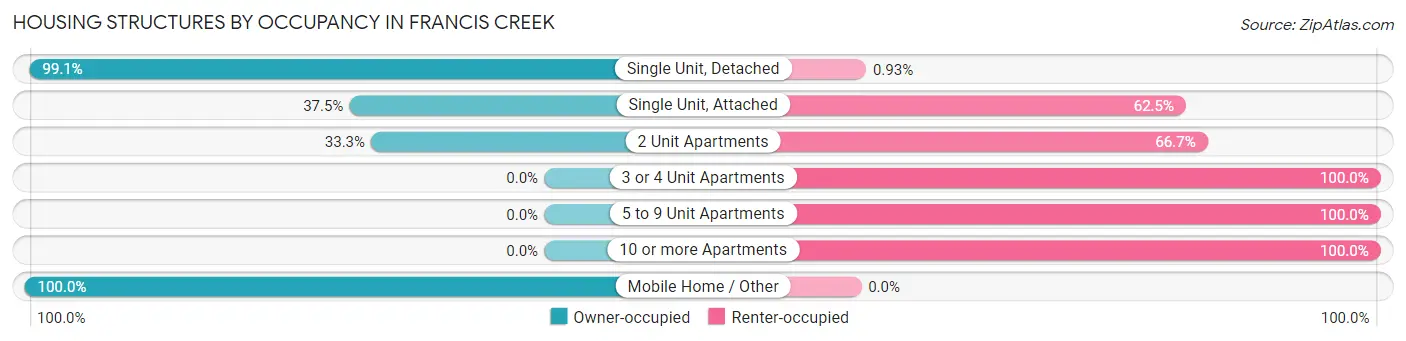
| Structure Type | Owner-occupied | Renter-occupied |
| Single Unit, Detached | 318 (99.1%) | 3 (0.9%) |
| Single Unit, Attached | 9 (37.5%) | 15 (62.5%) |
| 2 Unit Apartments | 2 (33.3%) | 4 (66.7%) |
| 3 or 4 Unit Apartments | 0 (0.0%) | 12 (100.0%) |
| 5 to 9 Unit Apartments | 0 (0.0%) | 2 (100.0%) |
| 10 or more Apartments | 0 (0.0%) | 17 (100.0%) |
| Mobile Home / Other | 2 (100.0%) | 0 (0.0%) |
| Total | 331 (86.2%) | 53 (13.8%) |
Housing Structures by Number of Rooms in Francis Creek
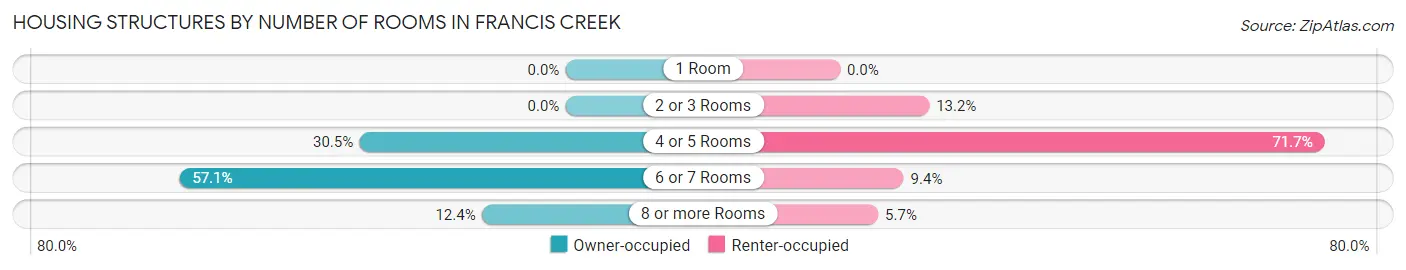
| Number of Rooms | Owner-occupied | Renter-occupied |
| 1 Room | 0 (0.0%) | 0 (0.0%) |
| 2 or 3 Rooms | 0 (0.0%) | 7 (13.2%) |
| 4 or 5 Rooms | 101 (30.5%) | 38 (71.7%) |
| 6 or 7 Rooms | 189 (57.1%) | 5 (9.4%) |
| 8 or more Rooms | 41 (12.4%) | 3 (5.7%) |
| Total | 331 (100.0%) | 53 (100.0%) |
Housing Structure by Heating Type in Francis Creek
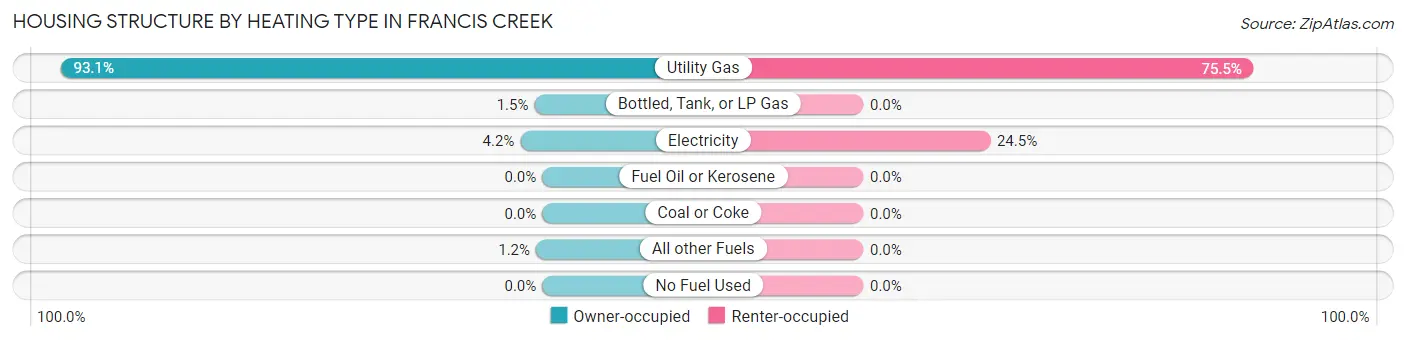
| Heating Type | Owner-occupied | Renter-occupied |
| Utility Gas | 308 (93.0%) | 40 (75.5%) |
| Bottled, Tank, or LP Gas | 5 (1.5%) | 0 (0.0%) |
| Electricity | 14 (4.2%) | 13 (24.5%) |
| Fuel Oil or Kerosene | 0 (0.0%) | 0 (0.0%) |
| Coal or Coke | 0 (0.0%) | 0 (0.0%) |
| All other Fuels | 4 (1.2%) | 0 (0.0%) |
| No Fuel Used | 0 (0.0%) | 0 (0.0%) |
| Total | 331 (100.0%) | 53 (100.0%) |
Household Vehicle Usage in Francis Creek
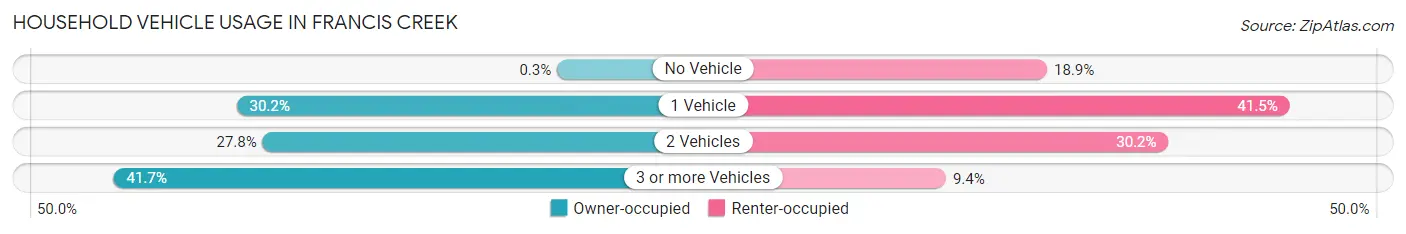
| Vehicles per Household | Owner-occupied | Renter-occupied |
| No Vehicle | 1 (0.3%) | 10 (18.9%) |
| 1 Vehicle | 100 (30.2%) | 22 (41.5%) |
| 2 Vehicles | 92 (27.8%) | 16 (30.2%) |
| 3 or more Vehicles | 138 (41.7%) | 5 (9.4%) |
| Total | 331 (100.0%) | 53 (100.0%) |
Real Estate & Mortgages in Francis Creek
Real Estate and Mortgage Overview in Francis Creek
| Characteristic | Without Mortgage | With Mortgage |
| Housing Units | 212 | 119 |
| Median Property Value | $241,000 | $157,800 |
| Median Household Income | - | - |
| Monthly Housing Costs | $768 | $0 |
| Real Estate Taxes | - | - |
Property Value by Mortgage Status in Francis Creek
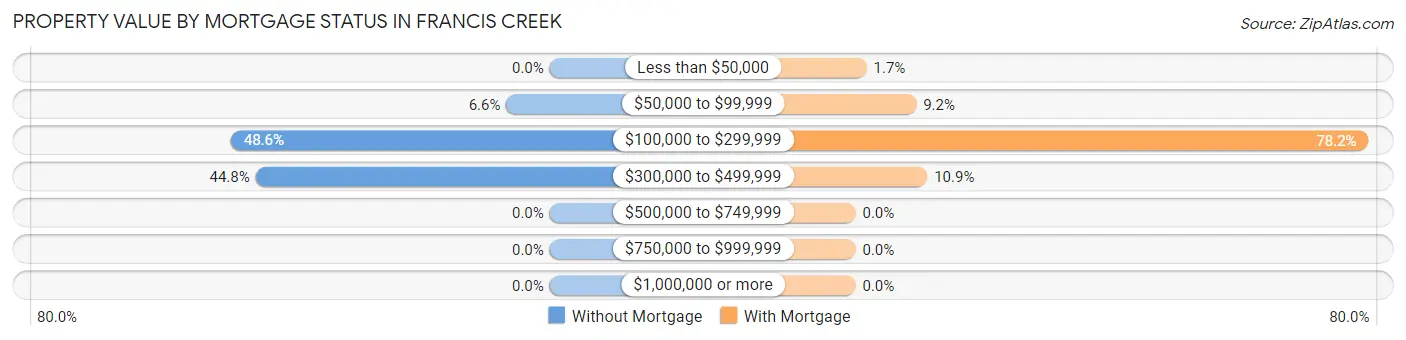
| Property Value | Without Mortgage | With Mortgage |
| Less than $50,000 | 0 (0.0%) | 2 (1.7%) |
| $50,000 to $99,999 | 14 (6.6%) | 11 (9.2%) |
| $100,000 to $299,999 | 103 (48.6%) | 93 (78.1%) |
| $300,000 to $499,999 | 95 (44.8%) | 13 (10.9%) |
| $500,000 to $749,999 | 0 (0.0%) | 0 (0.0%) |
| $750,000 to $999,999 | 0 (0.0%) | 0 (0.0%) |
| $1,000,000 or more | 0 (0.0%) | 0 (0.0%) |
| Total | 212 (100.0%) | 119 (100.0%) |
Household Income by Mortgage Status in Francis Creek
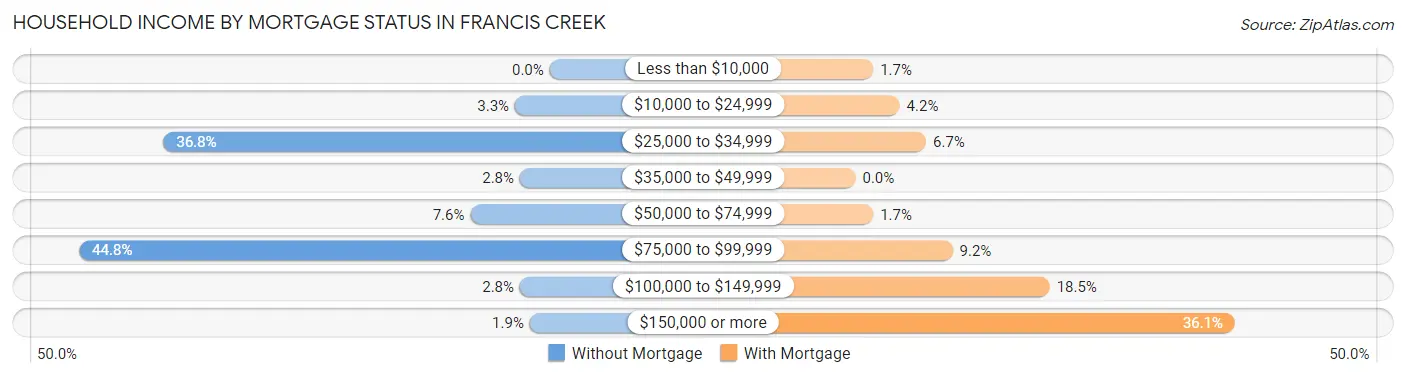
| Household Income | Without Mortgage | With Mortgage |
| Less than $10,000 | 0 (0.0%) | 2 (1.7%) |
| $10,000 to $24,999 | 7 (3.3%) | 5 (4.2%) |
| $25,000 to $34,999 | 78 (36.8%) | 8 (6.7%) |
| $35,000 to $49,999 | 6 (2.8%) | 0 (0.0%) |
| $50,000 to $74,999 | 16 (7.5%) | 2 (1.7%) |
| $75,000 to $99,999 | 95 (44.8%) | 11 (9.2%) |
| $100,000 to $149,999 | 6 (2.8%) | 22 (18.5%) |
| $150,000 or more | 4 (1.9%) | 43 (36.1%) |
| Total | 212 (100.0%) | 119 (100.0%) |
Property Value to Household Income Ratio in Francis Creek
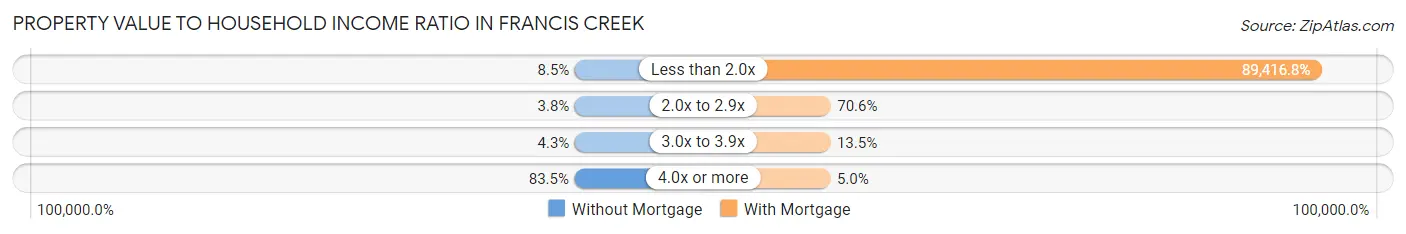
| Value-to-Income Ratio | Without Mortgage | With Mortgage |
| Less than 2.0x | 18 (8.5%) | 106,406 (89,416.8%) |
| 2.0x to 2.9x | 8 (3.8%) | 84 (70.6%) |
| 3.0x to 3.9x | 9 (4.3%) | 16 (13.5%) |
| 4.0x or more | 177 (83.5%) | 6 (5.0%) |
| Total | 212 (100.0%) | 119 (100.0%) |
Real Estate Taxes by Mortgage Status in Francis Creek
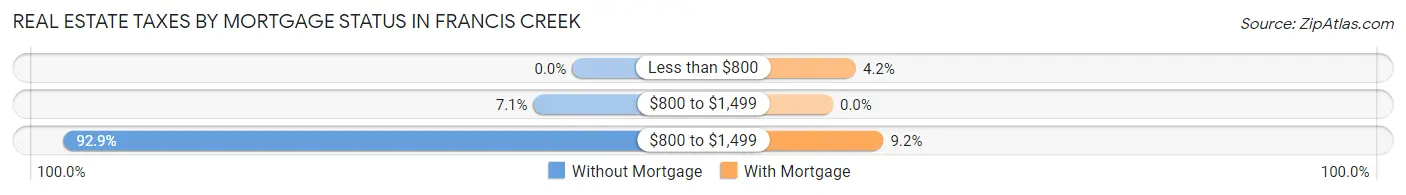
| Property Taxes | Without Mortgage | With Mortgage |
| Less than $800 | 0 (0.0%) | 5 (4.2%) |
| $800 to $1,499 | 15 (7.1%) | 0 (0.0%) |
| $800 to $1,499 | 197 (92.9%) | 11 (9.2%) |
| Total | 212 (100.0%) | 119 (100.0%) |
Health & Disability in Francis Creek
Health Insurance Coverage by Age in Francis Creek
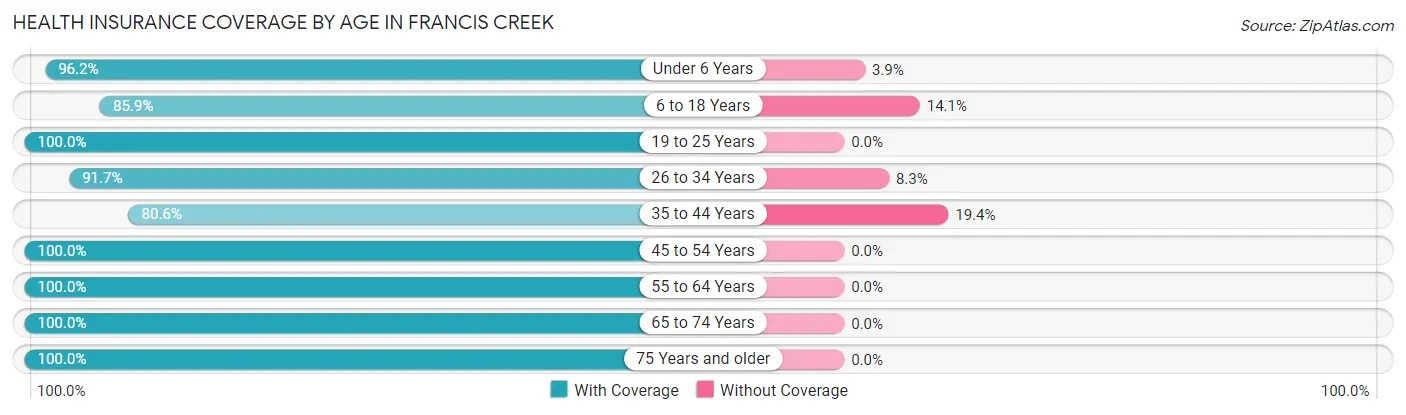
| Age Bracket | With Coverage | Without Coverage |
| Under 6 Years | 50 (96.2%) | 2 (3.8%) |
| 6 to 18 Years | 61 (85.9%) | 10 (14.1%) |
| 19 to 25 Years | 24 (100.0%) | 0 (0.0%) |
| 26 to 34 Years | 55 (91.7%) | 5 (8.3%) |
| 35 to 44 Years | 54 (80.6%) | 13 (19.4%) |
| 45 to 54 Years | 48 (100.0%) | 0 (0.0%) |
| 55 to 64 Years | 101 (100.0%) | 0 (0.0%) |
| 65 to 74 Years | 48 (100.0%) | 0 (0.0%) |
| 75 Years and older | 216 (100.0%) | 0 (0.0%) |
| Total | 657 (95.6%) | 30 (4.4%) |
Health Insurance Coverage by Citizenship Status in Francis Creek
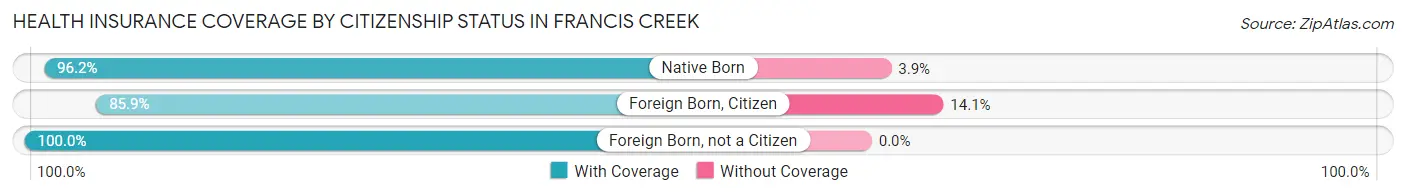
| Citizenship Status | With Coverage | Without Coverage |
| Native Born | 50 (96.2%) | 2 (3.8%) |
| Foreign Born, Citizen | 61 (85.9%) | 10 (14.1%) |
| Foreign Born, not a Citizen | 24 (100.0%) | 0 (0.0%) |
Health Insurance Coverage by Household Income in Francis Creek
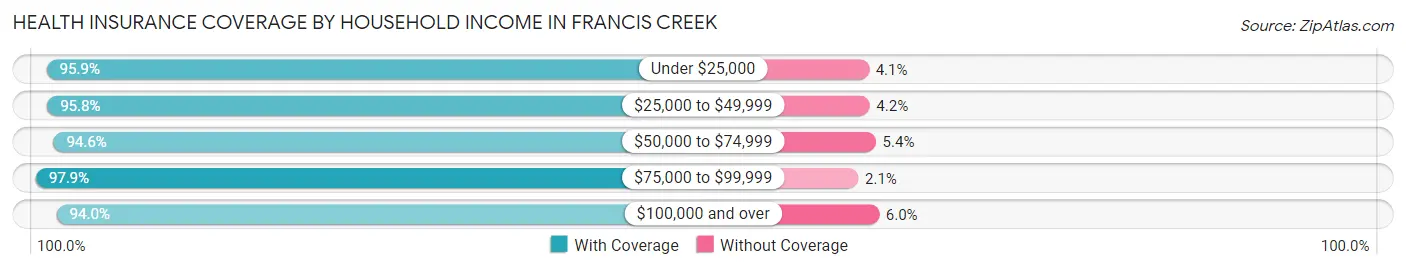
| Household Income | With Coverage | Without Coverage |
| Under $25,000 | 70 (95.9%) | 3 (4.1%) |
| $25,000 to $49,999 | 113 (95.8%) | 5 (4.2%) |
| $50,000 to $74,999 | 70 (94.6%) | 4 (5.4%) |
| $75,000 to $99,999 | 185 (97.9%) | 4 (2.1%) |
| $100,000 and over | 219 (94.0%) | 14 (6.0%) |
Public vs Private Health Insurance Coverage by Age in Francis Creek
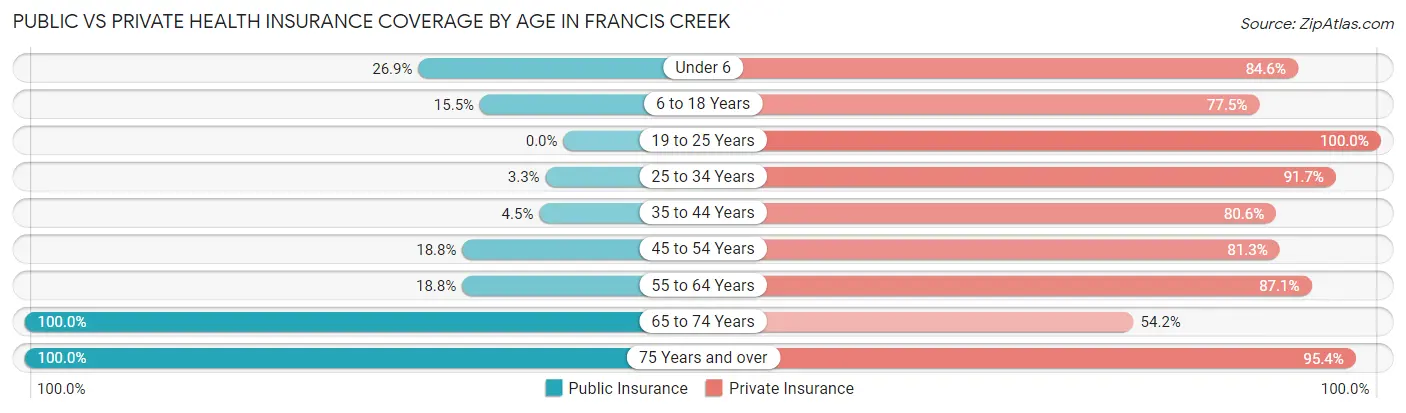
| Age Bracket | Public Insurance | Private Insurance |
| Under 6 | 14 (26.9%) | 44 (84.6%) |
| 6 to 18 Years | 11 (15.5%) | 55 (77.5%) |
| 19 to 25 Years | 0 (0.0%) | 24 (100.0%) |
| 25 to 34 Years | 2 (3.3%) | 55 (91.7%) |
| 35 to 44 Years | 3 (4.5%) | 54 (80.6%) |
| 45 to 54 Years | 9 (18.8%) | 39 (81.2%) |
| 55 to 64 Years | 19 (18.8%) | 88 (87.1%) |
| 65 to 74 Years | 48 (100.0%) | 26 (54.2%) |
| 75 Years and over | 216 (100.0%) | 206 (95.4%) |
| Total | 322 (46.9%) | 591 (86.0%) |
Disability Status by Sex by Age in Francis Creek
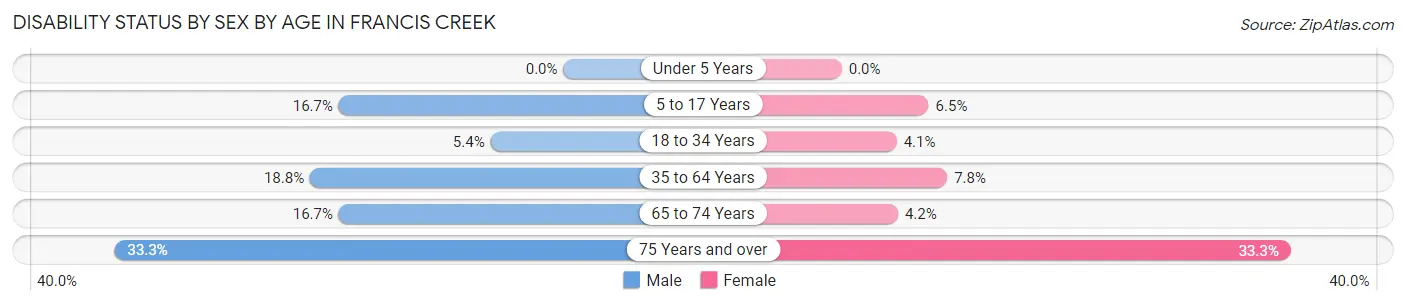
| Age Bracket | Male | Female |
| Under 5 Years | 0 (0.0%) | 0 (0.0%) |
| 5 to 17 Years | 7 (16.7%) | 2 (6.5%) |
| 18 to 34 Years | 2 (5.4%) | 2 (4.1%) |
| 35 to 64 Years | 19 (18.8%) | 9 (7.8%) |
| 65 to 74 Years | 4 (16.7%) | 1 (4.2%) |
| 75 Years and over | 19 (33.3%) | 53 (33.3%) |
Disability Class by Sex by Age in Francis Creek
Disability Class: Hearing Difficulty
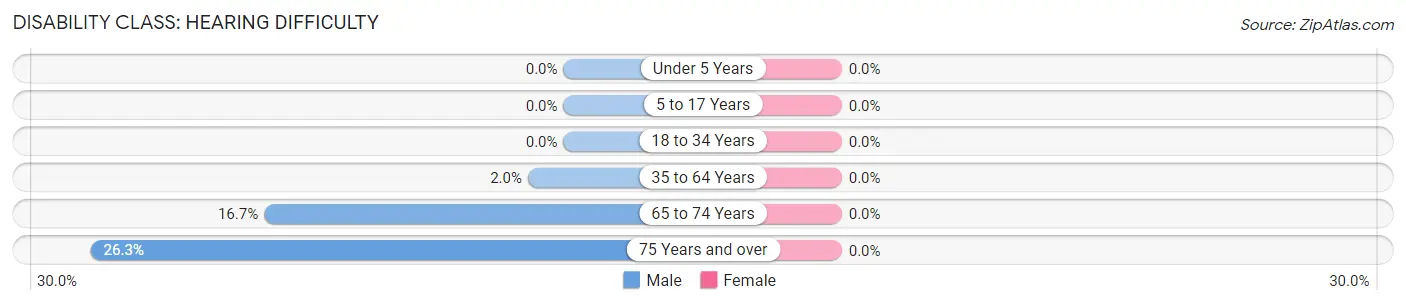
| Age Bracket | Male | Female |
| Under 5 Years | 0 (0.0%) | 0 (0.0%) |
| 5 to 17 Years | 0 (0.0%) | 0 (0.0%) |
| 18 to 34 Years | 0 (0.0%) | 0 (0.0%) |
| 35 to 64 Years | 2 (2.0%) | 0 (0.0%) |
| 65 to 74 Years | 4 (16.7%) | 0 (0.0%) |
| 75 Years and over | 15 (26.3%) | 0 (0.0%) |
Disability Class: Vision Difficulty
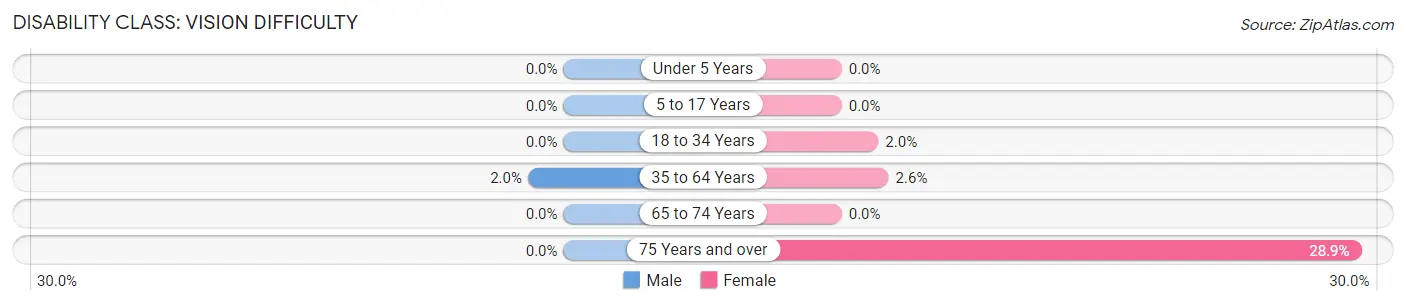
| Age Bracket | Male | Female |
| Under 5 Years | 0 (0.0%) | 0 (0.0%) |
| 5 to 17 Years | 0 (0.0%) | 0 (0.0%) |
| 18 to 34 Years | 0 (0.0%) | 1 (2.0%) |
| 35 to 64 Years | 2 (2.0%) | 3 (2.6%) |
| 65 to 74 Years | 0 (0.0%) | 0 (0.0%) |
| 75 Years and over | 0 (0.0%) | 46 (28.9%) |
Disability Class: Cognitive Difficulty
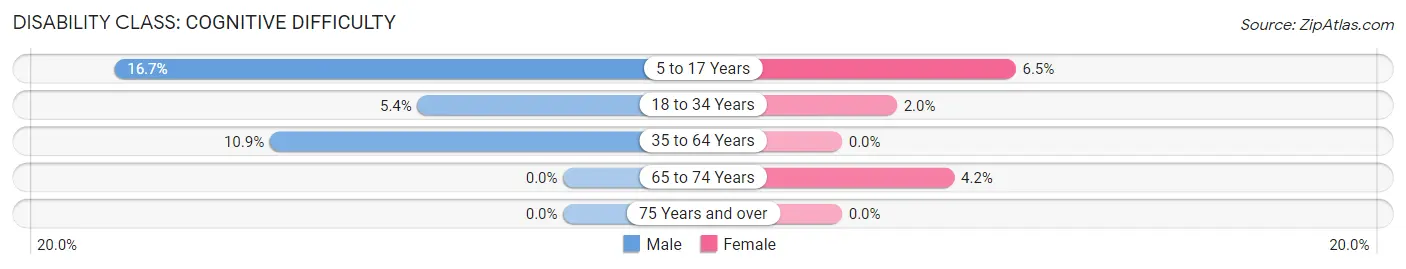
| Age Bracket | Male | Female |
| 5 to 17 Years | 7 (16.7%) | 2 (6.5%) |
| 18 to 34 Years | 2 (5.4%) | 1 (2.0%) |
| 35 to 64 Years | 11 (10.9%) | 0 (0.0%) |
| 65 to 74 Years | 0 (0.0%) | 1 (4.2%) |
| 75 Years and over | 0 (0.0%) | 0 (0.0%) |
Disability Class: Ambulatory Difficulty
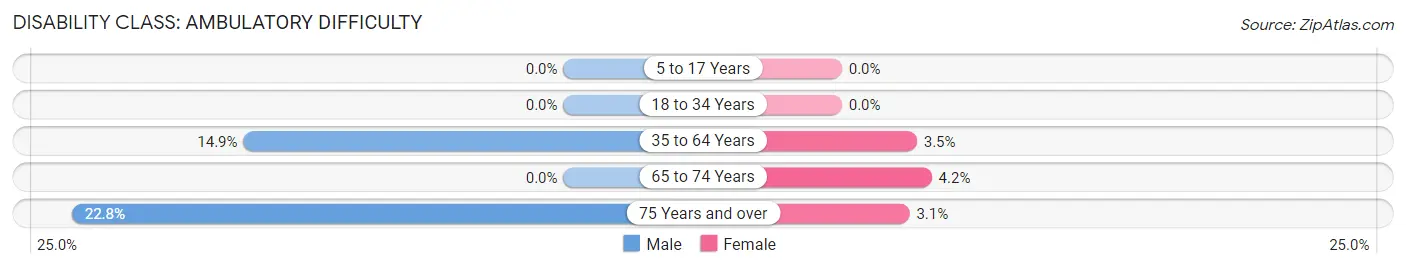
| Age Bracket | Male | Female |
| 5 to 17 Years | 0 (0.0%) | 0 (0.0%) |
| 18 to 34 Years | 0 (0.0%) | 0 (0.0%) |
| 35 to 64 Years | 15 (14.8%) | 4 (3.5%) |
| 65 to 74 Years | 0 (0.0%) | 1 (4.2%) |
| 75 Years and over | 13 (22.8%) | 5 (3.1%) |
Disability Class: Self-Care Difficulty
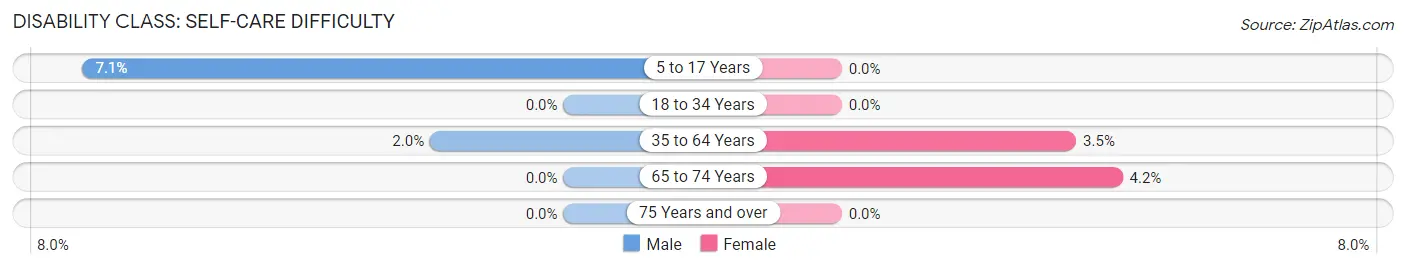
| Age Bracket | Male | Female |
| 5 to 17 Years | 3 (7.1%) | 0 (0.0%) |
| 18 to 34 Years | 0 (0.0%) | 0 (0.0%) |
| 35 to 64 Years | 2 (2.0%) | 4 (3.5%) |
| 65 to 74 Years | 0 (0.0%) | 1 (4.2%) |
| 75 Years and over | 0 (0.0%) | 0 (0.0%) |
Technology Access in Francis Creek
Computing Device Access in Francis Creek
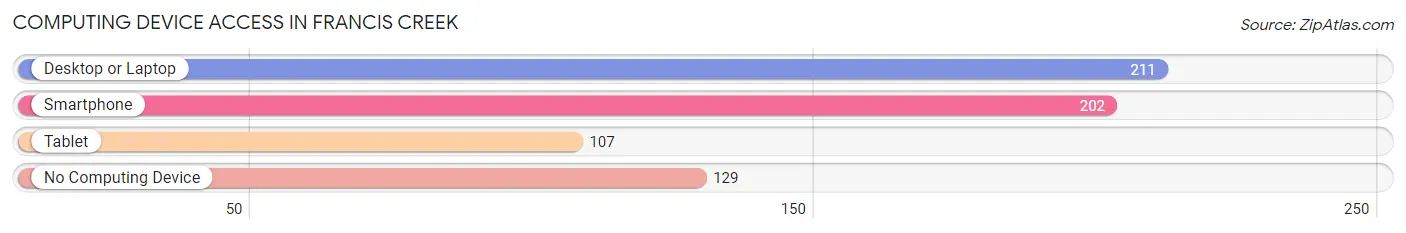
| Device Type | # Households | % Households |
| Desktop or Laptop | 211 | 54.9% |
| Smartphone | 202 | 52.6% |
| Tablet | 107 | 27.9% |
| No Computing Device | 129 | 33.6% |
| Total | 384 | 100.0% |
Internet Access in Francis Creek
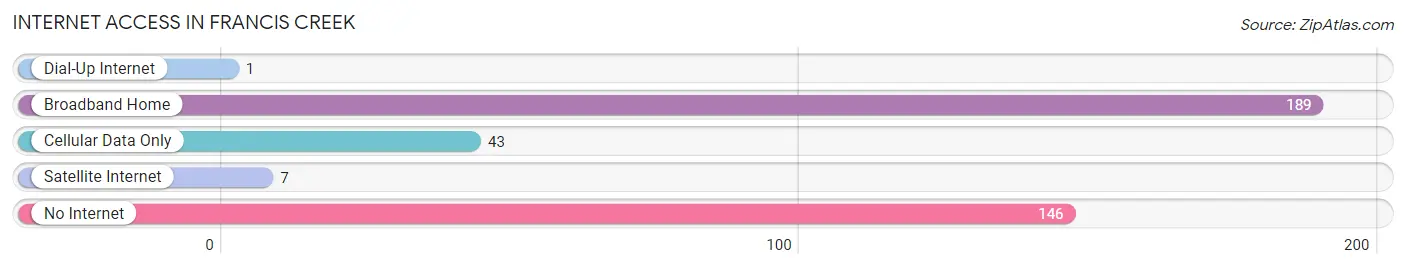
| Internet Type | # Households | % Households |
| Dial-Up Internet | 1 | 0.3% |
| Broadband Home | 189 | 49.2% |
| Cellular Data Only | 43 | 11.2% |
| Satellite Internet | 7 | 1.8% |
| No Internet | 146 | 38.0% |
| Total | 384 | 100.0% |
Francis Creek Summary
Francis Creek is a small unincorporated community located in Manitowoc County, Wisconsin, United States. It is situated in the town of Francis Creek, which is located in the eastern part of the county. The community is located along the Manitowoc River, and is bordered by the towns of Cato, Cooperstown, and Two Rivers.
History
The area that is now Francis Creek was first settled in the early 1800s by a group of German immigrants. The settlement was originally known as “Friedrichs Creek”, after the first settler, Friedrich Schubert. The name was later changed to Francis Creek, after the creek that runs through the area.
The first post office in the area was established in 1854, and the first school was built in 1856. The first church was built in 1858, and the first store was opened in 1859.
The community grew slowly over the years, and by the early 1900s, it had become a thriving farming community. The population peaked in the 1940s, when it reached a high of around 500 people.
Geography
Francis Creek is located in the eastern part of Manitowoc County, in the town of Francis Creek. It is situated along the Manitowoc River, and is bordered by the towns of Cato, Cooperstown, and Two Rivers.
The community is located at an elevation of 745 feet above sea level. The climate is characterized by warm summers and cold winters. The average annual temperature is around 45 degrees Fahrenheit, and the average annual precipitation is around 33 inches.
Economy
The economy of Francis Creek is largely based on agriculture. The area is home to several dairy farms, as well as a number of other farms that produce a variety of crops.
In addition to agriculture, the community is also home to a number of small businesses, including a grocery store, a hardware store, and a few restaurants.
Demographics
As of the 2010 census, the population of Francis Creek was 441. The racial makeup of the community was 97.7% White, 0.2% African American, 0.2% Native American, 0.2% Asian, 0.2% from other races, and 1.7% from two or more races.
The median household income in Francis Creek was $45,000, and the median family income was $50,000. The per capita income was $20,000.
Conclusion
Francis Creek is a small unincorporated community located in Manitowoc County, Wisconsin. It is situated along the Manitowoc River, and is bordered by the towns of Cato, Cooperstown, and Two Rivers. The economy of the community is largely based on agriculture, and the population is around 441 people. The median household income is $45,000, and the median family income is $50,000.
Common Questions
What is Per Capita Income in Francis Creek?
Per Capita income in Francis Creek is $35,028.
What is the Median Family Income in Francis Creek?
Median Family Income in Francis Creek is $93,494.
What is the Median Household income in Francis Creek?
Median Household Income in Francis Creek is $81,667.
What is Income or Wage Gap in Francis Creek?
Income or Wage Gap in Francis Creek is 43.4%.
Women in Francis Creek earn 56.6 cents for every dollar earned by a man.
What is Inequality or Gini Index in Francis Creek?
Inequality or Gini Index in Francis Creek is 0.39.
What is the Total Population of Francis Creek?
Total Population of Francis Creek is 687.
What is the Total Male Population of Francis Creek?
Total Male Population of Francis Creek is 285.
What is the Total Female Population of Francis Creek?
Total Female Population of Francis Creek is 402.
What is the Ratio of Males per 100 Females in Francis Creek?
There are 70.90 Males per 100 Females in Francis Creek.
What is the Ratio of Females per 100 Males in Francis Creek?
There are 141.05 Females per 100 Males in Francis Creek.
What is the Median Population Age in Francis Creek?
Median Population Age in Francis Creek is 57.3 Years.
What is the Average Family Size in Francis Creek
Average Family Size in Francis Creek is 2.1 People.
What is the Average Household Size in Francis Creek
Average Household Size in Francis Creek is 1.8 People.
How Large is the Labor Force in Francis Creek?
There are 258 People in the Labor Forcein in Francis Creek.
What is the Percentage of People in the Labor Force in Francis Creek?
44.9% of People are in the Labor Force in Francis Creek.
What is the Unemployment Rate in Francis Creek?
Unemployment Rate in Francis Creek is 1.2%.