Fox Crossing, WI Map & Demographics
Fox Crossing Map
Fox Crossing Overview
$42,669
PER CAPITA INCOME
$91,899
AVG FAMILY INCOME
$70,664
AVG HOUSEHOLD INCOME
21.0%
WAGE / INCOME GAP [ % ]
79.0¢/ $1
WAGE / INCOME GAP [ $ ]
$15,094
FAMILY INCOME DEFICIT
0.42
INEQUALITY / GINI INDEX
18,949
TOTAL POPULATION
9,367
MALE POPULATION
9,582
FEMALE POPULATION
97.76
MALES / 100 FEMALES
102.30
FEMALES / 100 MALES
39.0
MEDIAN AGE
2.8
AVG FAMILY SIZE
2.1
AVG HOUSEHOLD SIZE
10,602
LABOR FORCE [ PEOPLE ]
66.8%
PERCENT IN LABOR FORCE
1.3%
UNEMPLOYMENT RATE
Income in Fox Crossing
Income Overview in Fox Crossing
Per Capita Income in Fox Crossing is $42,669, while median incomes of families and households are $91,899 and $70,664 respectively.
| Characteristic | Number | Measure |
| Per Capita Income | 18,949 | $42,669 |
| Median Family Income | 4,828 | $91,899 |
| Mean Family Income | 4,828 | $113,531 |
| Median Household Income | 8,866 | $70,664 |
| Mean Household Income | 8,866 | $89,225 |
| Income Deficit | 4,828 | $15,094 |
| Wage / Income Gap (%) | 18,949 | 20.96% |
| Wage / Income Gap ($) | 18,949 | 79.04¢ per $1 |
| Gini / Inequality Index | 18,949 | 0.42 |
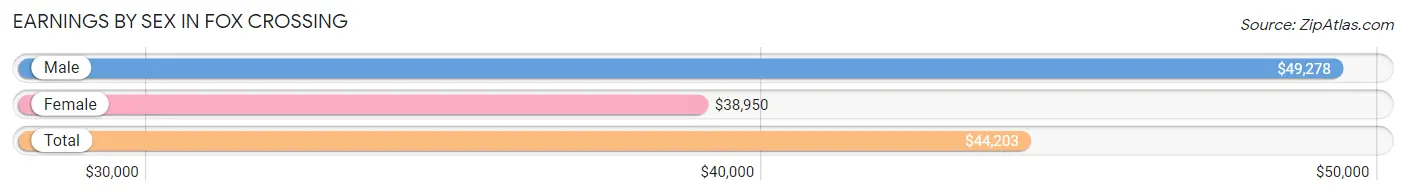
Earnings by Sex in Fox Crossing
Average Earnings in Fox Crossing are $44,203, $49,278 for men and $38,950 for women, a difference of 21.0%.
| Sex | Number | Average Earnings |
| Male | 5,627 (50.0%) | $49,278 |
| Female | 5,621 (50.0%) | $38,950 |
| Total | 11,248 (100.0%) | $44,203 |
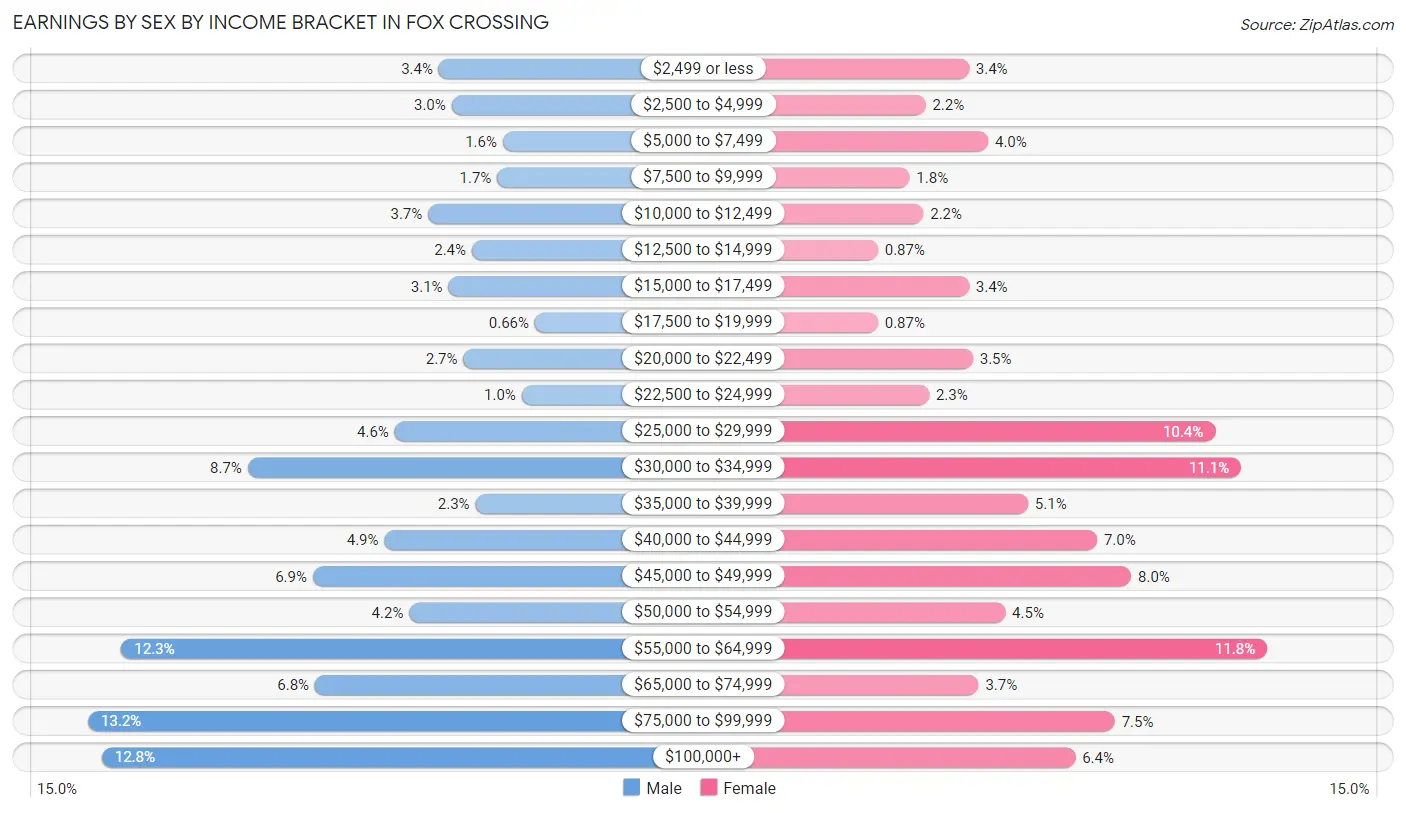
Earnings by Sex by Income Bracket in Fox Crossing
The most common earnings brackets in Fox Crossing are $75,000 to $99,999 for men (744 | 13.2%) and $55,000 to $64,999 for women (664 | 11.8%).
| Income | Male | Female |
| $2,499 or less | 189 (3.4%) | 193 (3.4%) |
| $2,500 to $4,999 | 169 (3.0%) | 124 (2.2%) |
| $5,000 to $7,499 | 88 (1.6%) | 223 (4.0%) |
| $7,500 to $9,999 | 97 (1.7%) | 99 (1.8%) |
| $10,000 to $12,499 | 206 (3.7%) | 121 (2.1%) |
| $12,500 to $14,999 | 137 (2.4%) | 49 (0.9%) |
| $15,000 to $17,499 | 174 (3.1%) | 193 (3.4%) |
| $17,500 to $19,999 | 37 (0.7%) | 49 (0.9%) |
| $20,000 to $22,499 | 150 (2.7%) | 199 (3.5%) |
| $22,500 to $24,999 | 58 (1.0%) | 130 (2.3%) |
| $25,000 to $29,999 | 259 (4.6%) | 582 (10.3%) |
| $30,000 to $34,999 | 491 (8.7%) | 623 (11.1%) |
| $35,000 to $39,999 | 131 (2.3%) | 286 (5.1%) |
| $40,000 to $44,999 | 275 (4.9%) | 395 (7.0%) |
| $45,000 to $49,999 | 388 (6.9%) | 449 (8.0%) |
| $50,000 to $54,999 | 236 (4.2%) | 250 (4.4%) |
| $55,000 to $64,999 | 691 (12.3%) | 664 (11.8%) |
| $65,000 to $74,999 | 385 (6.8%) | 208 (3.7%) |
| $75,000 to $99,999 | 744 (13.2%) | 423 (7.5%) |
| $100,000+ | 722 (12.8%) | 361 (6.4%) |
| Total | 5,627 (100.0%) | 5,621 (100.0%) |
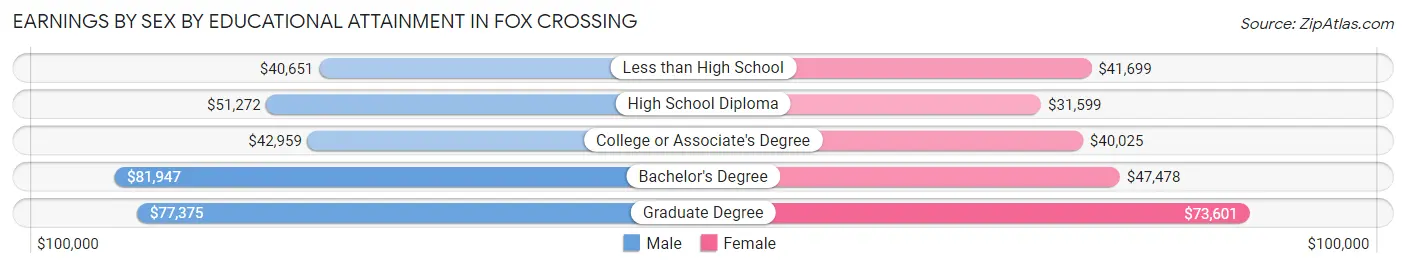
Earnings by Sex by Educational Attainment in Fox Crossing
Average earnings in Fox Crossing are $55,570 for men and $41,495 for women, a difference of 25.3%. Men with an educational attainment of bachelor's degree enjoy the highest average annual earnings of $81,947, while those with less than high school education earn the least with $40,651. Women with an educational attainment of graduate degree earn the most with the average annual earnings of $73,601, while those with high school diploma education have the smallest earnings of $31,599.
| Educational Attainment | Male Income | Female Income |
| Less than High School | $40,651 | $41,699 |
| High School Diploma | $51,272 | $31,599 |
| College or Associate's Degree | $42,959 | $40,025 |
| Bachelor's Degree | $81,947 | $47,478 |
| Graduate Degree | $77,375 | $73,601 |
| Total | $55,570 | $41,495 |
Family Income in Fox Crossing
Family Income Brackets in Fox Crossing
According to the Fox Crossing family income data, there are 1,164 families falling into the $100,000 to $149,999 income range, which is the most common income bracket and makes up 24.1% of all families. Conversely, the less than $10,000 income bracket is the least frequent group with only 68 families (1.4%) belonging to this category.
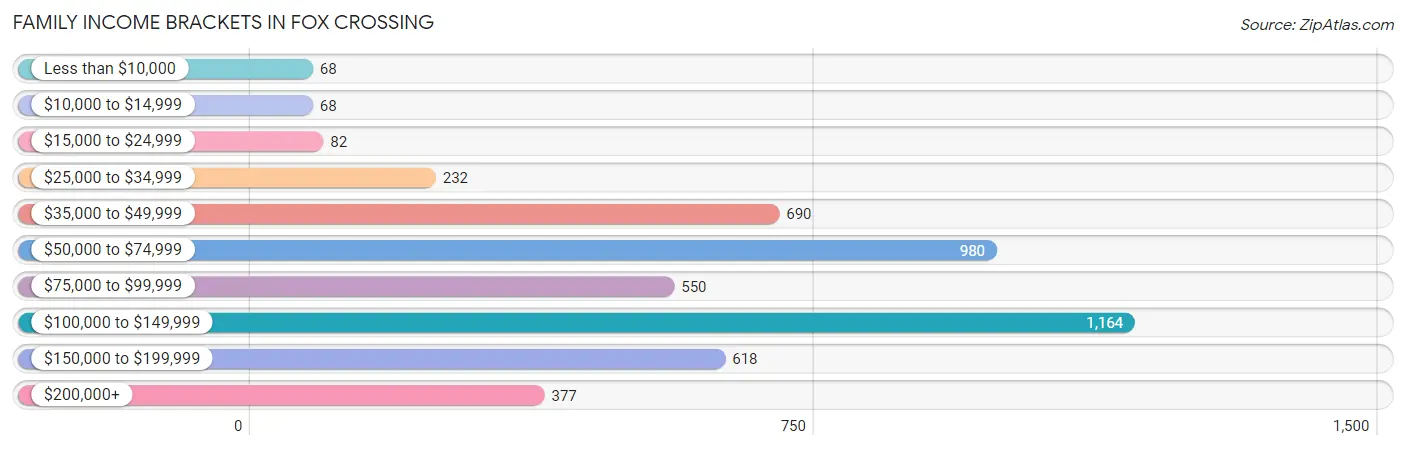
| Income Bracket | # Families | % Families |
| Less than $10,000 | 68 | 1.4% |
| $10,000 to $14,999 | 68 | 1.4% |
| $15,000 to $24,999 | 82 | 1.7% |
| $25,000 to $34,999 | 232 | 4.8% |
| $35,000 to $49,999 | 690 | 14.3% |
| $50,000 to $74,999 | 980 | 20.3% |
| $75,000 to $99,999 | 550 | 11.4% |
| $100,000 to $149,999 | 1,164 | 24.1% |
| $150,000 to $199,999 | 618 | 12.8% |
| $200,000+ | 377 | 7.8% |
Family Income by Famaliy Size in Fox Crossing
4-person families (818 | 16.9%) account for the highest median family income in Fox Crossing with $123,250 per family, while 3-person families (973 | 20.2%) have the highest median income of $38,031 per family member.
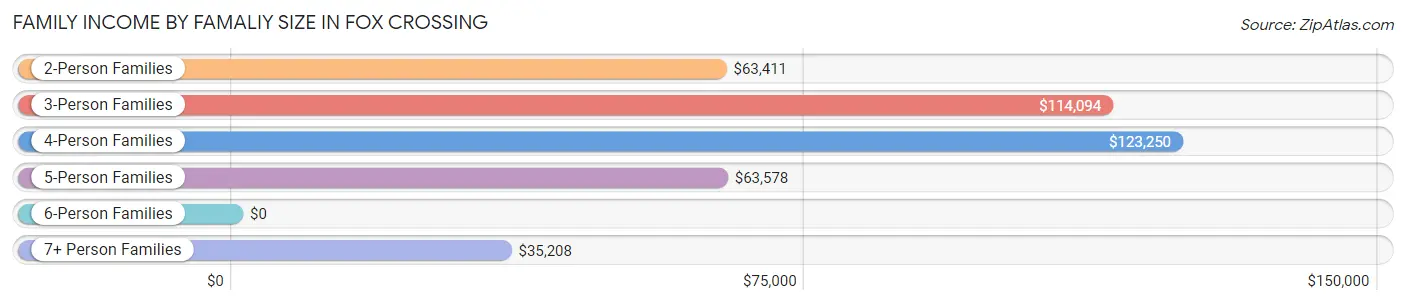
| Income Bracket | # Families | Median Income |
| 2-Person Families | 2,671 (55.3%) | $63,411 |
| 3-Person Families | 973 (20.2%) | $114,094 |
| 4-Person Families | 818 (16.9%) | $123,250 |
| 5-Person Families | 294 (6.1%) | $63,578 |
| 6-Person Families | 16 (0.3%) | $0 |
| 7+ Person Families | 56 (1.2%) | $35,208 |
| Total | 4,828 (100.0%) | $91,899 |
Family Income by Number of Earners in Fox Crossing
The median family income in Fox Crossing is $91,899, with families comprising 3+ earners (612) having the highest median family income of $127,870, while families with 1 earner (1,185) have the lowest median family income of $47,639, accounting for 12.7% and 24.5% of families, respectively.
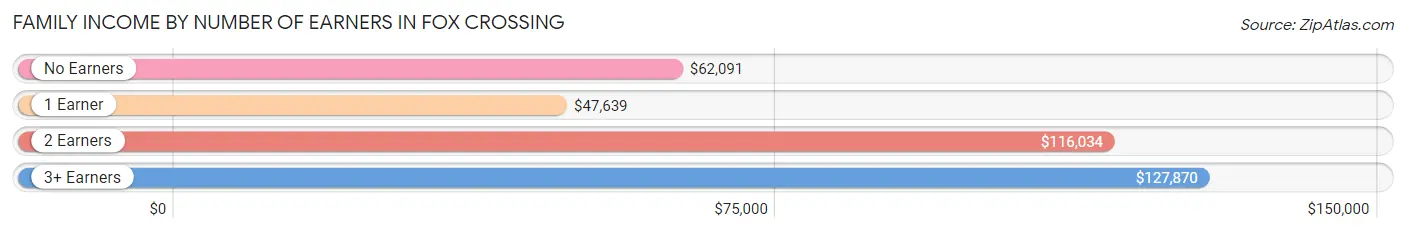
| Number of Earners | # Families | Median Income |
| No Earners | 857 (17.7%) | $62,091 |
| 1 Earner | 1,185 (24.5%) | $47,639 |
| 2 Earners | 2,174 (45.0%) | $116,034 |
| 3+ Earners | 612 (12.7%) | $127,870 |
| Total | 4,828 (100.0%) | $91,899 |
Household Income in Fox Crossing
Household Income Brackets in Fox Crossing
With 1,888 households falling in the category, the $50,000 to $74,999 income range is the most frequent in Fox Crossing, accounting for 21.3% of all households. In contrast, only 213 households (2.4%) fall into the $10,000 to $14,999 income bracket, making it the least populous group.
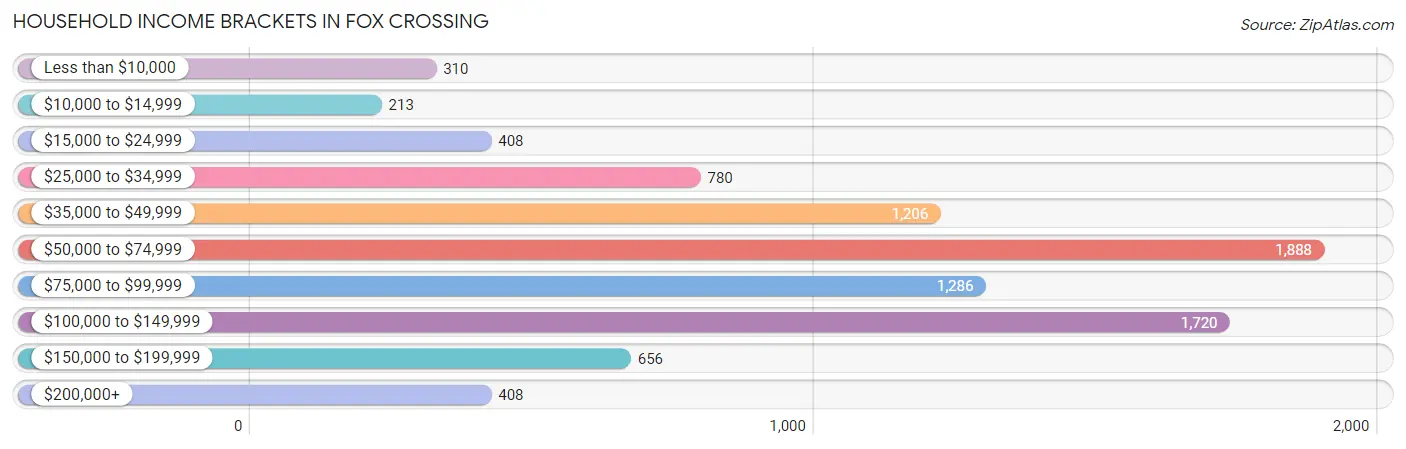
| Income Bracket | # Households | % Households |
| Less than $10,000 | 310 | 3.5% |
| $10,000 to $14,999 | 213 | 2.4% |
| $15,000 to $24,999 | 408 | 4.6% |
| $25,000 to $34,999 | 780 | 8.8% |
| $35,000 to $49,999 | 1,206 | 13.6% |
| $50,000 to $74,999 | 1,888 | 21.3% |
| $75,000 to $99,999 | 1,286 | 14.5% |
| $100,000 to $149,999 | 1,720 | 19.4% |
| $150,000 to $199,999 | 656 | 7.4% |
| $200,000+ | 408 | 4.6% |
Household Income by Householder Age in Fox Crossing
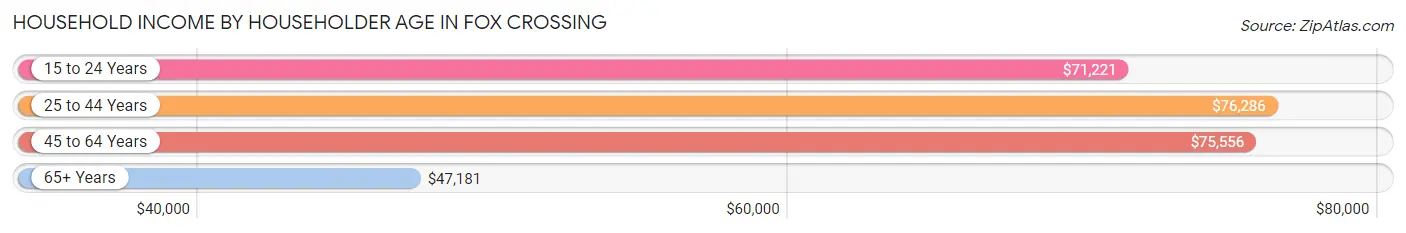
The median household income in Fox Crossing is $70,664, with the highest median household income of $76,286 found in the 25 to 44 years age bracket for the primary householder. A total of 2,811 households (31.7%) fall into this category. Meanwhile, the 65+ years age bracket for the primary householder has the lowest median household income of $47,181, with 2,245 households (25.3%) in this group.
| Income Bracket | # Households | Median Income |
| 15 to 24 Years | 802 (9.0%) | $71,221 |
| 25 to 44 Years | 2,811 (31.7%) | $76,286 |
| 45 to 64 Years | 3,008 (33.9%) | $75,556 |
| 65+ Years | 2,245 (25.3%) | $47,181 |
| Total | 8,866 (100.0%) | $70,664 |
Poverty in Fox Crossing
Income Below Poverty by Sex and Age in Fox Crossing
With 8.6% poverty level for males and 8.2% for females among the residents of Fox Crossing, 5 year old males and 5 year old females are the most vulnerable to poverty, with 30 males (21.1%) and 25 females (23.4%) in their respective age groups living below the poverty level.
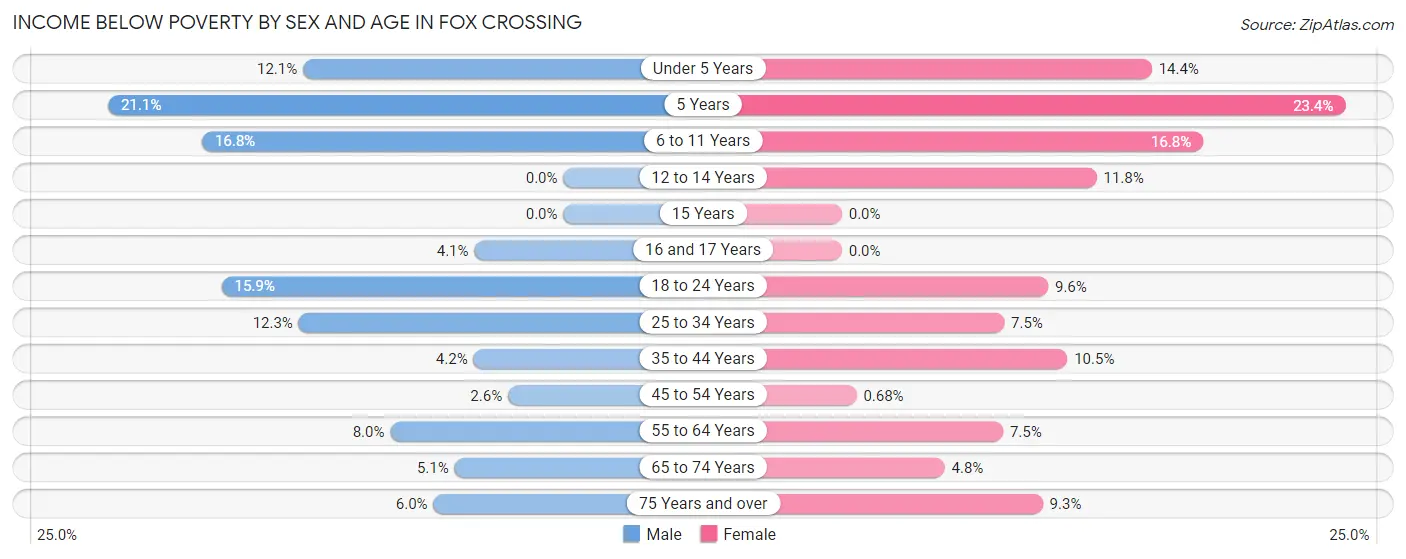
| Age Bracket | Male | Female |
| Under 5 Years | 93 (12.1%) | 63 (14.4%) |
| 5 Years | 30 (21.1%) | 25 (23.4%) |
| 6 to 11 Years | 82 (16.8%) | 92 (16.8%) |
| 12 to 14 Years | 0 (0.0%) | 35 (11.8%) |
| 15 Years | 0 (0.0%) | 0 (0.0%) |
| 16 and 17 Years | 10 (4.1%) | 0 (0.0%) |
| 18 to 24 Years | 114 (15.9%) | 113 (9.6%) |
| 25 to 34 Years | 208 (12.3%) | 110 (7.5%) |
| 35 to 44 Years | 44 (4.2%) | 106 (10.5%) |
| 45 to 54 Years | 27 (2.6%) | 7 (0.7%) |
| 55 to 64 Years | 105 (8.0%) | 104 (7.5%) |
| 65 to 74 Years | 49 (5.1%) | 52 (4.8%) |
| 75 Years and over | 43 (6.0%) | 71 (9.3%) |
| Total | 805 (8.6%) | 778 (8.2%) |
Income Above Poverty by Sex and Age in Fox Crossing
According to the poverty statistics in Fox Crossing, males aged 12 to 14 years and females aged 15 years are the age groups that are most secure financially, with 100.0% of males and 100.0% of females in these age groups living above the poverty line.
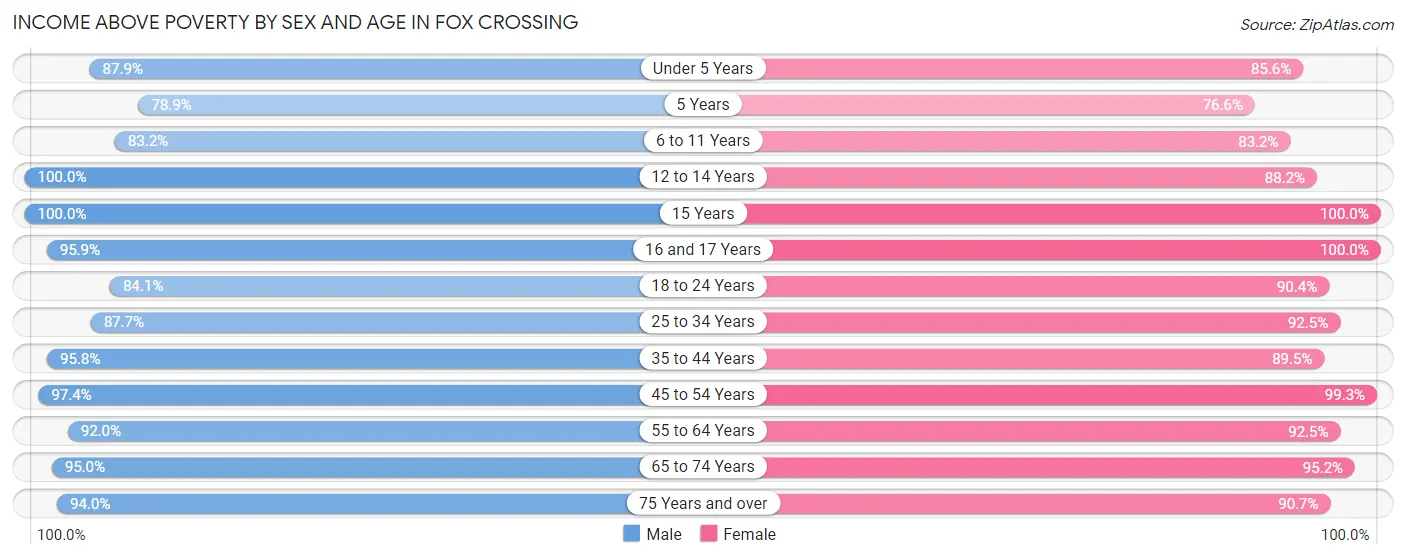
| Age Bracket | Male | Female |
| Under 5 Years | 677 (87.9%) | 375 (85.6%) |
| 5 Years | 112 (78.9%) | 82 (76.6%) |
| 6 to 11 Years | 407 (83.2%) | 457 (83.2%) |
| 12 to 14 Years | 186 (100.0%) | 261 (88.2%) |
| 15 Years | 7 (100.0%) | 54 (100.0%) |
| 16 and 17 Years | 232 (95.9%) | 129 (100.0%) |
| 18 to 24 Years | 605 (84.1%) | 1,068 (90.4%) |
| 25 to 34 Years | 1,486 (87.7%) | 1,351 (92.5%) |
| 35 to 44 Years | 1,010 (95.8%) | 907 (89.5%) |
| 45 to 54 Years | 1,023 (97.4%) | 1,022 (99.3%) |
| 55 to 64 Years | 1,202 (92.0%) | 1,286 (92.5%) |
| 65 to 74 Years | 921 (95.0%) | 1,038 (95.2%) |
| 75 Years and over | 670 (94.0%) | 691 (90.7%) |
| Total | 8,538 (91.4%) | 8,721 (91.8%) |
Income Below Poverty Among Married-Couple Families in Fox Crossing
The poverty statistics for married-couple families in Fox Crossing show that 2.3% or 89 of the total 3,924 families live below the poverty line. Families with 5 or more children have the highest poverty rate of 100.0%, comprising of 50 families. On the other hand, families with 1 or 2 children have the lowest poverty rate of 0.0%, which includes 0 families.
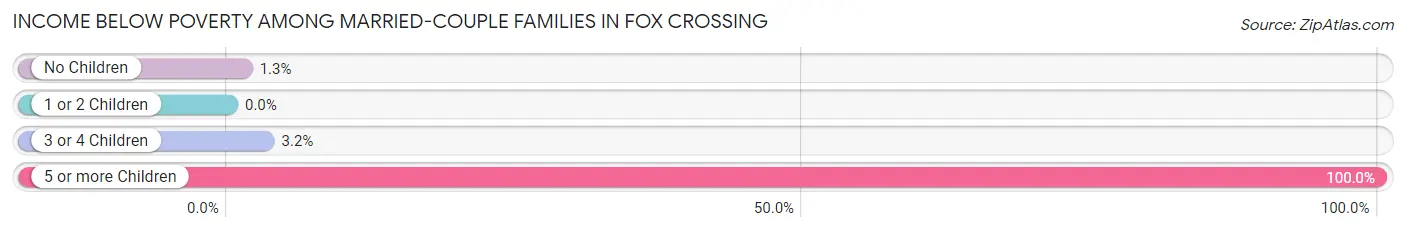
| Children | Above Poverty | Below Poverty |
| No Children | 2,460 (98.7%) | 32 (1.3%) |
| 1 or 2 Children | 1,162 (100.0%) | 0 (0.0%) |
| 3 or 4 Children | 213 (96.8%) | 7 (3.2%) |
| 5 or more Children | 0 (0.0%) | 50 (100.0%) |
| Total | 3,835 (97.7%) | 89 (2.3%) |
Income Below Poverty Among Single-Parent Households in Fox Crossing
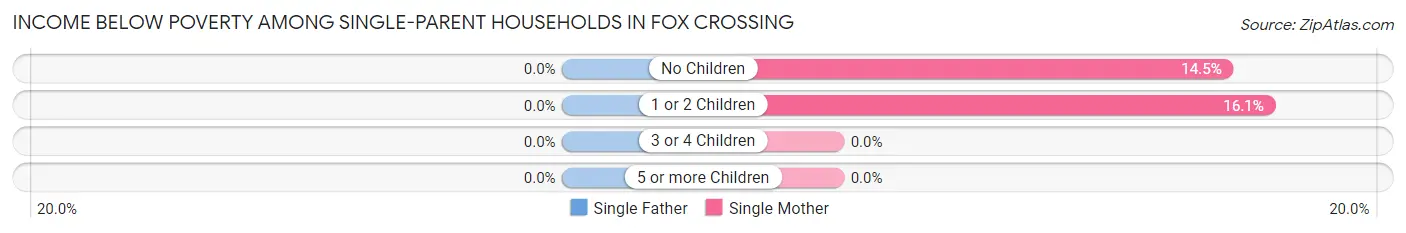
| Children | Single Father | Single Mother |
| No Children | 0 (0.0%) | 27 (14.5%) |
| 1 or 2 Children | 0 (0.0%) | 70 (16.1%) |
| 3 or 4 Children | 0 (0.0%) | 0 (0.0%) |
| 5 or more Children | 0 (0.0%) | 0 (0.0%) |
| Total | 0 (0.0%) | 97 (14.8%) |
Income Below Poverty Among Married-Couple vs Single-Parent Households in Fox Crossing
The poverty data for Fox Crossing shows that 89 of the married-couple family households (2.3%) and 97 of the single-parent households (10.7%) are living below the poverty level. Within the married-couple family households, those with 5 or more children have the highest poverty rate, with 50 households (100.0%) falling below the poverty line. Among the single-parent households, those with 1 or 2 children have the highest poverty rate, with 70 household (11.8%) living below poverty.
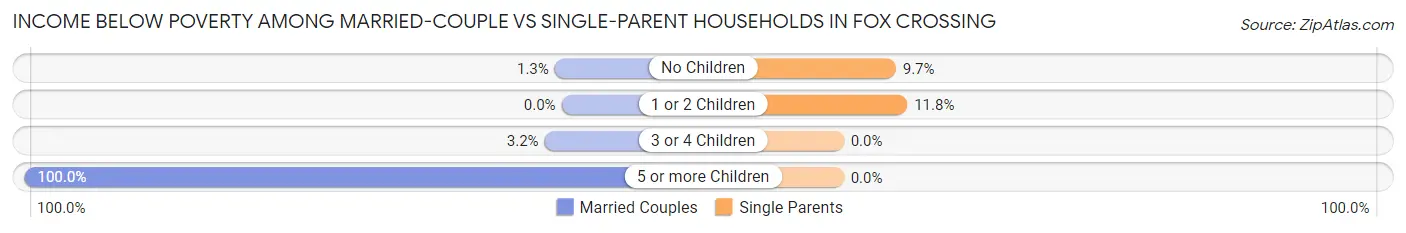
| Children | Married-Couple Families | Single-Parent Households |
| No Children | 32 (1.3%) | 27 (9.7%) |
| 1 or 2 Children | 0 (0.0%) | 70 (11.8%) |
| 3 or 4 Children | 7 (3.2%) | 0 (0.0%) |
| 5 or more Children | 50 (100.0%) | 0 (0.0%) |
| Total | 89 (2.3%) | 97 (10.7%) |
Race in Fox Crossing
The most populous races in Fox Crossing are White / Caucasian (17,104 | 90.3%), Hispanic or Latino (1,220 | 6.4%), and Two or more Races (872 | 4.6%).
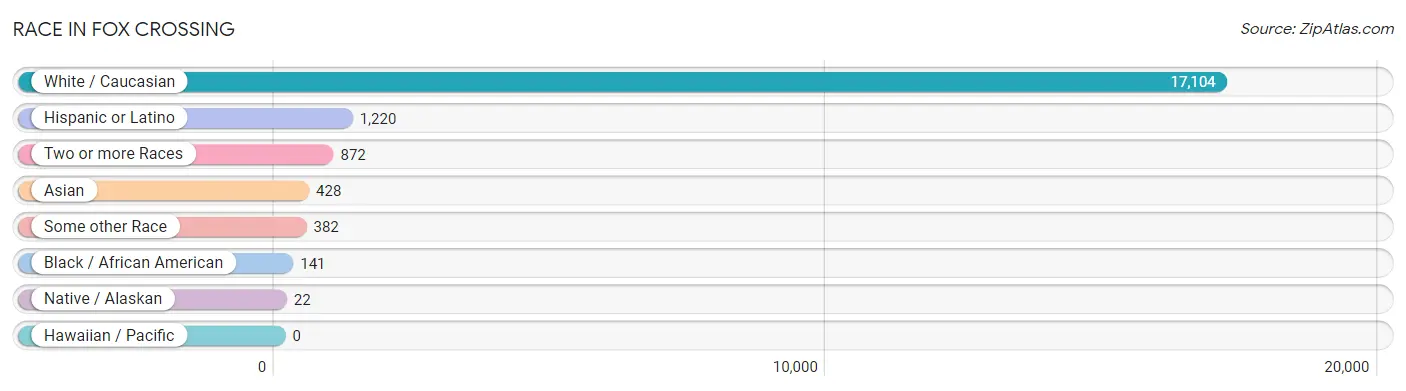
| Race | # Population | % Population |
| Asian | 428 | 2.3% |
| Black / African American | 141 | 0.7% |
| Hawaiian / Pacific | 0 | 0.0% |
| Hispanic or Latino | 1,220 | 6.4% |
| Native / Alaskan | 22 | 0.1% |
| White / Caucasian | 17,104 | 90.3% |
| Two or more Races | 872 | 4.6% |
| Some other Race | 382 | 2.0% |
| Total | 18,949 | 100.0% |
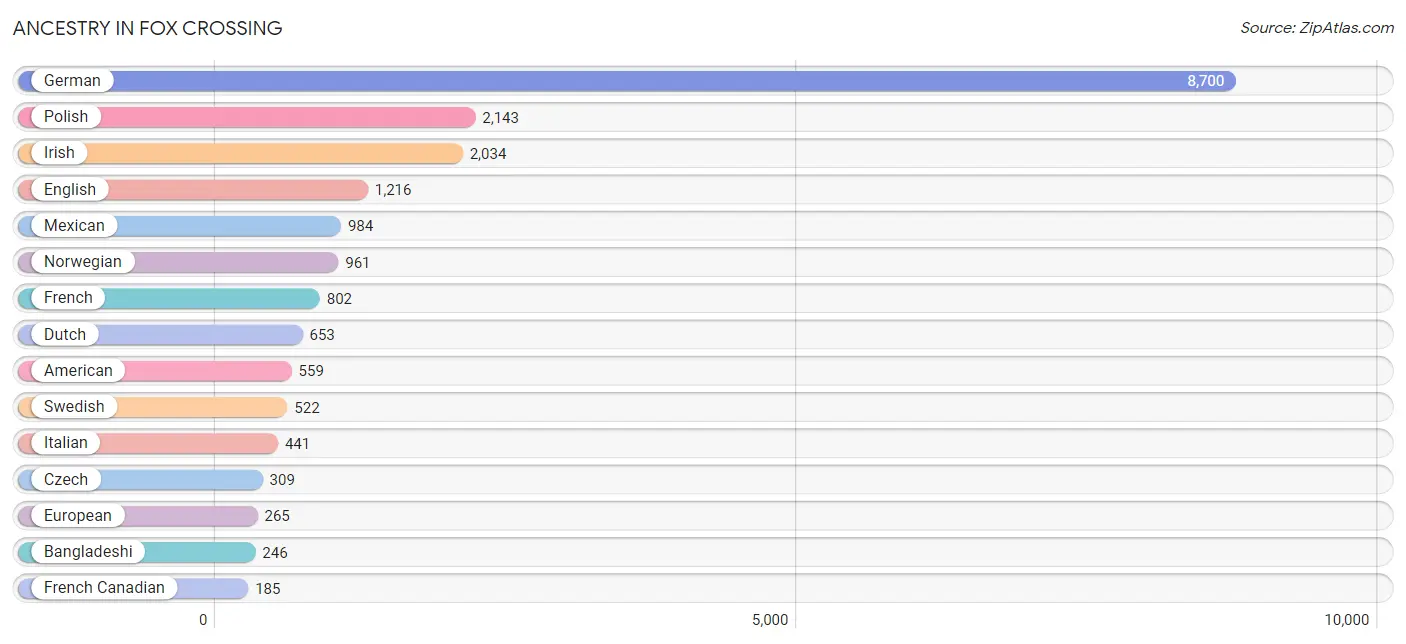
Ancestry in Fox Crossing
The most populous ancestries reported in Fox Crossing are German (8,700 | 45.9%), Polish (2,143 | 11.3%), Irish (2,034 | 10.7%), English (1,216 | 6.4%), and Mexican (984 | 5.2%), together accounting for 79.6% of all Fox Crossing residents.
| Ancestry | # Population | % Population |
| American | 559 | 2.9% |
| Austrian | 29 | 0.2% |
| Bangladeshi | 246 | 1.3% |
| Belgian | 146 | 0.8% |
| Bhutanese | 97 | 0.5% |
| Blackfeet | 10 | 0.1% |
| Brazilian | 10 | 0.1% |
| Bulgarian | 28 | 0.2% |
| Burmese | 9 | 0.1% |
| Central American | 15 | 0.1% |
| Central American Indian | 17 | 0.1% |
| Colombian | 27 | 0.1% |
| Croatian | 26 | 0.1% |
| Czech | 309 | 1.6% |
| Czechoslovakian | 31 | 0.2% |
| Danish | 110 | 0.6% |
| Dutch | 653 | 3.5% |
| English | 1,216 | 6.4% |
| European | 265 | 1.4% |
| Finnish | 133 | 0.7% |
| French | 802 | 4.2% |
| French American Indian | 13 | 0.1% |
| French Canadian | 185 | 1.0% |
| German | 8,700 | 45.9% |
| Greek | 25 | 0.1% |
| Guatemalan | 15 | 0.1% |
| Hungarian | 115 | 0.6% |
| Icelander | 14 | 0.1% |
| Irish | 2,034 | 10.7% |
| Italian | 441 | 2.3% |
| Jamaican | 49 | 0.3% |
| Korean | 36 | 0.2% |
| Lithuanian | 7 | 0.0% |
| Mexican | 984 | 5.2% |
| Nigerian | 10 | 0.1% |
| Northern European | 48 | 0.3% |
| Norwegian | 961 | 5.1% |
| Pakistani | 17 | 0.1% |
| Polish | 2,143 | 11.3% |
| Potawatomi | 47 | 0.3% |
| Puerto Rican | 151 | 0.8% |
| Puget Sound Salish | 15 | 0.1% |
| Romanian | 105 | 0.5% |
| Russian | 104 | 0.5% |
| Scandinavian | 98 | 0.5% |
| Scotch-Irish | 31 | 0.2% |
| Scottish | 158 | 0.8% |
| Slovak | 13 | 0.1% |
| Slovene | 18 | 0.1% |
| South American | 70 | 0.4% |
| Sri Lankan | 158 | 0.8% |
| Subsaharan African | 10 | 0.1% |
| Swedish | 522 | 2.8% |
| Swiss | 176 | 0.9% |
| Thai | 99 | 0.5% |
| Ukrainian | 20 | 0.1% |
| Venezuelan | 43 | 0.2% |
| Welsh | 31 | 0.2% |
| Yaqui | 17 | 0.1% | View All 59 Rows |
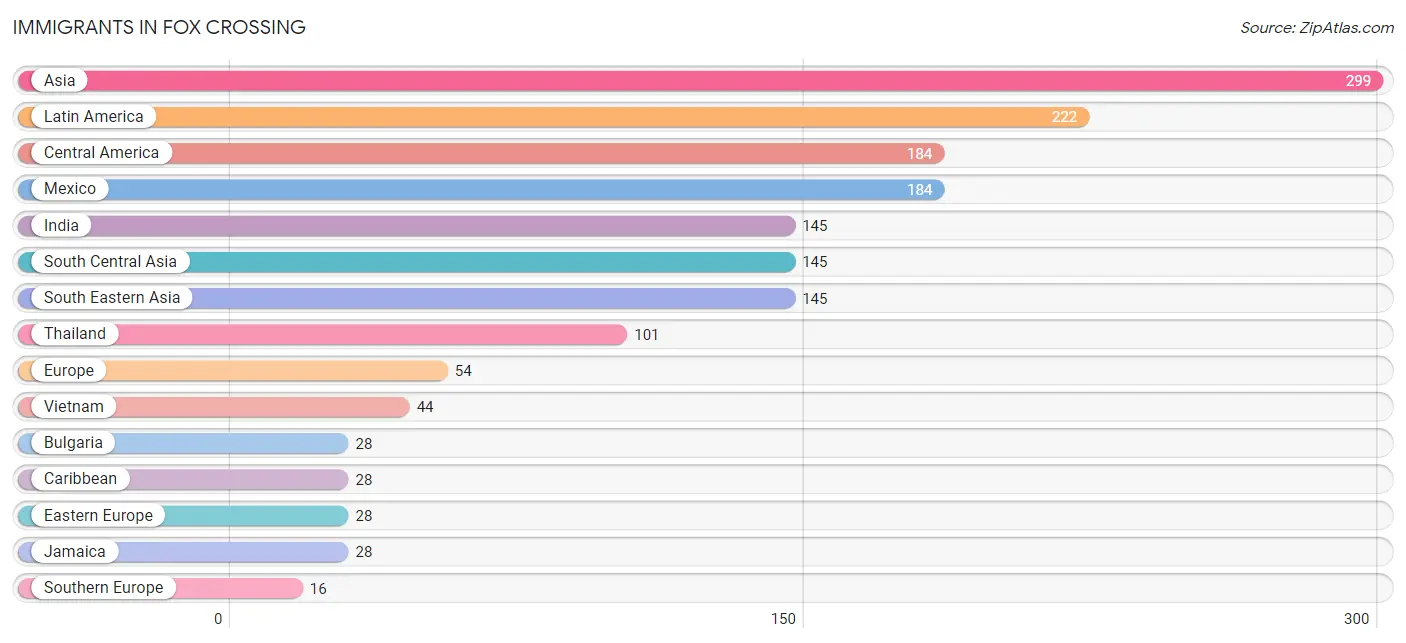
Immigrants in Fox Crossing
The most numerous immigrant groups reported in Fox Crossing came from Asia (299 | 1.6%), Latin America (222 | 1.2%), Central America (184 | 1.0%), Mexico (184 | 1.0%), and India (145 | 0.8%), together accounting for 5.5% of all Fox Crossing residents.
| Immigration Origin | # Population | % Population |
| Africa | 10 | 0.1% |
| Asia | 299 | 1.6% |
| Brazil | 10 | 0.1% |
| Bulgaria | 28 | 0.2% |
| Canada | 9 | 0.1% |
| Caribbean | 28 | 0.2% |
| Central America | 184 | 1.0% |
| Eastern Asia | 9 | 0.1% |
| Eastern Europe | 28 | 0.2% |
| Europe | 54 | 0.3% |
| Germany | 10 | 0.1% |
| India | 145 | 0.8% |
| Jamaica | 28 | 0.2% |
| Korea | 9 | 0.1% |
| Latin America | 222 | 1.2% |
| Mexico | 184 | 1.0% |
| Nigeria | 10 | 0.1% |
| South America | 10 | 0.1% |
| South Central Asia | 145 | 0.8% |
| South Eastern Asia | 145 | 0.8% |
| Southern Europe | 16 | 0.1% |
| Spain | 16 | 0.1% |
| Thailand | 101 | 0.5% |
| Vietnam | 44 | 0.2% |
| Western Africa | 10 | 0.1% |
| Western Europe | 10 | 0.1% | View All 26 Rows |
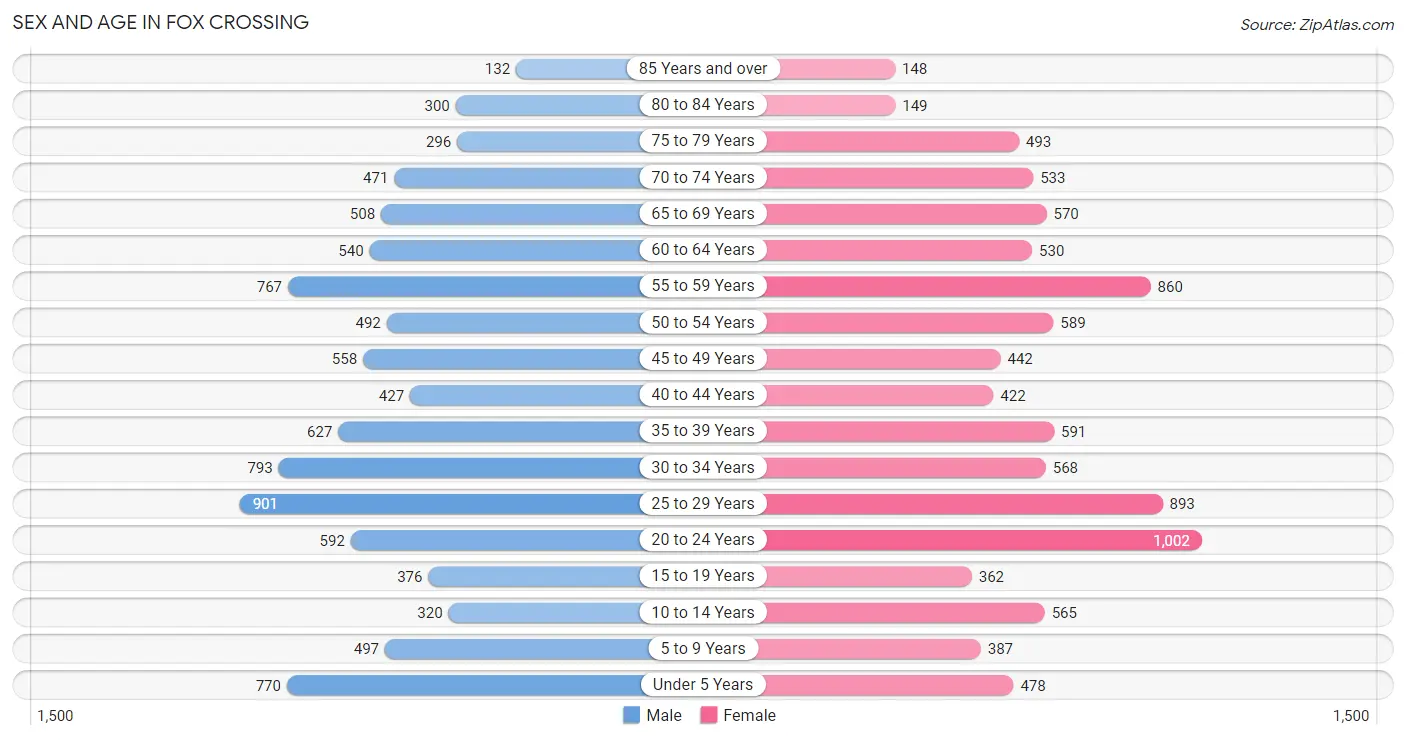
Sex and Age in Fox Crossing
Sex and Age in Fox Crossing
The most populous age groups in Fox Crossing are 25 to 29 Years (901 | 9.6%) for men and 20 to 24 Years (1,002 | 10.5%) for women.
| Age Bracket | Male | Female |
| Under 5 Years | 770 (8.2%) | 478 (5.0%) |
| 5 to 9 Years | 497 (5.3%) | 387 (4.0%) |
| 10 to 14 Years | 320 (3.4%) | 565 (5.9%) |
| 15 to 19 Years | 376 (4.0%) | 362 (3.8%) |
| 20 to 24 Years | 592 (6.3%) | 1,002 (10.5%) |
| 25 to 29 Years | 901 (9.6%) | 893 (9.3%) |
| 30 to 34 Years | 793 (8.5%) | 568 (5.9%) |
| 35 to 39 Years | 627 (6.7%) | 591 (6.2%) |
| 40 to 44 Years | 427 (4.6%) | 422 (4.4%) |
| 45 to 49 Years | 558 (6.0%) | 442 (4.6%) |
| 50 to 54 Years | 492 (5.2%) | 589 (6.1%) |
| 55 to 59 Years | 767 (8.2%) | 860 (9.0%) |
| 60 to 64 Years | 540 (5.8%) | 530 (5.5%) |
| 65 to 69 Years | 508 (5.4%) | 570 (5.9%) |
| 70 to 74 Years | 471 (5.0%) | 533 (5.6%) |
| 75 to 79 Years | 296 (3.2%) | 493 (5.1%) |
| 80 to 84 Years | 300 (3.2%) | 149 (1.5%) |
| 85 Years and over | 132 (1.4%) | 148 (1.5%) |
| Total | 9,367 (100.0%) | 9,582 (100.0%) |
Families and Households in Fox Crossing
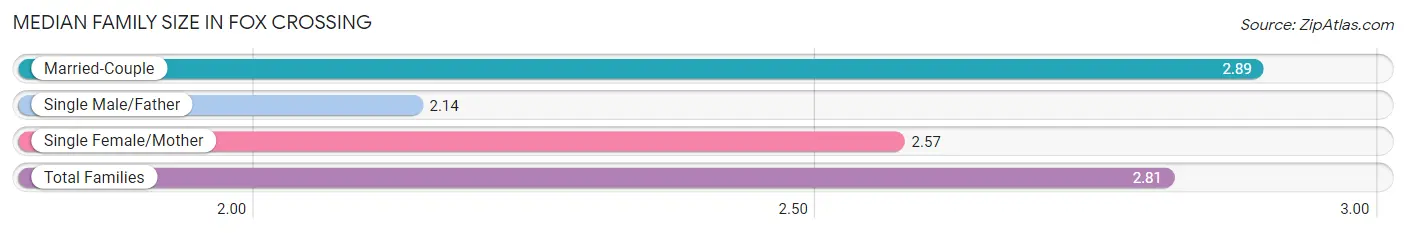
Median Family Size in Fox Crossing
The median family size in Fox Crossing is 2.81 persons per family, with married-couple families (3,924 | 81.3%) accounting for the largest median family size of 2.89 persons per family. On the other hand, single male/father families (248 | 5.1%) represent the smallest median family size with 2.14 persons per family.
| Family Type | # Families | Family Size |
| Married-Couple | 3,924 (81.3%) | 2.89 |
| Single Male/Father | 248 (5.1%) | 2.14 |
| Single Female/Mother | 656 (13.6%) | 2.57 |
| Total Families | 4,828 (100.0%) | 2.81 |
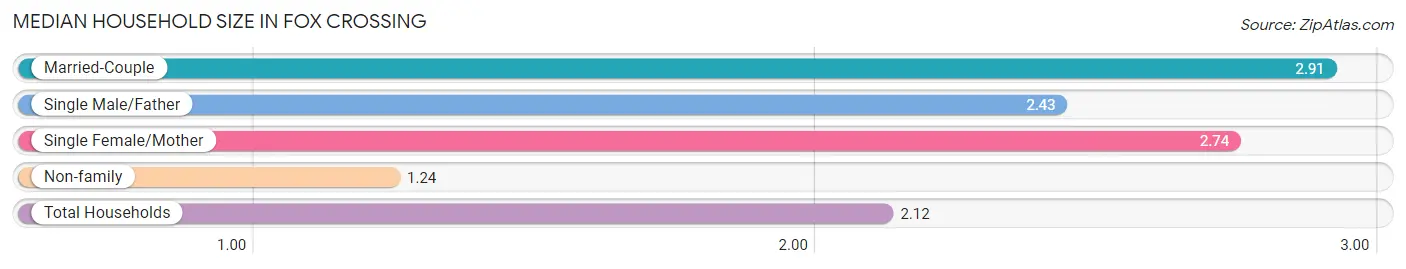
Median Household Size in Fox Crossing
The median household size in Fox Crossing is 2.12 persons per household, with married-couple households (3,924 | 44.3%) accounting for the largest median household size of 2.91 persons per household. non-family households (4,038 | 45.5%) represent the smallest median household size with 1.24 persons per household.
| Household Type | # Households | Household Size |
| Married-Couple | 3,924 (44.3%) | 2.91 |
| Single Male/Father | 248 (2.8%) | 2.43 |
| Single Female/Mother | 656 (7.4%) | 2.74 |
| Non-family | 4,038 (45.5%) | 1.24 |
| Total Households | 8,866 (100.0%) | 2.12 |
Household Size by Marriage Status in Fox Crossing
Out of a total of 8,866 households in Fox Crossing, 4,828 (54.5%) are family households, while 4,038 (45.5%) are nonfamily households. The most numerous type of family households are 2-person households, comprising 2,493, and the most common type of nonfamily households are 1-person households, comprising 3,085.
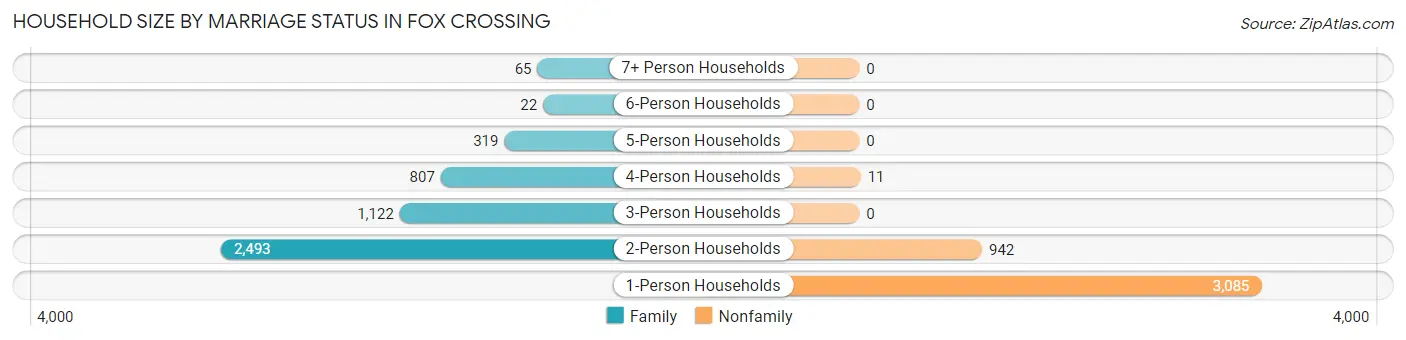
| Household Size | Family Households | Nonfamily Households |
| 1-Person Households | - | 3,085 (34.8%) |
| 2-Person Households | 2,493 (28.1%) | 942 (10.6%) |
| 3-Person Households | 1,122 (12.7%) | 0 (0.0%) |
| 4-Person Households | 807 (9.1%) | 11 (0.1%) |
| 5-Person Households | 319 (3.6%) | 0 (0.0%) |
| 6-Person Households | 22 (0.3%) | 0 (0.0%) |
| 7+ Person Households | 65 (0.7%) | 0 (0.0%) |
| Total | 4,828 (54.5%) | 4,038 (45.5%) |
Female Fertility in Fox Crossing
Fertility by Age in Fox Crossing
Average fertility rate in Fox Crossing is 47.0 births per 1,000 women. Women in the age bracket of 20 to 34 years have the highest fertility rate with 68.0 births per 1,000 women. Women in the age bracket of 20 to 34 years acount for 82.3% of all women with births.
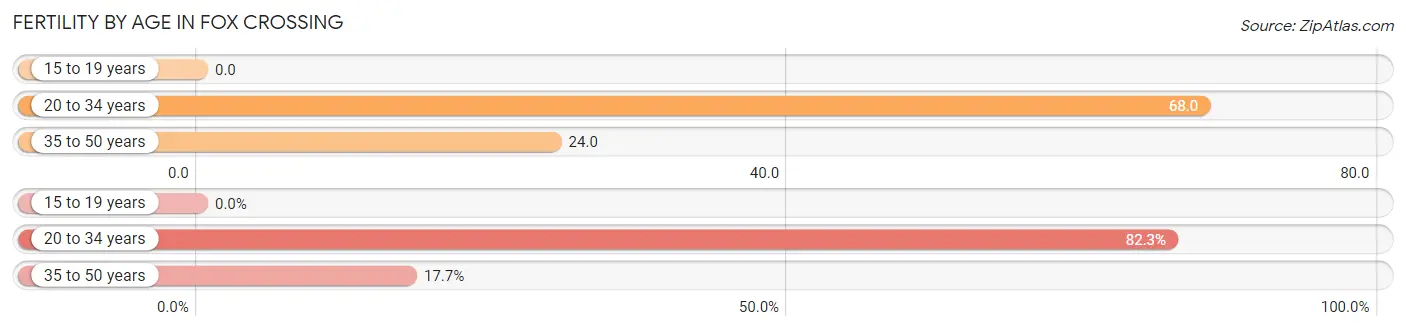
| Age Bracket | Women with Births | Births / 1,000 Women |
| 15 to 19 years | 0 (0.0%) | 0.0 |
| 20 to 34 years | 167 (82.3%) | 68.0 |
| 35 to 50 years | 36 (17.7%) | 24.0 |
| Total | 203 (100.0%) | 47.0 |
Fertility by Age by Marriage Status in Fox Crossing
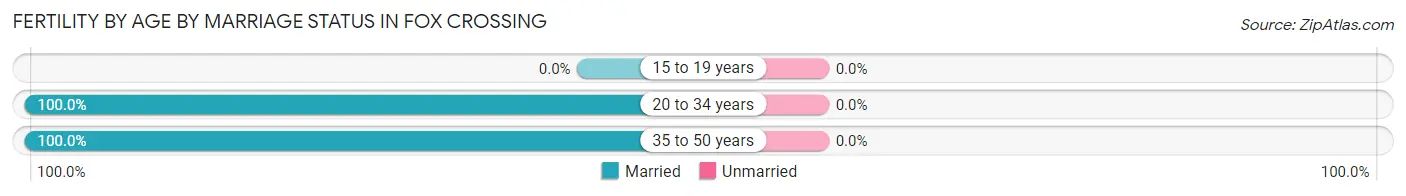
| Age Bracket | Married | Unmarried |
| 15 to 19 years | 0 (0.0%) | 0 (0.0%) |
| 20 to 34 years | 167 (100.0%) | 0 (0.0%) |
| 35 to 50 years | 36 (100.0%) | 0 (0.0%) |
| Total | 203 (100.0%) | 0 (0.0%) |
Fertility by Education in Fox Crossing
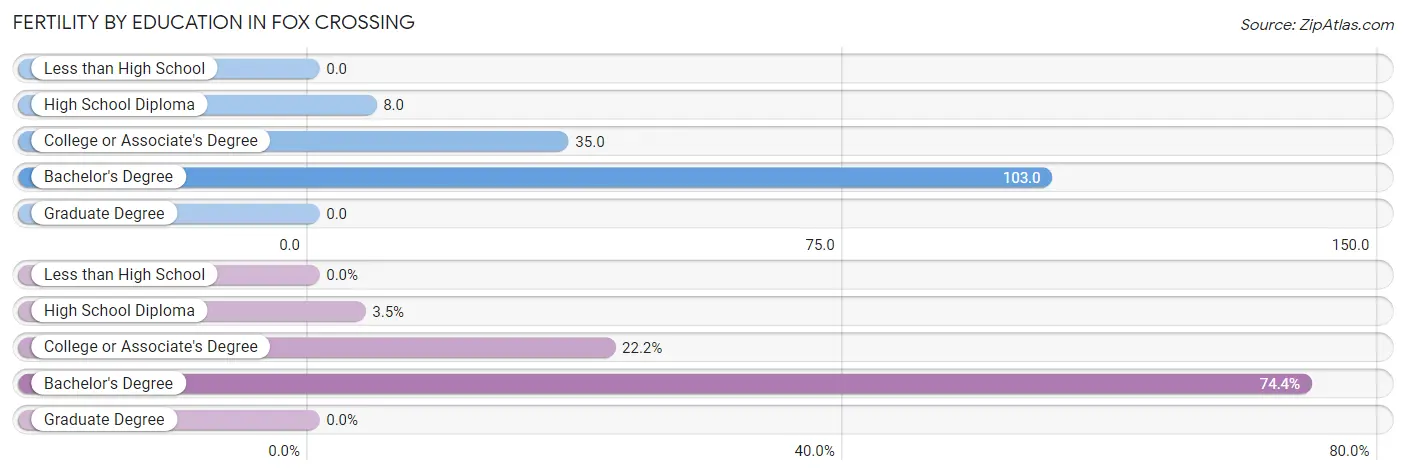
| Educational Attainment | Women with Births | Births / 1,000 Women |
| Less than High School | 0 (0.0%) | 0.0 |
| High School Diploma | 7 (3.5%) | 8.0 |
| College or Associate's Degree | 45 (22.2%) | 35.0 |
| Bachelor's Degree | 151 (74.4%) | 103.0 |
| Graduate Degree | 0 (0.0%) | 0.0 |
| Total | 203 (100.0%) | 47.0 |
Fertility by Education by Marriage Status in Fox Crossing
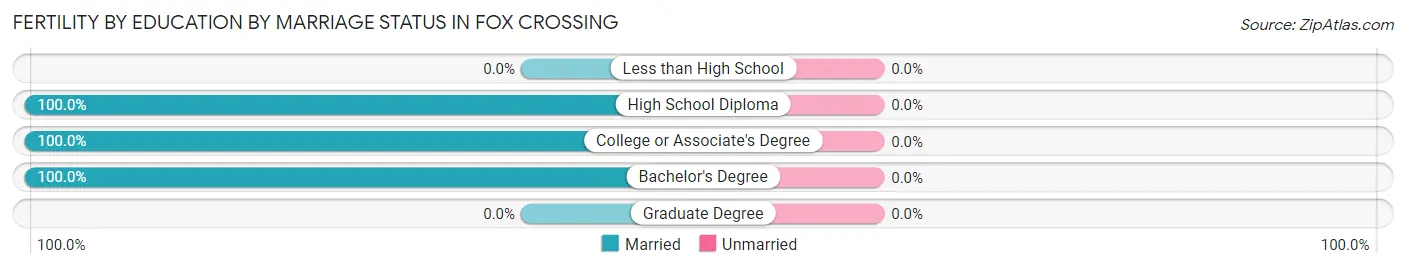
| Educational Attainment | Married | Unmarried |
| Less than High School | 0 (0.0%) | 0 (0.0%) |
| High School Diploma | 7 (100.0%) | 0 (0.0%) |
| College or Associate's Degree | 45 (100.0%) | 0 (0.0%) |
| Bachelor's Degree | 151 (100.0%) | 0 (0.0%) |
| Graduate Degree | 0 (0.0%) | 0 (0.0%) |
| Total | 203 (100.0%) | 0 (0.0%) |
Employment Characteristics in Fox Crossing
Employment by Class of Employer in Fox Crossing
Among the 10,240 employed individuals in Fox Crossing, private company employees (7,861 | 76.8%), local government employees (715 | 7.0%), and not-for-profit organizations (675 | 6.6%) make up the most common classes of employment.
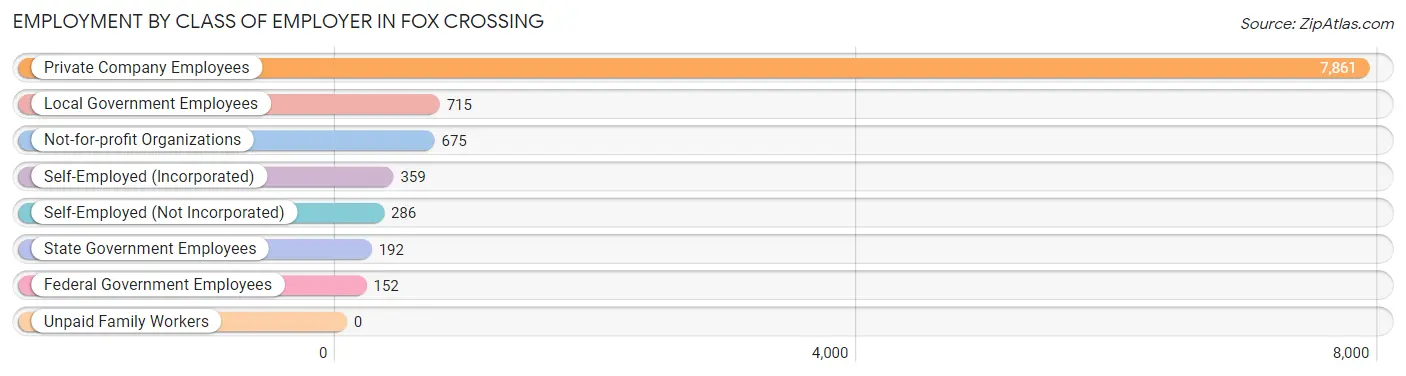
| Employer Class | # Employees | % Employees |
| Private Company Employees | 7,861 | 76.8% |
| Self-Employed (Incorporated) | 359 | 3.5% |
| Self-Employed (Not Incorporated) | 286 | 2.8% |
| Not-for-profit Organizations | 675 | 6.6% |
| Local Government Employees | 715 | 7.0% |
| State Government Employees | 192 | 1.9% |
| Federal Government Employees | 152 | 1.5% |
| Unpaid Family Workers | 0 | 0.0% |
| Total | 10,240 | 100.0% |
Employment Status by Age in Fox Crossing
According to the labor force statistics for Fox Crossing, out of the total population over 16 years of age (15,871), 66.8% or 10,602 individuals are in the labor force, with 1.3% or 138 of them unemployed. The age group with the highest labor force participation rate is 35 to 44 years, with 95.1% or 1,966 individuals in the labor force. Within the labor force, the 16 to 19 years age range has the highest percentage of unemployed individuals, with 6.7% or 20 of them being unemployed.
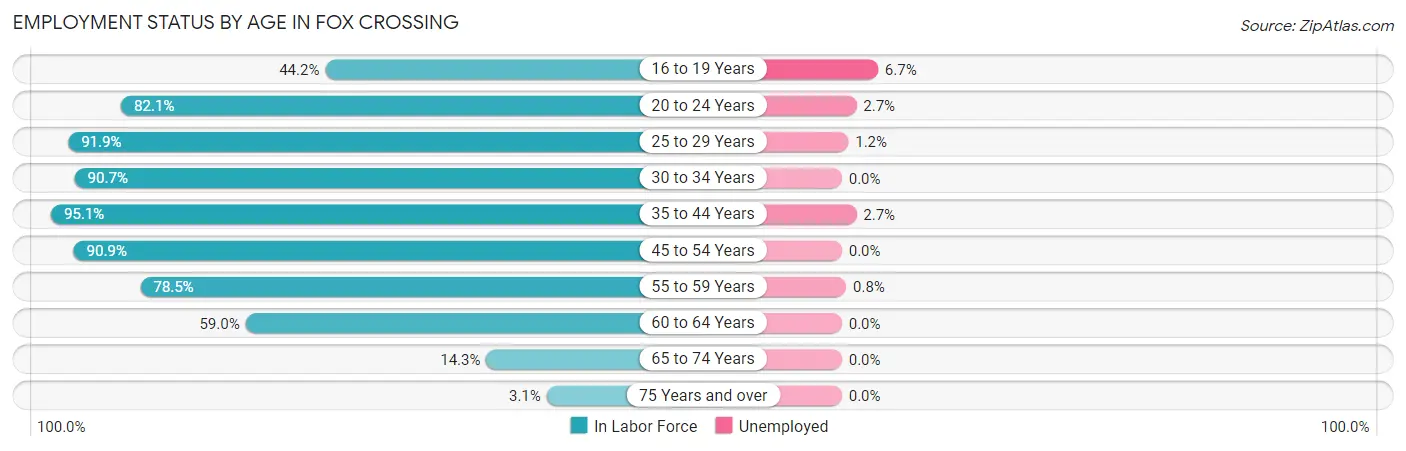
| Age Bracket | In Labor Force | Unemployed |
| 16 to 19 Years | 299 (44.2%) | 20 (6.7%) |
| 20 to 24 Years | 1,309 (82.1%) | 35 (2.7%) |
| 25 to 29 Years | 1,649 (91.9%) | 20 (1.2%) |
| 30 to 34 Years | 1,234 (90.7%) | 0 (0.0%) |
| 35 to 44 Years | 1,966 (95.1%) | 53 (2.7%) |
| 45 to 54 Years | 1,892 (90.9%) | 0 (0.0%) |
| 55 to 59 Years | 1,277 (78.5%) | 10 (0.8%) |
| 60 to 64 Years | 631 (59.0%) | 0 (0.0%) |
| 65 to 74 Years | 298 (14.3%) | 0 (0.0%) |
| 75 Years and over | 47 (3.1%) | 0 (0.0%) |
| Total | 10,602 (66.8%) | 138 (1.3%) |
Employment Status by Educational Attainment in Fox Crossing
According to labor force statistics for Fox Crossing, 86.5% of individuals (8,650) out of the total population between 25 and 64 years of age (10,000) are in the labor force, with 1.0% or 86 of them being unemployed. The group with the highest labor force participation rate are those with the educational attainment of bachelor's degree or higher, with 95.2% or 3,080 individuals in the labor force. Within the labor force, individuals with less than high school education have the highest percentage of unemployment, with 16.9% or 54 of them being unemployed.
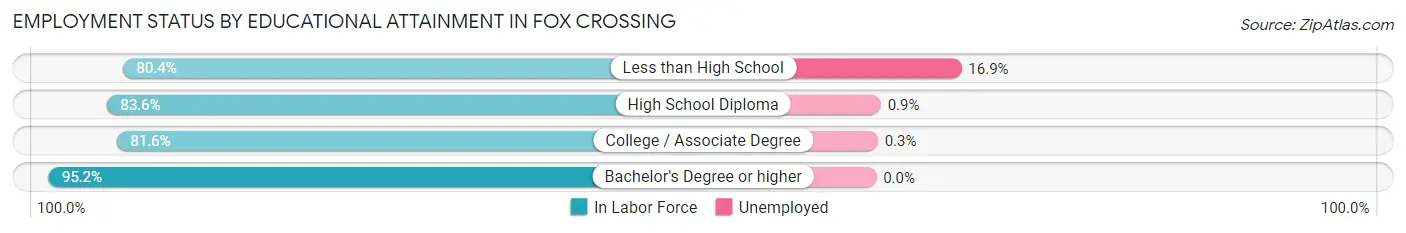
| Educational Attainment | In Labor Force | Unemployed |
| Less than High School | 319 (80.4%) | 67 (16.9%) |
| High School Diploma | 2,224 (83.6%) | 24 (0.9%) |
| College / Associate Degree | 3,026 (81.6%) | 11 (0.3%) |
| Bachelor's Degree or higher | 3,080 (95.2%) | 0 (0.0%) |
| Total | 8,650 (86.5%) | 100 (1.0%) |
Employment Occupations by Sex in Fox Crossing
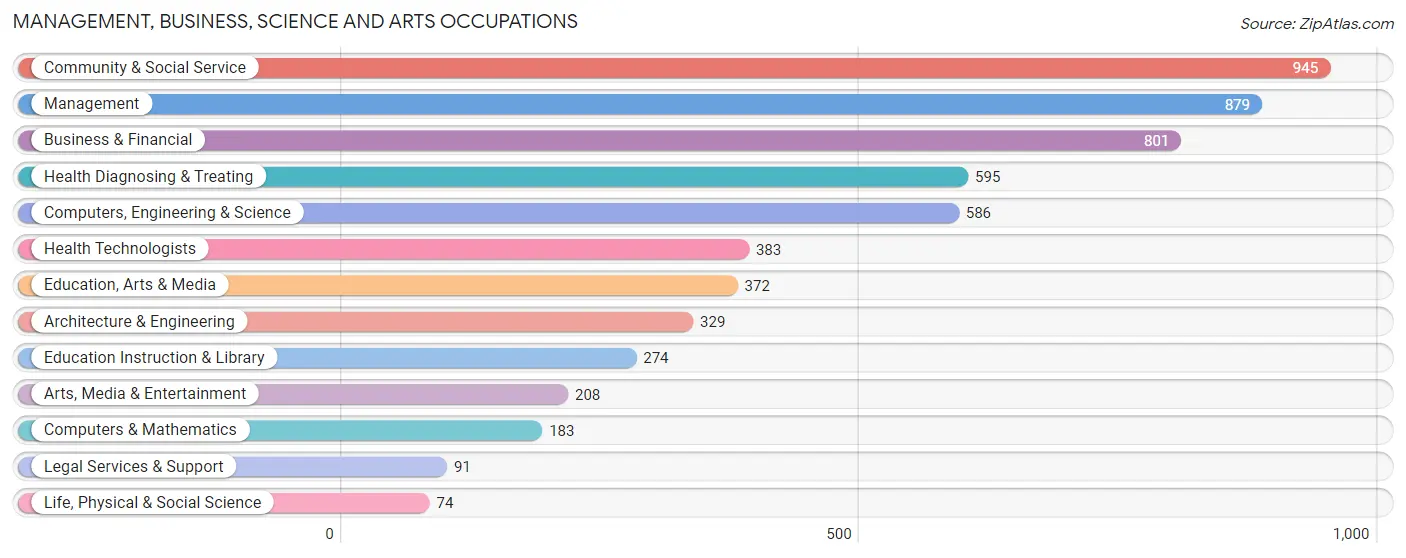
Management, Business, Science and Arts Occupations
The most common Management, Business, Science and Arts occupations in Fox Crossing are Community & Social Service (945 | 9.1%), Management (879 | 8.5%), Business & Financial (801 | 7.7%), Health Diagnosing & Treating (595 | 5.7%), and Computers, Engineering & Science (586 | 5.6%).
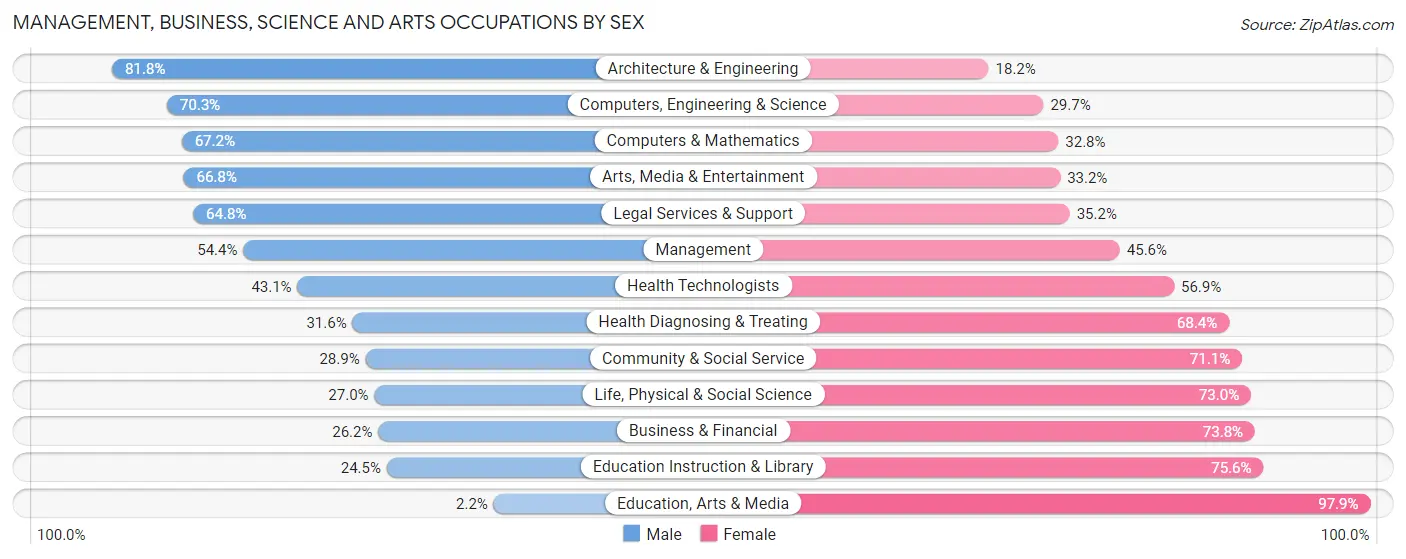
Management, Business, Science and Arts Occupations by Sex
Within the Management, Business, Science and Arts occupations in Fox Crossing, the most male-oriented occupations are Architecture & Engineering (81.8%), Computers, Engineering & Science (70.3%), and Computers & Mathematics (67.2%), while the most female-oriented occupations are Education, Arts & Media (97.9%), Education Instruction & Library (75.5%), and Business & Financial (73.8%).
| Occupation | Male | Female |
| Management | 478 (54.4%) | 401 (45.6%) |
| Business & Financial | 210 (26.2%) | 591 (73.8%) |
| Computers, Engineering & Science | 412 (70.3%) | 174 (29.7%) |
| Computers & Mathematics | 123 (67.2%) | 60 (32.8%) |
| Architecture & Engineering | 269 (81.8%) | 60 (18.2%) |
| Life, Physical & Social Science | 20 (27.0%) | 54 (73.0%) |
| Community & Social Service | 273 (28.9%) | 672 (71.1%) |
| Education, Arts & Media | 8 (2.1%) | 364 (97.9%) |
| Legal Services & Support | 59 (64.8%) | 32 (35.2%) |
| Education Instruction & Library | 67 (24.4%) | 207 (75.5%) |
| Arts, Media & Entertainment | 139 (66.8%) | 69 (33.2%) |
| Health Diagnosing & Treating | 188 (31.6%) | 407 (68.4%) |
| Health Technologists | 165 (43.1%) | 218 (56.9%) |
| Total (Category) | 1,561 (41.0%) | 2,245 (59.0%) |
| Total (Overall) | 5,213 (50.1%) | 5,183 (49.9%) |
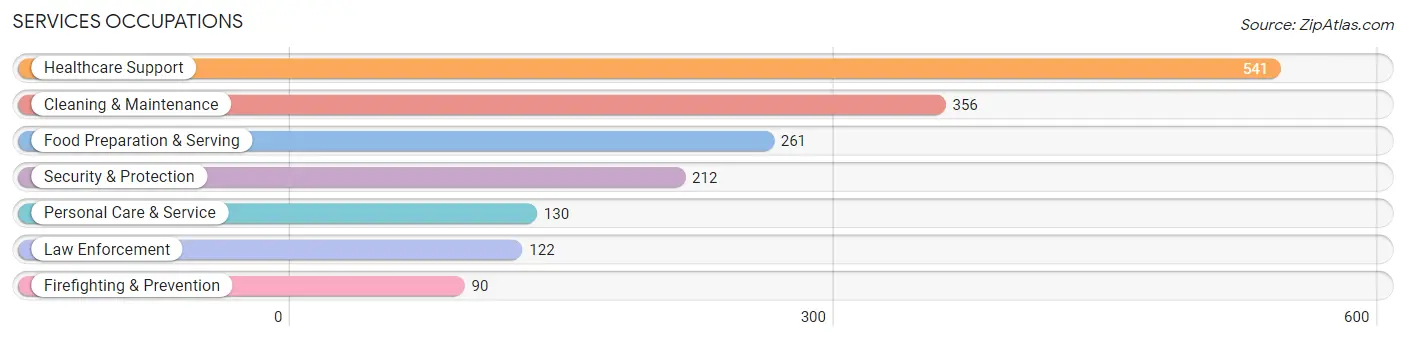
Services Occupations
The most common Services occupations in Fox Crossing are Healthcare Support (541 | 5.2%), Cleaning & Maintenance (356 | 3.4%), Food Preparation & Serving (261 | 2.5%), Security & Protection (212 | 2.0%), and Personal Care & Service (130 | 1.3%).
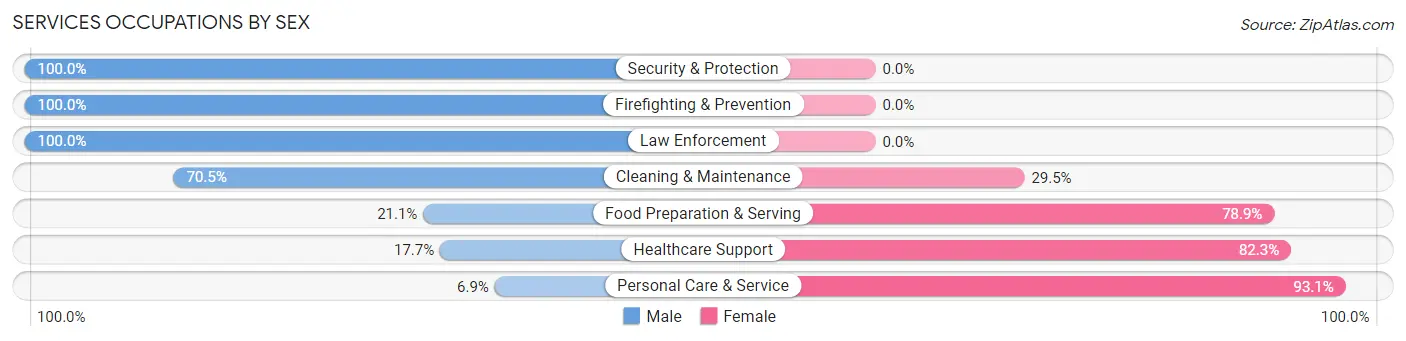
Services Occupations by Sex
Within the Services occupations in Fox Crossing, the most male-oriented occupations are Security & Protection (100.0%), Firefighting & Prevention (100.0%), and Law Enforcement (100.0%), while the most female-oriented occupations are Personal Care & Service (93.1%), Healthcare Support (82.3%), and Food Preparation & Serving (78.9%).
| Occupation | Male | Female |
| Healthcare Support | 96 (17.7%) | 445 (82.3%) |
| Security & Protection | 212 (100.0%) | 0 (0.0%) |
| Firefighting & Prevention | 90 (100.0%) | 0 (0.0%) |
| Law Enforcement | 122 (100.0%) | 0 (0.0%) |
| Food Preparation & Serving | 55 (21.1%) | 206 (78.9%) |
| Cleaning & Maintenance | 251 (70.5%) | 105 (29.5%) |
| Personal Care & Service | 9 (6.9%) | 121 (93.1%) |
| Total (Category) | 623 (41.5%) | 877 (58.5%) |
| Total (Overall) | 5,213 (50.1%) | 5,183 (49.9%) |
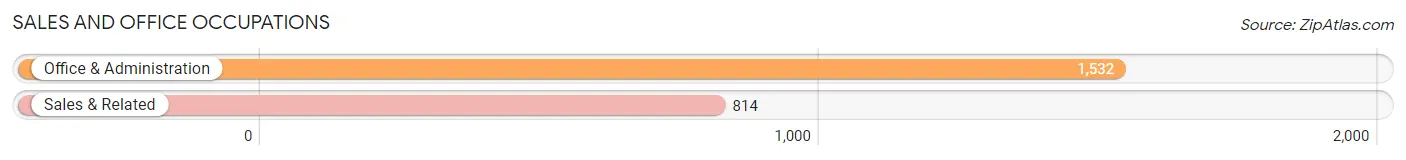
Sales and Office Occupations
The most common Sales and Office occupations in Fox Crossing are Office & Administration (1,532 | 14.7%), and Sales & Related (814 | 7.8%).
Sales and Office Occupations by Sex
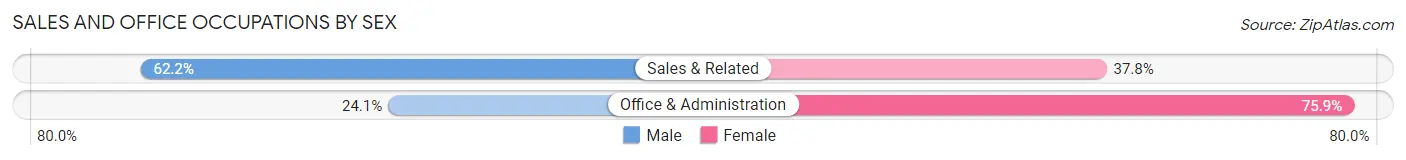
| Occupation | Male | Female |
| Sales & Related | 506 (62.2%) | 308 (37.8%) |
| Office & Administration | 369 (24.1%) | 1,163 (75.9%) |
| Total (Category) | 875 (37.3%) | 1,471 (62.7%) |
| Total (Overall) | 5,213 (50.1%) | 5,183 (49.9%) |
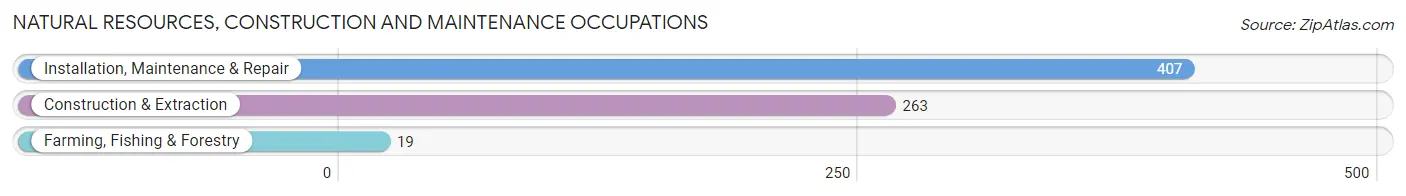
Natural Resources, Construction and Maintenance Occupations
The most common Natural Resources, Construction and Maintenance occupations in Fox Crossing are Installation, Maintenance & Repair (407 | 3.9%), Construction & Extraction (263 | 2.5%), and Farming, Fishing & Forestry (19 | 0.2%).
Natural Resources, Construction and Maintenance Occupations by Sex
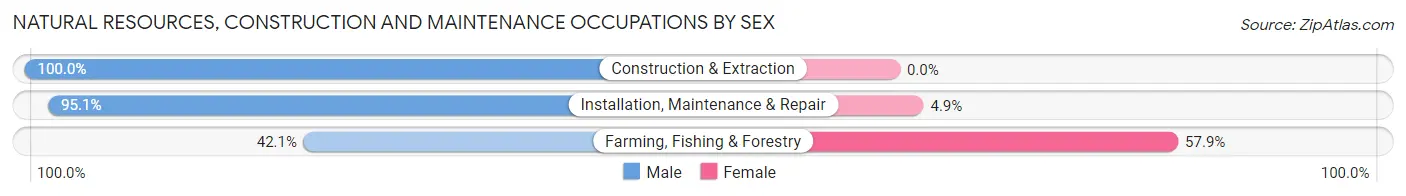
| Occupation | Male | Female |
| Farming, Fishing & Forestry | 8 (42.1%) | 11 (57.9%) |
| Construction & Extraction | 263 (100.0%) | 0 (0.0%) |
| Installation, Maintenance & Repair | 387 (95.1%) | 20 (4.9%) |
| Total (Category) | 658 (95.5%) | 31 (4.5%) |
| Total (Overall) | 5,213 (50.1%) | 5,183 (49.9%) |
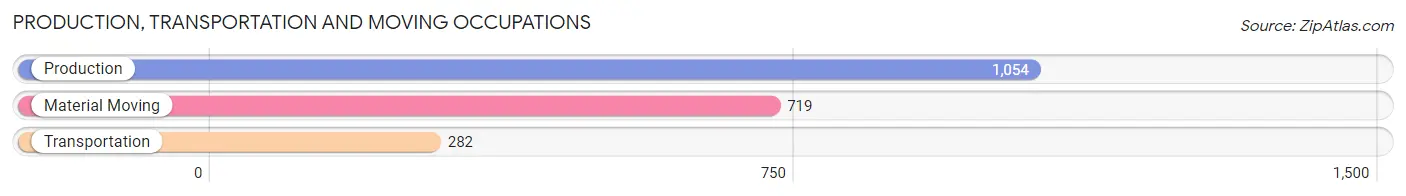
Production, Transportation and Moving Occupations
The most common Production, Transportation and Moving occupations in Fox Crossing are Production (1,054 | 10.1%), Material Moving (719 | 6.9%), and Transportation (282 | 2.7%).
Production, Transportation and Moving Occupations by Sex
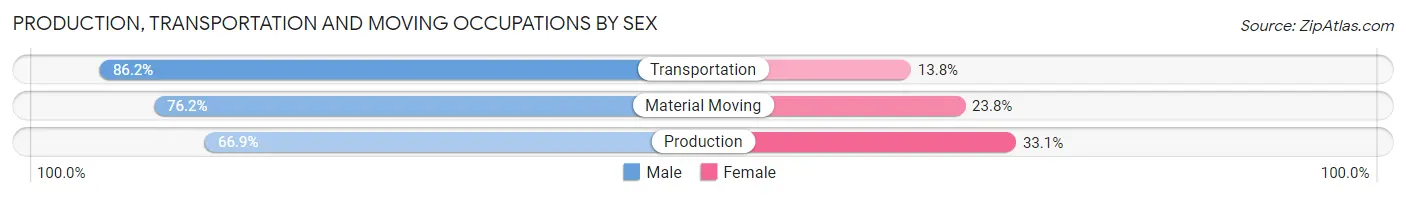
| Occupation | Male | Female |
| Production | 705 (66.9%) | 349 (33.1%) |
| Transportation | 243 (86.2%) | 39 (13.8%) |
| Material Moving | 548 (76.2%) | 171 (23.8%) |
| Total (Category) | 1,496 (72.8%) | 559 (27.2%) |
| Total (Overall) | 5,213 (50.1%) | 5,183 (49.9%) |
Employment Industries by Sex in Fox Crossing
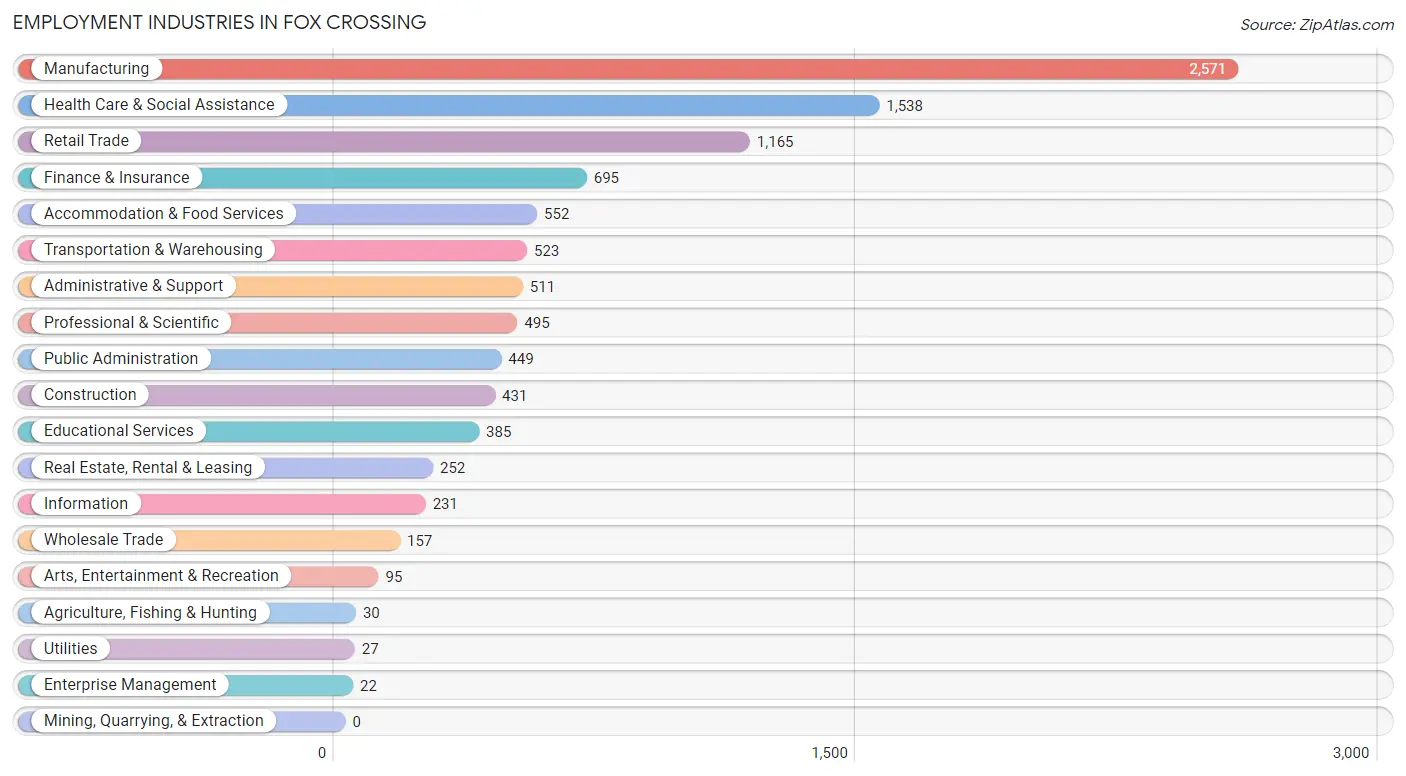
Employment Industries in Fox Crossing
The major employment industries in Fox Crossing include Manufacturing (2,571 | 24.7%), Health Care & Social Assistance (1,538 | 14.8%), Retail Trade (1,165 | 11.2%), Finance & Insurance (695 | 6.7%), and Accommodation & Food Services (552 | 5.3%).
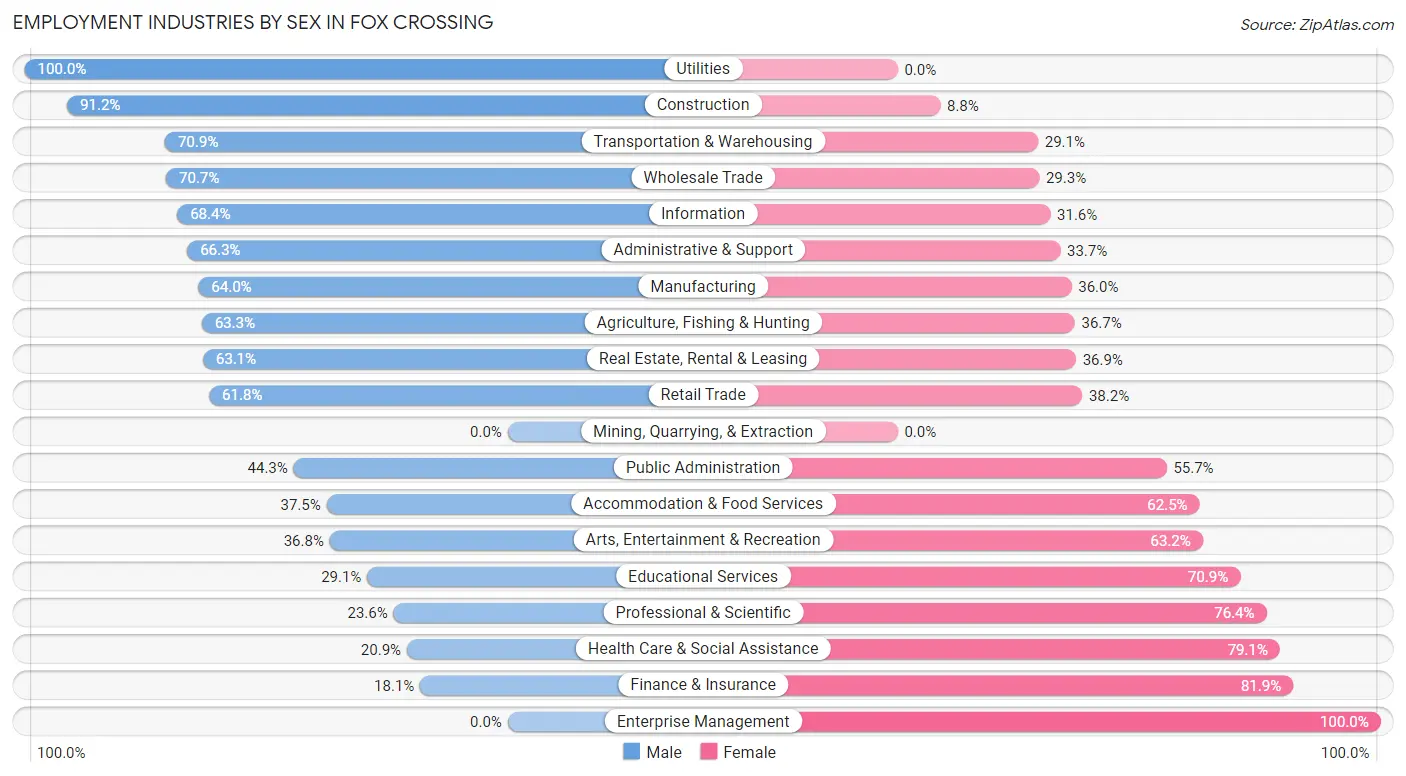
Employment Industries by Sex in Fox Crossing
The Fox Crossing industries that see more men than women are Utilities (100.0%), Construction (91.2%), and Transportation & Warehousing (70.9%), whereas the industries that tend to have a higher number of women are Enterprise Management (100.0%), Finance & Insurance (81.9%), and Health Care & Social Assistance (79.1%).
| Industry | Male | Female |
| Agriculture, Fishing & Hunting | 19 (63.3%) | 11 (36.7%) |
| Mining, Quarrying, & Extraction | 0 (0.0%) | 0 (0.0%) |
| Construction | 393 (91.2%) | 38 (8.8%) |
| Manufacturing | 1,646 (64.0%) | 925 (36.0%) |
| Wholesale Trade | 111 (70.7%) | 46 (29.3%) |
| Retail Trade | 720 (61.8%) | 445 (38.2%) |
| Transportation & Warehousing | 371 (70.9%) | 152 (29.1%) |
| Utilities | 27 (100.0%) | 0 (0.0%) |
| Information | 158 (68.4%) | 73 (31.6%) |
| Finance & Insurance | 126 (18.1%) | 569 (81.9%) |
| Real Estate, Rental & Leasing | 159 (63.1%) | 93 (36.9%) |
| Professional & Scientific | 117 (23.6%) | 378 (76.4%) |
| Enterprise Management | 0 (0.0%) | 22 (100.0%) |
| Administrative & Support | 339 (66.3%) | 172 (33.7%) |
| Educational Services | 112 (29.1%) | 273 (70.9%) |
| Health Care & Social Assistance | 321 (20.9%) | 1,217 (79.1%) |
| Arts, Entertainment & Recreation | 35 (36.8%) | 60 (63.2%) |
| Accommodation & Food Services | 207 (37.5%) | 345 (62.5%) |
| Public Administration | 199 (44.3%) | 250 (55.7%) |
| Total | 5,213 (50.1%) | 5,183 (49.9%) |
Education in Fox Crossing
School Enrollment in Fox Crossing
The most common levels of schooling among the 3,401 students in Fox Crossing are college / undergraduate (944 | 27.8%), middle school (698 | 20.5%), and high school (643 | 18.9%).
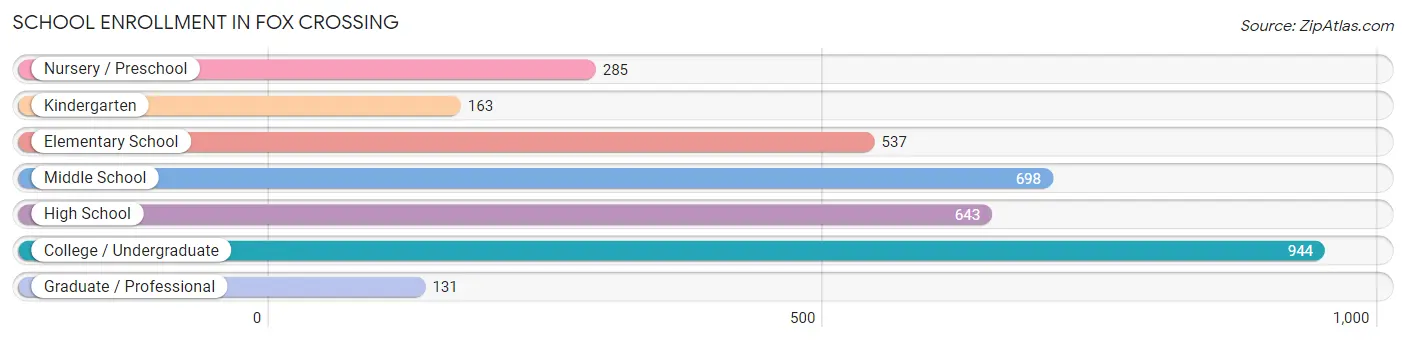
| School Level | # Students | % Students |
| Nursery / Preschool | 285 | 8.4% |
| Kindergarten | 163 | 4.8% |
| Elementary School | 537 | 15.8% |
| Middle School | 698 | 20.5% |
| High School | 643 | 18.9% |
| College / Undergraduate | 944 | 27.8% |
| Graduate / Professional | 131 | 3.8% |
| Total | 3,401 | 100.0% |
School Enrollment by Age by Funding Source in Fox Crossing
Out of a total of 3,401 students who are enrolled in schools in Fox Crossing, 571 (16.8%) attend a private institution, while the remaining 2,830 (83.2%) are enrolled in public schools. The age group of 35 years and over has the highest likelihood of being enrolled in private schools, with 37 (37.4% in the age bracket) enrolled. Conversely, the age group of 18 to 19 year olds has the lowest likelihood of being enrolled in a private school, with 214 (96.0% in the age bracket) attending a public institution.
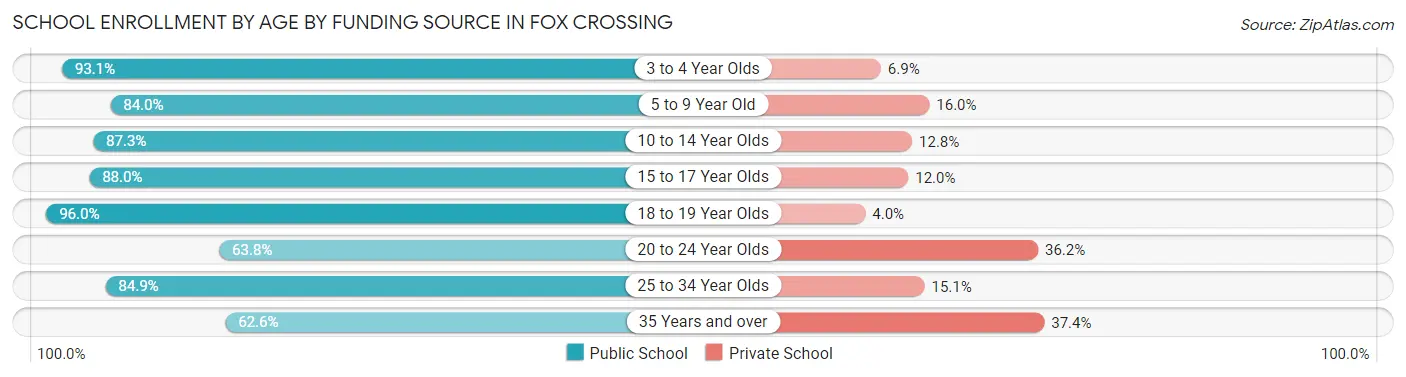
| Age Bracket | Public School | Private School |
| 3 to 4 Year Olds | 161 (93.1%) | 12 (6.9%) |
| 5 to 9 Year Old | 611 (84.0%) | 116 (16.0%) |
| 10 to 14 Year Olds | 739 (87.3%) | 108 (12.8%) |
| 15 to 17 Year Olds | 380 (88.0%) | 52 (12.0%) |
| 18 to 19 Year Olds | 214 (96.0%) | 9 (4.0%) |
| 20 to 24 Year Olds | 303 (63.8%) | 172 (36.2%) |
| 25 to 34 Year Olds | 361 (84.9%) | 64 (15.1%) |
| 35 Years and over | 62 (62.6%) | 37 (37.4%) |
| Total | 2,830 (83.2%) | 571 (16.8%) |
Educational Attainment by Field of Study in Fox Crossing
Business (1,053 | 24.0%), engineering (555 | 12.7%), education (522 | 11.9%), science & technology (427 | 9.7%), and psychology (327 | 7.4%) are the most common fields of study among 4,389 individuals in Fox Crossing who have obtained a bachelor's degree or higher.
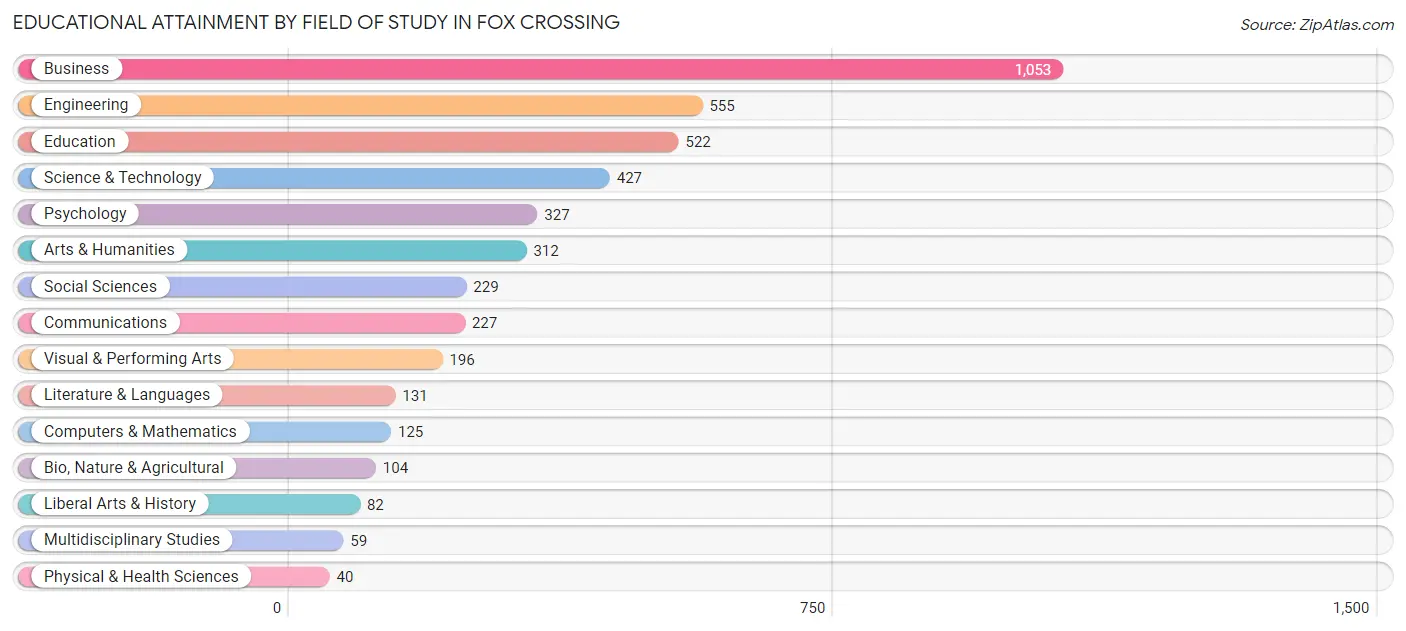
| Field of Study | # Graduates | % Graduates |
| Computers & Mathematics | 125 | 2.9% |
| Bio, Nature & Agricultural | 104 | 2.4% |
| Physical & Health Sciences | 40 | 0.9% |
| Psychology | 327 | 7.4% |
| Social Sciences | 229 | 5.2% |
| Engineering | 555 | 12.7% |
| Multidisciplinary Studies | 59 | 1.3% |
| Science & Technology | 427 | 9.7% |
| Business | 1,053 | 24.0% |
| Education | 522 | 11.9% |
| Literature & Languages | 131 | 3.0% |
| Liberal Arts & History | 82 | 1.9% |
| Visual & Performing Arts | 196 | 4.5% |
| Communications | 227 | 5.2% |
| Arts & Humanities | 312 | 7.1% |
| Total | 4,389 | 100.0% |
Transportation & Commute in Fox Crossing
Vehicle Availability by Sex in Fox Crossing
The most prevalent vehicle ownership categories in Fox Crossing are males with 2 vehicles (2,376, accounting for 46.3%) and females with 2 vehicles (2,630, making up 46.6%).
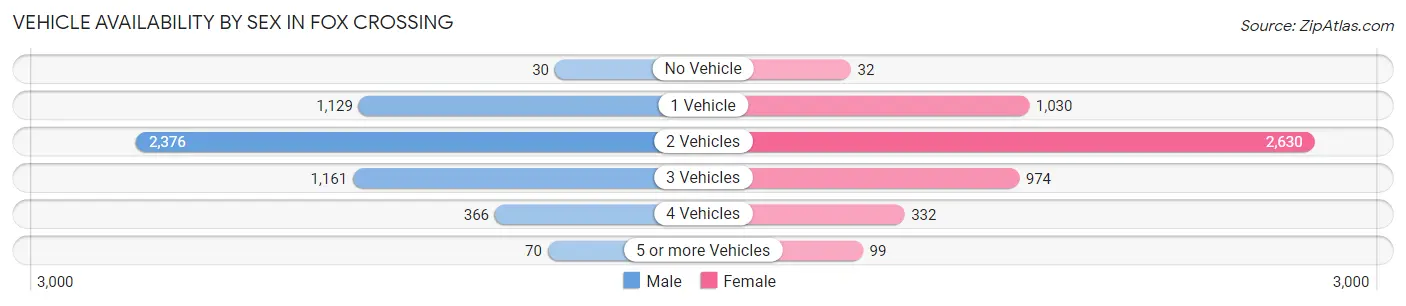
| Vehicles Available | Male | Female |
| No Vehicle | 30 (0.6%) | 32 (0.6%) |
| 1 Vehicle | 1,129 (22.0%) | 1,030 (20.2%) |
| 2 Vehicles | 2,376 (46.3%) | 2,630 (51.6%) |
| 3 Vehicles | 1,161 (22.6%) | 974 (19.1%) |
| 4 Vehicles | 366 (7.1%) | 332 (6.5%) |
| 5 or more Vehicles | 70 (1.4%) | 99 (1.9%) |
| Total | 5,132 (100.0%) | 5,097 (100.0%) |
Commute Time in Fox Crossing
The most frequently occuring commute durations in Fox Crossing are 15 to 19 minutes (2,478 commuters, 27.4%), 10 to 14 minutes (2,129 commuters, 23.5%), and 20 to 24 minutes (1,242 commuters, 13.7%).
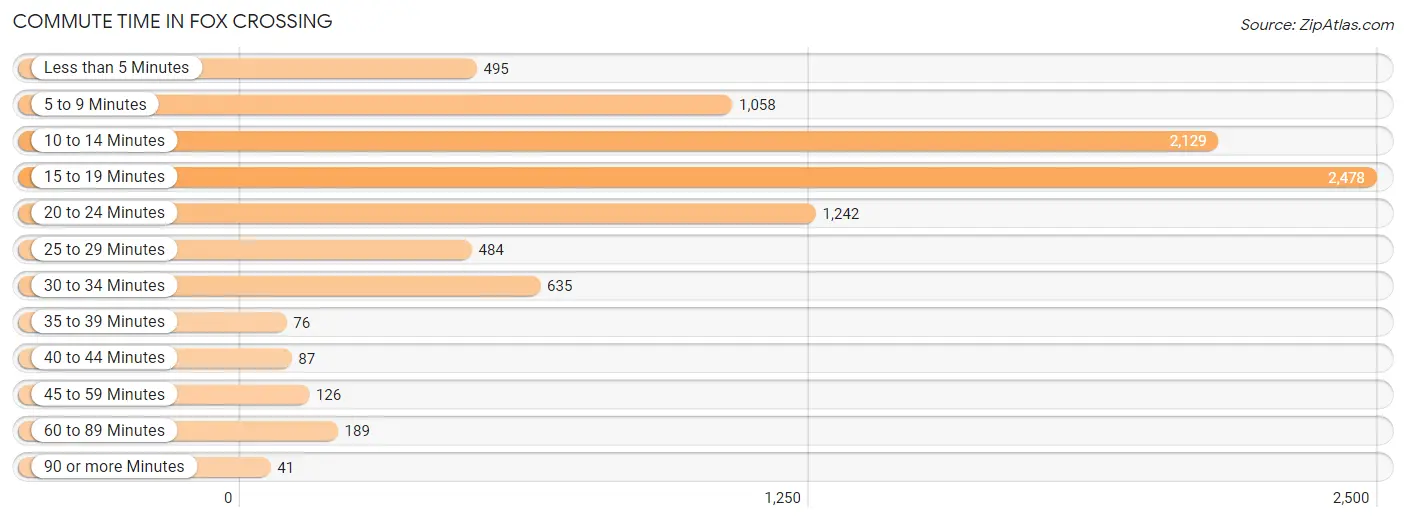
| Commute Time | # Commuters | % Commuters |
| Less than 5 Minutes | 495 | 5.5% |
| 5 to 9 Minutes | 1,058 | 11.7% |
| 10 to 14 Minutes | 2,129 | 23.5% |
| 15 to 19 Minutes | 2,478 | 27.4% |
| 20 to 24 Minutes | 1,242 | 13.7% |
| 25 to 29 Minutes | 484 | 5.3% |
| 30 to 34 Minutes | 635 | 7.0% |
| 35 to 39 Minutes | 76 | 0.8% |
| 40 to 44 Minutes | 87 | 1.0% |
| 45 to 59 Minutes | 126 | 1.4% |
| 60 to 89 Minutes | 189 | 2.1% |
| 90 or more Minutes | 41 | 0.4% |
Commute Time by Sex in Fox Crossing
The most common commute times in Fox Crossing are 15 to 19 minutes (1,092 commuters, 23.0%) for males and 15 to 19 minutes (1,386 commuters, 32.3%) for females.
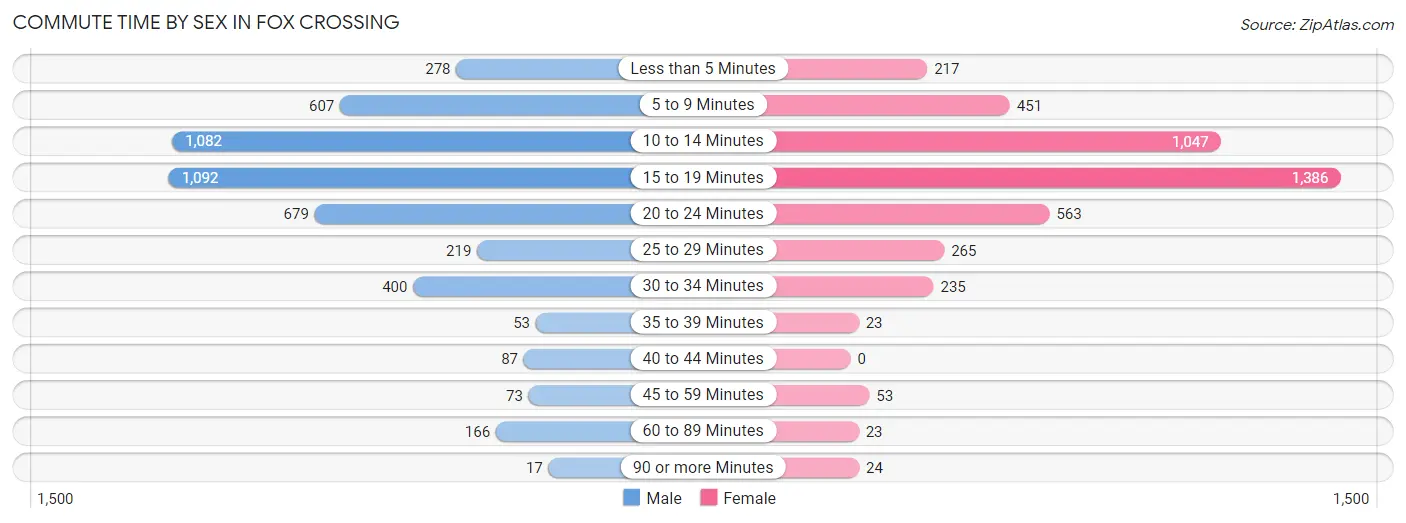
| Commute Time | Male | Female |
| Less than 5 Minutes | 278 (5.9%) | 217 (5.1%) |
| 5 to 9 Minutes | 607 (12.8%) | 451 (10.5%) |
| 10 to 14 Minutes | 1,082 (22.8%) | 1,047 (24.4%) |
| 15 to 19 Minutes | 1,092 (23.0%) | 1,386 (32.3%) |
| 20 to 24 Minutes | 679 (14.3%) | 563 (13.1%) |
| 25 to 29 Minutes | 219 (4.6%) | 265 (6.2%) |
| 30 to 34 Minutes | 400 (8.4%) | 235 (5.5%) |
| 35 to 39 Minutes | 53 (1.1%) | 23 (0.5%) |
| 40 to 44 Minutes | 87 (1.8%) | 0 (0.0%) |
| 45 to 59 Minutes | 73 (1.5%) | 53 (1.2%) |
| 60 to 89 Minutes | 166 (3.5%) | 23 (0.5%) |
| 90 or more Minutes | 17 (0.4%) | 24 (0.6%) |
Time of Departure to Work by Sex in Fox Crossing
The most frequent times of departure to work in Fox Crossing are 7:30 AM to 7:59 AM (774, 16.3%) for males and 7:30 AM to 7:59 AM (972, 22.7%) for females.
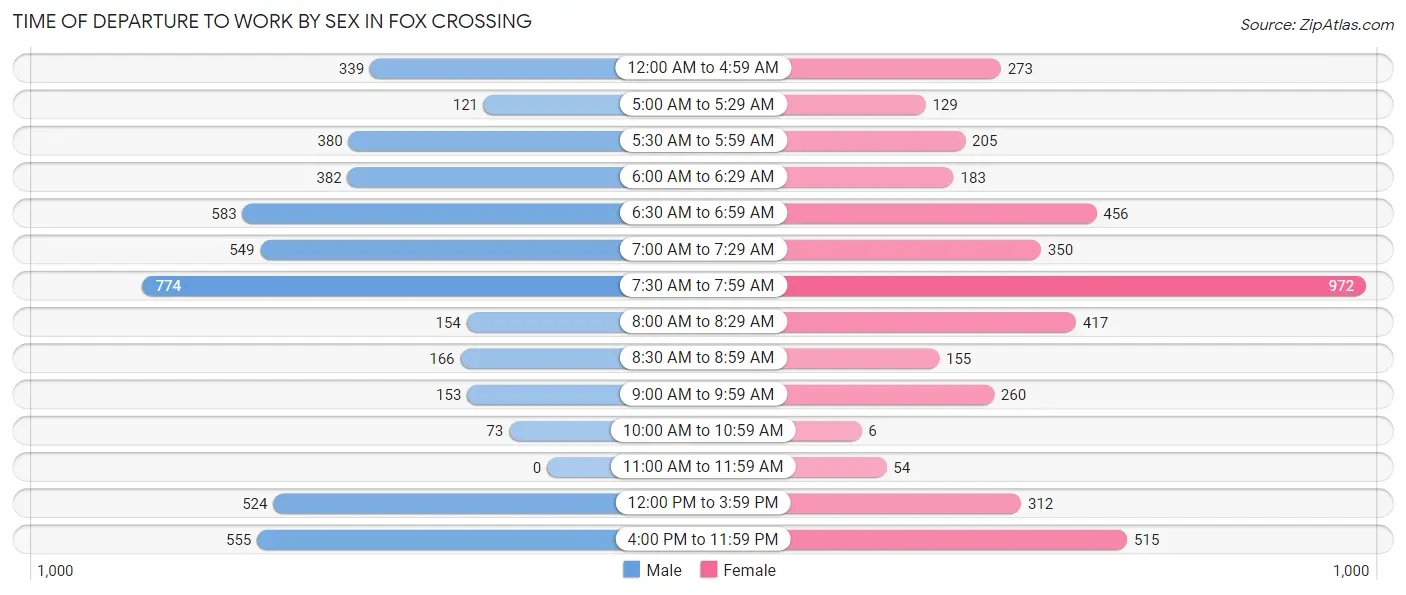
| Time of Departure | Male | Female |
| 12:00 AM to 4:59 AM | 339 (7.1%) | 273 (6.4%) |
| 5:00 AM to 5:29 AM | 121 (2.5%) | 129 (3.0%) |
| 5:30 AM to 5:59 AM | 380 (8.0%) | 205 (4.8%) |
| 6:00 AM to 6:29 AM | 382 (8.0%) | 183 (4.3%) |
| 6:30 AM to 6:59 AM | 583 (12.3%) | 456 (10.6%) |
| 7:00 AM to 7:29 AM | 549 (11.6%) | 350 (8.2%) |
| 7:30 AM to 7:59 AM | 774 (16.3%) | 972 (22.7%) |
| 8:00 AM to 8:29 AM | 154 (3.2%) | 417 (9.7%) |
| 8:30 AM to 8:59 AM | 166 (3.5%) | 155 (3.6%) |
| 9:00 AM to 9:59 AM | 153 (3.2%) | 260 (6.1%) |
| 10:00 AM to 10:59 AM | 73 (1.5%) | 6 (0.1%) |
| 11:00 AM to 11:59 AM | 0 (0.0%) | 54 (1.3%) |
| 12:00 PM to 3:59 PM | 524 (11.0%) | 312 (7.3%) |
| 4:00 PM to 11:59 PM | 555 (11.7%) | 515 (12.0%) |
| Total | 4,753 (100.0%) | 4,287 (100.0%) |
Housing Occupancy in Fox Crossing
Occupancy by Ownership in Fox Crossing
Of the total 8,866 dwellings in Fox Crossing, owner-occupied units account for 5,576 (62.9%), while renter-occupied units make up 3,290 (37.1%).
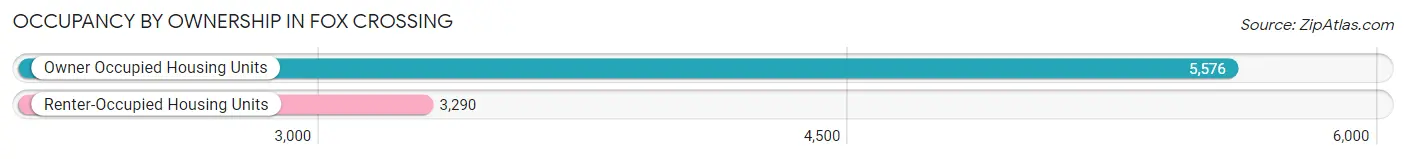
| Occupancy | # Housing Units | % Housing Units |
| Owner Occupied Housing Units | 5,576 | 62.9% |
| Renter-Occupied Housing Units | 3,290 | 37.1% |
| Total Occupied Housing Units | 8,866 | 100.0% |
Occupancy by Household Size in Fox Crossing
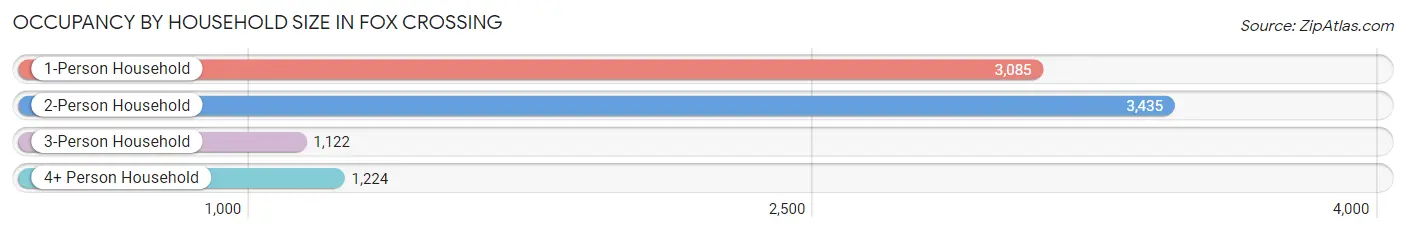
| Household Size | # Housing Units | % Housing Units |
| 1-Person Household | 3,085 | 34.8% |
| 2-Person Household | 3,435 | 38.7% |
| 3-Person Household | 1,122 | 12.7% |
| 4+ Person Household | 1,224 | 13.8% |
| Total Housing Units | 8,866 | 100.0% |
Occupancy by Ownership by Household Size in Fox Crossing
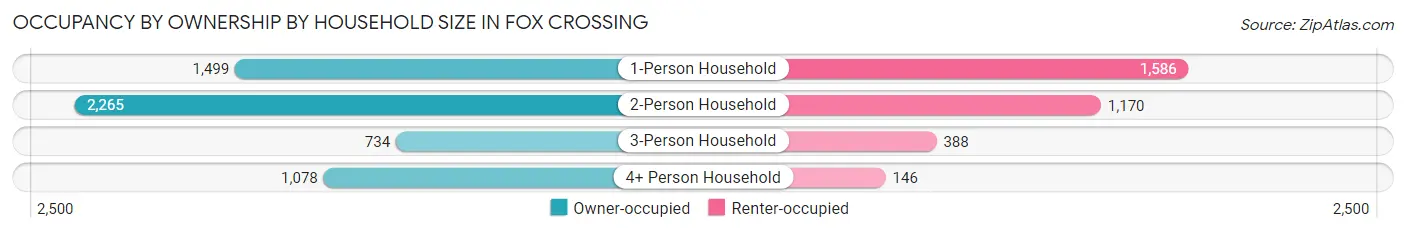
| Household Size | Owner-occupied | Renter-occupied |
| 1-Person Household | 1,499 (48.6%) | 1,586 (51.4%) |
| 2-Person Household | 2,265 (65.9%) | 1,170 (34.1%) |
| 3-Person Household | 734 (65.4%) | 388 (34.6%) |
| 4+ Person Household | 1,078 (88.1%) | 146 (11.9%) |
| Total Housing Units | 5,576 (62.9%) | 3,290 (37.1%) |
Occupancy by Educational Attainment in Fox Crossing
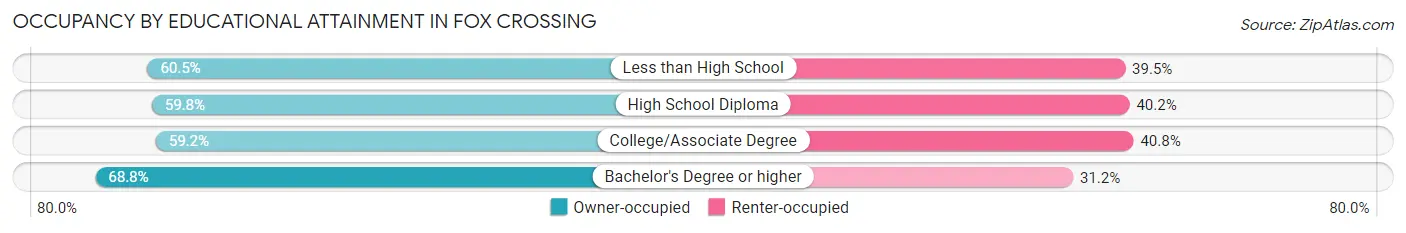
| Household Size | Owner-occupied | Renter-occupied |
| Less than High School | 213 (60.5%) | 139 (39.5%) |
| High School Diploma | 1,498 (59.8%) | 1,006 (40.2%) |
| College/Associate Degree | 1,656 (59.2%) | 1,142 (40.8%) |
| Bachelor's Degree or higher | 2,209 (68.8%) | 1,003 (31.2%) |
Occupancy by Age of Householder in Fox Crossing
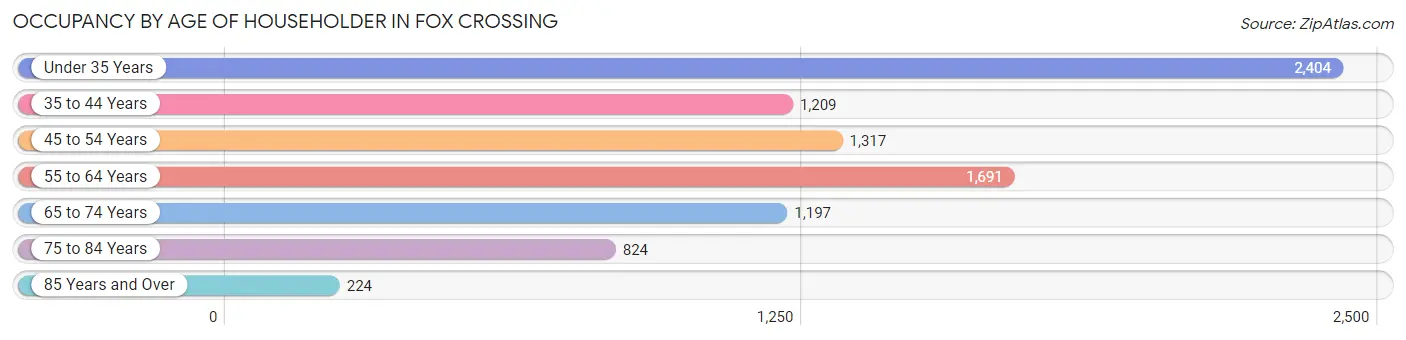
| Age Bracket | # Households | % Households |
| Under 35 Years | 2,404 | 27.1% |
| 35 to 44 Years | 1,209 | 13.6% |
| 45 to 54 Years | 1,317 | 14.8% |
| 55 to 64 Years | 1,691 | 19.1% |
| 65 to 74 Years | 1,197 | 13.5% |
| 75 to 84 Years | 824 | 9.3% |
| 85 Years and Over | 224 | 2.5% |
| Total | 8,866 | 100.0% |
Housing Finances in Fox Crossing
Median Income by Occupancy in Fox Crossing
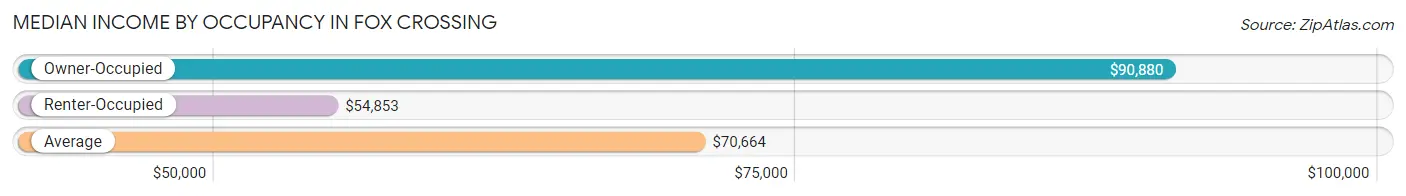
| Occupancy Type | # Households | Median Income |
| Owner-Occupied | 5,576 (62.9%) | $90,880 |
| Renter-Occupied | 3,290 (37.1%) | $54,853 |
| Average | 8,866 (100.0%) | $70,664 |
Occupancy by Householder Income Bracket in Fox Crossing
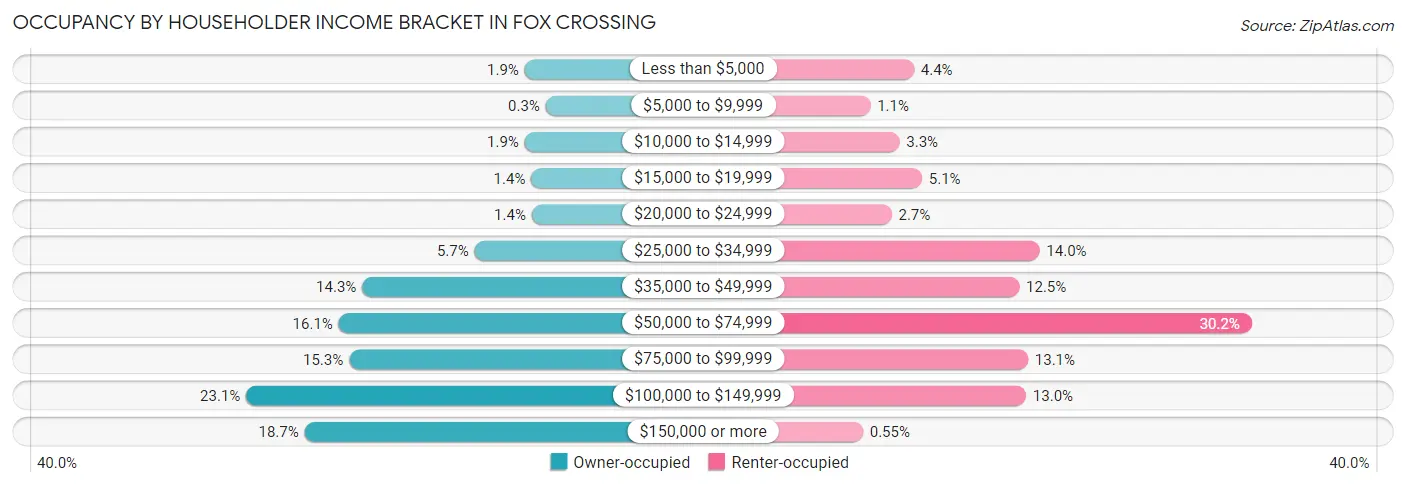
| Income Bracket | Owner-occupied | Renter-occupied |
| Less than $5,000 | 106 (1.9%) | 146 (4.4%) |
| $5,000 to $9,999 | 17 (0.3%) | 37 (1.1%) |
| $10,000 to $14,999 | 106 (1.9%) | 110 (3.3%) |
| $15,000 to $19,999 | 78 (1.4%) | 166 (5.1%) |
| $20,000 to $24,999 | 76 (1.4%) | 90 (2.7%) |
| $25,000 to $34,999 | 319 (5.7%) | 461 (14.0%) |
| $35,000 to $49,999 | 796 (14.3%) | 410 (12.5%) |
| $50,000 to $74,999 | 896 (16.1%) | 993 (30.2%) |
| $75,000 to $99,999 | 852 (15.3%) | 432 (13.1%) |
| $100,000 to $149,999 | 1,289 (23.1%) | 427 (13.0%) |
| $150,000 or more | 1,041 (18.7%) | 18 (0.5%) |
| Total | 5,576 (100.0%) | 3,290 (100.0%) |
Monthly Housing Cost Tiers in Fox Crossing
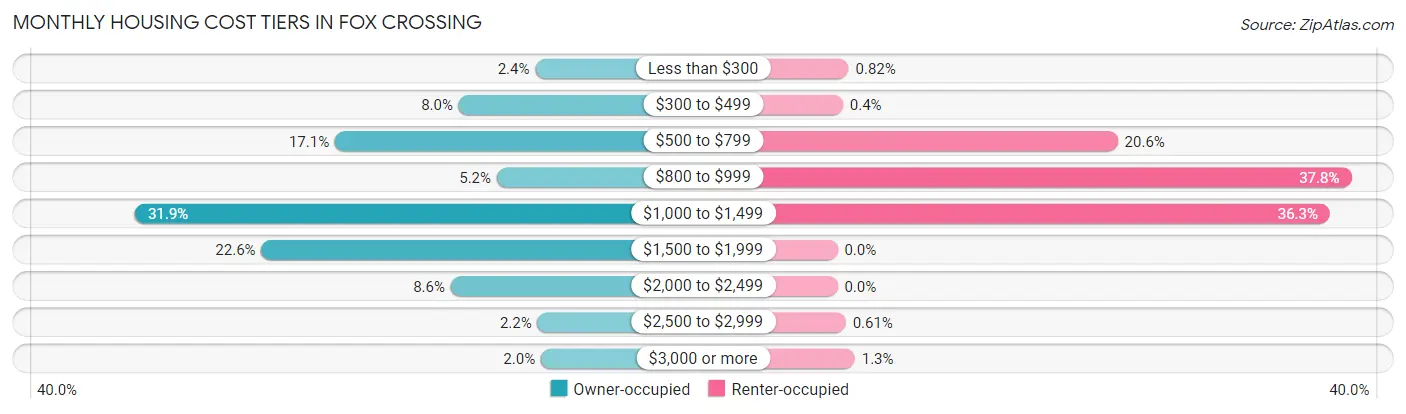
| Monthly Cost | Owner-occupied | Renter-occupied |
| Less than $300 | 133 (2.4%) | 27 (0.8%) |
| $300 to $499 | 447 (8.0%) | 13 (0.4%) |
| $500 to $799 | 956 (17.1%) | 679 (20.6%) |
| $800 to $999 | 291 (5.2%) | 1,245 (37.8%) |
| $1,000 to $1,499 | 1,777 (31.9%) | 1,193 (36.3%) |
| $1,500 to $1,999 | 1,258 (22.6%) | 0 (0.0%) |
| $2,000 to $2,499 | 480 (8.6%) | 0 (0.0%) |
| $2,500 to $2,999 | 124 (2.2%) | 20 (0.6%) |
| $3,000 or more | 110 (2.0%) | 42 (1.3%) |
| Total | 5,576 (100.0%) | 3,290 (100.0%) |
Physical Housing Characteristics in Fox Crossing
Housing Structures in Fox Crossing
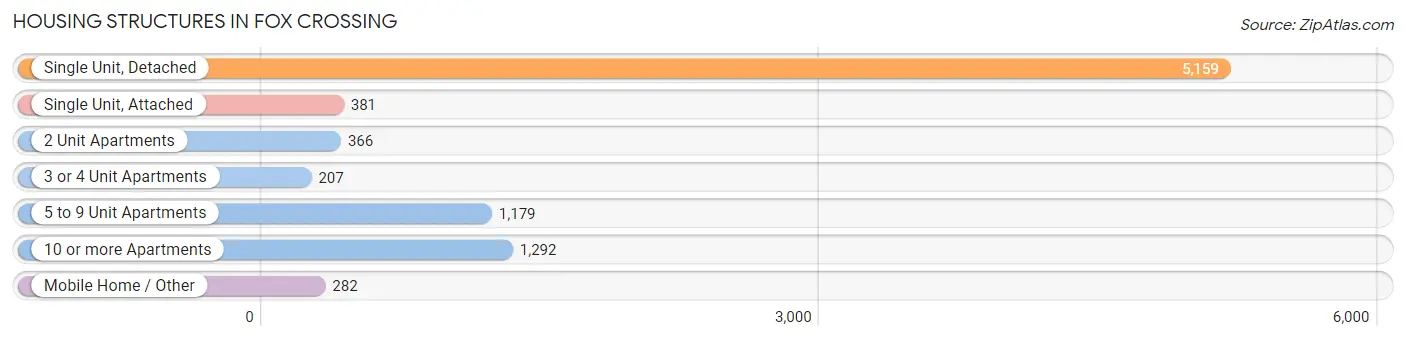
| Structure Type | # Housing Units | % Housing Units |
| Single Unit, Detached | 5,159 | 58.2% |
| Single Unit, Attached | 381 | 4.3% |
| 2 Unit Apartments | 366 | 4.1% |
| 3 or 4 Unit Apartments | 207 | 2.3% |
| 5 to 9 Unit Apartments | 1,179 | 13.3% |
| 10 or more Apartments | 1,292 | 14.6% |
| Mobile Home / Other | 282 | 3.2% |
| Total | 8,866 | 100.0% |
Housing Structures by Occupancy in Fox Crossing
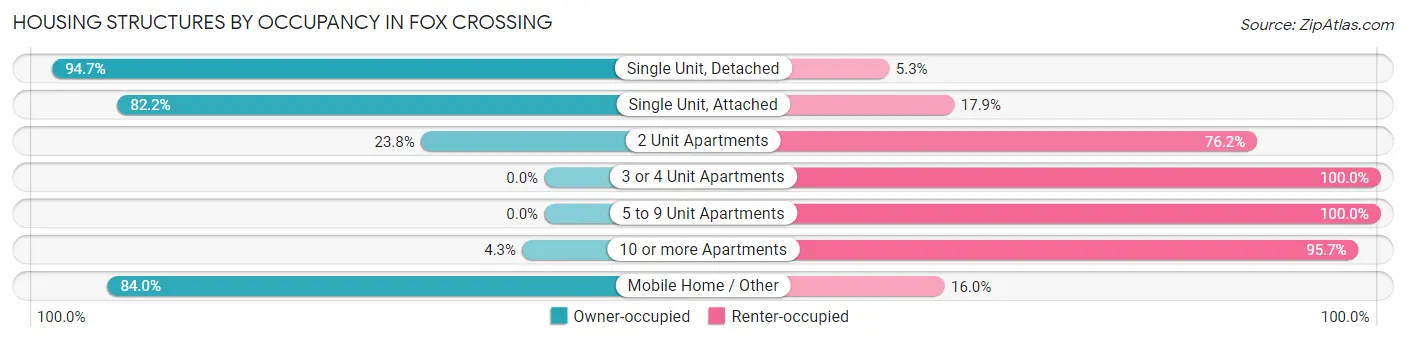
| Structure Type | Owner-occupied | Renter-occupied |
| Single Unit, Detached | 4,884 (94.7%) | 275 (5.3%) |
| Single Unit, Attached | 313 (82.2%) | 68 (17.8%) |
| 2 Unit Apartments | 87 (23.8%) | 279 (76.2%) |
| 3 or 4 Unit Apartments | 0 (0.0%) | 207 (100.0%) |
| 5 to 9 Unit Apartments | 0 (0.0%) | 1,179 (100.0%) |
| 10 or more Apartments | 55 (4.3%) | 1,237 (95.7%) |
| Mobile Home / Other | 237 (84.0%) | 45 (16.0%) |
| Total | 5,576 (62.9%) | 3,290 (37.1%) |
Housing Structures by Number of Rooms in Fox Crossing
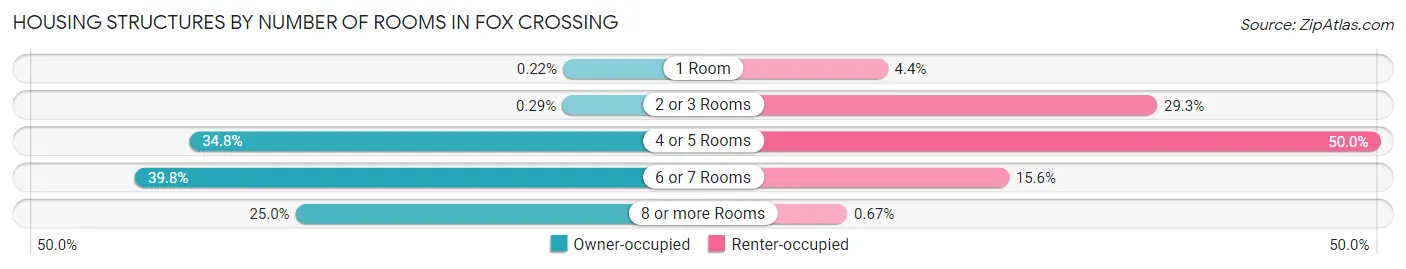
| Number of Rooms | Owner-occupied | Renter-occupied |
| 1 Room | 12 (0.2%) | 145 (4.4%) |
| 2 or 3 Rooms | 16 (0.3%) | 965 (29.3%) |
| 4 or 5 Rooms | 1,939 (34.8%) | 1,644 (50.0%) |
| 6 or 7 Rooms | 2,218 (39.8%) | 514 (15.6%) |
| 8 or more Rooms | 1,391 (24.9%) | 22 (0.7%) |
| Total | 5,576 (100.0%) | 3,290 (100.0%) |
Housing Structure by Heating Type in Fox Crossing
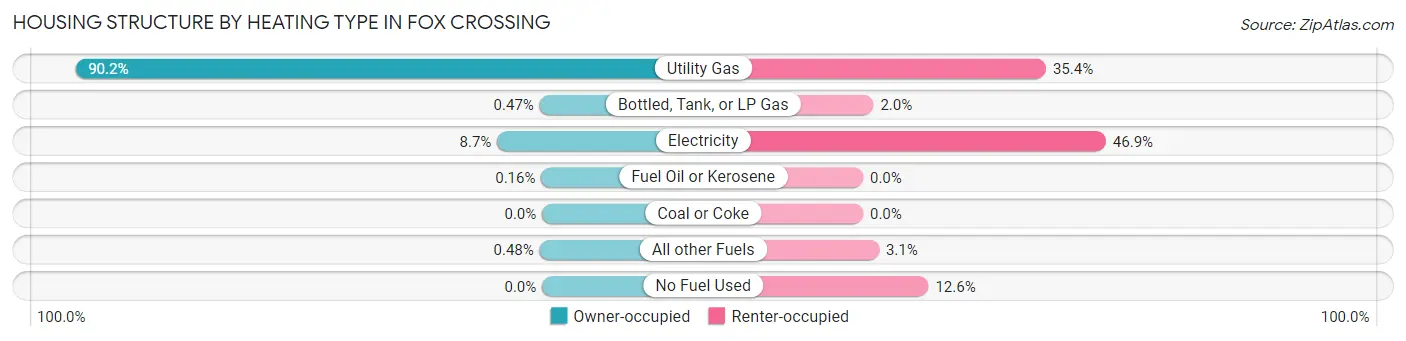
| Heating Type | Owner-occupied | Renter-occupied |
| Utility Gas | 5,030 (90.2%) | 1,163 (35.3%) |
| Bottled, Tank, or LP Gas | 26 (0.5%) | 66 (2.0%) |
| Electricity | 484 (8.7%) | 1,544 (46.9%) |
| Fuel Oil or Kerosene | 9 (0.2%) | 0 (0.0%) |
| Coal or Coke | 0 (0.0%) | 0 (0.0%) |
| All other Fuels | 27 (0.5%) | 101 (3.1%) |
| No Fuel Used | 0 (0.0%) | 416 (12.6%) |
| Total | 5,576 (100.0%) | 3,290 (100.0%) |
Household Vehicle Usage in Fox Crossing
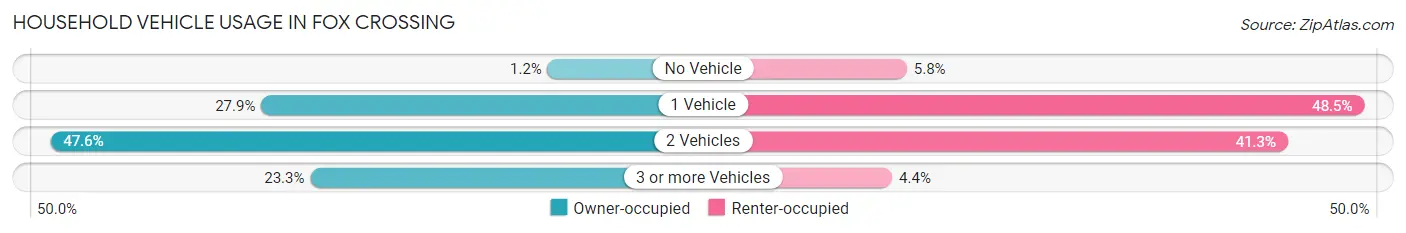
| Vehicles per Household | Owner-occupied | Renter-occupied |
| No Vehicle | 65 (1.2%) | 190 (5.8%) |
| 1 Vehicle | 1,556 (27.9%) | 1,595 (48.5%) |
| 2 Vehicles | 2,654 (47.6%) | 1,360 (41.3%) |
| 3 or more Vehicles | 1,301 (23.3%) | 145 (4.4%) |
| Total | 5,576 (100.0%) | 3,290 (100.0%) |
Real Estate & Mortgages in Fox Crossing
Real Estate and Mortgage Overview in Fox Crossing
| Characteristic | Without Mortgage | With Mortgage |
| Housing Units | 1,892 | 3,684 |
| Median Property Value | $188,800 | $213,200 |
| Median Household Income | $68,203 | $821 |
| Monthly Housing Costs | $625 | $110 |
| Real Estate Taxes | $3,497 | $0 |
Property Value by Mortgage Status in Fox Crossing
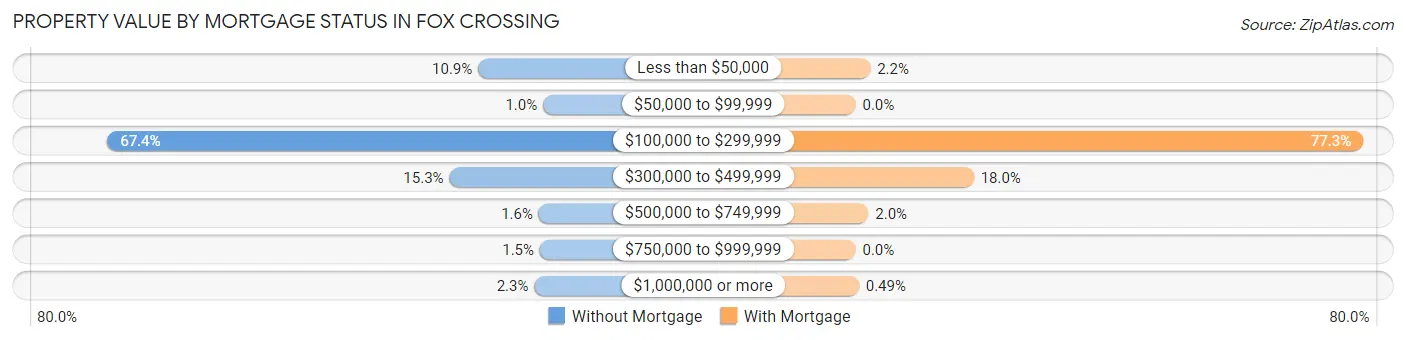
| Property Value | Without Mortgage | With Mortgage |
| Less than $50,000 | 206 (10.9%) | 82 (2.2%) |
| $50,000 to $99,999 | 19 (1.0%) | 0 (0.0%) |
| $100,000 to $299,999 | 1,275 (67.4%) | 2,849 (77.3%) |
| $300,000 to $499,999 | 289 (15.3%) | 663 (18.0%) |
| $500,000 to $749,999 | 31 (1.6%) | 72 (1.9%) |
| $750,000 to $999,999 | 28 (1.5%) | 0 (0.0%) |
| $1,000,000 or more | 44 (2.3%) | 18 (0.5%) |
| Total | 1,892 (100.0%) | 3,684 (100.0%) |
Household Income by Mortgage Status in Fox Crossing
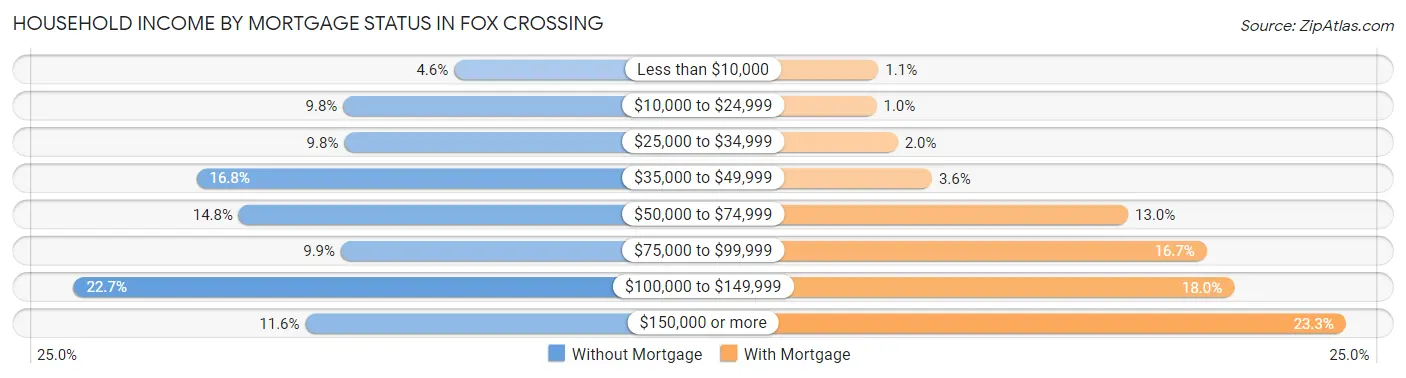
| Household Income | Without Mortgage | With Mortgage |
| Less than $10,000 | 86 (4.5%) | 40 (1.1%) |
| $10,000 to $24,999 | 186 (9.8%) | 37 (1.0%) |
| $25,000 to $34,999 | 185 (9.8%) | 74 (2.0%) |
| $35,000 to $49,999 | 318 (16.8%) | 134 (3.6%) |
| $50,000 to $74,999 | 280 (14.8%) | 478 (13.0%) |
| $75,000 to $99,999 | 188 (9.9%) | 616 (16.7%) |
| $100,000 to $149,999 | 429 (22.7%) | 664 (18.0%) |
| $150,000 or more | 220 (11.6%) | 860 (23.3%) |
| Total | 1,892 (100.0%) | 3,684 (100.0%) |
Property Value to Household Income Ratio in Fox Crossing
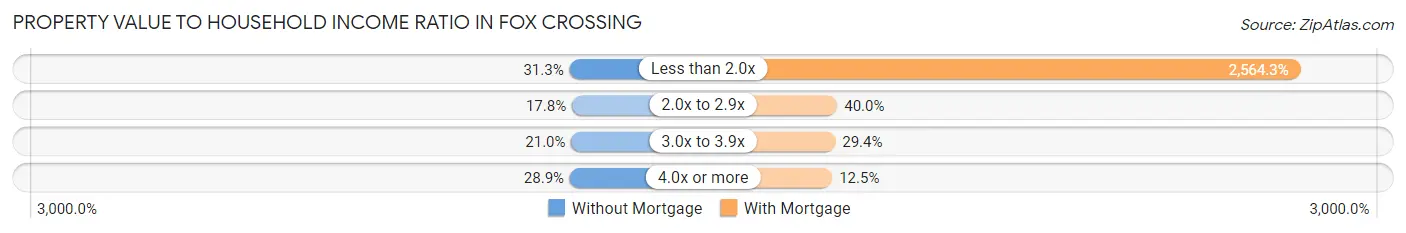
| Value-to-Income Ratio | Without Mortgage | With Mortgage |
| Less than 2.0x | 592 (31.3%) | 94,469 (2,564.3%) |
| 2.0x to 2.9x | 336 (17.8%) | 1,475 (40.0%) |
| 3.0x to 3.9x | 398 (21.0%) | 1,082 (29.4%) |
| 4.0x or more | 547 (28.9%) | 461 (12.5%) |
| Total | 1,892 (100.0%) | 3,684 (100.0%) |
Real Estate Taxes by Mortgage Status in Fox Crossing
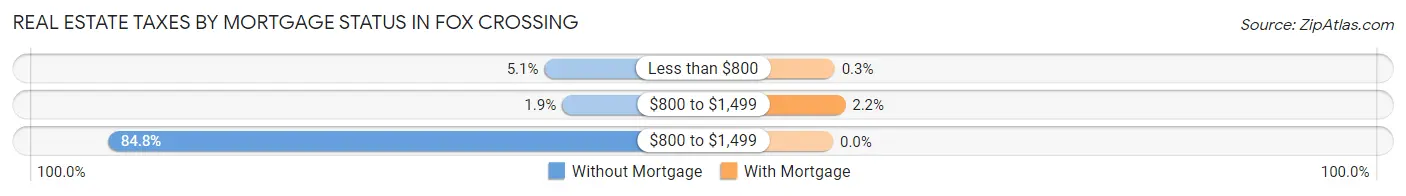
| Property Taxes | Without Mortgage | With Mortgage |
| Less than $800 | 96 (5.1%) | 11 (0.3%) |
| $800 to $1,499 | 35 (1.8%) | 82 (2.2%) |
| $800 to $1,499 | 1,604 (84.8%) | 0 (0.0%) |
| Total | 1,892 (100.0%) | 3,684 (100.0%) |
Health & Disability in Fox Crossing
Health Insurance Coverage by Age in Fox Crossing
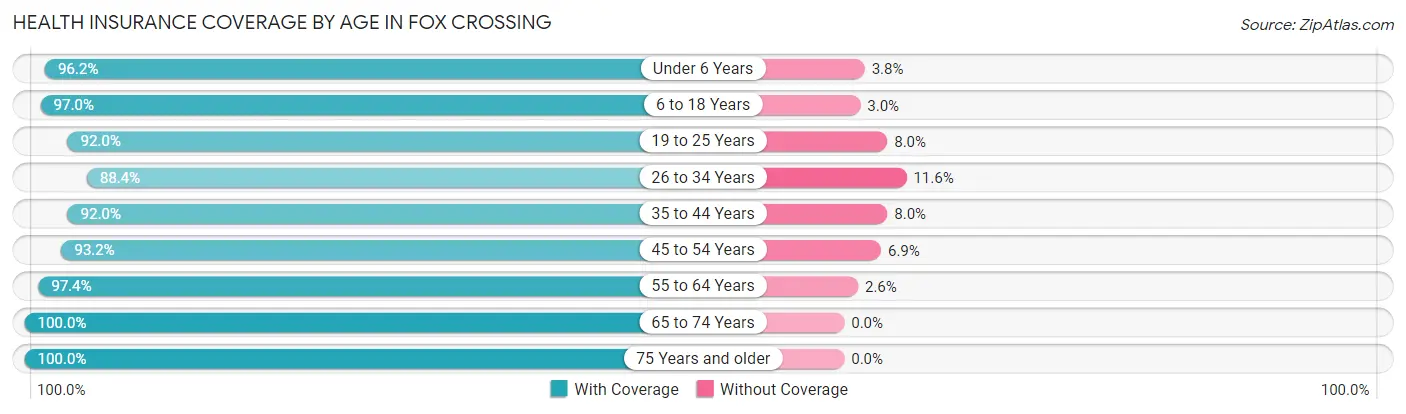
| Age Bracket | With Coverage | Without Coverage |
| Under 6 Years | 1,440 (96.2%) | 57 (3.8%) |
| 6 to 18 Years | 2,106 (97.0%) | 65 (3.0%) |
| 19 to 25 Years | 1,927 (92.0%) | 168 (8.0%) |
| 26 to 34 Years | 2,423 (88.4%) | 318 (11.6%) |
| 35 to 44 Years | 1,901 (92.0%) | 166 (8.0%) |
| 45 to 54 Years | 1,876 (93.1%) | 138 (6.9%) |
| 55 to 64 Years | 2,628 (97.4%) | 69 (2.6%) |
| 65 to 74 Years | 2,060 (100.0%) | 0 (0.0%) |
| 75 Years and older | 1,475 (100.0%) | 0 (0.0%) |
| Total | 17,836 (94.8%) | 981 (5.2%) |
Health Insurance Coverage by Citizenship Status in Fox Crossing
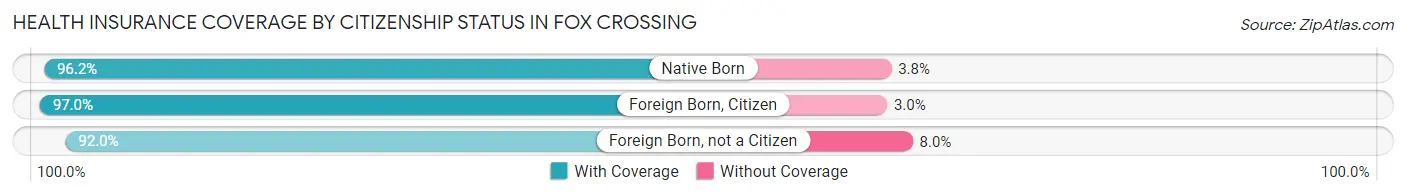
| Citizenship Status | With Coverage | Without Coverage |
| Native Born | 1,440 (96.2%) | 57 (3.8%) |
| Foreign Born, Citizen | 2,106 (97.0%) | 65 (3.0%) |
| Foreign Born, not a Citizen | 1,927 (92.0%) | 168 (8.0%) |
Health Insurance Coverage by Household Income in Fox Crossing
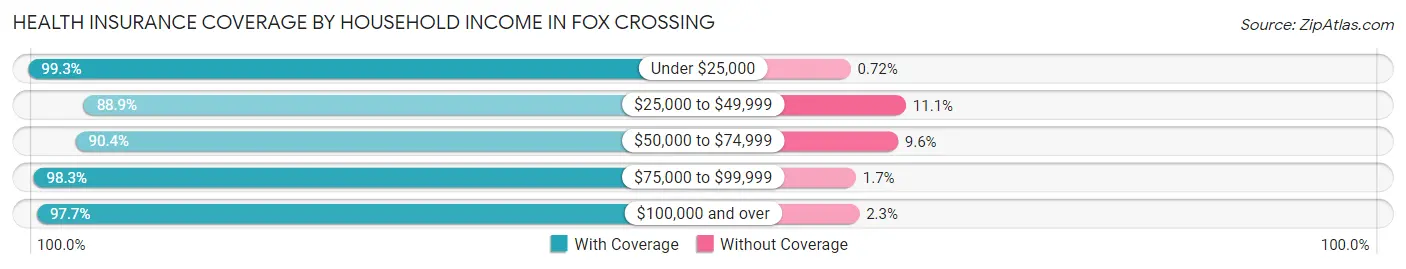
| Household Income | With Coverage | Without Coverage |
| Under $25,000 | 1,244 (99.3%) | 9 (0.7%) |
| $25,000 to $49,999 | 3,211 (88.9%) | 400 (11.1%) |
| $50,000 to $74,999 | 3,268 (90.4%) | 346 (9.6%) |
| $75,000 to $99,999 | 2,782 (98.3%) | 48 (1.7%) |
| $100,000 and over | 7,281 (97.7%) | 174 (2.3%) |
Public vs Private Health Insurance Coverage by Age in Fox Crossing
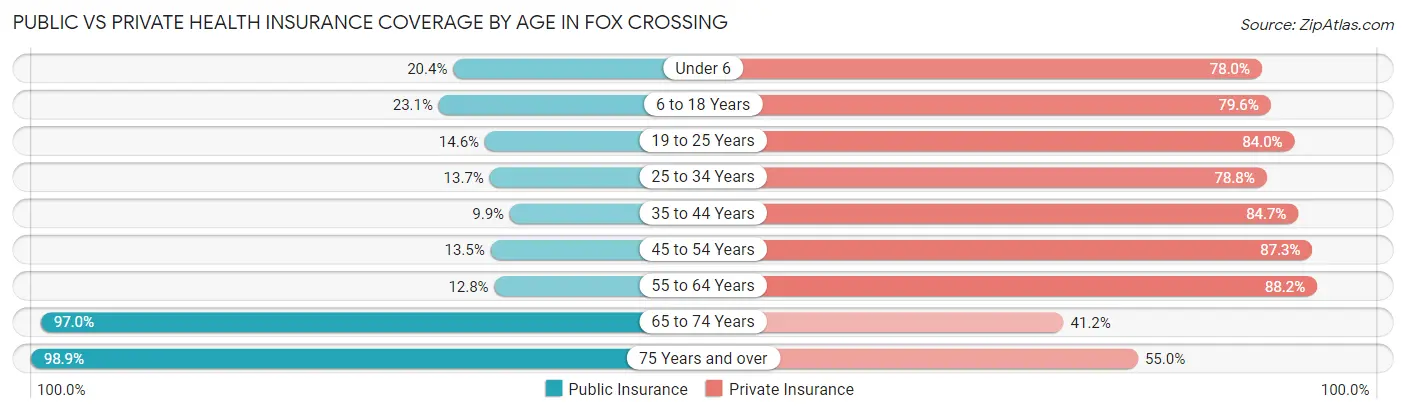
| Age Bracket | Public Insurance | Private Insurance |
| Under 6 | 306 (20.4%) | 1,167 (78.0%) |
| 6 to 18 Years | 502 (23.1%) | 1,728 (79.6%) |
| 19 to 25 Years | 305 (14.6%) | 1,760 (84.0%) |
| 25 to 34 Years | 375 (13.7%) | 2,161 (78.8%) |
| 35 to 44 Years | 205 (9.9%) | 1,751 (84.7%) |
| 45 to 54 Years | 272 (13.5%) | 1,759 (87.3%) |
| 55 to 64 Years | 345 (12.8%) | 2,379 (88.2%) |
| 65 to 74 Years | 1,998 (97.0%) | 848 (41.2%) |
| 75 Years and over | 1,458 (98.9%) | 811 (55.0%) |
| Total | 5,766 (30.6%) | 14,364 (76.3%) |
Disability Status by Sex by Age in Fox Crossing
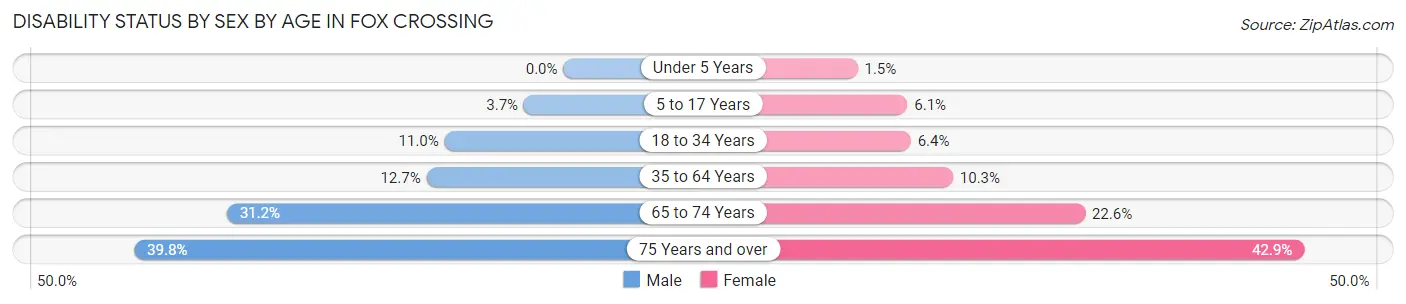
| Age Bracket | Male | Female |
| Under 5 Years | 0 (0.0%) | 7 (1.5%) |
| 5 to 17 Years | 39 (3.7%) | 69 (6.1%) |
| 18 to 34 Years | 266 (11.0%) | 169 (6.4%) |
| 35 to 64 Years | 425 (12.7%) | 354 (10.3%) |
| 65 to 74 Years | 303 (31.2%) | 246 (22.6%) |
| 75 Years and over | 284 (39.8%) | 327 (42.9%) |
Disability Class by Sex by Age in Fox Crossing
Disability Class: Hearing Difficulty
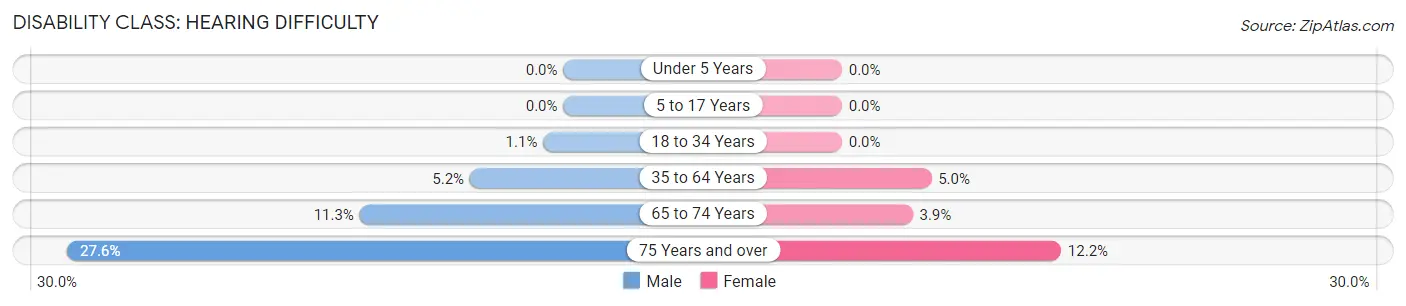
| Age Bracket | Male | Female |
| Under 5 Years | 0 (0.0%) | 0 (0.0%) |
| 5 to 17 Years | 0 (0.0%) | 0 (0.0%) |
| 18 to 34 Years | 27 (1.1%) | 0 (0.0%) |
| 35 to 64 Years | 174 (5.2%) | 171 (5.0%) |
| 65 to 74 Years | 110 (11.3%) | 43 (3.9%) |
| 75 Years and over | 197 (27.6%) | 93 (12.2%) |
Disability Class: Vision Difficulty
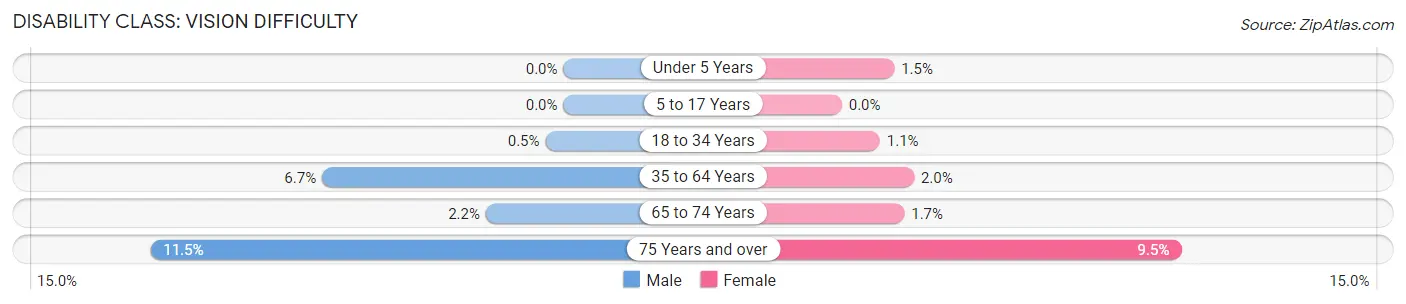
| Age Bracket | Male | Female |
| Under 5 Years | 0 (0.0%) | 7 (1.5%) |
| 5 to 17 Years | 0 (0.0%) | 0 (0.0%) |
| 18 to 34 Years | 12 (0.5%) | 28 (1.1%) |
| 35 to 64 Years | 225 (6.7%) | 69 (2.0%) |
| 65 to 74 Years | 21 (2.2%) | 19 (1.7%) |
| 75 Years and over | 82 (11.5%) | 72 (9.5%) |
Disability Class: Cognitive Difficulty
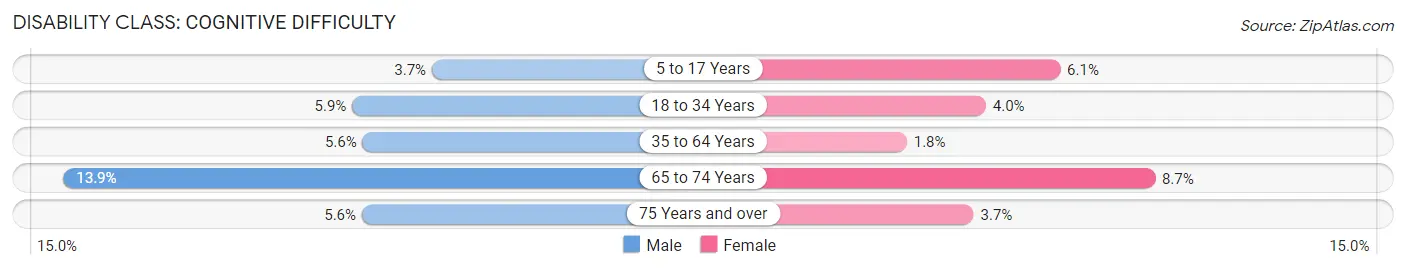
| Age Bracket | Male | Female |
| 5 to 17 Years | 39 (3.7%) | 69 (6.1%) |
| 18 to 34 Years | 142 (5.9%) | 106 (4.0%) |
| 35 to 64 Years | 187 (5.6%) | 62 (1.8%) |
| 65 to 74 Years | 135 (13.9%) | 95 (8.7%) |
| 75 Years and over | 40 (5.6%) | 28 (3.7%) |
Disability Class: Ambulatory Difficulty
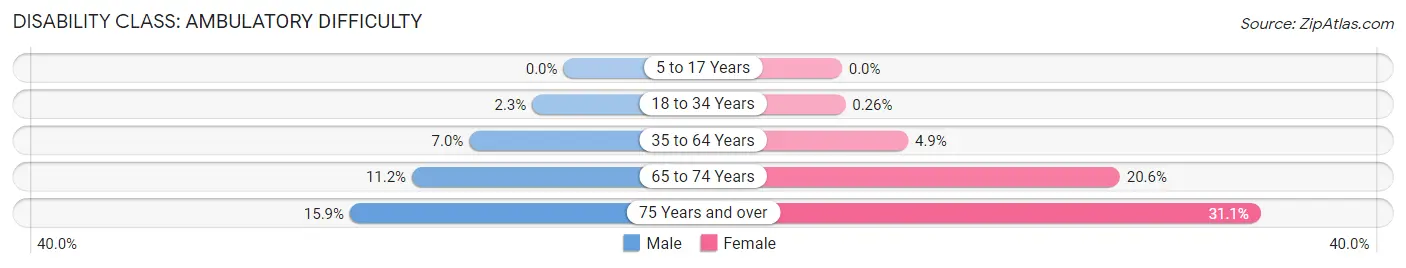
| Age Bracket | Male | Female |
| 5 to 17 Years | 0 (0.0%) | 0 (0.0%) |
| 18 to 34 Years | 56 (2.3%) | 7 (0.3%) |
| 35 to 64 Years | 234 (7.0%) | 169 (4.9%) |
| 65 to 74 Years | 109 (11.2%) | 225 (20.6%) |
| 75 Years and over | 113 (15.9%) | 237 (31.1%) |
Disability Class: Self-Care Difficulty
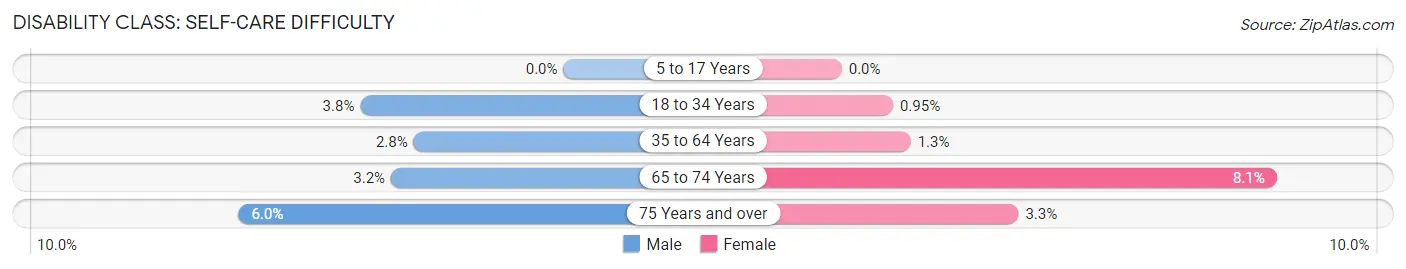
| Age Bracket | Male | Female |
| 5 to 17 Years | 0 (0.0%) | 0 (0.0%) |
| 18 to 34 Years | 91 (3.8%) | 25 (0.9%) |
| 35 to 64 Years | 93 (2.8%) | 44 (1.3%) |
| 65 to 74 Years | 31 (3.2%) | 88 (8.1%) |
| 75 Years and over | 43 (6.0%) | 25 (3.3%) |
Technology Access in Fox Crossing
Computing Device Access in Fox Crossing
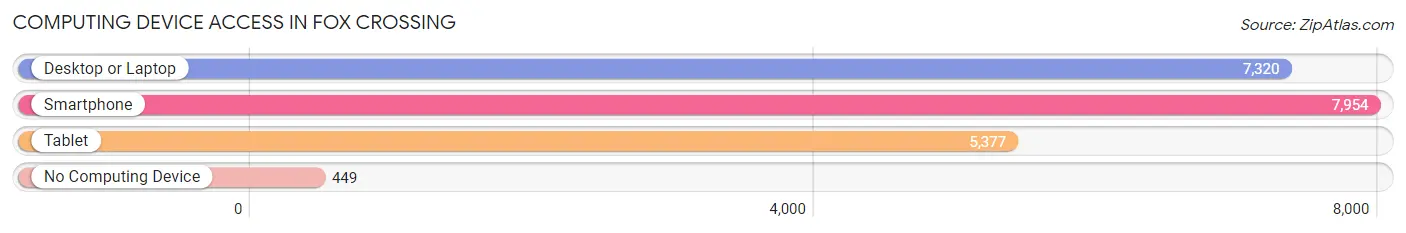
| Device Type | # Households | % Households |
| Desktop or Laptop | 7,320 | 82.6% |
| Smartphone | 7,954 | 89.7% |
| Tablet | 5,377 | 60.7% |
| No Computing Device | 449 | 5.1% |
| Total | 8,866 | 100.0% |
Internet Access in Fox Crossing
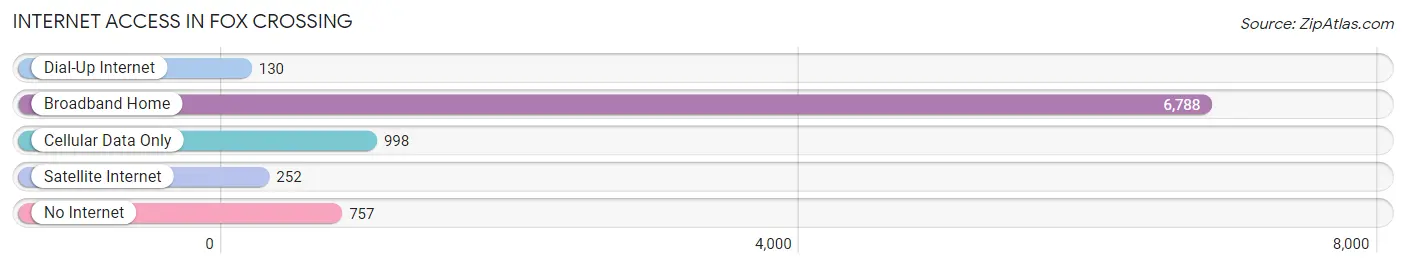
| Internet Type | # Households | % Households |
| Dial-Up Internet | 130 | 1.5% |
| Broadband Home | 6,788 | 76.6% |
| Cellular Data Only | 998 | 11.3% |
| Satellite Internet | 252 | 2.8% |
| No Internet | 757 | 8.5% |
| Total | 8,866 | 100.0% |
Fox Crossing Summary
Fox Crossing is a village located in Winnebago County, Wisconsin, United States. The population was 12,741 at the 2010 census. It is part of the Appleton, Wisconsin Metropolitan Statistical Area.
History
The area that is now Fox Crossing was originally inhabited by the Menominee and Winnebago Native American tribes. The first European settlers arrived in the area in the early 1800s. The village was originally known as Doty Island, named after James Doty, the first territorial governor of Wisconsin. The village was incorporated in 1858 and was renamed Fox Crossing in 1871.
Geography
Fox Crossing is located at 44°17'25"N 88°30'45"W (44.290278, -88.5125). According to the United States Census Bureau, the village has a total area of 8.2 square miles (21.2 km2), of which, 8.1 square miles (21.0 km2) of it is land and 0.1 square miles (0.2 km2) of it (1.22%) is water.
Economy
Fox Crossing is home to several large employers, including the Kimberly-Clark Corporation, which has a large paper mill in the village. Other major employers include the Fox Valley Technical College, the Fox Valley Orthopedic Institute, and the Fox Valley Medical Center.
Demographics
As of the census of 2010, there were 12,741 people, 5,093 households, and 3,541 families residing in the village. The population density was 1,569.2 people per square mile (606.3/km2). There were 5,346 housing units at an average density of 662.2 per square mile (255.6/km2). The racial makeup of the village was 94.2% White, 1.2% African American, 0.3% Native American, 1.9% Asian, 0.7% from other races, and 1.7% from two or more races. Hispanic or Latino of any race were 2.3% of the population.
There were 5,093 households, out of which 33.2% had children under the age of 18 living with them, 54.2% were married couples living together, 9.7% had a female householder with no husband present, and 32.2% were non-families. 26.2% of all households were made up of individuals, and 9.2% had someone living alone who was 65 years of age or older. The average household size was 2.50 and the average family size was 3.05.
In the village, the population was spread out, with 25.7% under the age of 18, 7.2% from 18 to 24, 30.2% from 25 to 44, 24.2% from 45 to 64, and 12.7% who were 65 years of age or older. The median age was 37 years. For every 100 females, there were 94.2 males. For every 100 females age 18 and over, there were 91.2 males.
The median income for a household in the village was $54,945, and the median income for a family was $64,945. Males had a median income of $45,945 versus $31,945 for females. The per capita income for the village was $25,945. About 3.2% of families and 4.7% of the population were below the poverty line, including 5.2% of those under age 18 and 4.2% of those age 65 or over.
Common Questions
What is Per Capita Income in Fox Crossing?
Per Capita income in Fox Crossing is $42,669.
What is the Median Family Income in Fox Crossing?
Median Family Income in Fox Crossing is $91,899.
What is the Median Household income in Fox Crossing?
Median Household Income in Fox Crossing is $70,664.
What is Income or Wage Gap in Fox Crossing?
Income or Wage Gap in Fox Crossing is 21.0%.
Women in Fox Crossing earn 79.0 cents for every dollar earned by a man.
What is Family Income Deficit in Fox Crossing?
Family Income Deficit in Fox Crossing is $15,094.
Families that are below poverty line in Fox Crossing earn $15,094 less on average than the poverty threshold level.
What is Inequality or Gini Index in Fox Crossing?
Inequality or Gini Index in Fox Crossing is 0.42.
What is the Total Population of Fox Crossing?
Total Population of Fox Crossing is 18,949.
What is the Total Male Population of Fox Crossing?
Total Male Population of Fox Crossing is 9,367.
What is the Total Female Population of Fox Crossing?
Total Female Population of Fox Crossing is 9,582.
What is the Ratio of Males per 100 Females in Fox Crossing?
There are 97.76 Males per 100 Females in Fox Crossing.
What is the Ratio of Females per 100 Males in Fox Crossing?
There are 102.30 Females per 100 Males in Fox Crossing.
What is the Median Population Age in Fox Crossing?
Median Population Age in Fox Crossing is 39.0 Years.
What is the Average Family Size in Fox Crossing
Average Family Size in Fox Crossing is 2.8 People.
What is the Average Household Size in Fox Crossing
Average Household Size in Fox Crossing is 2.1 People.
How Large is the Labor Force in Fox Crossing?
There are 10,602 People in the Labor Forcein in Fox Crossing.
What is the Percentage of People in the Labor Force in Fox Crossing?
66.8% of People are in the Labor Force in Fox Crossing.
What is the Unemployment Rate in Fox Crossing?
Unemployment Rate in Fox Crossing is 1.3%.