Fort Atkinson, WI Map & Demographics
Fort Atkinson Map
Fort Atkinson Overview
$35,850
PER CAPITA INCOME
$89,741
AVG FAMILY INCOME
$72,215
AVG HOUSEHOLD INCOME
25.6%
WAGE / INCOME GAP [ % ]
74.4¢/ $1
WAGE / INCOME GAP [ $ ]
0.37
INEQUALITY / GINI INDEX
12,522
TOTAL POPULATION
6,188
MALE POPULATION
6,334
FEMALE POPULATION
97.69
MALES / 100 FEMALES
102.36
FEMALES / 100 MALES
42.0
MEDIAN AGE
2.9
AVG FAMILY SIZE
2.3
AVG HOUSEHOLD SIZE
7,534
LABOR FORCE [ PEOPLE ]
71.4%
PERCENT IN LABOR FORCE
3.1%
UNEMPLOYMENT RATE
Fort Atkinson Zip Codes
Income in Fort Atkinson
Income Overview in Fort Atkinson
Per Capita Income in Fort Atkinson is $35,850, while median incomes of families and households are $89,741 and $72,215 respectively.
| Characteristic | Number | Measure |
| Per Capita Income | 12,522 | $35,850 |
| Median Family Income | 3,137 | $89,741 |
| Mean Family Income | 3,137 | $97,808 |
| Median Household Income | 5,367 | $72,215 |
| Mean Household Income | 5,367 | $82,690 |
| Income Deficit | 3,137 | $0 |
| Wage / Income Gap (%) | 12,522 | 25.60% |
| Wage / Income Gap ($) | 12,522 | 74.40¢ per $1 |
| Gini / Inequality Index | 12,522 | 0.37 |
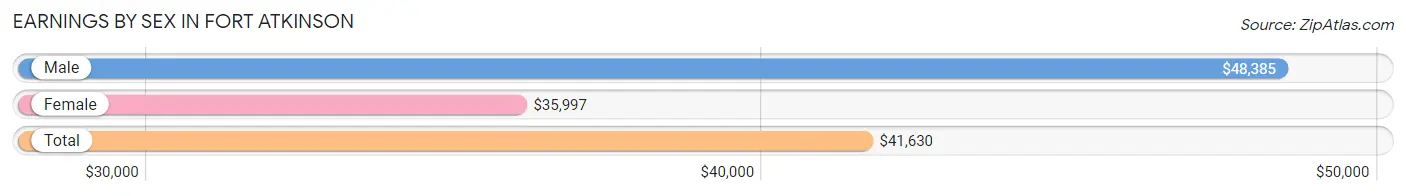
Earnings by Sex in Fort Atkinson
Average Earnings in Fort Atkinson are $41,630, $48,385 for men and $35,997 for women, a difference of 25.6%.
| Sex | Number | Average Earnings |
| Male | 4,164 (54.3%) | $48,385 |
| Female | 3,506 (45.7%) | $35,997 |
| Total | 7,670 (100.0%) | $41,630 |
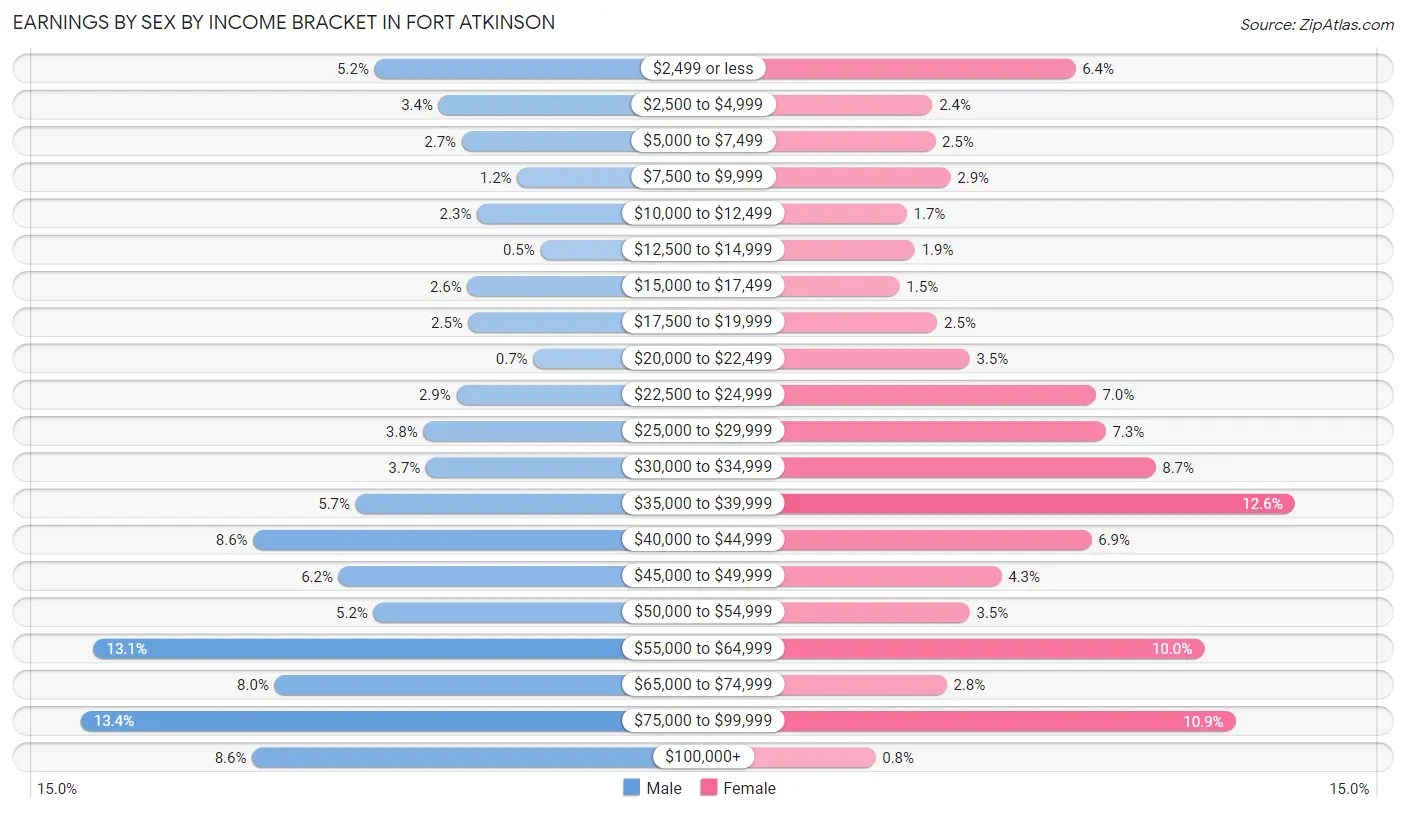
Earnings by Sex by Income Bracket in Fort Atkinson
The most common earnings brackets in Fort Atkinson are $75,000 to $99,999 for men (559 | 13.4%) and $35,000 to $39,999 for women (441 | 12.6%).
| Income | Male | Female |
| $2,499 or less | 215 (5.2%) | 225 (6.4%) |
| $2,500 to $4,999 | 140 (3.4%) | 84 (2.4%) |
| $5,000 to $7,499 | 113 (2.7%) | 87 (2.5%) |
| $7,500 to $9,999 | 48 (1.1%) | 102 (2.9%) |
| $10,000 to $12,499 | 95 (2.3%) | 59 (1.7%) |
| $12,500 to $14,999 | 21 (0.5%) | 67 (1.9%) |
| $15,000 to $17,499 | 106 (2.5%) | 52 (1.5%) |
| $17,500 to $19,999 | 105 (2.5%) | 89 (2.5%) |
| $20,000 to $22,499 | 29 (0.7%) | 121 (3.5%) |
| $22,500 to $24,999 | 119 (2.9%) | 245 (7.0%) |
| $25,000 to $29,999 | 158 (3.8%) | 255 (7.3%) |
| $30,000 to $34,999 | 155 (3.7%) | 304 (8.7%) |
| $35,000 to $39,999 | 237 (5.7%) | 441 (12.6%) |
| $40,000 to $44,999 | 357 (8.6%) | 241 (6.9%) |
| $45,000 to $49,999 | 257 (6.2%) | 152 (4.3%) |
| $50,000 to $54,999 | 216 (5.2%) | 121 (3.5%) |
| $55,000 to $64,999 | 544 (13.1%) | 352 (10.0%) |
| $65,000 to $74,999 | 332 (8.0%) | 98 (2.8%) |
| $75,000 to $99,999 | 559 (13.4%) | 383 (10.9%) |
| $100,000+ | 358 (8.6%) | 28 (0.8%) |
| Total | 4,164 (100.0%) | 3,506 (100.0%) |
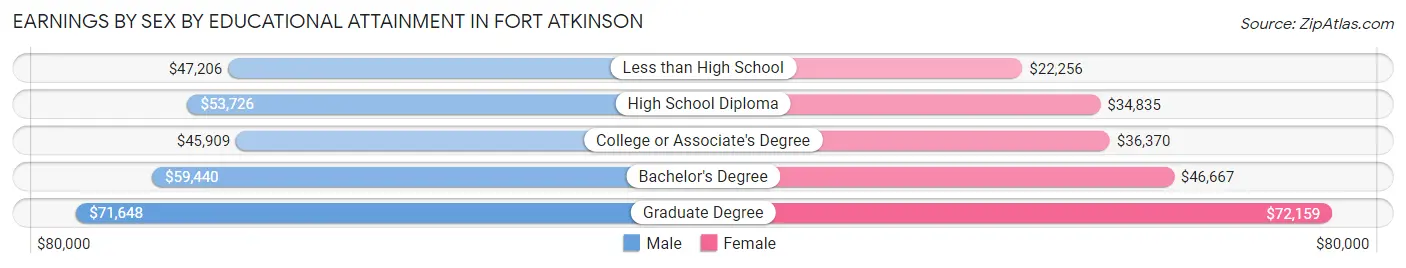
Earnings by Sex by Educational Attainment in Fort Atkinson
Average earnings in Fort Atkinson are $53,292 for men and $38,867 for women, a difference of 27.1%. Men with an educational attainment of graduate degree enjoy the highest average annual earnings of $71,648, while those with college or associate's degree education earn the least with $45,909. Women with an educational attainment of graduate degree earn the most with the average annual earnings of $72,159, while those with less than high school education have the smallest earnings of $22,256.
| Educational Attainment | Male Income | Female Income |
| Less than High School | $47,206 | $22,256 |
| High School Diploma | $53,726 | $34,835 |
| College or Associate's Degree | $45,909 | $36,370 |
| Bachelor's Degree | $59,440 | $46,667 |
| Graduate Degree | $71,648 | $72,159 |
| Total | $53,292 | $38,867 |
Family Income in Fort Atkinson
Family Income Brackets in Fort Atkinson
According to the Fort Atkinson family income data, there are 951 families falling into the $100,000 to $149,999 income range, which is the most common income bracket and makes up 30.3% of all families. Conversely, the $10,000 to $14,999 income bracket is the least frequent group with only 16 families (0.5%) belonging to this category.
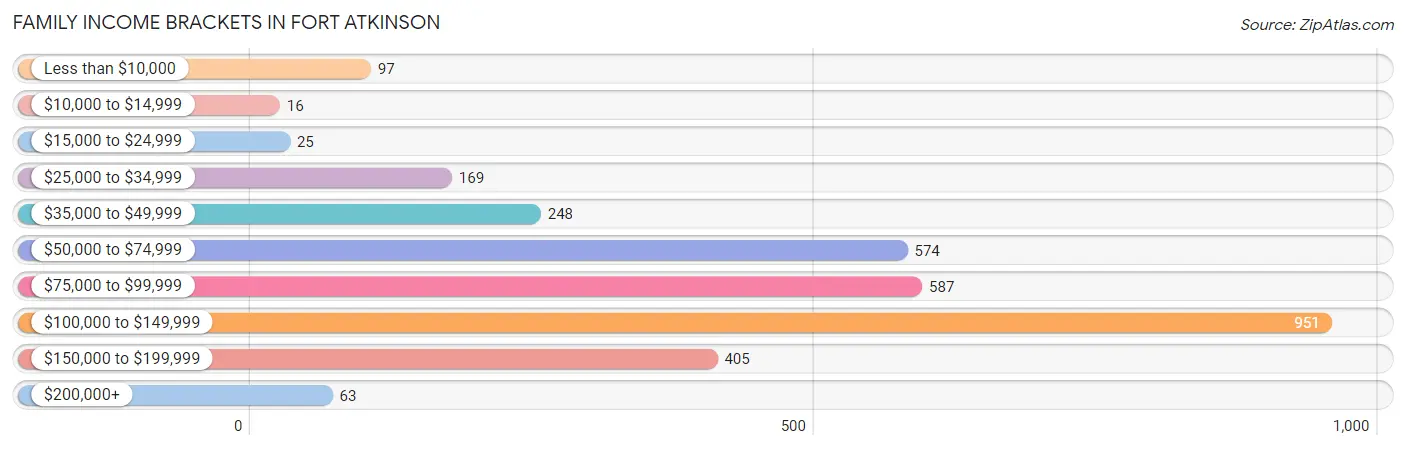
| Income Bracket | # Families | % Families |
| Less than $10,000 | 97 | 3.1% |
| $10,000 to $14,999 | 16 | 0.5% |
| $15,000 to $24,999 | 25 | 0.8% |
| $25,000 to $34,999 | 169 | 5.4% |
| $35,000 to $49,999 | 248 | 7.9% |
| $50,000 to $74,999 | 574 | 18.3% |
| $75,000 to $99,999 | 587 | 18.7% |
| $100,000 to $149,999 | 951 | 30.3% |
| $150,000 to $199,999 | 405 | 12.9% |
| $200,000+ | 63 | 2.0% |
Family Income by Famaliy Size in Fort Atkinson
5-person families (276 | 8.8%) account for the highest median family income in Fort Atkinson with $111,486 per family, while 2-person families (1,629 | 51.9%) have the highest median income of $40,176 per family member.
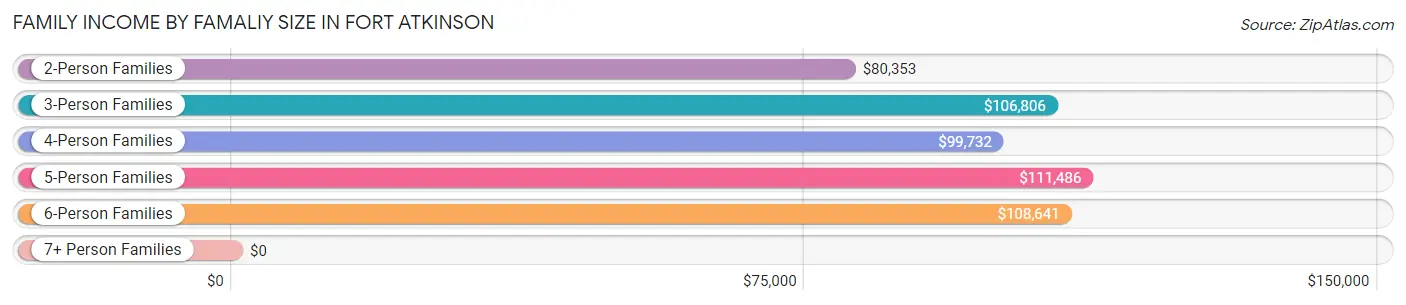
| Income Bracket | # Families | Median Income |
| 2-Person Families | 1,629 (51.9%) | $80,353 |
| 3-Person Families | 726 (23.1%) | $106,806 |
| 4-Person Families | 439 (14.0%) | $99,732 |
| 5-Person Families | 276 (8.8%) | $111,486 |
| 6-Person Families | 53 (1.7%) | $108,641 |
| 7+ Person Families | 14 (0.4%) | $0 |
| Total | 3,137 (100.0%) | $89,741 |
Family Income by Number of Earners in Fort Atkinson
The median family income in Fort Atkinson is $89,741, with families comprising 3+ earners (478) having the highest median family income of $155,853, while families with no earners (428) have the lowest median family income of $61,719, accounting for 15.2% and 13.6% of families, respectively.
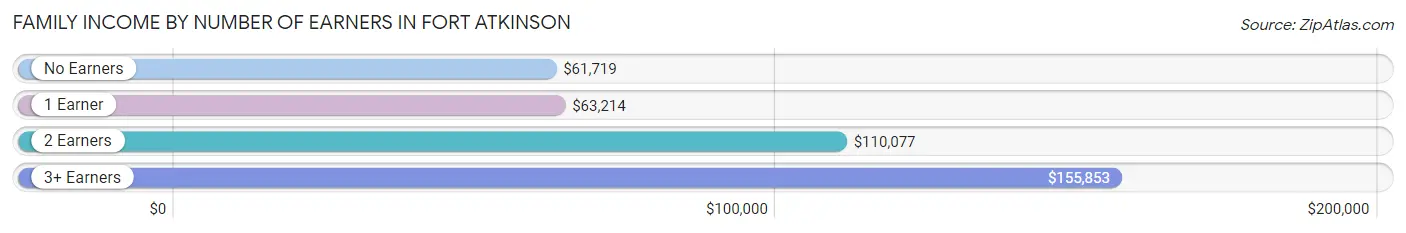
| Number of Earners | # Families | Median Income |
| No Earners | 428 (13.6%) | $61,719 |
| 1 Earner | 794 (25.3%) | $63,214 |
| 2 Earners | 1,437 (45.8%) | $110,077 |
| 3+ Earners | 478 (15.2%) | $155,853 |
| Total | 3,137 (100.0%) | $89,741 |
Household Income in Fort Atkinson
Household Income Brackets in Fort Atkinson
With 1,175 households falling in the category, the $100,000 to $149,999 income range is the most frequent in Fort Atkinson, accounting for 21.9% of all households. In contrast, only 107 households (2.0%) fall into the less than $10,000 income bracket, making it the least populous group.
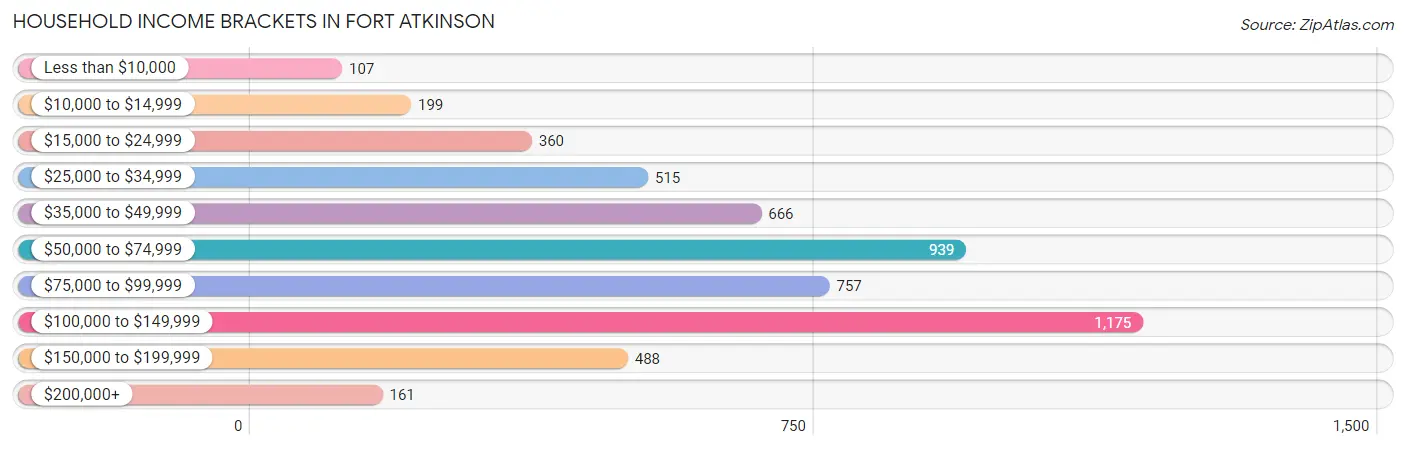
| Income Bracket | # Households | % Households |
| Less than $10,000 | 107 | 2.0% |
| $10,000 to $14,999 | 199 | 3.7% |
| $15,000 to $24,999 | 360 | 6.7% |
| $25,000 to $34,999 | 515 | 9.6% |
| $35,000 to $49,999 | 666 | 12.4% |
| $50,000 to $74,999 | 939 | 17.5% |
| $75,000 to $99,999 | 757 | 14.1% |
| $100,000 to $149,999 | 1,175 | 21.9% |
| $150,000 to $199,999 | 488 | 9.1% |
| $200,000+ | 161 | 3.0% |
Household Income by Householder Age in Fort Atkinson
The median household income in Fort Atkinson is $72,215, with the highest median household income of $86,140 found in the 25 to 44 years age bracket for the primary householder. A total of 1,606 households (29.9%) fall into this category. Meanwhile, the 65+ years age bracket for the primary householder has the lowest median household income of $45,139, with 1,548 households (28.8%) in this group.
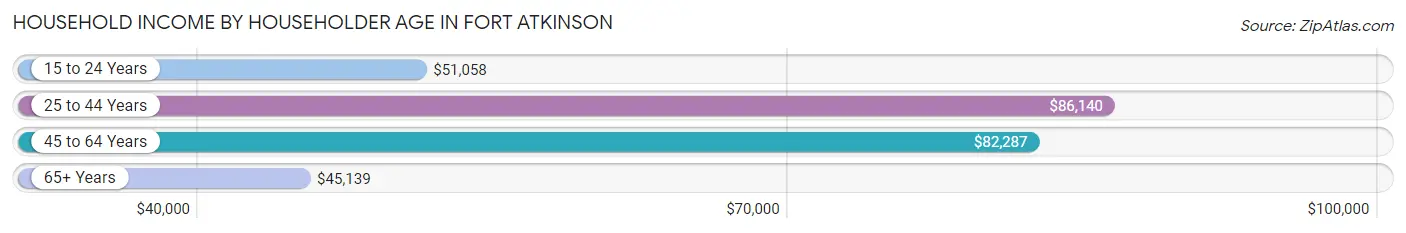
| Income Bracket | # Households | Median Income |
| 15 to 24 Years | 251 (4.7%) | $51,058 |
| 25 to 44 Years | 1,606 (29.9%) | $86,140 |
| 45 to 64 Years | 1,962 (36.6%) | $82,287 |
| 65+ Years | 1,548 (28.8%) | $45,139 |
| Total | 5,367 (100.0%) | $72,215 |
Poverty in Fort Atkinson
Income Below Poverty by Sex and Age in Fort Atkinson
With 5.6% poverty level for males and 7.3% for females among the residents of Fort Atkinson, 75 year old and over males and under 5 year old females are the most vulnerable to poverty, with 62 males (17.0%) and 55 females (25.1%) in their respective age groups living below the poverty level.
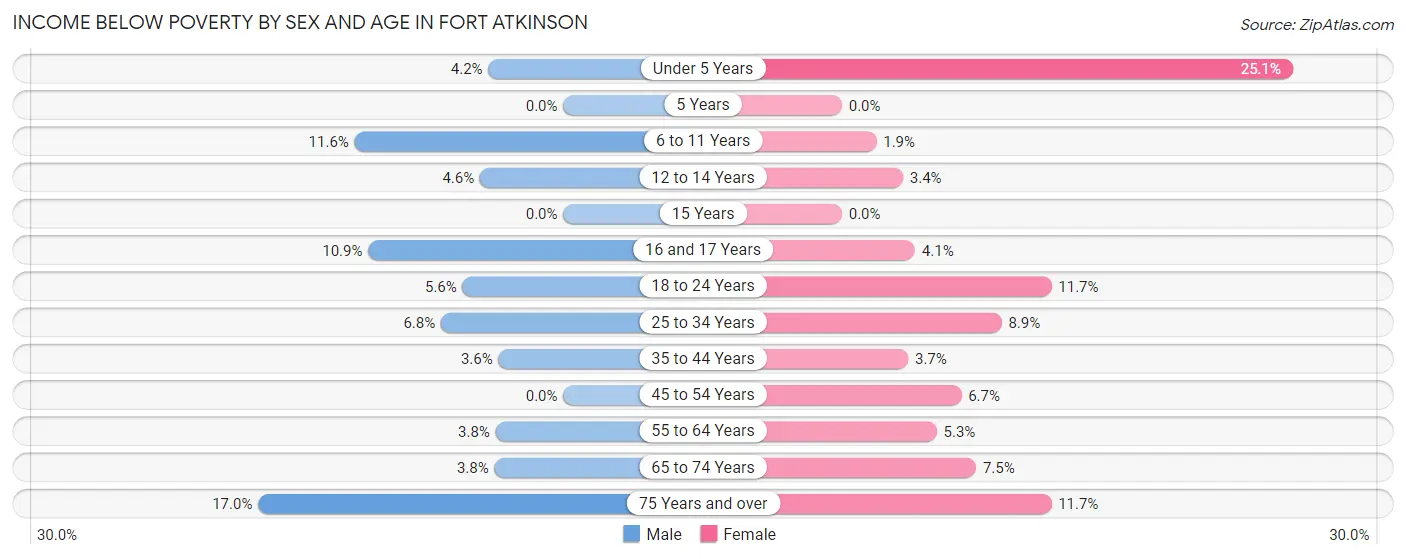
| Age Bracket | Male | Female |
| Under 5 Years | 11 (4.2%) | 55 (25.1%) |
| 5 Years | 0 (0.0%) | 0 (0.0%) |
| 6 to 11 Years | 51 (11.6%) | 8 (1.9%) |
| 12 to 14 Years | 7 (4.6%) | 8 (3.4%) |
| 15 Years | 0 (0.0%) | 0 (0.0%) |
| 16 and 17 Years | 29 (10.9%) | 9 (4.1%) |
| 18 to 24 Years | 27 (5.6%) | 53 (11.7%) |
| 25 to 34 Years | 63 (6.8%) | 75 (8.9%) |
| 35 to 44 Years | 29 (3.6%) | 28 (3.7%) |
| 45 to 54 Years | 0 (0.0%) | 63 (6.7%) |
| 55 to 64 Years | 42 (3.8%) | 48 (5.3%) |
| 65 to 74 Years | 24 (3.8%) | 38 (7.5%) |
| 75 Years and over | 62 (17.0%) | 75 (11.7%) |
| Total | 345 (5.6%) | 460 (7.3%) |
Income Above Poverty by Sex and Age in Fort Atkinson
According to the poverty statistics in Fort Atkinson, males aged 5 years and females aged 5 years are the age groups that are most secure financially, with 100.0% of males and 100.0% of females in these age groups living above the poverty line.
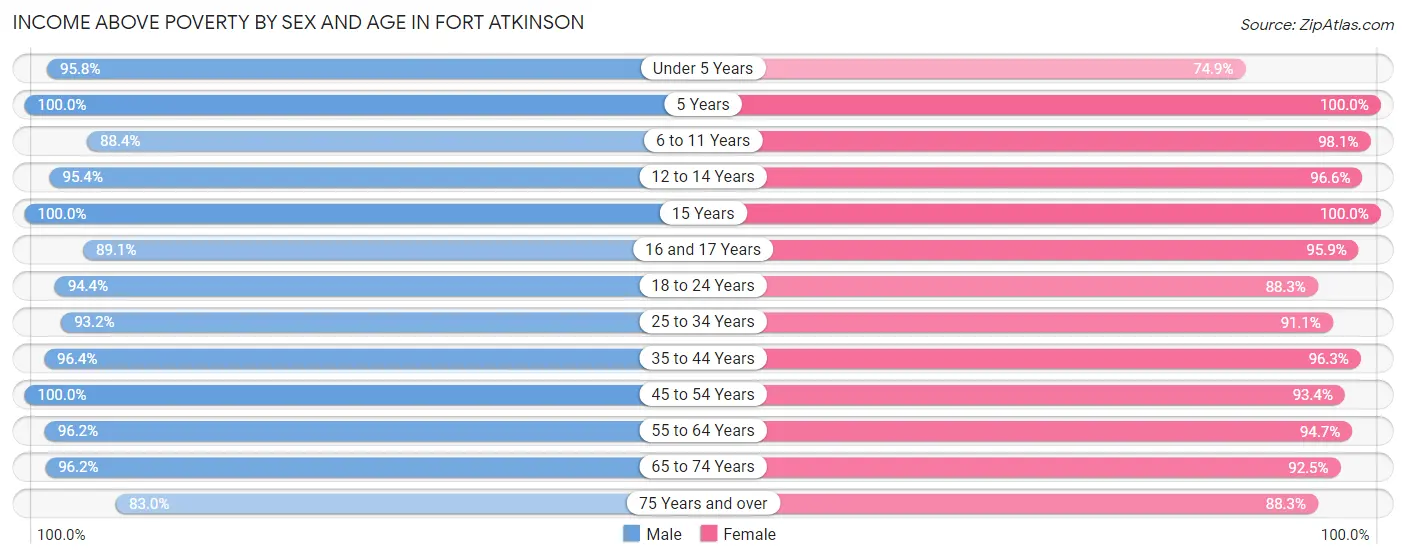
| Age Bracket | Male | Female |
| Under 5 Years | 253 (95.8%) | 164 (74.9%) |
| 5 Years | 69 (100.0%) | 71 (100.0%) |
| 6 to 11 Years | 388 (88.4%) | 409 (98.1%) |
| 12 to 14 Years | 144 (95.4%) | 227 (96.6%) |
| 15 Years | 36 (100.0%) | 56 (100.0%) |
| 16 and 17 Years | 238 (89.1%) | 212 (95.9%) |
| 18 to 24 Years | 454 (94.4%) | 401 (88.3%) |
| 25 to 34 Years | 862 (93.2%) | 769 (91.1%) |
| 35 to 44 Years | 775 (96.4%) | 730 (96.3%) |
| 45 to 54 Years | 636 (100.0%) | 884 (93.3%) |
| 55 to 64 Years | 1,072 (96.2%) | 861 (94.7%) |
| 65 to 74 Years | 602 (96.2%) | 471 (92.5%) |
| 75 Years and over | 303 (83.0%) | 568 (88.3%) |
| Total | 5,832 (94.4%) | 5,823 (92.7%) |
Income Below Poverty Among Married-Couple Families in Fort Atkinson
The poverty statistics for married-couple families in Fort Atkinson show that 1.1% or 28 of the total 2,480 families live below the poverty line. Families with 3 or 4 children have the highest poverty rate of 3.5%, comprising of 8 families. On the other hand, families with 1 or 2 children have the lowest poverty rate of 0.0%, which includes 0 families.
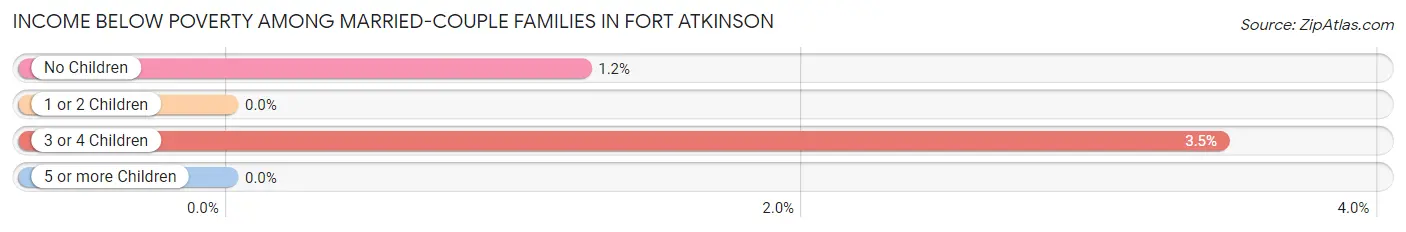
| Children | Above Poverty | Below Poverty |
| No Children | 1,612 (98.8%) | 20 (1.2%) |
| 1 or 2 Children | 602 (100.0%) | 0 (0.0%) |
| 3 or 4 Children | 224 (96.6%) | 8 (3.5%) |
| 5 or more Children | 14 (100.0%) | 0 (0.0%) |
| Total | 2,452 (98.9%) | 28 (1.1%) |
Income Below Poverty Among Single-Parent Households in Fort Atkinson
According to the poverty data in Fort Atkinson, 5.3% or 16 single-father households and 21.8% or 78 single-mother households are living below the poverty line. Among single-father households, those with 1 or 2 children have the highest poverty rate, with 16 households (17.6%) experiencing poverty. Likewise, among single-mother households, those with 1 or 2 children have the highest poverty rate, with 78 households (30.8%) falling below the poverty line.
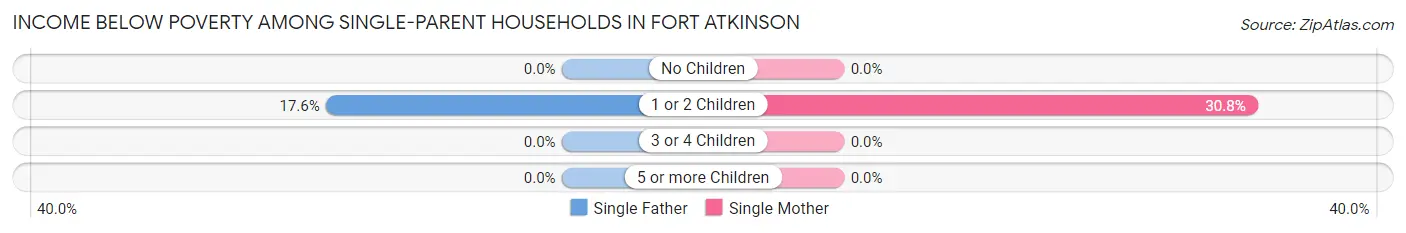
| Children | Single Father | Single Mother |
| No Children | 0 (0.0%) | 0 (0.0%) |
| 1 or 2 Children | 16 (17.6%) | 78 (30.8%) |
| 3 or 4 Children | 0 (0.0%) | 0 (0.0%) |
| 5 or more Children | 0 (0.0%) | 0 (0.0%) |
| Total | 16 (5.3%) | 78 (21.8%) |
Income Below Poverty Among Married-Couple vs Single-Parent Households in Fort Atkinson
The poverty data for Fort Atkinson shows that 28 of the married-couple family households (1.1%) and 94 of the single-parent households (14.3%) are living below the poverty level. Within the married-couple family households, those with 3 or 4 children have the highest poverty rate, with 8 households (3.5%) falling below the poverty line. Among the single-parent households, those with 1 or 2 children have the highest poverty rate, with 94 household (27.3%) living below poverty.
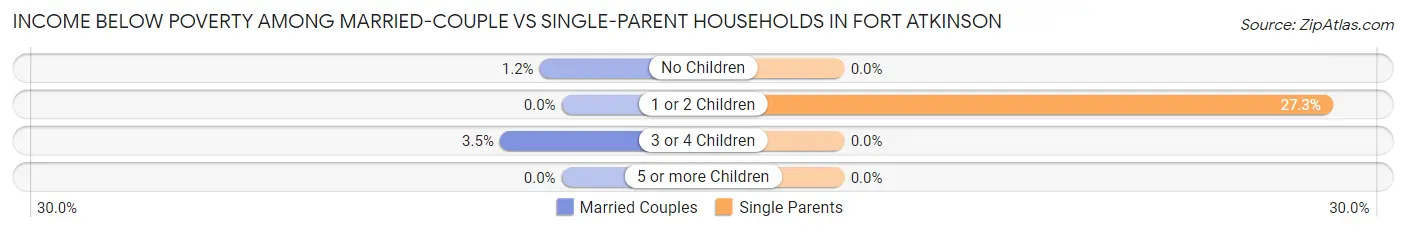
| Children | Married-Couple Families | Single-Parent Households |
| No Children | 20 (1.2%) | 0 (0.0%) |
| 1 or 2 Children | 0 (0.0%) | 94 (27.3%) |
| 3 or 4 Children | 8 (3.5%) | 0 (0.0%) |
| 5 or more Children | 0 (0.0%) | 0 (0.0%) |
| Total | 28 (1.1%) | 94 (14.3%) |
Race in Fort Atkinson
The most populous races in Fort Atkinson are White / Caucasian (11,420 | 91.2%), Hispanic or Latino (934 | 7.5%), and Some other Race (572 | 4.6%).
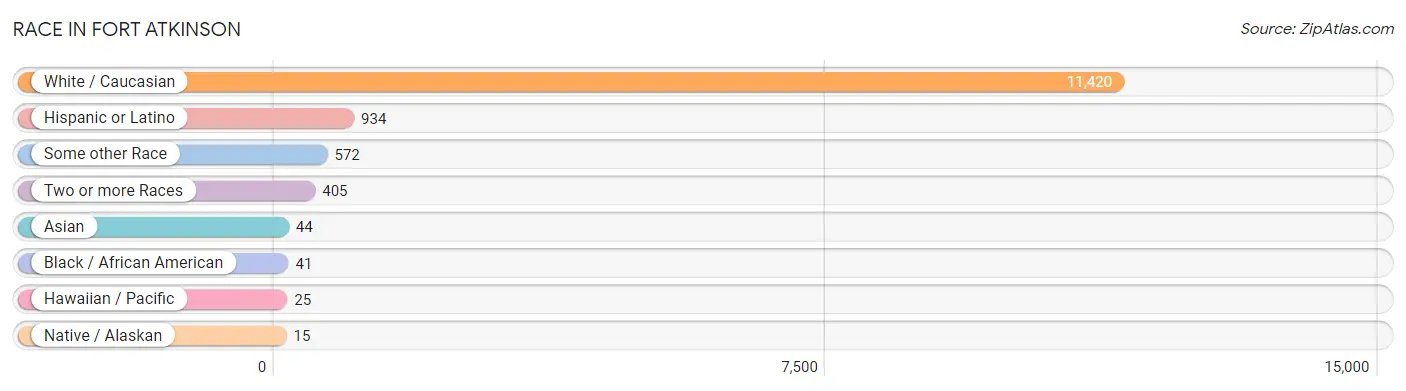
| Race | # Population | % Population |
| Asian | 44 | 0.4% |
| Black / African American | 41 | 0.3% |
| Hawaiian / Pacific | 25 | 0.2% |
| Hispanic or Latino | 934 | 7.5% |
| Native / Alaskan | 15 | 0.1% |
| White / Caucasian | 11,420 | 91.2% |
| Two or more Races | 405 | 3.2% |
| Some other Race | 572 | 4.6% |
| Total | 12,522 | 100.0% |
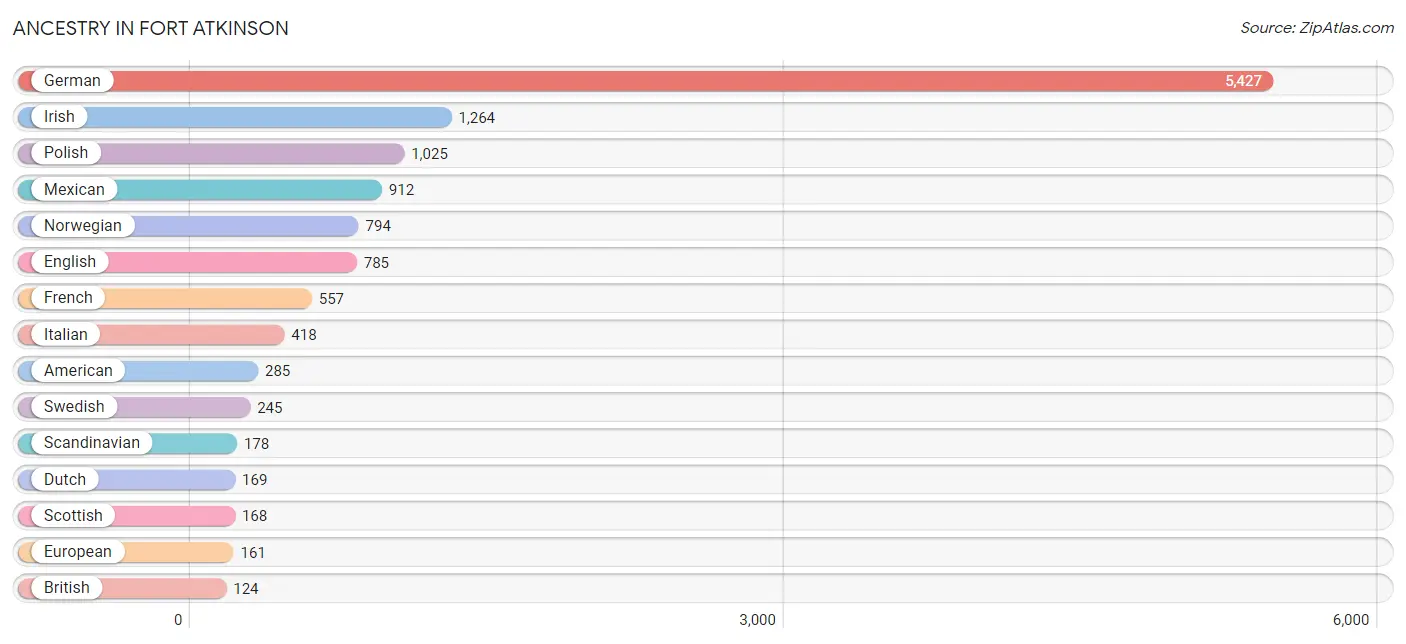
Ancestry in Fort Atkinson
The most populous ancestries reported in Fort Atkinson are German (5,427 | 43.3%), Irish (1,264 | 10.1%), Polish (1,025 | 8.2%), Mexican (912 | 7.3%), and Norwegian (794 | 6.3%), together accounting for 75.2% of all Fort Atkinson residents.
| Ancestry | # Population | % Population |
| American | 285 | 2.3% |
| Arab | 29 | 0.2% |
| Australian | 1 | 0.0% |
| Austrian | 13 | 0.1% |
| Belgian | 15 | 0.1% |
| Blackfeet | 90 | 0.7% |
| British | 124 | 1.0% |
| Cherokee | 11 | 0.1% |
| Chippewa | 30 | 0.2% |
| Czech | 62 | 0.5% |
| Czechoslovakian | 8 | 0.1% |
| Danish | 44 | 0.4% |
| Dutch | 169 | 1.3% |
| Eastern European | 35 | 0.3% |
| English | 785 | 6.3% |
| European | 161 | 1.3% |
| Filipino | 11 | 0.1% |
| French | 557 | 4.4% |
| French Canadian | 25 | 0.2% |
| German | 5,427 | 43.3% |
| Hungarian | 20 | 0.2% |
| Iranian | 32 | 0.3% |
| Irish | 1,264 | 10.1% |
| Italian | 418 | 3.3% |
| Lithuanian | 5 | 0.0% |
| Menominee | 11 | 0.1% |
| Mexican | 912 | 7.3% |
| Northern European | 30 | 0.2% |
| Norwegian | 794 | 6.3% |
| Polish | 1,025 | 8.2% |
| Portuguese | 11 | 0.1% |
| Russian | 9 | 0.1% |
| Scandinavian | 178 | 1.4% |
| Scotch-Irish | 61 | 0.5% |
| Scottish | 168 | 1.3% |
| Slovak | 20 | 0.2% |
| Sri Lankan | 47 | 0.4% |
| Swedish | 245 | 2.0% |
| Swiss | 75 | 0.6% |
| Thai | 13 | 0.1% |
| Tongan | 7 | 0.1% |
| Welsh | 6 | 0.1% | View All 42 Rows |
Immigrants in Fort Atkinson
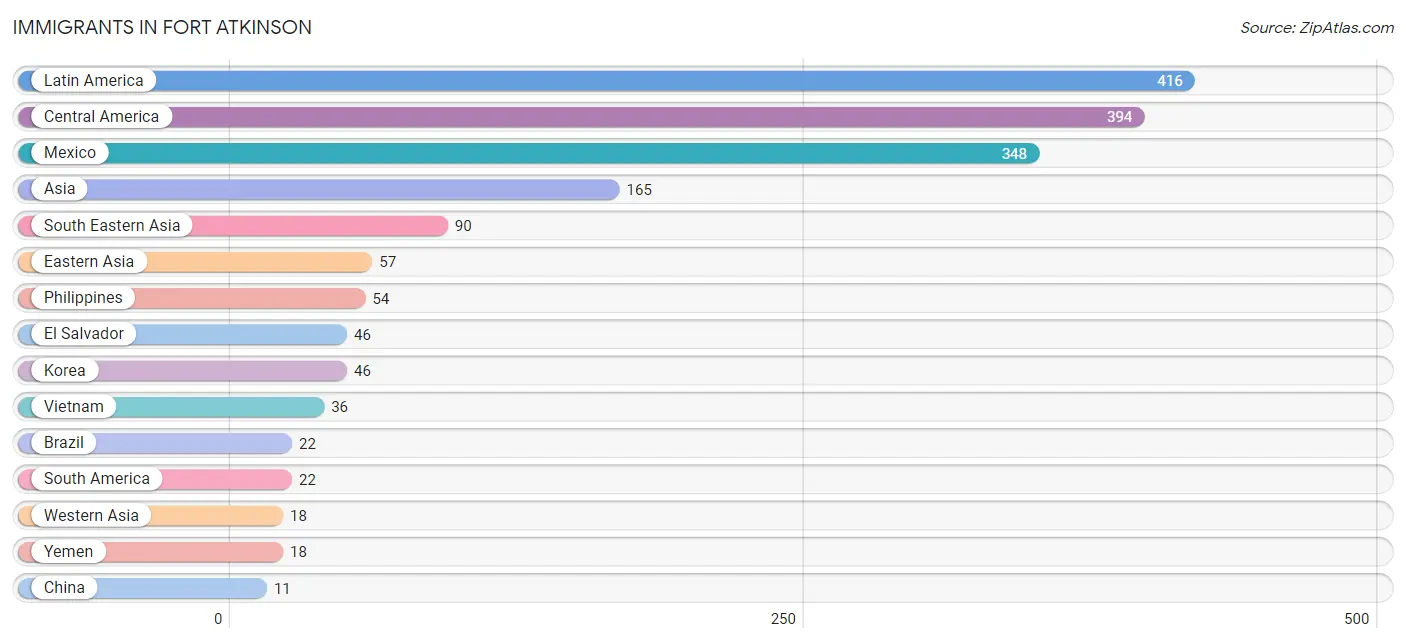
The most numerous immigrant groups reported in Fort Atkinson came from Latin America (416 | 3.3%), Central America (394 | 3.2%), Mexico (348 | 2.8%), Asia (165 | 1.3%), and South Eastern Asia (90 | 0.7%), together accounting for 11.3% of all Fort Atkinson residents.
| Immigration Origin | # Population | % Population |
| Asia | 165 | 1.3% |
| Brazil | 22 | 0.2% |
| Central America | 394 | 3.2% |
| China | 11 | 0.1% |
| Eastern Asia | 57 | 0.5% |
| El Salvador | 46 | 0.4% |
| Europe | 9 | 0.1% |
| Germany | 9 | 0.1% |
| Korea | 46 | 0.4% |
| Latin America | 416 | 3.3% |
| Mexico | 348 | 2.8% |
| Philippines | 54 | 0.4% |
| South America | 22 | 0.2% |
| South Eastern Asia | 90 | 0.7% |
| Taiwan | 11 | 0.1% |
| Vietnam | 36 | 0.3% |
| Western Asia | 18 | 0.1% |
| Western Europe | 9 | 0.1% |
| Yemen | 18 | 0.1% | View All 19 Rows |
Sex and Age in Fort Atkinson
Sex and Age in Fort Atkinson
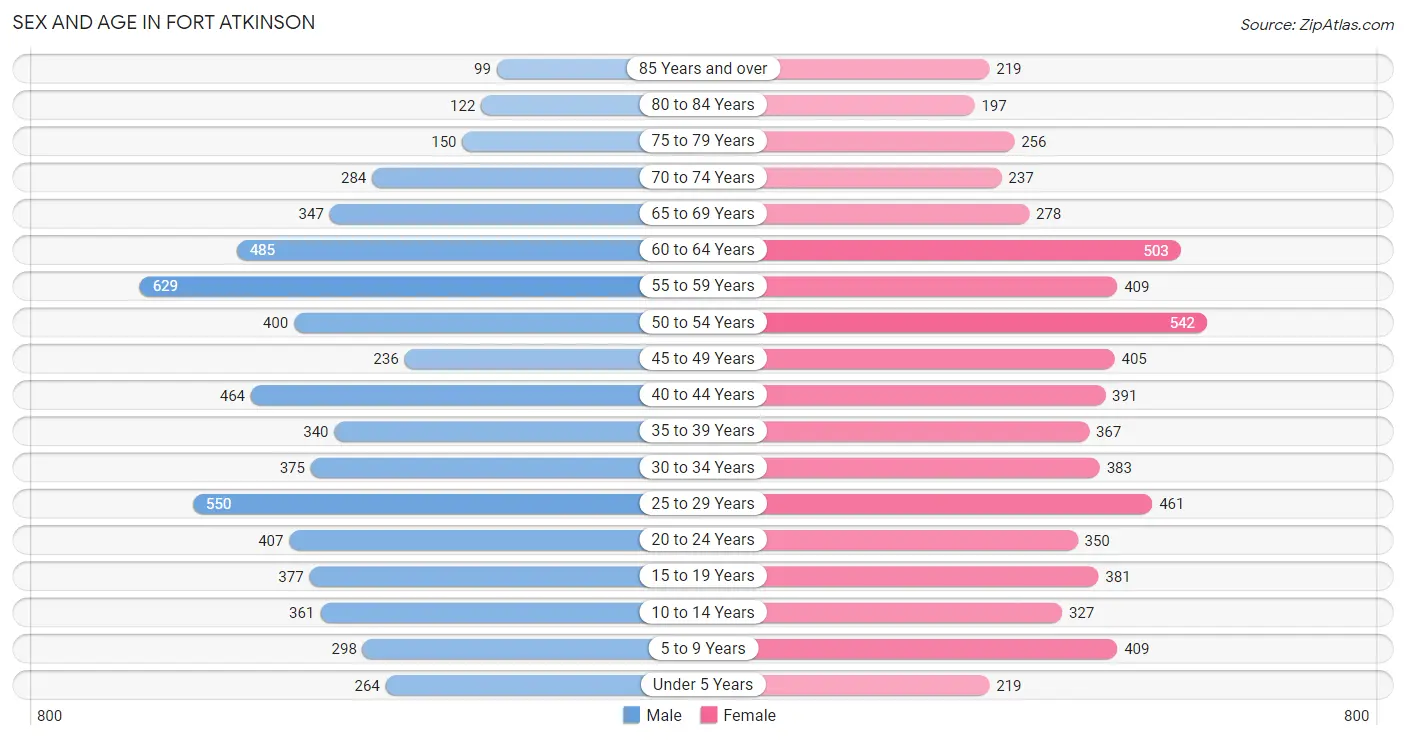
The most populous age groups in Fort Atkinson are 55 to 59 Years (629 | 10.2%) for men and 50 to 54 Years (542 | 8.6%) for women.
| Age Bracket | Male | Female |
| Under 5 Years | 264 (4.3%) | 219 (3.5%) |
| 5 to 9 Years | 298 (4.8%) | 409 (6.5%) |
| 10 to 14 Years | 361 (5.8%) | 327 (5.2%) |
| 15 to 19 Years | 377 (6.1%) | 381 (6.0%) |
| 20 to 24 Years | 407 (6.6%) | 350 (5.5%) |
| 25 to 29 Years | 550 (8.9%) | 461 (7.3%) |
| 30 to 34 Years | 375 (6.1%) | 383 (6.0%) |
| 35 to 39 Years | 340 (5.5%) | 367 (5.8%) |
| 40 to 44 Years | 464 (7.5%) | 391 (6.2%) |
| 45 to 49 Years | 236 (3.8%) | 405 (6.4%) |
| 50 to 54 Years | 400 (6.5%) | 542 (8.6%) |
| 55 to 59 Years | 629 (10.2%) | 409 (6.5%) |
| 60 to 64 Years | 485 (7.8%) | 503 (7.9%) |
| 65 to 69 Years | 347 (5.6%) | 278 (4.4%) |
| 70 to 74 Years | 284 (4.6%) | 237 (3.7%) |
| 75 to 79 Years | 150 (2.4%) | 256 (4.0%) |
| 80 to 84 Years | 122 (2.0%) | 197 (3.1%) |
| 85 Years and over | 99 (1.6%) | 219 (3.5%) |
| Total | 6,188 (100.0%) | 6,334 (100.0%) |
Families and Households in Fort Atkinson
Median Family Size in Fort Atkinson
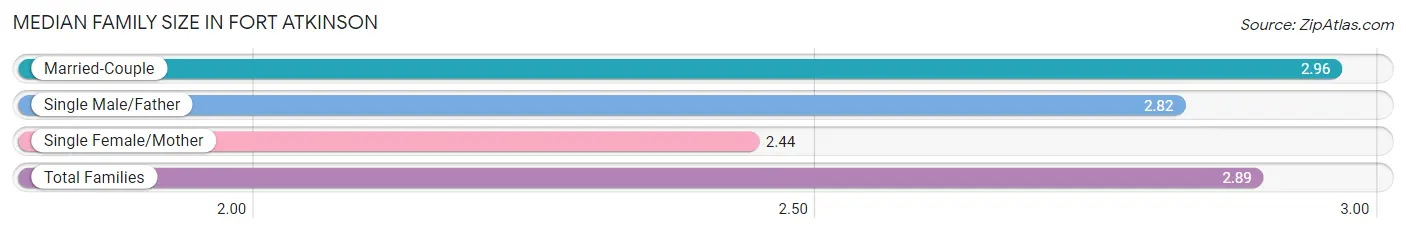
The median family size in Fort Atkinson is 2.89 persons per family, with married-couple families (2,480 | 79.1%) accounting for the largest median family size of 2.96 persons per family. On the other hand, single female/mother families (358 | 11.4%) represent the smallest median family size with 2.44 persons per family.
| Family Type | # Families | Family Size |
| Married-Couple | 2,480 (79.1%) | 2.96 |
| Single Male/Father | 299 (9.5%) | 2.82 |
| Single Female/Mother | 358 (11.4%) | 2.44 |
| Total Families | 3,137 (100.0%) | 2.89 |
Median Household Size in Fort Atkinson
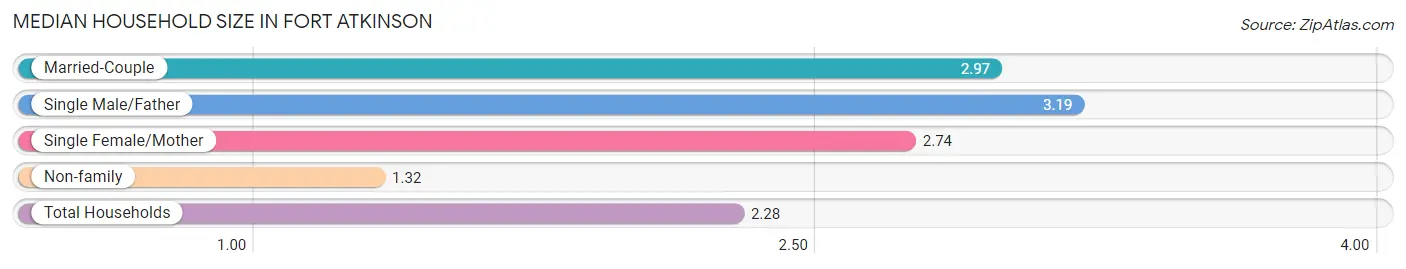
The median household size in Fort Atkinson is 2.28 persons per household, with single male/father households (299 | 5.6%) accounting for the largest median household size of 3.19 persons per household. non-family households (2,230 | 41.5%) represent the smallest median household size with 1.32 persons per household.
| Household Type | # Households | Household Size |
| Married-Couple | 2,480 (46.2%) | 2.97 |
| Single Male/Father | 299 (5.6%) | 3.19 |
| Single Female/Mother | 358 (6.7%) | 2.74 |
| Non-family | 2,230 (41.5%) | 1.32 |
| Total Households | 5,367 (100.0%) | 2.28 |
Household Size by Marriage Status in Fort Atkinson
Out of a total of 5,367 households in Fort Atkinson, 3,137 (58.5%) are family households, while 2,230 (41.5%) are nonfamily households. The most numerous type of family households are 2-person households, comprising 1,497, and the most common type of nonfamily households are 1-person households, comprising 1,697.
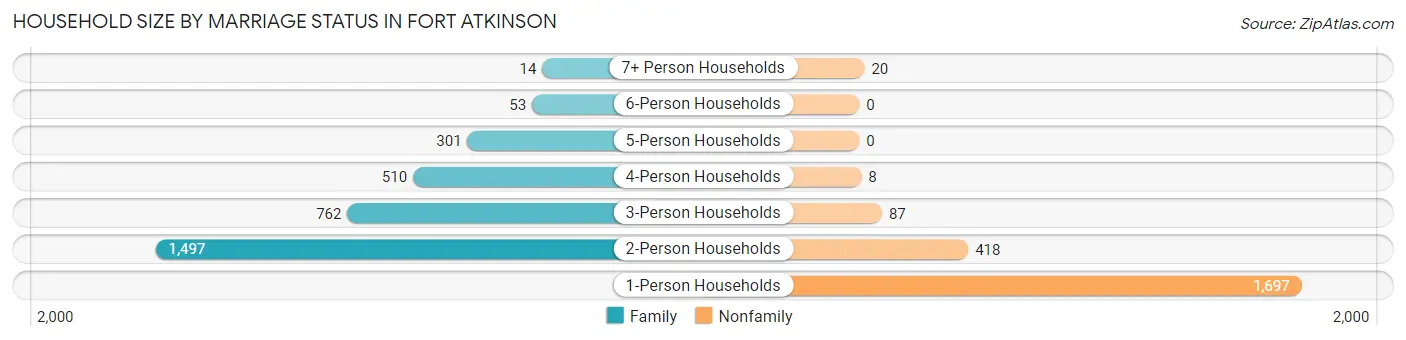
| Household Size | Family Households | Nonfamily Households |
| 1-Person Households | - | 1,697 (31.6%) |
| 2-Person Households | 1,497 (27.9%) | 418 (7.8%) |
| 3-Person Households | 762 (14.2%) | 87 (1.6%) |
| 4-Person Households | 510 (9.5%) | 8 (0.2%) |
| 5-Person Households | 301 (5.6%) | 0 (0.0%) |
| 6-Person Households | 53 (1.0%) | 0 (0.0%) |
| 7+ Person Households | 14 (0.3%) | 20 (0.4%) |
| Total | 3,137 (58.5%) | 2,230 (41.5%) |
Female Fertility in Fort Atkinson
Fertility by Age in Fort Atkinson
Average fertility rate in Fort Atkinson is 54.0 births per 1,000 women. Women in the age bracket of 20 to 34 years have the highest fertility rate with 107.0 births per 1,000 women. Women in the age bracket of 20 to 34 years acount for 83.7% of all women with births.
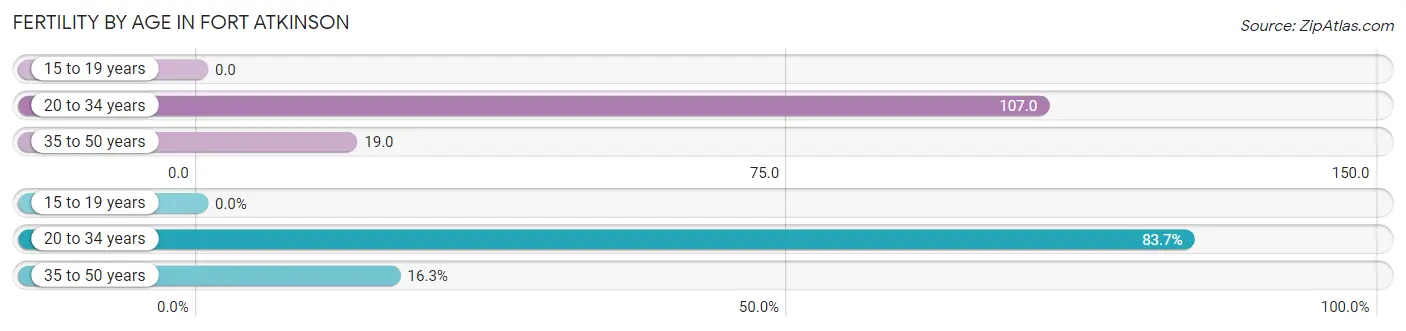
| Age Bracket | Women with Births | Births / 1,000 Women |
| 15 to 19 years | 0 (0.0%) | 0.0 |
| 20 to 34 years | 128 (83.7%) | 107.0 |
| 35 to 50 years | 25 (16.3%) | 19.0 |
| Total | 153 (100.0%) | 54.0 |
Fertility by Age by Marriage Status in Fort Atkinson
37.3% of women with births (153) in Fort Atkinson are married. The highest percentage of unmarried women with births falls into 20 to 34 years age bracket with 75.0% of them unmarried at the time of birth, while the lowest percentage of unmarried women with births belong to 35 to 50 years age bracket with 0.0% of them unmarried.
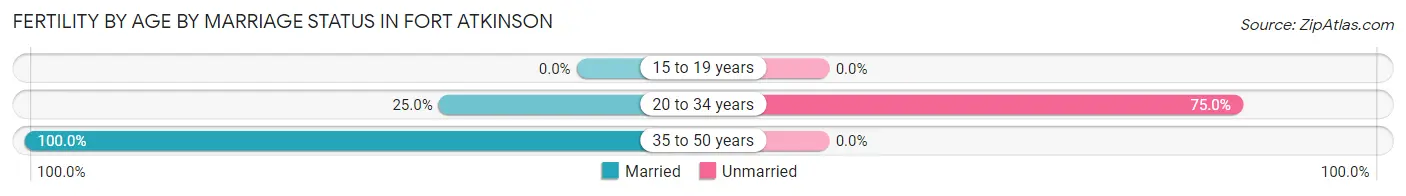
| Age Bracket | Married | Unmarried |
| 15 to 19 years | 0 (0.0%) | 0 (0.0%) |
| 20 to 34 years | 32 (25.0%) | 96 (75.0%) |
| 35 to 50 years | 25 (100.0%) | 0 (0.0%) |
| Total | 57 (37.2%) | 96 (62.7%) |
Fertility by Education in Fort Atkinson
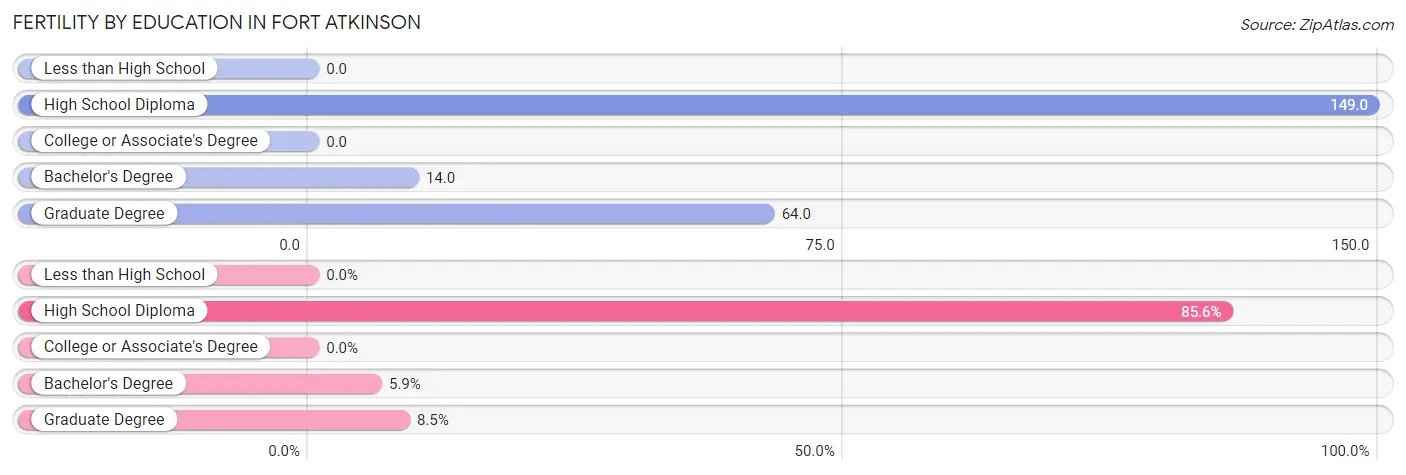
| Educational Attainment | Women with Births | Births / 1,000 Women |
| Less than High School | 0 (0.0%) | 0.0 |
| High School Diploma | 131 (85.6%) | 149.0 |
| College or Associate's Degree | 0 (0.0%) | 0.0 |
| Bachelor's Degree | 9 (5.9%) | 14.0 |
| Graduate Degree | 13 (8.5%) | 64.0 |
| Total | 153 (100.0%) | 54.0 |
Fertility by Education by Marriage Status in Fort Atkinson
62.7% of women with births in Fort Atkinson are unmarried. Women with the educational attainment of bachelor's degree are most likely to be married with 100.0% of them married at childbirth, while women with the educational attainment of high school diploma are least likely to be married with 73.3% of them unmarried at childbirth.
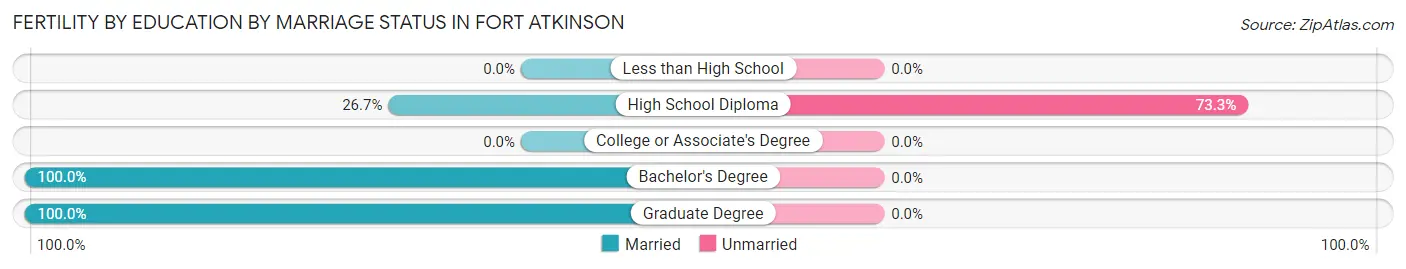
| Educational Attainment | Married | Unmarried |
| Less than High School | 0 (0.0%) | 0 (0.0%) |
| High School Diploma | 35 (26.7%) | 96 (73.3%) |
| College or Associate's Degree | 0 (0.0%) | 0 (0.0%) |
| Bachelor's Degree | 9 (100.0%) | 0 (0.0%) |
| Graduate Degree | 13 (100.0%) | 0 (0.0%) |
| Total | 57 (37.2%) | 96 (62.7%) |
Employment Characteristics in Fort Atkinson
Employment by Class of Employer in Fort Atkinson
Among the 7,226 employed individuals in Fort Atkinson, private company employees (5,123 | 70.9%), local government employees (623 | 8.6%), and not-for-profit organizations (447 | 6.2%) make up the most common classes of employment.
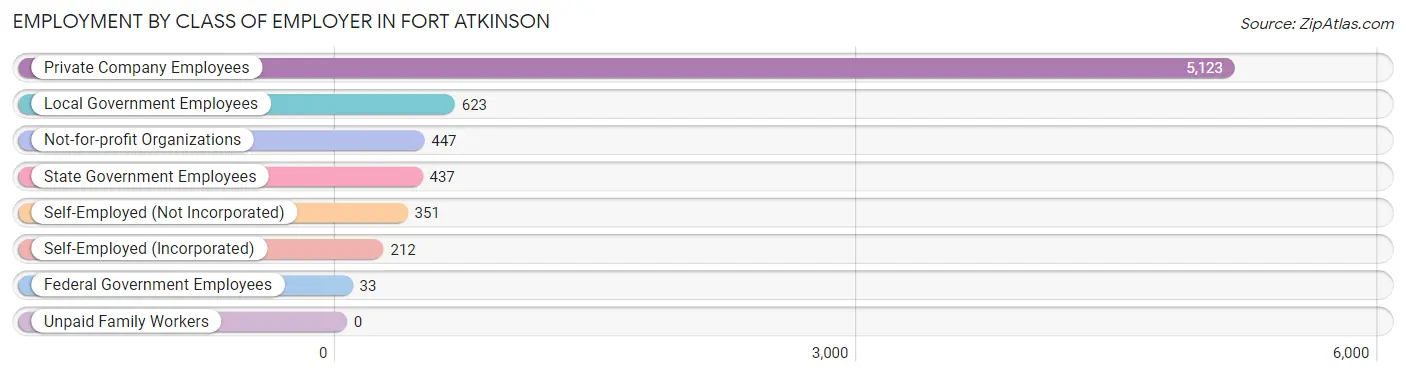
| Employer Class | # Employees | % Employees |
| Private Company Employees | 5,123 | 70.9% |
| Self-Employed (Incorporated) | 212 | 2.9% |
| Self-Employed (Not Incorporated) | 351 | 4.9% |
| Not-for-profit Organizations | 447 | 6.2% |
| Local Government Employees | 623 | 8.6% |
| State Government Employees | 437 | 6.0% |
| Federal Government Employees | 33 | 0.5% |
| Unpaid Family Workers | 0 | 0.0% |
| Total | 7,226 | 100.0% |
Employment Status by Age in Fort Atkinson
According to the labor force statistics for Fort Atkinson, out of the total population over 16 years of age (10,552), 71.4% or 7,534 individuals are in the labor force, with 3.1% or 234 of them unemployed. The age group with the highest labor force participation rate is 25 to 29 years, with 99.1% or 1,002 individuals in the labor force. Within the labor force, the 20 to 24 years age range has the highest percentage of unemployed individuals, with 19.7% or 146 of them being unemployed.
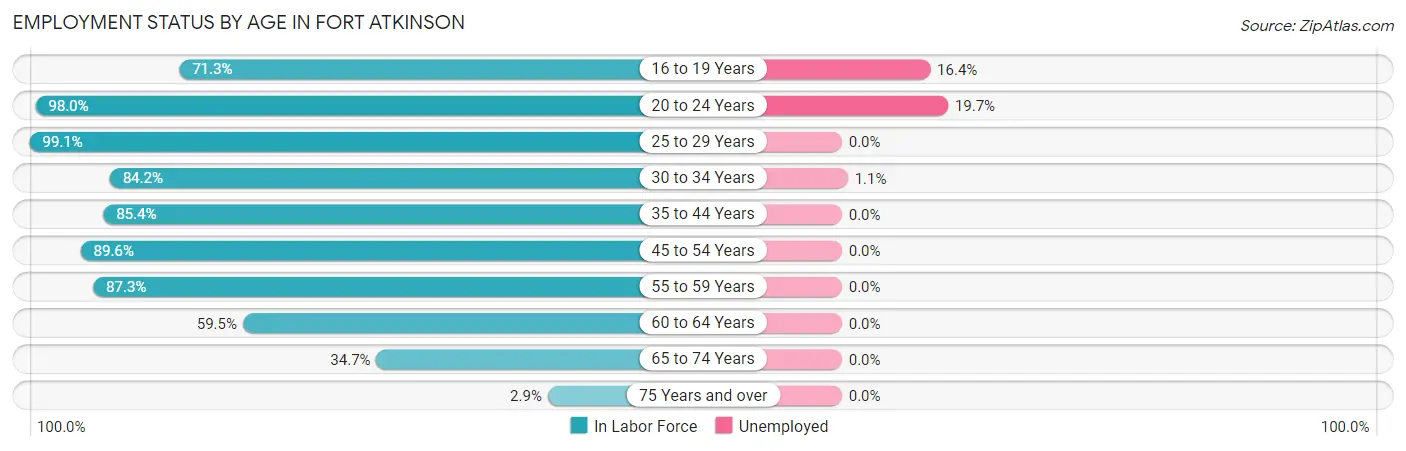
| Age Bracket | In Labor Force | Unemployed |
| 16 to 19 Years | 475 (71.3%) | 78 (16.4%) |
| 20 to 24 Years | 742 (98.0%) | 146 (19.7%) |
| 25 to 29 Years | 1,002 (99.1%) | 0 (0.0%) |
| 30 to 34 Years | 638 (84.2%) | 7 (1.1%) |
| 35 to 44 Years | 1,334 (85.4%) | 0 (0.0%) |
| 45 to 54 Years | 1,418 (89.6%) | 0 (0.0%) |
| 55 to 59 Years | 906 (87.3%) | 0 (0.0%) |
| 60 to 64 Years | 588 (59.5%) | 0 (0.0%) |
| 65 to 74 Years | 398 (34.7%) | 0 (0.0%) |
| 75 Years and over | 30 (2.9%) | 0 (0.0%) |
| Total | 7,534 (71.4%) | 234 (3.1%) |
Employment Status by Educational Attainment in Fort Atkinson
According to labor force statistics for Fort Atkinson, 84.8% of individuals (5,885) out of the total population between 25 and 64 years of age (6,940) are in the labor force, with 0.1% or 6 of them being unemployed. The group with the highest labor force participation rate are those with the educational attainment of bachelor's degree or higher, with 90.1% or 1,719 individuals in the labor force. Within the labor force, individuals with bachelor's degree or higher education have the highest percentage of unemployment, with 0.4% or 7 of them being unemployed.
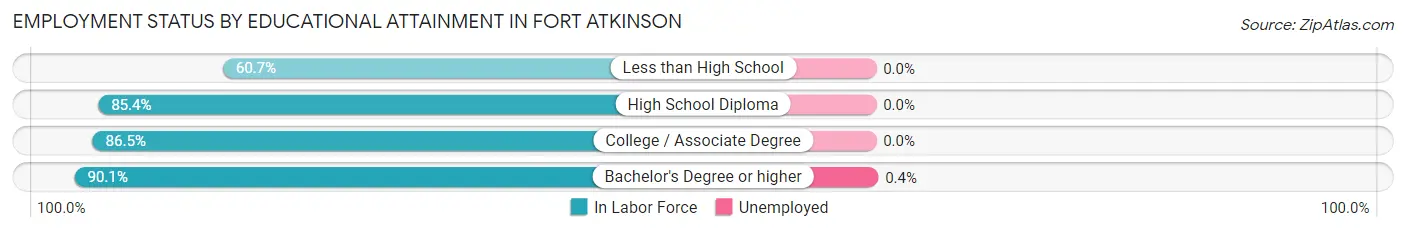
| Educational Attainment | In Labor Force | Unemployed |
| Less than High School | 382 (60.7%) | 0 (0.0%) |
| High School Diploma | 1,845 (85.4%) | 0 (0.0%) |
| College / Associate Degree | 1,939 (86.5%) | 0 (0.0%) |
| Bachelor's Degree or higher | 1,719 (90.1%) | 8 (0.4%) |
| Total | 5,885 (84.8%) | 7 (0.1%) |
Employment Occupations by Sex in Fort Atkinson
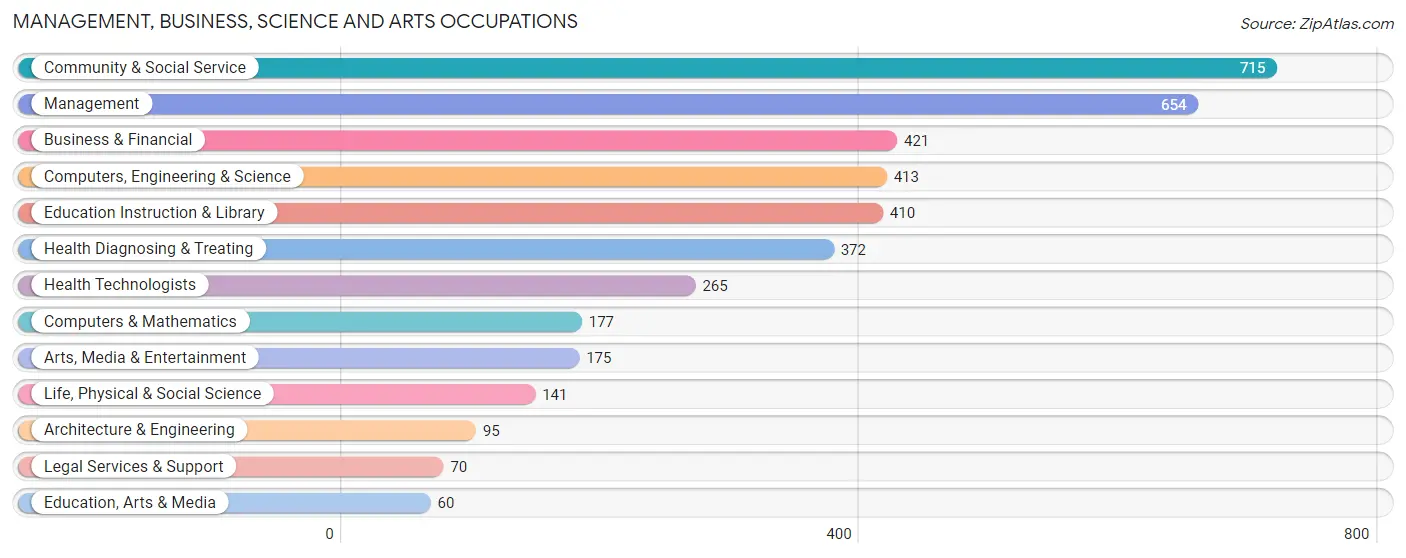
Management, Business, Science and Arts Occupations
The most common Management, Business, Science and Arts occupations in Fort Atkinson are Community & Social Service (715 | 9.8%), Management (654 | 9.0%), Business & Financial (421 | 5.8%), Computers, Engineering & Science (413 | 5.7%), and Education Instruction & Library (410 | 5.6%).
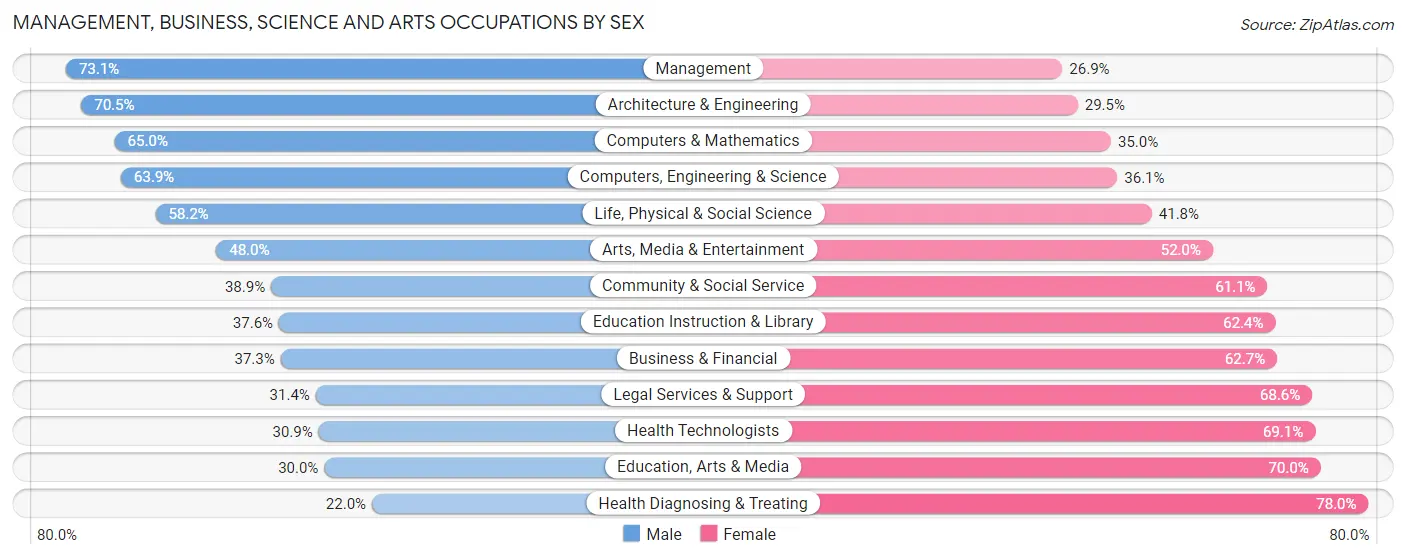
Management, Business, Science and Arts Occupations by Sex
Within the Management, Business, Science and Arts occupations in Fort Atkinson, the most male-oriented occupations are Management (73.1%), Architecture & Engineering (70.5%), and Computers & Mathematics (65.0%), while the most female-oriented occupations are Health Diagnosing & Treating (78.0%), Education, Arts & Media (70.0%), and Health Technologists (69.1%).
| Occupation | Male | Female |
| Management | 478 (73.1%) | 176 (26.9%) |
| Business & Financial | 157 (37.3%) | 264 (62.7%) |
| Computers, Engineering & Science | 264 (63.9%) | 149 (36.1%) |
| Computers & Mathematics | 115 (65.0%) | 62 (35.0%) |
| Architecture & Engineering | 67 (70.5%) | 28 (29.5%) |
| Life, Physical & Social Science | 82 (58.2%) | 59 (41.8%) |
| Community & Social Service | 278 (38.9%) | 437 (61.1%) |
| Education, Arts & Media | 18 (30.0%) | 42 (70.0%) |
| Legal Services & Support | 22 (31.4%) | 48 (68.6%) |
| Education Instruction & Library | 154 (37.6%) | 256 (62.4%) |
| Arts, Media & Entertainment | 84 (48.0%) | 91 (52.0%) |
| Health Diagnosing & Treating | 82 (22.0%) | 290 (78.0%) |
| Health Technologists | 82 (30.9%) | 183 (69.1%) |
| Total (Category) | 1,259 (48.9%) | 1,316 (51.1%) |
| Total (Overall) | 3,971 (54.4%) | 3,329 (45.6%) |
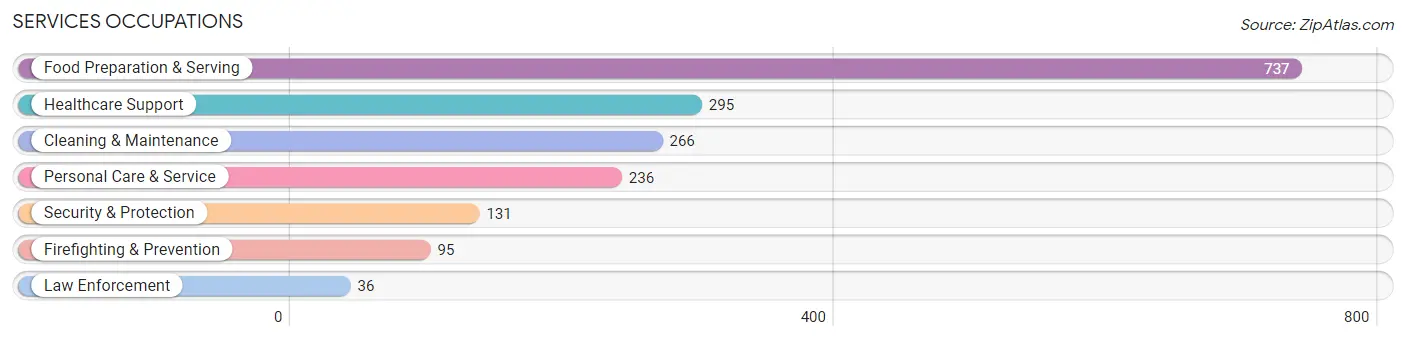
Services Occupations
The most common Services occupations in Fort Atkinson are Food Preparation & Serving (737 | 10.1%), Healthcare Support (295 | 4.0%), Cleaning & Maintenance (266 | 3.6%), Personal Care & Service (236 | 3.2%), and Security & Protection (131 | 1.8%).
Services Occupations by Sex
Within the Services occupations in Fort Atkinson, the most male-oriented occupations are Firefighting & Prevention (100.0%), Security & Protection (93.9%), and Law Enforcement (77.8%), while the most female-oriented occupations are Healthcare Support (80.3%), Personal Care & Service (75.4%), and Food Preparation & Serving (44.2%).

| Occupation | Male | Female |
| Healthcare Support | 58 (19.7%) | 237 (80.3%) |
| Security & Protection | 123 (93.9%) | 8 (6.1%) |
| Firefighting & Prevention | 95 (100.0%) | 0 (0.0%) |
| Law Enforcement | 28 (77.8%) | 8 (22.2%) |
| Food Preparation & Serving | 411 (55.8%) | 326 (44.2%) |
| Cleaning & Maintenance | 185 (69.6%) | 81 (30.4%) |
| Personal Care & Service | 58 (24.6%) | 178 (75.4%) |
| Total (Category) | 835 (50.1%) | 830 (49.8%) |
| Total (Overall) | 3,971 (54.4%) | 3,329 (45.6%) |
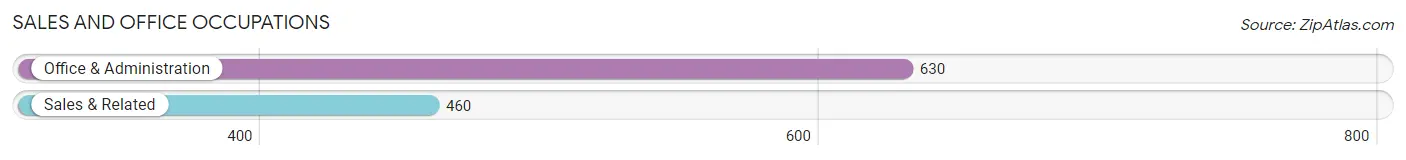
Sales and Office Occupations
The most common Sales and Office occupations in Fort Atkinson are Office & Administration (630 | 8.6%), and Sales & Related (460 | 6.3%).
Sales and Office Occupations by Sex
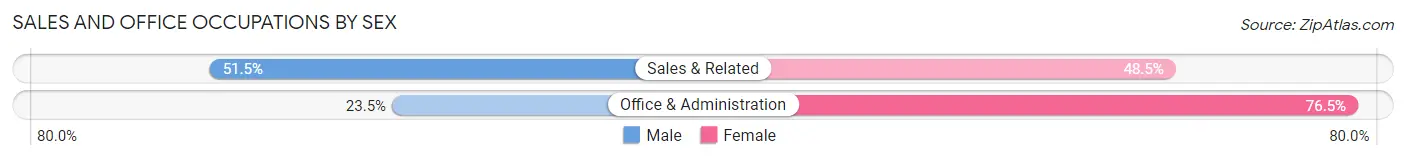
| Occupation | Male | Female |
| Sales & Related | 237 (51.5%) | 223 (48.5%) |
| Office & Administration | 148 (23.5%) | 482 (76.5%) |
| Total (Category) | 385 (35.3%) | 705 (64.7%) |
| Total (Overall) | 3,971 (54.4%) | 3,329 (45.6%) |
Natural Resources, Construction and Maintenance Occupations
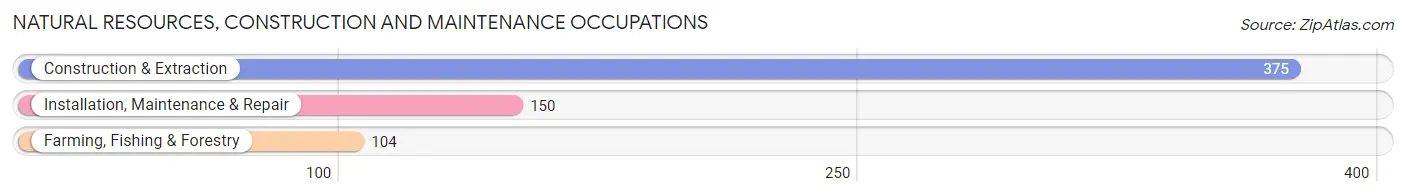
The most common Natural Resources, Construction and Maintenance occupations in Fort Atkinson are Construction & Extraction (375 | 5.1%), Installation, Maintenance & Repair (150 | 2.1%), and Farming, Fishing & Forestry (104 | 1.4%).
Natural Resources, Construction and Maintenance Occupations by Sex
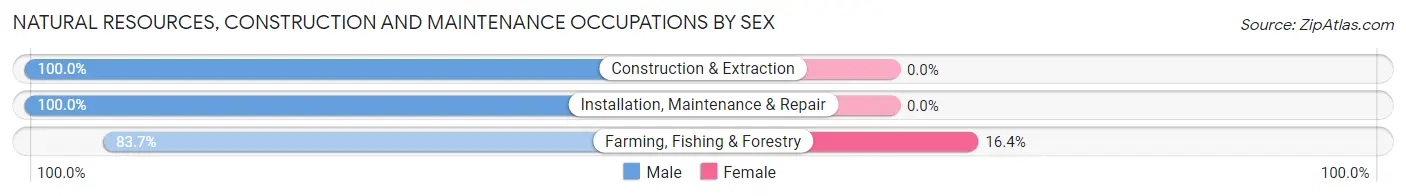
| Occupation | Male | Female |
| Farming, Fishing & Forestry | 87 (83.7%) | 17 (16.4%) |
| Construction & Extraction | 375 (100.0%) | 0 (0.0%) |
| Installation, Maintenance & Repair | 150 (100.0%) | 0 (0.0%) |
| Total (Category) | 612 (97.3%) | 17 (2.7%) |
| Total (Overall) | 3,971 (54.4%) | 3,329 (45.6%) |
Production, Transportation and Moving Occupations
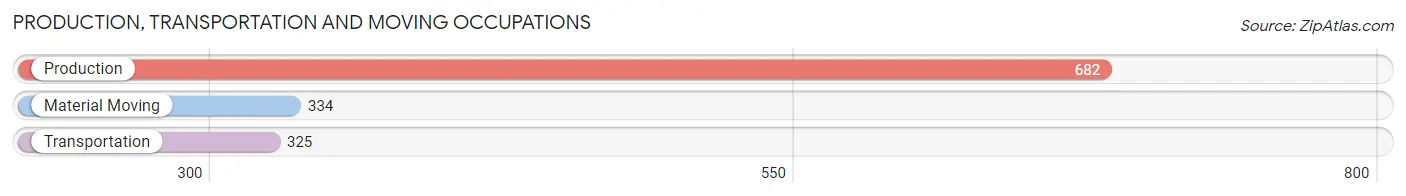
The most common Production, Transportation and Moving occupations in Fort Atkinson are Production (682 | 9.3%), Material Moving (334 | 4.6%), and Transportation (325 | 4.4%).
Production, Transportation and Moving Occupations by Sex
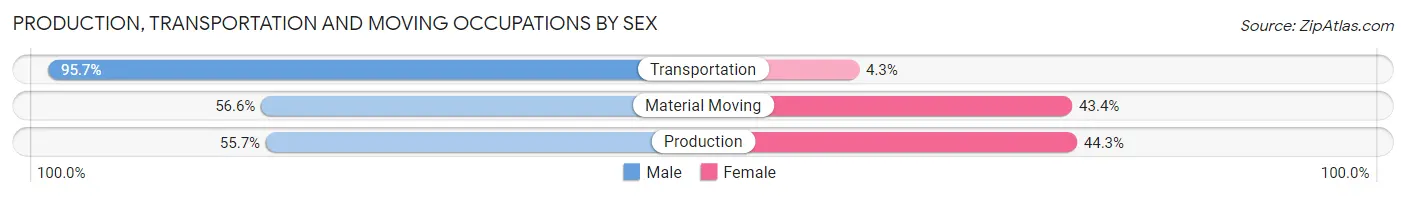
| Occupation | Male | Female |
| Production | 380 (55.7%) | 302 (44.3%) |
| Transportation | 311 (95.7%) | 14 (4.3%) |
| Material Moving | 189 (56.6%) | 145 (43.4%) |
| Total (Category) | 880 (65.6%) | 461 (34.4%) |
| Total (Overall) | 3,971 (54.4%) | 3,329 (45.6%) |
Employment Industries by Sex in Fort Atkinson
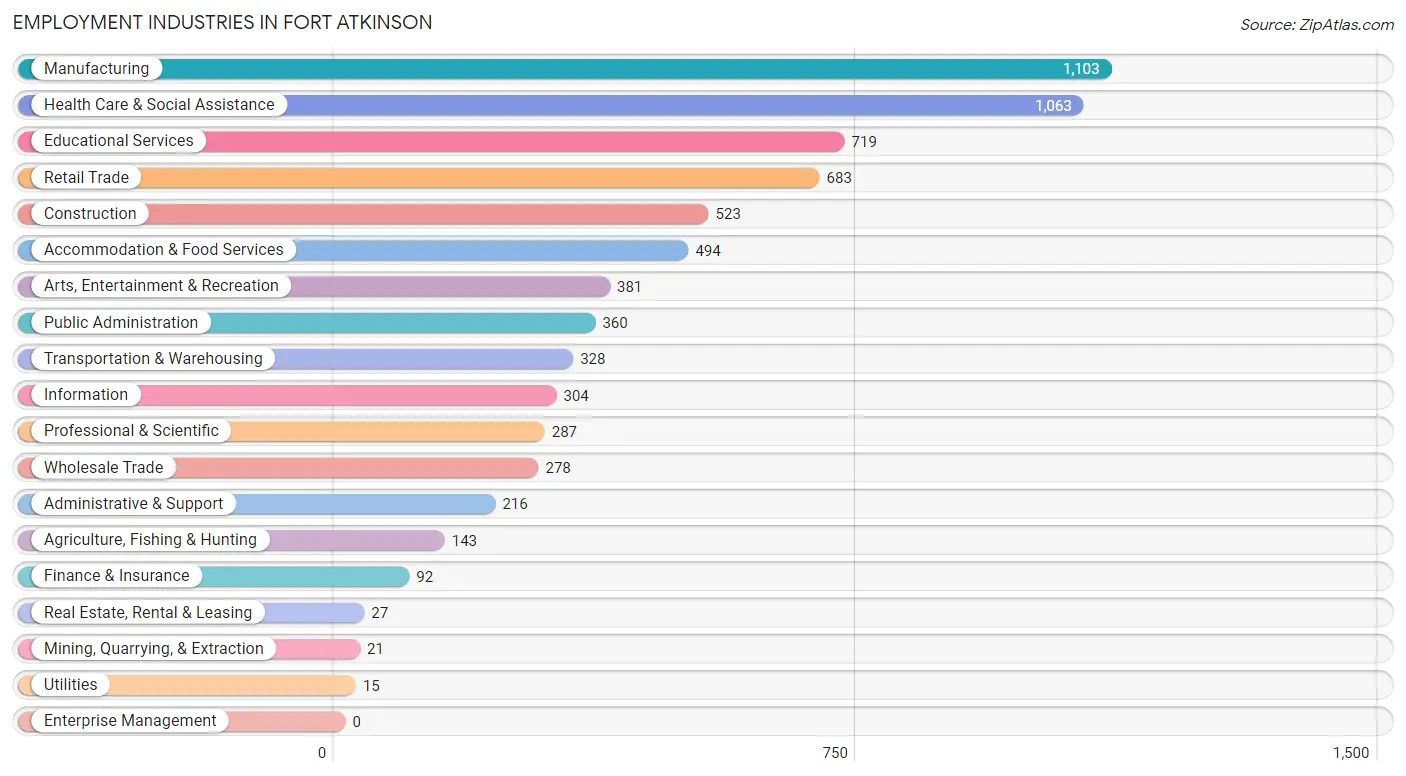
Employment Industries in Fort Atkinson
The major employment industries in Fort Atkinson include Manufacturing (1,103 | 15.1%), Health Care & Social Assistance (1,063 | 14.6%), Educational Services (719 | 9.9%), Retail Trade (683 | 9.4%), and Construction (523 | 7.2%).
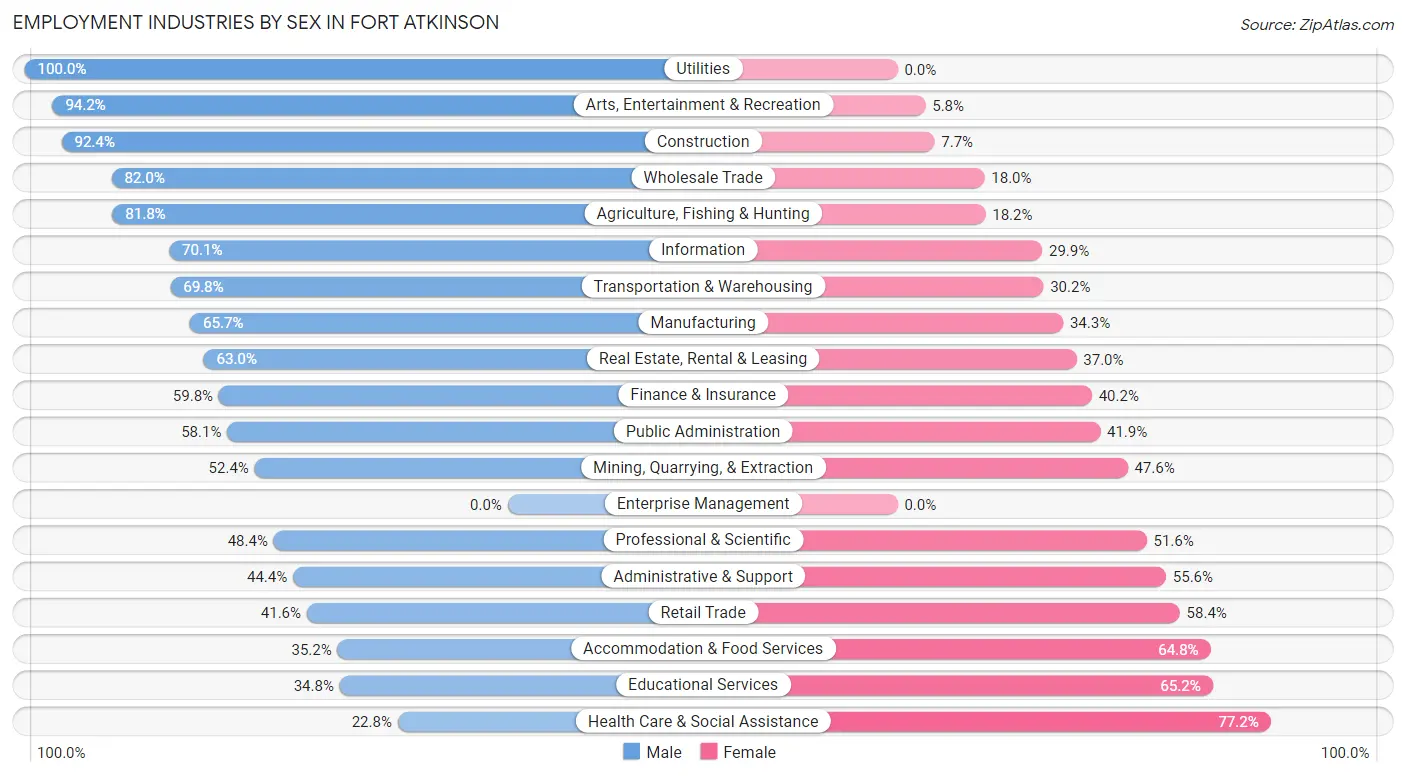
Employment Industries by Sex in Fort Atkinson
The Fort Atkinson industries that see more men than women are Utilities (100.0%), Arts, Entertainment & Recreation (94.2%), and Construction (92.3%), whereas the industries that tend to have a higher number of women are Health Care & Social Assistance (77.2%), Educational Services (65.2%), and Accommodation & Food Services (64.8%).
| Industry | Male | Female |
| Agriculture, Fishing & Hunting | 117 (81.8%) | 26 (18.2%) |
| Mining, Quarrying, & Extraction | 11 (52.4%) | 10 (47.6%) |
| Construction | 483 (92.3%) | 40 (7.6%) |
| Manufacturing | 725 (65.7%) | 378 (34.3%) |
| Wholesale Trade | 228 (82.0%) | 50 (18.0%) |
| Retail Trade | 284 (41.6%) | 399 (58.4%) |
| Transportation & Warehousing | 229 (69.8%) | 99 (30.2%) |
| Utilities | 15 (100.0%) | 0 (0.0%) |
| Information | 213 (70.1%) | 91 (29.9%) |
| Finance & Insurance | 55 (59.8%) | 37 (40.2%) |
| Real Estate, Rental & Leasing | 17 (63.0%) | 10 (37.0%) |
| Professional & Scientific | 139 (48.4%) | 148 (51.6%) |
| Enterprise Management | 0 (0.0%) | 0 (0.0%) |
| Administrative & Support | 96 (44.4%) | 120 (55.6%) |
| Educational Services | 250 (34.8%) | 469 (65.2%) |
| Health Care & Social Assistance | 242 (22.8%) | 821 (77.2%) |
| Arts, Entertainment & Recreation | 359 (94.2%) | 22 (5.8%) |
| Accommodation & Food Services | 174 (35.2%) | 320 (64.8%) |
| Public Administration | 209 (58.1%) | 151 (41.9%) |
| Total | 3,971 (54.4%) | 3,329 (45.6%) |
Education in Fort Atkinson
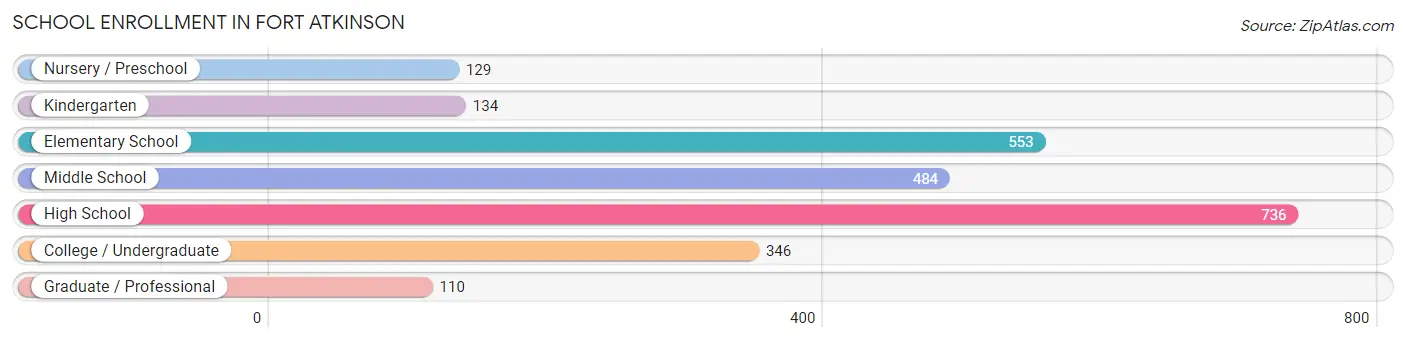
School Enrollment in Fort Atkinson
The most common levels of schooling among the 2,492 students in Fort Atkinson are high school (736 | 29.5%), elementary school (553 | 22.2%), and middle school (484 | 19.4%).
| School Level | # Students | % Students |
| Nursery / Preschool | 129 | 5.2% |
| Kindergarten | 134 | 5.4% |
| Elementary School | 553 | 22.2% |
| Middle School | 484 | 19.4% |
| High School | 736 | 29.5% |
| College / Undergraduate | 346 | 13.9% |
| Graduate / Professional | 110 | 4.4% |
| Total | 2,492 | 100.0% |
School Enrollment by Age by Funding Source in Fort Atkinson
Out of a total of 2,492 students who are enrolled in schools in Fort Atkinson, 369 (14.8%) attend a private institution, while the remaining 2,123 (85.2%) are enrolled in public schools. The age group of 25 to 34 year olds has the highest likelihood of being enrolled in private schools, with 72 (48.6% in the age bracket) enrolled. Conversely, the age group of 15 to 17 year olds has the lowest likelihood of being enrolled in a private school, with 567 (100.0% in the age bracket) attending a public institution.
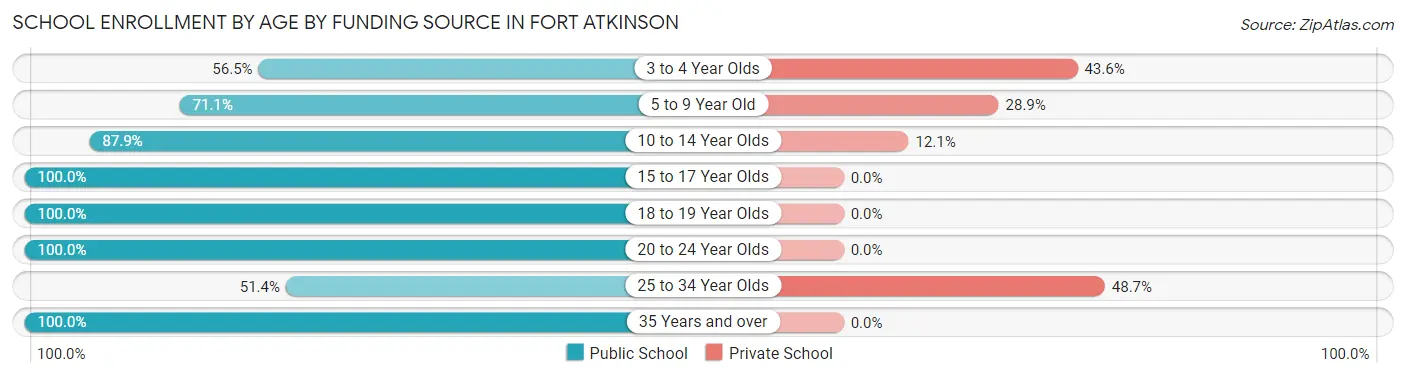
| Age Bracket | Public School | Private School |
| 3 to 4 Year Olds | 35 (56.5%) | 27 (43.5%) |
| 5 to 9 Year Old | 461 (71.1%) | 187 (28.9%) |
| 10 to 14 Year Olds | 597 (87.9%) | 82 (12.1%) |
| 15 to 17 Year Olds | 567 (100.0%) | 0 (0.0%) |
| 18 to 19 Year Olds | 109 (100.0%) | 0 (0.0%) |
| 20 to 24 Year Olds | 173 (100.0%) | 0 (0.0%) |
| 25 to 34 Year Olds | 76 (51.3%) | 72 (48.6%) |
| 35 Years and over | 106 (100.0%) | 0 (0.0%) |
| Total | 2,123 (85.2%) | 369 (14.8%) |
Educational Attainment by Field of Study in Fort Atkinson
Education (508 | 18.6%), business (470 | 17.2%), science & technology (373 | 13.7%), arts & humanities (284 | 10.4%), and social sciences (199 | 7.3%) are the most common fields of study among 2,733 individuals in Fort Atkinson who have obtained a bachelor's degree or higher.
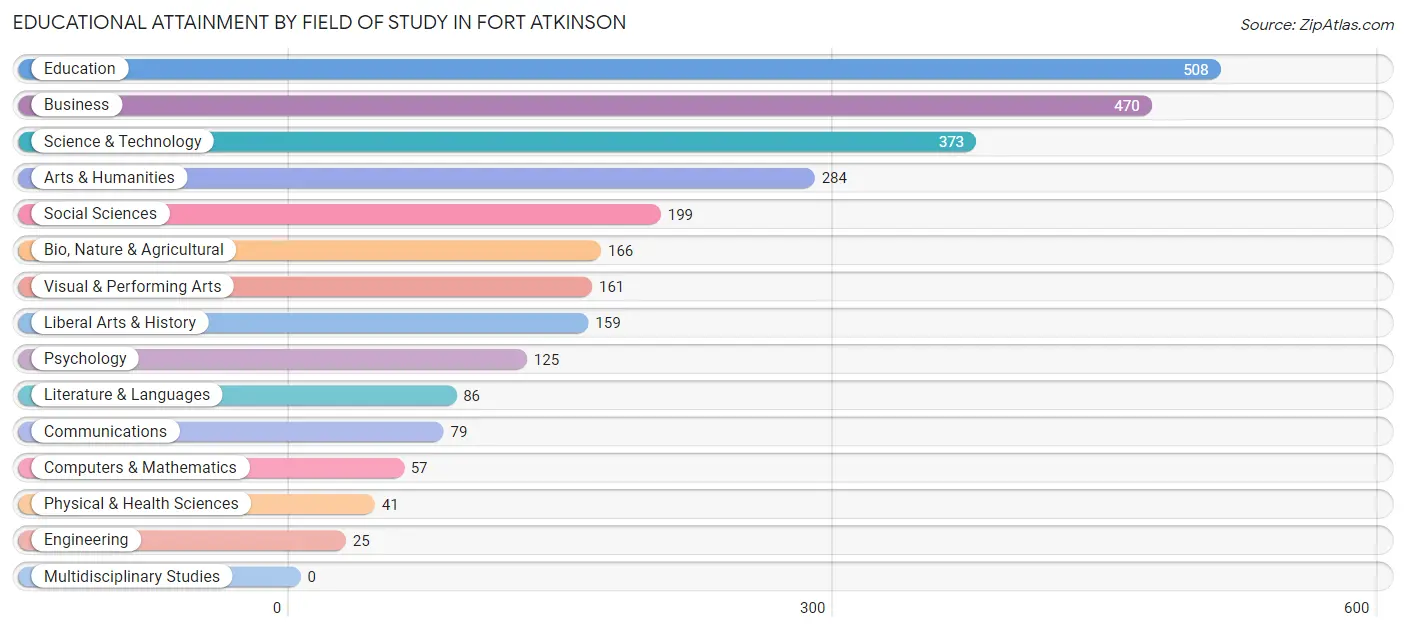
| Field of Study | # Graduates | % Graduates |
| Computers & Mathematics | 57 | 2.1% |
| Bio, Nature & Agricultural | 166 | 6.1% |
| Physical & Health Sciences | 41 | 1.5% |
| Psychology | 125 | 4.6% |
| Social Sciences | 199 | 7.3% |
| Engineering | 25 | 0.9% |
| Multidisciplinary Studies | 0 | 0.0% |
| Science & Technology | 373 | 13.7% |
| Business | 470 | 17.2% |
| Education | 508 | 18.6% |
| Literature & Languages | 86 | 3.2% |
| Liberal Arts & History | 159 | 5.8% |
| Visual & Performing Arts | 161 | 5.9% |
| Communications | 79 | 2.9% |
| Arts & Humanities | 284 | 10.4% |
| Total | 2,733 | 100.0% |
Transportation & Commute in Fort Atkinson
Vehicle Availability by Sex in Fort Atkinson
The most prevalent vehicle ownership categories in Fort Atkinson are males with 2 vehicles (1,736, accounting for 44.6%) and females with 2 vehicles (1,528, making up 52.8%).
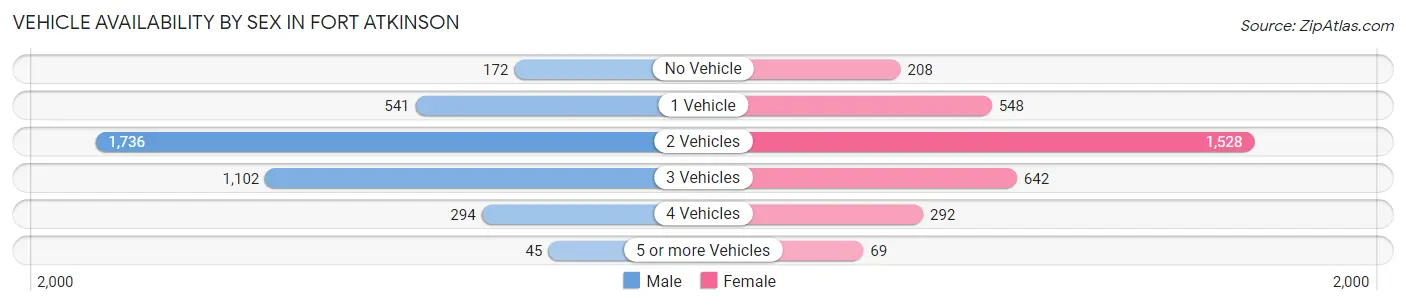
| Vehicles Available | Male | Female |
| No Vehicle | 172 (4.4%) | 208 (6.3%) |
| 1 Vehicle | 541 (13.9%) | 548 (16.7%) |
| 2 Vehicles | 1,736 (44.6%) | 1,528 (46.5%) |
| 3 Vehicles | 1,102 (28.3%) | 642 (19.5%) |
| 4 Vehicles | 294 (7.6%) | 292 (8.9%) |
| 5 or more Vehicles | 45 (1.2%) | 69 (2.1%) |
| Total | 3,890 (100.0%) | 3,287 (100.0%) |
Commute Time in Fort Atkinson
The most frequently occuring commute durations in Fort Atkinson are 5 to 9 minutes (1,869 commuters, 27.7%), 10 to 14 minutes (936 commuters, 13.9%), and 15 to 19 minutes (740 commuters, 11.0%).
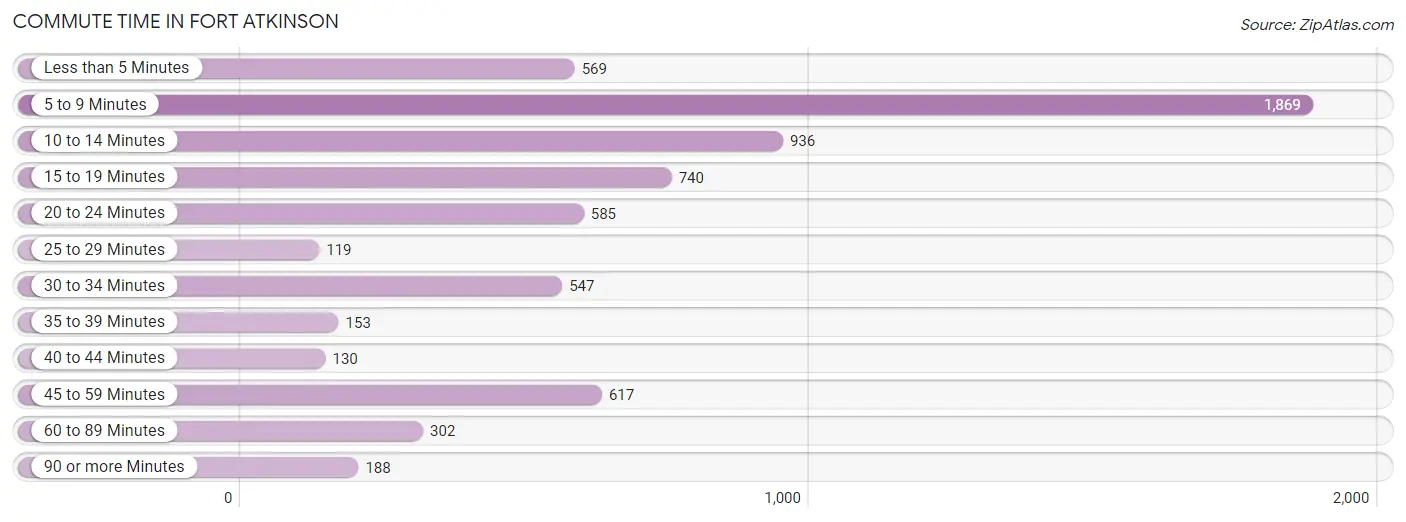
| Commute Time | # Commuters | % Commuters |
| Less than 5 Minutes | 569 | 8.4% |
| 5 to 9 Minutes | 1,869 | 27.7% |
| 10 to 14 Minutes | 936 | 13.9% |
| 15 to 19 Minutes | 740 | 11.0% |
| 20 to 24 Minutes | 585 | 8.7% |
| 25 to 29 Minutes | 119 | 1.8% |
| 30 to 34 Minutes | 547 | 8.1% |
| 35 to 39 Minutes | 153 | 2.3% |
| 40 to 44 Minutes | 130 | 1.9% |
| 45 to 59 Minutes | 617 | 9.1% |
| 60 to 89 Minutes | 302 | 4.5% |
| 90 or more Minutes | 188 | 2.8% |
Commute Time by Sex in Fort Atkinson
The most common commute times in Fort Atkinson are 5 to 9 minutes (1,002 commuters, 27.5%) for males and 5 to 9 minutes (867 commuters, 27.9%) for females.
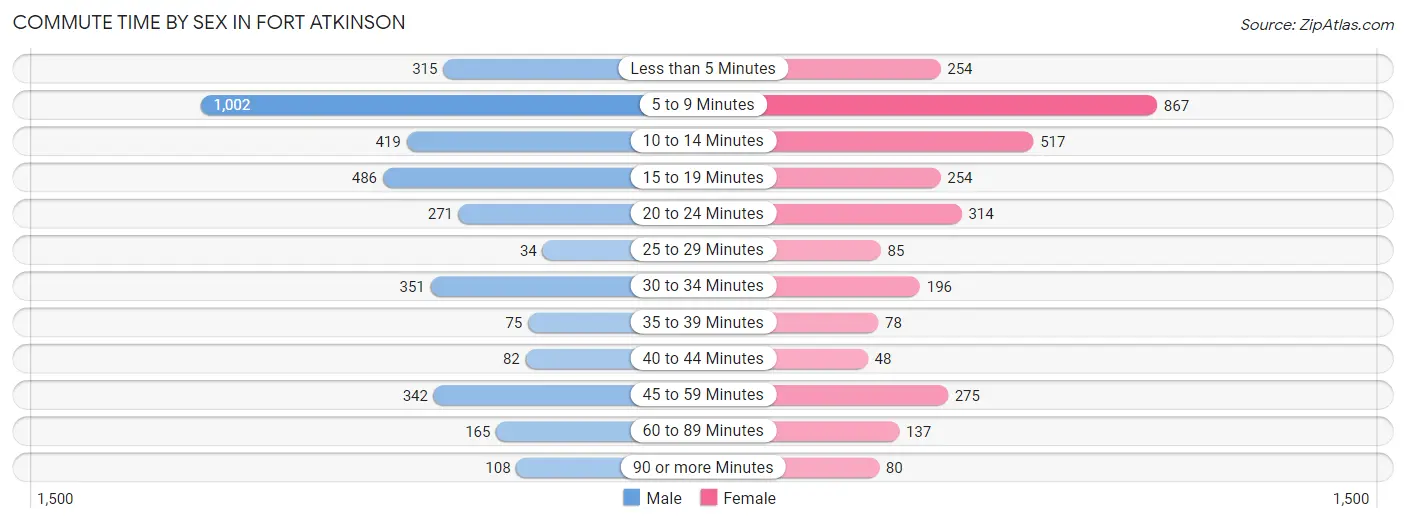
| Commute Time | Male | Female |
| Less than 5 Minutes | 315 (8.6%) | 254 (8.2%) |
| 5 to 9 Minutes | 1,002 (27.5%) | 867 (27.9%) |
| 10 to 14 Minutes | 419 (11.5%) | 517 (16.7%) |
| 15 to 19 Minutes | 486 (13.3%) | 254 (8.2%) |
| 20 to 24 Minutes | 271 (7.4%) | 314 (10.1%) |
| 25 to 29 Minutes | 34 (0.9%) | 85 (2.7%) |
| 30 to 34 Minutes | 351 (9.6%) | 196 (6.3%) |
| 35 to 39 Minutes | 75 (2.1%) | 78 (2.5%) |
| 40 to 44 Minutes | 82 (2.2%) | 48 (1.5%) |
| 45 to 59 Minutes | 342 (9.4%) | 275 (8.9%) |
| 60 to 89 Minutes | 165 (4.5%) | 137 (4.4%) |
| 90 or more Minutes | 108 (3.0%) | 80 (2.6%) |
Time of Departure to Work by Sex in Fort Atkinson
The most frequent times of departure to work in Fort Atkinson are 8:00 AM to 8:29 AM (493, 13.5%) for males and 7:00 AM to 7:29 AM (489, 15.8%) for females.
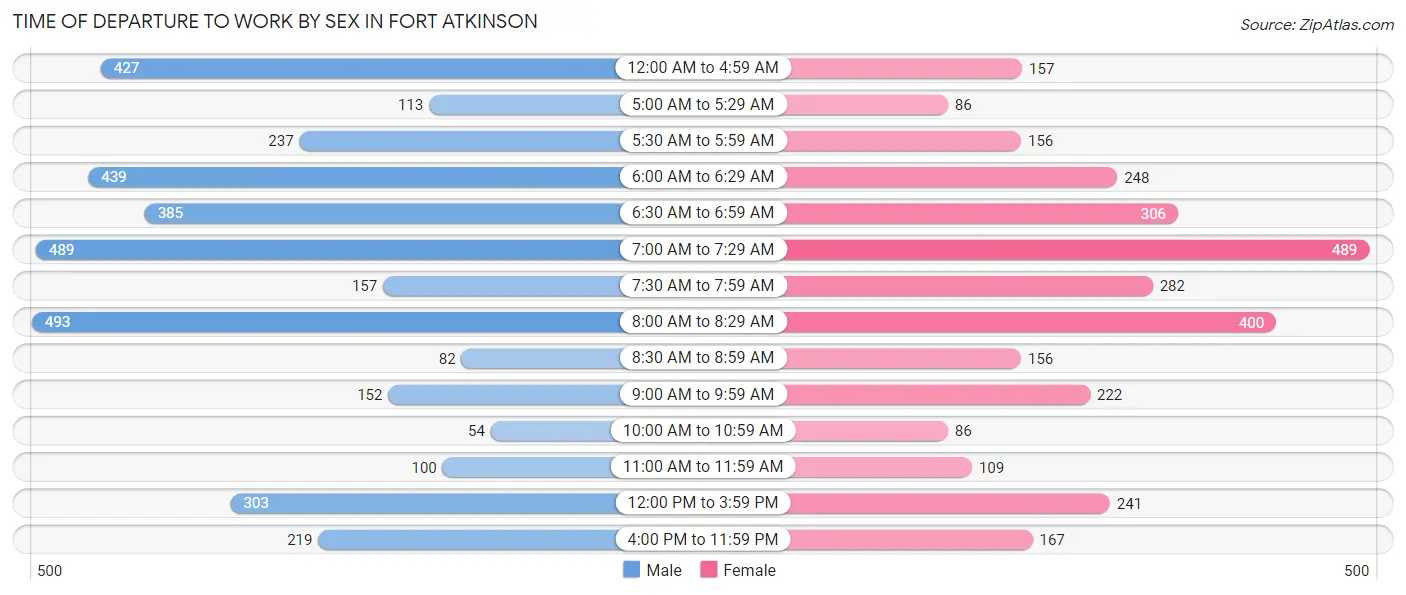
| Time of Departure | Male | Female |
| 12:00 AM to 4:59 AM | 427 (11.7%) | 157 (5.1%) |
| 5:00 AM to 5:29 AM | 113 (3.1%) | 86 (2.8%) |
| 5:30 AM to 5:59 AM | 237 (6.5%) | 156 (5.0%) |
| 6:00 AM to 6:29 AM | 439 (12.0%) | 248 (8.0%) |
| 6:30 AM to 6:59 AM | 385 (10.5%) | 306 (9.9%) |
| 7:00 AM to 7:29 AM | 489 (13.4%) | 489 (15.8%) |
| 7:30 AM to 7:59 AM | 157 (4.3%) | 282 (9.1%) |
| 8:00 AM to 8:29 AM | 493 (13.5%) | 400 (12.9%) |
| 8:30 AM to 8:59 AM | 82 (2.2%) | 156 (5.0%) |
| 9:00 AM to 9:59 AM | 152 (4.2%) | 222 (7.1%) |
| 10:00 AM to 10:59 AM | 54 (1.5%) | 86 (2.8%) |
| 11:00 AM to 11:59 AM | 100 (2.7%) | 109 (3.5%) |
| 12:00 PM to 3:59 PM | 303 (8.3%) | 241 (7.8%) |
| 4:00 PM to 11:59 PM | 219 (6.0%) | 167 (5.4%) |
| Total | 3,650 (100.0%) | 3,105 (100.0%) |
Housing Occupancy in Fort Atkinson
Occupancy by Ownership in Fort Atkinson
Of the total 5,367 dwellings in Fort Atkinson, owner-occupied units account for 3,837 (71.5%), while renter-occupied units make up 1,530 (28.5%).
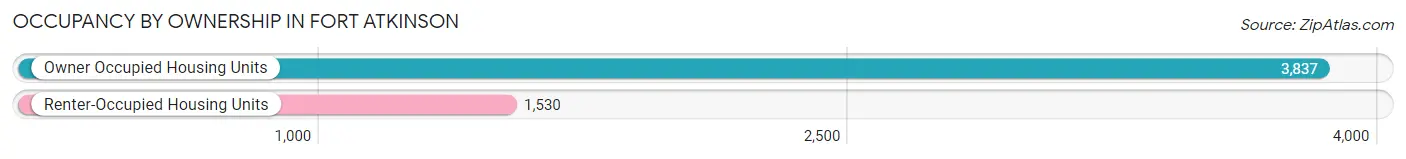
| Occupancy | # Housing Units | % Housing Units |
| Owner Occupied Housing Units | 3,837 | 71.5% |
| Renter-Occupied Housing Units | 1,530 | 28.5% |
| Total Occupied Housing Units | 5,367 | 100.0% |
Occupancy by Household Size in Fort Atkinson
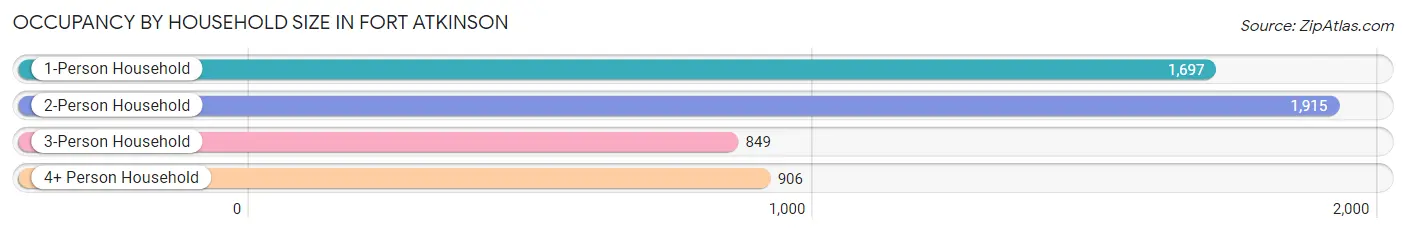
| Household Size | # Housing Units | % Housing Units |
| 1-Person Household | 1,697 | 31.6% |
| 2-Person Household | 1,915 | 35.7% |
| 3-Person Household | 849 | 15.8% |
| 4+ Person Household | 906 | 16.9% |
| Total Housing Units | 5,367 | 100.0% |
Occupancy by Ownership by Household Size in Fort Atkinson
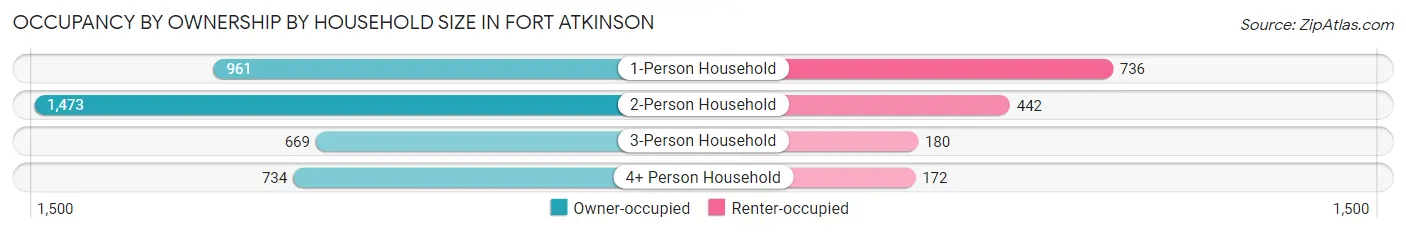
| Household Size | Owner-occupied | Renter-occupied |
| 1-Person Household | 961 (56.6%) | 736 (43.4%) |
| 2-Person Household | 1,473 (76.9%) | 442 (23.1%) |
| 3-Person Household | 669 (78.8%) | 180 (21.2%) |
| 4+ Person Household | 734 (81.0%) | 172 (19.0%) |
| Total Housing Units | 3,837 (71.5%) | 1,530 (28.5%) |
Occupancy by Educational Attainment in Fort Atkinson
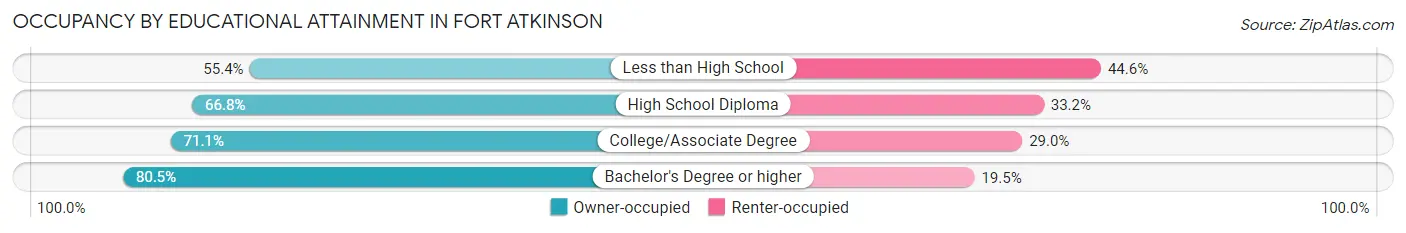
| Household Size | Owner-occupied | Renter-occupied |
| Less than High School | 194 (55.4%) | 156 (44.6%) |
| High School Diploma | 1,055 (66.8%) | 525 (33.2%) |
| College/Associate Degree | 1,345 (71.1%) | 548 (28.9%) |
| Bachelor's Degree or higher | 1,243 (80.5%) | 301 (19.5%) |
Occupancy by Age of Householder in Fort Atkinson
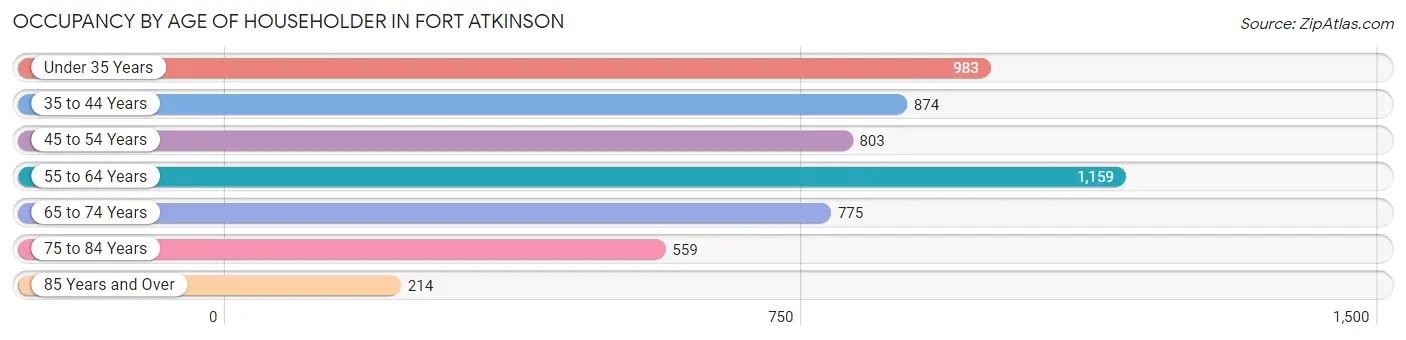
| Age Bracket | # Households | % Households |
| Under 35 Years | 983 | 18.3% |
| 35 to 44 Years | 874 | 16.3% |
| 45 to 54 Years | 803 | 15.0% |
| 55 to 64 Years | 1,159 | 21.6% |
| 65 to 74 Years | 775 | 14.4% |
| 75 to 84 Years | 559 | 10.4% |
| 85 Years and Over | 214 | 4.0% |
| Total | 5,367 | 100.0% |
Housing Finances in Fort Atkinson
Median Income by Occupancy in Fort Atkinson
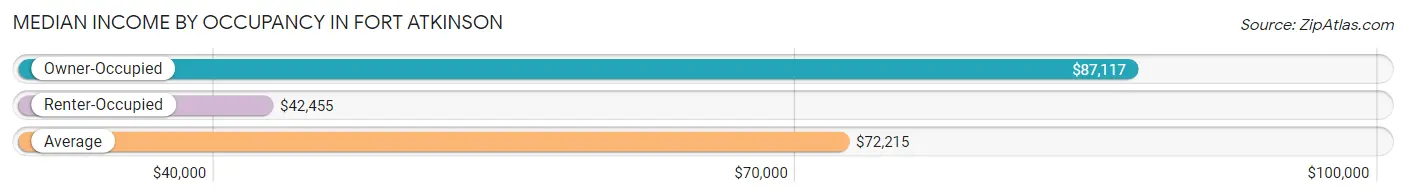
| Occupancy Type | # Households | Median Income |
| Owner-Occupied | 3,837 (71.5%) | $87,117 |
| Renter-Occupied | 1,530 (28.5%) | $42,455 |
| Average | 5,367 (100.0%) | $72,215 |
Occupancy by Householder Income Bracket in Fort Atkinson
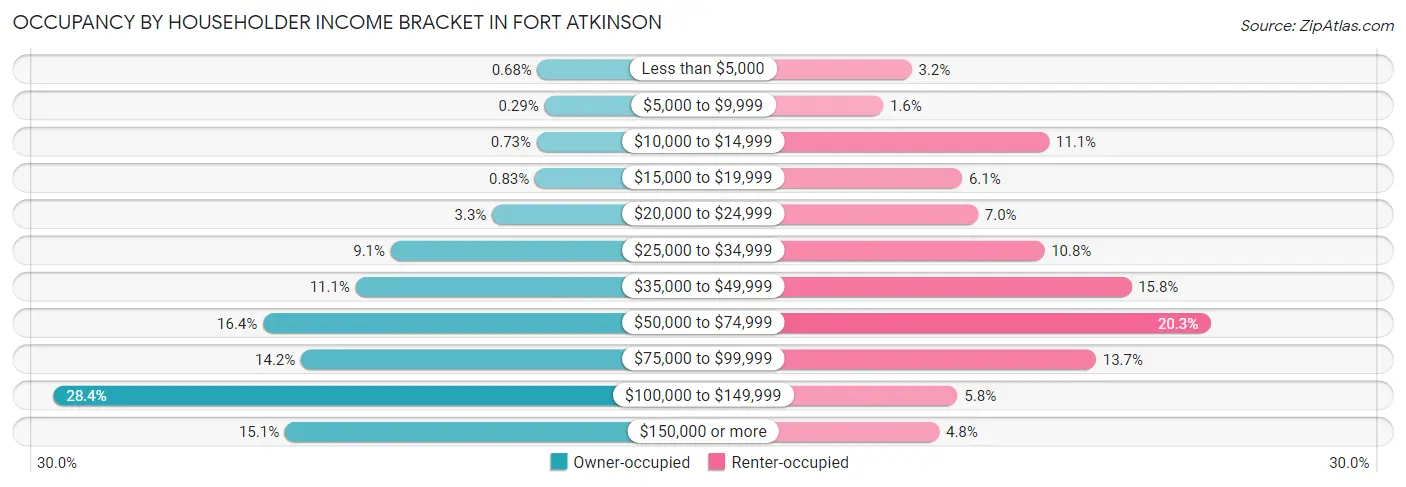
| Income Bracket | Owner-occupied | Renter-occupied |
| Less than $5,000 | 26 (0.7%) | 49 (3.2%) |
| $5,000 to $9,999 | 11 (0.3%) | 24 (1.6%) |
| $10,000 to $14,999 | 28 (0.7%) | 169 (11.1%) |
| $15,000 to $19,999 | 32 (0.8%) | 93 (6.1%) |
| $20,000 to $24,999 | 126 (3.3%) | 107 (7.0%) |
| $25,000 to $34,999 | 348 (9.1%) | 165 (10.8%) |
| $35,000 to $49,999 | 425 (11.1%) | 241 (15.8%) |
| $50,000 to $74,999 | 628 (16.4%) | 310 (20.3%) |
| $75,000 to $99,999 | 545 (14.2%) | 210 (13.7%) |
| $100,000 to $149,999 | 1,088 (28.4%) | 89 (5.8%) |
| $150,000 or more | 580 (15.1%) | 73 (4.8%) |
| Total | 3,837 (100.0%) | 1,530 (100.0%) |
Monthly Housing Cost Tiers in Fort Atkinson
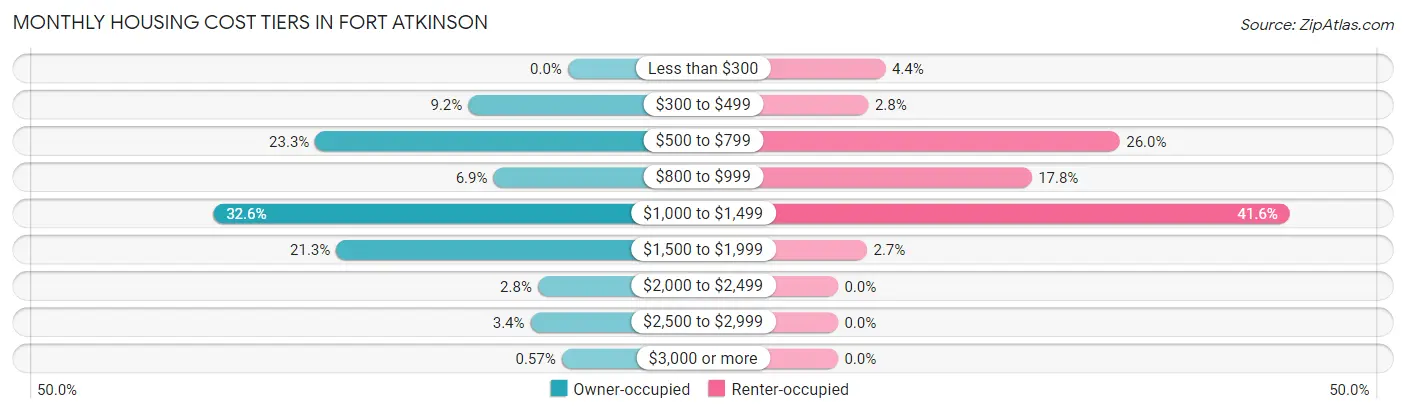
| Monthly Cost | Owner-occupied | Renter-occupied |
| Less than $300 | 0 (0.0%) | 67 (4.4%) |
| $300 to $499 | 352 (9.2%) | 43 (2.8%) |
| $500 to $799 | 892 (23.3%) | 397 (26.0%) |
| $800 to $999 | 263 (6.9%) | 273 (17.8%) |
| $1,000 to $1,499 | 1,252 (32.6%) | 637 (41.6%) |
| $1,500 to $1,999 | 818 (21.3%) | 41 (2.7%) |
| $2,000 to $2,499 | 106 (2.8%) | 0 (0.0%) |
| $2,500 to $2,999 | 132 (3.4%) | 0 (0.0%) |
| $3,000 or more | 22 (0.6%) | 0 (0.0%) |
| Total | 3,837 (100.0%) | 1,530 (100.0%) |
Physical Housing Characteristics in Fort Atkinson
Housing Structures in Fort Atkinson
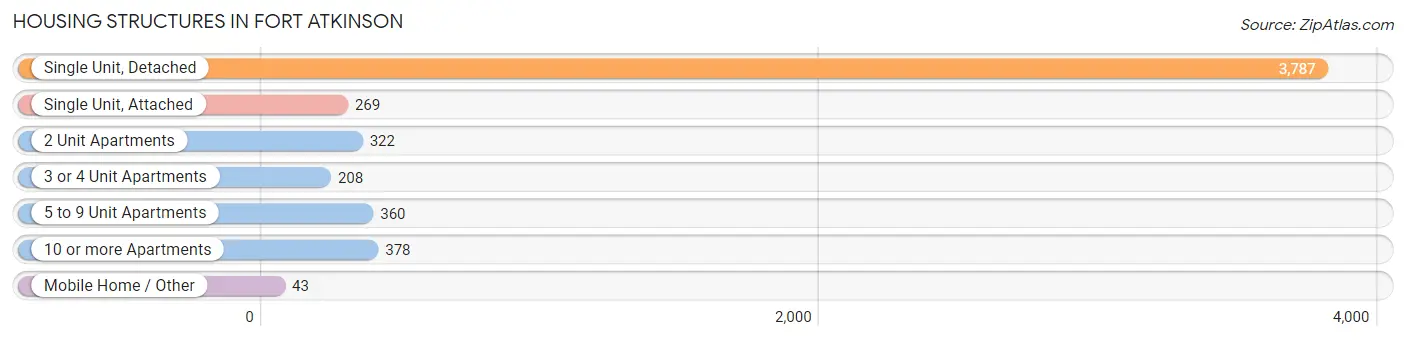
| Structure Type | # Housing Units | % Housing Units |
| Single Unit, Detached | 3,787 | 70.6% |
| Single Unit, Attached | 269 | 5.0% |
| 2 Unit Apartments | 322 | 6.0% |
| 3 or 4 Unit Apartments | 208 | 3.9% |
| 5 to 9 Unit Apartments | 360 | 6.7% |
| 10 or more Apartments | 378 | 7.0% |
| Mobile Home / Other | 43 | 0.8% |
| Total | 5,367 | 100.0% |
Housing Structures by Occupancy in Fort Atkinson
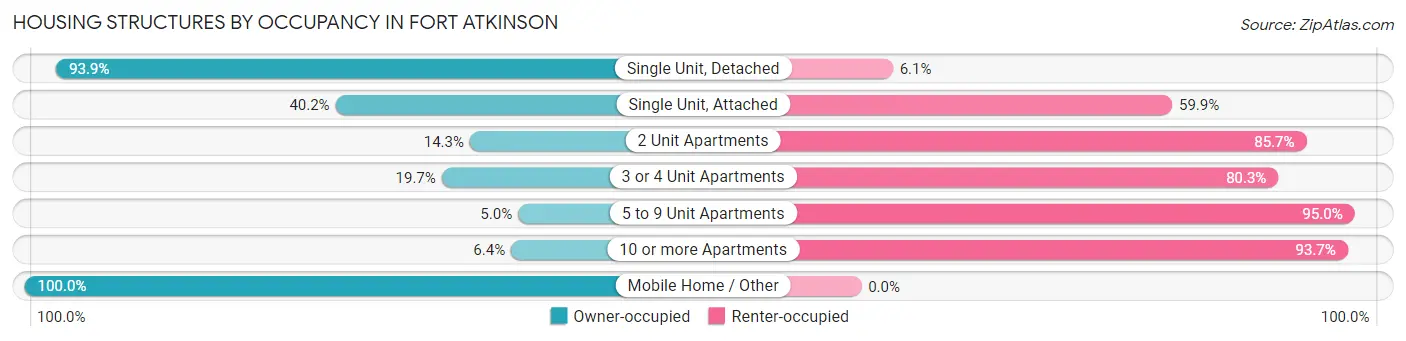
| Structure Type | Owner-occupied | Renter-occupied |
| Single Unit, Detached | 3,557 (93.9%) | 230 (6.1%) |
| Single Unit, Attached | 108 (40.2%) | 161 (59.9%) |
| 2 Unit Apartments | 46 (14.3%) | 276 (85.7%) |
| 3 or 4 Unit Apartments | 41 (19.7%) | 167 (80.3%) |
| 5 to 9 Unit Apartments | 18 (5.0%) | 342 (95.0%) |
| 10 or more Apartments | 24 (6.4%) | 354 (93.6%) |
| Mobile Home / Other | 43 (100.0%) | 0 (0.0%) |
| Total | 3,837 (71.5%) | 1,530 (28.5%) |
Housing Structures by Number of Rooms in Fort Atkinson
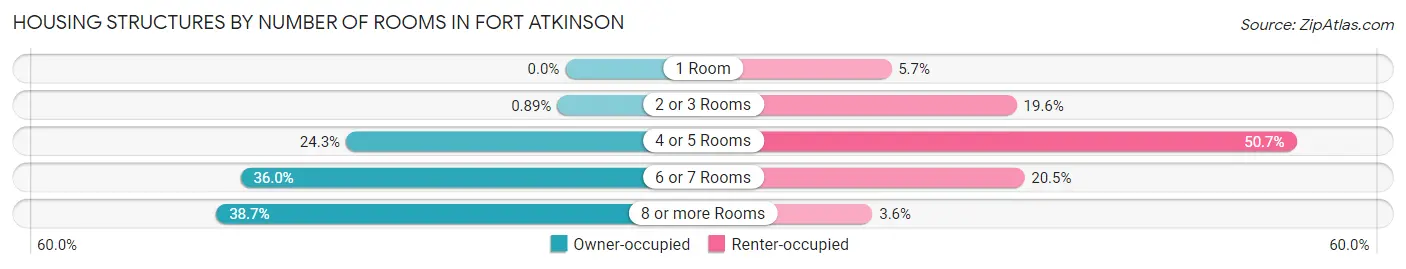
| Number of Rooms | Owner-occupied | Renter-occupied |
| 1 Room | 0 (0.0%) | 87 (5.7%) |
| 2 or 3 Rooms | 34 (0.9%) | 300 (19.6%) |
| 4 or 5 Rooms | 934 (24.3%) | 775 (50.6%) |
| 6 or 7 Rooms | 1,383 (36.0%) | 313 (20.5%) |
| 8 or more Rooms | 1,486 (38.7%) | 55 (3.6%) |
| Total | 3,837 (100.0%) | 1,530 (100.0%) |
Housing Structure by Heating Type in Fort Atkinson
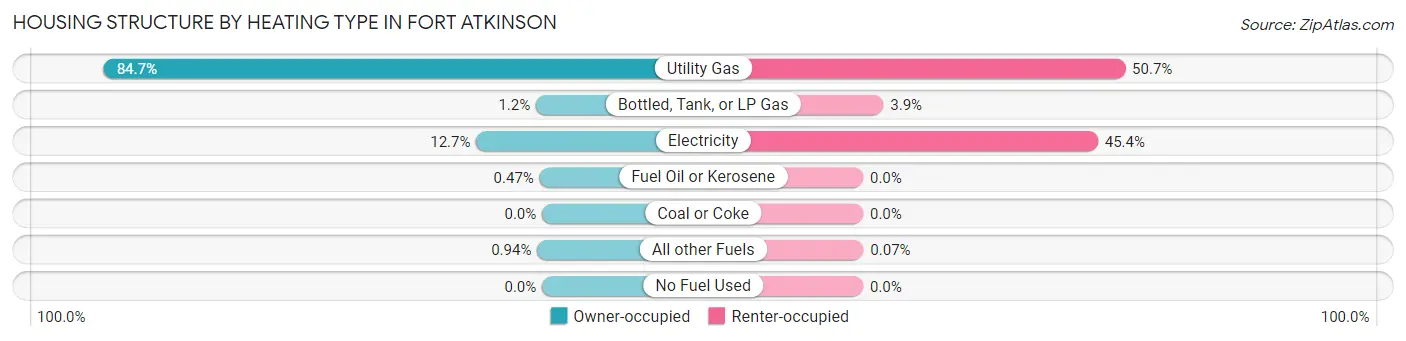
| Heating Type | Owner-occupied | Renter-occupied |
| Utility Gas | 3,250 (84.7%) | 775 (50.6%) |
| Bottled, Tank, or LP Gas | 45 (1.2%) | 60 (3.9%) |
| Electricity | 488 (12.7%) | 694 (45.4%) |
| Fuel Oil or Kerosene | 18 (0.5%) | 0 (0.0%) |
| Coal or Coke | 0 (0.0%) | 0 (0.0%) |
| All other Fuels | 36 (0.9%) | 1 (0.1%) |
| No Fuel Used | 0 (0.0%) | 0 (0.0%) |
| Total | 3,837 (100.0%) | 1,530 (100.0%) |
Household Vehicle Usage in Fort Atkinson
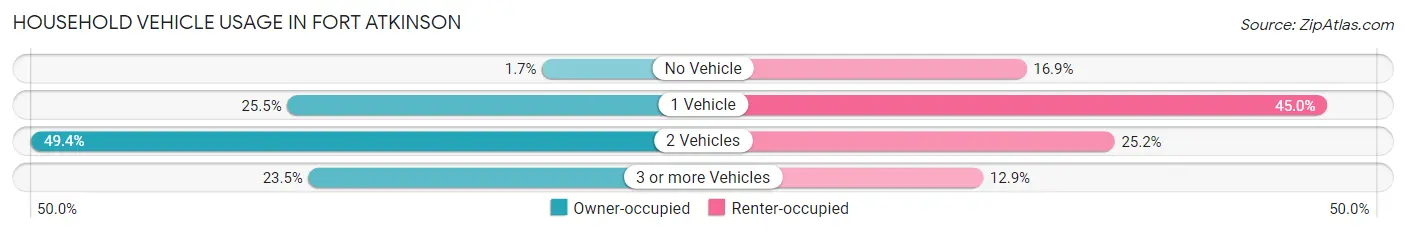
| Vehicles per Household | Owner-occupied | Renter-occupied |
| No Vehicle | 64 (1.7%) | 259 (16.9%) |
| 1 Vehicle | 977 (25.5%) | 689 (45.0%) |
| 2 Vehicles | 1,895 (49.4%) | 385 (25.2%) |
| 3 or more Vehicles | 901 (23.5%) | 197 (12.9%) |
| Total | 3,837 (100.0%) | 1,530 (100.0%) |
Real Estate & Mortgages in Fort Atkinson
Real Estate and Mortgage Overview in Fort Atkinson
| Characteristic | Without Mortgage | With Mortgage |
| Housing Units | 1,235 | 2,602 |
| Median Property Value | $188,000 | $193,800 |
| Median Household Income | $61,685 | $519 |
| Monthly Housing Costs | $600 | $22 |
| Real Estate Taxes | $3,534 | $41 |
Property Value by Mortgage Status in Fort Atkinson
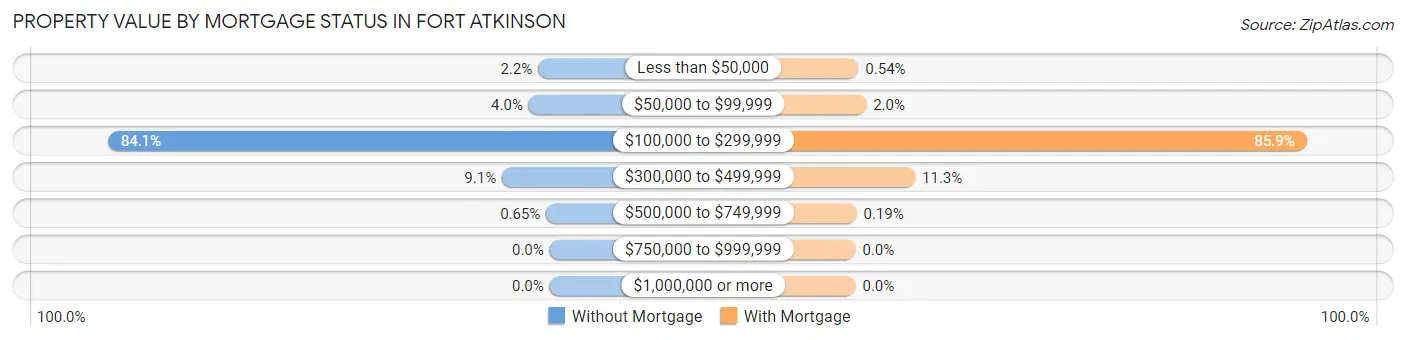
| Property Value | Without Mortgage | With Mortgage |
| Less than $50,000 | 27 (2.2%) | 14 (0.5%) |
| $50,000 to $99,999 | 49 (4.0%) | 53 (2.0%) |
| $100,000 to $299,999 | 1,039 (84.1%) | 2,235 (85.9%) |
| $300,000 to $499,999 | 112 (9.1%) | 295 (11.3%) |
| $500,000 to $749,999 | 8 (0.6%) | 5 (0.2%) |
| $750,000 to $999,999 | 0 (0.0%) | 0 (0.0%) |
| $1,000,000 or more | 0 (0.0%) | 0 (0.0%) |
| Total | 1,235 (100.0%) | 2,602 (100.0%) |
Household Income by Mortgage Status in Fort Atkinson
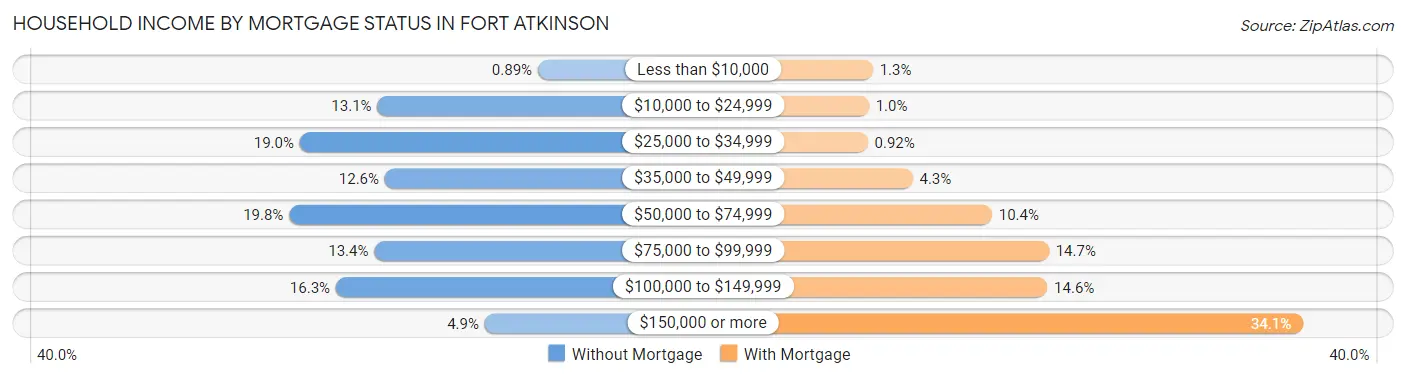
| Household Income | Without Mortgage | With Mortgage |
| Less than $10,000 | 11 (0.9%) | 34 (1.3%) |
| $10,000 to $24,999 | 162 (13.1%) | 26 (1.0%) |
| $25,000 to $34,999 | 235 (19.0%) | 24 (0.9%) |
| $35,000 to $49,999 | 155 (12.6%) | 113 (4.3%) |
| $50,000 to $74,999 | 245 (19.8%) | 270 (10.4%) |
| $75,000 to $99,999 | 165 (13.4%) | 383 (14.7%) |
| $100,000 to $149,999 | 201 (16.3%) | 380 (14.6%) |
| $150,000 or more | 61 (4.9%) | 887 (34.1%) |
| Total | 1,235 (100.0%) | 2,602 (100.0%) |
Property Value to Household Income Ratio in Fort Atkinson
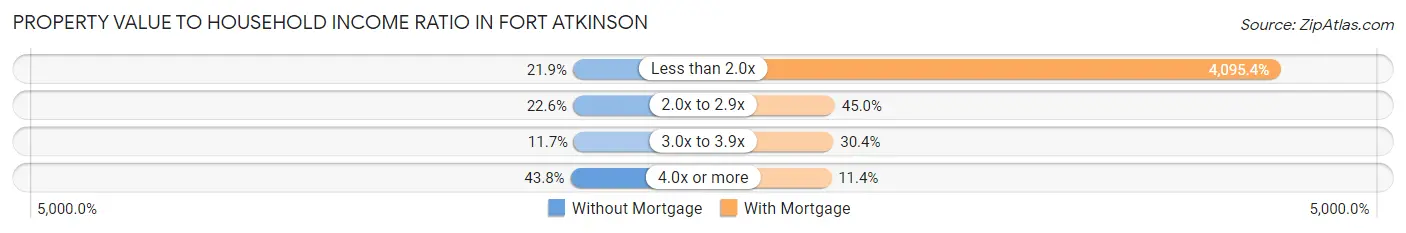
| Value-to-Income Ratio | Without Mortgage | With Mortgage |
| Less than 2.0x | 270 (21.9%) | 106,563 (4,095.4%) |
| 2.0x to 2.9x | 279 (22.6%) | 1,171 (45.0%) |
| 3.0x to 3.9x | 145 (11.7%) | 791 (30.4%) |
| 4.0x or more | 541 (43.8%) | 297 (11.4%) |
| Total | 1,235 (100.0%) | 2,602 (100.0%) |
Real Estate Taxes by Mortgage Status in Fort Atkinson
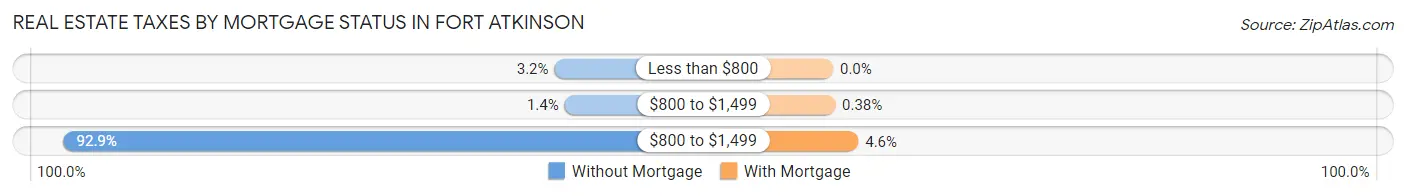
| Property Taxes | Without Mortgage | With Mortgage |
| Less than $800 | 40 (3.2%) | 0 (0.0%) |
| $800 to $1,499 | 17 (1.4%) | 10 (0.4%) |
| $800 to $1,499 | 1,147 (92.9%) | 120 (4.6%) |
| Total | 1,235 (100.0%) | 2,602 (100.0%) |
Health & Disability in Fort Atkinson
Health Insurance Coverage by Age in Fort Atkinson
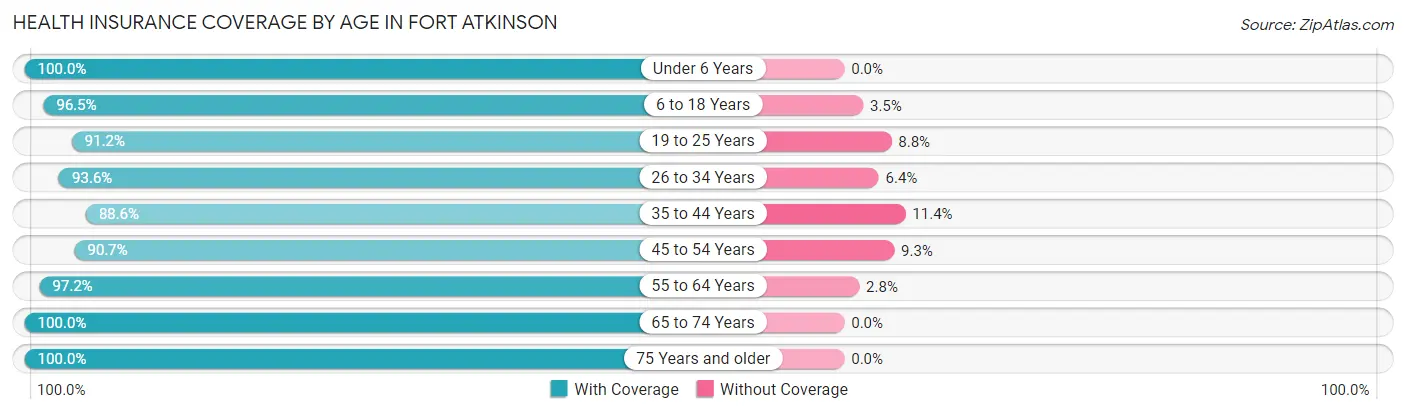
| Age Bracket | With Coverage | Without Coverage |
| Under 6 Years | 623 (100.0%) | 0 (0.0%) |
| 6 to 18 Years | 1,881 (96.5%) | 68 (3.5%) |
| 19 to 25 Years | 1,051 (91.2%) | 101 (8.8%) |
| 26 to 34 Years | 1,346 (93.6%) | 92 (6.4%) |
| 35 to 44 Years | 1,384 (88.6%) | 178 (11.4%) |
| 45 to 54 Years | 1,436 (90.7%) | 147 (9.3%) |
| 55 to 64 Years | 1,967 (97.2%) | 56 (2.8%) |
| 65 to 74 Years | 1,135 (100.0%) | 0 (0.0%) |
| 75 Years and older | 1,008 (100.0%) | 0 (0.0%) |
| Total | 11,831 (94.9%) | 642 (5.1%) |
Health Insurance Coverage by Citizenship Status in Fort Atkinson
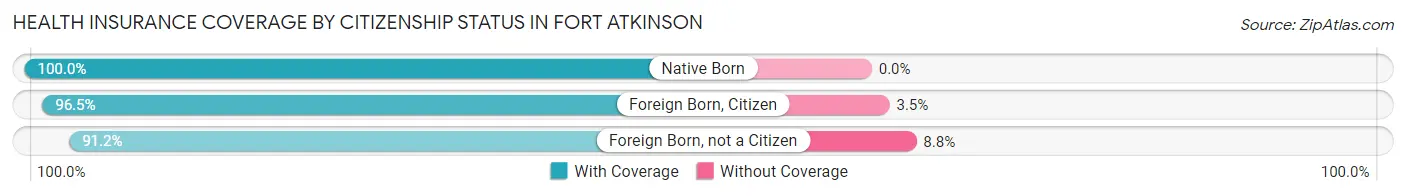
| Citizenship Status | With Coverage | Without Coverage |
| Native Born | 623 (100.0%) | 0 (0.0%) |
| Foreign Born, Citizen | 1,881 (96.5%) | 68 (3.5%) |
| Foreign Born, not a Citizen | 1,051 (91.2%) | 101 (8.8%) |
Health Insurance Coverage by Household Income in Fort Atkinson
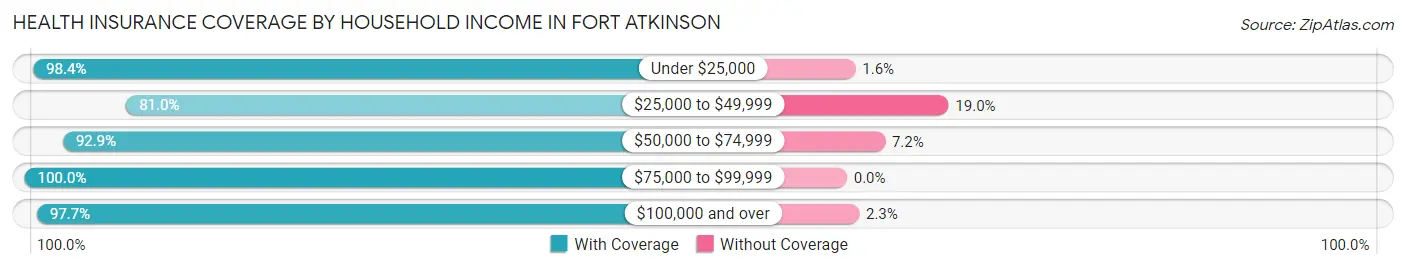
| Household Income | With Coverage | Without Coverage |
| Under $25,000 | 796 (98.4%) | 13 (1.6%) |
| $25,000 to $49,999 | 1,565 (81.0%) | 368 (19.0%) |
| $50,000 to $74,999 | 1,713 (92.8%) | 132 (7.1%) |
| $75,000 to $99,999 | 2,002 (100.0%) | 0 (0.0%) |
| $100,000 and over | 5,508 (97.7%) | 129 (2.3%) |
Public vs Private Health Insurance Coverage by Age in Fort Atkinson
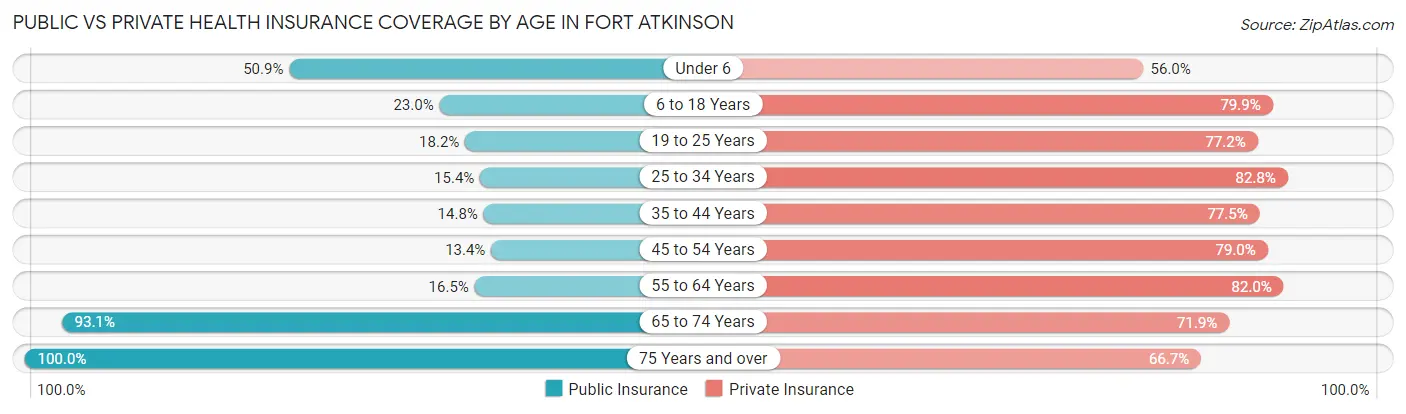
| Age Bracket | Public Insurance | Private Insurance |
| Under 6 | 317 (50.9%) | 349 (56.0%) |
| 6 to 18 Years | 448 (23.0%) | 1,558 (79.9%) |
| 19 to 25 Years | 210 (18.2%) | 889 (77.2%) |
| 25 to 34 Years | 222 (15.4%) | 1,190 (82.8%) |
| 35 to 44 Years | 231 (14.8%) | 1,211 (77.5%) |
| 45 to 54 Years | 212 (13.4%) | 1,251 (79.0%) |
| 55 to 64 Years | 333 (16.5%) | 1,659 (82.0%) |
| 65 to 74 Years | 1,057 (93.1%) | 816 (71.9%) |
| 75 Years and over | 1,008 (100.0%) | 672 (66.7%) |
| Total | 4,038 (32.4%) | 9,595 (76.9%) |
Disability Status by Sex by Age in Fort Atkinson

| Age Bracket | Male | Female |
| Under 5 Years | 0 (0.0%) | 0 (0.0%) |
| 5 to 17 Years | 89 (9.2%) | 23 (2.3%) |
| 18 to 34 Years | 125 (8.9%) | 91 (7.0%) |
| 35 to 64 Years | 238 (9.3%) | 426 (16.3%) |
| 65 to 74 Years | 177 (28.3%) | 63 (12.4%) |
| 75 Years and over | 145 (39.7%) | 257 (40.0%) |
Disability Class by Sex by Age in Fort Atkinson
Disability Class: Hearing Difficulty
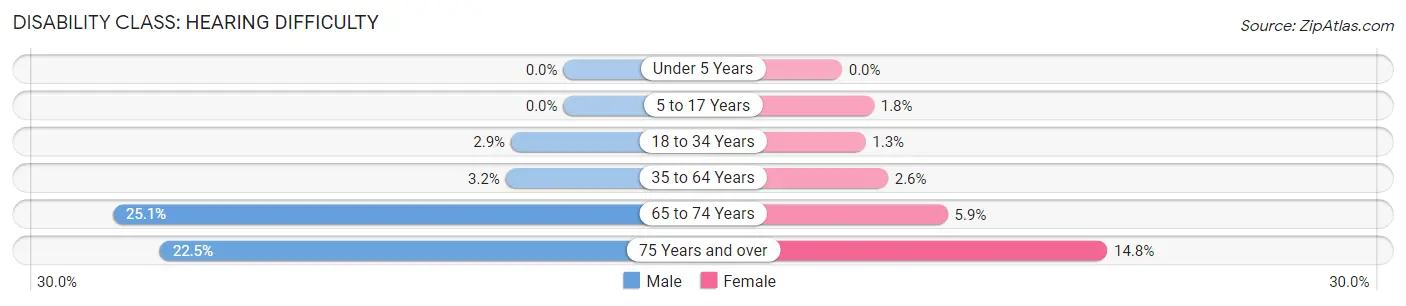
| Age Bracket | Male | Female |
| Under 5 Years | 0 (0.0%) | 0 (0.0%) |
| 5 to 17 Years | 0 (0.0%) | 18 (1.8%) |
| 18 to 34 Years | 41 (2.9%) | 17 (1.3%) |
| 35 to 64 Years | 82 (3.2%) | 67 (2.6%) |
| 65 to 74 Years | 157 (25.1%) | 30 (5.9%) |
| 75 Years and over | 82 (22.5%) | 95 (14.8%) |
Disability Class: Vision Difficulty
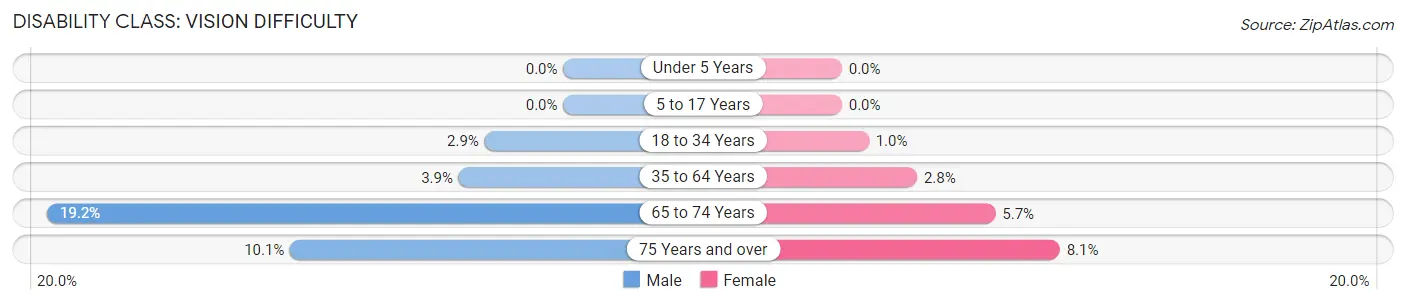
| Age Bracket | Male | Female |
| Under 5 Years | 0 (0.0%) | 0 (0.0%) |
| 5 to 17 Years | 0 (0.0%) | 0 (0.0%) |
| 18 to 34 Years | 41 (2.9%) | 13 (1.0%) |
| 35 to 64 Years | 99 (3.9%) | 73 (2.8%) |
| 65 to 74 Years | 120 (19.2%) | 29 (5.7%) |
| 75 Years and over | 37 (10.1%) | 52 (8.1%) |
Disability Class: Cognitive Difficulty
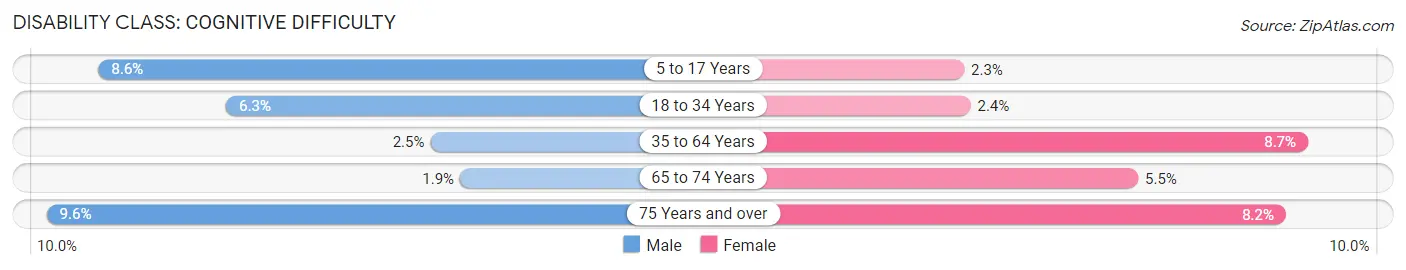
| Age Bracket | Male | Female |
| 5 to 17 Years | 83 (8.6%) | 23 (2.3%) |
| 18 to 34 Years | 88 (6.3%) | 31 (2.4%) |
| 35 to 64 Years | 63 (2.5%) | 226 (8.6%) |
| 65 to 74 Years | 12 (1.9%) | 28 (5.5%) |
| 75 Years and over | 35 (9.6%) | 53 (8.2%) |
Disability Class: Ambulatory Difficulty
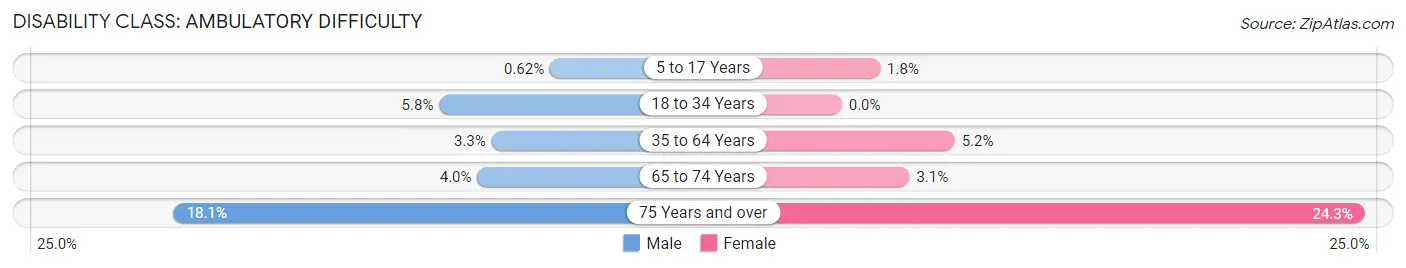
| Age Bracket | Male | Female |
| 5 to 17 Years | 6 (0.6%) | 18 (1.8%) |
| 18 to 34 Years | 81 (5.8%) | 0 (0.0%) |
| 35 to 64 Years | 85 (3.3%) | 137 (5.2%) |
| 65 to 74 Years | 25 (4.0%) | 16 (3.1%) |
| 75 Years and over | 66 (18.1%) | 156 (24.3%) |
Disability Class: Self-Care Difficulty
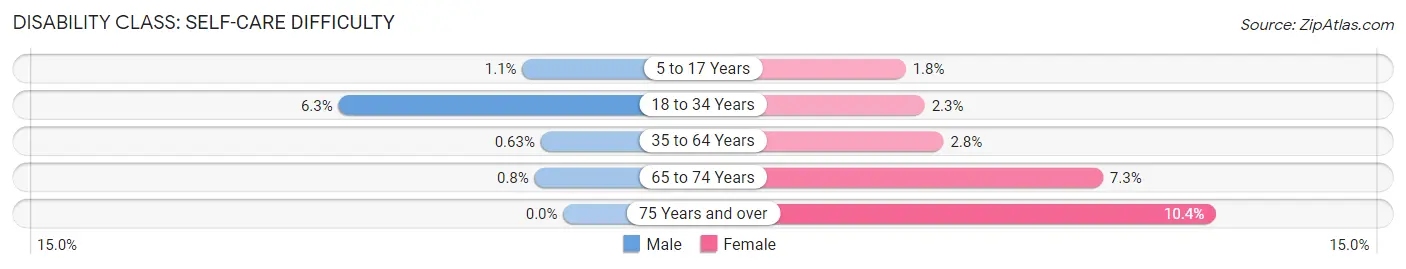
| Age Bracket | Male | Female |
| 5 to 17 Years | 11 (1.1%) | 18 (1.8%) |
| 18 to 34 Years | 88 (6.3%) | 30 (2.3%) |
| 35 to 64 Years | 16 (0.6%) | 74 (2.8%) |
| 65 to 74 Years | 5 (0.8%) | 37 (7.3%) |
| 75 Years and over | 0 (0.0%) | 67 (10.4%) |
Technology Access in Fort Atkinson
Computing Device Access in Fort Atkinson
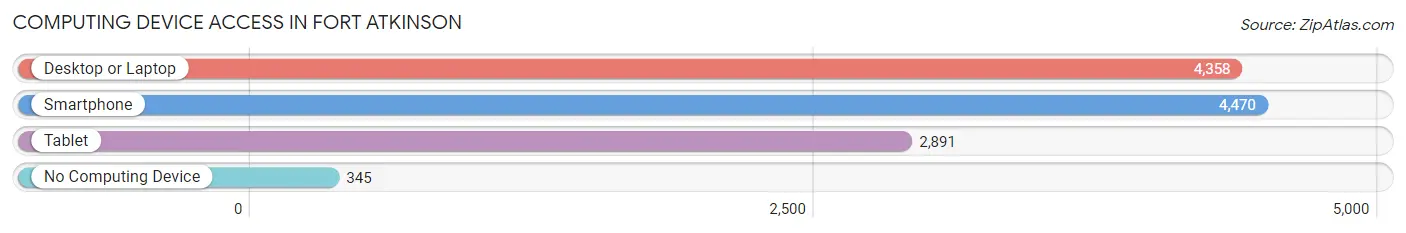
| Device Type | # Households | % Households |
| Desktop or Laptop | 4,358 | 81.2% |
| Smartphone | 4,470 | 83.3% |
| Tablet | 2,891 | 53.9% |
| No Computing Device | 345 | 6.4% |
| Total | 5,367 | 100.0% |
Internet Access in Fort Atkinson
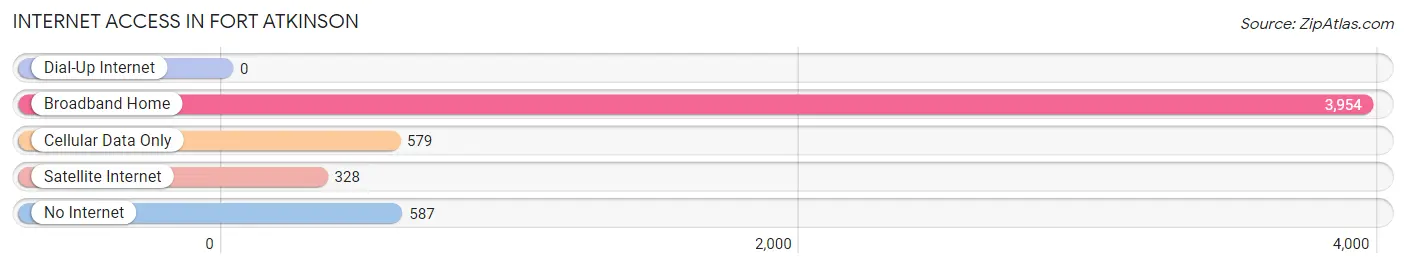
| Internet Type | # Households | % Households |
| Dial-Up Internet | 0 | 0.0% |
| Broadband Home | 3,954 | 73.7% |
| Cellular Data Only | 579 | 10.8% |
| Satellite Internet | 328 | 6.1% |
| No Internet | 587 | 10.9% |
| Total | 5,367 | 100.0% |
Fort Atkinson Summary
History
Fort Atkinson, Wisconsin is a city located in Jefferson County, Wisconsin. It is situated on the Rock River, and is the county seat of Jefferson County. The city was founded in 1836 by General Henry Atkinson, and was named after him. It was originally a military post, and was the first permanent settlement in the area.
The city was an important trading post for the local Native American tribes, and was also a major stop on the Underground Railroad. During the Civil War, Fort Atkinson was a major supply center for the Union Army. After the war, the city became an important industrial center, with several factories and mills.
The city was also home to the first public library in Wisconsin, which was established in 1867. The library was funded by the philanthropist Andrew Carnegie, and is still in operation today.
Geography
Fort Atkinson is located in southeastern Wisconsin, in the southeastern corner of Jefferson County. It is situated on the Rock River, and is about 40 miles west of Milwaukee. The city has a total area of 8.2 square miles, of which 8.1 square miles is land and 0.1 square miles is water.
The city has a humid continental climate, with cold winters and hot, humid summers. The average annual temperature is around 45 degrees Fahrenheit, and the average annual precipitation is around 33 inches.
Economy
Fort Atkinson has a diverse economy, with a variety of industries. The city is home to several manufacturing companies, including Fort Atkinson Foods, which produces a variety of food products. The city is also home to several technology companies, including the software company Epic Systems.
The city is also home to several retail stores, including Walmart, Target, and Kohl’s. The city is also home to several restaurants, including the popular local chain Culver’s.
Demographics
As of the 2010 census, the population of Fort Atkinson was 12,368. The racial makeup of the city was 94.2% White, 1.2% African American, 0.4% Native American, 1.2% Asian, 0.1% Pacific Islander, 1.7% from other races, and 1.2% from two or more races. Hispanic or Latino of any race were 4.2% of the population.
The median income for a household in the city was $45,945, and the median income for a family was $54,945. The per capita income for the city was $22,845. About 8.2% of families and 10.2% of the population were below the poverty line, including 14.2% of those under age 18 and 6.2% of those age 65 or over.
Common Questions
What is Per Capita Income in Fort Atkinson?
Per Capita income in Fort Atkinson is $35,850.
What is the Median Family Income in Fort Atkinson?
Median Family Income in Fort Atkinson is $89,741.
What is the Median Household income in Fort Atkinson?
Median Household Income in Fort Atkinson is $72,215.
What is Income or Wage Gap in Fort Atkinson?
Income or Wage Gap in Fort Atkinson is 25.6%.
Women in Fort Atkinson earn 74.4 cents for every dollar earned by a man.
What is Inequality or Gini Index in Fort Atkinson?
Inequality or Gini Index in Fort Atkinson is 0.37.
What is the Total Population of Fort Atkinson?
Total Population of Fort Atkinson is 12,522.
What is the Total Male Population of Fort Atkinson?
Total Male Population of Fort Atkinson is 6,188.
What is the Total Female Population of Fort Atkinson?
Total Female Population of Fort Atkinson is 6,334.
What is the Ratio of Males per 100 Females in Fort Atkinson?
There are 97.69 Males per 100 Females in Fort Atkinson.
What is the Ratio of Females per 100 Males in Fort Atkinson?
There are 102.36 Females per 100 Males in Fort Atkinson.
What is the Median Population Age in Fort Atkinson?
Median Population Age in Fort Atkinson is 42.0 Years.
What is the Average Family Size in Fort Atkinson
Average Family Size in Fort Atkinson is 2.9 People.
What is the Average Household Size in Fort Atkinson
Average Household Size in Fort Atkinson is 2.3 People.
How Large is the Labor Force in Fort Atkinson?
There are 7,534 People in the Labor Forcein in Fort Atkinson.
What is the Percentage of People in the Labor Force in Fort Atkinson?
71.4% of People are in the Labor Force in Fort Atkinson.
What is the Unemployment Rate in Fort Atkinson?
Unemployment Rate in Fort Atkinson is 3.1%.