Florence, WI Map & Demographics
Florence Map
Florence Overview
$20,690
PER CAPITA INCOME
$37,750
AVG FAMILY INCOME
$30,500
AVG HOUSEHOLD INCOME
24.7%
WAGE / INCOME GAP [ % ]
75.3¢/ $1
WAGE / INCOME GAP [ $ ]
0.42
INEQUALITY / GINI INDEX
477
TOTAL POPULATION
238
MALE POPULATION
239
FEMALE POPULATION
99.58
MALES / 100 FEMALES
100.42
FEMALES / 100 MALES
57.5
MEDIAN AGE
2.4
AVG FAMILY SIZE
1.7
AVG HOUSEHOLD SIZE
163
LABOR FORCE [ PEOPLE ]
40.8%
PERCENT IN LABOR FORCE
16.6%
UNEMPLOYMENT RATE
Florence Zip Codes
Florence Area Codes
Income in Florence
Income Overview in Florence
Per Capita Income in Florence is $20,690, while median incomes of families and households are $37,750 and $30,500 respectively.
| Characteristic | Number | Measure |
| Per Capita Income | 477 | $20,690 |
| Median Family Income | 104 | $37,750 |
| Mean Family Income | 104 | $50,620 |
| Median Household Income | 240 | $30,500 |
| Mean Household Income | 240 | $36,569 |
| Income Deficit | 104 | $0 |
| Wage / Income Gap (%) | 477 | 24.72% |
| Wage / Income Gap ($) | 477 | 75.28¢ per $1 |
| Gini / Inequality Index | 477 | 0.42 |
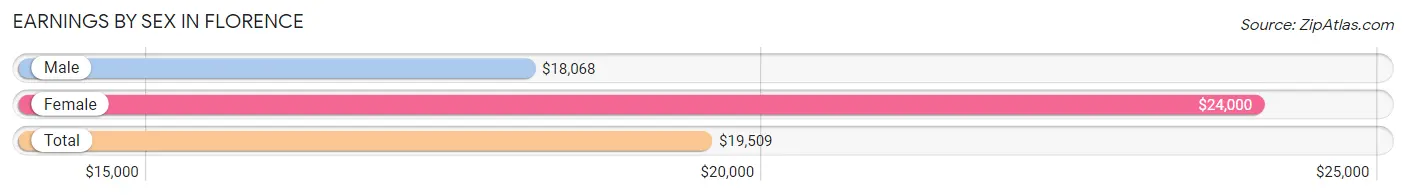
Earnings by Sex in Florence
Average Earnings in Florence are $19,509, $18,068 for men and $24,000 for women, a difference of 24.7%.
| Sex | Number | Average Earnings |
| Male | 103 (56.3%) | $18,068 |
| Female | 80 (43.7%) | $24,000 |
| Total | 183 (100.0%) | $19,509 |
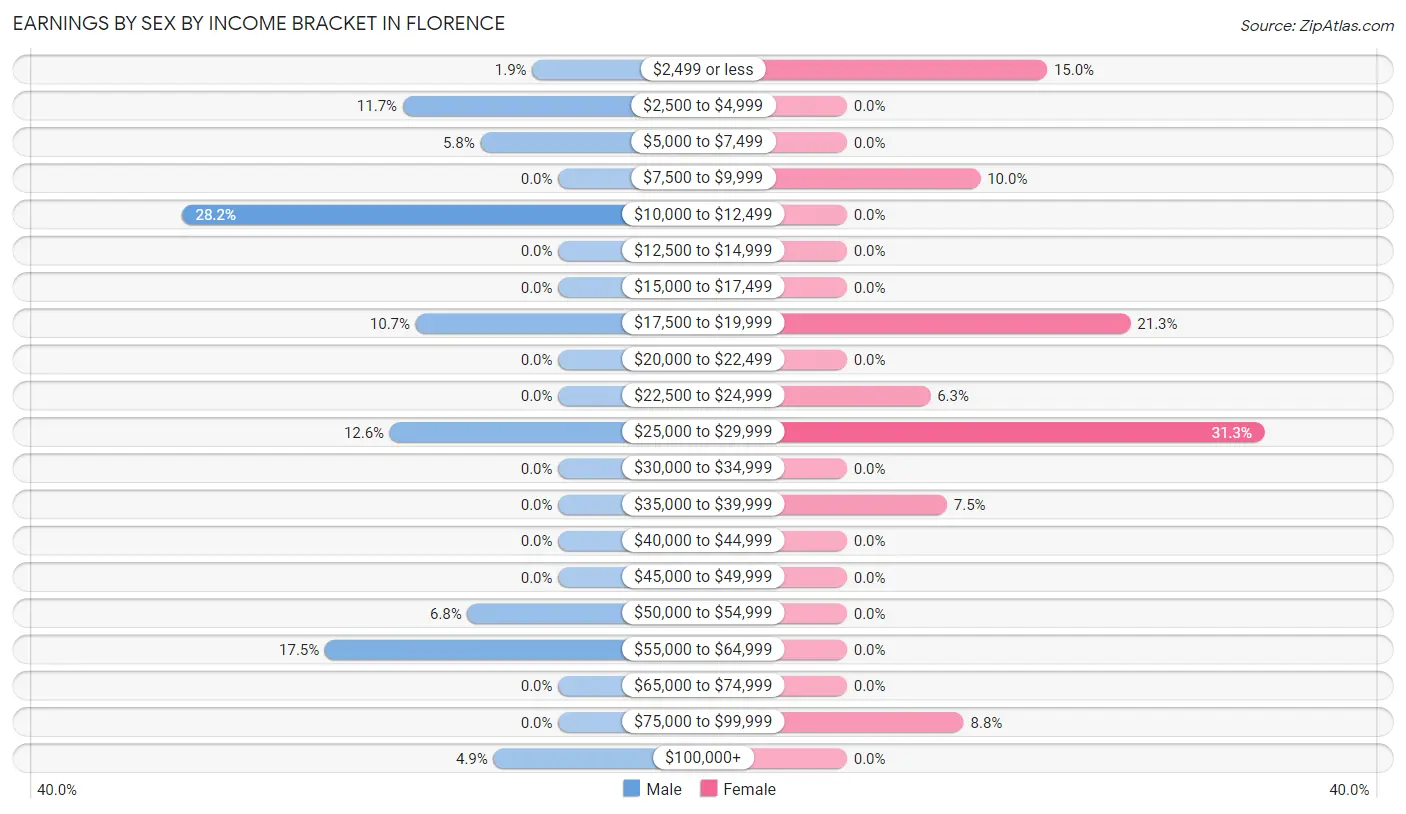
Earnings by Sex by Income Bracket in Florence
The most common earnings brackets in Florence are $10,000 to $12,499 for men (29 | 28.2%) and $25,000 to $29,999 for women (25 | 31.2%).
| Income | Male | Female |
| $2,499 or less | 2 (1.9%) | 12 (15.0%) |
| $2,500 to $4,999 | 12 (11.7%) | 0 (0.0%) |
| $5,000 to $7,499 | 6 (5.8%) | 0 (0.0%) |
| $7,500 to $9,999 | 0 (0.0%) | 8 (10.0%) |
| $10,000 to $12,499 | 29 (28.2%) | 0 (0.0%) |
| $12,500 to $14,999 | 0 (0.0%) | 0 (0.0%) |
| $15,000 to $17,499 | 0 (0.0%) | 0 (0.0%) |
| $17,500 to $19,999 | 11 (10.7%) | 17 (21.2%) |
| $20,000 to $22,499 | 0 (0.0%) | 0 (0.0%) |
| $22,500 to $24,999 | 0 (0.0%) | 5 (6.2%) |
| $25,000 to $29,999 | 13 (12.6%) | 25 (31.2%) |
| $30,000 to $34,999 | 0 (0.0%) | 0 (0.0%) |
| $35,000 to $39,999 | 0 (0.0%) | 6 (7.5%) |
| $40,000 to $44,999 | 0 (0.0%) | 0 (0.0%) |
| $45,000 to $49,999 | 0 (0.0%) | 0 (0.0%) |
| $50,000 to $54,999 | 7 (6.8%) | 0 (0.0%) |
| $55,000 to $64,999 | 18 (17.5%) | 0 (0.0%) |
| $65,000 to $74,999 | 0 (0.0%) | 0 (0.0%) |
| $75,000 to $99,999 | 0 (0.0%) | 7 (8.7%) |
| $100,000+ | 5 (4.9%) | 0 (0.0%) |
| Total | 103 (100.0%) | 80 (100.0%) |
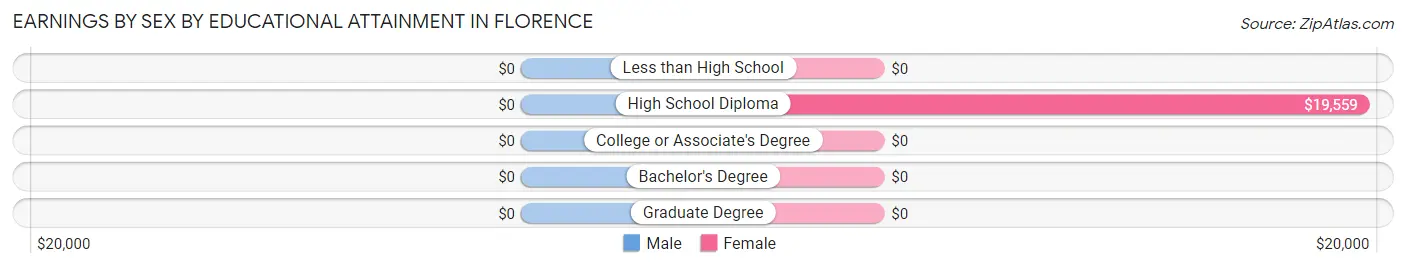
Earnings by Sex by Educational Attainment in Florence
| Educational Attainment | Male Income | Female Income |
| Less than High School | - | - |
| High School Diploma | - | - |
| College or Associate's Degree | - | - |
| Bachelor's Degree | - | - |
| Graduate Degree | - | - |
| Total | $18,295 | $24,000 |
Family Income in Florence
Family Income Brackets in Florence
According to the Florence family income data, there are 30 families falling into the $25,000 to $34,999 income range, which is the most common income bracket and makes up 28.8% of all families.
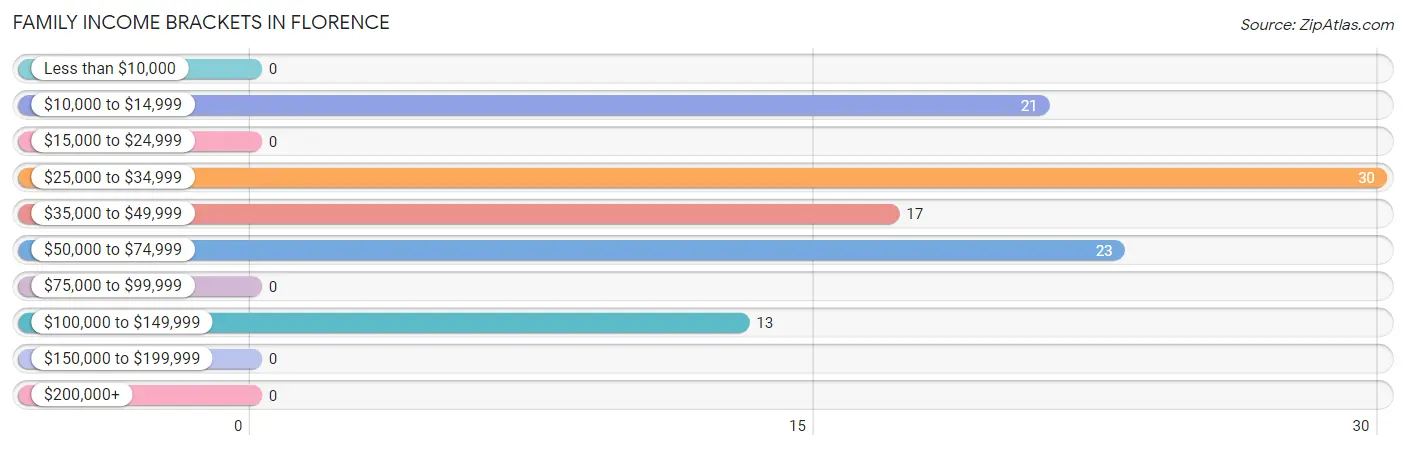
| Income Bracket | # Families | % Families |
| Less than $10,000 | 0 | 0.0% |
| $10,000 to $14,999 | 21 | 20.2% |
| $15,000 to $24,999 | 0 | 0.0% |
| $25,000 to $34,999 | 30 | 28.8% |
| $35,000 to $49,999 | 17 | 16.3% |
| $50,000 to $74,999 | 23 | 22.1% |
| $75,000 to $99,999 | 0 | 0.0% |
| $100,000 to $149,999 | 13 | 12.5% |
| $150,000 to $199,999 | 0 | 0.0% |
| $200,000+ | 0 | 0.0% |
Family Income by Famaliy Size in Florence
2-person families (74 | 71.2%) account for the highest median family income in Florence with $34,100 per family, while 2-person families (74 | 71.2%) have the highest median income of $17,050 per family member.
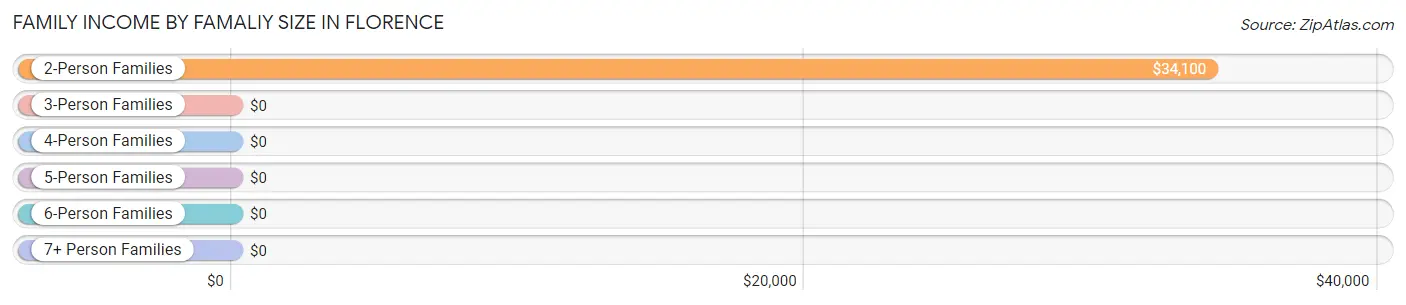
| Income Bracket | # Families | Median Income |
| 2-Person Families | 74 (71.2%) | $34,100 |
| 3-Person Families | 0 (0.0%) | $0 |
| 4-Person Families | 25 (24.0%) | $0 |
| 5-Person Families | 5 (4.8%) | $0 |
| 6-Person Families | 0 (0.0%) | $0 |
| 7+ Person Families | 0 (0.0%) | $0 |
| Total | 104 (100.0%) | $37,750 |
Family Income by Number of Earners in Florence
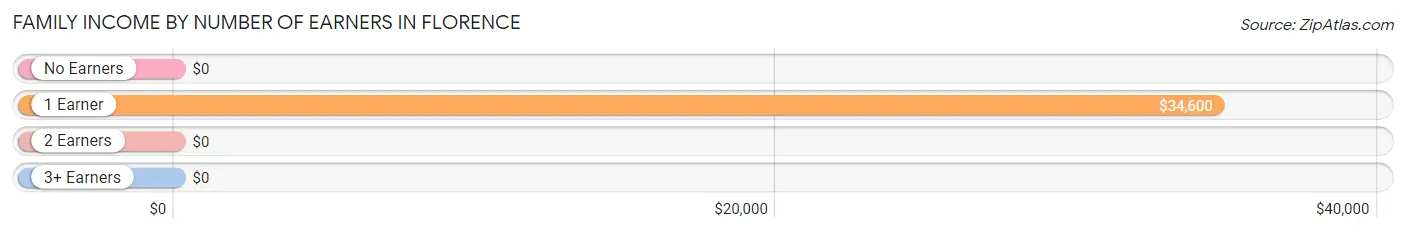
| Number of Earners | # Families | Median Income |
| No Earners | 6 (5.8%) | $0 |
| 1 Earner | 78 (75.0%) | $34,600 |
| 2 Earners | 20 (19.2%) | $0 |
| 3+ Earners | 0 (0.0%) | $0 |
| Total | 104 (100.0%) | $37,750 |
Household Income in Florence
Household Income Brackets in Florence
With 74 households falling in the category, the $10,000 to $14,999 income range is the most frequent in Florence, accounting for 30.8% of all households.
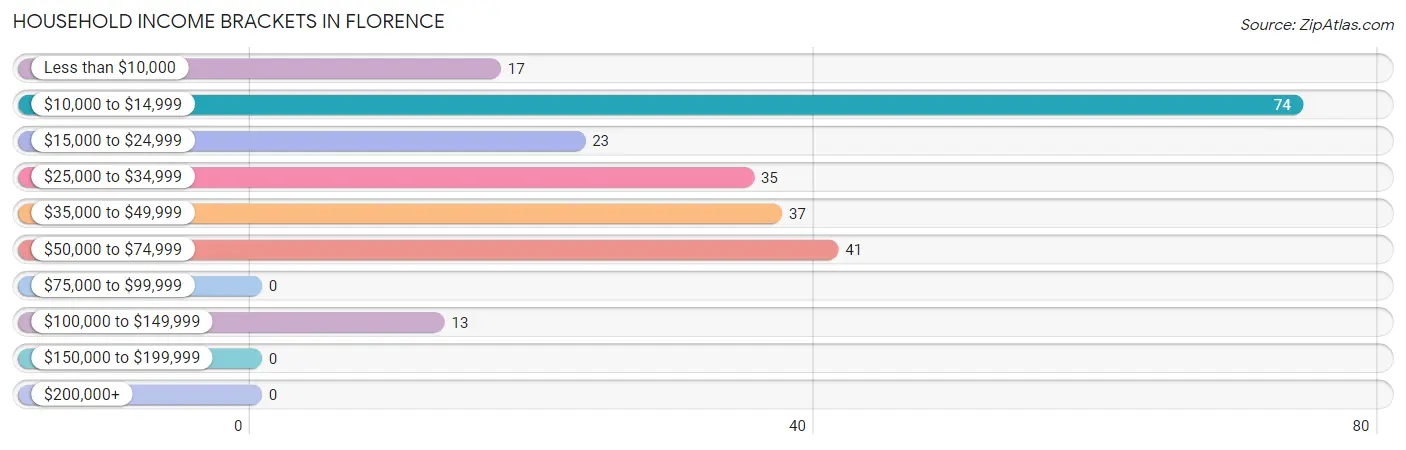
| Income Bracket | # Households | % Households |
| Less than $10,000 | 17 | 7.1% |
| $10,000 to $14,999 | 74 | 30.8% |
| $15,000 to $24,999 | 23 | 9.6% |
| $25,000 to $34,999 | 35 | 14.6% |
| $35,000 to $49,999 | 37 | 15.4% |
| $50,000 to $74,999 | 41 | 17.1% |
| $75,000 to $99,999 | 0 | 0.0% |
| $100,000 to $149,999 | 13 | 5.4% |
| $150,000 to $199,999 | 0 | 0.0% |
| $200,000+ | 0 | 0.0% |
Household Income by Householder Age in Florence
The median household income in Florence is $30,500, with the highest median household income of $70,625 found in the 25 to 44 years age bracket for the primary householder. A total of 41 households (17.1%) fall into this category.
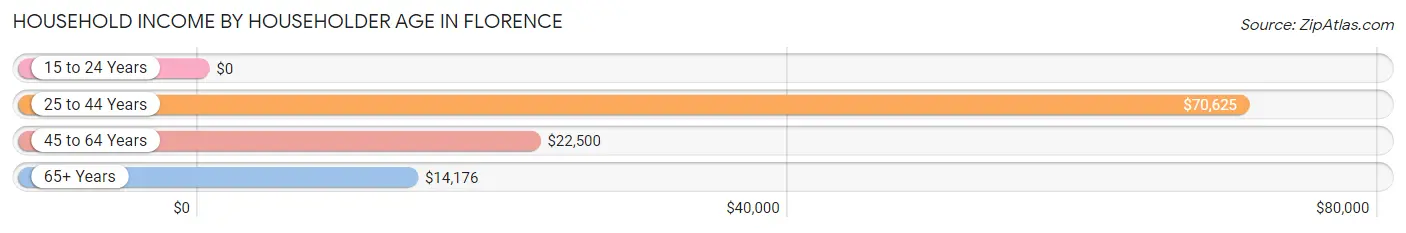
| Income Bracket | # Households | Median Income |
| 15 to 24 Years | 0 (0.0%) | $0 |
| 25 to 44 Years | 41 (17.1%) | $70,625 |
| 45 to 64 Years | 128 (53.3%) | $22,500 |
| 65+ Years | 71 (29.6%) | $14,176 |
| Total | 240 (100.0%) | $30,500 |
Poverty in Florence
Income Below Poverty by Sex and Age in Florence
With 27.1% poverty level for males and 49.3% for females among the residents of Florence, 16 and 17 year old males and 12 to 14 year old females are the most vulnerable to poverty, with 5 males (100.0%) and 3 females (100.0%) in their respective age groups living below the poverty level.
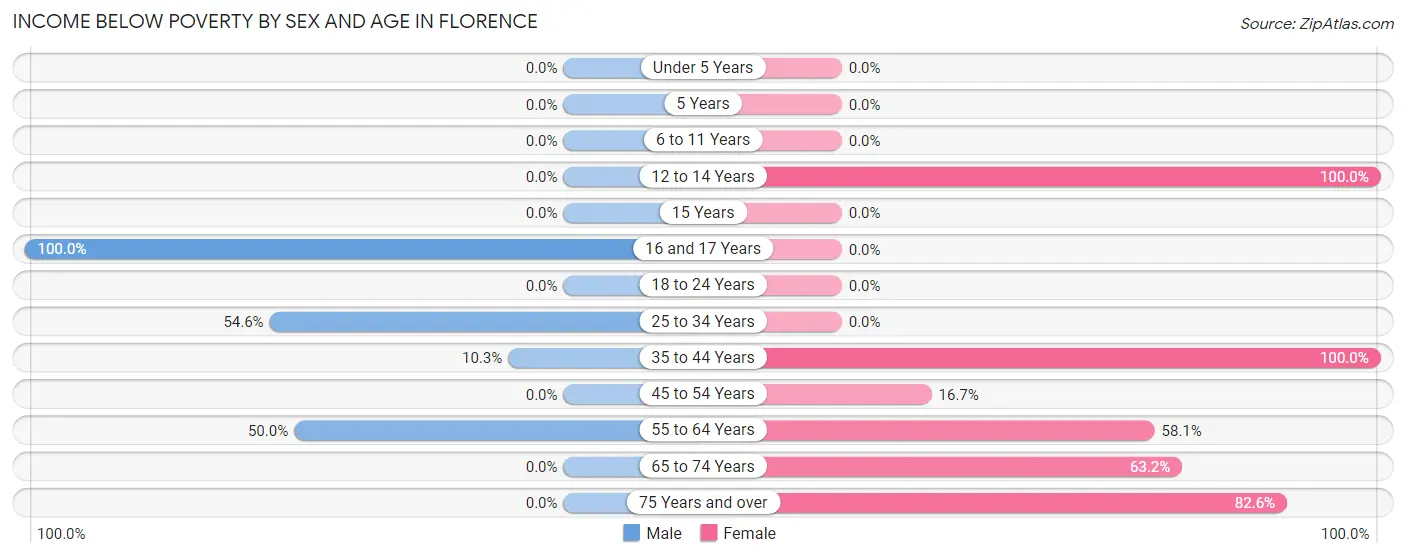
| Age Bracket | Male | Female |
| Under 5 Years | 0 (0.0%) | 0 (0.0%) |
| 5 Years | 0 (0.0%) | 0 (0.0%) |
| 6 to 11 Years | 0 (0.0%) | 0 (0.0%) |
| 12 to 14 Years | 0 (0.0%) | 3 (100.0%) |
| 15 Years | 0 (0.0%) | 0 (0.0%) |
| 16 and 17 Years | 5 (100.0%) | 0 (0.0%) |
| 18 to 24 Years | 0 (0.0%) | 0 (0.0%) |
| 25 to 34 Years | 12 (54.5%) | 0 (0.0%) |
| 35 to 44 Years | 4 (10.3%) | 10 (100.0%) |
| 45 to 54 Years | 0 (0.0%) | 5 (16.7%) |
| 55 to 64 Years | 35 (50.0%) | 36 (58.1%) |
| 65 to 74 Years | 0 (0.0%) | 12 (63.2%) |
| 75 Years and over | 0 (0.0%) | 38 (82.6%) |
| Total | 56 (27.1%) | 104 (49.3%) |
Income Above Poverty by Sex and Age in Florence
According to the poverty statistics in Florence, males aged under 5 years and females aged under 5 years are the age groups that are most secure financially, with 100.0% of males and 100.0% of females in these age groups living above the poverty line.
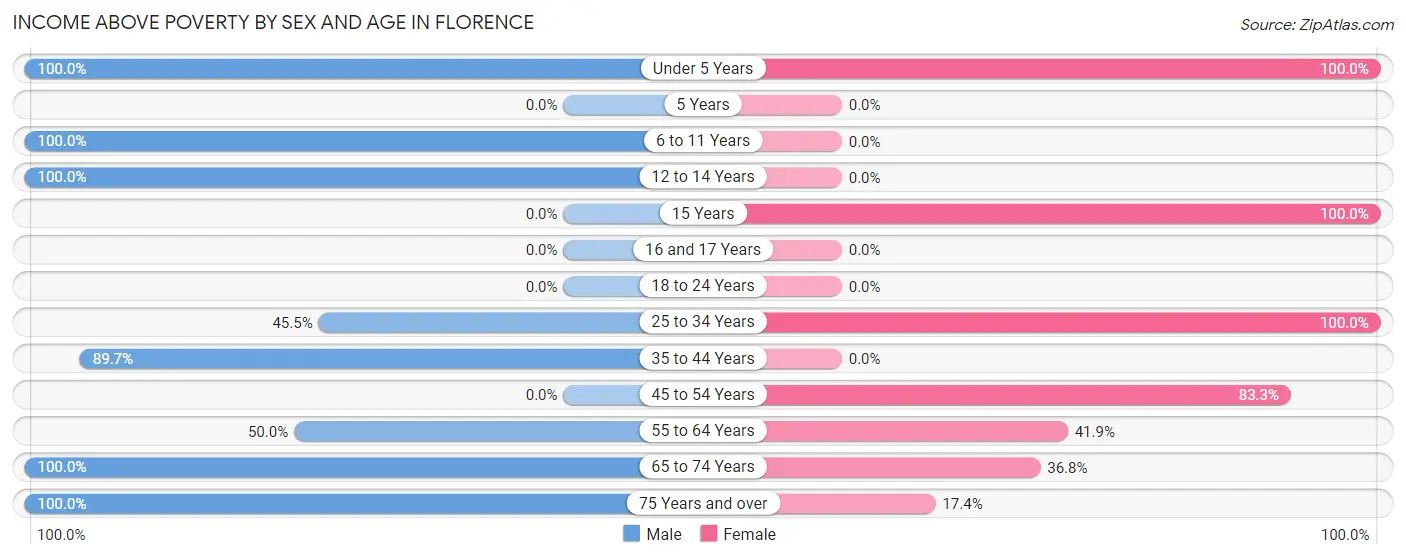
| Age Bracket | Male | Female |
| Under 5 Years | 5 (100.0%) | 8 (100.0%) |
| 5 Years | 0 (0.0%) | 0 (0.0%) |
| 6 to 11 Years | 13 (100.0%) | 0 (0.0%) |
| 12 to 14 Years | 28 (100.0%) | 0 (0.0%) |
| 15 Years | 0 (0.0%) | 20 (100.0%) |
| 16 and 17 Years | 0 (0.0%) | 0 (0.0%) |
| 18 to 24 Years | 0 (0.0%) | 0 (0.0%) |
| 25 to 34 Years | 10 (45.5%) | 13 (100.0%) |
| 35 to 44 Years | 35 (89.7%) | 0 (0.0%) |
| 45 to 54 Years | 0 (0.0%) | 25 (83.3%) |
| 55 to 64 Years | 35 (50.0%) | 26 (41.9%) |
| 65 to 74 Years | 10 (100.0%) | 7 (36.8%) |
| 75 Years and over | 15 (100.0%) | 8 (17.4%) |
| Total | 151 (73.0%) | 107 (50.7%) |
Income Below Poverty Among Married-Couple Families in Florence
The poverty statistics for married-couple families in Florence show that 41.9% or 18 of the total 43 families live below the poverty line. Families with 3 or 4 children have the highest poverty rate of 100.0%, comprising of 5 families. On the other hand, families with 1 or 2 children have the lowest poverty rate of 0.0%, which includes 0 families.
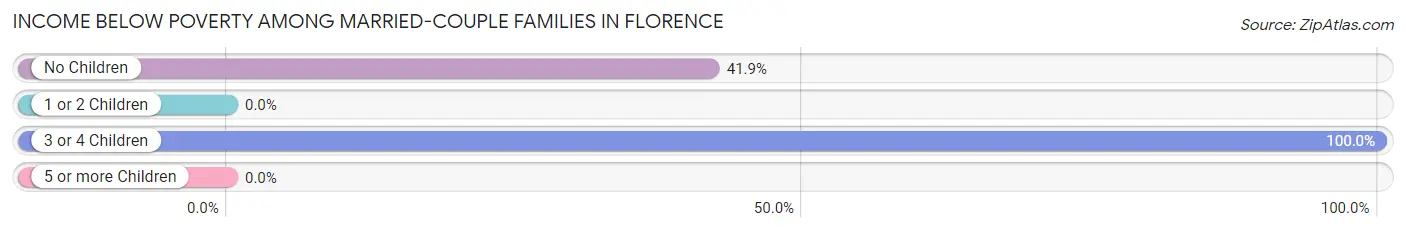
| Children | Above Poverty | Below Poverty |
| No Children | 18 (58.1%) | 13 (41.9%) |
| 1 or 2 Children | 7 (100.0%) | 0 (0.0%) |
| 3 or 4 Children | 0 (0.0%) | 5 (100.0%) |
| 5 or more Children | 0 (0.0%) | 0 (0.0%) |
| Total | 25 (58.1%) | 18 (41.9%) |
Income Below Poverty Among Single-Parent Households in Florence
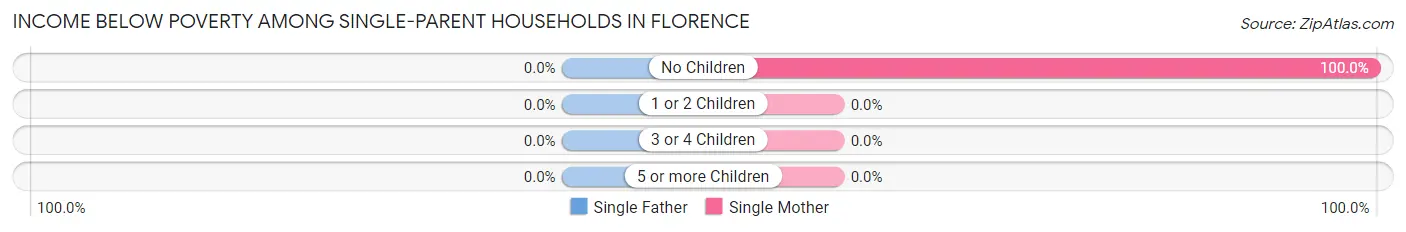
| Children | Single Father | Single Mother |
| No Children | 0 (0.0%) | 8 (100.0%) |
| 1 or 2 Children | 0 (0.0%) | 0 (0.0%) |
| 3 or 4 Children | 0 (0.0%) | 0 (0.0%) |
| 5 or more Children | 0 (0.0%) | 0 (0.0%) |
| Total | 0 (0.0%) | 8 (24.2%) |
Income Below Poverty Among Married-Couple vs Single-Parent Households in Florence
The poverty data for Florence shows that 18 of the married-couple family households (41.9%) and 8 of the single-parent households (13.1%) are living below the poverty level. Within the married-couple family households, those with 3 or 4 children have the highest poverty rate, with 5 households (100.0%) falling below the poverty line. Among the single-parent households, those with no children have the highest poverty rate, with 8 household (44.4%) living below poverty.
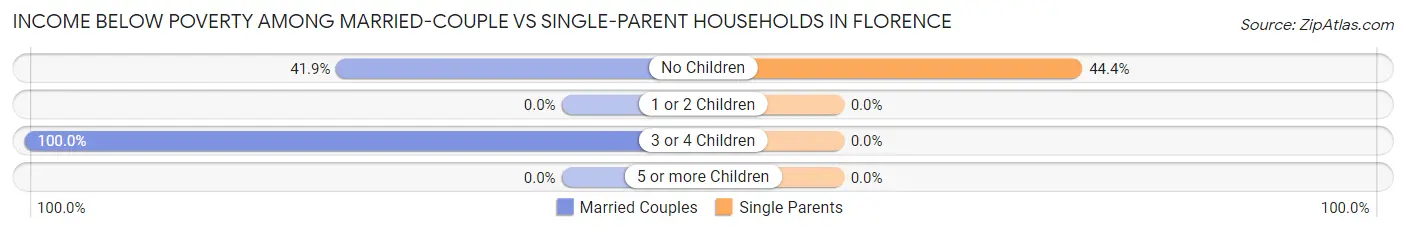
| Children | Married-Couple Families | Single-Parent Households |
| No Children | 13 (41.9%) | 8 (44.4%) |
| 1 or 2 Children | 0 (0.0%) | 0 (0.0%) |
| 3 or 4 Children | 5 (100.0%) | 0 (0.0%) |
| 5 or more Children | 0 (0.0%) | 0 (0.0%) |
| Total | 18 (41.9%) | 8 (13.1%) |
Race in Florence
The most populous races in Florence are White / Caucasian (466 | 97.7%), Black / African American (8 | 1.7%), and Hispanic or Latino (7 | 1.5%).
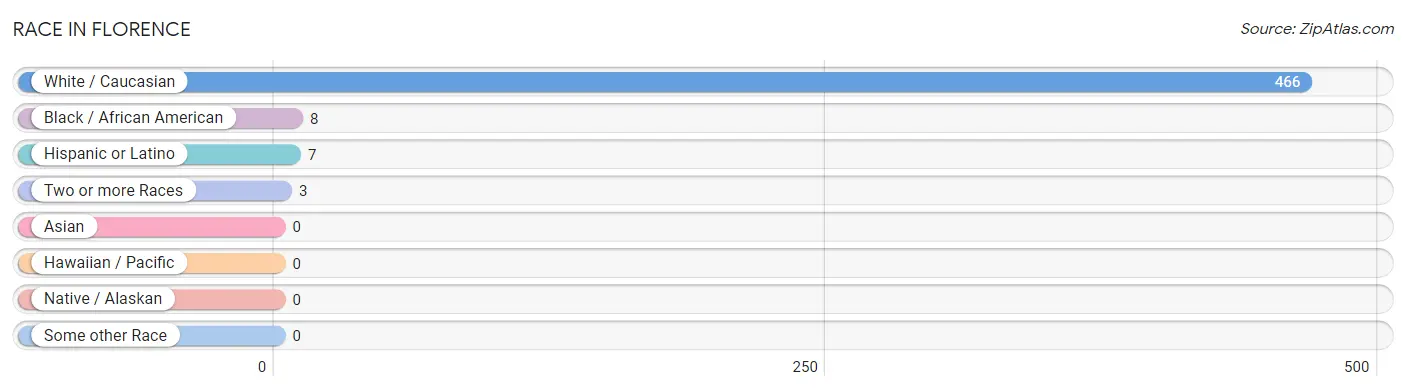
| Race | # Population | % Population |
| Asian | 0 | 0.0% |
| Black / African American | 8 | 1.7% |
| Hawaiian / Pacific | 0 | 0.0% |
| Hispanic or Latino | 7 | 1.5% |
| Native / Alaskan | 0 | 0.0% |
| White / Caucasian | 466 | 97.7% |
| Two or more Races | 3 | 0.6% |
| Some other Race | 0 | 0.0% |
| Total | 477 | 100.0% |
Ancestry in Florence
The most populous ancestries reported in Florence are German (131 | 27.5%), Irish (57 | 11.9%), Polish (25 | 5.2%), Scottish (24 | 5.0%), and French (22 | 4.6%), together accounting for 54.3% of all Florence residents.
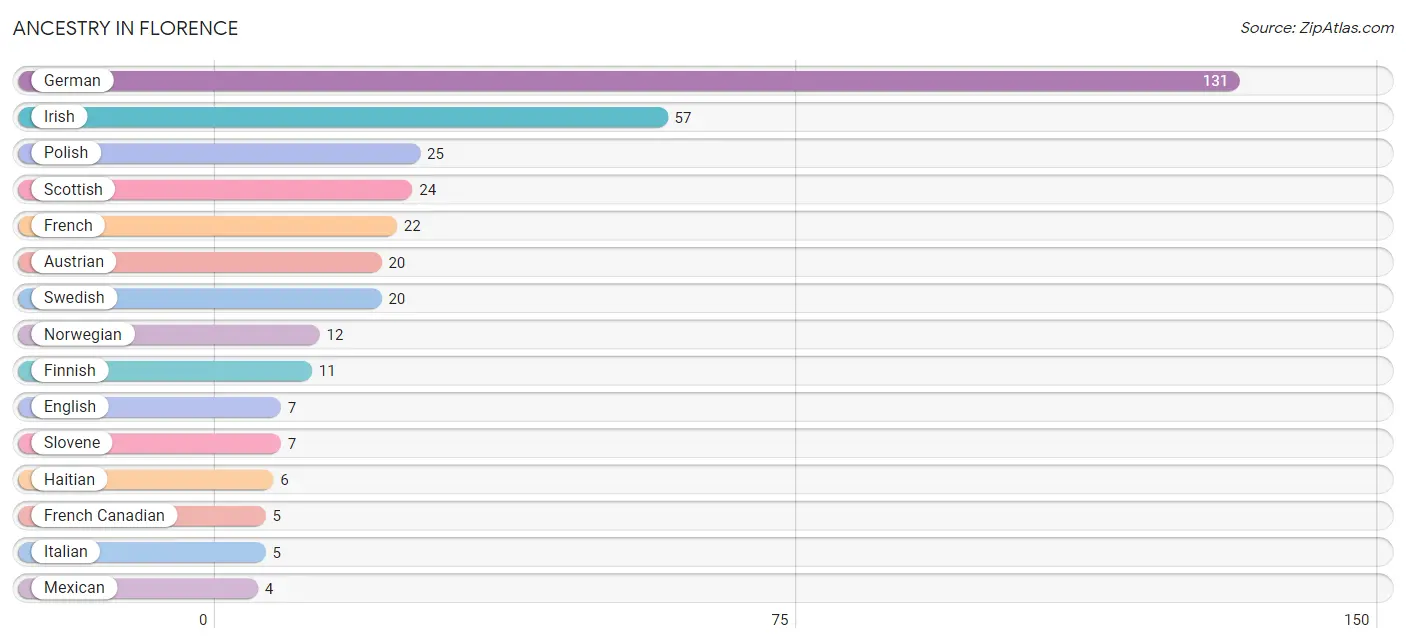
| Ancestry | # Population | % Population |
| Austrian | 20 | 4.2% |
| Danish | 3 | 0.6% |
| Dominican | 3 | 0.6% |
| English | 7 | 1.5% |
| Finnish | 11 | 2.3% |
| French | 22 | 4.6% |
| French Canadian | 5 | 1.1% |
| German | 131 | 27.5% |
| Haitian | 6 | 1.3% |
| Irish | 57 | 11.9% |
| Italian | 5 | 1.1% |
| Mexican | 4 | 0.8% |
| Norwegian | 12 | 2.5% |
| Polish | 25 | 5.2% |
| Scottish | 24 | 5.0% |
| Slovene | 7 | 1.5% |
| Swedish | 20 | 4.2% | View All 17 Rows |
Immigrants in Florence
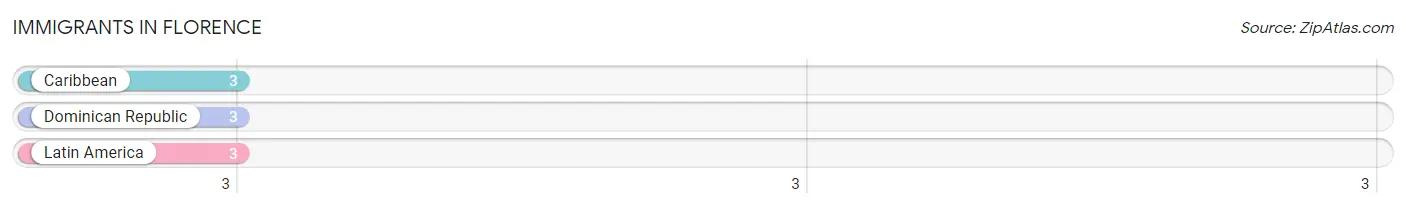
The most numerous immigrant groups reported in Florence came from Caribbean (3 | 0.6%), Dominican Republic (3 | 0.6%), and Latin America (3 | 0.6%), together accounting for 1.9% of all Florence residents.
| Immigration Origin | # Population | % Population |
| Caribbean | 3 | 0.6% |
| Dominican Republic | 3 | 0.6% |
| Latin America | 3 | 0.6% | View All 3 Rows |
Sex and Age in Florence
Sex and Age in Florence
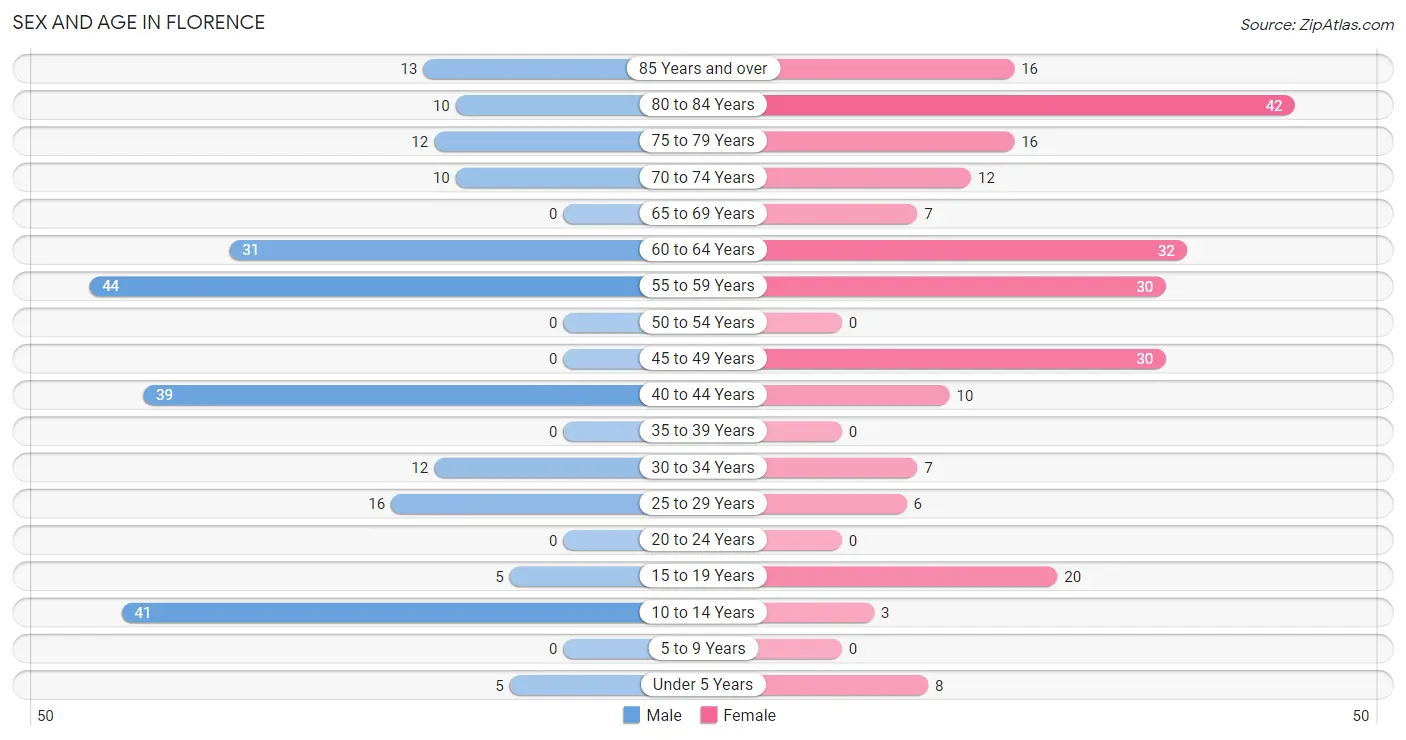
The most populous age groups in Florence are 55 to 59 Years (44 | 18.5%) for men and 80 to 84 Years (42 | 17.6%) for women.
| Age Bracket | Male | Female |
| Under 5 Years | 5 (2.1%) | 8 (3.4%) |
| 5 to 9 Years | 0 (0.0%) | 0 (0.0%) |
| 10 to 14 Years | 41 (17.2%) | 3 (1.3%) |
| 15 to 19 Years | 5 (2.1%) | 20 (8.4%) |
| 20 to 24 Years | 0 (0.0%) | 0 (0.0%) |
| 25 to 29 Years | 16 (6.7%) | 6 (2.5%) |
| 30 to 34 Years | 12 (5.0%) | 7 (2.9%) |
| 35 to 39 Years | 0 (0.0%) | 0 (0.0%) |
| 40 to 44 Years | 39 (16.4%) | 10 (4.2%) |
| 45 to 49 Years | 0 (0.0%) | 30 (12.6%) |
| 50 to 54 Years | 0 (0.0%) | 0 (0.0%) |
| 55 to 59 Years | 44 (18.5%) | 30 (12.6%) |
| 60 to 64 Years | 31 (13.0%) | 32 (13.4%) |
| 65 to 69 Years | 0 (0.0%) | 7 (2.9%) |
| 70 to 74 Years | 10 (4.2%) | 12 (5.0%) |
| 75 to 79 Years | 12 (5.0%) | 16 (6.7%) |
| 80 to 84 Years | 10 (4.2%) | 42 (17.6%) |
| 85 Years and over | 13 (5.5%) | 16 (6.7%) |
| Total | 238 (100.0%) | 239 (100.0%) |
Families and Households in Florence
Median Family Size in Florence
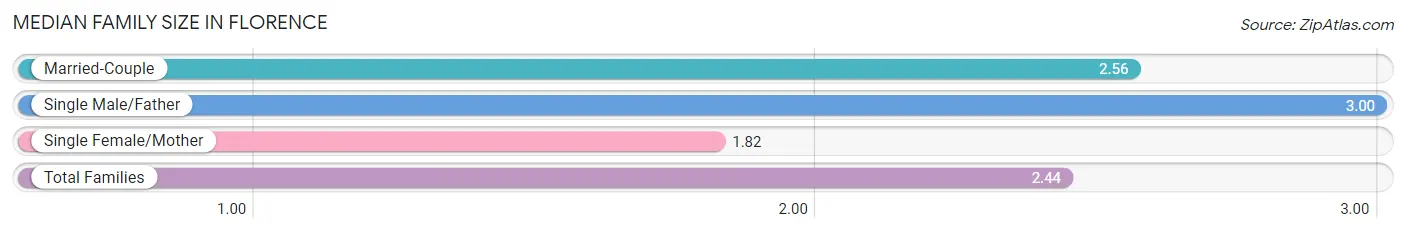
The median family size in Florence is 2.44 persons per family, with single male/father families (28 | 26.9%) accounting for the largest median family size of 3 persons per family. On the other hand, single female/mother families (33 | 31.7%) represent the smallest median family size with 1.82 persons per family.
| Family Type | # Families | Family Size |
| Married-Couple | 43 (41.3%) | 2.56 |
| Single Male/Father | 28 (26.9%) | 3.00 |
| Single Female/Mother | 33 (31.7%) | 1.82 |
| Total Families | 104 (100.0%) | 2.44 |
Median Household Size in Florence
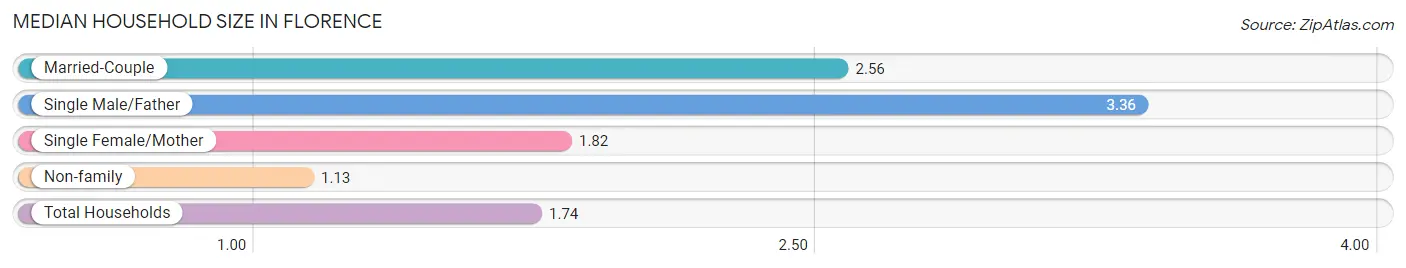
The median household size in Florence is 1.74 persons per household, with single male/father households (28 | 11.7%) accounting for the largest median household size of 3.36 persons per household. non-family households (136 | 56.7%) represent the smallest median household size with 1.13 persons per household.
| Household Type | # Households | Household Size |
| Married-Couple | 43 (17.9%) | 2.56 |
| Single Male/Father | 28 (11.7%) | 3.36 |
| Single Female/Mother | 33 (13.8%) | 1.82 |
| Non-family | 136 (56.7%) | 1.13 |
| Total Households | 240 (100.0%) | 1.74 |
Household Size by Marriage Status in Florence
Out of a total of 240 households in Florence, 104 (43.3%) are family households, while 136 (56.7%) are nonfamily households. The most numerous type of family households are 2-person households, comprising 64, and the most common type of nonfamily households are 1-person households, comprising 112.
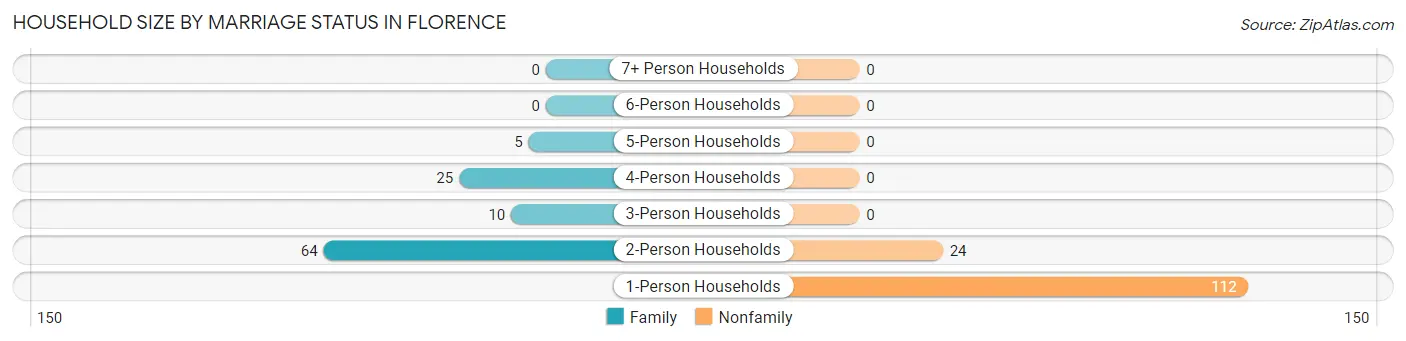
| Household Size | Family Households | Nonfamily Households |
| 1-Person Households | - | 112 (46.7%) |
| 2-Person Households | 64 (26.7%) | 24 (10.0%) |
| 3-Person Households | 10 (4.2%) | 0 (0.0%) |
| 4-Person Households | 25 (10.4%) | 0 (0.0%) |
| 5-Person Households | 5 (2.1%) | 0 (0.0%) |
| 6-Person Households | 0 (0.0%) | 0 (0.0%) |
| 7+ Person Households | 0 (0.0%) | 0 (0.0%) |
| Total | 104 (43.3%) | 136 (56.7%) |
Female Fertility in Florence
Fertility by Age in Florence
| Age Bracket | Women with Births | Births / 1,000 Women |
| 15 to 19 years | 0 (0.0%) | 0.0 |
| 20 to 34 years | 0 (0.0%) | 0.0 |
| 35 to 50 years | 0 (0.0%) | 0.0 |
| Total | 0 (0.0%) | 0.0 |
Fertility by Age by Marriage Status in Florence
| Age Bracket | Married | Unmarried |
| 15 to 19 years | 0 (0.0%) | 0 (0.0%) |
| 20 to 34 years | 0 (0.0%) | 0 (0.0%) |
| 35 to 50 years | 0 (0.0%) | 0 (0.0%) |
| Total | 0 (0.0%) | 0 (0.0%) |
Fertility by Education in Florence
| Educational Attainment | Women with Births | Births / 1,000 Women |
| Less than High School | 0 (0.0%) | 0.0 |
| High School Diploma | 0 (0.0%) | 0.0 |
| College or Associate's Degree | 0 (0.0%) | 0.0 |
| Bachelor's Degree | 0 (0.0%) | 0.0 |
| Graduate Degree | 0 (0.0%) | 0.0 |
| Total | 0 (0.0%) | 0.0 |
Fertility by Education by Marriage Status in Florence
| Educational Attainment | Married | Unmarried |
| Less than High School | 0 (0.0%) | 0 (0.0%) |
| High School Diploma | 0 (0.0%) | 0 (0.0%) |
| College or Associate's Degree | 0 (0.0%) | 0 (0.0%) |
| Bachelor's Degree | 0 (0.0%) | 0 (0.0%) |
| Graduate Degree | 0 (0.0%) | 0 (0.0%) |
| Total | 0 (0.0%) | 0 (0.0%) |
Employment Characteristics in Florence
Employment by Class of Employer in Florence
Among the 124 employed individuals in Florence, private company employees (79 | 63.7%), self-employed (not incorporated) (25 | 20.2%), and federal government employees (14 | 11.3%) make up the most common classes of employment.
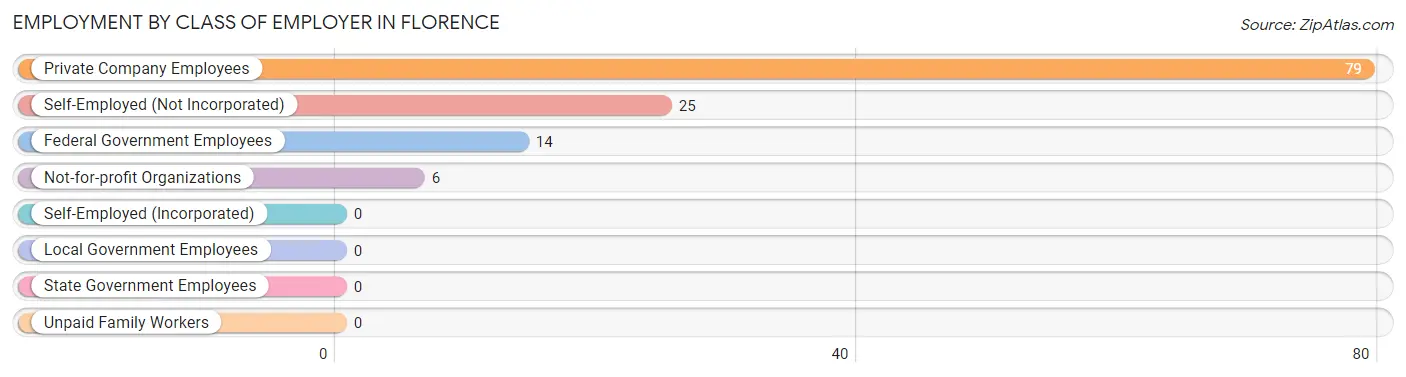
| Employer Class | # Employees | % Employees |
| Private Company Employees | 79 | 63.7% |
| Self-Employed (Incorporated) | 0 | 0.0% |
| Self-Employed (Not Incorporated) | 25 | 20.2% |
| Not-for-profit Organizations | 6 | 4.8% |
| Local Government Employees | 0 | 0.0% |
| State Government Employees | 0 | 0.0% |
| Federal Government Employees | 14 | 11.3% |
| Unpaid Family Workers | 0 | 0.0% |
| Total | 124 | 100.0% |
Employment Status by Age in Florence
According to the labor force statistics for Florence, out of the total population over 16 years of age (400), 40.8% or 163 individuals are in the labor force, with 16.6% or 27 of them unemployed. The age group with the highest labor force participation rate is 30 to 34 years, with 100.0% or 19 individuals in the labor force. Within the labor force, the 25 to 29 years age range has the highest percentage of unemployed individuals, with 62.5% or 10 of them being unemployed.
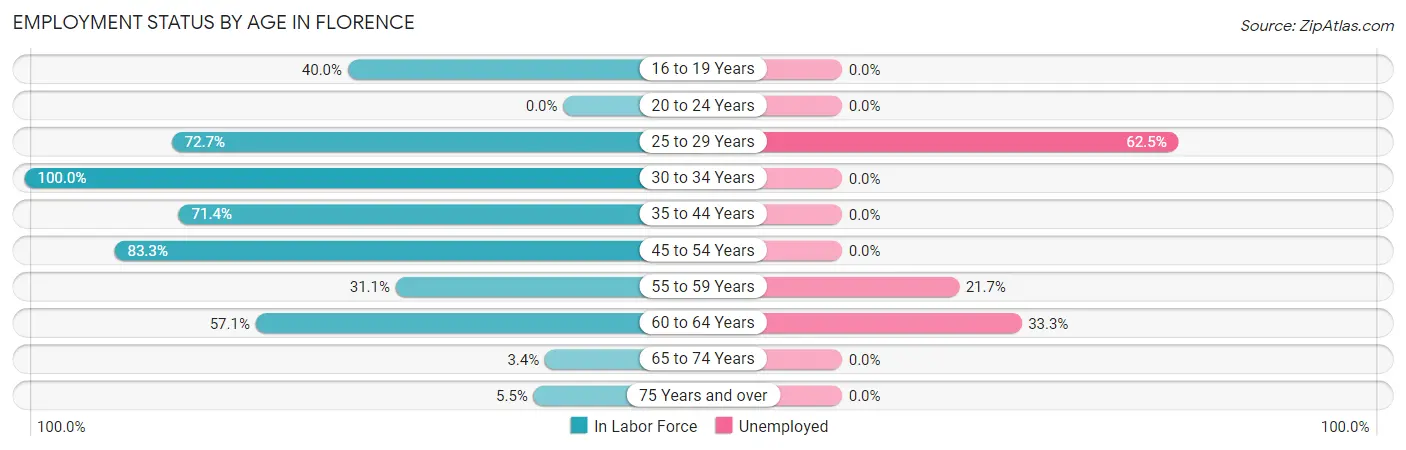
| Age Bracket | In Labor Force | Unemployed |
| 16 to 19 Years | 2 (40.0%) | 0 (0.0%) |
| 20 to 24 Years | 0 (0.0%) | 0 (0.0%) |
| 25 to 29 Years | 16 (72.7%) | 10 (62.5%) |
| 30 to 34 Years | 19 (100.0%) | 0 (0.0%) |
| 35 to 44 Years | 35 (71.4%) | 0 (0.0%) |
| 45 to 54 Years | 25 (83.3%) | 0 (0.0%) |
| 55 to 59 Years | 23 (31.1%) | 5 (21.7%) |
| 60 to 64 Years | 36 (57.1%) | 12 (33.3%) |
| 65 to 74 Years | 1 (3.4%) | 0 (0.0%) |
| 75 Years and over | 6 (5.5%) | 0 (0.0%) |
| Total | 163 (40.8%) | 27 (16.6%) |
Employment Status by Educational Attainment in Florence
According to labor force statistics for Florence, 59.9% of individuals (154) out of the total population between 25 and 64 years of age (257) are in the labor force, with 17.5% or 27 of them being unemployed. The group with the highest labor force participation rate are those with the educational attainment of college / associate degree, with 79.7% or 47 individuals in the labor force. Within the labor force, individuals with high school diploma education have the highest percentage of unemployment, with 27.3% or 15 of them being unemployed.
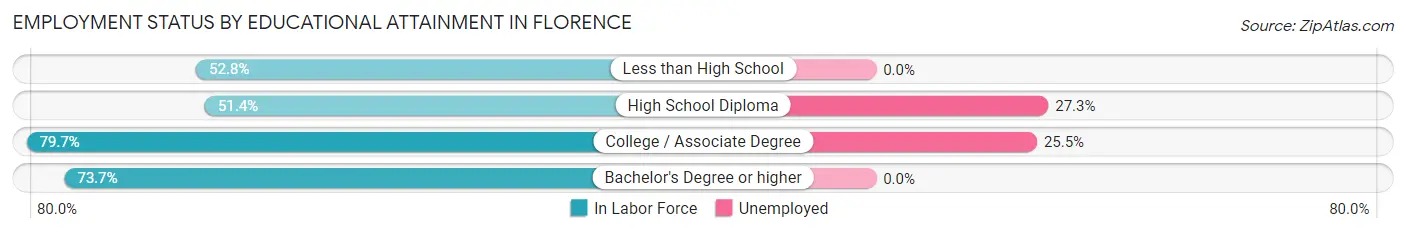
| Educational Attainment | In Labor Force | Unemployed |
| Less than High School | 38 (52.8%) | 0 (0.0%) |
| High School Diploma | 55 (51.4%) | 29 (27.3%) |
| College / Associate Degree | 47 (79.7%) | 15 (25.5%) |
| Bachelor's Degree or higher | 14 (73.7%) | 0 (0.0%) |
| Total | 154 (59.9%) | 45 (17.5%) |
Employment Occupations by Sex in Florence
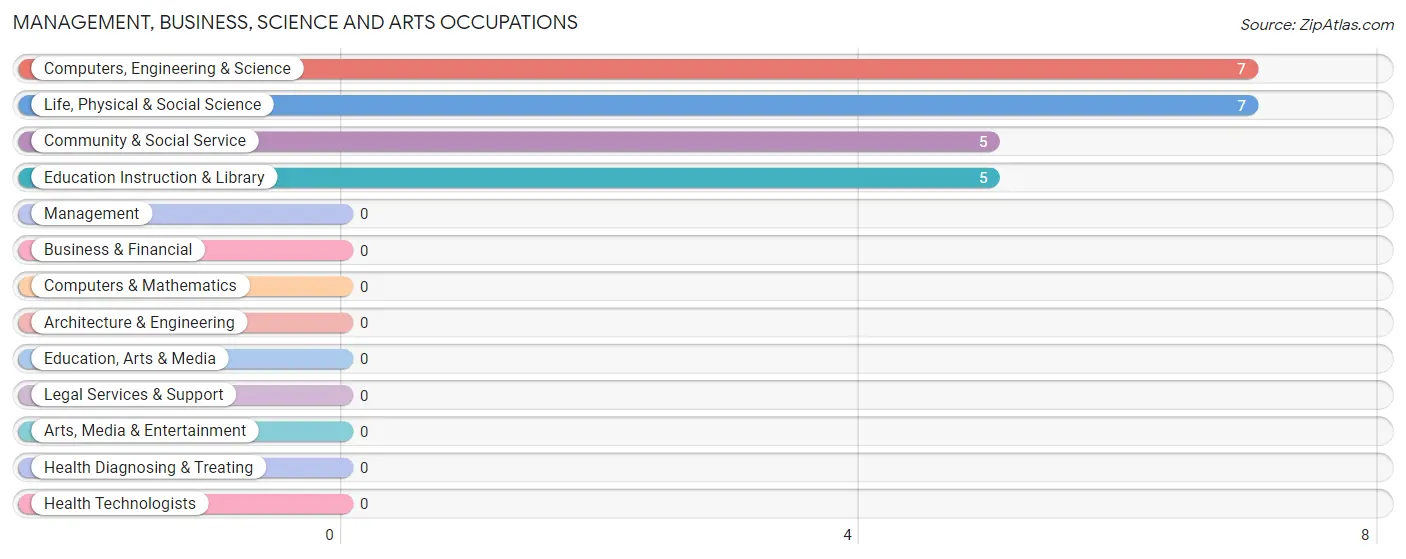
Management, Business, Science and Arts Occupations
The most common Management, Business, Science and Arts occupations in Florence are Computers, Engineering & Science (7 | 5.1%), Life, Physical & Social Science (7 | 5.1%), Community & Social Service (5 | 3.7%), and Education Instruction & Library (5 | 3.7%).
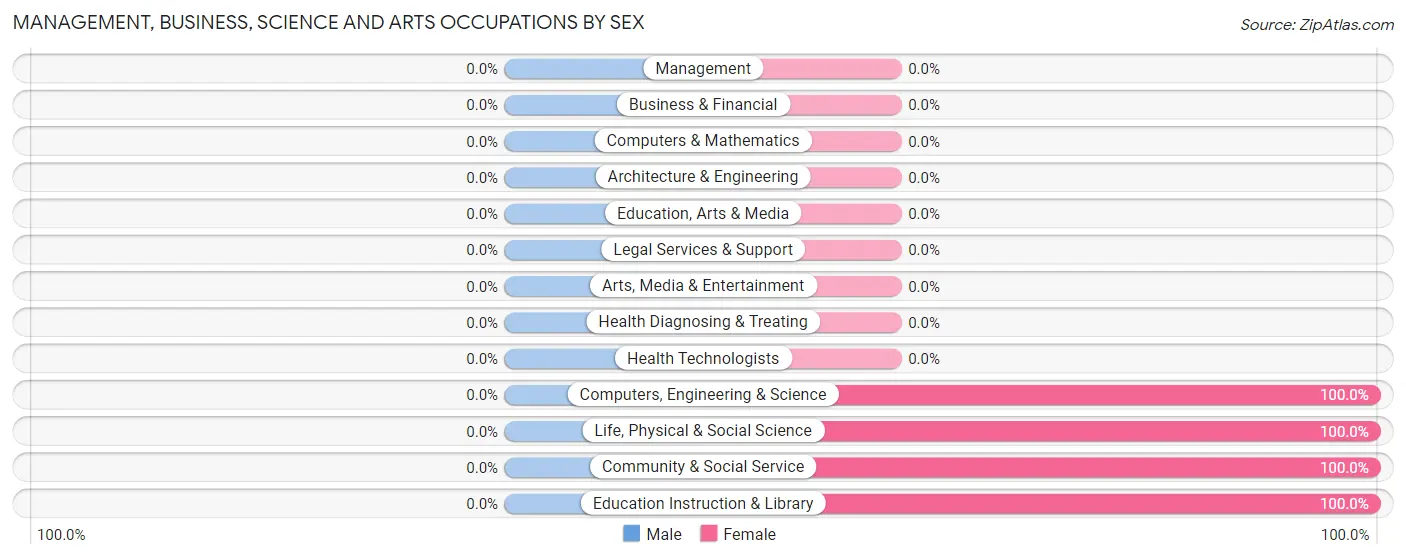
Management, Business, Science and Arts Occupations by Sex
| Occupation | Male | Female |
| Management | 0 (0.0%) | 0 (0.0%) |
| Business & Financial | 0 (0.0%) | 0 (0.0%) |
| Computers, Engineering & Science | 0 (0.0%) | 7 (100.0%) |
| Computers & Mathematics | 0 (0.0%) | 0 (0.0%) |
| Architecture & Engineering | 0 (0.0%) | 0 (0.0%) |
| Life, Physical & Social Science | 0 (0.0%) | 7 (100.0%) |
| Community & Social Service | 0 (0.0%) | 5 (100.0%) |
| Education, Arts & Media | 0 (0.0%) | 0 (0.0%) |
| Legal Services & Support | 0 (0.0%) | 0 (0.0%) |
| Education Instruction & Library | 0 (0.0%) | 5 (100.0%) |
| Arts, Media & Entertainment | 0 (0.0%) | 0 (0.0%) |
| Health Diagnosing & Treating | 0 (0.0%) | 0 (0.0%) |
| Health Technologists | 0 (0.0%) | 0 (0.0%) |
| Total (Category) | 0 (0.0%) | 12 (100.0%) |
| Total (Overall) | 84 (61.8%) | 52 (38.2%) |
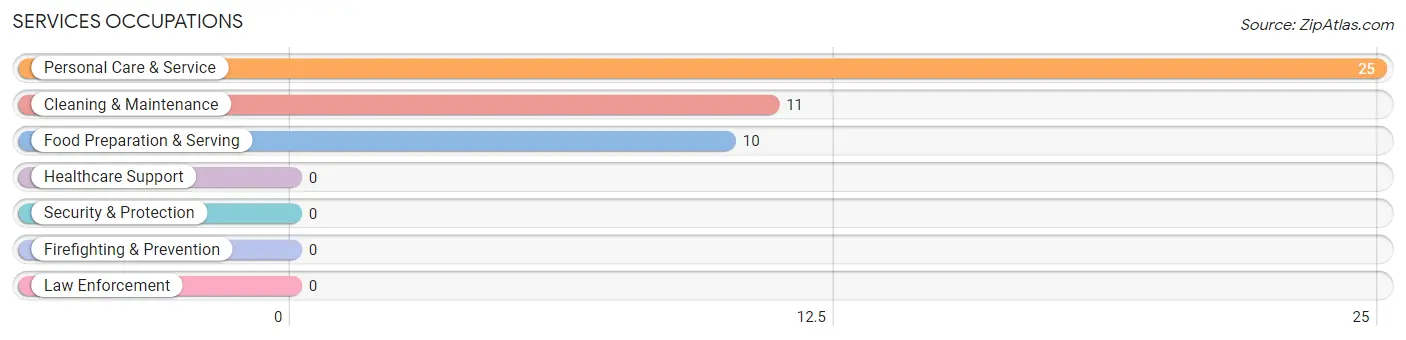
Services Occupations
The most common Services occupations in Florence are Personal Care & Service (25 | 18.4%), Cleaning & Maintenance (11 | 8.1%), and Food Preparation & Serving (10 | 7.3%).
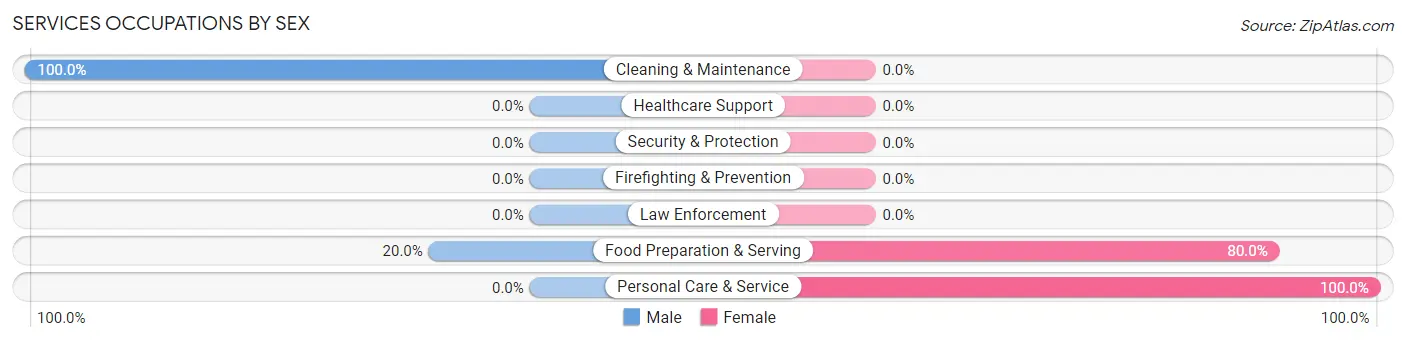
Services Occupations by Sex
Within the Services occupations in Florence, the most male-oriented occupations are Cleaning & Maintenance (100.0%), and Food Preparation & Serving (20.0%), while the most female-oriented occupations are Personal Care & Service (100.0%), and Food Preparation & Serving (80.0%).
| Occupation | Male | Female |
| Healthcare Support | 0 (0.0%) | 0 (0.0%) |
| Security & Protection | 0 (0.0%) | 0 (0.0%) |
| Firefighting & Prevention | 0 (0.0%) | 0 (0.0%) |
| Law Enforcement | 0 (0.0%) | 0 (0.0%) |
| Food Preparation & Serving | 2 (20.0%) | 8 (80.0%) |
| Cleaning & Maintenance | 11 (100.0%) | 0 (0.0%) |
| Personal Care & Service | 0 (0.0%) | 25 (100.0%) |
| Total (Category) | 13 (28.3%) | 33 (71.7%) |
| Total (Overall) | 84 (61.8%) | 52 (38.2%) |
Sales and Office Occupations
The most common Sales and Office occupations in Florence are Office & Administration (18 | 13.2%), and Sales & Related (1 | 0.7%).
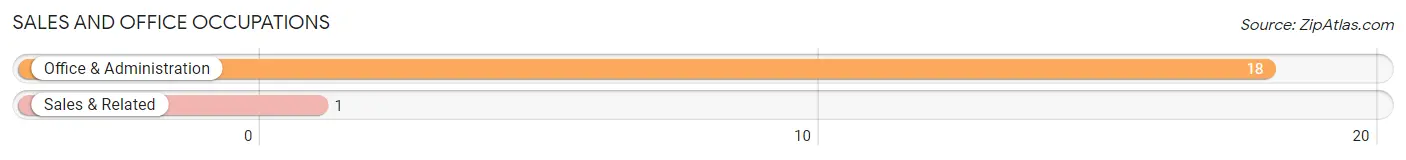
Sales and Office Occupations by Sex

| Occupation | Male | Female |
| Sales & Related | 0 (0.0%) | 1 (100.0%) |
| Office & Administration | 12 (66.7%) | 6 (33.3%) |
| Total (Category) | 12 (63.2%) | 7 (36.8%) |
| Total (Overall) | 84 (61.8%) | 52 (38.2%) |
Natural Resources, Construction and Maintenance Occupations
The most common Natural Resources, Construction and Maintenance occupations in Florence are Construction & Extraction (24 | 17.6%), and Farming, Fishing & Forestry (7 | 5.1%).
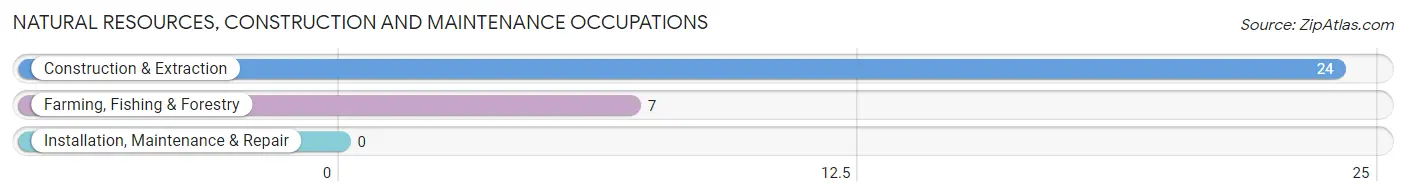
Natural Resources, Construction and Maintenance Occupations by Sex
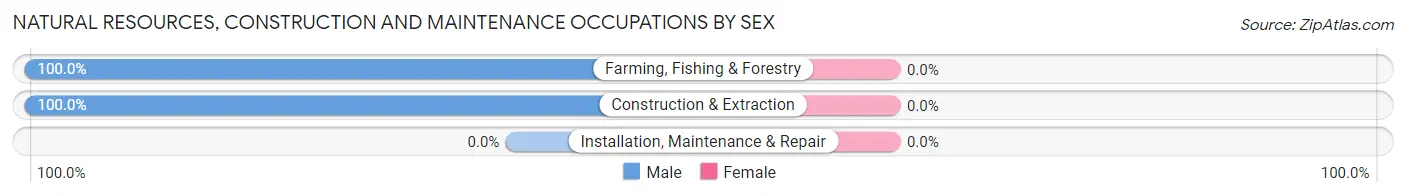
| Occupation | Male | Female |
| Farming, Fishing & Forestry | 7 (100.0%) | 0 (0.0%) |
| Construction & Extraction | 24 (100.0%) | 0 (0.0%) |
| Installation, Maintenance & Repair | 0 (0.0%) | 0 (0.0%) |
| Total (Category) | 31 (100.0%) | 0 (0.0%) |
| Total (Overall) | 84 (61.8%) | 52 (38.2%) |
Production, Transportation and Moving Occupations
The most common Production, Transportation and Moving occupations in Florence are Transportation (15 | 11.0%), and Material Moving (13 | 9.6%).
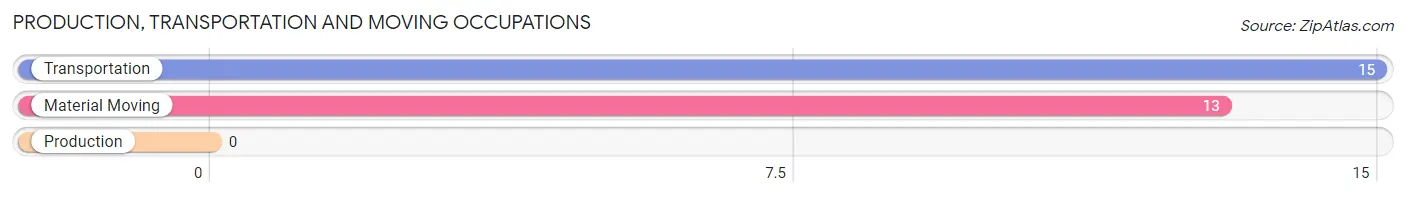
Production, Transportation and Moving Occupations by Sex
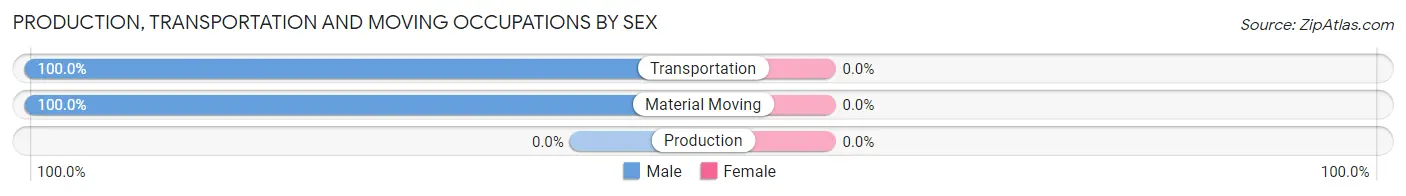
| Occupation | Male | Female |
| Production | 0 (0.0%) | 0 (0.0%) |
| Transportation | 15 (100.0%) | 0 (0.0%) |
| Material Moving | 13 (100.0%) | 0 (0.0%) |
| Total (Category) | 28 (100.0%) | 0 (0.0%) |
| Total (Overall) | 84 (61.8%) | 52 (38.2%) |
Employment Industries by Sex in Florence
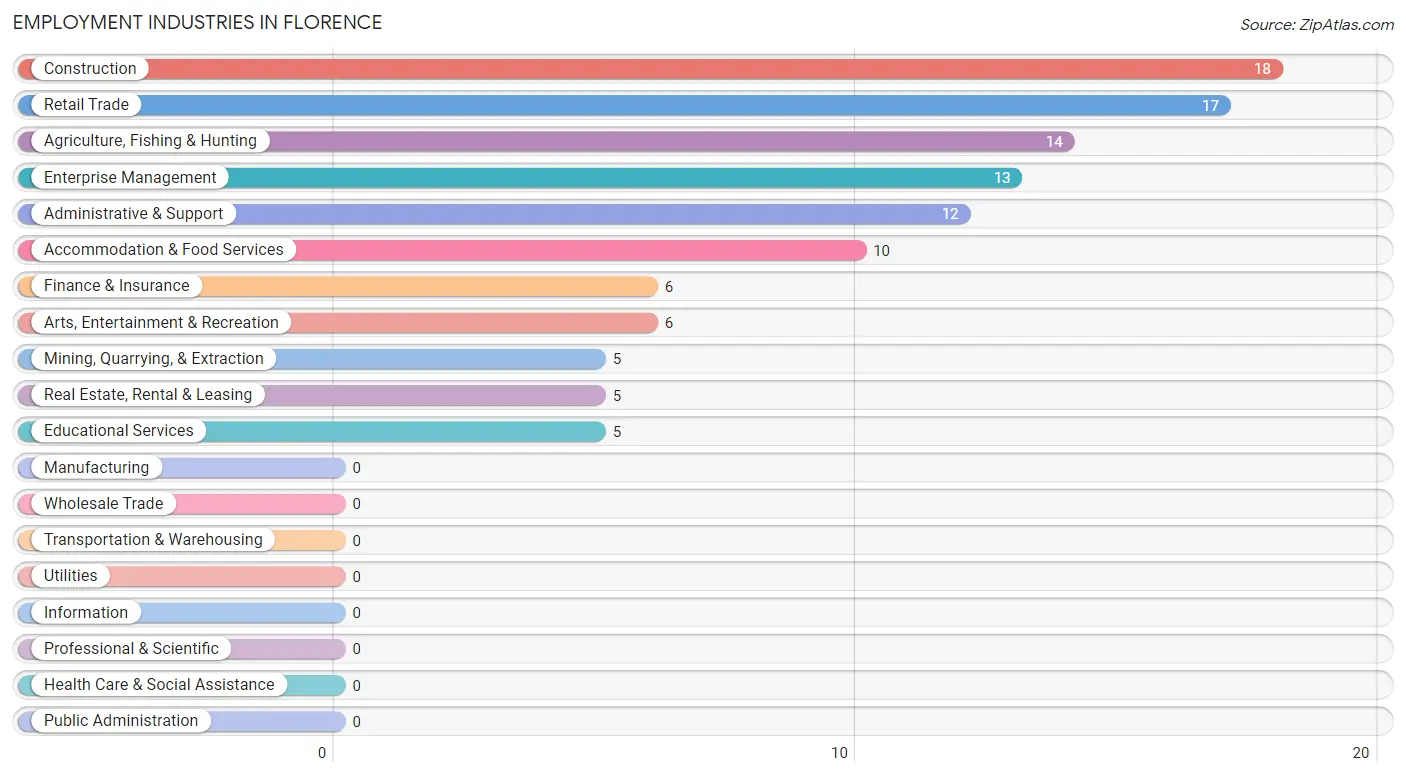
Employment Industries in Florence
The major employment industries in Florence include Construction (18 | 13.2%), Retail Trade (17 | 12.5%), Agriculture, Fishing & Hunting (14 | 10.3%), Enterprise Management (13 | 9.6%), and Administrative & Support (12 | 8.8%).
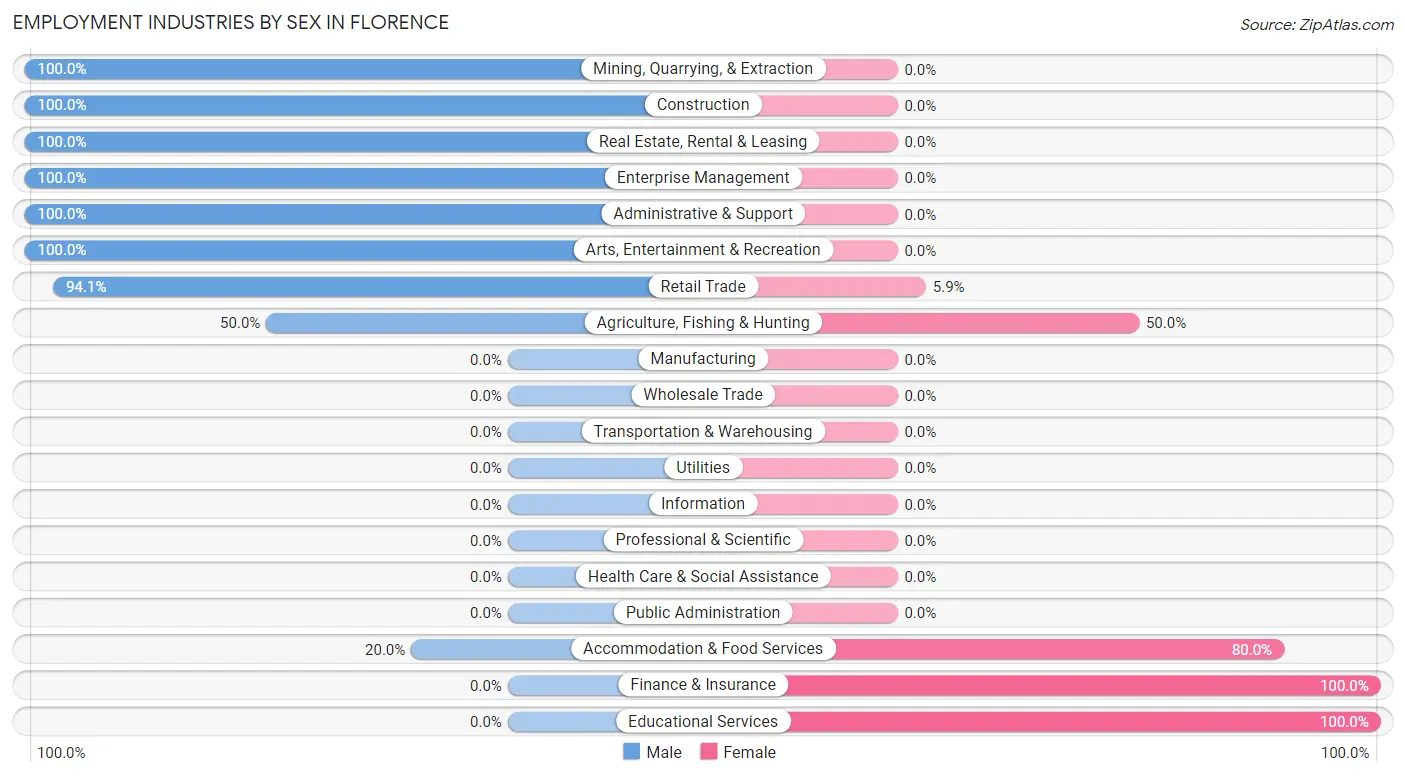
Employment Industries by Sex in Florence
The Florence industries that see more men than women are Mining, Quarrying, & Extraction (100.0%), Construction (100.0%), and Real Estate, Rental & Leasing (100.0%), whereas the industries that tend to have a higher number of women are Finance & Insurance (100.0%), Educational Services (100.0%), and Accommodation & Food Services (80.0%).
| Industry | Male | Female |
| Agriculture, Fishing & Hunting | 7 (50.0%) | 7 (50.0%) |
| Mining, Quarrying, & Extraction | 5 (100.0%) | 0 (0.0%) |
| Construction | 18 (100.0%) | 0 (0.0%) |
| Manufacturing | 0 (0.0%) | 0 (0.0%) |
| Wholesale Trade | 0 (0.0%) | 0 (0.0%) |
| Retail Trade | 16 (94.1%) | 1 (5.9%) |
| Transportation & Warehousing | 0 (0.0%) | 0 (0.0%) |
| Utilities | 0 (0.0%) | 0 (0.0%) |
| Information | 0 (0.0%) | 0 (0.0%) |
| Finance & Insurance | 0 (0.0%) | 6 (100.0%) |
| Real Estate, Rental & Leasing | 5 (100.0%) | 0 (0.0%) |
| Professional & Scientific | 0 (0.0%) | 0 (0.0%) |
| Enterprise Management | 13 (100.0%) | 0 (0.0%) |
| Administrative & Support | 12 (100.0%) | 0 (0.0%) |
| Educational Services | 0 (0.0%) | 5 (100.0%) |
| Health Care & Social Assistance | 0 (0.0%) | 0 (0.0%) |
| Arts, Entertainment & Recreation | 6 (100.0%) | 0 (0.0%) |
| Accommodation & Food Services | 2 (20.0%) | 8 (80.0%) |
| Public Administration | 0 (0.0%) | 0 (0.0%) |
| Total | 84 (61.8%) | 52 (38.2%) |
Education in Florence
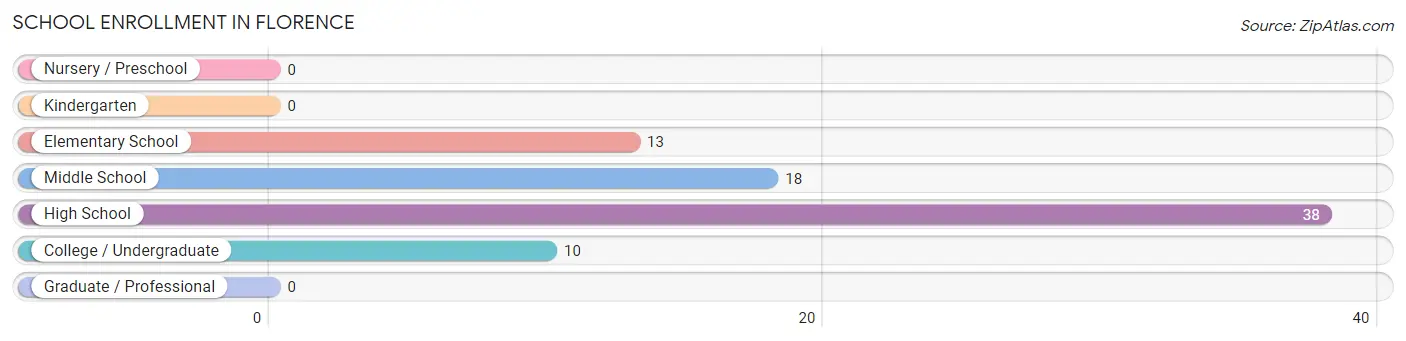
School Enrollment in Florence
The most common levels of schooling among the 79 students in Florence are high school (38 | 48.1%), middle school (18 | 22.8%), and elementary school (13 | 16.5%).
| School Level | # Students | % Students |
| Nursery / Preschool | 0 | 0.0% |
| Kindergarten | 0 | 0.0% |
| Elementary School | 13 | 16.5% |
| Middle School | 18 | 22.8% |
| High School | 38 | 48.1% |
| College / Undergraduate | 10 | 12.7% |
| Graduate / Professional | 0 | 0.0% |
| Total | 79 | 100.0% |
School Enrollment by Age by Funding Source in Florence
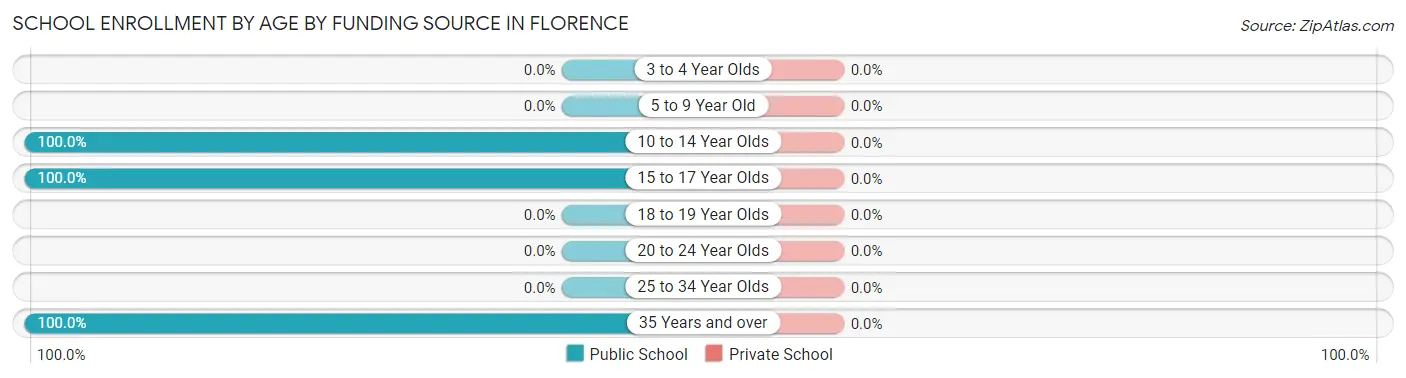
| Age Bracket | Public School | Private School |
| 3 to 4 Year Olds | 0 (0.0%) | 0 (0.0%) |
| 5 to 9 Year Old | 0 (0.0%) | 0 (0.0%) |
| 10 to 14 Year Olds | 44 (100.0%) | 0 (0.0%) |
| 15 to 17 Year Olds | 25 (100.0%) | 0 (0.0%) |
| 18 to 19 Year Olds | 0 (0.0%) | 0 (0.0%) |
| 20 to 24 Year Olds | 0 (0.0%) | 0 (0.0%) |
| 25 to 34 Year Olds | 0 (0.0%) | 0 (0.0%) |
| 35 Years and over | 10 (100.0%) | 0 (0.0%) |
| Total | 79 (100.0%) | 0 (0.0%) |
Educational Attainment by Field of Study in Florence
Science & technology (42 | 52.5%), bio, nature & agricultural (14 | 17.5%), education (13 | 16.3%), social sciences (6 | 7.5%), and arts & humanities (5 | 6.2%) are the most common fields of study among 80 individuals in Florence who have obtained a bachelor's degree or higher.
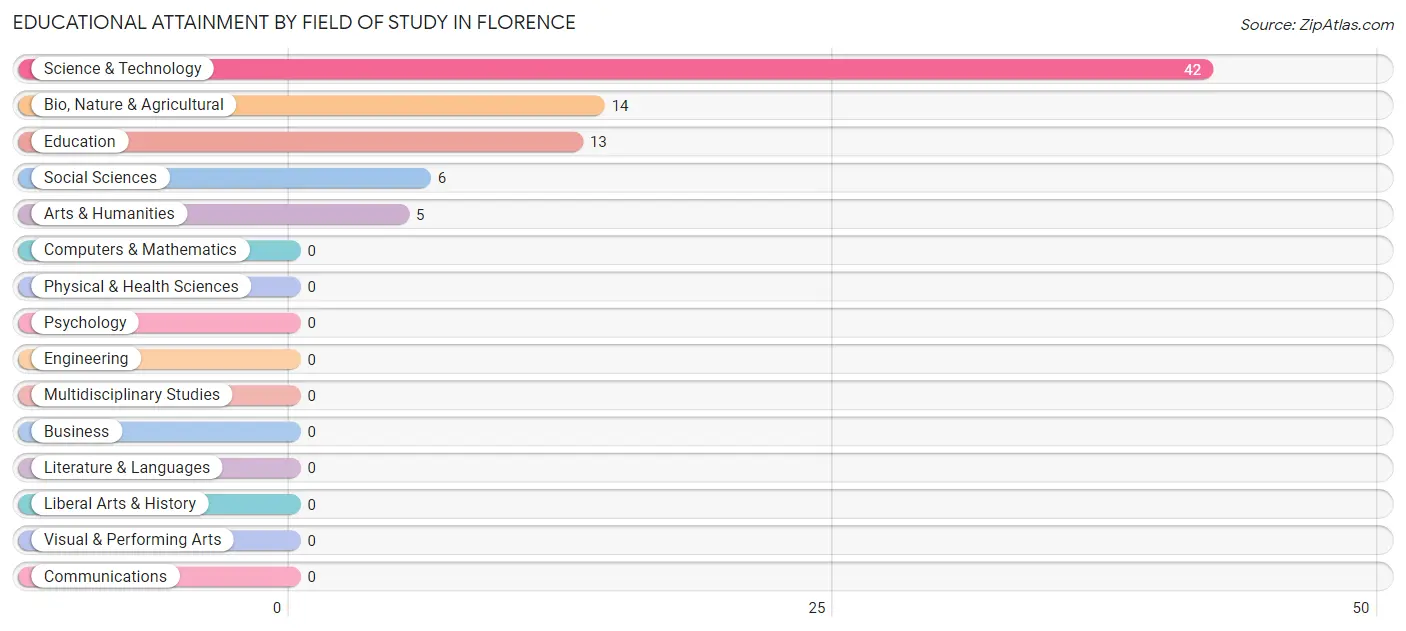
| Field of Study | # Graduates | % Graduates |
| Computers & Mathematics | 0 | 0.0% |
| Bio, Nature & Agricultural | 14 | 17.5% |
| Physical & Health Sciences | 0 | 0.0% |
| Psychology | 0 | 0.0% |
| Social Sciences | 6 | 7.5% |
| Engineering | 0 | 0.0% |
| Multidisciplinary Studies | 0 | 0.0% |
| Science & Technology | 42 | 52.5% |
| Business | 0 | 0.0% |
| Education | 13 | 16.3% |
| Literature & Languages | 0 | 0.0% |
| Liberal Arts & History | 0 | 0.0% |
| Visual & Performing Arts | 0 | 0.0% |
| Communications | 0 | 0.0% |
| Arts & Humanities | 5 | 6.2% |
| Total | 80 | 100.0% |
Transportation & Commute in Florence
Vehicle Availability by Sex in Florence
The most prevalent vehicle ownership categories in Florence are males with 1 vehicle (27, accounting for 37.5%) and females with 1 vehicle (26, making up 51.9%).
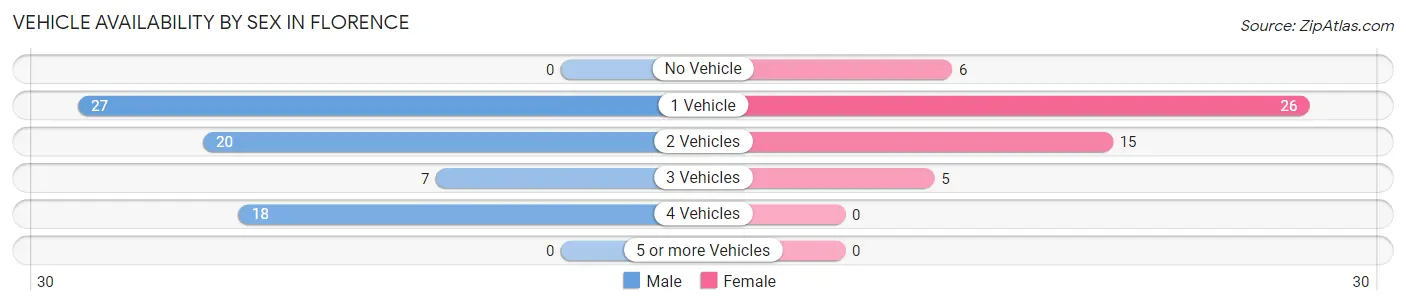
| Vehicles Available | Male | Female |
| No Vehicle | 0 (0.0%) | 6 (11.5%) |
| 1 Vehicle | 27 (37.5%) | 26 (50.0%) |
| 2 Vehicles | 20 (27.8%) | 15 (28.8%) |
| 3 Vehicles | 7 (9.7%) | 5 (9.6%) |
| 4 Vehicles | 18 (25.0%) | 0 (0.0%) |
| 5 or more Vehicles | 0 (0.0%) | 0 (0.0%) |
| Total | 72 (100.0%) | 52 (100.0%) |
Commute Time in Florence
The most frequently occuring commute durations in Florence are less than 5 minutes (43 commuters, 36.1%), 5 to 9 minutes (31 commuters, 26.1%), and 20 to 24 minutes (19 commuters, 16.0%).
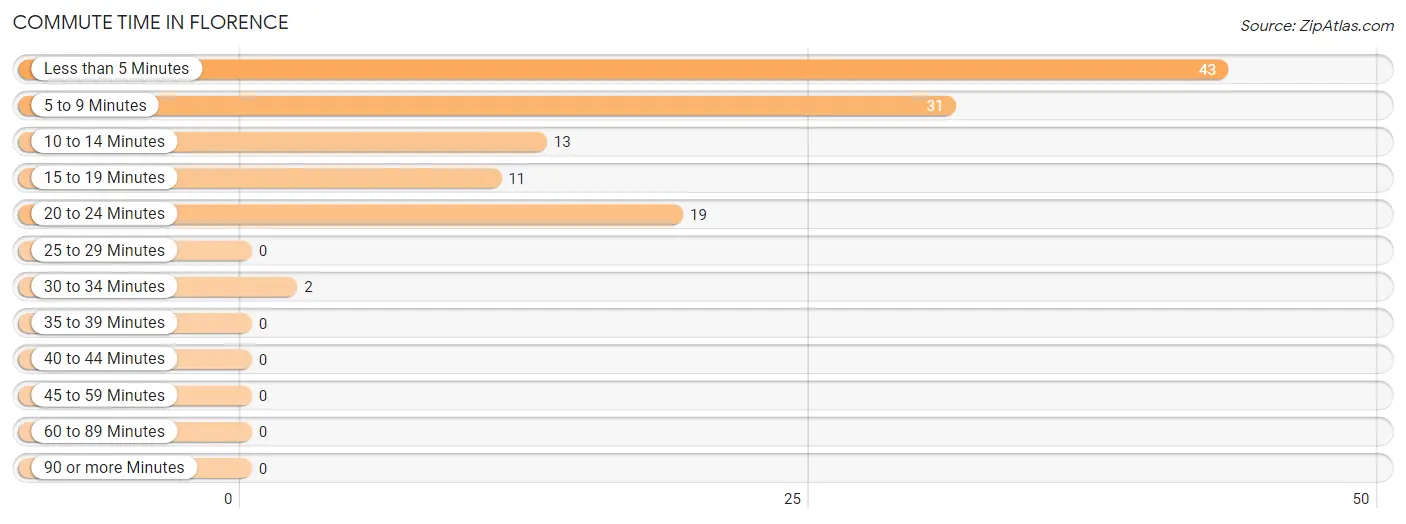
| Commute Time | # Commuters | % Commuters |
| Less than 5 Minutes | 43 | 36.1% |
| 5 to 9 Minutes | 31 | 26.1% |
| 10 to 14 Minutes | 13 | 10.9% |
| 15 to 19 Minutes | 11 | 9.2% |
| 20 to 24 Minutes | 19 | 16.0% |
| 25 to 29 Minutes | 0 | 0.0% |
| 30 to 34 Minutes | 2 | 1.7% |
| 35 to 39 Minutes | 0 | 0.0% |
| 40 to 44 Minutes | 0 | 0.0% |
| 45 to 59 Minutes | 0 | 0.0% |
| 60 to 89 Minutes | 0 | 0.0% |
| 90 or more Minutes | 0 | 0.0% |
Commute Time by Sex in Florence
The most common commute times in Florence are 20 to 24 minutes (19 commuters, 28.4%) for males and less than 5 minutes (25 commuters, 48.1%) for females.
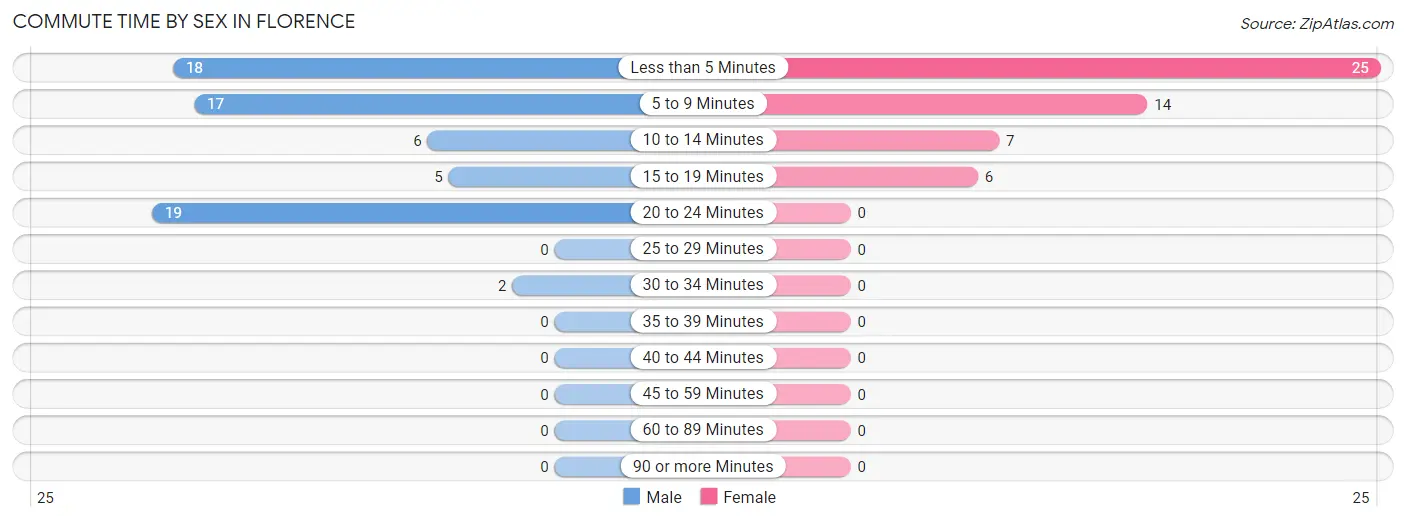
| Commute Time | Male | Female |
| Less than 5 Minutes | 18 (26.9%) | 25 (48.1%) |
| 5 to 9 Minutes | 17 (25.4%) | 14 (26.9%) |
| 10 to 14 Minutes | 6 (9.0%) | 7 (13.5%) |
| 15 to 19 Minutes | 5 (7.5%) | 6 (11.5%) |
| 20 to 24 Minutes | 19 (28.4%) | 0 (0.0%) |
| 25 to 29 Minutes | 0 (0.0%) | 0 (0.0%) |
| 30 to 34 Minutes | 2 (3.0%) | 0 (0.0%) |
| 35 to 39 Minutes | 0 (0.0%) | 0 (0.0%) |
| 40 to 44 Minutes | 0 (0.0%) | 0 (0.0%) |
| 45 to 59 Minutes | 0 (0.0%) | 0 (0.0%) |
| 60 to 89 Minutes | 0 (0.0%) | 0 (0.0%) |
| 90 or more Minutes | 0 (0.0%) | 0 (0.0%) |
Time of Departure to Work by Sex in Florence
The most frequent times of departure to work in Florence are 6:00 AM to 6:29 AM (25, 37.3%) for males and 8:00 AM to 8:29 AM (33, 63.5%) for females.
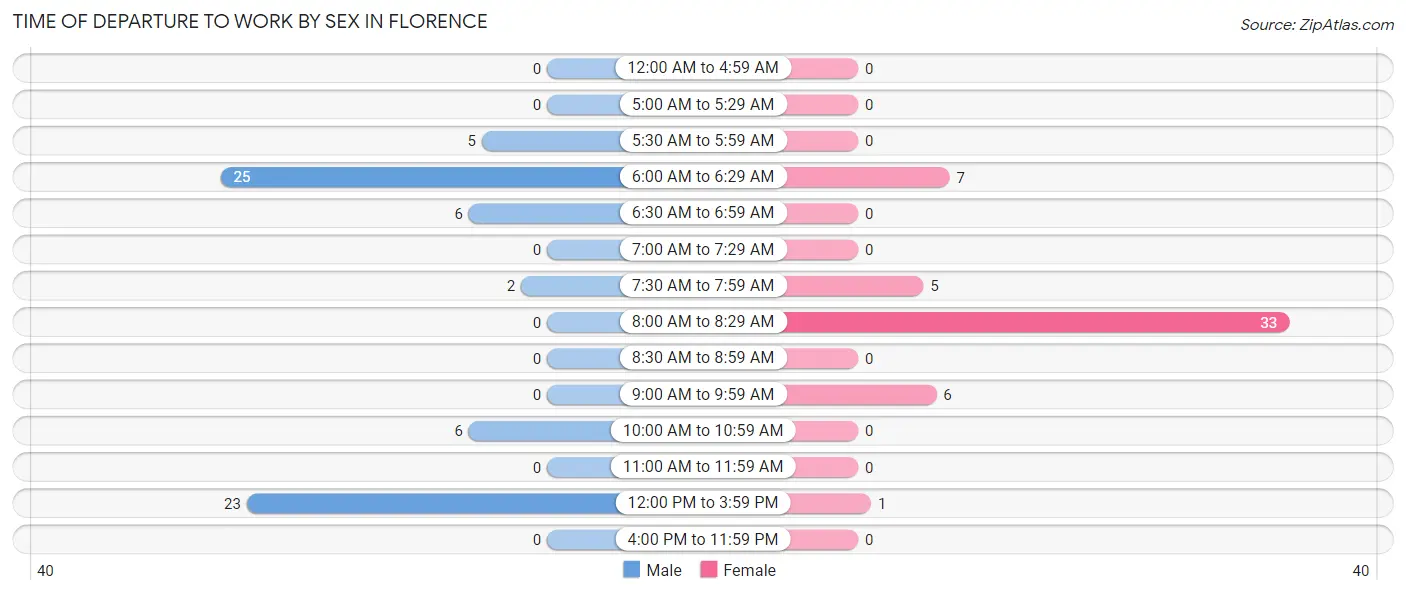
| Time of Departure | Male | Female |
| 12:00 AM to 4:59 AM | 0 (0.0%) | 0 (0.0%) |
| 5:00 AM to 5:29 AM | 0 (0.0%) | 0 (0.0%) |
| 5:30 AM to 5:59 AM | 5 (7.5%) | 0 (0.0%) |
| 6:00 AM to 6:29 AM | 25 (37.3%) | 7 (13.5%) |
| 6:30 AM to 6:59 AM | 6 (9.0%) | 0 (0.0%) |
| 7:00 AM to 7:29 AM | 0 (0.0%) | 0 (0.0%) |
| 7:30 AM to 7:59 AM | 2 (3.0%) | 5 (9.6%) |
| 8:00 AM to 8:29 AM | 0 (0.0%) | 33 (63.5%) |
| 8:30 AM to 8:59 AM | 0 (0.0%) | 0 (0.0%) |
| 9:00 AM to 9:59 AM | 0 (0.0%) | 6 (11.5%) |
| 10:00 AM to 10:59 AM | 6 (9.0%) | 0 (0.0%) |
| 11:00 AM to 11:59 AM | 0 (0.0%) | 0 (0.0%) |
| 12:00 PM to 3:59 PM | 23 (34.3%) | 1 (1.9%) |
| 4:00 PM to 11:59 PM | 0 (0.0%) | 0 (0.0%) |
| Total | 67 (100.0%) | 52 (100.0%) |
Housing Occupancy in Florence
Occupancy by Ownership in Florence
Of the total 240 dwellings in Florence, owner-occupied units account for 159 (66.2%), while renter-occupied units make up 81 (33.8%).
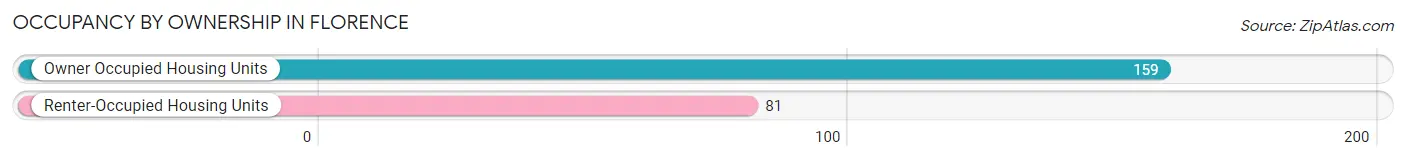
| Occupancy | # Housing Units | % Housing Units |
| Owner Occupied Housing Units | 159 | 66.2% |
| Renter-Occupied Housing Units | 81 | 33.8% |
| Total Occupied Housing Units | 240 | 100.0% |
Occupancy by Household Size in Florence
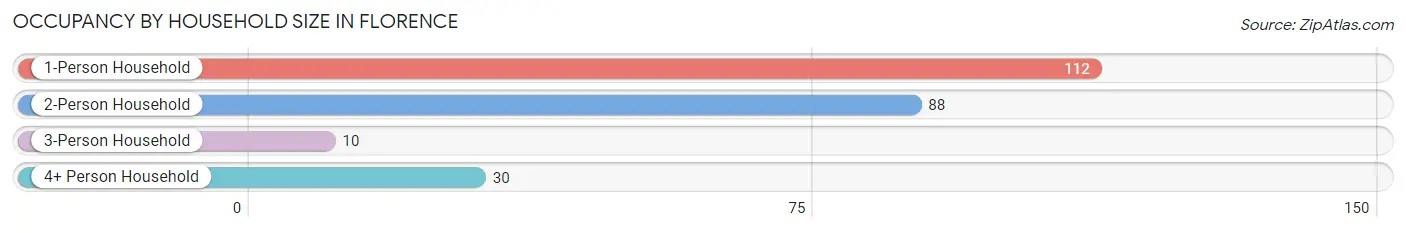
| Household Size | # Housing Units | % Housing Units |
| 1-Person Household | 112 | 46.7% |
| 2-Person Household | 88 | 36.7% |
| 3-Person Household | 10 | 4.2% |
| 4+ Person Household | 30 | 12.5% |
| Total Housing Units | 240 | 100.0% |
Occupancy by Ownership by Household Size in Florence
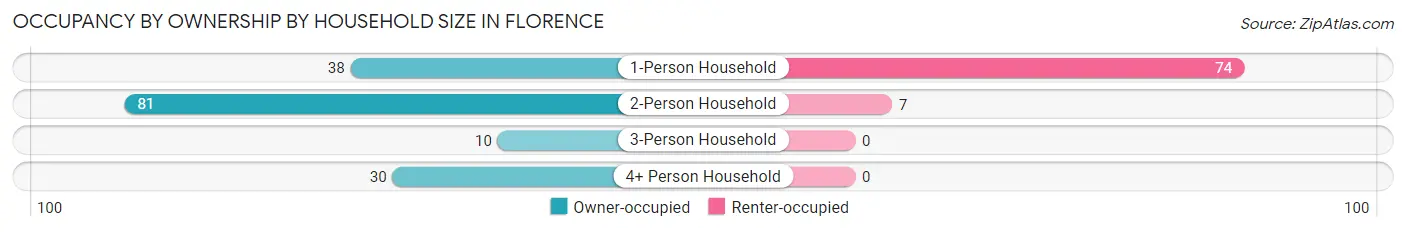
| Household Size | Owner-occupied | Renter-occupied |
| 1-Person Household | 38 (33.9%) | 74 (66.1%) |
| 2-Person Household | 81 (92.0%) | 7 (8.0%) |
| 3-Person Household | 10 (100.0%) | 0 (0.0%) |
| 4+ Person Household | 30 (100.0%) | 0 (0.0%) |
| Total Housing Units | 159 (66.2%) | 81 (33.8%) |
Occupancy by Educational Attainment in Florence
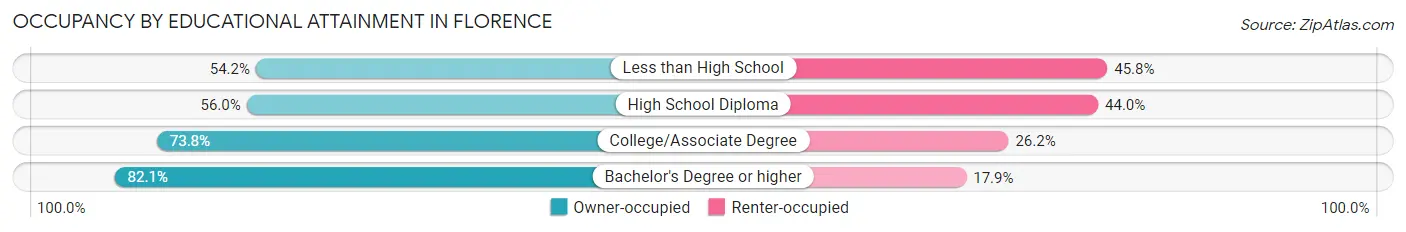
| Household Size | Owner-occupied | Renter-occupied |
| Less than High School | 26 (54.2%) | 22 (45.8%) |
| High School Diploma | 42 (56.0%) | 33 (44.0%) |
| College/Associate Degree | 45 (73.8%) | 16 (26.2%) |
| Bachelor's Degree or higher | 46 (82.1%) | 10 (17.9%) |
Occupancy by Age of Householder in Florence
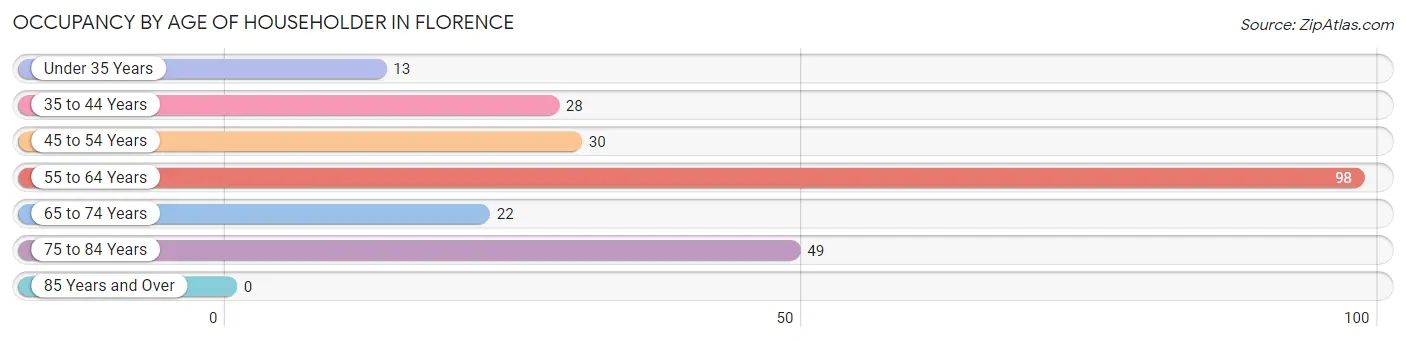
| Age Bracket | # Households | % Households |
| Under 35 Years | 13 | 5.4% |
| 35 to 44 Years | 28 | 11.7% |
| 45 to 54 Years | 30 | 12.5% |
| 55 to 64 Years | 98 | 40.8% |
| 65 to 74 Years | 22 | 9.2% |
| 75 to 84 Years | 49 | 20.4% |
| 85 Years and Over | 0 | 0.0% |
| Total | 240 | 100.0% |
Housing Finances in Florence
Median Income by Occupancy in Florence
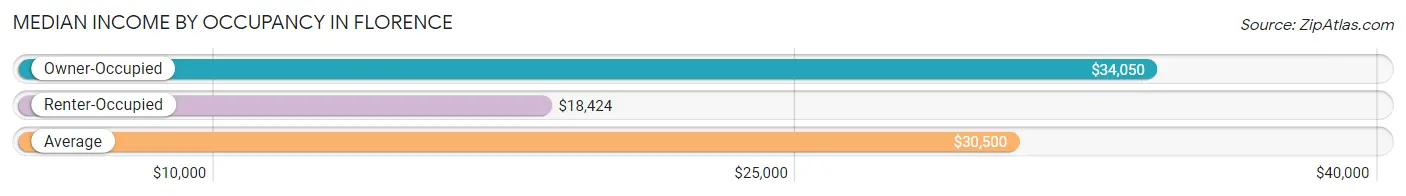
| Occupancy Type | # Households | Median Income |
| Owner-Occupied | 159 (66.2%) | $34,050 |
| Renter-Occupied | 81 (33.8%) | $18,424 |
| Average | 240 (100.0%) | $30,500 |
Occupancy by Householder Income Bracket in Florence
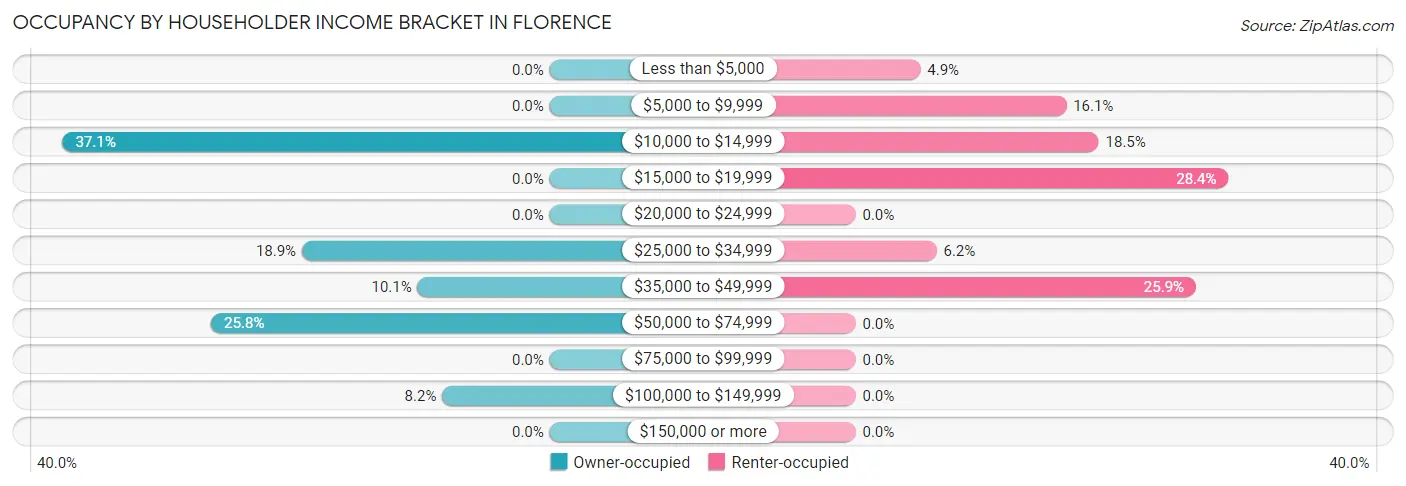
| Income Bracket | Owner-occupied | Renter-occupied |
| Less than $5,000 | 0 (0.0%) | 4 (4.9%) |
| $5,000 to $9,999 | 0 (0.0%) | 13 (16.1%) |
| $10,000 to $14,999 | 59 (37.1%) | 15 (18.5%) |
| $15,000 to $19,999 | 0 (0.0%) | 23 (28.4%) |
| $20,000 to $24,999 | 0 (0.0%) | 0 (0.0%) |
| $25,000 to $34,999 | 30 (18.9%) | 5 (6.2%) |
| $35,000 to $49,999 | 16 (10.1%) | 21 (25.9%) |
| $50,000 to $74,999 | 41 (25.8%) | 0 (0.0%) |
| $75,000 to $99,999 | 0 (0.0%) | 0 (0.0%) |
| $100,000 to $149,999 | 13 (8.2%) | 0 (0.0%) |
| $150,000 or more | 0 (0.0%) | 0 (0.0%) |
| Total | 159 (100.0%) | 81 (100.0%) |
Monthly Housing Cost Tiers in Florence
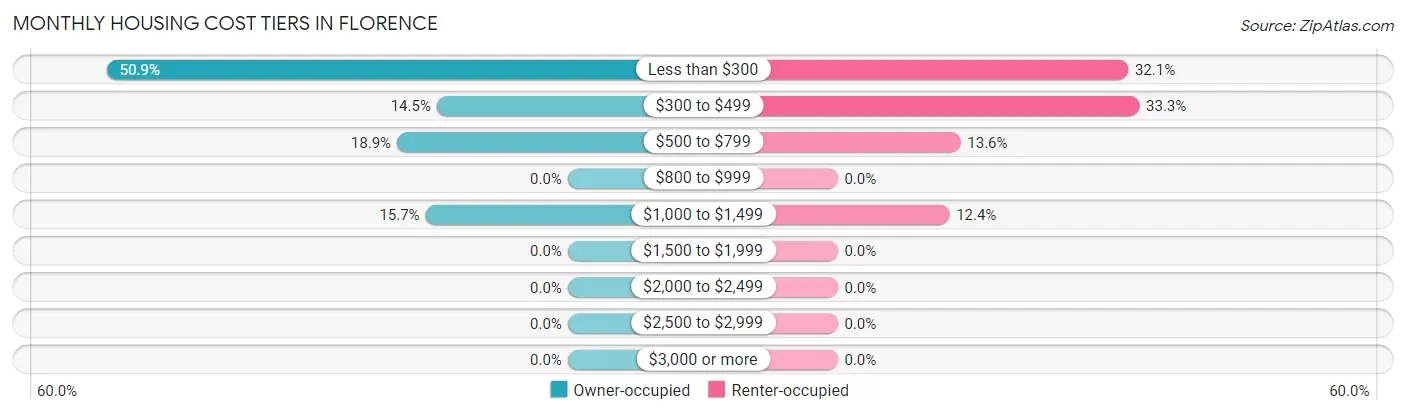
| Monthly Cost | Owner-occupied | Renter-occupied |
| Less than $300 | 81 (50.9%) | 26 (32.1%) |
| $300 to $499 | 23 (14.5%) | 27 (33.3%) |
| $500 to $799 | 30 (18.9%) | 11 (13.6%) |
| $800 to $999 | 0 (0.0%) | 0 (0.0%) |
| $1,000 to $1,499 | 25 (15.7%) | 10 (12.3%) |
| $1,500 to $1,999 | 0 (0.0%) | 0 (0.0%) |
| $2,000 to $2,499 | 0 (0.0%) | 0 (0.0%) |
| $2,500 to $2,999 | 0 (0.0%) | 0 (0.0%) |
| $3,000 or more | 0 (0.0%) | 0 (0.0%) |
| Total | 159 (100.0%) | 81 (100.0%) |
Physical Housing Characteristics in Florence
Housing Structures in Florence
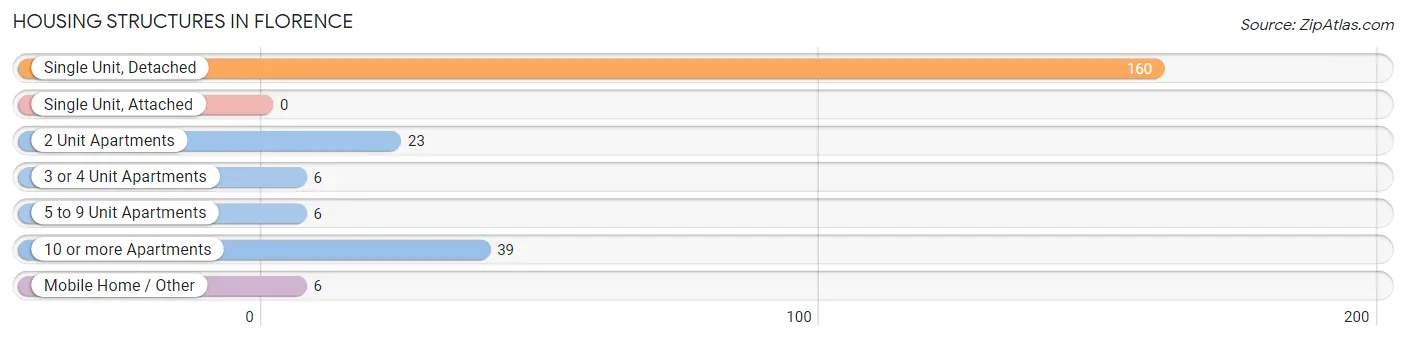
| Structure Type | # Housing Units | % Housing Units |
| Single Unit, Detached | 160 | 66.7% |
| Single Unit, Attached | 0 | 0.0% |
| 2 Unit Apartments | 23 | 9.6% |
| 3 or 4 Unit Apartments | 6 | 2.5% |
| 5 to 9 Unit Apartments | 6 | 2.5% |
| 10 or more Apartments | 39 | 16.3% |
| Mobile Home / Other | 6 | 2.5% |
| Total | 240 | 100.0% |
Housing Structures by Occupancy in Florence
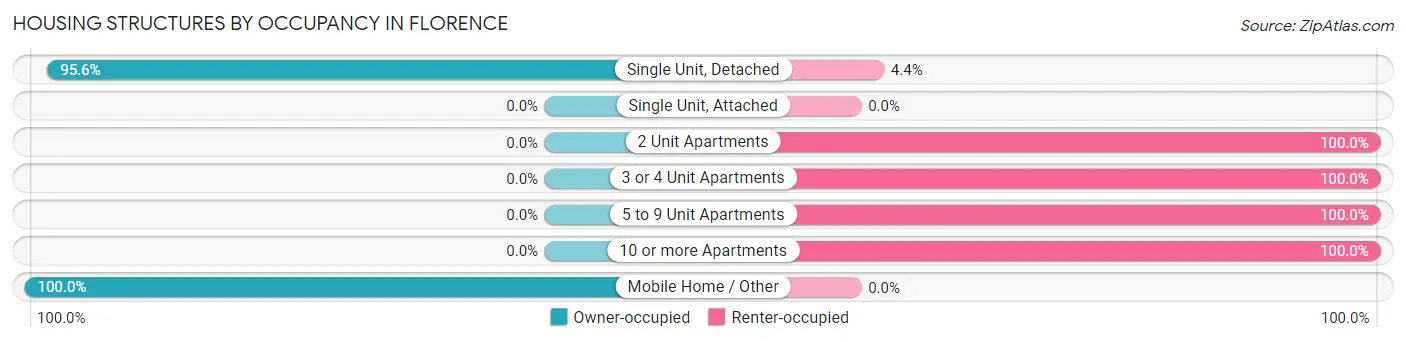
| Structure Type | Owner-occupied | Renter-occupied |
| Single Unit, Detached | 153 (95.6%) | 7 (4.4%) |
| Single Unit, Attached | 0 (0.0%) | 0 (0.0%) |
| 2 Unit Apartments | 0 (0.0%) | 23 (100.0%) |
| 3 or 4 Unit Apartments | 0 (0.0%) | 6 (100.0%) |
| 5 to 9 Unit Apartments | 0 (0.0%) | 6 (100.0%) |
| 10 or more Apartments | 0 (0.0%) | 39 (100.0%) |
| Mobile Home / Other | 6 (100.0%) | 0 (0.0%) |
| Total | 159 (66.2%) | 81 (33.8%) |
Housing Structures by Number of Rooms in Florence
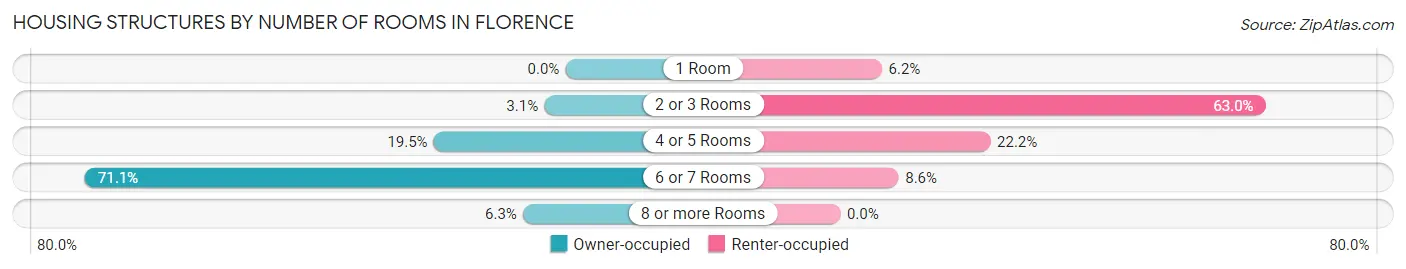
| Number of Rooms | Owner-occupied | Renter-occupied |
| 1 Room | 0 (0.0%) | 5 (6.2%) |
| 2 or 3 Rooms | 5 (3.1%) | 51 (63.0%) |
| 4 or 5 Rooms | 31 (19.5%) | 18 (22.2%) |
| 6 or 7 Rooms | 113 (71.1%) | 7 (8.6%) |
| 8 or more Rooms | 10 (6.3%) | 0 (0.0%) |
| Total | 159 (100.0%) | 81 (100.0%) |
Housing Structure by Heating Type in Florence
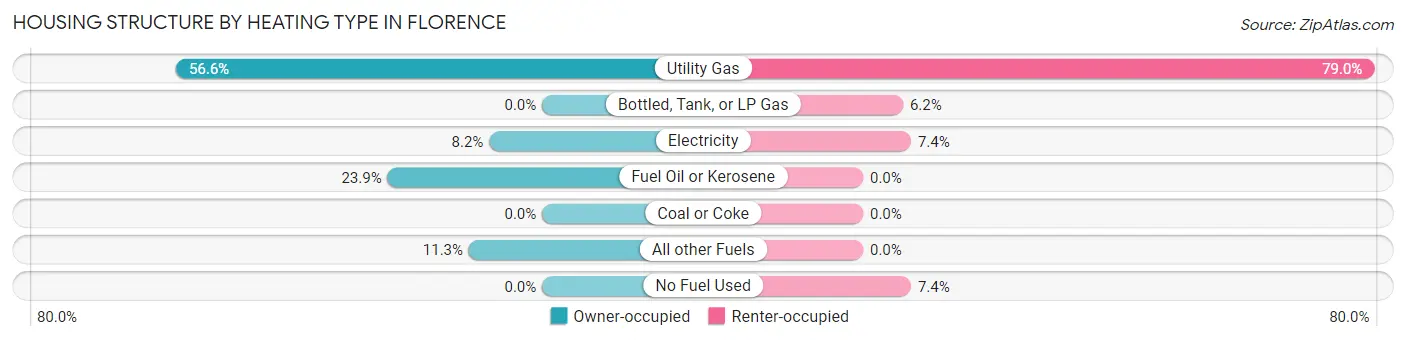
| Heating Type | Owner-occupied | Renter-occupied |
| Utility Gas | 90 (56.6%) | 64 (79.0%) |
| Bottled, Tank, or LP Gas | 0 (0.0%) | 5 (6.2%) |
| Electricity | 13 (8.2%) | 6 (7.4%) |
| Fuel Oil or Kerosene | 38 (23.9%) | 0 (0.0%) |
| Coal or Coke | 0 (0.0%) | 0 (0.0%) |
| All other Fuels | 18 (11.3%) | 0 (0.0%) |
| No Fuel Used | 0 (0.0%) | 6 (7.4%) |
| Total | 159 (100.0%) | 81 (100.0%) |
Household Vehicle Usage in Florence
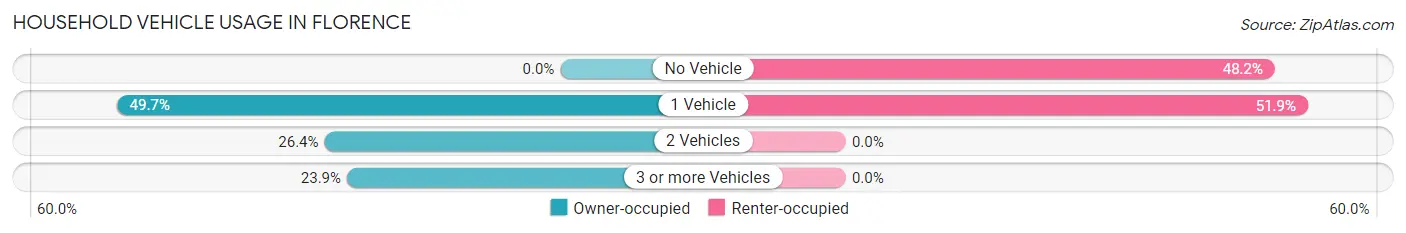
| Vehicles per Household | Owner-occupied | Renter-occupied |
| No Vehicle | 0 (0.0%) | 39 (48.1%) |
| 1 Vehicle | 79 (49.7%) | 42 (51.8%) |
| 2 Vehicles | 42 (26.4%) | 0 (0.0%) |
| 3 or more Vehicles | 38 (23.9%) | 0 (0.0%) |
| Total | 159 (100.0%) | 81 (100.0%) |
Real Estate & Mortgages in Florence
Real Estate and Mortgage Overview in Florence
| Characteristic | Without Mortgage | With Mortgage |
| Housing Units | 124 | 35 |
| Median Property Value | $32,000 | $157,500 |
| Median Household Income | - | - |
| Monthly Housing Costs | $262 | $0 |
| Real Estate Taxes | $356 | $0 |
Property Value by Mortgage Status in Florence
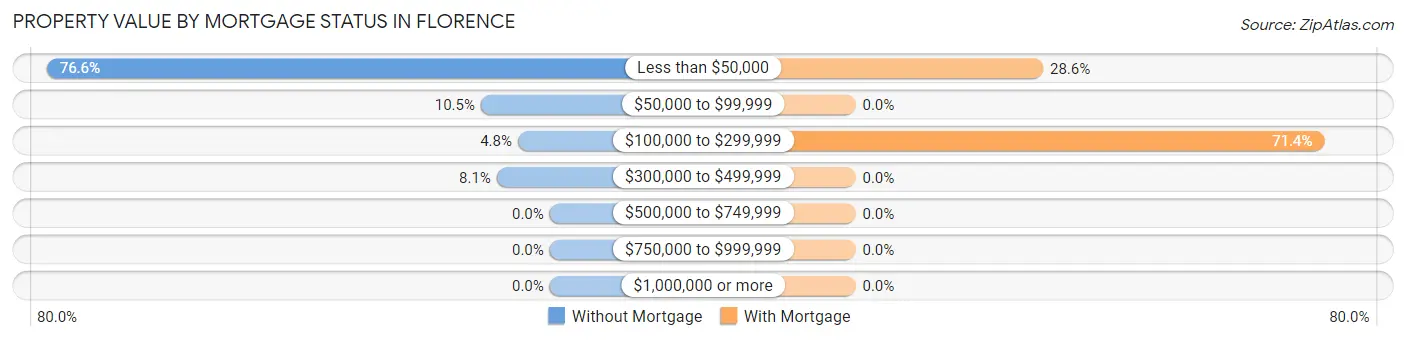
| Property Value | Without Mortgage | With Mortgage |
| Less than $50,000 | 95 (76.6%) | 10 (28.6%) |
| $50,000 to $99,999 | 13 (10.5%) | 0 (0.0%) |
| $100,000 to $299,999 | 6 (4.8%) | 25 (71.4%) |
| $300,000 to $499,999 | 10 (8.1%) | 0 (0.0%) |
| $500,000 to $749,999 | 0 (0.0%) | 0 (0.0%) |
| $750,000 to $999,999 | 0 (0.0%) | 0 (0.0%) |
| $1,000,000 or more | 0 (0.0%) | 0 (0.0%) |
| Total | 124 (100.0%) | 35 (100.0%) |
Household Income by Mortgage Status in Florence
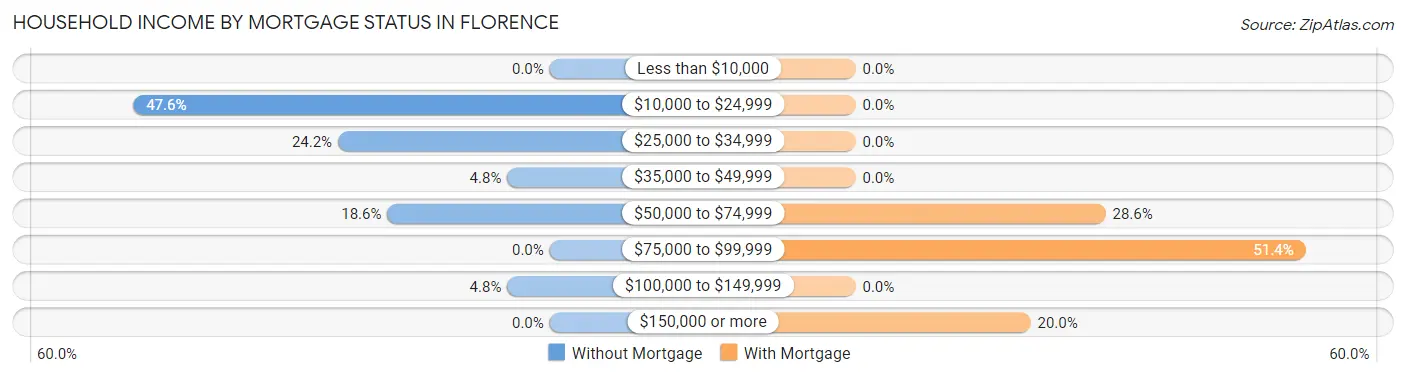
| Household Income | Without Mortgage | With Mortgage |
| Less than $10,000 | 0 (0.0%) | 0 (0.0%) |
| $10,000 to $24,999 | 59 (47.6%) | 0 (0.0%) |
| $25,000 to $34,999 | 30 (24.2%) | 0 (0.0%) |
| $35,000 to $49,999 | 6 (4.8%) | 0 (0.0%) |
| $50,000 to $74,999 | 23 (18.5%) | 10 (28.6%) |
| $75,000 to $99,999 | 0 (0.0%) | 18 (51.4%) |
| $100,000 to $149,999 | 6 (4.8%) | 0 (0.0%) |
| $150,000 or more | 0 (0.0%) | 7 (20.0%) |
| Total | 124 (100.0%) | 35 (100.0%) |
Property Value to Household Income Ratio in Florence
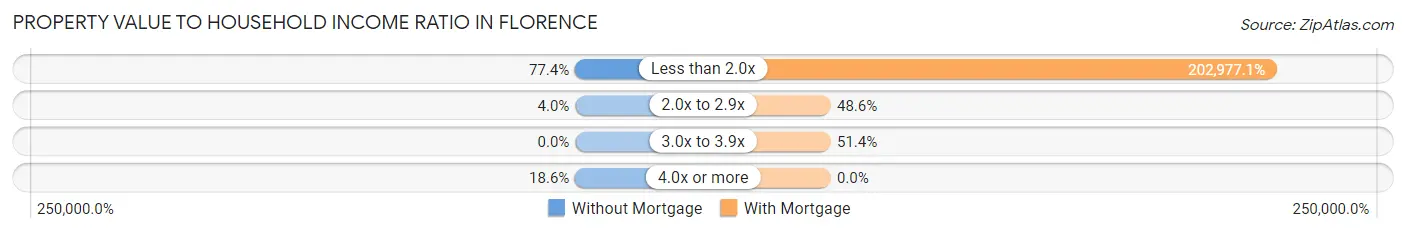
| Value-to-Income Ratio | Without Mortgage | With Mortgage |
| Less than 2.0x | 96 (77.4%) | 71,042 (202,977.1%) |
| 2.0x to 2.9x | 5 (4.0%) | 17 (48.6%) |
| 3.0x to 3.9x | 0 (0.0%) | 18 (51.4%) |
| 4.0x or more | 23 (18.5%) | 0 (0.0%) |
| Total | 124 (100.0%) | 35 (100.0%) |
Real Estate Taxes by Mortgage Status in Florence
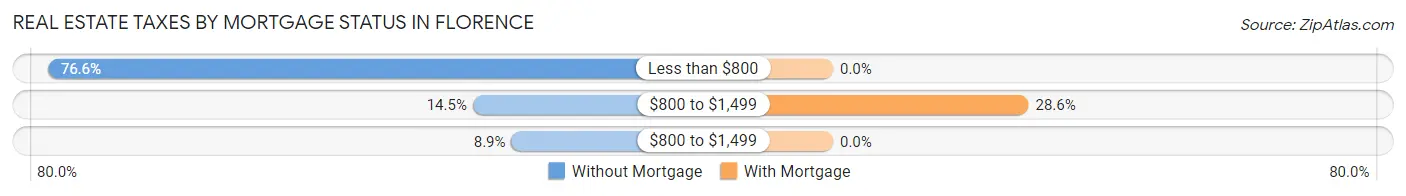
| Property Taxes | Without Mortgage | With Mortgage |
| Less than $800 | 95 (76.6%) | 0 (0.0%) |
| $800 to $1,499 | 18 (14.5%) | 10 (28.6%) |
| $800 to $1,499 | 11 (8.9%) | 0 (0.0%) |
| Total | 124 (100.0%) | 35 (100.0%) |
Health & Disability in Florence
Health Insurance Coverage by Age in Florence
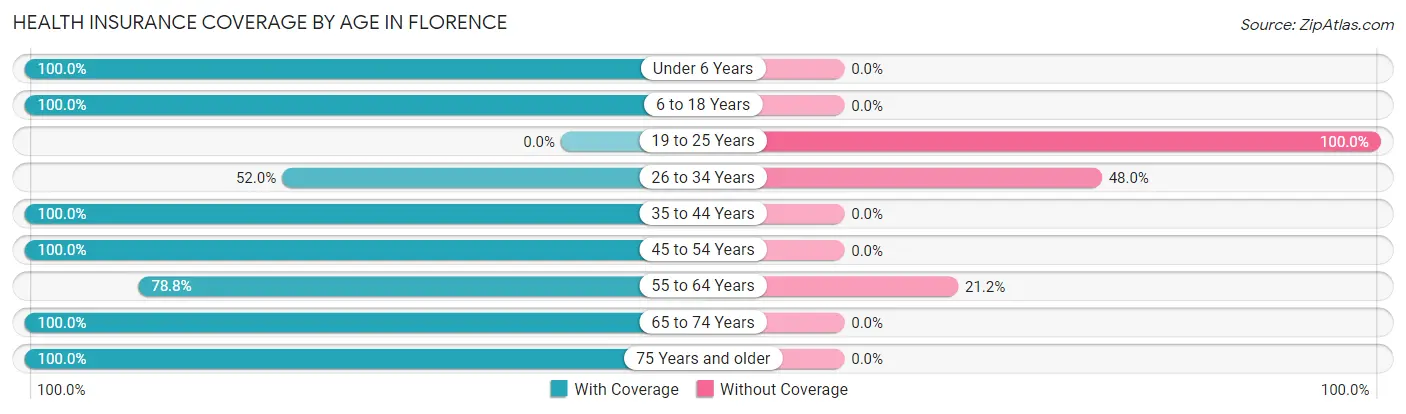
| Age Bracket | With Coverage | Without Coverage |
| Under 6 Years | 13 (100.0%) | 0 (0.0%) |
| 6 to 18 Years | 69 (100.0%) | 0 (0.0%) |
| 19 to 25 Years | 0 (0.0%) | 10 (100.0%) |
| 26 to 34 Years | 13 (52.0%) | 12 (48.0%) |
| 35 to 44 Years | 49 (100.0%) | 0 (0.0%) |
| 45 to 54 Years | 30 (100.0%) | 0 (0.0%) |
| 55 to 64 Years | 104 (78.8%) | 28 (21.2%) |
| 65 to 74 Years | 29 (100.0%) | 0 (0.0%) |
| 75 Years and older | 61 (100.0%) | 0 (0.0%) |
| Total | 368 (88.0%) | 50 (12.0%) |
Health Insurance Coverage by Citizenship Status in Florence
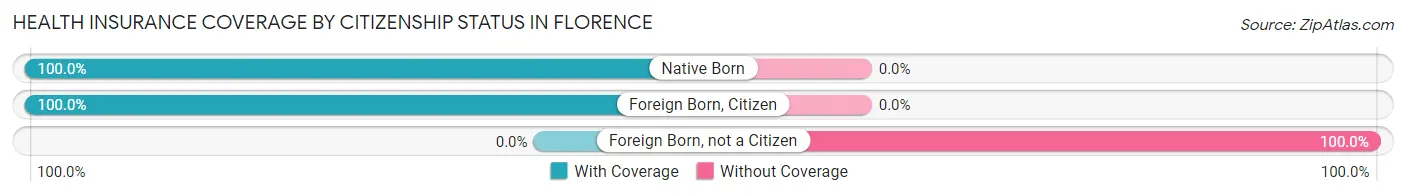
| Citizenship Status | With Coverage | Without Coverage |
| Native Born | 13 (100.0%) | 0 (0.0%) |
| Foreign Born, Citizen | 69 (100.0%) | 0 (0.0%) |
| Foreign Born, not a Citizen | 0 (0.0%) | 10 (100.0%) |
Health Insurance Coverage by Household Income in Florence
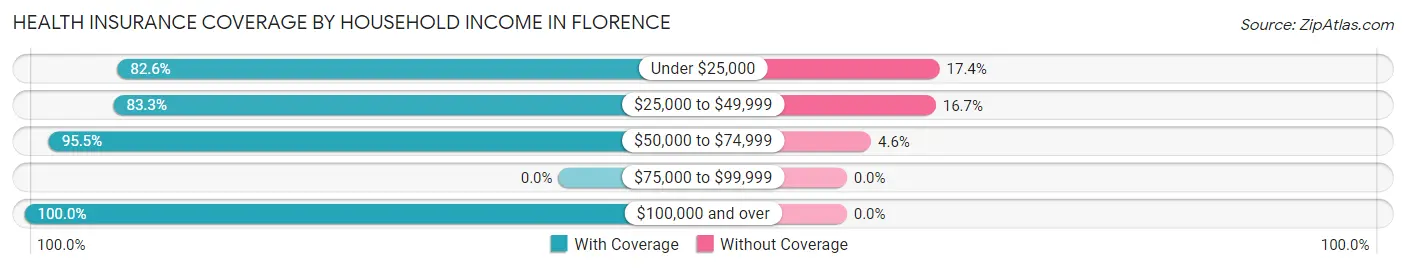
| Household Income | With Coverage | Without Coverage |
| Under $25,000 | 114 (82.6%) | 24 (17.4%) |
| $25,000 to $49,999 | 105 (83.3%) | 21 (16.7%) |
| $50,000 to $74,999 | 105 (95.5%) | 5 (4.5%) |
| $75,000 to $99,999 | 0 (0.0%) | 0 (0.0%) |
| $100,000 and over | 44 (100.0%) | 0 (0.0%) |
Public vs Private Health Insurance Coverage by Age in Florence
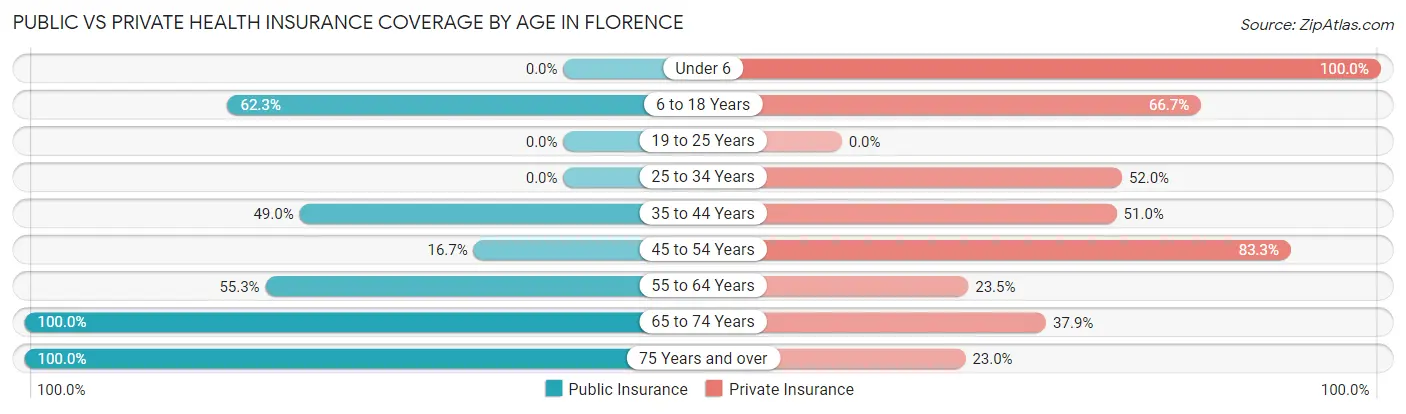
| Age Bracket | Public Insurance | Private Insurance |
| Under 6 | 0 (0.0%) | 13 (100.0%) |
| 6 to 18 Years | 43 (62.3%) | 46 (66.7%) |
| 19 to 25 Years | 0 (0.0%) | 0 (0.0%) |
| 25 to 34 Years | 0 (0.0%) | 13 (52.0%) |
| 35 to 44 Years | 24 (49.0%) | 25 (51.0%) |
| 45 to 54 Years | 5 (16.7%) | 25 (83.3%) |
| 55 to 64 Years | 73 (55.3%) | 31 (23.5%) |
| 65 to 74 Years | 29 (100.0%) | 11 (37.9%) |
| 75 Years and over | 61 (100.0%) | 14 (23.0%) |
| Total | 235 (56.2%) | 178 (42.6%) |
Disability Status by Sex by Age in Florence
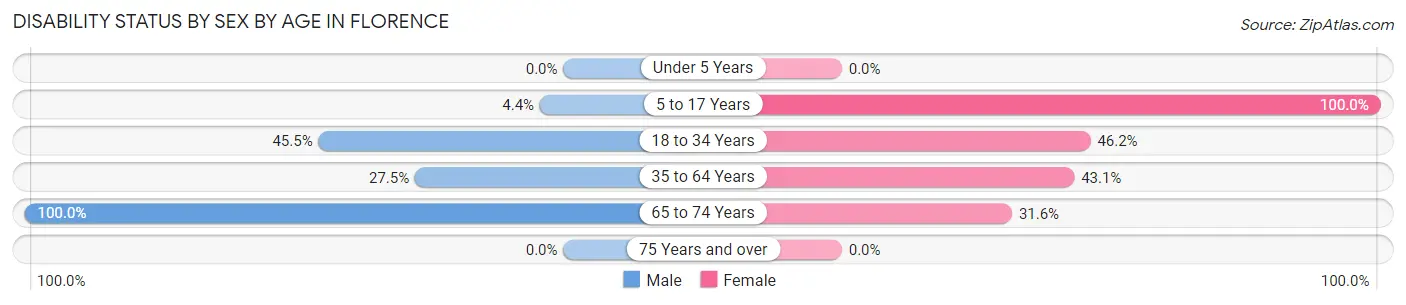
| Age Bracket | Male | Female |
| Under 5 Years | 0 (0.0%) | 0 (0.0%) |
| 5 to 17 Years | 2 (4.3%) | 23 (100.0%) |
| 18 to 34 Years | 10 (45.5%) | 6 (46.2%) |
| 35 to 64 Years | 30 (27.5%) | 44 (43.1%) |
| 65 to 74 Years | 10 (100.0%) | 6 (31.6%) |
| 75 Years and over | 0 (0.0%) | 0 (0.0%) |
Disability Class by Sex by Age in Florence
Disability Class: Hearing Difficulty
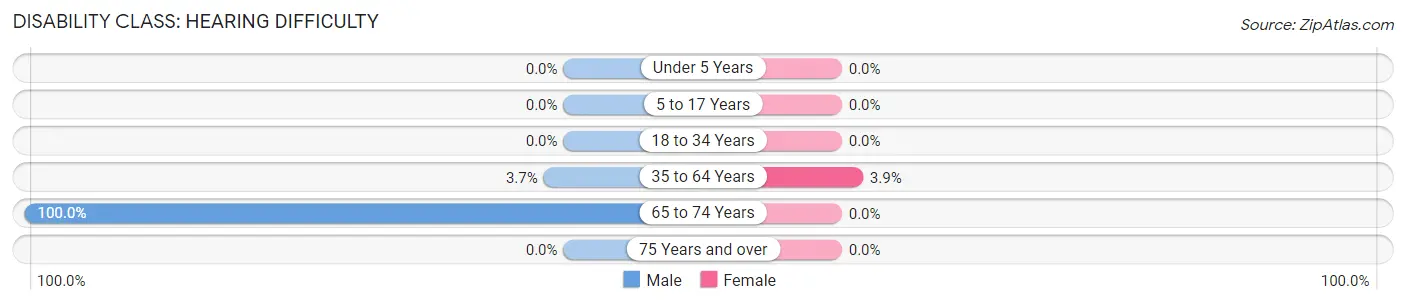
| Age Bracket | Male | Female |
| Under 5 Years | 0 (0.0%) | 0 (0.0%) |
| 5 to 17 Years | 0 (0.0%) | 0 (0.0%) |
| 18 to 34 Years | 0 (0.0%) | 0 (0.0%) |
| 35 to 64 Years | 4 (3.7%) | 4 (3.9%) |
| 65 to 74 Years | 10 (100.0%) | 0 (0.0%) |
| 75 Years and over | 0 (0.0%) | 0 (0.0%) |
Disability Class: Vision Difficulty
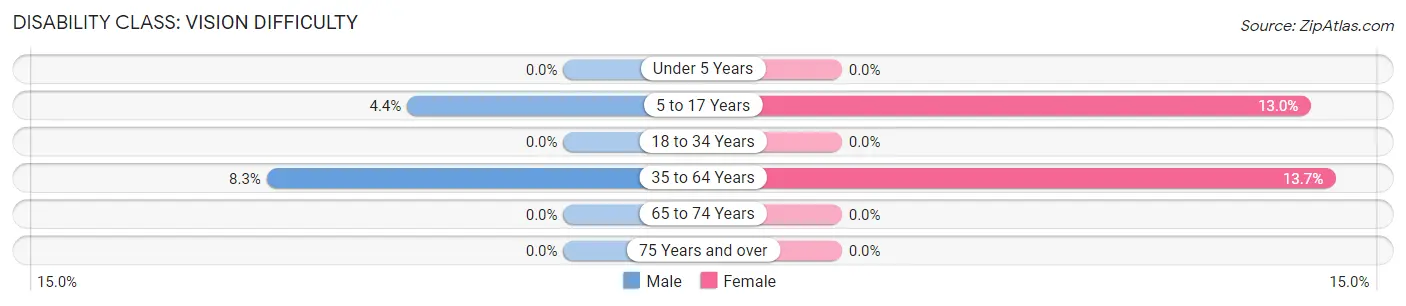
| Age Bracket | Male | Female |
| Under 5 Years | 0 (0.0%) | 0 (0.0%) |
| 5 to 17 Years | 2 (4.3%) | 3 (13.0%) |
| 18 to 34 Years | 0 (0.0%) | 0 (0.0%) |
| 35 to 64 Years | 9 (8.3%) | 14 (13.7%) |
| 65 to 74 Years | 0 (0.0%) | 0 (0.0%) |
| 75 Years and over | 0 (0.0%) | 0 (0.0%) |
Disability Class: Cognitive Difficulty
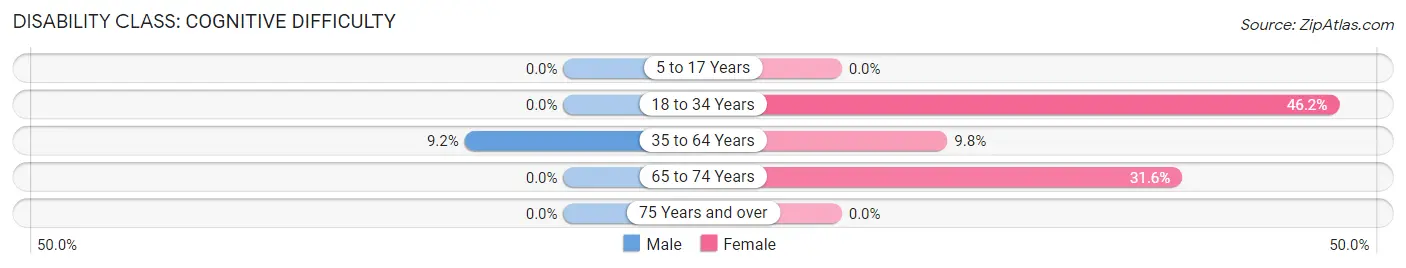
| Age Bracket | Male | Female |
| 5 to 17 Years | 0 (0.0%) | 0 (0.0%) |
| 18 to 34 Years | 0 (0.0%) | 6 (46.2%) |
| 35 to 64 Years | 10 (9.2%) | 10 (9.8%) |
| 65 to 74 Years | 0 (0.0%) | 6 (31.6%) |
| 75 Years and over | 0 (0.0%) | 0 (0.0%) |
Disability Class: Ambulatory Difficulty
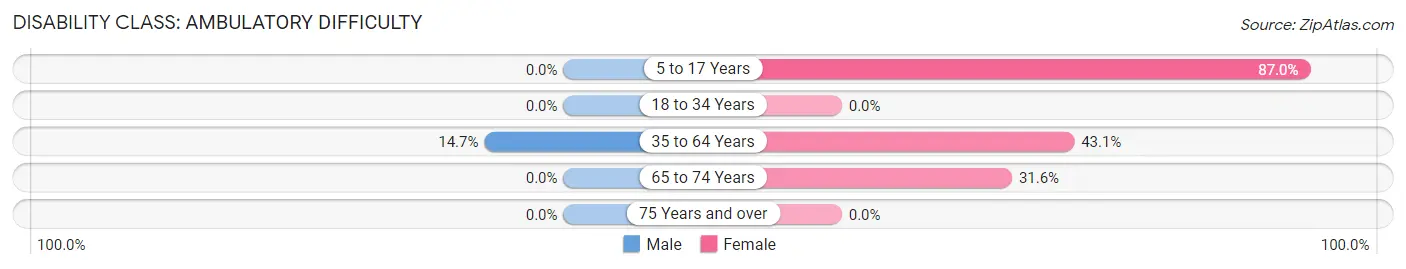
| Age Bracket | Male | Female |
| 5 to 17 Years | 0 (0.0%) | 20 (87.0%) |
| 18 to 34 Years | 0 (0.0%) | 0 (0.0%) |
| 35 to 64 Years | 16 (14.7%) | 44 (43.1%) |
| 65 to 74 Years | 0 (0.0%) | 6 (31.6%) |
| 75 Years and over | 0 (0.0%) | 0 (0.0%) |
Disability Class: Self-Care Difficulty
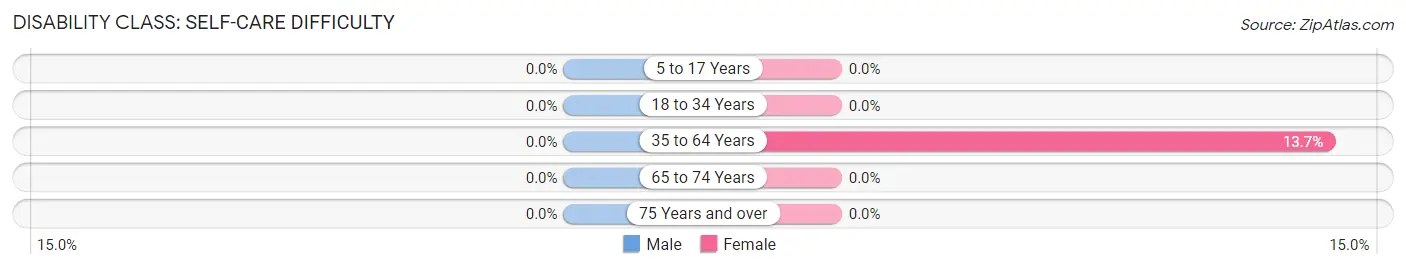
| Age Bracket | Male | Female |
| 5 to 17 Years | 0 (0.0%) | 0 (0.0%) |
| 18 to 34 Years | 0 (0.0%) | 0 (0.0%) |
| 35 to 64 Years | 0 (0.0%) | 14 (13.7%) |
| 65 to 74 Years | 0 (0.0%) | 0 (0.0%) |
| 75 Years and over | 0 (0.0%) | 0 (0.0%) |
Technology Access in Florence
Computing Device Access in Florence
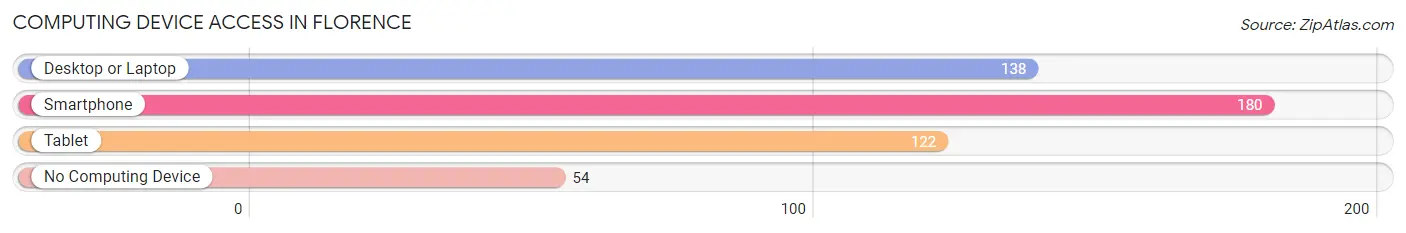
| Device Type | # Households | % Households |
| Desktop or Laptop | 138 | 57.5% |
| Smartphone | 180 | 75.0% |
| Tablet | 122 | 50.8% |
| No Computing Device | 54 | 22.5% |
| Total | 240 | 100.0% |
Internet Access in Florence
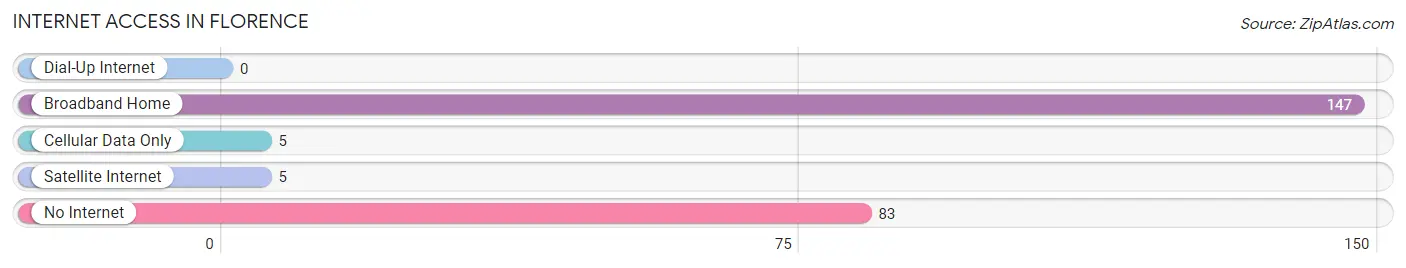
| Internet Type | # Households | % Households |
| Dial-Up Internet | 0 | 0.0% |
| Broadband Home | 147 | 61.3% |
| Cellular Data Only | 5 | 2.1% |
| Satellite Internet | 5 | 2.1% |
| No Internet | 83 | 34.6% |
| Total | 240 | 100.0% |
Florence Summary
Florence, Wisconsin is a small town located in Florence County, Wisconsin. It is situated on the banks of the Pine River, and is the county seat of Florence County. The population of Florence was 1,845 at the 2010 census.
History
Florence was first settled in 1854 by a group of lumberjacks from Michigan. The town was named after Florence, Italy, and was incorporated in 1881. The first post office was established in 1882.
In the late 19th century, Florence was a major lumbering center. The town was home to several sawmills, and the lumber industry was the main source of employment for the town's residents.
In the early 20th century, Florence began to transition away from its reliance on the lumber industry. The town became a center for the production of paper products, and several paper mills were established in the area.
Geography
Florence is located in northern Wisconsin, in Florence County. It is situated on the banks of the Pine River, and is surrounded by forests and lakes. The town is located approximately 30 miles north of Iron Mountain, Michigan, and is about 90 miles northwest of Green Bay.
The terrain around Florence is mostly flat, with some rolling hills. The town is located in a region of Wisconsin known as the Northwoods, and is home to a variety of wildlife, including deer, bear, and moose.
Economy
Florence's economy is largely based on the paper industry. The town is home to several paper mills, which produce a variety of paper products, including newsprint, cardboard, and tissue paper.
In addition to the paper industry, Florence is also home to several small businesses, including restaurants, retail stores, and service providers. The town is also home to a number of tourist attractions, including the Florence County Historical Museum and the Florence County Fairgrounds.
Demographics
As of the 2010 census, the population of Florence was 1,845. The racial makeup of the town was 97.2% White, 0.3% African American, 0.2% Native American, 0.2% Asian, 0.1% Pacific Islander, 0.7% from other races, and 1.3% from two or more races. Hispanic or Latino of any race were 1.7% of the population.
The median household income in Florence was $37,917, and the median family income was $45,938. The per capita income for the town was $19,945. About 11.2% of families and 14.3% of the population were below the poverty line, including 19.2% of those under age 18 and 8.2% of those age 65 or over.
Common Questions
What is Per Capita Income in Florence?
Per Capita income in Florence is $20,690.
What is the Median Family Income in Florence?
Median Family Income in Florence is $37,750.
What is the Median Household income in Florence?
Median Household Income in Florence is $30,500.
What is Income or Wage Gap in Florence?
Income or Wage Gap in Florence is 24.7%.
Women in Florence earn 75.3 cents for every dollar earned by a man.
What is Inequality or Gini Index in Florence?
Inequality or Gini Index in Florence is 0.42.
What is the Total Population of Florence?
Total Population of Florence is 477.
What is the Total Male Population of Florence?
Total Male Population of Florence is 238.
What is the Total Female Population of Florence?
Total Female Population of Florence is 239.
What is the Ratio of Males per 100 Females in Florence?
There are 99.58 Males per 100 Females in Florence.
What is the Ratio of Females per 100 Males in Florence?
There are 100.42 Females per 100 Males in Florence.
What is the Median Population Age in Florence?
Median Population Age in Florence is 57.5 Years.
What is the Average Family Size in Florence
Average Family Size in Florence is 2.4 People.
What is the Average Household Size in Florence
Average Household Size in Florence is 1.7 People.
How Large is the Labor Force in Florence?
There are 163 People in the Labor Forcein in Florence.
What is the Percentage of People in the Labor Force in Florence?
40.8% of People are in the Labor Force in Florence.
What is the Unemployment Rate in Florence?
Unemployment Rate in Florence is 16.6%.