Fall Creek, WI Map & Demographics
Fall Creek Map
Fall Creek Overview
$32,381
PER CAPITA INCOME
$97,125
AVG FAMILY INCOME
$76,417
AVG HOUSEHOLD INCOME
28.9%
WAGE / INCOME GAP [ % ]
71.1¢/ $1
WAGE / INCOME GAP [ $ ]
0.37
INEQUALITY / GINI INDEX
1,459
TOTAL POPULATION
712
MALE POPULATION
747
FEMALE POPULATION
95.31
MALES / 100 FEMALES
104.92
FEMALES / 100 MALES
34.5
MEDIAN AGE
3.7
AVG FAMILY SIZE
3.0
AVG HOUSEHOLD SIZE
872
LABOR FORCE [ PEOPLE ]
77.8%
PERCENT IN LABOR FORCE
2.8%
UNEMPLOYMENT RATE
Fall Creek Zip Codes
Fall Creek Area Codes
Income in Fall Creek
Income Overview in Fall Creek
Per Capita Income in Fall Creek is $32,381, while median incomes of families and households are $97,125 and $76,417 respectively.
| Characteristic | Number | Measure |
| Per Capita Income | 1,459 | $32,381 |
| Median Family Income | 333 | $97,125 |
| Mean Family Income | 333 | $109,720 |
| Median Household Income | 477 | $76,417 |
| Mean Household Income | 477 | $89,602 |
| Income Deficit | 333 | $0 |
| Wage / Income Gap (%) | 1,459 | 28.91% |
| Wage / Income Gap ($) | 1,459 | 71.09¢ per $1 |
| Gini / Inequality Index | 1,459 | 0.37 |
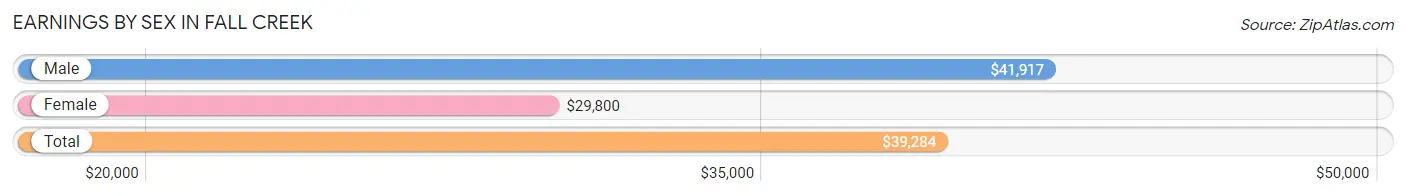
Earnings by Sex in Fall Creek
Average Earnings in Fall Creek are $39,284, $41,917 for men and $29,800 for women, a difference of 28.9%.
| Sex | Number | Average Earnings |
| Male | 449 (49.9%) | $41,917 |
| Female | 450 (50.1%) | $29,800 |
| Total | 899 (100.0%) | $39,284 |
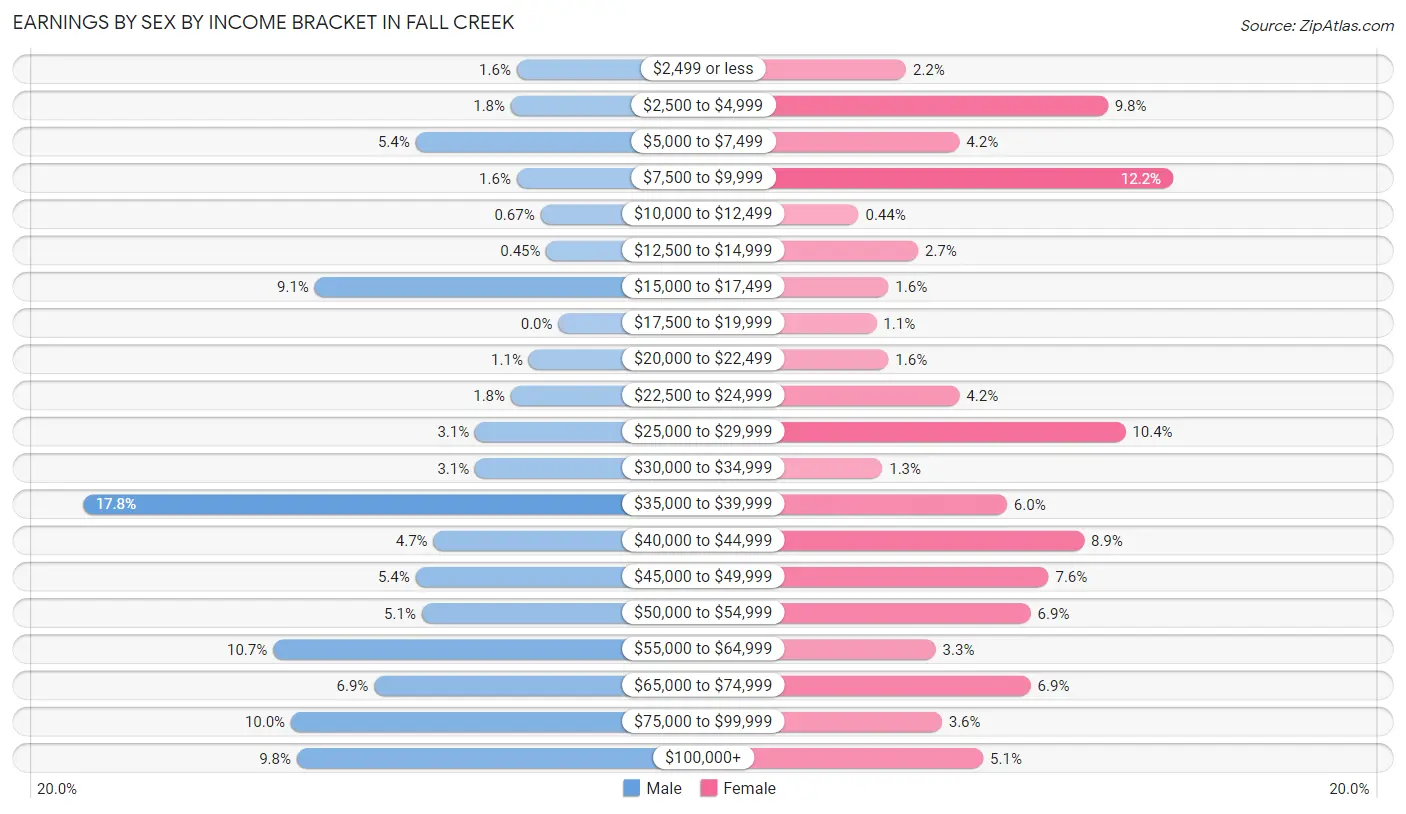
Earnings by Sex by Income Bracket in Fall Creek
The most common earnings brackets in Fall Creek are $35,000 to $39,999 for men (80 | 17.8%) and $7,500 to $9,999 for women (55 | 12.2%).
| Income | Male | Female |
| $2,499 or less | 7 (1.6%) | 10 (2.2%) |
| $2,500 to $4,999 | 8 (1.8%) | 44 (9.8%) |
| $5,000 to $7,499 | 24 (5.3%) | 19 (4.2%) |
| $7,500 to $9,999 | 7 (1.6%) | 55 (12.2%) |
| $10,000 to $12,499 | 3 (0.7%) | 2 (0.4%) |
| $12,500 to $14,999 | 2 (0.4%) | 12 (2.7%) |
| $15,000 to $17,499 | 41 (9.1%) | 7 (1.6%) |
| $17,500 to $19,999 | 0 (0.0%) | 5 (1.1%) |
| $20,000 to $22,499 | 5 (1.1%) | 7 (1.6%) |
| $22,500 to $24,999 | 8 (1.8%) | 19 (4.2%) |
| $25,000 to $29,999 | 14 (3.1%) | 47 (10.4%) |
| $30,000 to $34,999 | 14 (3.1%) | 6 (1.3%) |
| $35,000 to $39,999 | 80 (17.8%) | 27 (6.0%) |
| $40,000 to $44,999 | 21 (4.7%) | 40 (8.9%) |
| $45,000 to $49,999 | 24 (5.3%) | 34 (7.6%) |
| $50,000 to $54,999 | 23 (5.1%) | 31 (6.9%) |
| $55,000 to $64,999 | 48 (10.7%) | 15 (3.3%) |
| $65,000 to $74,999 | 31 (6.9%) | 31 (6.9%) |
| $75,000 to $99,999 | 45 (10.0%) | 16 (3.6%) |
| $100,000+ | 44 (9.8%) | 23 (5.1%) |
| Total | 449 (100.0%) | 450 (100.0%) |
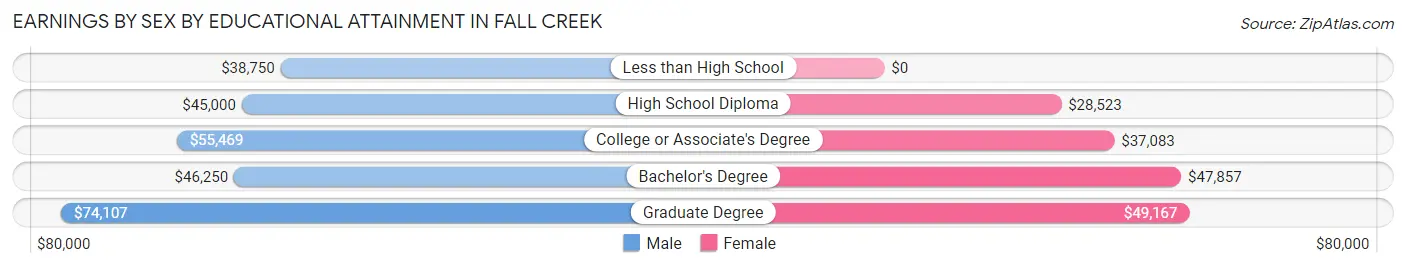
Earnings by Sex by Educational Attainment in Fall Creek
Average earnings in Fall Creek are $50,547 for men and $40,598 for women, a difference of 19.7%. Men with an educational attainment of graduate degree enjoy the highest average annual earnings of $74,107, while those with less than high school education earn the least with $38,750. Women with an educational attainment of graduate degree earn the most with the average annual earnings of $49,167, while those with high school diploma education have the smallest earnings of $28,523.
| Educational Attainment | Male Income | Female Income |
| Less than High School | $38,750 | $0 |
| High School Diploma | $45,000 | $28,523 |
| College or Associate's Degree | $55,469 | $37,083 |
| Bachelor's Degree | $46,250 | $47,857 |
| Graduate Degree | $74,107 | $49,167 |
| Total | $50,547 | $40,598 |
Family Income in Fall Creek
Family Income Brackets in Fall Creek
According to the Fall Creek family income data, there are 103 families falling into the $100,000 to $149,999 income range, which is the most common income bracket and makes up 30.9% of all families.
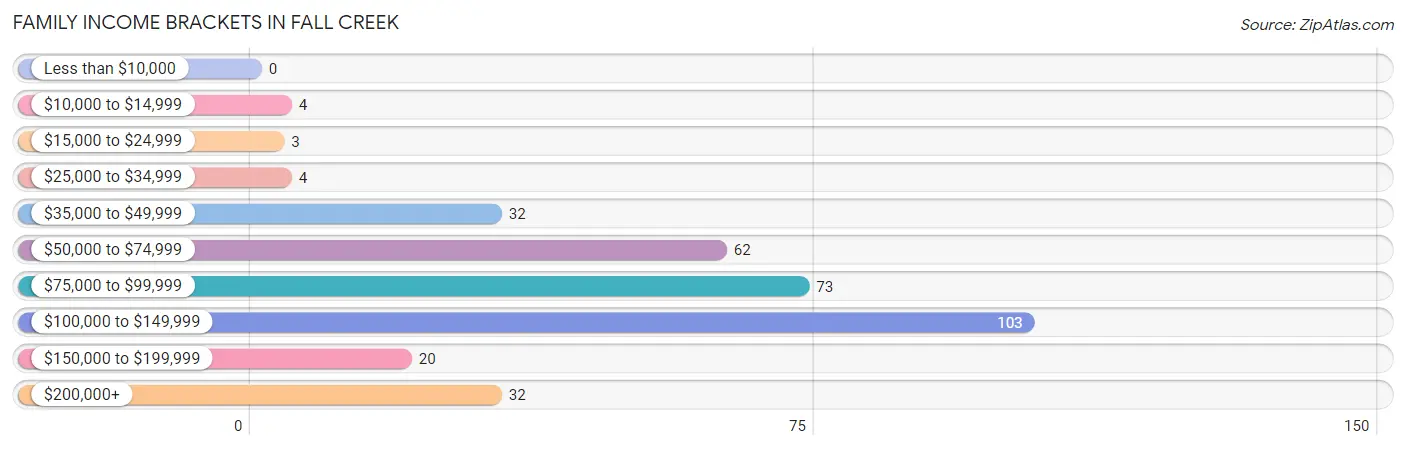
| Income Bracket | # Families | % Families |
| Less than $10,000 | 0 | 0.0% |
| $10,000 to $14,999 | 4 | 1.2% |
| $15,000 to $24,999 | 3 | 0.9% |
| $25,000 to $34,999 | 4 | 1.2% |
| $35,000 to $49,999 | 32 | 9.6% |
| $50,000 to $74,999 | 62 | 18.6% |
| $75,000 to $99,999 | 73 | 21.9% |
| $100,000 to $149,999 | 103 | 30.9% |
| $150,000 to $199,999 | 20 | 6.0% |
| $200,000+ | 32 | 9.6% |
Family Income by Famaliy Size in Fall Creek
4-person families (77 | 23.1%) account for the highest median family income in Fall Creek with $110,156 per family, while 2-person families (125 | 37.5%) have the highest median income of $42,054 per family member.
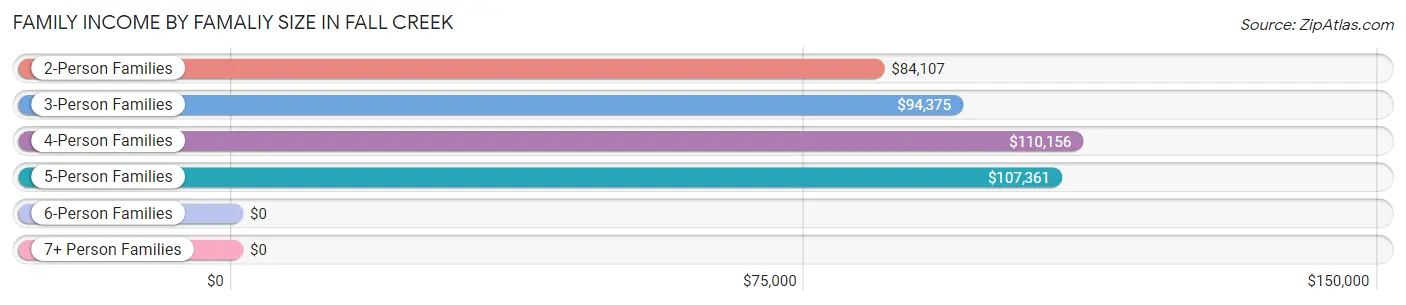
| Income Bracket | # Families | Median Income |
| 2-Person Families | 125 (37.5%) | $84,107 |
| 3-Person Families | 82 (24.6%) | $94,375 |
| 4-Person Families | 77 (23.1%) | $110,156 |
| 5-Person Families | 41 (12.3%) | $107,361 |
| 6-Person Families | 5 (1.5%) | $0 |
| 7+ Person Families | 3 (0.9%) | $0 |
| Total | 333 (100.0%) | $97,125 |
Family Income by Number of Earners in Fall Creek
The median family income in Fall Creek is $97,125, with families comprising 3+ earners (65) having the highest median family income of $139,375, while families with no earners (22) have the lowest median family income of $66,250, accounting for 19.5% and 6.6% of families, respectively.
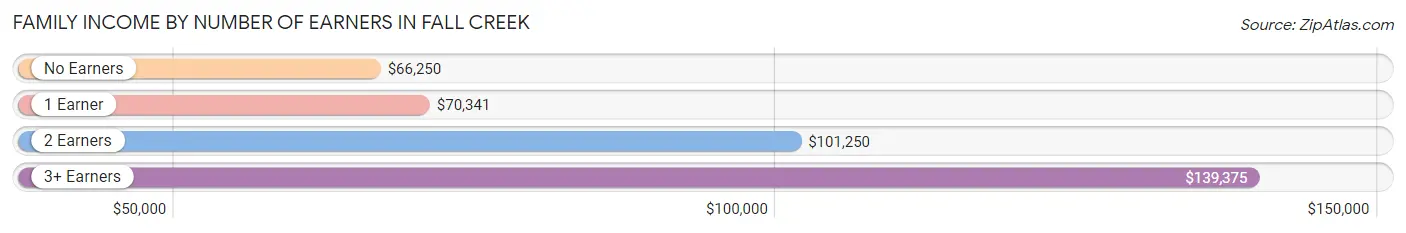
| Number of Earners | # Families | Median Income |
| No Earners | 22 (6.6%) | $66,250 |
| 1 Earner | 83 (24.9%) | $70,341 |
| 2 Earners | 163 (48.9%) | $101,250 |
| 3+ Earners | 65 (19.5%) | $139,375 |
| Total | 333 (100.0%) | $97,125 |
Household Income in Fall Creek
Household Income Brackets in Fall Creek
With 107 households falling in the category, the $100,000 to $149,999 income range is the most frequent in Fall Creek, accounting for 22.4% of all households. In contrast, only 6 households (1.3%) fall into the less than $10,000 income bracket, making it the least populous group.
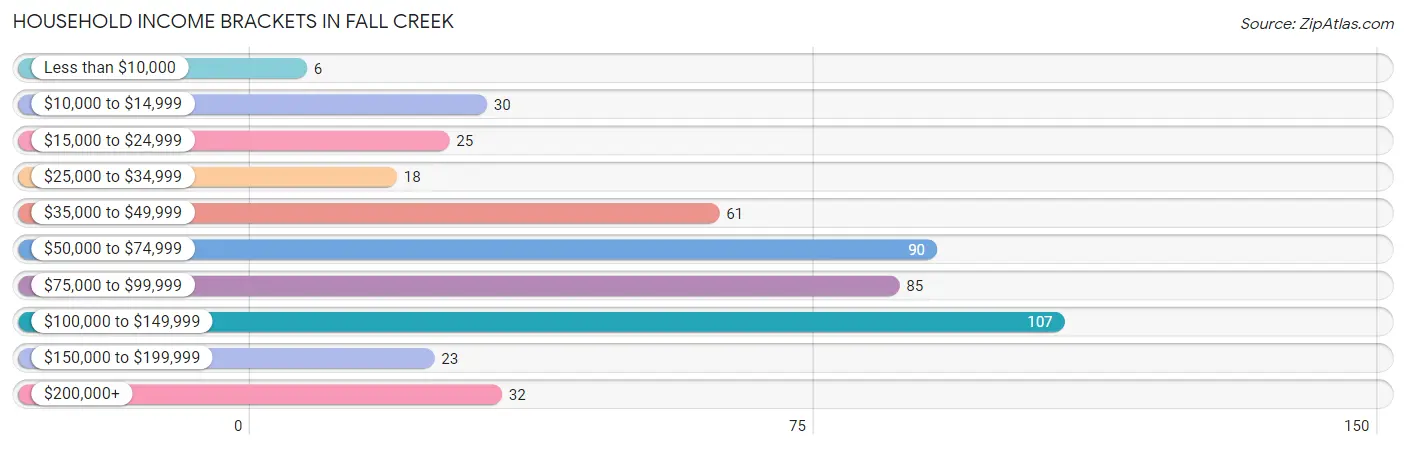
| Income Bracket | # Households | % Households |
| Less than $10,000 | 6 | 1.3% |
| $10,000 to $14,999 | 30 | 6.3% |
| $15,000 to $24,999 | 25 | 5.2% |
| $25,000 to $34,999 | 18 | 3.8% |
| $35,000 to $49,999 | 61 | 12.8% |
| $50,000 to $74,999 | 90 | 18.9% |
| $75,000 to $99,999 | 85 | 17.8% |
| $100,000 to $149,999 | 107 | 22.4% |
| $150,000 to $199,999 | 23 | 4.8% |
| $200,000+ | 32 | 6.7% |
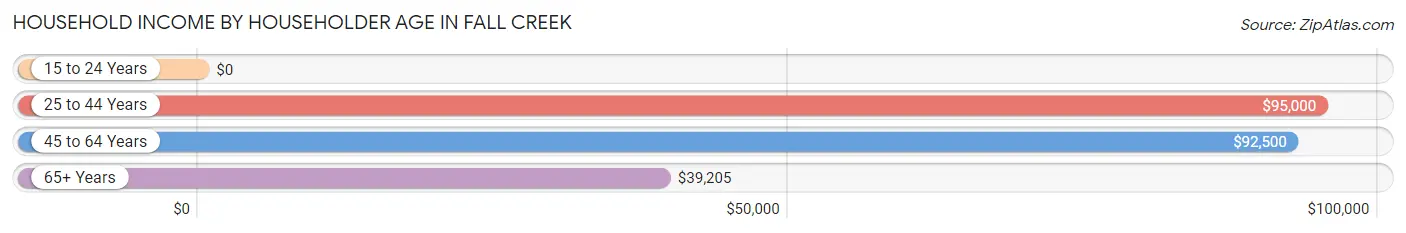
Household Income by Householder Age in Fall Creek
The median household income in Fall Creek is $76,417, with the highest median household income of $95,000 found in the 25 to 44 years age bracket for the primary householder. A total of 174 households (36.5%) fall into this category. Meanwhile, the 15 to 24 years age bracket for the primary householder has the lowest median household income of $0, with 8 households (1.7%) in this group.
| Income Bracket | # Households | Median Income |
| 15 to 24 Years | 8 (1.7%) | $0 |
| 25 to 44 Years | 174 (36.5%) | $95,000 |
| 45 to 64 Years | 176 (36.9%) | $92,500 |
| 65+ Years | 119 (24.9%) | $39,205 |
| Total | 477 (100.0%) | $76,417 |
Poverty in Fall Creek
Income Below Poverty by Sex and Age in Fall Creek
With 1.3% poverty level for males and 6.9% for females among the residents of Fall Creek, 5 year old males and 75 year old and over females are the most vulnerable to poverty, with 3 males (10.0%) and 6 females (14.6%) in their respective age groups living below the poverty level.
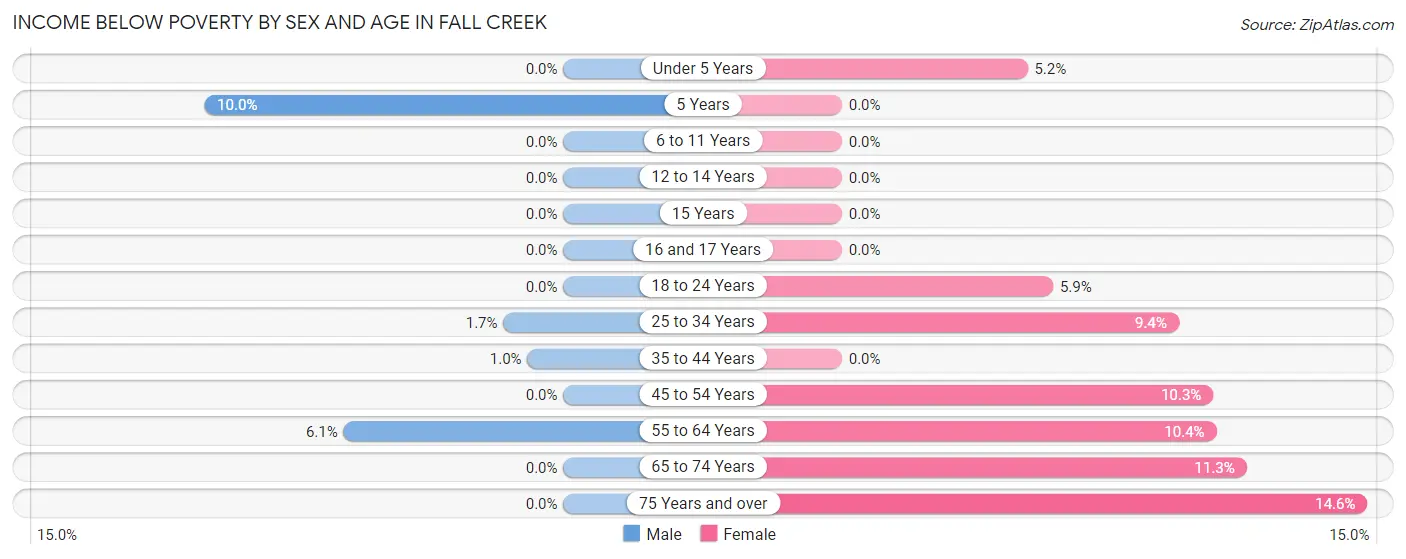
| Age Bracket | Male | Female |
| Under 5 Years | 0 (0.0%) | 3 (5.2%) |
| 5 Years | 3 (10.0%) | 0 (0.0%) |
| 6 to 11 Years | 0 (0.0%) | 0 (0.0%) |
| 12 to 14 Years | 0 (0.0%) | 0 (0.0%) |
| 15 Years | 0 (0.0%) | 0 (0.0%) |
| 16 and 17 Years | 0 (0.0%) | 0 (0.0%) |
| 18 to 24 Years | 0 (0.0%) | 4 (5.9%) |
| 25 to 34 Years | 2 (1.7%) | 9 (9.4%) |
| 35 to 44 Years | 1 (1.0%) | 0 (0.0%) |
| 45 to 54 Years | 0 (0.0%) | 9 (10.3%) |
| 55 to 64 Years | 3 (6.1%) | 12 (10.4%) |
| 65 to 74 Years | 0 (0.0%) | 8 (11.3%) |
| 75 Years and over | 0 (0.0%) | 6 (14.6%) |
| Total | 9 (1.3%) | 51 (6.9%) |
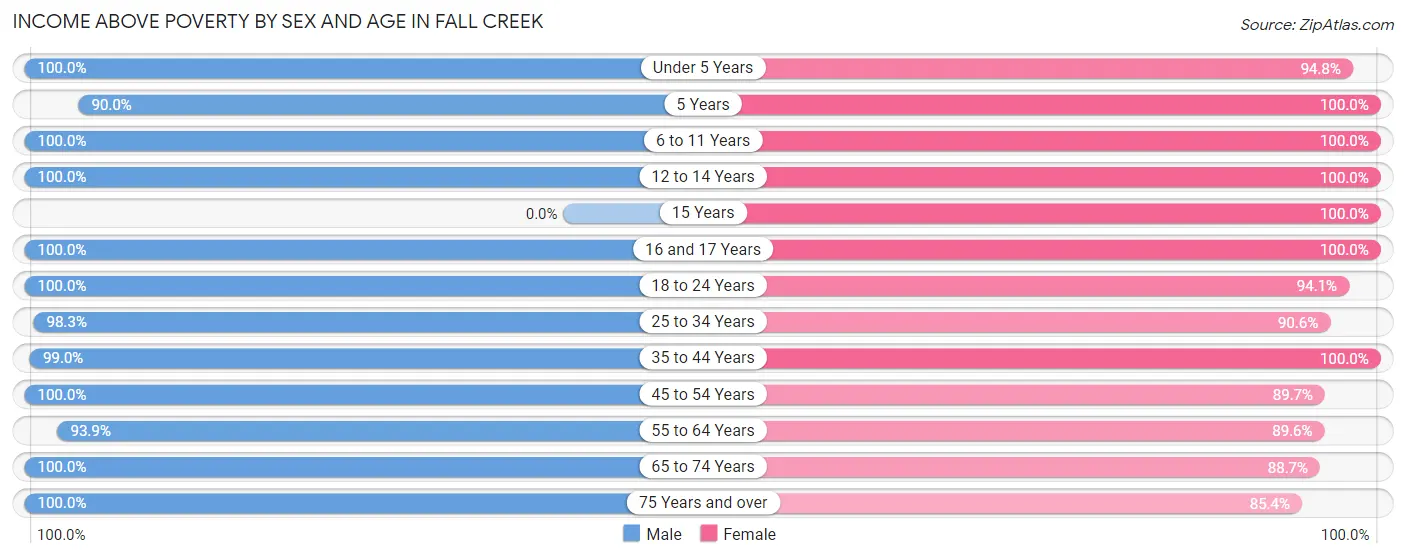
Income Above Poverty by Sex and Age in Fall Creek
According to the poverty statistics in Fall Creek, males aged under 5 years and females aged 5 years are the age groups that are most secure financially, with 100.0% of males and 100.0% of females in these age groups living above the poverty line.
| Age Bracket | Male | Female |
| Under 5 Years | 38 (100.0%) | 55 (94.8%) |
| 5 Years | 27 (90.0%) | 3 (100.0%) |
| 6 to 11 Years | 81 (100.0%) | 54 (100.0%) |
| 12 to 14 Years | 26 (100.0%) | 28 (100.0%) |
| 15 Years | 0 (0.0%) | 14 (100.0%) |
| 16 and 17 Years | 13 (100.0%) | 18 (100.0%) |
| 18 to 24 Years | 91 (100.0%) | 64 (94.1%) |
| 25 to 34 Years | 118 (98.3%) | 87 (90.6%) |
| 35 to 44 Years | 99 (99.0%) | 85 (100.0%) |
| 45 to 54 Years | 66 (100.0%) | 78 (89.7%) |
| 55 to 64 Years | 46 (93.9%) | 103 (89.6%) |
| 65 to 74 Years | 43 (100.0%) | 63 (88.7%) |
| 75 Years and over | 30 (100.0%) | 35 (85.4%) |
| Total | 678 (98.7%) | 687 (93.1%) |
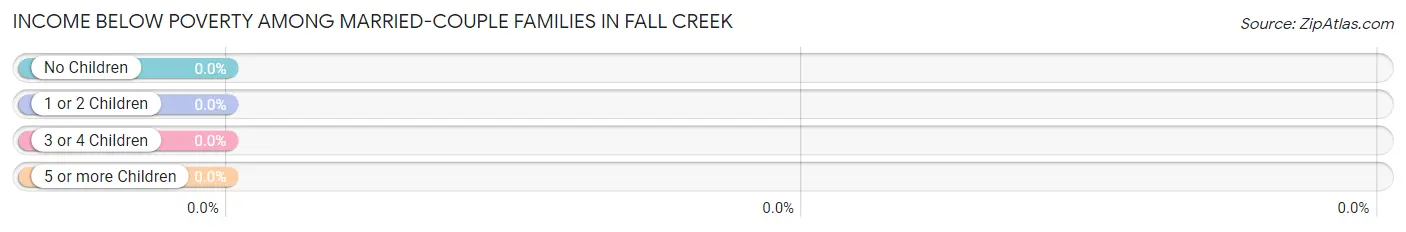
Income Below Poverty Among Married-Couple Families in Fall Creek
| Children | Above Poverty | Below Poverty |
| No Children | 148 (100.0%) | 0 (0.0%) |
| 1 or 2 Children | 83 (100.0%) | 0 (0.0%) |
| 3 or 4 Children | 23 (100.0%) | 0 (0.0%) |
| 5 or more Children | 3 (100.0%) | 0 (0.0%) |
| Total | 257 (100.0%) | 0 (0.0%) |
Income Below Poverty Among Single-Parent Households in Fall Creek
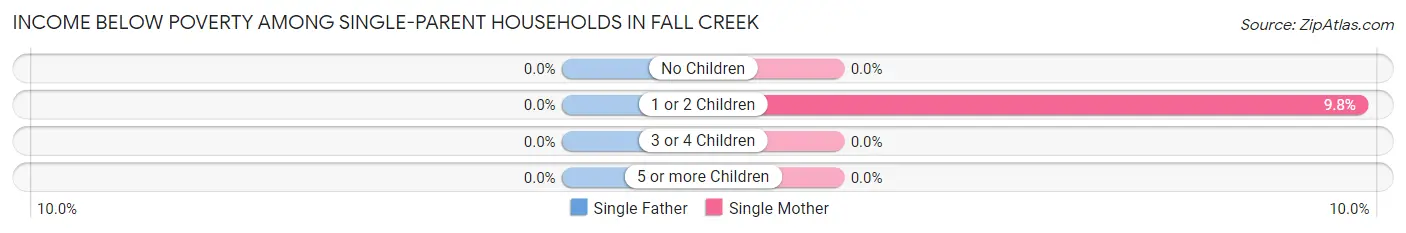
| Children | Single Father | Single Mother |
| No Children | 0 (0.0%) | 0 (0.0%) |
| 1 or 2 Children | 0 (0.0%) | 4 (9.8%) |
| 3 or 4 Children | 0 (0.0%) | 0 (0.0%) |
| 5 or more Children | 0 (0.0%) | 0 (0.0%) |
| Total | 0 (0.0%) | 4 (7.1%) |
Income Below Poverty Among Married-Couple vs Single-Parent Households in Fall Creek
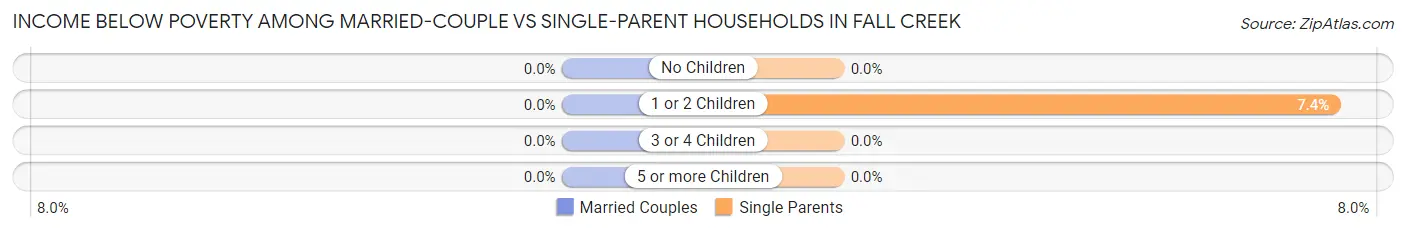
| Children | Married-Couple Families | Single-Parent Households |
| No Children | 0 (0.0%) | 0 (0.0%) |
| 1 or 2 Children | 0 (0.0%) | 4 (7.4%) |
| 3 or 4 Children | 0 (0.0%) | 0 (0.0%) |
| 5 or more Children | 0 (0.0%) | 0 (0.0%) |
| Total | 0 (0.0%) | 4 (5.3%) |
Race in Fall Creek
The most populous races in Fall Creek are White / Caucasian (1,414 | 96.9%), Hispanic or Latino (30 | 2.1%), and Two or more Races (30 | 2.1%).
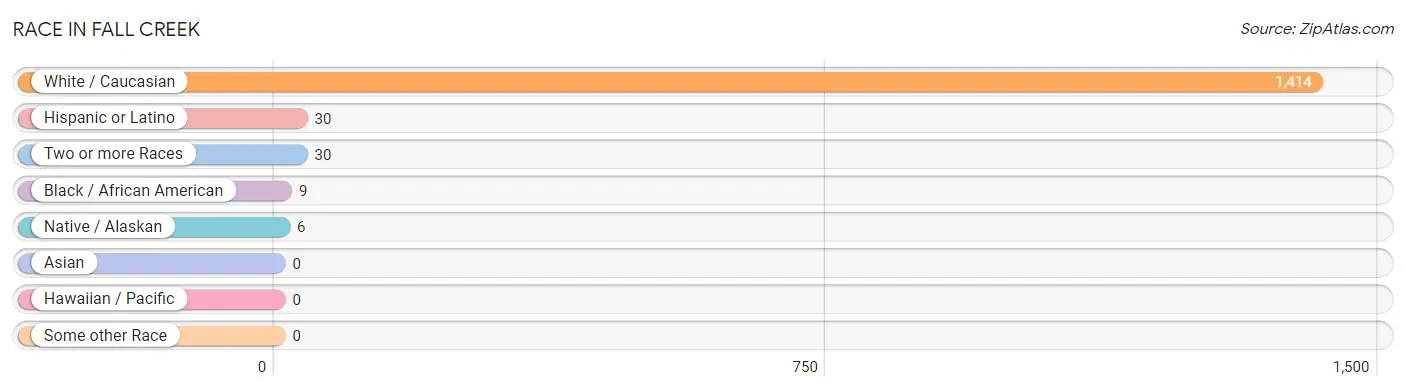
| Race | # Population | % Population |
| Asian | 0 | 0.0% |
| Black / African American | 9 | 0.6% |
| Hawaiian / Pacific | 0 | 0.0% |
| Hispanic or Latino | 30 | 2.1% |
| Native / Alaskan | 6 | 0.4% |
| White / Caucasian | 1,414 | 96.9% |
| Two or more Races | 30 | 2.1% |
| Some other Race | 0 | 0.0% |
| Total | 1,459 | 100.0% |
Ancestry in Fall Creek
The most populous ancestries reported in Fall Creek are German (864 | 59.2%), Norwegian (228 | 15.6%), Irish (148 | 10.1%), English (84 | 5.8%), and Polish (81 | 5.6%), together accounting for 96.3% of all Fall Creek residents.
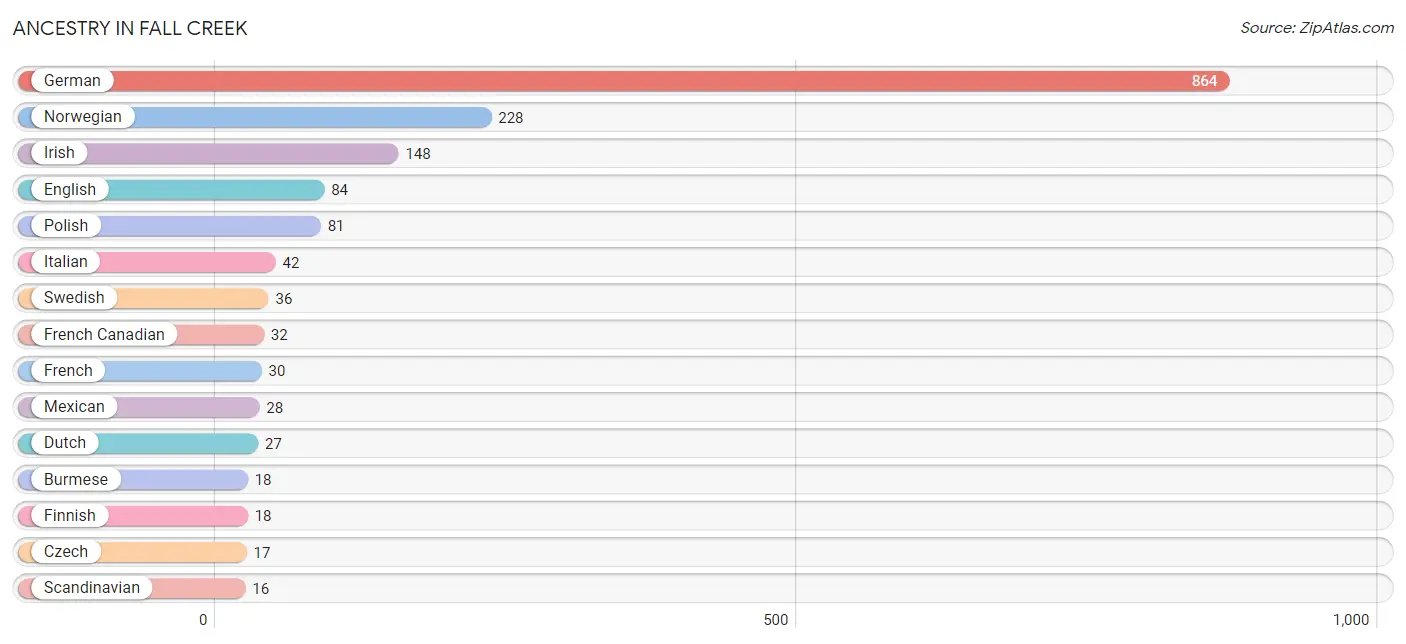
| Ancestry | # Population | % Population |
| Austrian | 7 | 0.5% |
| British | 4 | 0.3% |
| Burmese | 18 | 1.2% |
| Chippewa | 10 | 0.7% |
| Czech | 17 | 1.2% |
| Danish | 4 | 0.3% |
| Dutch | 27 | 1.8% |
| English | 84 | 5.8% |
| European | 1 | 0.1% |
| Finnish | 18 | 1.2% |
| French | 30 | 2.1% |
| French Canadian | 32 | 2.2% |
| German | 864 | 59.2% |
| Greek | 3 | 0.2% |
| Hungarian | 3 | 0.2% |
| Irish | 148 | 10.1% |
| Italian | 42 | 2.9% |
| Mexican | 28 | 1.9% |
| Northern European | 2 | 0.1% |
| Norwegian | 228 | 15.6% |
| Polish | 81 | 5.6% |
| Scandinavian | 16 | 1.1% |
| Scotch-Irish | 3 | 0.2% |
| Scottish | 8 | 0.5% |
| Swedish | 36 | 2.5% |
| Swiss | 5 | 0.3% |
| Ukrainian | 4 | 0.3% | View All 27 Rows |
Immigrants in Fall Creek
The most numerous immigrant groups reported in Fall Creek came from Central America (7 | 0.5%), Latin America (7 | 0.5%), Mexico (7 | 0.5%), Europe (4 | 0.3%), and Germany (4 | 0.3%), together accounting for 2.0% of all Fall Creek residents.
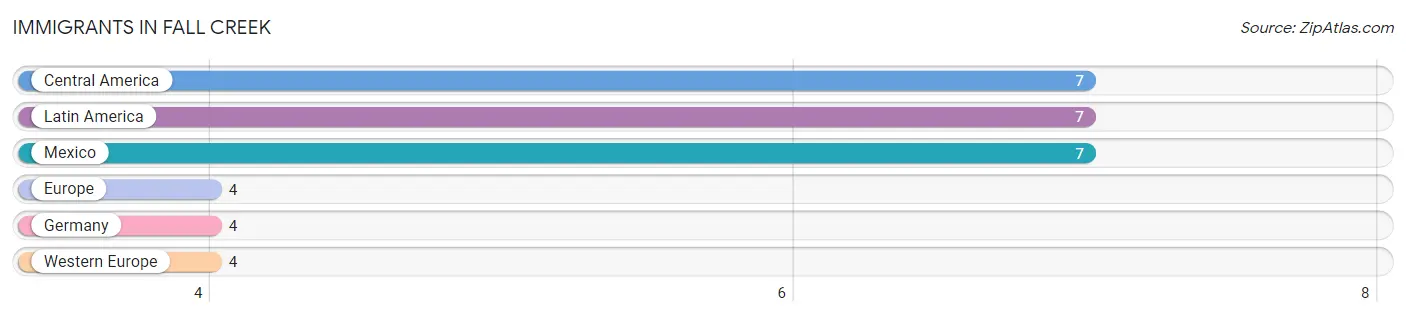
| Immigration Origin | # Population | % Population |
| Central America | 7 | 0.5% |
| Europe | 4 | 0.3% |
| Germany | 4 | 0.3% |
| Latin America | 7 | 0.5% |
| Mexico | 7 | 0.5% |
| Western Europe | 4 | 0.3% | View All 6 Rows |
Sex and Age in Fall Creek
Sex and Age in Fall Creek
The most populous age groups in Fall Creek are 5 to 9 Years (98 | 13.8%) for men and 15 to 19 Years (81 | 10.8%) for women.
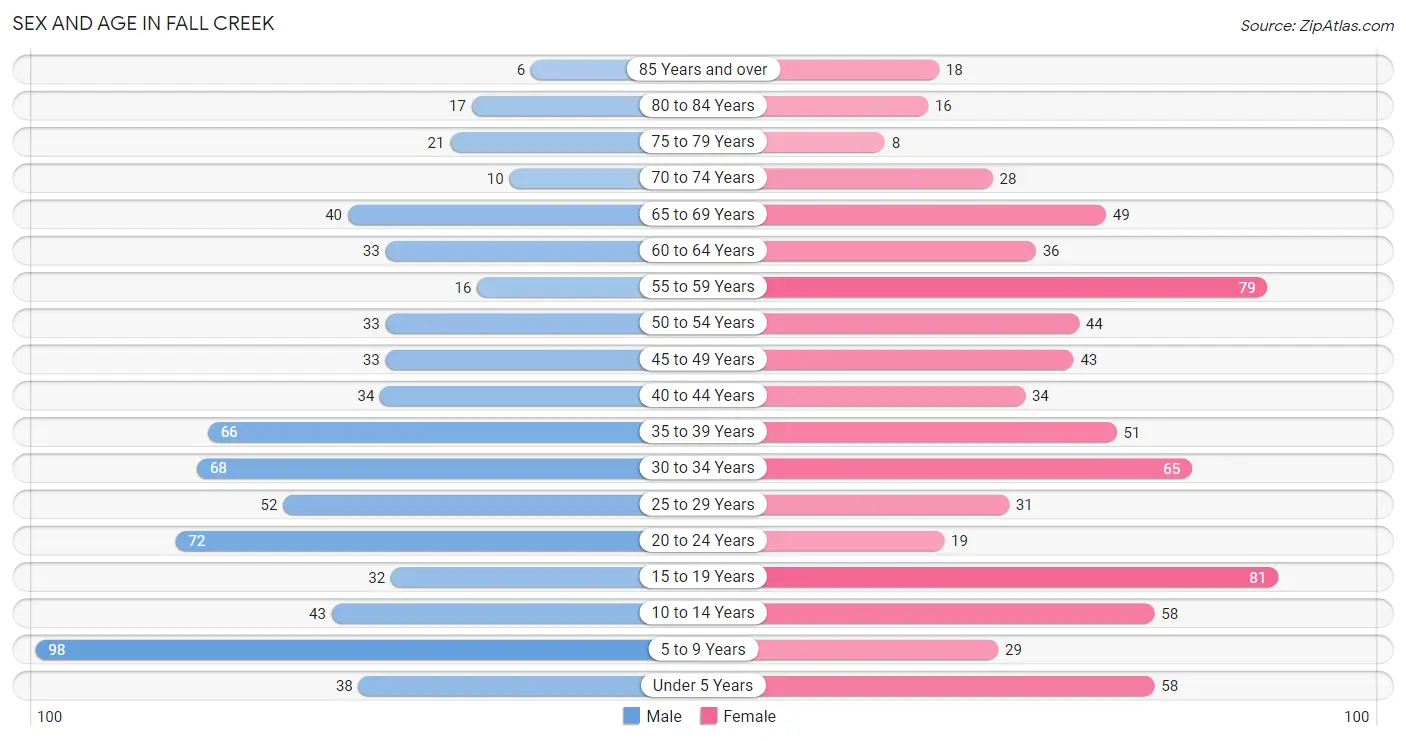
| Age Bracket | Male | Female |
| Under 5 Years | 38 (5.3%) | 58 (7.8%) |
| 5 to 9 Years | 98 (13.8%) | 29 (3.9%) |
| 10 to 14 Years | 43 (6.0%) | 58 (7.8%) |
| 15 to 19 Years | 32 (4.5%) | 81 (10.8%) |
| 20 to 24 Years | 72 (10.1%) | 19 (2.5%) |
| 25 to 29 Years | 52 (7.3%) | 31 (4.2%) |
| 30 to 34 Years | 68 (9.6%) | 65 (8.7%) |
| 35 to 39 Years | 66 (9.3%) | 51 (6.8%) |
| 40 to 44 Years | 34 (4.8%) | 34 (4.5%) |
| 45 to 49 Years | 33 (4.6%) | 43 (5.8%) |
| 50 to 54 Years | 33 (4.6%) | 44 (5.9%) |
| 55 to 59 Years | 16 (2.2%) | 79 (10.6%) |
| 60 to 64 Years | 33 (4.6%) | 36 (4.8%) |
| 65 to 69 Years | 40 (5.6%) | 49 (6.6%) |
| 70 to 74 Years | 10 (1.4%) | 28 (3.7%) |
| 75 to 79 Years | 21 (2.9%) | 8 (1.1%) |
| 80 to 84 Years | 17 (2.4%) | 16 (2.1%) |
| 85 Years and over | 6 (0.8%) | 18 (2.4%) |
| Total | 712 (100.0%) | 747 (100.0%) |
Families and Households in Fall Creek
Median Family Size in Fall Creek
The median family size in Fall Creek is 3.70 persons per family, with married-couple families (257 | 77.2%) accounting for the largest median family size of 3.75 persons per family. On the other hand, single male/father families (20 | 6.0%) represent the smallest median family size with 3.10 persons per family.
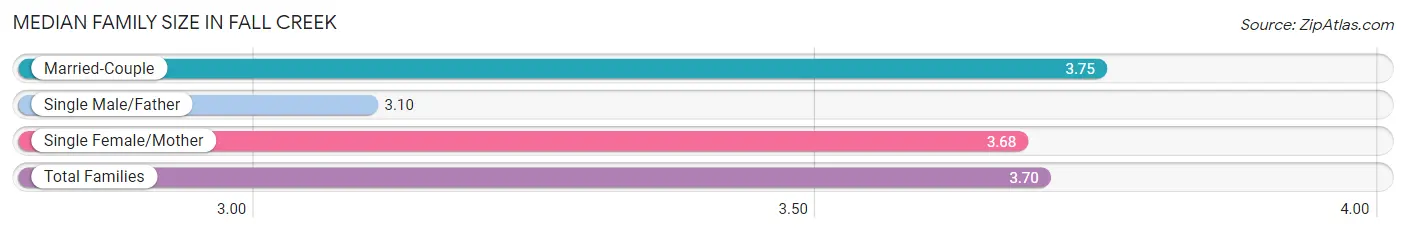
| Family Type | # Families | Family Size |
| Married-Couple | 257 (77.2%) | 3.75 |
| Single Male/Father | 20 (6.0%) | 3.10 |
| Single Female/Mother | 56 (16.8%) | 3.68 |
| Total Families | 333 (100.0%) | 3.70 |
Median Household Size in Fall Creek
The median household size in Fall Creek is 2.99 persons per household, with married-couple households (257 | 53.9%) accounting for the largest median household size of 3.75 persons per household. non-family households (144 | 30.2%) represent the smallest median household size with 1.24 persons per household.
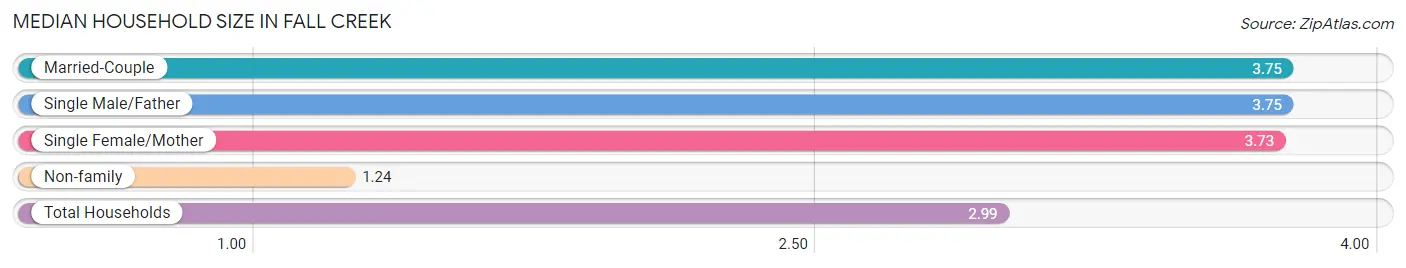
| Household Type | # Households | Household Size |
| Married-Couple | 257 (53.9%) | 3.75 |
| Single Male/Father | 20 (4.2%) | 3.75 |
| Single Female/Mother | 56 (11.7%) | 3.73 |
| Non-family | 144 (30.2%) | 1.24 |
| Total Households | 477 (100.0%) | 2.99 |
Household Size by Marriage Status in Fall Creek
Out of a total of 477 households in Fall Creek, 333 (69.8%) are family households, while 144 (30.2%) are nonfamily households. The most numerous type of family households are 2-person households, comprising 125, and the most common type of nonfamily households are 1-person households, comprising 119.
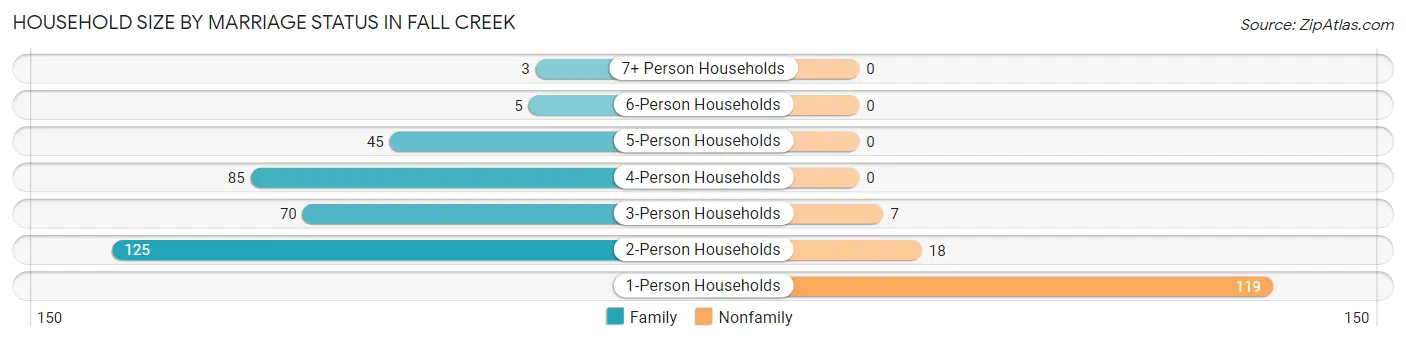
| Household Size | Family Households | Nonfamily Households |
| 1-Person Households | - | 119 (24.9%) |
| 2-Person Households | 125 (26.2%) | 18 (3.8%) |
| 3-Person Households | 70 (14.7%) | 7 (1.5%) |
| 4-Person Households | 85 (17.8%) | 0 (0.0%) |
| 5-Person Households | 45 (9.4%) | 0 (0.0%) |
| 6-Person Households | 5 (1.1%) | 0 (0.0%) |
| 7+ Person Households | 3 (0.6%) | 0 (0.0%) |
| Total | 333 (69.8%) | 144 (30.2%) |
Female Fertility in Fall Creek
Fertility by Age in Fall Creek
Average fertility rate in Fall Creek is 30.0 births per 1,000 women. Women in the age bracket of 20 to 34 years have the highest fertility rate with 70.0 births per 1,000 women. Women in the age bracket of 20 to 34 years acount for 80.0% of all women with births.
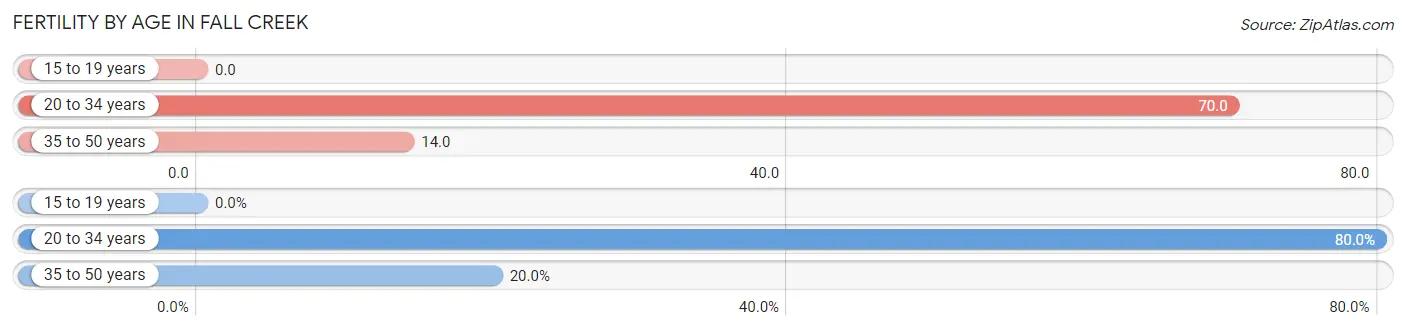
| Age Bracket | Women with Births | Births / 1,000 Women |
| 15 to 19 years | 0 (0.0%) | 0.0 |
| 20 to 34 years | 8 (80.0%) | 70.0 |
| 35 to 50 years | 2 (20.0%) | 14.0 |
| Total | 10 (100.0%) | 30.0 |
Fertility by Age by Marriage Status in Fall Creek
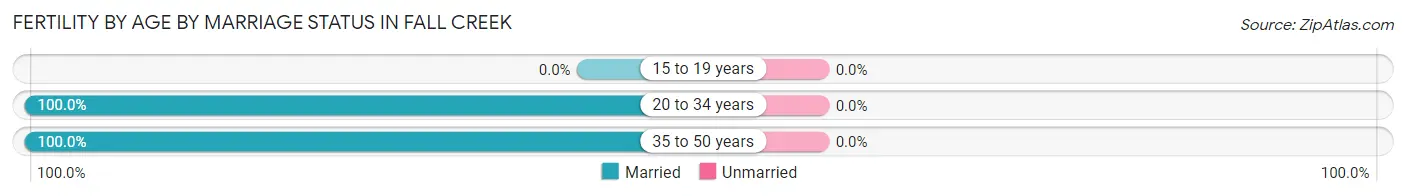
| Age Bracket | Married | Unmarried |
| 15 to 19 years | 0 (0.0%) | 0 (0.0%) |
| 20 to 34 years | 8 (100.0%) | 0 (0.0%) |
| 35 to 50 years | 2 (100.0%) | 0 (0.0%) |
| Total | 10 (100.0%) | 0 (0.0%) |
Fertility by Education in Fall Creek
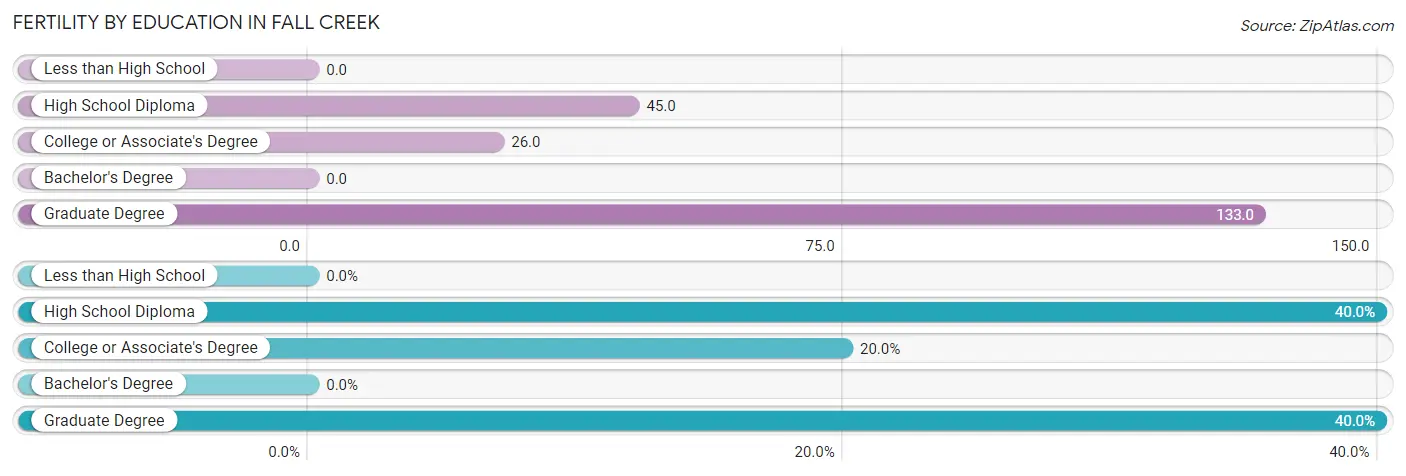
| Educational Attainment | Women with Births | Births / 1,000 Women |
| Less than High School | 0 (0.0%) | 0.0 |
| High School Diploma | 4 (40.0%) | 45.0 |
| College or Associate's Degree | 2 (20.0%) | 26.0 |
| Bachelor's Degree | 0 (0.0%) | 0.0 |
| Graduate Degree | 4 (40.0%) | 133.0 |
| Total | 10 (100.0%) | 30.0 |
Fertility by Education by Marriage Status in Fall Creek
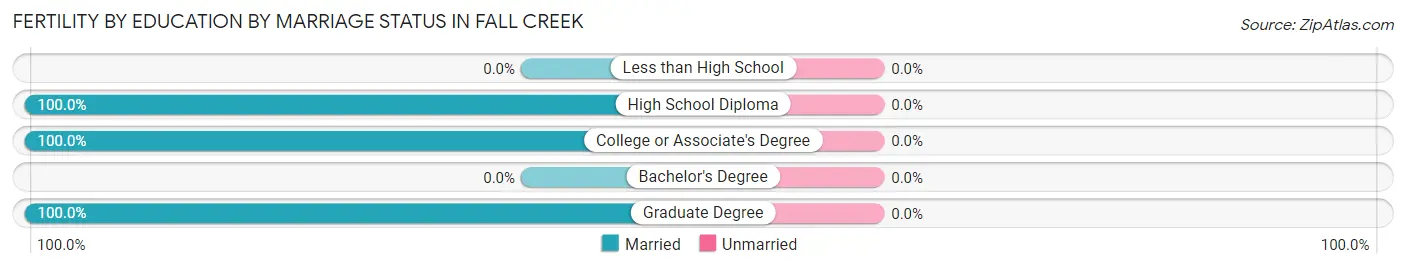
| Educational Attainment | Married | Unmarried |
| Less than High School | 0 (0.0%) | 0 (0.0%) |
| High School Diploma | 4 (100.0%) | 0 (0.0%) |
| College or Associate's Degree | 2 (100.0%) | 0 (0.0%) |
| Bachelor's Degree | 0 (0.0%) | 0 (0.0%) |
| Graduate Degree | 4 (100.0%) | 0 (0.0%) |
| Total | 10 (100.0%) | 0 (0.0%) |
Employment Characteristics in Fall Creek
Employment by Class of Employer in Fall Creek
Among the 833 employed individuals in Fall Creek, private company employees (495 | 59.4%), not-for-profit organizations (133 | 16.0%), and local government employees (107 | 12.9%) make up the most common classes of employment.
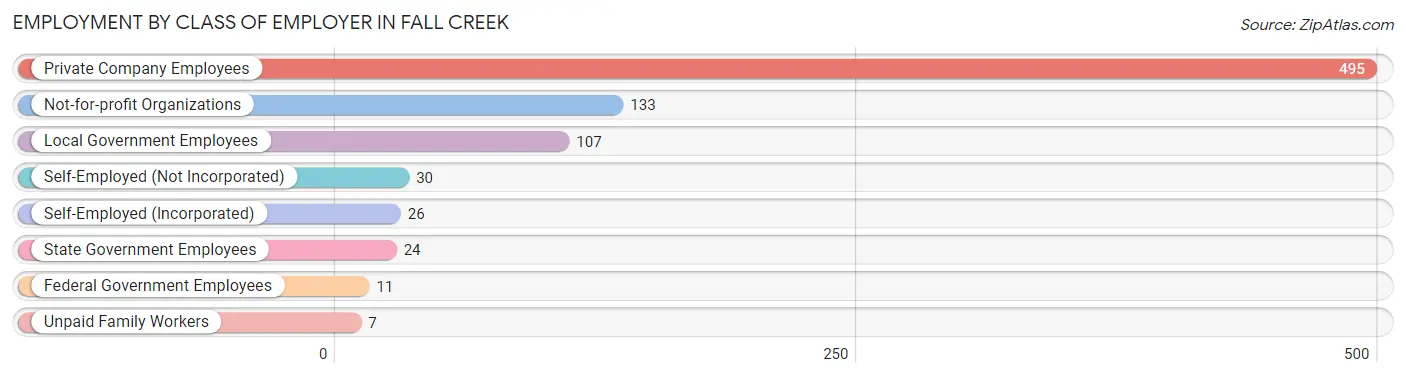
| Employer Class | # Employees | % Employees |
| Private Company Employees | 495 | 59.4% |
| Self-Employed (Incorporated) | 26 | 3.1% |
| Self-Employed (Not Incorporated) | 30 | 3.6% |
| Not-for-profit Organizations | 133 | 16.0% |
| Local Government Employees | 107 | 12.9% |
| State Government Employees | 24 | 2.9% |
| Federal Government Employees | 11 | 1.3% |
| Unpaid Family Workers | 7 | 0.8% |
| Total | 833 | 100.0% |
Employment Status by Age in Fall Creek
According to the labor force statistics for Fall Creek, out of the total population over 16 years of age (1,121), 77.8% or 872 individuals are in the labor force, with 2.8% or 24 of them unemployed. The age group with the highest labor force participation rate is 20 to 24 years, with 100.0% or 91 individuals in the labor force. Within the labor force, the 16 to 19 years age range has the highest percentage of unemployed individuals, with 14.3% or 13 of them being unemployed.
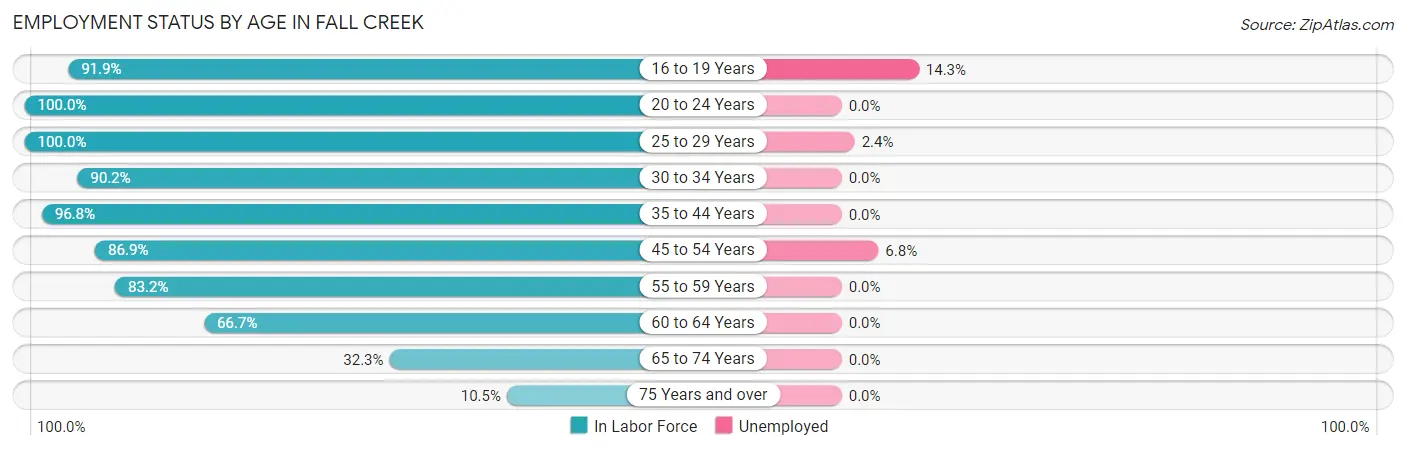
| Age Bracket | In Labor Force | Unemployed |
| 16 to 19 Years | 91 (91.9%) | 13 (14.3%) |
| 20 to 24 Years | 91 (100.0%) | 0 (0.0%) |
| 25 to 29 Years | 83 (100.0%) | 2 (2.4%) |
| 30 to 34 Years | 120 (90.2%) | 0 (0.0%) |
| 35 to 44 Years | 179 (96.8%) | 0 (0.0%) |
| 45 to 54 Years | 133 (86.9%) | 9 (6.8%) |
| 55 to 59 Years | 79 (83.2%) | 0 (0.0%) |
| 60 to 64 Years | 46 (66.7%) | 0 (0.0%) |
| 65 to 74 Years | 41 (32.3%) | 0 (0.0%) |
| 75 Years and over | 9 (10.5%) | 0 (0.0%) |
| Total | 872 (77.8%) | 24 (2.8%) |
Employment Status by Educational Attainment in Fall Creek
According to labor force statistics for Fall Creek, 89.1% of individuals (640) out of the total population between 25 and 64 years of age (718) are in the labor force, with 1.7% or 11 of them being unemployed. The group with the highest labor force participation rate are those with the educational attainment of bachelor's degree or higher, with 95.4% or 272 individuals in the labor force. Within the labor force, individuals with bachelor's degree or higher education have the highest percentage of unemployment, with 4.0% or 11 of them being unemployed.
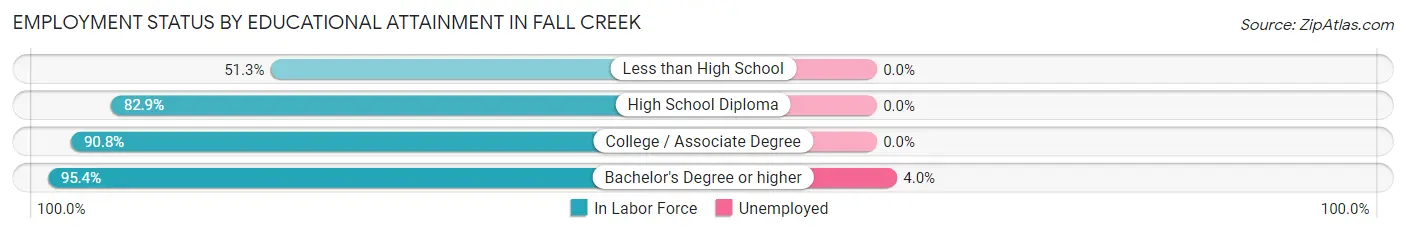
| Educational Attainment | In Labor Force | Unemployed |
| Less than High School | 20 (51.3%) | 0 (0.0%) |
| High School Diploma | 102 (82.9%) | 0 (0.0%) |
| College / Associate Degree | 246 (90.8%) | 0 (0.0%) |
| Bachelor's Degree or higher | 272 (95.4%) | 11 (4.0%) |
| Total | 640 (89.1%) | 12 (1.7%) |
Employment Occupations by Sex in Fall Creek
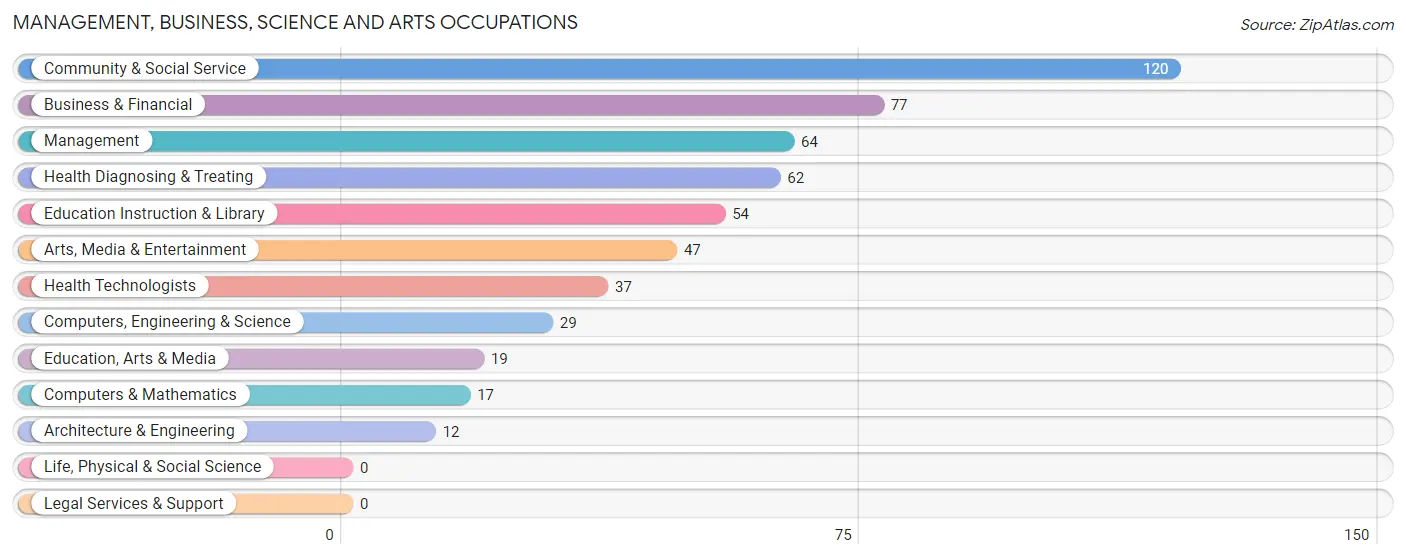
Management, Business, Science and Arts Occupations
The most common Management, Business, Science and Arts occupations in Fall Creek are Community & Social Service (120 | 14.1%), Business & Financial (77 | 9.1%), Management (64 | 7.5%), Health Diagnosing & Treating (62 | 7.3%), and Education Instruction & Library (54 | 6.4%).
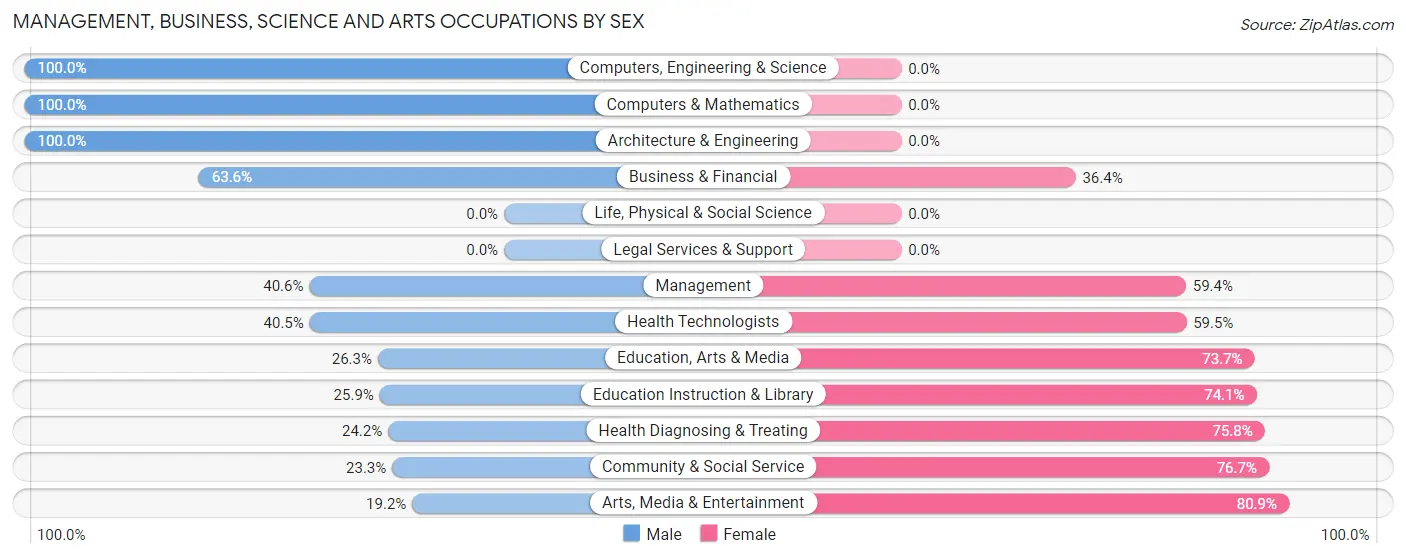
Management, Business, Science and Arts Occupations by Sex
Within the Management, Business, Science and Arts occupations in Fall Creek, the most male-oriented occupations are Computers, Engineering & Science (100.0%), Computers & Mathematics (100.0%), and Architecture & Engineering (100.0%), while the most female-oriented occupations are Arts, Media & Entertainment (80.8%), Community & Social Service (76.7%), and Health Diagnosing & Treating (75.8%).
| Occupation | Male | Female |
| Management | 26 (40.6%) | 38 (59.4%) |
| Business & Financial | 49 (63.6%) | 28 (36.4%) |
| Computers, Engineering & Science | 29 (100.0%) | 0 (0.0%) |
| Computers & Mathematics | 17 (100.0%) | 0 (0.0%) |
| Architecture & Engineering | 12 (100.0%) | 0 (0.0%) |
| Life, Physical & Social Science | 0 (0.0%) | 0 (0.0%) |
| Community & Social Service | 28 (23.3%) | 92 (76.7%) |
| Education, Arts & Media | 5 (26.3%) | 14 (73.7%) |
| Legal Services & Support | 0 (0.0%) | 0 (0.0%) |
| Education Instruction & Library | 14 (25.9%) | 40 (74.1%) |
| Arts, Media & Entertainment | 9 (19.2%) | 38 (80.8%) |
| Health Diagnosing & Treating | 15 (24.2%) | 47 (75.8%) |
| Health Technologists | 15 (40.5%) | 22 (59.5%) |
| Total (Category) | 147 (41.8%) | 205 (58.2%) |
| Total (Overall) | 425 (50.1%) | 423 (49.9%) |
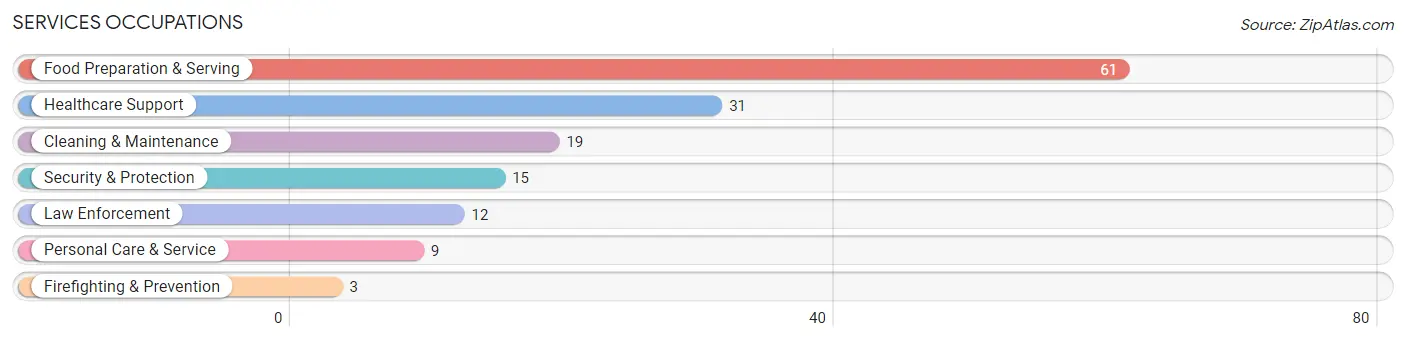
Services Occupations
The most common Services occupations in Fall Creek are Food Preparation & Serving (61 | 7.2%), Healthcare Support (31 | 3.7%), Cleaning & Maintenance (19 | 2.2%), Security & Protection (15 | 1.8%), and Law Enforcement (12 | 1.4%).
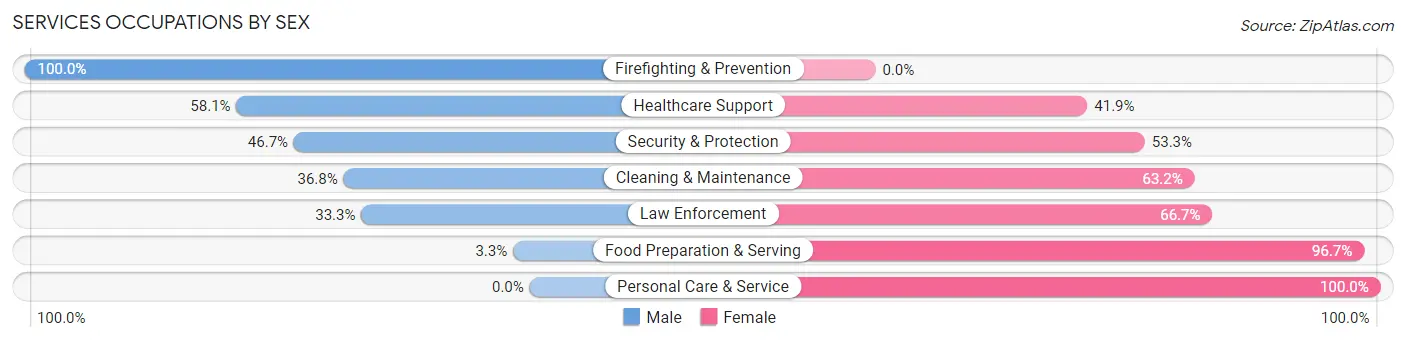
Services Occupations by Sex
Within the Services occupations in Fall Creek, the most male-oriented occupations are Firefighting & Prevention (100.0%), Healthcare Support (58.1%), and Security & Protection (46.7%), while the most female-oriented occupations are Personal Care & Service (100.0%), Food Preparation & Serving (96.7%), and Law Enforcement (66.7%).
| Occupation | Male | Female |
| Healthcare Support | 18 (58.1%) | 13 (41.9%) |
| Security & Protection | 7 (46.7%) | 8 (53.3%) |
| Firefighting & Prevention | 3 (100.0%) | 0 (0.0%) |
| Law Enforcement | 4 (33.3%) | 8 (66.7%) |
| Food Preparation & Serving | 2 (3.3%) | 59 (96.7%) |
| Cleaning & Maintenance | 7 (36.8%) | 12 (63.2%) |
| Personal Care & Service | 0 (0.0%) | 9 (100.0%) |
| Total (Category) | 34 (25.2%) | 101 (74.8%) |
| Total (Overall) | 425 (50.1%) | 423 (49.9%) |
Sales and Office Occupations
The most common Sales and Office occupations in Fall Creek are Office & Administration (86 | 10.1%), and Sales & Related (42 | 5.0%).
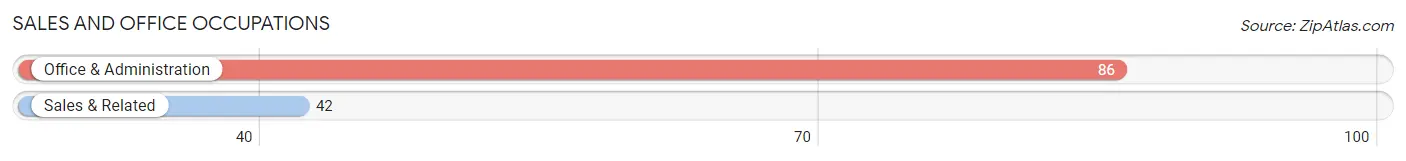
Sales and Office Occupations by Sex
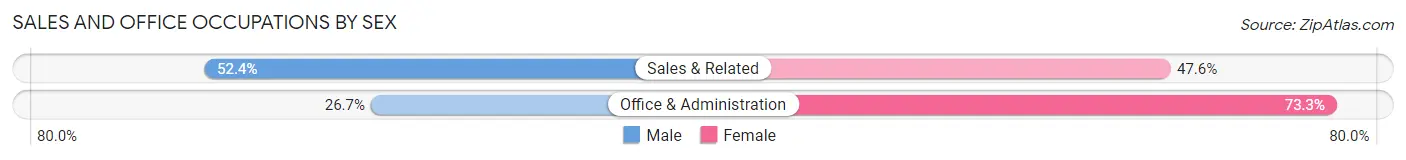
| Occupation | Male | Female |
| Sales & Related | 22 (52.4%) | 20 (47.6%) |
| Office & Administration | 23 (26.7%) | 63 (73.3%) |
| Total (Category) | 45 (35.2%) | 83 (64.8%) |
| Total (Overall) | 425 (50.1%) | 423 (49.9%) |
Natural Resources, Construction and Maintenance Occupations
The most common Natural Resources, Construction and Maintenance occupations in Fall Creek are Construction & Extraction (30 | 3.5%), Installation, Maintenance & Repair (27 | 3.2%), and Farming, Fishing & Forestry (1 | 0.1%).
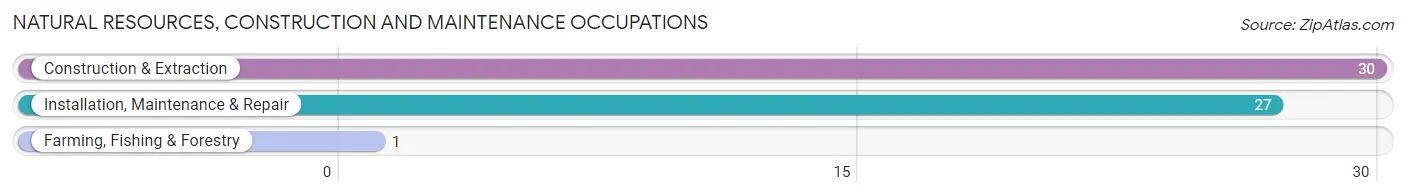
Natural Resources, Construction and Maintenance Occupations by Sex
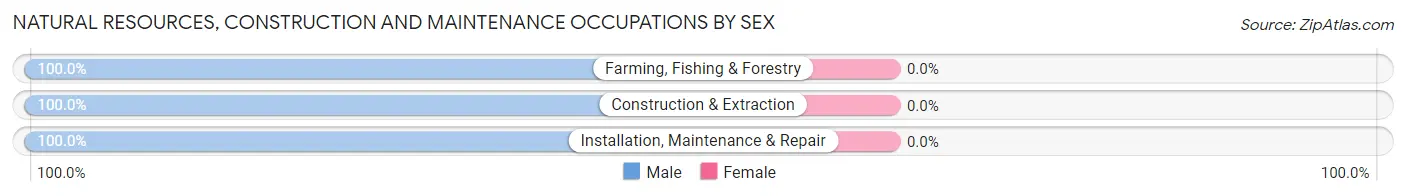
| Occupation | Male | Female |
| Farming, Fishing & Forestry | 1 (100.0%) | 0 (0.0%) |
| Construction & Extraction | 30 (100.0%) | 0 (0.0%) |
| Installation, Maintenance & Repair | 27 (100.0%) | 0 (0.0%) |
| Total (Category) | 58 (100.0%) | 0 (0.0%) |
| Total (Overall) | 425 (50.1%) | 423 (49.9%) |
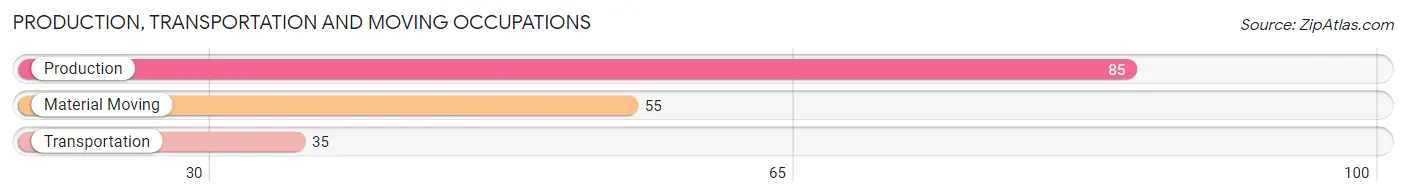
Production, Transportation and Moving Occupations
The most common Production, Transportation and Moving occupations in Fall Creek are Production (85 | 10.0%), Material Moving (55 | 6.5%), and Transportation (35 | 4.1%).
Production, Transportation and Moving Occupations by Sex
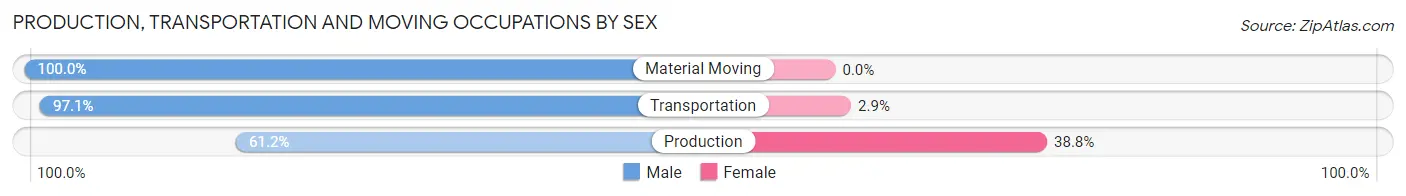
| Occupation | Male | Female |
| Production | 52 (61.2%) | 33 (38.8%) |
| Transportation | 34 (97.1%) | 1 (2.9%) |
| Material Moving | 55 (100.0%) | 0 (0.0%) |
| Total (Category) | 141 (80.6%) | 34 (19.4%) |
| Total (Overall) | 425 (50.1%) | 423 (49.9%) |
Employment Industries by Sex in Fall Creek
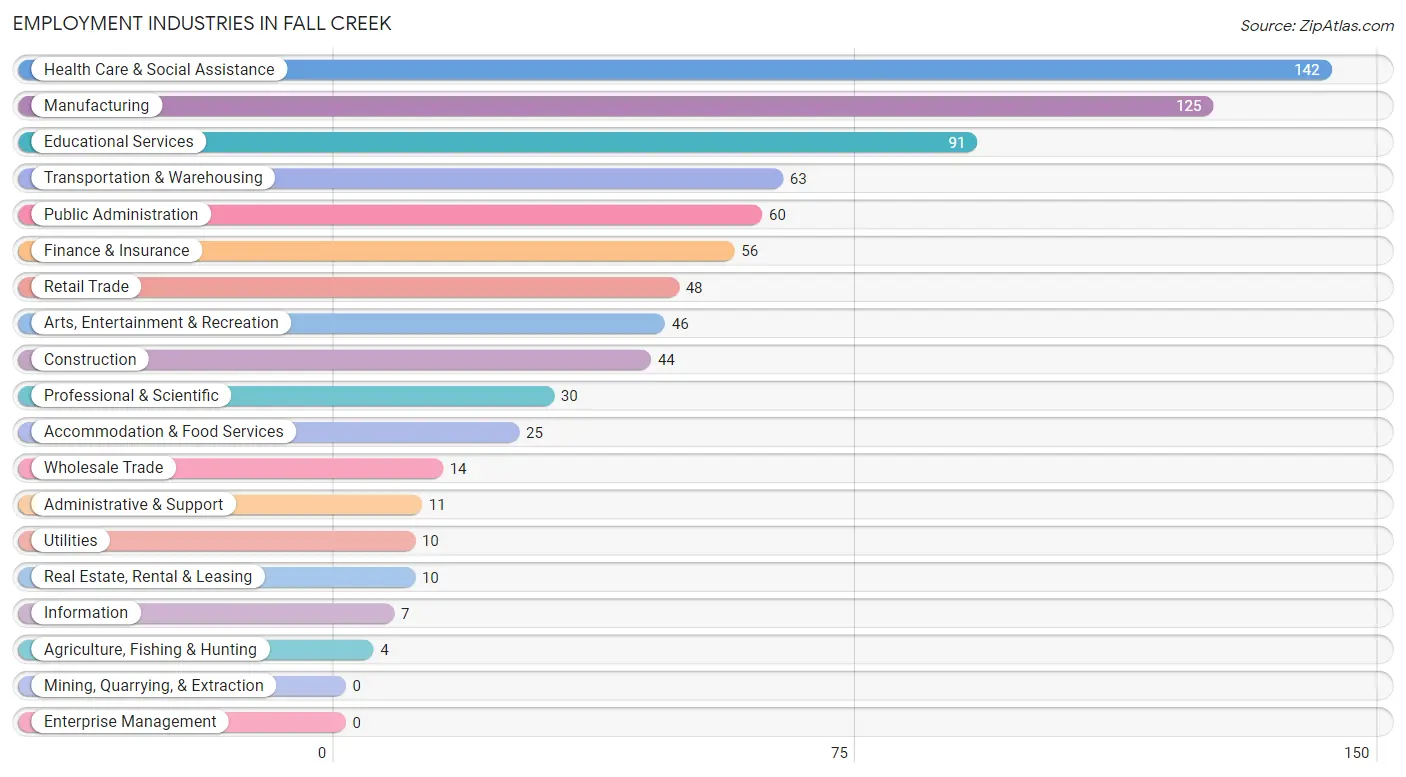
Employment Industries in Fall Creek
The major employment industries in Fall Creek include Health Care & Social Assistance (142 | 16.8%), Manufacturing (125 | 14.7%), Educational Services (91 | 10.7%), Transportation & Warehousing (63 | 7.4%), and Public Administration (60 | 7.1%).
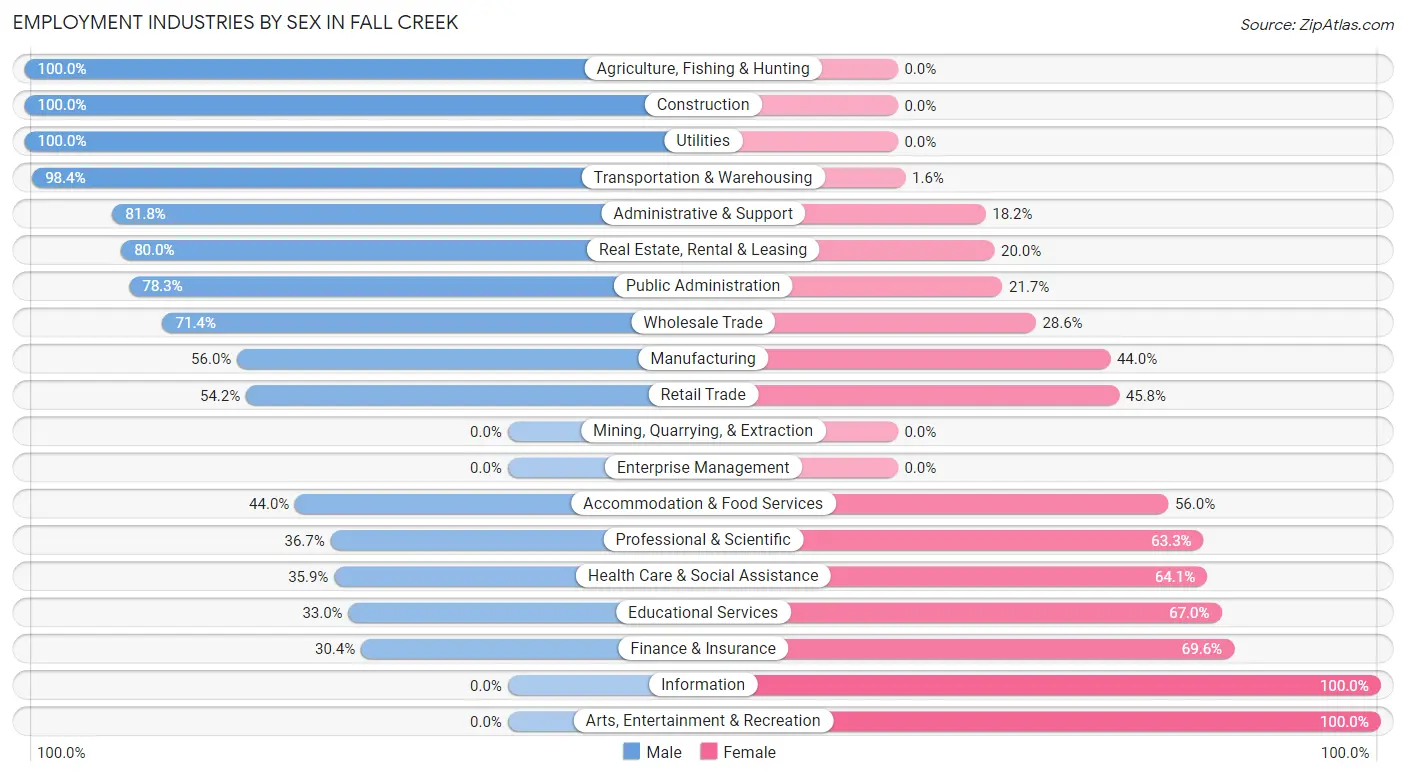
Employment Industries by Sex in Fall Creek
The Fall Creek industries that see more men than women are Agriculture, Fishing & Hunting (100.0%), Construction (100.0%), and Utilities (100.0%), whereas the industries that tend to have a higher number of women are Information (100.0%), Arts, Entertainment & Recreation (100.0%), and Finance & Insurance (69.6%).
| Industry | Male | Female |
| Agriculture, Fishing & Hunting | 4 (100.0%) | 0 (0.0%) |
| Mining, Quarrying, & Extraction | 0 (0.0%) | 0 (0.0%) |
| Construction | 44 (100.0%) | 0 (0.0%) |
| Manufacturing | 70 (56.0%) | 55 (44.0%) |
| Wholesale Trade | 10 (71.4%) | 4 (28.6%) |
| Retail Trade | 26 (54.2%) | 22 (45.8%) |
| Transportation & Warehousing | 62 (98.4%) | 1 (1.6%) |
| Utilities | 10 (100.0%) | 0 (0.0%) |
| Information | 0 (0.0%) | 7 (100.0%) |
| Finance & Insurance | 17 (30.4%) | 39 (69.6%) |
| Real Estate, Rental & Leasing | 8 (80.0%) | 2 (20.0%) |
| Professional & Scientific | 11 (36.7%) | 19 (63.3%) |
| Enterprise Management | 0 (0.0%) | 0 (0.0%) |
| Administrative & Support | 9 (81.8%) | 2 (18.2%) |
| Educational Services | 30 (33.0%) | 61 (67.0%) |
| Health Care & Social Assistance | 51 (35.9%) | 91 (64.1%) |
| Arts, Entertainment & Recreation | 0 (0.0%) | 46 (100.0%) |
| Accommodation & Food Services | 11 (44.0%) | 14 (56.0%) |
| Public Administration | 47 (78.3%) | 13 (21.7%) |
| Total | 425 (50.1%) | 423 (49.9%) |
Education in Fall Creek
School Enrollment in Fall Creek
The most common levels of schooling among the 336 students in Fall Creek are middle school (84 | 25.0%), elementary school (80 | 23.8%), and high school (64 | 19.1%).
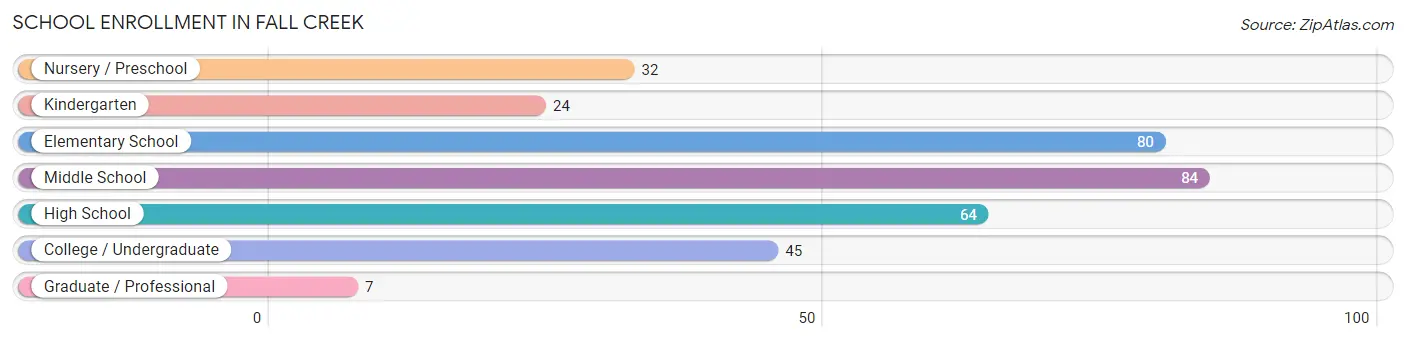
| School Level | # Students | % Students |
| Nursery / Preschool | 32 | 9.5% |
| Kindergarten | 24 | 7.1% |
| Elementary School | 80 | 23.8% |
| Middle School | 84 | 25.0% |
| High School | 64 | 19.1% |
| College / Undergraduate | 45 | 13.4% |
| Graduate / Professional | 7 | 2.1% |
| Total | 336 | 100.0% |
School Enrollment by Age by Funding Source in Fall Creek
Out of a total of 336 students who are enrolled in schools in Fall Creek, 12 (3.6%) attend a private institution, while the remaining 324 (96.4%) are enrolled in public schools. The age group of 25 to 34 year olds has the highest likelihood of being enrolled in private schools, with 4 (36.4% in the age bracket) enrolled. Conversely, the age group of 3 to 4 year olds has the lowest likelihood of being enrolled in a private school, with 7 (100.0% in the age bracket) attending a public institution.
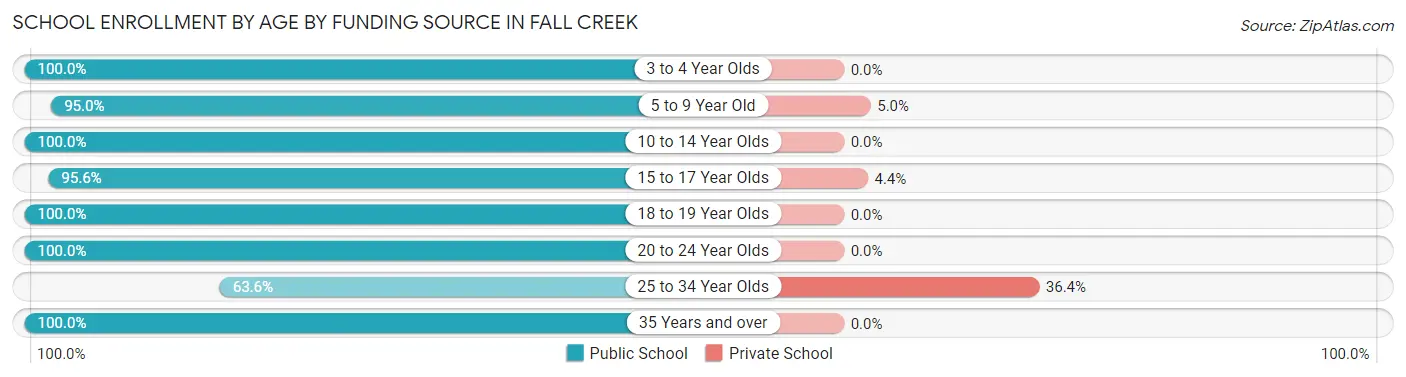
| Age Bracket | Public School | Private School |
| 3 to 4 Year Olds | 7 (100.0%) | 0 (0.0%) |
| 5 to 9 Year Old | 115 (95.0%) | 6 (5.0%) |
| 10 to 14 Year Olds | 101 (100.0%) | 0 (0.0%) |
| 15 to 17 Year Olds | 43 (95.6%) | 2 (4.4%) |
| 18 to 19 Year Olds | 11 (100.0%) | 0 (0.0%) |
| 20 to 24 Year Olds | 32 (100.0%) | 0 (0.0%) |
| 25 to 34 Year Olds | 7 (63.6%) | 4 (36.4%) |
| 35 Years and over | 8 (100.0%) | 0 (0.0%) |
| Total | 324 (96.4%) | 12 (3.6%) |
Educational Attainment by Field of Study in Fall Creek
Business (97 | 29.7%), engineering (44 | 13.5%), arts & humanities (42 | 12.8%), education (36 | 11.0%), and science & technology (35 | 10.7%) are the most common fields of study among 327 individuals in Fall Creek who have obtained a bachelor's degree or higher.
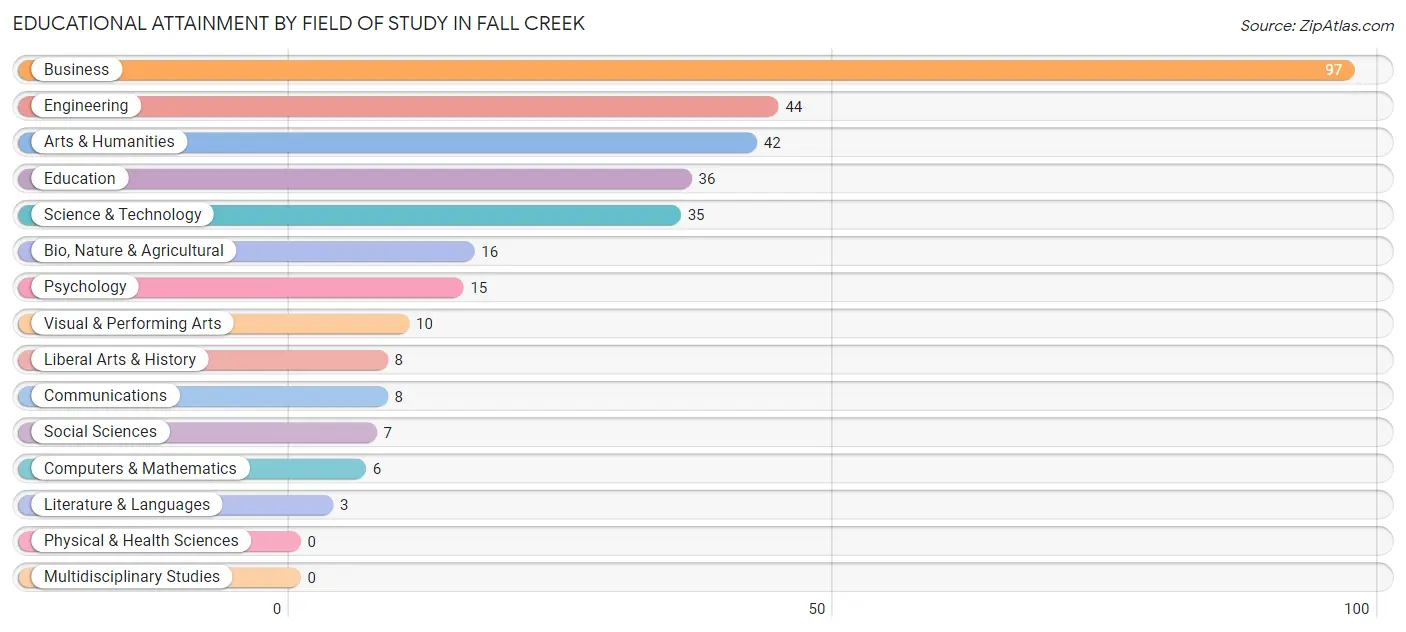
| Field of Study | # Graduates | % Graduates |
| Computers & Mathematics | 6 | 1.8% |
| Bio, Nature & Agricultural | 16 | 4.9% |
| Physical & Health Sciences | 0 | 0.0% |
| Psychology | 15 | 4.6% |
| Social Sciences | 7 | 2.1% |
| Engineering | 44 | 13.5% |
| Multidisciplinary Studies | 0 | 0.0% |
| Science & Technology | 35 | 10.7% |
| Business | 97 | 29.7% |
| Education | 36 | 11.0% |
| Literature & Languages | 3 | 0.9% |
| Liberal Arts & History | 8 | 2.5% |
| Visual & Performing Arts | 10 | 3.1% |
| Communications | 8 | 2.5% |
| Arts & Humanities | 42 | 12.8% |
| Total | 327 | 100.0% |
Transportation & Commute in Fall Creek
Vehicle Availability by Sex in Fall Creek
The most prevalent vehicle ownership categories in Fall Creek are males with 2 vehicles (155, accounting for 36.7%) and females with 2 vehicles (167, making up 38.0%).
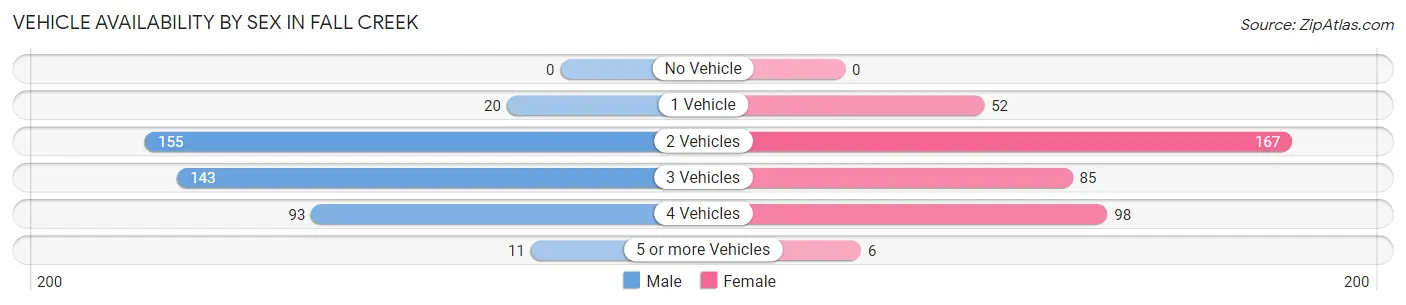
| Vehicles Available | Male | Female |
| No Vehicle | 0 (0.0%) | 0 (0.0%) |
| 1 Vehicle | 20 (4.7%) | 52 (12.8%) |
| 2 Vehicles | 155 (36.7%) | 167 (40.9%) |
| 3 Vehicles | 143 (33.9%) | 85 (20.8%) |
| 4 Vehicles | 93 (22.0%) | 98 (24.0%) |
| 5 or more Vehicles | 11 (2.6%) | 6 (1.5%) |
| Total | 422 (100.0%) | 408 (100.0%) |
Commute Time in Fall Creek
The most frequently occuring commute durations in Fall Creek are 25 to 29 minutes (155 commuters, 20.9%), 20 to 24 minutes (132 commuters, 17.8%), and 30 to 34 minutes (111 commuters, 14.9%).
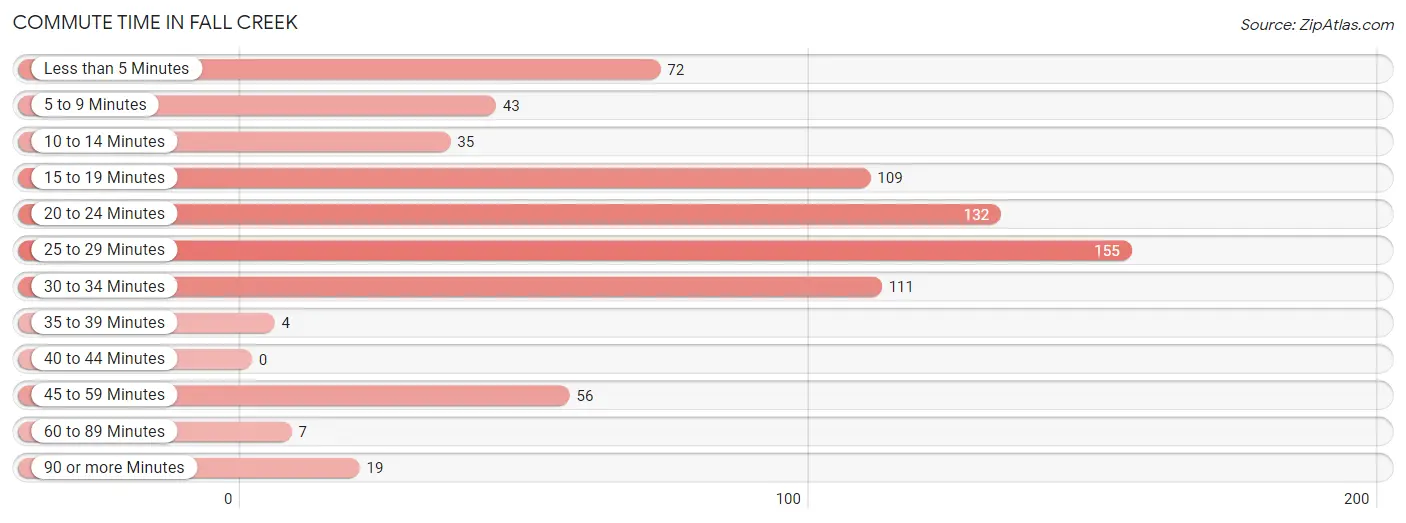
| Commute Time | # Commuters | % Commuters |
| Less than 5 Minutes | 72 | 9.7% |
| 5 to 9 Minutes | 43 | 5.8% |
| 10 to 14 Minutes | 35 | 4.7% |
| 15 to 19 Minutes | 109 | 14.7% |
| 20 to 24 Minutes | 132 | 17.8% |
| 25 to 29 Minutes | 155 | 20.9% |
| 30 to 34 Minutes | 111 | 14.9% |
| 35 to 39 Minutes | 4 | 0.5% |
| 40 to 44 Minutes | 0 | 0.0% |
| 45 to 59 Minutes | 56 | 7.5% |
| 60 to 89 Minutes | 7 | 0.9% |
| 90 or more Minutes | 19 | 2.6% |
Commute Time by Sex in Fall Creek
The most common commute times in Fall Creek are 20 to 24 minutes (93 commuters, 23.7%) for males and 25 to 29 minutes (72 commuters, 20.6%) for females.
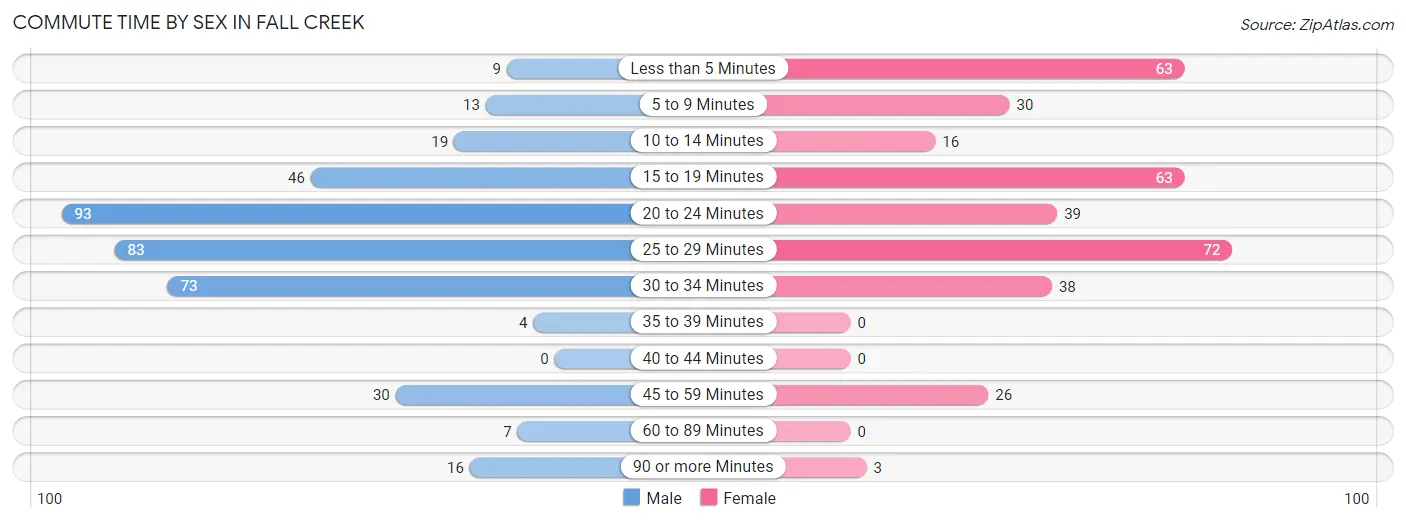
| Commute Time | Male | Female |
| Less than 5 Minutes | 9 (2.3%) | 63 (18.0%) |
| 5 to 9 Minutes | 13 (3.3%) | 30 (8.6%) |
| 10 to 14 Minutes | 19 (4.8%) | 16 (4.6%) |
| 15 to 19 Minutes | 46 (11.7%) | 63 (18.0%) |
| 20 to 24 Minutes | 93 (23.7%) | 39 (11.1%) |
| 25 to 29 Minutes | 83 (21.1%) | 72 (20.6%) |
| 30 to 34 Minutes | 73 (18.6%) | 38 (10.9%) |
| 35 to 39 Minutes | 4 (1.0%) | 0 (0.0%) |
| 40 to 44 Minutes | 0 (0.0%) | 0 (0.0%) |
| 45 to 59 Minutes | 30 (7.6%) | 26 (7.4%) |
| 60 to 89 Minutes | 7 (1.8%) | 0 (0.0%) |
| 90 or more Minutes | 16 (4.1%) | 3 (0.9%) |
Time of Departure to Work by Sex in Fall Creek
The most frequent times of departure to work in Fall Creek are 12:00 AM to 4:59 AM (97, 24.7%) for males and 7:30 AM to 7:59 AM (98, 28.0%) for females.
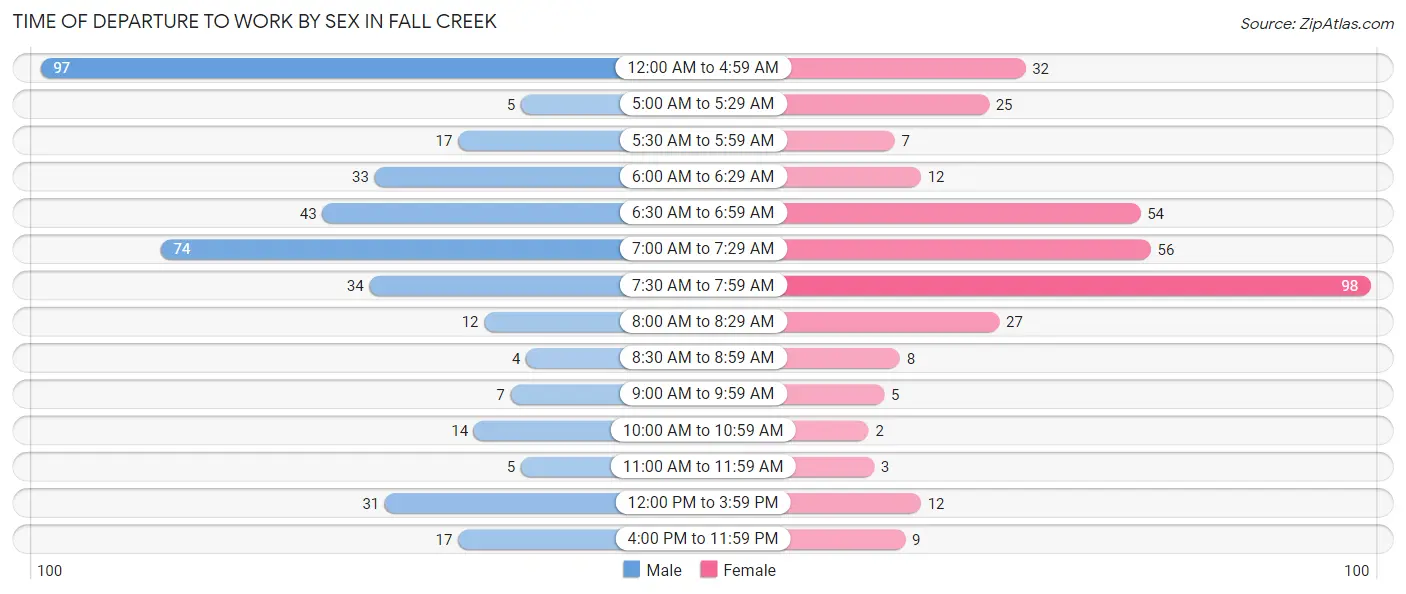
| Time of Departure | Male | Female |
| 12:00 AM to 4:59 AM | 97 (24.7%) | 32 (9.1%) |
| 5:00 AM to 5:29 AM | 5 (1.3%) | 25 (7.1%) |
| 5:30 AM to 5:59 AM | 17 (4.3%) | 7 (2.0%) |
| 6:00 AM to 6:29 AM | 33 (8.4%) | 12 (3.4%) |
| 6:30 AM to 6:59 AM | 43 (10.9%) | 54 (15.4%) |
| 7:00 AM to 7:29 AM | 74 (18.8%) | 56 (16.0%) |
| 7:30 AM to 7:59 AM | 34 (8.6%) | 98 (28.0%) |
| 8:00 AM to 8:29 AM | 12 (3.0%) | 27 (7.7%) |
| 8:30 AM to 8:59 AM | 4 (1.0%) | 8 (2.3%) |
| 9:00 AM to 9:59 AM | 7 (1.8%) | 5 (1.4%) |
| 10:00 AM to 10:59 AM | 14 (3.6%) | 2 (0.6%) |
| 11:00 AM to 11:59 AM | 5 (1.3%) | 3 (0.9%) |
| 12:00 PM to 3:59 PM | 31 (7.9%) | 12 (3.4%) |
| 4:00 PM to 11:59 PM | 17 (4.3%) | 9 (2.6%) |
| Total | 393 (100.0%) | 350 (100.0%) |
Housing Occupancy in Fall Creek
Occupancy by Ownership in Fall Creek
Of the total 477 dwellings in Fall Creek, owner-occupied units account for 358 (75.0%), while renter-occupied units make up 119 (24.9%).
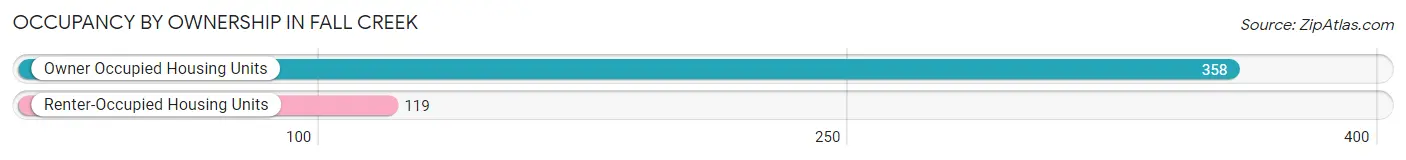
| Occupancy | # Housing Units | % Housing Units |
| Owner Occupied Housing Units | 358 | 75.0% |
| Renter-Occupied Housing Units | 119 | 24.9% |
| Total Occupied Housing Units | 477 | 100.0% |
Occupancy by Household Size in Fall Creek
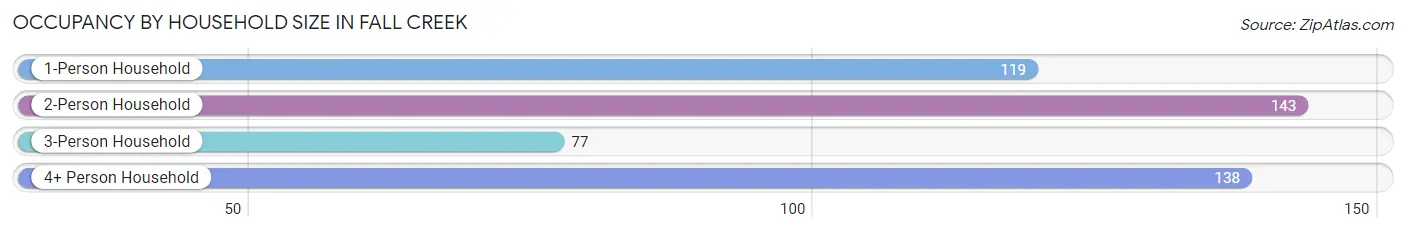
| Household Size | # Housing Units | % Housing Units |
| 1-Person Household | 119 | 24.9% |
| 2-Person Household | 143 | 30.0% |
| 3-Person Household | 77 | 16.1% |
| 4+ Person Household | 138 | 28.9% |
| Total Housing Units | 477 | 100.0% |
Occupancy by Ownership by Household Size in Fall Creek
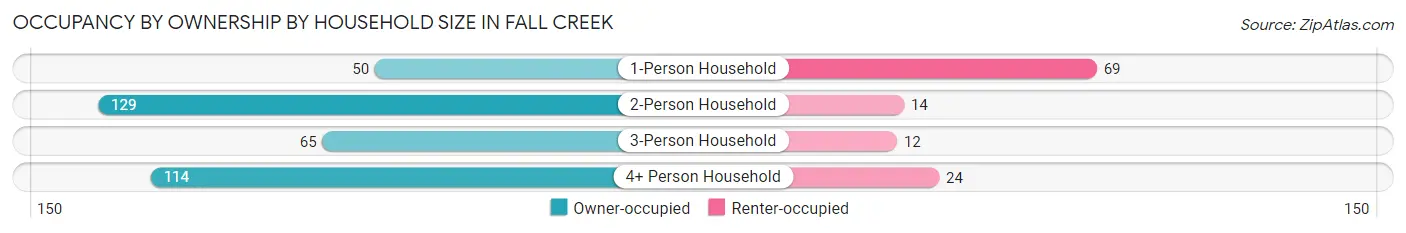
| Household Size | Owner-occupied | Renter-occupied |
| 1-Person Household | 50 (42.0%) | 69 (58.0%) |
| 2-Person Household | 129 (90.2%) | 14 (9.8%) |
| 3-Person Household | 65 (84.4%) | 12 (15.6%) |
| 4+ Person Household | 114 (82.6%) | 24 (17.4%) |
| Total Housing Units | 358 (75.0%) | 119 (24.9%) |
Occupancy by Educational Attainment in Fall Creek
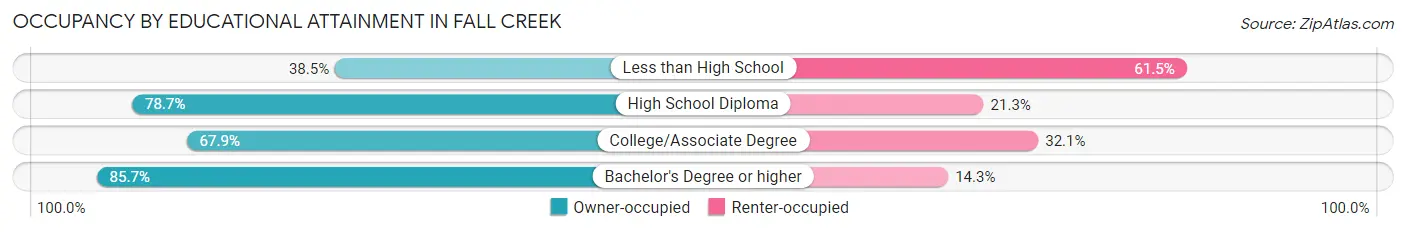
| Household Size | Owner-occupied | Renter-occupied |
| Less than High School | 10 (38.5%) | 16 (61.5%) |
| High School Diploma | 96 (78.7%) | 26 (21.3%) |
| College/Associate Degree | 114 (67.9%) | 54 (32.1%) |
| Bachelor's Degree or higher | 138 (85.7%) | 23 (14.3%) |
Occupancy by Age of Householder in Fall Creek
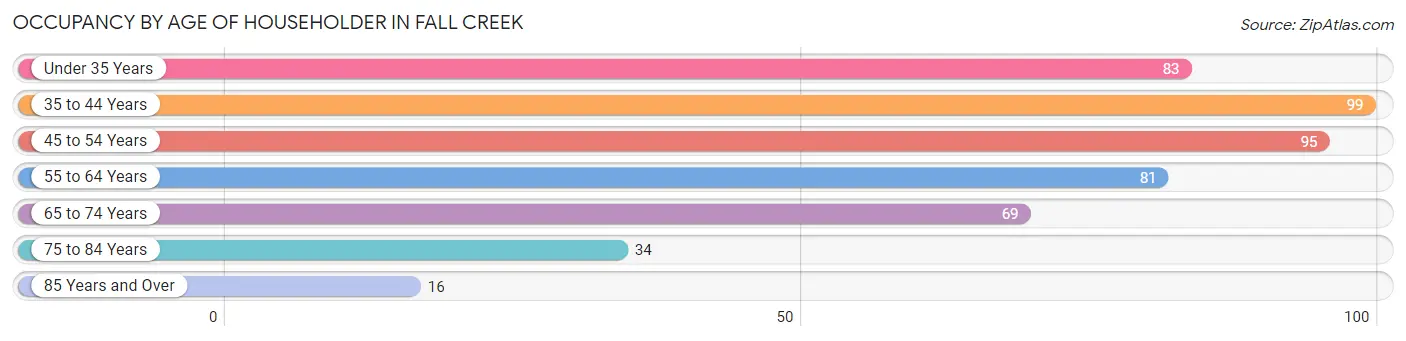
| Age Bracket | # Households | % Households |
| Under 35 Years | 83 | 17.4% |
| 35 to 44 Years | 99 | 20.7% |
| 45 to 54 Years | 95 | 19.9% |
| 55 to 64 Years | 81 | 17.0% |
| 65 to 74 Years | 69 | 14.5% |
| 75 to 84 Years | 34 | 7.1% |
| 85 Years and Over | 16 | 3.4% |
| Total | 477 | 100.0% |
Housing Finances in Fall Creek
Median Income by Occupancy in Fall Creek
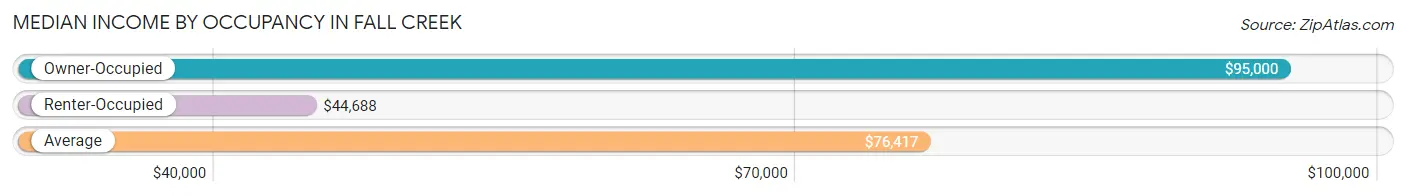
| Occupancy Type | # Households | Median Income |
| Owner-Occupied | 358 (75.0%) | $95,000 |
| Renter-Occupied | 119 (24.9%) | $44,688 |
| Average | 477 (100.0%) | $76,417 |
Occupancy by Householder Income Bracket in Fall Creek
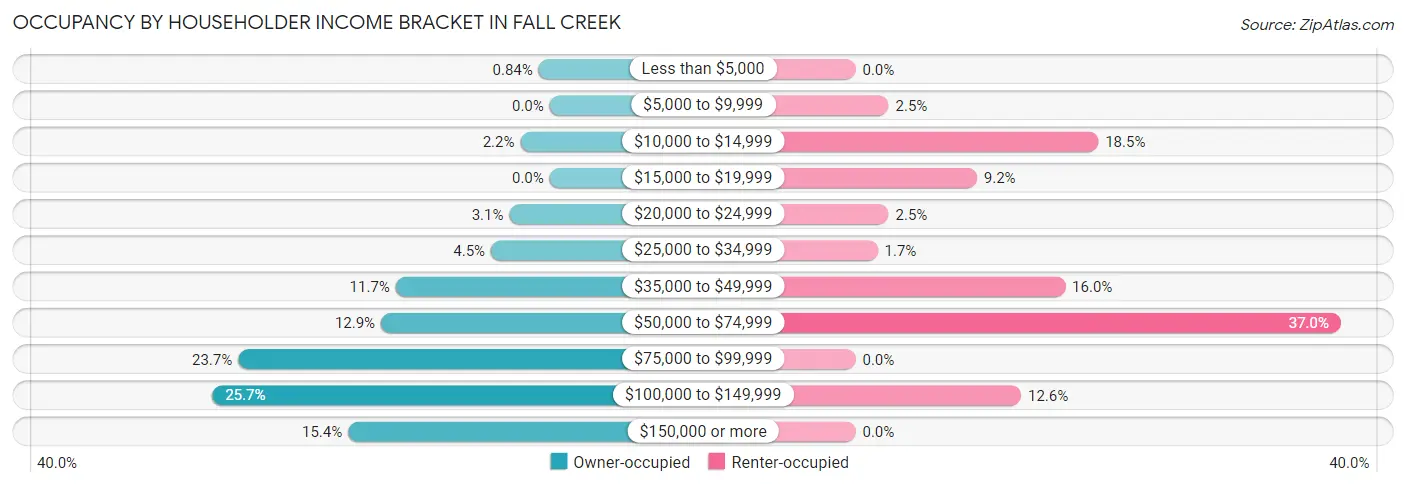
| Income Bracket | Owner-occupied | Renter-occupied |
| Less than $5,000 | 3 (0.8%) | 0 (0.0%) |
| $5,000 to $9,999 | 0 (0.0%) | 3 (2.5%) |
| $10,000 to $14,999 | 8 (2.2%) | 22 (18.5%) |
| $15,000 to $19,999 | 0 (0.0%) | 11 (9.2%) |
| $20,000 to $24,999 | 11 (3.1%) | 3 (2.5%) |
| $25,000 to $34,999 | 16 (4.5%) | 2 (1.7%) |
| $35,000 to $49,999 | 42 (11.7%) | 19 (16.0%) |
| $50,000 to $74,999 | 46 (12.9%) | 44 (37.0%) |
| $75,000 to $99,999 | 85 (23.7%) | 0 (0.0%) |
| $100,000 to $149,999 | 92 (25.7%) | 15 (12.6%) |
| $150,000 or more | 55 (15.4%) | 0 (0.0%) |
| Total | 358 (100.0%) | 119 (100.0%) |
Monthly Housing Cost Tiers in Fall Creek
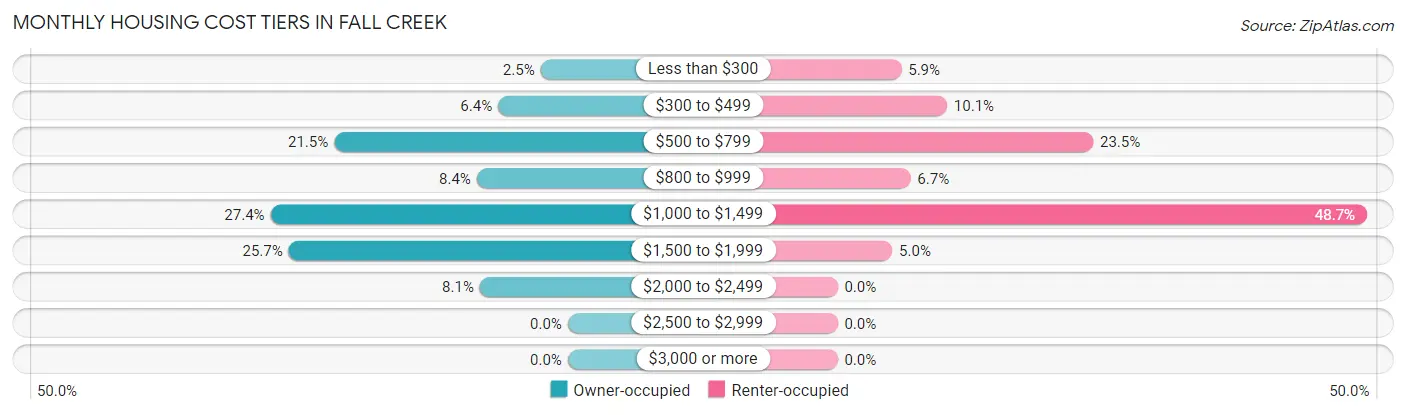
| Monthly Cost | Owner-occupied | Renter-occupied |
| Less than $300 | 9 (2.5%) | 7 (5.9%) |
| $300 to $499 | 23 (6.4%) | 12 (10.1%) |
| $500 to $799 | 77 (21.5%) | 28 (23.5%) |
| $800 to $999 | 30 (8.4%) | 8 (6.7%) |
| $1,000 to $1,499 | 98 (27.4%) | 58 (48.7%) |
| $1,500 to $1,999 | 92 (25.7%) | 6 (5.0%) |
| $2,000 to $2,499 | 29 (8.1%) | 0 (0.0%) |
| $2,500 to $2,999 | 0 (0.0%) | 0 (0.0%) |
| $3,000 or more | 0 (0.0%) | 0 (0.0%) |
| Total | 358 (100.0%) | 119 (100.0%) |
Physical Housing Characteristics in Fall Creek
Housing Structures in Fall Creek
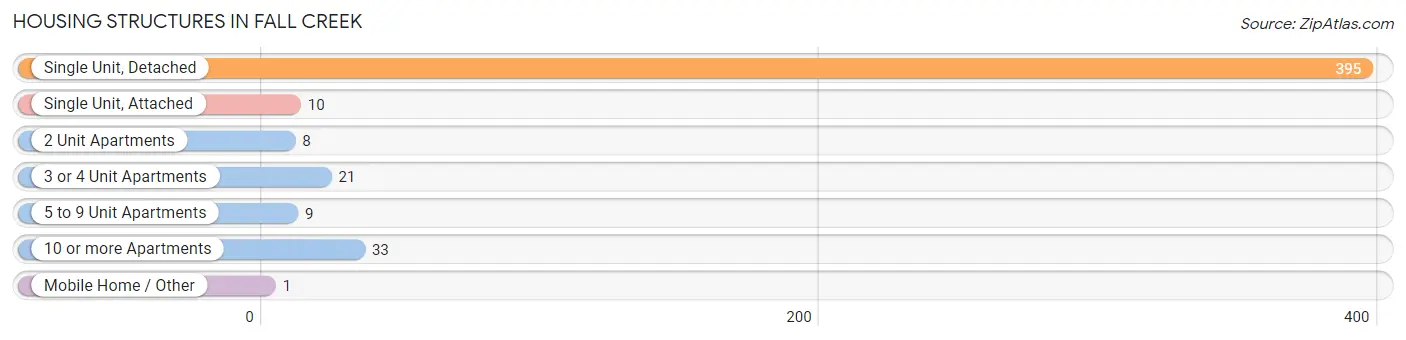
| Structure Type | # Housing Units | % Housing Units |
| Single Unit, Detached | 395 | 82.8% |
| Single Unit, Attached | 10 | 2.1% |
| 2 Unit Apartments | 8 | 1.7% |
| 3 or 4 Unit Apartments | 21 | 4.4% |
| 5 to 9 Unit Apartments | 9 | 1.9% |
| 10 or more Apartments | 33 | 6.9% |
| Mobile Home / Other | 1 | 0.2% |
| Total | 477 | 100.0% |
Housing Structures by Occupancy in Fall Creek
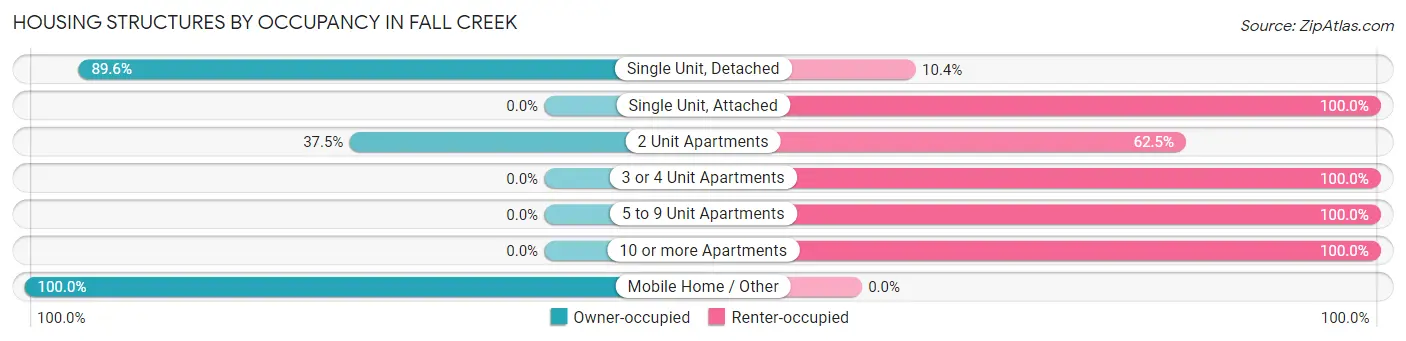
| Structure Type | Owner-occupied | Renter-occupied |
| Single Unit, Detached | 354 (89.6%) | 41 (10.4%) |
| Single Unit, Attached | 0 (0.0%) | 10 (100.0%) |
| 2 Unit Apartments | 3 (37.5%) | 5 (62.5%) |
| 3 or 4 Unit Apartments | 0 (0.0%) | 21 (100.0%) |
| 5 to 9 Unit Apartments | 0 (0.0%) | 9 (100.0%) |
| 10 or more Apartments | 0 (0.0%) | 33 (100.0%) |
| Mobile Home / Other | 1 (100.0%) | 0 (0.0%) |
| Total | 358 (75.0%) | 119 (24.9%) |
Housing Structures by Number of Rooms in Fall Creek
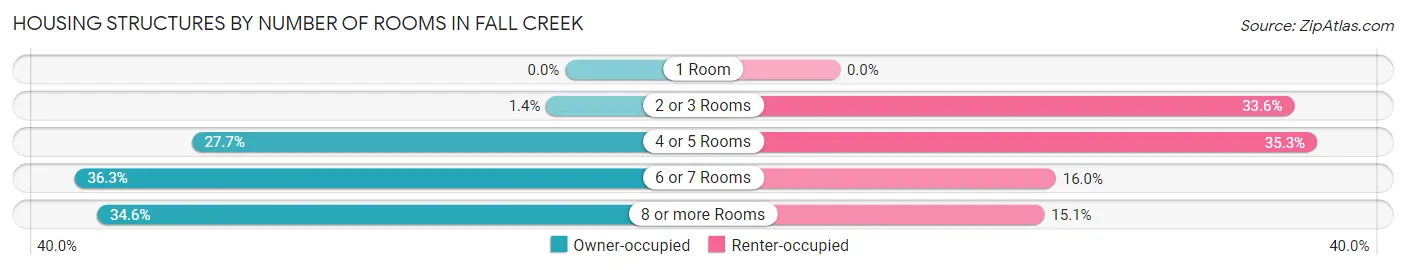
| Number of Rooms | Owner-occupied | Renter-occupied |
| 1 Room | 0 (0.0%) | 0 (0.0%) |
| 2 or 3 Rooms | 5 (1.4%) | 40 (33.6%) |
| 4 or 5 Rooms | 99 (27.7%) | 42 (35.3%) |
| 6 or 7 Rooms | 130 (36.3%) | 19 (16.0%) |
| 8 or more Rooms | 124 (34.6%) | 18 (15.1%) |
| Total | 358 (100.0%) | 119 (100.0%) |
Housing Structure by Heating Type in Fall Creek
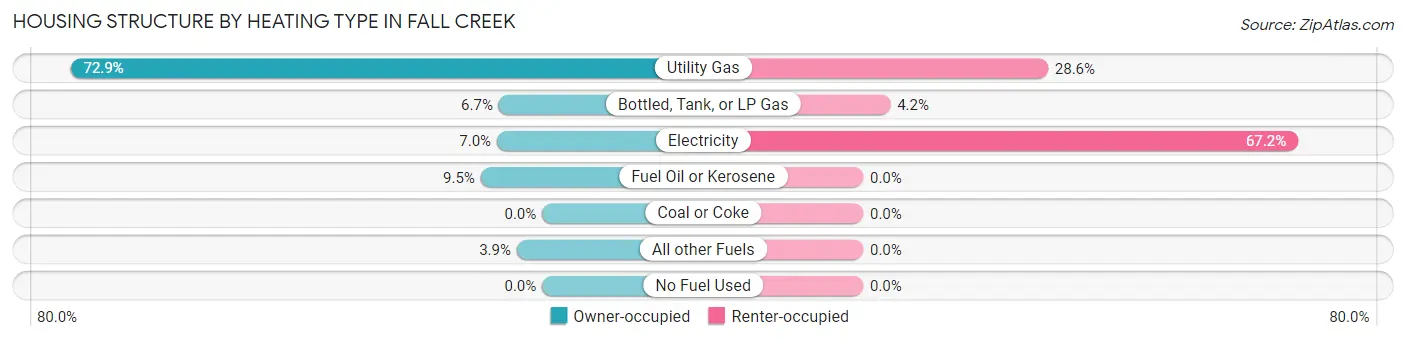
| Heating Type | Owner-occupied | Renter-occupied |
| Utility Gas | 261 (72.9%) | 34 (28.6%) |
| Bottled, Tank, or LP Gas | 24 (6.7%) | 5 (4.2%) |
| Electricity | 25 (7.0%) | 80 (67.2%) |
| Fuel Oil or Kerosene | 34 (9.5%) | 0 (0.0%) |
| Coal or Coke | 0 (0.0%) | 0 (0.0%) |
| All other Fuels | 14 (3.9%) | 0 (0.0%) |
| No Fuel Used | 0 (0.0%) | 0 (0.0%) |
| Total | 358 (100.0%) | 119 (100.0%) |
Household Vehicle Usage in Fall Creek
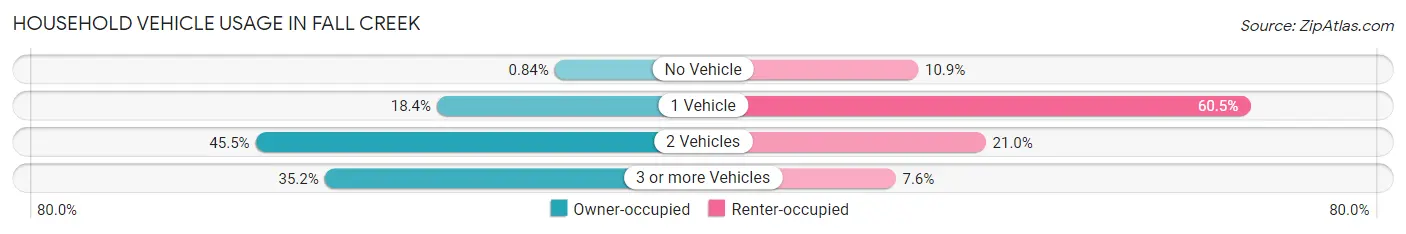
| Vehicles per Household | Owner-occupied | Renter-occupied |
| No Vehicle | 3 (0.8%) | 13 (10.9%) |
| 1 Vehicle | 66 (18.4%) | 72 (60.5%) |
| 2 Vehicles | 163 (45.5%) | 25 (21.0%) |
| 3 or more Vehicles | 126 (35.2%) | 9 (7.6%) |
| Total | 358 (100.0%) | 119 (100.0%) |
Real Estate & Mortgages in Fall Creek
Real Estate and Mortgage Overview in Fall Creek
| Characteristic | Without Mortgage | With Mortgage |
| Housing Units | 117 | 241 |
| Median Property Value | $171,300 | $184,900 |
| Median Household Income | $63,750 | $39 |
| Monthly Housing Costs | $554 | $0 |
| Real Estate Taxes | $2,906 | $2 |
Property Value by Mortgage Status in Fall Creek
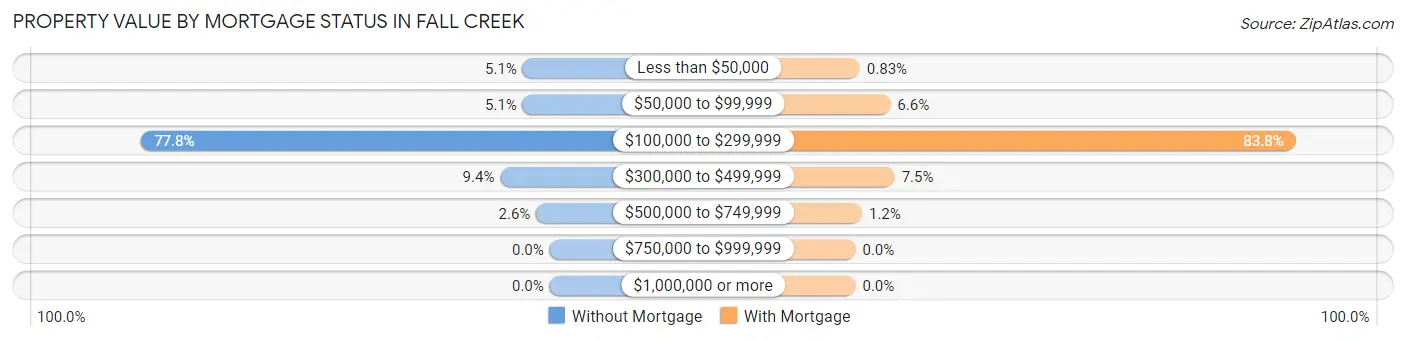
| Property Value | Without Mortgage | With Mortgage |
| Less than $50,000 | 6 (5.1%) | 2 (0.8%) |
| $50,000 to $99,999 | 6 (5.1%) | 16 (6.6%) |
| $100,000 to $299,999 | 91 (77.8%) | 202 (83.8%) |
| $300,000 to $499,999 | 11 (9.4%) | 18 (7.5%) |
| $500,000 to $749,999 | 3 (2.6%) | 3 (1.2%) |
| $750,000 to $999,999 | 0 (0.0%) | 0 (0.0%) |
| $1,000,000 or more | 0 (0.0%) | 0 (0.0%) |
| Total | 117 (100.0%) | 241 (100.0%) |
Household Income by Mortgage Status in Fall Creek
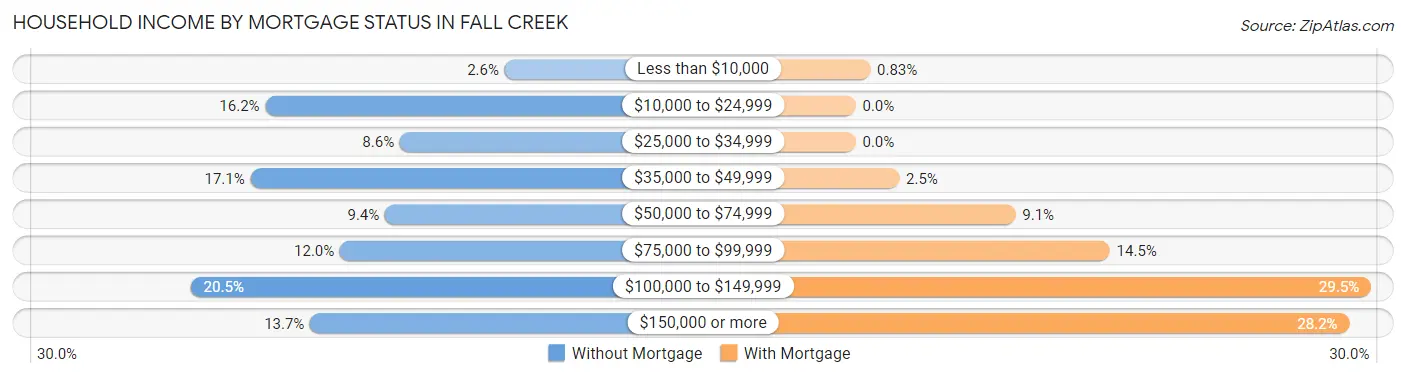
| Household Income | Without Mortgage | With Mortgage |
| Less than $10,000 | 3 (2.6%) | 2 (0.8%) |
| $10,000 to $24,999 | 19 (16.2%) | 0 (0.0%) |
| $25,000 to $34,999 | 10 (8.6%) | 0 (0.0%) |
| $35,000 to $49,999 | 20 (17.1%) | 6 (2.5%) |
| $50,000 to $74,999 | 11 (9.4%) | 22 (9.1%) |
| $75,000 to $99,999 | 14 (12.0%) | 35 (14.5%) |
| $100,000 to $149,999 | 24 (20.5%) | 71 (29.5%) |
| $150,000 or more | 16 (13.7%) | 68 (28.2%) |
| Total | 117 (100.0%) | 241 (100.0%) |
Property Value to Household Income Ratio in Fall Creek
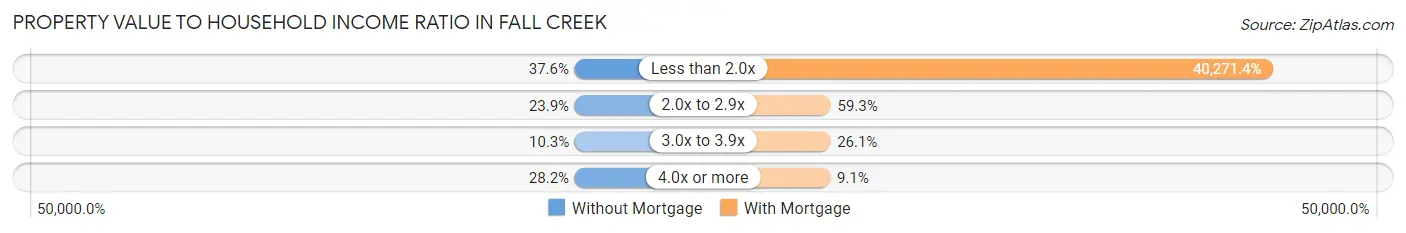
| Value-to-Income Ratio | Without Mortgage | With Mortgage |
| Less than 2.0x | 44 (37.6%) | 97,054 (40,271.4%) |
| 2.0x to 2.9x | 28 (23.9%) | 143 (59.3%) |
| 3.0x to 3.9x | 12 (10.3%) | 63 (26.1%) |
| 4.0x or more | 33 (28.2%) | 22 (9.1%) |
| Total | 117 (100.0%) | 241 (100.0%) |
Real Estate Taxes by Mortgage Status in Fall Creek
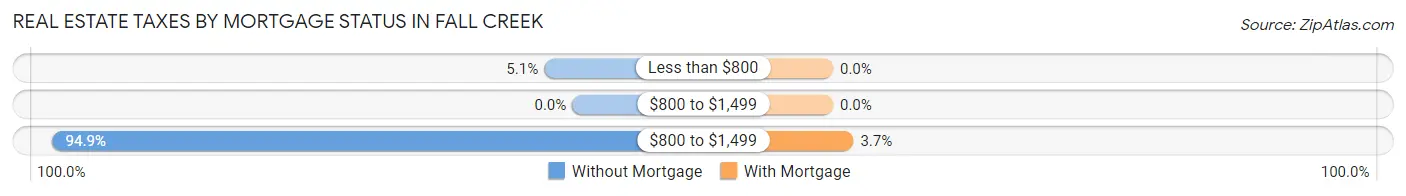
| Property Taxes | Without Mortgage | With Mortgage |
| Less than $800 | 6 (5.1%) | 0 (0.0%) |
| $800 to $1,499 | 0 (0.0%) | 0 (0.0%) |
| $800 to $1,499 | 111 (94.9%) | 9 (3.7%) |
| Total | 117 (100.0%) | 241 (100.0%) |
Health & Disability in Fall Creek
Health Insurance Coverage by Age in Fall Creek
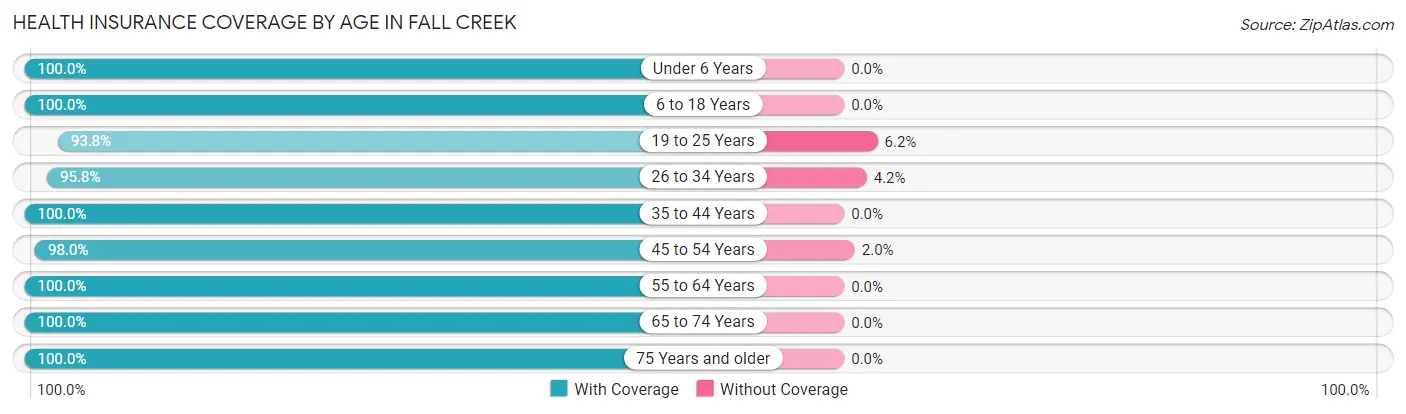
| Age Bracket | With Coverage | Without Coverage |
| Under 6 Years | 133 (100.0%) | 0 (0.0%) |
| 6 to 18 Years | 243 (100.0%) | 0 (0.0%) |
| 19 to 25 Years | 166 (93.8%) | 11 (6.2%) |
| 26 to 34 Years | 183 (95.8%) | 8 (4.2%) |
| 35 to 44 Years | 185 (100.0%) | 0 (0.0%) |
| 45 to 54 Years | 150 (98.0%) | 3 (2.0%) |
| 55 to 64 Years | 164 (100.0%) | 0 (0.0%) |
| 65 to 74 Years | 114 (100.0%) | 0 (0.0%) |
| 75 Years and older | 71 (100.0%) | 0 (0.0%) |
| Total | 1,409 (98.5%) | 22 (1.5%) |
Health Insurance Coverage by Citizenship Status in Fall Creek
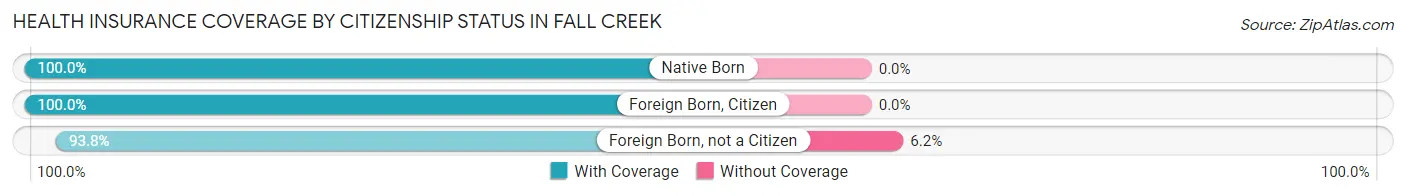
| Citizenship Status | With Coverage | Without Coverage |
| Native Born | 133 (100.0%) | 0 (0.0%) |
| Foreign Born, Citizen | 243 (100.0%) | 0 (0.0%) |
| Foreign Born, not a Citizen | 166 (93.8%) | 11 (6.2%) |
Health Insurance Coverage by Household Income in Fall Creek
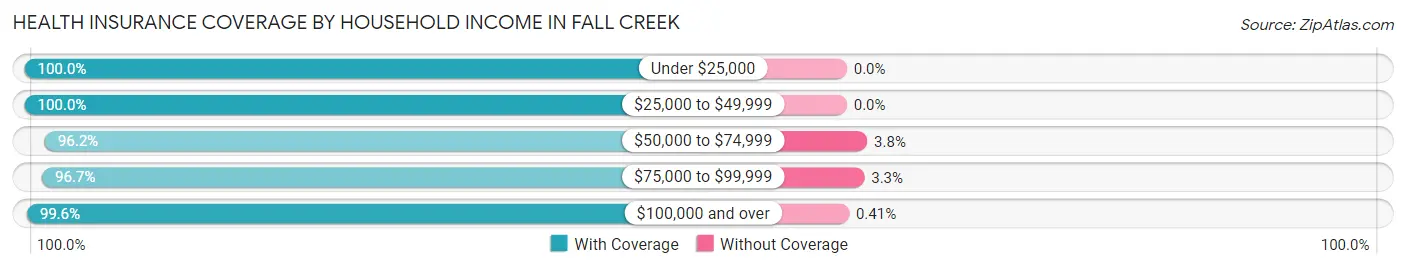
| Household Income | With Coverage | Without Coverage |
| Under $25,000 | 63 (100.0%) | 0 (0.0%) |
| $25,000 to $49,999 | 126 (100.0%) | 0 (0.0%) |
| $50,000 to $74,999 | 227 (96.2%) | 9 (3.8%) |
| $75,000 to $99,999 | 265 (96.7%) | 9 (3.3%) |
| $100,000 and over | 725 (99.6%) | 3 (0.4%) |
Public vs Private Health Insurance Coverage by Age in Fall Creek
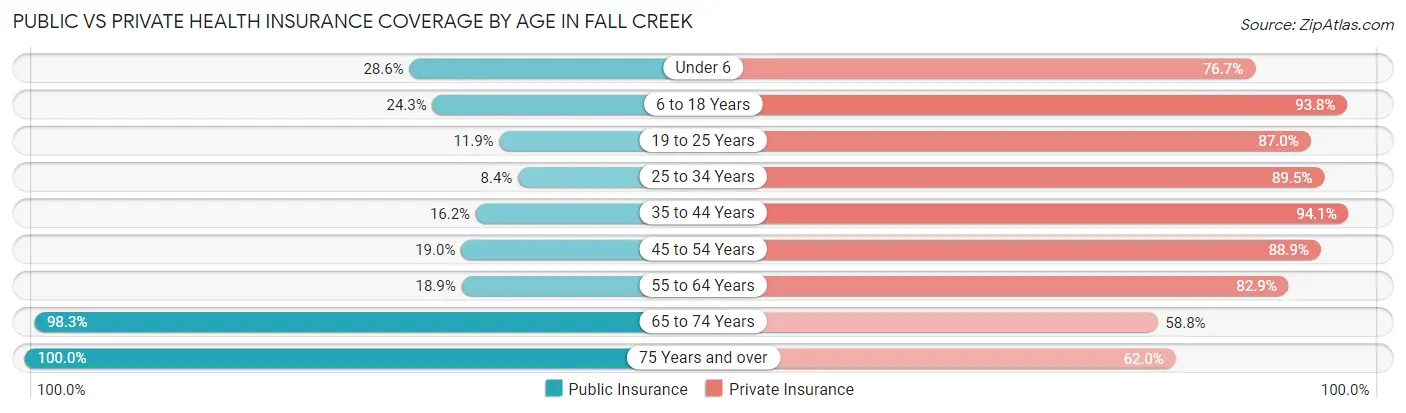
| Age Bracket | Public Insurance | Private Insurance |
| Under 6 | 38 (28.6%) | 102 (76.7%) |
| 6 to 18 Years | 59 (24.3%) | 228 (93.8%) |
| 19 to 25 Years | 21 (11.9%) | 154 (87.0%) |
| 25 to 34 Years | 16 (8.4%) | 171 (89.5%) |
| 35 to 44 Years | 30 (16.2%) | 174 (94.1%) |
| 45 to 54 Years | 29 (19.0%) | 136 (88.9%) |
| 55 to 64 Years | 31 (18.9%) | 136 (82.9%) |
| 65 to 74 Years | 112 (98.3%) | 67 (58.8%) |
| 75 Years and over | 71 (100.0%) | 44 (62.0%) |
| Total | 407 (28.4%) | 1,212 (84.7%) |
Disability Status by Sex by Age in Fall Creek
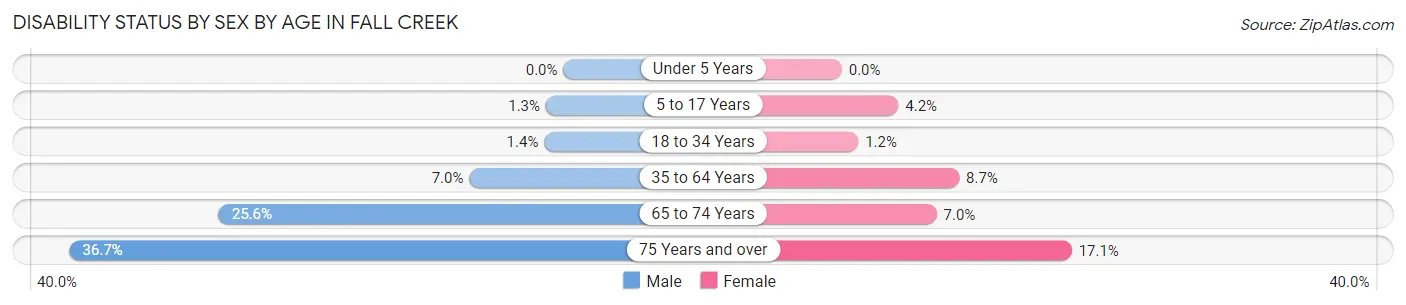
| Age Bracket | Male | Female |
| Under 5 Years | 0 (0.0%) | 0 (0.0%) |
| 5 to 17 Years | 2 (1.3%) | 5 (4.2%) |
| 18 to 34 Years | 3 (1.4%) | 2 (1.2%) |
| 35 to 64 Years | 15 (7.0%) | 25 (8.7%) |
| 65 to 74 Years | 11 (25.6%) | 5 (7.0%) |
| 75 Years and over | 11 (36.7%) | 7 (17.1%) |
Disability Class by Sex by Age in Fall Creek
Disability Class: Hearing Difficulty
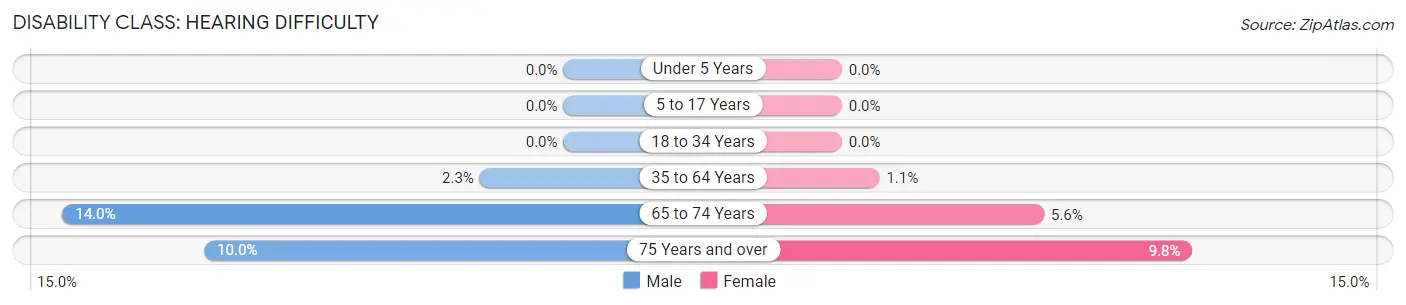
| Age Bracket | Male | Female |
| Under 5 Years | 0 (0.0%) | 0 (0.0%) |
| 5 to 17 Years | 0 (0.0%) | 0 (0.0%) |
| 18 to 34 Years | 0 (0.0%) | 0 (0.0%) |
| 35 to 64 Years | 5 (2.3%) | 3 (1.1%) |
| 65 to 74 Years | 6 (14.0%) | 4 (5.6%) |
| 75 Years and over | 3 (10.0%) | 4 (9.8%) |
Disability Class: Vision Difficulty
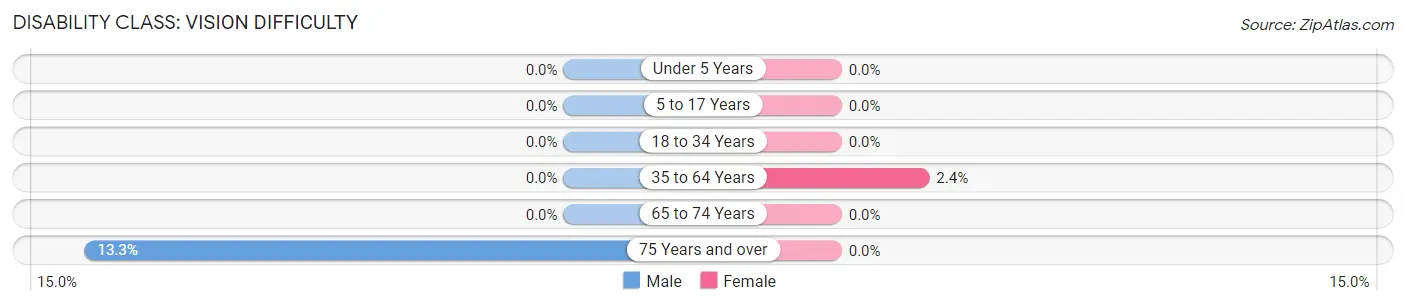
| Age Bracket | Male | Female |
| Under 5 Years | 0 (0.0%) | 0 (0.0%) |
| 5 to 17 Years | 0 (0.0%) | 0 (0.0%) |
| 18 to 34 Years | 0 (0.0%) | 0 (0.0%) |
| 35 to 64 Years | 0 (0.0%) | 7 (2.4%) |
| 65 to 74 Years | 0 (0.0%) | 0 (0.0%) |
| 75 Years and over | 4 (13.3%) | 0 (0.0%) |
Disability Class: Cognitive Difficulty
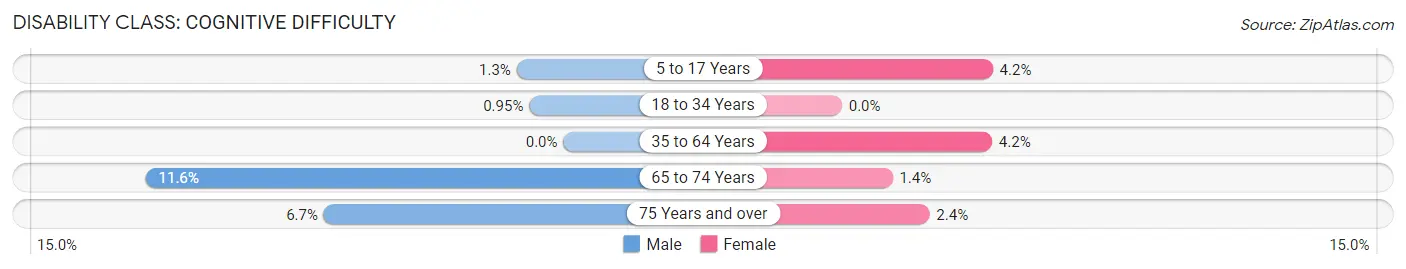
| Age Bracket | Male | Female |
| 5 to 17 Years | 2 (1.3%) | 5 (4.2%) |
| 18 to 34 Years | 2 (0.9%) | 0 (0.0%) |
| 35 to 64 Years | 0 (0.0%) | 12 (4.2%) |
| 65 to 74 Years | 5 (11.6%) | 1 (1.4%) |
| 75 Years and over | 2 (6.7%) | 1 (2.4%) |
Disability Class: Ambulatory Difficulty
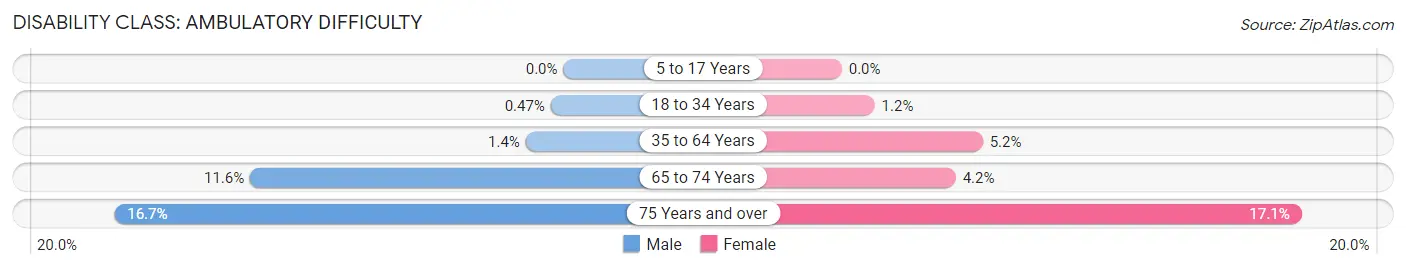
| Age Bracket | Male | Female |
| 5 to 17 Years | 0 (0.0%) | 0 (0.0%) |
| 18 to 34 Years | 1 (0.5%) | 2 (1.2%) |
| 35 to 64 Years | 3 (1.4%) | 15 (5.2%) |
| 65 to 74 Years | 5 (11.6%) | 3 (4.2%) |
| 75 Years and over | 5 (16.7%) | 7 (17.1%) |
Disability Class: Self-Care Difficulty
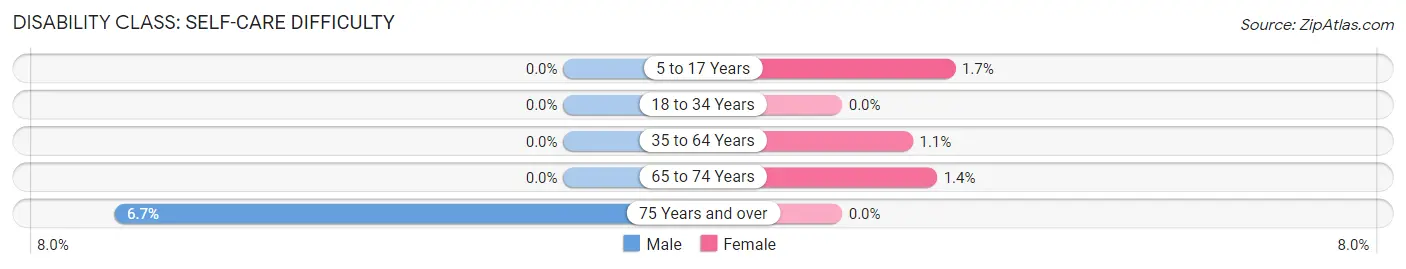
| Age Bracket | Male | Female |
| 5 to 17 Years | 0 (0.0%) | 2 (1.7%) |
| 18 to 34 Years | 0 (0.0%) | 0 (0.0%) |
| 35 to 64 Years | 0 (0.0%) | 3 (1.1%) |
| 65 to 74 Years | 0 (0.0%) | 1 (1.4%) |
| 75 Years and over | 2 (6.7%) | 0 (0.0%) |
Technology Access in Fall Creek
Computing Device Access in Fall Creek
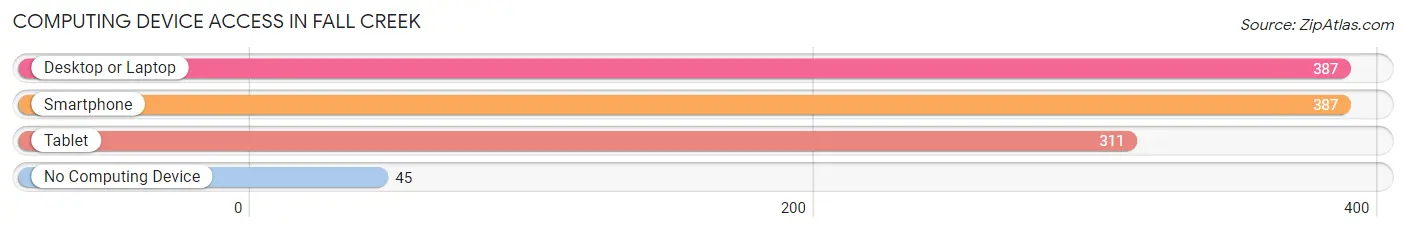
| Device Type | # Households | % Households |
| Desktop or Laptop | 387 | 81.1% |
| Smartphone | 387 | 81.1% |
| Tablet | 311 | 65.2% |
| No Computing Device | 45 | 9.4% |
| Total | 477 | 100.0% |
Internet Access in Fall Creek
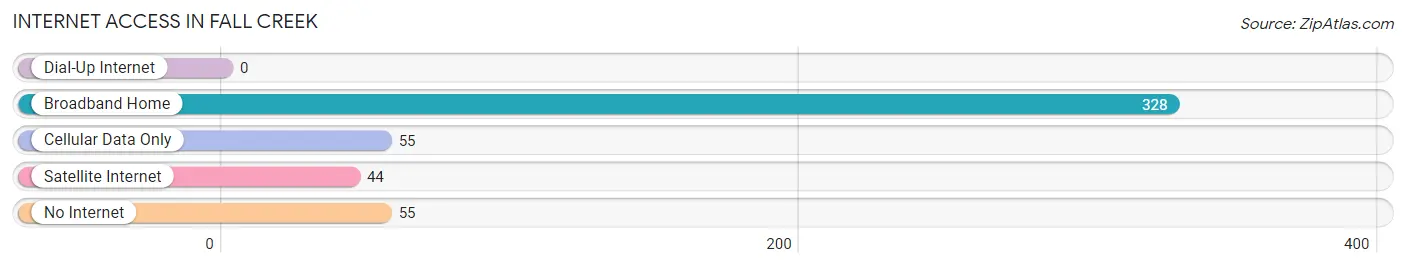
| Internet Type | # Households | % Households |
| Dial-Up Internet | 0 | 0.0% |
| Broadband Home | 328 | 68.8% |
| Cellular Data Only | 55 | 11.5% |
| Satellite Internet | 44 | 9.2% |
| No Internet | 55 | 11.5% |
| Total | 477 | 100.0% |
Fall Creek Summary
History
Fall Creek, Wisconsin is a small village located in Eau Claire County, Wisconsin. It is situated on the banks of the Chippewa River, and is part of the Eau Claire metropolitan area. The village was first settled in 1854 by a group of settlers from New York. The settlers were attracted to the area due to its abundance of natural resources, including timber and water. The village was originally named “Fall Creek” after the nearby creek, which was named for the falls that were located along its banks.
The village was officially incorporated in 1872, and the first mayor was elected in 1873. The village quickly grew and prospered, and by the early 1900s, it had become a thriving community. The village was home to a variety of businesses, including a sawmill, a grist mill, a creamery, a blacksmith shop, and a general store. The village also had a school, a post office, and a church.
In the early 1900s, the village was also home to a number of resorts, which attracted visitors from all over the country. The resorts offered a variety of activities, including fishing, boating, swimming, and hunting. The resorts also provided a place for visitors to relax and enjoy the natural beauty of the area.
The village continued to grow and prosper throughout the 20th century. In the 1950s, the village was home to a number of manufacturing plants, including a paper mill and a furniture factory. The village also had a number of retail stores, including a grocery store, a hardware store, and a drug store.
Geography
Fall Creek is located in Eau Claire County, Wisconsin. It is situated on the banks of the Chippewa River, and is part of the Eau Claire metropolitan area. The village is located approximately 25 miles east of Eau Claire, and is bordered by the towns of Brunswick, Fairchild, and Augusta.
The village is situated on a flat plain, with the Chippewa River running through the center of the village. The village is surrounded by rolling hills and wooded areas, and is home to a variety of wildlife, including deer, foxes, and turkeys.
The village is located in a temperate climate, with warm summers and cold winters. The average temperature in the summer is around 75 degrees Fahrenheit, and the average temperature in the winter is around 25 degrees Fahrenheit.
Economy
The economy of Fall Creek is largely based on agriculture and manufacturing. The village is home to a number of farms, which produce a variety of crops, including corn, soybeans, and hay. The village also has a number of manufacturing plants, including a paper mill and a furniture factory.
The village is also home to a number of retail stores, including a grocery store, a hardware store, and a drug store. The village also has a number of restaurants, bars, and other businesses.
Demographics
As of the 2010 census, the population of Fall Creek was 1,845. The population is largely white (94.3%), with small percentages of African American (2.2%), Asian (1.2%), and Hispanic (1.2%) residents. The median household income is $45,000, and the median home value is $150,000.
The village is served by the Fall Creek School District, which includes two elementary schools, a middle school, and a high school. The village is also home to a number of churches, including the First Presbyterian Church, the United Methodist Church, and the Church of the Nazarene.
Common Questions
What is Per Capita Income in Fall Creek?
Per Capita income in Fall Creek is $32,381.
What is the Median Family Income in Fall Creek?
Median Family Income in Fall Creek is $97,125.
What is the Median Household income in Fall Creek?
Median Household Income in Fall Creek is $76,417.
What is Income or Wage Gap in Fall Creek?
Income or Wage Gap in Fall Creek is 28.9%.
Women in Fall Creek earn 71.1 cents for every dollar earned by a man.
What is Inequality or Gini Index in Fall Creek?
Inequality or Gini Index in Fall Creek is 0.37.
What is the Total Population of Fall Creek?
Total Population of Fall Creek is 1,459.
What is the Total Male Population of Fall Creek?
Total Male Population of Fall Creek is 712.
What is the Total Female Population of Fall Creek?
Total Female Population of Fall Creek is 747.
What is the Ratio of Males per 100 Females in Fall Creek?
There are 95.31 Males per 100 Females in Fall Creek.
What is the Ratio of Females per 100 Males in Fall Creek?
There are 104.92 Females per 100 Males in Fall Creek.
What is the Median Population Age in Fall Creek?
Median Population Age in Fall Creek is 34.5 Years.
What is the Average Family Size in Fall Creek
Average Family Size in Fall Creek is 3.7 People.
What is the Average Household Size in Fall Creek
Average Household Size in Fall Creek is 3.0 People.
How Large is the Labor Force in Fall Creek?
There are 872 People in the Labor Forcein in Fall Creek.
What is the Percentage of People in the Labor Force in Fall Creek?
77.8% of People are in the Labor Force in Fall Creek.
What is the Unemployment Rate in Fall Creek?
Unemployment Rate in Fall Creek is 2.8%.