Ephraim, WI Map & Demographics
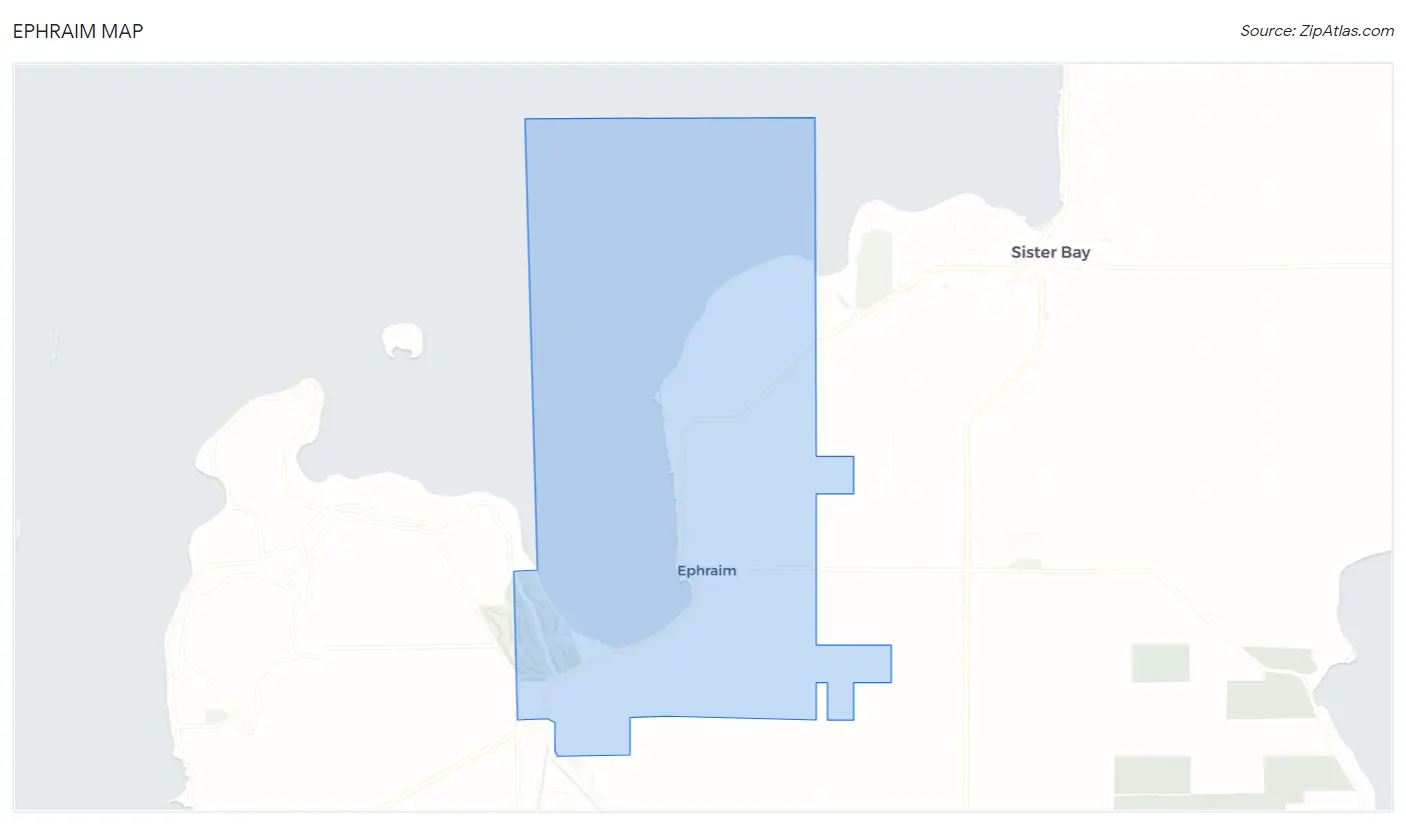
Ephraim Map
Ephraim Overview
$78,712
PER CAPITA INCOME
$106,250
AVG FAMILY INCOME
$72,292
AVG HOUSEHOLD INCOME
39.9%
WAGE / INCOME GAP [ % ]
60.1¢/ $1
WAGE / INCOME GAP [ $ ]
0.56
INEQUALITY / GINI INDEX
307
TOTAL POPULATION
145
MALE POPULATION
162
FEMALE POPULATION
89.51
MALES / 100 FEMALES
111.72
FEMALES / 100 MALES
63.9
MEDIAN AGE
2.4
AVG FAMILY SIZE
1.8
AVG HOUSEHOLD SIZE
146
LABOR FORCE [ PEOPLE ]
50.2%
PERCENT IN LABOR FORCE
Ephraim Zip Codes
Ephraim Area Codes
Income in Ephraim
Income Overview in Ephraim
Per Capita Income in Ephraim is $78,712, while median incomes of families and households are $106,250 and $72,292 respectively.
| Characteristic | Number | Measure |
| Per Capita Income | 307 | $78,712 |
| Median Family Income | 99 | $106,250 |
| Mean Family Income | 99 | $176,344 |
| Median Household Income | 167 | $72,292 |
| Mean Household Income | 167 | $124,249 |
| Income Deficit | 99 | $0 |
| Wage / Income Gap (%) | 307 | 39.91% |
| Wage / Income Gap ($) | 307 | 60.09¢ per $1 |
| Gini / Inequality Index | 307 | 0.56 |
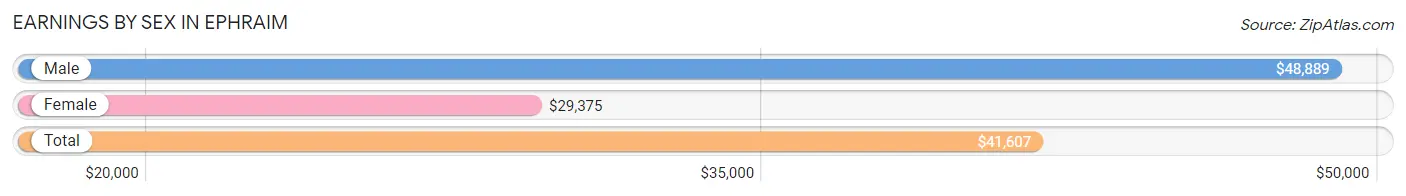
Earnings by Sex in Ephraim
Average Earnings in Ephraim are $41,607, $48,889 for men and $29,375 for women, a difference of 39.9%.
| Sex | Number | Average Earnings |
| Male | 86 (56.2%) | $48,889 |
| Female | 67 (43.8%) | $29,375 |
| Total | 153 (100.0%) | $41,607 |
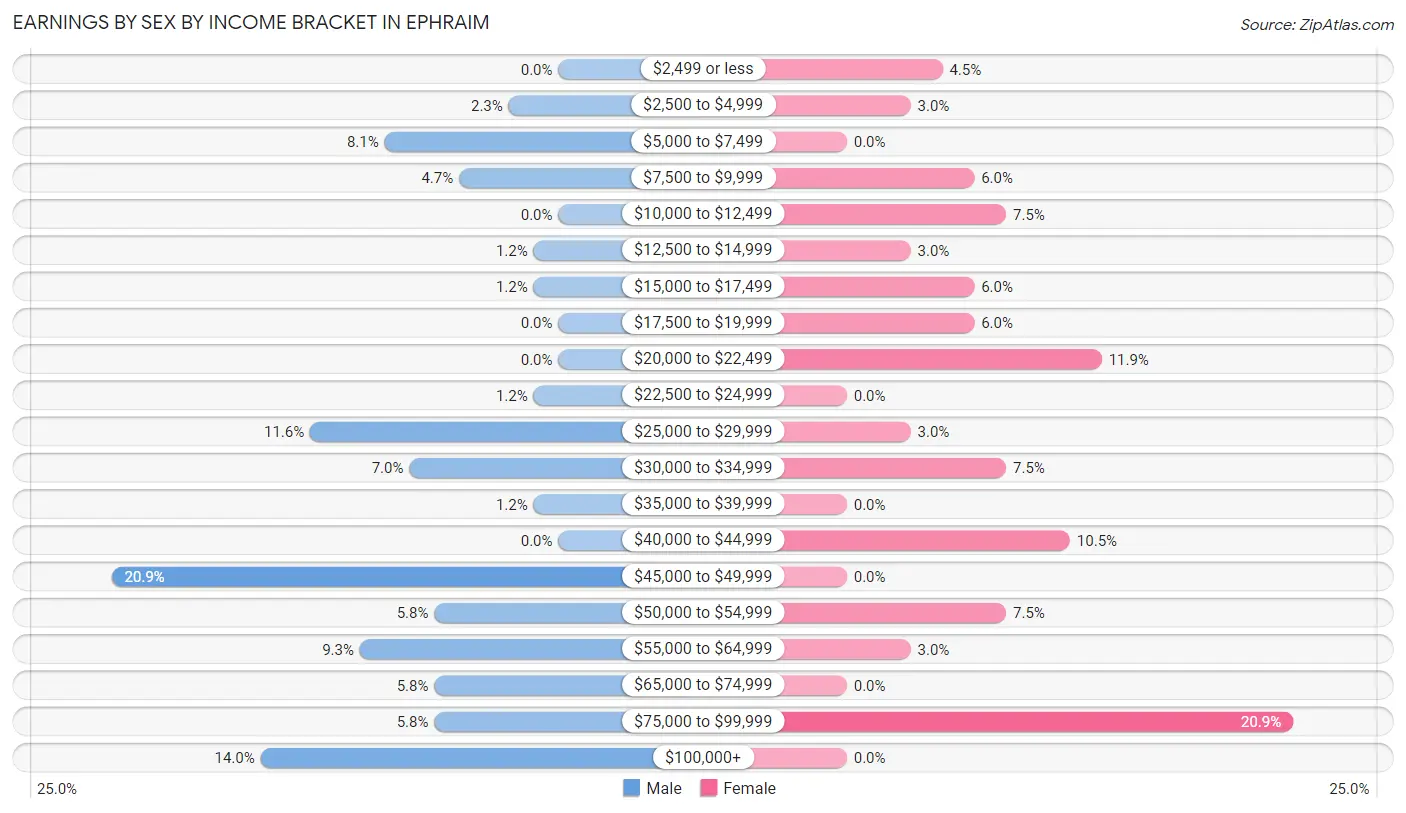
Earnings by Sex by Income Bracket in Ephraim
The most common earnings brackets in Ephraim are $45,000 to $49,999 for men (18 | 20.9%) and $75,000 to $99,999 for women (14 | 20.9%).
| Income | Male | Female |
| $2,499 or less | 0 (0.0%) | 3 (4.5%) |
| $2,500 to $4,999 | 2 (2.3%) | 2 (3.0%) |
| $5,000 to $7,499 | 7 (8.1%) | 0 (0.0%) |
| $7,500 to $9,999 | 4 (4.6%) | 4 (6.0%) |
| $10,000 to $12,499 | 0 (0.0%) | 5 (7.5%) |
| $12,500 to $14,999 | 1 (1.2%) | 2 (3.0%) |
| $15,000 to $17,499 | 1 (1.2%) | 4 (6.0%) |
| $17,500 to $19,999 | 0 (0.0%) | 4 (6.0%) |
| $20,000 to $22,499 | 0 (0.0%) | 8 (11.9%) |
| $22,500 to $24,999 | 1 (1.2%) | 0 (0.0%) |
| $25,000 to $29,999 | 10 (11.6%) | 2 (3.0%) |
| $30,000 to $34,999 | 6 (7.0%) | 5 (7.5%) |
| $35,000 to $39,999 | 1 (1.2%) | 0 (0.0%) |
| $40,000 to $44,999 | 0 (0.0%) | 7 (10.4%) |
| $45,000 to $49,999 | 18 (20.9%) | 0 (0.0%) |
| $50,000 to $54,999 | 5 (5.8%) | 5 (7.5%) |
| $55,000 to $64,999 | 8 (9.3%) | 2 (3.0%) |
| $65,000 to $74,999 | 5 (5.8%) | 0 (0.0%) |
| $75,000 to $99,999 | 5 (5.8%) | 14 (20.9%) |
| $100,000+ | 12 (14.0%) | 0 (0.0%) |
| Total | 86 (100.0%) | 67 (100.0%) |
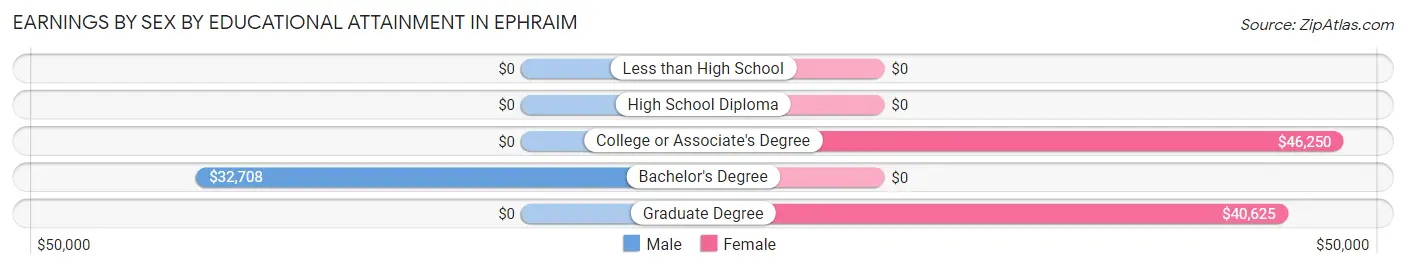
Earnings by Sex by Educational Attainment in Ephraim
Average earnings in Ephraim are $48,889 for men and $34,750 for women, a difference of 28.9%. Men with an educational attainment of bachelor's degree enjoy the highest average annual earnings of $32,708, while those with bachelor's degree education earn the least with $32,708. Women with an educational attainment of college or associate's degree earn the most with the average annual earnings of $46,250, while those with graduate degree education have the smallest earnings of $40,625.
| Educational Attainment | Male Income | Female Income |
| Less than High School | - | - |
| High School Diploma | - | - |
| College or Associate's Degree | - | - |
| Bachelor's Degree | $32,708 | $0 |
| Graduate Degree | - | - |
| Total | $48,889 | $34,750 |
Family Income in Ephraim
Family Income Brackets in Ephraim
According to the Ephraim family income data, there are 39 families falling into the $100,000 to $149,999 income range, which is the most common income bracket and makes up 39.4% of all families.
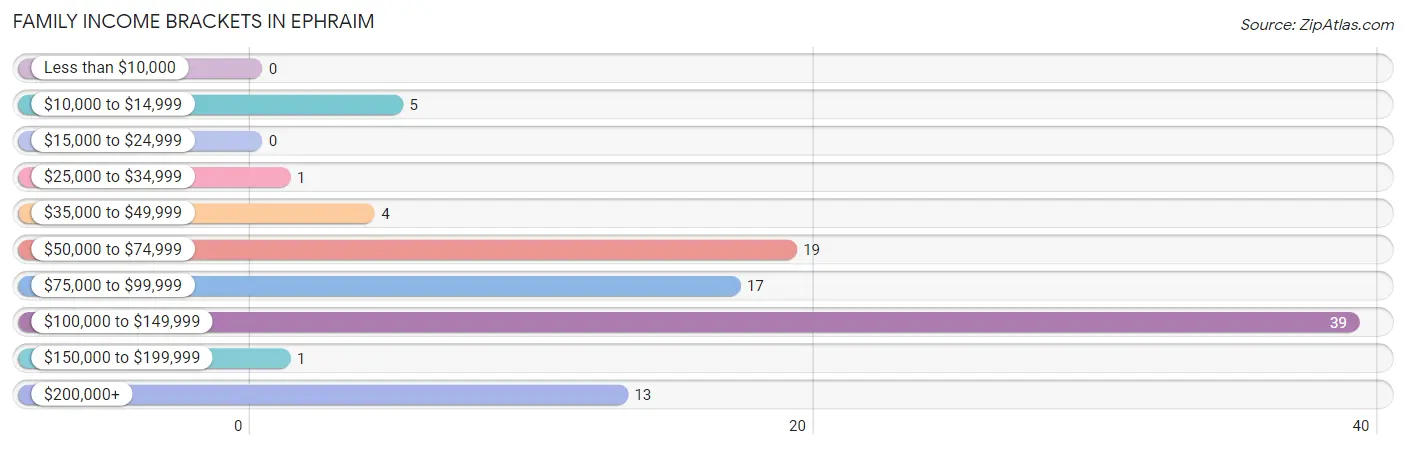
| Income Bracket | # Families | % Families |
| Less than $10,000 | 0 | 0.0% |
| $10,000 to $14,999 | 5 | 5.1% |
| $15,000 to $24,999 | 0 | 0.0% |
| $25,000 to $34,999 | 1 | 1.0% |
| $35,000 to $49,999 | 4 | 4.0% |
| $50,000 to $74,999 | 19 | 19.2% |
| $75,000 to $99,999 | 17 | 17.2% |
| $100,000 to $149,999 | 39 | 39.4% |
| $150,000 to $199,999 | 1 | 1.0% |
| $200,000+ | 13 | 13.1% |
Family Income by Famaliy Size in Ephraim
3-person families (20 | 20.2%) account for the highest median family income in Ephraim with $123,750 per family, while 2-person families (71 | 71.7%) have the highest median income of $53,542 per family member.
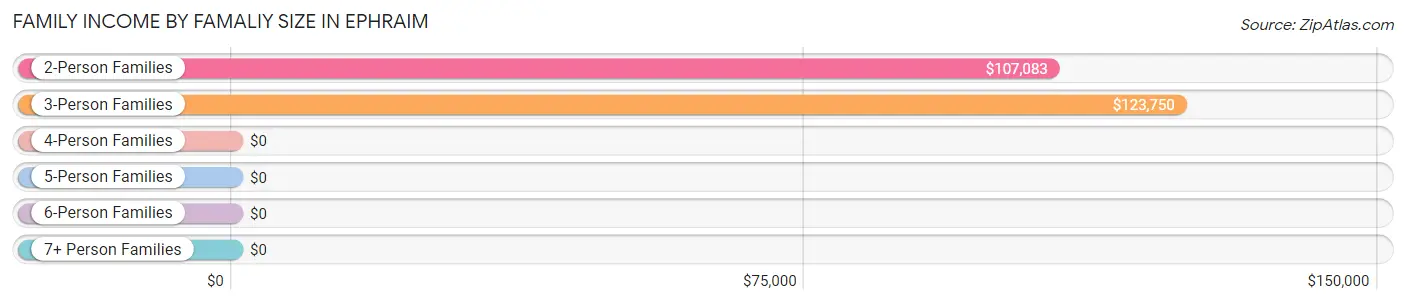
| Income Bracket | # Families | Median Income |
| 2-Person Families | 71 (71.7%) | $107,083 |
| 3-Person Families | 20 (20.2%) | $123,750 |
| 4-Person Families | 3 (3.0%) | $0 |
| 5-Person Families | 5 (5.1%) | $0 |
| 6-Person Families | 0 (0.0%) | $0 |
| 7+ Person Families | 0 (0.0%) | $0 |
| Total | 99 (100.0%) | $106,250 |
Family Income by Number of Earners in Ephraim
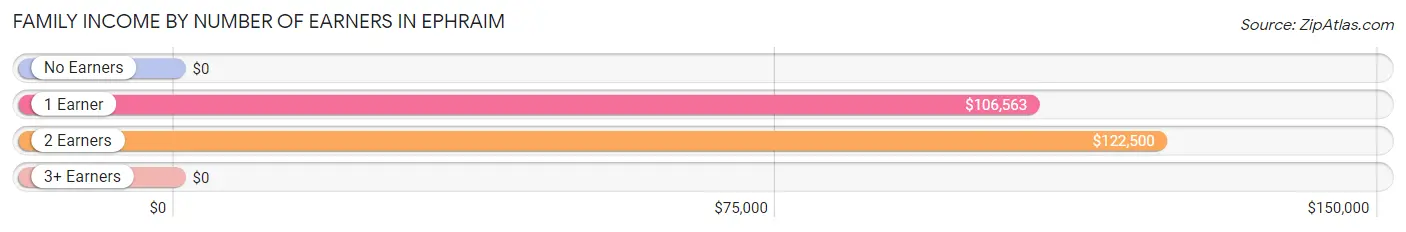
| Number of Earners | # Families | Median Income |
| No Earners | 22 (22.2%) | $0 |
| 1 Earner | 31 (31.3%) | $106,563 |
| 2 Earners | 46 (46.5%) | $122,500 |
| 3+ Earners | 0 (0.0%) | $0 |
| Total | 99 (100.0%) | $106,250 |
Household Income in Ephraim
Household Income Brackets in Ephraim
With 46 households falling in the category, the $100,000 to $149,999 income range is the most frequent in Ephraim, accounting for 27.5% of all households. In contrast, only 1 households (0.6%) fall into the $150,000 to $199,999 income bracket, making it the least populous group.
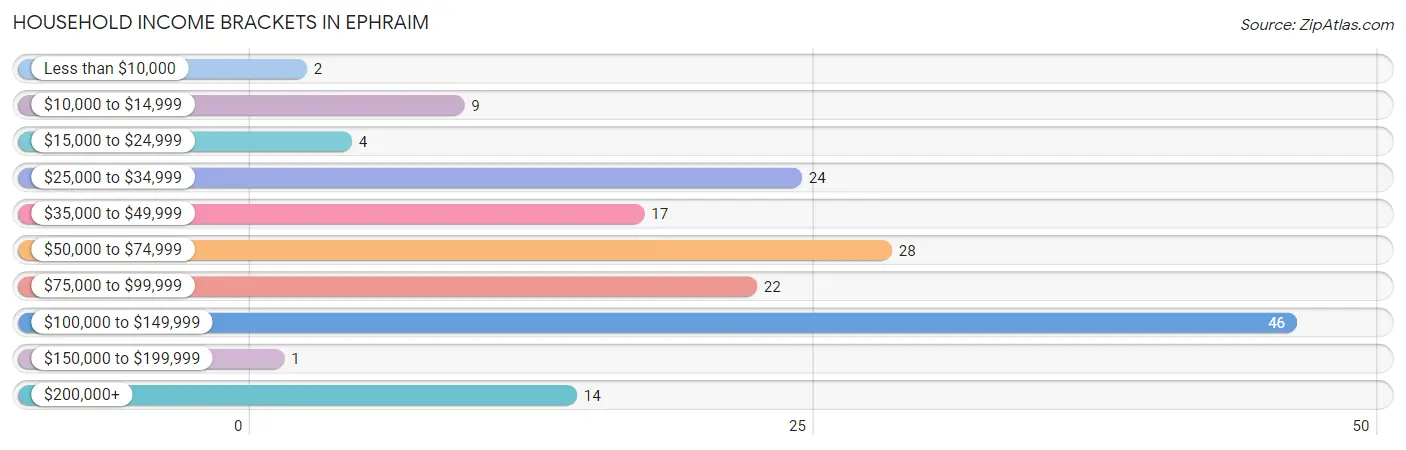
| Income Bracket | # Households | % Households |
| Less than $10,000 | 2 | 1.2% |
| $10,000 to $14,999 | 9 | 5.4% |
| $15,000 to $24,999 | 4 | 2.4% |
| $25,000 to $34,999 | 24 | 14.4% |
| $35,000 to $49,999 | 17 | 10.2% |
| $50,000 to $74,999 | 28 | 16.8% |
| $75,000 to $99,999 | 22 | 13.2% |
| $100,000 to $149,999 | 46 | 27.5% |
| $150,000 to $199,999 | 1 | 0.6% |
| $200,000+ | 14 | 8.4% |
Household Income by Householder Age in Ephraim
The median household income in Ephraim is $72,292, with the highest median household income of $127,500 found in the 45 to 64 years age bracket for the primary householder. A total of 50 households (29.9%) fall into this category.
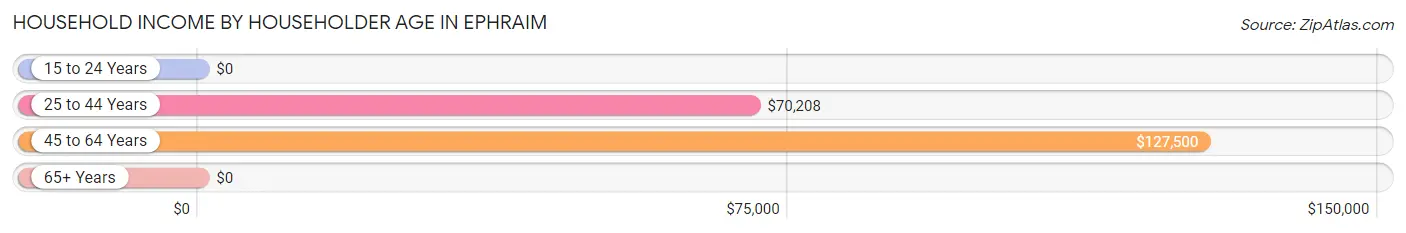
| Income Bracket | # Households | Median Income |
| 15 to 24 Years | 0 (0.0%) | $0 |
| 25 to 44 Years | 15 (9.0%) | $70,208 |
| 45 to 64 Years | 50 (29.9%) | $127,500 |
| 65+ Years | 102 (61.1%) | $0 |
| Total | 167 (100.0%) | $72,292 |
Poverty in Ephraim
Income Below Poverty by Sex and Age in Ephraim
With 6.2% poverty level for males and 4.3% for females among the residents of Ephraim, 75 year old and over males and 75 year old and over females are the most vulnerable to poverty, with 5 males (19.2%) and 6 females (10.7%) in their respective age groups living below the poverty level.
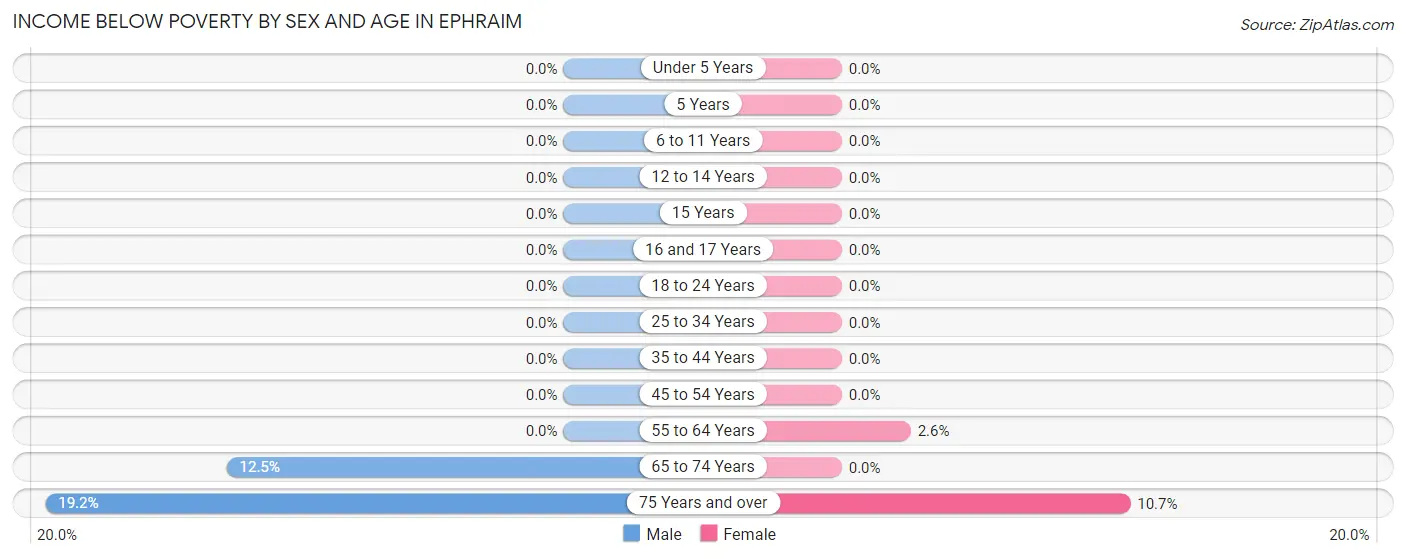
| Age Bracket | Male | Female |
| Under 5 Years | 0 (0.0%) | 0 (0.0%) |
| 5 Years | 0 (0.0%) | 0 (0.0%) |
| 6 to 11 Years | 0 (0.0%) | 0 (0.0%) |
| 12 to 14 Years | 0 (0.0%) | 0 (0.0%) |
| 15 Years | 0 (0.0%) | 0 (0.0%) |
| 16 and 17 Years | 0 (0.0%) | 0 (0.0%) |
| 18 to 24 Years | 0 (0.0%) | 0 (0.0%) |
| 25 to 34 Years | 0 (0.0%) | 0 (0.0%) |
| 35 to 44 Years | 0 (0.0%) | 0 (0.0%) |
| 45 to 54 Years | 0 (0.0%) | 0 (0.0%) |
| 55 to 64 Years | 0 (0.0%) | 1 (2.6%) |
| 65 to 74 Years | 4 (12.5%) | 0 (0.0%) |
| 75 Years and over | 5 (19.2%) | 6 (10.7%) |
| Total | 9 (6.2%) | 7 (4.3%) |
Income Above Poverty by Sex and Age in Ephraim
According to the poverty statistics in Ephraim, males aged under 5 years and females aged 6 to 11 years are the age groups that are most secure financially, with 100.0% of males and 100.0% of females in these age groups living above the poverty line.
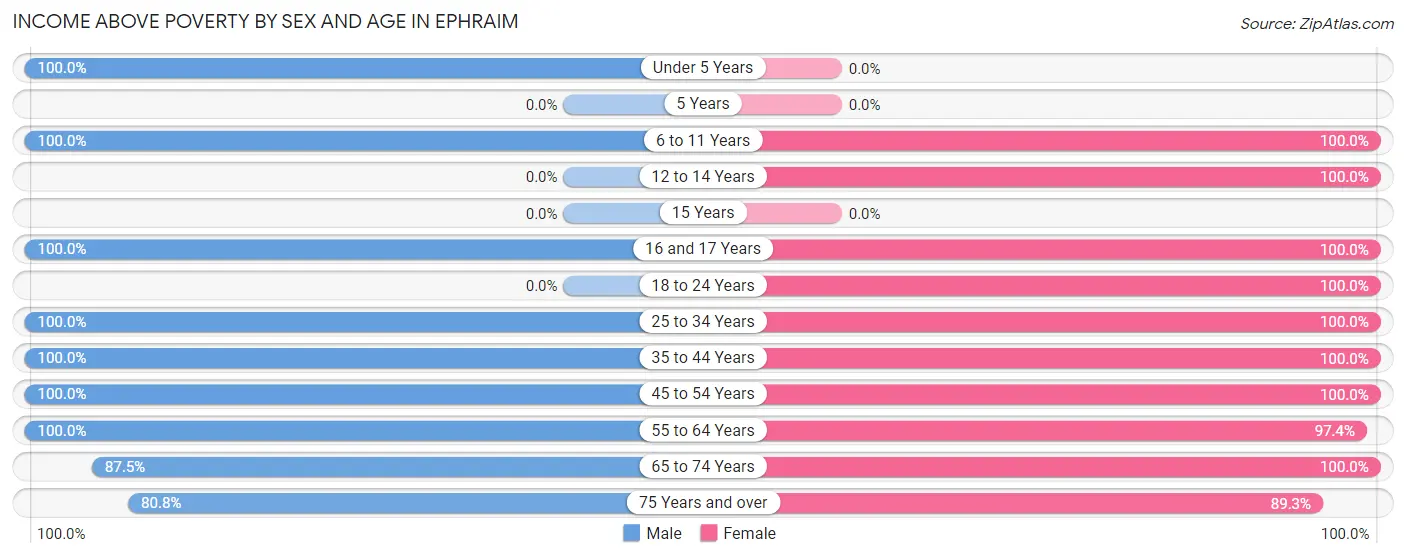
| Age Bracket | Male | Female |
| Under 5 Years | 8 (100.0%) | 0 (0.0%) |
| 5 Years | 0 (0.0%) | 0 (0.0%) |
| 6 to 11 Years | 1 (100.0%) | 4 (100.0%) |
| 12 to 14 Years | 0 (0.0%) | 3 (100.0%) |
| 15 Years | 0 (0.0%) | 0 (0.0%) |
| 16 and 17 Years | 6 (100.0%) | 2 (100.0%) |
| 18 to 24 Years | 0 (0.0%) | 8 (100.0%) |
| 25 to 34 Years | 5 (100.0%) | 5 (100.0%) |
| 35 to 44 Years | 8 (100.0%) | 3 (100.0%) |
| 45 to 54 Years | 20 (100.0%) | 4 (100.0%) |
| 55 to 64 Years | 39 (100.0%) | 38 (97.4%) |
| 65 to 74 Years | 28 (87.5%) | 38 (100.0%) |
| 75 Years and over | 21 (80.8%) | 50 (89.3%) |
| Total | 136 (93.8%) | 155 (95.7%) |
Income Below Poverty Among Married-Couple Families in Ephraim
The poverty statistics for married-couple families in Ephraim show that 5.1% or 5 of the total 97 families live below the poverty line. Families with no children have the highest poverty rate of 6.3%, comprising of 5 families. On the other hand, families with 1 or 2 children have the lowest poverty rate of 0.0%, which includes 0 families.
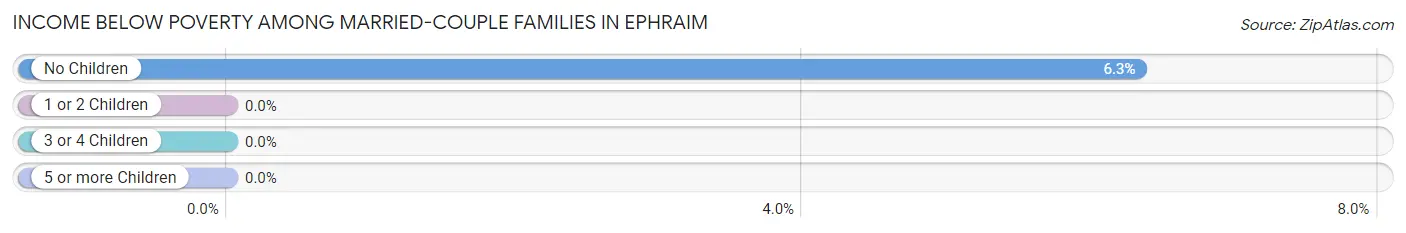
| Children | Above Poverty | Below Poverty |
| No Children | 74 (93.7%) | 5 (6.3%) |
| 1 or 2 Children | 13 (100.0%) | 0 (0.0%) |
| 3 or 4 Children | 5 (100.0%) | 0 (0.0%) |
| 5 or more Children | 0 (0.0%) | 0 (0.0%) |
| Total | 92 (94.9%) | 5 (5.1%) |
Income Below Poverty Among Single-Parent Households in Ephraim
| Children | Single Father | Single Mother |
| No Children | 0 (0.0%) | 0 (0.0%) |
| 1 or 2 Children | 0 (0.0%) | 0 (0.0%) |
| 3 or 4 Children | 0 (0.0%) | 0 (0.0%) |
| 5 or more Children | 0 (0.0%) | 0 (0.0%) |
| Total | 0 (0.0%) | 0 (0.0%) |
Income Below Poverty Among Married-Couple vs Single-Parent Households in Ephraim
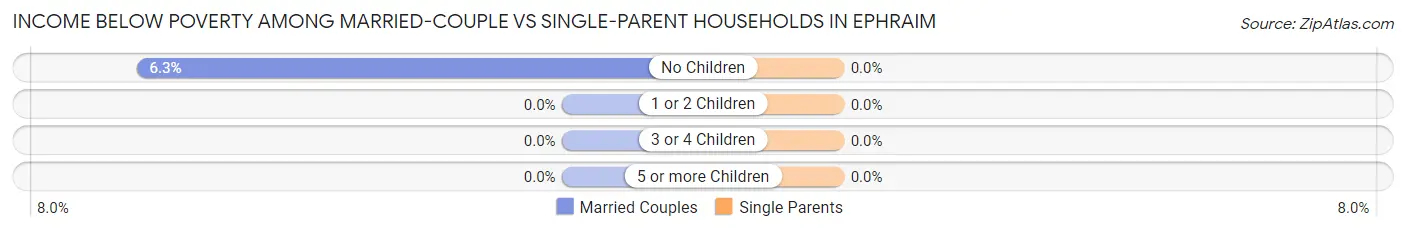
| Children | Married-Couple Families | Single-Parent Households |
| No Children | 5 (6.3%) | 0 (0.0%) |
| 1 or 2 Children | 0 (0.0%) | 0 (0.0%) |
| 3 or 4 Children | 0 (0.0%) | 0 (0.0%) |
| 5 or more Children | 0 (0.0%) | 0 (0.0%) |
| Total | 5 (5.1%) | 0 (0.0%) |
Race in Ephraim
The most populous races in Ephraim are White / Caucasian (292 | 95.1%), and Two or more Races (15 | 4.9%).
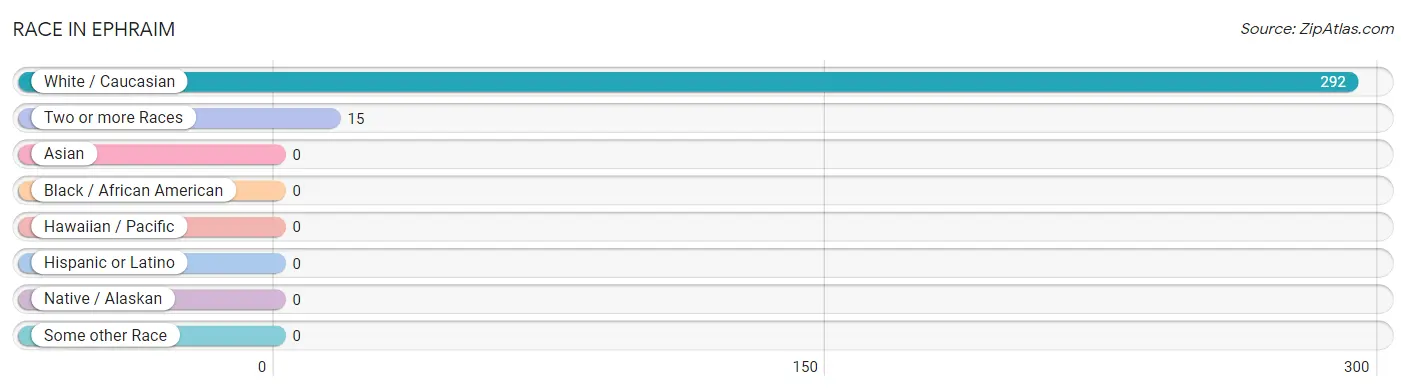
| Race | # Population | % Population |
| Asian | 0 | 0.0% |
| Black / African American | 0 | 0.0% |
| Hawaiian / Pacific | 0 | 0.0% |
| Hispanic or Latino | 0 | 0.0% |
| Native / Alaskan | 0 | 0.0% |
| White / Caucasian | 292 | 95.1% |
| Two or more Races | 15 | 4.9% |
| Some other Race | 0 | 0.0% |
| Total | 307 | 100.0% |
Ancestry in Ephraim
The most populous ancestries reported in Ephraim are German (150 | 48.9%), Irish (53 | 17.3%), English (36 | 11.7%), Norwegian (32 | 10.4%), and Scandinavian (18 | 5.9%), together accounting for 94.1% of all Ephraim residents.
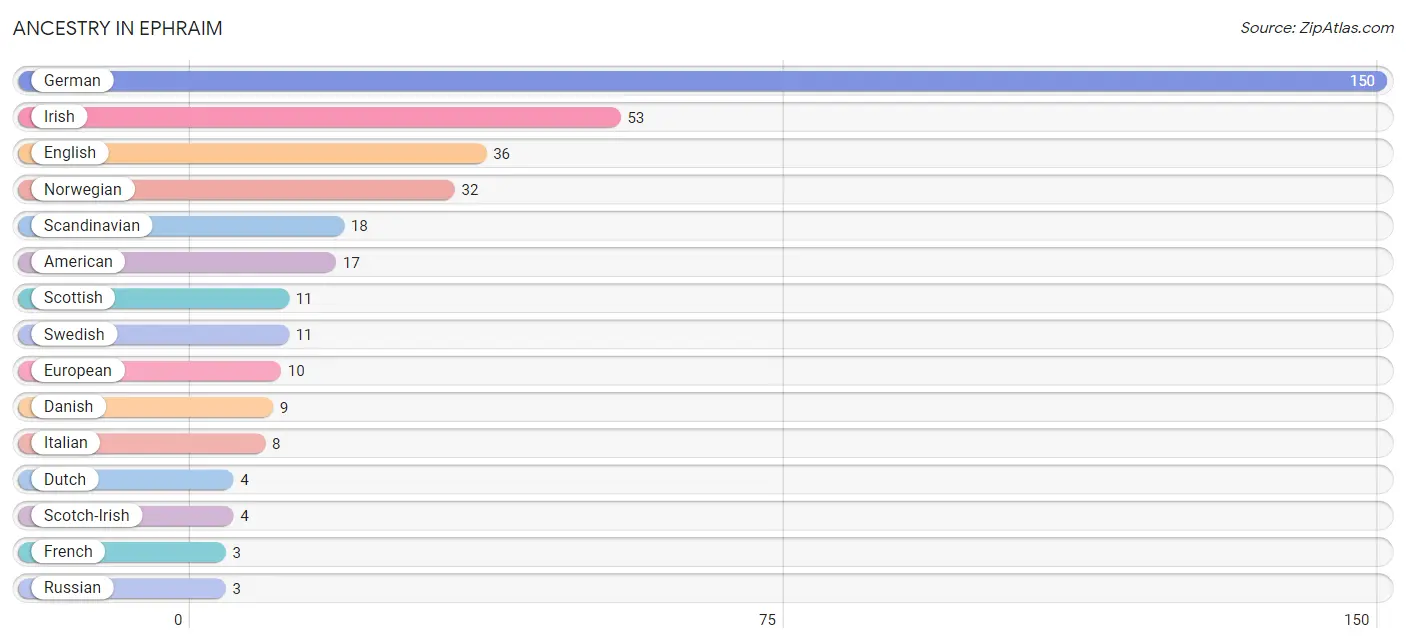
| Ancestry | # Population | % Population |
| American | 17 | 5.5% |
| Croatian | 1 | 0.3% |
| Danish | 9 | 2.9% |
| Dutch | 4 | 1.3% |
| Eastern European | 1 | 0.3% |
| English | 36 | 11.7% |
| European | 10 | 3.3% |
| Finnish | 1 | 0.3% |
| French | 3 | 1.0% |
| French Canadian | 1 | 0.3% |
| German | 150 | 48.9% |
| Irish | 53 | 17.3% |
| Italian | 8 | 2.6% |
| Norwegian | 32 | 10.4% |
| Polish | 2 | 0.6% |
| Russian | 3 | 1.0% |
| Scandinavian | 18 | 5.9% |
| Scotch-Irish | 4 | 1.3% |
| Scottish | 11 | 3.6% |
| Swedish | 11 | 3.6% | View All 20 Rows |
Immigrants in Ephraim

| Immigration Origin | # Population | % Population | View All 0 Rows |
Sex and Age in Ephraim
Sex and Age in Ephraim
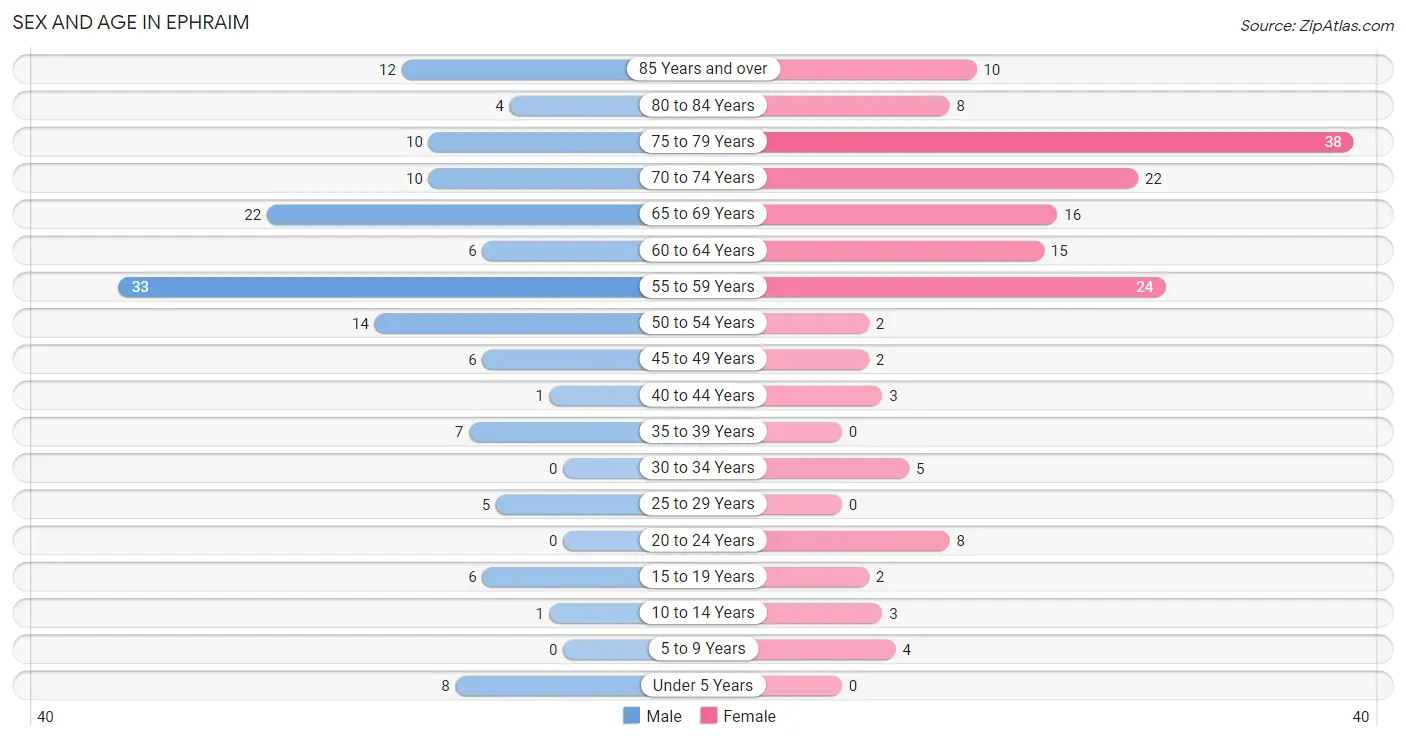
The most populous age groups in Ephraim are 55 to 59 Years (33 | 22.8%) for men and 75 to 79 Years (38 | 23.5%) for women.
| Age Bracket | Male | Female |
| Under 5 Years | 8 (5.5%) | 0 (0.0%) |
| 5 to 9 Years | 0 (0.0%) | 4 (2.5%) |
| 10 to 14 Years | 1 (0.7%) | 3 (1.8%) |
| 15 to 19 Years | 6 (4.1%) | 2 (1.2%) |
| 20 to 24 Years | 0 (0.0%) | 8 (4.9%) |
| 25 to 29 Years | 5 (3.5%) | 0 (0.0%) |
| 30 to 34 Years | 0 (0.0%) | 5 (3.1%) |
| 35 to 39 Years | 7 (4.8%) | 0 (0.0%) |
| 40 to 44 Years | 1 (0.7%) | 3 (1.8%) |
| 45 to 49 Years | 6 (4.1%) | 2 (1.2%) |
| 50 to 54 Years | 14 (9.7%) | 2 (1.2%) |
| 55 to 59 Years | 33 (22.8%) | 24 (14.8%) |
| 60 to 64 Years | 6 (4.1%) | 15 (9.3%) |
| 65 to 69 Years | 22 (15.2%) | 16 (9.9%) |
| 70 to 74 Years | 10 (6.9%) | 22 (13.6%) |
| 75 to 79 Years | 10 (6.9%) | 38 (23.5%) |
| 80 to 84 Years | 4 (2.8%) | 8 (4.9%) |
| 85 Years and over | 12 (8.3%) | 10 (6.2%) |
| Total | 145 (100.0%) | 162 (100.0%) |
Families and Households in Ephraim
Median Family Size in Ephraim
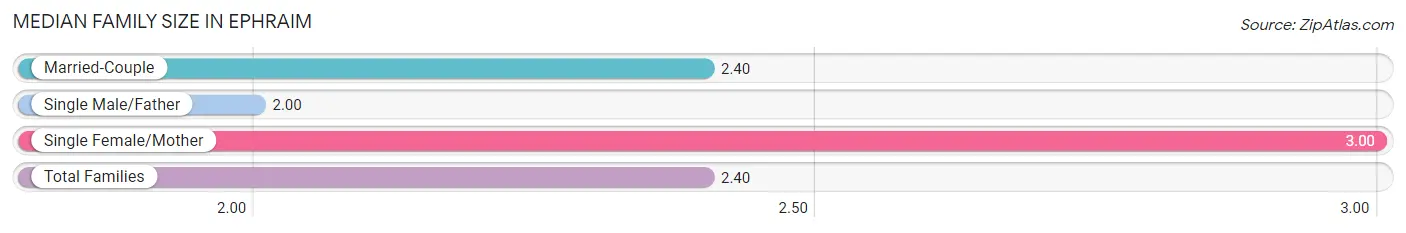
The median family size in Ephraim is 2.40 persons per family, with single female/mother families (1 | 1.0%) accounting for the largest median family size of 3 persons per family. On the other hand, single male/father families (1 | 1.0%) represent the smallest median family size with 2.00 persons per family.
| Family Type | # Families | Family Size |
| Married-Couple | 97 (98.0%) | 2.40 |
| Single Male/Father | 1 (1.0%) | 2.00 |
| Single Female/Mother | 1 (1.0%) | 3.00 |
| Total Families | 99 (100.0%) | 2.40 |
Median Household Size in Ephraim
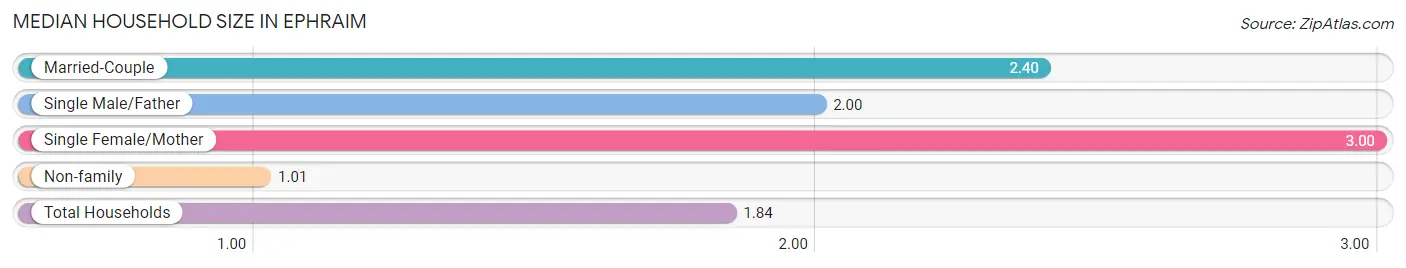
The median household size in Ephraim is 1.84 persons per household, with single female/mother households (1 | 0.6%) accounting for the largest median household size of 3 persons per household. non-family households (68 | 40.7%) represent the smallest median household size with 1.01 persons per household.
| Household Type | # Households | Household Size |
| Married-Couple | 97 (58.1%) | 2.40 |
| Single Male/Father | 1 (0.6%) | 2.00 |
| Single Female/Mother | 1 (0.6%) | 3.00 |
| Non-family | 68 (40.7%) | 1.01 |
| Total Households | 167 (100.0%) | 1.84 |
Household Size by Marriage Status in Ephraim
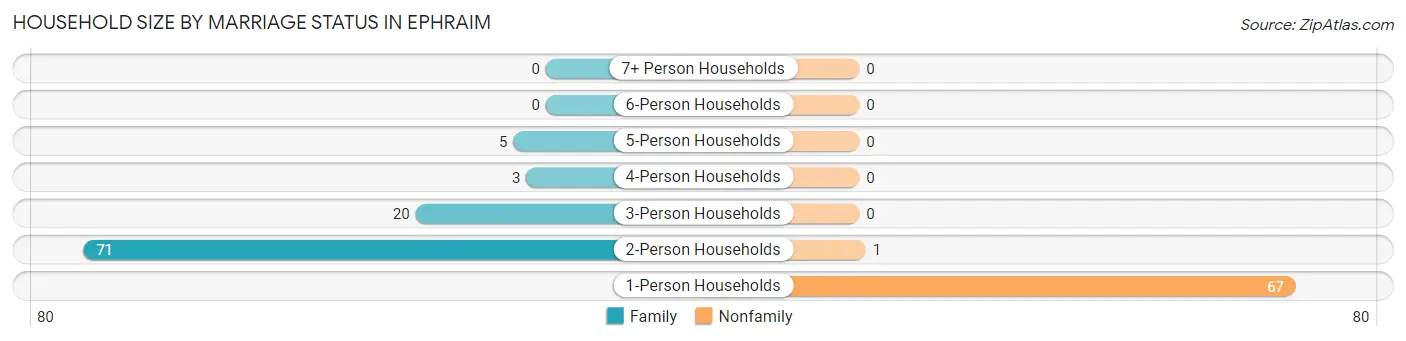
Out of a total of 167 households in Ephraim, 99 (59.3%) are family households, while 68 (40.7%) are nonfamily households. The most numerous type of family households are 2-person households, comprising 71, and the most common type of nonfamily households are 1-person households, comprising 67.
| Household Size | Family Households | Nonfamily Households |
| 1-Person Households | - | 67 (40.1%) |
| 2-Person Households | 71 (42.5%) | 1 (0.6%) |
| 3-Person Households | 20 (12.0%) | 0 (0.0%) |
| 4-Person Households | 3 (1.8%) | 0 (0.0%) |
| 5-Person Households | 5 (3.0%) | 0 (0.0%) |
| 6-Person Households | 0 (0.0%) | 0 (0.0%) |
| 7+ Person Households | 0 (0.0%) | 0 (0.0%) |
| Total | 99 (59.3%) | 68 (40.7%) |
Female Fertility in Ephraim
Fertility by Age in Ephraim
| Age Bracket | Women with Births | Births / 1,000 Women |
| 15 to 19 years | 0 (0.0%) | 0.0 |
| 20 to 34 years | 0 (0.0%) | 0.0 |
| 35 to 50 years | 0 (0.0%) | 0.0 |
| Total | 0 (0.0%) | 0.0 |
Fertility by Age by Marriage Status in Ephraim
| Age Bracket | Married | Unmarried |
| 15 to 19 years | 0 (0.0%) | 0 (0.0%) |
| 20 to 34 years | 0 (0.0%) | 0 (0.0%) |
| 35 to 50 years | 0 (0.0%) | 0 (0.0%) |
| Total | 0 (0.0%) | 0 (0.0%) |
Fertility by Education in Ephraim
| Educational Attainment | Women with Births | Births / 1,000 Women |
| Less than High School | 0 (0.0%) | 0.0 |
| High School Diploma | 0 (0.0%) | 0.0 |
| College or Associate's Degree | 0 (0.0%) | 0.0 |
| Bachelor's Degree | 0 (0.0%) | 0.0 |
| Graduate Degree | 0 (0.0%) | 0.0 |
| Total | 0 (0.0%) | 0.0 |
Fertility by Education by Marriage Status in Ephraim
| Educational Attainment | Married | Unmarried |
| Less than High School | 0 (0.0%) | 0 (0.0%) |
| High School Diploma | 0 (0.0%) | 0 (0.0%) |
| College or Associate's Degree | 0 (0.0%) | 0 (0.0%) |
| Bachelor's Degree | 0 (0.0%) | 0 (0.0%) |
| Graduate Degree | 0 (0.0%) | 0 (0.0%) |
| Total | 0 (0.0%) | 0 (0.0%) |
Employment Characteristics in Ephraim
Employment by Class of Employer in Ephraim
Among the 146 employed individuals in Ephraim, private company employees (87 | 59.6%), self-employed (not incorporated) (16 | 11.0%), and self-employed (incorporated) (14 | 9.6%) make up the most common classes of employment.
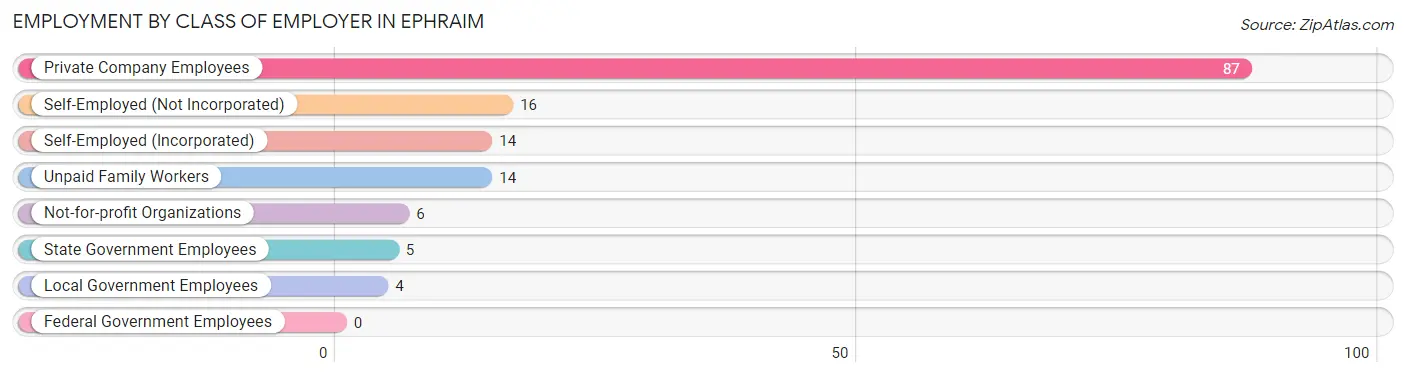
| Employer Class | # Employees | % Employees |
| Private Company Employees | 87 | 59.6% |
| Self-Employed (Incorporated) | 14 | 9.6% |
| Self-Employed (Not Incorporated) | 16 | 11.0% |
| Not-for-profit Organizations | 6 | 4.1% |
| Local Government Employees | 4 | 2.7% |
| State Government Employees | 5 | 3.4% |
| Federal Government Employees | 0 | 0.0% |
| Unpaid Family Workers | 14 | 9.6% |
| Total | 146 | 100.0% |
Employment Status by Age in Ephraim
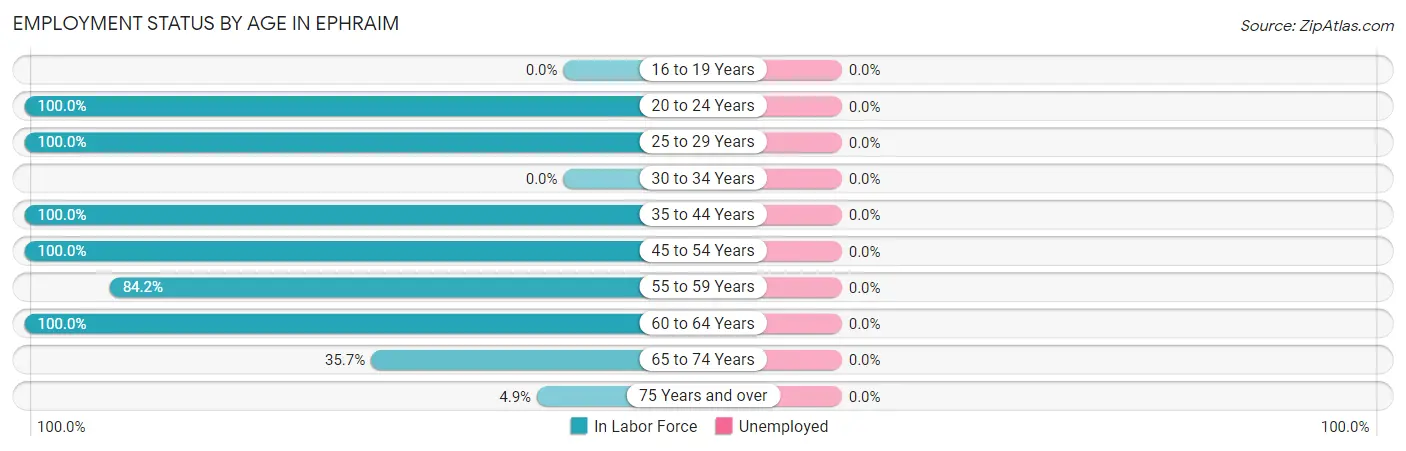
| Age Bracket | In Labor Force | Unemployed |
| 16 to 19 Years | 0 (0.0%) | 0 (0.0%) |
| 20 to 24 Years | 8 (100.0%) | 0 (0.0%) |
| 25 to 29 Years | 5 (100.0%) | 0 (0.0%) |
| 30 to 34 Years | 0 (0.0%) | 0 (0.0%) |
| 35 to 44 Years | 11 (100.0%) | 0 (0.0%) |
| 45 to 54 Years | 24 (100.0%) | 0 (0.0%) |
| 55 to 59 Years | 48 (84.2%) | 0 (0.0%) |
| 60 to 64 Years | 21 (100.0%) | 0 (0.0%) |
| 65 to 74 Years | 25 (35.7%) | 0 (0.0%) |
| 75 Years and over | 4 (4.9%) | 0 (0.0%) |
| Total | 146 (50.2%) | 0 (0.0%) |
Employment Status by Educational Attainment in Ephraim
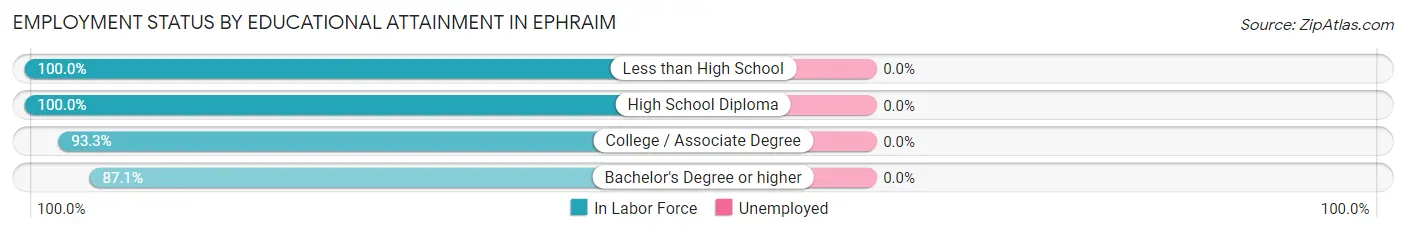
| Educational Attainment | In Labor Force | Unemployed |
| Less than High School | 1 (100.0%) | 0 (0.0%) |
| High School Diploma | 6 (100.0%) | 0 (0.0%) |
| College / Associate Degree | 14 (93.3%) | 0 (0.0%) |
| Bachelor's Degree or higher | 88 (87.1%) | 0 (0.0%) |
| Total | 109 (88.6%) | 0 (0.0%) |
Employment Occupations by Sex in Ephraim
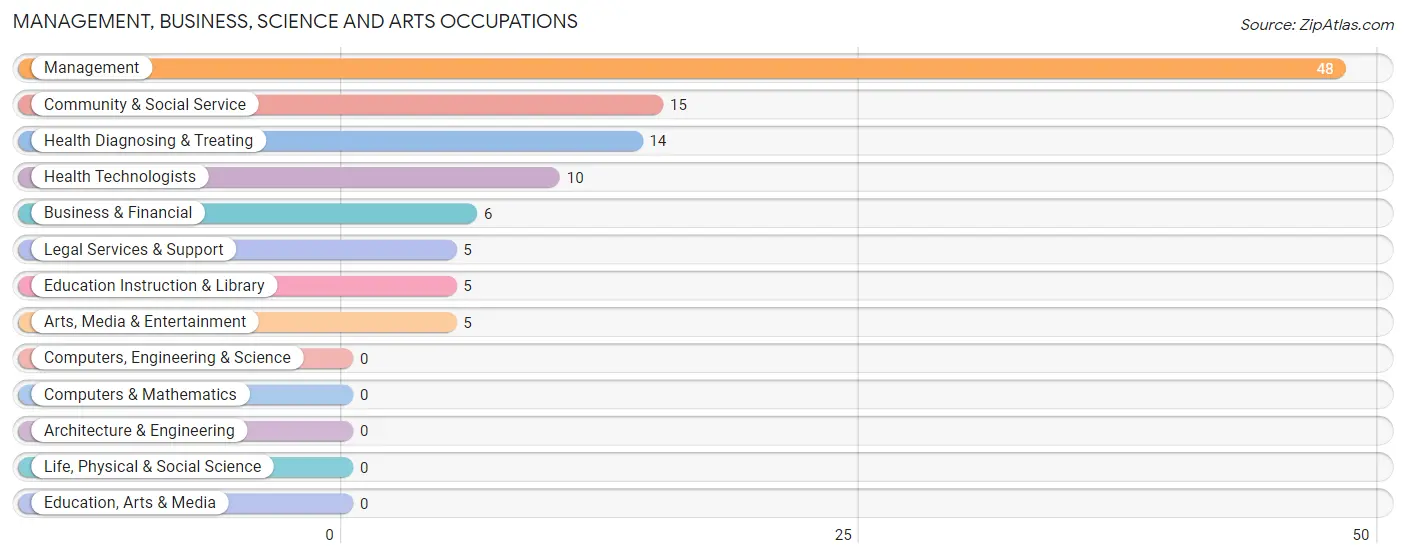
Management, Business, Science and Arts Occupations
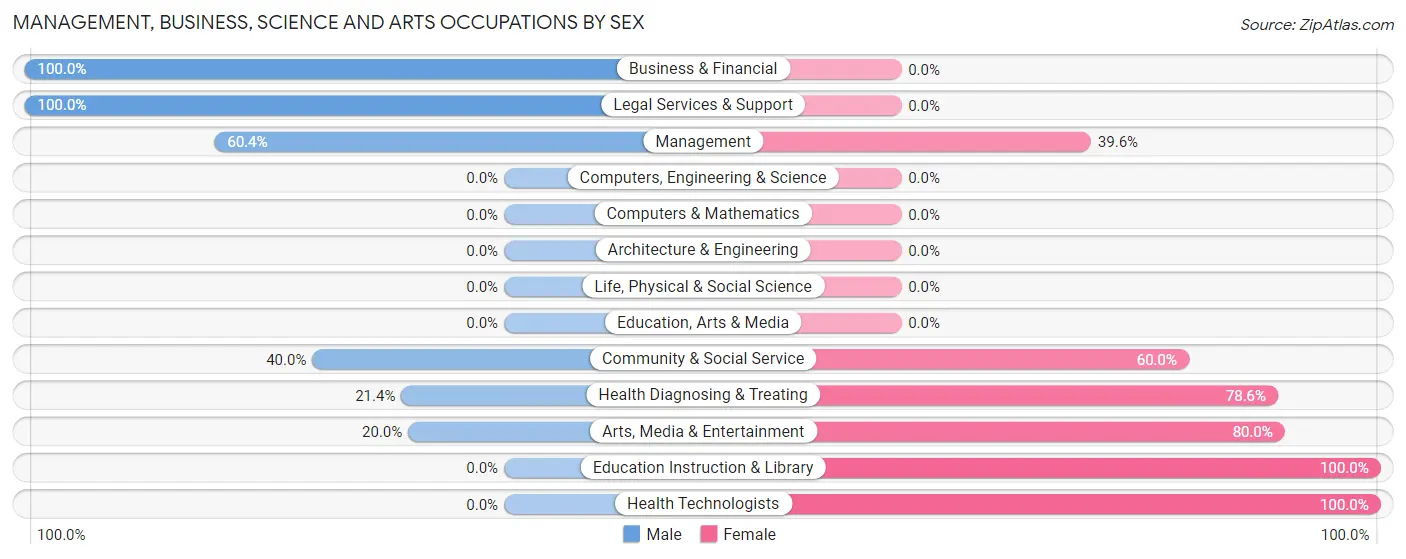
The most common Management, Business, Science and Arts occupations in Ephraim are Management (48 | 32.9%), Community & Social Service (15 | 10.3%), Health Diagnosing & Treating (14 | 9.6%), Health Technologists (10 | 6.9%), and Business & Financial (6 | 4.1%).
Management, Business, Science and Arts Occupations by Sex
Within the Management, Business, Science and Arts occupations in Ephraim, the most male-oriented occupations are Business & Financial (100.0%), Legal Services & Support (100.0%), and Management (60.4%), while the most female-oriented occupations are Education Instruction & Library (100.0%), Health Technologists (100.0%), and Arts, Media & Entertainment (80.0%).
| Occupation | Male | Female |
| Management | 29 (60.4%) | 19 (39.6%) |
| Business & Financial | 6 (100.0%) | 0 (0.0%) |
| Computers, Engineering & Science | 0 (0.0%) | 0 (0.0%) |
| Computers & Mathematics | 0 (0.0%) | 0 (0.0%) |
| Architecture & Engineering | 0 (0.0%) | 0 (0.0%) |
| Life, Physical & Social Science | 0 (0.0%) | 0 (0.0%) |
| Community & Social Service | 6 (40.0%) | 9 (60.0%) |
| Education, Arts & Media | 0 (0.0%) | 0 (0.0%) |
| Legal Services & Support | 5 (100.0%) | 0 (0.0%) |
| Education Instruction & Library | 0 (0.0%) | 5 (100.0%) |
| Arts, Media & Entertainment | 1 (20.0%) | 4 (80.0%) |
| Health Diagnosing & Treating | 3 (21.4%) | 11 (78.6%) |
| Health Technologists | 0 (0.0%) | 10 (100.0%) |
| Total (Category) | 44 (53.0%) | 39 (47.0%) |
| Total (Overall) | 87 (59.6%) | 59 (40.4%) |
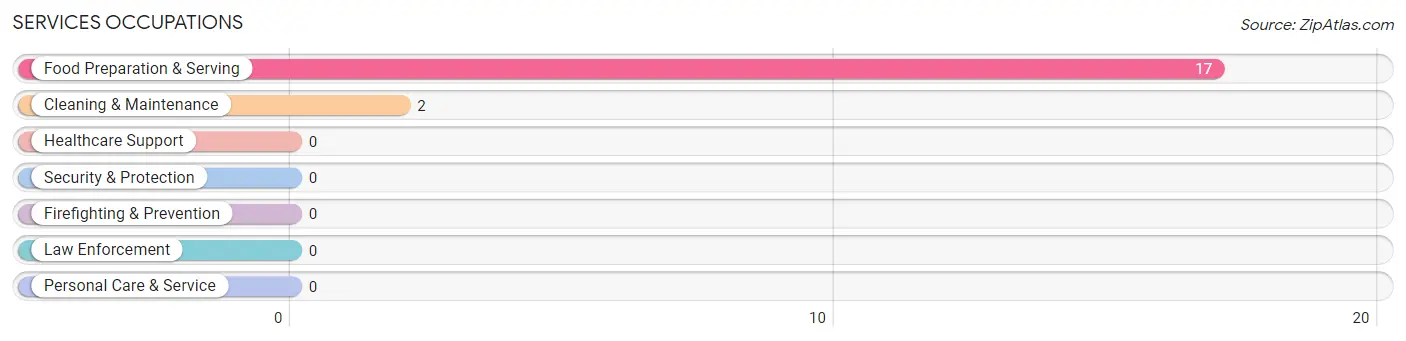
Services Occupations
The most common Services occupations in Ephraim are Food Preparation & Serving (17 | 11.6%), and Cleaning & Maintenance (2 | 1.4%).
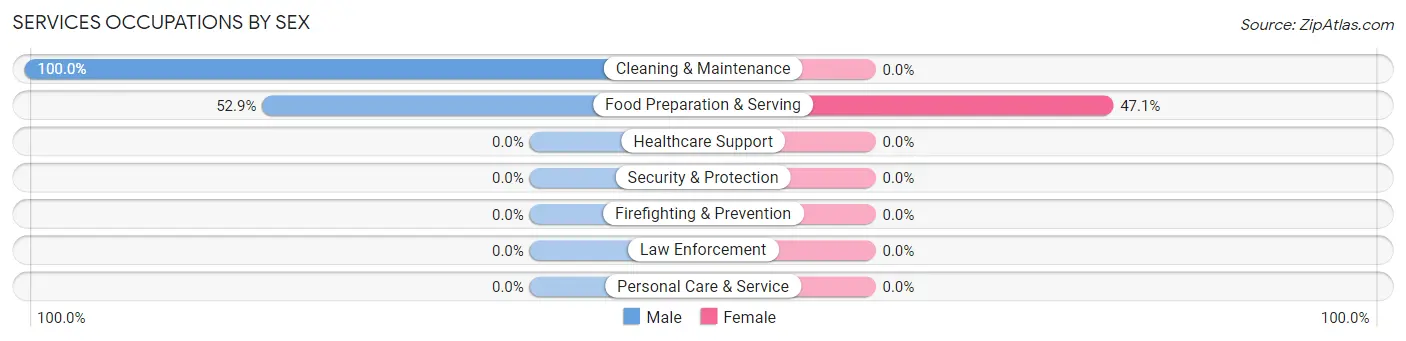
Services Occupations by Sex
| Occupation | Male | Female |
| Healthcare Support | 0 (0.0%) | 0 (0.0%) |
| Security & Protection | 0 (0.0%) | 0 (0.0%) |
| Firefighting & Prevention | 0 (0.0%) | 0 (0.0%) |
| Law Enforcement | 0 (0.0%) | 0 (0.0%) |
| Food Preparation & Serving | 9 (52.9%) | 8 (47.1%) |
| Cleaning & Maintenance | 2 (100.0%) | 0 (0.0%) |
| Personal Care & Service | 0 (0.0%) | 0 (0.0%) |
| Total (Category) | 11 (57.9%) | 8 (42.1%) |
| Total (Overall) | 87 (59.6%) | 59 (40.4%) |
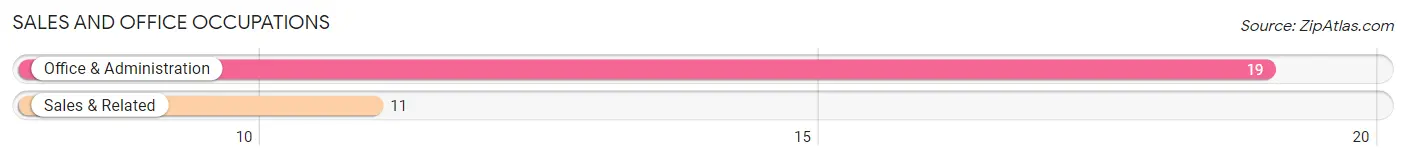
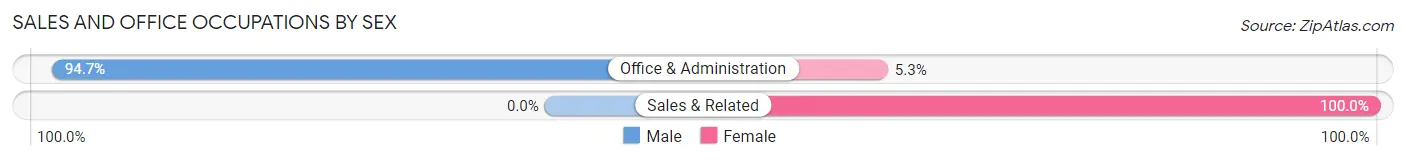
Sales and Office Occupations
The most common Sales and Office occupations in Ephraim are Office & Administration (19 | 13.0%), and Sales & Related (11 | 7.5%).
Sales and Office Occupations by Sex
| Occupation | Male | Female |
| Sales & Related | 0 (0.0%) | 11 (100.0%) |
| Office & Administration | 18 (94.7%) | 1 (5.3%) |
| Total (Category) | 18 (60.0%) | 12 (40.0%) |
| Total (Overall) | 87 (59.6%) | 59 (40.4%) |
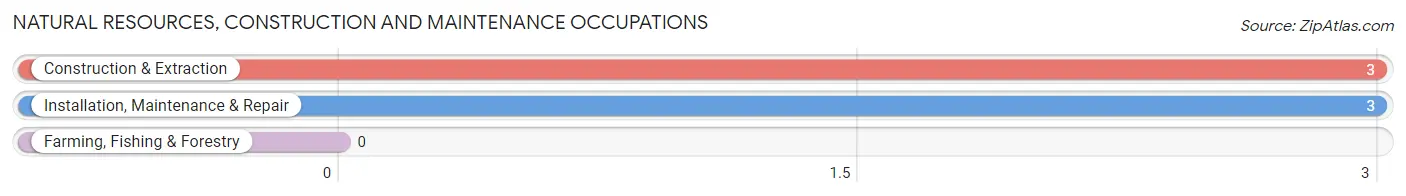
Natural Resources, Construction and Maintenance Occupations
The most common Natural Resources, Construction and Maintenance occupations in Ephraim are Construction & Extraction (3 | 2.1%), and Installation, Maintenance & Repair (3 | 2.1%).
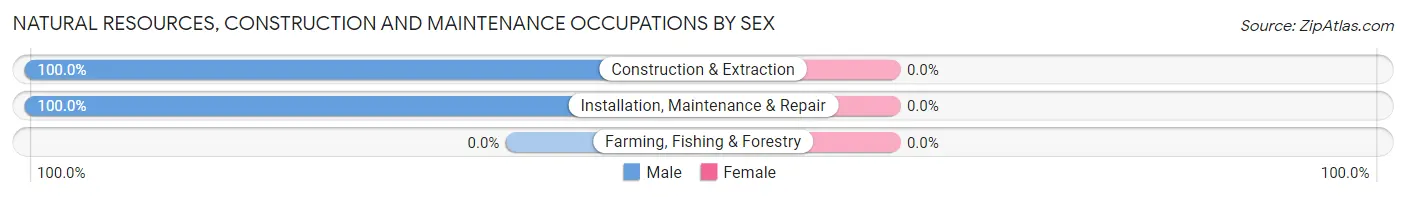
Natural Resources, Construction and Maintenance Occupations by Sex
| Occupation | Male | Female |
| Farming, Fishing & Forestry | 0 (0.0%) | 0 (0.0%) |
| Construction & Extraction | 3 (100.0%) | 0 (0.0%) |
| Installation, Maintenance & Repair | 3 (100.0%) | 0 (0.0%) |
| Total (Category) | 6 (100.0%) | 0 (0.0%) |
| Total (Overall) | 87 (59.6%) | 59 (40.4%) |
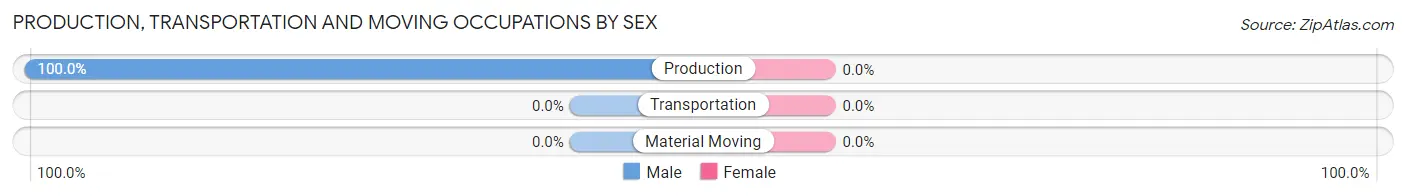
Production, Transportation and Moving Occupations
The most common Production, Transportation and Moving occupations in Ephraim are , and Production (8 | 5.5%).
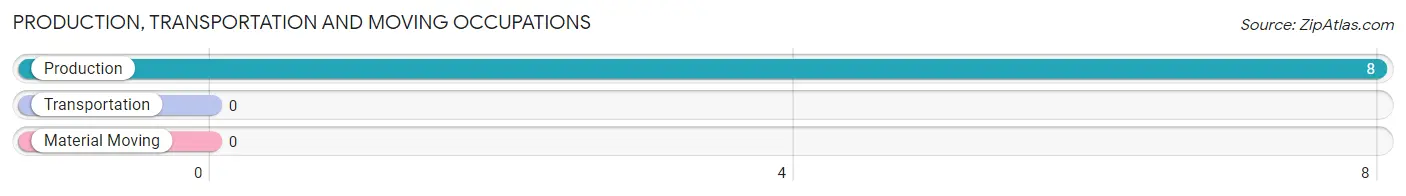
Production, Transportation and Moving Occupations by Sex
| Occupation | Male | Female |
| Production | 8 (100.0%) | 0 (0.0%) |
| Transportation | 0 (0.0%) | 0 (0.0%) |
| Material Moving | 0 (0.0%) | 0 (0.0%) |
| Total (Category) | 8 (100.0%) | 0 (0.0%) |
| Total (Overall) | 87 (59.6%) | 59 (40.4%) |
Employment Industries by Sex in Ephraim
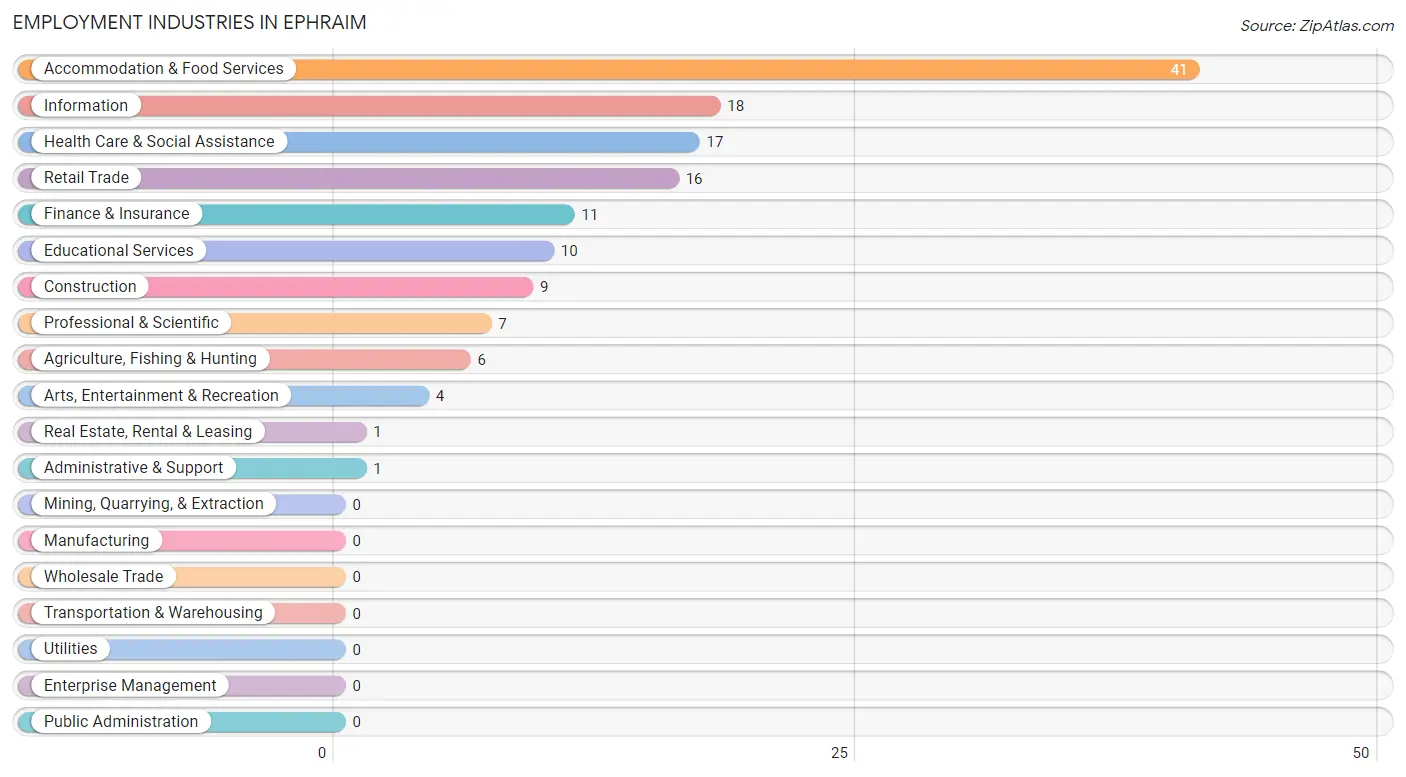
Employment Industries in Ephraim
The major employment industries in Ephraim include Accommodation & Food Services (41 | 28.1%), Information (18 | 12.3%), Health Care & Social Assistance (17 | 11.6%), Retail Trade (16 | 11.0%), and Finance & Insurance (11 | 7.5%).
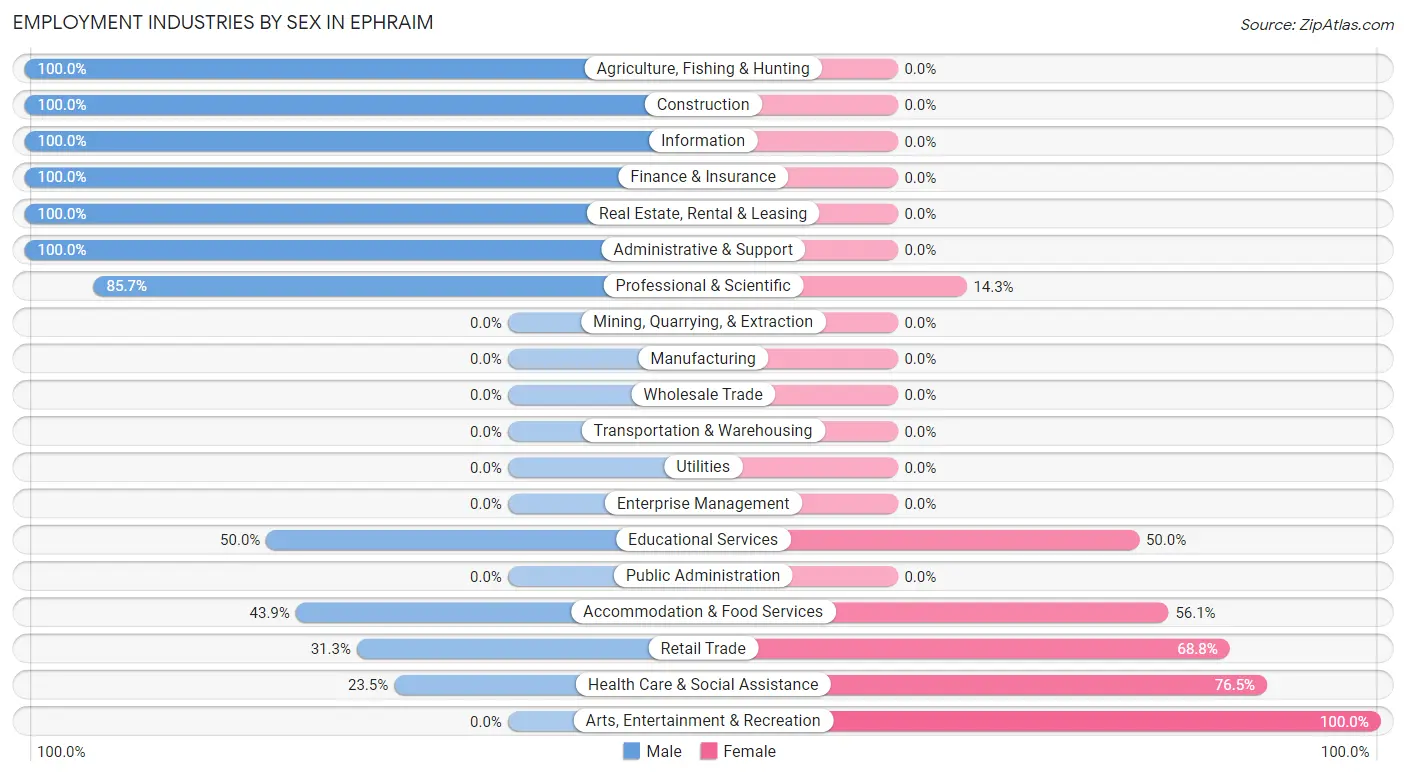
Employment Industries by Sex in Ephraim
The Ephraim industries that see more men than women are Agriculture, Fishing & Hunting (100.0%), Construction (100.0%), and Information (100.0%), whereas the industries that tend to have a higher number of women are Arts, Entertainment & Recreation (100.0%), Health Care & Social Assistance (76.5%), and Retail Trade (68.8%).
| Industry | Male | Female |
| Agriculture, Fishing & Hunting | 6 (100.0%) | 0 (0.0%) |
| Mining, Quarrying, & Extraction | 0 (0.0%) | 0 (0.0%) |
| Construction | 9 (100.0%) | 0 (0.0%) |
| Manufacturing | 0 (0.0%) | 0 (0.0%) |
| Wholesale Trade | 0 (0.0%) | 0 (0.0%) |
| Retail Trade | 5 (31.2%) | 11 (68.8%) |
| Transportation & Warehousing | 0 (0.0%) | 0 (0.0%) |
| Utilities | 0 (0.0%) | 0 (0.0%) |
| Information | 18 (100.0%) | 0 (0.0%) |
| Finance & Insurance | 11 (100.0%) | 0 (0.0%) |
| Real Estate, Rental & Leasing | 1 (100.0%) | 0 (0.0%) |
| Professional & Scientific | 6 (85.7%) | 1 (14.3%) |
| Enterprise Management | 0 (0.0%) | 0 (0.0%) |
| Administrative & Support | 1 (100.0%) | 0 (0.0%) |
| Educational Services | 5 (50.0%) | 5 (50.0%) |
| Health Care & Social Assistance | 4 (23.5%) | 13 (76.5%) |
| Arts, Entertainment & Recreation | 0 (0.0%) | 4 (100.0%) |
| Accommodation & Food Services | 18 (43.9%) | 23 (56.1%) |
| Public Administration | 0 (0.0%) | 0 (0.0%) |
| Total | 87 (59.6%) | 59 (40.4%) |
Education in Ephraim
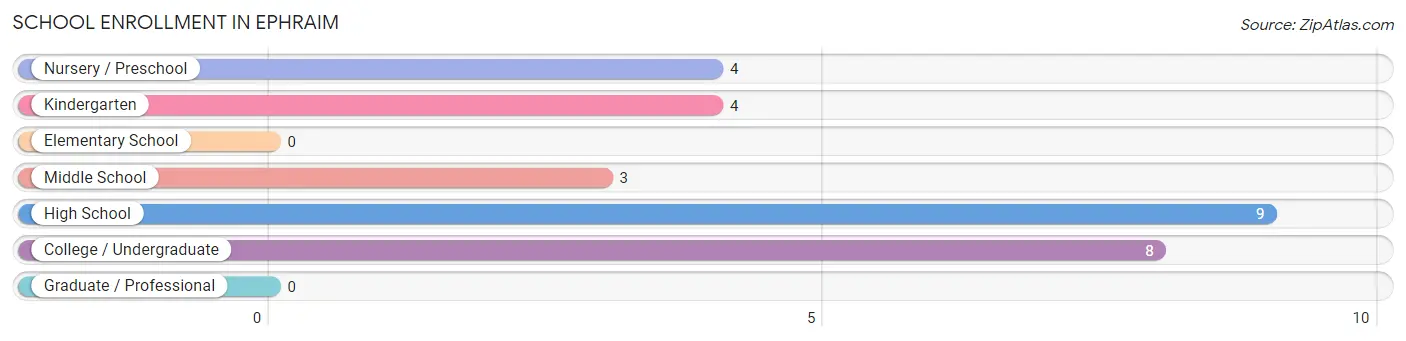
School Enrollment in Ephraim
The most common levels of schooling among the 28 students in Ephraim are high school (9 | 32.1%), college / undergraduate (8 | 28.6%), and nursery / preschool (4 | 14.3%).
| School Level | # Students | % Students |
| Nursery / Preschool | 4 | 14.3% |
| Kindergarten | 4 | 14.3% |
| Elementary School | 0 | 0.0% |
| Middle School | 3 | 10.7% |
| High School | 9 | 32.1% |
| College / Undergraduate | 8 | 28.6% |
| Graduate / Professional | 0 | 0.0% |
| Total | 28 | 100.0% |
School Enrollment by Age by Funding Source in Ephraim
Out of a total of 28 students who are enrolled in schools in Ephraim, 10 (35.7%) attend a private institution, while the remaining 18 (64.3%) are enrolled in public schools. The age group of 3 to 4 year olds has the highest likelihood of being enrolled in private schools, with 4 (100.0% in the age bracket) enrolled. Conversely, the age group of 15 to 17 year olds has the lowest likelihood of being enrolled in a private school, with 8 (100.0% in the age bracket) attending a public institution.
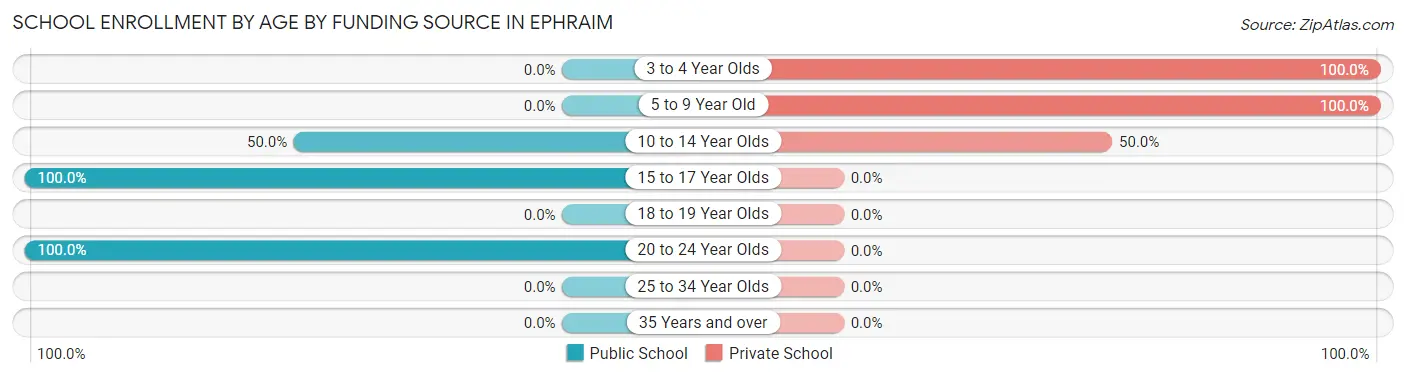
| Age Bracket | Public School | Private School |
| 3 to 4 Year Olds | 0 (0.0%) | 4 (100.0%) |
| 5 to 9 Year Old | 0 (0.0%) | 4 (100.0%) |
| 10 to 14 Year Olds | 2 (50.0%) | 2 (50.0%) |
| 15 to 17 Year Olds | 8 (100.0%) | 0 (0.0%) |
| 18 to 19 Year Olds | 0 (0.0%) | 0 (0.0%) |
| 20 to 24 Year Olds | 8 (100.0%) | 0 (0.0%) |
| 25 to 34 Year Olds | 0 (0.0%) | 0 (0.0%) |
| 35 Years and over | 0 (0.0%) | 0 (0.0%) |
| Total | 18 (64.3%) | 10 (35.7%) |
Educational Attainment by Field of Study in Ephraim
Education (49 | 22.8%), social sciences (42 | 19.5%), business (42 | 19.5%), visual & performing arts (16 | 7.4%), and science & technology (15 | 7.0%) are the most common fields of study among 215 individuals in Ephraim who have obtained a bachelor's degree or higher.
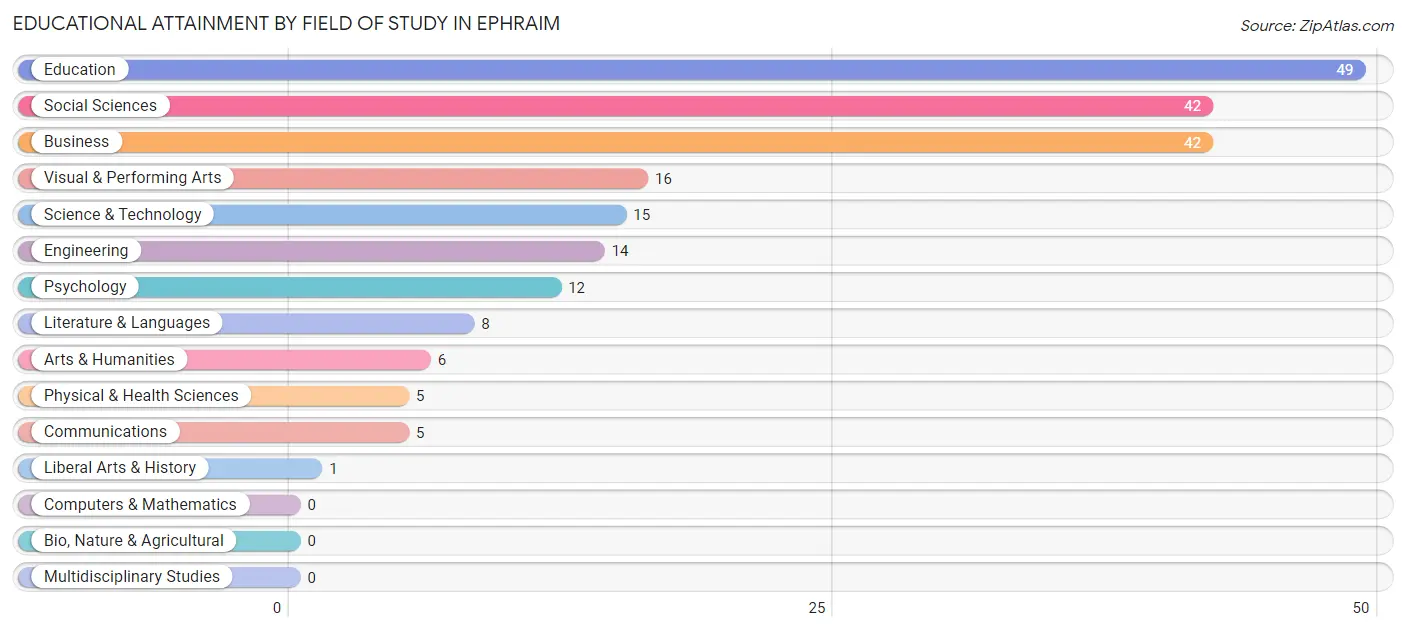
| Field of Study | # Graduates | % Graduates |
| Computers & Mathematics | 0 | 0.0% |
| Bio, Nature & Agricultural | 0 | 0.0% |
| Physical & Health Sciences | 5 | 2.3% |
| Psychology | 12 | 5.6% |
| Social Sciences | 42 | 19.5% |
| Engineering | 14 | 6.5% |
| Multidisciplinary Studies | 0 | 0.0% |
| Science & Technology | 15 | 7.0% |
| Business | 42 | 19.5% |
| Education | 49 | 22.8% |
| Literature & Languages | 8 | 3.7% |
| Liberal Arts & History | 1 | 0.5% |
| Visual & Performing Arts | 16 | 7.4% |
| Communications | 5 | 2.3% |
| Arts & Humanities | 6 | 2.8% |
| Total | 215 | 100.0% |
Transportation & Commute in Ephraim
Vehicle Availability by Sex in Ephraim
The most prevalent vehicle ownership categories in Ephraim are males with 2 vehicles (41, accounting for 47.1%) and females with 2 vehicles (24, making up 69.5%).
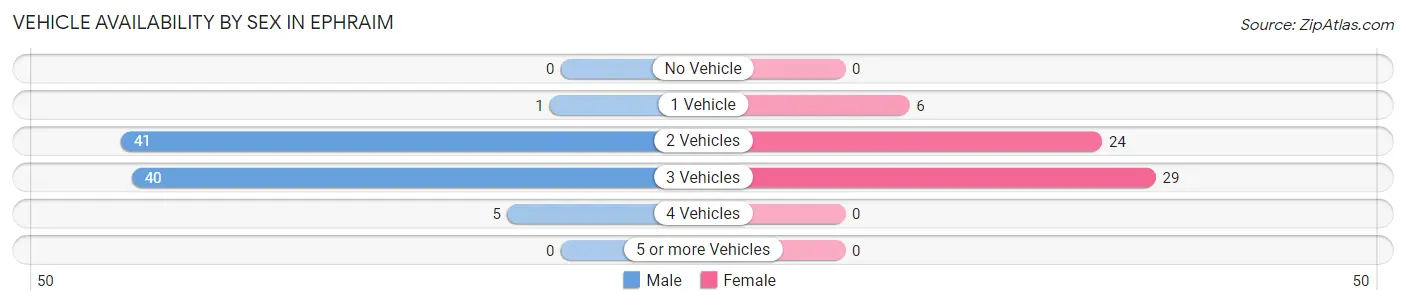
| Vehicles Available | Male | Female |
| No Vehicle | 0 (0.0%) | 0 (0.0%) |
| 1 Vehicle | 1 (1.1%) | 6 (10.2%) |
| 2 Vehicles | 41 (47.1%) | 24 (40.7%) |
| 3 Vehicles | 40 (46.0%) | 29 (49.1%) |
| 4 Vehicles | 5 (5.8%) | 0 (0.0%) |
| 5 or more Vehicles | 0 (0.0%) | 0 (0.0%) |
| Total | 87 (100.0%) | 59 (100.0%) |
Commute Time in Ephraim
The most frequently occuring commute durations in Ephraim are less than 5 minutes (40 commuters, 30.5%), 15 to 19 minutes (29 commuters, 22.1%), and 5 to 9 minutes (23 commuters, 17.6%).
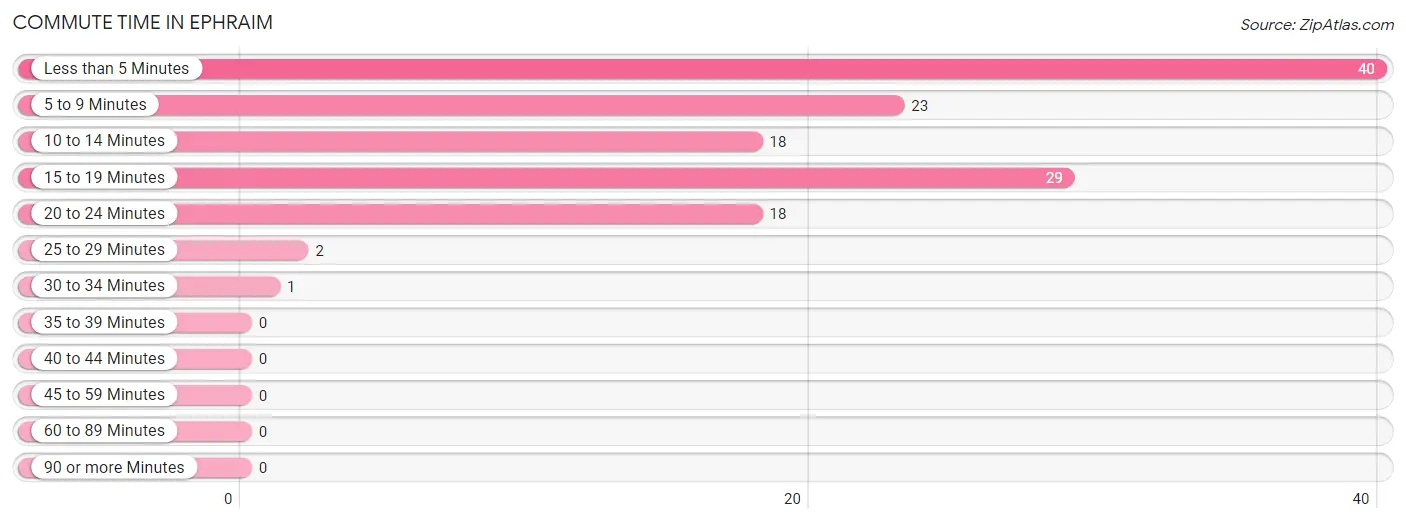
| Commute Time | # Commuters | % Commuters |
| Less than 5 Minutes | 40 | 30.5% |
| 5 to 9 Minutes | 23 | 17.6% |
| 10 to 14 Minutes | 18 | 13.7% |
| 15 to 19 Minutes | 29 | 22.1% |
| 20 to 24 Minutes | 18 | 13.7% |
| 25 to 29 Minutes | 2 | 1.5% |
| 30 to 34 Minutes | 1 | 0.8% |
| 35 to 39 Minutes | 0 | 0.0% |
| 40 to 44 Minutes | 0 | 0.0% |
| 45 to 59 Minutes | 0 | 0.0% |
| 60 to 89 Minutes | 0 | 0.0% |
| 90 or more Minutes | 0 | 0.0% |
Commute Time by Sex in Ephraim
The most common commute times in Ephraim are less than 5 minutes (19 commuters, 22.6%) for males and less than 5 minutes (21 commuters, 44.7%) for females.
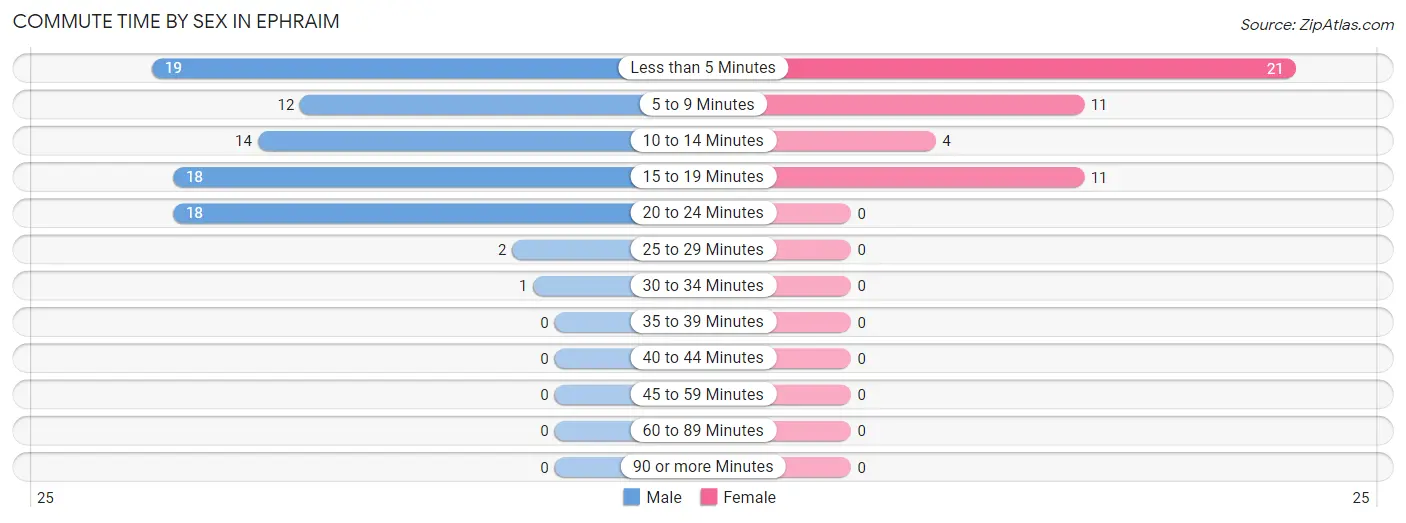
| Commute Time | Male | Female |
| Less than 5 Minutes | 19 (22.6%) | 21 (44.7%) |
| 5 to 9 Minutes | 12 (14.3%) | 11 (23.4%) |
| 10 to 14 Minutes | 14 (16.7%) | 4 (8.5%) |
| 15 to 19 Minutes | 18 (21.4%) | 11 (23.4%) |
| 20 to 24 Minutes | 18 (21.4%) | 0 (0.0%) |
| 25 to 29 Minutes | 2 (2.4%) | 0 (0.0%) |
| 30 to 34 Minutes | 1 (1.2%) | 0 (0.0%) |
| 35 to 39 Minutes | 0 (0.0%) | 0 (0.0%) |
| 40 to 44 Minutes | 0 (0.0%) | 0 (0.0%) |
| 45 to 59 Minutes | 0 (0.0%) | 0 (0.0%) |
| 60 to 89 Minutes | 0 (0.0%) | 0 (0.0%) |
| 90 or more Minutes | 0 (0.0%) | 0 (0.0%) |
Time of Departure to Work by Sex in Ephraim
The most frequent times of departure to work in Ephraim are 8:00 AM to 8:29 AM (27, 32.1%) for males and 7:30 AM to 7:59 AM (14, 29.8%) for females.
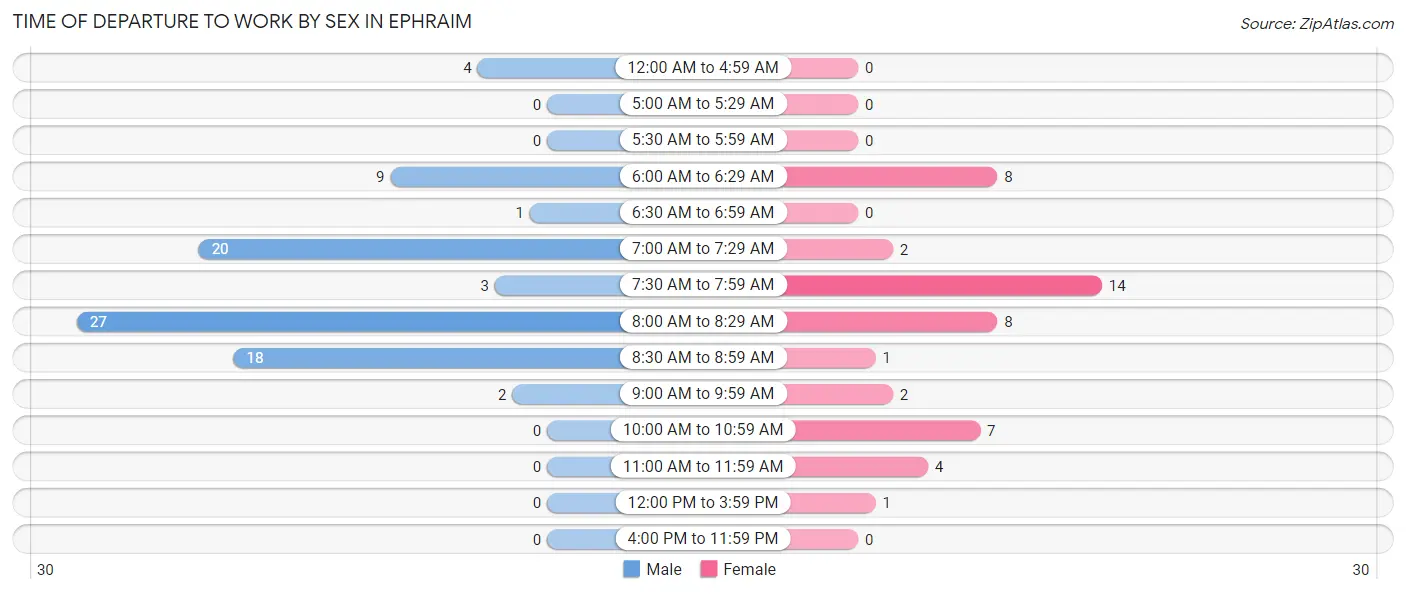
| Time of Departure | Male | Female |
| 12:00 AM to 4:59 AM | 4 (4.8%) | 0 (0.0%) |
| 5:00 AM to 5:29 AM | 0 (0.0%) | 0 (0.0%) |
| 5:30 AM to 5:59 AM | 0 (0.0%) | 0 (0.0%) |
| 6:00 AM to 6:29 AM | 9 (10.7%) | 8 (17.0%) |
| 6:30 AM to 6:59 AM | 1 (1.2%) | 0 (0.0%) |
| 7:00 AM to 7:29 AM | 20 (23.8%) | 2 (4.3%) |
| 7:30 AM to 7:59 AM | 3 (3.6%) | 14 (29.8%) |
| 8:00 AM to 8:29 AM | 27 (32.1%) | 8 (17.0%) |
| 8:30 AM to 8:59 AM | 18 (21.4%) | 1 (2.1%) |
| 9:00 AM to 9:59 AM | 2 (2.4%) | 2 (4.3%) |
| 10:00 AM to 10:59 AM | 0 (0.0%) | 7 (14.9%) |
| 11:00 AM to 11:59 AM | 0 (0.0%) | 4 (8.5%) |
| 12:00 PM to 3:59 PM | 0 (0.0%) | 1 (2.1%) |
| 4:00 PM to 11:59 PM | 0 (0.0%) | 0 (0.0%) |
| Total | 84 (100.0%) | 47 (100.0%) |
Housing Occupancy in Ephraim
Occupancy by Ownership in Ephraim
Of the total 167 dwellings in Ephraim, owner-occupied units account for 152 (91.0%), while renter-occupied units make up 15 (9.0%).
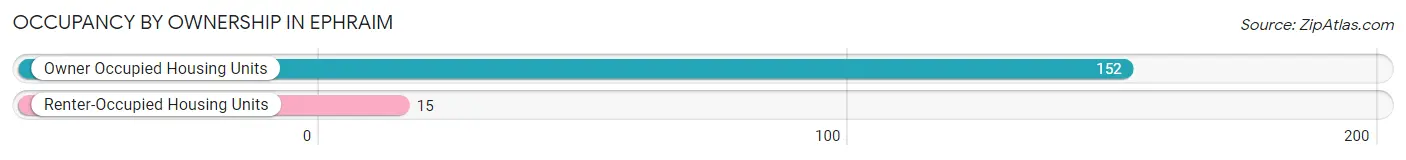
| Occupancy | # Housing Units | % Housing Units |
| Owner Occupied Housing Units | 152 | 91.0% |
| Renter-Occupied Housing Units | 15 | 9.0% |
| Total Occupied Housing Units | 167 | 100.0% |
Occupancy by Household Size in Ephraim
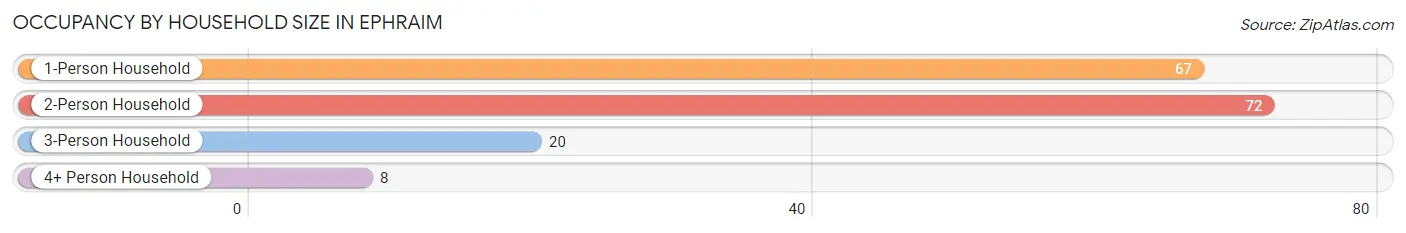
| Household Size | # Housing Units | % Housing Units |
| 1-Person Household | 67 | 40.1% |
| 2-Person Household | 72 | 43.1% |
| 3-Person Household | 20 | 12.0% |
| 4+ Person Household | 8 | 4.8% |
| Total Housing Units | 167 | 100.0% |
Occupancy by Ownership by Household Size in Ephraim
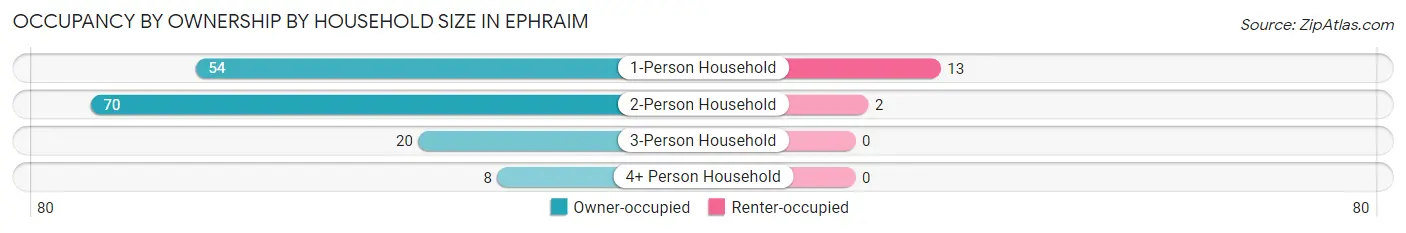
| Household Size | Owner-occupied | Renter-occupied |
| 1-Person Household | 54 (80.6%) | 13 (19.4%) |
| 2-Person Household | 70 (97.2%) | 2 (2.8%) |
| 3-Person Household | 20 (100.0%) | 0 (0.0%) |
| 4+ Person Household | 8 (100.0%) | 0 (0.0%) |
| Total Housing Units | 152 (91.0%) | 15 (9.0%) |
Occupancy by Educational Attainment in Ephraim
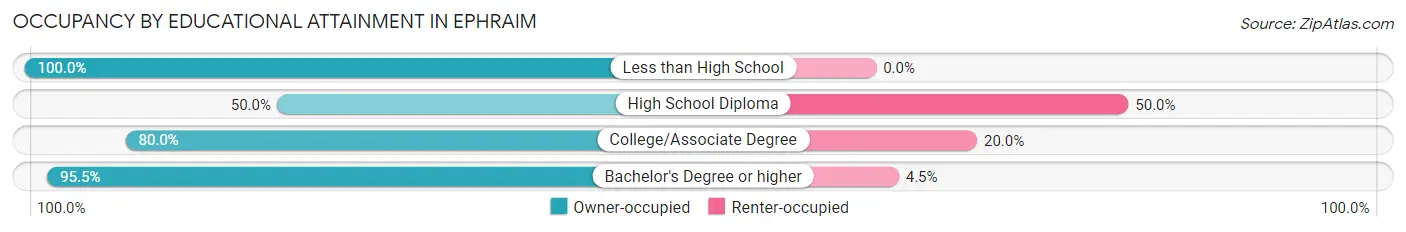
| Household Size | Owner-occupied | Renter-occupied |
| Less than High School | 3 (100.0%) | 0 (0.0%) |
| High School Diploma | 5 (50.0%) | 5 (50.0%) |
| College/Associate Degree | 16 (80.0%) | 4 (20.0%) |
| Bachelor's Degree or higher | 128 (95.5%) | 6 (4.5%) |
Occupancy by Age of Householder in Ephraim
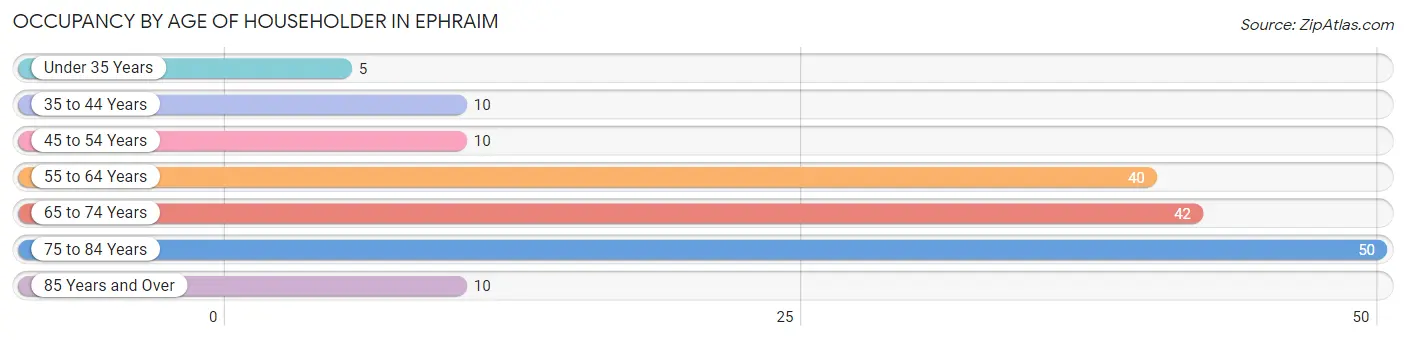
| Age Bracket | # Households | % Households |
| Under 35 Years | 5 | 3.0% |
| 35 to 44 Years | 10 | 6.0% |
| 45 to 54 Years | 10 | 6.0% |
| 55 to 64 Years | 40 | 23.9% |
| 65 to 74 Years | 42 | 25.2% |
| 75 to 84 Years | 50 | 29.9% |
| 85 Years and Over | 10 | 6.0% |
| Total | 167 | 100.0% |
Housing Finances in Ephraim
Median Income by Occupancy in Ephraim
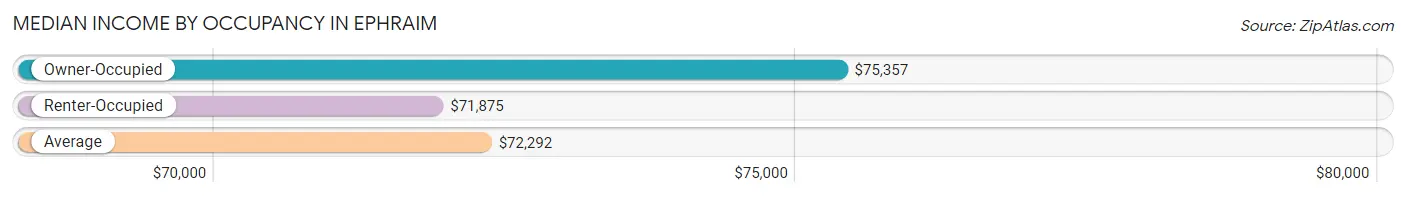
| Occupancy Type | # Households | Median Income |
| Owner-Occupied | 152 (91.0%) | $75,357 |
| Renter-Occupied | 15 (9.0%) | $71,875 |
| Average | 167 (100.0%) | $72,292 |
Occupancy by Householder Income Bracket in Ephraim
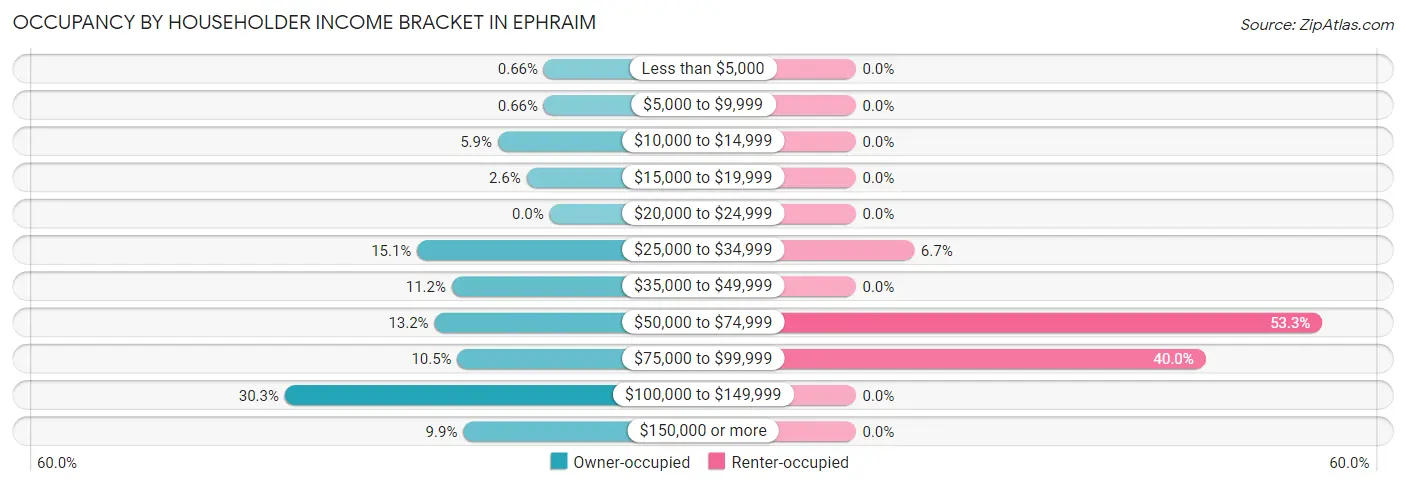
| Income Bracket | Owner-occupied | Renter-occupied |
| Less than $5,000 | 1 (0.7%) | 0 (0.0%) |
| $5,000 to $9,999 | 1 (0.7%) | 0 (0.0%) |
| $10,000 to $14,999 | 9 (5.9%) | 0 (0.0%) |
| $15,000 to $19,999 | 4 (2.6%) | 0 (0.0%) |
| $20,000 to $24,999 | 0 (0.0%) | 0 (0.0%) |
| $25,000 to $34,999 | 23 (15.1%) | 1 (6.7%) |
| $35,000 to $49,999 | 17 (11.2%) | 0 (0.0%) |
| $50,000 to $74,999 | 20 (13.2%) | 8 (53.3%) |
| $75,000 to $99,999 | 16 (10.5%) | 6 (40.0%) |
| $100,000 to $149,999 | 46 (30.3%) | 0 (0.0%) |
| $150,000 or more | 15 (9.9%) | 0 (0.0%) |
| Total | 152 (100.0%) | 15 (100.0%) |
Monthly Housing Cost Tiers in Ephraim
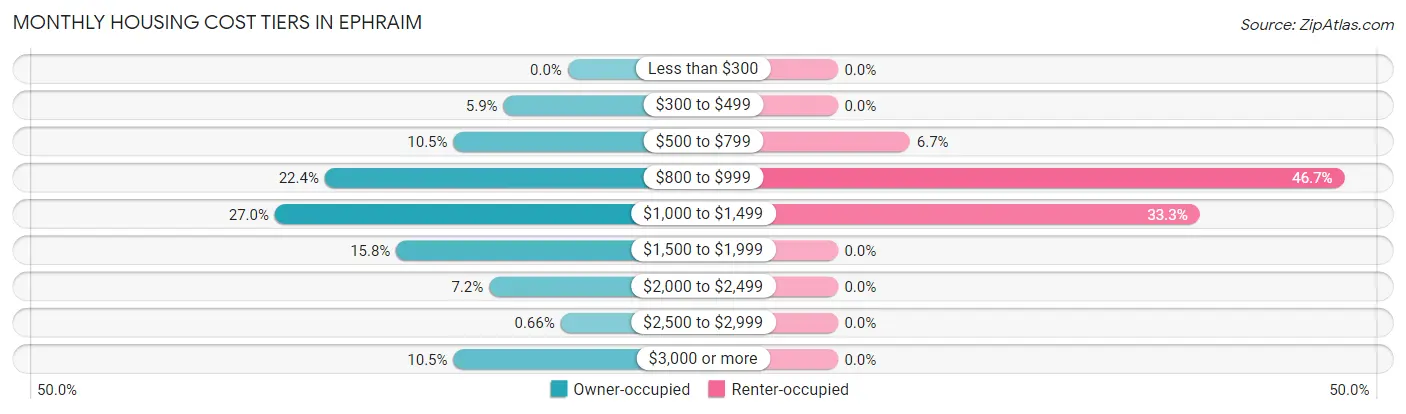
| Monthly Cost | Owner-occupied | Renter-occupied |
| Less than $300 | 0 (0.0%) | 0 (0.0%) |
| $300 to $499 | 9 (5.9%) | 0 (0.0%) |
| $500 to $799 | 16 (10.5%) | 1 (6.7%) |
| $800 to $999 | 34 (22.4%) | 7 (46.7%) |
| $1,000 to $1,499 | 41 (27.0%) | 5 (33.3%) |
| $1,500 to $1,999 | 24 (15.8%) | 0 (0.0%) |
| $2,000 to $2,499 | 11 (7.2%) | 0 (0.0%) |
| $2,500 to $2,999 | 1 (0.7%) | 0 (0.0%) |
| $3,000 or more | 16 (10.5%) | 0 (0.0%) |
| Total | 152 (100.0%) | 15 (100.0%) |
Physical Housing Characteristics in Ephraim
Housing Structures in Ephraim
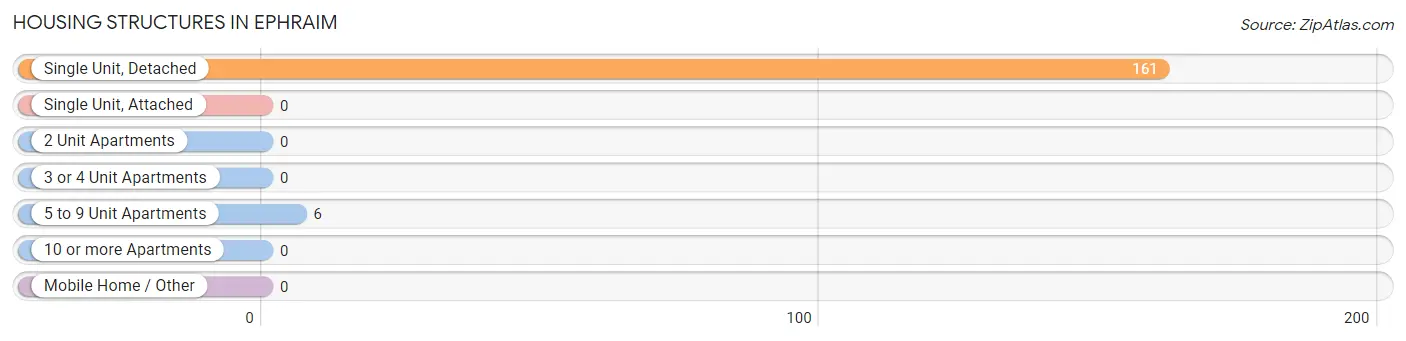
| Structure Type | # Housing Units | % Housing Units |
| Single Unit, Detached | 161 | 96.4% |
| Single Unit, Attached | 0 | 0.0% |
| 2 Unit Apartments | 0 | 0.0% |
| 3 or 4 Unit Apartments | 0 | 0.0% |
| 5 to 9 Unit Apartments | 6 | 3.6% |
| 10 or more Apartments | 0 | 0.0% |
| Mobile Home / Other | 0 | 0.0% |
| Total | 167 | 100.0% |
Housing Structures by Occupancy in Ephraim
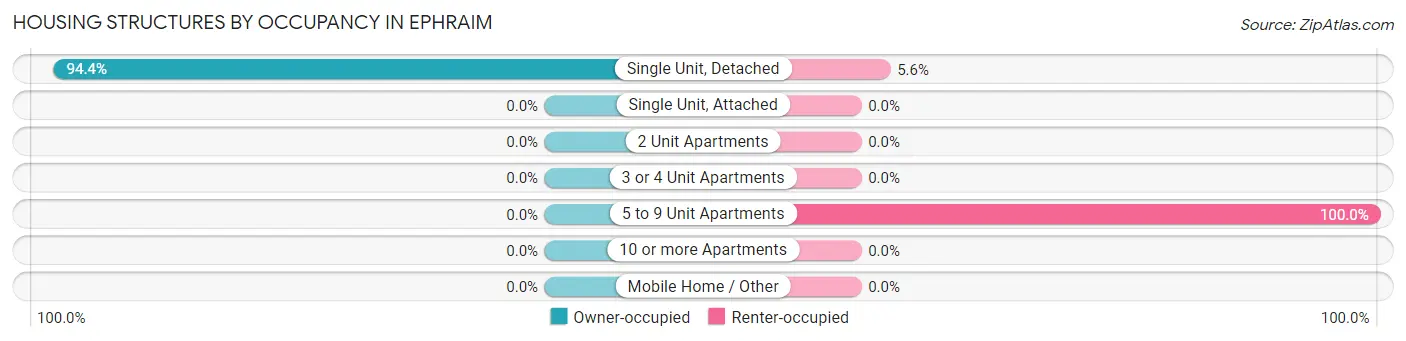
| Structure Type | Owner-occupied | Renter-occupied |
| Single Unit, Detached | 152 (94.4%) | 9 (5.6%) |
| Single Unit, Attached | 0 (0.0%) | 0 (0.0%) |
| 2 Unit Apartments | 0 (0.0%) | 0 (0.0%) |
| 3 or 4 Unit Apartments | 0 (0.0%) | 0 (0.0%) |
| 5 to 9 Unit Apartments | 0 (0.0%) | 6 (100.0%) |
| 10 or more Apartments | 0 (0.0%) | 0 (0.0%) |
| Mobile Home / Other | 0 (0.0%) | 0 (0.0%) |
| Total | 152 (91.0%) | 15 (9.0%) |
Housing Structures by Number of Rooms in Ephraim
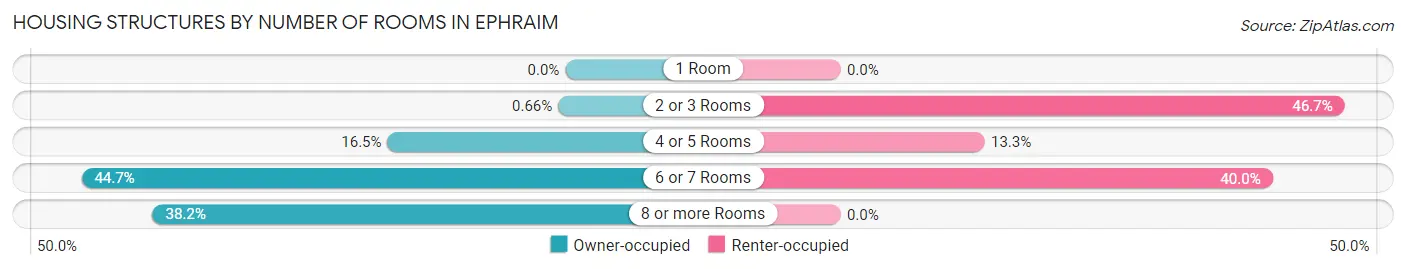
| Number of Rooms | Owner-occupied | Renter-occupied |
| 1 Room | 0 (0.0%) | 0 (0.0%) |
| 2 or 3 Rooms | 1 (0.7%) | 7 (46.7%) |
| 4 or 5 Rooms | 25 (16.5%) | 2 (13.3%) |
| 6 or 7 Rooms | 68 (44.7%) | 6 (40.0%) |
| 8 or more Rooms | 58 (38.2%) | 0 (0.0%) |
| Total | 152 (100.0%) | 15 (100.0%) |
Housing Structure by Heating Type in Ephraim
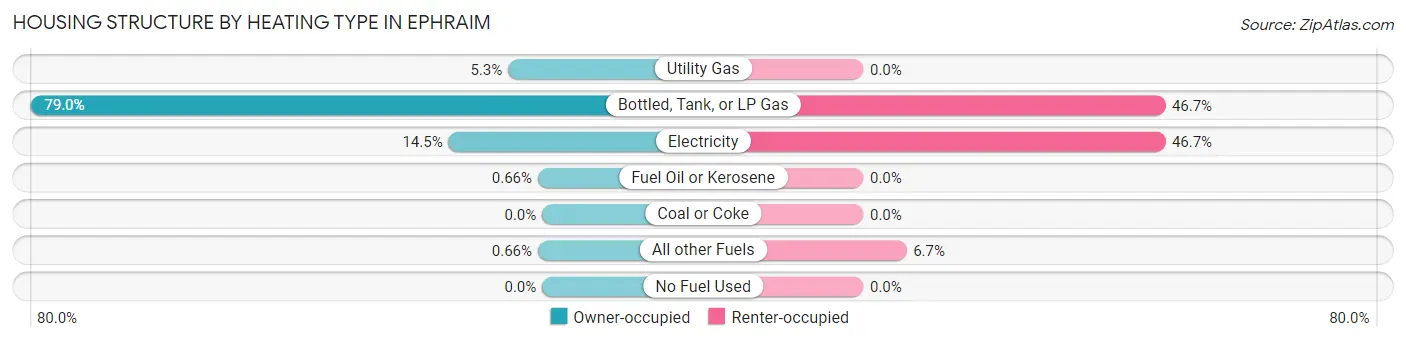
| Heating Type | Owner-occupied | Renter-occupied |
| Utility Gas | 8 (5.3%) | 0 (0.0%) |
| Bottled, Tank, or LP Gas | 120 (78.9%) | 7 (46.7%) |
| Electricity | 22 (14.5%) | 7 (46.7%) |
| Fuel Oil or Kerosene | 1 (0.7%) | 0 (0.0%) |
| Coal or Coke | 0 (0.0%) | 0 (0.0%) |
| All other Fuels | 1 (0.7%) | 1 (6.7%) |
| No Fuel Used | 0 (0.0%) | 0 (0.0%) |
| Total | 152 (100.0%) | 15 (100.0%) |
Household Vehicle Usage in Ephraim
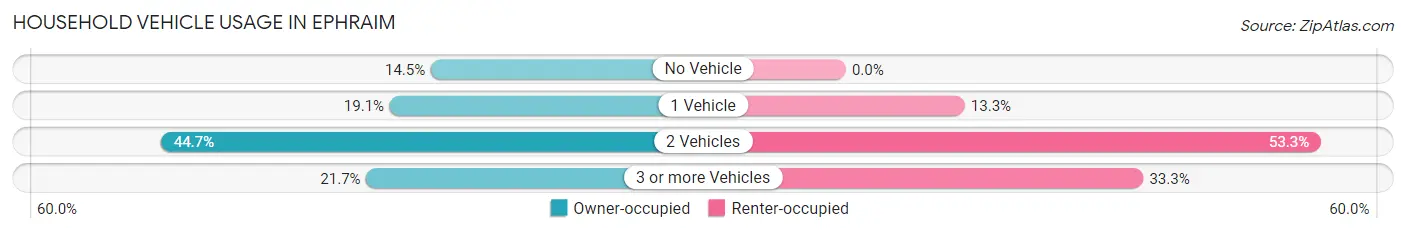
| Vehicles per Household | Owner-occupied | Renter-occupied |
| No Vehicle | 22 (14.5%) | 0 (0.0%) |
| 1 Vehicle | 29 (19.1%) | 2 (13.3%) |
| 2 Vehicles | 68 (44.7%) | 8 (53.3%) |
| 3 or more Vehicles | 33 (21.7%) | 5 (33.3%) |
| Total | 152 (100.0%) | 15 (100.0%) |
Real Estate & Mortgages in Ephraim
Real Estate and Mortgage Overview in Ephraim
| Characteristic | Without Mortgage | With Mortgage |
| Housing Units | 94 | 58 |
| Median Property Value | $490,300 | $387,500 |
| Median Household Income | - | - |
| Monthly Housing Costs | $945 | $16 |
| Real Estate Taxes | $5,682 | $0 |
Property Value by Mortgage Status in Ephraim
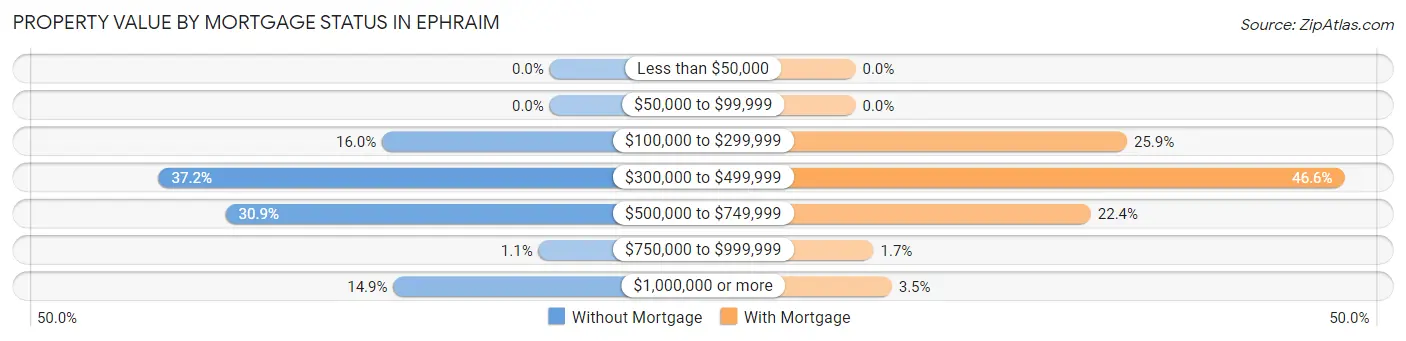
| Property Value | Without Mortgage | With Mortgage |
| Less than $50,000 | 0 (0.0%) | 0 (0.0%) |
| $50,000 to $99,999 | 0 (0.0%) | 0 (0.0%) |
| $100,000 to $299,999 | 15 (16.0%) | 15 (25.9%) |
| $300,000 to $499,999 | 35 (37.2%) | 27 (46.6%) |
| $500,000 to $749,999 | 29 (30.8%) | 13 (22.4%) |
| $750,000 to $999,999 | 1 (1.1%) | 1 (1.7%) |
| $1,000,000 or more | 14 (14.9%) | 2 (3.5%) |
| Total | 94 (100.0%) | 58 (100.0%) |
Household Income by Mortgage Status in Ephraim
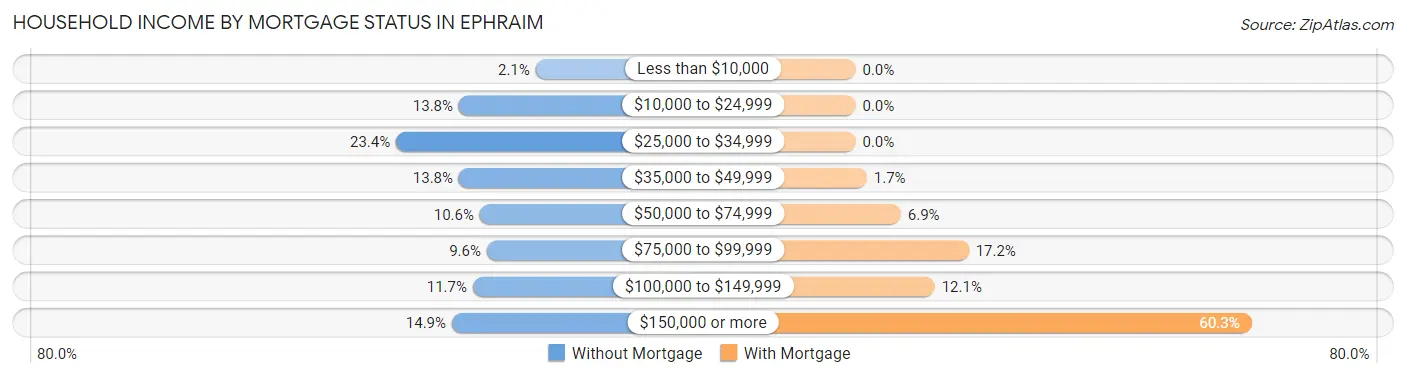
| Household Income | Without Mortgage | With Mortgage |
| Less than $10,000 | 2 (2.1%) | 0 (0.0%) |
| $10,000 to $24,999 | 13 (13.8%) | 0 (0.0%) |
| $25,000 to $34,999 | 22 (23.4%) | 0 (0.0%) |
| $35,000 to $49,999 | 13 (13.8%) | 1 (1.7%) |
| $50,000 to $74,999 | 10 (10.6%) | 4 (6.9%) |
| $75,000 to $99,999 | 9 (9.6%) | 10 (17.2%) |
| $100,000 to $149,999 | 11 (11.7%) | 7 (12.1%) |
| $150,000 or more | 14 (14.9%) | 35 (60.3%) |
| Total | 94 (100.0%) | 58 (100.0%) |
Property Value to Household Income Ratio in Ephraim
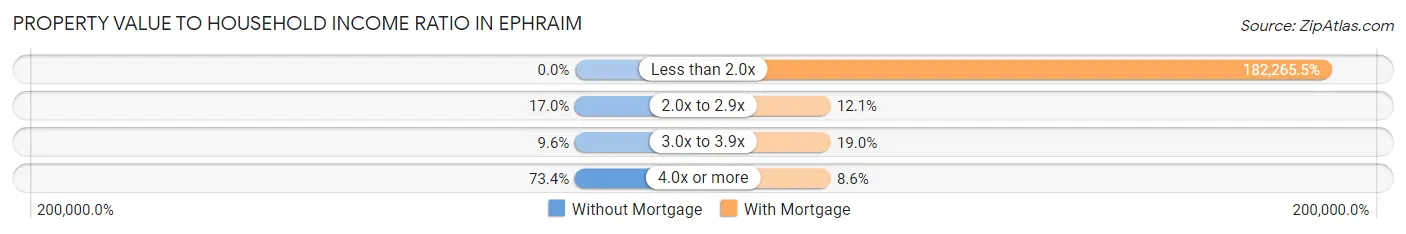
| Value-to-Income Ratio | Without Mortgage | With Mortgage |
| Less than 2.0x | 0 (0.0%) | 105,714 (182,265.5%) |
| 2.0x to 2.9x | 16 (17.0%) | 7 (12.1%) |
| 3.0x to 3.9x | 9 (9.6%) | 11 (19.0%) |
| 4.0x or more | 69 (73.4%) | 5 (8.6%) |
| Total | 94 (100.0%) | 58 (100.0%) |
Real Estate Taxes by Mortgage Status in Ephraim
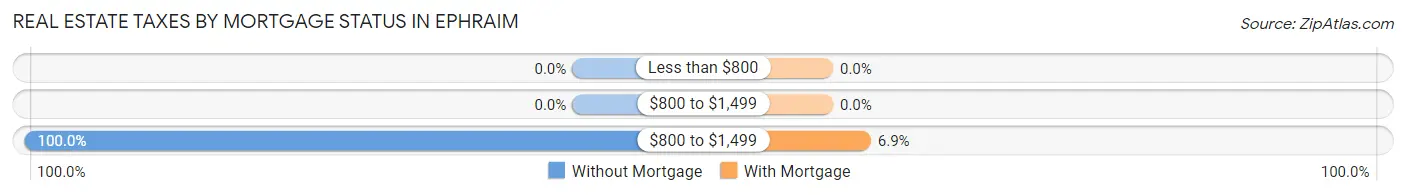
| Property Taxes | Without Mortgage | With Mortgage |
| Less than $800 | 0 (0.0%) | 0 (0.0%) |
| $800 to $1,499 | 0 (0.0%) | 0 (0.0%) |
| $800 to $1,499 | 94 (100.0%) | 4 (6.9%) |
| Total | 94 (100.0%) | 58 (100.0%) |
Health & Disability in Ephraim
Health Insurance Coverage by Age in Ephraim
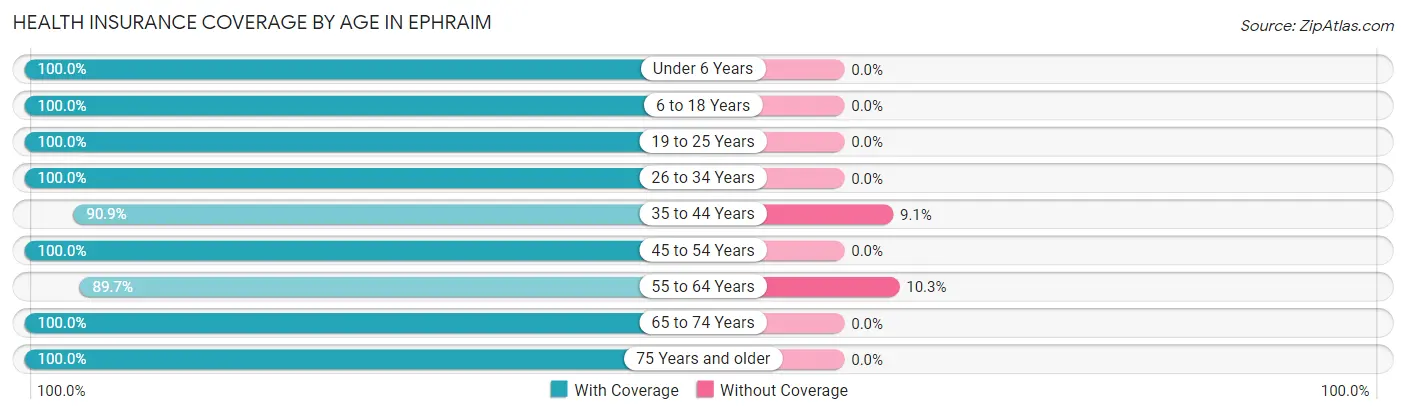
| Age Bracket | With Coverage | Without Coverage |
| Under 6 Years | 8 (100.0%) | 0 (0.0%) |
| 6 to 18 Years | 16 (100.0%) | 0 (0.0%) |
| 19 to 25 Years | 8 (100.0%) | 0 (0.0%) |
| 26 to 34 Years | 10 (100.0%) | 0 (0.0%) |
| 35 to 44 Years | 10 (90.9%) | 1 (9.1%) |
| 45 to 54 Years | 24 (100.0%) | 0 (0.0%) |
| 55 to 64 Years | 70 (89.7%) | 8 (10.3%) |
| 65 to 74 Years | 70 (100.0%) | 0 (0.0%) |
| 75 Years and older | 82 (100.0%) | 0 (0.0%) |
| Total | 298 (97.1%) | 9 (2.9%) |
Health Insurance Coverage by Citizenship Status in Ephraim
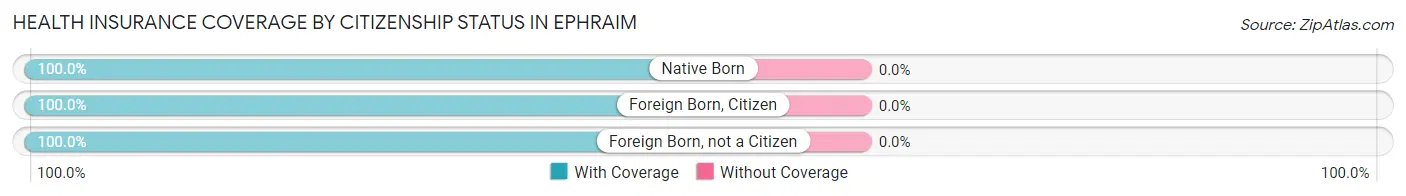
| Citizenship Status | With Coverage | Without Coverage |
| Native Born | 8 (100.0%) | 0 (0.0%) |
| Foreign Born, Citizen | 16 (100.0%) | 0 (0.0%) |
| Foreign Born, not a Citizen | 8 (100.0%) | 0 (0.0%) |
Health Insurance Coverage by Household Income in Ephraim
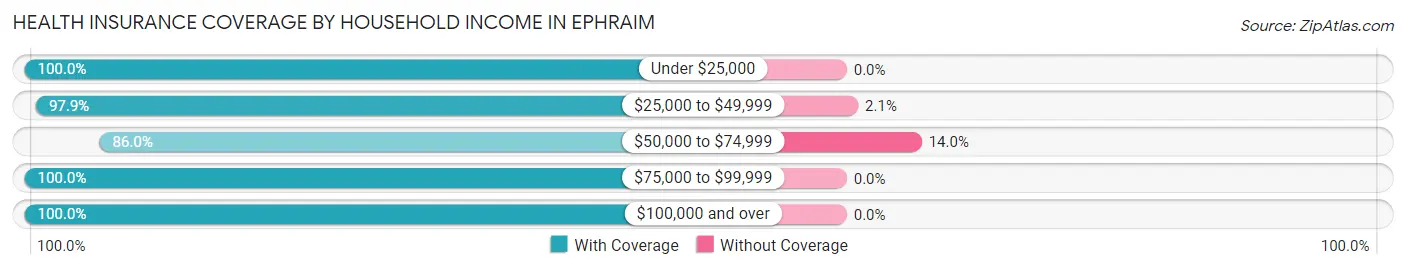
| Household Income | With Coverage | Without Coverage |
| Under $25,000 | 20 (100.0%) | 0 (0.0%) |
| $25,000 to $49,999 | 46 (97.9%) | 1 (2.1%) |
| $50,000 to $74,999 | 49 (86.0%) | 8 (14.0%) |
| $75,000 to $99,999 | 47 (100.0%) | 0 (0.0%) |
| $100,000 and over | 136 (100.0%) | 0 (0.0%) |
Public vs Private Health Insurance Coverage by Age in Ephraim
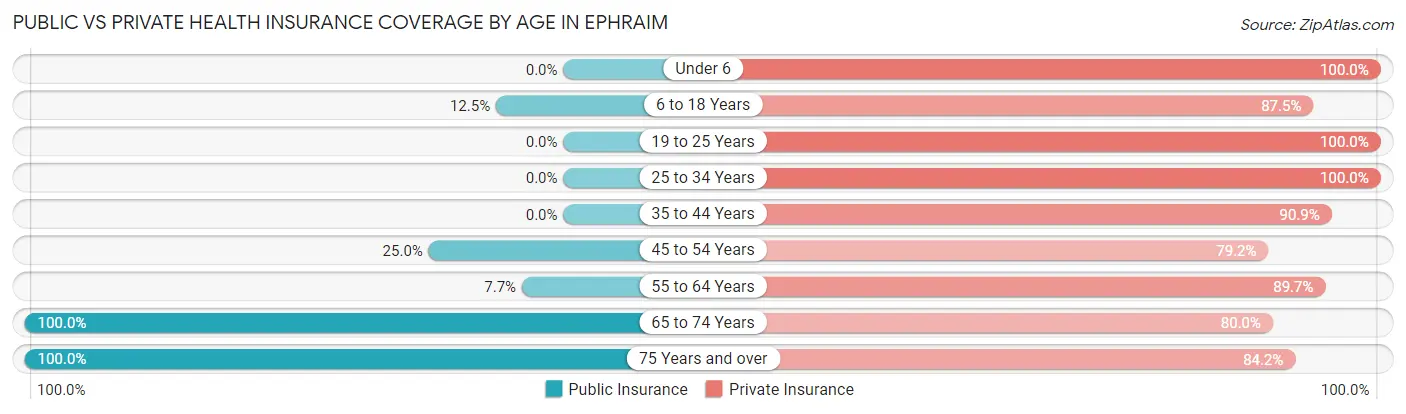
| Age Bracket | Public Insurance | Private Insurance |
| Under 6 | 0 (0.0%) | 8 (100.0%) |
| 6 to 18 Years | 2 (12.5%) | 14 (87.5%) |
| 19 to 25 Years | 0 (0.0%) | 8 (100.0%) |
| 25 to 34 Years | 0 (0.0%) | 10 (100.0%) |
| 35 to 44 Years | 0 (0.0%) | 10 (90.9%) |
| 45 to 54 Years | 6 (25.0%) | 19 (79.2%) |
| 55 to 64 Years | 6 (7.7%) | 70 (89.7%) |
| 65 to 74 Years | 70 (100.0%) | 56 (80.0%) |
| 75 Years and over | 82 (100.0%) | 69 (84.2%) |
| Total | 166 (54.1%) | 264 (86.0%) |
Disability Status by Sex by Age in Ephraim
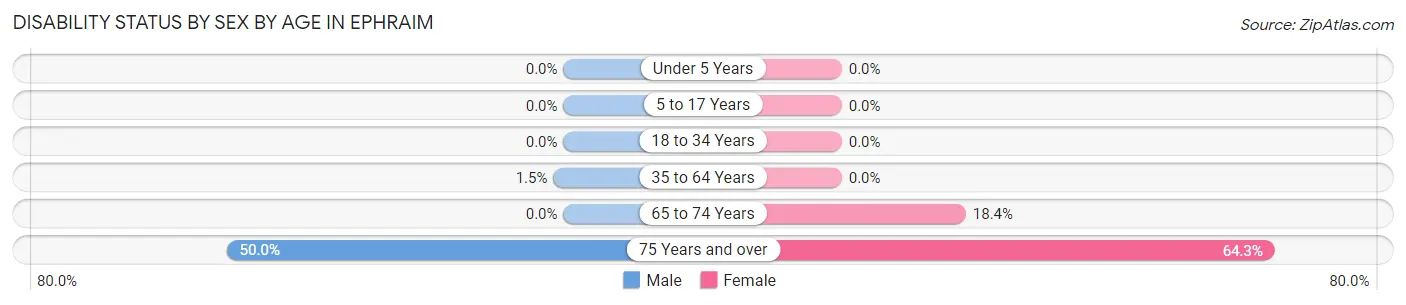
| Age Bracket | Male | Female |
| Under 5 Years | 0 (0.0%) | 0 (0.0%) |
| 5 to 17 Years | 0 (0.0%) | 0 (0.0%) |
| 18 to 34 Years | 0 (0.0%) | 0 (0.0%) |
| 35 to 64 Years | 1 (1.5%) | 0 (0.0%) |
| 65 to 74 Years | 0 (0.0%) | 7 (18.4%) |
| 75 Years and over | 13 (50.0%) | 36 (64.3%) |
Disability Class by Sex by Age in Ephraim
Disability Class: Hearing Difficulty
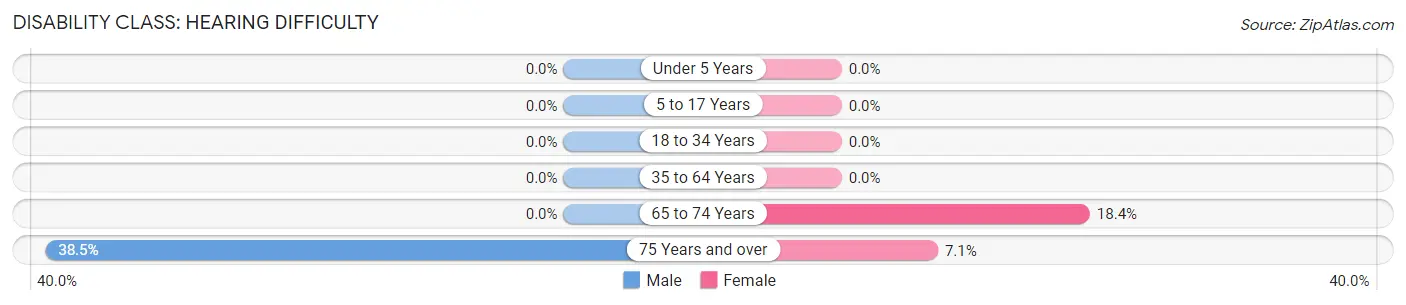
| Age Bracket | Male | Female |
| Under 5 Years | 0 (0.0%) | 0 (0.0%) |
| 5 to 17 Years | 0 (0.0%) | 0 (0.0%) |
| 18 to 34 Years | 0 (0.0%) | 0 (0.0%) |
| 35 to 64 Years | 0 (0.0%) | 0 (0.0%) |
| 65 to 74 Years | 0 (0.0%) | 7 (18.4%) |
| 75 Years and over | 10 (38.5%) | 4 (7.1%) |
Disability Class: Vision Difficulty
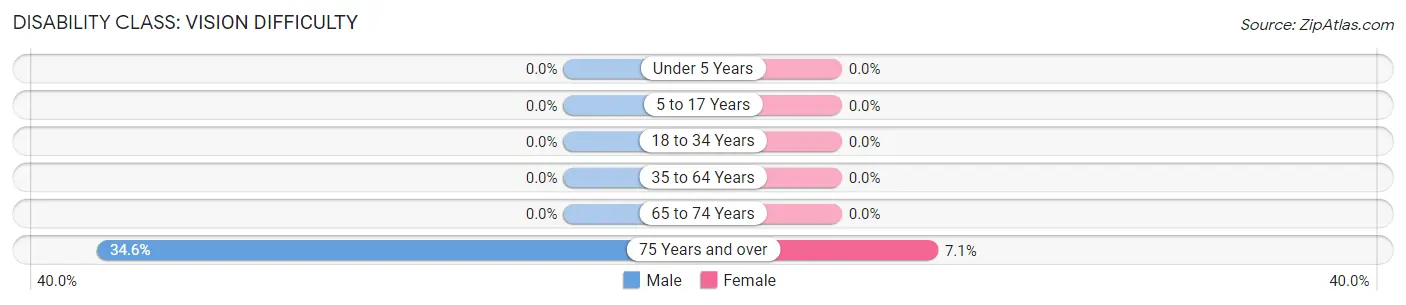
| Age Bracket | Male | Female |
| Under 5 Years | 0 (0.0%) | 0 (0.0%) |
| 5 to 17 Years | 0 (0.0%) | 0 (0.0%) |
| 18 to 34 Years | 0 (0.0%) | 0 (0.0%) |
| 35 to 64 Years | 0 (0.0%) | 0 (0.0%) |
| 65 to 74 Years | 0 (0.0%) | 0 (0.0%) |
| 75 Years and over | 9 (34.6%) | 4 (7.1%) |
Disability Class: Cognitive Difficulty
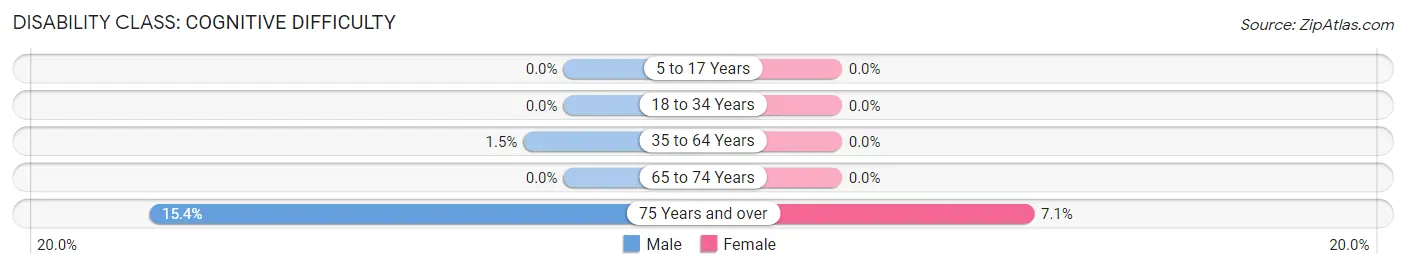
| Age Bracket | Male | Female |
| 5 to 17 Years | 0 (0.0%) | 0 (0.0%) |
| 18 to 34 Years | 0 (0.0%) | 0 (0.0%) |
| 35 to 64 Years | 1 (1.5%) | 0 (0.0%) |
| 65 to 74 Years | 0 (0.0%) | 0 (0.0%) |
| 75 Years and over | 4 (15.4%) | 4 (7.1%) |
Disability Class: Ambulatory Difficulty
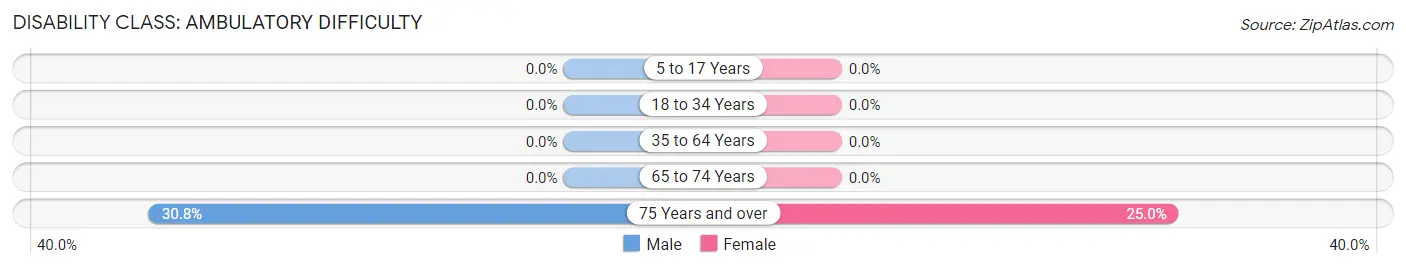
| Age Bracket | Male | Female |
| 5 to 17 Years | 0 (0.0%) | 0 (0.0%) |
| 18 to 34 Years | 0 (0.0%) | 0 (0.0%) |
| 35 to 64 Years | 0 (0.0%) | 0 (0.0%) |
| 65 to 74 Years | 0 (0.0%) | 0 (0.0%) |
| 75 Years and over | 8 (30.8%) | 14 (25.0%) |
Disability Class: Self-Care Difficulty
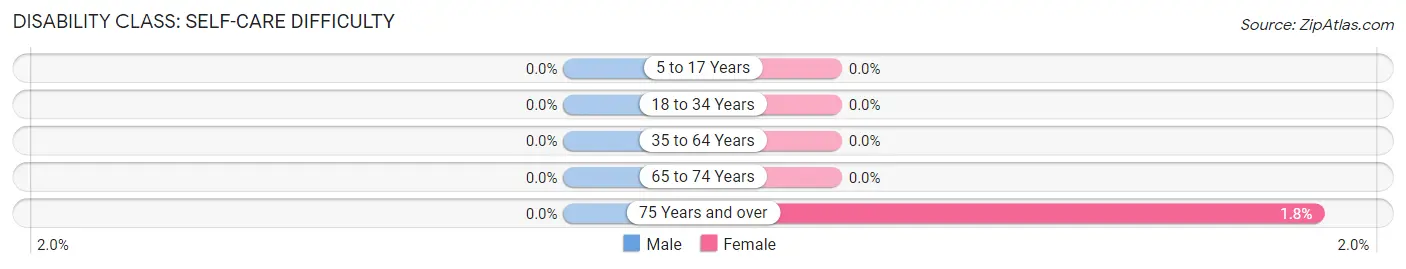
| Age Bracket | Male | Female |
| 5 to 17 Years | 0 (0.0%) | 0 (0.0%) |
| 18 to 34 Years | 0 (0.0%) | 0 (0.0%) |
| 35 to 64 Years | 0 (0.0%) | 0 (0.0%) |
| 65 to 74 Years | 0 (0.0%) | 0 (0.0%) |
| 75 Years and over | 0 (0.0%) | 1 (1.8%) |
Technology Access in Ephraim
Computing Device Access in Ephraim
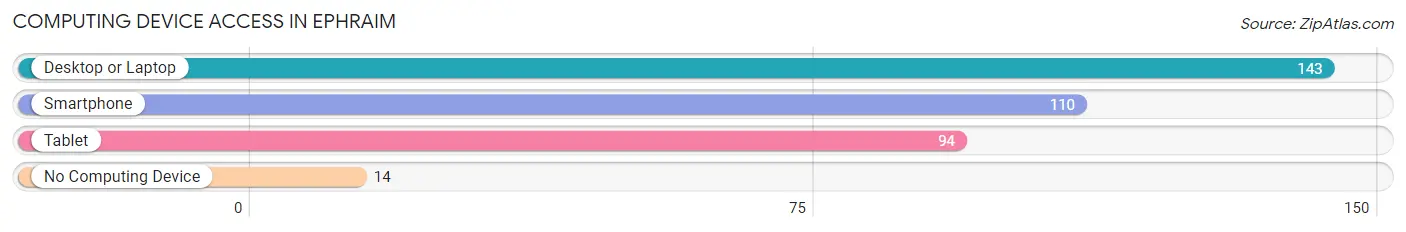
| Device Type | # Households | % Households |
| Desktop or Laptop | 143 | 85.6% |
| Smartphone | 110 | 65.9% |
| Tablet | 94 | 56.3% |
| No Computing Device | 14 | 8.4% |
| Total | 167 | 100.0% |
Internet Access in Ephraim
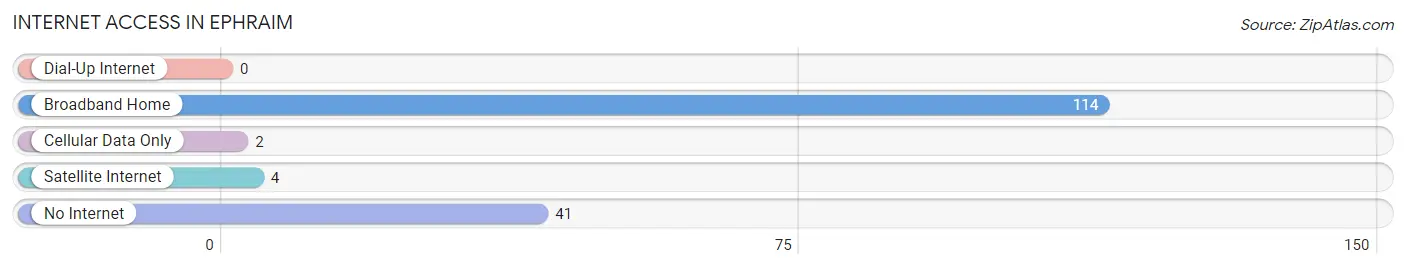
| Internet Type | # Households | % Households |
| Dial-Up Internet | 0 | 0.0% |
| Broadband Home | 114 | 68.3% |
| Cellular Data Only | 2 | 1.2% |
| Satellite Internet | 4 | 2.4% |
| No Internet | 41 | 24.5% |
| Total | 167 | 100.0% |
Ephraim Summary
Ephraim, Wisconsin is a small village located in Door County, Wisconsin. It is situated on the shores of Eagle Harbor, a part of the Green Bay. The village is known for its picturesque views of the harbor and its quaint downtown area.
History
Ephraim was founded in 1853 by Norwegian immigrants. The village was named after Ephraim Hjort, a Norwegian immigrant who was the first settler in the area. The village was incorporated in 1894 and has since grown to a population of around 500 people.
Geography
Ephraim is located in Door County, Wisconsin, on the shores of Eagle Harbor. The village is situated on a peninsula, surrounded by the waters of Green Bay. The village is known for its picturesque views of the harbor and its quaint downtown area.
Economy
Ephraim’s economy is largely based on tourism. The village is a popular destination for visitors from all over the world, who come to enjoy the area’s natural beauty and recreational activities. The village is also home to several businesses, including restaurants, shops, and galleries.
Demographics
As of the 2010 census, the population of Ephraim was 498. The racial makeup of the village was 97.2% White, 0.2% African American, 0.2% Native American, 0.6% Asian, 0.2% from other races, and 1.8% from two or more races. The median household income was $45,000, and the median family income was $50,000.
Ephraim is a small village with a rich history and a vibrant economy. The village is known for its picturesque views of the harbor and its quaint downtown area. The village is a popular destination for visitors from all over the world, who come to enjoy the area’s natural beauty and recreational activities. The village is also home to several businesses, including restaurants, shops, and galleries. The population of Ephraim is largely white, with a median household income of $45,000 and a median family income of $50,000.
Common Questions
What is Per Capita Income in Ephraim?
Per Capita income in Ephraim is $78,712.
What is the Median Family Income in Ephraim?
Median Family Income in Ephraim is $106,250.
What is the Median Household income in Ephraim?
Median Household Income in Ephraim is $72,292.
What is Income or Wage Gap in Ephraim?
Income or Wage Gap in Ephraim is 39.9%.
Women in Ephraim earn 60.1 cents for every dollar earned by a man.
What is Inequality or Gini Index in Ephraim?
Inequality or Gini Index in Ephraim is 0.56.
What is the Total Population of Ephraim?
Total Population of Ephraim is 307.
What is the Total Male Population of Ephraim?
Total Male Population of Ephraim is 145.
What is the Total Female Population of Ephraim?
Total Female Population of Ephraim is 162.
What is the Ratio of Males per 100 Females in Ephraim?
There are 89.51 Males per 100 Females in Ephraim.
What is the Ratio of Females per 100 Males in Ephraim?
There are 111.72 Females per 100 Males in Ephraim.
What is the Median Population Age in Ephraim?
Median Population Age in Ephraim is 63.9 Years.
What is the Average Family Size in Ephraim
Average Family Size in Ephraim is 2.4 People.
What is the Average Household Size in Ephraim
Average Household Size in Ephraim is 1.8 People.
How Large is the Labor Force in Ephraim?
There are 146 People in the Labor Forcein in Ephraim.
What is the Percentage of People in the Labor Force in Ephraim?
50.2% of People are in the Labor Force in Ephraim.