Embarrass, WI Map & Demographics
Embarrass Map
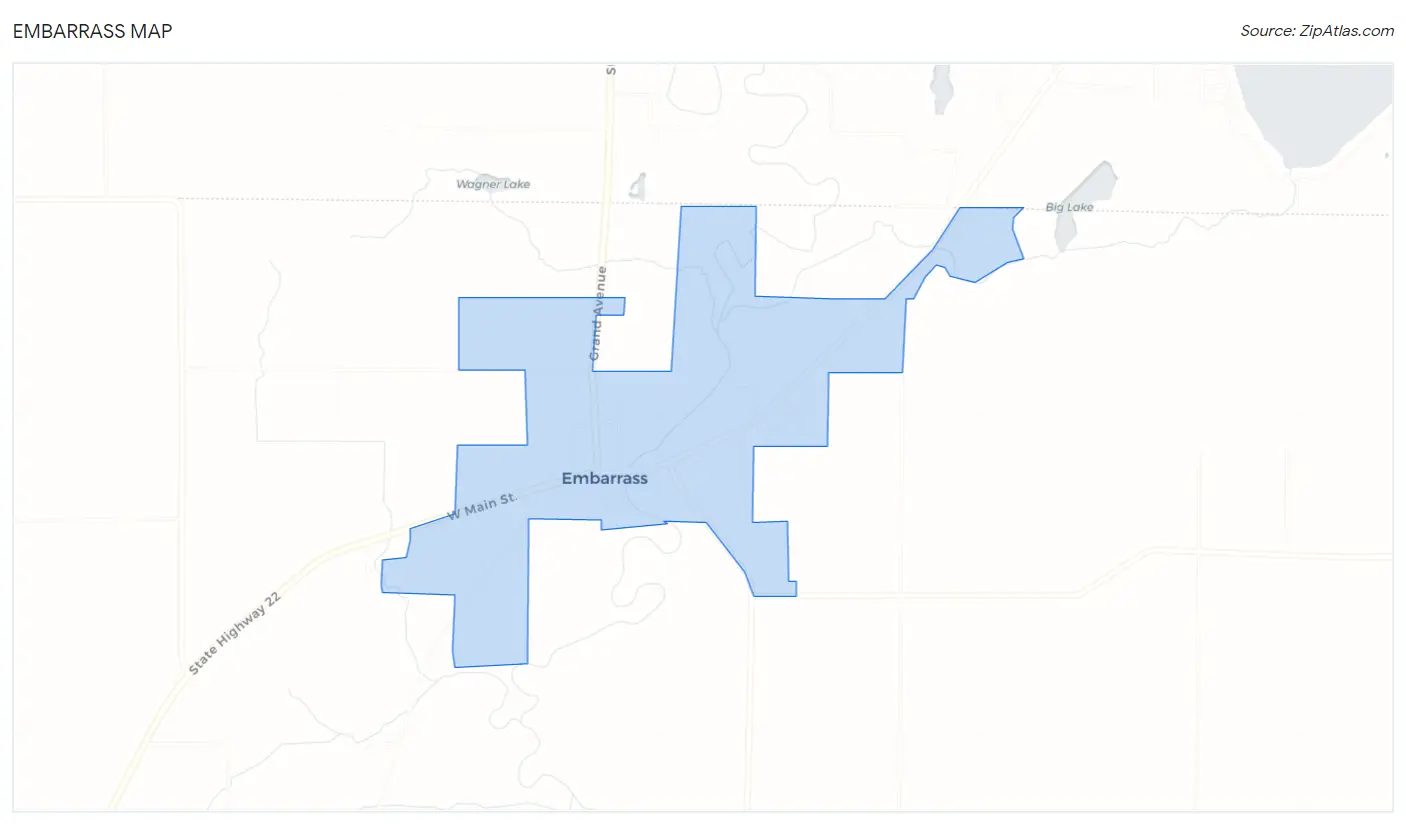
Embarrass Overview
$26,847
PER CAPITA INCOME
$34,286
AVG HOUSEHOLD INCOME
57.5%
WAGE / INCOME GAP [ % ]
42.5¢/ $1
WAGE / INCOME GAP [ $ ]
0.42
INEQUALITY / GINI INDEX
506
TOTAL POPULATION
295
MALE POPULATION
211
FEMALE POPULATION
139.81
MALES / 100 FEMALES
71.53
FEMALES / 100 MALES
43.5
MEDIAN AGE
2.8
AVG FAMILY SIZE
2.3
AVG HOUSEHOLD SIZE
163
LABOR FORCE [ PEOPLE ]
44.4%
PERCENT IN LABOR FORCE
1.2%
UNEMPLOYMENT RATE
Embarrass Zip Codes
Income in Embarrass
Income Overview in Embarrass
| Characteristic | Number | Measure |
| Per Capita Income | 506 | $26,847 |
| Median Family Income | 131 | $0 |
| Mean Family Income | 131 | $55,197 |
| Median Household Income | 200 | $34,286 |
| Mean Household Income | 200 | $53,514 |
| Income Deficit | 131 | $0 |
| Wage / Income Gap (%) | 506 | 57.50% |
| Wage / Income Gap ($) | 506 | 42.50¢ per $1 |
| Gini / Inequality Index | 506 | 0.42 |
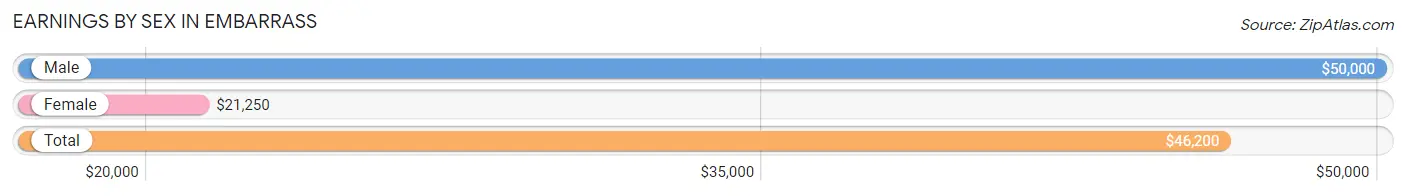
Earnings by Sex in Embarrass
Average Earnings in Embarrass are $46,200, $50,000 for men and $21,250 for women, a difference of 57.5%.
| Sex | Number | Average Earnings |
| Male | 106 (62.4%) | $50,000 |
| Female | 64 (37.7%) | $21,250 |
| Total | 170 (100.0%) | $46,200 |
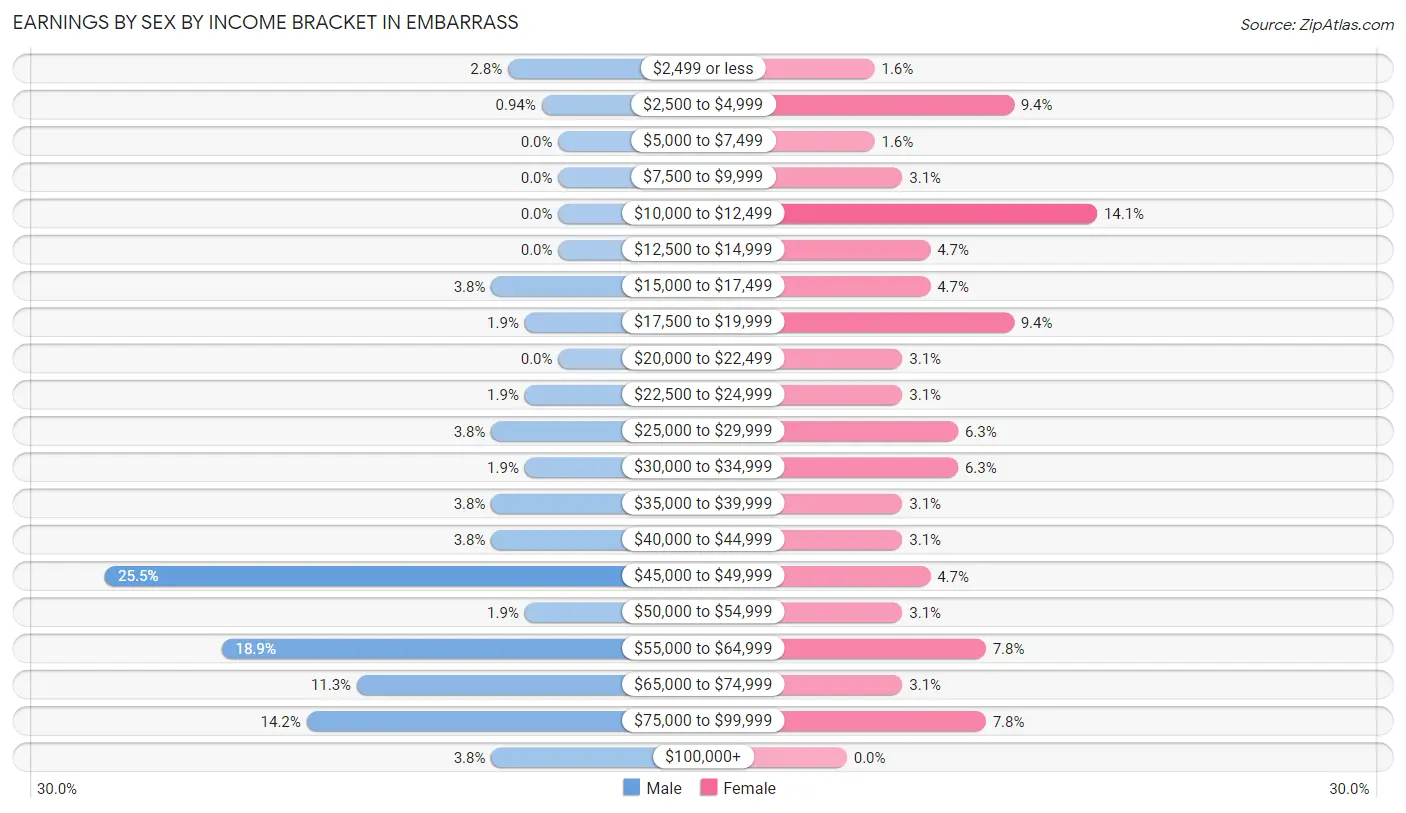
Earnings by Sex by Income Bracket in Embarrass
The most common earnings brackets in Embarrass are $45,000 to $49,999 for men (27 | 25.5%) and $10,000 to $12,499 for women (9 | 14.1%).
| Income | Male | Female |
| $2,499 or less | 3 (2.8%) | 1 (1.6%) |
| $2,500 to $4,999 | 1 (0.9%) | 6 (9.4%) |
| $5,000 to $7,499 | 0 (0.0%) | 1 (1.6%) |
| $7,500 to $9,999 | 0 (0.0%) | 2 (3.1%) |
| $10,000 to $12,499 | 0 (0.0%) | 9 (14.1%) |
| $12,500 to $14,999 | 0 (0.0%) | 3 (4.7%) |
| $15,000 to $17,499 | 4 (3.8%) | 3 (4.7%) |
| $17,500 to $19,999 | 2 (1.9%) | 6 (9.4%) |
| $20,000 to $22,499 | 0 (0.0%) | 2 (3.1%) |
| $22,500 to $24,999 | 2 (1.9%) | 2 (3.1%) |
| $25,000 to $29,999 | 4 (3.8%) | 4 (6.2%) |
| $30,000 to $34,999 | 2 (1.9%) | 4 (6.2%) |
| $35,000 to $39,999 | 4 (3.8%) | 2 (3.1%) |
| $40,000 to $44,999 | 4 (3.8%) | 2 (3.1%) |
| $45,000 to $49,999 | 27 (25.5%) | 3 (4.7%) |
| $50,000 to $54,999 | 2 (1.9%) | 2 (3.1%) |
| $55,000 to $64,999 | 20 (18.9%) | 5 (7.8%) |
| $65,000 to $74,999 | 12 (11.3%) | 2 (3.1%) |
| $75,000 to $99,999 | 15 (14.1%) | 5 (7.8%) |
| $100,000+ | 4 (3.8%) | 0 (0.0%) |
| Total | 106 (100.0%) | 64 (100.0%) |
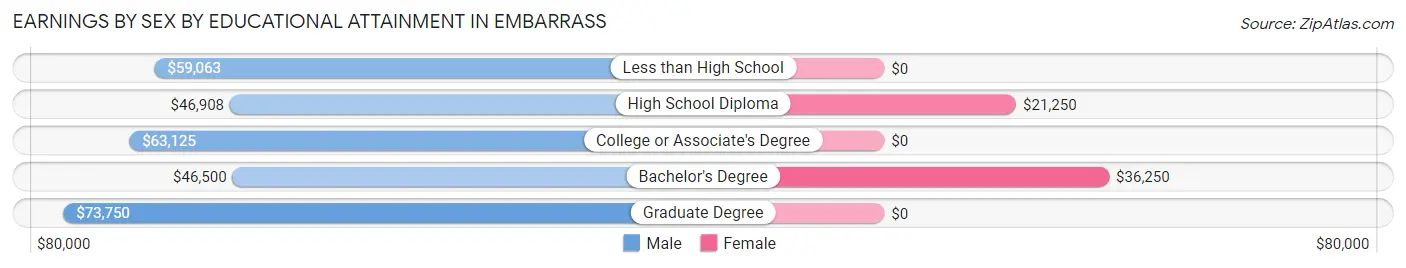
Earnings by Sex by Educational Attainment in Embarrass
Average earnings in Embarrass are $52,500 for men and $26,667 for women, a difference of 49.2%. Men with an educational attainment of graduate degree enjoy the highest average annual earnings of $73,750, while those with bachelor's degree education earn the least with $46,500. Women with an educational attainment of bachelor's degree earn the most with the average annual earnings of $36,250, while those with high school diploma education have the smallest earnings of $21,250.
| Educational Attainment | Male Income | Female Income |
| Less than High School | $59,063 | $0 |
| High School Diploma | $46,908 | $21,250 |
| College or Associate's Degree | $63,125 | $0 |
| Bachelor's Degree | $46,500 | $36,250 |
| Graduate Degree | $73,750 | $0 |
| Total | $52,500 | $26,667 |
Family Income in Embarrass
Family Income Brackets in Embarrass
According to the Embarrass family income data, there are 50 families falling into the $15,000 to $24,999 income range, which is the most common income bracket and makes up 38.2% of all families.
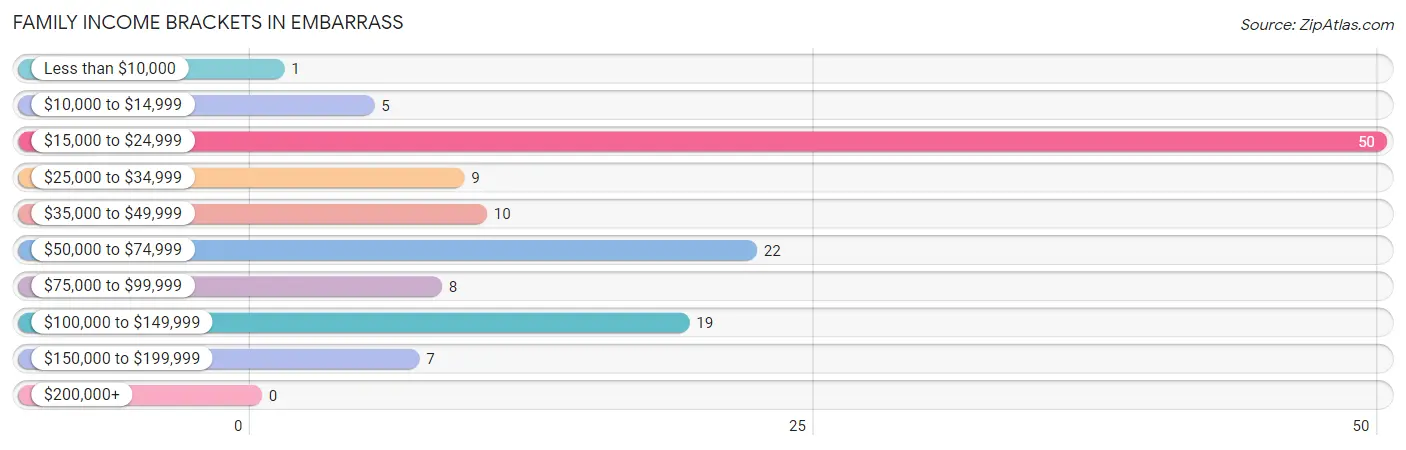
| Income Bracket | # Families | % Families |
| Less than $10,000 | 1 | 0.8% |
| $10,000 to $14,999 | 5 | 3.8% |
| $15,000 to $24,999 | 50 | 38.2% |
| $25,000 to $34,999 | 9 | 6.9% |
| $35,000 to $49,999 | 10 | 7.6% |
| $50,000 to $74,999 | 22 | 16.8% |
| $75,000 to $99,999 | 8 | 6.1% |
| $100,000 to $149,999 | 19 | 14.5% |
| $150,000 to $199,999 | 7 | 5.3% |
| $200,000+ | 0 | 0.0% |
Family Income by Famaliy Size in Embarrass
4-person families (11 | 8.4%) account for the highest median family income in Embarrass with $99,583 per family, while 2-person families (56 | 42.7%) have the highest median income of $26,562 per family member.
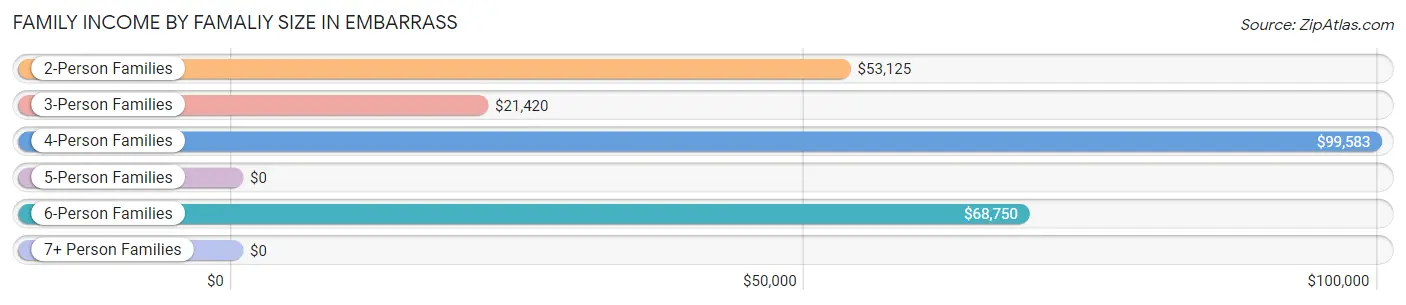
| Income Bracket | # Families | Median Income |
| 2-Person Families | 56 (42.7%) | $53,125 |
| 3-Person Families | 56 (42.7%) | $21,420 |
| 4-Person Families | 11 (8.4%) | $99,583 |
| 5-Person Families | 4 (3.0%) | $0 |
| 6-Person Families | 4 (3.0%) | $68,750 |
| 7+ Person Families | 0 (0.0%) | $0 |
| Total | 131 (100.0%) | $0 |
Family Income by Number of Earners in Embarrass
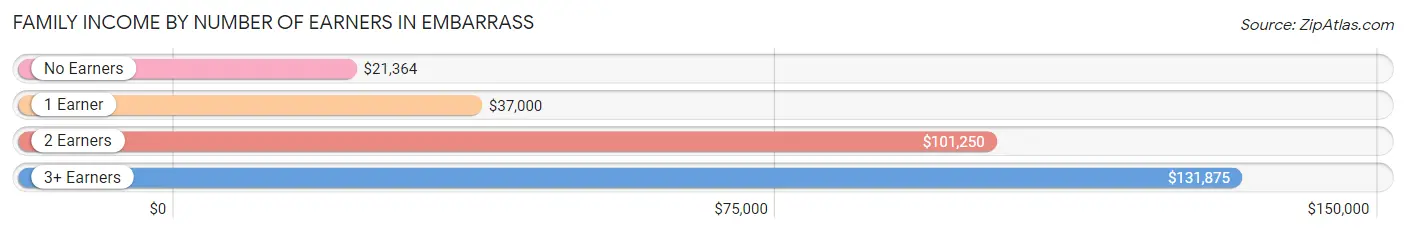
| Number of Earners | # Families | Median Income |
| No Earners | 60 (45.8%) | $21,364 |
| 1 Earner | 32 (24.4%) | $37,000 |
| 2 Earners | 30 (22.9%) | $101,250 |
| 3+ Earners | 9 (6.9%) | $131,875 |
| Total | 131 (100.0%) | $0 |
Household Income in Embarrass
Household Income Brackets in Embarrass
With 57 households falling in the category, the $15,000 to $24,999 income range is the most frequent in Embarrass, accounting for 28.5% of all households.
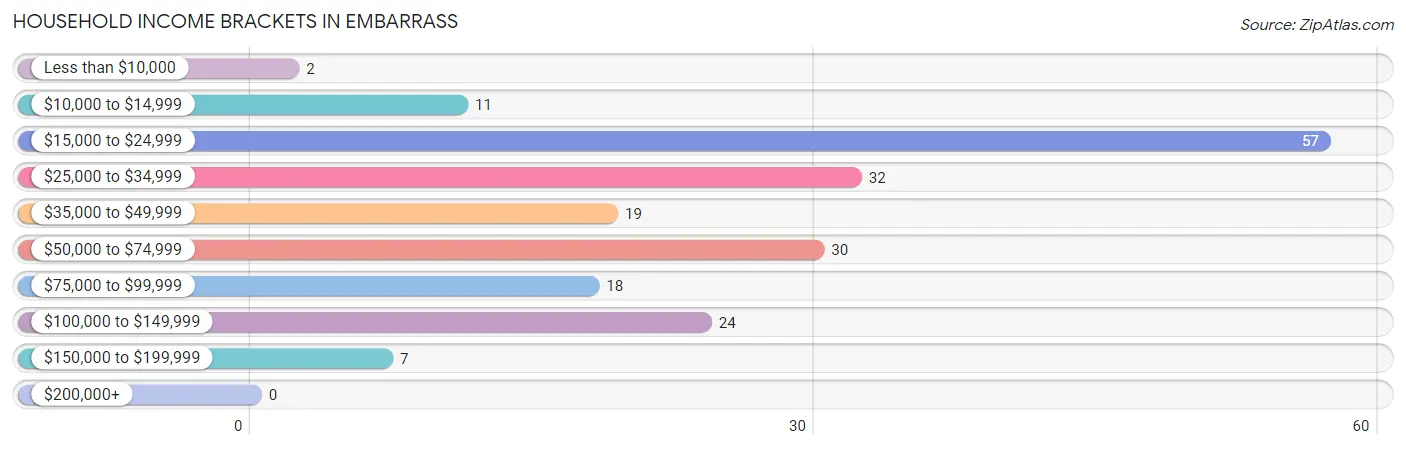
| Income Bracket | # Households | % Households |
| Less than $10,000 | 2 | 1.0% |
| $10,000 to $14,999 | 11 | 5.5% |
| $15,000 to $24,999 | 57 | 28.5% |
| $25,000 to $34,999 | 32 | 16.0% |
| $35,000 to $49,999 | 19 | 9.5% |
| $50,000 to $74,999 | 30 | 15.0% |
| $75,000 to $99,999 | 18 | 9.0% |
| $100,000 to $149,999 | 24 | 12.0% |
| $150,000 to $199,999 | 7 | 3.5% |
| $200,000+ | 0 | 0.0% |
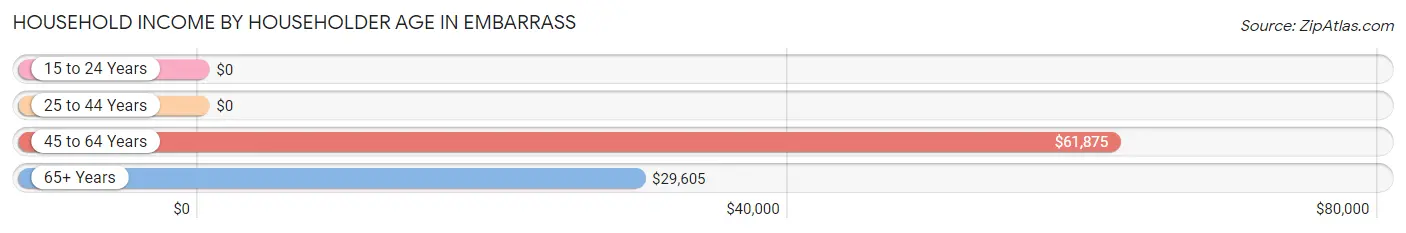
Household Income by Householder Age in Embarrass
The median household income in Embarrass is $34,286, with the highest median household income of $61,875 found in the 45 to 64 years age bracket for the primary householder. A total of 61 households (30.5%) fall into this category. Meanwhile, the 15 to 24 years age bracket for the primary householder has the lowest median household income of $0, with 3 households (1.5%) in this group.
| Income Bracket | # Households | Median Income |
| 15 to 24 Years | 3 (1.5%) | $0 |
| 25 to 44 Years | 80 (40.0%) | $0 |
| 45 to 64 Years | 61 (30.5%) | $61,875 |
| 65+ Years | 56 (28.0%) | $29,605 |
| Total | 200 (100.0%) | $34,286 |
Poverty in Embarrass
Income Below Poverty by Sex and Age in Embarrass
With 40.9% poverty level for males and 29.5% for females among the residents of Embarrass, 6 to 11 year old males and 6 to 11 year old females are the most vulnerable to poverty, with 43 males (82.7%) and 38 females (86.4%) in their respective age groups living below the poverty level.
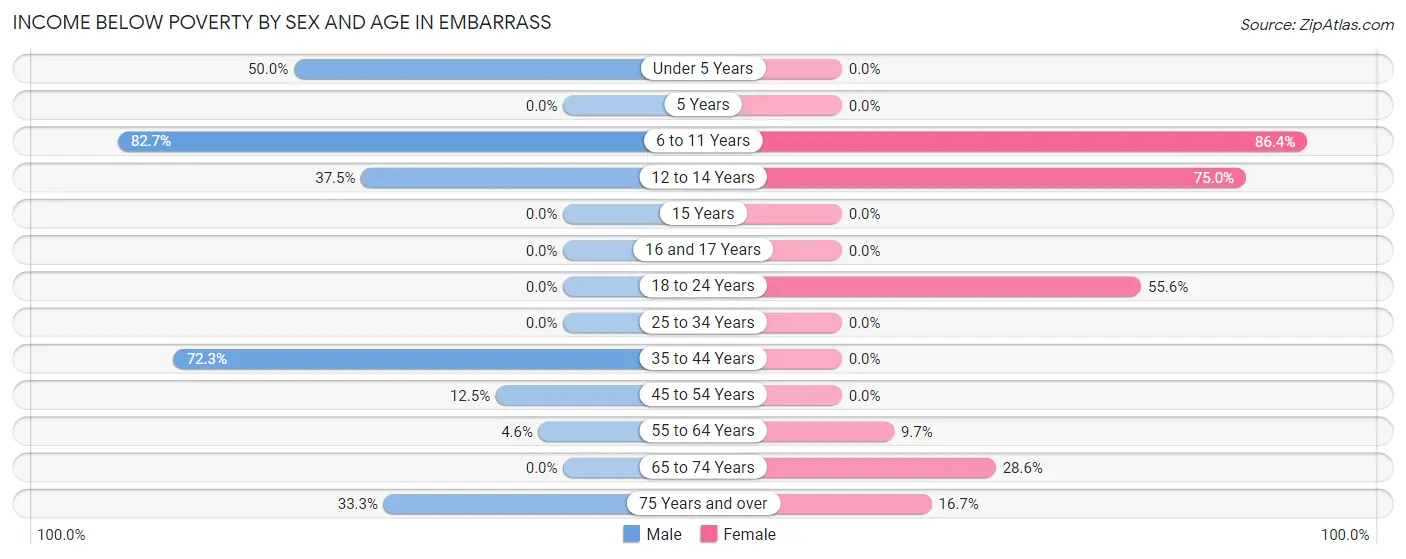
| Age Bracket | Male | Female |
| Under 5 Years | 3 (50.0%) | 0 (0.0%) |
| 5 Years | 0 (0.0%) | 0 (0.0%) |
| 6 to 11 Years | 43 (82.7%) | 38 (86.4%) |
| 12 to 14 Years | 3 (37.5%) | 3 (75.0%) |
| 15 Years | 0 (0.0%) | 0 (0.0%) |
| 16 and 17 Years | 0 (0.0%) | 0 (0.0%) |
| 18 to 24 Years | 0 (0.0%) | 5 (55.6%) |
| 25 to 34 Years | 0 (0.0%) | 0 (0.0%) |
| 35 to 44 Years | 47 (72.3%) | 0 (0.0%) |
| 45 to 54 Years | 4 (12.5%) | 0 (0.0%) |
| 55 to 64 Years | 1 (4.5%) | 3 (9.7%) |
| 65 to 74 Years | 0 (0.0%) | 2 (28.6%) |
| 75 Years and over | 3 (33.3%) | 6 (16.7%) |
| Total | 104 (40.9%) | 57 (29.5%) |
Income Above Poverty by Sex and Age in Embarrass
According to the poverty statistics in Embarrass, males aged 5 years and females aged under 5 years are the age groups that are most secure financially, with 100.0% of males and 100.0% of females in these age groups living above the poverty line.
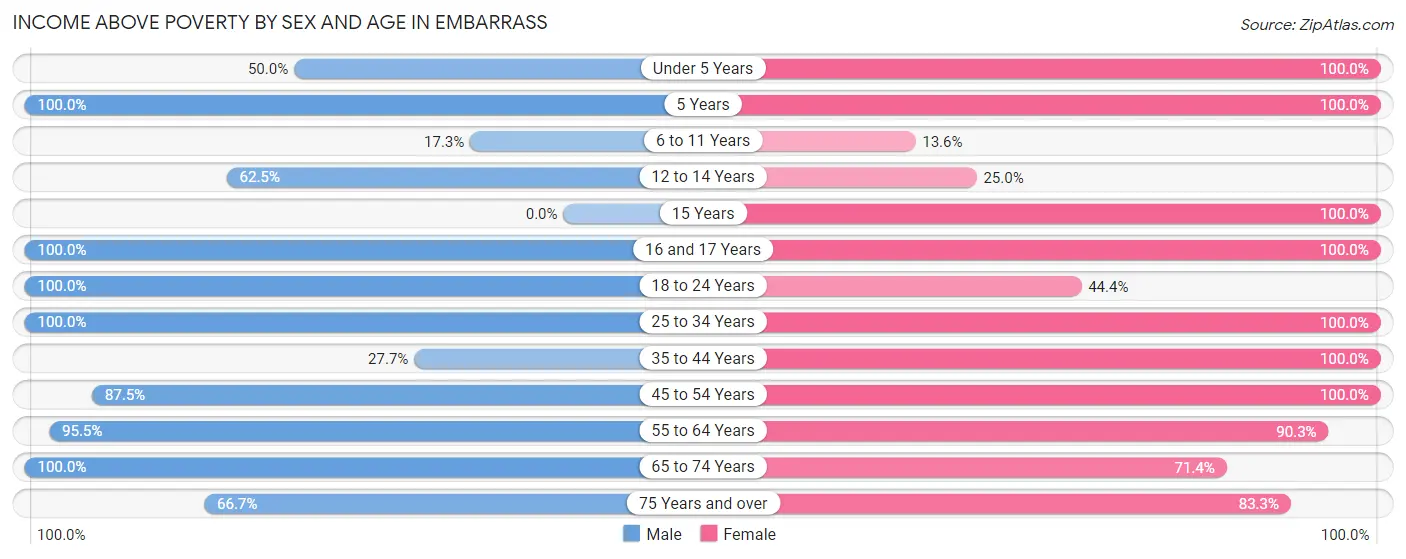
| Age Bracket | Male | Female |
| Under 5 Years | 3 (50.0%) | 11 (100.0%) |
| 5 Years | 4 (100.0%) | 3 (100.0%) |
| 6 to 11 Years | 9 (17.3%) | 6 (13.6%) |
| 12 to 14 Years | 5 (62.5%) | 1 (25.0%) |
| 15 Years | 0 (0.0%) | 2 (100.0%) |
| 16 and 17 Years | 5 (100.0%) | 1 (100.0%) |
| 18 to 24 Years | 7 (100.0%) | 4 (44.4%) |
| 25 to 34 Years | 24 (100.0%) | 13 (100.0%) |
| 35 to 44 Years | 18 (27.7%) | 15 (100.0%) |
| 45 to 54 Years | 28 (87.5%) | 17 (100.0%) |
| 55 to 64 Years | 21 (95.5%) | 28 (90.3%) |
| 65 to 74 Years | 20 (100.0%) | 5 (71.4%) |
| 75 Years and over | 6 (66.7%) | 30 (83.3%) |
| Total | 150 (59.1%) | 136 (70.5%) |
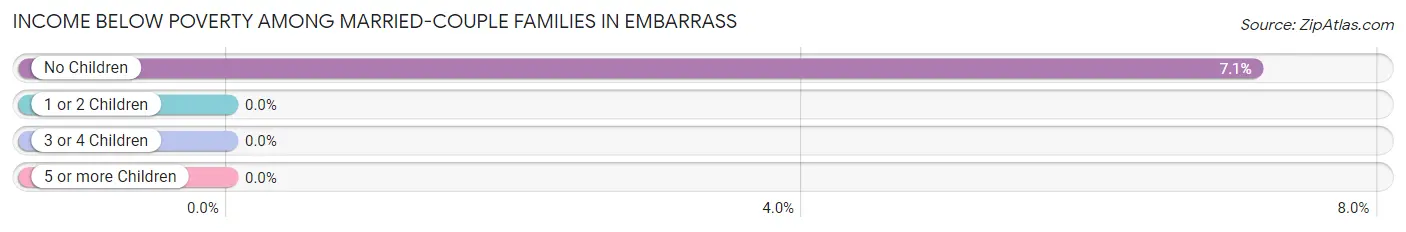
Income Below Poverty Among Married-Couple Families in Embarrass
The poverty statistics for married-couple families in Embarrass show that 5.0% or 3 of the total 60 families live below the poverty line. Families with no children have the highest poverty rate of 7.1%, comprising of 3 families. On the other hand, families with 1 or 2 children have the lowest poverty rate of 0.0%, which includes 0 families.
| Children | Above Poverty | Below Poverty |
| No Children | 39 (92.9%) | 3 (7.1%) |
| 1 or 2 Children | 12 (100.0%) | 0 (0.0%) |
| 3 or 4 Children | 6 (100.0%) | 0 (0.0%) |
| 5 or more Children | 0 (0.0%) | 0 (0.0%) |
| Total | 57 (95.0%) | 3 (5.0%) |
Income Below Poverty Among Single-Parent Households in Embarrass
According to the poverty data in Embarrass, 84.8% or 50 single-father households and 25.0% or 3 single-mother households are living below the poverty line. Among single-father households, those with 1 or 2 children have the highest poverty rate, with 50 households (98.0%) experiencing poverty. Likewise, among single-mother households, those with 1 or 2 children have the highest poverty rate, with 3 households (50.0%) falling below the poverty line.
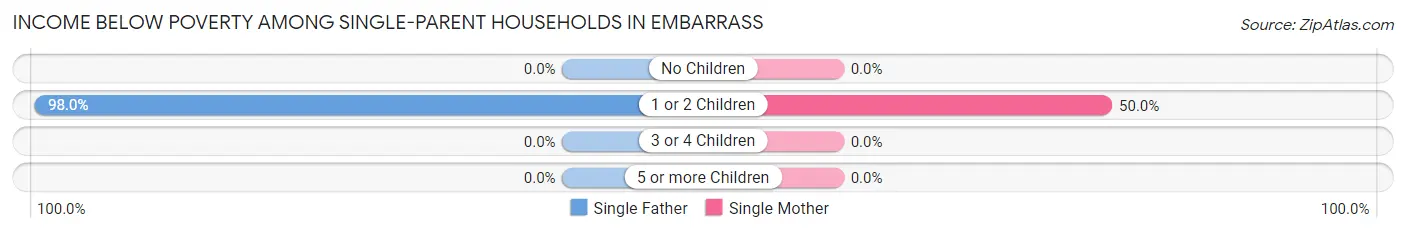
| Children | Single Father | Single Mother |
| No Children | 0 (0.0%) | 0 (0.0%) |
| 1 or 2 Children | 50 (98.0%) | 3 (50.0%) |
| 3 or 4 Children | 0 (0.0%) | 0 (0.0%) |
| 5 or more Children | 0 (0.0%) | 0 (0.0%) |
| Total | 50 (84.8%) | 3 (25.0%) |
Income Below Poverty Among Married-Couple vs Single-Parent Households in Embarrass
The poverty data for Embarrass shows that 3 of the married-couple family households (5.0%) and 53 of the single-parent households (74.7%) are living below the poverty level. Within the married-couple family households, those with no children have the highest poverty rate, with 3 households (7.1%) falling below the poverty line. Among the single-parent households, those with 1 or 2 children have the highest poverty rate, with 53 household (93.0%) living below poverty.
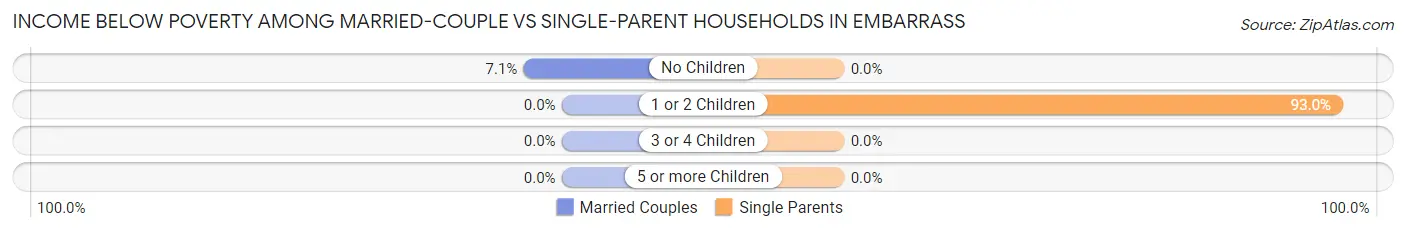
| Children | Married-Couple Families | Single-Parent Households |
| No Children | 3 (7.1%) | 0 (0.0%) |
| 1 or 2 Children | 0 (0.0%) | 53 (93.0%) |
| 3 or 4 Children | 0 (0.0%) | 0 (0.0%) |
| 5 or more Children | 0 (0.0%) | 0 (0.0%) |
| Total | 3 (5.0%) | 53 (74.7%) |
Race in Embarrass
The most populous races in Embarrass are White / Caucasian (496 | 98.0%), Two or more Races (8 | 1.6%), and Some other Race (2 | 0.4%).
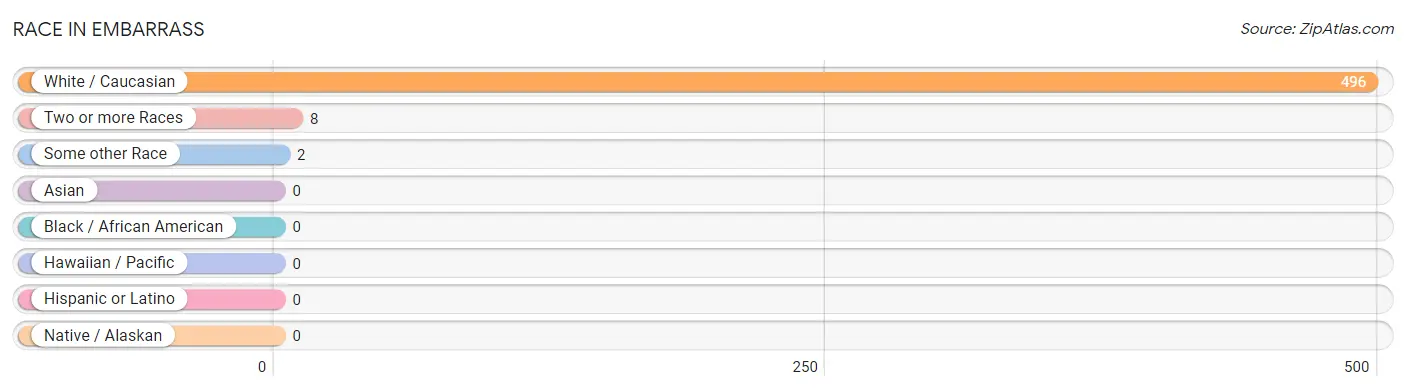
| Race | # Population | % Population |
| Asian | 0 | 0.0% |
| Black / African American | 0 | 0.0% |
| Hawaiian / Pacific | 0 | 0.0% |
| Hispanic or Latino | 0 | 0.0% |
| Native / Alaskan | 0 | 0.0% |
| White / Caucasian | 496 | 98.0% |
| Two or more Races | 8 | 1.6% |
| Some other Race | 2 | 0.4% |
| Total | 506 | 100.0% |
Ancestry in Embarrass
The most populous ancestries reported in Embarrass are German (196 | 38.7%), Irish (39 | 7.7%), Norwegian (37 | 7.3%), Polish (14 | 2.8%), and American (11 | 2.2%), together accounting for 58.7% of all Embarrass residents.
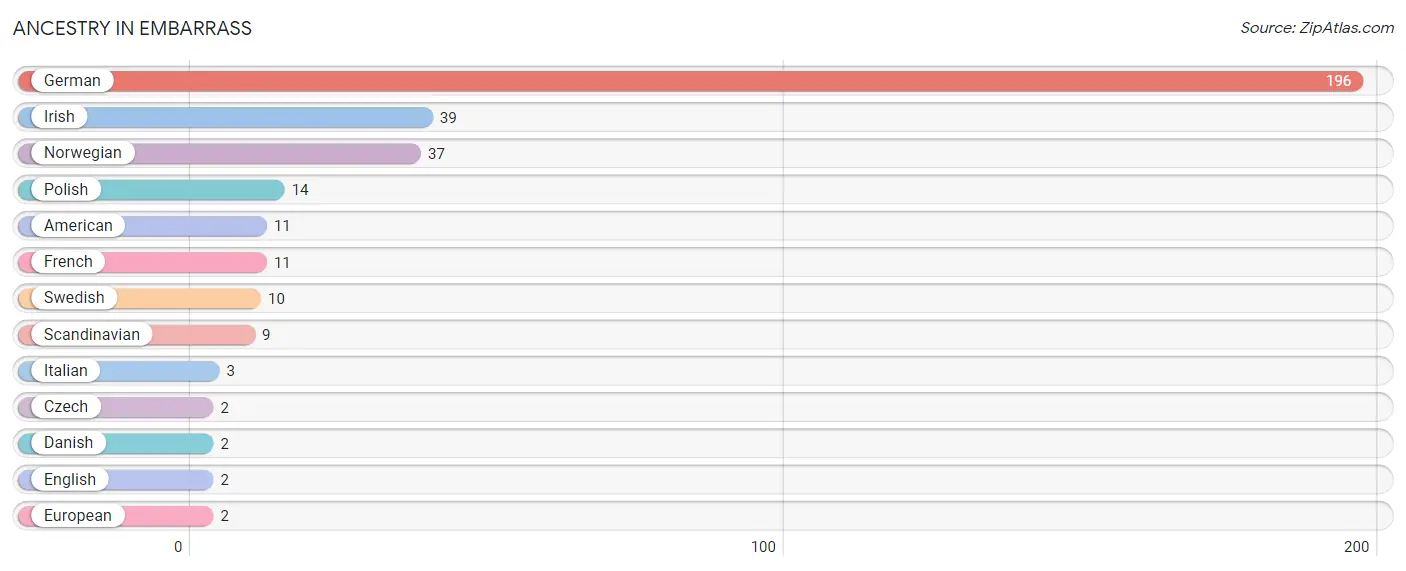
| Ancestry | # Population | % Population |
| American | 11 | 2.2% |
| Czech | 2 | 0.4% |
| Danish | 2 | 0.4% |
| English | 2 | 0.4% |
| European | 2 | 0.4% |
| French | 11 | 2.2% |
| German | 196 | 38.7% |
| Irish | 39 | 7.7% |
| Italian | 3 | 0.6% |
| Norwegian | 37 | 7.3% |
| Polish | 14 | 2.8% |
| Scandinavian | 9 | 1.8% |
| Swedish | 10 | 2.0% | View All 13 Rows |
Immigrants in Embarrass

| Immigration Origin | # Population | % Population | View All 0 Rows |
Sex and Age in Embarrass
Sex and Age in Embarrass
The most populous age groups in Embarrass are 40 to 44 Years (60 | 20.3%) for men and 5 to 9 Years (45 | 21.3%) for women.
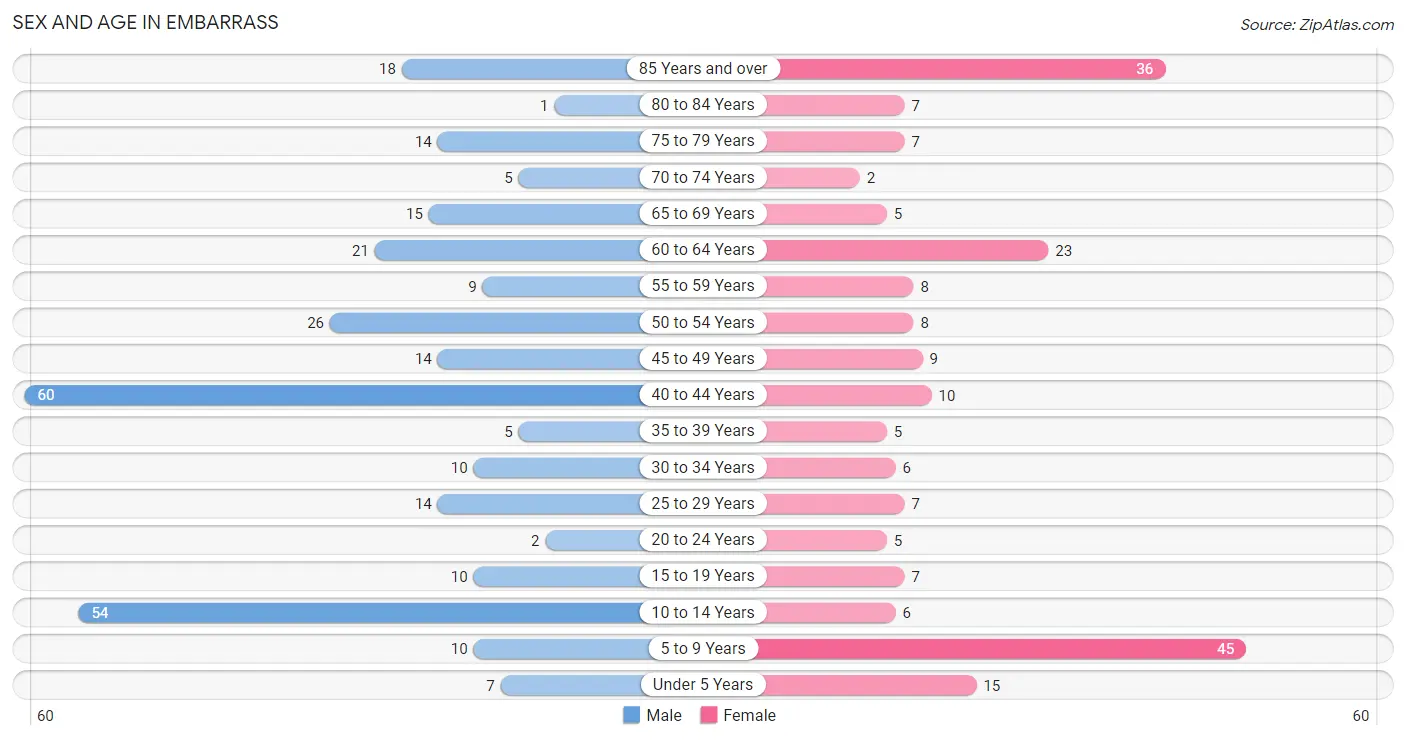
| Age Bracket | Male | Female |
| Under 5 Years | 7 (2.4%) | 15 (7.1%) |
| 5 to 9 Years | 10 (3.4%) | 45 (21.3%) |
| 10 to 14 Years | 54 (18.3%) | 6 (2.8%) |
| 15 to 19 Years | 10 (3.4%) | 7 (3.3%) |
| 20 to 24 Years | 2 (0.7%) | 5 (2.4%) |
| 25 to 29 Years | 14 (4.8%) | 7 (3.3%) |
| 30 to 34 Years | 10 (3.4%) | 6 (2.8%) |
| 35 to 39 Years | 5 (1.7%) | 5 (2.4%) |
| 40 to 44 Years | 60 (20.3%) | 10 (4.7%) |
| 45 to 49 Years | 14 (4.8%) | 9 (4.3%) |
| 50 to 54 Years | 26 (8.8%) | 8 (3.8%) |
| 55 to 59 Years | 9 (3.0%) | 8 (3.8%) |
| 60 to 64 Years | 21 (7.1%) | 23 (10.9%) |
| 65 to 69 Years | 15 (5.1%) | 5 (2.4%) |
| 70 to 74 Years | 5 (1.7%) | 2 (0.9%) |
| 75 to 79 Years | 14 (4.8%) | 7 (3.3%) |
| 80 to 84 Years | 1 (0.3%) | 7 (3.3%) |
| 85 Years and over | 18 (6.1%) | 36 (17.1%) |
| Total | 295 (100.0%) | 211 (100.0%) |
Families and Households in Embarrass
Median Family Size in Embarrass
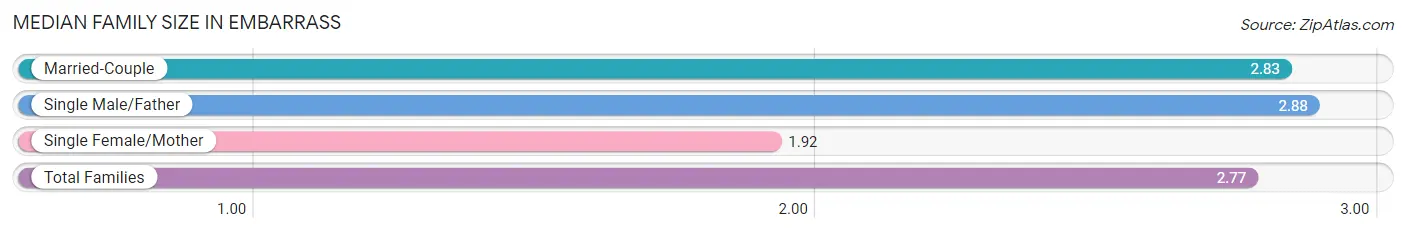
The median family size in Embarrass is 2.77 persons per family, with single male/father families (59 | 45.0%) accounting for the largest median family size of 2.88 persons per family. On the other hand, single female/mother families (12 | 9.2%) represent the smallest median family size with 1.92 persons per family.
| Family Type | # Families | Family Size |
| Married-Couple | 60 (45.8%) | 2.83 |
| Single Male/Father | 59 (45.0%) | 2.88 |
| Single Female/Mother | 12 (9.2%) | 1.92 |
| Total Families | 131 (100.0%) | 2.77 |
Median Household Size in Embarrass
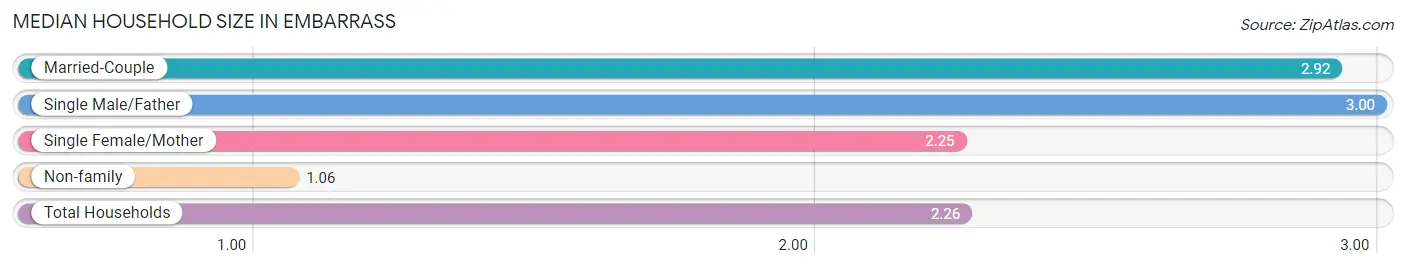
The median household size in Embarrass is 2.26 persons per household, with single male/father households (59 | 29.5%) accounting for the largest median household size of 3 persons per household. non-family households (69 | 34.5%) represent the smallest median household size with 1.06 persons per household.
| Household Type | # Households | Household Size |
| Married-Couple | 60 (30.0%) | 2.92 |
| Single Male/Father | 59 (29.5%) | 3.00 |
| Single Female/Mother | 12 (6.0%) | 2.25 |
| Non-family | 69 (34.5%) | 1.06 |
| Total Households | 200 (100.0%) | 2.26 |
Household Size by Marriage Status in Embarrass
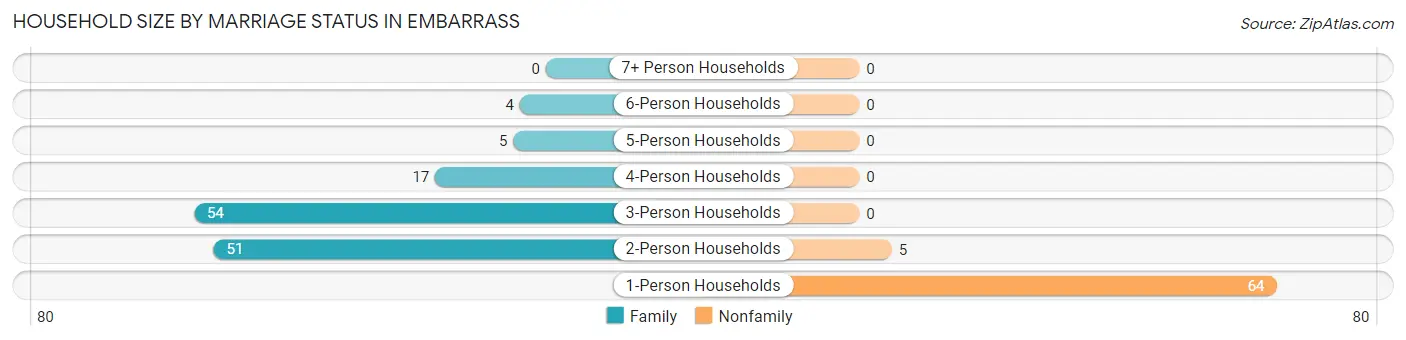
Out of a total of 200 households in Embarrass, 131 (65.5%) are family households, while 69 (34.5%) are nonfamily households. The most numerous type of family households are 3-person households, comprising 54, and the most common type of nonfamily households are 1-person households, comprising 64.
| Household Size | Family Households | Nonfamily Households |
| 1-Person Households | - | 64 (32.0%) |
| 2-Person Households | 51 (25.5%) | 5 (2.5%) |
| 3-Person Households | 54 (27.0%) | 0 (0.0%) |
| 4-Person Households | 17 (8.5%) | 0 (0.0%) |
| 5-Person Households | 5 (2.5%) | 0 (0.0%) |
| 6-Person Households | 4 (2.0%) | 0 (0.0%) |
| 7+ Person Households | 0 (0.0%) | 0 (0.0%) |
| Total | 131 (65.5%) | 69 (34.5%) |
Female Fertility in Embarrass
Fertility by Age in Embarrass
Average fertility rate in Embarrass is 96.0 births per 1,000 women. Women in the age bracket of 20 to 34 years have the highest fertility rate with 222.0 births per 1,000 women. Women in the age bracket of 20 to 34 years acount for 80.0% of all women with births.
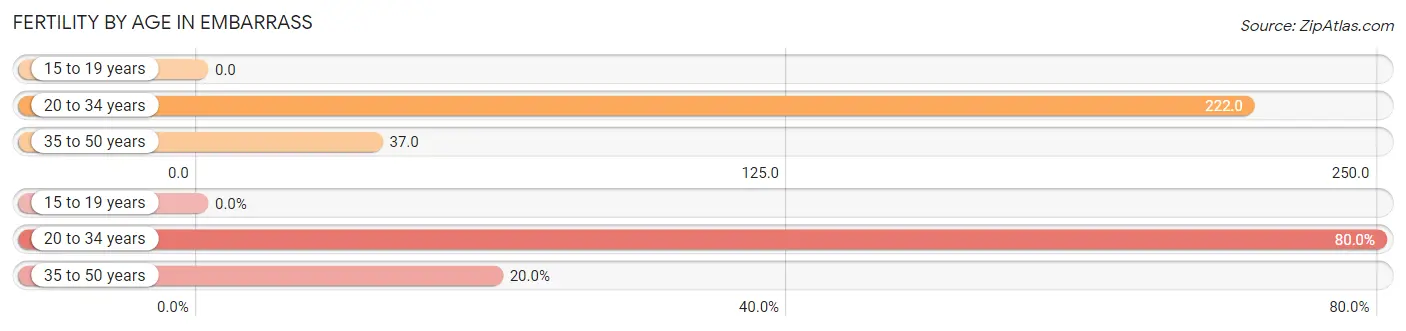
| Age Bracket | Women with Births | Births / 1,000 Women |
| 15 to 19 years | 0 (0.0%) | 0.0 |
| 20 to 34 years | 4 (80.0%) | 222.0 |
| 35 to 50 years | 1 (20.0%) | 37.0 |
| Total | 5 (100.0%) | 96.0 |
Fertility by Age by Marriage Status in Embarrass
40.0% of women with births (5) in Embarrass are married. The highest percentage of unmarried women with births falls into 20 to 34 years age bracket with 75.0% of them unmarried at the time of birth, while the lowest percentage of unmarried women with births belong to 35 to 50 years age bracket with 0.0% of them unmarried.
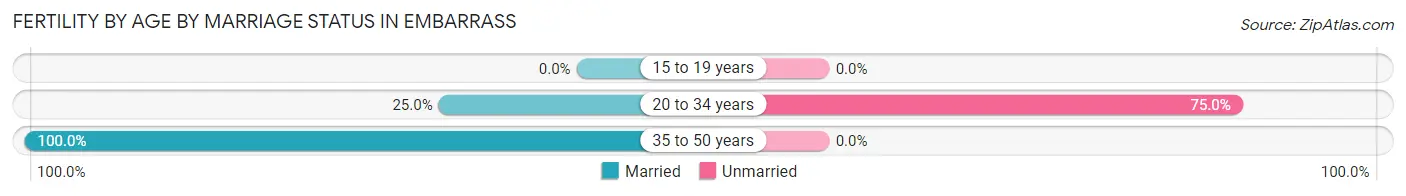
| Age Bracket | Married | Unmarried |
| 15 to 19 years | 0 (0.0%) | 0 (0.0%) |
| 20 to 34 years | 1 (25.0%) | 3 (75.0%) |
| 35 to 50 years | 1 (100.0%) | 0 (0.0%) |
| Total | 2 (40.0%) | 3 (60.0%) |
Fertility by Education in Embarrass
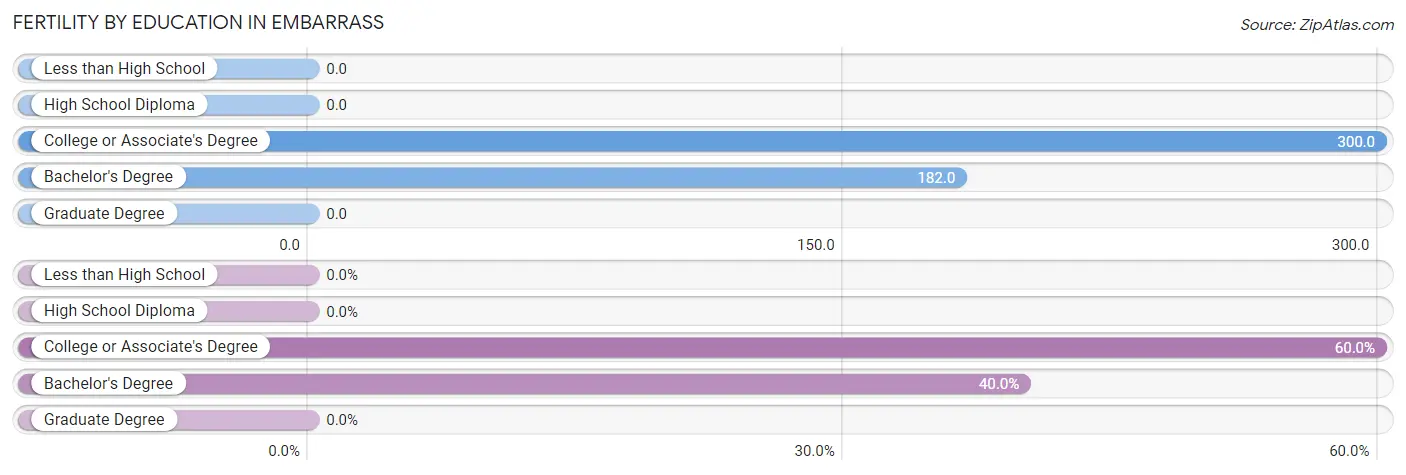
| Educational Attainment | Women with Births | Births / 1,000 Women |
| Less than High School | 0 (0.0%) | 0.0 |
| High School Diploma | 0 (0.0%) | 0.0 |
| College or Associate's Degree | 3 (60.0%) | 300.0 |
| Bachelor's Degree | 2 (40.0%) | 182.0 |
| Graduate Degree | 0 (0.0%) | 0.0 |
| Total | 5 (100.0%) | 96.0 |
Fertility by Education by Marriage Status in Embarrass
60.0% of women with births in Embarrass are unmarried. Women with the educational attainment of bachelor's degree are most likely to be married with 100.0% of them married at childbirth, while women with the educational attainment of college or associate's degree are least likely to be married with 100.0% of them unmarried at childbirth.
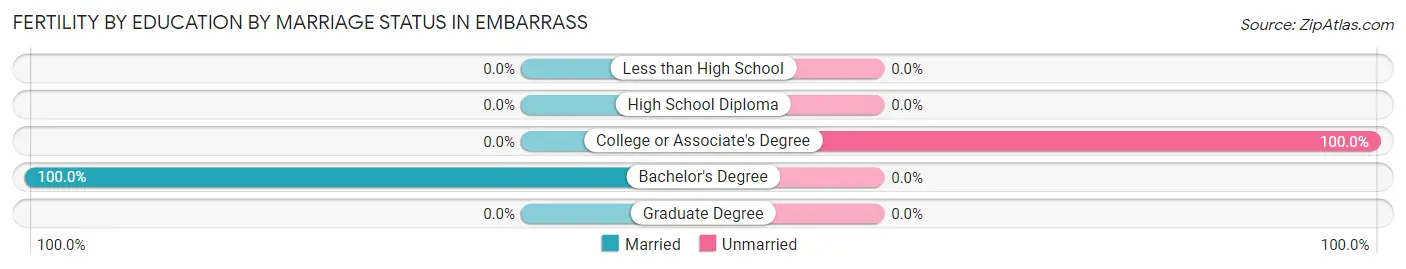
| Educational Attainment | Married | Unmarried |
| Less than High School | 0 (0.0%) | 0 (0.0%) |
| High School Diploma | 0 (0.0%) | 0 (0.0%) |
| College or Associate's Degree | 0 (0.0%) | 3 (100.0%) |
| Bachelor's Degree | 2 (100.0%) | 0 (0.0%) |
| Graduate Degree | 0 (0.0%) | 0 (0.0%) |
| Total | 2 (40.0%) | 3 (60.0%) |
Employment Characteristics in Embarrass
Employment by Class of Employer in Embarrass
Among the 157 employed individuals in Embarrass, private company employees (114 | 72.6%), local government employees (19 | 12.1%), and state government employees (9 | 5.7%) make up the most common classes of employment.
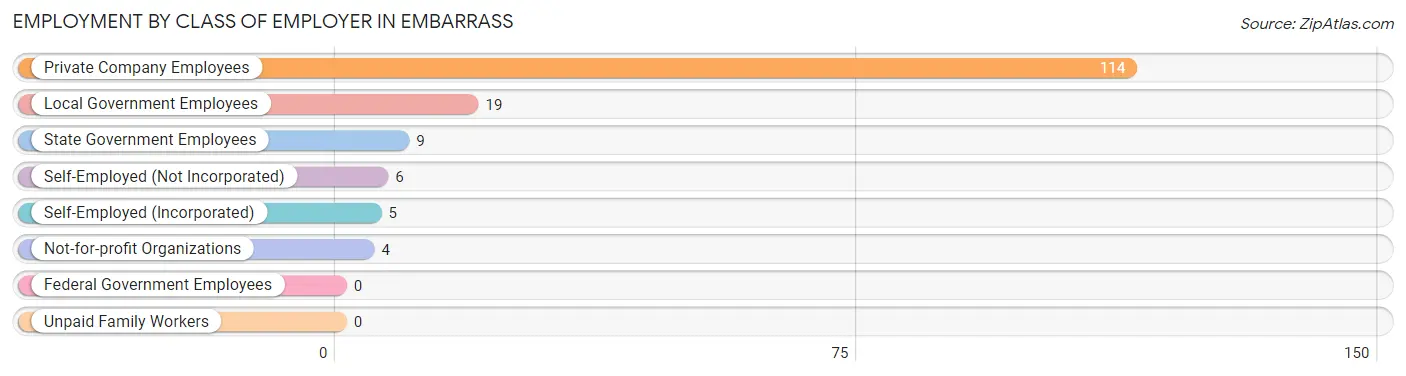
| Employer Class | # Employees | % Employees |
| Private Company Employees | 114 | 72.6% |
| Self-Employed (Incorporated) | 5 | 3.2% |
| Self-Employed (Not Incorporated) | 6 | 3.8% |
| Not-for-profit Organizations | 4 | 2.5% |
| Local Government Employees | 19 | 12.1% |
| State Government Employees | 9 | 5.7% |
| Federal Government Employees | 0 | 0.0% |
| Unpaid Family Workers | 0 | 0.0% |
| Total | 157 | 100.0% |
Employment Status by Age in Embarrass
According to the labor force statistics for Embarrass, out of the total population over 16 years of age (367), 44.4% or 163 individuals are in the labor force, with 1.2% or 2 of them unemployed. The age group with the highest labor force participation rate is 20 to 24 years, with 100.0% or 7 individuals in the labor force. Within the labor force, the 16 to 19 years age range has the highest percentage of unemployed individuals, with 22.2% or 2 of them being unemployed.
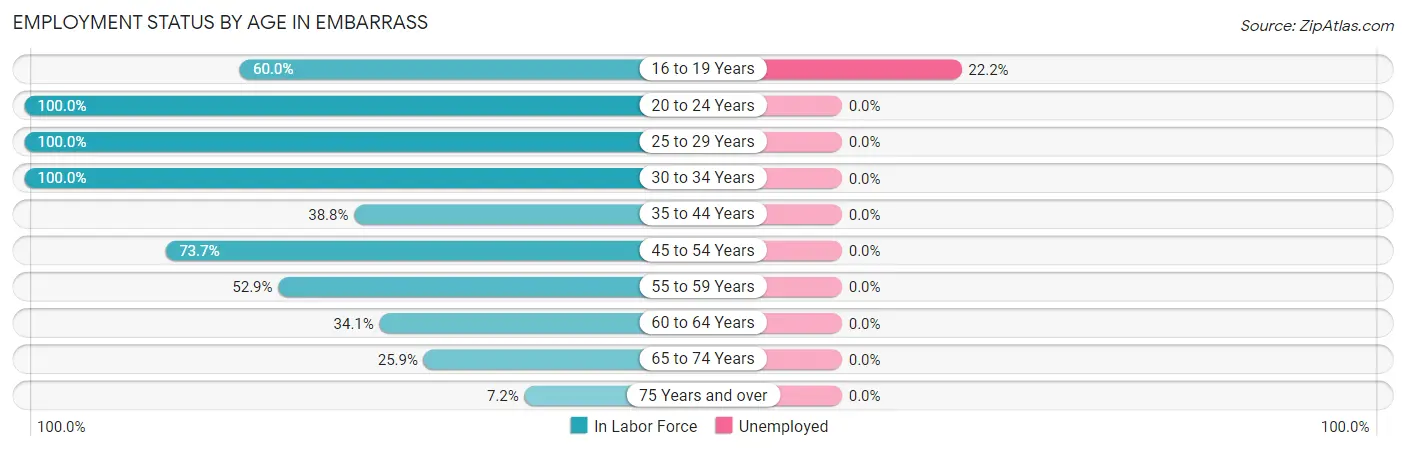
| Age Bracket | In Labor Force | Unemployed |
| 16 to 19 Years | 9 (60.0%) | 2 (22.2%) |
| 20 to 24 Years | 7 (100.0%) | 0 (0.0%) |
| 25 to 29 Years | 21 (100.0%) | 0 (0.0%) |
| 30 to 34 Years | 16 (100.0%) | 0 (0.0%) |
| 35 to 44 Years | 31 (38.8%) | 0 (0.0%) |
| 45 to 54 Years | 42 (73.7%) | 0 (0.0%) |
| 55 to 59 Years | 9 (52.9%) | 0 (0.0%) |
| 60 to 64 Years | 15 (34.1%) | 0 (0.0%) |
| 65 to 74 Years | 7 (25.9%) | 0 (0.0%) |
| 75 Years and over | 6 (7.2%) | 0 (0.0%) |
| Total | 163 (44.4%) | 2 (1.2%) |
Employment Status by Educational Attainment in Embarrass
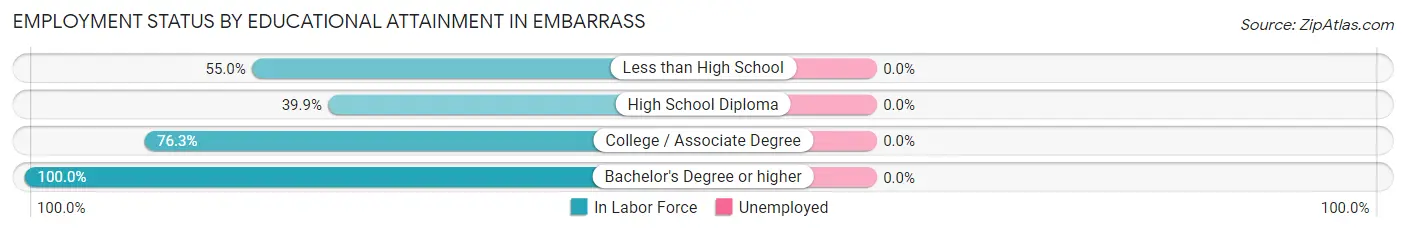
| Educational Attainment | In Labor Force | Unemployed |
| Less than High School | 11 (55.0%) | 0 (0.0%) |
| High School Diploma | 55 (39.9%) | 0 (0.0%) |
| College / Associate Degree | 29 (76.3%) | 0 (0.0%) |
| Bachelor's Degree or higher | 39 (100.0%) | 0 (0.0%) |
| Total | 134 (57.0%) | 0 (0.0%) |
Employment Occupations by Sex in Embarrass
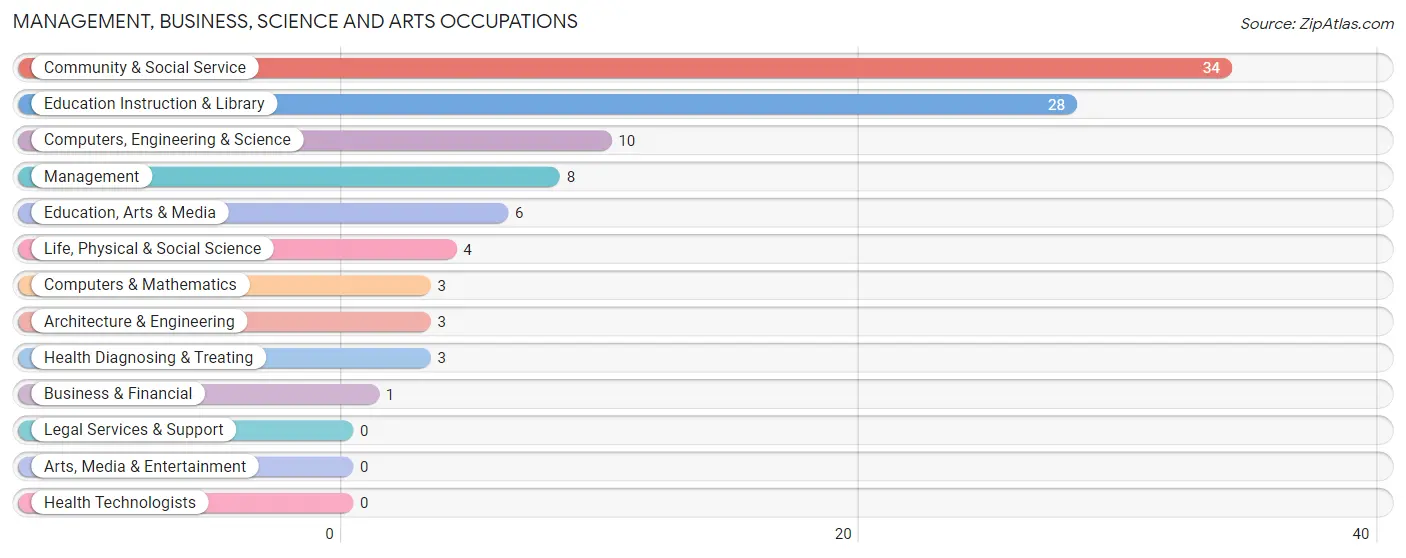
Management, Business, Science and Arts Occupations
The most common Management, Business, Science and Arts occupations in Embarrass are Community & Social Service (34 | 21.1%), Education Instruction & Library (28 | 17.4%), Computers, Engineering & Science (10 | 6.2%), Management (8 | 5.0%), and Education, Arts & Media (6 | 3.7%).
Management, Business, Science and Arts Occupations by Sex
Within the Management, Business, Science and Arts occupations in Embarrass, the most male-oriented occupations are Management (100.0%), Computers & Mathematics (100.0%), and Architecture & Engineering (100.0%), while the most female-oriented occupations are Business & Financial (100.0%), Life, Physical & Social Science (100.0%), and Health Diagnosing & Treating (100.0%).
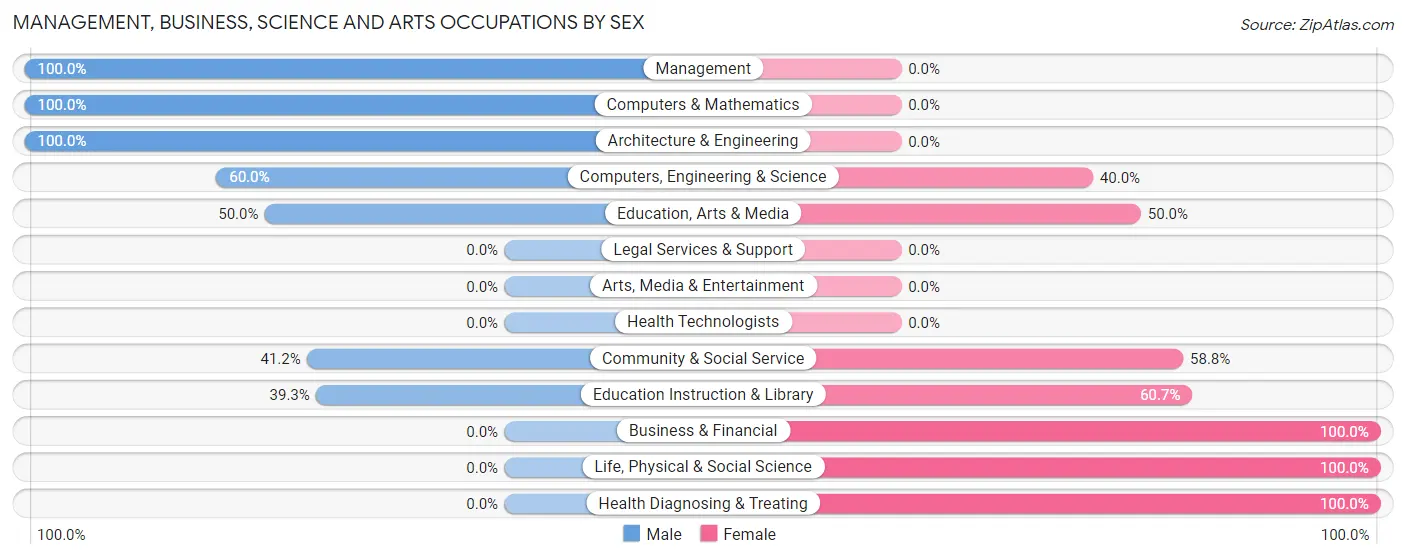
| Occupation | Male | Female |
| Management | 8 (100.0%) | 0 (0.0%) |
| Business & Financial | 0 (0.0%) | 1 (100.0%) |
| Computers, Engineering & Science | 6 (60.0%) | 4 (40.0%) |
| Computers & Mathematics | 3 (100.0%) | 0 (0.0%) |
| Architecture & Engineering | 3 (100.0%) | 0 (0.0%) |
| Life, Physical & Social Science | 0 (0.0%) | 4 (100.0%) |
| Community & Social Service | 14 (41.2%) | 20 (58.8%) |
| Education, Arts & Media | 3 (50.0%) | 3 (50.0%) |
| Legal Services & Support | 0 (0.0%) | 0 (0.0%) |
| Education Instruction & Library | 11 (39.3%) | 17 (60.7%) |
| Arts, Media & Entertainment | 0 (0.0%) | 0 (0.0%) |
| Health Diagnosing & Treating | 0 (0.0%) | 3 (100.0%) |
| Health Technologists | 0 (0.0%) | 0 (0.0%) |
| Total (Category) | 28 (50.0%) | 28 (50.0%) |
| Total (Overall) | 103 (64.0%) | 58 (36.0%) |
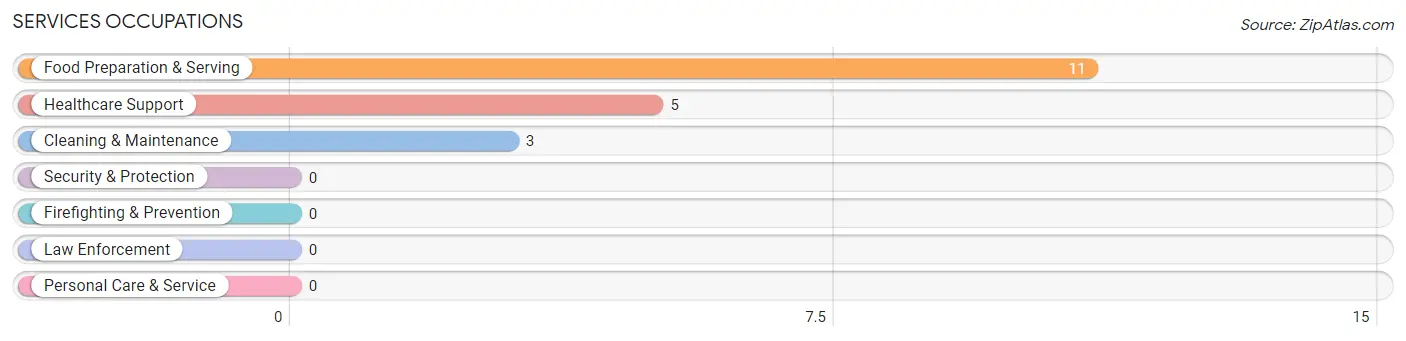
Services Occupations
The most common Services occupations in Embarrass are Food Preparation & Serving (11 | 6.8%), Healthcare Support (5 | 3.1%), and Cleaning & Maintenance (3 | 1.9%).
Services Occupations by Sex
Within the Services occupations in Embarrass, the most male-oriented occupations are Food Preparation & Serving (54.5%), and Cleaning & Maintenance (33.3%), while the most female-oriented occupations are Healthcare Support (100.0%), Cleaning & Maintenance (66.7%), and Food Preparation & Serving (45.5%).
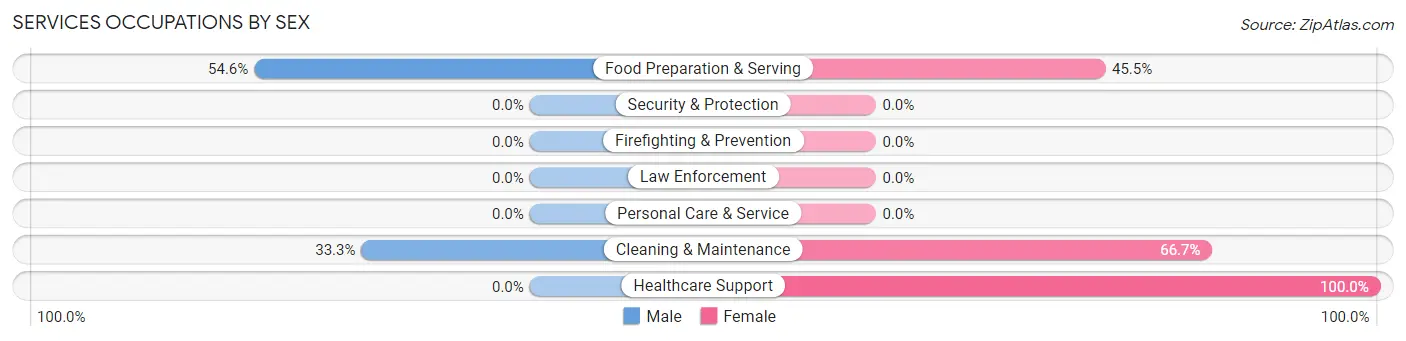
| Occupation | Male | Female |
| Healthcare Support | 0 (0.0%) | 5 (100.0%) |
| Security & Protection | 0 (0.0%) | 0 (0.0%) |
| Firefighting & Prevention | 0 (0.0%) | 0 (0.0%) |
| Law Enforcement | 0 (0.0%) | 0 (0.0%) |
| Food Preparation & Serving | 6 (54.5%) | 5 (45.5%) |
| Cleaning & Maintenance | 1 (33.3%) | 2 (66.7%) |
| Personal Care & Service | 0 (0.0%) | 0 (0.0%) |
| Total (Category) | 7 (36.8%) | 12 (63.2%) |
| Total (Overall) | 103 (64.0%) | 58 (36.0%) |
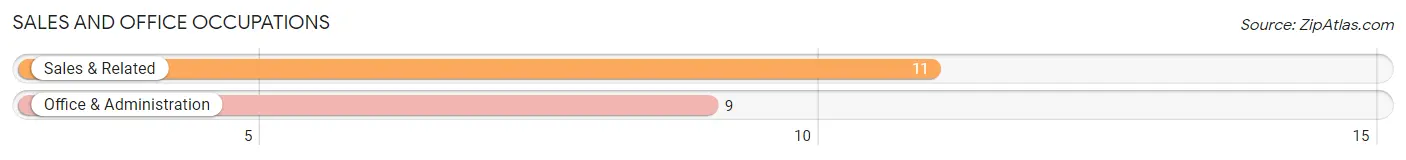
Sales and Office Occupations
The most common Sales and Office occupations in Embarrass are Sales & Related (11 | 6.8%), and Office & Administration (9 | 5.6%).
Sales and Office Occupations by Sex
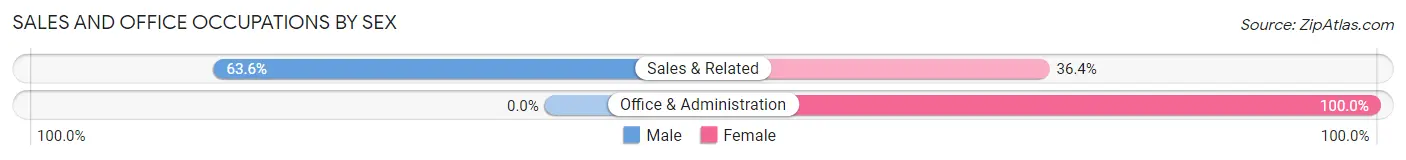
| Occupation | Male | Female |
| Sales & Related | 7 (63.6%) | 4 (36.4%) |
| Office & Administration | 0 (0.0%) | 9 (100.0%) |
| Total (Category) | 7 (35.0%) | 13 (65.0%) |
| Total (Overall) | 103 (64.0%) | 58 (36.0%) |
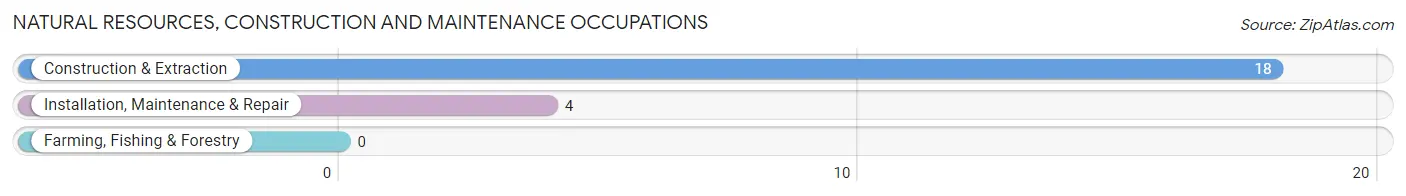
Natural Resources, Construction and Maintenance Occupations
The most common Natural Resources, Construction and Maintenance occupations in Embarrass are Construction & Extraction (18 | 11.2%), and Installation, Maintenance & Repair (4 | 2.5%).
Natural Resources, Construction and Maintenance Occupations by Sex
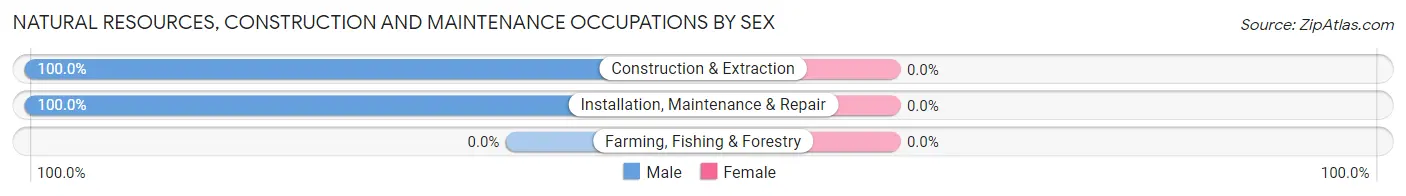
| Occupation | Male | Female |
| Farming, Fishing & Forestry | 0 (0.0%) | 0 (0.0%) |
| Construction & Extraction | 18 (100.0%) | 0 (0.0%) |
| Installation, Maintenance & Repair | 4 (100.0%) | 0 (0.0%) |
| Total (Category) | 22 (100.0%) | 0 (0.0%) |
| Total (Overall) | 103 (64.0%) | 58 (36.0%) |
Production, Transportation and Moving Occupations
The most common Production, Transportation and Moving occupations in Embarrass are Production (20 | 12.4%), Transportation (14 | 8.7%), and Material Moving (10 | 6.2%).
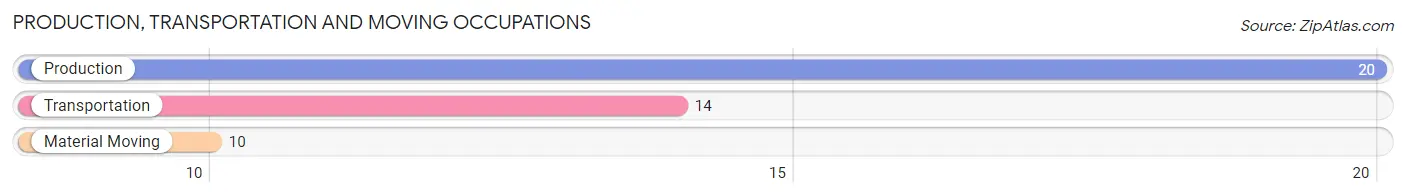
Production, Transportation and Moving Occupations by Sex
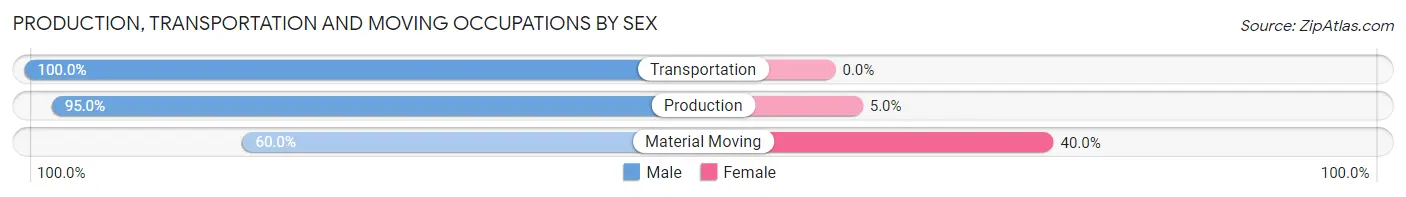
| Occupation | Male | Female |
| Production | 19 (95.0%) | 1 (5.0%) |
| Transportation | 14 (100.0%) | 0 (0.0%) |
| Material Moving | 6 (60.0%) | 4 (40.0%) |
| Total (Category) | 39 (88.6%) | 5 (11.4%) |
| Total (Overall) | 103 (64.0%) | 58 (36.0%) |
Employment Industries by Sex in Embarrass
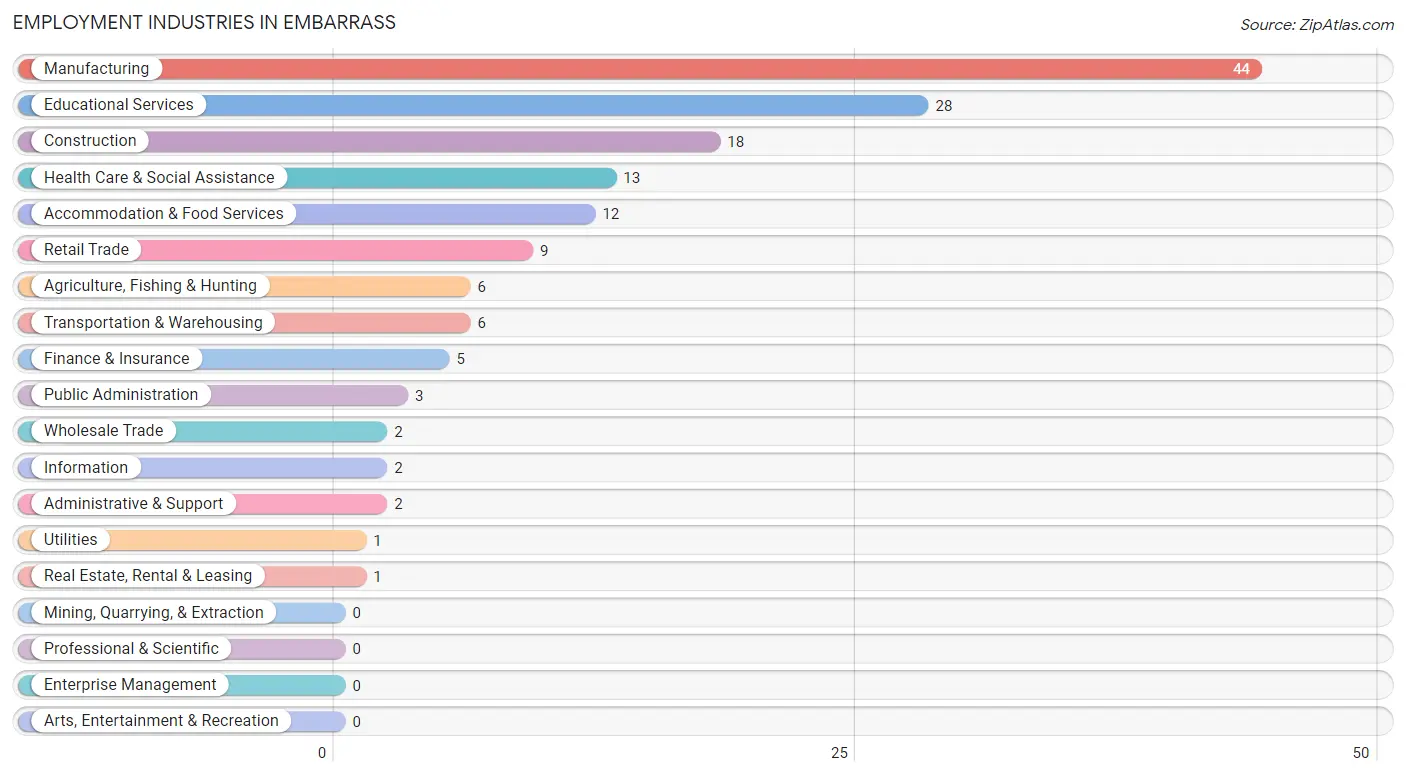
Employment Industries in Embarrass
The major employment industries in Embarrass include Manufacturing (44 | 27.3%), Educational Services (28 | 17.4%), Construction (18 | 11.2%), Health Care & Social Assistance (13 | 8.1%), and Accommodation & Food Services (12 | 7.4%).
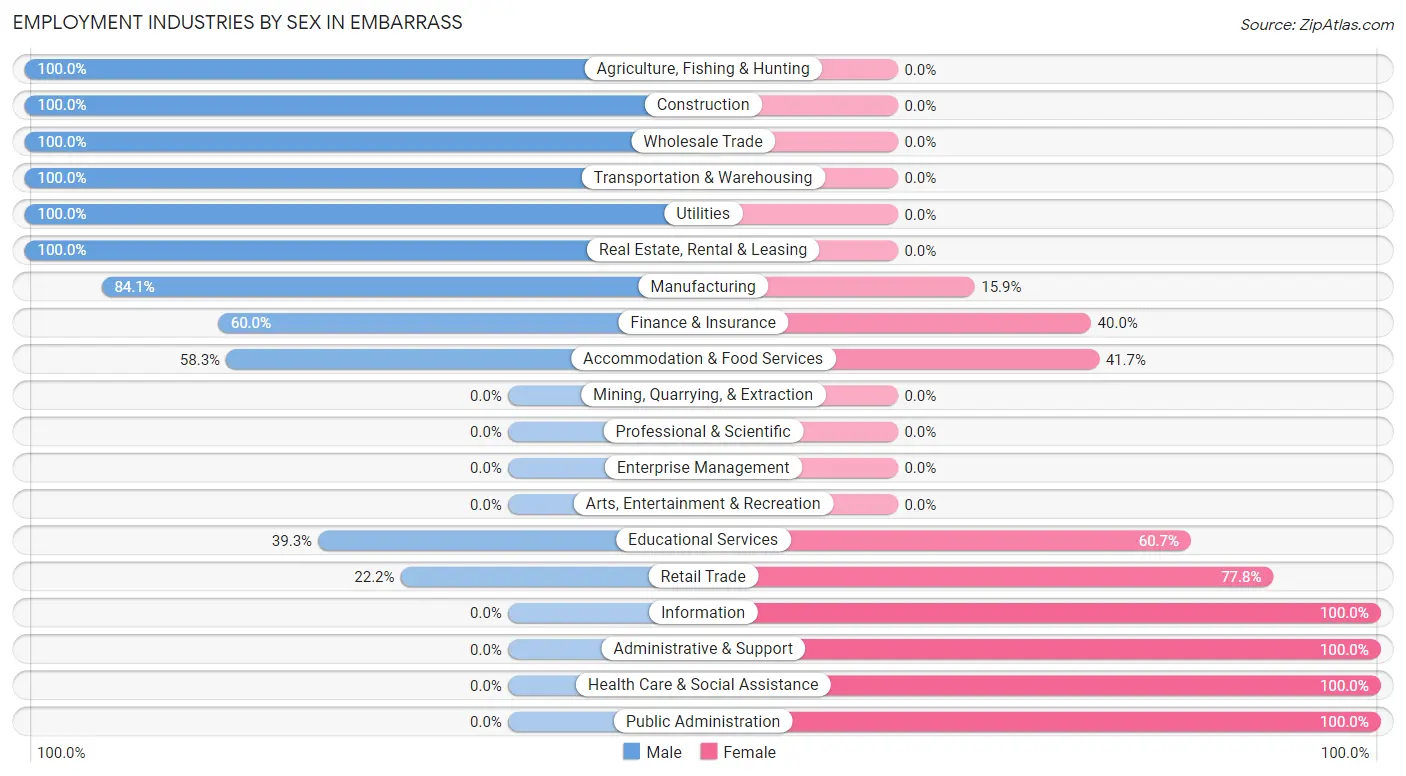
Employment Industries by Sex in Embarrass
The Embarrass industries that see more men than women are Agriculture, Fishing & Hunting (100.0%), Construction (100.0%), and Wholesale Trade (100.0%), whereas the industries that tend to have a higher number of women are Information (100.0%), Administrative & Support (100.0%), and Health Care & Social Assistance (100.0%).
| Industry | Male | Female |
| Agriculture, Fishing & Hunting | 6 (100.0%) | 0 (0.0%) |
| Mining, Quarrying, & Extraction | 0 (0.0%) | 0 (0.0%) |
| Construction | 18 (100.0%) | 0 (0.0%) |
| Manufacturing | 37 (84.1%) | 7 (15.9%) |
| Wholesale Trade | 2 (100.0%) | 0 (0.0%) |
| Retail Trade | 2 (22.2%) | 7 (77.8%) |
| Transportation & Warehousing | 6 (100.0%) | 0 (0.0%) |
| Utilities | 1 (100.0%) | 0 (0.0%) |
| Information | 0 (0.0%) | 2 (100.0%) |
| Finance & Insurance | 3 (60.0%) | 2 (40.0%) |
| Real Estate, Rental & Leasing | 1 (100.0%) | 0 (0.0%) |
| Professional & Scientific | 0 (0.0%) | 0 (0.0%) |
| Enterprise Management | 0 (0.0%) | 0 (0.0%) |
| Administrative & Support | 0 (0.0%) | 2 (100.0%) |
| Educational Services | 11 (39.3%) | 17 (60.7%) |
| Health Care & Social Assistance | 0 (0.0%) | 13 (100.0%) |
| Arts, Entertainment & Recreation | 0 (0.0%) | 0 (0.0%) |
| Accommodation & Food Services | 7 (58.3%) | 5 (41.7%) |
| Public Administration | 0 (0.0%) | 3 (100.0%) |
| Total | 103 (64.0%) | 58 (36.0%) |
Education in Embarrass
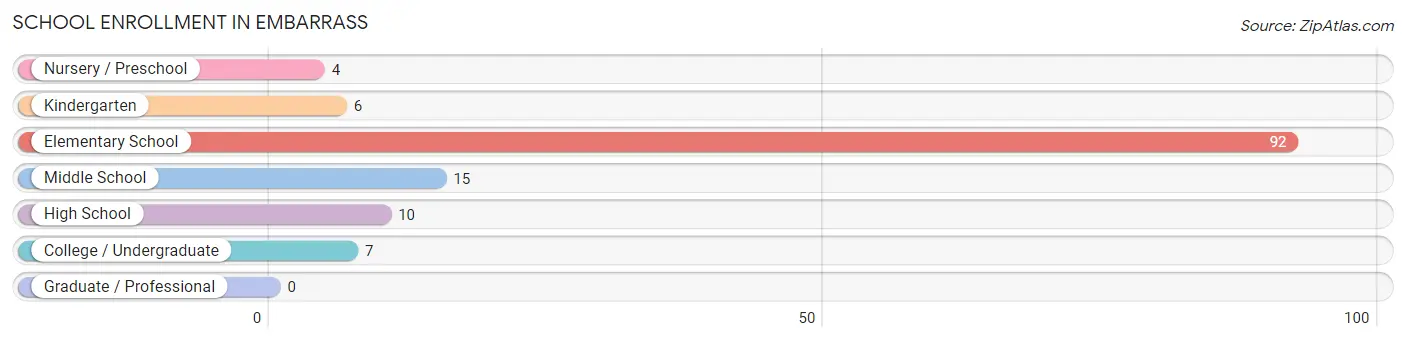
School Enrollment in Embarrass
The most common levels of schooling among the 134 students in Embarrass are elementary school (92 | 68.7%), middle school (15 | 11.2%), and high school (10 | 7.5%).
| School Level | # Students | % Students |
| Nursery / Preschool | 4 | 3.0% |
| Kindergarten | 6 | 4.5% |
| Elementary School | 92 | 68.7% |
| Middle School | 15 | 11.2% |
| High School | 10 | 7.5% |
| College / Undergraduate | 7 | 5.2% |
| Graduate / Professional | 0 | 0.0% |
| Total | 134 | 100.0% |
School Enrollment by Age by Funding Source in Embarrass
Out of a total of 134 students who are enrolled in schools in Embarrass, 7 (5.2%) attend a private institution, while the remaining 127 (94.8%) are enrolled in public schools. The age group of 3 to 4 year olds has the highest likelihood of being enrolled in private schools, with 3 (100.0% in the age bracket) enrolled. Conversely, the age group of 15 to 17 year olds has the lowest likelihood of being enrolled in a private school, with 8 (100.0% in the age bracket) attending a public institution.
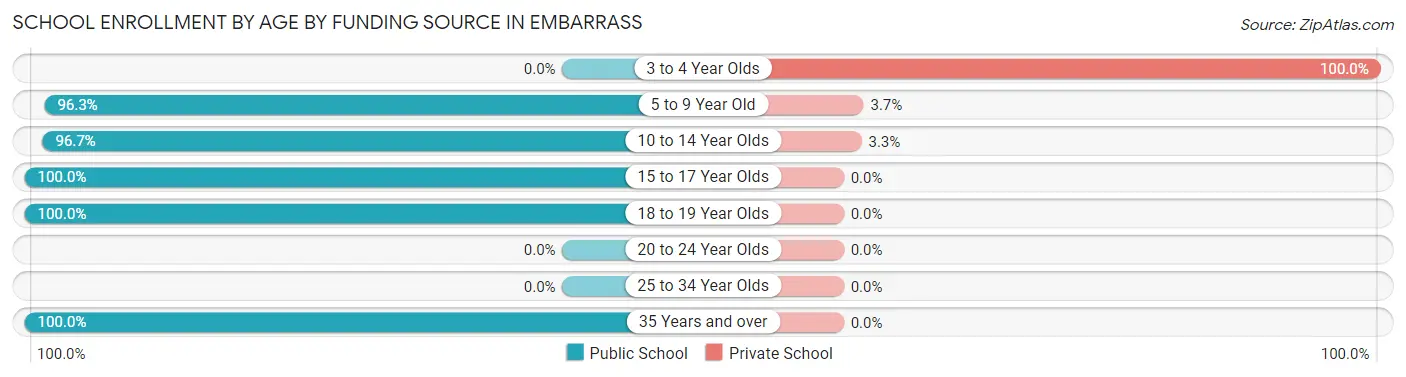
| Age Bracket | Public School | Private School |
| 3 to 4 Year Olds | 0 (0.0%) | 3 (100.0%) |
| 5 to 9 Year Old | 52 (96.3%) | 2 (3.7%) |
| 10 to 14 Year Olds | 58 (96.7%) | 2 (3.3%) |
| 15 to 17 Year Olds | 8 (100.0%) | 0 (0.0%) |
| 18 to 19 Year Olds | 4 (100.0%) | 0 (0.0%) |
| 20 to 24 Year Olds | 0 (0.0%) | 0 (0.0%) |
| 25 to 34 Year Olds | 0 (0.0%) | 0 (0.0%) |
| 35 Years and over | 5 (100.0%) | 0 (0.0%) |
| Total | 127 (94.8%) | 7 (5.2%) |
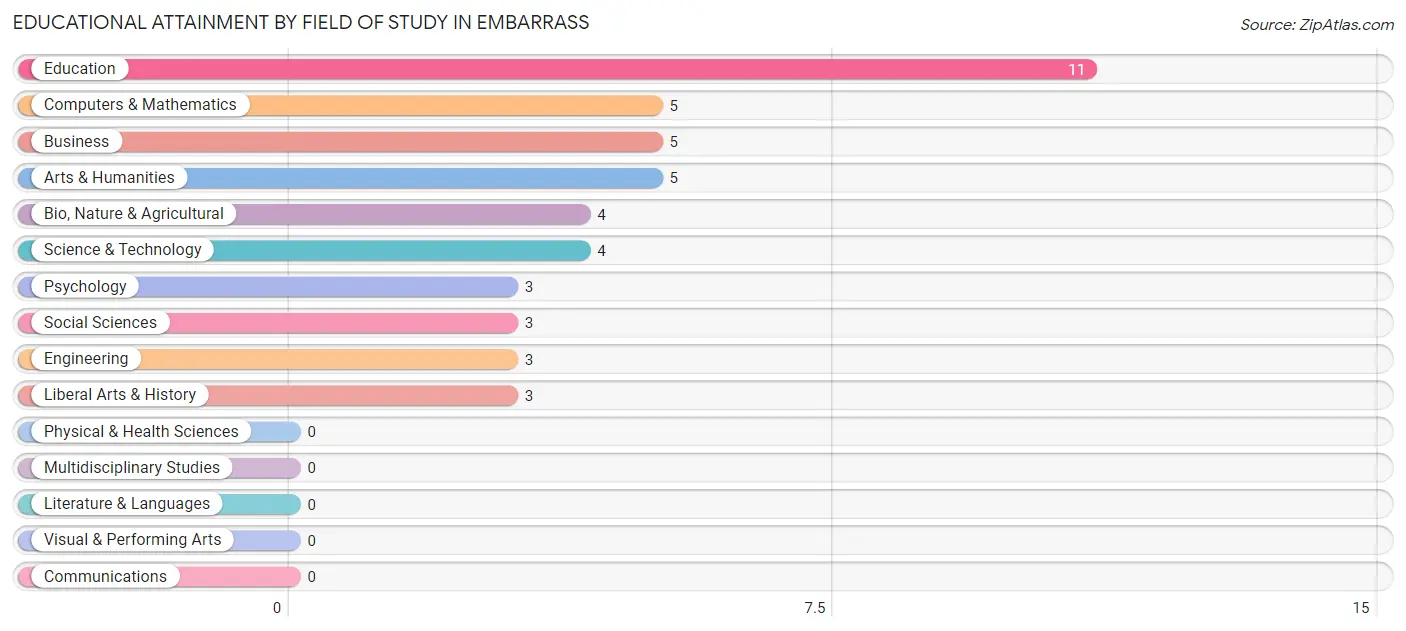
Educational Attainment by Field of Study in Embarrass
Education (11 | 23.9%), computers & mathematics (5 | 10.9%), business (5 | 10.9%), arts & humanities (5 | 10.9%), and bio, nature & agricultural (4 | 8.7%) are the most common fields of study among 46 individuals in Embarrass who have obtained a bachelor's degree or higher.
| Field of Study | # Graduates | % Graduates |
| Computers & Mathematics | 5 | 10.9% |
| Bio, Nature & Agricultural | 4 | 8.7% |
| Physical & Health Sciences | 0 | 0.0% |
| Psychology | 3 | 6.5% |
| Social Sciences | 3 | 6.5% |
| Engineering | 3 | 6.5% |
| Multidisciplinary Studies | 0 | 0.0% |
| Science & Technology | 4 | 8.7% |
| Business | 5 | 10.9% |
| Education | 11 | 23.9% |
| Literature & Languages | 0 | 0.0% |
| Liberal Arts & History | 3 | 6.5% |
| Visual & Performing Arts | 0 | 0.0% |
| Communications | 0 | 0.0% |
| Arts & Humanities | 5 | 10.9% |
| Total | 46 | 100.0% |
Transportation & Commute in Embarrass
Vehicle Availability by Sex in Embarrass
The most prevalent vehicle ownership categories in Embarrass are males with 2 vehicles (34, accounting for 33.7%) and females with 2 vehicles (21, making up 60.7%).
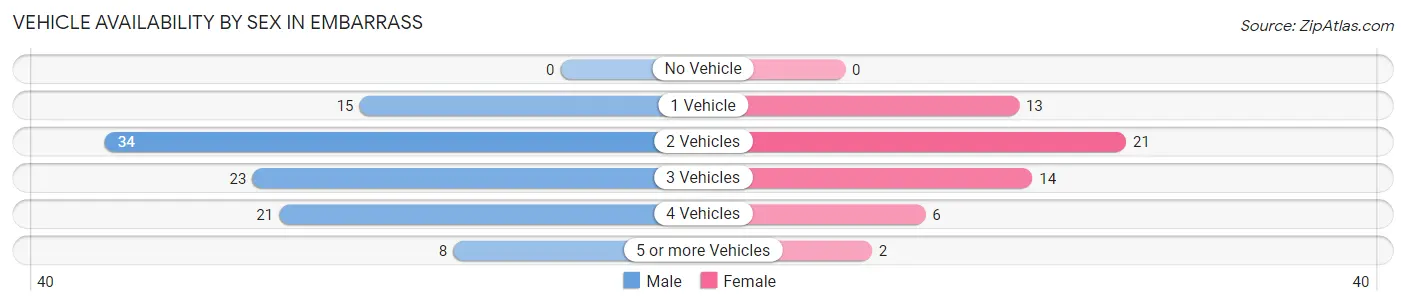
| Vehicles Available | Male | Female |
| No Vehicle | 0 (0.0%) | 0 (0.0%) |
| 1 Vehicle | 15 (14.8%) | 13 (23.2%) |
| 2 Vehicles | 34 (33.7%) | 21 (37.5%) |
| 3 Vehicles | 23 (22.8%) | 14 (25.0%) |
| 4 Vehicles | 21 (20.8%) | 6 (10.7%) |
| 5 or more Vehicles | 8 (7.9%) | 2 (3.6%) |
| Total | 101 (100.0%) | 56 (100.0%) |
Commute Time in Embarrass
The most frequently occuring commute durations in Embarrass are 5 to 9 minutes (41 commuters, 27.0%), 45 to 59 minutes (26 commuters, 17.1%), and 10 to 14 minutes (22 commuters, 14.5%).
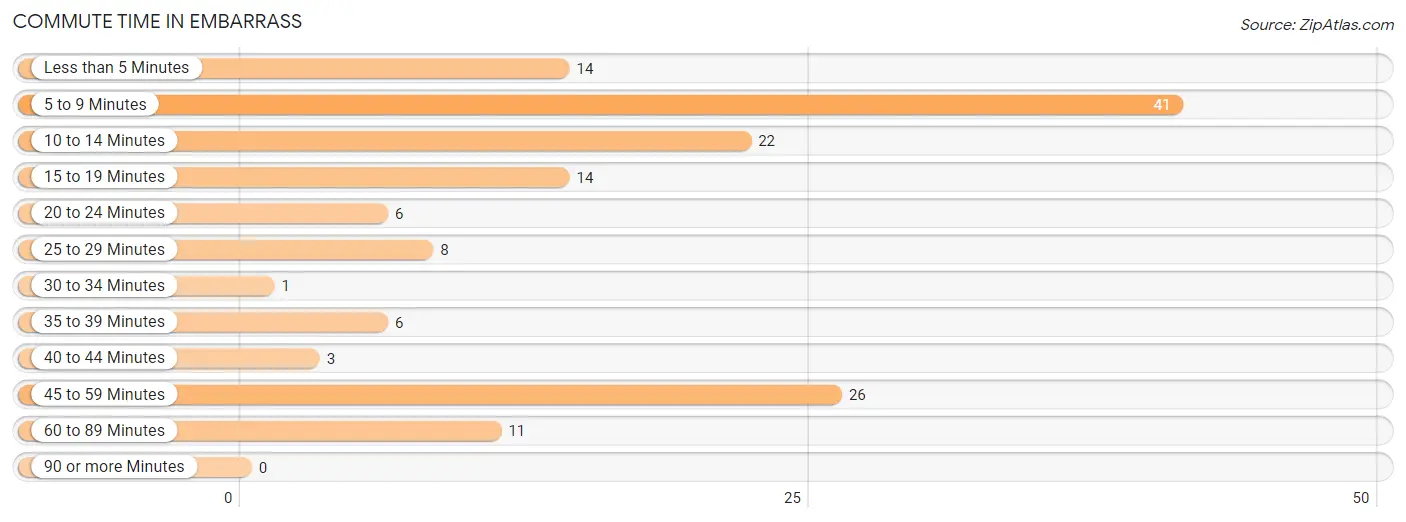
| Commute Time | # Commuters | % Commuters |
| Less than 5 Minutes | 14 | 9.2% |
| 5 to 9 Minutes | 41 | 27.0% |
| 10 to 14 Minutes | 22 | 14.5% |
| 15 to 19 Minutes | 14 | 9.2% |
| 20 to 24 Minutes | 6 | 4.0% |
| 25 to 29 Minutes | 8 | 5.3% |
| 30 to 34 Minutes | 1 | 0.7% |
| 35 to 39 Minutes | 6 | 4.0% |
| 40 to 44 Minutes | 3 | 2.0% |
| 45 to 59 Minutes | 26 | 17.1% |
| 60 to 89 Minutes | 11 | 7.2% |
| 90 or more Minutes | 0 | 0.0% |
Commute Time by Sex in Embarrass
The most common commute times in Embarrass are 5 to 9 minutes (24 commuters, 23.8%) for males and 5 to 9 minutes (17 commuters, 33.3%) for females.
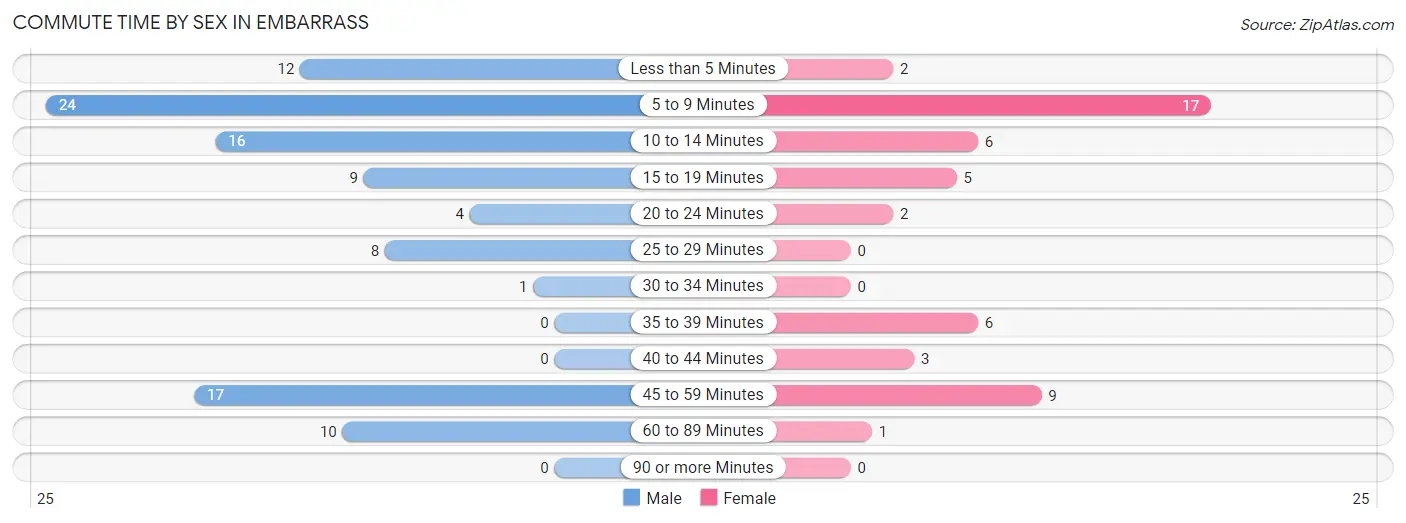
| Commute Time | Male | Female |
| Less than 5 Minutes | 12 (11.9%) | 2 (3.9%) |
| 5 to 9 Minutes | 24 (23.8%) | 17 (33.3%) |
| 10 to 14 Minutes | 16 (15.8%) | 6 (11.8%) |
| 15 to 19 Minutes | 9 (8.9%) | 5 (9.8%) |
| 20 to 24 Minutes | 4 (4.0%) | 2 (3.9%) |
| 25 to 29 Minutes | 8 (7.9%) | 0 (0.0%) |
| 30 to 34 Minutes | 1 (1.0%) | 0 (0.0%) |
| 35 to 39 Minutes | 0 (0.0%) | 6 (11.8%) |
| 40 to 44 Minutes | 0 (0.0%) | 3 (5.9%) |
| 45 to 59 Minutes | 17 (16.8%) | 9 (17.6%) |
| 60 to 89 Minutes | 10 (9.9%) | 1 (2.0%) |
| 90 or more Minutes | 0 (0.0%) | 0 (0.0%) |
Time of Departure to Work by Sex in Embarrass
The most frequent times of departure to work in Embarrass are 7:00 AM to 7:29 AM (34, 33.7%) for males and 7:00 AM to 7:29 AM (12, 23.5%) for females.
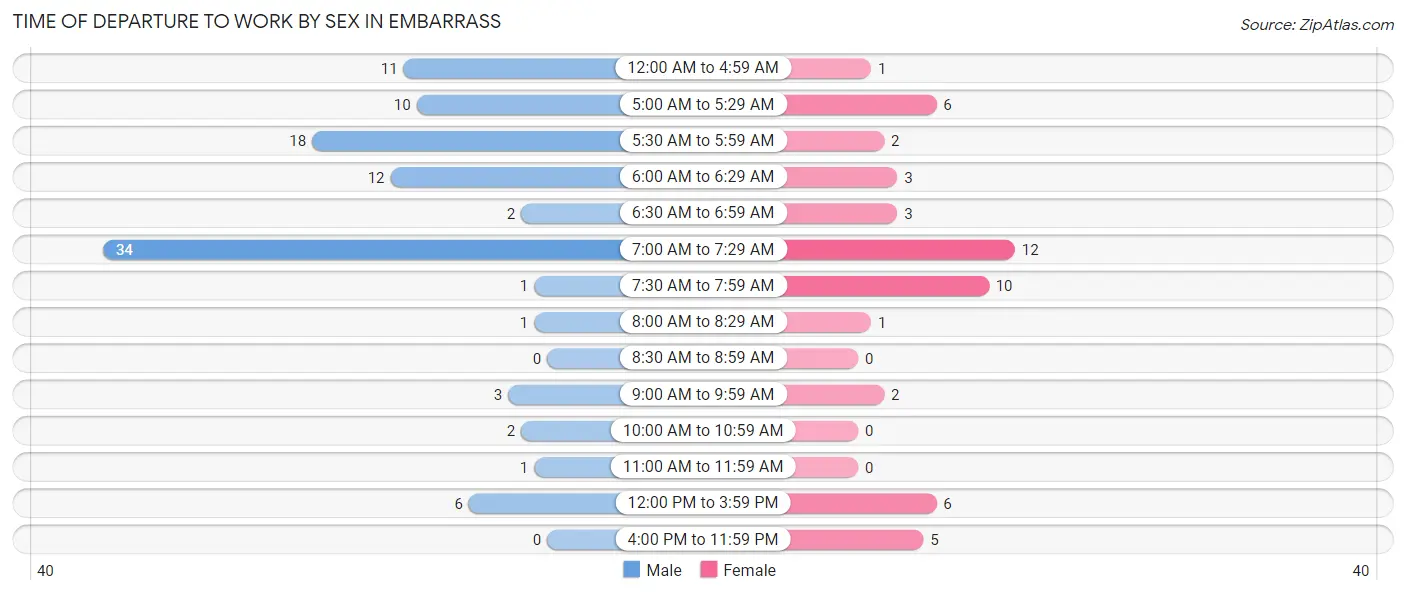
| Time of Departure | Male | Female |
| 12:00 AM to 4:59 AM | 11 (10.9%) | 1 (2.0%) |
| 5:00 AM to 5:29 AM | 10 (9.9%) | 6 (11.8%) |
| 5:30 AM to 5:59 AM | 18 (17.8%) | 2 (3.9%) |
| 6:00 AM to 6:29 AM | 12 (11.9%) | 3 (5.9%) |
| 6:30 AM to 6:59 AM | 2 (2.0%) | 3 (5.9%) |
| 7:00 AM to 7:29 AM | 34 (33.7%) | 12 (23.5%) |
| 7:30 AM to 7:59 AM | 1 (1.0%) | 10 (19.6%) |
| 8:00 AM to 8:29 AM | 1 (1.0%) | 1 (2.0%) |
| 8:30 AM to 8:59 AM | 0 (0.0%) | 0 (0.0%) |
| 9:00 AM to 9:59 AM | 3 (3.0%) | 2 (3.9%) |
| 10:00 AM to 10:59 AM | 2 (2.0%) | 0 (0.0%) |
| 11:00 AM to 11:59 AM | 1 (1.0%) | 0 (0.0%) |
| 12:00 PM to 3:59 PM | 6 (5.9%) | 6 (11.8%) |
| 4:00 PM to 11:59 PM | 0 (0.0%) | 5 (9.8%) |
| Total | 101 (100.0%) | 51 (100.0%) |
Housing Occupancy in Embarrass
Occupancy by Ownership in Embarrass
Of the total 200 dwellings in Embarrass, owner-occupied units account for 118 (59.0%), while renter-occupied units make up 82 (41.0%).
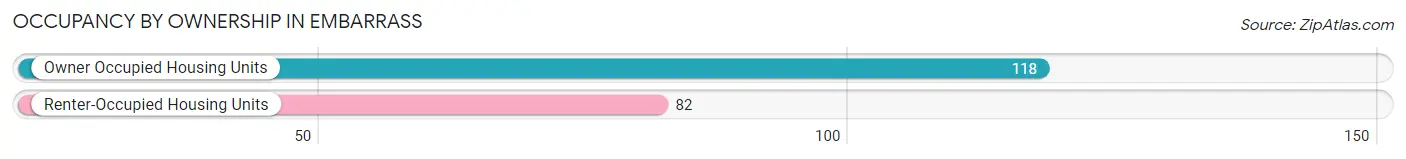
| Occupancy | # Housing Units | % Housing Units |
| Owner Occupied Housing Units | 118 | 59.0% |
| Renter-Occupied Housing Units | 82 | 41.0% |
| Total Occupied Housing Units | 200 | 100.0% |
Occupancy by Household Size in Embarrass
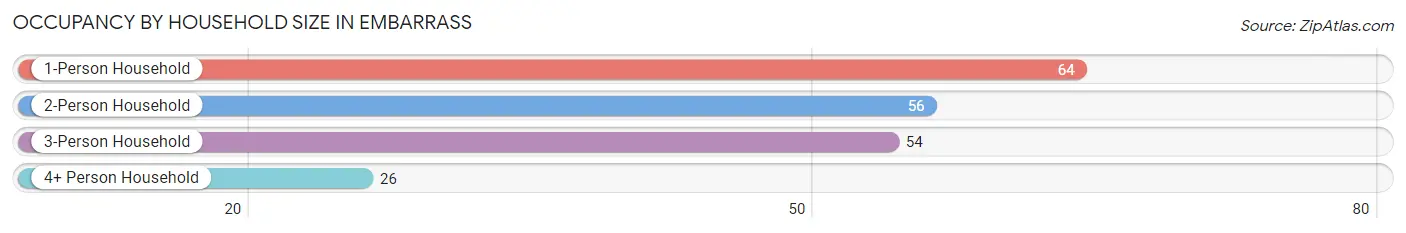
| Household Size | # Housing Units | % Housing Units |
| 1-Person Household | 64 | 32.0% |
| 2-Person Household | 56 | 28.0% |
| 3-Person Household | 54 | 27.0% |
| 4+ Person Household | 26 | 13.0% |
| Total Housing Units | 200 | 100.0% |
Occupancy by Ownership by Household Size in Embarrass
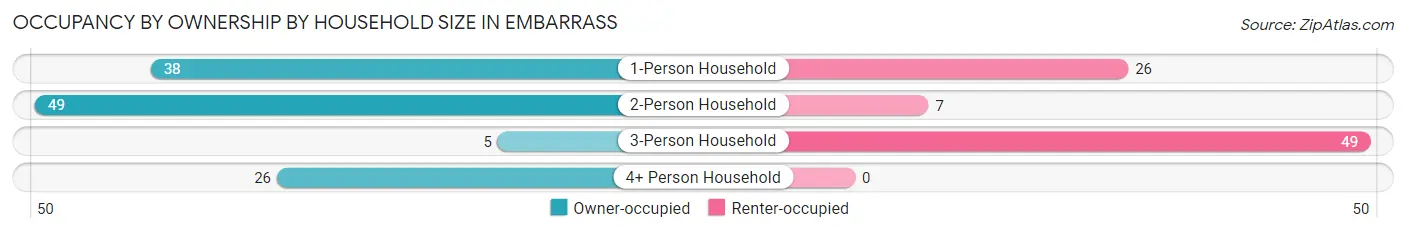
| Household Size | Owner-occupied | Renter-occupied |
| 1-Person Household | 38 (59.4%) | 26 (40.6%) |
| 2-Person Household | 49 (87.5%) | 7 (12.5%) |
| 3-Person Household | 5 (9.3%) | 49 (90.7%) |
| 4+ Person Household | 26 (100.0%) | 0 (0.0%) |
| Total Housing Units | 118 (59.0%) | 82 (41.0%) |
Occupancy by Educational Attainment in Embarrass
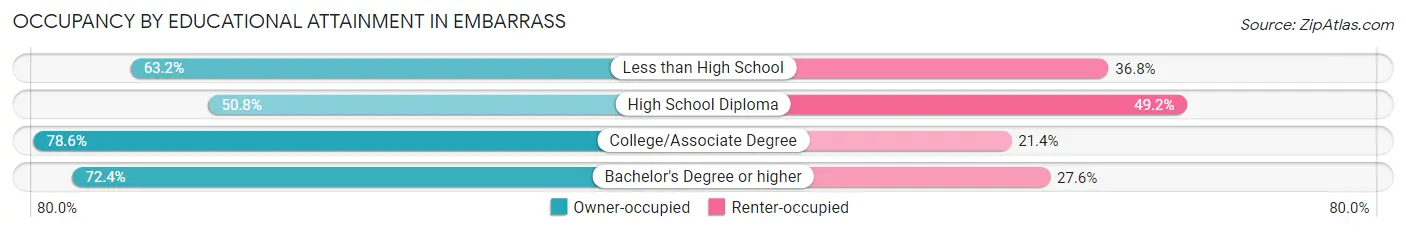
| Household Size | Owner-occupied | Renter-occupied |
| Less than High School | 12 (63.2%) | 7 (36.8%) |
| High School Diploma | 63 (50.8%) | 61 (49.2%) |
| College/Associate Degree | 22 (78.6%) | 6 (21.4%) |
| Bachelor's Degree or higher | 21 (72.4%) | 8 (27.6%) |
Occupancy by Age of Householder in Embarrass
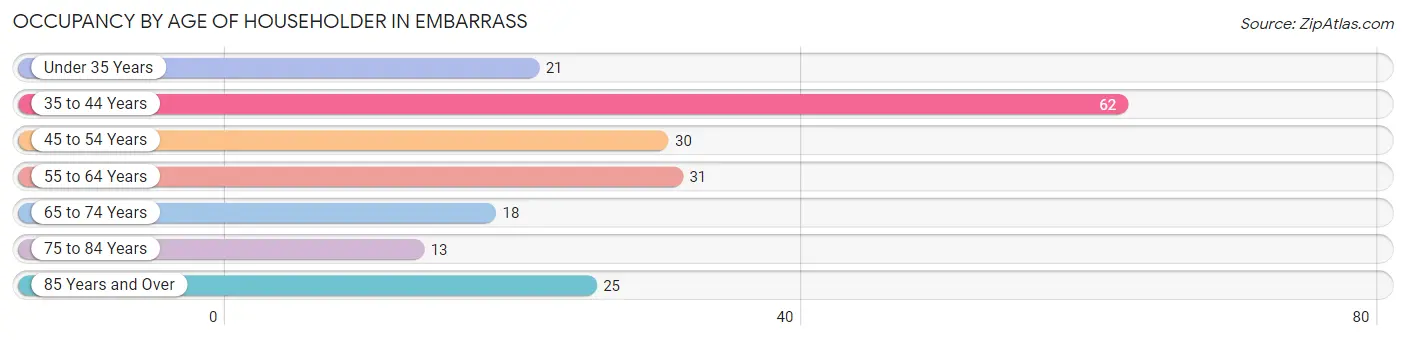
| Age Bracket | # Households | % Households |
| Under 35 Years | 21 | 10.5% |
| 35 to 44 Years | 62 | 31.0% |
| 45 to 54 Years | 30 | 15.0% |
| 55 to 64 Years | 31 | 15.5% |
| 65 to 74 Years | 18 | 9.0% |
| 75 to 84 Years | 13 | 6.5% |
| 85 Years and Over | 25 | 12.5% |
| Total | 200 | 100.0% |
Housing Finances in Embarrass
Median Income by Occupancy in Embarrass
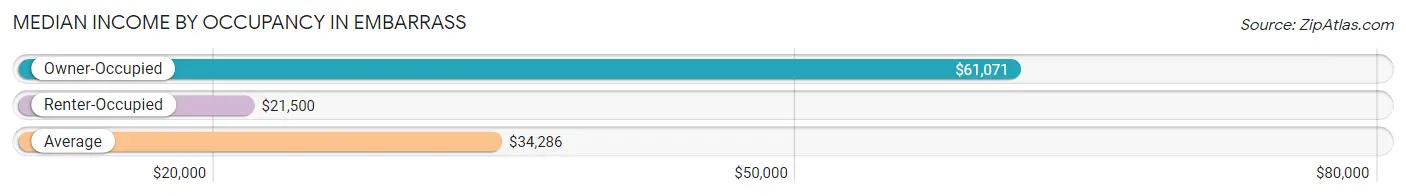
| Occupancy Type | # Households | Median Income |
| Owner-Occupied | 118 (59.0%) | $61,071 |
| Renter-Occupied | 82 (41.0%) | $21,500 |
| Average | 200 (100.0%) | $34,286 |
Occupancy by Householder Income Bracket in Embarrass
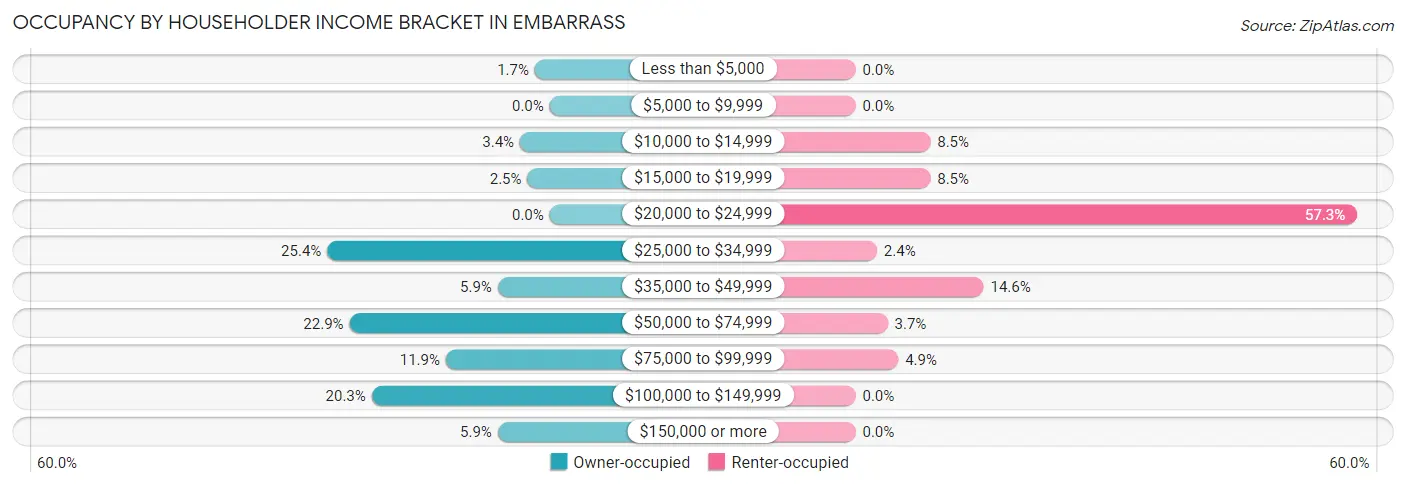
| Income Bracket | Owner-occupied | Renter-occupied |
| Less than $5,000 | 2 (1.7%) | 0 (0.0%) |
| $5,000 to $9,999 | 0 (0.0%) | 0 (0.0%) |
| $10,000 to $14,999 | 4 (3.4%) | 7 (8.5%) |
| $15,000 to $19,999 | 3 (2.5%) | 7 (8.5%) |
| $20,000 to $24,999 | 0 (0.0%) | 47 (57.3%) |
| $25,000 to $34,999 | 30 (25.4%) | 2 (2.4%) |
| $35,000 to $49,999 | 7 (5.9%) | 12 (14.6%) |
| $50,000 to $74,999 | 27 (22.9%) | 3 (3.7%) |
| $75,000 to $99,999 | 14 (11.9%) | 4 (4.9%) |
| $100,000 to $149,999 | 24 (20.3%) | 0 (0.0%) |
| $150,000 or more | 7 (5.9%) | 0 (0.0%) |
| Total | 118 (100.0%) | 82 (100.0%) |
Monthly Housing Cost Tiers in Embarrass
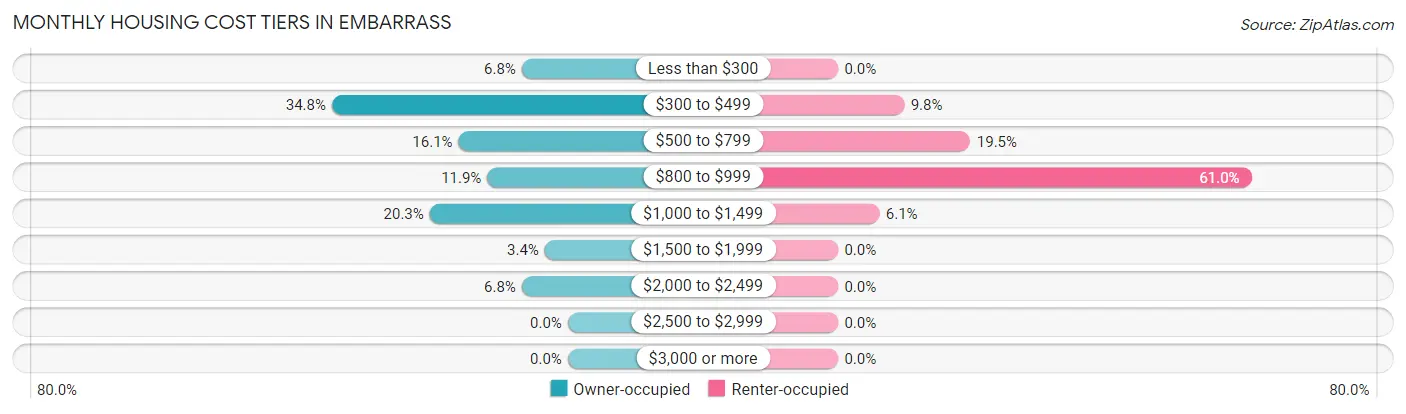
| Monthly Cost | Owner-occupied | Renter-occupied |
| Less than $300 | 8 (6.8%) | 0 (0.0%) |
| $300 to $499 | 41 (34.7%) | 8 (9.8%) |
| $500 to $799 | 19 (16.1%) | 16 (19.5%) |
| $800 to $999 | 14 (11.9%) | 50 (61.0%) |
| $1,000 to $1,499 | 24 (20.3%) | 5 (6.1%) |
| $1,500 to $1,999 | 4 (3.4%) | 0 (0.0%) |
| $2,000 to $2,499 | 8 (6.8%) | 0 (0.0%) |
| $2,500 to $2,999 | 0 (0.0%) | 0 (0.0%) |
| $3,000 or more | 0 (0.0%) | 0 (0.0%) |
| Total | 118 (100.0%) | 82 (100.0%) |
Physical Housing Characteristics in Embarrass
Housing Structures in Embarrass
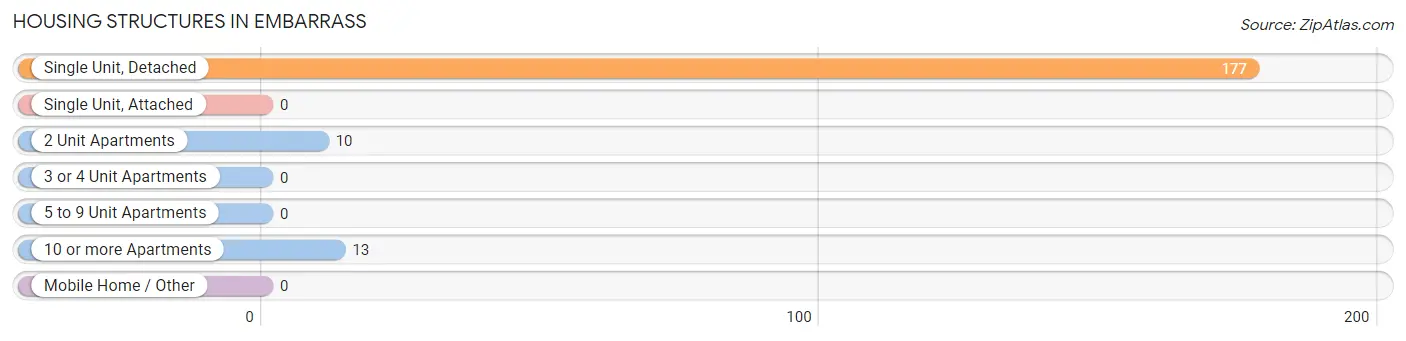
| Structure Type | # Housing Units | % Housing Units |
| Single Unit, Detached | 177 | 88.5% |
| Single Unit, Attached | 0 | 0.0% |
| 2 Unit Apartments | 10 | 5.0% |
| 3 or 4 Unit Apartments | 0 | 0.0% |
| 5 to 9 Unit Apartments | 0 | 0.0% |
| 10 or more Apartments | 13 | 6.5% |
| Mobile Home / Other | 0 | 0.0% |
| Total | 200 | 100.0% |
Housing Structures by Occupancy in Embarrass
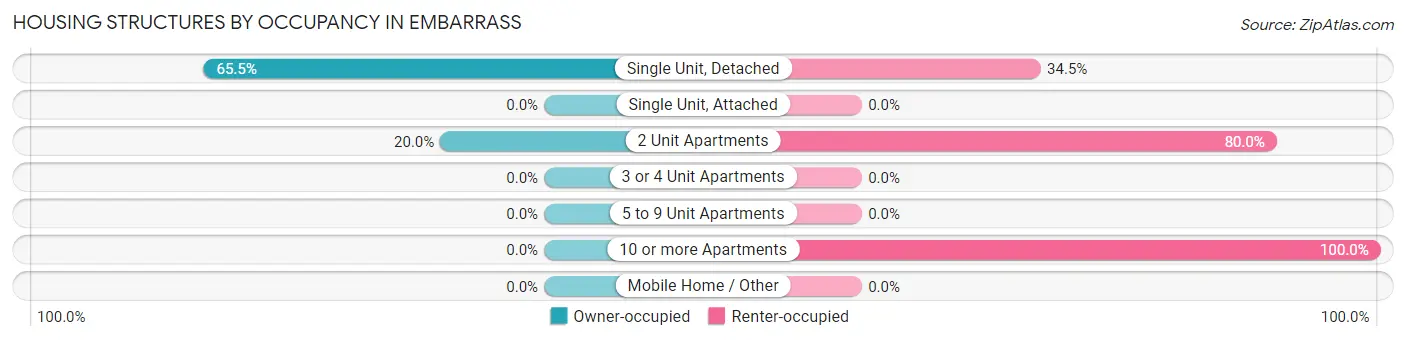
| Structure Type | Owner-occupied | Renter-occupied |
| Single Unit, Detached | 116 (65.5%) | 61 (34.5%) |
| Single Unit, Attached | 0 (0.0%) | 0 (0.0%) |
| 2 Unit Apartments | 2 (20.0%) | 8 (80.0%) |
| 3 or 4 Unit Apartments | 0 (0.0%) | 0 (0.0%) |
| 5 to 9 Unit Apartments | 0 (0.0%) | 0 (0.0%) |
| 10 or more Apartments | 0 (0.0%) | 13 (100.0%) |
| Mobile Home / Other | 0 (0.0%) | 0 (0.0%) |
| Total | 118 (59.0%) | 82 (41.0%) |
Housing Structures by Number of Rooms in Embarrass
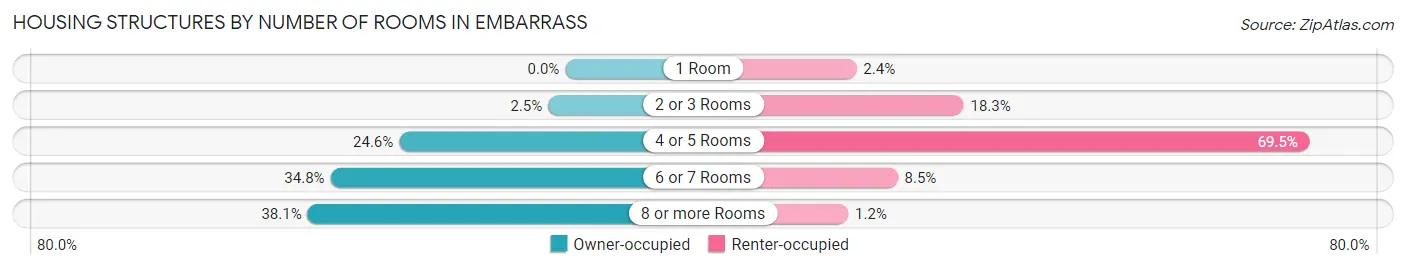
| Number of Rooms | Owner-occupied | Renter-occupied |
| 1 Room | 0 (0.0%) | 2 (2.4%) |
| 2 or 3 Rooms | 3 (2.5%) | 15 (18.3%) |
| 4 or 5 Rooms | 29 (24.6%) | 57 (69.5%) |
| 6 or 7 Rooms | 41 (34.7%) | 7 (8.5%) |
| 8 or more Rooms | 45 (38.1%) | 1 (1.2%) |
| Total | 118 (100.0%) | 82 (100.0%) |
Housing Structure by Heating Type in Embarrass
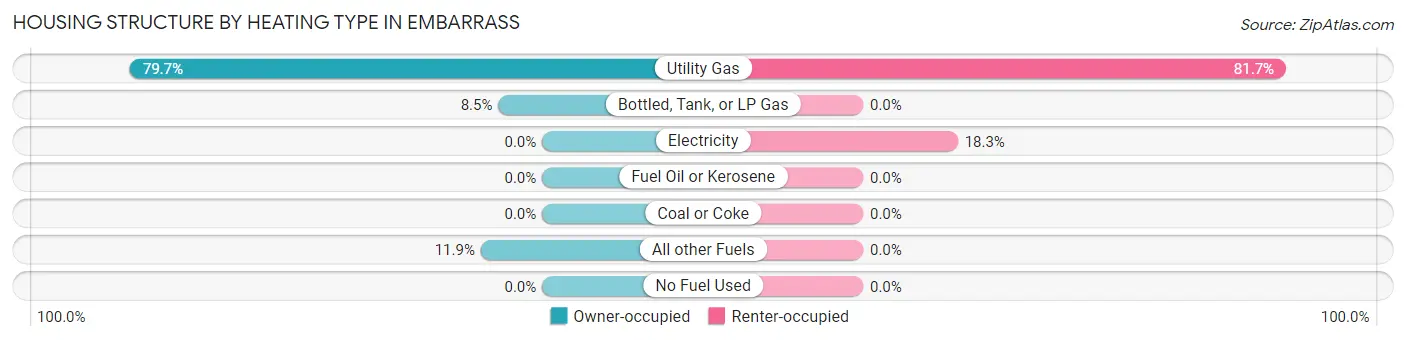
| Heating Type | Owner-occupied | Renter-occupied |
| Utility Gas | 94 (79.7%) | 67 (81.7%) |
| Bottled, Tank, or LP Gas | 10 (8.5%) | 0 (0.0%) |
| Electricity | 0 (0.0%) | 15 (18.3%) |
| Fuel Oil or Kerosene | 0 (0.0%) | 0 (0.0%) |
| Coal or Coke | 0 (0.0%) | 0 (0.0%) |
| All other Fuels | 14 (11.9%) | 0 (0.0%) |
| No Fuel Used | 0 (0.0%) | 0 (0.0%) |
| Total | 118 (100.0%) | 82 (100.0%) |
Household Vehicle Usage in Embarrass
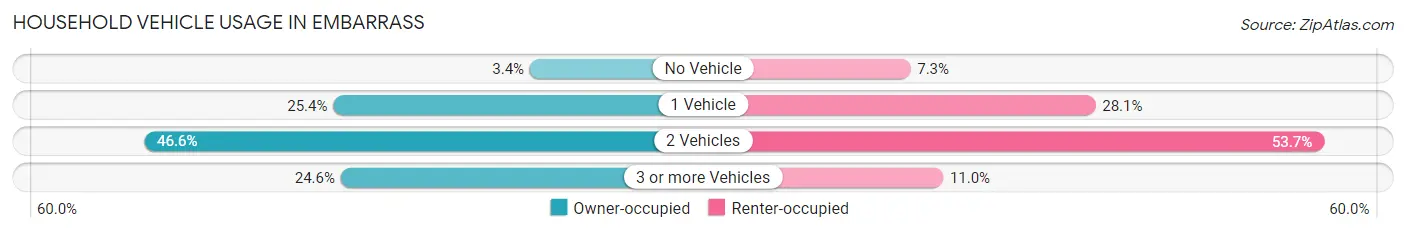
| Vehicles per Household | Owner-occupied | Renter-occupied |
| No Vehicle | 4 (3.4%) | 6 (7.3%) |
| 1 Vehicle | 30 (25.4%) | 23 (28.1%) |
| 2 Vehicles | 55 (46.6%) | 44 (53.7%) |
| 3 or more Vehicles | 29 (24.6%) | 9 (11.0%) |
| Total | 118 (100.0%) | 82 (100.0%) |
Real Estate & Mortgages in Embarrass
Real Estate and Mortgage Overview in Embarrass
| Characteristic | Without Mortgage | With Mortgage |
| Housing Units | 53 | 65 |
| Median Property Value | $136,200 | $114,100 |
| Median Household Income | $33,438 | $6 |
| Monthly Housing Costs | $346 | $0 |
| Real Estate Taxes | $1,238 | $3 |
Property Value by Mortgage Status in Embarrass
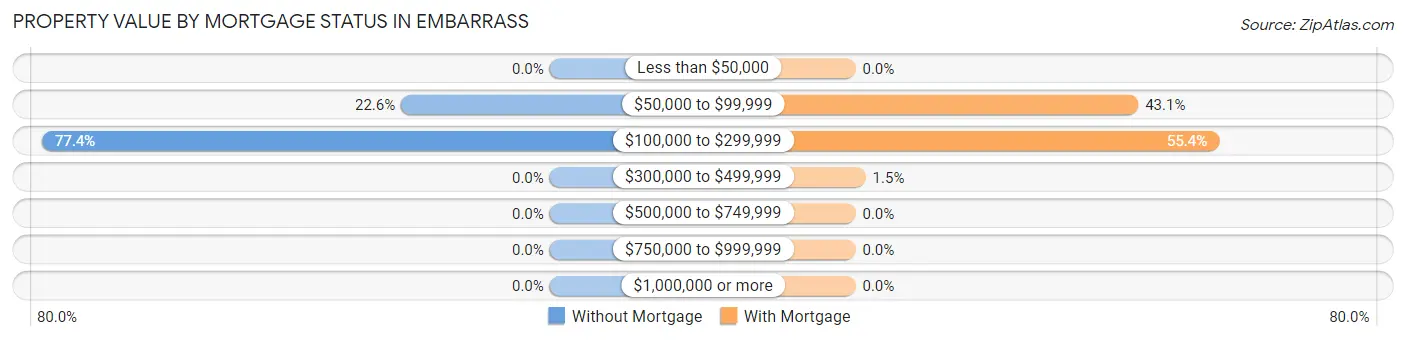
| Property Value | Without Mortgage | With Mortgage |
| Less than $50,000 | 0 (0.0%) | 0 (0.0%) |
| $50,000 to $99,999 | 12 (22.6%) | 28 (43.1%) |
| $100,000 to $299,999 | 41 (77.4%) | 36 (55.4%) |
| $300,000 to $499,999 | 0 (0.0%) | 1 (1.5%) |
| $500,000 to $749,999 | 0 (0.0%) | 0 (0.0%) |
| $750,000 to $999,999 | 0 (0.0%) | 0 (0.0%) |
| $1,000,000 or more | 0 (0.0%) | 0 (0.0%) |
| Total | 53 (100.0%) | 65 (100.0%) |
Household Income by Mortgage Status in Embarrass
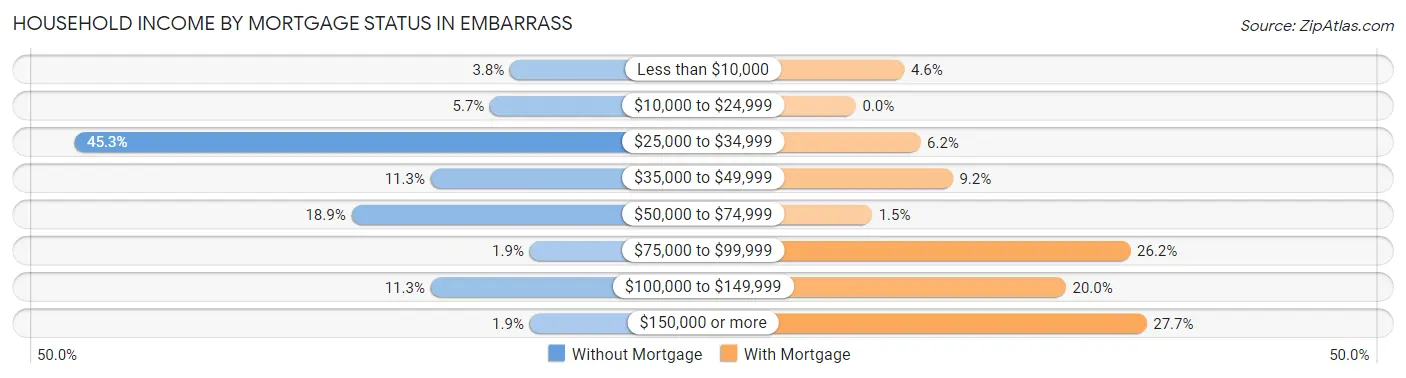
| Household Income | Without Mortgage | With Mortgage |
| Less than $10,000 | 2 (3.8%) | 3 (4.6%) |
| $10,000 to $24,999 | 3 (5.7%) | 0 (0.0%) |
| $25,000 to $34,999 | 24 (45.3%) | 4 (6.1%) |
| $35,000 to $49,999 | 6 (11.3%) | 6 (9.2%) |
| $50,000 to $74,999 | 10 (18.9%) | 1 (1.5%) |
| $75,000 to $99,999 | 1 (1.9%) | 17 (26.2%) |
| $100,000 to $149,999 | 6 (11.3%) | 13 (20.0%) |
| $150,000 or more | 1 (1.9%) | 18 (27.7%) |
| Total | 53 (100.0%) | 65 (100.0%) |
Property Value to Household Income Ratio in Embarrass
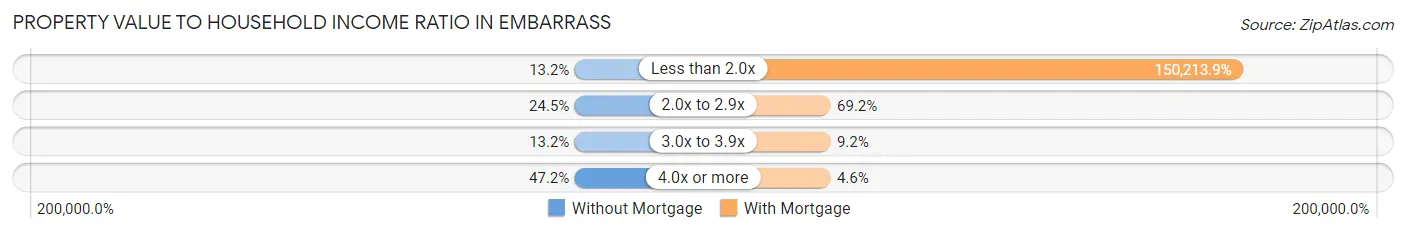
| Value-to-Income Ratio | Without Mortgage | With Mortgage |
| Less than 2.0x | 7 (13.2%) | 97,639 (150,213.9%) |
| 2.0x to 2.9x | 13 (24.5%) | 45 (69.2%) |
| 3.0x to 3.9x | 7 (13.2%) | 6 (9.2%) |
| 4.0x or more | 25 (47.2%) | 3 (4.6%) |
| Total | 53 (100.0%) | 65 (100.0%) |
Real Estate Taxes by Mortgage Status in Embarrass
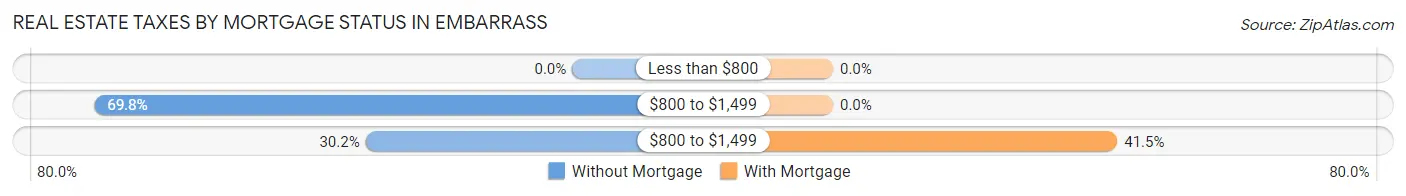
| Property Taxes | Without Mortgage | With Mortgage |
| Less than $800 | 0 (0.0%) | 0 (0.0%) |
| $800 to $1,499 | 37 (69.8%) | 0 (0.0%) |
| $800 to $1,499 | 16 (30.2%) | 27 (41.5%) |
| Total | 53 (100.0%) | 65 (100.0%) |
Health & Disability in Embarrass
Health Insurance Coverage by Age in Embarrass
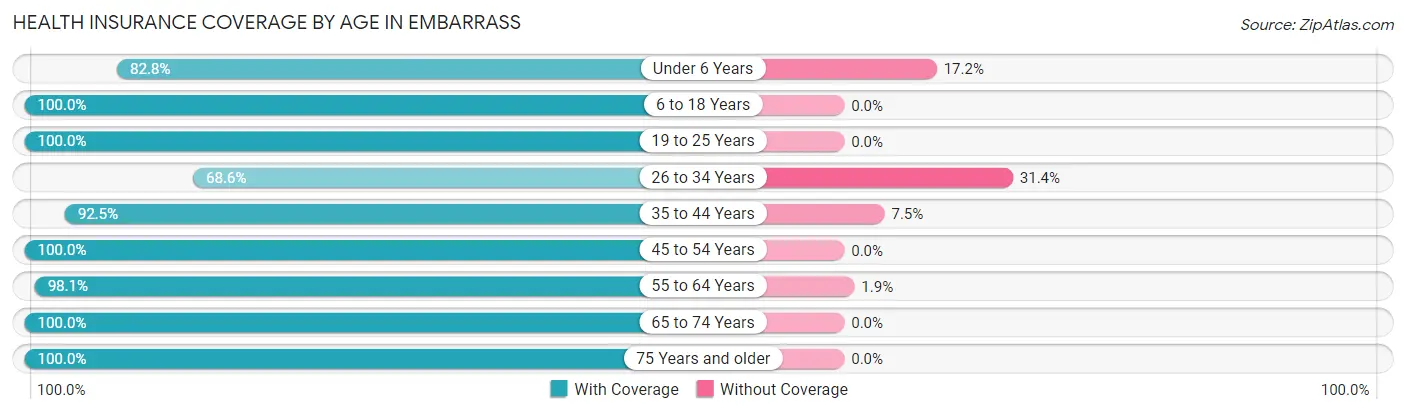
| Age Bracket | With Coverage | Without Coverage |
| Under 6 Years | 24 (82.8%) | 5 (17.2%) |
| 6 to 18 Years | 122 (100.0%) | 0 (0.0%) |
| 19 to 25 Years | 12 (100.0%) | 0 (0.0%) |
| 26 to 34 Years | 24 (68.6%) | 11 (31.4%) |
| 35 to 44 Years | 74 (92.5%) | 6 (7.5%) |
| 45 to 54 Years | 49 (100.0%) | 0 (0.0%) |
| 55 to 64 Years | 52 (98.1%) | 1 (1.9%) |
| 65 to 74 Years | 27 (100.0%) | 0 (0.0%) |
| 75 Years and older | 45 (100.0%) | 0 (0.0%) |
| Total | 429 (94.9%) | 23 (5.1%) |
Health Insurance Coverage by Citizenship Status in Embarrass
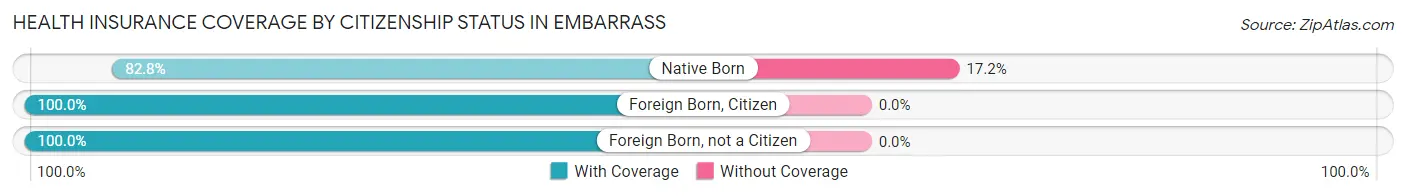
| Citizenship Status | With Coverage | Without Coverage |
| Native Born | 24 (82.8%) | 5 (17.2%) |
| Foreign Born, Citizen | 122 (100.0%) | 0 (0.0%) |
| Foreign Born, not a Citizen | 12 (100.0%) | 0 (0.0%) |
Health Insurance Coverage by Household Income in Embarrass
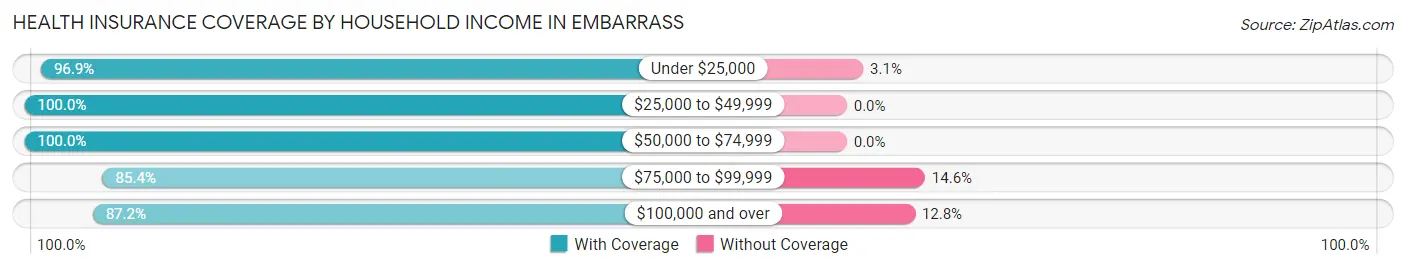
| Household Income | With Coverage | Without Coverage |
| Under $25,000 | 158 (96.9%) | 5 (3.1%) |
| $25,000 to $49,999 | 78 (100.0%) | 0 (0.0%) |
| $50,000 to $74,999 | 76 (100.0%) | 0 (0.0%) |
| $75,000 to $99,999 | 35 (85.4%) | 6 (14.6%) |
| $100,000 and over | 82 (87.2%) | 12 (12.8%) |
Public vs Private Health Insurance Coverage by Age in Embarrass
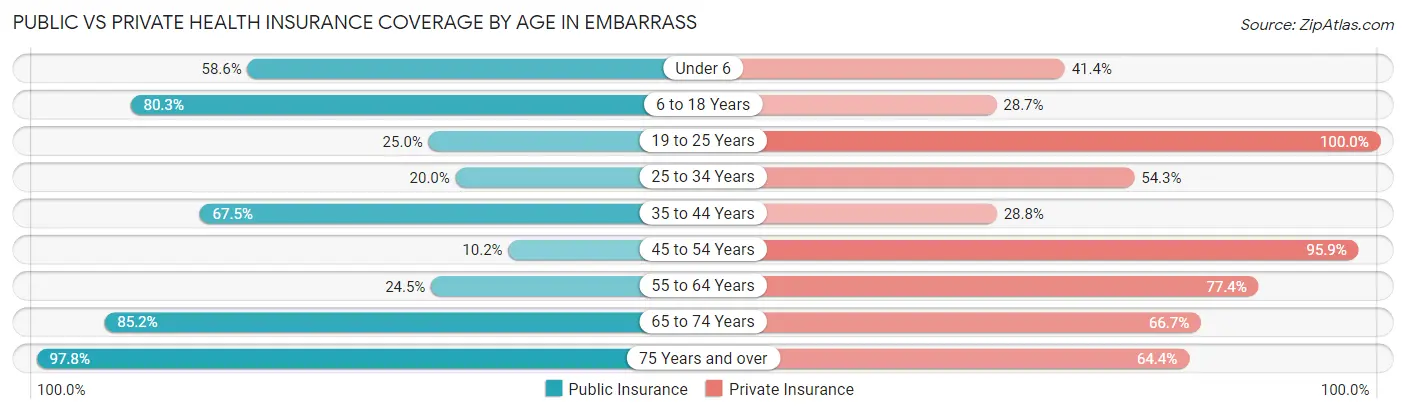
| Age Bracket | Public Insurance | Private Insurance |
| Under 6 | 17 (58.6%) | 12 (41.4%) |
| 6 to 18 Years | 98 (80.3%) | 35 (28.7%) |
| 19 to 25 Years | 3 (25.0%) | 12 (100.0%) |
| 25 to 34 Years | 7 (20.0%) | 19 (54.3%) |
| 35 to 44 Years | 54 (67.5%) | 23 (28.7%) |
| 45 to 54 Years | 5 (10.2%) | 47 (95.9%) |
| 55 to 64 Years | 13 (24.5%) | 41 (77.4%) |
| 65 to 74 Years | 23 (85.2%) | 18 (66.7%) |
| 75 Years and over | 44 (97.8%) | 29 (64.4%) |
| Total | 264 (58.4%) | 236 (52.2%) |
Disability Status by Sex by Age in Embarrass
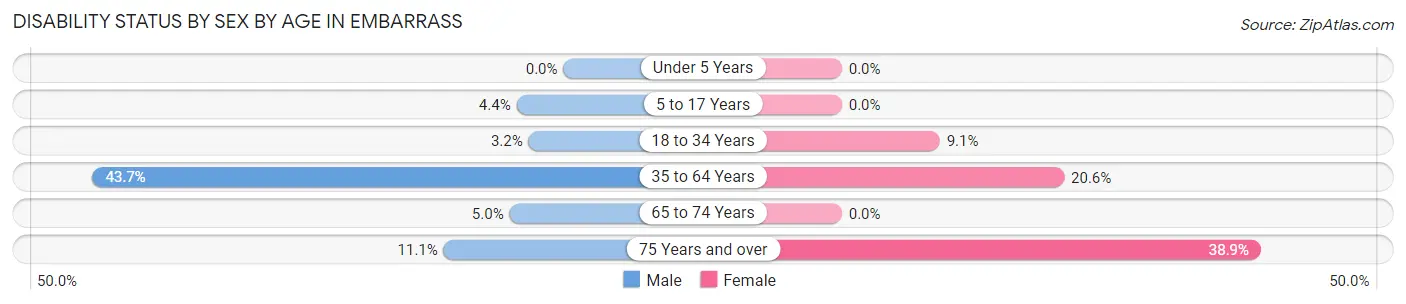
| Age Bracket | Male | Female |
| Under 5 Years | 0 (0.0%) | 0 (0.0%) |
| 5 to 17 Years | 3 (4.3%) | 0 (0.0%) |
| 18 to 34 Years | 1 (3.2%) | 2 (9.1%) |
| 35 to 64 Years | 52 (43.7%) | 13 (20.6%) |
| 65 to 74 Years | 1 (5.0%) | 0 (0.0%) |
| 75 Years and over | 1 (11.1%) | 14 (38.9%) |
Disability Class by Sex by Age in Embarrass
Disability Class: Hearing Difficulty
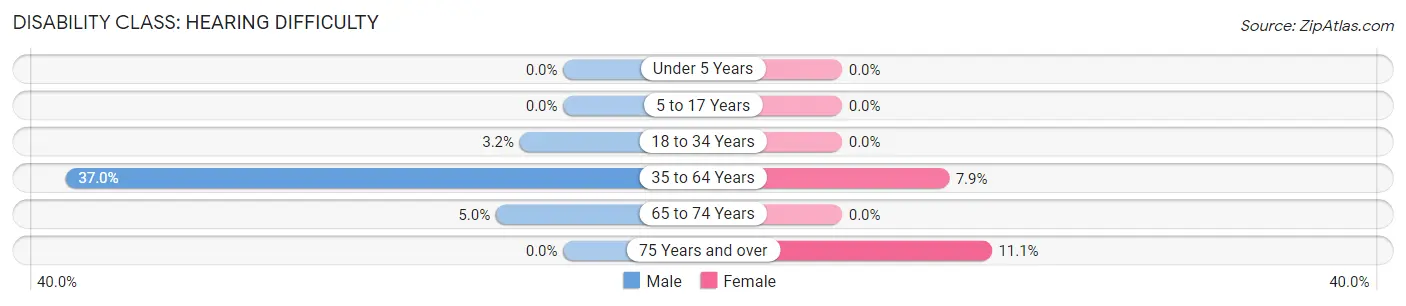
| Age Bracket | Male | Female |
| Under 5 Years | 0 (0.0%) | 0 (0.0%) |
| 5 to 17 Years | 0 (0.0%) | 0 (0.0%) |
| 18 to 34 Years | 1 (3.2%) | 0 (0.0%) |
| 35 to 64 Years | 44 (37.0%) | 5 (7.9%) |
| 65 to 74 Years | 1 (5.0%) | 0 (0.0%) |
| 75 Years and over | 0 (0.0%) | 4 (11.1%) |
Disability Class: Vision Difficulty
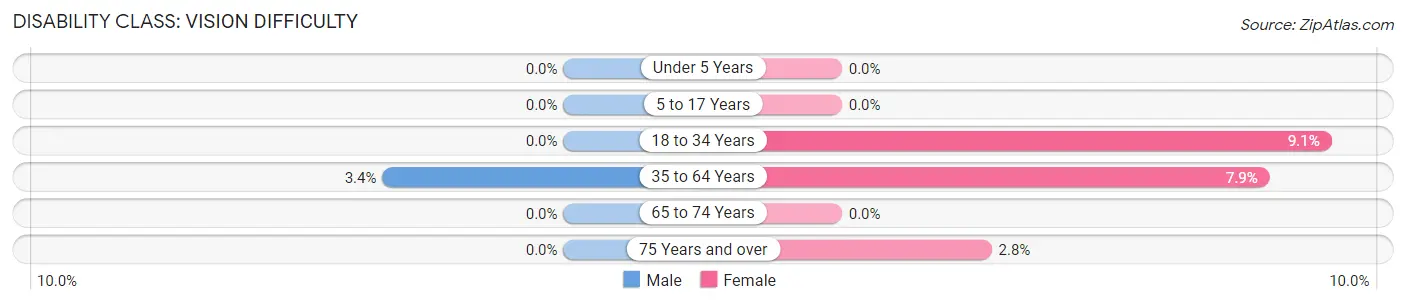
| Age Bracket | Male | Female |
| Under 5 Years | 0 (0.0%) | 0 (0.0%) |
| 5 to 17 Years | 0 (0.0%) | 0 (0.0%) |
| 18 to 34 Years | 0 (0.0%) | 2 (9.1%) |
| 35 to 64 Years | 4 (3.4%) | 5 (7.9%) |
| 65 to 74 Years | 0 (0.0%) | 0 (0.0%) |
| 75 Years and over | 0 (0.0%) | 1 (2.8%) |
Disability Class: Cognitive Difficulty
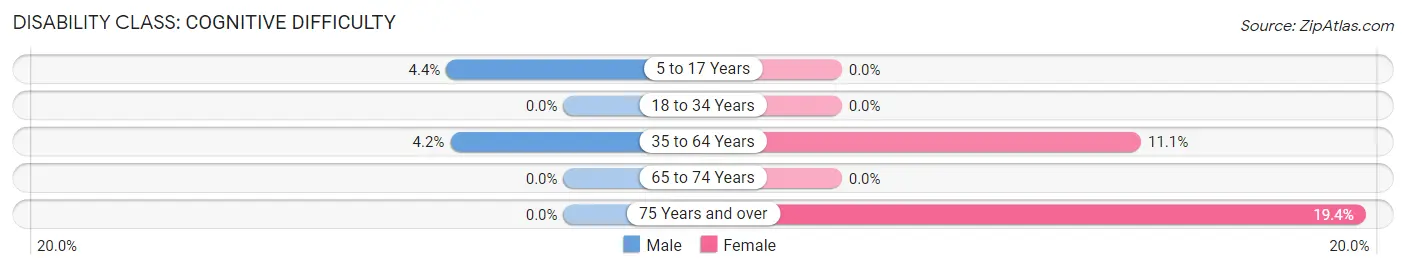
| Age Bracket | Male | Female |
| 5 to 17 Years | 3 (4.3%) | 0 (0.0%) |
| 18 to 34 Years | 0 (0.0%) | 0 (0.0%) |
| 35 to 64 Years | 5 (4.2%) | 7 (11.1%) |
| 65 to 74 Years | 0 (0.0%) | 0 (0.0%) |
| 75 Years and over | 0 (0.0%) | 7 (19.4%) |
Disability Class: Ambulatory Difficulty
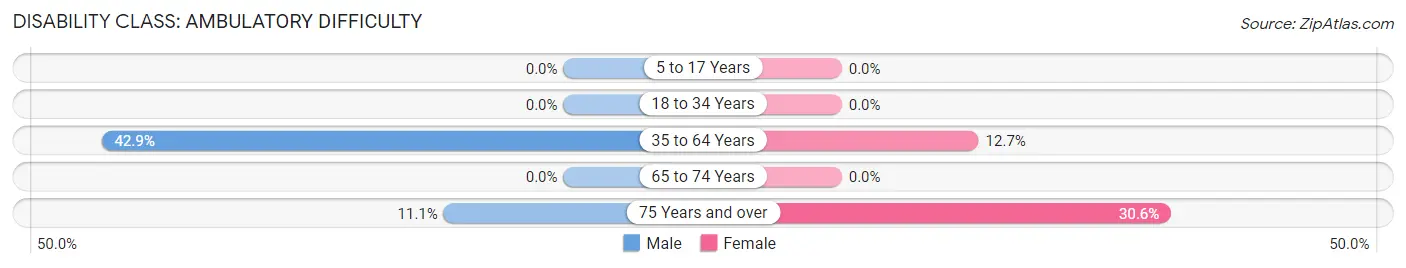
| Age Bracket | Male | Female |
| 5 to 17 Years | 0 (0.0%) | 0 (0.0%) |
| 18 to 34 Years | 0 (0.0%) | 0 (0.0%) |
| 35 to 64 Years | 51 (42.9%) | 8 (12.7%) |
| 65 to 74 Years | 0 (0.0%) | 0 (0.0%) |
| 75 Years and over | 1 (11.1%) | 11 (30.6%) |
Disability Class: Self-Care Difficulty
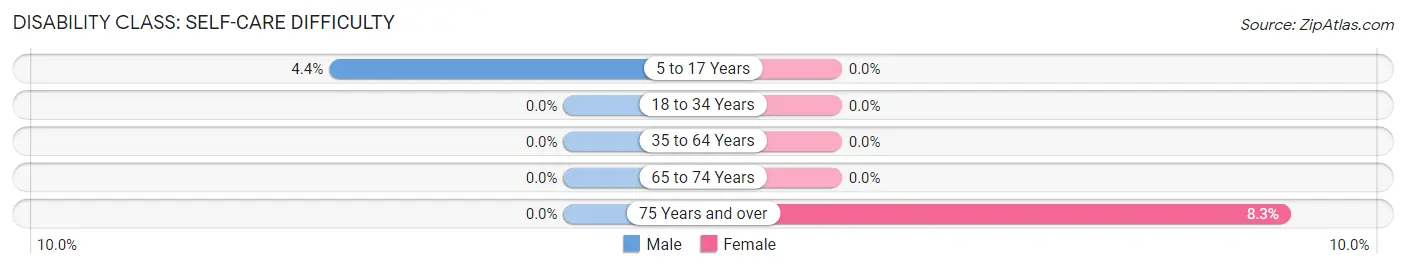
| Age Bracket | Male | Female |
| 5 to 17 Years | 3 (4.3%) | 0 (0.0%) |
| 18 to 34 Years | 0 (0.0%) | 0 (0.0%) |
| 35 to 64 Years | 0 (0.0%) | 0 (0.0%) |
| 65 to 74 Years | 0 (0.0%) | 0 (0.0%) |
| 75 Years and over | 0 (0.0%) | 3 (8.3%) |
Technology Access in Embarrass
Computing Device Access in Embarrass
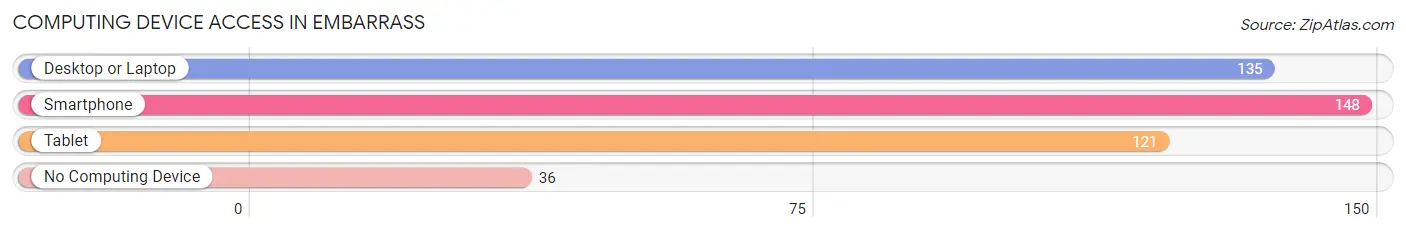
| Device Type | # Households | % Households |
| Desktop or Laptop | 135 | 67.5% |
| Smartphone | 148 | 74.0% |
| Tablet | 121 | 60.5% |
| No Computing Device | 36 | 18.0% |
| Total | 200 | 100.0% |
Internet Access in Embarrass
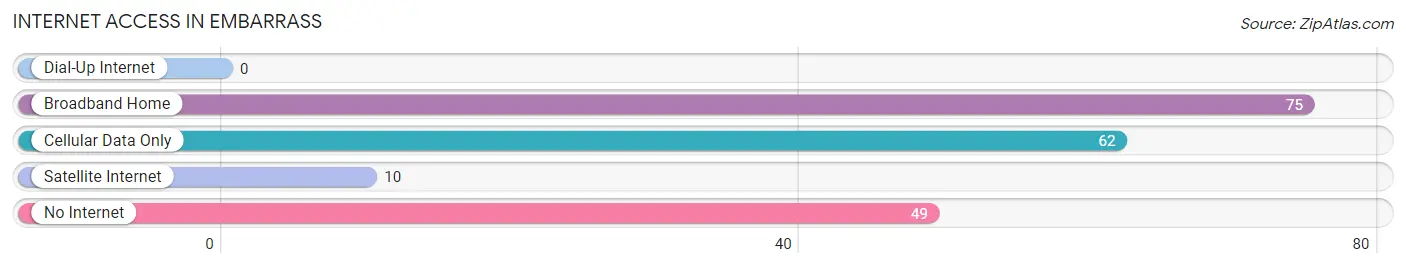
| Internet Type | # Households | % Households |
| Dial-Up Internet | 0 | 0.0% |
| Broadband Home | 75 | 37.5% |
| Cellular Data Only | 62 | 31.0% |
| Satellite Internet | 10 | 5.0% |
| No Internet | 49 | 24.5% |
| Total | 200 | 100.0% |
Embarrass Summary
Embarrass, Wisconsin is a small town located in the northern part of the state, in the county of Vilas. It is situated on the banks of the Embarrass River, which is a tributary of the Wisconsin River. The town was founded in 1883 and has a population of just over 500 people.
History
The area that is now Embarrass was first settled in the late 1800s by a group of Finnish immigrants. The town was originally called “Finn Town”, but was later changed to Embarrass in 1883. The name was chosen to honor the Embarrass River, which runs through the town.
The town was originally a logging and farming community, and the first sawmill was built in 1884. The town grew slowly, and by the early 1900s, it had a population of around 200 people.
In the 1920s, the town began to experience a period of growth, as the logging industry expanded and the town became a popular tourist destination. The town was also home to a number of resorts, which attracted visitors from all over the country.
In the 1950s, the town began to decline, as the logging industry began to decline and the resorts closed. The population of the town dropped to just over 200 people by the 1970s.
In the 1980s, the town began to experience a resurgence, as the logging industry began to recover and the town became a popular destination for outdoor recreation. The population of the town has since grown to over 500 people.
Geography
Embarrass is located in the northern part of Wisconsin, in the county of Vilas. It is situated on the banks of the Embarrass River, which is a tributary of the Wisconsin River. The town is surrounded by forests and lakes, and is home to a number of outdoor recreation areas.
The town is located in a temperate climate, with warm summers and cold winters. The average temperature in the summer is around 70 degrees Fahrenheit, and the average temperature in the winter is around 20 degrees Fahrenheit.
Economy
The economy of Embarrass is largely based on tourism and outdoor recreation. The town is home to a number of resorts and outdoor recreation areas, which attract visitors from all over the country. The town is also home to a number of small businesses, including restaurants, shops, and other services.
The town is also home to a number of logging and lumber companies, which provide employment for many of the town’s residents.
Demographics
As of the 2010 census, the population of Embarrass was 514 people. The town is predominantly white, with 95.3% of the population being white. The town also has a small Hispanic population, with 2.7% of the population being Hispanic.
The median household income in Embarrass is $41,250, and the median home value is $127,500. The town has a high rate of homeownership, with 81.3% of the population owning their own homes.
Embarrass is a small town with a rich history and a vibrant economy. The town is home to a number of outdoor recreation areas, and is a popular destination for tourists from all over the country. The town is also home to a number of small businesses, which provide employment for many of the town’s residents.
Common Questions
What is Per Capita Income in Embarrass?
Per Capita income in Embarrass is $26,847.
What is the Median Household income in Embarrass?
Median Household Income in Embarrass is $34,286.
What is Income or Wage Gap in Embarrass?
Income or Wage Gap in Embarrass is 57.5%.
Women in Embarrass earn 42.5 cents for every dollar earned by a man.
What is Inequality or Gini Index in Embarrass?
Inequality or Gini Index in Embarrass is 0.42.
What is the Total Population of Embarrass?
Total Population of Embarrass is 506.
What is the Total Male Population of Embarrass?
Total Male Population of Embarrass is 295.
What is the Total Female Population of Embarrass?
Total Female Population of Embarrass is 211.
What is the Ratio of Males per 100 Females in Embarrass?
There are 139.81 Males per 100 Females in Embarrass.
What is the Ratio of Females per 100 Males in Embarrass?
There are 71.53 Females per 100 Males in Embarrass.
What is the Median Population Age in Embarrass?
Median Population Age in Embarrass is 43.5 Years.
What is the Average Family Size in Embarrass
Average Family Size in Embarrass is 2.8 People.
What is the Average Household Size in Embarrass
Average Household Size in Embarrass is 2.3 People.
How Large is the Labor Force in Embarrass?
There are 163 People in the Labor Forcein in Embarrass.
What is the Percentage of People in the Labor Force in Embarrass?
44.4% of People are in the Labor Force in Embarrass.
What is the Unemployment Rate in Embarrass?
Unemployment Rate in Embarrass is 1.2%.