Elroy, WI Map & Demographics
Elroy Map
Elroy Overview
$28,777
PER CAPITA INCOME
$68,125
AVG FAMILY INCOME
$57,583
AVG HOUSEHOLD INCOME
21.6%
WAGE / INCOME GAP [ % ]
78.4¢/ $1
WAGE / INCOME GAP [ $ ]
0.41
INEQUALITY / GINI INDEX
1,543
TOTAL POPULATION
841
MALE POPULATION
702
FEMALE POPULATION
119.80
MALES / 100 FEMALES
83.47
FEMALES / 100 MALES
36.7
MEDIAN AGE
3.1
AVG FAMILY SIZE
2.5
AVG HOUSEHOLD SIZE
717
LABOR FORCE [ PEOPLE ]
62.8%
PERCENT IN LABOR FORCE
1.0%
UNEMPLOYMENT RATE
Elroy Zip Codes
Elroy Area Codes
Income in Elroy
Income Overview in Elroy
Per Capita Income in Elroy is $28,777, while median incomes of families and households are $68,125 and $57,583 respectively.
| Characteristic | Number | Measure |
| Per Capita Income | 1,543 | $28,777 |
| Median Family Income | 374 | $68,125 |
| Mean Family Income | 374 | $74,140 |
| Median Household Income | 595 | $57,583 |
| Mean Household Income | 595 | $69,595 |
| Income Deficit | 374 | $0 |
| Wage / Income Gap (%) | 1,543 | 21.59% |
| Wage / Income Gap ($) | 1,543 | 78.41¢ per $1 |
| Gini / Inequality Index | 1,543 | 0.41 |
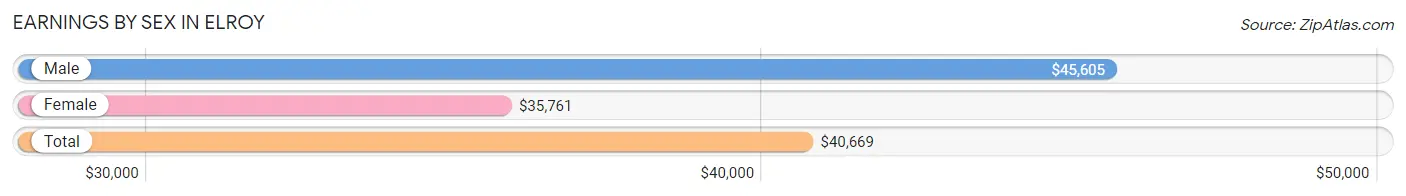
Earnings by Sex in Elroy
Average Earnings in Elroy are $40,669, $45,605 for men and $35,761 for women, a difference of 21.6%.
| Sex | Number | Average Earnings |
| Male | 413 (55.4%) | $45,605 |
| Female | 332 (44.6%) | $35,761 |
| Total | 745 (100.0%) | $40,669 |
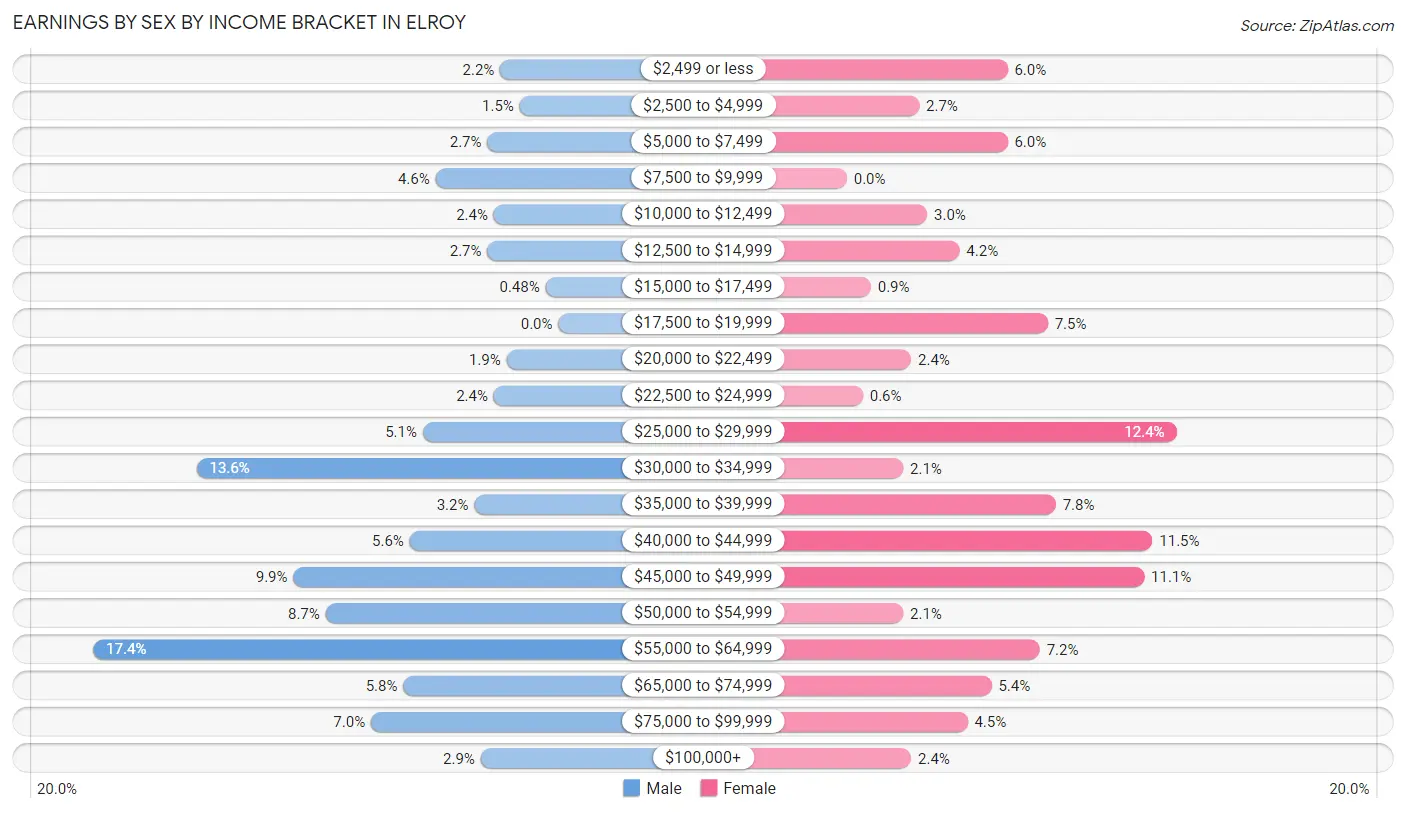
Earnings by Sex by Income Bracket in Elroy
The most common earnings brackets in Elroy are $55,000 to $64,999 for men (72 | 17.4%) and $25,000 to $29,999 for women (41 | 12.3%).
| Income | Male | Female |
| $2,499 or less | 9 (2.2%) | 20 (6.0%) |
| $2,500 to $4,999 | 6 (1.5%) | 9 (2.7%) |
| $5,000 to $7,499 | 11 (2.7%) | 20 (6.0%) |
| $7,500 to $9,999 | 19 (4.6%) | 0 (0.0%) |
| $10,000 to $12,499 | 10 (2.4%) | 10 (3.0%) |
| $12,500 to $14,999 | 11 (2.7%) | 14 (4.2%) |
| $15,000 to $17,499 | 2 (0.5%) | 3 (0.9%) |
| $17,500 to $19,999 | 0 (0.0%) | 25 (7.5%) |
| $20,000 to $22,499 | 8 (1.9%) | 8 (2.4%) |
| $22,500 to $24,999 | 10 (2.4%) | 2 (0.6%) |
| $25,000 to $29,999 | 21 (5.1%) | 41 (12.3%) |
| $30,000 to $34,999 | 56 (13.6%) | 7 (2.1%) |
| $35,000 to $39,999 | 13 (3.2%) | 26 (7.8%) |
| $40,000 to $44,999 | 23 (5.6%) | 38 (11.5%) |
| $45,000 to $49,999 | 41 (9.9%) | 37 (11.1%) |
| $50,000 to $54,999 | 36 (8.7%) | 7 (2.1%) |
| $55,000 to $64,999 | 72 (17.4%) | 24 (7.2%) |
| $65,000 to $74,999 | 24 (5.8%) | 18 (5.4%) |
| $75,000 to $99,999 | 29 (7.0%) | 15 (4.5%) |
| $100,000+ | 12 (2.9%) | 8 (2.4%) |
| Total | 413 (100.0%) | 332 (100.0%) |
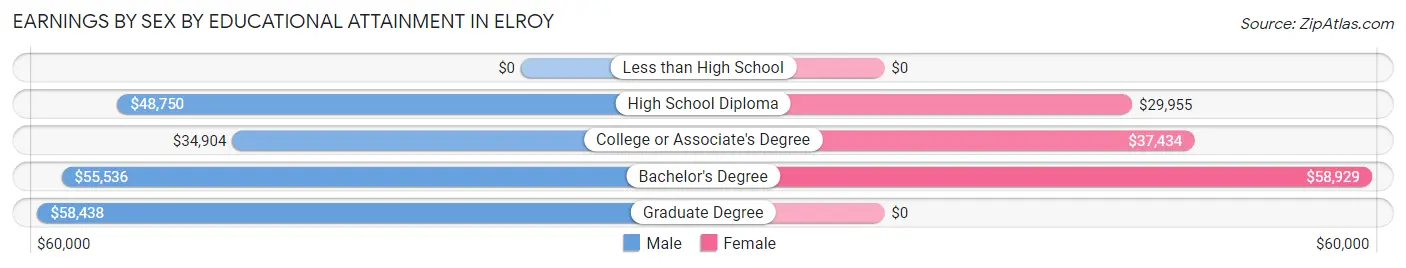
Earnings by Sex by Educational Attainment in Elroy
Average earnings in Elroy are $46,550 for men and $36,304 for women, a difference of 22.0%. Men with an educational attainment of graduate degree enjoy the highest average annual earnings of $58,438, while those with college or associate's degree education earn the least with $34,904. Women with an educational attainment of bachelor's degree earn the most with the average annual earnings of $58,929, while those with high school diploma education have the smallest earnings of $29,955.
| Educational Attainment | Male Income | Female Income |
| Less than High School | - | - |
| High School Diploma | $48,750 | $29,955 |
| College or Associate's Degree | $34,904 | $37,434 |
| Bachelor's Degree | $55,536 | $58,929 |
| Graduate Degree | $58,438 | $0 |
| Total | $46,550 | $36,304 |
Family Income in Elroy
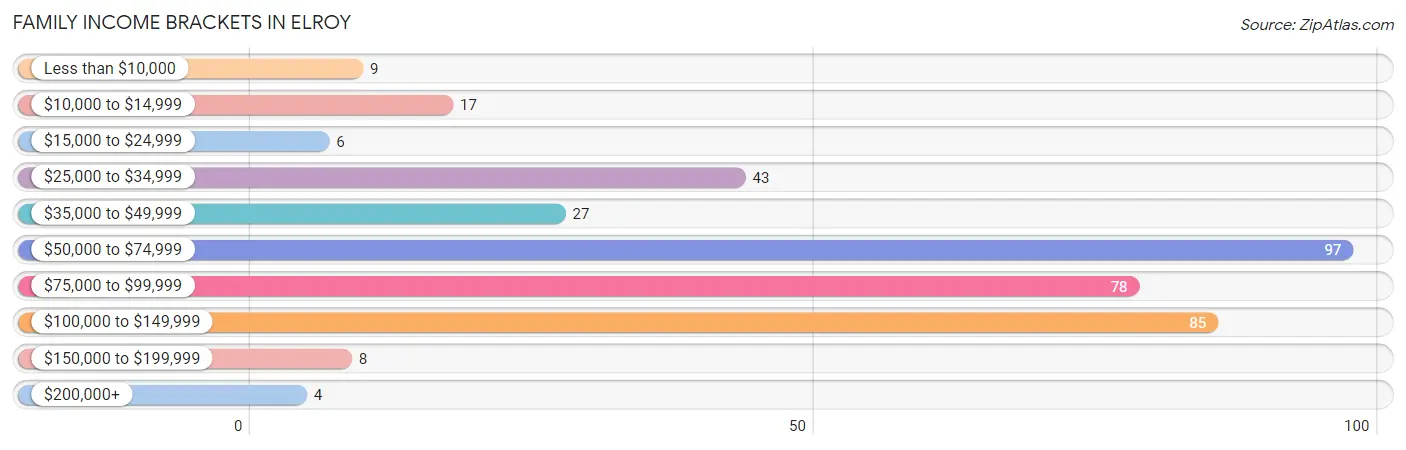
Family Income Brackets in Elroy
According to the Elroy family income data, there are 97 families falling into the $50,000 to $74,999 income range, which is the most common income bracket and makes up 25.9% of all families. Conversely, the $200,000+ income bracket is the least frequent group with only 4 families (1.1%) belonging to this category.
| Income Bracket | # Families | % Families |
| Less than $10,000 | 9 | 2.4% |
| $10,000 to $14,999 | 17 | 4.5% |
| $15,000 to $24,999 | 6 | 1.6% |
| $25,000 to $34,999 | 43 | 11.5% |
| $35,000 to $49,999 | 27 | 7.2% |
| $50,000 to $74,999 | 97 | 25.9% |
| $75,000 to $99,999 | 78 | 20.9% |
| $100,000 to $149,999 | 85 | 22.7% |
| $150,000 to $199,999 | 8 | 2.1% |
| $200,000+ | 4 | 1.1% |
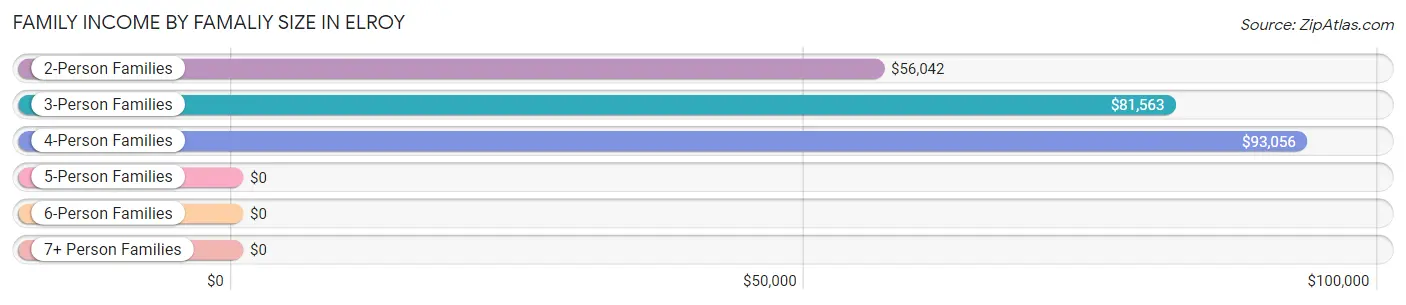
Family Income by Famaliy Size in Elroy
4-person families (68 | 18.2%) account for the highest median family income in Elroy with $93,056 per family, while 2-person families (195 | 52.1%) have the highest median income of $28,021 per family member.
| Income Bracket | # Families | Median Income |
| 2-Person Families | 195 (52.1%) | $56,042 |
| 3-Person Families | 65 (17.4%) | $81,563 |
| 4-Person Families | 68 (18.2%) | $93,056 |
| 5-Person Families | 16 (4.3%) | $0 |
| 6-Person Families | 3 (0.8%) | $0 |
| 7+ Person Families | 27 (7.2%) | $0 |
| Total | 374 (100.0%) | $68,125 |
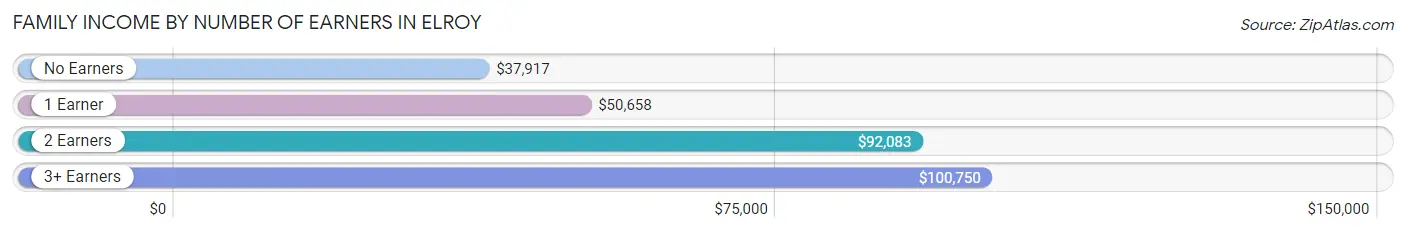
Family Income by Number of Earners in Elroy
The median family income in Elroy is $68,125, with families comprising 3+ earners (31) having the highest median family income of $100,750, while families with no earners (61) have the lowest median family income of $37,917, accounting for 8.3% and 16.3% of families, respectively.
| Number of Earners | # Families | Median Income |
| No Earners | 61 (16.3%) | $37,917 |
| 1 Earner | 118 (31.6%) | $50,658 |
| 2 Earners | 164 (43.9%) | $92,083 |
| 3+ Earners | 31 (8.3%) | $100,750 |
| Total | 374 (100.0%) | $68,125 |
Household Income in Elroy
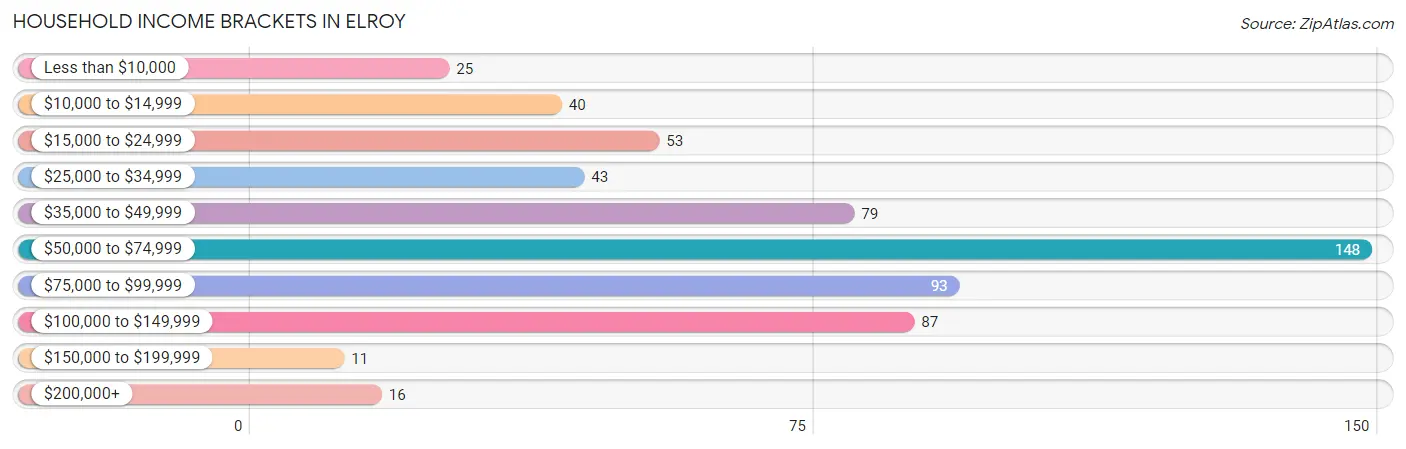
Household Income Brackets in Elroy
With 148 households falling in the category, the $50,000 to $74,999 income range is the most frequent in Elroy, accounting for 24.9% of all households. In contrast, only 11 households (1.8%) fall into the $150,000 to $199,999 income bracket, making it the least populous group.
| Income Bracket | # Households | % Households |
| Less than $10,000 | 25 | 4.2% |
| $10,000 to $14,999 | 40 | 6.7% |
| $15,000 to $24,999 | 53 | 8.9% |
| $25,000 to $34,999 | 43 | 7.2% |
| $35,000 to $49,999 | 79 | 13.3% |
| $50,000 to $74,999 | 148 | 24.9% |
| $75,000 to $99,999 | 93 | 15.6% |
| $100,000 to $149,999 | 87 | 14.6% |
| $150,000 to $199,999 | 11 | 1.8% |
| $200,000+ | 16 | 2.7% |
Household Income by Householder Age in Elroy
The median household income in Elroy is $57,583, with the highest median household income of $64,583 found in the 45 to 64 years age bracket for the primary householder. A total of 175 households (29.4%) fall into this category. Meanwhile, the 65+ years age bracket for the primary householder has the lowest median household income of $38,750, with 194 households (32.6%) in this group.
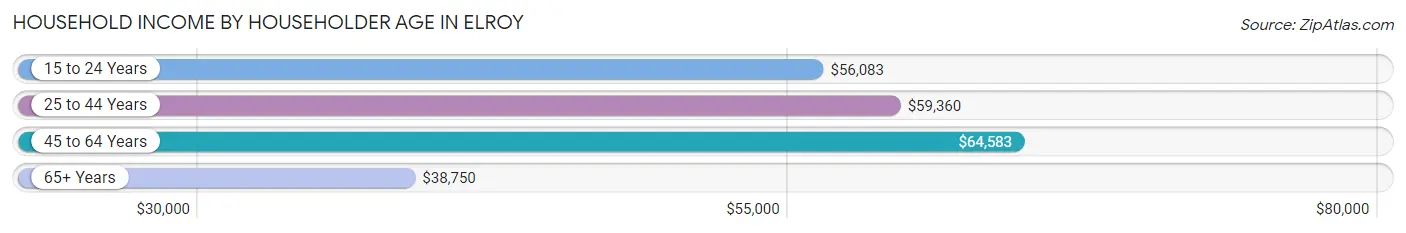
| Income Bracket | # Households | Median Income |
| 15 to 24 Years | 39 (6.6%) | $56,083 |
| 25 to 44 Years | 187 (31.4%) | $59,360 |
| 45 to 64 Years | 175 (29.4%) | $64,583 |
| 65+ Years | 194 (32.6%) | $38,750 |
| Total | 595 (100.0%) | $57,583 |
Poverty in Elroy
Income Below Poverty by Sex and Age in Elroy
With 13.5% poverty level for males and 16.5% for females among the residents of Elroy, 16 and 17 year old males and 16 and 17 year old females are the most vulnerable to poverty, with 7 males (41.2%) and 8 females (72.7%) in their respective age groups living below the poverty level.
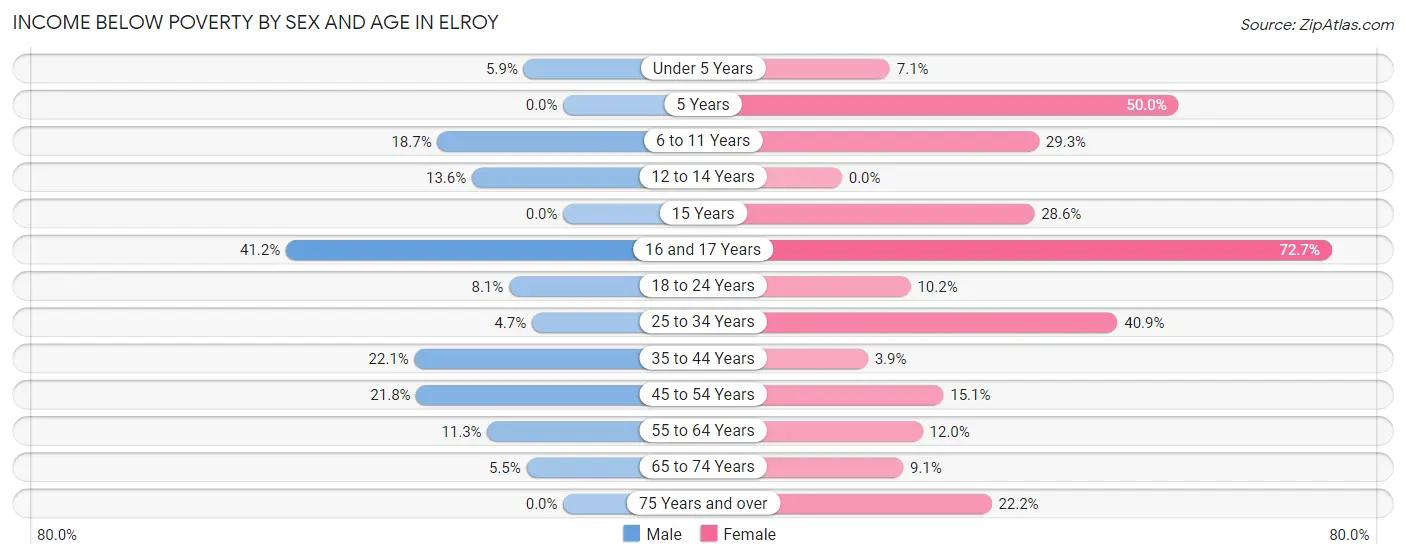
| Age Bracket | Male | Female |
| Under 5 Years | 5 (5.9%) | 3 (7.1%) |
| 5 Years | 0 (0.0%) | 4 (50.0%) |
| 6 to 11 Years | 20 (18.7%) | 12 (29.3%) |
| 12 to 14 Years | 8 (13.6%) | 0 (0.0%) |
| 15 Years | 0 (0.0%) | 2 (28.6%) |
| 16 and 17 Years | 7 (41.2%) | 8 (72.7%) |
| 18 to 24 Years | 7 (8.1%) | 5 (10.2%) |
| 25 to 34 Years | 4 (4.6%) | 27 (40.9%) |
| 35 to 44 Years | 34 (22.1%) | 3 (3.8%) |
| 45 to 54 Years | 12 (21.8%) | 11 (15.1%) |
| 55 to 64 Years | 8 (11.3%) | 12 (12.0%) |
| 65 to 74 Years | 3 (5.4%) | 9 (9.1%) |
| 75 Years and over | 0 (0.0%) | 12 (22.2%) |
| Total | 108 (13.5%) | 108 (16.5%) |
Income Above Poverty by Sex and Age in Elroy
According to the poverty statistics in Elroy, males aged 5 years and females aged 12 to 14 years are the age groups that are most secure financially, with 100.0% of males and 100.0% of females in these age groups living above the poverty line.
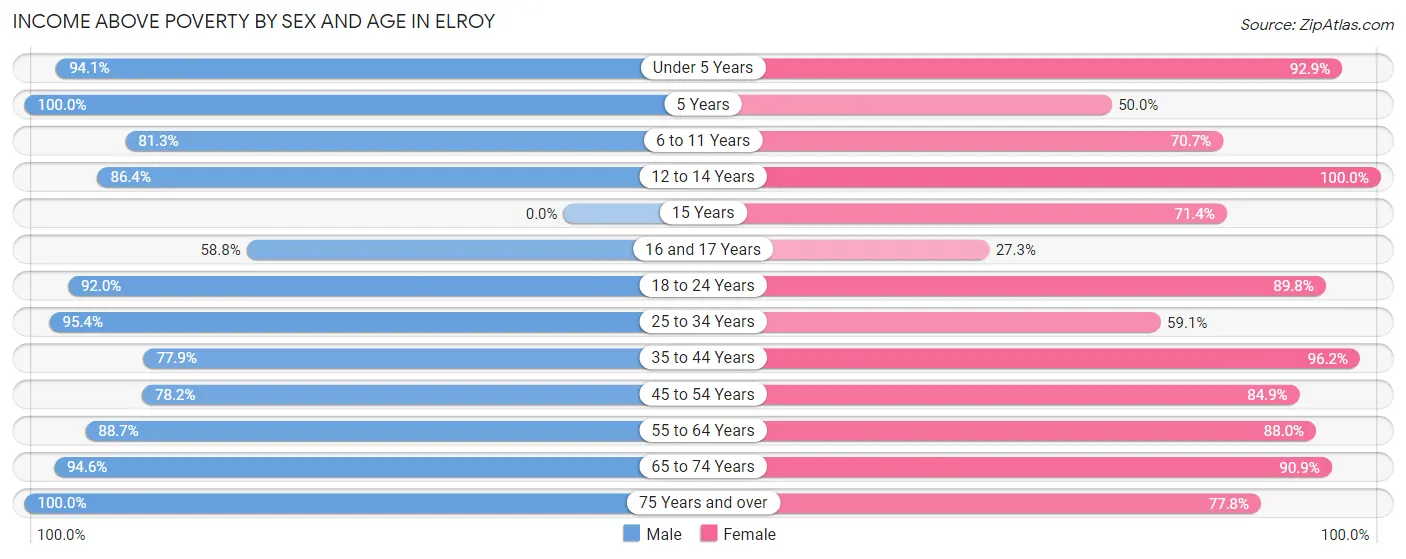
| Age Bracket | Male | Female |
| Under 5 Years | 80 (94.1%) | 39 (92.9%) |
| 5 Years | 6 (100.0%) | 4 (50.0%) |
| 6 to 11 Years | 87 (81.3%) | 29 (70.7%) |
| 12 to 14 Years | 51 (86.4%) | 25 (100.0%) |
| 15 Years | 0 (0.0%) | 5 (71.4%) |
| 16 and 17 Years | 10 (58.8%) | 3 (27.3%) |
| 18 to 24 Years | 80 (91.9%) | 44 (89.8%) |
| 25 to 34 Years | 82 (95.4%) | 39 (59.1%) |
| 35 to 44 Years | 120 (77.9%) | 75 (96.2%) |
| 45 to 54 Years | 43 (78.2%) | 62 (84.9%) |
| 55 to 64 Years | 63 (88.7%) | 88 (88.0%) |
| 65 to 74 Years | 52 (94.6%) | 90 (90.9%) |
| 75 Years and over | 18 (100.0%) | 42 (77.8%) |
| Total | 692 (86.5%) | 545 (83.5%) |
Income Below Poverty Among Married-Couple Families in Elroy
The poverty statistics for married-couple families in Elroy show that 9.8% or 24 of the total 245 families live below the poverty line. Families with 3 or 4 children have the highest poverty rate of 60.0%, comprising of 9 families. On the other hand, families with 5 or more children have the lowest poverty rate of 0.0%, which includes 0 families.
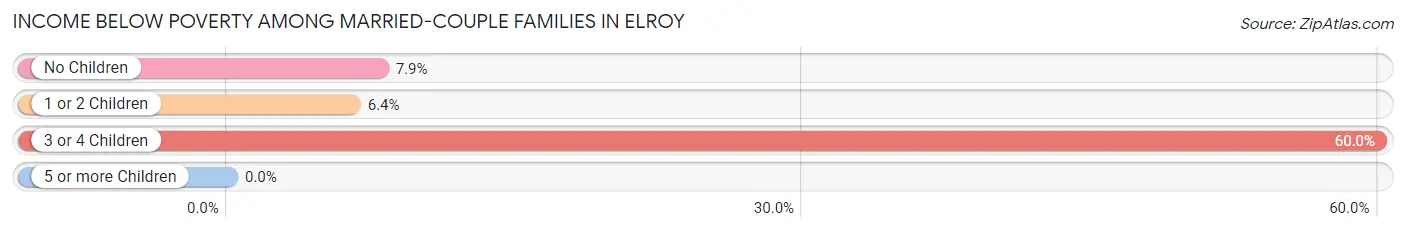
| Children | Above Poverty | Below Poverty |
| No Children | 117 (92.1%) | 10 (7.9%) |
| 1 or 2 Children | 73 (93.6%) | 5 (6.4%) |
| 3 or 4 Children | 6 (40.0%) | 9 (60.0%) |
| 5 or more Children | 25 (100.0%) | 0 (0.0%) |
| Total | 221 (90.2%) | 24 (9.8%) |
Income Below Poverty Among Single-Parent Households in Elroy
According to the poverty data in Elroy, 7.3% or 4 single-father households and 25.7% or 19 single-mother households are living below the poverty line. Among single-father households, those with 1 or 2 children have the highest poverty rate, with 4 households (9.3%) experiencing poverty. Likewise, among single-mother households, those with 3 or 4 children have the highest poverty rate, with 3 households (100.0%) falling below the poverty line.
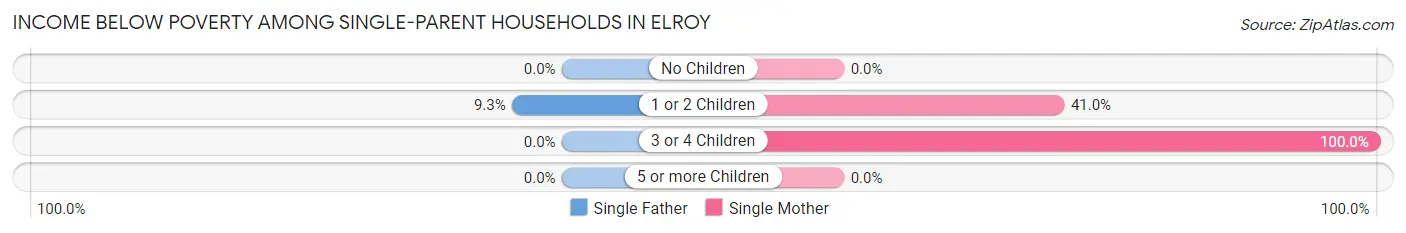
| Children | Single Father | Single Mother |
| No Children | 0 (0.0%) | 0 (0.0%) |
| 1 or 2 Children | 4 (9.3%) | 16 (41.0%) |
| 3 or 4 Children | 0 (0.0%) | 3 (100.0%) |
| 5 or more Children | 0 (0.0%) | 0 (0.0%) |
| Total | 4 (7.3%) | 19 (25.7%) |
Income Below Poverty Among Married-Couple vs Single-Parent Households in Elroy
The poverty data for Elroy shows that 24 of the married-couple family households (9.8%) and 23 of the single-parent households (17.8%) are living below the poverty level. Within the married-couple family households, those with 3 or 4 children have the highest poverty rate, with 9 households (60.0%) falling below the poverty line. Among the single-parent households, those with 3 or 4 children have the highest poverty rate, with 3 household (37.5%) living below poverty.
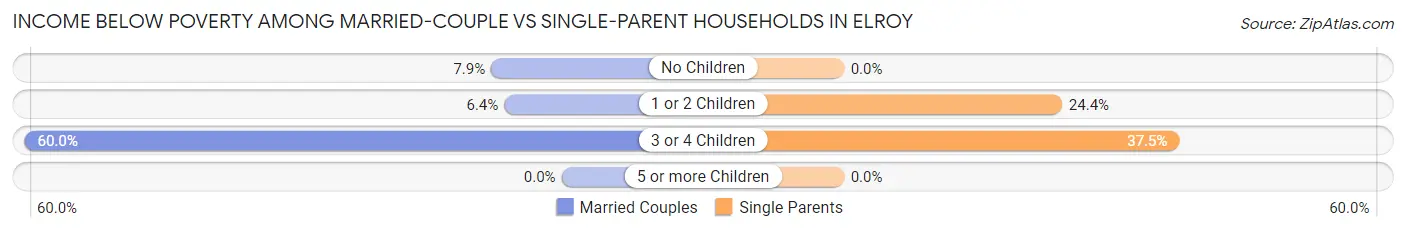
| Children | Married-Couple Families | Single-Parent Households |
| No Children | 10 (7.9%) | 0 (0.0%) |
| 1 or 2 Children | 5 (6.4%) | 20 (24.4%) |
| 3 or 4 Children | 9 (60.0%) | 3 (37.5%) |
| 5 or more Children | 0 (0.0%) | 0 (0.0%) |
| Total | 24 (9.8%) | 23 (17.8%) |
Race in Elroy
The most populous races in Elroy are White / Caucasian (1,443 | 93.5%), Two or more Races (68 | 4.4%), and Black / African American (22 | 1.4%).
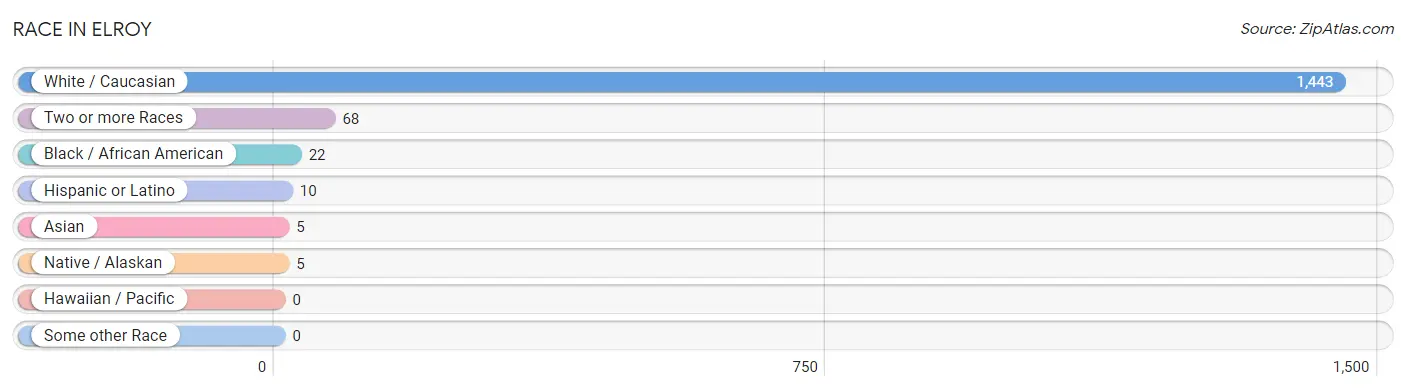
| Race | # Population | % Population |
| Asian | 5 | 0.3% |
| Black / African American | 22 | 1.4% |
| Hawaiian / Pacific | 0 | 0.0% |
| Hispanic or Latino | 10 | 0.6% |
| Native / Alaskan | 5 | 0.3% |
| White / Caucasian | 1,443 | 93.5% |
| Two or more Races | 68 | 4.4% |
| Some other Race | 0 | 0.0% |
| Total | 1,543 | 100.0% |
Ancestry in Elroy
The most populous ancestries reported in Elroy are German (500 | 32.4%), American (217 | 14.1%), Norwegian (161 | 10.4%), Irish (148 | 9.6%), and English (118 | 7.6%), together accounting for 74.1% of all Elroy residents.
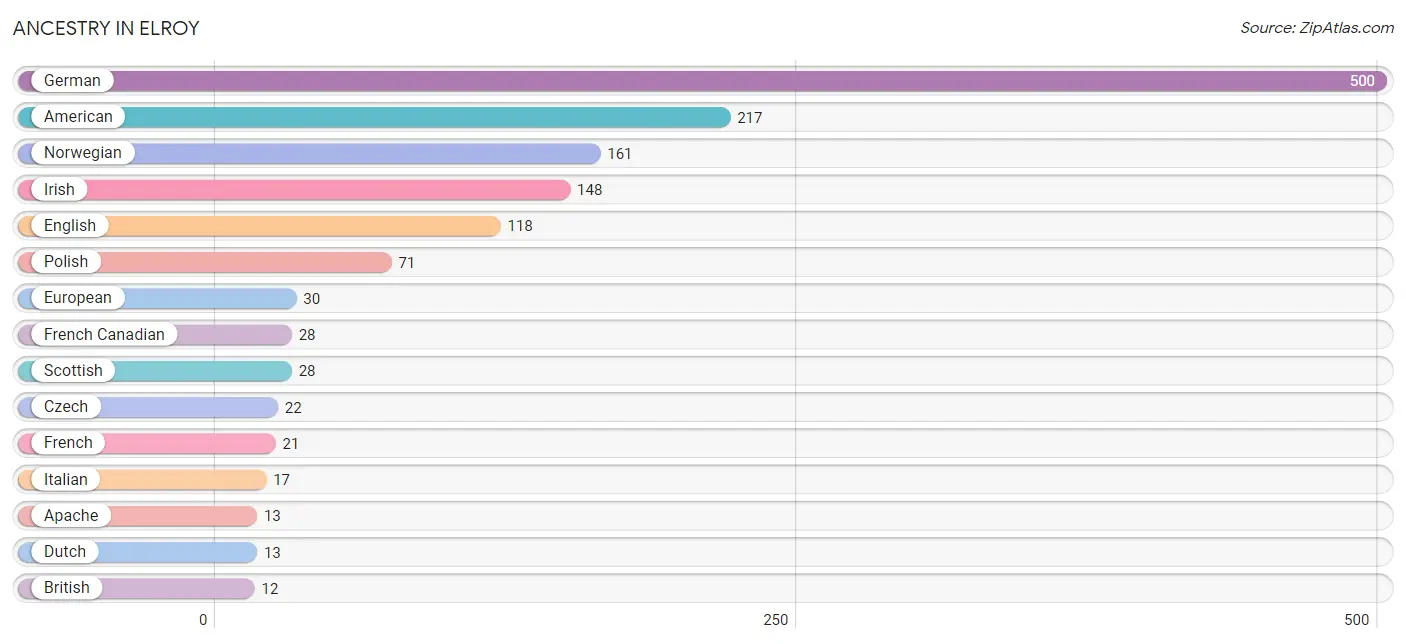
| Ancestry | # Population | % Population |
| American | 217 | 14.1% |
| Apache | 13 | 0.8% |
| Austrian | 10 | 0.6% |
| British | 12 | 0.8% |
| Cherokee | 2 | 0.1% |
| Czech | 22 | 1.4% |
| Danish | 6 | 0.4% |
| Dutch | 13 | 0.8% |
| English | 118 | 7.6% |
| European | 30 | 1.9% |
| French | 21 | 1.4% |
| French American Indian | 3 | 0.2% |
| French Canadian | 28 | 1.8% |
| German | 500 | 32.4% |
| Hungarian | 2 | 0.1% |
| Irish | 148 | 9.6% |
| Italian | 17 | 1.1% |
| Korean | 1 | 0.1% |
| Luxembourger | 6 | 0.4% |
| Mexican | 10 | 0.6% |
| Norwegian | 161 | 10.4% |
| Polish | 71 | 4.6% |
| Scandinavian | 3 | 0.2% |
| Scotch-Irish | 3 | 0.2% |
| Scottish | 28 | 1.8% |
| Swedish | 12 | 0.8% |
| Thai | 5 | 0.3% |
| Ukrainian | 3 | 0.2% | View All 28 Rows |
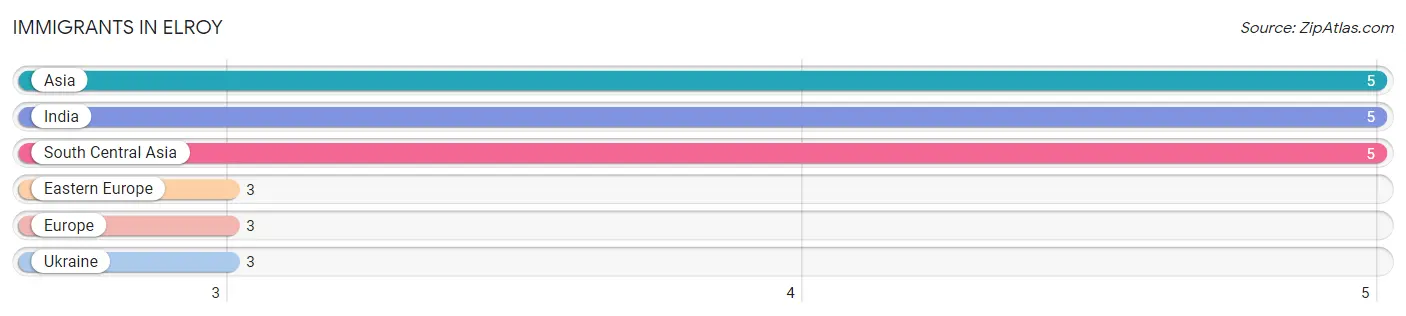
Immigrants in Elroy
The most numerous immigrant groups reported in Elroy came from Asia (5 | 0.3%), India (5 | 0.3%), South Central Asia (5 | 0.3%), Eastern Europe (3 | 0.2%), and Europe (3 | 0.2%), together accounting for 1.3% of all Elroy residents.
| Immigration Origin | # Population | % Population |
| Asia | 5 | 0.3% |
| Eastern Europe | 3 | 0.2% |
| Europe | 3 | 0.2% |
| India | 5 | 0.3% |
| South Central Asia | 5 | 0.3% |
| Ukraine | 3 | 0.2% | View All 6 Rows |
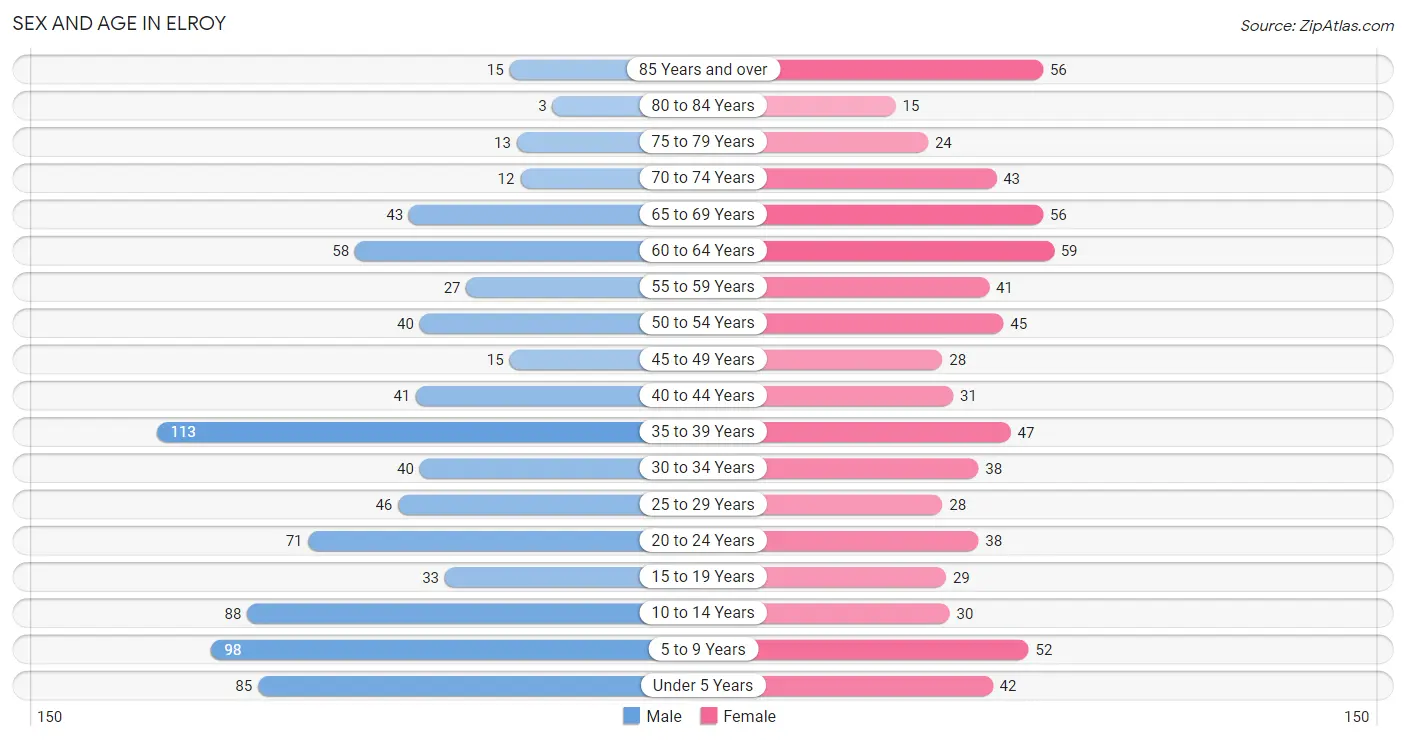
Sex and Age in Elroy
Sex and Age in Elroy
The most populous age groups in Elroy are 35 to 39 Years (113 | 13.4%) for men and 60 to 64 Years (59 | 8.4%) for women.
| Age Bracket | Male | Female |
| Under 5 Years | 85 (10.1%) | 42 (6.0%) |
| 5 to 9 Years | 98 (11.7%) | 52 (7.4%) |
| 10 to 14 Years | 88 (10.5%) | 30 (4.3%) |
| 15 to 19 Years | 33 (3.9%) | 29 (4.1%) |
| 20 to 24 Years | 71 (8.4%) | 38 (5.4%) |
| 25 to 29 Years | 46 (5.5%) | 28 (4.0%) |
| 30 to 34 Years | 40 (4.8%) | 38 (5.4%) |
| 35 to 39 Years | 113 (13.4%) | 47 (6.7%) |
| 40 to 44 Years | 41 (4.9%) | 31 (4.4%) |
| 45 to 49 Years | 15 (1.8%) | 28 (4.0%) |
| 50 to 54 Years | 40 (4.8%) | 45 (6.4%) |
| 55 to 59 Years | 27 (3.2%) | 41 (5.8%) |
| 60 to 64 Years | 58 (6.9%) | 59 (8.4%) |
| 65 to 69 Years | 43 (5.1%) | 56 (8.0%) |
| 70 to 74 Years | 12 (1.4%) | 43 (6.1%) |
| 75 to 79 Years | 13 (1.5%) | 24 (3.4%) |
| 80 to 84 Years | 3 (0.4%) | 15 (2.1%) |
| 85 Years and over | 15 (1.8%) | 56 (8.0%) |
| Total | 841 (100.0%) | 702 (100.0%) |
Families and Households in Elroy
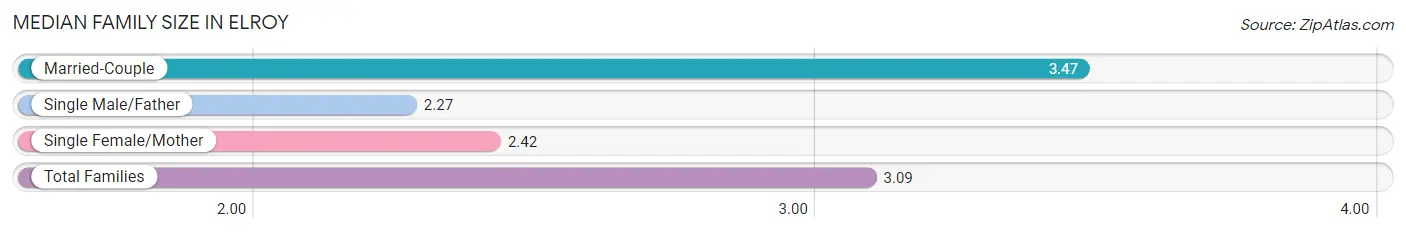
Median Family Size in Elroy
The median family size in Elroy is 3.09 persons per family, with married-couple families (245 | 65.5%) accounting for the largest median family size of 3.47 persons per family. On the other hand, single male/father families (55 | 14.7%) represent the smallest median family size with 2.27 persons per family.
| Family Type | # Families | Family Size |
| Married-Couple | 245 (65.5%) | 3.47 |
| Single Male/Father | 55 (14.7%) | 2.27 |
| Single Female/Mother | 74 (19.8%) | 2.42 |
| Total Families | 374 (100.0%) | 3.09 |
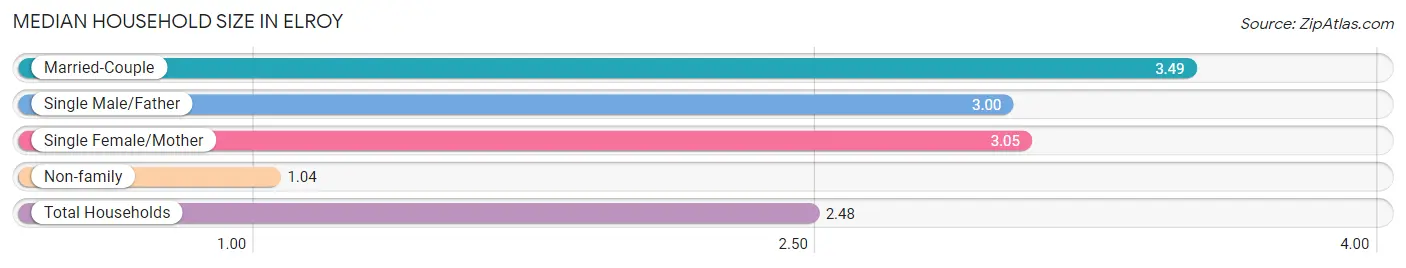
Median Household Size in Elroy
The median household size in Elroy is 2.48 persons per household, with married-couple households (245 | 41.2%) accounting for the largest median household size of 3.49 persons per household. non-family households (221 | 37.1%) represent the smallest median household size with 1.04 persons per household.
| Household Type | # Households | Household Size |
| Married-Couple | 245 (41.2%) | 3.49 |
| Single Male/Father | 55 (9.2%) | 3.00 |
| Single Female/Mother | 74 (12.4%) | 3.05 |
| Non-family | 221 (37.1%) | 1.04 |
| Total Households | 595 (100.0%) | 2.48 |
Household Size by Marriage Status in Elroy
Out of a total of 595 households in Elroy, 374 (62.9%) are family households, while 221 (37.1%) are nonfamily households. The most numerous type of family households are 2-person households, comprising 161, and the most common type of nonfamily households are 1-person households, comprising 213.
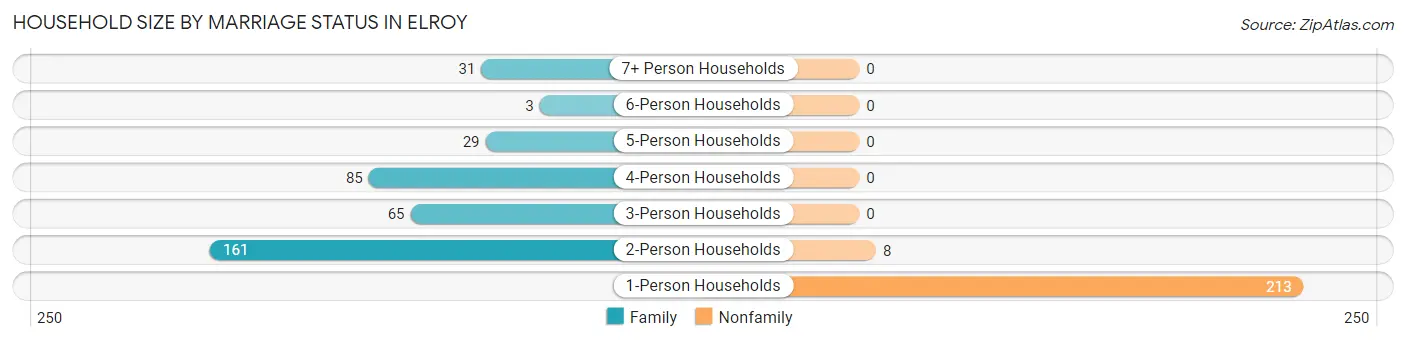
| Household Size | Family Households | Nonfamily Households |
| 1-Person Households | - | 213 (35.8%) |
| 2-Person Households | 161 (27.1%) | 8 (1.3%) |
| 3-Person Households | 65 (10.9%) | 0 (0.0%) |
| 4-Person Households | 85 (14.3%) | 0 (0.0%) |
| 5-Person Households | 29 (4.9%) | 0 (0.0%) |
| 6-Person Households | 3 (0.5%) | 0 (0.0%) |
| 7+ Person Households | 31 (5.2%) | 0 (0.0%) |
| Total | 374 (62.9%) | 221 (37.1%) |
Female Fertility in Elroy
Fertility by Age in Elroy
Average fertility rate in Elroy is 89.0 births per 1,000 women. Women in the age bracket of 20 to 34 years have the highest fertility rate with 212.0 births per 1,000 women. Women in the age bracket of 20 to 34 years acount for 100.0% of all women with births.
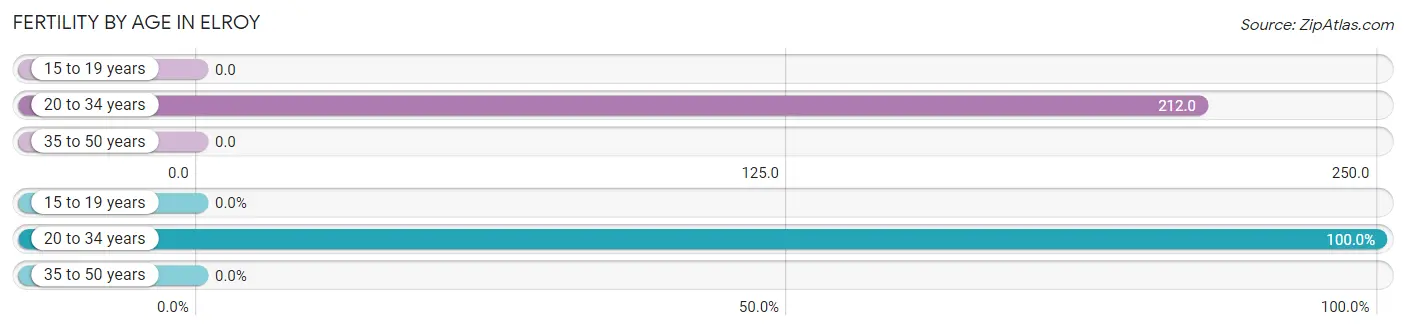
| Age Bracket | Women with Births | Births / 1,000 Women |
| 15 to 19 years | 0 (0.0%) | 0.0 |
| 20 to 34 years | 22 (100.0%) | 212.0 |
| 35 to 50 years | 0 (0.0%) | 0.0 |
| Total | 22 (100.0%) | 89.0 |
Fertility by Age by Marriage Status in Elroy
36.4% of women with births (22) in Elroy are married. The highest percentage of unmarried women with births falls into 20 to 34 years age bracket with 63.6% of them unmarried at the time of birth, while the lowest percentage of unmarried women with births belong to 20 to 34 years age bracket with 63.6% of them unmarried.
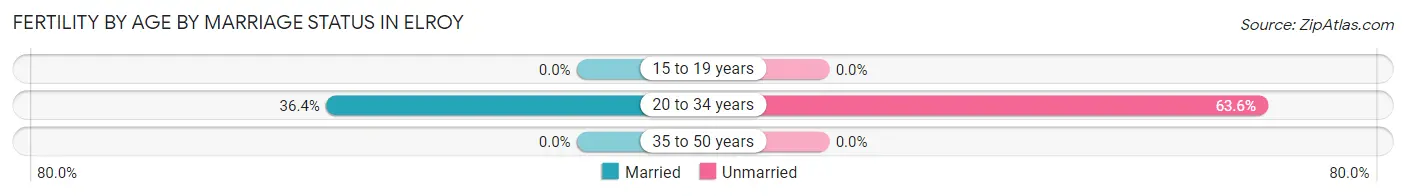
| Age Bracket | Married | Unmarried |
| 15 to 19 years | 0 (0.0%) | 0 (0.0%) |
| 20 to 34 years | 8 (36.4%) | 14 (63.6%) |
| 35 to 50 years | 0 (0.0%) | 0 (0.0%) |
| Total | 8 (36.4%) | 14 (63.6%) |
Fertility by Education in Elroy
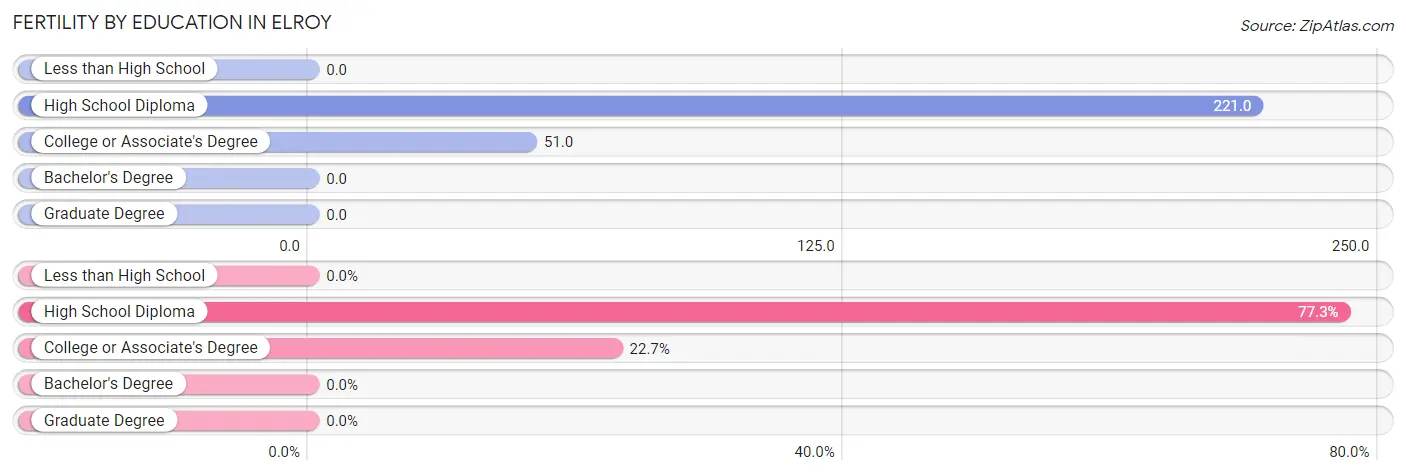
| Educational Attainment | Women with Births | Births / 1,000 Women |
| Less than High School | 0 (0.0%) | 0.0 |
| High School Diploma | 17 (77.3%) | 221.0 |
| College or Associate's Degree | 5 (22.7%) | 51.0 |
| Bachelor's Degree | 0 (0.0%) | 0.0 |
| Graduate Degree | 0 (0.0%) | 0.0 |
| Total | 22 (100.0%) | 89.0 |
Fertility by Education by Marriage Status in Elroy
63.6% of women with births in Elroy are unmarried. Women with the educational attainment of college or associate's degree are most likely to be married with 100.0% of them married at childbirth, while women with the educational attainment of high school diploma are least likely to be married with 82.4% of them unmarried at childbirth.
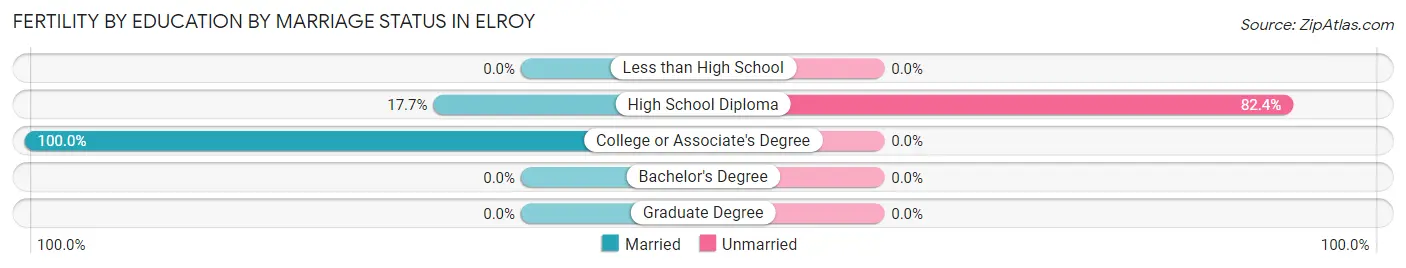
| Educational Attainment | Married | Unmarried |
| Less than High School | 0 (0.0%) | 0 (0.0%) |
| High School Diploma | 3 (17.6%) | 14 (82.4%) |
| College or Associate's Degree | 5 (100.0%) | 0 (0.0%) |
| Bachelor's Degree | 0 (0.0%) | 0 (0.0%) |
| Graduate Degree | 0 (0.0%) | 0 (0.0%) |
| Total | 8 (36.4%) | 14 (63.6%) |
Employment Characteristics in Elroy
Employment by Class of Employer in Elroy
Among the 689 employed individuals in Elroy, private company employees (467 | 67.8%), federal government employees (66 | 9.6%), and local government employees (65 | 9.4%) make up the most common classes of employment.
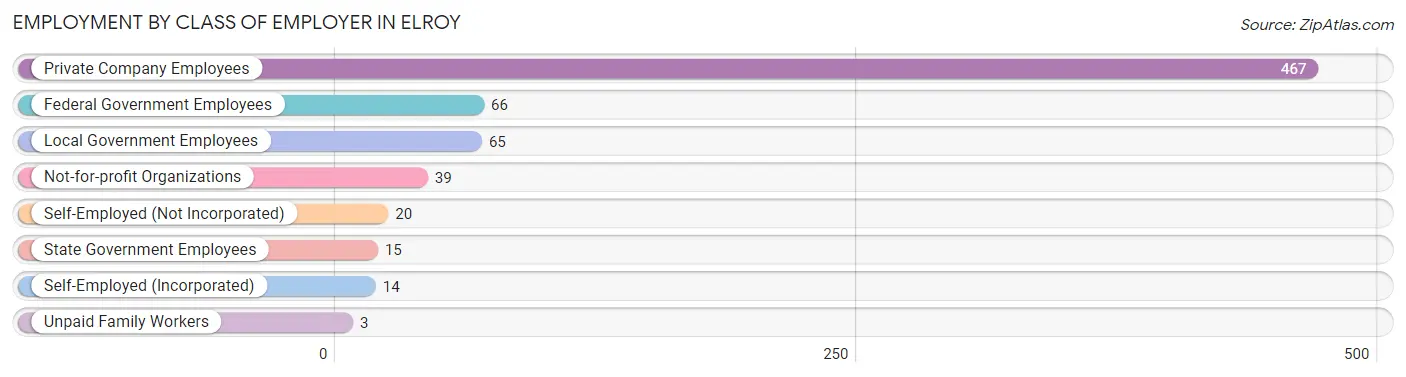
| Employer Class | # Employees | % Employees |
| Private Company Employees | 467 | 67.8% |
| Self-Employed (Incorporated) | 14 | 2.0% |
| Self-Employed (Not Incorporated) | 20 | 2.9% |
| Not-for-profit Organizations | 39 | 5.7% |
| Local Government Employees | 65 | 9.4% |
| State Government Employees | 15 | 2.2% |
| Federal Government Employees | 66 | 9.6% |
| Unpaid Family Workers | 3 | 0.4% |
| Total | 689 | 100.0% |
Employment Status by Age in Elroy
According to the labor force statistics for Elroy, out of the total population over 16 years of age (1,141), 62.8% or 717 individuals are in the labor force, with 1.0% or 7 of them unemployed. The age group with the highest labor force participation rate is 20 to 24 years, with 98.2% or 107 individuals in the labor force. Within the labor force, the 65 to 74 years age range has the highest percentage of unemployed individuals, with 13.6% or 3 of them being unemployed.
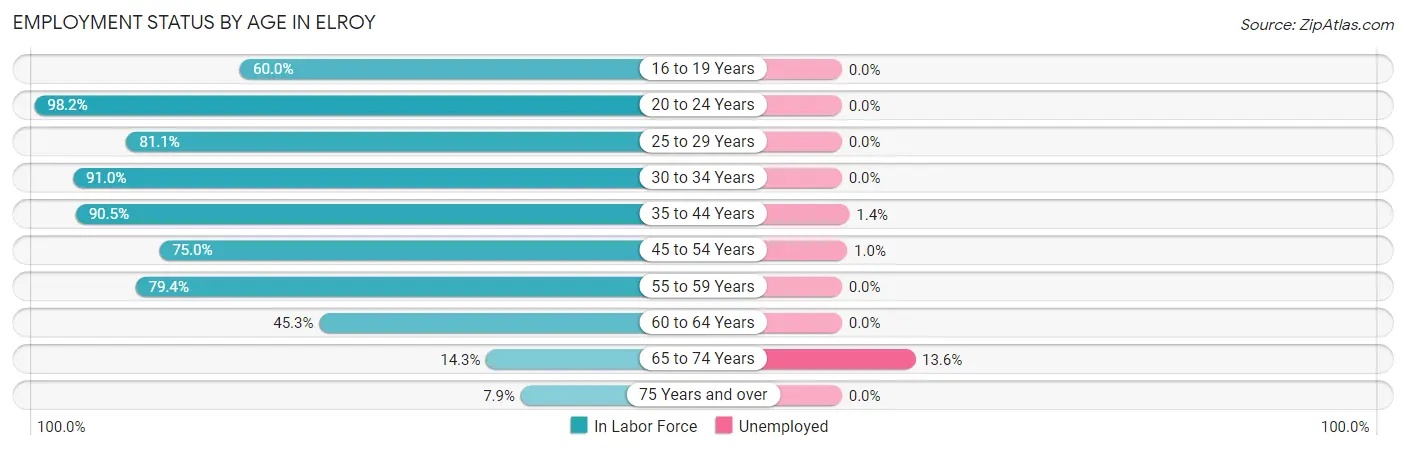
| Age Bracket | In Labor Force | Unemployed |
| 16 to 19 Years | 33 (60.0%) | 0 (0.0%) |
| 20 to 24 Years | 107 (98.2%) | 0 (0.0%) |
| 25 to 29 Years | 60 (81.1%) | 0 (0.0%) |
| 30 to 34 Years | 71 (91.0%) | 0 (0.0%) |
| 35 to 44 Years | 210 (90.5%) | 3 (1.4%) |
| 45 to 54 Years | 96 (75.0%) | 1 (1.0%) |
| 55 to 59 Years | 54 (79.4%) | 0 (0.0%) |
| 60 to 64 Years | 53 (45.3%) | 0 (0.0%) |
| 65 to 74 Years | 22 (14.3%) | 3 (13.6%) |
| 75 Years and over | 10 (7.9%) | 0 (0.0%) |
| Total | 717 (62.8%) | 7 (1.0%) |
Employment Status by Educational Attainment in Elroy
According to labor force statistics for Elroy, 78.0% of individuals (544) out of the total population between 25 and 64 years of age (697) are in the labor force, with 0.7% or 4 of them being unemployed. The group with the highest labor force participation rate are those with the educational attainment of bachelor's degree or higher, with 93.2% or 82 individuals in the labor force. Within the labor force, individuals with college / associate degree education have the highest percentage of unemployment, with 2.0% or 4 of them being unemployed.
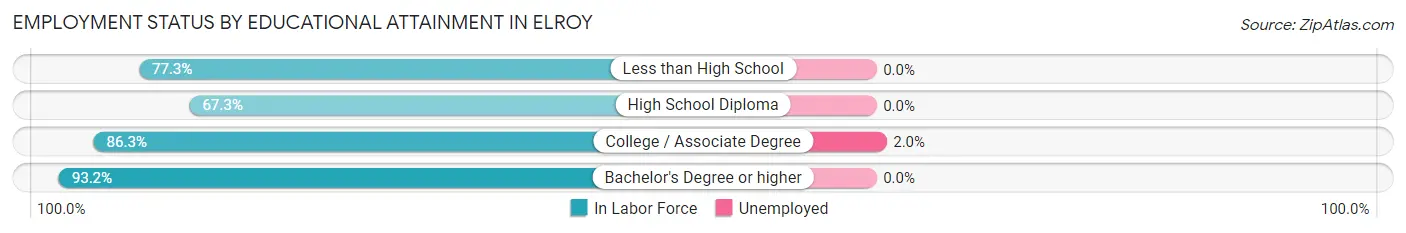
| Educational Attainment | In Labor Force | Unemployed |
| Less than High School | 58 (77.3%) | 0 (0.0%) |
| High School Diploma | 202 (67.3%) | 0 (0.0%) |
| College / Associate Degree | 202 (86.3%) | 5 (2.0%) |
| Bachelor's Degree or higher | 82 (93.2%) | 0 (0.0%) |
| Total | 544 (78.0%) | 5 (0.7%) |
Employment Occupations by Sex in Elroy
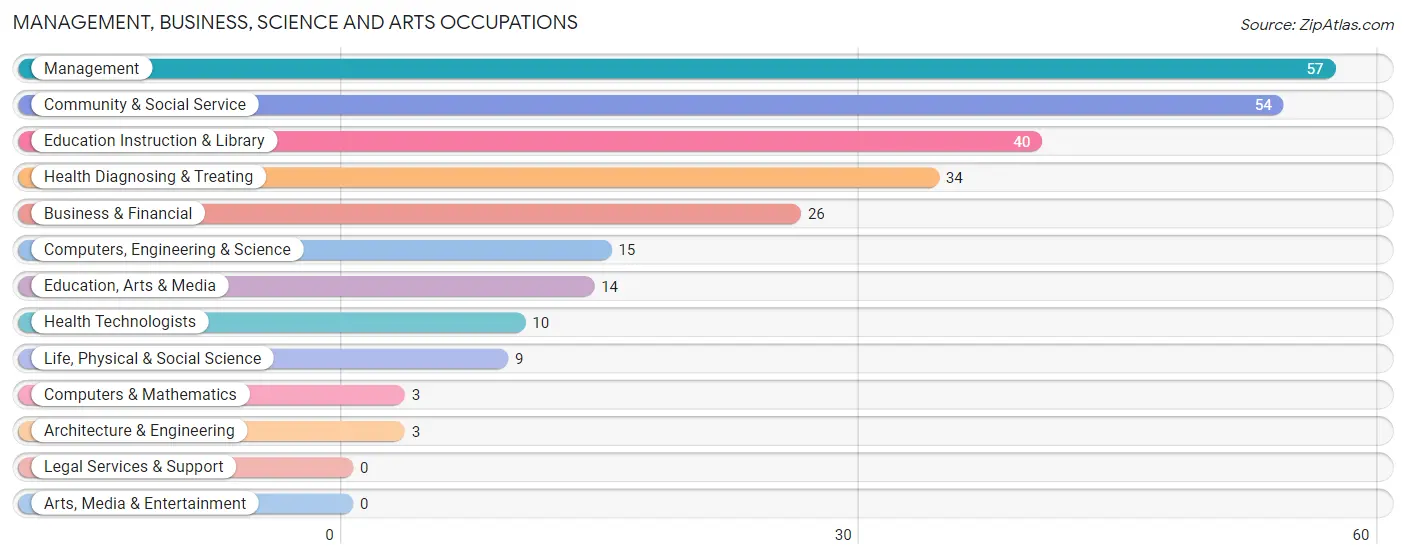
Management, Business, Science and Arts Occupations
The most common Management, Business, Science and Arts occupations in Elroy are Management (57 | 8.0%), Community & Social Service (54 | 7.6%), Education Instruction & Library (40 | 5.6%), Health Diagnosing & Treating (34 | 4.8%), and Business & Financial (26 | 3.7%).
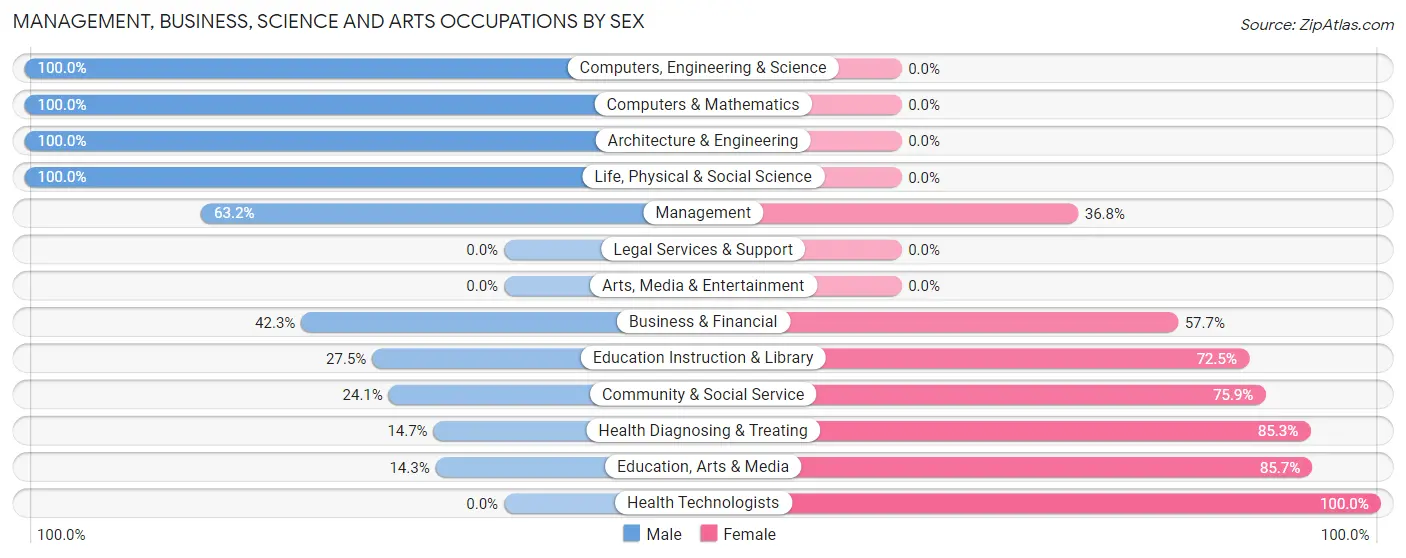
Management, Business, Science and Arts Occupations by Sex
Within the Management, Business, Science and Arts occupations in Elroy, the most male-oriented occupations are Computers, Engineering & Science (100.0%), Computers & Mathematics (100.0%), and Architecture & Engineering (100.0%), while the most female-oriented occupations are Health Technologists (100.0%), Education, Arts & Media (85.7%), and Health Diagnosing & Treating (85.3%).
| Occupation | Male | Female |
| Management | 36 (63.2%) | 21 (36.8%) |
| Business & Financial | 11 (42.3%) | 15 (57.7%) |
| Computers, Engineering & Science | 15 (100.0%) | 0 (0.0%) |
| Computers & Mathematics | 3 (100.0%) | 0 (0.0%) |
| Architecture & Engineering | 3 (100.0%) | 0 (0.0%) |
| Life, Physical & Social Science | 9 (100.0%) | 0 (0.0%) |
| Community & Social Service | 13 (24.1%) | 41 (75.9%) |
| Education, Arts & Media | 2 (14.3%) | 12 (85.7%) |
| Legal Services & Support | 0 (0.0%) | 0 (0.0%) |
| Education Instruction & Library | 11 (27.5%) | 29 (72.5%) |
| Arts, Media & Entertainment | 0 (0.0%) | 0 (0.0%) |
| Health Diagnosing & Treating | 5 (14.7%) | 29 (85.3%) |
| Health Technologists | 0 (0.0%) | 10 (100.0%) |
| Total (Category) | 80 (43.0%) | 106 (57.0%) |
| Total (Overall) | 399 (56.3%) | 310 (43.7%) |
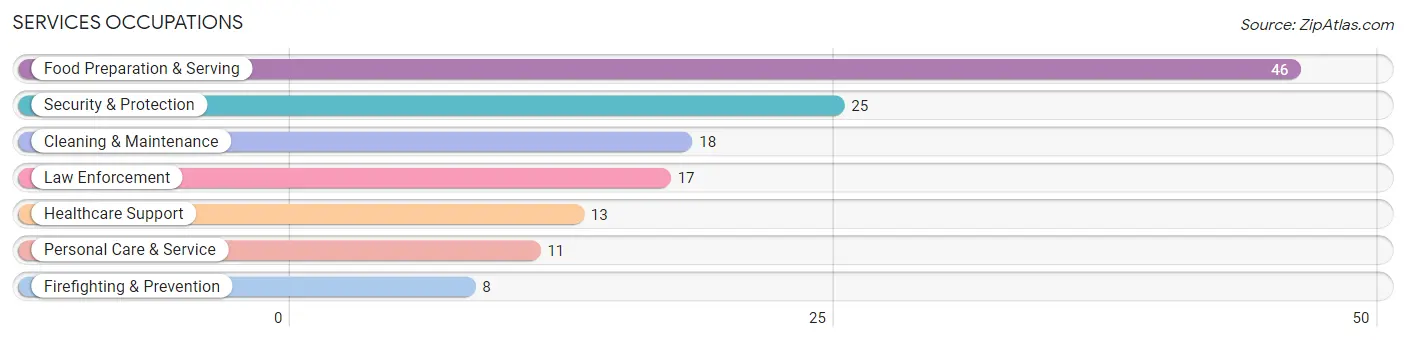
Services Occupations
The most common Services occupations in Elroy are Food Preparation & Serving (46 | 6.5%), Security & Protection (25 | 3.5%), Cleaning & Maintenance (18 | 2.5%), Law Enforcement (17 | 2.4%), and Healthcare Support (13 | 1.8%).
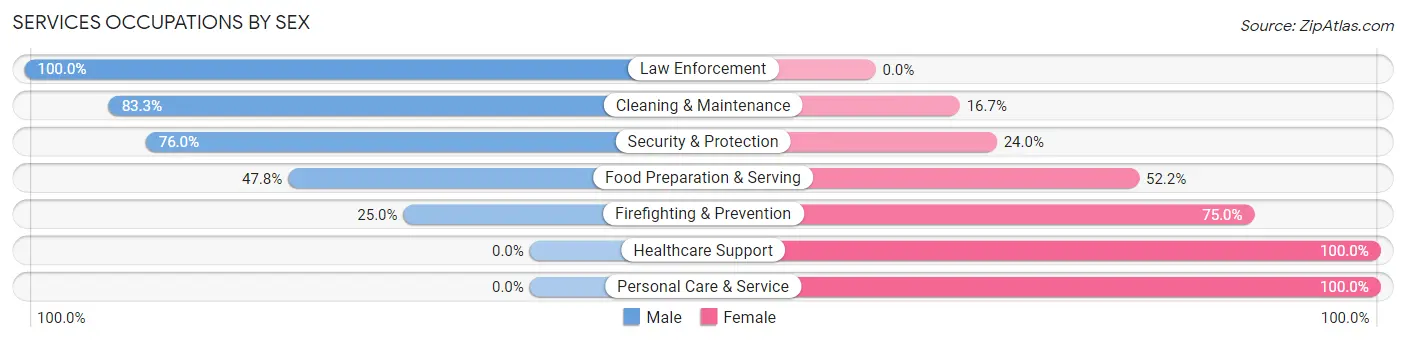
Services Occupations by Sex
Within the Services occupations in Elroy, the most male-oriented occupations are Law Enforcement (100.0%), Cleaning & Maintenance (83.3%), and Security & Protection (76.0%), while the most female-oriented occupations are Healthcare Support (100.0%), Personal Care & Service (100.0%), and Firefighting & Prevention (75.0%).
| Occupation | Male | Female |
| Healthcare Support | 0 (0.0%) | 13 (100.0%) |
| Security & Protection | 19 (76.0%) | 6 (24.0%) |
| Firefighting & Prevention | 2 (25.0%) | 6 (75.0%) |
| Law Enforcement | 17 (100.0%) | 0 (0.0%) |
| Food Preparation & Serving | 22 (47.8%) | 24 (52.2%) |
| Cleaning & Maintenance | 15 (83.3%) | 3 (16.7%) |
| Personal Care & Service | 0 (0.0%) | 11 (100.0%) |
| Total (Category) | 56 (49.6%) | 57 (50.4%) |
| Total (Overall) | 399 (56.3%) | 310 (43.7%) |
Sales and Office Occupations
The most common Sales and Office occupations in Elroy are Office & Administration (120 | 16.9%), and Sales & Related (46 | 6.5%).

Sales and Office Occupations by Sex
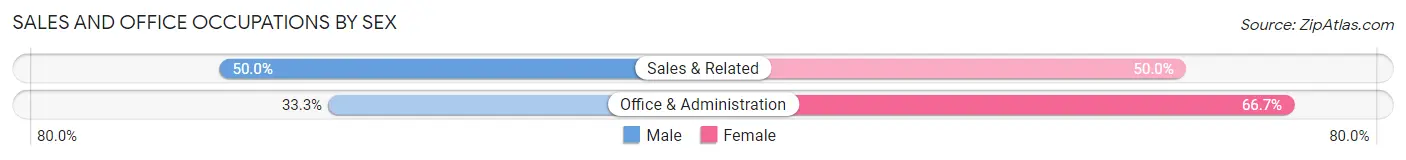
| Occupation | Male | Female |
| Sales & Related | 23 (50.0%) | 23 (50.0%) |
| Office & Administration | 40 (33.3%) | 80 (66.7%) |
| Total (Category) | 63 (38.0%) | 103 (62.1%) |
| Total (Overall) | 399 (56.3%) | 310 (43.7%) |
Natural Resources, Construction and Maintenance Occupations
The most common Natural Resources, Construction and Maintenance occupations in Elroy are Construction & Extraction (22 | 3.1%), and Installation, Maintenance & Repair (5 | 0.7%).

Natural Resources, Construction and Maintenance Occupations by Sex
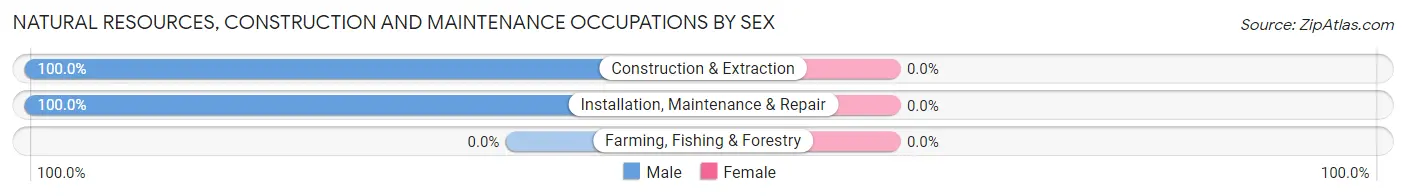
| Occupation | Male | Female |
| Farming, Fishing & Forestry | 0 (0.0%) | 0 (0.0%) |
| Construction & Extraction | 22 (100.0%) | 0 (0.0%) |
| Installation, Maintenance & Repair | 5 (100.0%) | 0 (0.0%) |
| Total (Category) | 27 (100.0%) | 0 (0.0%) |
| Total (Overall) | 399 (56.3%) | 310 (43.7%) |
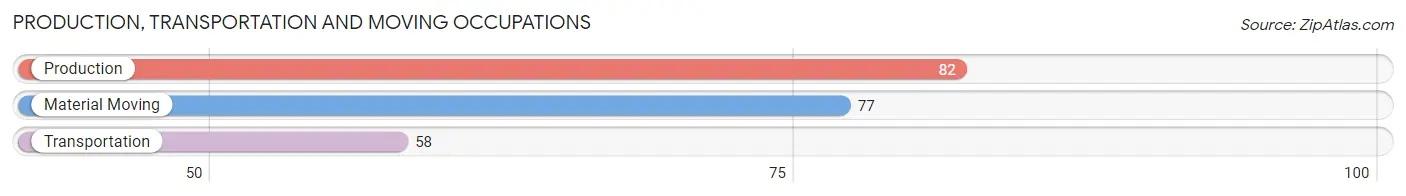
Production, Transportation and Moving Occupations
The most common Production, Transportation and Moving occupations in Elroy are Production (82 | 11.6%), Material Moving (77 | 10.9%), and Transportation (58 | 8.2%).
Production, Transportation and Moving Occupations by Sex
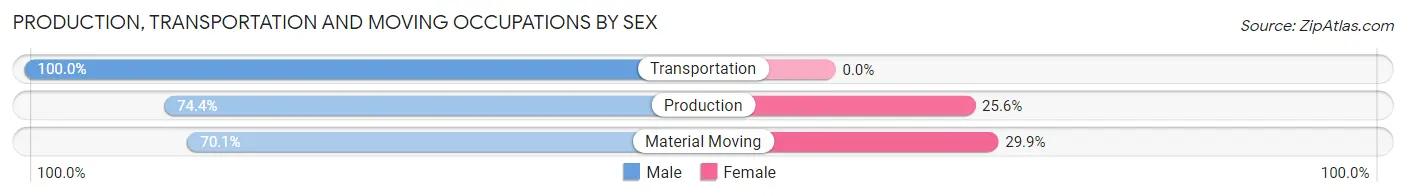
| Occupation | Male | Female |
| Production | 61 (74.4%) | 21 (25.6%) |
| Transportation | 58 (100.0%) | 0 (0.0%) |
| Material Moving | 54 (70.1%) | 23 (29.9%) |
| Total (Category) | 173 (79.7%) | 44 (20.3%) |
| Total (Overall) | 399 (56.3%) | 310 (43.7%) |
Employment Industries by Sex in Elroy
Employment Industries in Elroy
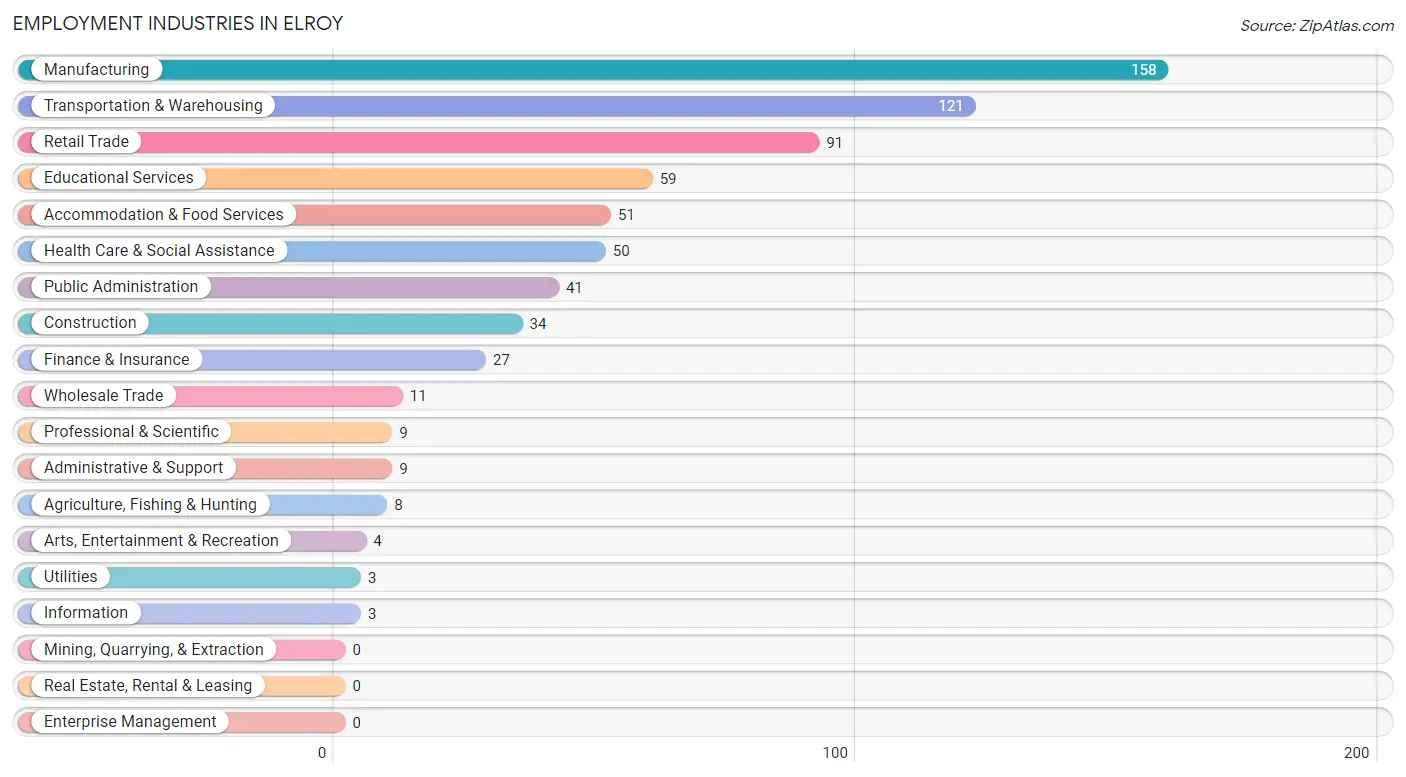
The major employment industries in Elroy include Manufacturing (158 | 22.3%), Transportation & Warehousing (121 | 17.1%), Retail Trade (91 | 12.8%), Educational Services (59 | 8.3%), and Accommodation & Food Services (51 | 7.2%).
Employment Industries by Sex in Elroy
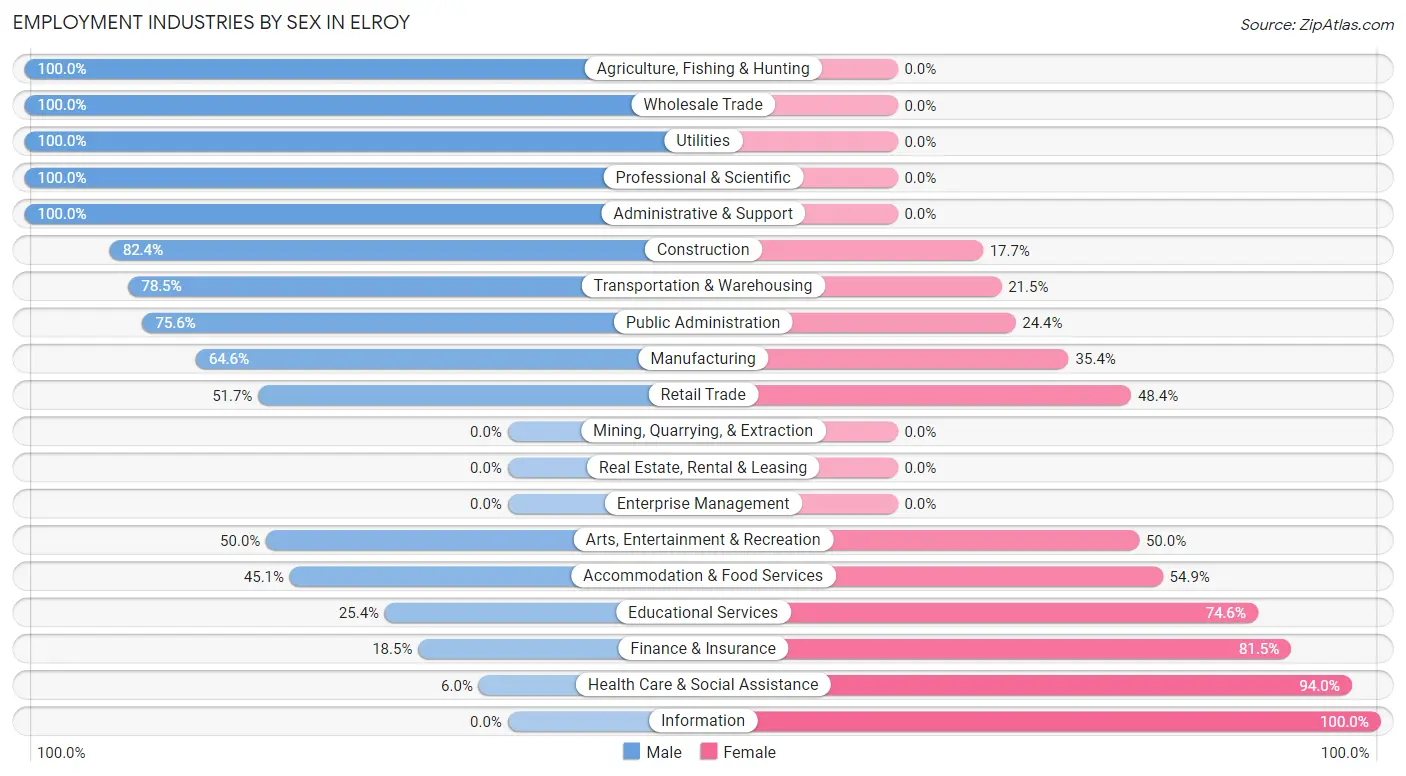
The Elroy industries that see more men than women are Agriculture, Fishing & Hunting (100.0%), Wholesale Trade (100.0%), and Utilities (100.0%), whereas the industries that tend to have a higher number of women are Information (100.0%), Health Care & Social Assistance (94.0%), and Finance & Insurance (81.5%).
| Industry | Male | Female |
| Agriculture, Fishing & Hunting | 8 (100.0%) | 0 (0.0%) |
| Mining, Quarrying, & Extraction | 0 (0.0%) | 0 (0.0%) |
| Construction | 28 (82.4%) | 6 (17.6%) |
| Manufacturing | 102 (64.6%) | 56 (35.4%) |
| Wholesale Trade | 11 (100.0%) | 0 (0.0%) |
| Retail Trade | 47 (51.6%) | 44 (48.3%) |
| Transportation & Warehousing | 95 (78.5%) | 26 (21.5%) |
| Utilities | 3 (100.0%) | 0 (0.0%) |
| Information | 0 (0.0%) | 3 (100.0%) |
| Finance & Insurance | 5 (18.5%) | 22 (81.5%) |
| Real Estate, Rental & Leasing | 0 (0.0%) | 0 (0.0%) |
| Professional & Scientific | 9 (100.0%) | 0 (0.0%) |
| Enterprise Management | 0 (0.0%) | 0 (0.0%) |
| Administrative & Support | 9 (100.0%) | 0 (0.0%) |
| Educational Services | 15 (25.4%) | 44 (74.6%) |
| Health Care & Social Assistance | 3 (6.0%) | 47 (94.0%) |
| Arts, Entertainment & Recreation | 2 (50.0%) | 2 (50.0%) |
| Accommodation & Food Services | 23 (45.1%) | 28 (54.9%) |
| Public Administration | 31 (75.6%) | 10 (24.4%) |
| Total | 399 (56.3%) | 310 (43.7%) |
Education in Elroy
School Enrollment in Elroy
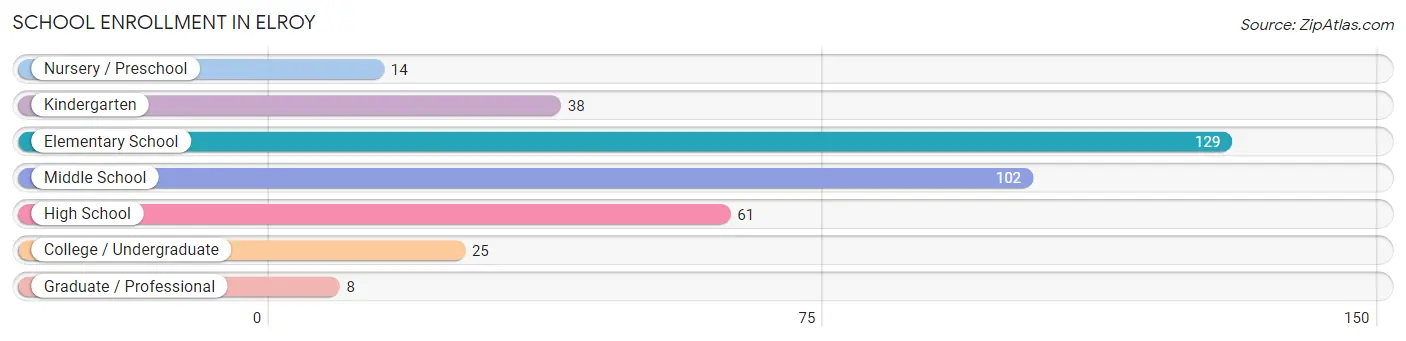
The most common levels of schooling among the 377 students in Elroy are elementary school (129 | 34.2%), middle school (102 | 27.1%), and high school (61 | 16.2%).
| School Level | # Students | % Students |
| Nursery / Preschool | 14 | 3.7% |
| Kindergarten | 38 | 10.1% |
| Elementary School | 129 | 34.2% |
| Middle School | 102 | 27.1% |
| High School | 61 | 16.2% |
| College / Undergraduate | 25 | 6.6% |
| Graduate / Professional | 8 | 2.1% |
| Total | 377 | 100.0% |
School Enrollment by Age by Funding Source in Elroy
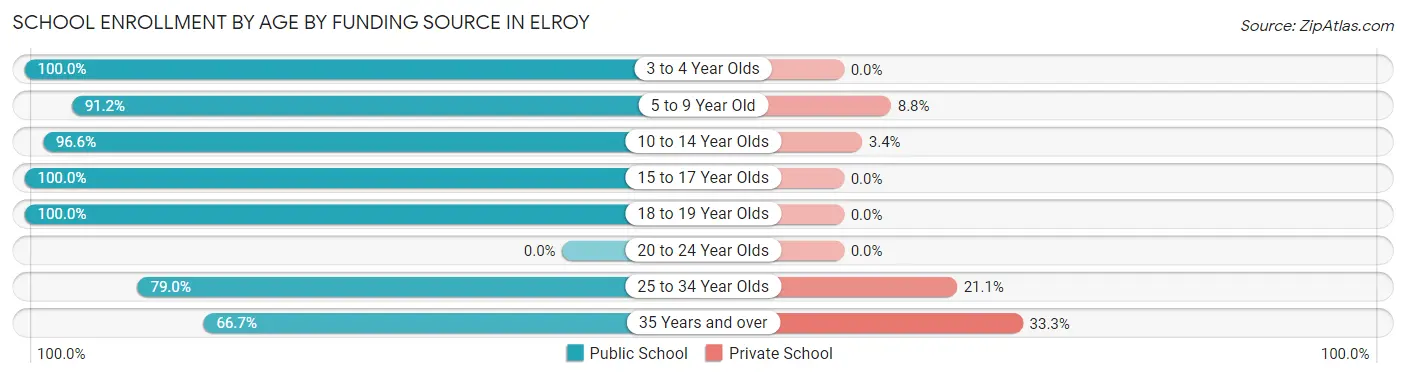
Out of a total of 377 students who are enrolled in schools in Elroy, 25 (6.6%) attend a private institution, while the remaining 352 (93.4%) are enrolled in public schools. The age group of 35 years and over has the highest likelihood of being enrolled in private schools, with 4 (33.3% in the age bracket) enrolled. Conversely, the age group of 3 to 4 year olds has the lowest likelihood of being enrolled in a private school, with 33 (100.0% in the age bracket) attending a public institution.
| Age Bracket | Public School | Private School |
| 3 to 4 Year Olds | 33 (100.0%) | 0 (0.0%) |
| 5 to 9 Year Old | 135 (91.2%) | 13 (8.8%) |
| 10 to 14 Year Olds | 114 (96.6%) | 4 (3.4%) |
| 15 to 17 Year Olds | 35 (100.0%) | 0 (0.0%) |
| 18 to 19 Year Olds | 12 (100.0%) | 0 (0.0%) |
| 20 to 24 Year Olds | 0 (0.0%) | 0 (0.0%) |
| 25 to 34 Year Olds | 15 (78.9%) | 4 (21.0%) |
| 35 Years and over | 8 (66.7%) | 4 (33.3%) |
| Total | 352 (93.4%) | 25 (6.6%) |
Educational Attainment by Field of Study in Elroy
Education (53 | 29.4%), arts & humanities (25 | 13.9%), business (24 | 13.3%), science & technology (20 | 11.1%), and social sciences (18 | 10.0%) are the most common fields of study among 180 individuals in Elroy who have obtained a bachelor's degree or higher.
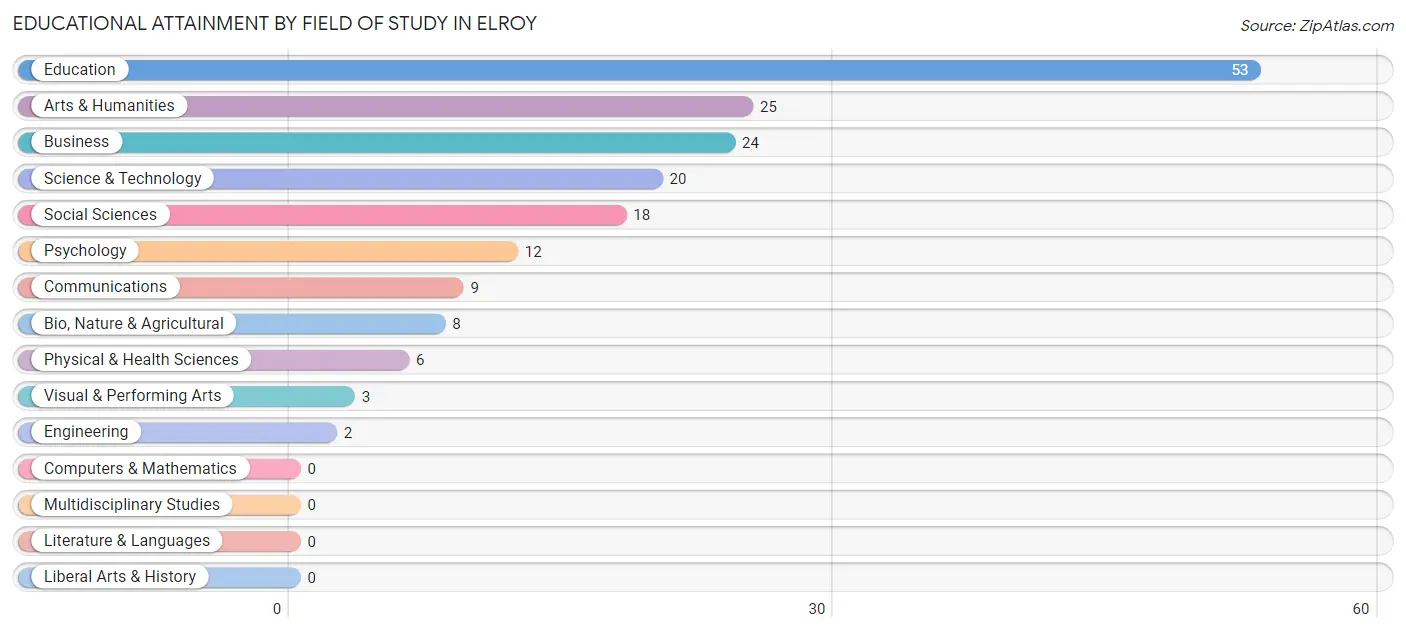
| Field of Study | # Graduates | % Graduates |
| Computers & Mathematics | 0 | 0.0% |
| Bio, Nature & Agricultural | 8 | 4.4% |
| Physical & Health Sciences | 6 | 3.3% |
| Psychology | 12 | 6.7% |
| Social Sciences | 18 | 10.0% |
| Engineering | 2 | 1.1% |
| Multidisciplinary Studies | 0 | 0.0% |
| Science & Technology | 20 | 11.1% |
| Business | 24 | 13.3% |
| Education | 53 | 29.4% |
| Literature & Languages | 0 | 0.0% |
| Liberal Arts & History | 0 | 0.0% |
| Visual & Performing Arts | 3 | 1.7% |
| Communications | 9 | 5.0% |
| Arts & Humanities | 25 | 13.9% |
| Total | 180 | 100.0% |
Transportation & Commute in Elroy
Vehicle Availability by Sex in Elroy
The most prevalent vehicle ownership categories in Elroy are males with 2 vehicles (197, accounting for 50.0%) and females with 2 vehicles (169, making up 66.8%).
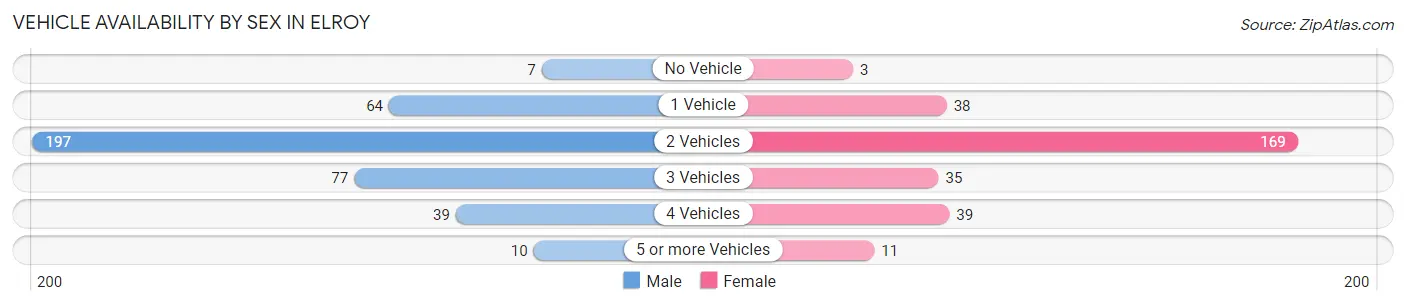
| Vehicles Available | Male | Female |
| No Vehicle | 7 (1.8%) | 3 (1.0%) |
| 1 Vehicle | 64 (16.2%) | 38 (12.9%) |
| 2 Vehicles | 197 (50.0%) | 169 (57.3%) |
| 3 Vehicles | 77 (19.5%) | 35 (11.9%) |
| 4 Vehicles | 39 (9.9%) | 39 (13.2%) |
| 5 or more Vehicles | 10 (2.5%) | 11 (3.7%) |
| Total | 394 (100.0%) | 295 (100.0%) |
Commute Time in Elroy
The most frequently occuring commute durations in Elroy are 5 to 9 minutes (142 commuters, 21.5%), 15 to 19 minutes (100 commuters, 15.1%), and less than 5 minutes (99 commuters, 15.0%).
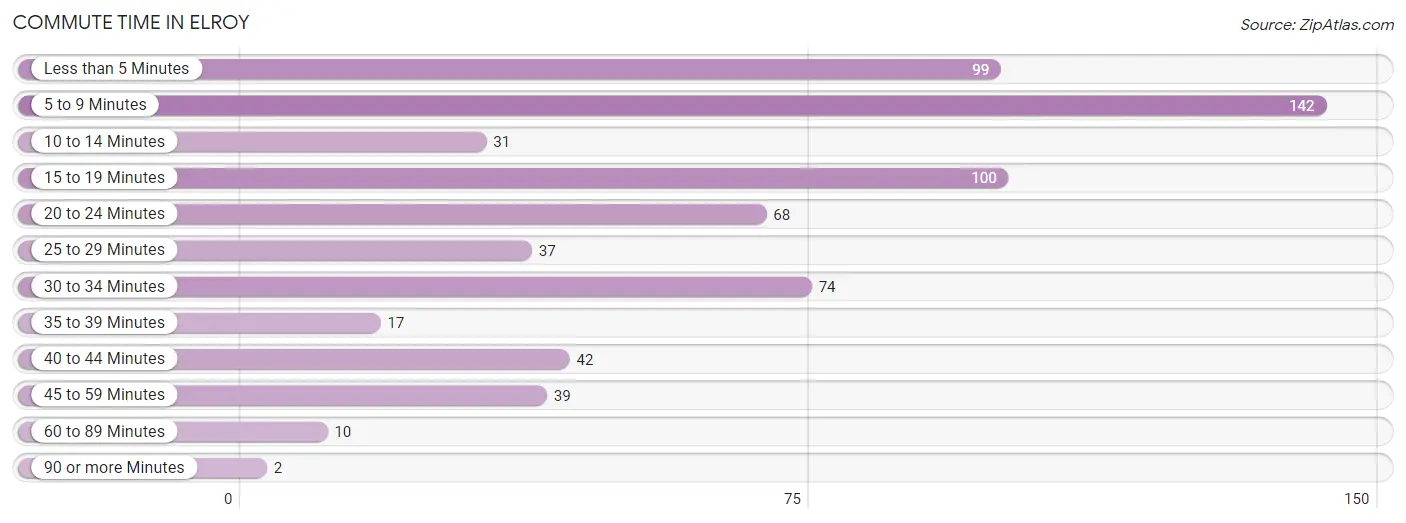
| Commute Time | # Commuters | % Commuters |
| Less than 5 Minutes | 99 | 15.0% |
| 5 to 9 Minutes | 142 | 21.5% |
| 10 to 14 Minutes | 31 | 4.7% |
| 15 to 19 Minutes | 100 | 15.1% |
| 20 to 24 Minutes | 68 | 10.3% |
| 25 to 29 Minutes | 37 | 5.6% |
| 30 to 34 Minutes | 74 | 11.2% |
| 35 to 39 Minutes | 17 | 2.6% |
| 40 to 44 Minutes | 42 | 6.4% |
| 45 to 59 Minutes | 39 | 5.9% |
| 60 to 89 Minutes | 10 | 1.5% |
| 90 or more Minutes | 2 | 0.3% |
Commute Time by Sex in Elroy
The most common commute times in Elroy are 20 to 24 minutes (66 commuters, 18.0%) for males and 5 to 9 minutes (83 commuters, 28.1%) for females.
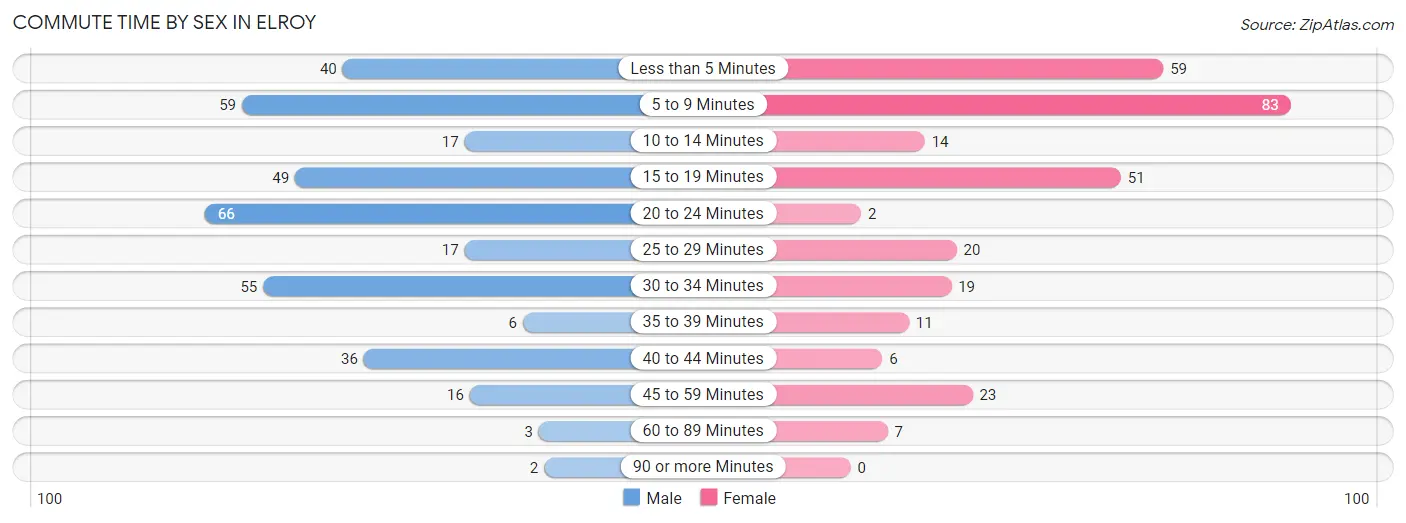
| Commute Time | Male | Female |
| Less than 5 Minutes | 40 (10.9%) | 59 (20.0%) |
| 5 to 9 Minutes | 59 (16.1%) | 83 (28.1%) |
| 10 to 14 Minutes | 17 (4.6%) | 14 (4.8%) |
| 15 to 19 Minutes | 49 (13.4%) | 51 (17.3%) |
| 20 to 24 Minutes | 66 (18.0%) | 2 (0.7%) |
| 25 to 29 Minutes | 17 (4.6%) | 20 (6.8%) |
| 30 to 34 Minutes | 55 (15.0%) | 19 (6.4%) |
| 35 to 39 Minutes | 6 (1.6%) | 11 (3.7%) |
| 40 to 44 Minutes | 36 (9.8%) | 6 (2.0%) |
| 45 to 59 Minutes | 16 (4.4%) | 23 (7.8%) |
| 60 to 89 Minutes | 3 (0.8%) | 7 (2.4%) |
| 90 or more Minutes | 2 (0.5%) | 0 (0.0%) |
Time of Departure to Work by Sex in Elroy
The most frequent times of departure to work in Elroy are 12:00 PM to 3:59 PM (65, 17.8%) for males and 7:30 AM to 7:59 AM (78, 26.4%) for females.
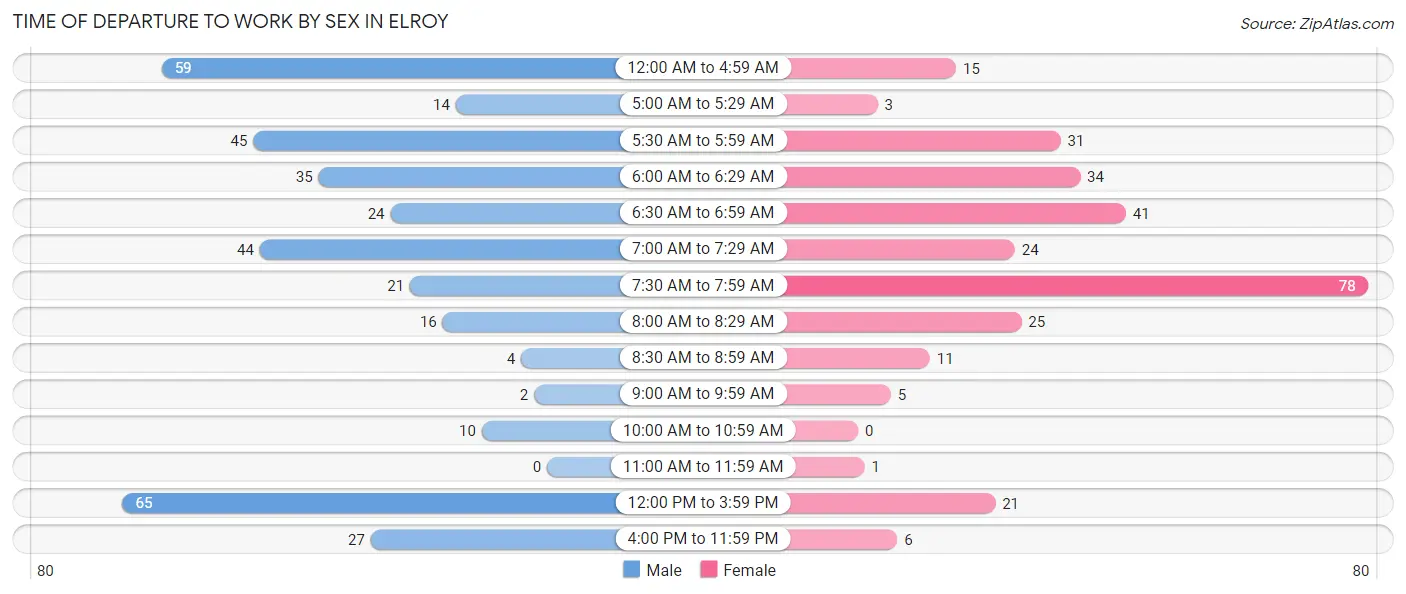
| Time of Departure | Male | Female |
| 12:00 AM to 4:59 AM | 59 (16.1%) | 15 (5.1%) |
| 5:00 AM to 5:29 AM | 14 (3.8%) | 3 (1.0%) |
| 5:30 AM to 5:59 AM | 45 (12.3%) | 31 (10.5%) |
| 6:00 AM to 6:29 AM | 35 (9.6%) | 34 (11.5%) |
| 6:30 AM to 6:59 AM | 24 (6.6%) | 41 (13.9%) |
| 7:00 AM to 7:29 AM | 44 (12.0%) | 24 (8.1%) |
| 7:30 AM to 7:59 AM | 21 (5.7%) | 78 (26.4%) |
| 8:00 AM to 8:29 AM | 16 (4.4%) | 25 (8.5%) |
| 8:30 AM to 8:59 AM | 4 (1.1%) | 11 (3.7%) |
| 9:00 AM to 9:59 AM | 2 (0.5%) | 5 (1.7%) |
| 10:00 AM to 10:59 AM | 10 (2.7%) | 0 (0.0%) |
| 11:00 AM to 11:59 AM | 0 (0.0%) | 1 (0.3%) |
| 12:00 PM to 3:59 PM | 65 (17.8%) | 21 (7.1%) |
| 4:00 PM to 11:59 PM | 27 (7.4%) | 6 (2.0%) |
| Total | 366 (100.0%) | 295 (100.0%) |
Housing Occupancy in Elroy
Occupancy by Ownership in Elroy
Of the total 595 dwellings in Elroy, owner-occupied units account for 435 (73.1%), while renter-occupied units make up 160 (26.9%).
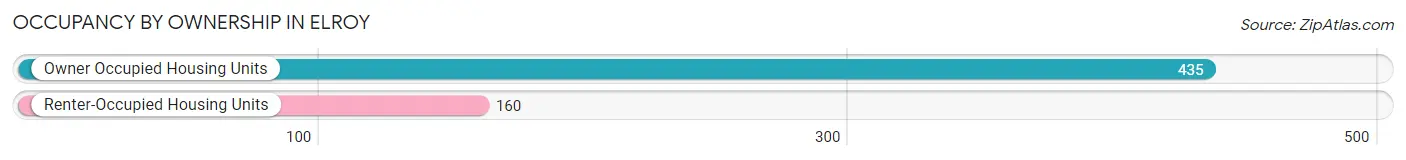
| Occupancy | # Housing Units | % Housing Units |
| Owner Occupied Housing Units | 435 | 73.1% |
| Renter-Occupied Housing Units | 160 | 26.9% |
| Total Occupied Housing Units | 595 | 100.0% |
Occupancy by Household Size in Elroy
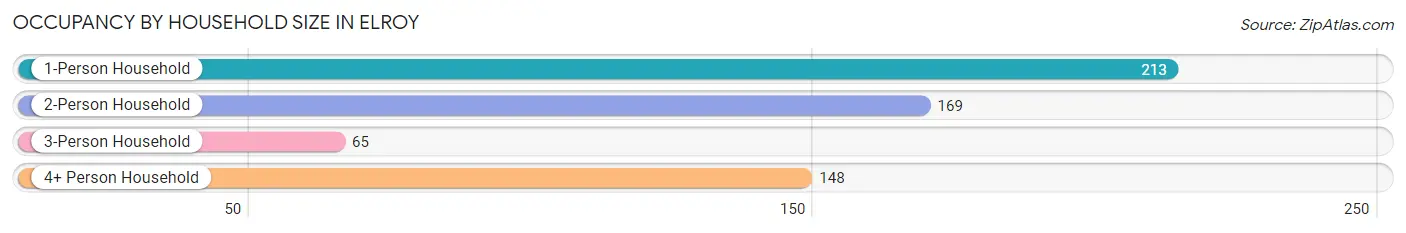
| Household Size | # Housing Units | % Housing Units |
| 1-Person Household | 213 | 35.8% |
| 2-Person Household | 169 | 28.4% |
| 3-Person Household | 65 | 10.9% |
| 4+ Person Household | 148 | 24.9% |
| Total Housing Units | 595 | 100.0% |
Occupancy by Ownership by Household Size in Elroy
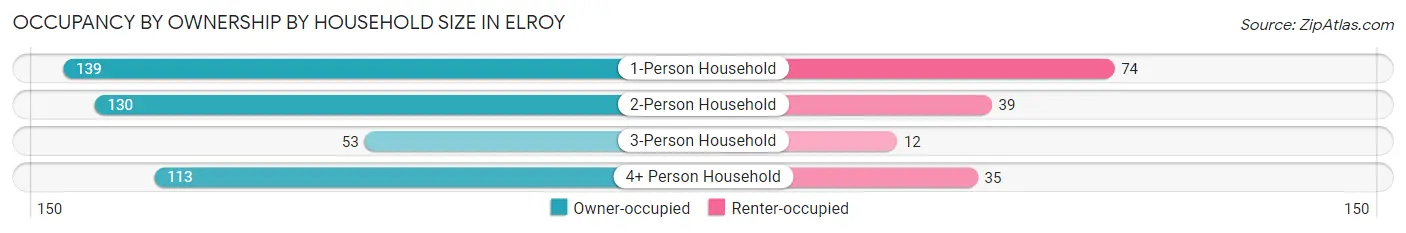
| Household Size | Owner-occupied | Renter-occupied |
| 1-Person Household | 139 (65.3%) | 74 (34.7%) |
| 2-Person Household | 130 (76.9%) | 39 (23.1%) |
| 3-Person Household | 53 (81.5%) | 12 (18.5%) |
| 4+ Person Household | 113 (76.3%) | 35 (23.6%) |
| Total Housing Units | 435 (73.1%) | 160 (26.9%) |
Occupancy by Educational Attainment in Elroy
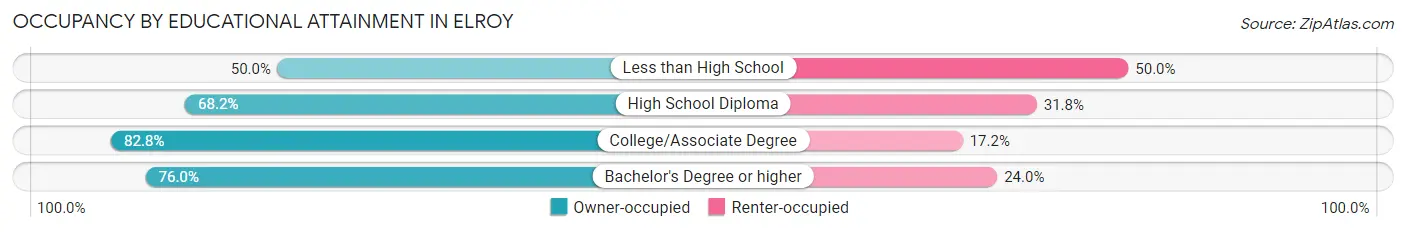
| Household Size | Owner-occupied | Renter-occupied |
| Less than High School | 23 (50.0%) | 23 (50.0%) |
| High School Diploma | 167 (68.2%) | 78 (31.8%) |
| College/Associate Degree | 169 (82.8%) | 35 (17.2%) |
| Bachelor's Degree or higher | 76 (76.0%) | 24 (24.0%) |
Occupancy by Age of Householder in Elroy
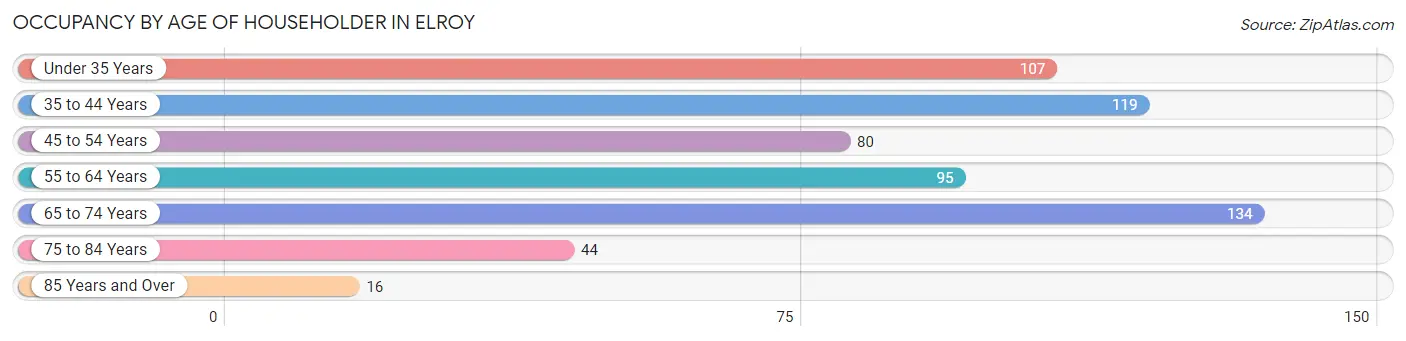
| Age Bracket | # Households | % Households |
| Under 35 Years | 107 | 18.0% |
| 35 to 44 Years | 119 | 20.0% |
| 45 to 54 Years | 80 | 13.5% |
| 55 to 64 Years | 95 | 16.0% |
| 65 to 74 Years | 134 | 22.5% |
| 75 to 84 Years | 44 | 7.4% |
| 85 Years and Over | 16 | 2.7% |
| Total | 595 | 100.0% |
Housing Finances in Elroy
Median Income by Occupancy in Elroy
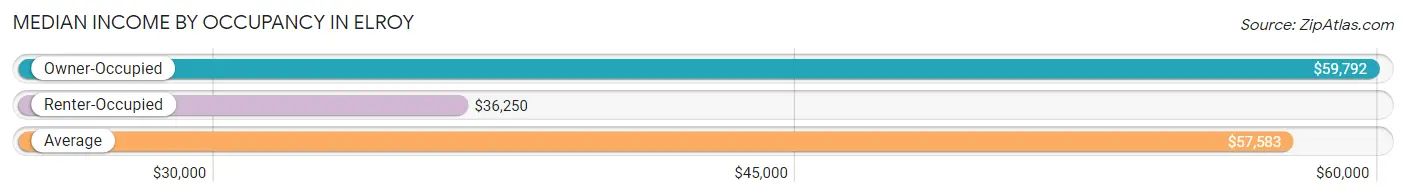
| Occupancy Type | # Households | Median Income |
| Owner-Occupied | 435 (73.1%) | $59,792 |
| Renter-Occupied | 160 (26.9%) | $36,250 |
| Average | 595 (100.0%) | $57,583 |
Occupancy by Householder Income Bracket in Elroy
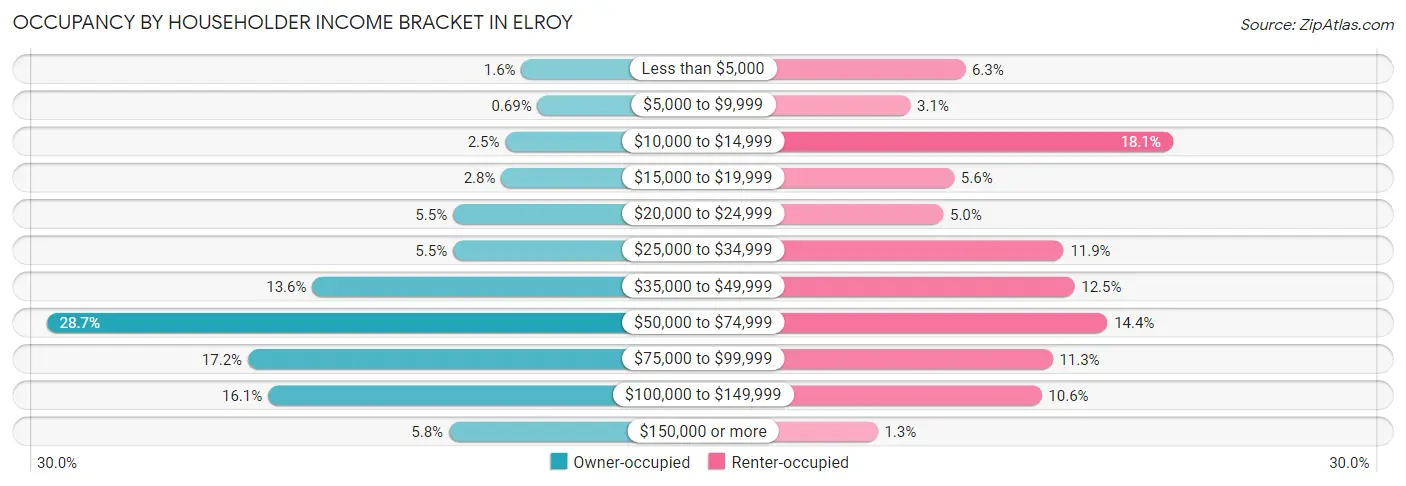
| Income Bracket | Owner-occupied | Renter-occupied |
| Less than $5,000 | 7 (1.6%) | 10 (6.2%) |
| $5,000 to $9,999 | 3 (0.7%) | 5 (3.1%) |
| $10,000 to $14,999 | 11 (2.5%) | 29 (18.1%) |
| $15,000 to $19,999 | 12 (2.8%) | 9 (5.6%) |
| $20,000 to $24,999 | 24 (5.5%) | 8 (5.0%) |
| $25,000 to $34,999 | 24 (5.5%) | 19 (11.9%) |
| $35,000 to $49,999 | 59 (13.6%) | 20 (12.5%) |
| $50,000 to $74,999 | 125 (28.7%) | 23 (14.4%) |
| $75,000 to $99,999 | 75 (17.2%) | 18 (11.3%) |
| $100,000 to $149,999 | 70 (16.1%) | 17 (10.6%) |
| $150,000 or more | 25 (5.8%) | 2 (1.3%) |
| Total | 435 (100.0%) | 160 (100.0%) |
Monthly Housing Cost Tiers in Elroy
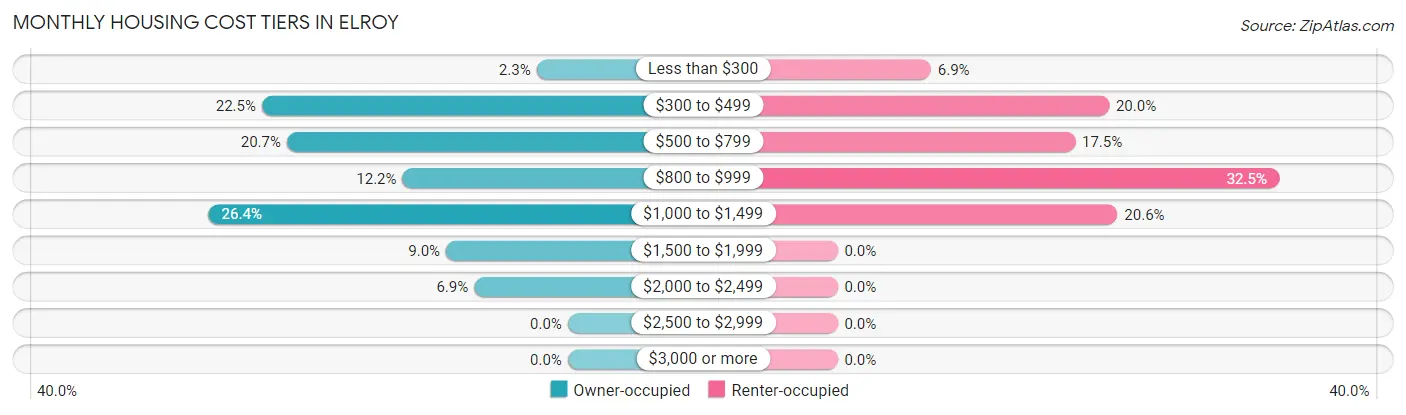
| Monthly Cost | Owner-occupied | Renter-occupied |
| Less than $300 | 10 (2.3%) | 11 (6.9%) |
| $300 to $499 | 98 (22.5%) | 32 (20.0%) |
| $500 to $799 | 90 (20.7%) | 28 (17.5%) |
| $800 to $999 | 53 (12.2%) | 52 (32.5%) |
| $1,000 to $1,499 | 115 (26.4%) | 33 (20.6%) |
| $1,500 to $1,999 | 39 (9.0%) | 0 (0.0%) |
| $2,000 to $2,499 | 30 (6.9%) | 0 (0.0%) |
| $2,500 to $2,999 | 0 (0.0%) | 0 (0.0%) |
| $3,000 or more | 0 (0.0%) | 0 (0.0%) |
| Total | 435 (100.0%) | 160 (100.0%) |
Physical Housing Characteristics in Elroy
Housing Structures in Elroy
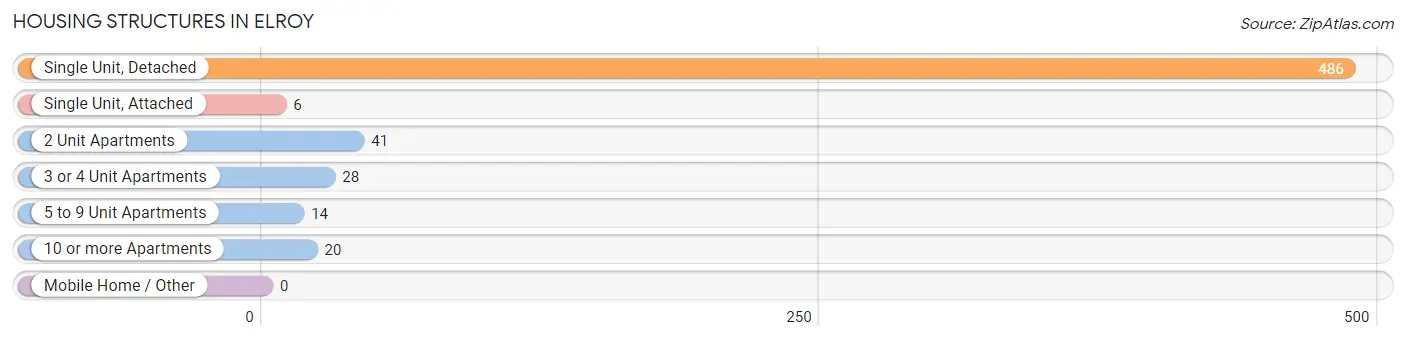
| Structure Type | # Housing Units | % Housing Units |
| Single Unit, Detached | 486 | 81.7% |
| Single Unit, Attached | 6 | 1.0% |
| 2 Unit Apartments | 41 | 6.9% |
| 3 or 4 Unit Apartments | 28 | 4.7% |
| 5 to 9 Unit Apartments | 14 | 2.4% |
| 10 or more Apartments | 20 | 3.4% |
| Mobile Home / Other | 0 | 0.0% |
| Total | 595 | 100.0% |
Housing Structures by Occupancy in Elroy
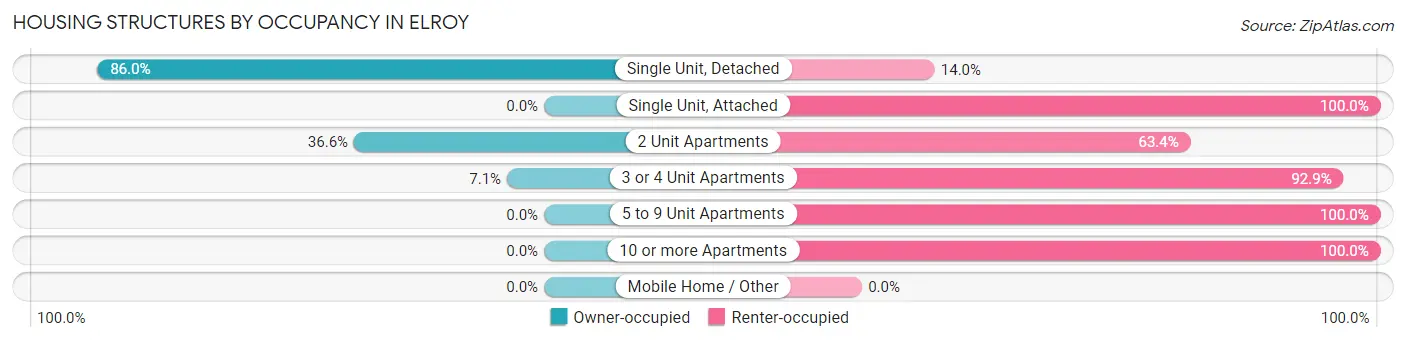
| Structure Type | Owner-occupied | Renter-occupied |
| Single Unit, Detached | 418 (86.0%) | 68 (14.0%) |
| Single Unit, Attached | 0 (0.0%) | 6 (100.0%) |
| 2 Unit Apartments | 15 (36.6%) | 26 (63.4%) |
| 3 or 4 Unit Apartments | 2 (7.1%) | 26 (92.9%) |
| 5 to 9 Unit Apartments | 0 (0.0%) | 14 (100.0%) |
| 10 or more Apartments | 0 (0.0%) | 20 (100.0%) |
| Mobile Home / Other | 0 (0.0%) | 0 (0.0%) |
| Total | 435 (73.1%) | 160 (26.9%) |
Housing Structures by Number of Rooms in Elroy
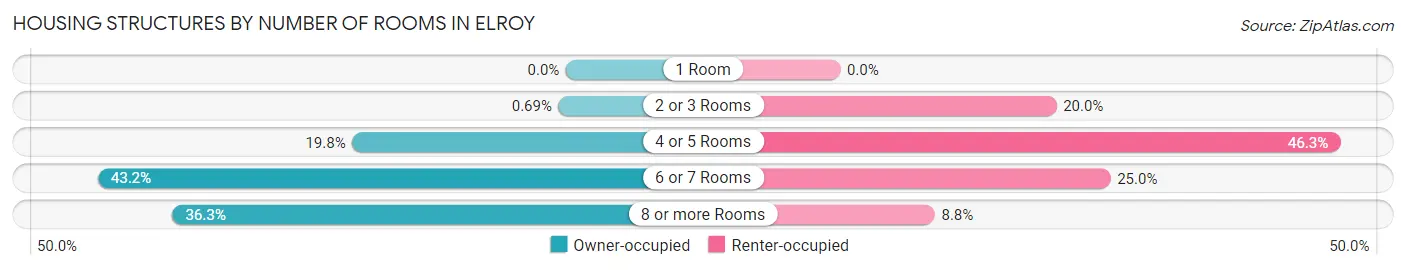
| Number of Rooms | Owner-occupied | Renter-occupied |
| 1 Room | 0 (0.0%) | 0 (0.0%) |
| 2 or 3 Rooms | 3 (0.7%) | 32 (20.0%) |
| 4 or 5 Rooms | 86 (19.8%) | 74 (46.3%) |
| 6 or 7 Rooms | 188 (43.2%) | 40 (25.0%) |
| 8 or more Rooms | 158 (36.3%) | 14 (8.7%) |
| Total | 435 (100.0%) | 160 (100.0%) |
Housing Structure by Heating Type in Elroy
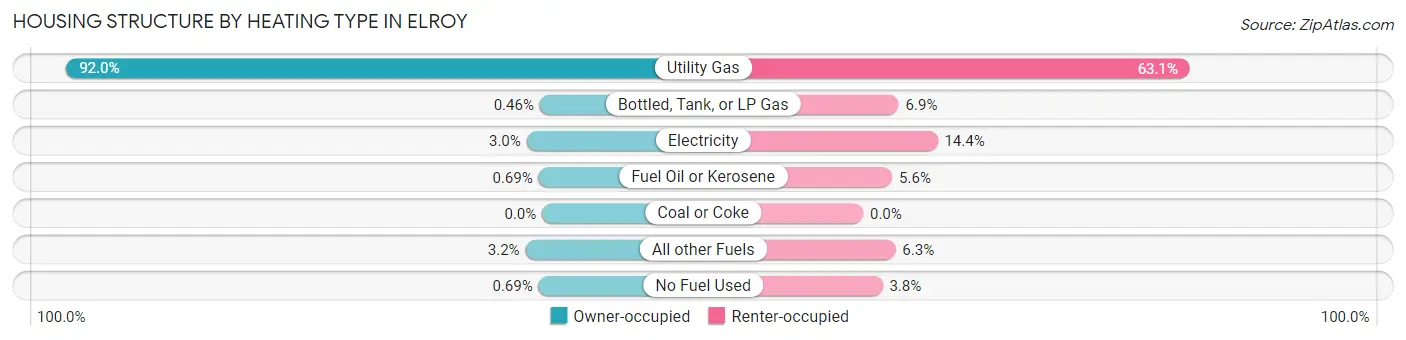
| Heating Type | Owner-occupied | Renter-occupied |
| Utility Gas | 400 (91.9%) | 101 (63.1%) |
| Bottled, Tank, or LP Gas | 2 (0.5%) | 11 (6.9%) |
| Electricity | 13 (3.0%) | 23 (14.4%) |
| Fuel Oil or Kerosene | 3 (0.7%) | 9 (5.6%) |
| Coal or Coke | 0 (0.0%) | 0 (0.0%) |
| All other Fuels | 14 (3.2%) | 10 (6.2%) |
| No Fuel Used | 3 (0.7%) | 6 (3.7%) |
| Total | 435 (100.0%) | 160 (100.0%) |
Household Vehicle Usage in Elroy
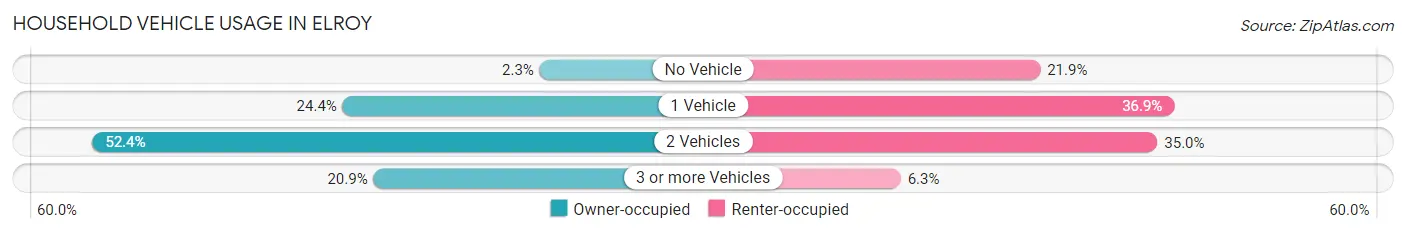
| Vehicles per Household | Owner-occupied | Renter-occupied |
| No Vehicle | 10 (2.3%) | 35 (21.9%) |
| 1 Vehicle | 106 (24.4%) | 59 (36.9%) |
| 2 Vehicles | 228 (52.4%) | 56 (35.0%) |
| 3 or more Vehicles | 91 (20.9%) | 10 (6.2%) |
| Total | 435 (100.0%) | 160 (100.0%) |
Real Estate & Mortgages in Elroy
Real Estate and Mortgage Overview in Elroy
| Characteristic | Without Mortgage | With Mortgage |
| Housing Units | 178 | 257 |
| Median Property Value | $98,000 | $115,800 |
| Median Household Income | $57,125 | $19 |
| Monthly Housing Costs | $471 | $0 |
| Real Estate Taxes | $1,909 | $3 |
Property Value by Mortgage Status in Elroy
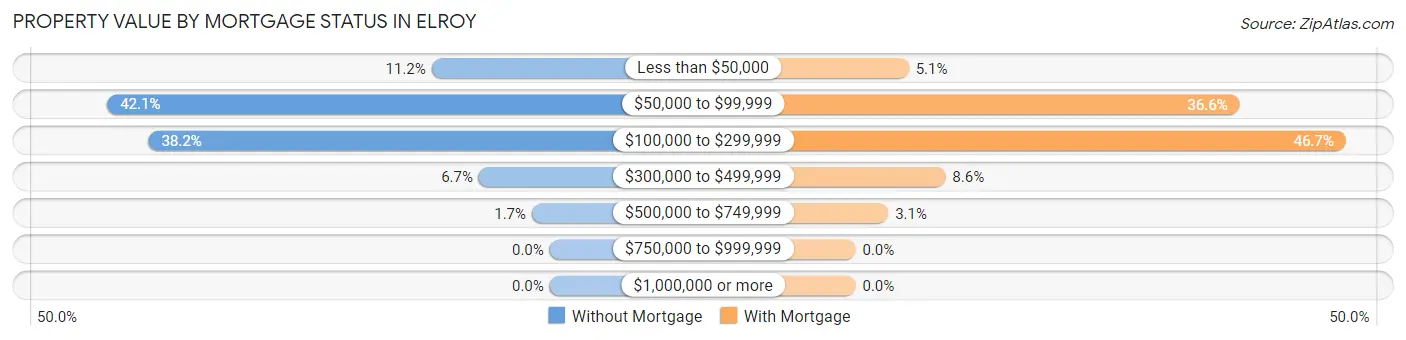
| Property Value | Without Mortgage | With Mortgage |
| Less than $50,000 | 20 (11.2%) | 13 (5.1%) |
| $50,000 to $99,999 | 75 (42.1%) | 94 (36.6%) |
| $100,000 to $299,999 | 68 (38.2%) | 120 (46.7%) |
| $300,000 to $499,999 | 12 (6.7%) | 22 (8.6%) |
| $500,000 to $749,999 | 3 (1.7%) | 8 (3.1%) |
| $750,000 to $999,999 | 0 (0.0%) | 0 (0.0%) |
| $1,000,000 or more | 0 (0.0%) | 0 (0.0%) |
| Total | 178 (100.0%) | 257 (100.0%) |
Household Income by Mortgage Status in Elroy
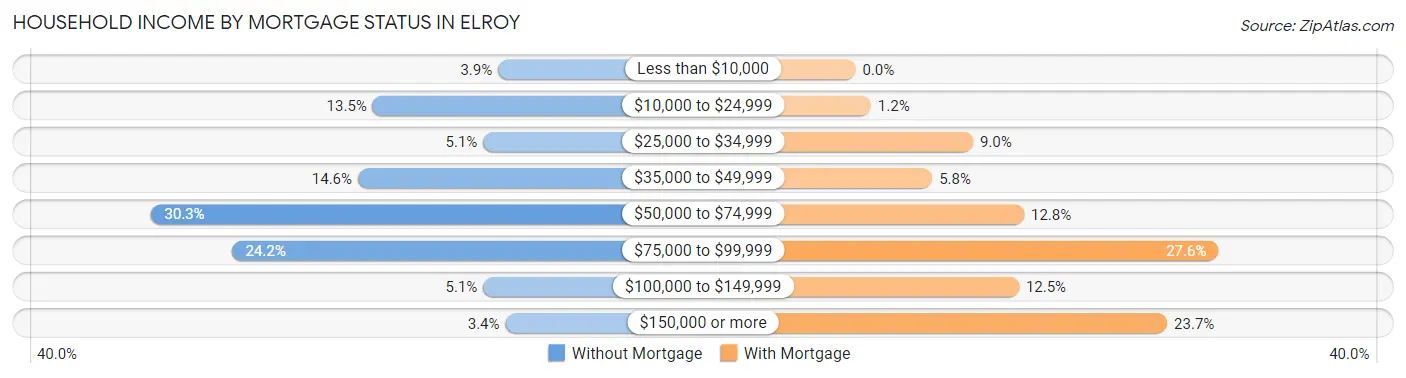
| Household Income | Without Mortgage | With Mortgage |
| Less than $10,000 | 7 (3.9%) | 0 (0.0%) |
| $10,000 to $24,999 | 24 (13.5%) | 3 (1.2%) |
| $25,000 to $34,999 | 9 (5.1%) | 23 (8.9%) |
| $35,000 to $49,999 | 26 (14.6%) | 15 (5.8%) |
| $50,000 to $74,999 | 54 (30.3%) | 33 (12.8%) |
| $75,000 to $99,999 | 43 (24.2%) | 71 (27.6%) |
| $100,000 to $149,999 | 9 (5.1%) | 32 (12.4%) |
| $150,000 or more | 6 (3.4%) | 61 (23.7%) |
| Total | 178 (100.0%) | 257 (100.0%) |
Property Value to Household Income Ratio in Elroy
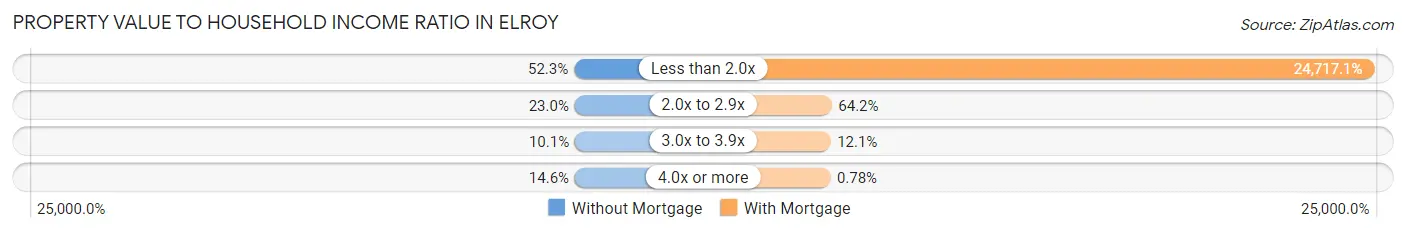
| Value-to-Income Ratio | Without Mortgage | With Mortgage |
| Less than 2.0x | 93 (52.2%) | 63,523 (24,717.1%) |
| 2.0x to 2.9x | 41 (23.0%) | 165 (64.2%) |
| 3.0x to 3.9x | 18 (10.1%) | 31 (12.1%) |
| 4.0x or more | 26 (14.6%) | 2 (0.8%) |
| Total | 178 (100.0%) | 257 (100.0%) |
Real Estate Taxes by Mortgage Status in Elroy
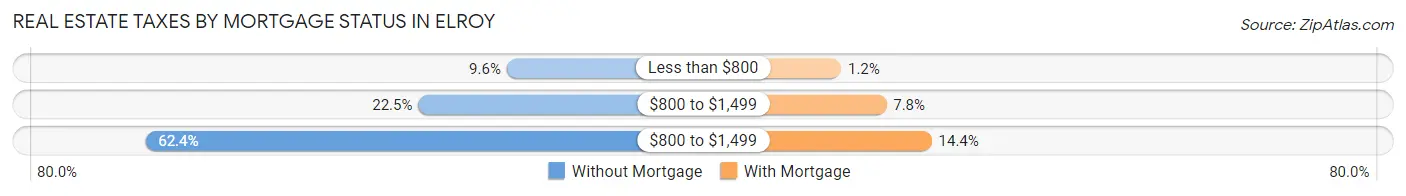
| Property Taxes | Without Mortgage | With Mortgage |
| Less than $800 | 17 (9.6%) | 3 (1.2%) |
| $800 to $1,499 | 40 (22.5%) | 20 (7.8%) |
| $800 to $1,499 | 111 (62.4%) | 37 (14.4%) |
| Total | 178 (100.0%) | 257 (100.0%) |
Health & Disability in Elroy
Health Insurance Coverage by Age in Elroy
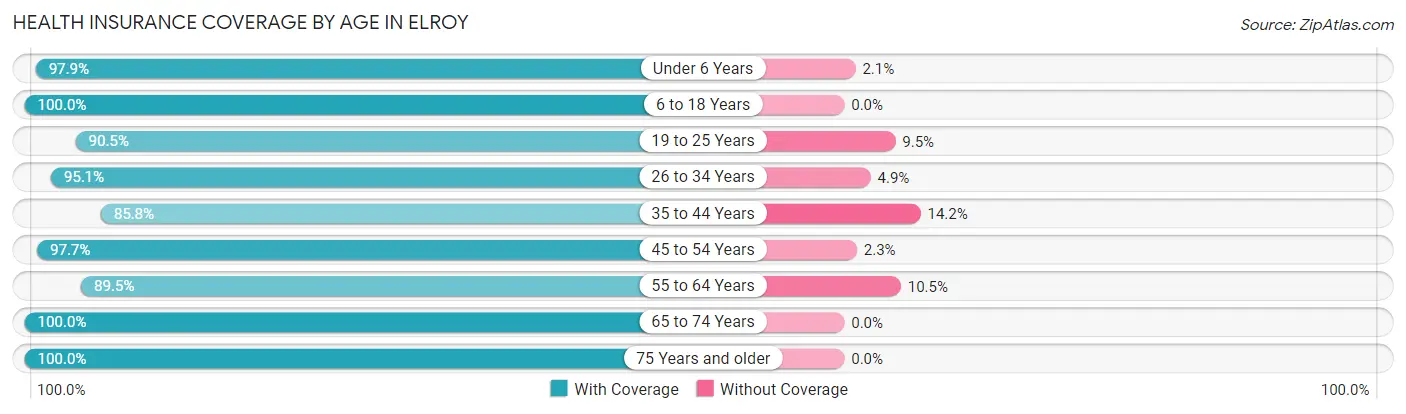
| Age Bracket | With Coverage | Without Coverage |
| Under 6 Years | 141 (97.9%) | 3 (2.1%) |
| 6 to 18 Years | 305 (100.0%) | 0 (0.0%) |
| 19 to 25 Years | 114 (90.5%) | 12 (9.5%) |
| 26 to 34 Years | 136 (95.1%) | 7 (4.9%) |
| 35 to 44 Years | 199 (85.8%) | 33 (14.2%) |
| 45 to 54 Years | 125 (97.7%) | 3 (2.3%) |
| 55 to 64 Years | 153 (89.5%) | 18 (10.5%) |
| 65 to 74 Years | 154 (100.0%) | 0 (0.0%) |
| 75 Years and older | 72 (100.0%) | 0 (0.0%) |
| Total | 1,399 (94.9%) | 76 (5.1%) |
Health Insurance Coverage by Citizenship Status in Elroy

| Citizenship Status | With Coverage | Without Coverage |
| Native Born | 141 (97.9%) | 3 (2.1%) |
| Foreign Born, Citizen | 305 (100.0%) | 0 (0.0%) |
| Foreign Born, not a Citizen | 114 (90.5%) | 12 (9.5%) |
Health Insurance Coverage by Household Income in Elroy
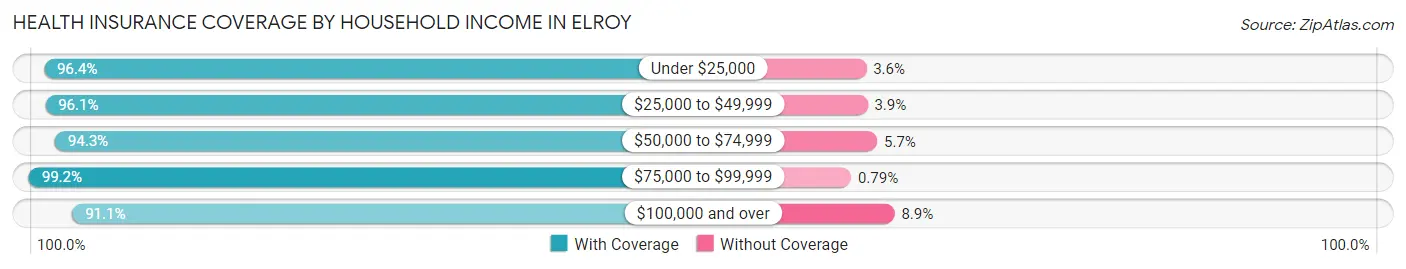
| Household Income | With Coverage | Without Coverage |
| Under $25,000 | 159 (96.4%) | 6 (3.6%) |
| $25,000 to $49,999 | 273 (96.1%) | 11 (3.9%) |
| $50,000 to $74,999 | 349 (94.3%) | 21 (5.7%) |
| $75,000 to $99,999 | 251 (99.2%) | 2 (0.8%) |
| $100,000 and over | 367 (91.1%) | 36 (8.9%) |
Public vs Private Health Insurance Coverage by Age in Elroy
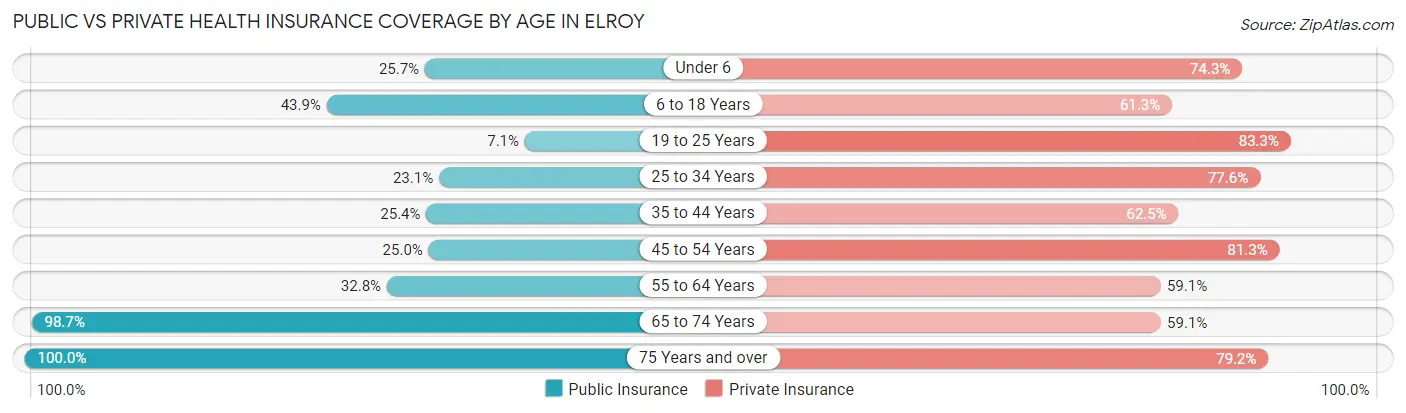
| Age Bracket | Public Insurance | Private Insurance |
| Under 6 | 37 (25.7%) | 107 (74.3%) |
| 6 to 18 Years | 134 (43.9%) | 187 (61.3%) |
| 19 to 25 Years | 9 (7.1%) | 105 (83.3%) |
| 25 to 34 Years | 33 (23.1%) | 111 (77.6%) |
| 35 to 44 Years | 59 (25.4%) | 145 (62.5%) |
| 45 to 54 Years | 32 (25.0%) | 104 (81.2%) |
| 55 to 64 Years | 56 (32.8%) | 101 (59.1%) |
| 65 to 74 Years | 152 (98.7%) | 91 (59.1%) |
| 75 Years and over | 72 (100.0%) | 57 (79.2%) |
| Total | 584 (39.6%) | 1,008 (68.3%) |
Disability Status by Sex by Age in Elroy
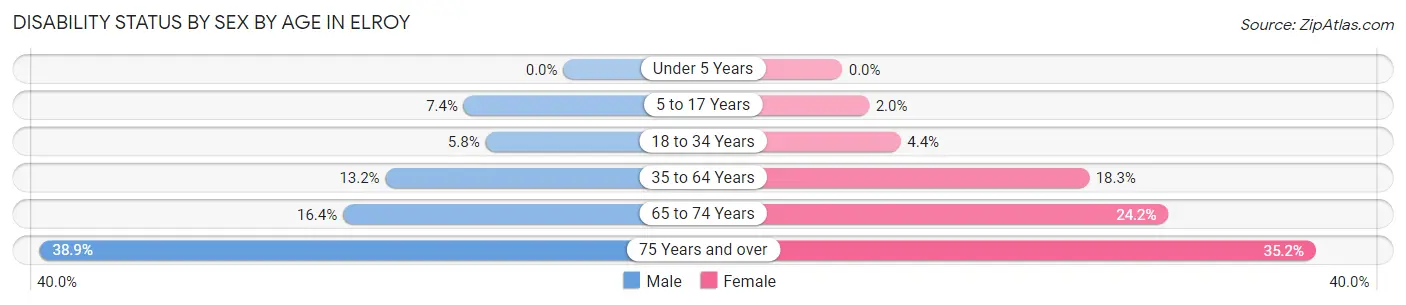
| Age Bracket | Male | Female |
| Under 5 Years | 0 (0.0%) | 0 (0.0%) |
| 5 to 17 Years | 15 (7.4%) | 2 (2.0%) |
| 18 to 34 Years | 10 (5.8%) | 5 (4.3%) |
| 35 to 64 Years | 37 (13.2%) | 46 (18.3%) |
| 65 to 74 Years | 9 (16.4%) | 24 (24.2%) |
| 75 Years and over | 7 (38.9%) | 19 (35.2%) |
Disability Class by Sex by Age in Elroy
Disability Class: Hearing Difficulty
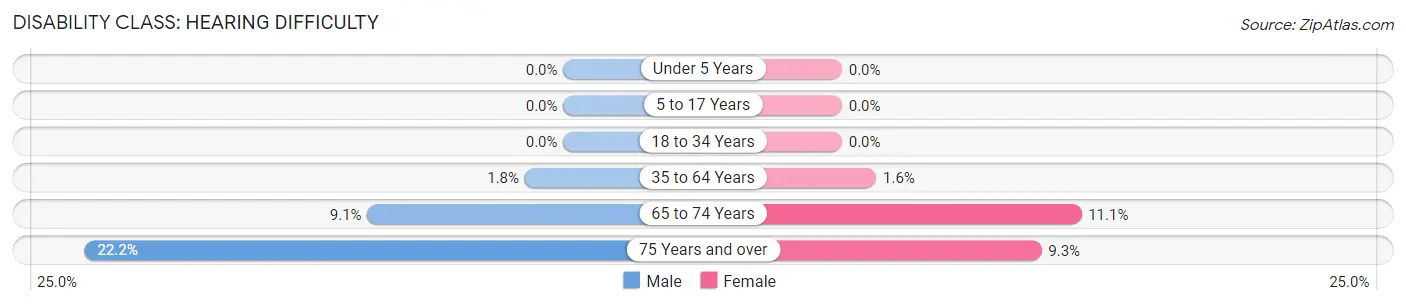
| Age Bracket | Male | Female |
| Under 5 Years | 0 (0.0%) | 0 (0.0%) |
| 5 to 17 Years | 0 (0.0%) | 0 (0.0%) |
| 18 to 34 Years | 0 (0.0%) | 0 (0.0%) |
| 35 to 64 Years | 5 (1.8%) | 4 (1.6%) |
| 65 to 74 Years | 5 (9.1%) | 11 (11.1%) |
| 75 Years and over | 4 (22.2%) | 5 (9.3%) |
Disability Class: Vision Difficulty
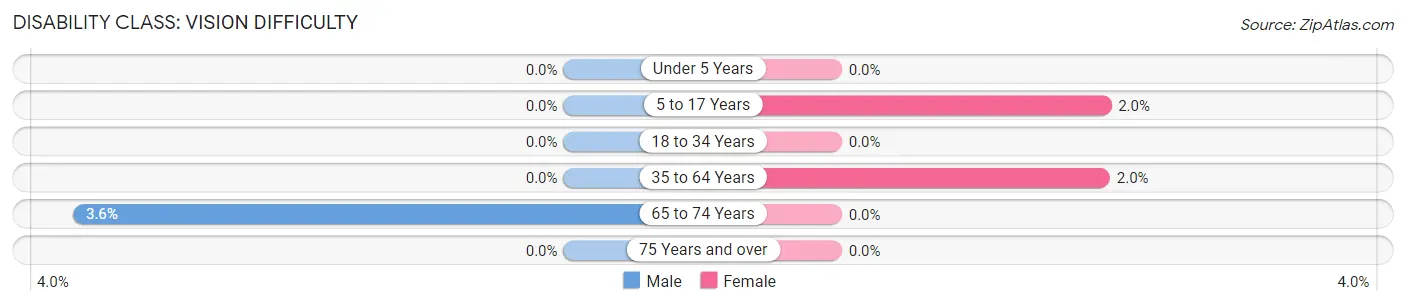
| Age Bracket | Male | Female |
| Under 5 Years | 0 (0.0%) | 0 (0.0%) |
| 5 to 17 Years | 0 (0.0%) | 2 (2.0%) |
| 18 to 34 Years | 0 (0.0%) | 0 (0.0%) |
| 35 to 64 Years | 0 (0.0%) | 5 (2.0%) |
| 65 to 74 Years | 2 (3.6%) | 0 (0.0%) |
| 75 Years and over | 0 (0.0%) | 0 (0.0%) |
Disability Class: Cognitive Difficulty
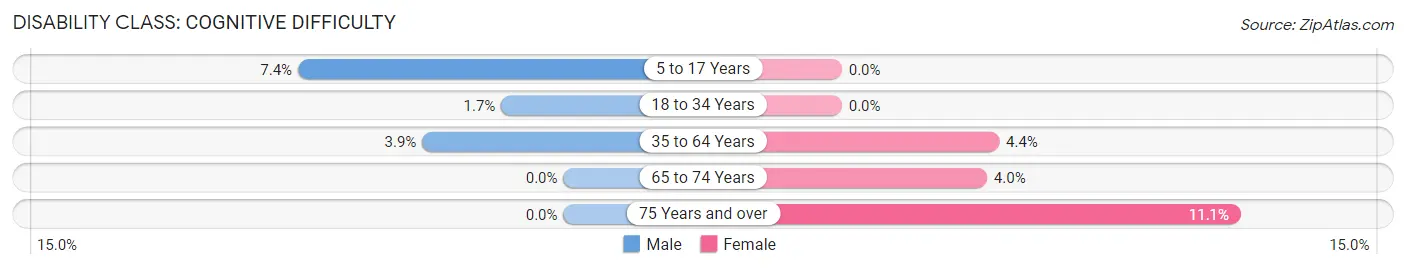
| Age Bracket | Male | Female |
| 5 to 17 Years | 15 (7.4%) | 0 (0.0%) |
| 18 to 34 Years | 3 (1.7%) | 0 (0.0%) |
| 35 to 64 Years | 11 (3.9%) | 11 (4.4%) |
| 65 to 74 Years | 0 (0.0%) | 4 (4.0%) |
| 75 Years and over | 0 (0.0%) | 6 (11.1%) |
Disability Class: Ambulatory Difficulty
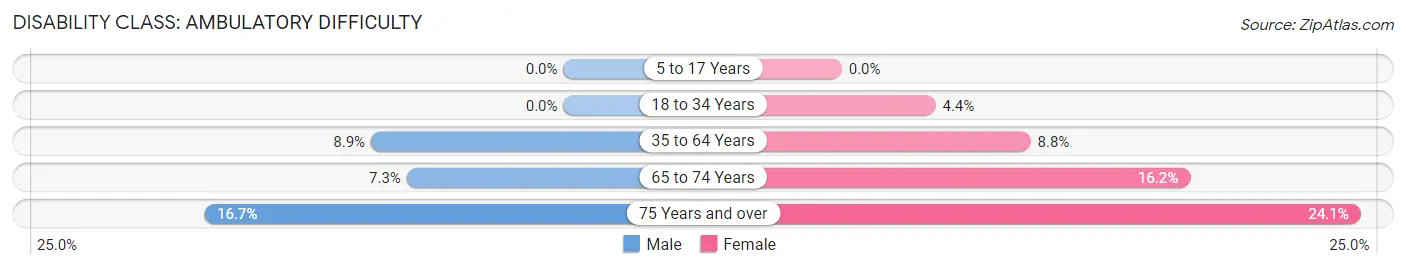
| Age Bracket | Male | Female |
| 5 to 17 Years | 0 (0.0%) | 0 (0.0%) |
| 18 to 34 Years | 0 (0.0%) | 5 (4.3%) |
| 35 to 64 Years | 25 (8.9%) | 22 (8.8%) |
| 65 to 74 Years | 4 (7.3%) | 16 (16.2%) |
| 75 Years and over | 3 (16.7%) | 13 (24.1%) |
Disability Class: Self-Care Difficulty
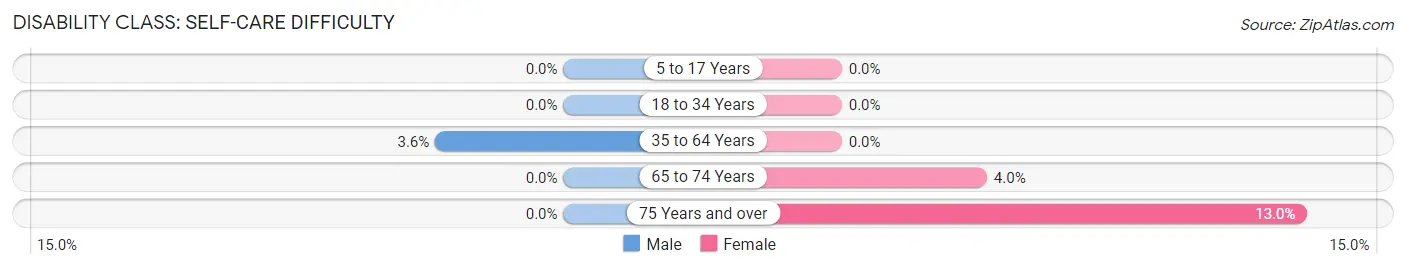
| Age Bracket | Male | Female |
| 5 to 17 Years | 0 (0.0%) | 0 (0.0%) |
| 18 to 34 Years | 0 (0.0%) | 0 (0.0%) |
| 35 to 64 Years | 10 (3.6%) | 0 (0.0%) |
| 65 to 74 Years | 0 (0.0%) | 4 (4.0%) |
| 75 Years and over | 0 (0.0%) | 7 (13.0%) |
Technology Access in Elroy
Computing Device Access in Elroy
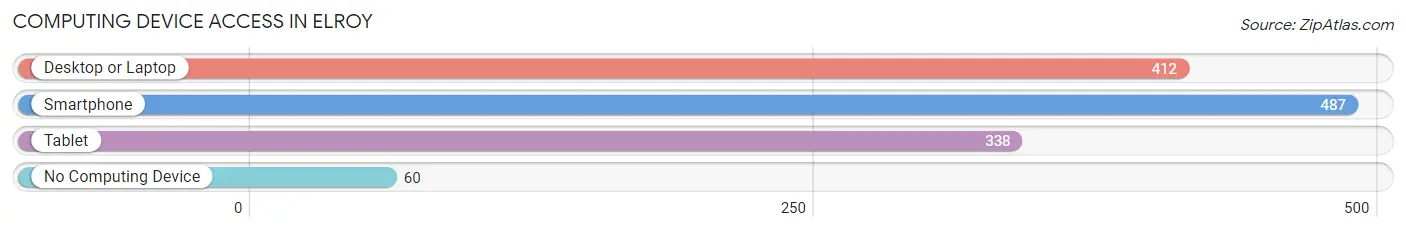
| Device Type | # Households | % Households |
| Desktop or Laptop | 412 | 69.2% |
| Smartphone | 487 | 81.9% |
| Tablet | 338 | 56.8% |
| No Computing Device | 60 | 10.1% |
| Total | 595 | 100.0% |
Internet Access in Elroy
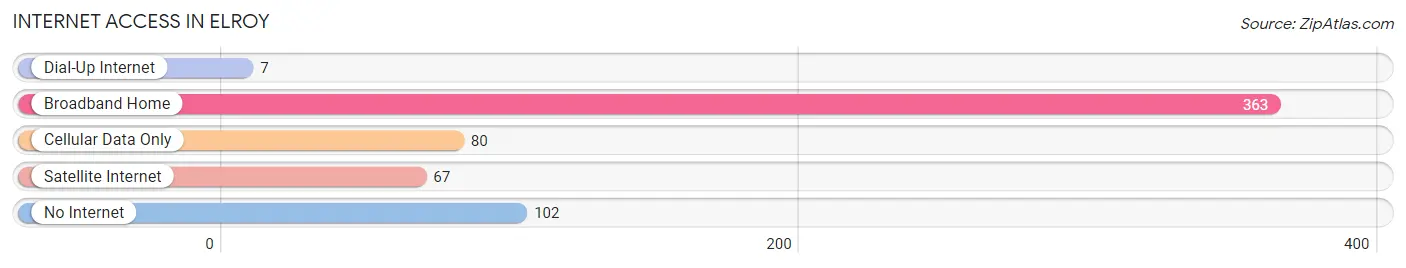
| Internet Type | # Households | % Households |
| Dial-Up Internet | 7 | 1.2% |
| Broadband Home | 363 | 61.0% |
| Cellular Data Only | 80 | 13.5% |
| Satellite Internet | 67 | 11.3% |
| No Internet | 102 | 17.1% |
| Total | 595 | 100.0% |
Elroy Summary
Elroy, Wisconsin is a small city located in the southwestern corner of the state, in Juneau County. It is situated on the Baraboo River, and is surrounded by rolling hills and farmland. The city has a population of 1,717 people, according to the 2010 census.
History
Elroy was founded in 1856 by a group of settlers from New York. The city was named after Elroy, New York, the hometown of the settlers. The city was incorporated in 1875.
In the late 19th century, Elroy was a major stop on the Chicago and Northwestern Railroad. The railroad brought many new people to the area, and the city grew rapidly. By the early 20th century, Elroy had become a bustling small city, with a variety of businesses and industries.
Geography
Elroy is located in the southwestern corner of Wisconsin, in Juneau County. It is situated on the Baraboo River, and is surrounded by rolling hills and farmland. The city has a total area of 1.7 square miles, all of which is land.
Economy
Elroy’s economy is largely based on agriculture and tourism. The city is home to several small businesses, including a grocery store, a hardware store, and a variety of restaurants. The city is also home to a number of small manufacturing companies, including a furniture factory and a plastics factory.
Demographics
According to the 2010 census, Elroy has a population of 1,717 people. The population is predominantly white (96.2%), with a small percentage of African Americans (1.2%) and Hispanics (1.6%). The median household income is $37,917, and the median age is 43.7 years.
Elroy is a small city with a rich history and a vibrant economy. It is a great place to live, work, and raise a family. The city is home to a variety of businesses and industries, and is a popular tourist destination. With its friendly people and beautiful scenery, Elroy is a great place to call home.
Common Questions
What is Per Capita Income in Elroy?
Per Capita income in Elroy is $28,777.
What is the Median Family Income in Elroy?
Median Family Income in Elroy is $68,125.
What is the Median Household income in Elroy?
Median Household Income in Elroy is $57,583.
What is Income or Wage Gap in Elroy?
Income or Wage Gap in Elroy is 21.6%.
Women in Elroy earn 78.4 cents for every dollar earned by a man.
What is Inequality or Gini Index in Elroy?
Inequality or Gini Index in Elroy is 0.41.
What is the Total Population of Elroy?
Total Population of Elroy is 1,543.
What is the Total Male Population of Elroy?
Total Male Population of Elroy is 841.
What is the Total Female Population of Elroy?
Total Female Population of Elroy is 702.
What is the Ratio of Males per 100 Females in Elroy?
There are 119.80 Males per 100 Females in Elroy.
What is the Ratio of Females per 100 Males in Elroy?
There are 83.47 Females per 100 Males in Elroy.
What is the Median Population Age in Elroy?
Median Population Age in Elroy is 36.7 Years.
What is the Average Family Size in Elroy
Average Family Size in Elroy is 3.1 People.
What is the Average Household Size in Elroy
Average Household Size in Elroy is 2.5 People.
How Large is the Labor Force in Elroy?
There are 717 People in the Labor Forcein in Elroy.
What is the Percentage of People in the Labor Force in Elroy?
62.8% of People are in the Labor Force in Elroy.
What is the Unemployment Rate in Elroy?
Unemployment Rate in Elroy is 1.0%.