Eland, WI Map & Demographics
Eland Map
Eland Overview
$30,968
PER CAPITA INCOME
$77,500
AVG FAMILY INCOME
$63,438
AVG HOUSEHOLD INCOME
36.6%
WAGE / INCOME GAP [ % ]
63.4¢/ $1
WAGE / INCOME GAP [ $ ]
0.27
INEQUALITY / GINI INDEX
243
TOTAL POPULATION
114
MALE POPULATION
129
FEMALE POPULATION
88.37
MALES / 100 FEMALES
113.16
FEMALES / 100 MALES
47.8
MEDIAN AGE
2.9
AVG FAMILY SIZE
2.4
AVG HOUSEHOLD SIZE
136
LABOR FORCE [ PEOPLE ]
74.3%
PERCENT IN LABOR FORCE
Eland Zip Codes
Eland Area Codes
Income in Eland
Income Overview in Eland
Per Capita Income in Eland is $30,968, while median incomes of families and households are $77,500 and $63,438 respectively.
| Characteristic | Number | Measure |
| Per Capita Income | 243 | $30,968 |
| Median Family Income | 68 | $77,500 |
| Mean Family Income | 68 | $78,540 |
| Median Household Income | 103 | $63,438 |
| Mean Household Income | 103 | $73,190 |
| Income Deficit | 68 | $0 |
| Wage / Income Gap (%) | 243 | 36.58% |
| Wage / Income Gap ($) | 243 | 63.42¢ per $1 |
| Gini / Inequality Index | 243 | 0.27 |
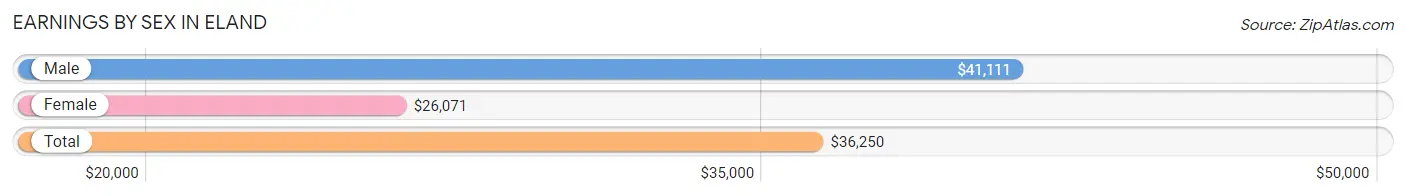
Earnings by Sex in Eland
Average Earnings in Eland are $36,250, $41,111 for men and $26,071 for women, a difference of 36.6%.
| Sex | Number | Average Earnings |
| Male | 82 (58.6%) | $41,111 |
| Female | 58 (41.4%) | $26,071 |
| Total | 140 (100.0%) | $36,250 |
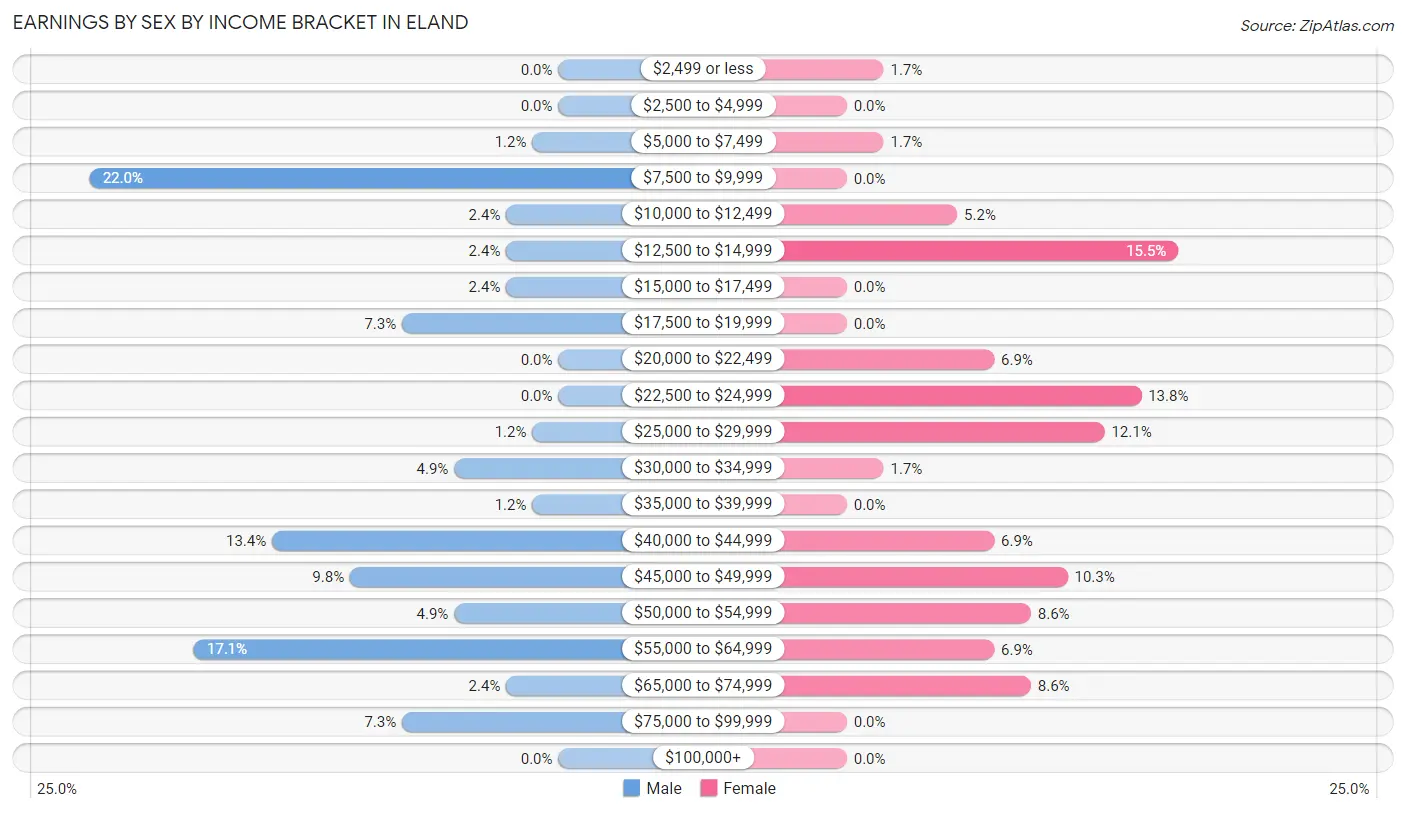
Earnings by Sex by Income Bracket in Eland
The most common earnings brackets in Eland are $7,500 to $9,999 for men (18 | 22.0%) and $12,500 to $14,999 for women (9 | 15.5%).
| Income | Male | Female |
| $2,499 or less | 0 (0.0%) | 1 (1.7%) |
| $2,500 to $4,999 | 0 (0.0%) | 0 (0.0%) |
| $5,000 to $7,499 | 1 (1.2%) | 1 (1.7%) |
| $7,500 to $9,999 | 18 (22.0%) | 0 (0.0%) |
| $10,000 to $12,499 | 2 (2.4%) | 3 (5.2%) |
| $12,500 to $14,999 | 2 (2.4%) | 9 (15.5%) |
| $15,000 to $17,499 | 2 (2.4%) | 0 (0.0%) |
| $17,500 to $19,999 | 6 (7.3%) | 0 (0.0%) |
| $20,000 to $22,499 | 0 (0.0%) | 4 (6.9%) |
| $22,500 to $24,999 | 0 (0.0%) | 8 (13.8%) |
| $25,000 to $29,999 | 1 (1.2%) | 7 (12.1%) |
| $30,000 to $34,999 | 4 (4.9%) | 1 (1.7%) |
| $35,000 to $39,999 | 1 (1.2%) | 0 (0.0%) |
| $40,000 to $44,999 | 11 (13.4%) | 4 (6.9%) |
| $45,000 to $49,999 | 8 (9.8%) | 6 (10.3%) |
| $50,000 to $54,999 | 4 (4.9%) | 5 (8.6%) |
| $55,000 to $64,999 | 14 (17.1%) | 4 (6.9%) |
| $65,000 to $74,999 | 2 (2.4%) | 5 (8.6%) |
| $75,000 to $99,999 | 6 (7.3%) | 0 (0.0%) |
| $100,000+ | 0 (0.0%) | 0 (0.0%) |
| Total | 82 (100.0%) | 58 (100.0%) |
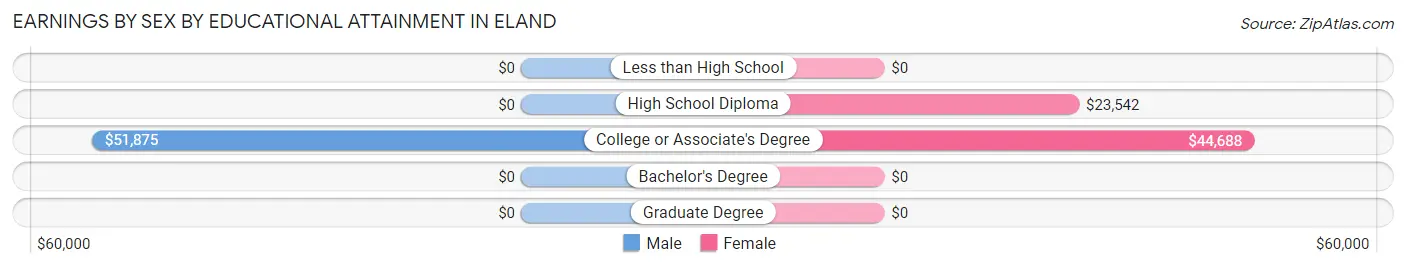
Earnings by Sex by Educational Attainment in Eland
Average earnings in Eland are $42,188 for men and $26,607 for women, a difference of 36.9%. Men with an educational attainment of college or associate's degree enjoy the highest average annual earnings of $51,875, while those with college or associate's degree education earn the least with $51,875. Women with an educational attainment of college or associate's degree earn the most with the average annual earnings of $44,688, while those with high school diploma education have the smallest earnings of $23,542.
| Educational Attainment | Male Income | Female Income |
| Less than High School | - | - |
| High School Diploma | - | - |
| College or Associate's Degree | $51,875 | $44,688 |
| Bachelor's Degree | - | - |
| Graduate Degree | - | - |
| Total | $42,188 | $26,607 |
Family Income in Eland
Family Income Brackets in Eland
According to the Eland family income data, there are 21 families falling into the $75,000 to $99,999 income range, which is the most common income bracket and makes up 30.9% of all families.
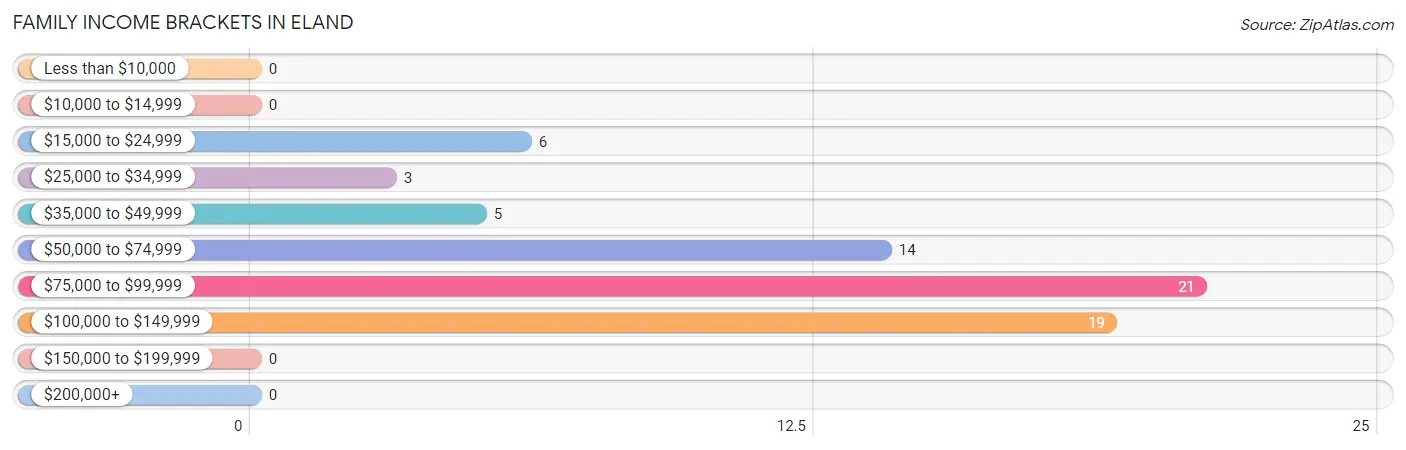
| Income Bracket | # Families | % Families |
| Less than $10,000 | 0 | 0.0% |
| $10,000 to $14,999 | 0 | 0.0% |
| $15,000 to $24,999 | 6 | 8.8% |
| $25,000 to $34,999 | 3 | 4.4% |
| $35,000 to $49,999 | 5 | 7.4% |
| $50,000 to $74,999 | 14 | 20.6% |
| $75,000 to $99,999 | 21 | 30.9% |
| $100,000 to $149,999 | 19 | 27.9% |
| $150,000 to $199,999 | 0 | 0.0% |
| $200,000+ | 0 | 0.0% |
Family Income by Famaliy Size in Eland
2-person families (31 | 45.6%) account for the highest median family income in Eland with $79,583 per family, while 2-person families (31 | 45.6%) have the highest median income of $39,792 per family member.
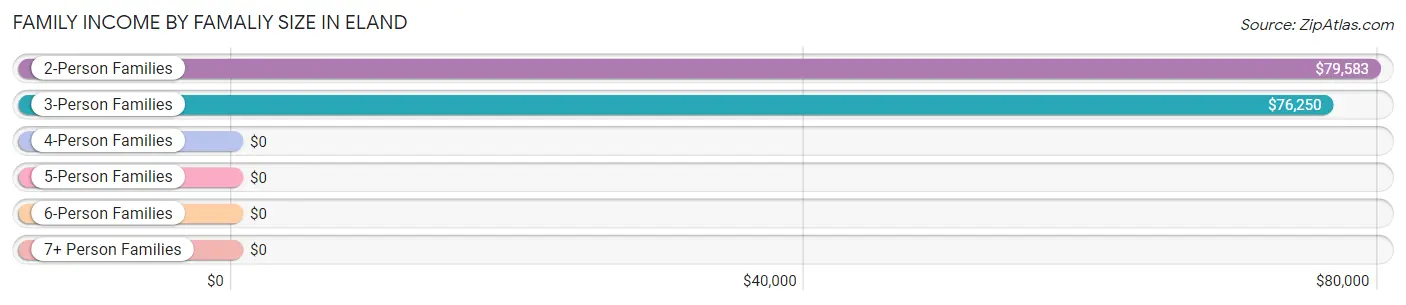
| Income Bracket | # Families | Median Income |
| 2-Person Families | 31 (45.6%) | $79,583 |
| 3-Person Families | 24 (35.3%) | $76,250 |
| 4-Person Families | 9 (13.2%) | $0 |
| 5-Person Families | 4 (5.9%) | $0 |
| 6-Person Families | 0 (0.0%) | $0 |
| 7+ Person Families | 0 (0.0%) | $0 |
| Total | 68 (100.0%) | $77,500 |
Family Income by Number of Earners in Eland
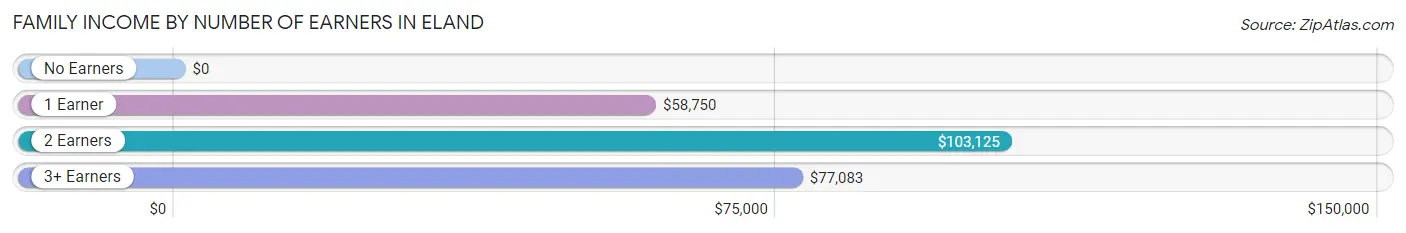
| Number of Earners | # Families | Median Income |
| No Earners | 6 (8.8%) | $0 |
| 1 Earner | 26 (38.2%) | $58,750 |
| 2 Earners | 26 (38.2%) | $103,125 |
| 3+ Earners | 10 (14.7%) | $77,083 |
| Total | 68 (100.0%) | $77,500 |
Household Income in Eland
Household Income Brackets in Eland
With 34 households falling in the category, the $50,000 to $74,999 income range is the most frequent in Eland, accounting for 33.0% of all households.
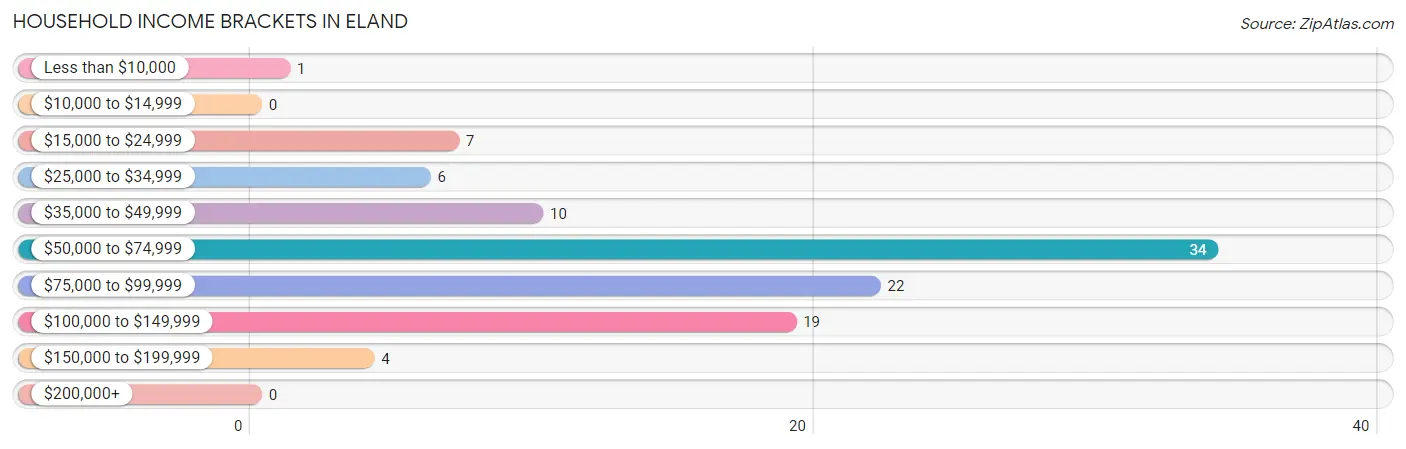
| Income Bracket | # Households | % Households |
| Less than $10,000 | 1 | 1.0% |
| $10,000 to $14,999 | 0 | 0.0% |
| $15,000 to $24,999 | 7 | 6.8% |
| $25,000 to $34,999 | 6 | 5.8% |
| $35,000 to $49,999 | 10 | 9.7% |
| $50,000 to $74,999 | 34 | 33.0% |
| $75,000 to $99,999 | 22 | 21.4% |
| $100,000 to $149,999 | 19 | 18.4% |
| $150,000 to $199,999 | 4 | 3.9% |
| $200,000+ | 0 | 0.0% |
Household Income by Householder Age in Eland
The median household income in Eland is $63,438, with the highest median household income of $78,750 found in the 25 to 44 years age bracket for the primary householder. A total of 21 households (20.4%) fall into this category. Meanwhile, the 15 to 24 years age bracket for the primary householder has the lowest median household income of $0, with 3 households (2.9%) in this group.
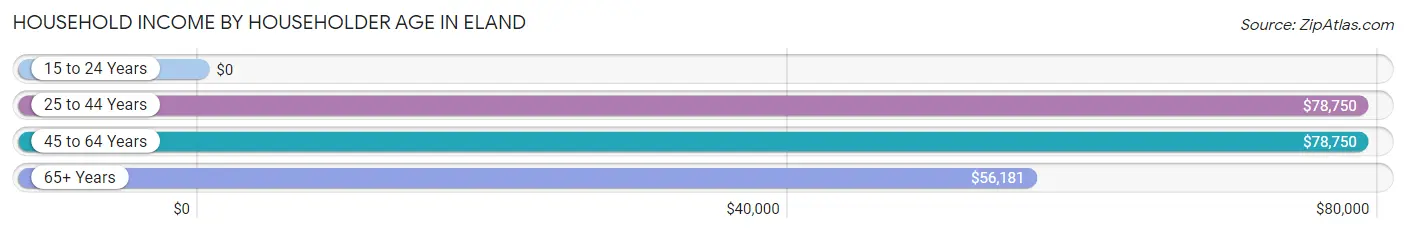
| Income Bracket | # Households | Median Income |
| 15 to 24 Years | 3 (2.9%) | $0 |
| 25 to 44 Years | 21 (20.4%) | $78,750 |
| 45 to 64 Years | 42 (40.8%) | $78,750 |
| 65+ Years | 37 (35.9%) | $56,181 |
| Total | 103 (100.0%) | $63,438 |
Poverty in Eland
Income Below Poverty by Sex and Age in Eland
With 2.6% poverty level for males and 22.5% for females among the residents of Eland, 75 year old and over males and 5 year old females are the most vulnerable to poverty, with 1 males (20.0%) and 6 females (75.0%) in their respective age groups living below the poverty level.
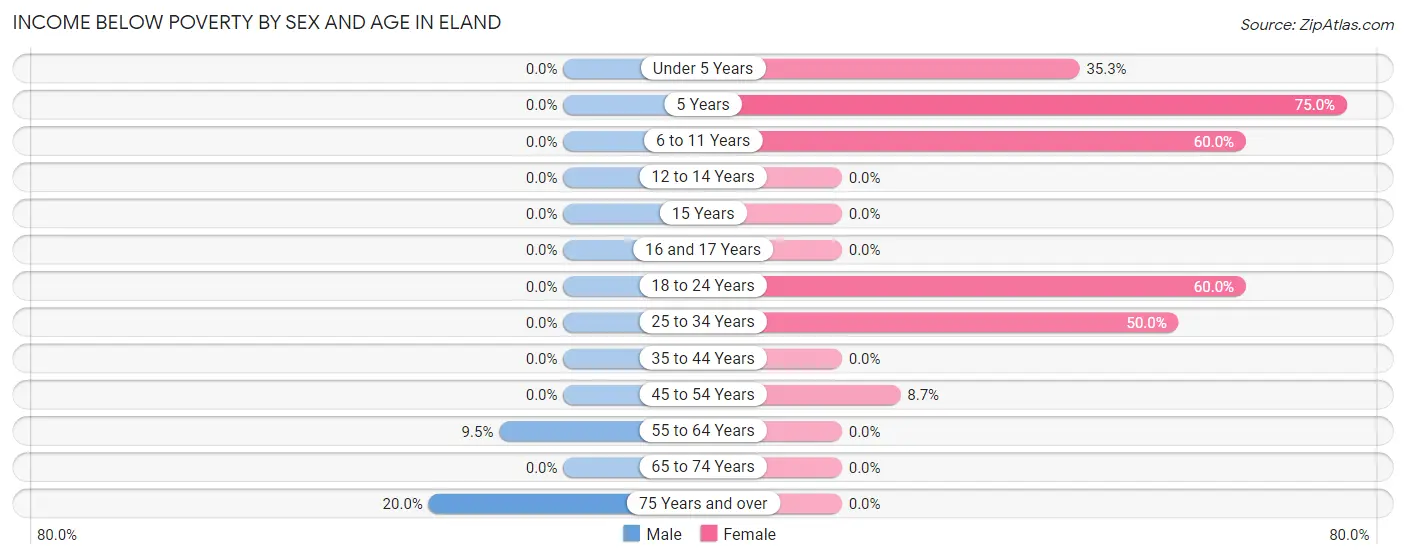
| Age Bracket | Male | Female |
| Under 5 Years | 0 (0.0%) | 6 (35.3%) |
| 5 Years | 0 (0.0%) | 6 (75.0%) |
| 6 to 11 Years | 0 (0.0%) | 6 (60.0%) |
| 12 to 14 Years | 0 (0.0%) | 0 (0.0%) |
| 15 Years | 0 (0.0%) | 0 (0.0%) |
| 16 and 17 Years | 0 (0.0%) | 0 (0.0%) |
| 18 to 24 Years | 0 (0.0%) | 3 (60.0%) |
| 25 to 34 Years | 0 (0.0%) | 6 (50.0%) |
| 35 to 44 Years | 0 (0.0%) | 0 (0.0%) |
| 45 to 54 Years | 0 (0.0%) | 2 (8.7%) |
| 55 to 64 Years | 2 (9.5%) | 0 (0.0%) |
| 65 to 74 Years | 0 (0.0%) | 0 (0.0%) |
| 75 Years and over | 1 (20.0%) | 0 (0.0%) |
| Total | 3 (2.6%) | 29 (22.5%) |
Income Above Poverty by Sex and Age in Eland
According to the poverty statistics in Eland, males aged under 5 years and females aged 12 to 14 years are the age groups that are most secure financially, with 100.0% of males and 100.0% of females in these age groups living above the poverty line.
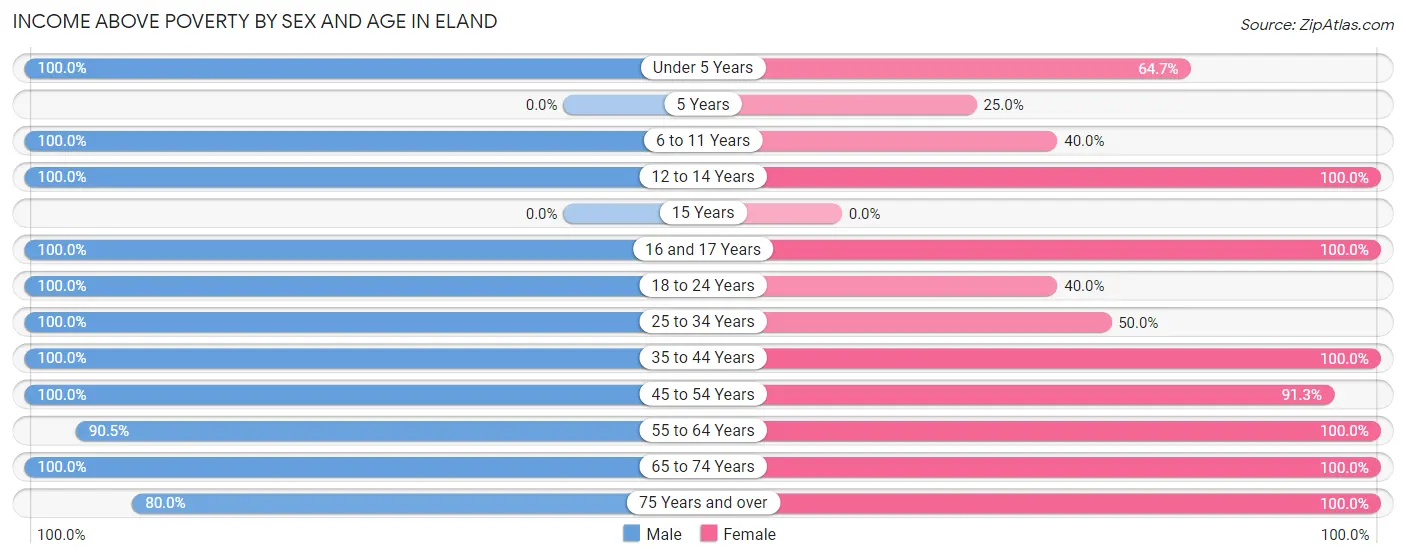
| Age Bracket | Male | Female |
| Under 5 Years | 5 (100.0%) | 11 (64.7%) |
| 5 Years | 0 (0.0%) | 2 (25.0%) |
| 6 to 11 Years | 3 (100.0%) | 4 (40.0%) |
| 12 to 14 Years | 4 (100.0%) | 13 (100.0%) |
| 15 Years | 0 (0.0%) | 0 (0.0%) |
| 16 and 17 Years | 1 (100.0%) | 1 (100.0%) |
| 18 to 24 Years | 7 (100.0%) | 2 (40.0%) |
| 25 to 34 Years | 11 (100.0%) | 6 (50.0%) |
| 35 to 44 Years | 11 (100.0%) | 4 (100.0%) |
| 45 to 54 Years | 17 (100.0%) | 21 (91.3%) |
| 55 to 64 Years | 19 (90.5%) | 23 (100.0%) |
| 65 to 74 Years | 29 (100.0%) | 8 (100.0%) |
| 75 Years and over | 4 (80.0%) | 5 (100.0%) |
| Total | 111 (97.4%) | 100 (77.5%) |
Income Below Poverty Among Married-Couple Families in Eland
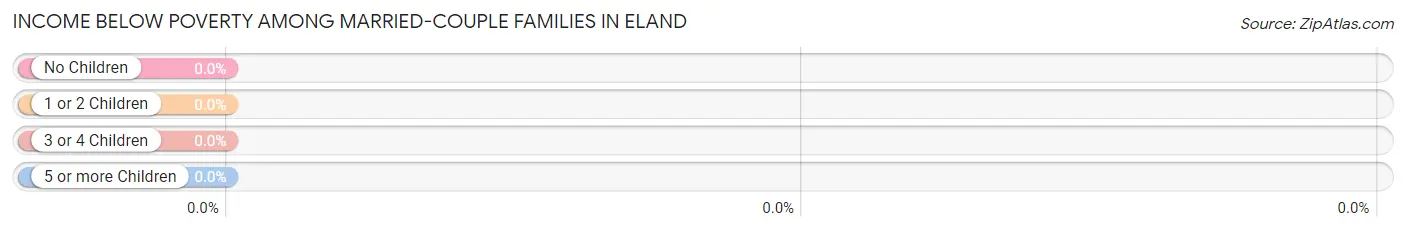
| Children | Above Poverty | Below Poverty |
| No Children | 32 (100.0%) | 0 (0.0%) |
| 1 or 2 Children | 9 (100.0%) | 0 (0.0%) |
| 3 or 4 Children | 4 (100.0%) | 0 (0.0%) |
| 5 or more Children | 0 (0.0%) | 0 (0.0%) |
| Total | 45 (100.0%) | 0 (0.0%) |
Income Below Poverty Among Single-Parent Households in Eland
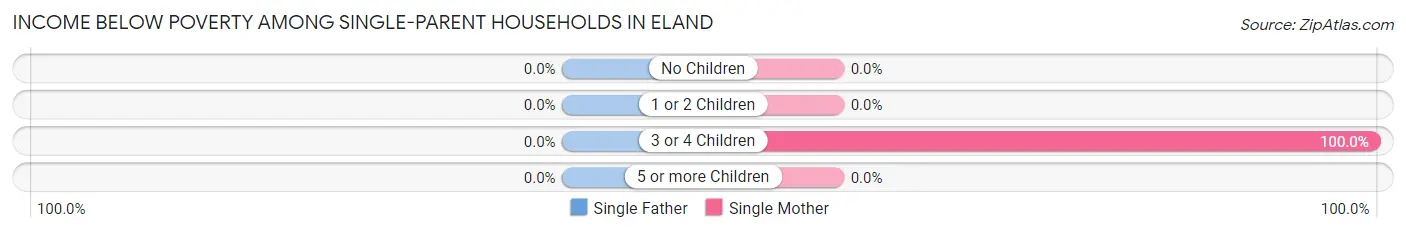
| Children | Single Father | Single Mother |
| No Children | 0 (0.0%) | 0 (0.0%) |
| 1 or 2 Children | 0 (0.0%) | 0 (0.0%) |
| 3 or 4 Children | 0 (0.0%) | 6 (100.0%) |
| 5 or more Children | 0 (0.0%) | 0 (0.0%) |
| Total | 0 (0.0%) | 6 (66.7%) |
Income Below Poverty Among Married-Couple vs Single-Parent Households in Eland
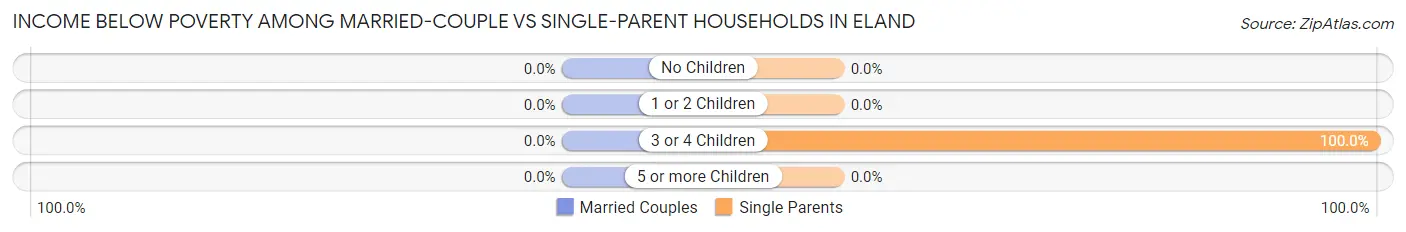
| Children | Married-Couple Families | Single-Parent Households |
| No Children | 0 (0.0%) | 0 (0.0%) |
| 1 or 2 Children | 0 (0.0%) | 0 (0.0%) |
| 3 or 4 Children | 0 (0.0%) | 6 (100.0%) |
| 5 or more Children | 0 (0.0%) | 0 (0.0%) |
| Total | 0 (0.0%) | 6 (26.1%) |
Race in Eland
The most populous races in Eland are White / Caucasian (239 | 98.4%), and Native / Alaskan (4 | 1.7%).
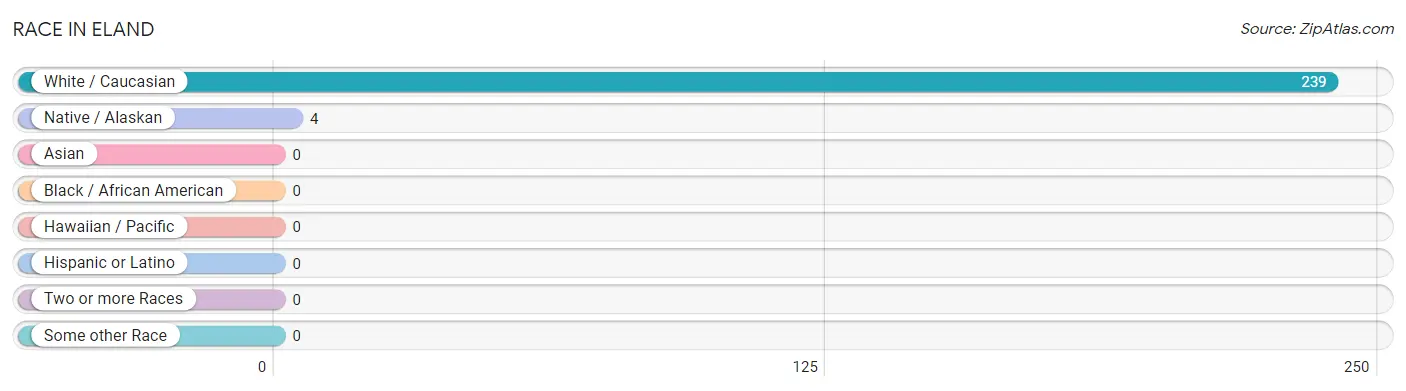
| Race | # Population | % Population |
| Asian | 0 | 0.0% |
| Black / African American | 0 | 0.0% |
| Hawaiian / Pacific | 0 | 0.0% |
| Hispanic or Latino | 0 | 0.0% |
| Native / Alaskan | 4 | 1.7% |
| White / Caucasian | 239 | 98.4% |
| Two or more Races | 0 | 0.0% |
| Some other Race | 0 | 0.0% |
| Total | 243 | 100.0% |
Ancestry in Eland
The most populous ancestries reported in Eland are German (153 | 63.0%), Norwegian (45 | 18.5%), Polish (25 | 10.3%), Irish (18 | 7.4%), and American (11 | 4.5%), together accounting for 103.7% of all Eland residents.
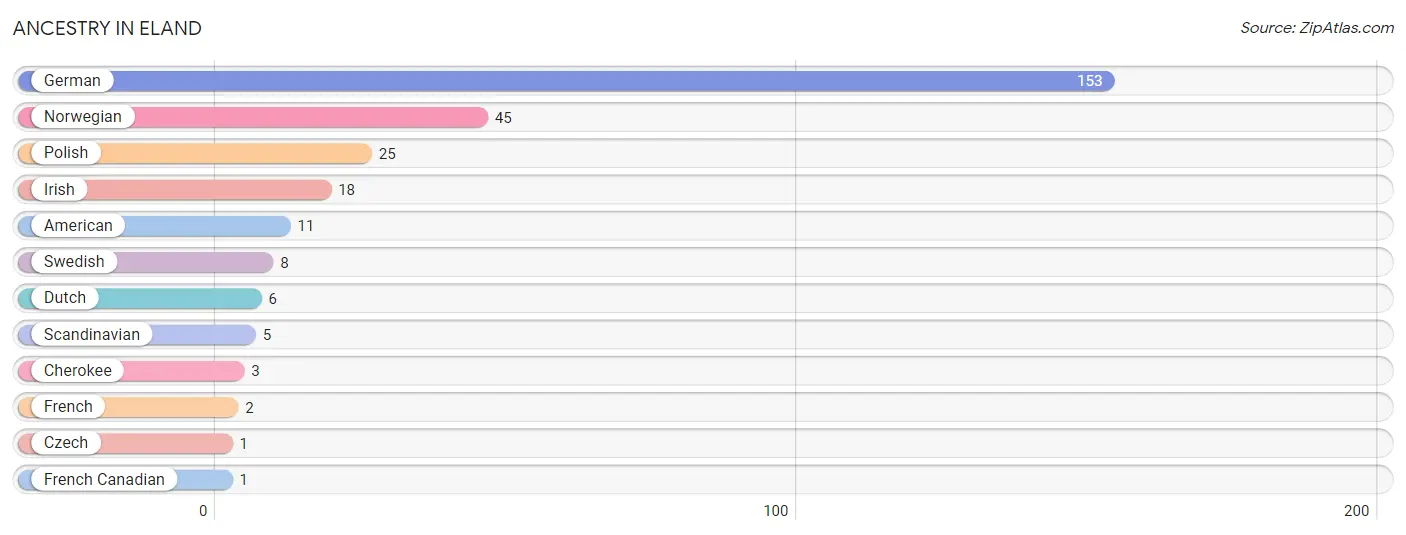
| Ancestry | # Population | % Population |
| American | 11 | 4.5% |
| Cherokee | 3 | 1.2% |
| Czech | 1 | 0.4% |
| Dutch | 6 | 2.5% |
| French | 2 | 0.8% |
| French Canadian | 1 | 0.4% |
| German | 153 | 63.0% |
| Irish | 18 | 7.4% |
| Norwegian | 45 | 18.5% |
| Polish | 25 | 10.3% |
| Scandinavian | 5 | 2.1% |
| Swedish | 8 | 3.3% | View All 12 Rows |
Immigrants in Eland

| Immigration Origin | # Population | % Population | View All 0 Rows |
Sex and Age in Eland
Sex and Age in Eland
The most populous age groups in Eland are 70 to 74 Years (21 | 18.4%) for men and 5 to 9 Years (18 | 14.0%) for women.
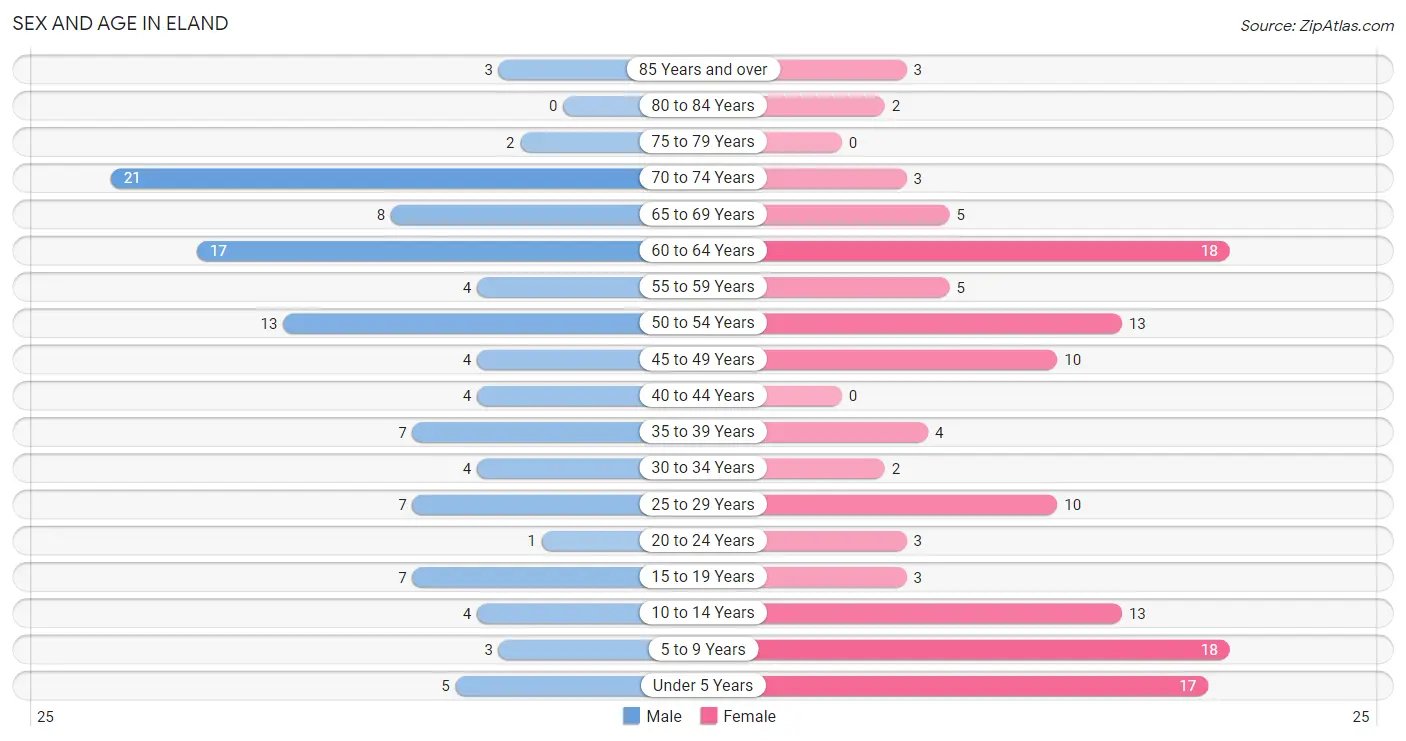
| Age Bracket | Male | Female |
| Under 5 Years | 5 (4.4%) | 17 (13.2%) |
| 5 to 9 Years | 3 (2.6%) | 18 (14.0%) |
| 10 to 14 Years | 4 (3.5%) | 13 (10.1%) |
| 15 to 19 Years | 7 (6.1%) | 3 (2.3%) |
| 20 to 24 Years | 1 (0.9%) | 3 (2.3%) |
| 25 to 29 Years | 7 (6.1%) | 10 (7.7%) |
| 30 to 34 Years | 4 (3.5%) | 2 (1.5%) |
| 35 to 39 Years | 7 (6.1%) | 4 (3.1%) |
| 40 to 44 Years | 4 (3.5%) | 0 (0.0%) |
| 45 to 49 Years | 4 (3.5%) | 10 (7.7%) |
| 50 to 54 Years | 13 (11.4%) | 13 (10.1%) |
| 55 to 59 Years | 4 (3.5%) | 5 (3.9%) |
| 60 to 64 Years | 17 (14.9%) | 18 (14.0%) |
| 65 to 69 Years | 8 (7.0%) | 5 (3.9%) |
| 70 to 74 Years | 21 (18.4%) | 3 (2.3%) |
| 75 to 79 Years | 2 (1.8%) | 0 (0.0%) |
| 80 to 84 Years | 0 (0.0%) | 2 (1.5%) |
| 85 Years and over | 3 (2.6%) | 3 (2.3%) |
| Total | 114 (100.0%) | 129 (100.0%) |
Families and Households in Eland
Median Family Size in Eland
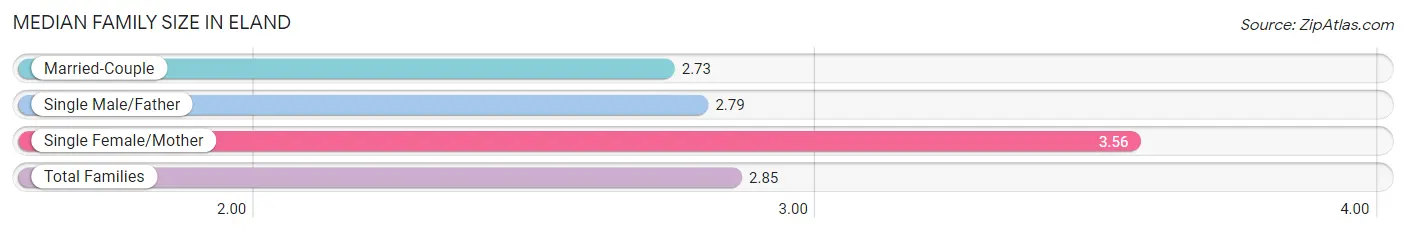
The median family size in Eland is 2.85 persons per family, with single female/mother families (9 | 13.2%) accounting for the largest median family size of 3.56 persons per family. On the other hand, married-couple families (45 | 66.2%) represent the smallest median family size with 2.73 persons per family.
| Family Type | # Families | Family Size |
| Married-Couple | 45 (66.2%) | 2.73 |
| Single Male/Father | 14 (20.6%) | 2.79 |
| Single Female/Mother | 9 (13.2%) | 3.56 |
| Total Families | 68 (100.0%) | 2.85 |
Median Household Size in Eland
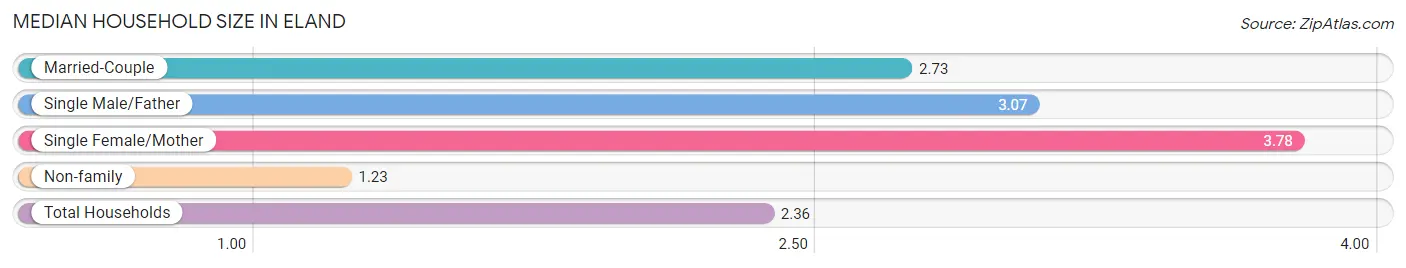
The median household size in Eland is 2.36 persons per household, with single female/mother households (9 | 8.7%) accounting for the largest median household size of 3.78 persons per household. non-family households (35 | 34.0%) represent the smallest median household size with 1.23 persons per household.
| Household Type | # Households | Household Size |
| Married-Couple | 45 (43.7%) | 2.73 |
| Single Male/Father | 14 (13.6%) | 3.07 |
| Single Female/Mother | 9 (8.7%) | 3.78 |
| Non-family | 35 (34.0%) | 1.23 |
| Total Households | 103 (100.0%) | 2.36 |
Household Size by Marriage Status in Eland
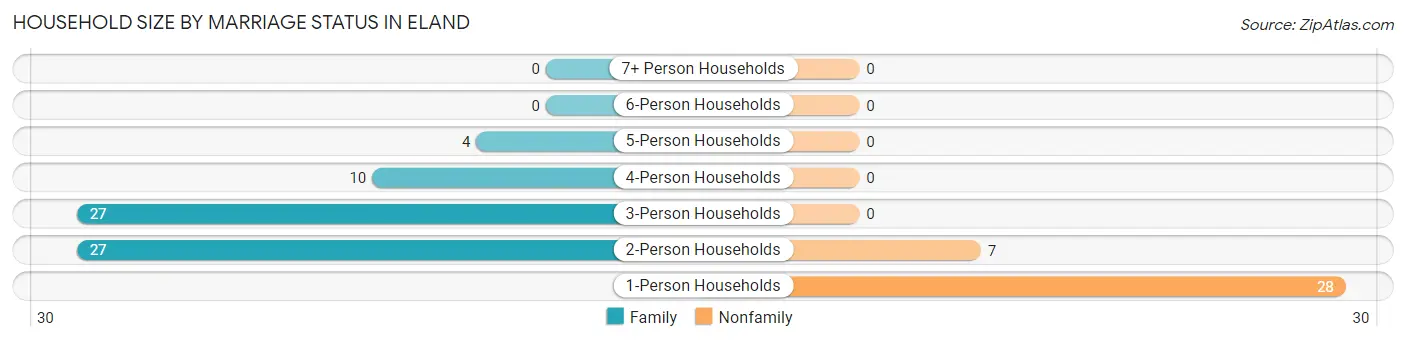
Out of a total of 103 households in Eland, 68 (66.0%) are family households, while 35 (34.0%) are nonfamily households. The most numerous type of family households are 2-person households, comprising 27, and the most common type of nonfamily households are 1-person households, comprising 28.
| Household Size | Family Households | Nonfamily Households |
| 1-Person Households | - | 28 (27.2%) |
| 2-Person Households | 27 (26.2%) | 7 (6.8%) |
| 3-Person Households | 27 (26.2%) | 0 (0.0%) |
| 4-Person Households | 10 (9.7%) | 0 (0.0%) |
| 5-Person Households | 4 (3.9%) | 0 (0.0%) |
| 6-Person Households | 0 (0.0%) | 0 (0.0%) |
| 7+ Person Households | 0 (0.0%) | 0 (0.0%) |
| Total | 68 (66.0%) | 35 (34.0%) |
Female Fertility in Eland
Fertility by Age in Eland
| Age Bracket | Women with Births | Births / 1,000 Women |
| 15 to 19 years | 0 (0.0%) | 0.0 |
| 20 to 34 years | 0 (0.0%) | 0.0 |
| 35 to 50 years | 0 (0.0%) | 0.0 |
| Total | 0 (0.0%) | 0.0 |
Fertility by Age by Marriage Status in Eland
| Age Bracket | Married | Unmarried |
| 15 to 19 years | 0 (0.0%) | 0 (0.0%) |
| 20 to 34 years | 0 (0.0%) | 0 (0.0%) |
| 35 to 50 years | 0 (0.0%) | 0 (0.0%) |
| Total | 0 (0.0%) | 0 (0.0%) |
Fertility by Education in Eland
| Educational Attainment | Women with Births | Births / 1,000 Women |
| Less than High School | 0 (0.0%) | 0.0 |
| High School Diploma | 0 (0.0%) | 0.0 |
| College or Associate's Degree | 0 (0.0%) | 0.0 |
| Bachelor's Degree | 0 (0.0%) | 0.0 |
| Graduate Degree | 0 (0.0%) | 0.0 |
| Total | 0 (0.0%) | 0.0 |
Fertility by Education by Marriage Status in Eland
| Educational Attainment | Married | Unmarried |
| Less than High School | 0 (0.0%) | 0 (0.0%) |
| High School Diploma | 0 (0.0%) | 0 (0.0%) |
| College or Associate's Degree | 0 (0.0%) | 0 (0.0%) |
| Bachelor's Degree | 0 (0.0%) | 0 (0.0%) |
| Graduate Degree | 0 (0.0%) | 0 (0.0%) |
| Total | 0 (0.0%) | 0 (0.0%) |
Employment Characteristics in Eland
Employment by Class of Employer in Eland
Among the 135 employed individuals in Eland, private company employees (116 | 85.9%), self-employed (not incorporated) (8 | 5.9%), and not-for-profit organizations (3 | 2.2%) make up the most common classes of employment.
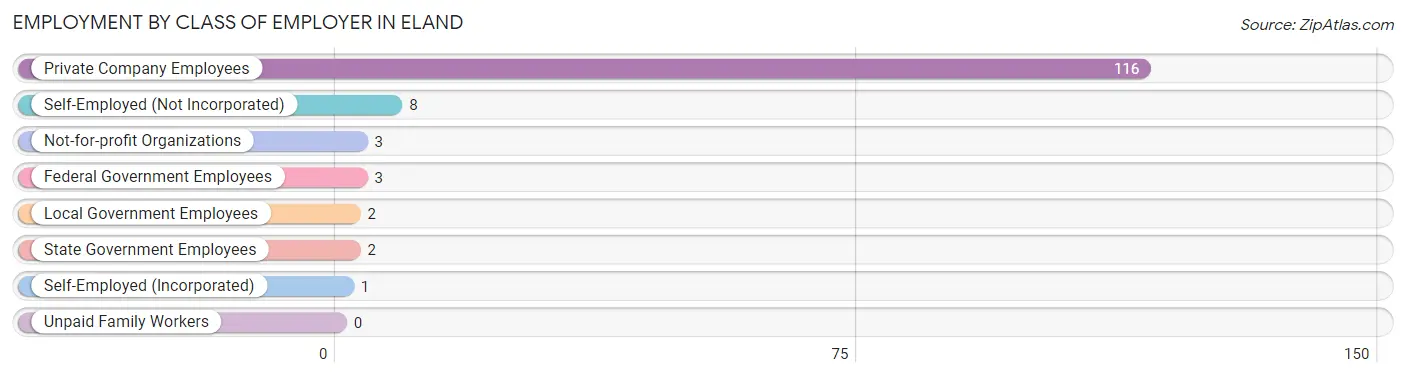
| Employer Class | # Employees | % Employees |
| Private Company Employees | 116 | 85.9% |
| Self-Employed (Incorporated) | 1 | 0.7% |
| Self-Employed (Not Incorporated) | 8 | 5.9% |
| Not-for-profit Organizations | 3 | 2.2% |
| Local Government Employees | 2 | 1.5% |
| State Government Employees | 2 | 1.5% |
| Federal Government Employees | 3 | 2.2% |
| Unpaid Family Workers | 0 | 0.0% |
| Total | 135 | 100.0% |
Employment Status by Age in Eland
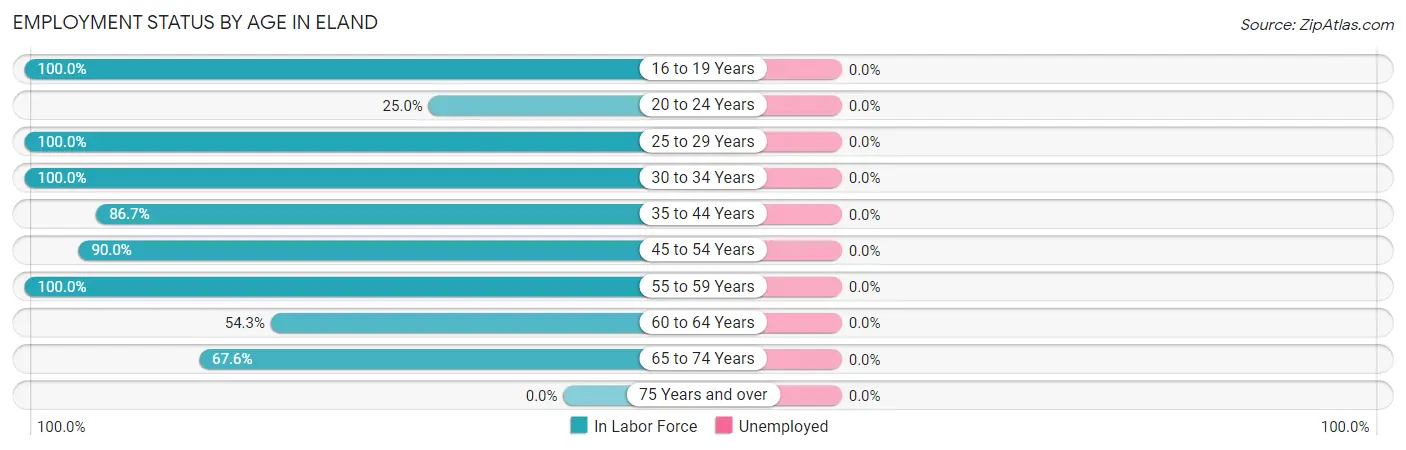
| Age Bracket | In Labor Force | Unemployed |
| 16 to 19 Years | 10 (100.0%) | 0 (0.0%) |
| 20 to 24 Years | 1 (25.0%) | 0 (0.0%) |
| 25 to 29 Years | 17 (100.0%) | 0 (0.0%) |
| 30 to 34 Years | 6 (100.0%) | 0 (0.0%) |
| 35 to 44 Years | 13 (86.7%) | 0 (0.0%) |
| 45 to 54 Years | 36 (90.0%) | 0 (0.0%) |
| 55 to 59 Years | 9 (100.0%) | 0 (0.0%) |
| 60 to 64 Years | 19 (54.3%) | 0 (0.0%) |
| 65 to 74 Years | 25 (67.6%) | 0 (0.0%) |
| 75 Years and over | 0 (0.0%) | 0 (0.0%) |
| Total | 136 (74.3%) | 0 (0.0%) |
Employment Status by Educational Attainment in Eland
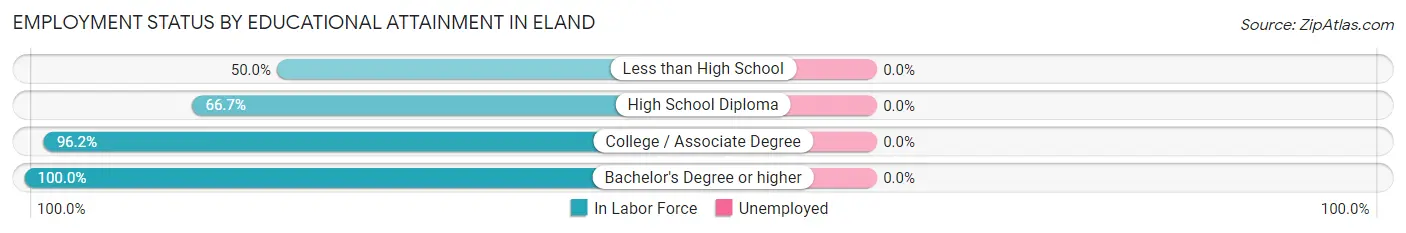
| Educational Attainment | In Labor Force | Unemployed |
| Less than High School | 2 (50.0%) | 0 (0.0%) |
| High School Diploma | 36 (66.7%) | 0 (0.0%) |
| College / Associate Degree | 51 (96.2%) | 0 (0.0%) |
| Bachelor's Degree or higher | 11 (100.0%) | 0 (0.0%) |
| Total | 100 (82.0%) | 0 (0.0%) |
Employment Occupations by Sex in Eland
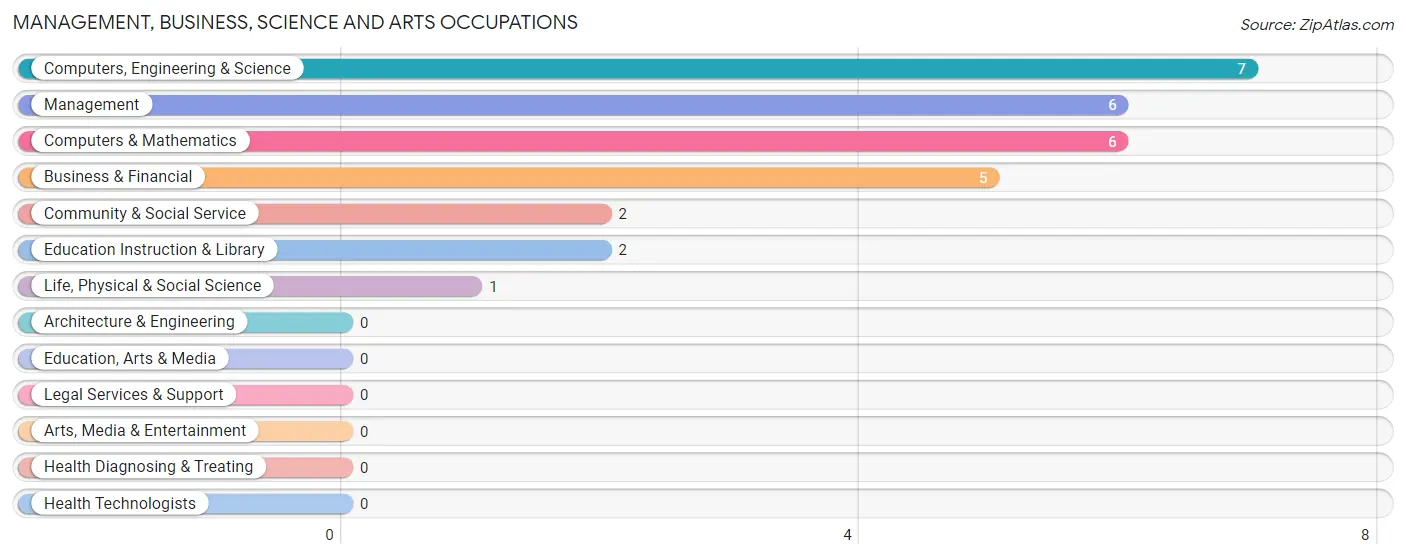
Management, Business, Science and Arts Occupations
The most common Management, Business, Science and Arts occupations in Eland are Computers, Engineering & Science (7 | 5.1%), Management (6 | 4.4%), Computers & Mathematics (6 | 4.4%), Business & Financial (5 | 3.7%), and Community & Social Service (2 | 1.5%).
Management, Business, Science and Arts Occupations by Sex
Within the Management, Business, Science and Arts occupations in Eland, the most male-oriented occupations are Community & Social Service (100.0%), Education Instruction & Library (100.0%), and Computers & Mathematics (66.7%), while the most female-oriented occupations are Management (100.0%), Life, Physical & Social Science (100.0%), and Business & Financial (60.0%).
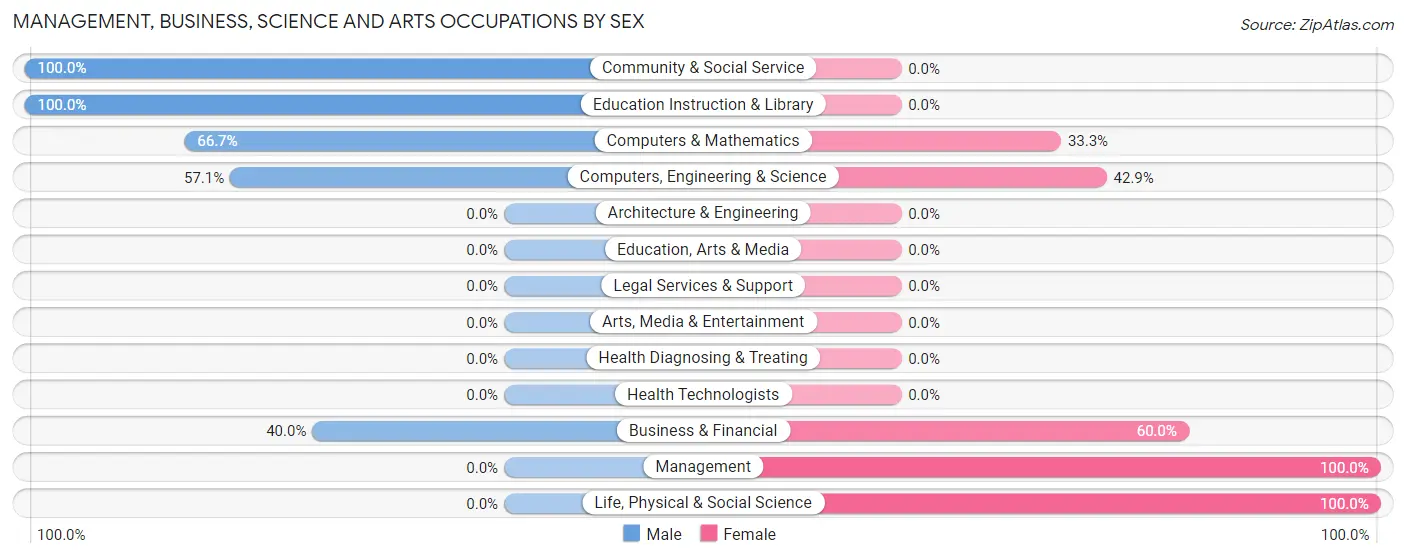
| Occupation | Male | Female |
| Management | 0 (0.0%) | 6 (100.0%) |
| Business & Financial | 2 (40.0%) | 3 (60.0%) |
| Computers, Engineering & Science | 4 (57.1%) | 3 (42.9%) |
| Computers & Mathematics | 4 (66.7%) | 2 (33.3%) |
| Architecture & Engineering | 0 (0.0%) | 0 (0.0%) |
| Life, Physical & Social Science | 0 (0.0%) | 1 (100.0%) |
| Community & Social Service | 2 (100.0%) | 0 (0.0%) |
| Education, Arts & Media | 0 (0.0%) | 0 (0.0%) |
| Legal Services & Support | 0 (0.0%) | 0 (0.0%) |
| Education Instruction & Library | 2 (100.0%) | 0 (0.0%) |
| Arts, Media & Entertainment | 0 (0.0%) | 0 (0.0%) |
| Health Diagnosing & Treating | 0 (0.0%) | 0 (0.0%) |
| Health Technologists | 0 (0.0%) | 0 (0.0%) |
| Total (Category) | 8 (40.0%) | 12 (60.0%) |
| Total (Overall) | 78 (57.4%) | 58 (42.6%) |
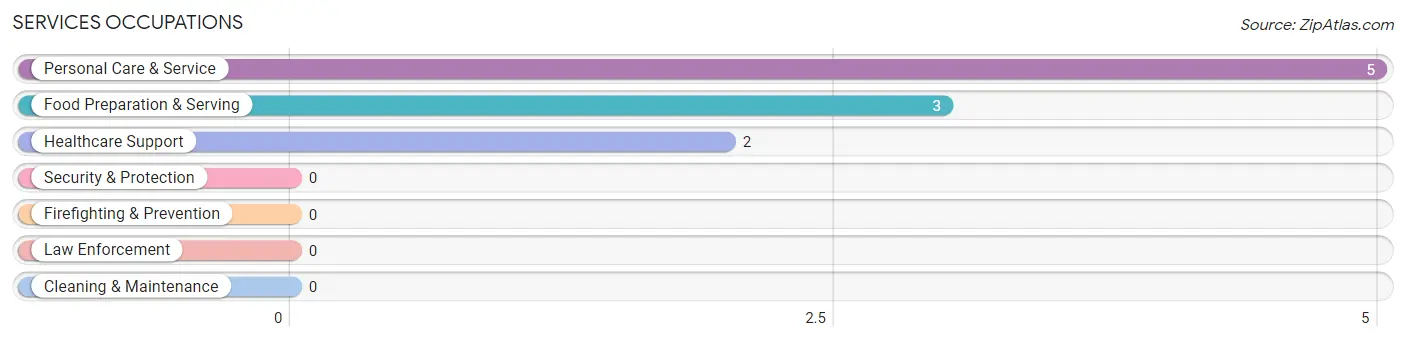
Services Occupations
The most common Services occupations in Eland are Personal Care & Service (5 | 3.7%), Food Preparation & Serving (3 | 2.2%), and Healthcare Support (2 | 1.5%).
Services Occupations by Sex
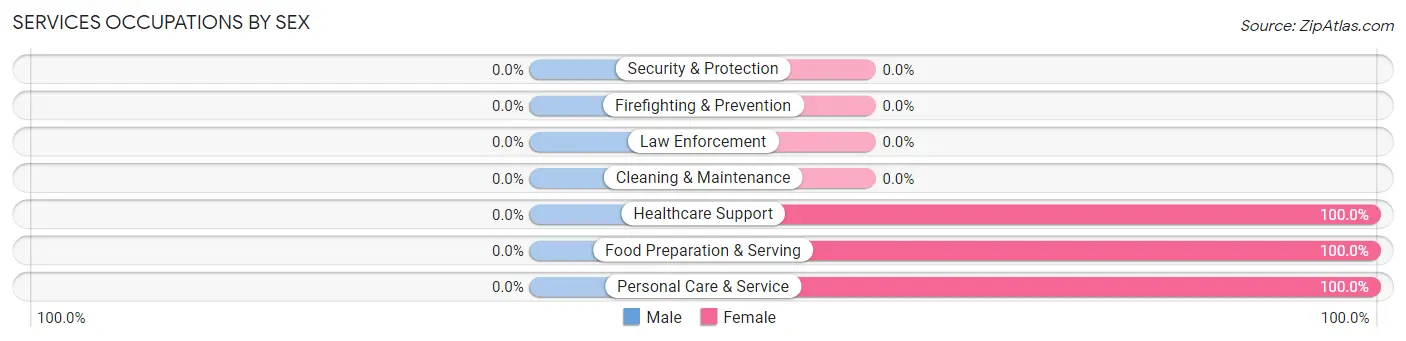
| Occupation | Male | Female |
| Healthcare Support | 0 (0.0%) | 2 (100.0%) |
| Security & Protection | 0 (0.0%) | 0 (0.0%) |
| Firefighting & Prevention | 0 (0.0%) | 0 (0.0%) |
| Law Enforcement | 0 (0.0%) | 0 (0.0%) |
| Food Preparation & Serving | 0 (0.0%) | 3 (100.0%) |
| Cleaning & Maintenance | 0 (0.0%) | 0 (0.0%) |
| Personal Care & Service | 0 (0.0%) | 5 (100.0%) |
| Total (Category) | 0 (0.0%) | 10 (100.0%) |
| Total (Overall) | 78 (57.4%) | 58 (42.6%) |
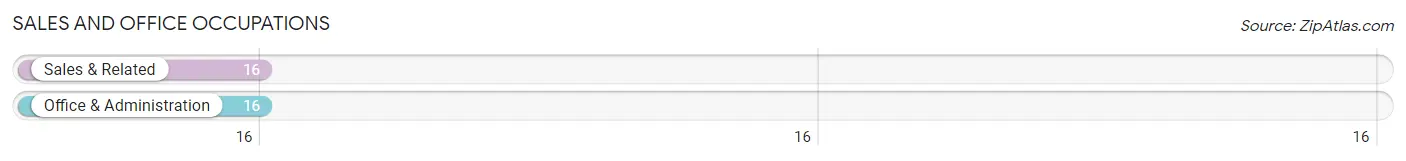
Sales and Office Occupations
The most common Sales and Office occupations in Eland are Sales & Related (16 | 11.8%), and Office & Administration (16 | 11.8%).
Sales and Office Occupations by Sex
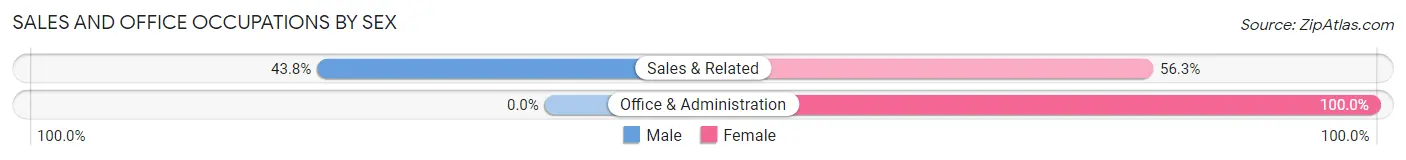
| Occupation | Male | Female |
| Sales & Related | 7 (43.8%) | 9 (56.2%) |
| Office & Administration | 0 (0.0%) | 16 (100.0%) |
| Total (Category) | 7 (21.9%) | 25 (78.1%) |
| Total (Overall) | 78 (57.4%) | 58 (42.6%) |
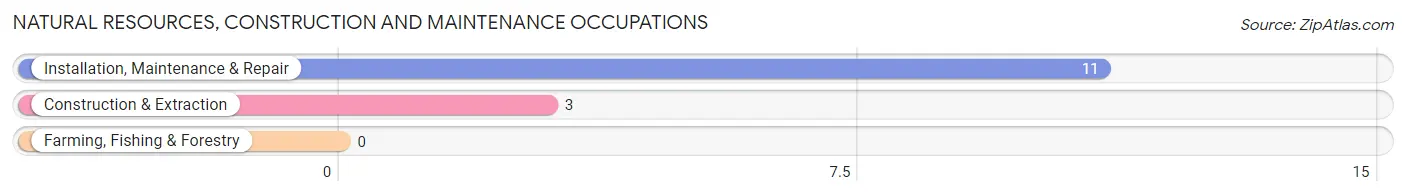
Natural Resources, Construction and Maintenance Occupations
The most common Natural Resources, Construction and Maintenance occupations in Eland are Installation, Maintenance & Repair (11 | 8.1%), and Construction & Extraction (3 | 2.2%).
Natural Resources, Construction and Maintenance Occupations by Sex
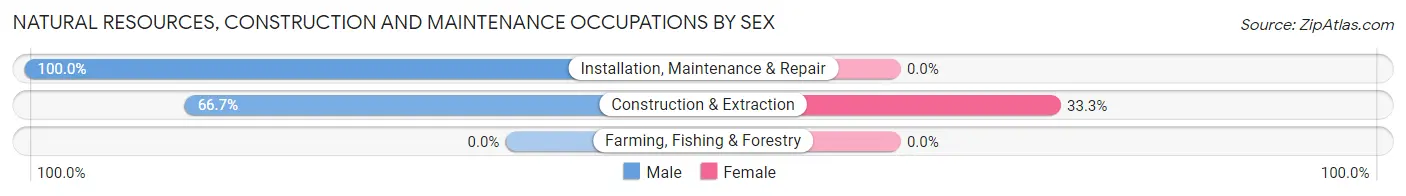
| Occupation | Male | Female |
| Farming, Fishing & Forestry | 0 (0.0%) | 0 (0.0%) |
| Construction & Extraction | 2 (66.7%) | 1 (33.3%) |
| Installation, Maintenance & Repair | 11 (100.0%) | 0 (0.0%) |
| Total (Category) | 13 (92.9%) | 1 (7.1%) |
| Total (Overall) | 78 (57.4%) | 58 (42.6%) |
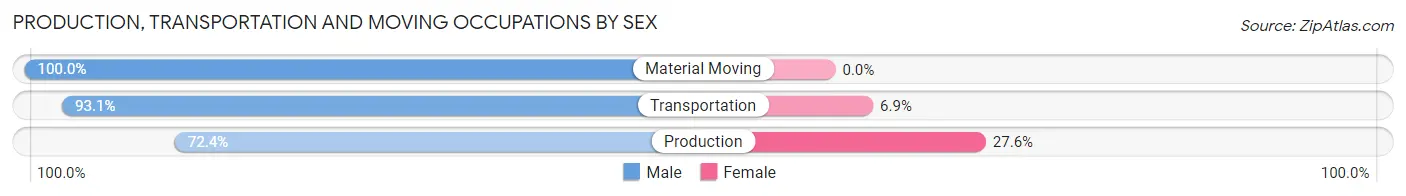
Production, Transportation and Moving Occupations
The most common Production, Transportation and Moving occupations in Eland are Production (29 | 21.3%), Transportation (29 | 21.3%), and Material Moving (2 | 1.5%).
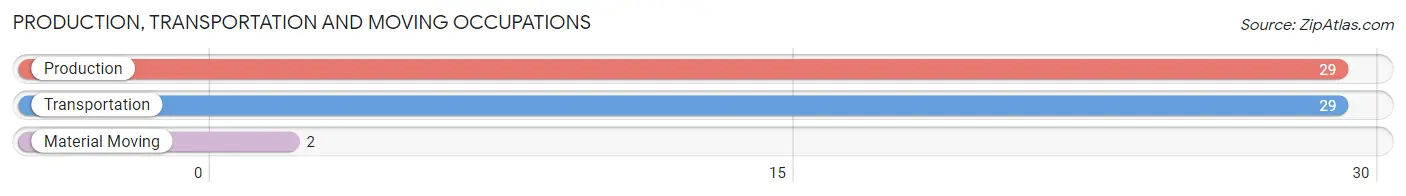
Production, Transportation and Moving Occupations by Sex
| Occupation | Male | Female |
| Production | 21 (72.4%) | 8 (27.6%) |
| Transportation | 27 (93.1%) | 2 (6.9%) |
| Material Moving | 2 (100.0%) | 0 (0.0%) |
| Total (Category) | 50 (83.3%) | 10 (16.7%) |
| Total (Overall) | 78 (57.4%) | 58 (42.6%) |
Employment Industries by Sex in Eland
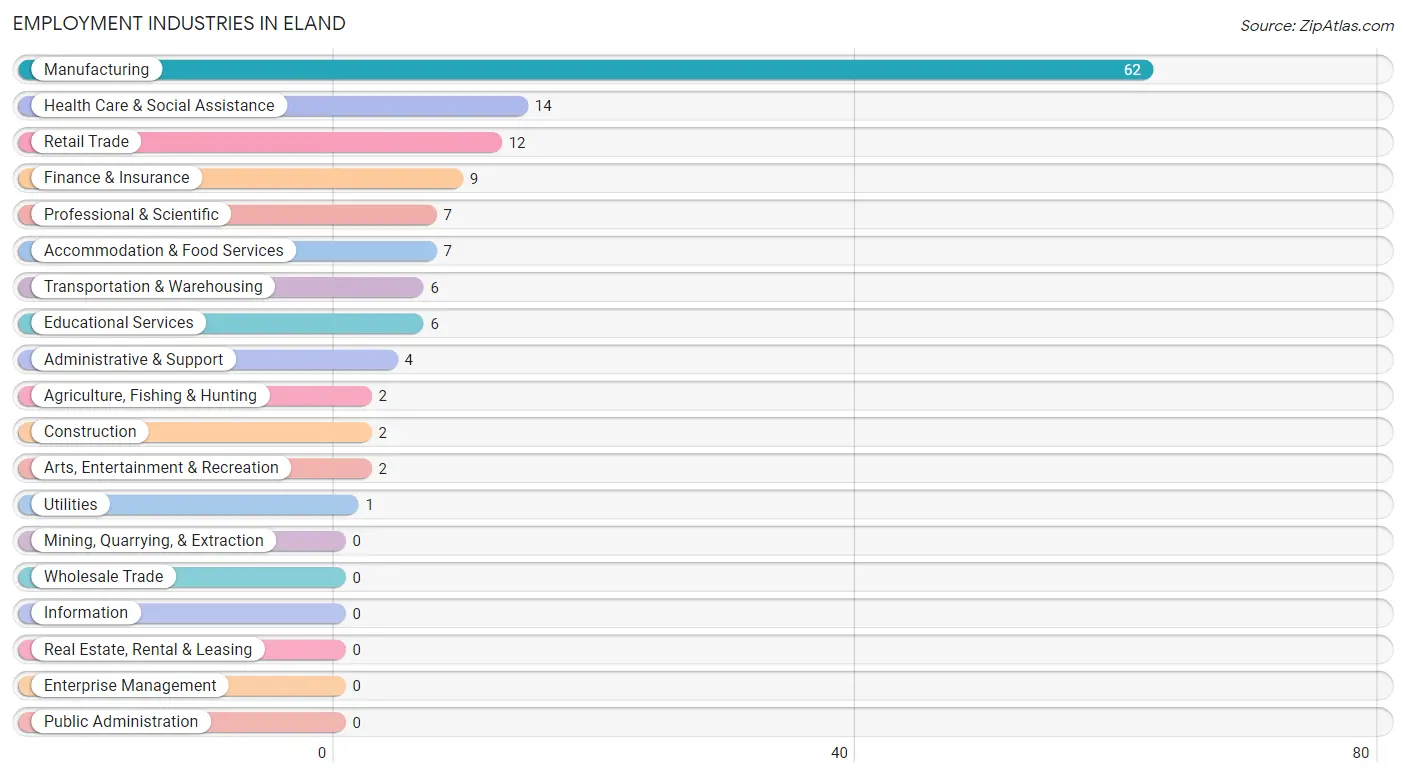
Employment Industries in Eland
The major employment industries in Eland include Manufacturing (62 | 45.6%), Health Care & Social Assistance (14 | 10.3%), Retail Trade (12 | 8.8%), Finance & Insurance (9 | 6.6%), and Professional & Scientific (7 | 5.1%).
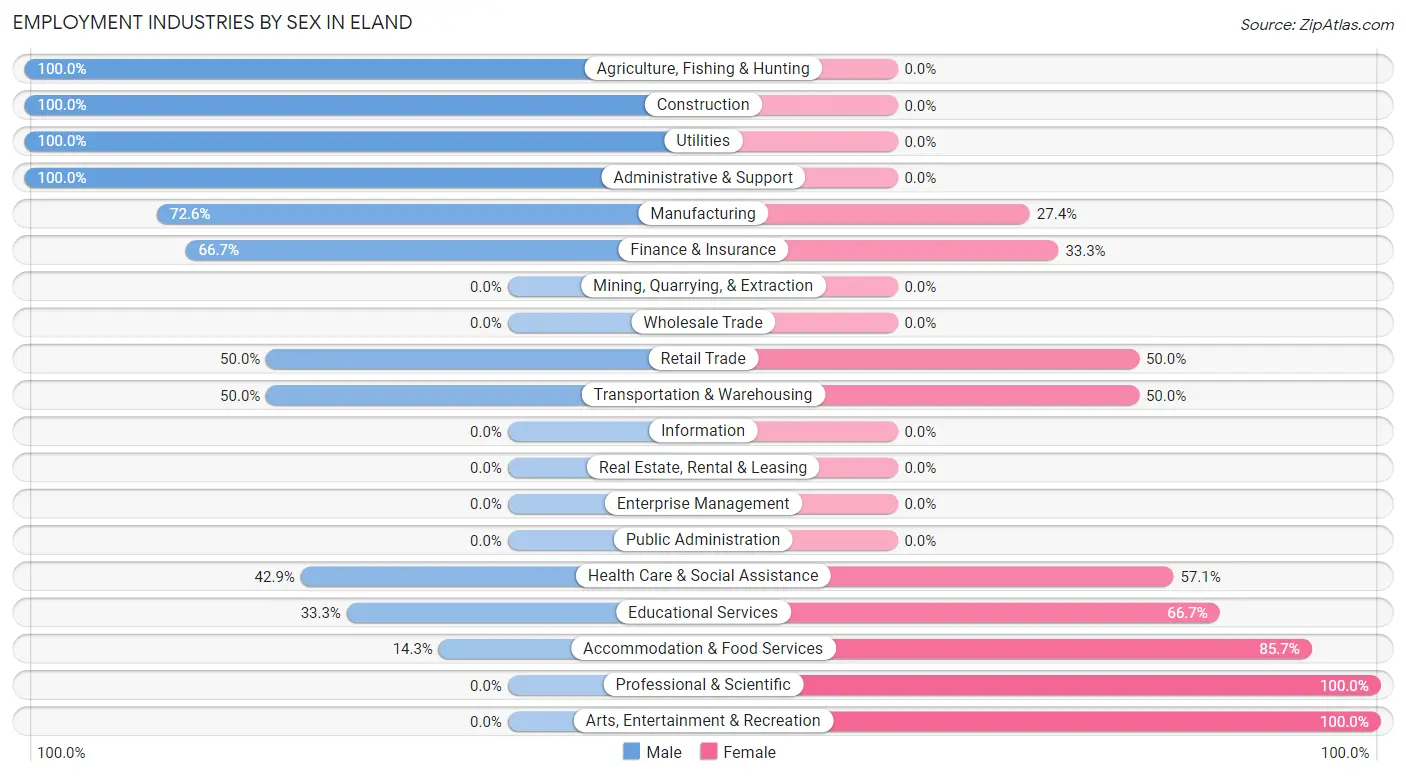
Employment Industries by Sex in Eland
The Eland industries that see more men than women are Agriculture, Fishing & Hunting (100.0%), Construction (100.0%), and Utilities (100.0%), whereas the industries that tend to have a higher number of women are Professional & Scientific (100.0%), Arts, Entertainment & Recreation (100.0%), and Accommodation & Food Services (85.7%).
| Industry | Male | Female |
| Agriculture, Fishing & Hunting | 2 (100.0%) | 0 (0.0%) |
| Mining, Quarrying, & Extraction | 0 (0.0%) | 0 (0.0%) |
| Construction | 2 (100.0%) | 0 (0.0%) |
| Manufacturing | 45 (72.6%) | 17 (27.4%) |
| Wholesale Trade | 0 (0.0%) | 0 (0.0%) |
| Retail Trade | 6 (50.0%) | 6 (50.0%) |
| Transportation & Warehousing | 3 (50.0%) | 3 (50.0%) |
| Utilities | 1 (100.0%) | 0 (0.0%) |
| Information | 0 (0.0%) | 0 (0.0%) |
| Finance & Insurance | 6 (66.7%) | 3 (33.3%) |
| Real Estate, Rental & Leasing | 0 (0.0%) | 0 (0.0%) |
| Professional & Scientific | 0 (0.0%) | 7 (100.0%) |
| Enterprise Management | 0 (0.0%) | 0 (0.0%) |
| Administrative & Support | 4 (100.0%) | 0 (0.0%) |
| Educational Services | 2 (33.3%) | 4 (66.7%) |
| Health Care & Social Assistance | 6 (42.9%) | 8 (57.1%) |
| Arts, Entertainment & Recreation | 0 (0.0%) | 2 (100.0%) |
| Accommodation & Food Services | 1 (14.3%) | 6 (85.7%) |
| Public Administration | 0 (0.0%) | 0 (0.0%) |
| Total | 78 (57.4%) | 58 (42.6%) |
Education in Eland
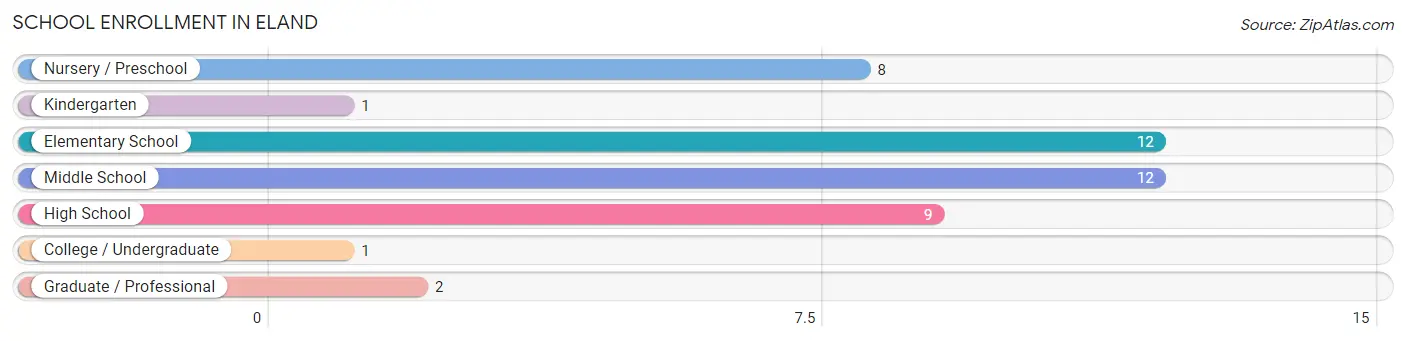
School Enrollment in Eland
The most common levels of schooling among the 45 students in Eland are elementary school (12 | 26.7%), middle school (12 | 26.7%), and high school (9 | 20.0%).
| School Level | # Students | % Students |
| Nursery / Preschool | 8 | 17.8% |
| Kindergarten | 1 | 2.2% |
| Elementary School | 12 | 26.7% |
| Middle School | 12 | 26.7% |
| High School | 9 | 20.0% |
| College / Undergraduate | 1 | 2.2% |
| Graduate / Professional | 2 | 4.4% |
| Total | 45 | 100.0% |
School Enrollment by Age by Funding Source in Eland
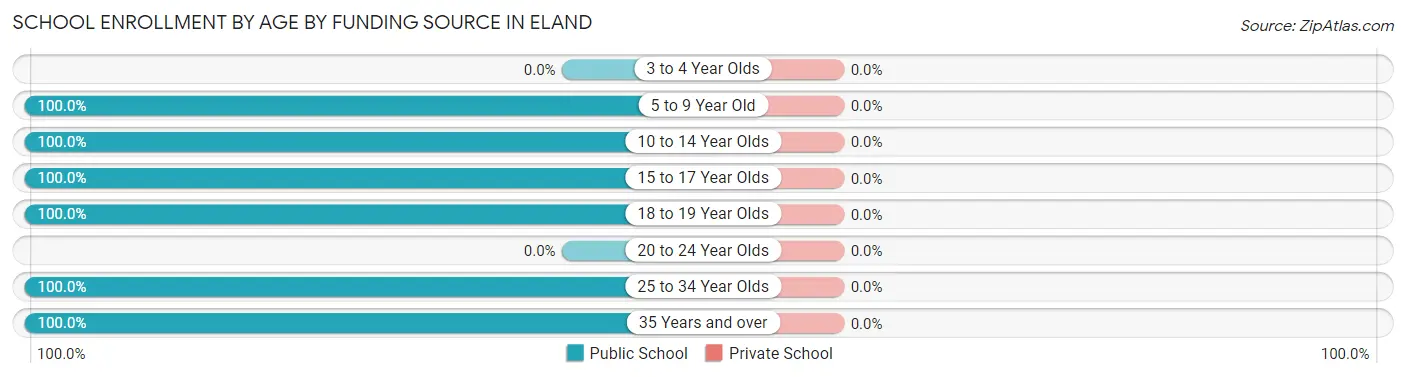
| Age Bracket | Public School | Private School |
| 3 to 4 Year Olds | 0 (0.0%) | 0 (0.0%) |
| 5 to 9 Year Old | 21 (100.0%) | 0 (0.0%) |
| 10 to 14 Year Olds | 17 (100.0%) | 0 (0.0%) |
| 15 to 17 Year Olds | 2 (100.0%) | 0 (0.0%) |
| 18 to 19 Year Olds | 2 (100.0%) | 0 (0.0%) |
| 20 to 24 Year Olds | 0 (0.0%) | 0 (0.0%) |
| 25 to 34 Year Olds | 1 (100.0%) | 0 (0.0%) |
| 35 Years and over | 2 (100.0%) | 0 (0.0%) |
| Total | 45 (100.0%) | 0 (0.0%) |
Educational Attainment by Field of Study in Eland
Bio, nature & agricultural (4 | 21.0%), education (4 | 21.0%), communications (4 | 21.0%), science & technology (2 | 10.5%), and literature & languages (2 | 10.5%) are the most common fields of study among 19 individuals in Eland who have obtained a bachelor's degree or higher.
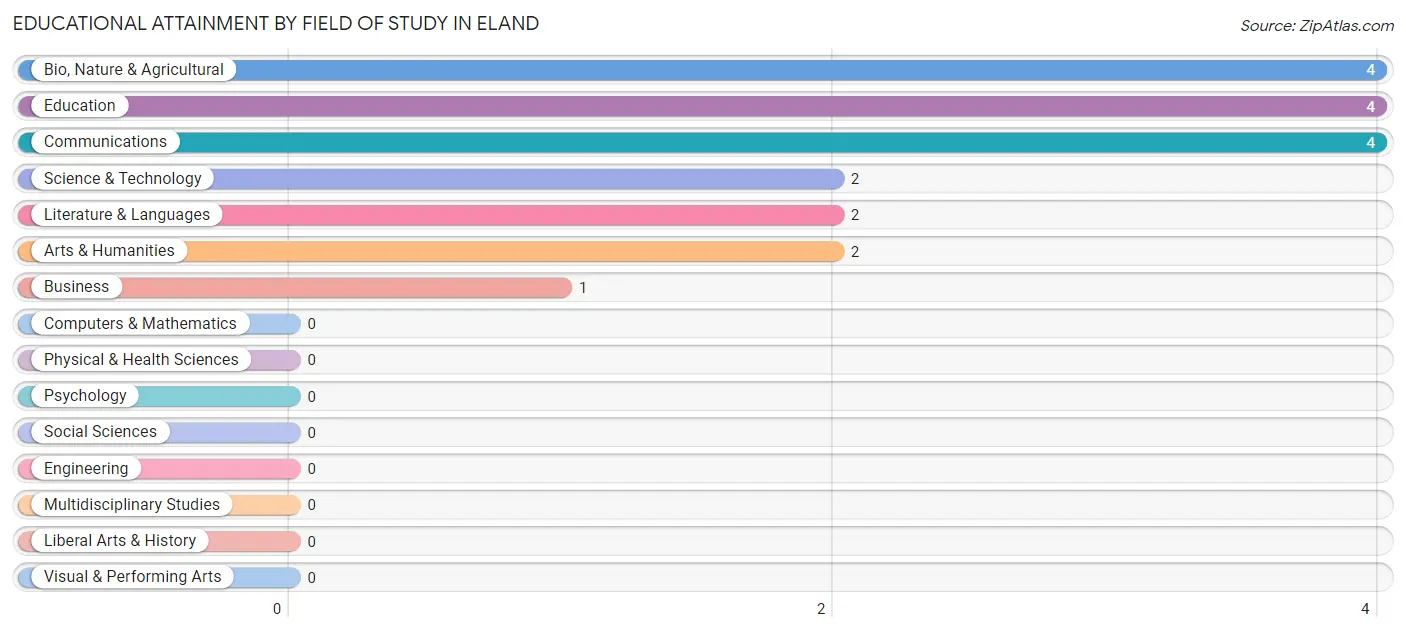
| Field of Study | # Graduates | % Graduates |
| Computers & Mathematics | 0 | 0.0% |
| Bio, Nature & Agricultural | 4 | 21.0% |
| Physical & Health Sciences | 0 | 0.0% |
| Psychology | 0 | 0.0% |
| Social Sciences | 0 | 0.0% |
| Engineering | 0 | 0.0% |
| Multidisciplinary Studies | 0 | 0.0% |
| Science & Technology | 2 | 10.5% |
| Business | 1 | 5.3% |
| Education | 4 | 21.0% |
| Literature & Languages | 2 | 10.5% |
| Liberal Arts & History | 0 | 0.0% |
| Visual & Performing Arts | 0 | 0.0% |
| Communications | 4 | 21.0% |
| Arts & Humanities | 2 | 10.5% |
| Total | 19 | 100.0% |
Transportation & Commute in Eland
Vehicle Availability by Sex in Eland
The most prevalent vehicle ownership categories in Eland are males with 2 vehicles (47, accounting for 61.0%) and females with 2 vehicles (29, making up 81.0%).
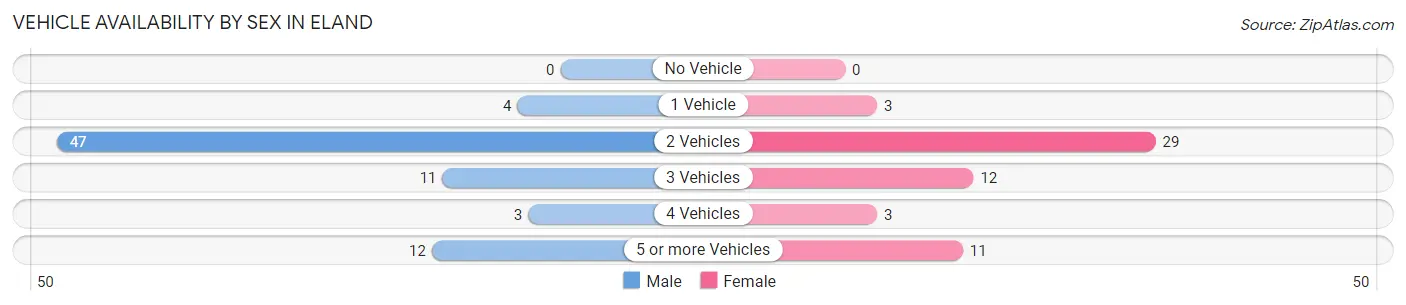
| Vehicles Available | Male | Female |
| No Vehicle | 0 (0.0%) | 0 (0.0%) |
| 1 Vehicle | 4 (5.2%) | 3 (5.2%) |
| 2 Vehicles | 47 (61.0%) | 29 (50.0%) |
| 3 Vehicles | 11 (14.3%) | 12 (20.7%) |
| 4 Vehicles | 3 (3.9%) | 3 (5.2%) |
| 5 or more Vehicles | 12 (15.6%) | 11 (19.0%) |
| Total | 77 (100.0%) | 58 (100.0%) |
Commute Time in Eland
The most frequently occuring commute durations in Eland are 5 to 9 minutes (29 commuters, 24.6%), 10 to 14 minutes (21 commuters, 17.8%), and 30 to 34 minutes (18 commuters, 15.2%).
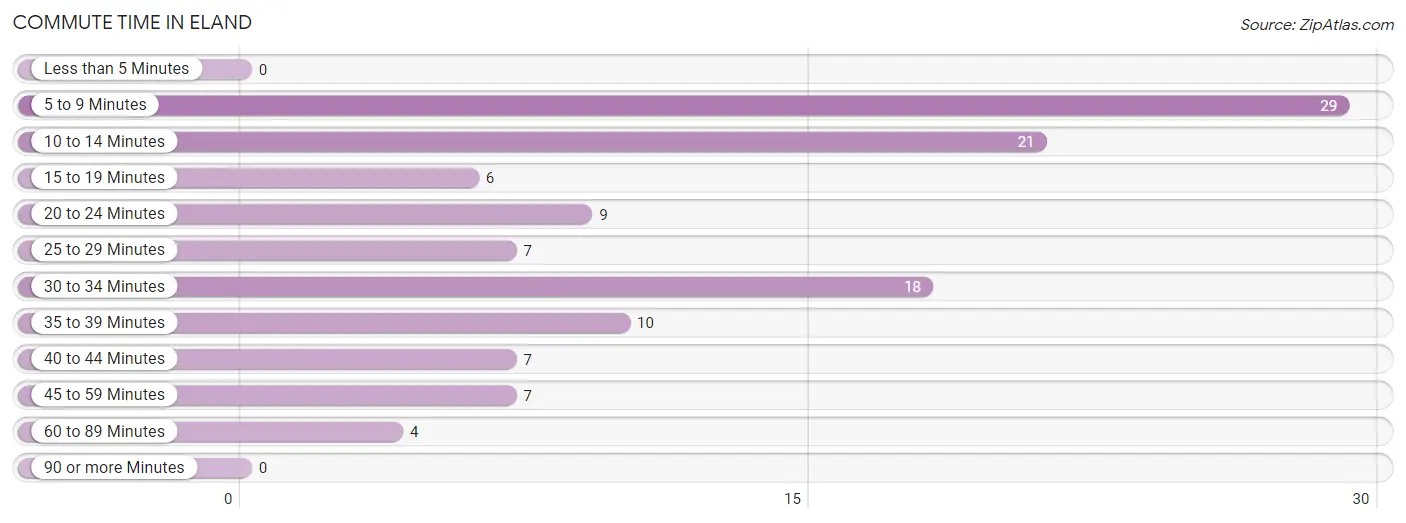
| Commute Time | # Commuters | % Commuters |
| Less than 5 Minutes | 0 | 0.0% |
| 5 to 9 Minutes | 29 | 24.6% |
| 10 to 14 Minutes | 21 | 17.8% |
| 15 to 19 Minutes | 6 | 5.1% |
| 20 to 24 Minutes | 9 | 7.6% |
| 25 to 29 Minutes | 7 | 5.9% |
| 30 to 34 Minutes | 18 | 15.2% |
| 35 to 39 Minutes | 10 | 8.5% |
| 40 to 44 Minutes | 7 | 5.9% |
| 45 to 59 Minutes | 7 | 5.9% |
| 60 to 89 Minutes | 4 | 3.4% |
| 90 or more Minutes | 0 | 0.0% |
Commute Time by Sex in Eland
The most common commute times in Eland are 5 to 9 minutes (22 commuters, 33.9%) for males and 10 to 14 minutes (15 commuters, 28.3%) for females.
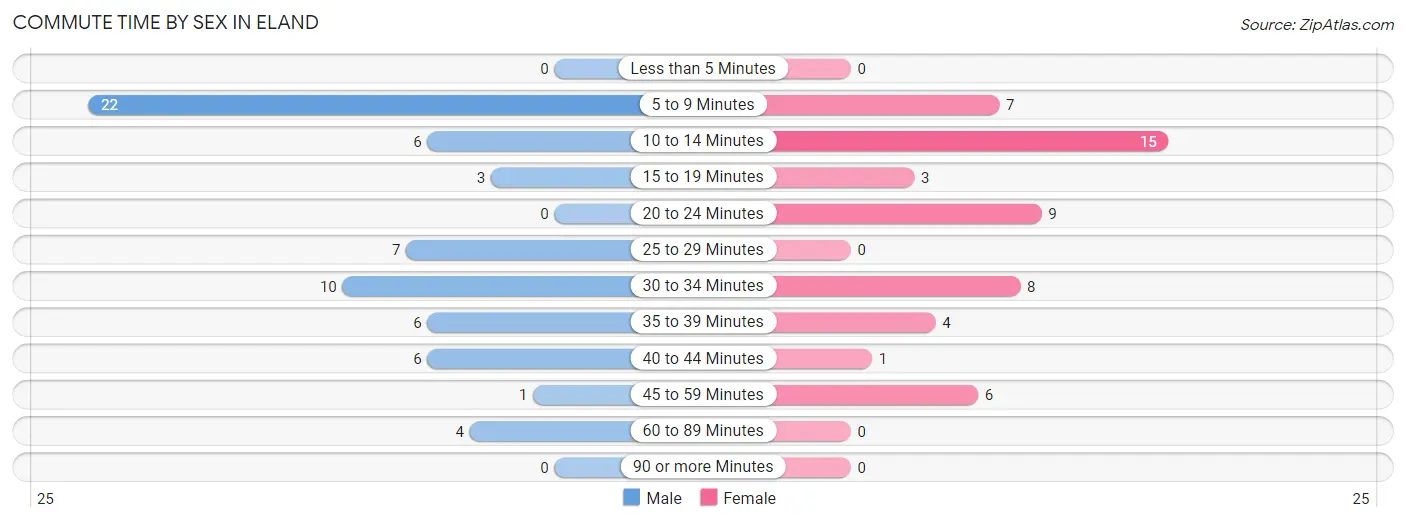
| Commute Time | Male | Female |
| Less than 5 Minutes | 0 (0.0%) | 0 (0.0%) |
| 5 to 9 Minutes | 22 (33.9%) | 7 (13.2%) |
| 10 to 14 Minutes | 6 (9.2%) | 15 (28.3%) |
| 15 to 19 Minutes | 3 (4.6%) | 3 (5.7%) |
| 20 to 24 Minutes | 0 (0.0%) | 9 (17.0%) |
| 25 to 29 Minutes | 7 (10.8%) | 0 (0.0%) |
| 30 to 34 Minutes | 10 (15.4%) | 8 (15.1%) |
| 35 to 39 Minutes | 6 (9.2%) | 4 (7.5%) |
| 40 to 44 Minutes | 6 (9.2%) | 1 (1.9%) |
| 45 to 59 Minutes | 1 (1.5%) | 6 (11.3%) |
| 60 to 89 Minutes | 4 (6.1%) | 0 (0.0%) |
| 90 or more Minutes | 0 (0.0%) | 0 (0.0%) |
Time of Departure to Work by Sex in Eland
The most frequent times of departure to work in Eland are 5:00 AM to 5:29 AM (22, 33.9%) for males and 7:00 AM to 7:29 AM (14, 26.4%) for females.
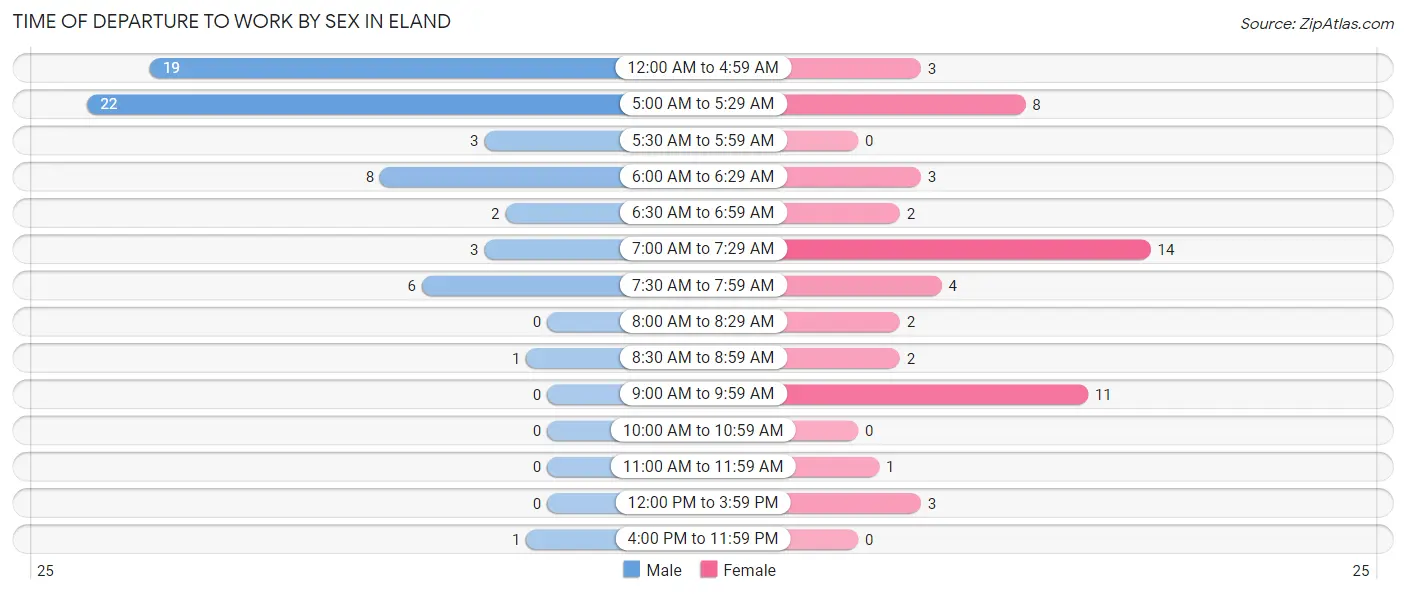
| Time of Departure | Male | Female |
| 12:00 AM to 4:59 AM | 19 (29.2%) | 3 (5.7%) |
| 5:00 AM to 5:29 AM | 22 (33.9%) | 8 (15.1%) |
| 5:30 AM to 5:59 AM | 3 (4.6%) | 0 (0.0%) |
| 6:00 AM to 6:29 AM | 8 (12.3%) | 3 (5.7%) |
| 6:30 AM to 6:59 AM | 2 (3.1%) | 2 (3.8%) |
| 7:00 AM to 7:29 AM | 3 (4.6%) | 14 (26.4%) |
| 7:30 AM to 7:59 AM | 6 (9.2%) | 4 (7.5%) |
| 8:00 AM to 8:29 AM | 0 (0.0%) | 2 (3.8%) |
| 8:30 AM to 8:59 AM | 1 (1.5%) | 2 (3.8%) |
| 9:00 AM to 9:59 AM | 0 (0.0%) | 11 (20.7%) |
| 10:00 AM to 10:59 AM | 0 (0.0%) | 0 (0.0%) |
| 11:00 AM to 11:59 AM | 0 (0.0%) | 1 (1.9%) |
| 12:00 PM to 3:59 PM | 0 (0.0%) | 3 (5.7%) |
| 4:00 PM to 11:59 PM | 1 (1.5%) | 0 (0.0%) |
| Total | 65 (100.0%) | 53 (100.0%) |
Housing Occupancy in Eland
Occupancy by Ownership in Eland
Of the total 103 dwellings in Eland, owner-occupied units account for 88 (85.4%), while renter-occupied units make up 15 (14.6%).
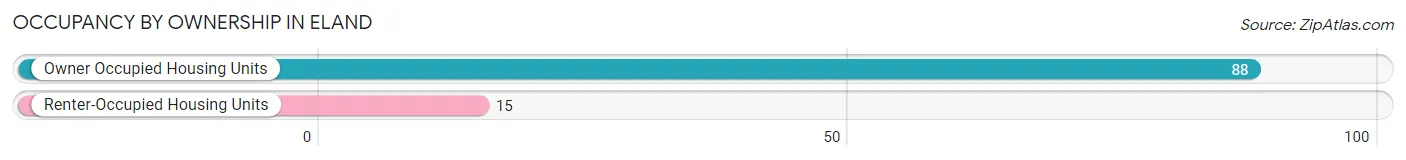
| Occupancy | # Housing Units | % Housing Units |
| Owner Occupied Housing Units | 88 | 85.4% |
| Renter-Occupied Housing Units | 15 | 14.6% |
| Total Occupied Housing Units | 103 | 100.0% |
Occupancy by Household Size in Eland
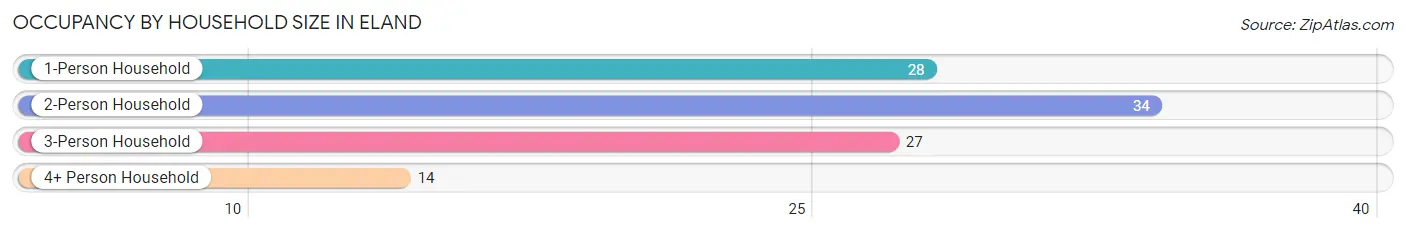
| Household Size | # Housing Units | % Housing Units |
| 1-Person Household | 28 | 27.2% |
| 2-Person Household | 34 | 33.0% |
| 3-Person Household | 27 | 26.2% |
| 4+ Person Household | 14 | 13.6% |
| Total Housing Units | 103 | 100.0% |
Occupancy by Ownership by Household Size in Eland
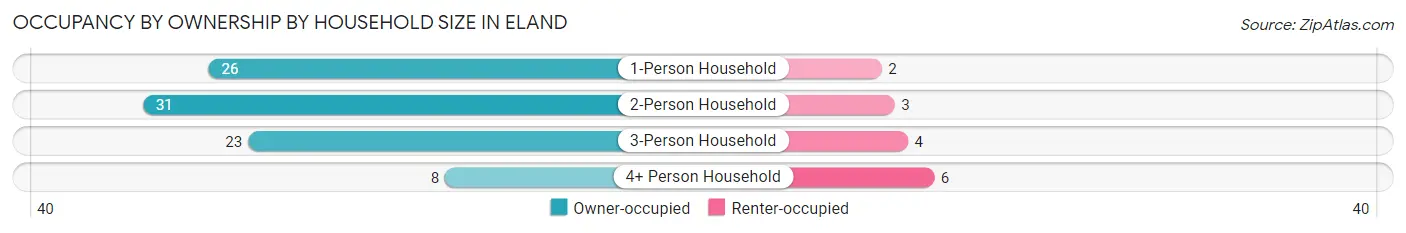
| Household Size | Owner-occupied | Renter-occupied |
| 1-Person Household | 26 (92.9%) | 2 (7.1%) |
| 2-Person Household | 31 (91.2%) | 3 (8.8%) |
| 3-Person Household | 23 (85.2%) | 4 (14.8%) |
| 4+ Person Household | 8 (57.1%) | 6 (42.9%) |
| Total Housing Units | 88 (85.4%) | 15 (14.6%) |
Occupancy by Educational Attainment in Eland
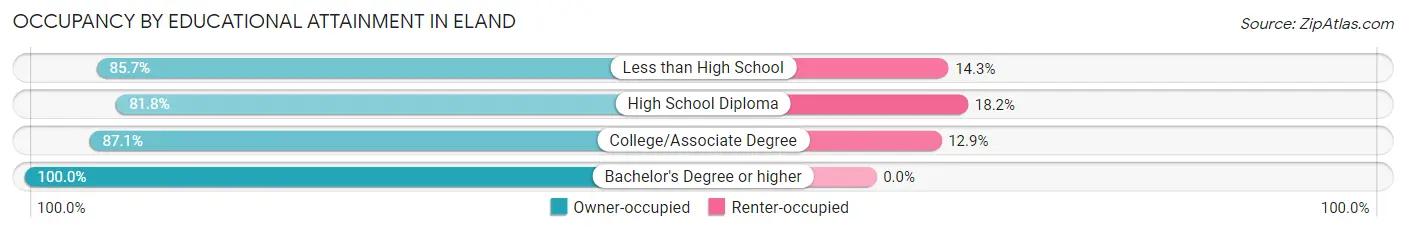
| Household Size | Owner-occupied | Renter-occupied |
| Less than High School | 6 (85.7%) | 1 (14.3%) |
| High School Diploma | 45 (81.8%) | 10 (18.2%) |
| College/Associate Degree | 27 (87.1%) | 4 (12.9%) |
| Bachelor's Degree or higher | 10 (100.0%) | 0 (0.0%) |
Occupancy by Age of Householder in Eland
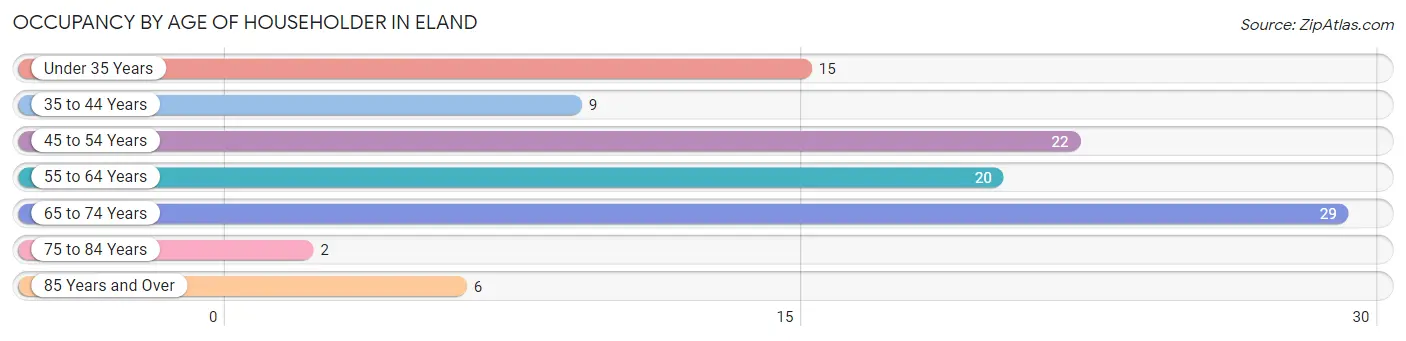
| Age Bracket | # Households | % Households |
| Under 35 Years | 15 | 14.6% |
| 35 to 44 Years | 9 | 8.7% |
| 45 to 54 Years | 22 | 21.4% |
| 55 to 64 Years | 20 | 19.4% |
| 65 to 74 Years | 29 | 28.2% |
| 75 to 84 Years | 2 | 1.9% |
| 85 Years and Over | 6 | 5.8% |
| Total | 103 | 100.0% |
Housing Finances in Eland
Median Income by Occupancy in Eland
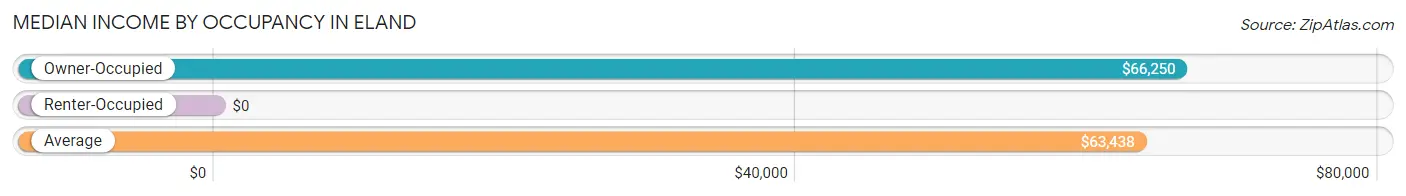
| Occupancy Type | # Households | Median Income |
| Owner-Occupied | 88 (85.4%) | $66,250 |
| Renter-Occupied | 15 (14.6%) | $0 |
| Average | 103 (100.0%) | $63,438 |
Occupancy by Householder Income Bracket in Eland
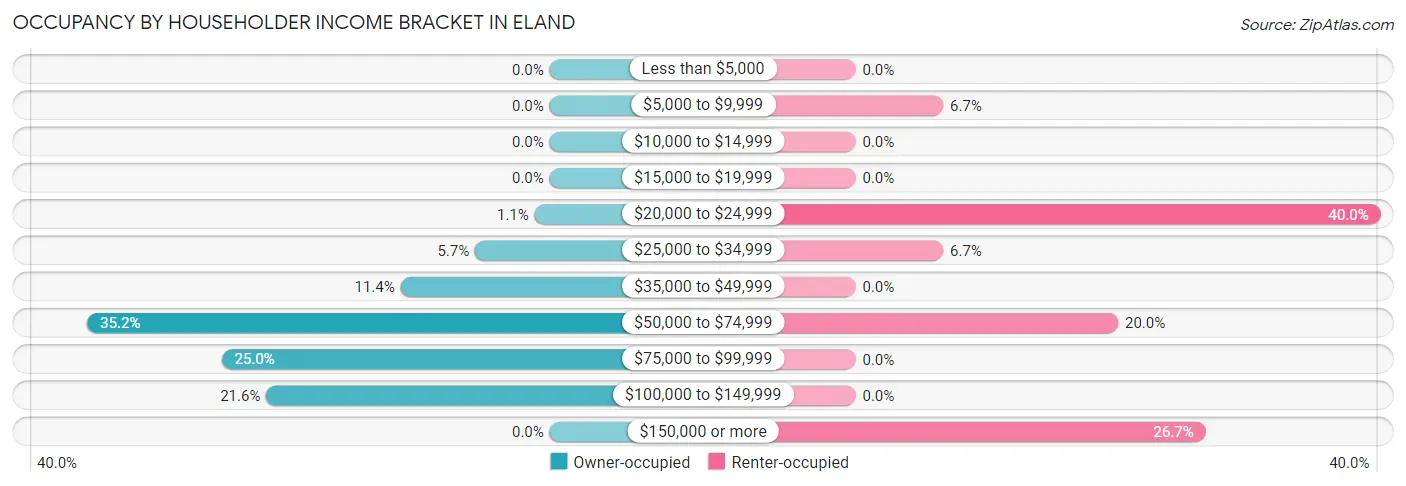
| Income Bracket | Owner-occupied | Renter-occupied |
| Less than $5,000 | 0 (0.0%) | 0 (0.0%) |
| $5,000 to $9,999 | 0 (0.0%) | 1 (6.7%) |
| $10,000 to $14,999 | 0 (0.0%) | 0 (0.0%) |
| $15,000 to $19,999 | 0 (0.0%) | 0 (0.0%) |
| $20,000 to $24,999 | 1 (1.1%) | 6 (40.0%) |
| $25,000 to $34,999 | 5 (5.7%) | 1 (6.7%) |
| $35,000 to $49,999 | 10 (11.4%) | 0 (0.0%) |
| $50,000 to $74,999 | 31 (35.2%) | 3 (20.0%) |
| $75,000 to $99,999 | 22 (25.0%) | 0 (0.0%) |
| $100,000 to $149,999 | 19 (21.6%) | 0 (0.0%) |
| $150,000 or more | 0 (0.0%) | 4 (26.7%) |
| Total | 88 (100.0%) | 15 (100.0%) |
Monthly Housing Cost Tiers in Eland
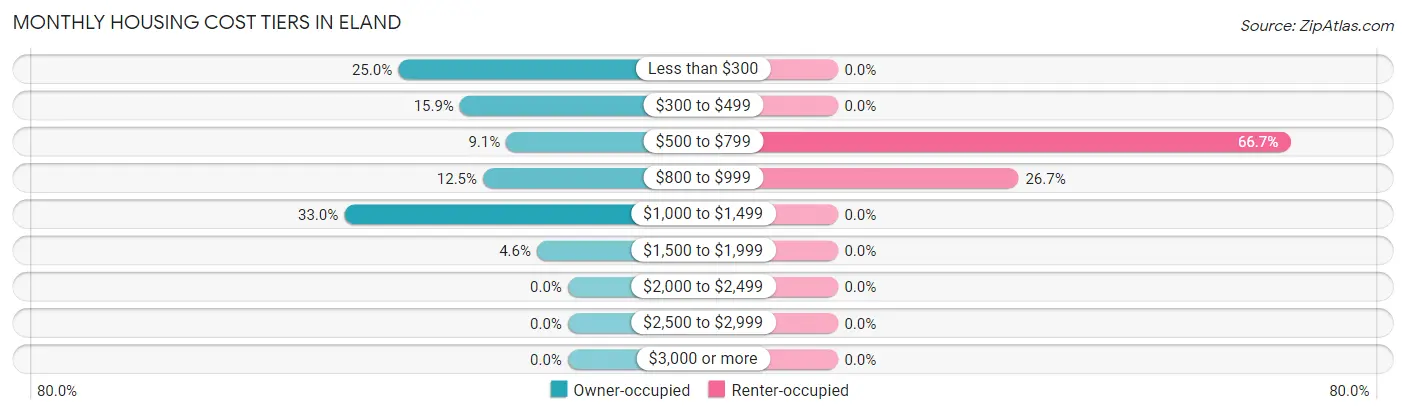
| Monthly Cost | Owner-occupied | Renter-occupied |
| Less than $300 | 22 (25.0%) | 0 (0.0%) |
| $300 to $499 | 14 (15.9%) | 0 (0.0%) |
| $500 to $799 | 8 (9.1%) | 10 (66.7%) |
| $800 to $999 | 11 (12.5%) | 4 (26.7%) |
| $1,000 to $1,499 | 29 (33.0%) | 0 (0.0%) |
| $1,500 to $1,999 | 4 (4.5%) | 0 (0.0%) |
| $2,000 to $2,499 | 0 (0.0%) | 0 (0.0%) |
| $2,500 to $2,999 | 0 (0.0%) | 0 (0.0%) |
| $3,000 or more | 0 (0.0%) | 0 (0.0%) |
| Total | 88 (100.0%) | 15 (100.0%) |
Physical Housing Characteristics in Eland
Housing Structures in Eland
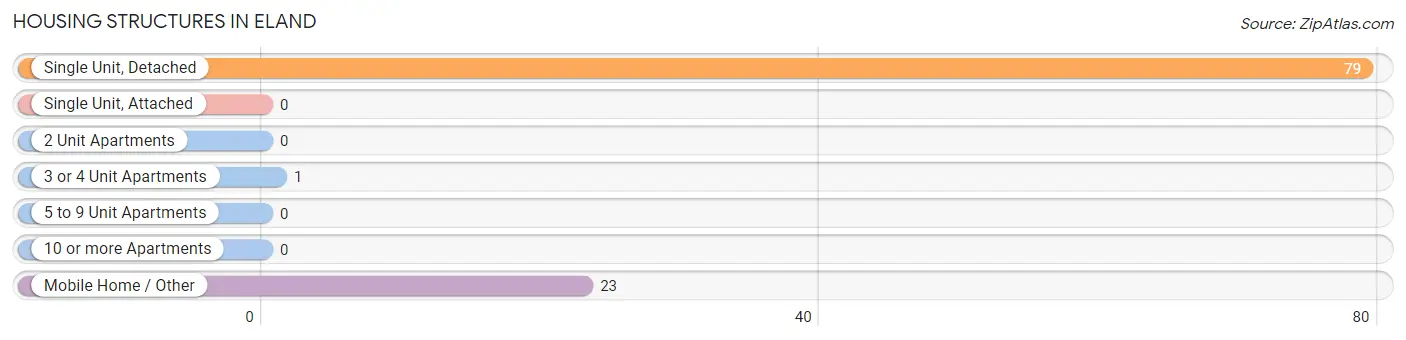
| Structure Type | # Housing Units | % Housing Units |
| Single Unit, Detached | 79 | 76.7% |
| Single Unit, Attached | 0 | 0.0% |
| 2 Unit Apartments | 0 | 0.0% |
| 3 or 4 Unit Apartments | 1 | 1.0% |
| 5 to 9 Unit Apartments | 0 | 0.0% |
| 10 or more Apartments | 0 | 0.0% |
| Mobile Home / Other | 23 | 22.3% |
| Total | 103 | 100.0% |
Housing Structures by Occupancy in Eland
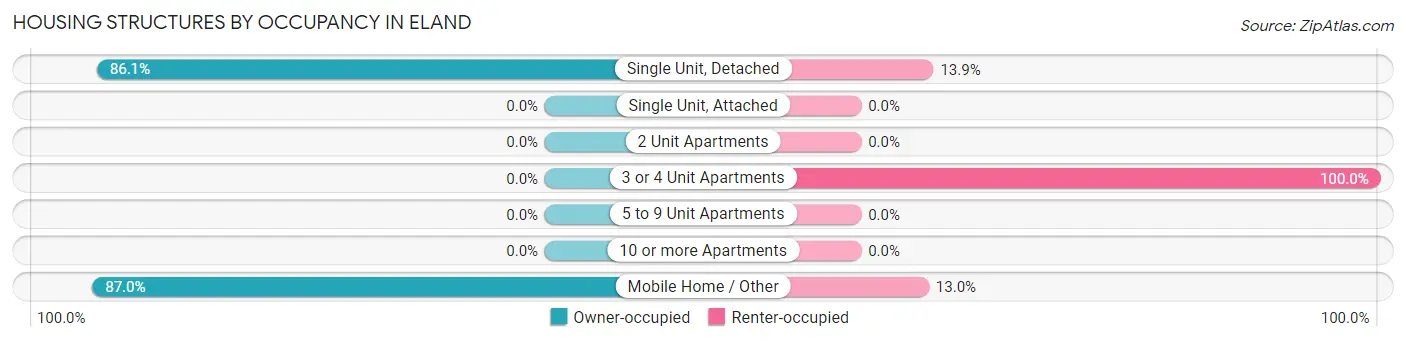
| Structure Type | Owner-occupied | Renter-occupied |
| Single Unit, Detached | 68 (86.1%) | 11 (13.9%) |
| Single Unit, Attached | 0 (0.0%) | 0 (0.0%) |
| 2 Unit Apartments | 0 (0.0%) | 0 (0.0%) |
| 3 or 4 Unit Apartments | 0 (0.0%) | 1 (100.0%) |
| 5 to 9 Unit Apartments | 0 (0.0%) | 0 (0.0%) |
| 10 or more Apartments | 0 (0.0%) | 0 (0.0%) |
| Mobile Home / Other | 20 (87.0%) | 3 (13.0%) |
| Total | 88 (85.4%) | 15 (14.6%) |
Housing Structures by Number of Rooms in Eland
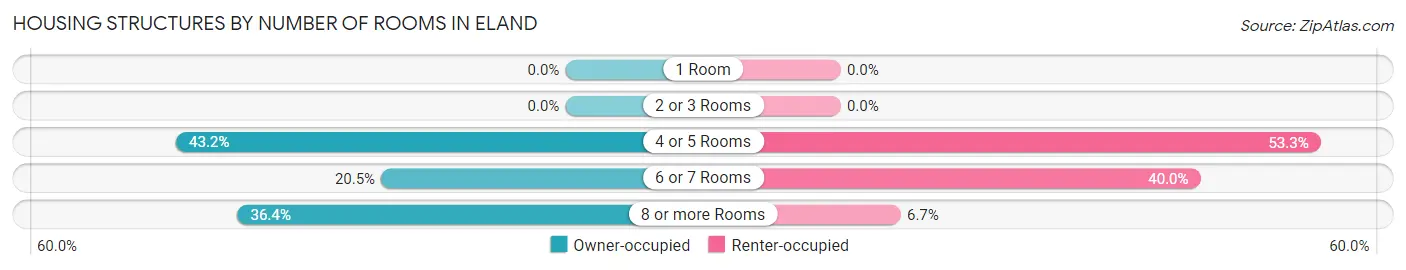
| Number of Rooms | Owner-occupied | Renter-occupied |
| 1 Room | 0 (0.0%) | 0 (0.0%) |
| 2 or 3 Rooms | 0 (0.0%) | 0 (0.0%) |
| 4 or 5 Rooms | 38 (43.2%) | 8 (53.3%) |
| 6 or 7 Rooms | 18 (20.4%) | 6 (40.0%) |
| 8 or more Rooms | 32 (36.4%) | 1 (6.7%) |
| Total | 88 (100.0%) | 15 (100.0%) |
Housing Structure by Heating Type in Eland
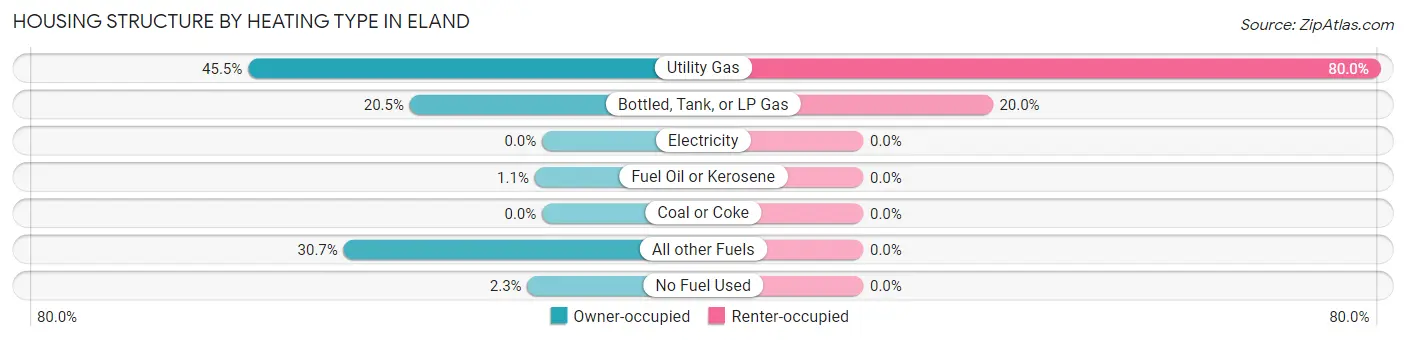
| Heating Type | Owner-occupied | Renter-occupied |
| Utility Gas | 40 (45.5%) | 12 (80.0%) |
| Bottled, Tank, or LP Gas | 18 (20.4%) | 3 (20.0%) |
| Electricity | 0 (0.0%) | 0 (0.0%) |
| Fuel Oil or Kerosene | 1 (1.1%) | 0 (0.0%) |
| Coal or Coke | 0 (0.0%) | 0 (0.0%) |
| All other Fuels | 27 (30.7%) | 0 (0.0%) |
| No Fuel Used | 2 (2.3%) | 0 (0.0%) |
| Total | 88 (100.0%) | 15 (100.0%) |
Household Vehicle Usage in Eland
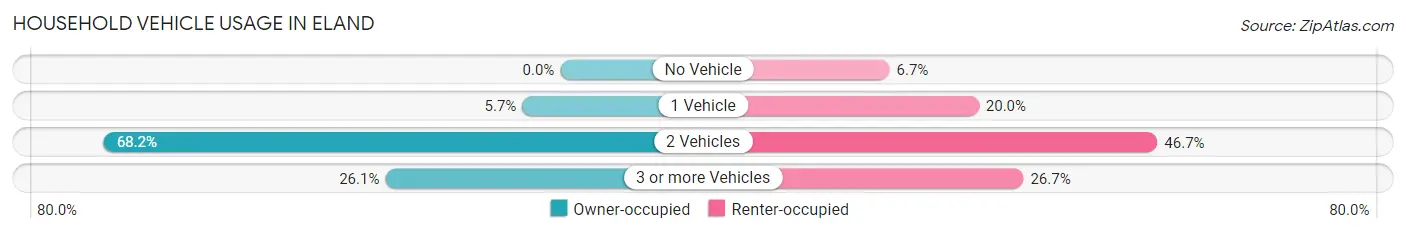
| Vehicles per Household | Owner-occupied | Renter-occupied |
| No Vehicle | 0 (0.0%) | 1 (6.7%) |
| 1 Vehicle | 5 (5.7%) | 3 (20.0%) |
| 2 Vehicles | 60 (68.2%) | 7 (46.7%) |
| 3 or more Vehicles | 23 (26.1%) | 4 (26.7%) |
| Total | 88 (100.0%) | 15 (100.0%) |
Real Estate & Mortgages in Eland
Real Estate and Mortgage Overview in Eland
| Characteristic | Without Mortgage | With Mortgage |
| Housing Units | 45 | 43 |
| Median Property Value | - | - |
| Median Household Income | $56,458 | $0 |
| Monthly Housing Costs | $306 | $0 |
| Real Estate Taxes | $1,386 | $0 |
Property Value by Mortgage Status in Eland
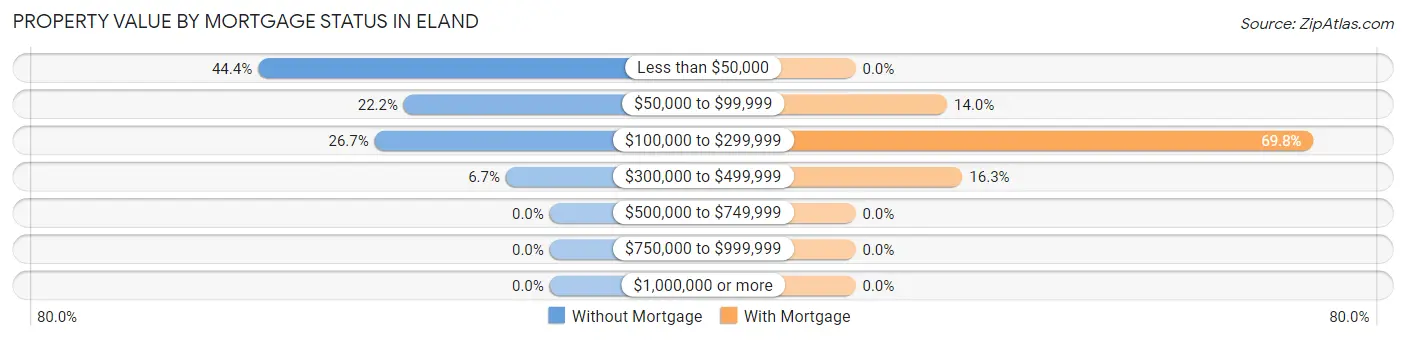
| Property Value | Without Mortgage | With Mortgage |
| Less than $50,000 | 20 (44.4%) | 0 (0.0%) |
| $50,000 to $99,999 | 10 (22.2%) | 6 (14.0%) |
| $100,000 to $299,999 | 12 (26.7%) | 30 (69.8%) |
| $300,000 to $499,999 | 3 (6.7%) | 7 (16.3%) |
| $500,000 to $749,999 | 0 (0.0%) | 0 (0.0%) |
| $750,000 to $999,999 | 0 (0.0%) | 0 (0.0%) |
| $1,000,000 or more | 0 (0.0%) | 0 (0.0%) |
| Total | 45 (100.0%) | 43 (100.0%) |
Household Income by Mortgage Status in Eland
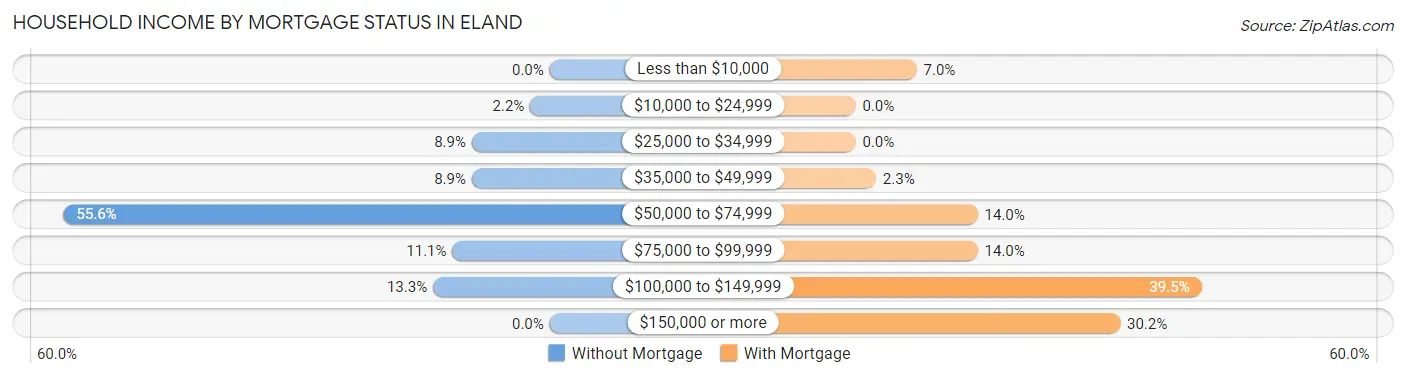
| Household Income | Without Mortgage | With Mortgage |
| Less than $10,000 | 0 (0.0%) | 3 (7.0%) |
| $10,000 to $24,999 | 1 (2.2%) | 0 (0.0%) |
| $25,000 to $34,999 | 4 (8.9%) | 0 (0.0%) |
| $35,000 to $49,999 | 4 (8.9%) | 1 (2.3%) |
| $50,000 to $74,999 | 25 (55.6%) | 6 (14.0%) |
| $75,000 to $99,999 | 5 (11.1%) | 6 (14.0%) |
| $100,000 to $149,999 | 6 (13.3%) | 17 (39.5%) |
| $150,000 or more | 0 (0.0%) | 13 (30.2%) |
| Total | 45 (100.0%) | 43 (100.0%) |
Property Value to Household Income Ratio in Eland
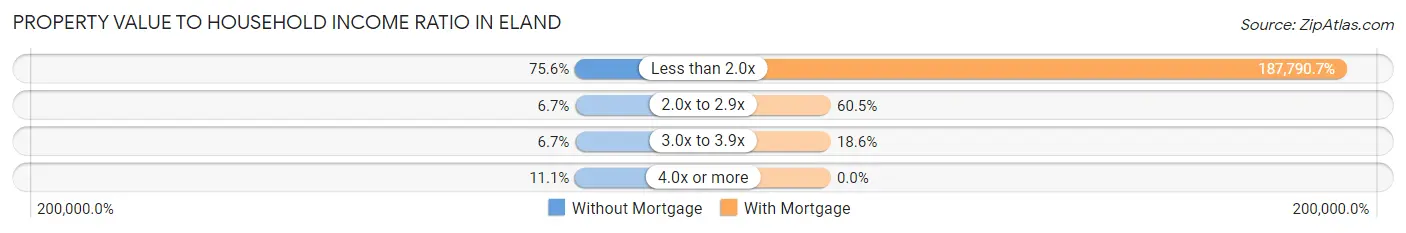
| Value-to-Income Ratio | Without Mortgage | With Mortgage |
| Less than 2.0x | 34 (75.6%) | 80,750 (187,790.7%) |
| 2.0x to 2.9x | 3 (6.7%) | 26 (60.5%) |
| 3.0x to 3.9x | 3 (6.7%) | 8 (18.6%) |
| 4.0x or more | 5 (11.1%) | 0 (0.0%) |
| Total | 45 (100.0%) | 43 (100.0%) |
Real Estate Taxes by Mortgage Status in Eland
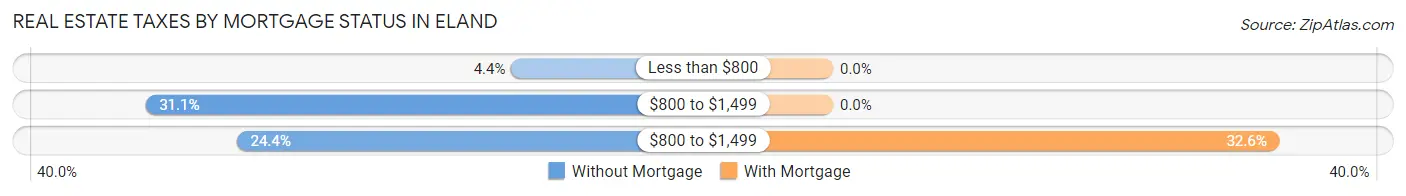
| Property Taxes | Without Mortgage | With Mortgage |
| Less than $800 | 2 (4.4%) | 0 (0.0%) |
| $800 to $1,499 | 14 (31.1%) | 0 (0.0%) |
| $800 to $1,499 | 11 (24.4%) | 14 (32.6%) |
| Total | 45 (100.0%) | 43 (100.0%) |
Health & Disability in Eland
Health Insurance Coverage by Age in Eland
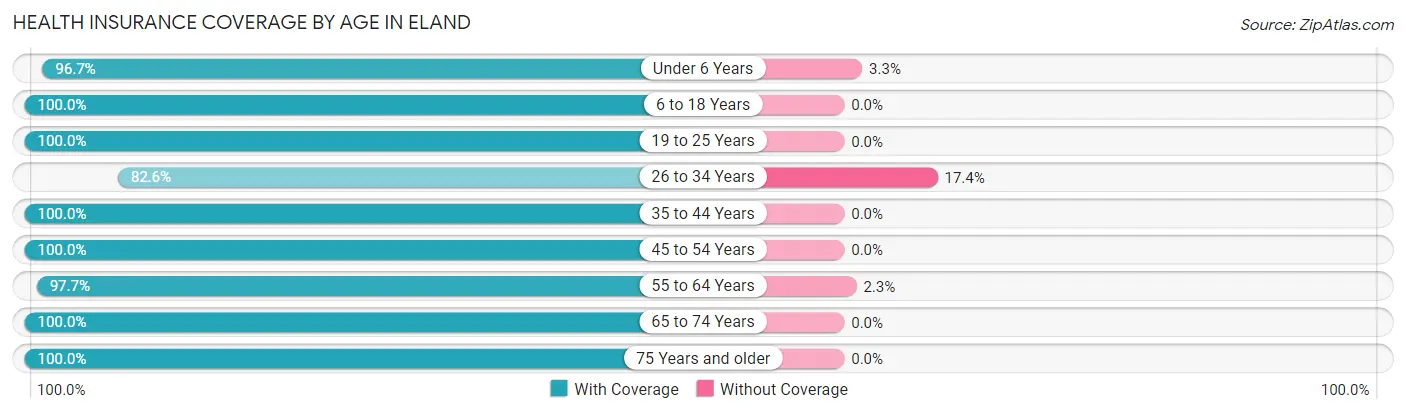
| Age Bracket | With Coverage | Without Coverage |
| Under 6 Years | 29 (96.7%) | 1 (3.3%) |
| 6 to 18 Years | 34 (100.0%) | 0 (0.0%) |
| 19 to 25 Years | 10 (100.0%) | 0 (0.0%) |
| 26 to 34 Years | 19 (82.6%) | 4 (17.4%) |
| 35 to 44 Years | 15 (100.0%) | 0 (0.0%) |
| 45 to 54 Years | 40 (100.0%) | 0 (0.0%) |
| 55 to 64 Years | 43 (97.7%) | 1 (2.3%) |
| 65 to 74 Years | 37 (100.0%) | 0 (0.0%) |
| 75 Years and older | 10 (100.0%) | 0 (0.0%) |
| Total | 237 (97.5%) | 6 (2.5%) |
Health Insurance Coverage by Citizenship Status in Eland
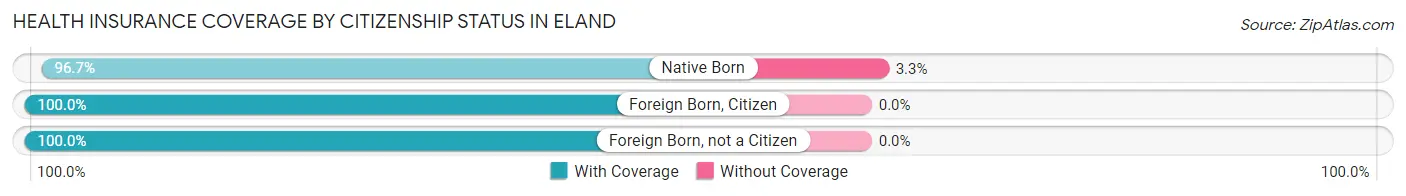
| Citizenship Status | With Coverage | Without Coverage |
| Native Born | 29 (96.7%) | 1 (3.3%) |
| Foreign Born, Citizen | 34 (100.0%) | 0 (0.0%) |
| Foreign Born, not a Citizen | 10 (100.0%) | 0 (0.0%) |
Health Insurance Coverage by Household Income in Eland
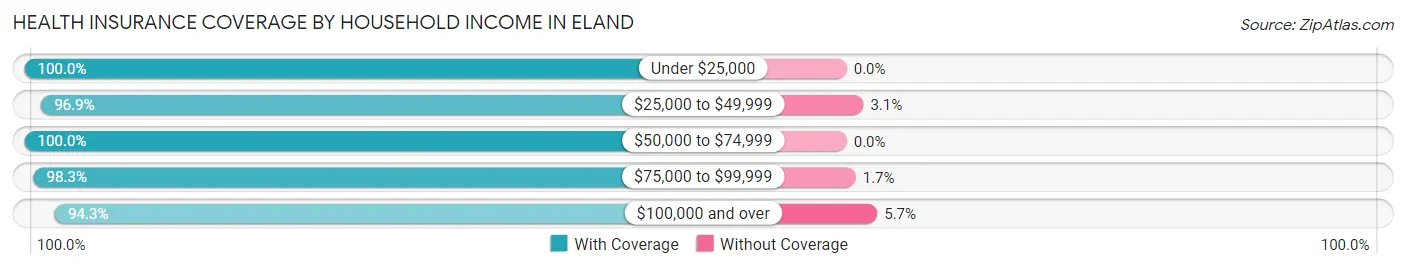
| Household Income | With Coverage | Without Coverage |
| Under $25,000 | 26 (100.0%) | 0 (0.0%) |
| $25,000 to $49,999 | 31 (96.9%) | 1 (3.1%) |
| $50,000 to $74,999 | 56 (100.0%) | 0 (0.0%) |
| $75,000 to $99,999 | 58 (98.3%) | 1 (1.7%) |
| $100,000 and over | 66 (94.3%) | 4 (5.7%) |
Public vs Private Health Insurance Coverage by Age in Eland
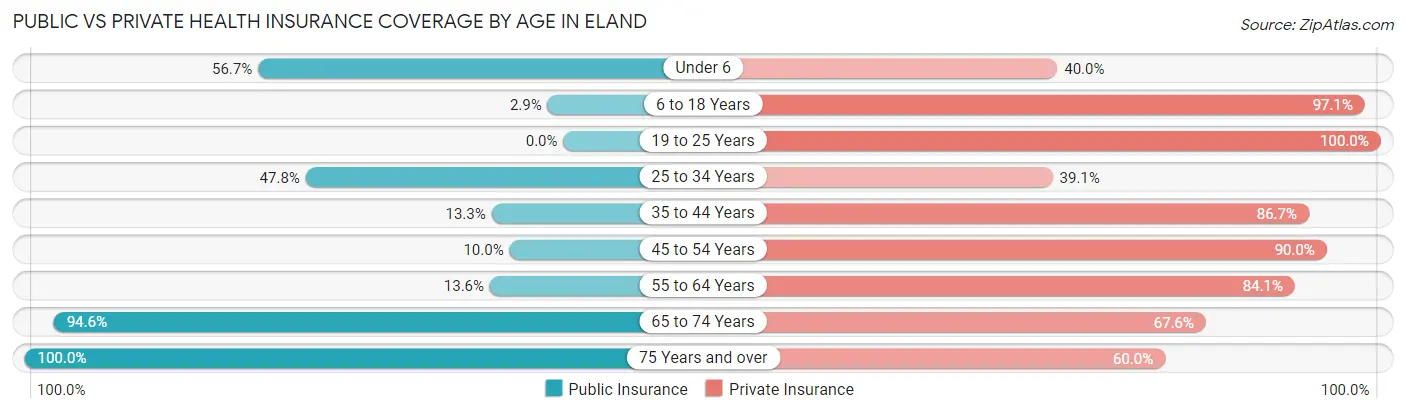
| Age Bracket | Public Insurance | Private Insurance |
| Under 6 | 17 (56.7%) | 12 (40.0%) |
| 6 to 18 Years | 1 (2.9%) | 33 (97.1%) |
| 19 to 25 Years | 0 (0.0%) | 10 (100.0%) |
| 25 to 34 Years | 11 (47.8%) | 9 (39.1%) |
| 35 to 44 Years | 2 (13.3%) | 13 (86.7%) |
| 45 to 54 Years | 4 (10.0%) | 36 (90.0%) |
| 55 to 64 Years | 6 (13.6%) | 37 (84.1%) |
| 65 to 74 Years | 35 (94.6%) | 25 (67.6%) |
| 75 Years and over | 10 (100.0%) | 6 (60.0%) |
| Total | 86 (35.4%) | 181 (74.5%) |
Disability Status by Sex by Age in Eland
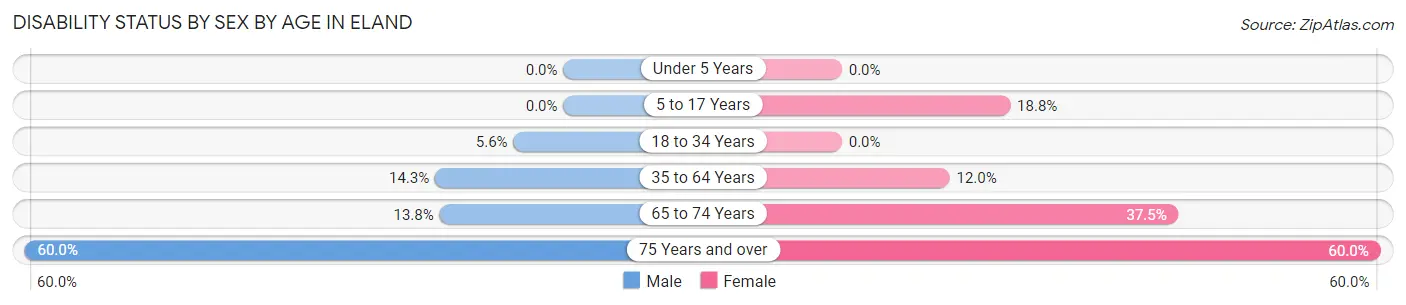
| Age Bracket | Male | Female |
| Under 5 Years | 0 (0.0%) | 0 (0.0%) |
| 5 to 17 Years | 0 (0.0%) | 6 (18.8%) |
| 18 to 34 Years | 1 (5.6%) | 0 (0.0%) |
| 35 to 64 Years | 7 (14.3%) | 6 (12.0%) |
| 65 to 74 Years | 4 (13.8%) | 3 (37.5%) |
| 75 Years and over | 3 (60.0%) | 3 (60.0%) |
Disability Class by Sex by Age in Eland
Disability Class: Hearing Difficulty
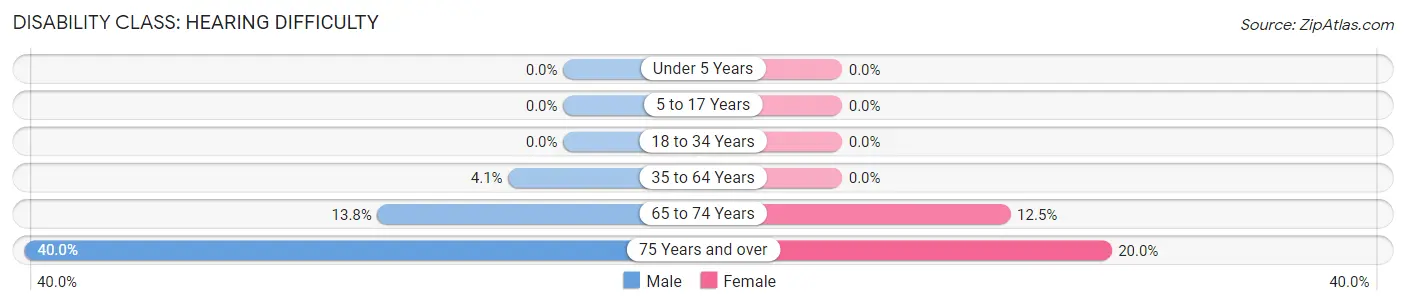
| Age Bracket | Male | Female |
| Under 5 Years | 0 (0.0%) | 0 (0.0%) |
| 5 to 17 Years | 0 (0.0%) | 0 (0.0%) |
| 18 to 34 Years | 0 (0.0%) | 0 (0.0%) |
| 35 to 64 Years | 2 (4.1%) | 0 (0.0%) |
| 65 to 74 Years | 4 (13.8%) | 1 (12.5%) |
| 75 Years and over | 2 (40.0%) | 1 (20.0%) |
Disability Class: Vision Difficulty
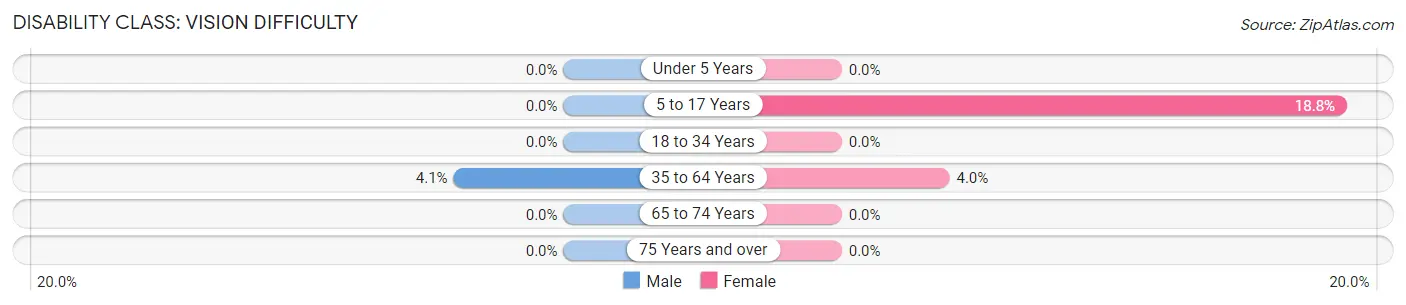
| Age Bracket | Male | Female |
| Under 5 Years | 0 (0.0%) | 0 (0.0%) |
| 5 to 17 Years | 0 (0.0%) | 6 (18.8%) |
| 18 to 34 Years | 0 (0.0%) | 0 (0.0%) |
| 35 to 64 Years | 2 (4.1%) | 2 (4.0%) |
| 65 to 74 Years | 0 (0.0%) | 0 (0.0%) |
| 75 Years and over | 0 (0.0%) | 0 (0.0%) |
Disability Class: Cognitive Difficulty
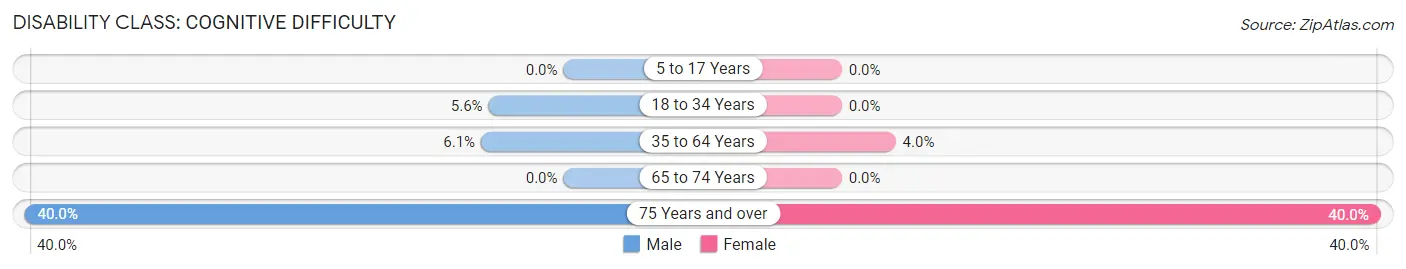
| Age Bracket | Male | Female |
| 5 to 17 Years | 0 (0.0%) | 0 (0.0%) |
| 18 to 34 Years | 1 (5.6%) | 0 (0.0%) |
| 35 to 64 Years | 3 (6.1%) | 2 (4.0%) |
| 65 to 74 Years | 0 (0.0%) | 0 (0.0%) |
| 75 Years and over | 2 (40.0%) | 2 (40.0%) |
Disability Class: Ambulatory Difficulty
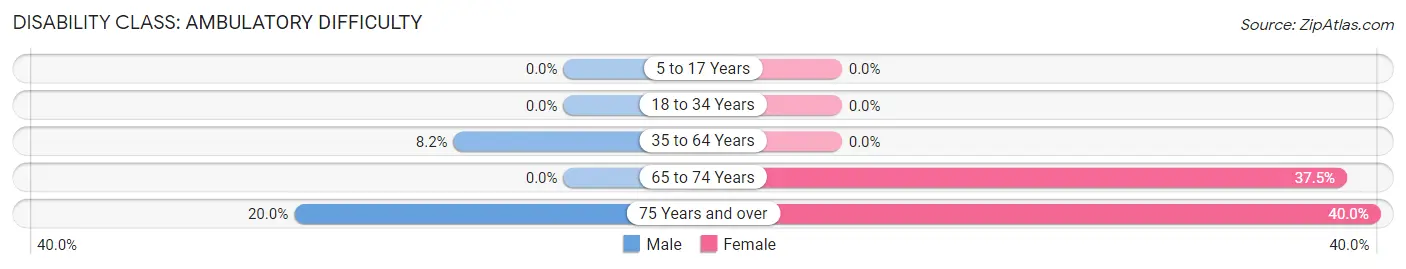
| Age Bracket | Male | Female |
| 5 to 17 Years | 0 (0.0%) | 0 (0.0%) |
| 18 to 34 Years | 0 (0.0%) | 0 (0.0%) |
| 35 to 64 Years | 4 (8.2%) | 0 (0.0%) |
| 65 to 74 Years | 0 (0.0%) | 3 (37.5%) |
| 75 Years and over | 1 (20.0%) | 2 (40.0%) |
Disability Class: Self-Care Difficulty
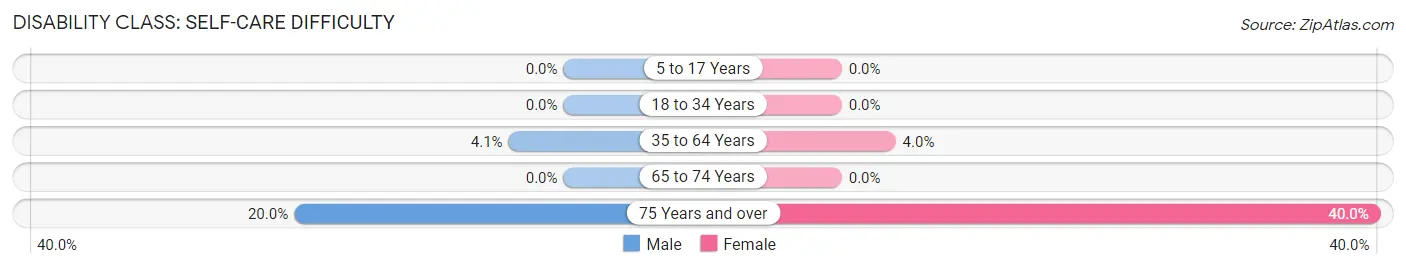
| Age Bracket | Male | Female |
| 5 to 17 Years | 0 (0.0%) | 0 (0.0%) |
| 18 to 34 Years | 0 (0.0%) | 0 (0.0%) |
| 35 to 64 Years | 2 (4.1%) | 2 (4.0%) |
| 65 to 74 Years | 0 (0.0%) | 0 (0.0%) |
| 75 Years and over | 1 (20.0%) | 2 (40.0%) |
Technology Access in Eland
Computing Device Access in Eland
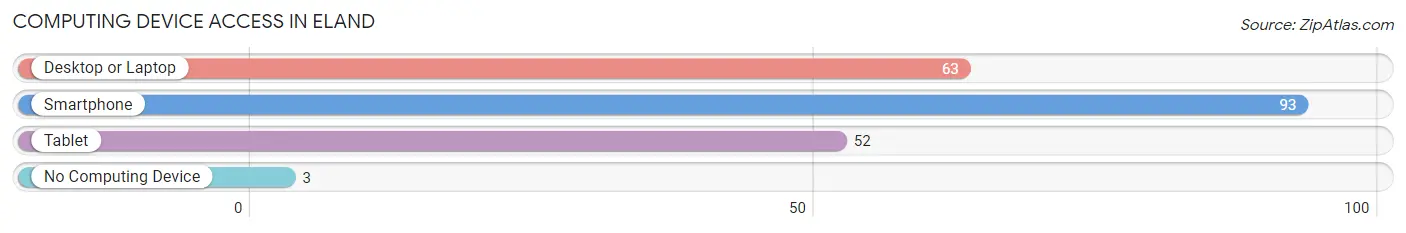
| Device Type | # Households | % Households |
| Desktop or Laptop | 63 | 61.2% |
| Smartphone | 93 | 90.3% |
| Tablet | 52 | 50.5% |
| No Computing Device | 3 | 2.9% |
| Total | 103 | 100.0% |
Internet Access in Eland
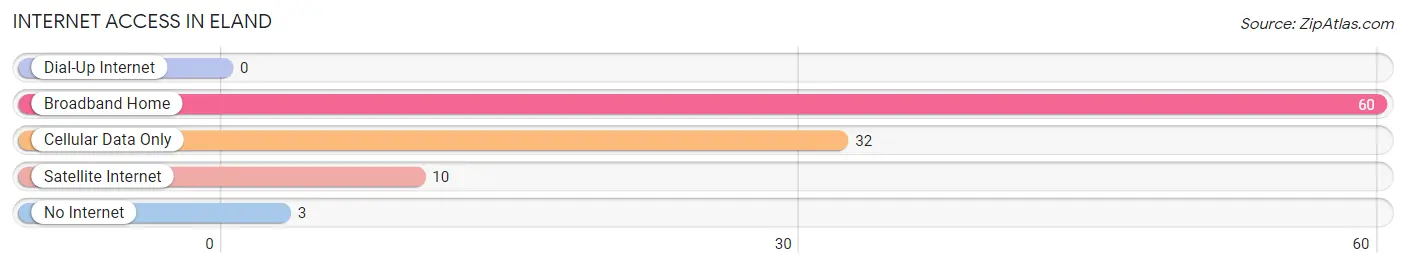
| Internet Type | # Households | % Households |
| Dial-Up Internet | 0 | 0.0% |
| Broadband Home | 60 | 58.3% |
| Cellular Data Only | 32 | 31.1% |
| Satellite Internet | 10 | 9.7% |
| No Internet | 3 | 2.9% |
| Total | 103 | 100.0% |
Eland Summary
Eland is a small unincorporated community located in the town of Eland, in Shawano County, Wisconsin, United States. It is located on the Wolf River, about 10 miles (16 km) northwest of Shawano. The population was estimated to be around 200 in 2020.
History
The area that is now Eland was first settled in the late 1800s by German immigrants. The town was originally known as "Eland Station" and was named after the Eland River, which runs through the area. The town was officially incorporated in 1891.
In the early 1900s, Eland was a thriving logging and farming community. The town had a sawmill, a grist mill, a cheese factory, a blacksmith shop, and a general store. The town also had a post office, a school, and a church.
In the 1920s, the town began to decline as the logging industry moved away from the area. The sawmill and grist mill closed, and the cheese factory moved to a nearby town. The post office closed in the 1930s, and the school closed in the 1940s.
Geography
Eland is located in the town of Eland, in Shawano County, Wisconsin. It is situated on the Wolf River, about 10 miles (16 km) northwest of Shawano. The town is surrounded by rolling hills and forests.
The climate in Eland is humid continental, with cold winters and warm summers. The average annual temperature is around 40°F (4°C). The average annual precipitation is around 33 inches (84 cm).
Economy
The economy of Eland is largely based on agriculture and tourism. The town is home to several small farms, which produce a variety of crops, including corn, soybeans, and hay. The town also has several small businesses, including a gas station, a restaurant, and a grocery store.
Tourism is an important part of the local economy. The town is home to several popular attractions, including the Wolf River State Trail, which is a popular destination for hikers, bikers, and horseback riders. The town also has several parks, including Eland Park, which is a popular spot for picnics and camping.
Demographics
As of the 2010 census, the population of Eland was estimated to be around 200. The racial makeup of the town was 97.5% White, 0.5% African American, 0.5% Native American, and 1.5% from other races. The median household income was $37,500, and the median family income was $45,000.
Conclusion
Eland is a small unincorporated community located in the town of Eland, in Shawano County, Wisconsin. It is situated on the Wolf River, about 10 miles (16 km) northwest of Shawano. The town was originally settled in the late 1800s by German immigrants and was officially incorporated in 1891. The economy of Eland is largely based on agriculture and tourism, and the population was estimated to be around 200 in 2020.
Common Questions
What is Per Capita Income in Eland?
Per Capita income in Eland is $30,968.
What is the Median Family Income in Eland?
Median Family Income in Eland is $77,500.
What is the Median Household income in Eland?
Median Household Income in Eland is $63,438.
What is Income or Wage Gap in Eland?
Income or Wage Gap in Eland is 36.6%.
Women in Eland earn 63.4 cents for every dollar earned by a man.
What is Inequality or Gini Index in Eland?
Inequality or Gini Index in Eland is 0.27.
What is the Total Population of Eland?
Total Population of Eland is 243.
What is the Total Male Population of Eland?
Total Male Population of Eland is 114.
What is the Total Female Population of Eland?
Total Female Population of Eland is 129.
What is the Ratio of Males per 100 Females in Eland?
There are 88.37 Males per 100 Females in Eland.
What is the Ratio of Females per 100 Males in Eland?
There are 113.16 Females per 100 Males in Eland.
What is the Median Population Age in Eland?
Median Population Age in Eland is 47.8 Years.
What is the Average Family Size in Eland
Average Family Size in Eland is 2.9 People.
What is the Average Household Size in Eland
Average Household Size in Eland is 2.4 People.
How Large is the Labor Force in Eland?
There are 136 People in the Labor Forcein in Eland.
What is the Percentage of People in the Labor Force in Eland?
74.3% of People are in the Labor Force in Eland.