Eden, WI Map & Demographics
Eden Map
Eden Overview
$34,375
PER CAPITA INCOME
$69,167
AVG FAMILY INCOME
$64,290
AVG HOUSEHOLD INCOME
20.8%
WAGE / INCOME GAP [ % ]
79.2¢/ $1
WAGE / INCOME GAP [ $ ]
$5,818
FAMILY INCOME DEFICIT
0.32
INEQUALITY / GINI INDEX
726
TOTAL POPULATION
337
MALE POPULATION
389
FEMALE POPULATION
86.63
MALES / 100 FEMALES
115.43
FEMALES / 100 MALES
40.1
MEDIAN AGE
2.6
AVG FAMILY SIZE
2.2
AVG HOUSEHOLD SIZE
438
LABOR FORCE [ PEOPLE ]
76.0%
PERCENT IN LABOR FORCE
5.5%
UNEMPLOYMENT RATE
Eden Zip Codes
Eden Area Codes
Income in Eden
Income Overview in Eden
Per Capita Income in Eden is $34,375, while median incomes of families and households are $69,167 and $64,290 respectively.
| Characteristic | Number | Measure |
| Per Capita Income | 726 | $34,375 |
| Median Family Income | 236 | $69,167 |
| Mean Family Income | 236 | $81,590 |
| Median Household Income | 329 | $64,290 |
| Mean Household Income | 329 | $75,051 |
| Income Deficit | 236 | $5,818 |
| Wage / Income Gap (%) | 726 | 20.79% |
| Wage / Income Gap ($) | 726 | 79.21¢ per $1 |
| Gini / Inequality Index | 726 | 0.32 |
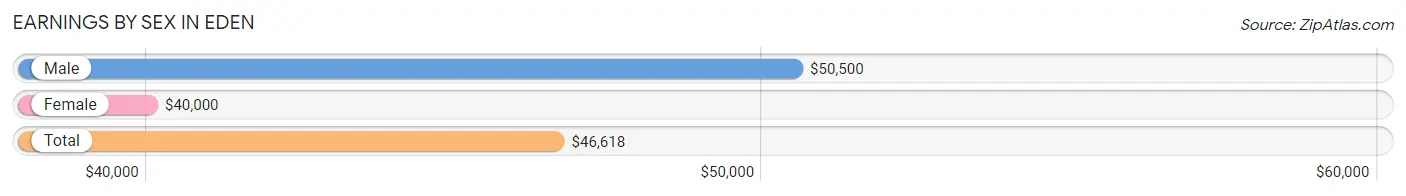
Earnings by Sex in Eden
Average Earnings in Eden are $46,618, $50,500 for men and $40,000 for women, a difference of 20.8%.
| Sex | Number | Average Earnings |
| Male | 220 (49.1%) | $50,500 |
| Female | 228 (50.9%) | $40,000 |
| Total | 448 (100.0%) | $46,618 |
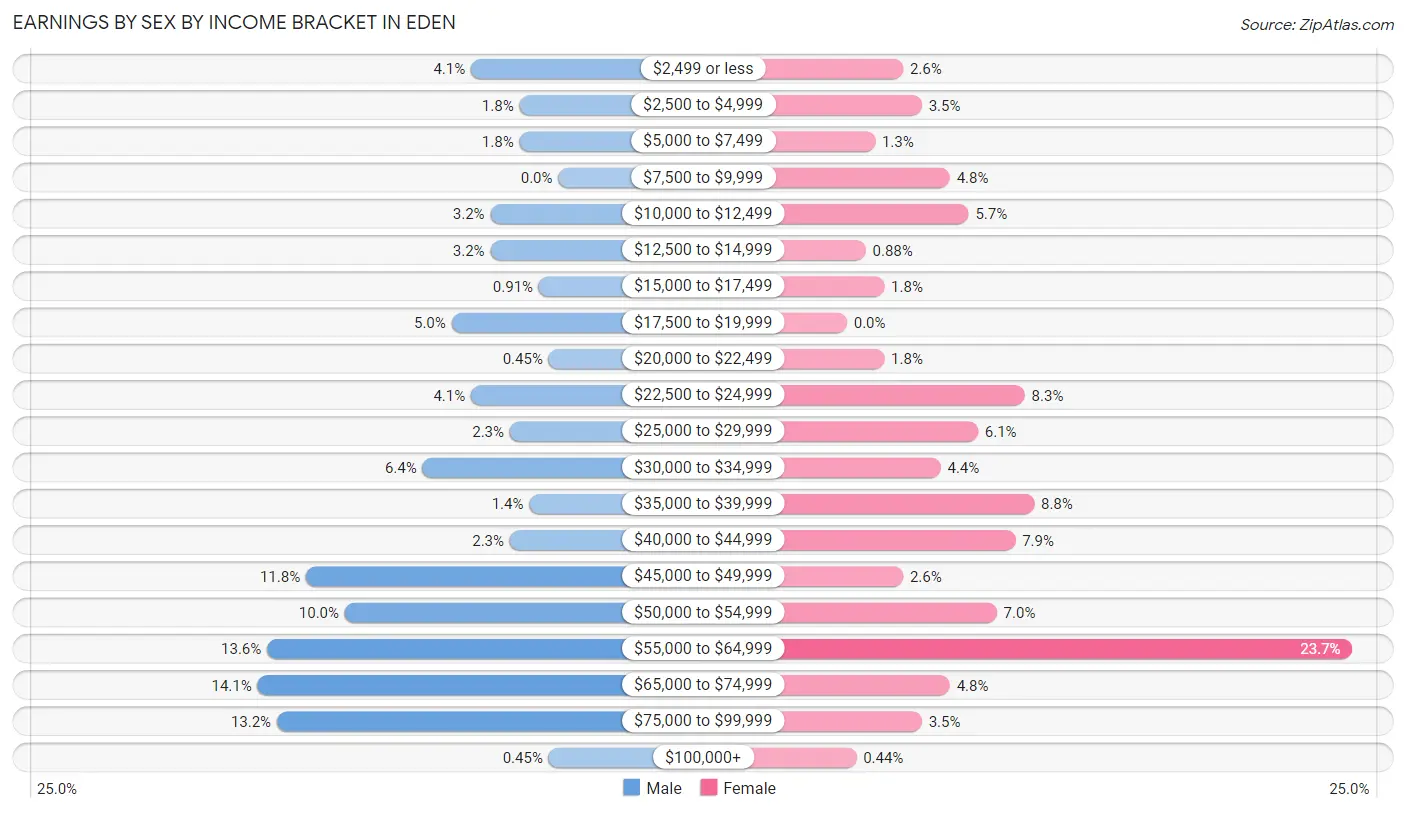
Earnings by Sex by Income Bracket in Eden
The most common earnings brackets in Eden are $65,000 to $74,999 for men (31 | 14.1%) and $55,000 to $64,999 for women (54 | 23.7%).
| Income | Male | Female |
| $2,499 or less | 9 (4.1%) | 6 (2.6%) |
| $2,500 to $4,999 | 4 (1.8%) | 8 (3.5%) |
| $5,000 to $7,499 | 4 (1.8%) | 3 (1.3%) |
| $7,500 to $9,999 | 0 (0.0%) | 11 (4.8%) |
| $10,000 to $12,499 | 7 (3.2%) | 13 (5.7%) |
| $12,500 to $14,999 | 7 (3.2%) | 2 (0.9%) |
| $15,000 to $17,499 | 2 (0.9%) | 4 (1.8%) |
| $17,500 to $19,999 | 11 (5.0%) | 0 (0.0%) |
| $20,000 to $22,499 | 1 (0.4%) | 4 (1.8%) |
| $22,500 to $24,999 | 9 (4.1%) | 19 (8.3%) |
| $25,000 to $29,999 | 5 (2.3%) | 14 (6.1%) |
| $30,000 to $34,999 | 14 (6.4%) | 10 (4.4%) |
| $35,000 to $39,999 | 3 (1.4%) | 20 (8.8%) |
| $40,000 to $44,999 | 5 (2.3%) | 18 (7.9%) |
| $45,000 to $49,999 | 26 (11.8%) | 6 (2.6%) |
| $50,000 to $54,999 | 22 (10.0%) | 16 (7.0%) |
| $55,000 to $64,999 | 30 (13.6%) | 54 (23.7%) |
| $65,000 to $74,999 | 31 (14.1%) | 11 (4.8%) |
| $75,000 to $99,999 | 29 (13.2%) | 8 (3.5%) |
| $100,000+ | 1 (0.4%) | 1 (0.4%) |
| Total | 220 (100.0%) | 228 (100.0%) |
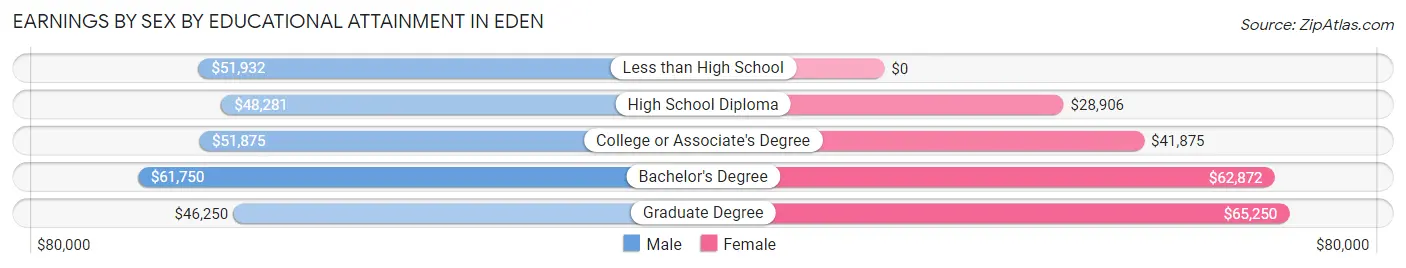
Earnings by Sex by Educational Attainment in Eden
Average earnings in Eden are $52,115 for men and $43,846 for women, a difference of 15.9%. Men with an educational attainment of bachelor's degree enjoy the highest average annual earnings of $61,750, while those with graduate degree education earn the least with $46,250. Women with an educational attainment of graduate degree earn the most with the average annual earnings of $65,250, while those with high school diploma education have the smallest earnings of $28,906.
| Educational Attainment | Male Income | Female Income |
| Less than High School | $51,932 | $0 |
| High School Diploma | $48,281 | $28,906 |
| College or Associate's Degree | $51,875 | $41,875 |
| Bachelor's Degree | $61,750 | $62,872 |
| Graduate Degree | $46,250 | $65,250 |
| Total | $52,115 | $43,846 |
Family Income in Eden
Family Income Brackets in Eden
According to the Eden family income data, there are 70 families falling into the $50,000 to $74,999 income range, which is the most common income bracket and makes up 29.7% of all families.
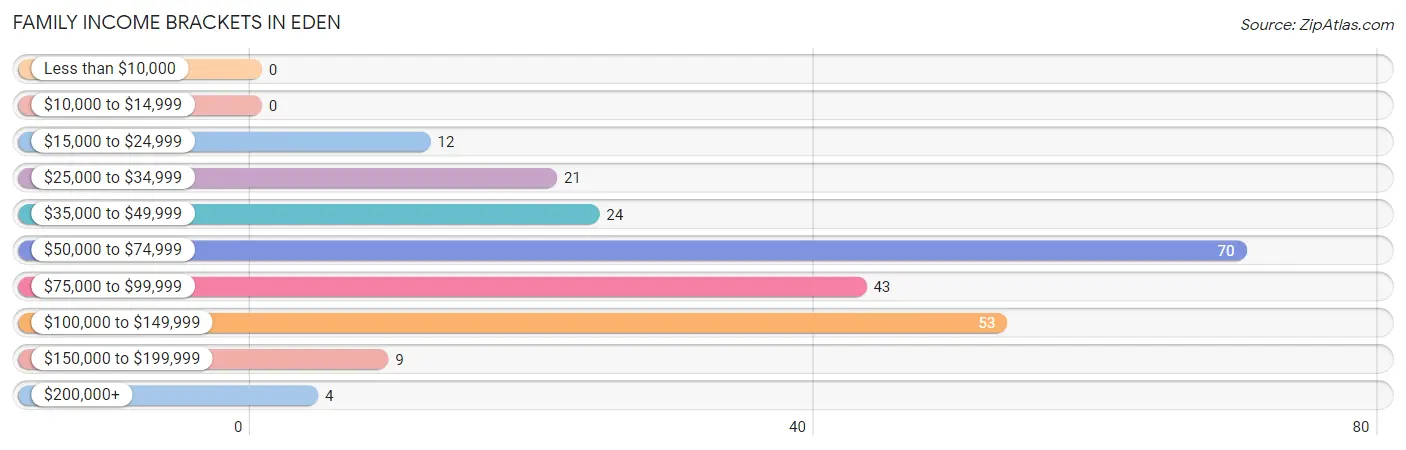
| Income Bracket | # Families | % Families |
| Less than $10,000 | 0 | 0.0% |
| $10,000 to $14,999 | 0 | 0.0% |
| $15,000 to $24,999 | 12 | 5.1% |
| $25,000 to $34,999 | 21 | 8.9% |
| $35,000 to $49,999 | 24 | 10.2% |
| $50,000 to $74,999 | 70 | 29.7% |
| $75,000 to $99,999 | 43 | 18.2% |
| $100,000 to $149,999 | 53 | 22.5% |
| $150,000 to $199,999 | 9 | 3.8% |
| $200,000+ | 4 | 1.7% |
Family Income by Famaliy Size in Eden
5-person families (9 | 3.8%) account for the highest median family income in Eden with $119,375 per family, while 2-person families (128 | 54.2%) have the highest median income of $35,208 per family member.
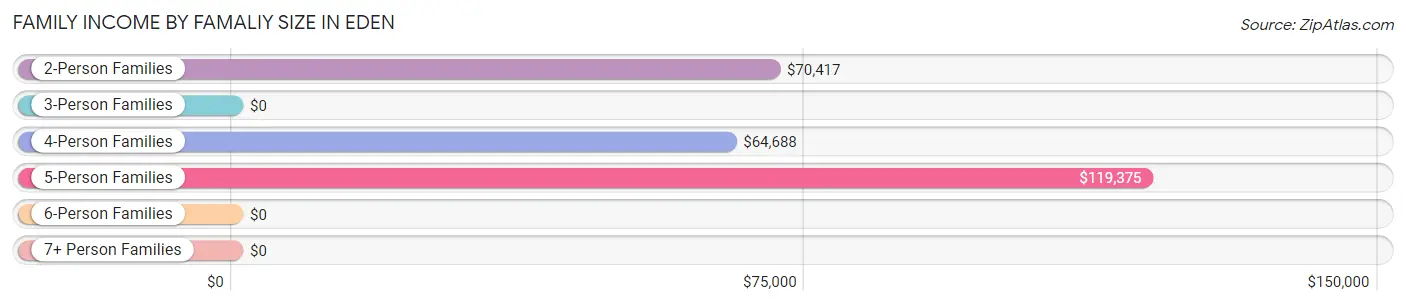
| Income Bracket | # Families | Median Income |
| 2-Person Families | 128 (54.2%) | $70,417 |
| 3-Person Families | 31 (13.1%) | $0 |
| 4-Person Families | 66 (28.0%) | $64,688 |
| 5-Person Families | 9 (3.8%) | $119,375 |
| 6-Person Families | 2 (0.9%) | $0 |
| 7+ Person Families | 0 (0.0%) | $0 |
| Total | 236 (100.0%) | $69,167 |
Family Income by Number of Earners in Eden
The median family income in Eden is $69,167, with families comprising 3+ earners (17) having the highest median family income of $108,750, while families with no earners (29) have the lowest median family income of $53,750, accounting for 7.2% and 12.3% of families, respectively.
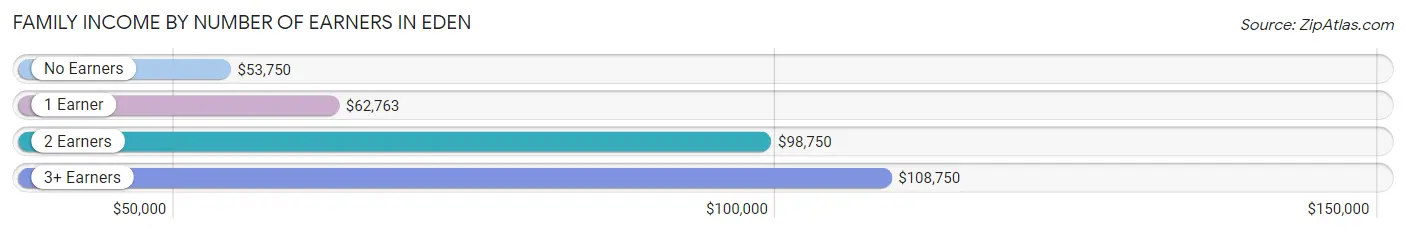
| Number of Earners | # Families | Median Income |
| No Earners | 29 (12.3%) | $53,750 |
| 1 Earner | 92 (39.0%) | $62,763 |
| 2 Earners | 98 (41.5%) | $98,750 |
| 3+ Earners | 17 (7.2%) | $108,750 |
| Total | 236 (100.0%) | $69,167 |
Household Income in Eden
Household Income Brackets in Eden
With 95 households falling in the category, the $50,000 to $74,999 income range is the most frequent in Eden, accounting for 28.9% of all households. In contrast, only 1 households (0.3%) fall into the $10,000 to $14,999 income bracket, making it the least populous group.
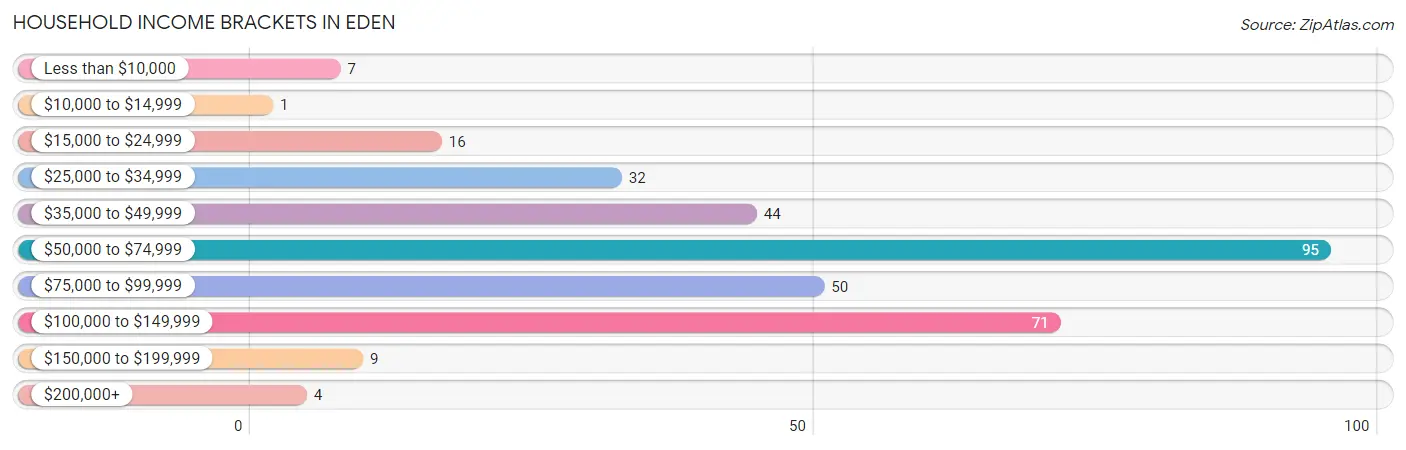
| Income Bracket | # Households | % Households |
| Less than $10,000 | 7 | 2.1% |
| $10,000 to $14,999 | 1 | 0.3% |
| $15,000 to $24,999 | 16 | 4.9% |
| $25,000 to $34,999 | 32 | 9.7% |
| $35,000 to $49,999 | 44 | 13.4% |
| $50,000 to $74,999 | 95 | 28.9% |
| $75,000 to $99,999 | 50 | 15.2% |
| $100,000 to $149,999 | 71 | 21.6% |
| $150,000 to $199,999 | 9 | 2.7% |
| $200,000+ | 4 | 1.2% |
Household Income by Householder Age in Eden
The median household income in Eden is $64,290, with the highest median household income of $93,750 found in the 25 to 44 years age bracket for the primary householder. A total of 116 households (35.3%) fall into this category. Meanwhile, the 15 to 24 years age bracket for the primary householder has the lowest median household income of $0, with 10 households (3.0%) in this group.
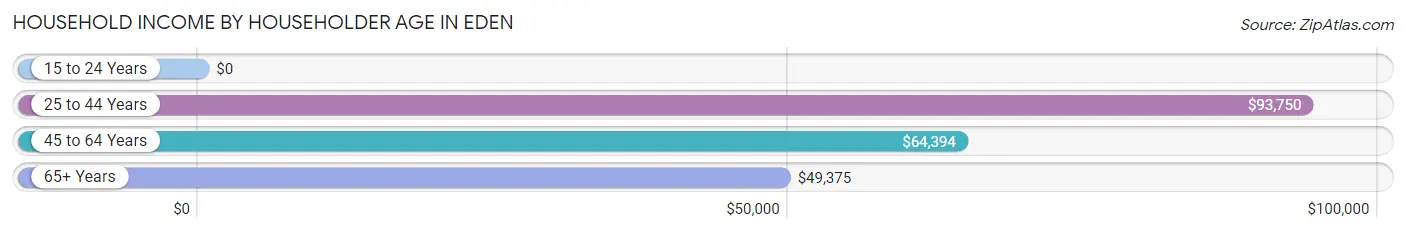
| Income Bracket | # Households | Median Income |
| 15 to 24 Years | 10 (3.0%) | $0 |
| 25 to 44 Years | 116 (35.3%) | $93,750 |
| 45 to 64 Years | 126 (38.3%) | $64,394 |
| 65+ Years | 77 (23.4%) | $49,375 |
| Total | 329 (100.0%) | $64,290 |
Poverty in Eden
Income Below Poverty by Sex and Age in Eden
With 2.1% poverty level for males and 7.5% for females among the residents of Eden, 5 year old males and 15 year old females are the most vulnerable to poverty, with 1 males (33.3%) and 4 females (80.0%) in their respective age groups living below the poverty level.
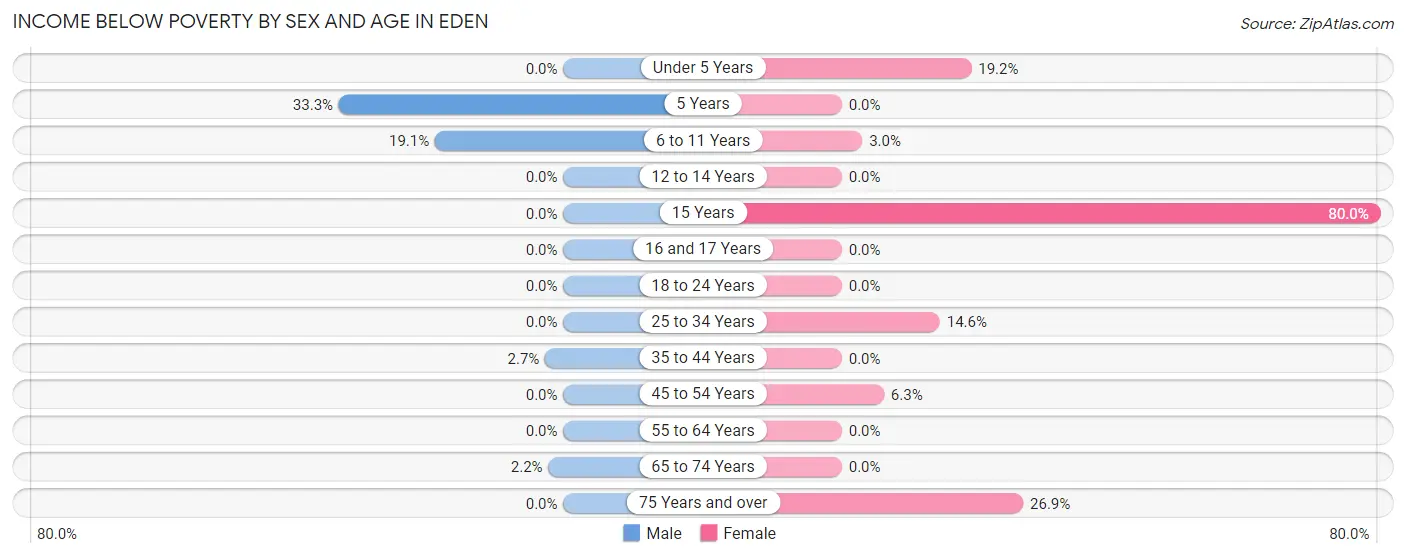
| Age Bracket | Male | Female |
| Under 5 Years | 0 (0.0%) | 5 (19.2%) |
| 5 Years | 1 (33.3%) | 0 (0.0%) |
| 6 to 11 Years | 4 (19.1%) | 1 (3.0%) |
| 12 to 14 Years | 0 (0.0%) | 0 (0.0%) |
| 15 Years | 0 (0.0%) | 4 (80.0%) |
| 16 and 17 Years | 0 (0.0%) | 0 (0.0%) |
| 18 to 24 Years | 0 (0.0%) | 0 (0.0%) |
| 25 to 34 Years | 0 (0.0%) | 8 (14.5%) |
| 35 to 44 Years | 1 (2.7%) | 0 (0.0%) |
| 45 to 54 Years | 0 (0.0%) | 4 (6.2%) |
| 55 to 64 Years | 0 (0.0%) | 0 (0.0%) |
| 65 to 74 Years | 1 (2.2%) | 0 (0.0%) |
| 75 Years and over | 0 (0.0%) | 7 (26.9%) |
| Total | 7 (2.1%) | 29 (7.5%) |
Income Above Poverty by Sex and Age in Eden
According to the poverty statistics in Eden, males aged under 5 years and females aged 5 years are the age groups that are most secure financially, with 100.0% of males and 100.0% of females in these age groups living above the poverty line.
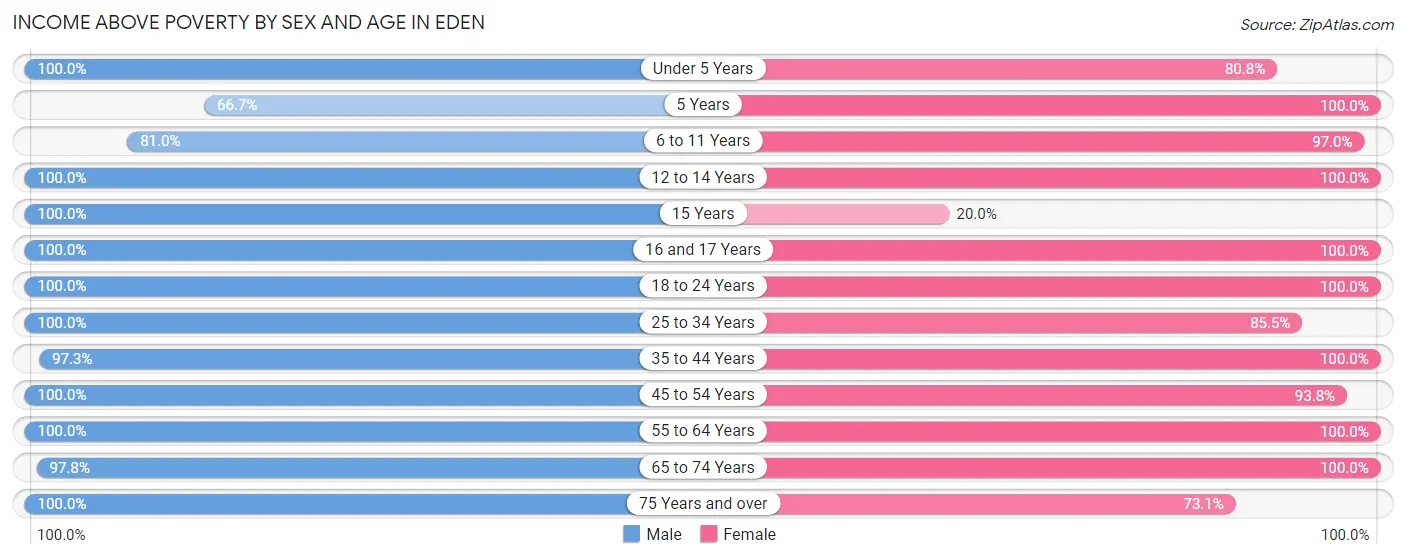
| Age Bracket | Male | Female |
| Under 5 Years | 15 (100.0%) | 21 (80.8%) |
| 5 Years | 2 (66.7%) | 3 (100.0%) |
| 6 to 11 Years | 17 (80.9%) | 32 (97.0%) |
| 12 to 14 Years | 5 (100.0%) | 15 (100.0%) |
| 15 Years | 24 (100.0%) | 1 (20.0%) |
| 16 and 17 Years | 6 (100.0%) | 2 (100.0%) |
| 18 to 24 Years | 26 (100.0%) | 27 (100.0%) |
| 25 to 34 Years | 54 (100.0%) | 47 (85.5%) |
| 35 to 44 Years | 36 (97.3%) | 47 (100.0%) |
| 45 to 54 Years | 41 (100.0%) | 60 (93.8%) |
| 55 to 64 Years | 39 (100.0%) | 46 (100.0%) |
| 65 to 74 Years | 44 (97.8%) | 40 (100.0%) |
| 75 Years and over | 21 (100.0%) | 19 (73.1%) |
| Total | 330 (97.9%) | 360 (92.5%) |
Income Below Poverty Among Married-Couple Families in Eden
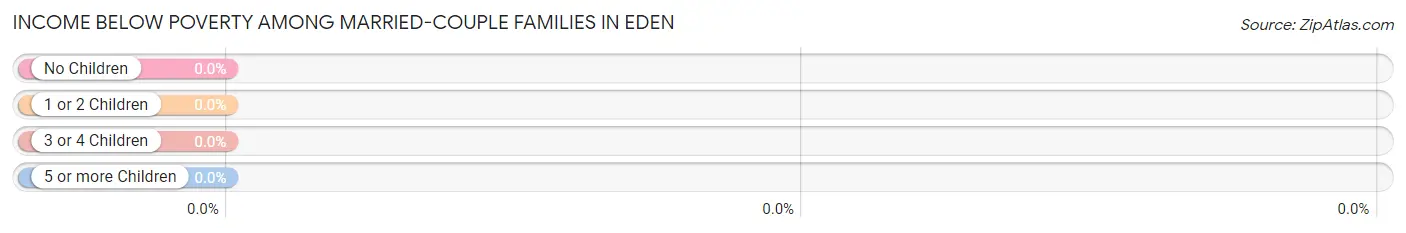
| Children | Above Poverty | Below Poverty |
| No Children | 109 (100.0%) | 0 (0.0%) |
| 1 or 2 Children | 32 (100.0%) | 0 (0.0%) |
| 3 or 4 Children | 11 (100.0%) | 0 (0.0%) |
| 5 or more Children | 0 (0.0%) | 0 (0.0%) |
| Total | 152 (100.0%) | 0 (0.0%) |
Income Below Poverty Among Single-Parent Households in Eden
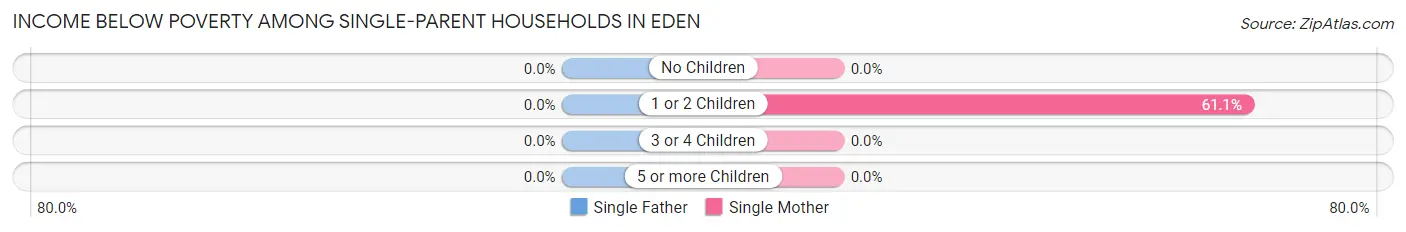
| Children | Single Father | Single Mother |
| No Children | 0 (0.0%) | 0 (0.0%) |
| 1 or 2 Children | 0 (0.0%) | 11 (61.1%) |
| 3 or 4 Children | 0 (0.0%) | 0 (0.0%) |
| 5 or more Children | 0 (0.0%) | 0 (0.0%) |
| Total | 0 (0.0%) | 11 (19.3%) |
Income Below Poverty Among Married-Couple vs Single-Parent Households in Eden
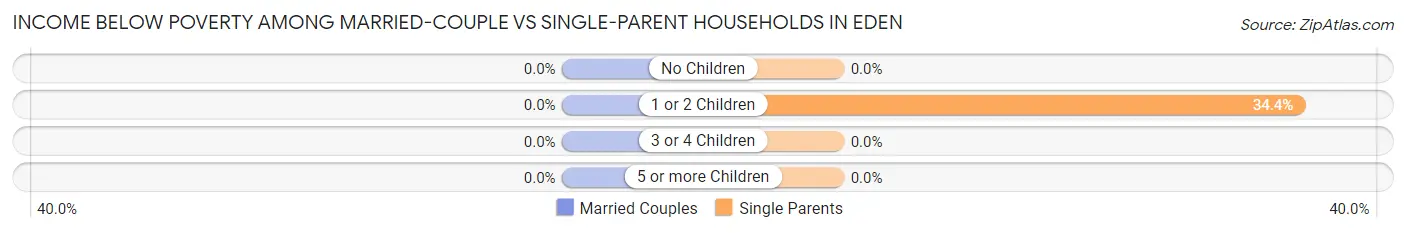
| Children | Married-Couple Families | Single-Parent Households |
| No Children | 0 (0.0%) | 0 (0.0%) |
| 1 or 2 Children | 0 (0.0%) | 11 (34.4%) |
| 3 or 4 Children | 0 (0.0%) | 0 (0.0%) |
| 5 or more Children | 0 (0.0%) | 0 (0.0%) |
| Total | 0 (0.0%) | 11 (13.1%) |
Race in Eden
The most populous races in Eden are White / Caucasian (690 | 95.0%), Hispanic or Latino (27 | 3.7%), and Two or more Races (23 | 3.2%).
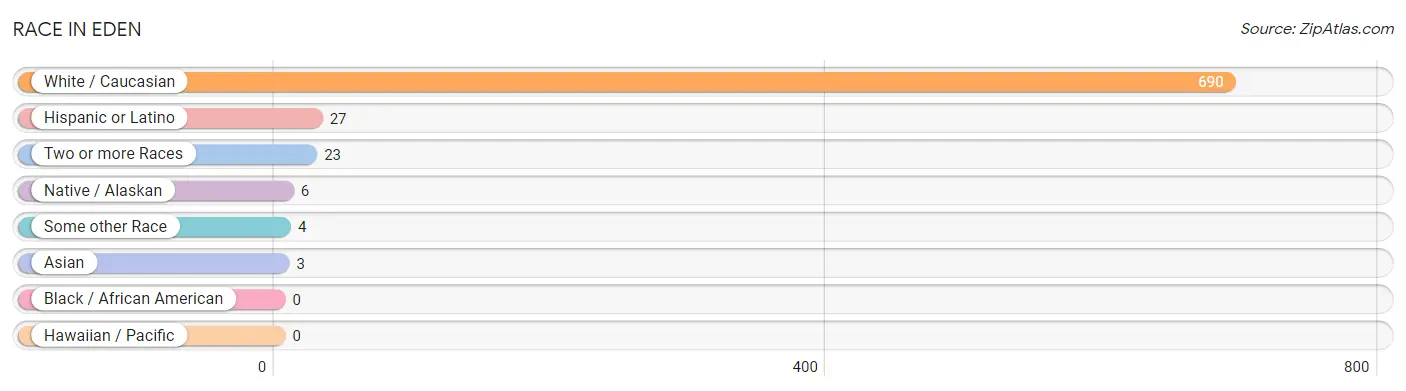
| Race | # Population | % Population |
| Asian | 3 | 0.4% |
| Black / African American | 0 | 0.0% |
| Hawaiian / Pacific | 0 | 0.0% |
| Hispanic or Latino | 27 | 3.7% |
| Native / Alaskan | 6 | 0.8% |
| White / Caucasian | 690 | 95.0% |
| Two or more Races | 23 | 3.2% |
| Some other Race | 4 | 0.5% |
| Total | 726 | 100.0% |
Ancestry in Eden
The most populous ancestries reported in Eden are German (436 | 60.1%), Irish (97 | 13.4%), Polish (57 | 7.9%), American (45 | 6.2%), and English (33 | 4.5%), together accounting for 92.0% of all Eden residents.
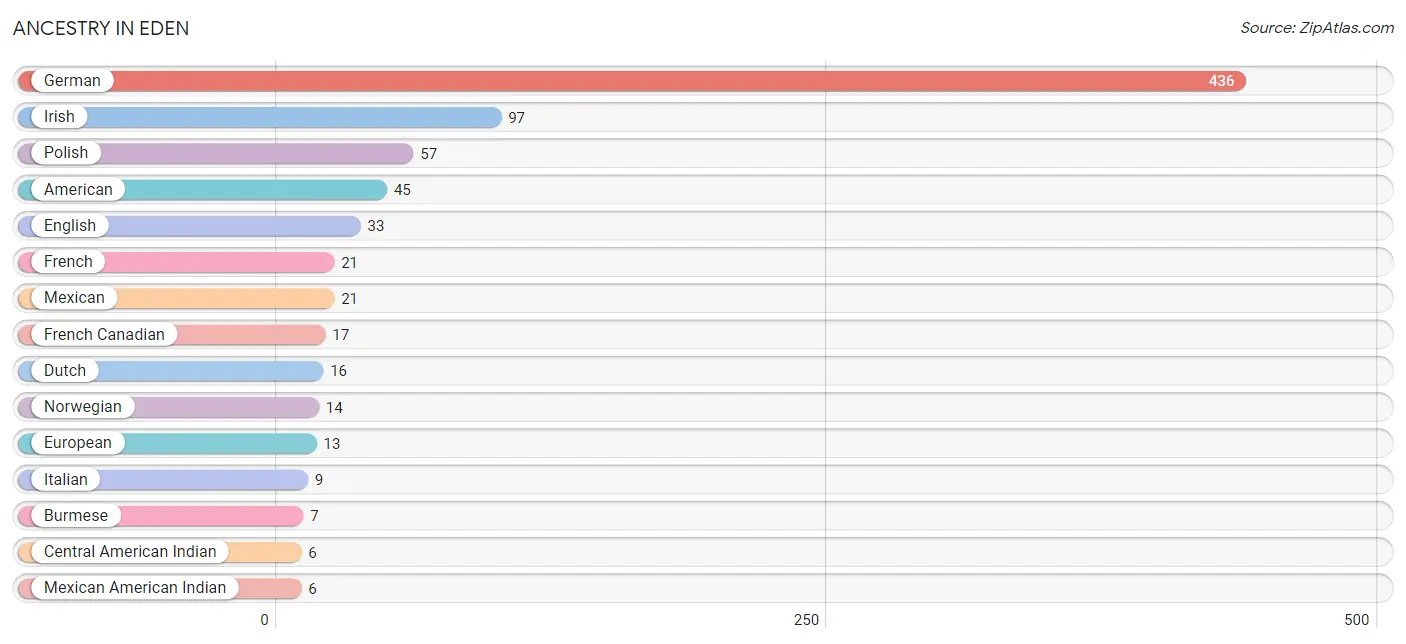
| Ancestry | # Population | % Population |
| American | 45 | 6.2% |
| Belgian | 2 | 0.3% |
| Burmese | 7 | 1.0% |
| Canadian | 1 | 0.1% |
| Central American Indian | 6 | 0.8% |
| Dutch | 16 | 2.2% |
| English | 33 | 4.5% |
| European | 13 | 1.8% |
| French | 21 | 2.9% |
| French Canadian | 17 | 2.3% |
| German | 436 | 60.1% |
| Irish | 97 | 13.4% |
| Italian | 9 | 1.2% |
| Luxembourger | 2 | 0.3% |
| Mexican | 21 | 2.9% |
| Mexican American Indian | 6 | 0.8% |
| Norwegian | 14 | 1.9% |
| Polish | 57 | 7.9% |
| Puerto Rican | 1 | 0.1% |
| Scandinavian | 2 | 0.3% |
| Scottish | 2 | 0.3% |
| Swedish | 4 | 0.5% |
| Welsh | 2 | 0.3% | View All 23 Rows |
Immigrants in Eden
The most numerous immigrant groups reported in Eden came from Central America (11 | 1.5%), Latin America (11 | 1.5%), Mexico (11 | 1.5%), Asia (3 | 0.4%), and Eastern Asia (3 | 0.4%), together accounting for 5.4% of all Eden residents.
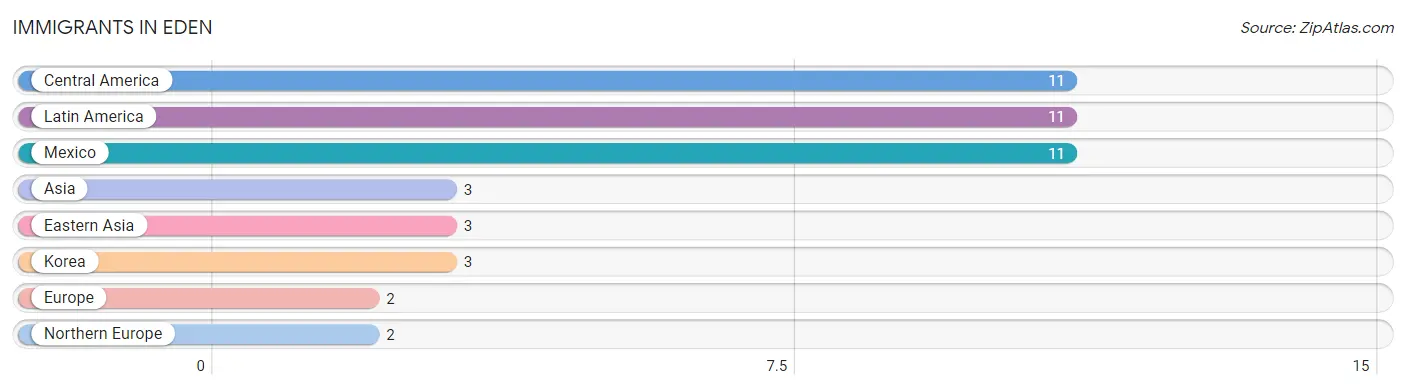
| Immigration Origin | # Population | % Population |
| Asia | 3 | 0.4% |
| Central America | 11 | 1.5% |
| Eastern Asia | 3 | 0.4% |
| Europe | 2 | 0.3% |
| Korea | 3 | 0.4% |
| Latin America | 11 | 1.5% |
| Mexico | 11 | 1.5% |
| Northern Europe | 2 | 0.3% | View All 8 Rows |
Sex and Age in Eden
Sex and Age in Eden
The most populous age groups in Eden are 15 to 19 Years (41 | 12.2%) for men and 45 to 49 Years (44 | 11.3%) for women.
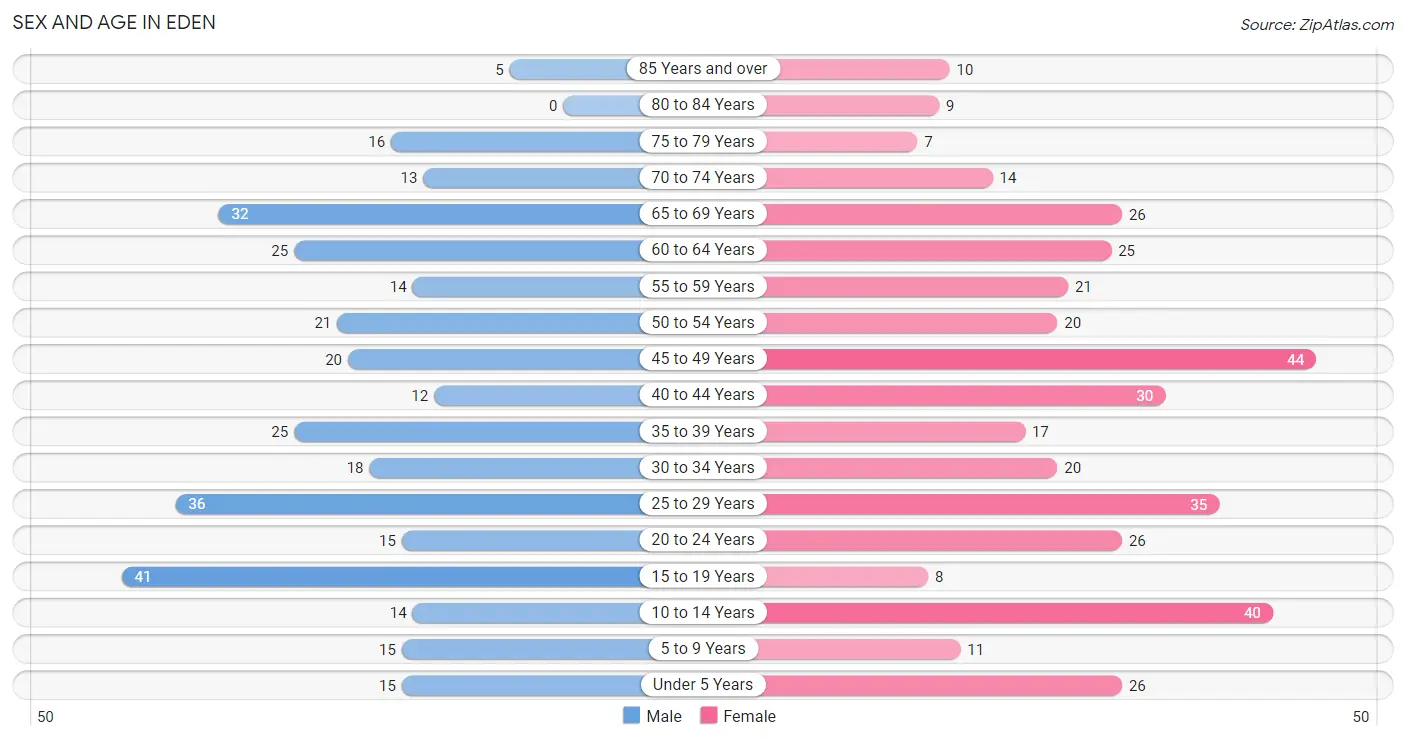
| Age Bracket | Male | Female |
| Under 5 Years | 15 (4.4%) | 26 (6.7%) |
| 5 to 9 Years | 15 (4.4%) | 11 (2.8%) |
| 10 to 14 Years | 14 (4.2%) | 40 (10.3%) |
| 15 to 19 Years | 41 (12.2%) | 8 (2.1%) |
| 20 to 24 Years | 15 (4.4%) | 26 (6.7%) |
| 25 to 29 Years | 36 (10.7%) | 35 (9.0%) |
| 30 to 34 Years | 18 (5.3%) | 20 (5.1%) |
| 35 to 39 Years | 25 (7.4%) | 17 (4.4%) |
| 40 to 44 Years | 12 (3.6%) | 30 (7.7%) |
| 45 to 49 Years | 20 (5.9%) | 44 (11.3%) |
| 50 to 54 Years | 21 (6.2%) | 20 (5.1%) |
| 55 to 59 Years | 14 (4.2%) | 21 (5.4%) |
| 60 to 64 Years | 25 (7.4%) | 25 (6.4%) |
| 65 to 69 Years | 32 (9.5%) | 26 (6.7%) |
| 70 to 74 Years | 13 (3.9%) | 14 (3.6%) |
| 75 to 79 Years | 16 (4.8%) | 7 (1.8%) |
| 80 to 84 Years | 0 (0.0%) | 9 (2.3%) |
| 85 Years and over | 5 (1.5%) | 10 (2.6%) |
| Total | 337 (100.0%) | 389 (100.0%) |
Families and Households in Eden
Median Family Size in Eden
The median family size in Eden is 2.58 persons per family, with married-couple families (152 | 64.4%) accounting for the largest median family size of 2.76 persons per family. On the other hand, single male/father families (27 | 11.4%) represent the smallest median family size with 2.19 persons per family.
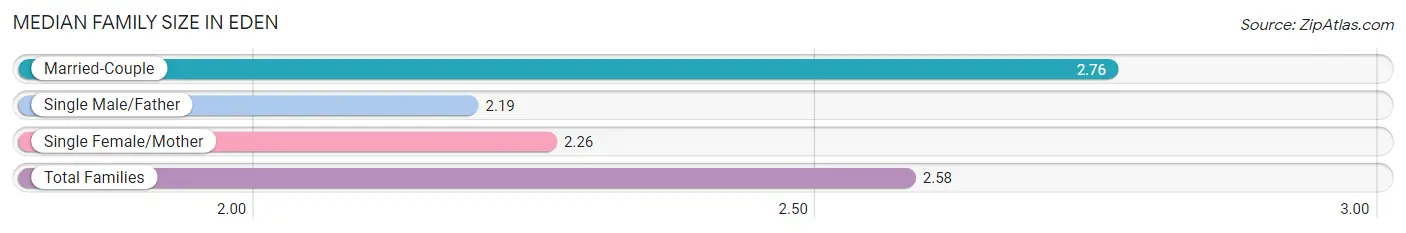
| Family Type | # Families | Family Size |
| Married-Couple | 152 (64.4%) | 2.76 |
| Single Male/Father | 27 (11.4%) | 2.19 |
| Single Female/Mother | 57 (24.1%) | 2.26 |
| Total Families | 236 (100.0%) | 2.58 |
Median Household Size in Eden
The median household size in Eden is 2.21 persons per household, with married-couple households (152 | 46.2%) accounting for the largest median household size of 2.76 persons per household. non-family households (93 | 28.3%) represent the smallest median household size with 1.23 persons per household.
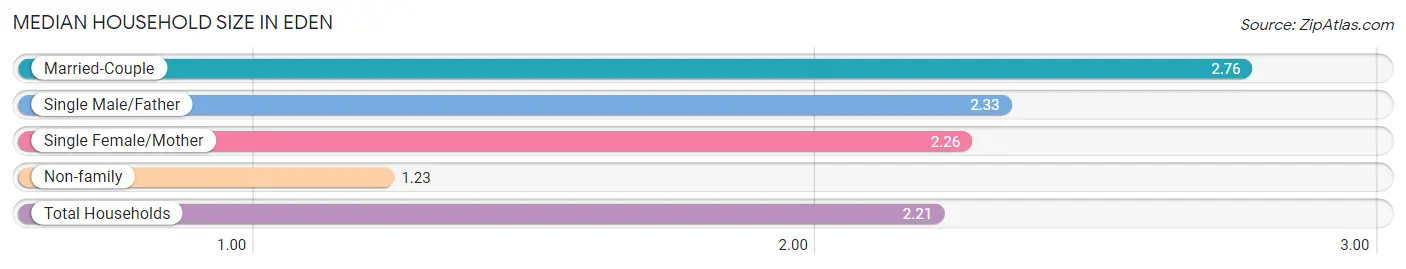
| Household Type | # Households | Household Size |
| Married-Couple | 152 (46.2%) | 2.76 |
| Single Male/Father | 27 (8.2%) | 2.33 |
| Single Female/Mother | 57 (17.3%) | 2.26 |
| Non-family | 93 (28.3%) | 1.23 |
| Total Households | 329 (100.0%) | 2.21 |
Household Size by Marriage Status in Eden
Out of a total of 329 households in Eden, 236 (71.7%) are family households, while 93 (28.3%) are nonfamily households. The most numerous type of family households are 2-person households, comprising 124, and the most common type of nonfamily households are 1-person households, comprising 75.
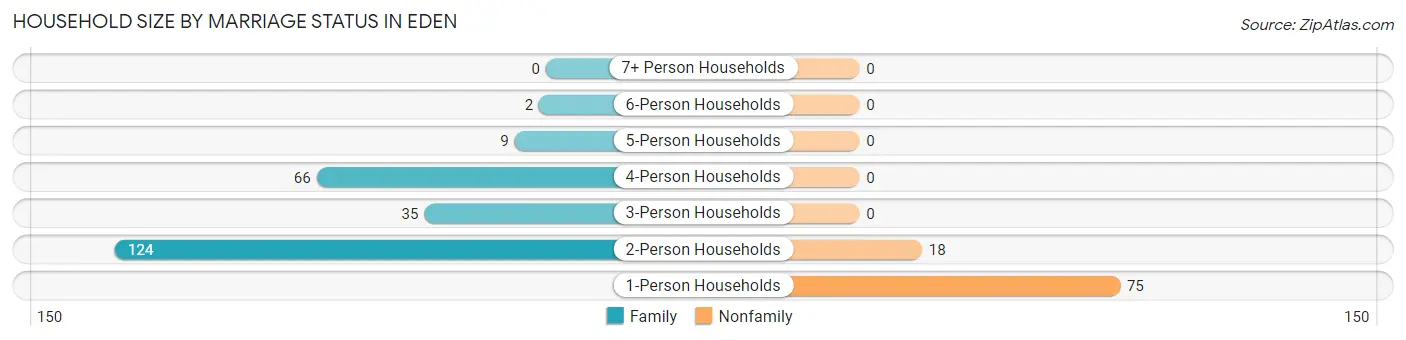
| Household Size | Family Households | Nonfamily Households |
| 1-Person Households | - | 75 (22.8%) |
| 2-Person Households | 124 (37.7%) | 18 (5.5%) |
| 3-Person Households | 35 (10.6%) | 0 (0.0%) |
| 4-Person Households | 66 (20.1%) | 0 (0.0%) |
| 5-Person Households | 9 (2.7%) | 0 (0.0%) |
| 6-Person Households | 2 (0.6%) | 0 (0.0%) |
| 7+ Person Households | 0 (0.0%) | 0 (0.0%) |
| Total | 236 (71.7%) | 93 (28.3%) |
Female Fertility in Eden
Fertility by Age in Eden
Average fertility rate in Eden is 27.0 births per 1,000 women. Women in the age bracket of 20 to 34 years have the highest fertility rate with 49.0 births per 1,000 women. Women in the age bracket of 20 to 34 years acount for 80.0% of all women with births.
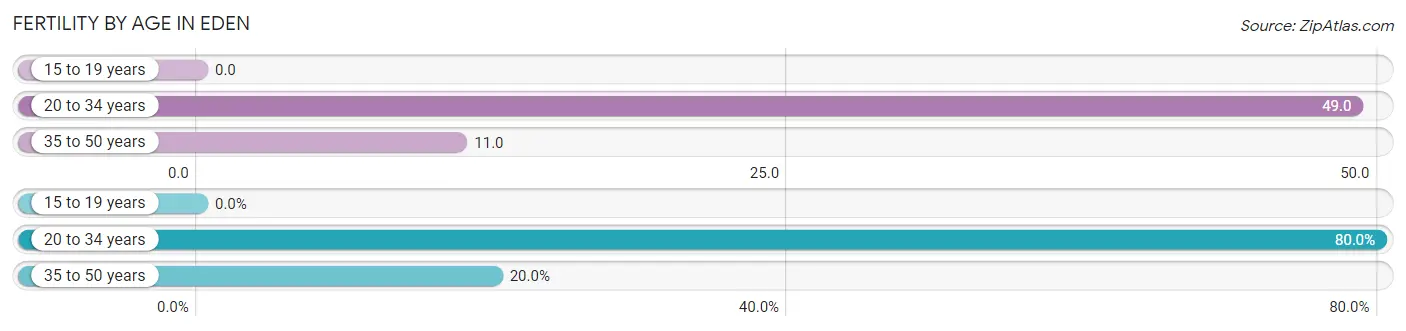
| Age Bracket | Women with Births | Births / 1,000 Women |
| 15 to 19 years | 0 (0.0%) | 0.0 |
| 20 to 34 years | 4 (80.0%) | 49.0 |
| 35 to 50 years | 1 (20.0%) | 11.0 |
| Total | 5 (100.0%) | 27.0 |
Fertility by Age by Marriage Status in Eden
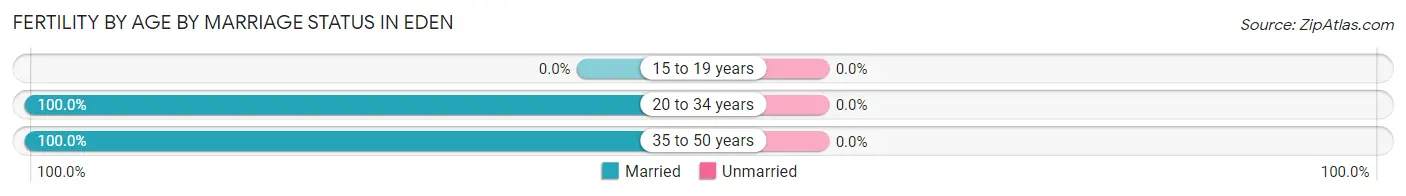
| Age Bracket | Married | Unmarried |
| 15 to 19 years | 0 (0.0%) | 0 (0.0%) |
| 20 to 34 years | 4 (100.0%) | 0 (0.0%) |
| 35 to 50 years | 1 (100.0%) | 0 (0.0%) |
| Total | 5 (100.0%) | 0 (0.0%) |
Fertility by Education in Eden
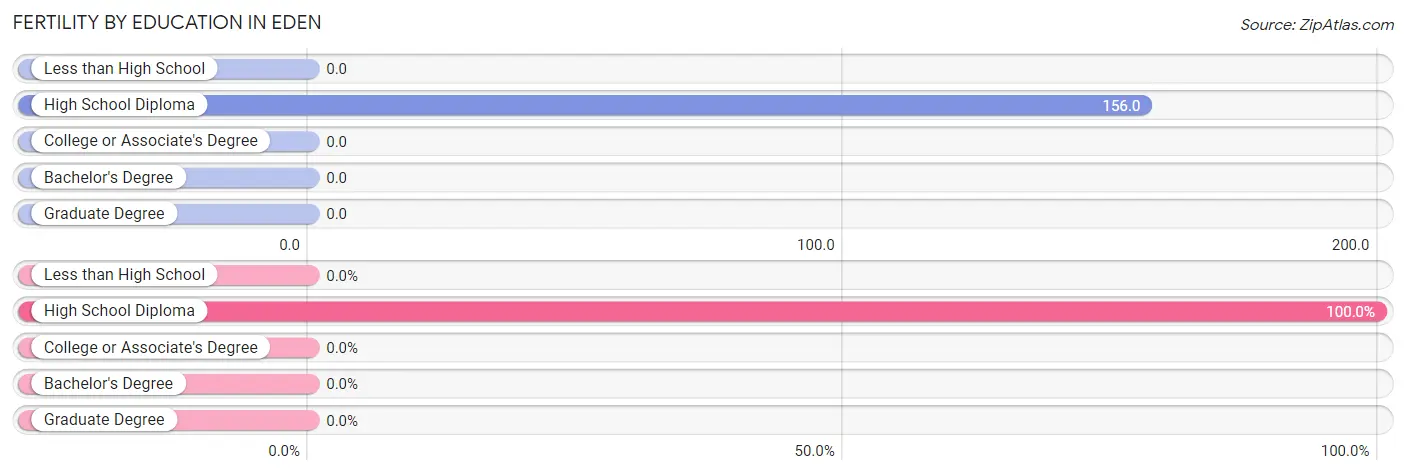
| Educational Attainment | Women with Births | Births / 1,000 Women |
| Less than High School | 0 (0.0%) | 0.0 |
| High School Diploma | 5 (100.0%) | 156.0 |
| College or Associate's Degree | 0 (0.0%) | 0.0 |
| Bachelor's Degree | 0 (0.0%) | 0.0 |
| Graduate Degree | 0 (0.0%) | 0.0 |
| Total | 5 (100.0%) | 27.0 |
Fertility by Education by Marriage Status in Eden
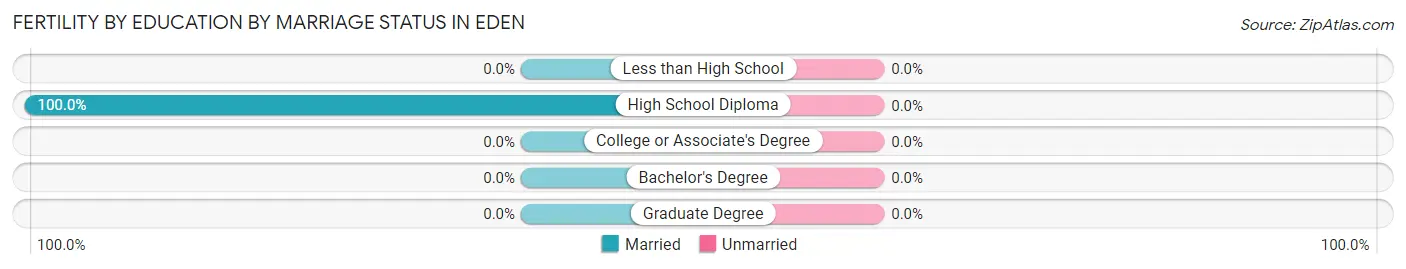
| Educational Attainment | Married | Unmarried |
| Less than High School | 0 (0.0%) | 0 (0.0%) |
| High School Diploma | 5 (100.0%) | 0 (0.0%) |
| College or Associate's Degree | 0 (0.0%) | 0 (0.0%) |
| Bachelor's Degree | 0 (0.0%) | 0 (0.0%) |
| Graduate Degree | 0 (0.0%) | 0 (0.0%) |
| Total | 5 (100.0%) | 0 (0.0%) |
Employment Characteristics in Eden
Employment by Class of Employer in Eden
Among the 402 employed individuals in Eden, private company employees (262 | 65.2%), state government employees (42 | 10.4%), and not-for-profit organizations (35 | 8.7%) make up the most common classes of employment.
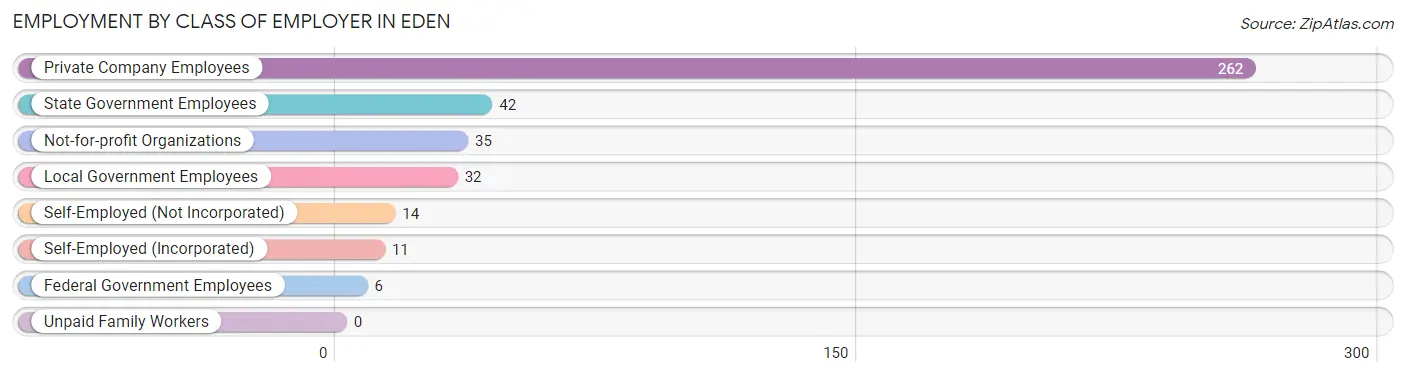
| Employer Class | # Employees | % Employees |
| Private Company Employees | 262 | 65.2% |
| Self-Employed (Incorporated) | 11 | 2.7% |
| Self-Employed (Not Incorporated) | 14 | 3.5% |
| Not-for-profit Organizations | 35 | 8.7% |
| Local Government Employees | 32 | 8.0% |
| State Government Employees | 42 | 10.4% |
| Federal Government Employees | 6 | 1.5% |
| Unpaid Family Workers | 0 | 0.0% |
| Total | 402 | 100.0% |
Employment Status by Age in Eden
According to the labor force statistics for Eden, out of the total population over 16 years of age (576), 76.0% or 438 individuals are in the labor force, with 5.5% or 24 of them unemployed. The age group with the highest labor force participation rate is 30 to 34 years, with 100.0% or 38 individuals in the labor force. Within the labor force, the 16 to 19 years age range has the highest percentage of unemployed individuals, with 26.7% or 4 of them being unemployed.
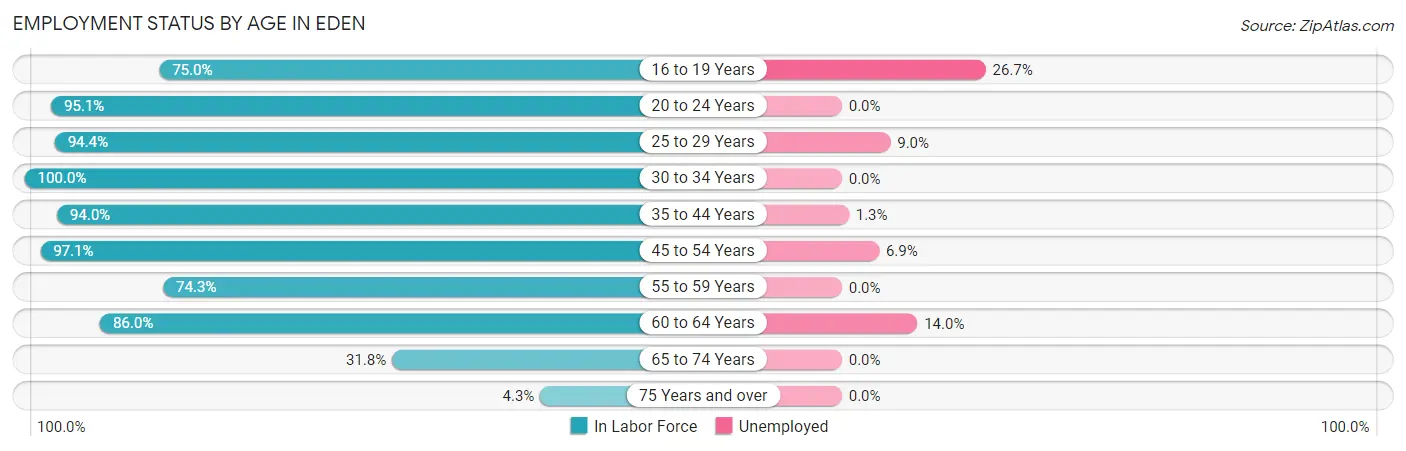
| Age Bracket | In Labor Force | Unemployed |
| 16 to 19 Years | 15 (75.0%) | 4 (26.7%) |
| 20 to 24 Years | 39 (95.1%) | 0 (0.0%) |
| 25 to 29 Years | 67 (94.4%) | 6 (9.0%) |
| 30 to 34 Years | 38 (100.0%) | 0 (0.0%) |
| 35 to 44 Years | 79 (94.0%) | 1 (1.3%) |
| 45 to 54 Years | 102 (97.1%) | 7 (6.9%) |
| 55 to 59 Years | 26 (74.3%) | 0 (0.0%) |
| 60 to 64 Years | 43 (86.0%) | 6 (14.0%) |
| 65 to 74 Years | 27 (31.8%) | 0 (0.0%) |
| 75 Years and over | 2 (4.3%) | 0 (0.0%) |
| Total | 438 (76.0%) | 24 (5.5%) |
Employment Status by Educational Attainment in Eden
According to labor force statistics for Eden, 92.7% of individuals (355) out of the total population between 25 and 64 years of age (383) are in the labor force, with 5.6% or 20 of them being unemployed. The group with the highest labor force participation rate are those with the educational attainment of bachelor's degree or higher, with 95.1% or 117 individuals in the labor force. Within the labor force, individuals with high school diploma education have the highest percentage of unemployment, with 9.8% or 13 of them being unemployed.
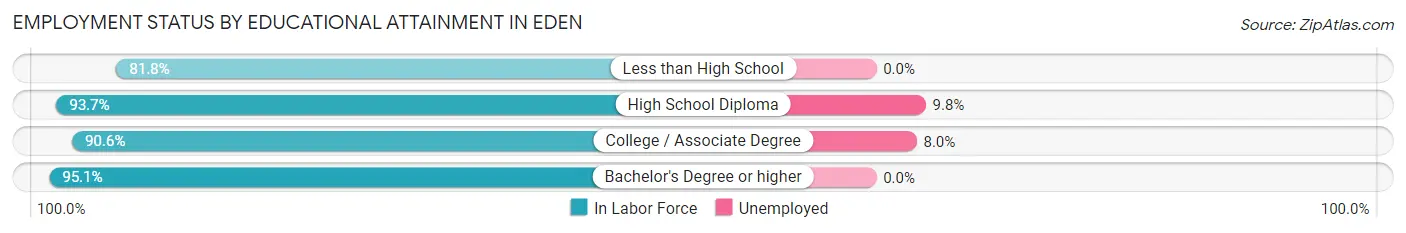
| Educational Attainment | In Labor Force | Unemployed |
| Less than High School | 18 (81.8%) | 0 (0.0%) |
| High School Diploma | 133 (93.7%) | 14 (9.8%) |
| College / Associate Degree | 87 (90.6%) | 8 (8.0%) |
| Bachelor's Degree or higher | 117 (95.1%) | 0 (0.0%) |
| Total | 355 (92.7%) | 21 (5.6%) |
Employment Occupations by Sex in Eden
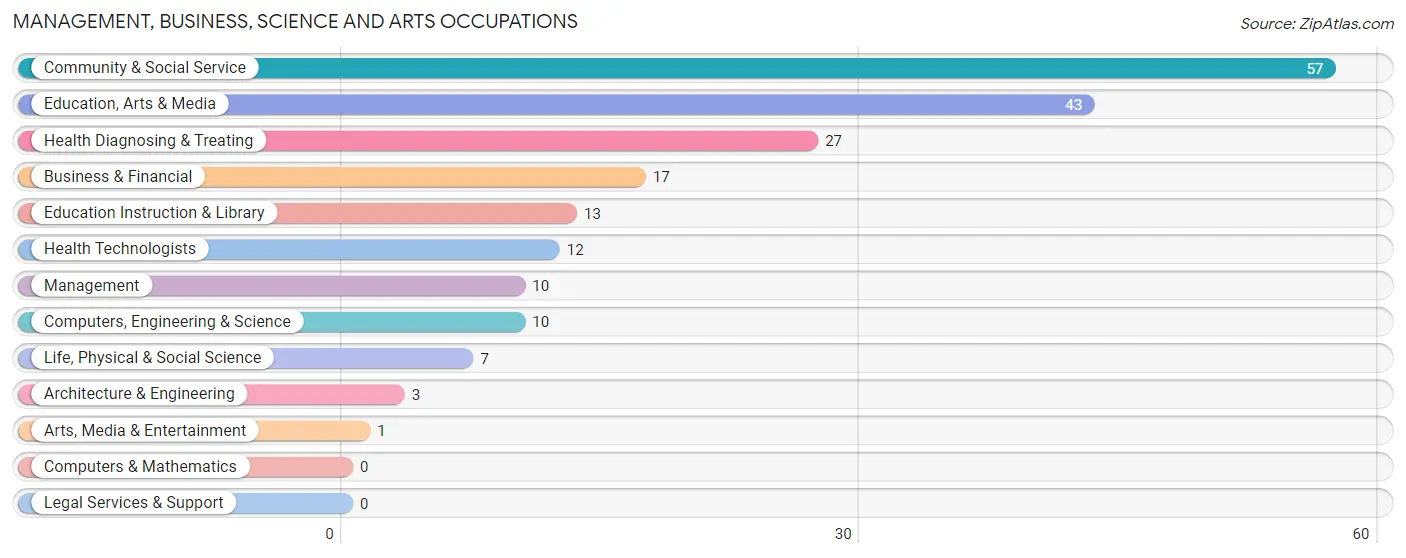
Management, Business, Science and Arts Occupations
The most common Management, Business, Science and Arts occupations in Eden are Community & Social Service (57 | 13.8%), Education, Arts & Media (43 | 10.4%), Health Diagnosing & Treating (27 | 6.5%), Business & Financial (17 | 4.1%), and Education Instruction & Library (13 | 3.1%).
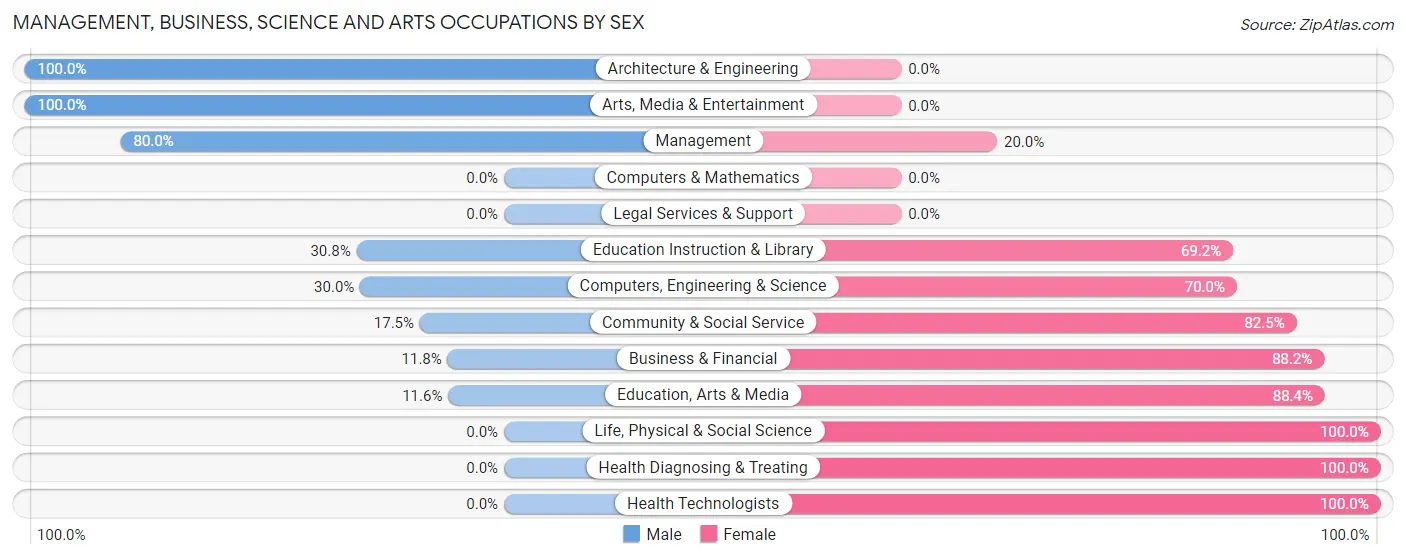
Management, Business, Science and Arts Occupations by Sex
Within the Management, Business, Science and Arts occupations in Eden, the most male-oriented occupations are Architecture & Engineering (100.0%), Arts, Media & Entertainment (100.0%), and Management (80.0%), while the most female-oriented occupations are Life, Physical & Social Science (100.0%), Health Diagnosing & Treating (100.0%), and Health Technologists (100.0%).
| Occupation | Male | Female |
| Management | 8 (80.0%) | 2 (20.0%) |
| Business & Financial | 2 (11.8%) | 15 (88.2%) |
| Computers, Engineering & Science | 3 (30.0%) | 7 (70.0%) |
| Computers & Mathematics | 0 (0.0%) | 0 (0.0%) |
| Architecture & Engineering | 3 (100.0%) | 0 (0.0%) |
| Life, Physical & Social Science | 0 (0.0%) | 7 (100.0%) |
| Community & Social Service | 10 (17.5%) | 47 (82.5%) |
| Education, Arts & Media | 5 (11.6%) | 38 (88.4%) |
| Legal Services & Support | 0 (0.0%) | 0 (0.0%) |
| Education Instruction & Library | 4 (30.8%) | 9 (69.2%) |
| Arts, Media & Entertainment | 1 (100.0%) | 0 (0.0%) |
| Health Diagnosing & Treating | 0 (0.0%) | 27 (100.0%) |
| Health Technologists | 0 (0.0%) | 12 (100.0%) |
| Total (Category) | 23 (19.0%) | 98 (81.0%) |
| Total (Overall) | 207 (50.0%) | 207 (50.0%) |
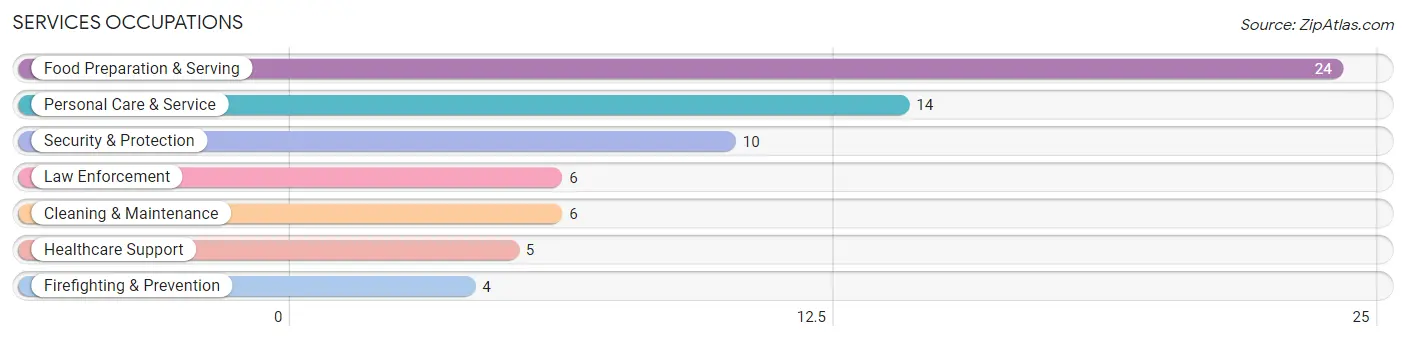
Services Occupations
The most common Services occupations in Eden are Food Preparation & Serving (24 | 5.8%), Personal Care & Service (14 | 3.4%), Security & Protection (10 | 2.4%), Law Enforcement (6 | 1.5%), and Cleaning & Maintenance (6 | 1.5%).
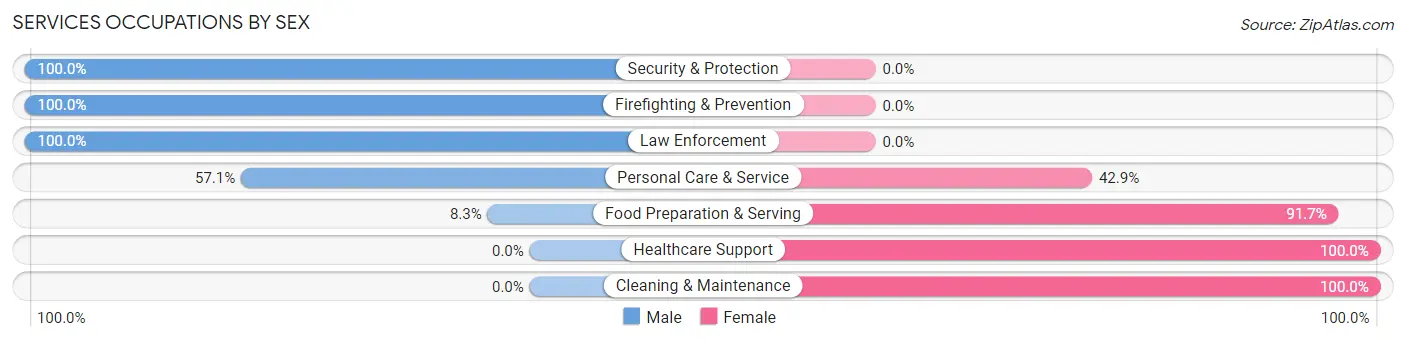
Services Occupations by Sex
Within the Services occupations in Eden, the most male-oriented occupations are Security & Protection (100.0%), Firefighting & Prevention (100.0%), and Law Enforcement (100.0%), while the most female-oriented occupations are Healthcare Support (100.0%), Cleaning & Maintenance (100.0%), and Food Preparation & Serving (91.7%).
| Occupation | Male | Female |
| Healthcare Support | 0 (0.0%) | 5 (100.0%) |
| Security & Protection | 10 (100.0%) | 0 (0.0%) |
| Firefighting & Prevention | 4 (100.0%) | 0 (0.0%) |
| Law Enforcement | 6 (100.0%) | 0 (0.0%) |
| Food Preparation & Serving | 2 (8.3%) | 22 (91.7%) |
| Cleaning & Maintenance | 0 (0.0%) | 6 (100.0%) |
| Personal Care & Service | 8 (57.1%) | 6 (42.9%) |
| Total (Category) | 20 (33.9%) | 39 (66.1%) |
| Total (Overall) | 207 (50.0%) | 207 (50.0%) |
Sales and Office Occupations
The most common Sales and Office occupations in Eden are Office & Administration (44 | 10.6%), and Sales & Related (26 | 6.3%).
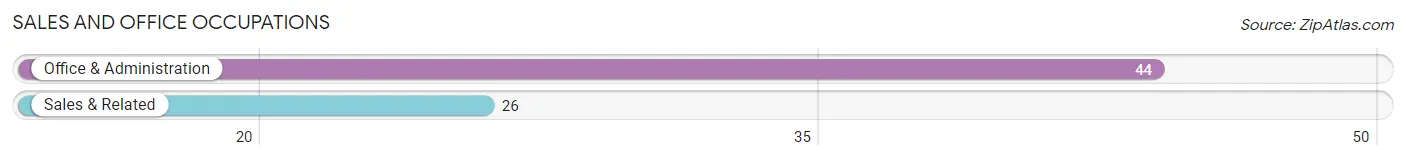
Sales and Office Occupations by Sex
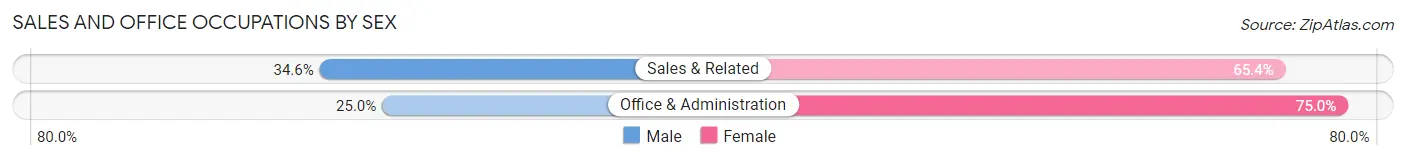
| Occupation | Male | Female |
| Sales & Related | 9 (34.6%) | 17 (65.4%) |
| Office & Administration | 11 (25.0%) | 33 (75.0%) |
| Total (Category) | 20 (28.6%) | 50 (71.4%) |
| Total (Overall) | 207 (50.0%) | 207 (50.0%) |
Natural Resources, Construction and Maintenance Occupations
The most common Natural Resources, Construction and Maintenance occupations in Eden are Construction & Extraction (31 | 7.5%), Installation, Maintenance & Repair (26 | 6.3%), and Farming, Fishing & Forestry (4 | 1.0%).
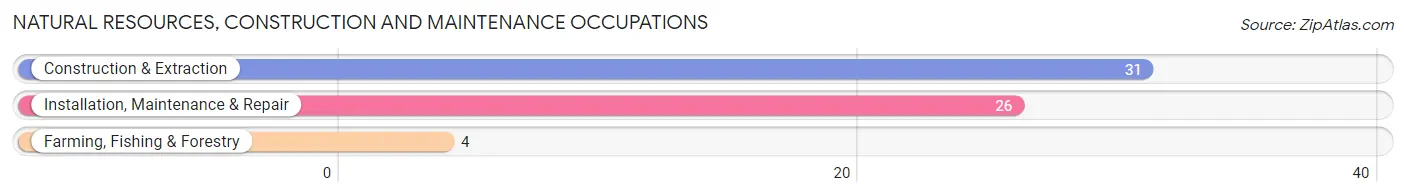
Natural Resources, Construction and Maintenance Occupations by Sex
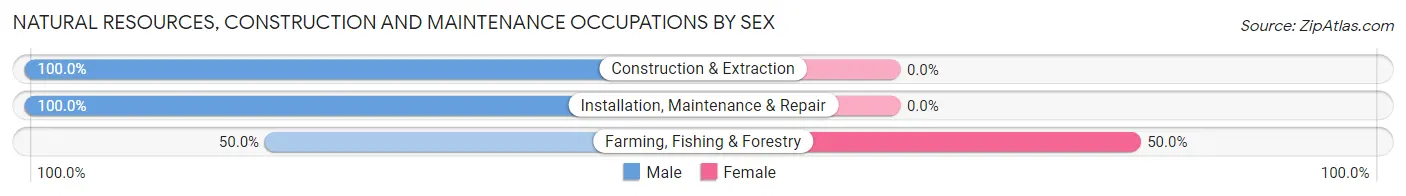
| Occupation | Male | Female |
| Farming, Fishing & Forestry | 2 (50.0%) | 2 (50.0%) |
| Construction & Extraction | 31 (100.0%) | 0 (0.0%) |
| Installation, Maintenance & Repair | 26 (100.0%) | 0 (0.0%) |
| Total (Category) | 59 (96.7%) | 2 (3.3%) |
| Total (Overall) | 207 (50.0%) | 207 (50.0%) |
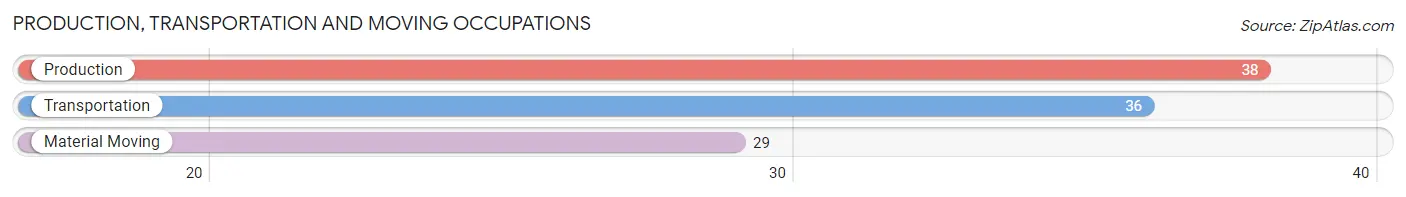
Production, Transportation and Moving Occupations
The most common Production, Transportation and Moving occupations in Eden are Production (38 | 9.2%), Transportation (36 | 8.7%), and Material Moving (29 | 7.0%).
Production, Transportation and Moving Occupations by Sex
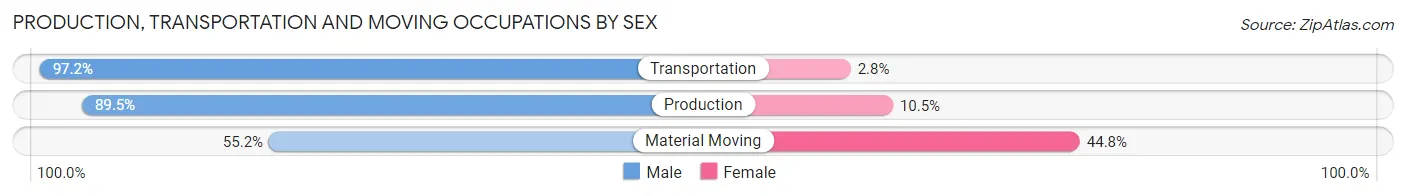
| Occupation | Male | Female |
| Production | 34 (89.5%) | 4 (10.5%) |
| Transportation | 35 (97.2%) | 1 (2.8%) |
| Material Moving | 16 (55.2%) | 13 (44.8%) |
| Total (Category) | 85 (82.5%) | 18 (17.5%) |
| Total (Overall) | 207 (50.0%) | 207 (50.0%) |
Employment Industries by Sex in Eden
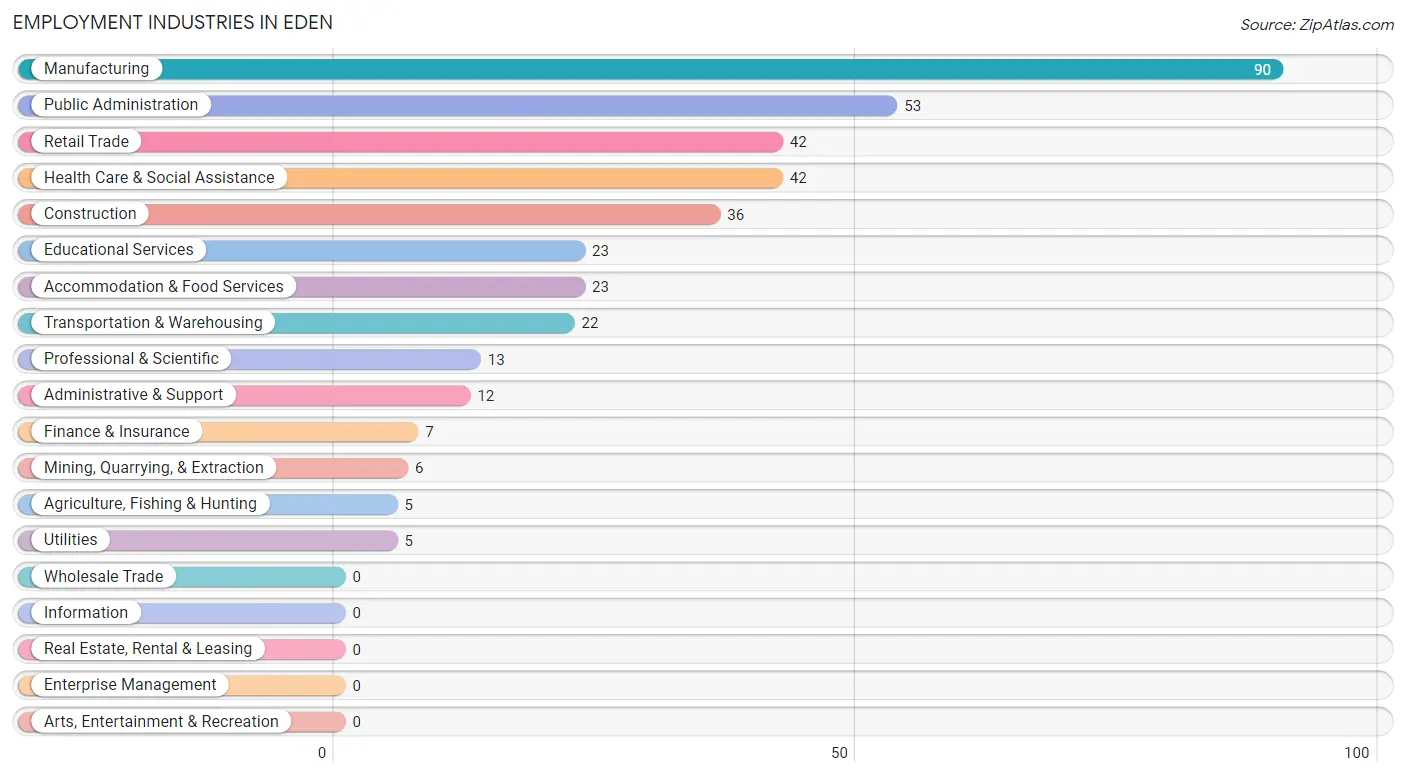
Employment Industries in Eden
The major employment industries in Eden include Manufacturing (90 | 21.7%), Public Administration (53 | 12.8%), Retail Trade (42 | 10.1%), Health Care & Social Assistance (42 | 10.1%), and Construction (36 | 8.7%).
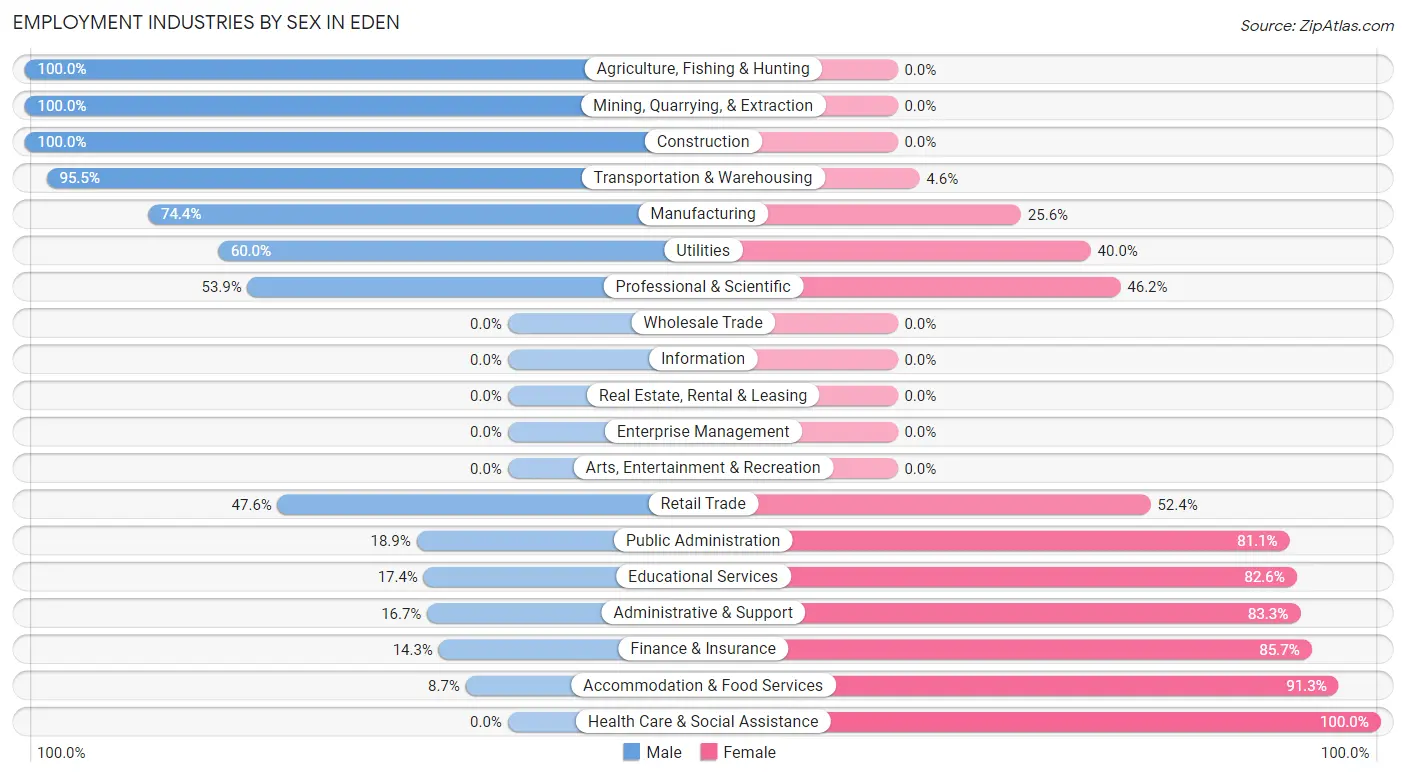
Employment Industries by Sex in Eden
The Eden industries that see more men than women are Agriculture, Fishing & Hunting (100.0%), Mining, Quarrying, & Extraction (100.0%), and Construction (100.0%), whereas the industries that tend to have a higher number of women are Health Care & Social Assistance (100.0%), Accommodation & Food Services (91.3%), and Finance & Insurance (85.7%).
| Industry | Male | Female |
| Agriculture, Fishing & Hunting | 5 (100.0%) | 0 (0.0%) |
| Mining, Quarrying, & Extraction | 6 (100.0%) | 0 (0.0%) |
| Construction | 36 (100.0%) | 0 (0.0%) |
| Manufacturing | 67 (74.4%) | 23 (25.6%) |
| Wholesale Trade | 0 (0.0%) | 0 (0.0%) |
| Retail Trade | 20 (47.6%) | 22 (52.4%) |
| Transportation & Warehousing | 21 (95.5%) | 1 (4.5%) |
| Utilities | 3 (60.0%) | 2 (40.0%) |
| Information | 0 (0.0%) | 0 (0.0%) |
| Finance & Insurance | 1 (14.3%) | 6 (85.7%) |
| Real Estate, Rental & Leasing | 0 (0.0%) | 0 (0.0%) |
| Professional & Scientific | 7 (53.8%) | 6 (46.2%) |
| Enterprise Management | 0 (0.0%) | 0 (0.0%) |
| Administrative & Support | 2 (16.7%) | 10 (83.3%) |
| Educational Services | 4 (17.4%) | 19 (82.6%) |
| Health Care & Social Assistance | 0 (0.0%) | 42 (100.0%) |
| Arts, Entertainment & Recreation | 0 (0.0%) | 0 (0.0%) |
| Accommodation & Food Services | 2 (8.7%) | 21 (91.3%) |
| Public Administration | 10 (18.9%) | 43 (81.1%) |
| Total | 207 (50.0%) | 207 (50.0%) |
Education in Eden
School Enrollment in Eden
The most common levels of schooling among the 149 students in Eden are middle school (48 | 32.2%), high school (41 | 27.5%), and college / undergraduate (29 | 19.5%).
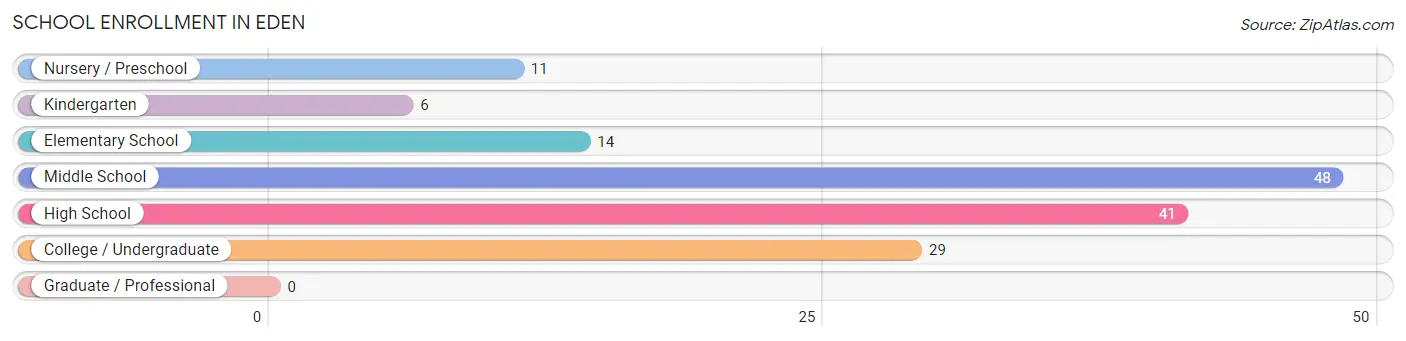
| School Level | # Students | % Students |
| Nursery / Preschool | 11 | 7.4% |
| Kindergarten | 6 | 4.0% |
| Elementary School | 14 | 9.4% |
| Middle School | 48 | 32.2% |
| High School | 41 | 27.5% |
| College / Undergraduate | 29 | 19.5% |
| Graduate / Professional | 0 | 0.0% |
| Total | 149 | 100.0% |
School Enrollment by Age by Funding Source in Eden
Out of a total of 149 students who are enrolled in schools in Eden, 26 (17.4%) attend a private institution, while the remaining 123 (82.6%) are enrolled in public schools. The age group of 20 to 24 year olds has the highest likelihood of being enrolled in private schools, with 7 (36.8% in the age bracket) enrolled. Conversely, the age group of 18 to 19 year olds has the lowest likelihood of being enrolled in a private school, with 8 (100.0% in the age bracket) attending a public institution.
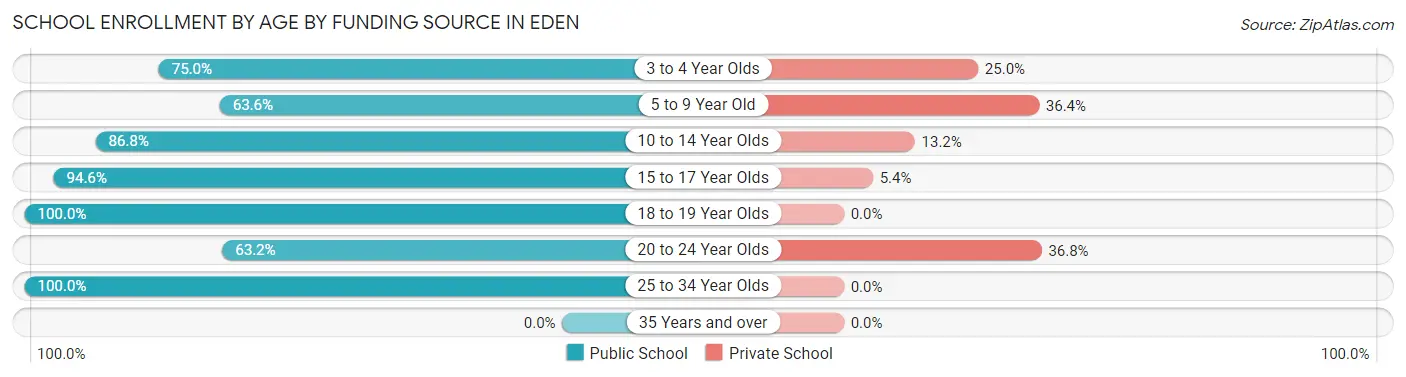
| Age Bracket | Public School | Private School |
| 3 to 4 Year Olds | 6 (75.0%) | 2 (25.0%) |
| 5 to 9 Year Old | 14 (63.6%) | 8 (36.4%) |
| 10 to 14 Year Olds | 46 (86.8%) | 7 (13.2%) |
| 15 to 17 Year Olds | 35 (94.6%) | 2 (5.4%) |
| 18 to 19 Year Olds | 8 (100.0%) | 0 (0.0%) |
| 20 to 24 Year Olds | 12 (63.2%) | 7 (36.8%) |
| 25 to 34 Year Olds | 2 (100.0%) | 0 (0.0%) |
| 35 Years and over | 0 (0.0%) | 0 (0.0%) |
| Total | 123 (82.6%) | 26 (17.4%) |
Educational Attainment by Field of Study in Eden
Arts & humanities (51 | 38.9%), business (18 | 13.7%), science & technology (13 | 9.9%), education (12 | 9.2%), and bio, nature & agricultural (9 | 6.9%) are the most common fields of study among 131 individuals in Eden who have obtained a bachelor's degree or higher.
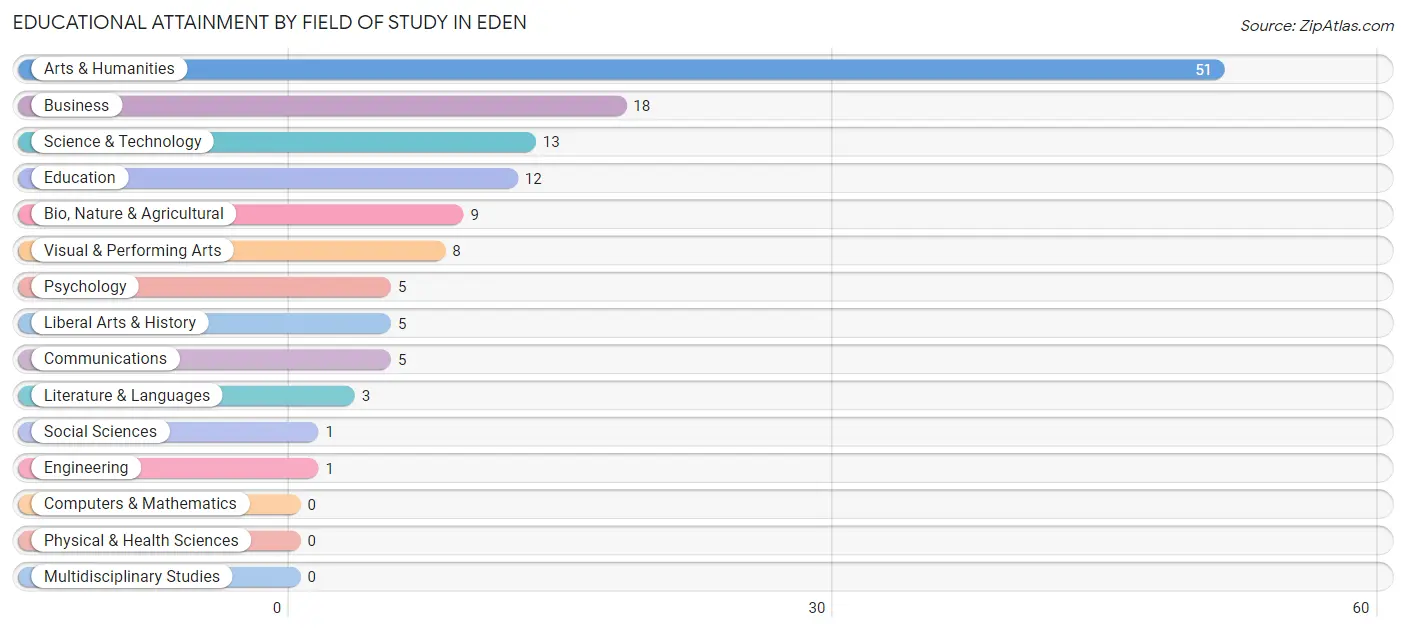
| Field of Study | # Graduates | % Graduates |
| Computers & Mathematics | 0 | 0.0% |
| Bio, Nature & Agricultural | 9 | 6.9% |
| Physical & Health Sciences | 0 | 0.0% |
| Psychology | 5 | 3.8% |
| Social Sciences | 1 | 0.8% |
| Engineering | 1 | 0.8% |
| Multidisciplinary Studies | 0 | 0.0% |
| Science & Technology | 13 | 9.9% |
| Business | 18 | 13.7% |
| Education | 12 | 9.2% |
| Literature & Languages | 3 | 2.3% |
| Liberal Arts & History | 5 | 3.8% |
| Visual & Performing Arts | 8 | 6.1% |
| Communications | 5 | 3.8% |
| Arts & Humanities | 51 | 38.9% |
| Total | 131 | 100.0% |
Transportation & Commute in Eden
Vehicle Availability by Sex in Eden
The most prevalent vehicle ownership categories in Eden are males with 2 vehicles (91, accounting for 46.7%) and females with 2 vehicles (67, making up 44.0%).
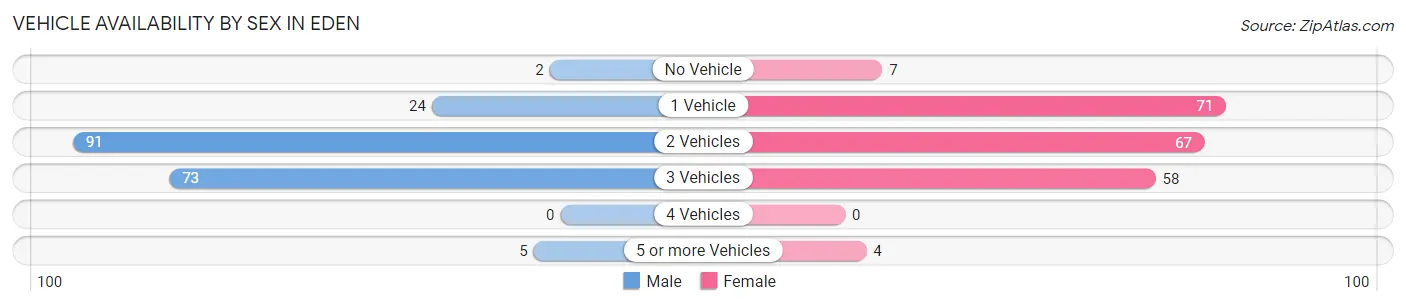
| Vehicles Available | Male | Female |
| No Vehicle | 2 (1.0%) | 7 (3.4%) |
| 1 Vehicle | 24 (12.3%) | 71 (34.3%) |
| 2 Vehicles | 91 (46.7%) | 67 (32.4%) |
| 3 Vehicles | 73 (37.4%) | 58 (28.0%) |
| 4 Vehicles | 0 (0.0%) | 0 (0.0%) |
| 5 or more Vehicles | 5 (2.6%) | 4 (1.9%) |
| Total | 195 (100.0%) | 207 (100.0%) |
Commute Time in Eden
The most frequently occuring commute durations in Eden are 10 to 14 minutes (87 commuters, 22.3%), 20 to 24 minutes (77 commuters, 19.7%), and 15 to 19 minutes (71 commuters, 18.2%).
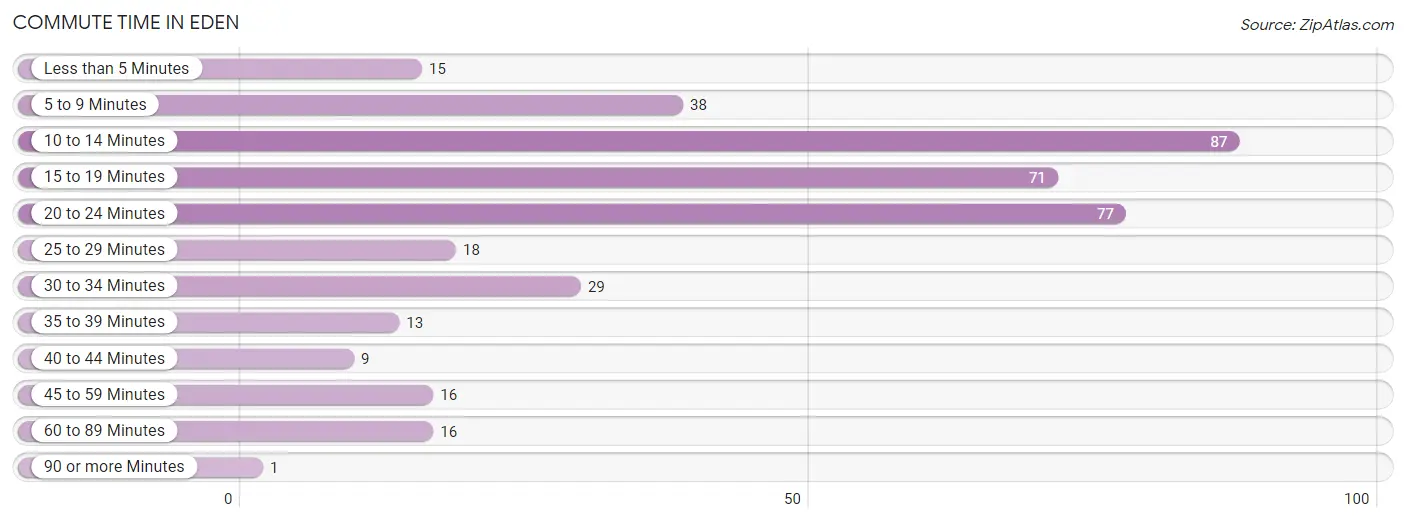
| Commute Time | # Commuters | % Commuters |
| Less than 5 Minutes | 15 | 3.8% |
| 5 to 9 Minutes | 38 | 9.7% |
| 10 to 14 Minutes | 87 | 22.3% |
| 15 to 19 Minutes | 71 | 18.2% |
| 20 to 24 Minutes | 77 | 19.7% |
| 25 to 29 Minutes | 18 | 4.6% |
| 30 to 34 Minutes | 29 | 7.4% |
| 35 to 39 Minutes | 13 | 3.3% |
| 40 to 44 Minutes | 9 | 2.3% |
| 45 to 59 Minutes | 16 | 4.1% |
| 60 to 89 Minutes | 16 | 4.1% |
| 90 or more Minutes | 1 | 0.3% |
Commute Time by Sex in Eden
The most common commute times in Eden are 5 to 9 minutes (36 commuters, 18.6%) for males and 10 to 14 minutes (61 commuters, 31.0%) for females.
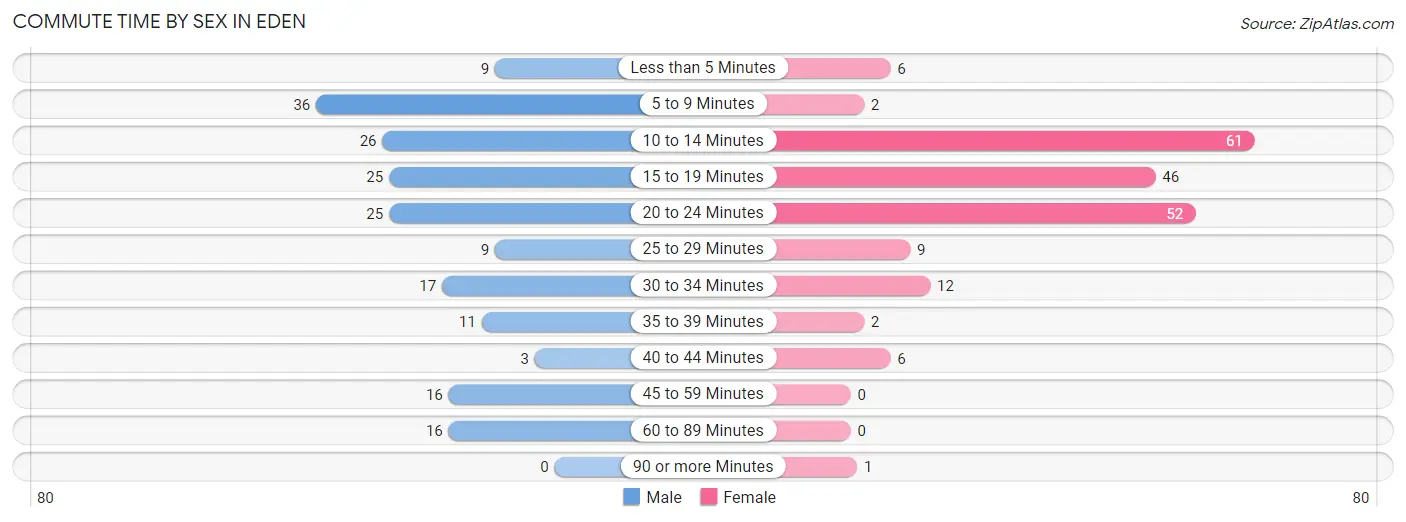
| Commute Time | Male | Female |
| Less than 5 Minutes | 9 (4.7%) | 6 (3.0%) |
| 5 to 9 Minutes | 36 (18.6%) | 2 (1.0%) |
| 10 to 14 Minutes | 26 (13.5%) | 61 (31.0%) |
| 15 to 19 Minutes | 25 (13.0%) | 46 (23.4%) |
| 20 to 24 Minutes | 25 (13.0%) | 52 (26.4%) |
| 25 to 29 Minutes | 9 (4.7%) | 9 (4.6%) |
| 30 to 34 Minutes | 17 (8.8%) | 12 (6.1%) |
| 35 to 39 Minutes | 11 (5.7%) | 2 (1.0%) |
| 40 to 44 Minutes | 3 (1.5%) | 6 (3.0%) |
| 45 to 59 Minutes | 16 (8.3%) | 0 (0.0%) |
| 60 to 89 Minutes | 16 (8.3%) | 0 (0.0%) |
| 90 or more Minutes | 0 (0.0%) | 1 (0.5%) |
Time of Departure to Work by Sex in Eden
The most frequent times of departure to work in Eden are 6:00 AM to 6:29 AM (38, 19.7%) for males and 7:30 AM to 7:59 AM (51, 25.9%) for females.
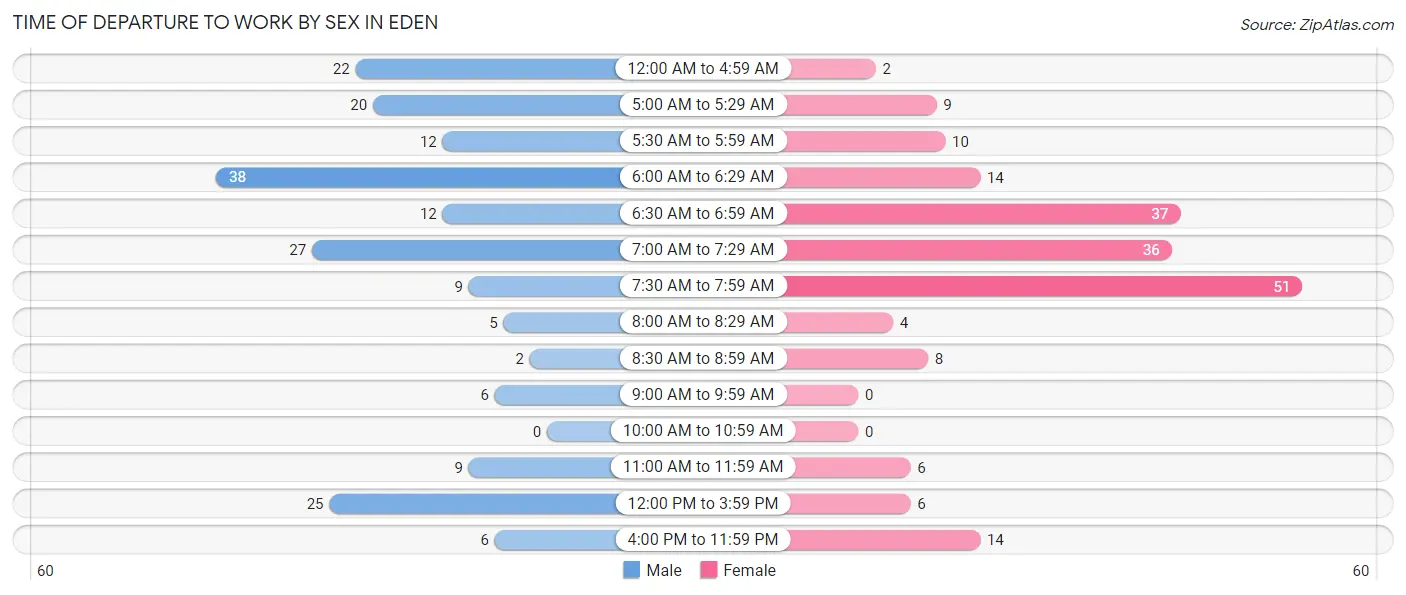
| Time of Departure | Male | Female |
| 12:00 AM to 4:59 AM | 22 (11.4%) | 2 (1.0%) |
| 5:00 AM to 5:29 AM | 20 (10.4%) | 9 (4.6%) |
| 5:30 AM to 5:59 AM | 12 (6.2%) | 10 (5.1%) |
| 6:00 AM to 6:29 AM | 38 (19.7%) | 14 (7.1%) |
| 6:30 AM to 6:59 AM | 12 (6.2%) | 37 (18.8%) |
| 7:00 AM to 7:29 AM | 27 (14.0%) | 36 (18.3%) |
| 7:30 AM to 7:59 AM | 9 (4.7%) | 51 (25.9%) |
| 8:00 AM to 8:29 AM | 5 (2.6%) | 4 (2.0%) |
| 8:30 AM to 8:59 AM | 2 (1.0%) | 8 (4.1%) |
| 9:00 AM to 9:59 AM | 6 (3.1%) | 0 (0.0%) |
| 10:00 AM to 10:59 AM | 0 (0.0%) | 0 (0.0%) |
| 11:00 AM to 11:59 AM | 9 (4.7%) | 6 (3.0%) |
| 12:00 PM to 3:59 PM | 25 (13.0%) | 6 (3.0%) |
| 4:00 PM to 11:59 PM | 6 (3.1%) | 14 (7.1%) |
| Total | 193 (100.0%) | 197 (100.0%) |
Housing Occupancy in Eden
Occupancy by Ownership in Eden
Of the total 329 dwellings in Eden, owner-occupied units account for 227 (69.0%), while renter-occupied units make up 102 (31.0%).
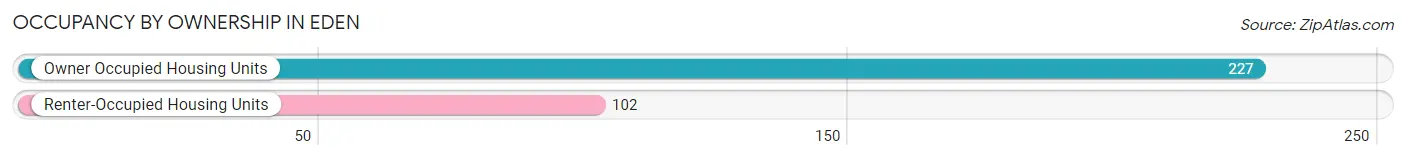
| Occupancy | # Housing Units | % Housing Units |
| Owner Occupied Housing Units | 227 | 69.0% |
| Renter-Occupied Housing Units | 102 | 31.0% |
| Total Occupied Housing Units | 329 | 100.0% |
Occupancy by Household Size in Eden
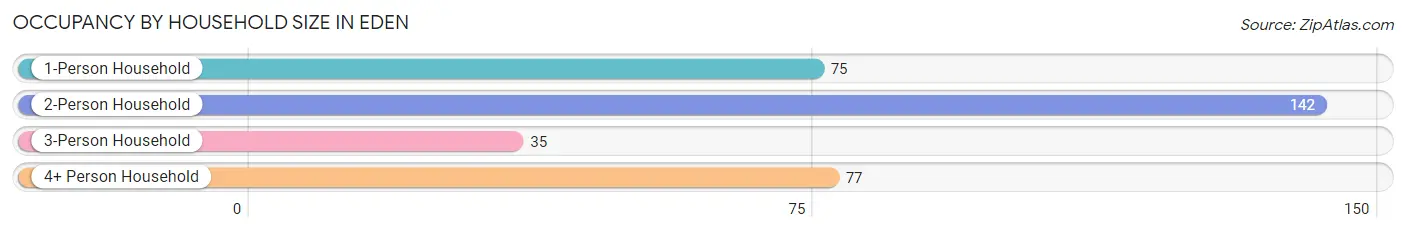
| Household Size | # Housing Units | % Housing Units |
| 1-Person Household | 75 | 22.8% |
| 2-Person Household | 142 | 43.2% |
| 3-Person Household | 35 | 10.6% |
| 4+ Person Household | 77 | 23.4% |
| Total Housing Units | 329 | 100.0% |
Occupancy by Ownership by Household Size in Eden
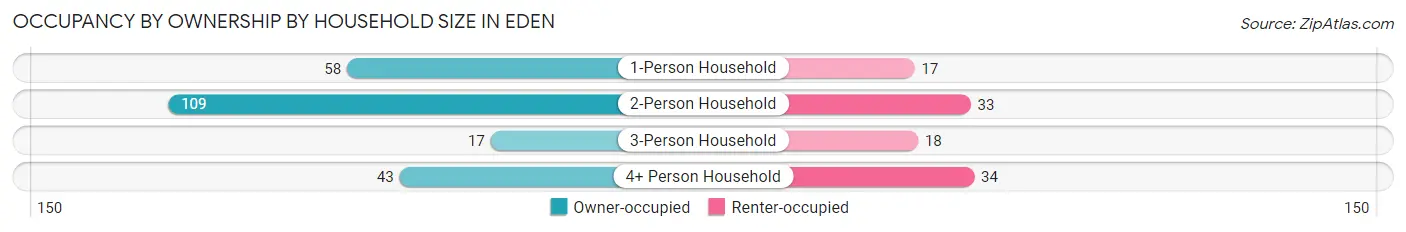
| Household Size | Owner-occupied | Renter-occupied |
| 1-Person Household | 58 (77.3%) | 17 (22.7%) |
| 2-Person Household | 109 (76.8%) | 33 (23.2%) |
| 3-Person Household | 17 (48.6%) | 18 (51.4%) |
| 4+ Person Household | 43 (55.8%) | 34 (44.2%) |
| Total Housing Units | 227 (69.0%) | 102 (31.0%) |
Occupancy by Educational Attainment in Eden
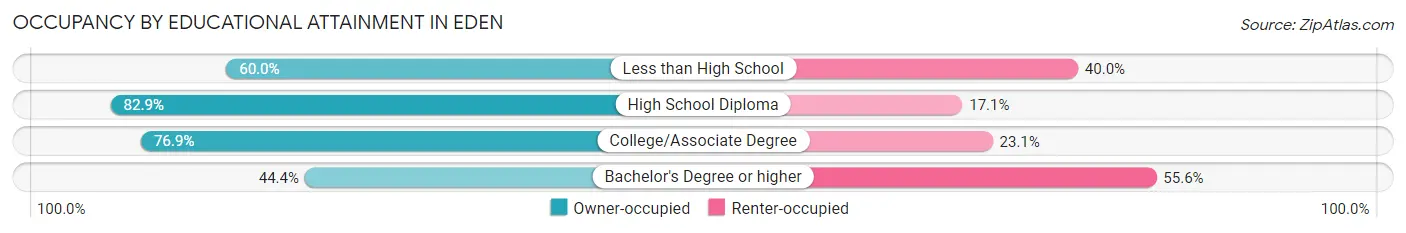
| Household Size | Owner-occupied | Renter-occupied |
| Less than High School | 15 (60.0%) | 10 (40.0%) |
| High School Diploma | 102 (82.9%) | 21 (17.1%) |
| College/Associate Degree | 70 (76.9%) | 21 (23.1%) |
| Bachelor's Degree or higher | 40 (44.4%) | 50 (55.6%) |
Occupancy by Age of Householder in Eden
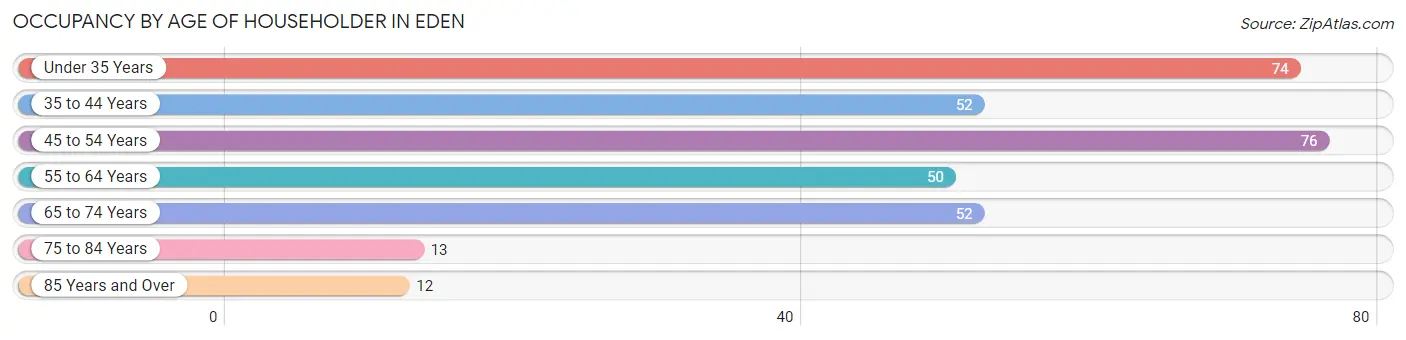
| Age Bracket | # Households | % Households |
| Under 35 Years | 74 | 22.5% |
| 35 to 44 Years | 52 | 15.8% |
| 45 to 54 Years | 76 | 23.1% |
| 55 to 64 Years | 50 | 15.2% |
| 65 to 74 Years | 52 | 15.8% |
| 75 to 84 Years | 13 | 4.0% |
| 85 Years and Over | 12 | 3.6% |
| Total | 329 | 100.0% |
Housing Finances in Eden
Median Income by Occupancy in Eden
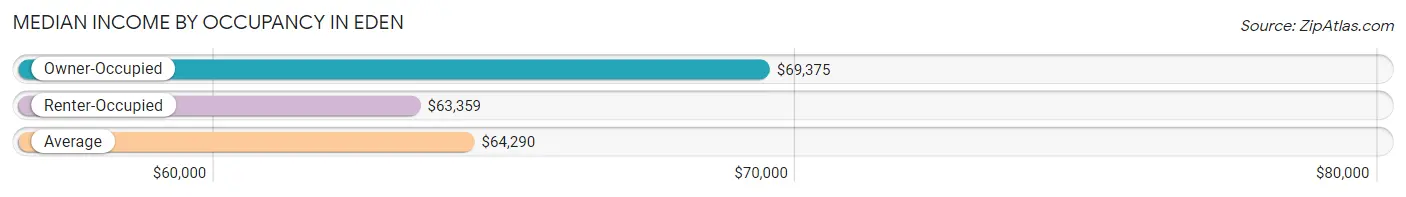
| Occupancy Type | # Households | Median Income |
| Owner-Occupied | 227 (69.0%) | $69,375 |
| Renter-Occupied | 102 (31.0%) | $63,359 |
| Average | 329 (100.0%) | $64,290 |
Occupancy by Householder Income Bracket in Eden
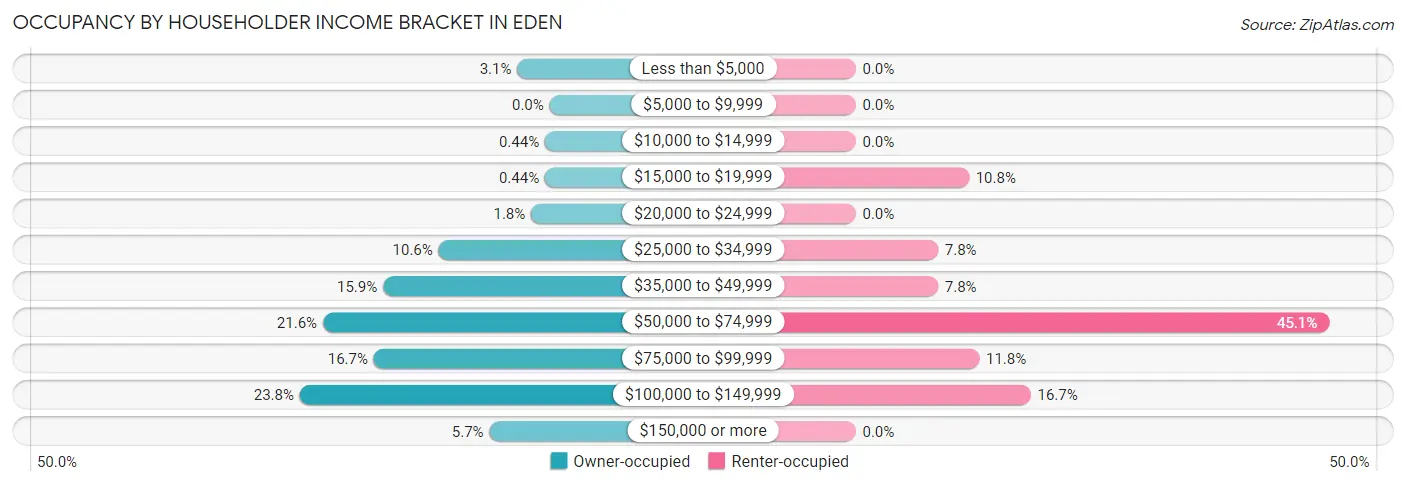
| Income Bracket | Owner-occupied | Renter-occupied |
| Less than $5,000 | 7 (3.1%) | 0 (0.0%) |
| $5,000 to $9,999 | 0 (0.0%) | 0 (0.0%) |
| $10,000 to $14,999 | 1 (0.4%) | 0 (0.0%) |
| $15,000 to $19,999 | 1 (0.4%) | 11 (10.8%) |
| $20,000 to $24,999 | 4 (1.8%) | 0 (0.0%) |
| $25,000 to $34,999 | 24 (10.6%) | 8 (7.8%) |
| $35,000 to $49,999 | 36 (15.9%) | 8 (7.8%) |
| $50,000 to $74,999 | 49 (21.6%) | 46 (45.1%) |
| $75,000 to $99,999 | 38 (16.7%) | 12 (11.8%) |
| $100,000 to $149,999 | 54 (23.8%) | 17 (16.7%) |
| $150,000 or more | 13 (5.7%) | 0 (0.0%) |
| Total | 227 (100.0%) | 102 (100.0%) |
Monthly Housing Cost Tiers in Eden
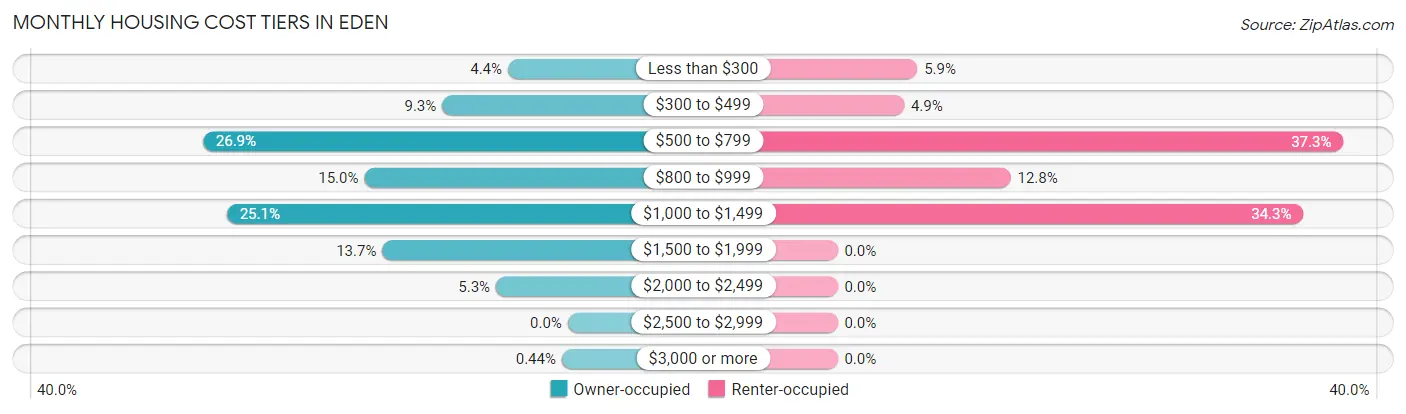
| Monthly Cost | Owner-occupied | Renter-occupied |
| Less than $300 | 10 (4.4%) | 6 (5.9%) |
| $300 to $499 | 21 (9.2%) | 5 (4.9%) |
| $500 to $799 | 61 (26.9%) | 38 (37.2%) |
| $800 to $999 | 34 (15.0%) | 13 (12.8%) |
| $1,000 to $1,499 | 57 (25.1%) | 35 (34.3%) |
| $1,500 to $1,999 | 31 (13.7%) | 0 (0.0%) |
| $2,000 to $2,499 | 12 (5.3%) | 0 (0.0%) |
| $2,500 to $2,999 | 0 (0.0%) | 0 (0.0%) |
| $3,000 or more | 1 (0.4%) | 0 (0.0%) |
| Total | 227 (100.0%) | 102 (100.0%) |
Physical Housing Characteristics in Eden
Housing Structures in Eden
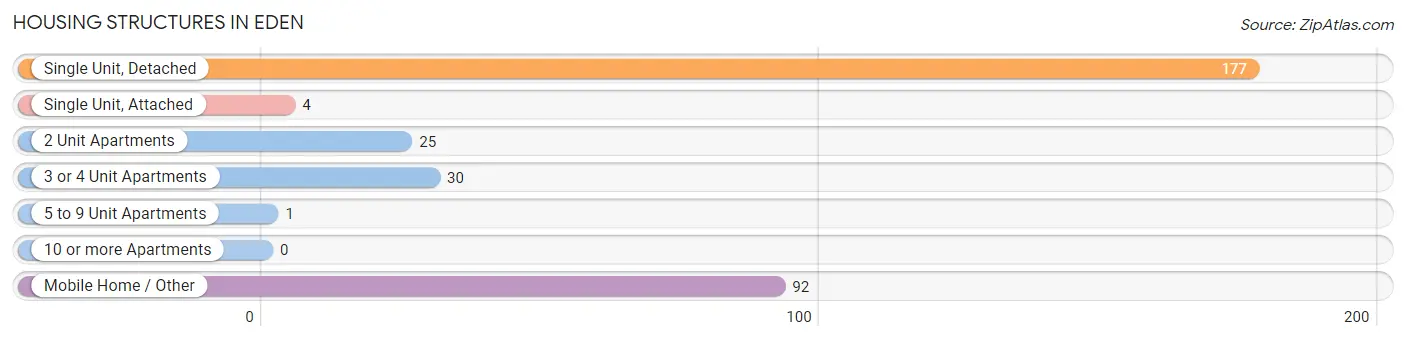
| Structure Type | # Housing Units | % Housing Units |
| Single Unit, Detached | 177 | 53.8% |
| Single Unit, Attached | 4 | 1.2% |
| 2 Unit Apartments | 25 | 7.6% |
| 3 or 4 Unit Apartments | 30 | 9.1% |
| 5 to 9 Unit Apartments | 1 | 0.3% |
| 10 or more Apartments | 0 | 0.0% |
| Mobile Home / Other | 92 | 28.0% |
| Total | 329 | 100.0% |
Housing Structures by Occupancy in Eden
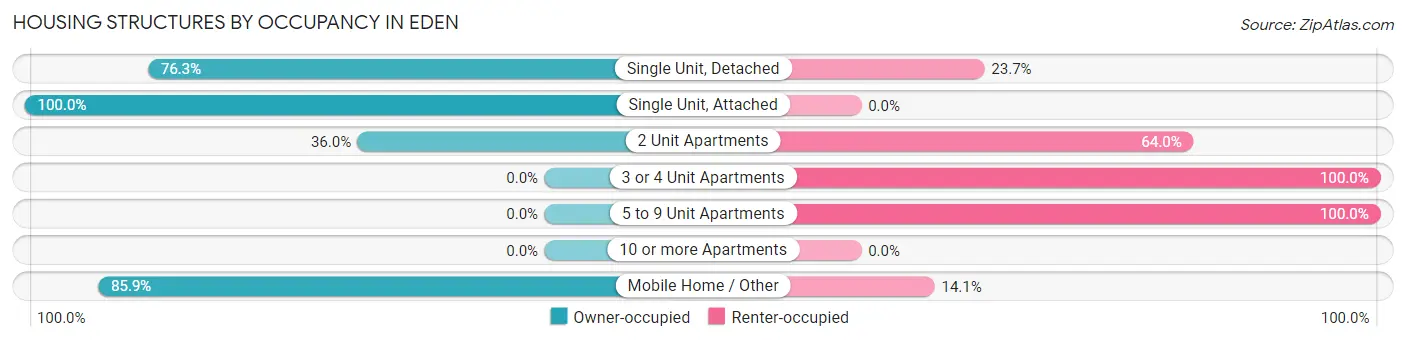
| Structure Type | Owner-occupied | Renter-occupied |
| Single Unit, Detached | 135 (76.3%) | 42 (23.7%) |
| Single Unit, Attached | 4 (100.0%) | 0 (0.0%) |
| 2 Unit Apartments | 9 (36.0%) | 16 (64.0%) |
| 3 or 4 Unit Apartments | 0 (0.0%) | 30 (100.0%) |
| 5 to 9 Unit Apartments | 0 (0.0%) | 1 (100.0%) |
| 10 or more Apartments | 0 (0.0%) | 0 (0.0%) |
| Mobile Home / Other | 79 (85.9%) | 13 (14.1%) |
| Total | 227 (69.0%) | 102 (31.0%) |
Housing Structures by Number of Rooms in Eden
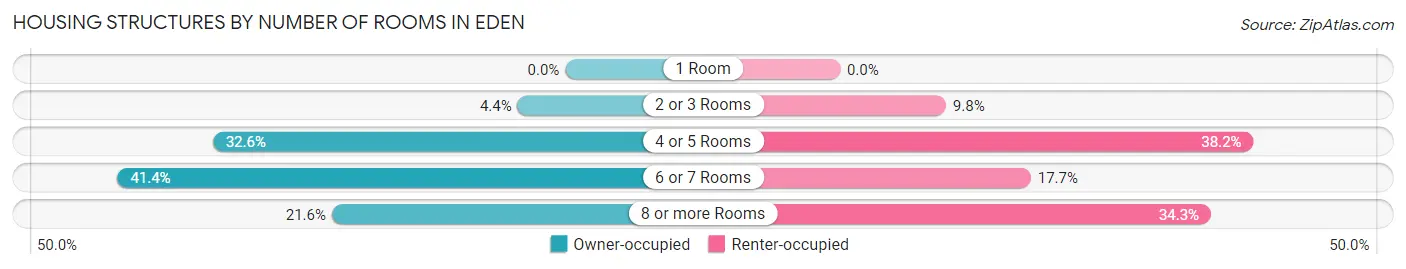
| Number of Rooms | Owner-occupied | Renter-occupied |
| 1 Room | 0 (0.0%) | 0 (0.0%) |
| 2 or 3 Rooms | 10 (4.4%) | 10 (9.8%) |
| 4 or 5 Rooms | 74 (32.6%) | 39 (38.2%) |
| 6 or 7 Rooms | 94 (41.4%) | 18 (17.6%) |
| 8 or more Rooms | 49 (21.6%) | 35 (34.3%) |
| Total | 227 (100.0%) | 102 (100.0%) |
Housing Structure by Heating Type in Eden
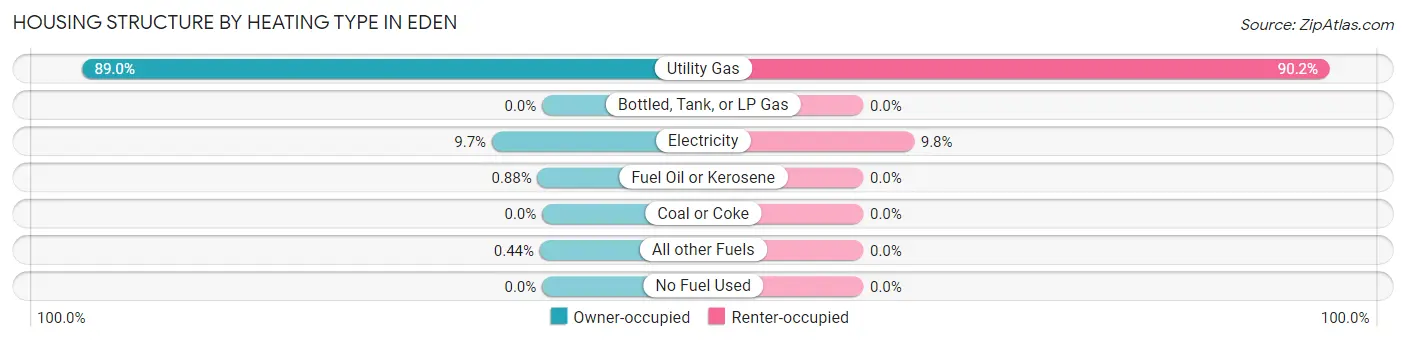
| Heating Type | Owner-occupied | Renter-occupied |
| Utility Gas | 202 (89.0%) | 92 (90.2%) |
| Bottled, Tank, or LP Gas | 0 (0.0%) | 0 (0.0%) |
| Electricity | 22 (9.7%) | 10 (9.8%) |
| Fuel Oil or Kerosene | 2 (0.9%) | 0 (0.0%) |
| Coal or Coke | 0 (0.0%) | 0 (0.0%) |
| All other Fuels | 1 (0.4%) | 0 (0.0%) |
| No Fuel Used | 0 (0.0%) | 0 (0.0%) |
| Total | 227 (100.0%) | 102 (100.0%) |
Household Vehicle Usage in Eden
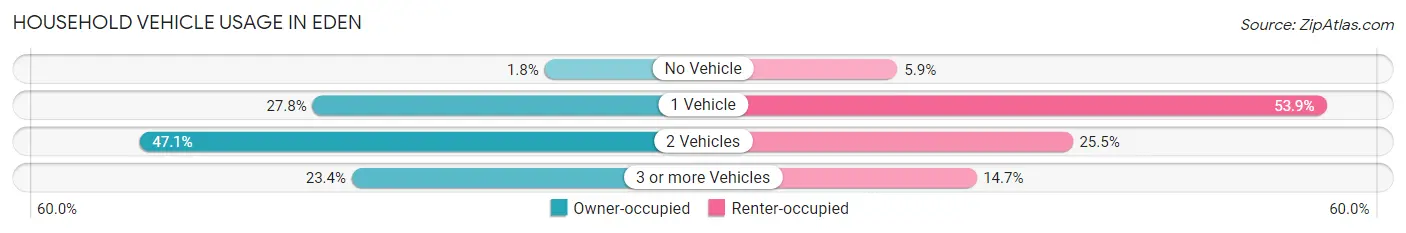
| Vehicles per Household | Owner-occupied | Renter-occupied |
| No Vehicle | 4 (1.8%) | 6 (5.9%) |
| 1 Vehicle | 63 (27.8%) | 55 (53.9%) |
| 2 Vehicles | 107 (47.1%) | 26 (25.5%) |
| 3 or more Vehicles | 53 (23.4%) | 15 (14.7%) |
| Total | 227 (100.0%) | 102 (100.0%) |
Real Estate & Mortgages in Eden
Real Estate and Mortgage Overview in Eden
| Characteristic | Without Mortgage | With Mortgage |
| Housing Units | 104 | 123 |
| Median Property Value | $39,000 | $181,900 |
| Median Household Income | $56,250 | $8 |
| Monthly Housing Costs | $600 | $0 |
| Real Estate Taxes | $2,017 | $17 |
Property Value by Mortgage Status in Eden
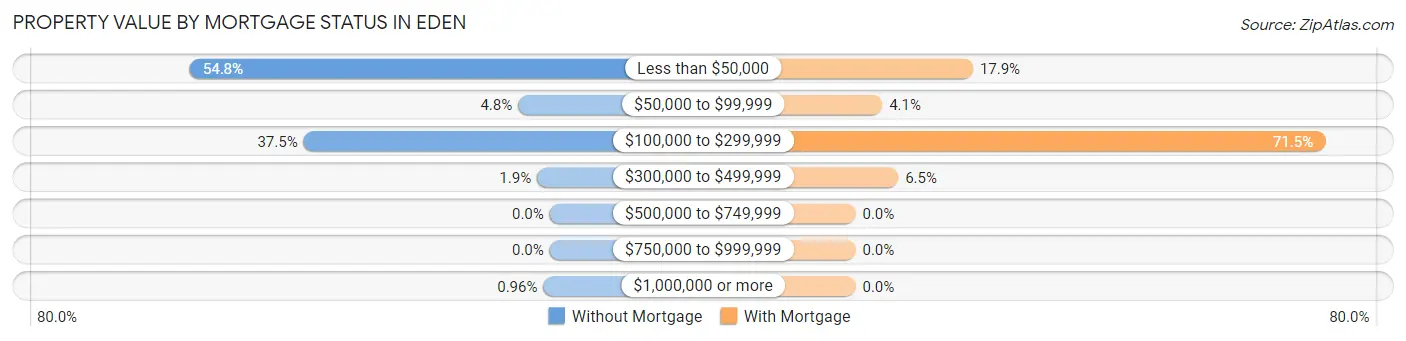
| Property Value | Without Mortgage | With Mortgage |
| Less than $50,000 | 57 (54.8%) | 22 (17.9%) |
| $50,000 to $99,999 | 5 (4.8%) | 5 (4.1%) |
| $100,000 to $299,999 | 39 (37.5%) | 88 (71.5%) |
| $300,000 to $499,999 | 2 (1.9%) | 8 (6.5%) |
| $500,000 to $749,999 | 0 (0.0%) | 0 (0.0%) |
| $750,000 to $999,999 | 0 (0.0%) | 0 (0.0%) |
| $1,000,000 or more | 1 (1.0%) | 0 (0.0%) |
| Total | 104 (100.0%) | 123 (100.0%) |
Household Income by Mortgage Status in Eden
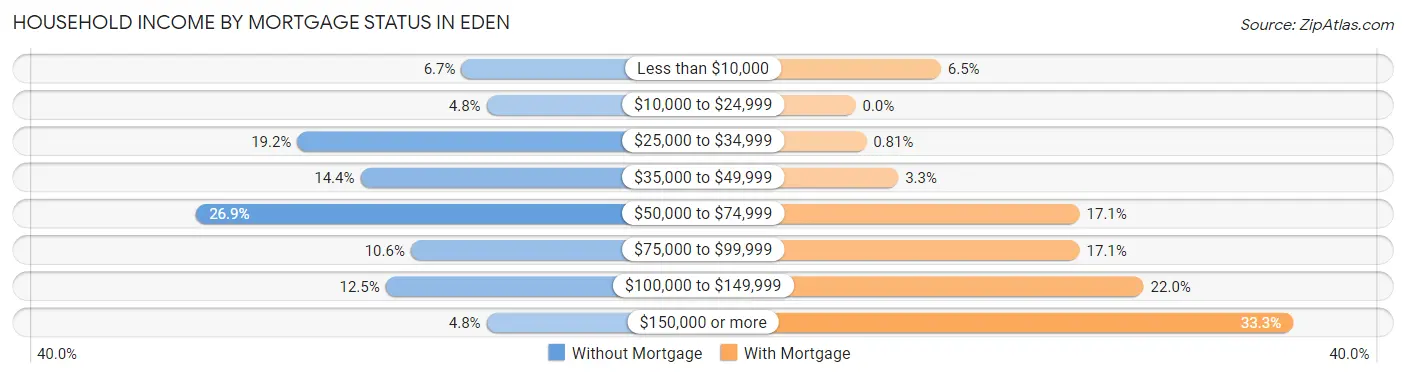
| Household Income | Without Mortgage | With Mortgage |
| Less than $10,000 | 7 (6.7%) | 8 (6.5%) |
| $10,000 to $24,999 | 5 (4.8%) | 0 (0.0%) |
| $25,000 to $34,999 | 20 (19.2%) | 1 (0.8%) |
| $35,000 to $49,999 | 15 (14.4%) | 4 (3.3%) |
| $50,000 to $74,999 | 28 (26.9%) | 21 (17.1%) |
| $75,000 to $99,999 | 11 (10.6%) | 21 (17.1%) |
| $100,000 to $149,999 | 13 (12.5%) | 27 (22.0%) |
| $150,000 or more | 5 (4.8%) | 41 (33.3%) |
| Total | 104 (100.0%) | 123 (100.0%) |
Property Value to Household Income Ratio in Eden
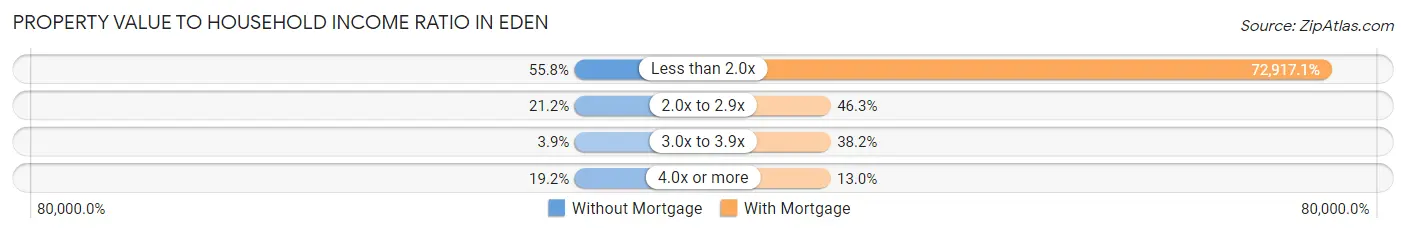
| Value-to-Income Ratio | Without Mortgage | With Mortgage |
| Less than 2.0x | 58 (55.8%) | 89,688 (72,917.1%) |
| 2.0x to 2.9x | 22 (21.1%) | 57 (46.3%) |
| 3.0x to 3.9x | 4 (3.8%) | 47 (38.2%) |
| 4.0x or more | 20 (19.2%) | 16 (13.0%) |
| Total | 104 (100.0%) | 123 (100.0%) |
Real Estate Taxes by Mortgage Status in Eden
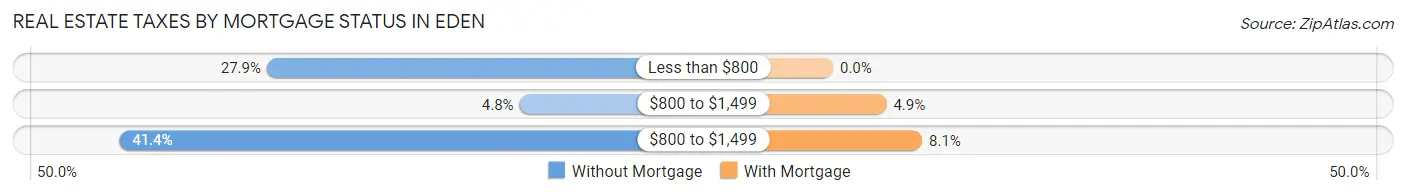
| Property Taxes | Without Mortgage | With Mortgage |
| Less than $800 | 29 (27.9%) | 0 (0.0%) |
| $800 to $1,499 | 5 (4.8%) | 6 (4.9%) |
| $800 to $1,499 | 43 (41.3%) | 10 (8.1%) |
| Total | 104 (100.0%) | 123 (100.0%) |
Health & Disability in Eden
Health Insurance Coverage by Age in Eden
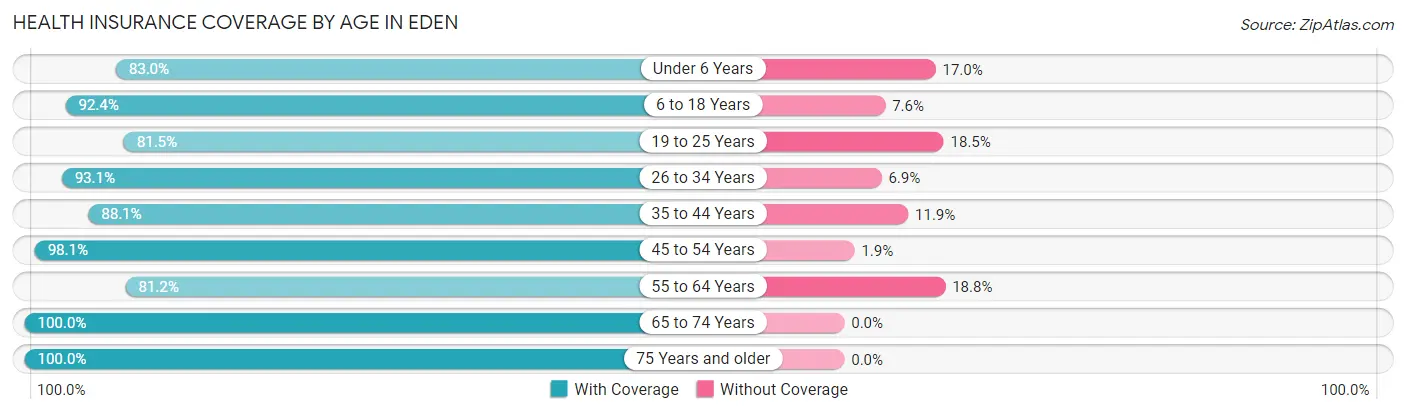
| Age Bracket | With Coverage | Without Coverage |
| Under 6 Years | 39 (83.0%) | 8 (17.0%) |
| 6 to 18 Years | 109 (92.4%) | 9 (7.6%) |
| 19 to 25 Years | 44 (81.5%) | 10 (18.5%) |
| 26 to 34 Years | 94 (93.1%) | 7 (6.9%) |
| 35 to 44 Years | 74 (88.1%) | 10 (11.9%) |
| 45 to 54 Years | 103 (98.1%) | 2 (1.9%) |
| 55 to 64 Years | 69 (81.2%) | 16 (18.8%) |
| 65 to 74 Years | 85 (100.0%) | 0 (0.0%) |
| 75 Years and older | 47 (100.0%) | 0 (0.0%) |
| Total | 664 (91.5%) | 62 (8.5%) |
Health Insurance Coverage by Citizenship Status in Eden
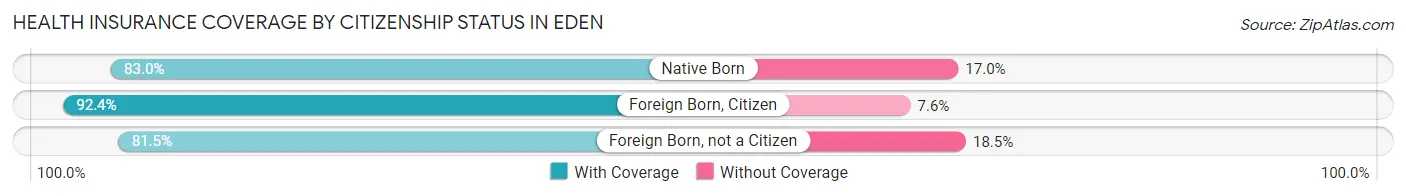
| Citizenship Status | With Coverage | Without Coverage |
| Native Born | 39 (83.0%) | 8 (17.0%) |
| Foreign Born, Citizen | 109 (92.4%) | 9 (7.6%) |
| Foreign Born, not a Citizen | 44 (81.5%) | 10 (18.5%) |
Health Insurance Coverage by Household Income in Eden
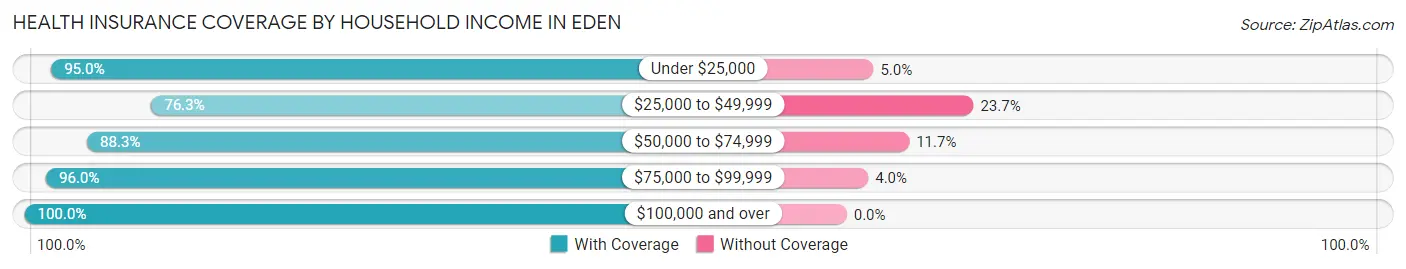
| Household Income | With Coverage | Without Coverage |
| Under $25,000 | 38 (95.0%) | 2 (5.0%) |
| $25,000 to $49,999 | 106 (76.3%) | 33 (23.7%) |
| $50,000 to $74,999 | 166 (88.3%) | 22 (11.7%) |
| $75,000 to $99,999 | 119 (96.0%) | 5 (4.0%) |
| $100,000 and over | 235 (100.0%) | 0 (0.0%) |
Public vs Private Health Insurance Coverage by Age in Eden
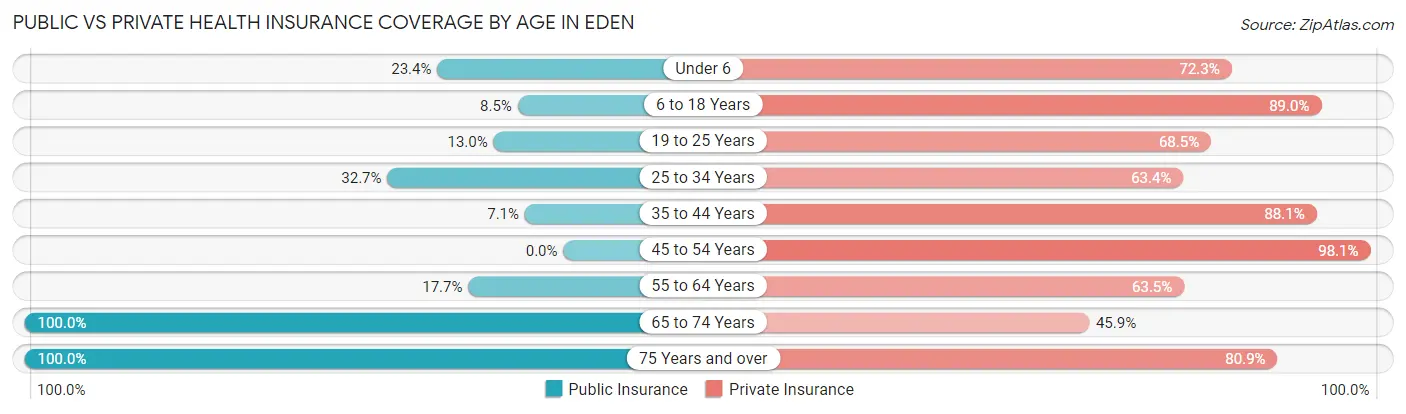
| Age Bracket | Public Insurance | Private Insurance |
| Under 6 | 11 (23.4%) | 34 (72.3%) |
| 6 to 18 Years | 10 (8.5%) | 105 (89.0%) |
| 19 to 25 Years | 7 (13.0%) | 37 (68.5%) |
| 25 to 34 Years | 33 (32.7%) | 64 (63.4%) |
| 35 to 44 Years | 6 (7.1%) | 74 (88.1%) |
| 45 to 54 Years | 0 (0.0%) | 103 (98.1%) |
| 55 to 64 Years | 15 (17.6%) | 54 (63.5%) |
| 65 to 74 Years | 85 (100.0%) | 39 (45.9%) |
| 75 Years and over | 47 (100.0%) | 38 (80.8%) |
| Total | 214 (29.5%) | 548 (75.5%) |
Disability Status by Sex by Age in Eden
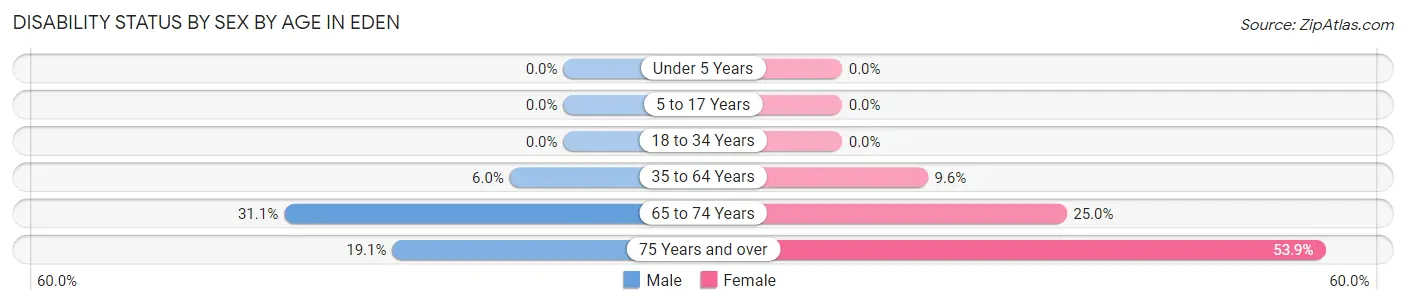
| Age Bracket | Male | Female |
| Under 5 Years | 0 (0.0%) | 0 (0.0%) |
| 5 to 17 Years | 0 (0.0%) | 0 (0.0%) |
| 18 to 34 Years | 0 (0.0%) | 0 (0.0%) |
| 35 to 64 Years | 7 (6.0%) | 15 (9.6%) |
| 65 to 74 Years | 14 (31.1%) | 10 (25.0%) |
| 75 Years and over | 4 (19.1%) | 14 (53.8%) |
Disability Class by Sex by Age in Eden
Disability Class: Hearing Difficulty
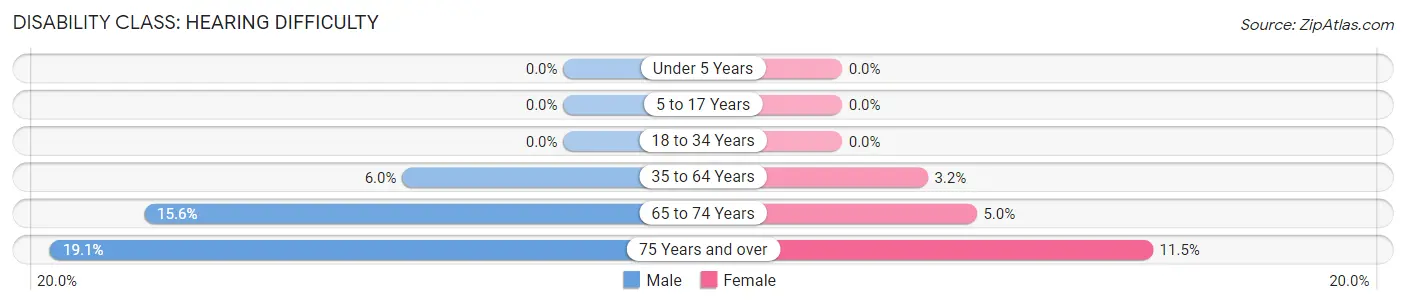
| Age Bracket | Male | Female |
| Under 5 Years | 0 (0.0%) | 0 (0.0%) |
| 5 to 17 Years | 0 (0.0%) | 0 (0.0%) |
| 18 to 34 Years | 0 (0.0%) | 0 (0.0%) |
| 35 to 64 Years | 7 (6.0%) | 5 (3.2%) |
| 65 to 74 Years | 7 (15.6%) | 2 (5.0%) |
| 75 Years and over | 4 (19.1%) | 3 (11.5%) |
Disability Class: Vision Difficulty
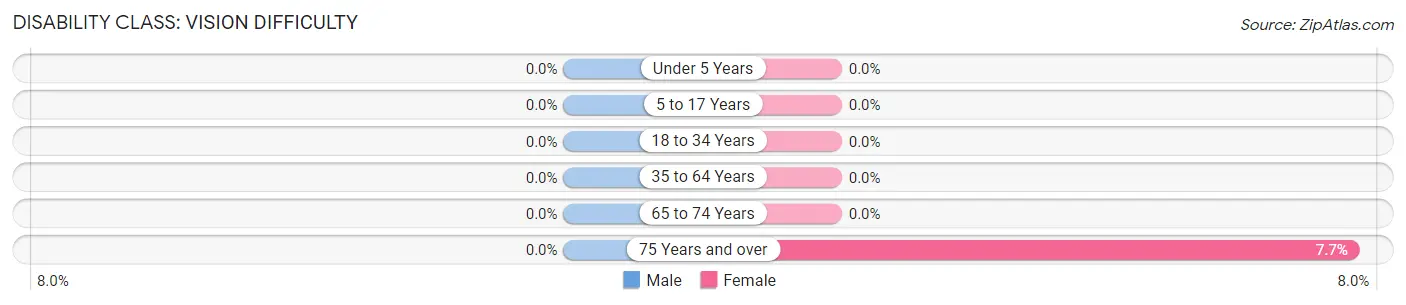
| Age Bracket | Male | Female |
| Under 5 Years | 0 (0.0%) | 0 (0.0%) |
| 5 to 17 Years | 0 (0.0%) | 0 (0.0%) |
| 18 to 34 Years | 0 (0.0%) | 0 (0.0%) |
| 35 to 64 Years | 0 (0.0%) | 0 (0.0%) |
| 65 to 74 Years | 0 (0.0%) | 0 (0.0%) |
| 75 Years and over | 0 (0.0%) | 2 (7.7%) |
Disability Class: Cognitive Difficulty
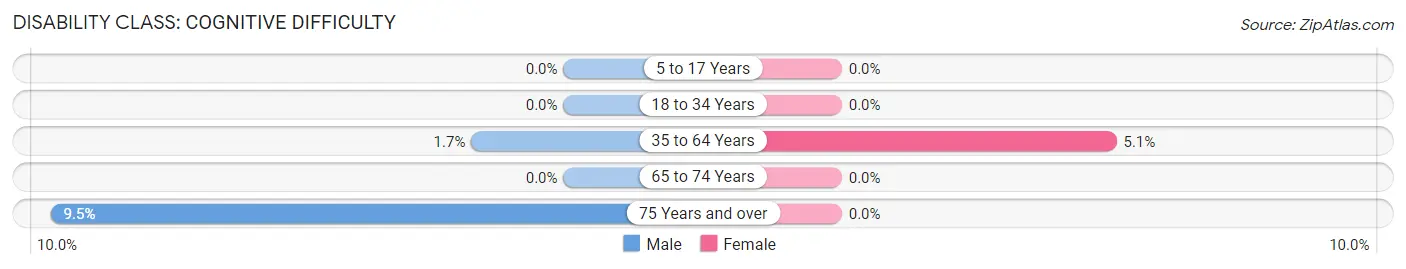
| Age Bracket | Male | Female |
| 5 to 17 Years | 0 (0.0%) | 0 (0.0%) |
| 18 to 34 Years | 0 (0.0%) | 0 (0.0%) |
| 35 to 64 Years | 2 (1.7%) | 8 (5.1%) |
| 65 to 74 Years | 0 (0.0%) | 0 (0.0%) |
| 75 Years and over | 2 (9.5%) | 0 (0.0%) |
Disability Class: Ambulatory Difficulty
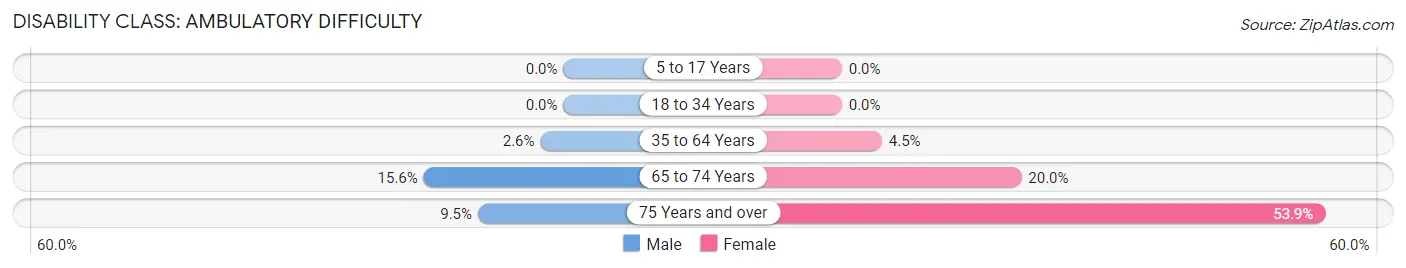
| Age Bracket | Male | Female |
| 5 to 17 Years | 0 (0.0%) | 0 (0.0%) |
| 18 to 34 Years | 0 (0.0%) | 0 (0.0%) |
| 35 to 64 Years | 3 (2.6%) | 7 (4.5%) |
| 65 to 74 Years | 7 (15.6%) | 8 (20.0%) |
| 75 Years and over | 2 (9.5%) | 14 (53.8%) |
Disability Class: Self-Care Difficulty
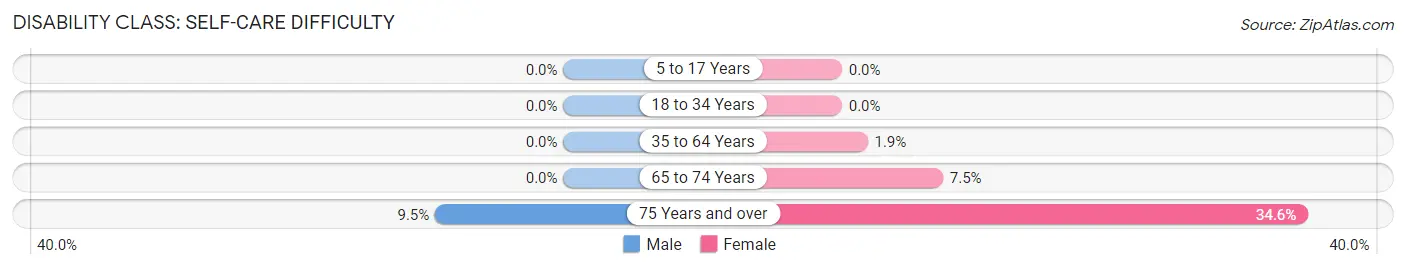
| Age Bracket | Male | Female |
| 5 to 17 Years | 0 (0.0%) | 0 (0.0%) |
| 18 to 34 Years | 0 (0.0%) | 0 (0.0%) |
| 35 to 64 Years | 0 (0.0%) | 3 (1.9%) |
| 65 to 74 Years | 0 (0.0%) | 3 (7.5%) |
| 75 Years and over | 2 (9.5%) | 9 (34.6%) |
Technology Access in Eden
Computing Device Access in Eden
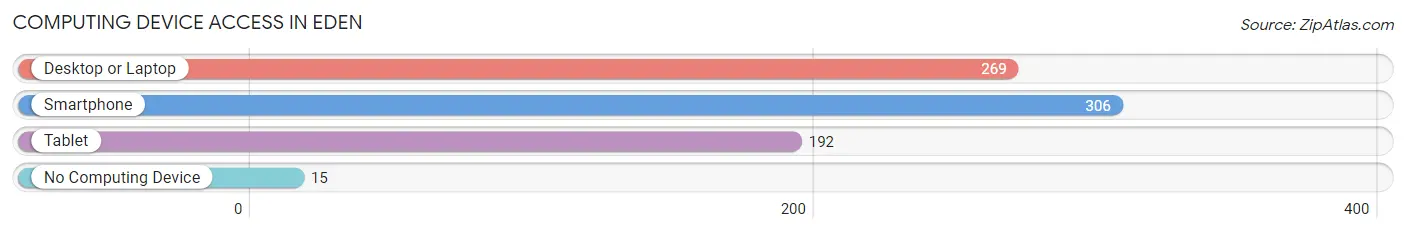
| Device Type | # Households | % Households |
| Desktop or Laptop | 269 | 81.8% |
| Smartphone | 306 | 93.0% |
| Tablet | 192 | 58.4% |
| No Computing Device | 15 | 4.6% |
| Total | 329 | 100.0% |
Internet Access in Eden
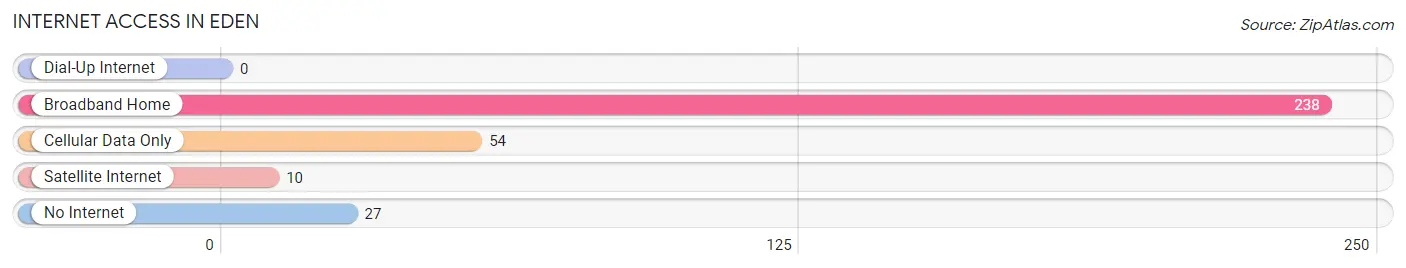
| Internet Type | # Households | % Households |
| Dial-Up Internet | 0 | 0.0% |
| Broadband Home | 238 | 72.3% |
| Cellular Data Only | 54 | 16.4% |
| Satellite Internet | 10 | 3.0% |
| No Internet | 27 | 8.2% |
| Total | 329 | 100.0% |
Eden Summary
Eden, Wisconsin is a small village located in Fond du Lac County, Wisconsin. It is situated on the western shore of Lake Winnebago, approximately 25 miles southwest of the city of Fond du Lac. The village has a population of 1,845 people, according to the 2010 census.
Geography
Eden is located in the Central Sands region of Wisconsin, which is characterized by sandy soils and rolling hills. The village is situated on the western shore of Lake Winnebago, the largest lake in Wisconsin. The lake is approximately 25 miles long and 10 miles wide, and is a popular destination for fishing, boating, and other recreational activities. The village is also located near the Horicon Marsh, a large wetland area that is home to a variety of wildlife.
The village of Eden is located in the Town of Eden, which is bordered by the towns of Oakfield, Brandon, and Taycheedah. The village is located at the intersection of State Highways 45 and 49.
History
The area that is now the village of Eden was first settled in the early 1800s by German immigrants. The village was originally known as “Edenburg”, and was officially incorporated in 1876. The village was named after the biblical Garden of Eden.
The village grew slowly over the years, and by the early 1900s had a population of around 500 people. The village was primarily an agricultural community, and the main crops grown were wheat, oats, and corn.
In the 1950s, the village began to experience a period of growth and development. The village was connected to the nearby city of Fond du Lac by a new highway, and the village began to attract new businesses and residents.
Economy
The economy of Eden is largely based on agriculture and tourism. The village is home to several farms, which produce a variety of crops, including corn, soybeans, and wheat. The village is also home to several wineries, which produce a variety of wines.
The village is also a popular tourist destination, due to its proximity to Lake Winnebago and the Horicon Marsh. The village is home to several restaurants, hotels, and other tourist attractions.
Demographics
As of the 2010 census, the village of Eden had a population of 1,845 people. The racial makeup of the village was 97.3% White, 0.7% African American, 0.3% Native American, 0.3% Asian, 0.2% from other races, and 1.2% from two or more races. Hispanic or Latino of any race were 1.2% of the population.
The median household income in the village was $50,938, and the median family income was $60,938. The per capita income for the village was $24,938. About 4.3% of families and 5.3% of the population were below the poverty line, including 6.3% of those under age 18 and 4.3% of those age 65 or over.
Common Questions
What is Per Capita Income in Eden?
Per Capita income in Eden is $34,375.
What is the Median Family Income in Eden?
Median Family Income in Eden is $69,167.
What is the Median Household income in Eden?
Median Household Income in Eden is $64,290.
What is Income or Wage Gap in Eden?
Income or Wage Gap in Eden is 20.8%.
Women in Eden earn 79.2 cents for every dollar earned by a man.
What is Family Income Deficit in Eden?
Family Income Deficit in Eden is $5,818.
Families that are below poverty line in Eden earn $5,818 less on average than the poverty threshold level.
What is Inequality or Gini Index in Eden?
Inequality or Gini Index in Eden is 0.32.
What is the Total Population of Eden?
Total Population of Eden is 726.
What is the Total Male Population of Eden?
Total Male Population of Eden is 337.
What is the Total Female Population of Eden?
Total Female Population of Eden is 389.
What is the Ratio of Males per 100 Females in Eden?
There are 86.63 Males per 100 Females in Eden.
What is the Ratio of Females per 100 Males in Eden?
There are 115.43 Females per 100 Males in Eden.
What is the Median Population Age in Eden?
Median Population Age in Eden is 40.1 Years.
What is the Average Family Size in Eden
Average Family Size in Eden is 2.6 People.
What is the Average Household Size in Eden
Average Household Size in Eden is 2.2 People.
How Large is the Labor Force in Eden?
There are 438 People in the Labor Forcein in Eden.
What is the Percentage of People in the Labor Force in Eden?
76.0% of People are in the Labor Force in Eden.
What is the Unemployment Rate in Eden?
Unemployment Rate in Eden is 5.5%.