East Troy, WI Map & Demographics
East Troy Map
East Troy Overview
$42,350
PER CAPITA INCOME
$93,269
AVG FAMILY INCOME
$79,504
AVG HOUSEHOLD INCOME
37.5%
WAGE / INCOME GAP [ % ]
62.5¢/ $1
WAGE / INCOME GAP [ $ ]
0.39
INEQUALITY / GINI INDEX
4,669
TOTAL POPULATION
2,330
MALE POPULATION
2,339
FEMALE POPULATION
99.62
MALES / 100 FEMALES
100.39
FEMALES / 100 MALES
38.7
MEDIAN AGE
2.7
AVG FAMILY SIZE
2.2
AVG HOUSEHOLD SIZE
2,671
LABOR FORCE [ PEOPLE ]
70.0%
PERCENT IN LABOR FORCE
2.0%
UNEMPLOYMENT RATE
East Troy Zip Codes
East Troy Area Codes
Income in East Troy
Income Overview in East Troy
Per Capita Income in East Troy is $42,350, while median incomes of families and households are $93,269 and $79,504 respectively.
| Characteristic | Number | Measure |
| Per Capita Income | 4,669 | $42,350 |
| Median Family Income | 1,304 | $93,269 |
| Mean Family Income | 1,304 | $109,188 |
| Median Household Income | 2,055 | $79,504 |
| Mean Household Income | 2,055 | $96,059 |
| Income Deficit | 1,304 | $0 |
| Wage / Income Gap (%) | 4,669 | 37.52% |
| Wage / Income Gap ($) | 4,669 | 62.48¢ per $1 |
| Gini / Inequality Index | 4,669 | 0.39 |
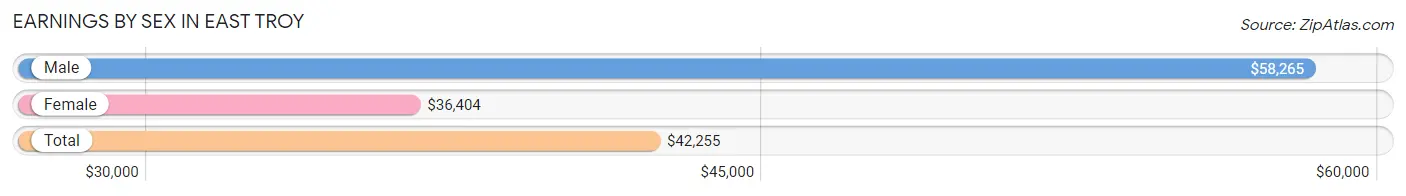
Earnings by Sex in East Troy
Average Earnings in East Troy are $42,255, $58,265 for men and $36,404 for women, a difference of 37.5%.
| Sex | Number | Average Earnings |
| Male | 1,517 (53.0%) | $58,265 |
| Female | 1,347 (47.0%) | $36,404 |
| Total | 2,864 (100.0%) | $42,255 |
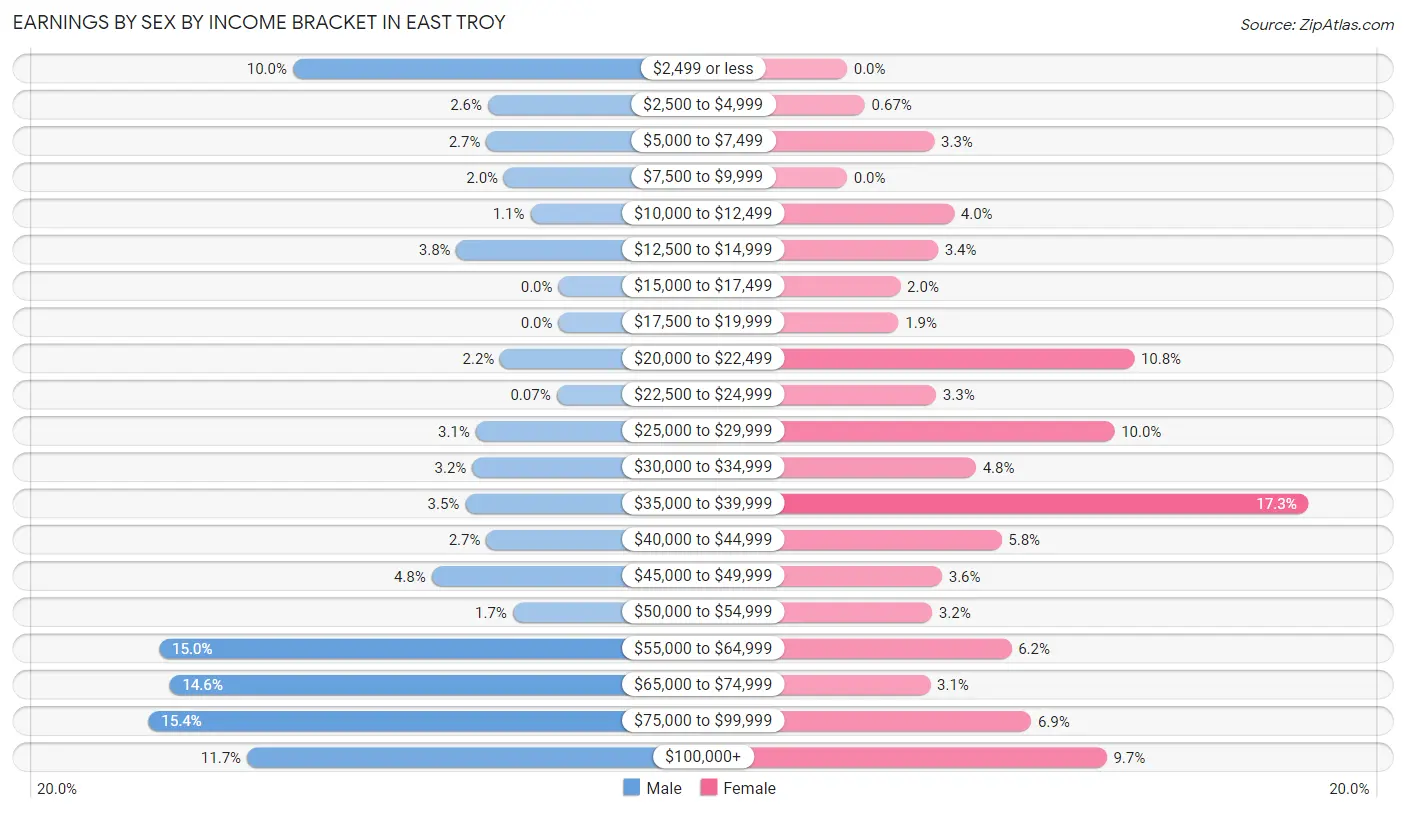
Earnings by Sex by Income Bracket in East Troy
The most common earnings brackets in East Troy are $75,000 to $99,999 for men (233 | 15.4%) and $35,000 to $39,999 for women (233 | 17.3%).
| Income | Male | Female |
| $2,499 or less | 151 (10.0%) | 0 (0.0%) |
| $2,500 to $4,999 | 40 (2.6%) | 9 (0.7%) |
| $5,000 to $7,499 | 41 (2.7%) | 44 (3.3%) |
| $7,500 to $9,999 | 31 (2.0%) | 0 (0.0%) |
| $10,000 to $12,499 | 16 (1.1%) | 54 (4.0%) |
| $12,500 to $14,999 | 58 (3.8%) | 46 (3.4%) |
| $15,000 to $17,499 | 0 (0.0%) | 27 (2.0%) |
| $17,500 to $19,999 | 0 (0.0%) | 26 (1.9%) |
| $20,000 to $22,499 | 33 (2.2%) | 145 (10.8%) |
| $22,500 to $24,999 | 1 (0.1%) | 45 (3.3%) |
| $25,000 to $29,999 | 47 (3.1%) | 135 (10.0%) |
| $30,000 to $34,999 | 49 (3.2%) | 65 (4.8%) |
| $35,000 to $39,999 | 53 (3.5%) | 233 (17.3%) |
| $40,000 to $44,999 | 41 (2.7%) | 78 (5.8%) |
| $45,000 to $49,999 | 72 (4.8%) | 48 (3.6%) |
| $50,000 to $54,999 | 26 (1.7%) | 43 (3.2%) |
| $55,000 to $64,999 | 227 (15.0%) | 83 (6.2%) |
| $65,000 to $74,999 | 221 (14.6%) | 42 (3.1%) |
| $75,000 to $99,999 | 233 (15.4%) | 93 (6.9%) |
| $100,000+ | 177 (11.7%) | 131 (9.7%) |
| Total | 1,517 (100.0%) | 1,347 (100.0%) |
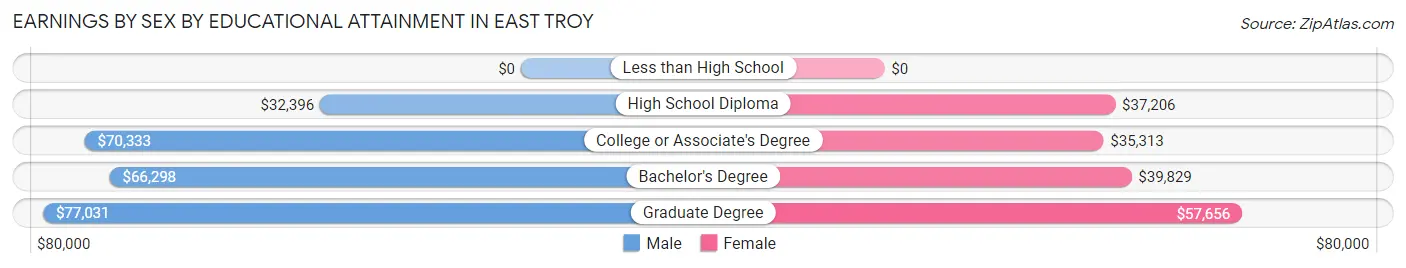
Earnings by Sex by Educational Attainment in East Troy
Average earnings in East Troy are $62,593 for men and $39,961 for women, a difference of 36.2%. Men with an educational attainment of graduate degree enjoy the highest average annual earnings of $77,031, while those with high school diploma education earn the least with $32,396. Women with an educational attainment of graduate degree earn the most with the average annual earnings of $57,656, while those with college or associate's degree education have the smallest earnings of $35,313.
| Educational Attainment | Male Income | Female Income |
| Less than High School | - | - |
| High School Diploma | $32,396 | $37,206 |
| College or Associate's Degree | $70,333 | $35,313 |
| Bachelor's Degree | $66,298 | $39,829 |
| Graduate Degree | $77,031 | $57,656 |
| Total | $62,593 | $39,961 |
Family Income in East Troy
Family Income Brackets in East Troy
According to the East Troy family income data, there are 299 families falling into the $75,000 to $99,999 income range, which is the most common income bracket and makes up 22.9% of all families.
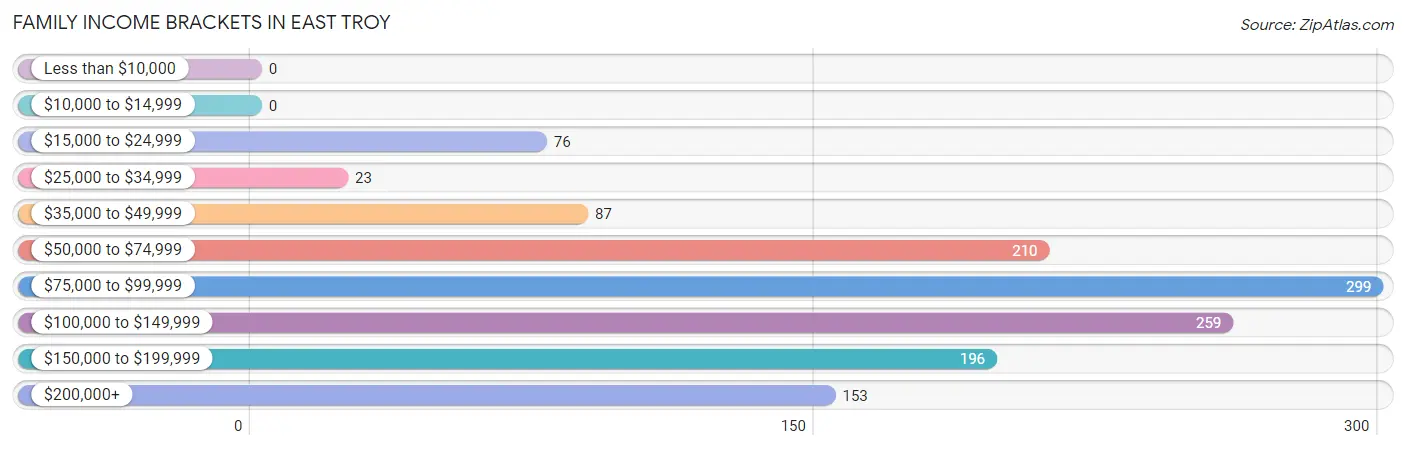
| Income Bracket | # Families | % Families |
| Less than $10,000 | 0 | 0.0% |
| $10,000 to $14,999 | 0 | 0.0% |
| $15,000 to $24,999 | 76 | 5.8% |
| $25,000 to $34,999 | 23 | 1.8% |
| $35,000 to $49,999 | 87 | 6.7% |
| $50,000 to $74,999 | 210 | 16.1% |
| $75,000 to $99,999 | 299 | 22.9% |
| $100,000 to $149,999 | 259 | 19.9% |
| $150,000 to $199,999 | 196 | 15.0% |
| $200,000+ | 153 | 11.7% |
Family Income by Famaliy Size in East Troy
4-person families (250 | 19.2%) account for the highest median family income in East Troy with $160,179 per family, while 2-person families (744 | 57.1%) have the highest median income of $42,310 per family member.
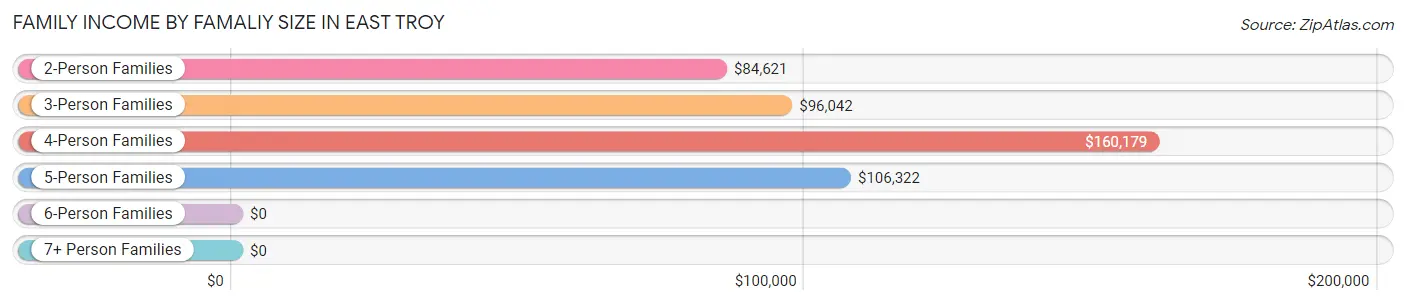
| Income Bracket | # Families | Median Income |
| 2-Person Families | 744 (57.1%) | $84,621 |
| 3-Person Families | 193 (14.8%) | $96,042 |
| 4-Person Families | 250 (19.2%) | $160,179 |
| 5-Person Families | 117 (9.0%) | $106,322 |
| 6-Person Families | 0 (0.0%) | $0 |
| 7+ Person Families | 0 (0.0%) | $0 |
| Total | 1,304 (100.0%) | $93,269 |
Family Income by Number of Earners in East Troy
The median family income in East Troy is $93,269, with families comprising 3+ earners (126) having the highest median family income of $168,929, while families with no earners (210) have the lowest median family income of $60,577, accounting for 9.7% and 16.1% of families, respectively.
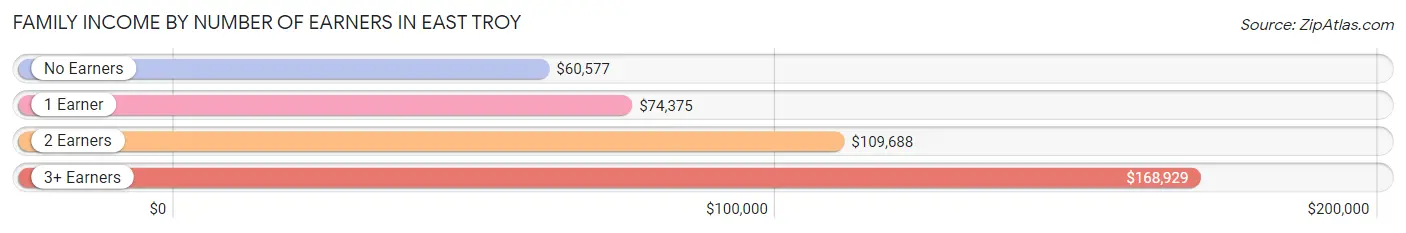
| Number of Earners | # Families | Median Income |
| No Earners | 210 (16.1%) | $60,577 |
| 1 Earner | 247 (18.9%) | $74,375 |
| 2 Earners | 721 (55.3%) | $109,688 |
| 3+ Earners | 126 (9.7%) | $168,929 |
| Total | 1,304 (100.0%) | $93,269 |
Household Income in East Troy
Household Income Brackets in East Troy
With 390 households falling in the category, the $50,000 to $74,999 income range is the most frequent in East Troy, accounting for 19.0% of all households. In contrast, only 25 households (1.2%) fall into the less than $10,000 income bracket, making it the least populous group.
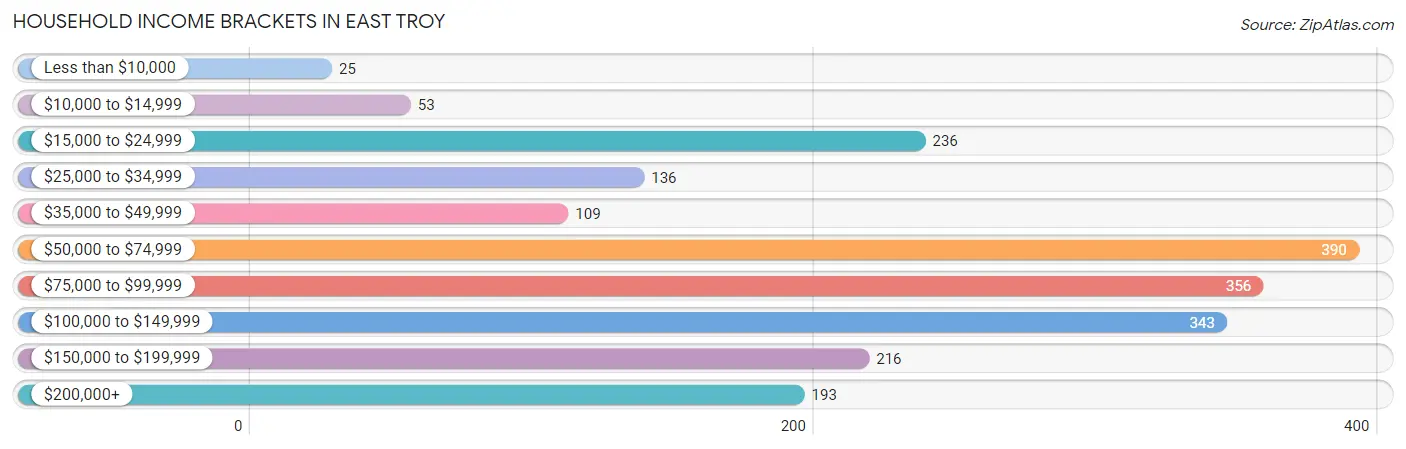
| Income Bracket | # Households | % Households |
| Less than $10,000 | 25 | 1.2% |
| $10,000 to $14,999 | 53 | 2.6% |
| $15,000 to $24,999 | 236 | 11.5% |
| $25,000 to $34,999 | 136 | 6.6% |
| $35,000 to $49,999 | 109 | 5.3% |
| $50,000 to $74,999 | 390 | 19.0% |
| $75,000 to $99,999 | 356 | 17.3% |
| $100,000 to $149,999 | 343 | 16.7% |
| $150,000 to $199,999 | 216 | 10.5% |
| $200,000+ | 193 | 9.4% |
Household Income by Householder Age in East Troy
The median household income in East Troy is $79,504, with the highest median household income of $108,750 found in the 45 to 64 years age bracket for the primary householder. A total of 797 households (38.8%) fall into this category. Meanwhile, the 65+ years age bracket for the primary householder has the lowest median household income of $53,476, with 528 households (25.7%) in this group.
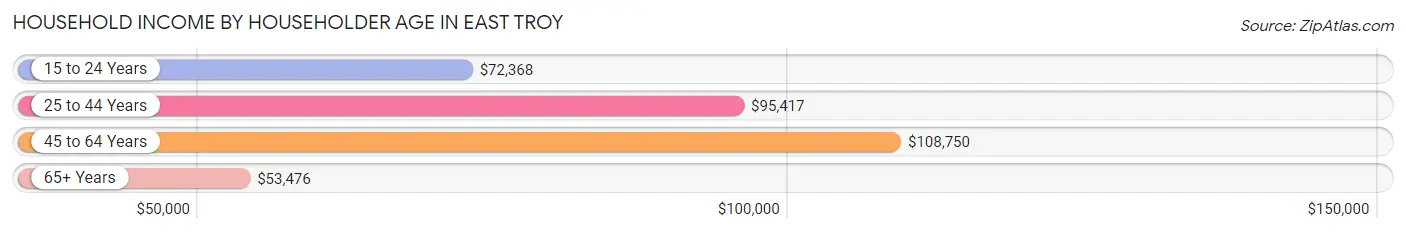
| Income Bracket | # Households | Median Income |
| 15 to 24 Years | 236 (11.5%) | $72,368 |
| 25 to 44 Years | 494 (24.0%) | $95,417 |
| 45 to 64 Years | 797 (38.8%) | $108,750 |
| 65+ Years | 528 (25.7%) | $53,476 |
| Total | 2,055 (100.0%) | $79,504 |
Poverty in East Troy
Income Below Poverty by Sex and Age in East Troy
With 3.7% poverty level for males and 4.2% for females among the residents of East Troy, 12 to 14 year old males and 65 to 74 year old females are the most vulnerable to poverty, with 27 males (52.9%) and 27 females (11.8%) in their respective age groups living below the poverty level.
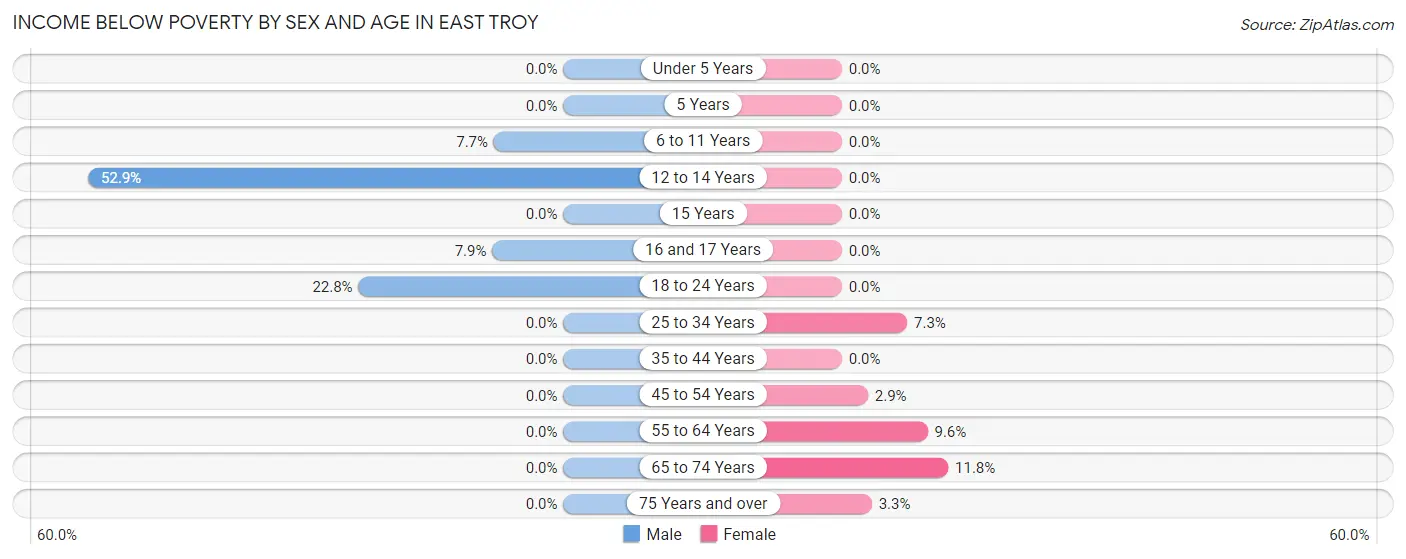
| Age Bracket | Male | Female |
| Under 5 Years | 0 (0.0%) | 0 (0.0%) |
| 5 Years | 0 (0.0%) | 0 (0.0%) |
| 6 to 11 Years | 13 (7.7%) | 0 (0.0%) |
| 12 to 14 Years | 27 (52.9%) | 0 (0.0%) |
| 15 Years | 0 (0.0%) | 0 (0.0%) |
| 16 and 17 Years | 11 (7.9%) | 0 (0.0%) |
| 18 to 24 Years | 34 (22.8%) | 0 (0.0%) |
| 25 to 34 Years | 0 (0.0%) | 16 (7.3%) |
| 35 to 44 Years | 0 (0.0%) | 0 (0.0%) |
| 45 to 54 Years | 0 (0.0%) | 10 (2.9%) |
| 55 to 64 Years | 0 (0.0%) | 38 (9.6%) |
| 65 to 74 Years | 0 (0.0%) | 27 (11.8%) |
| 75 Years and over | 0 (0.0%) | 5 (3.3%) |
| Total | 85 (3.7%) | 96 (4.2%) |
Income Above Poverty by Sex and Age in East Troy
According to the poverty statistics in East Troy, males aged under 5 years and females aged under 5 years are the age groups that are most secure financially, with 100.0% of males and 100.0% of females in these age groups living above the poverty line.
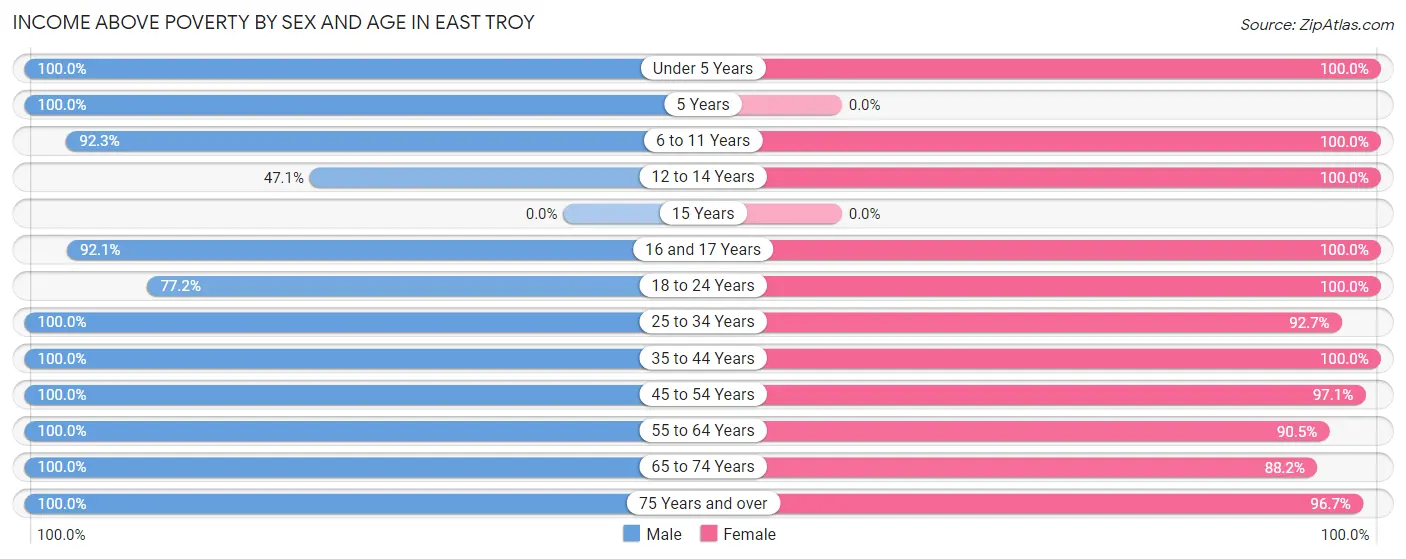
| Age Bracket | Male | Female |
| Under 5 Years | 216 (100.0%) | 61 (100.0%) |
| 5 Years | 9 (100.0%) | 0 (0.0%) |
| 6 to 11 Years | 155 (92.3%) | 146 (100.0%) |
| 12 to 14 Years | 24 (47.1%) | 142 (100.0%) |
| 15 Years | 0 (0.0%) | 0 (0.0%) |
| 16 and 17 Years | 128 (92.1%) | 60 (100.0%) |
| 18 to 24 Years | 115 (77.2%) | 326 (100.0%) |
| 25 to 34 Years | 350 (100.0%) | 204 (92.7%) |
| 35 to 44 Years | 210 (100.0%) | 221 (100.0%) |
| 45 to 54 Years | 420 (100.0%) | 335 (97.1%) |
| 55 to 64 Years | 258 (100.0%) | 360 (90.4%) |
| 65 to 74 Years | 233 (100.0%) | 201 (88.2%) |
| 75 Years and over | 65 (100.0%) | 145 (96.7%) |
| Total | 2,183 (96.3%) | 2,201 (95.8%) |
Income Below Poverty Among Married-Couple Families in East Troy
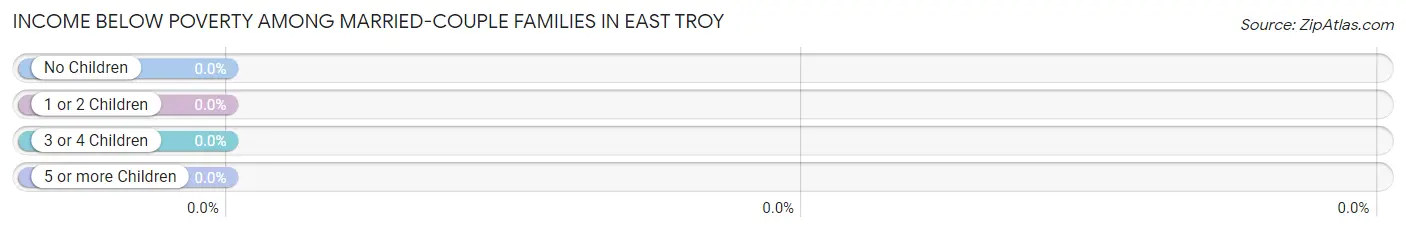
| Children | Above Poverty | Below Poverty |
| No Children | 657 (100.0%) | 0 (0.0%) |
| 1 or 2 Children | 320 (100.0%) | 0 (0.0%) |
| 3 or 4 Children | 97 (100.0%) | 0 (0.0%) |
| 5 or more Children | 0 (0.0%) | 0 (0.0%) |
| Total | 1,074 (100.0%) | 0 (0.0%) |
Income Below Poverty Among Single-Parent Households in East Troy
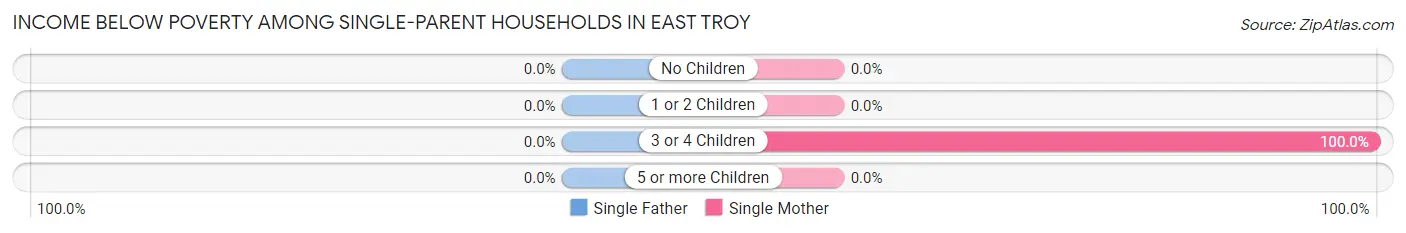
| Children | Single Father | Single Mother |
| No Children | 0 (0.0%) | 0 (0.0%) |
| 1 or 2 Children | 0 (0.0%) | 0 (0.0%) |
| 3 or 4 Children | 0 (0.0%) | 16 (100.0%) |
| 5 or more Children | 0 (0.0%) | 0 (0.0%) |
| Total | 0 (0.0%) | 16 (11.6%) |
Income Below Poverty Among Married-Couple vs Single-Parent Households in East Troy
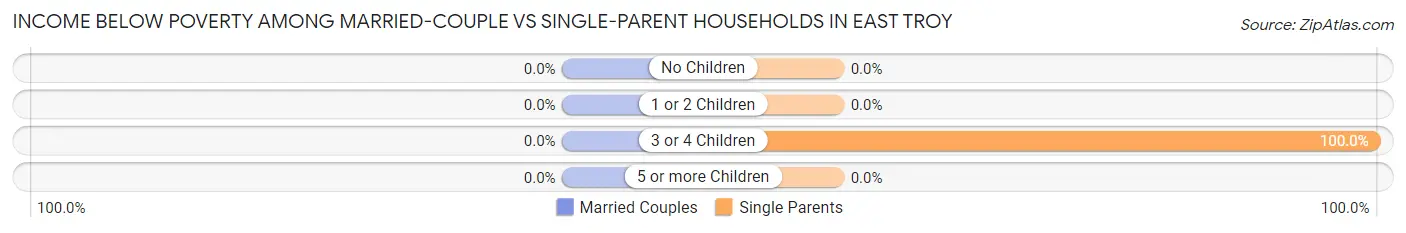
| Children | Married-Couple Families | Single-Parent Households |
| No Children | 0 (0.0%) | 0 (0.0%) |
| 1 or 2 Children | 0 (0.0%) | 0 (0.0%) |
| 3 or 4 Children | 0 (0.0%) | 16 (100.0%) |
| 5 or more Children | 0 (0.0%) | 0 (0.0%) |
| Total | 0 (0.0%) | 16 (7.0%) |
Race in East Troy
The most populous races in East Troy are White / Caucasian (4,519 | 96.8%), Two or more Races (110 | 2.4%), and Hispanic or Latino (41 | 0.9%).
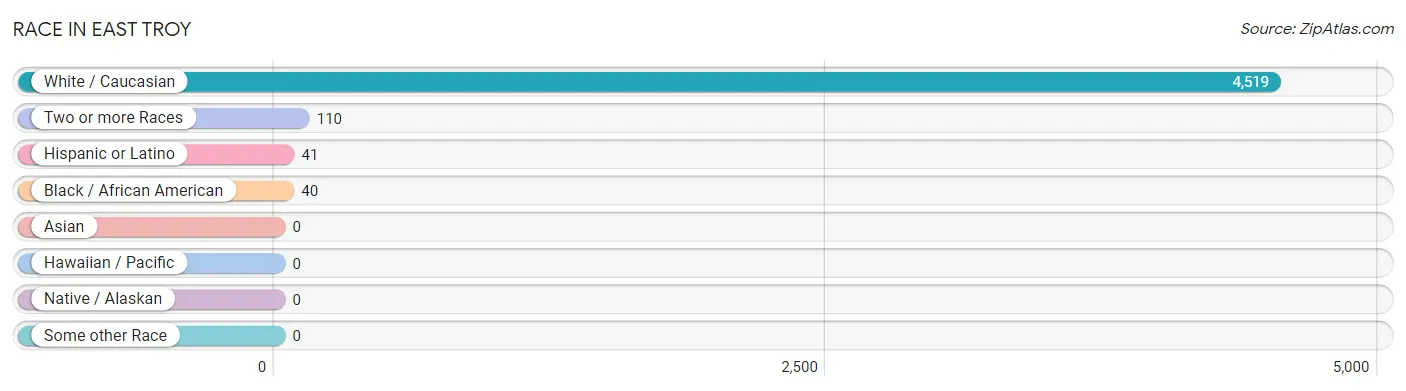
| Race | # Population | % Population |
| Asian | 0 | 0.0% |
| Black / African American | 40 | 0.9% |
| Hawaiian / Pacific | 0 | 0.0% |
| Hispanic or Latino | 41 | 0.9% |
| Native / Alaskan | 0 | 0.0% |
| White / Caucasian | 4,519 | 96.8% |
| Two or more Races | 110 | 2.4% |
| Some other Race | 0 | 0.0% |
| Total | 4,669 | 100.0% |
Ancestry in East Troy
The most populous ancestries reported in East Troy are German (1,879 | 40.2%), Irish (712 | 15.2%), Italian (555 | 11.9%), Polish (498 | 10.7%), and English (300 | 6.4%), together accounting for 84.5% of all East Troy residents.
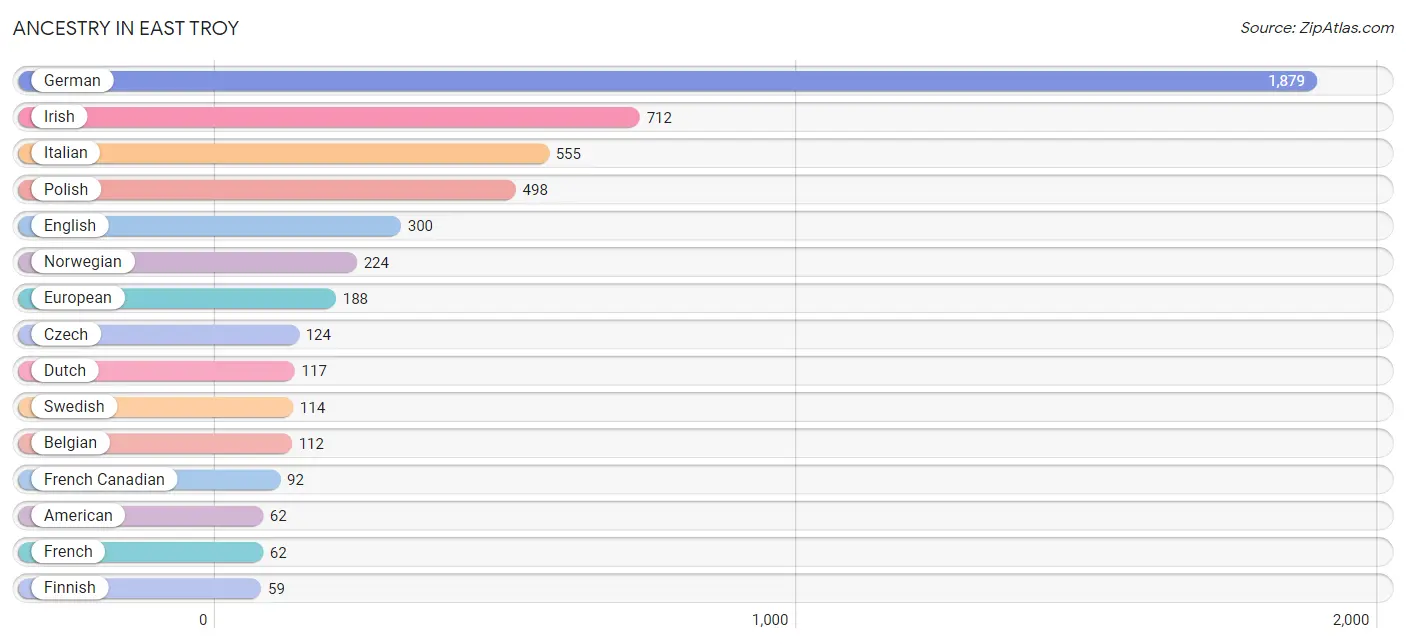
| Ancestry | # Population | % Population |
| African | 12 | 0.3% |
| American | 62 | 1.3% |
| Arab | 29 | 0.6% |
| Austrian | 10 | 0.2% |
| Belgian | 112 | 2.4% |
| Bhutanese | 12 | 0.3% |
| Croatian | 35 | 0.7% |
| Cuban | 5 | 0.1% |
| Czech | 124 | 2.7% |
| Czechoslovakian | 36 | 0.8% |
| Danish | 54 | 1.2% |
| Dutch | 117 | 2.5% |
| Egyptian | 29 | 0.6% |
| English | 300 | 6.4% |
| European | 188 | 4.0% |
| Finnish | 59 | 1.3% |
| French | 62 | 1.3% |
| French Canadian | 92 | 2.0% |
| German | 1,879 | 40.2% |
| Greek | 35 | 0.7% |
| Hungarian | 11 | 0.2% |
| Irish | 712 | 15.2% |
| Italian | 555 | 11.9% |
| Lithuanian | 17 | 0.4% |
| New Zealander | 37 | 0.8% |
| Norwegian | 224 | 4.8% |
| Peruvian | 6 | 0.1% |
| Polish | 498 | 10.7% |
| Russian | 14 | 0.3% |
| Scandinavian | 37 | 0.8% |
| Scotch-Irish | 49 | 1.1% |
| Slovene | 4 | 0.1% |
| South American | 6 | 0.1% |
| Spanish | 30 | 0.6% |
| Subsaharan African | 12 | 0.3% |
| Swedish | 114 | 2.4% |
| Ukrainian | 12 | 0.3% |
| Welsh | 39 | 0.8% | View All 38 Rows |
Immigrants in East Troy
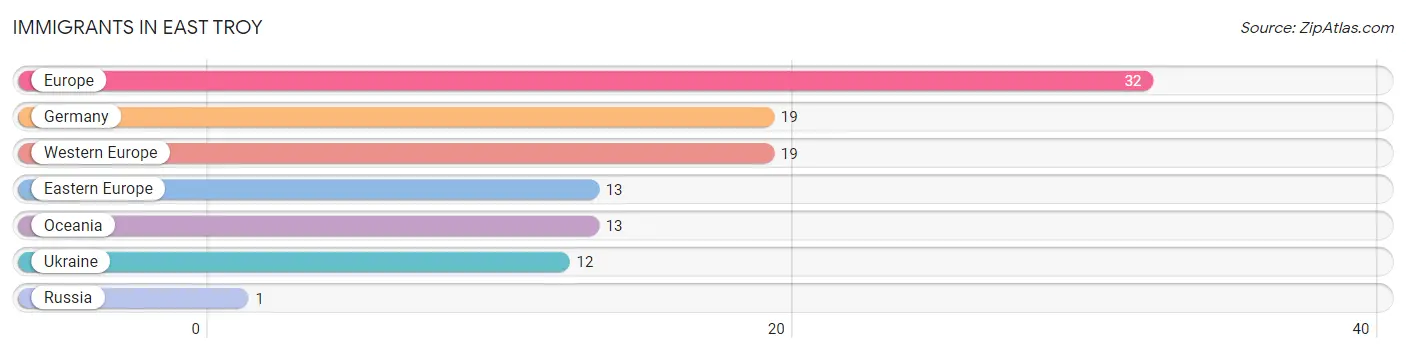
The most numerous immigrant groups reported in East Troy came from Europe (32 | 0.7%), Germany (19 | 0.4%), Western Europe (19 | 0.4%), Eastern Europe (13 | 0.3%), and Oceania (13 | 0.3%), together accounting for 2.1% of all East Troy residents.
| Immigration Origin | # Population | % Population |
| Eastern Europe | 13 | 0.3% |
| Europe | 32 | 0.7% |
| Germany | 19 | 0.4% |
| Oceania | 13 | 0.3% |
| Russia | 1 | 0.0% |
| Ukraine | 12 | 0.3% |
| Western Europe | 19 | 0.4% | View All 7 Rows |
Sex and Age in East Troy
Sex and Age in East Troy
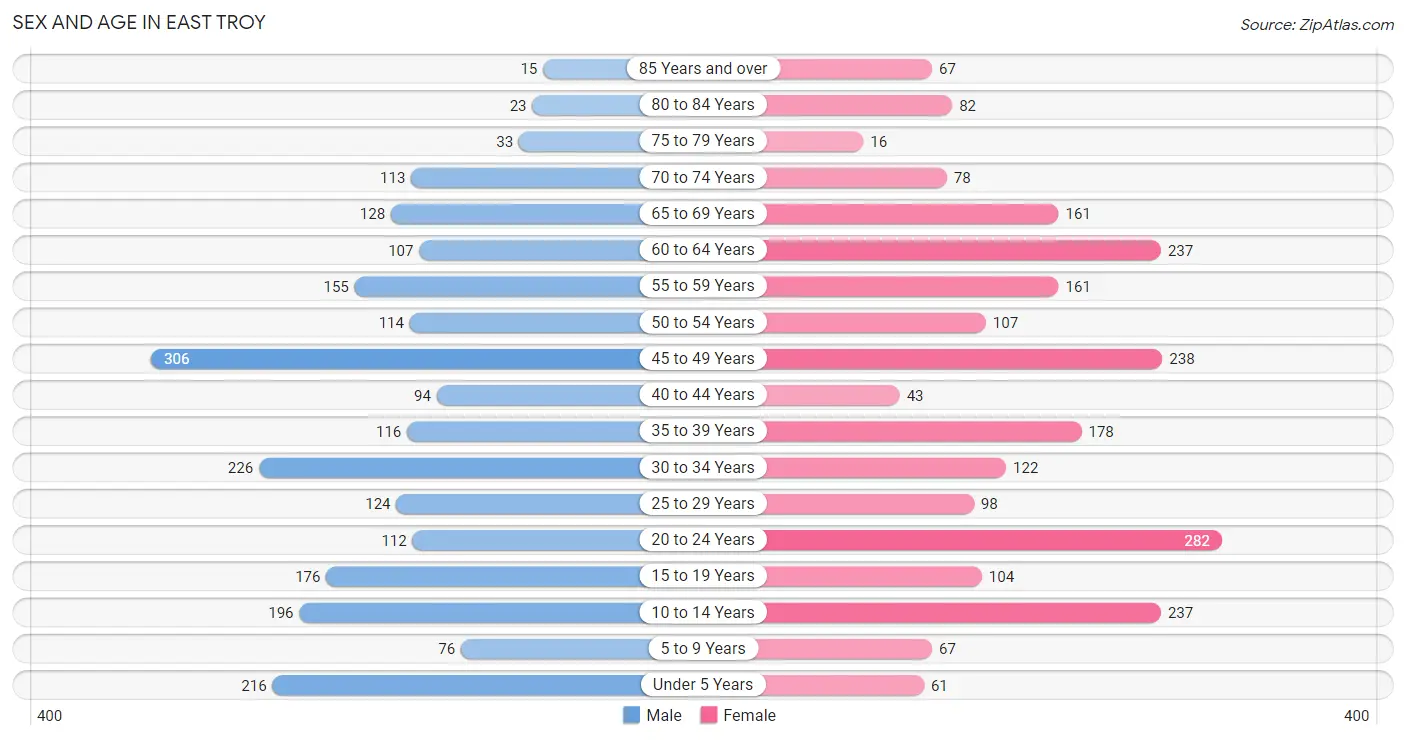
The most populous age groups in East Troy are 45 to 49 Years (306 | 13.1%) for men and 20 to 24 Years (282 | 12.1%) for women.
| Age Bracket | Male | Female |
| Under 5 Years | 216 (9.3%) | 61 (2.6%) |
| 5 to 9 Years | 76 (3.3%) | 67 (2.9%) |
| 10 to 14 Years | 196 (8.4%) | 237 (10.1%) |
| 15 to 19 Years | 176 (7.5%) | 104 (4.4%) |
| 20 to 24 Years | 112 (4.8%) | 282 (12.1%) |
| 25 to 29 Years | 124 (5.3%) | 98 (4.2%) |
| 30 to 34 Years | 226 (9.7%) | 122 (5.2%) |
| 35 to 39 Years | 116 (5.0%) | 178 (7.6%) |
| 40 to 44 Years | 94 (4.0%) | 43 (1.8%) |
| 45 to 49 Years | 306 (13.1%) | 238 (10.2%) |
| 50 to 54 Years | 114 (4.9%) | 107 (4.6%) |
| 55 to 59 Years | 155 (6.7%) | 161 (6.9%) |
| 60 to 64 Years | 107 (4.6%) | 237 (10.1%) |
| 65 to 69 Years | 128 (5.5%) | 161 (6.9%) |
| 70 to 74 Years | 113 (4.9%) | 78 (3.3%) |
| 75 to 79 Years | 33 (1.4%) | 16 (0.7%) |
| 80 to 84 Years | 23 (1.0%) | 82 (3.5%) |
| 85 Years and over | 15 (0.6%) | 67 (2.9%) |
| Total | 2,330 (100.0%) | 2,339 (100.0%) |
Families and Households in East Troy
Median Family Size in East Troy
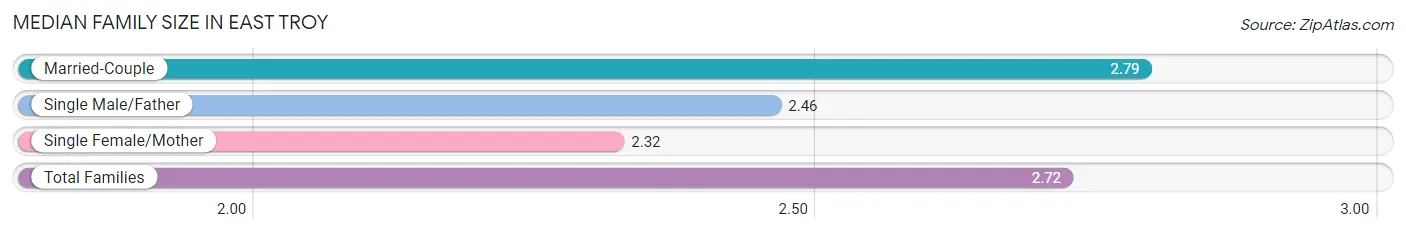
The median family size in East Troy is 2.72 persons per family, with married-couple families (1,074 | 82.4%) accounting for the largest median family size of 2.79 persons per family. On the other hand, single female/mother families (138 | 10.6%) represent the smallest median family size with 2.32 persons per family.
| Family Type | # Families | Family Size |
| Married-Couple | 1,074 (82.4%) | 2.79 |
| Single Male/Father | 92 (7.1%) | 2.46 |
| Single Female/Mother | 138 (10.6%) | 2.32 |
| Total Families | 1,304 (100.0%) | 2.72 |
Median Household Size in East Troy
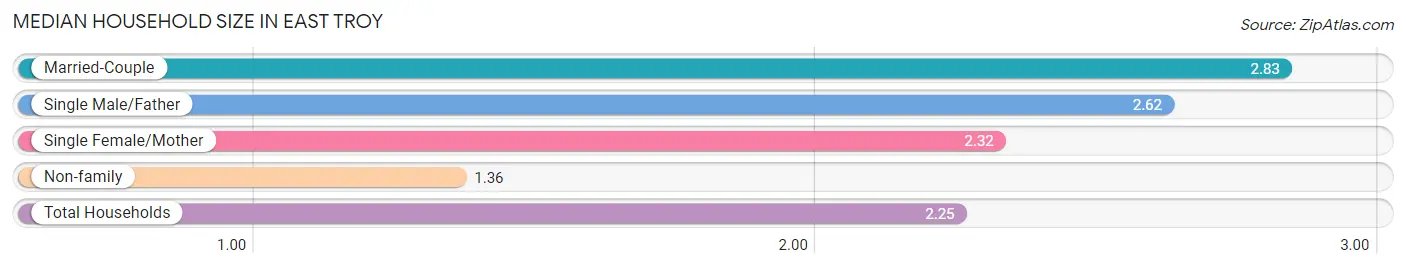
The median household size in East Troy is 2.25 persons per household, with married-couple households (1,074 | 52.3%) accounting for the largest median household size of 2.83 persons per household. non-family households (751 | 36.5%) represent the smallest median household size with 1.36 persons per household.
| Household Type | # Households | Household Size |
| Married-Couple | 1,074 (52.3%) | 2.83 |
| Single Male/Father | 92 (4.5%) | 2.62 |
| Single Female/Mother | 138 (6.7%) | 2.32 |
| Non-family | 751 (36.5%) | 1.36 |
| Total Households | 2,055 (100.0%) | 2.25 |
Household Size by Marriage Status in East Troy
Out of a total of 2,055 households in East Troy, 1,304 (63.4%) are family households, while 751 (36.5%) are nonfamily households. The most numerous type of family households are 2-person households, comprising 706, and the most common type of nonfamily households are 1-person households, comprising 530.
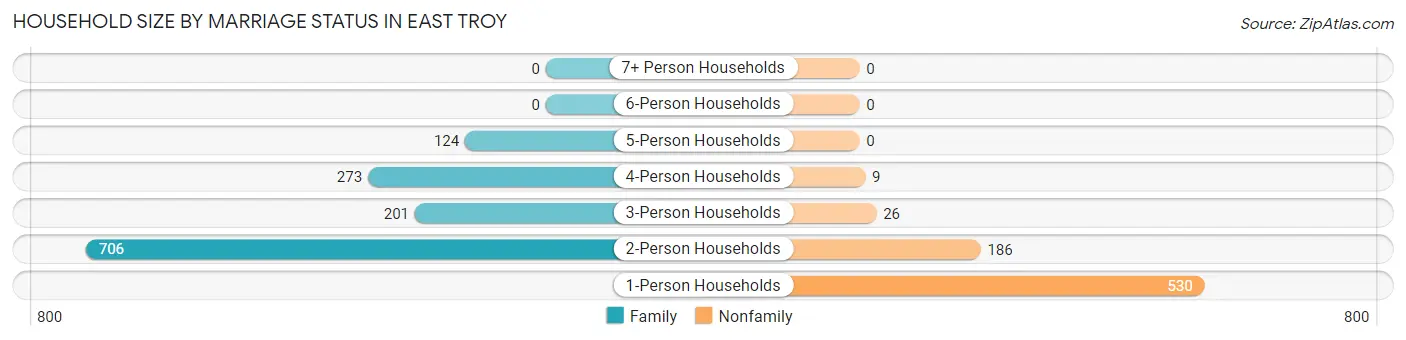
| Household Size | Family Households | Nonfamily Households |
| 1-Person Households | - | 530 (25.8%) |
| 2-Person Households | 706 (34.4%) | 186 (9.0%) |
| 3-Person Households | 201 (9.8%) | 26 (1.3%) |
| 4-Person Households | 273 (13.3%) | 9 (0.4%) |
| 5-Person Households | 124 (6.0%) | 0 (0.0%) |
| 6-Person Households | 0 (0.0%) | 0 (0.0%) |
| 7+ Person Households | 0 (0.0%) | 0 (0.0%) |
| Total | 1,304 (63.4%) | 751 (36.5%) |
Female Fertility in East Troy
Fertility by Age in East Troy
Average fertility rate in East Troy is 23.0 births per 1,000 women. Women in the age bracket of 35 to 50 years have the highest fertility rate with 28.0 births per 1,000 women. Women in the age bracket of 35 to 50 years acount for 52.0% of all women with births.
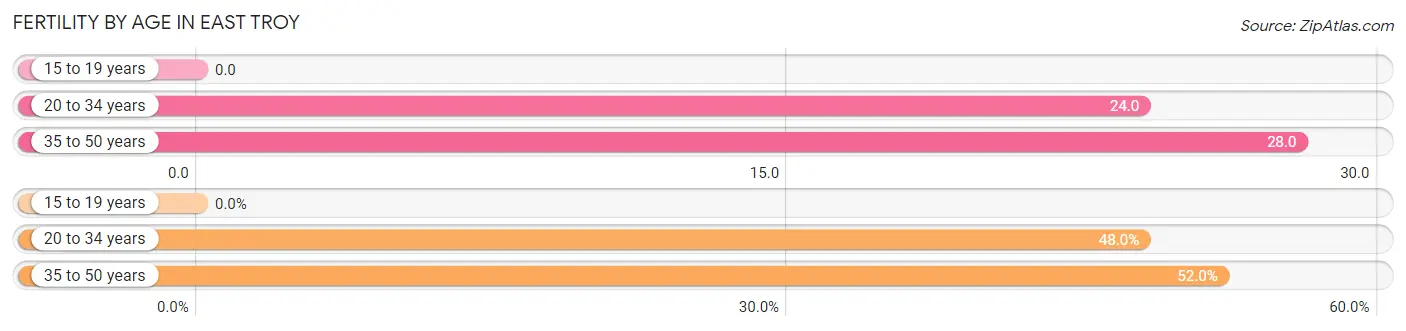
| Age Bracket | Women with Births | Births / 1,000 Women |
| 15 to 19 years | 0 (0.0%) | 0.0 |
| 20 to 34 years | 12 (48.0%) | 24.0 |
| 35 to 50 years | 13 (52.0%) | 28.0 |
| Total | 25 (100.0%) | 23.0 |
Fertility by Age by Marriage Status in East Troy
48.0% of women with births (25) in East Troy are married. The highest percentage of unmarried women with births falls into 35 to 50 years age bracket with 100.0% of them unmarried at the time of birth, while the lowest percentage of unmarried women with births belong to 20 to 34 years age bracket with 0.0% of them unmarried.
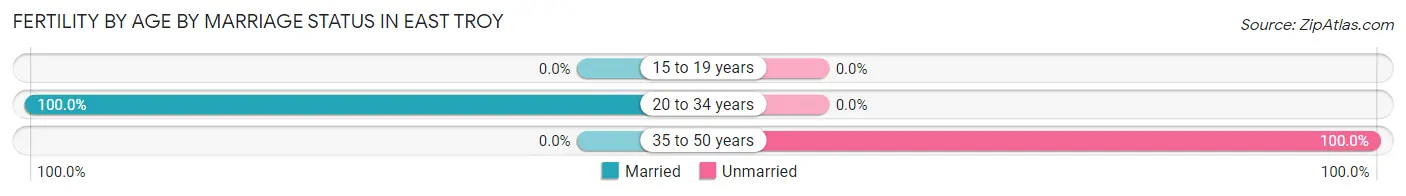
| Age Bracket | Married | Unmarried |
| 15 to 19 years | 0 (0.0%) | 0 (0.0%) |
| 20 to 34 years | 12 (100.0%) | 0 (0.0%) |
| 35 to 50 years | 0 (0.0%) | 13 (100.0%) |
| Total | 12 (48.0%) | 13 (52.0%) |
Fertility by Education in East Troy
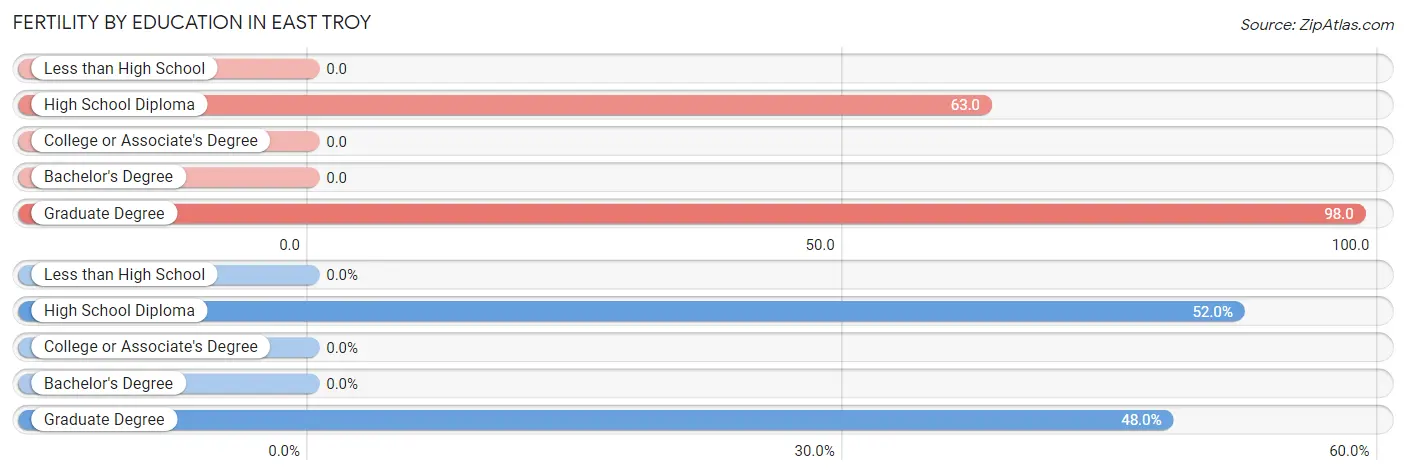
| Educational Attainment | Women with Births | Births / 1,000 Women |
| Less than High School | 0 (0.0%) | 0.0 |
| High School Diploma | 13 (52.0%) | 63.0 |
| College or Associate's Degree | 0 (0.0%) | 0.0 |
| Bachelor's Degree | 0 (0.0%) | 0.0 |
| Graduate Degree | 12 (48.0%) | 98.0 |
| Total | 25 (100.0%) | 23.0 |
Fertility by Education by Marriage Status in East Troy
52.0% of women with births in East Troy are unmarried. Women with the educational attainment of graduate degree are most likely to be married with 100.0% of them married at childbirth, while women with the educational attainment of high school diploma are least likely to be married with 100.0% of them unmarried at childbirth.
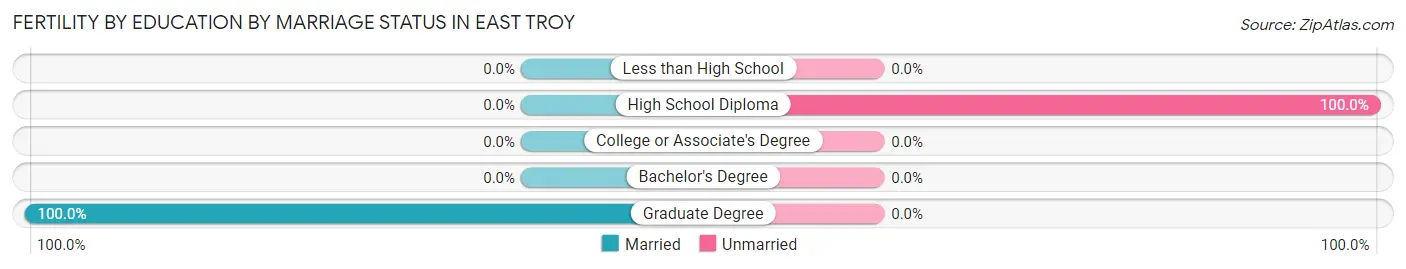
| Educational Attainment | Married | Unmarried |
| Less than High School | 0 (0.0%) | 0 (0.0%) |
| High School Diploma | 0 (0.0%) | 13 (100.0%) |
| College or Associate's Degree | 0 (0.0%) | 0 (0.0%) |
| Bachelor's Degree | 0 (0.0%) | 0 (0.0%) |
| Graduate Degree | 12 (100.0%) | 0 (0.0%) |
| Total | 12 (48.0%) | 13 (52.0%) |
Employment Characteristics in East Troy
Employment by Class of Employer in East Troy
Among the 2,606 employed individuals in East Troy, private company employees (1,962 | 75.3%), not-for-profit organizations (296 | 11.4%), and local government employees (160 | 6.1%) make up the most common classes of employment.
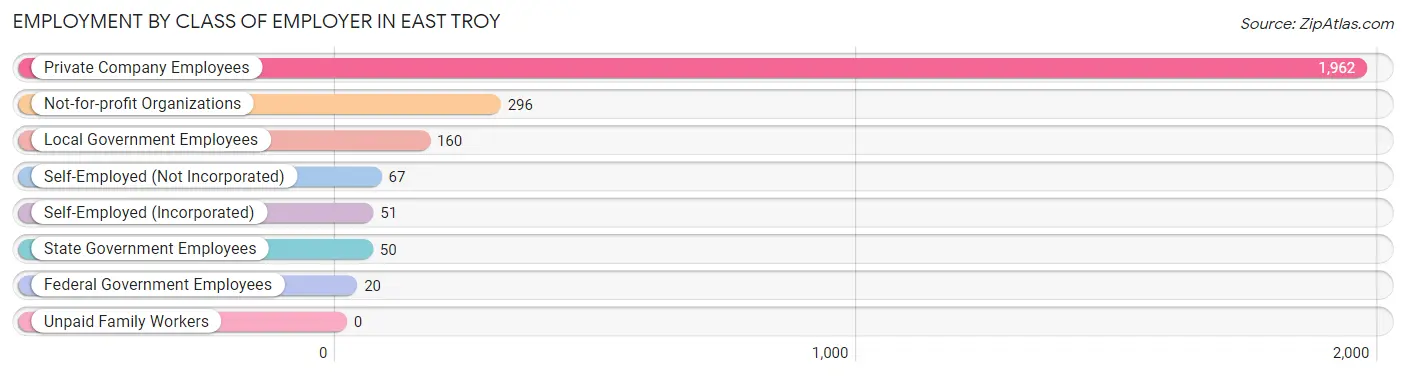
| Employer Class | # Employees | % Employees |
| Private Company Employees | 1,962 | 75.3% |
| Self-Employed (Incorporated) | 51 | 2.0% |
| Self-Employed (Not Incorporated) | 67 | 2.6% |
| Not-for-profit Organizations | 296 | 11.4% |
| Local Government Employees | 160 | 6.1% |
| State Government Employees | 50 | 1.9% |
| Federal Government Employees | 20 | 0.8% |
| Unpaid Family Workers | 0 | 0.0% |
| Total | 2,606 | 100.0% |
Employment Status by Age in East Troy
According to the labor force statistics for East Troy, out of the total population over 16 years of age (3,816), 70.0% or 2,671 individuals are in the labor force, with 2.0% or 53 of them unemployed. The age group with the highest labor force participation rate is 20 to 24 years, with 100.0% or 394 individuals in the labor force. Within the labor force, the 35 to 44 years age range has the highest percentage of unemployed individuals, with 7.2% or 27 of them being unemployed.
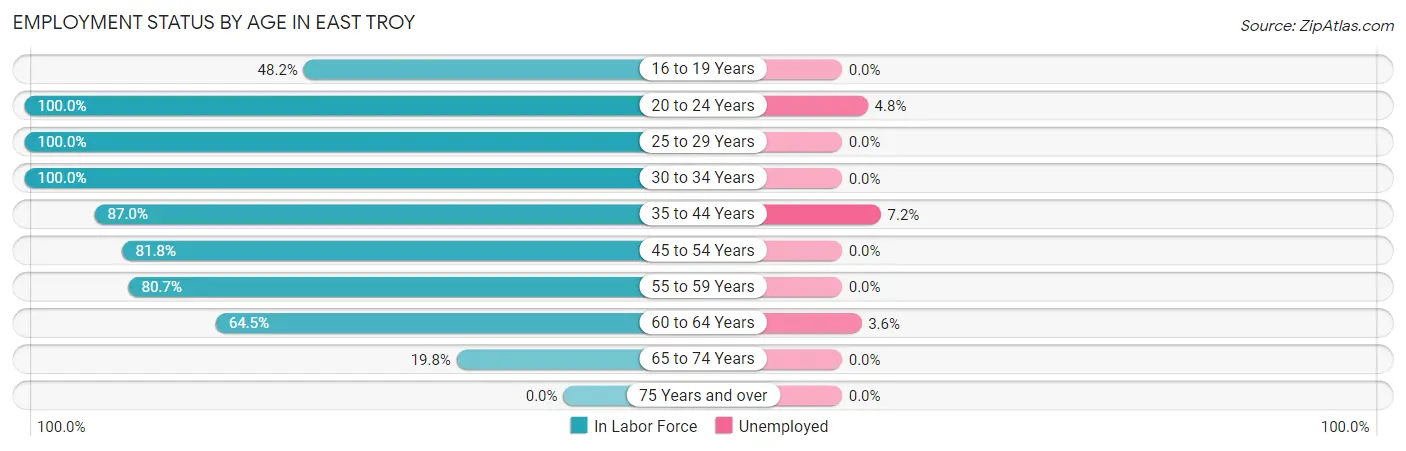
| Age Bracket | In Labor Force | Unemployed |
| 16 to 19 Years | 135 (48.2%) | 0 (0.0%) |
| 20 to 24 Years | 394 (100.0%) | 19 (4.8%) |
| 25 to 29 Years | 222 (100.0%) | 0 (0.0%) |
| 30 to 34 Years | 348 (100.0%) | 0 (0.0%) |
| 35 to 44 Years | 375 (87.0%) | 27 (7.2%) |
| 45 to 54 Years | 626 (81.8%) | 0 (0.0%) |
| 55 to 59 Years | 255 (80.7%) | 0 (0.0%) |
| 60 to 64 Years | 222 (64.5%) | 8 (3.6%) |
| 65 to 74 Years | 95 (19.8%) | 0 (0.0%) |
| 75 Years and over | 0 (0.0%) | 0 (0.0%) |
| Total | 2,671 (70.0%) | 53 (2.0%) |
Employment Status by Educational Attainment in East Troy
According to labor force statistics for East Troy, 84.4% of individuals (2,048) out of the total population between 25 and 64 years of age (2,426) are in the labor force, with 1.7% or 35 of them being unemployed. The group with the highest labor force participation rate are those with the educational attainment of college / associate degree, with 89.1% or 718 individuals in the labor force. Within the labor force, individuals with college / associate degree education have the highest percentage of unemployment, with 4.9% or 35 of them being unemployed.
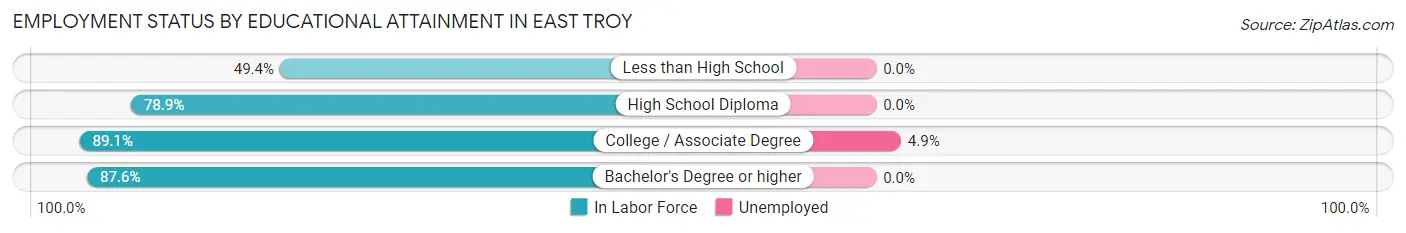
| Educational Attainment | In Labor Force | Unemployed |
| Less than High School | 40 (49.4%) | 0 (0.0%) |
| High School Diploma | 522 (78.9%) | 0 (0.0%) |
| College / Associate Degree | 718 (89.1%) | 39 (4.9%) |
| Bachelor's Degree or higher | 768 (87.6%) | 0 (0.0%) |
| Total | 2,048 (84.4%) | 41 (1.7%) |
Employment Occupations by Sex in East Troy
Management, Business, Science and Arts Occupations
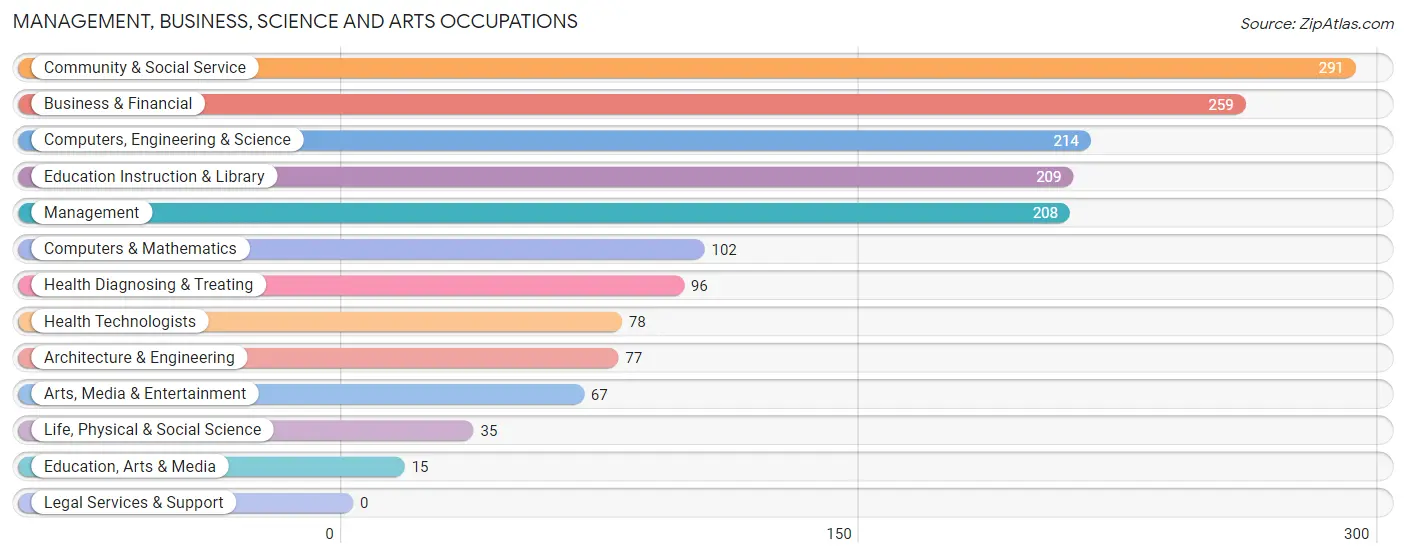
The most common Management, Business, Science and Arts occupations in East Troy are Community & Social Service (291 | 11.1%), Business & Financial (259 | 9.9%), Computers, Engineering & Science (214 | 8.2%), Education Instruction & Library (209 | 8.0%), and Management (208 | 7.9%).
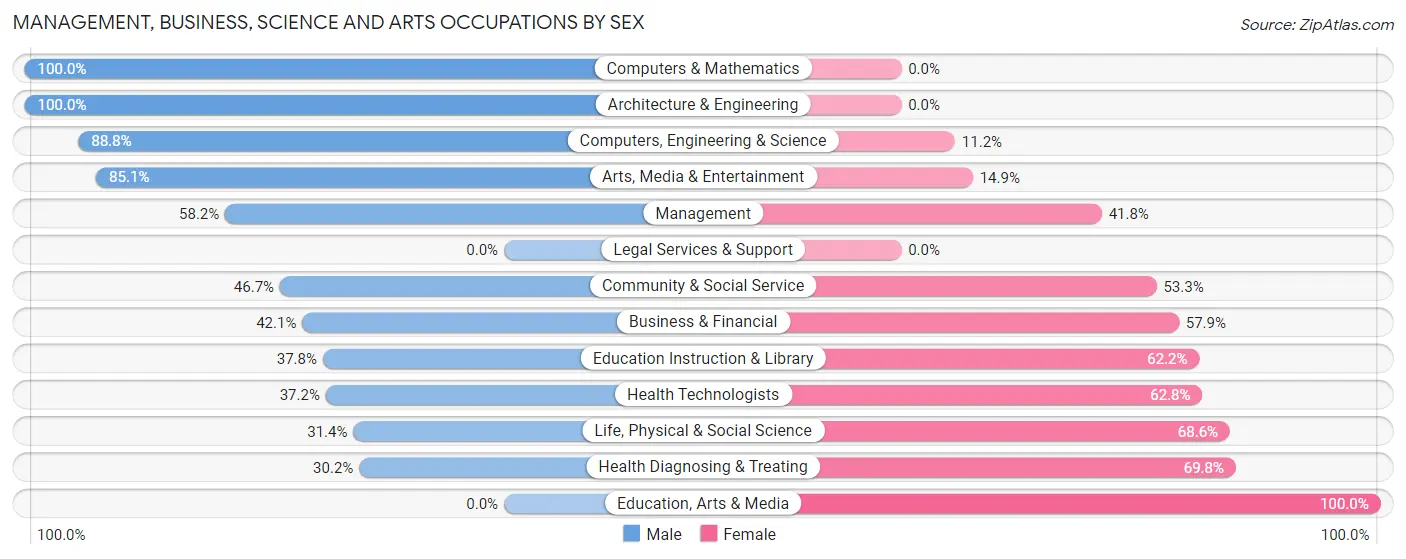
Management, Business, Science and Arts Occupations by Sex
Within the Management, Business, Science and Arts occupations in East Troy, the most male-oriented occupations are Computers & Mathematics (100.0%), Architecture & Engineering (100.0%), and Computers, Engineering & Science (88.8%), while the most female-oriented occupations are Education, Arts & Media (100.0%), Health Diagnosing & Treating (69.8%), and Life, Physical & Social Science (68.6%).
| Occupation | Male | Female |
| Management | 121 (58.2%) | 87 (41.8%) |
| Business & Financial | 109 (42.1%) | 150 (57.9%) |
| Computers, Engineering & Science | 190 (88.8%) | 24 (11.2%) |
| Computers & Mathematics | 102 (100.0%) | 0 (0.0%) |
| Architecture & Engineering | 77 (100.0%) | 0 (0.0%) |
| Life, Physical & Social Science | 11 (31.4%) | 24 (68.6%) |
| Community & Social Service | 136 (46.7%) | 155 (53.3%) |
| Education, Arts & Media | 0 (0.0%) | 15 (100.0%) |
| Legal Services & Support | 0 (0.0%) | 0 (0.0%) |
| Education Instruction & Library | 79 (37.8%) | 130 (62.2%) |
| Arts, Media & Entertainment | 57 (85.1%) | 10 (14.9%) |
| Health Diagnosing & Treating | 29 (30.2%) | 67 (69.8%) |
| Health Technologists | 29 (37.2%) | 49 (62.8%) |
| Total (Category) | 585 (54.8%) | 483 (45.2%) |
| Total (Overall) | 1,373 (52.4%) | 1,245 (47.6%) |
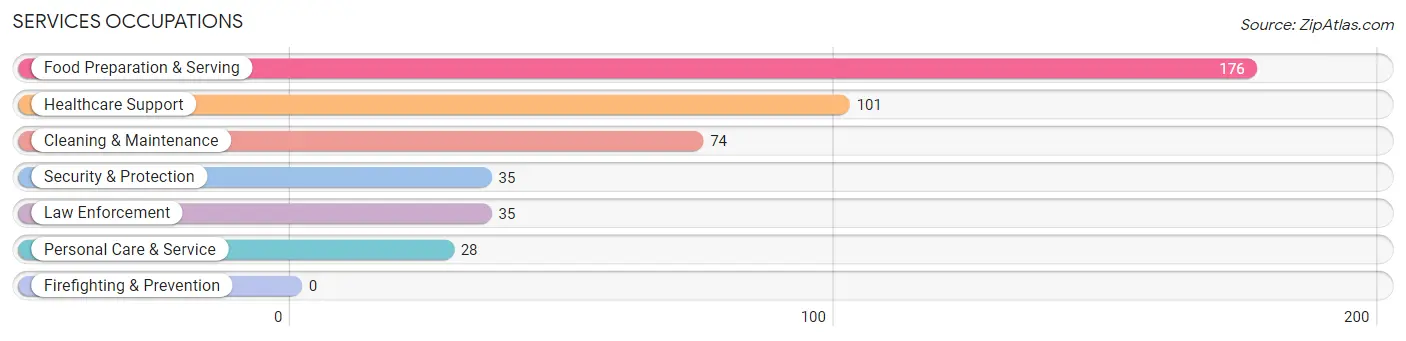
Services Occupations
The most common Services occupations in East Troy are Food Preparation & Serving (176 | 6.7%), Healthcare Support (101 | 3.9%), Cleaning & Maintenance (74 | 2.8%), Security & Protection (35 | 1.3%), and Law Enforcement (35 | 1.3%).
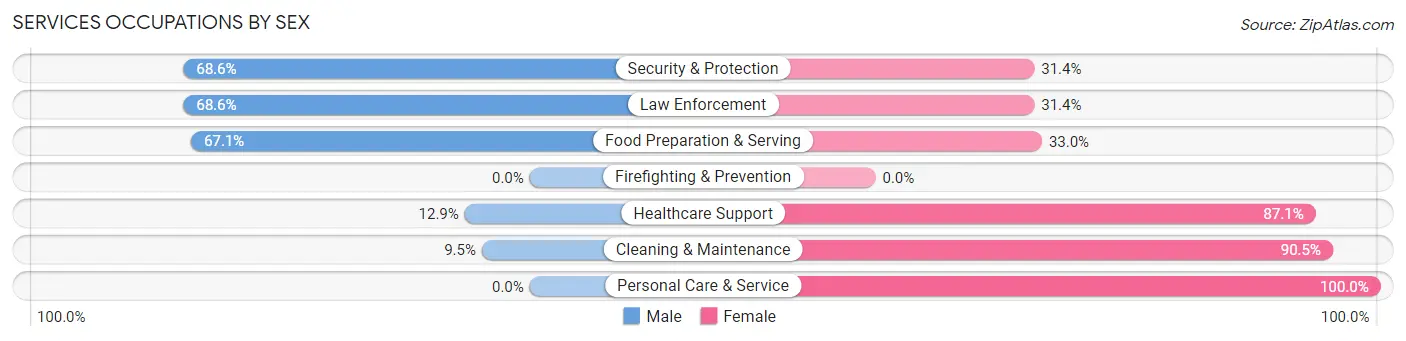
Services Occupations by Sex
Within the Services occupations in East Troy, the most male-oriented occupations are Security & Protection (68.6%), Law Enforcement (68.6%), and Food Preparation & Serving (67.0%), while the most female-oriented occupations are Personal Care & Service (100.0%), Cleaning & Maintenance (90.5%), and Healthcare Support (87.1%).
| Occupation | Male | Female |
| Healthcare Support | 13 (12.9%) | 88 (87.1%) |
| Security & Protection | 24 (68.6%) | 11 (31.4%) |
| Firefighting & Prevention | 0 (0.0%) | 0 (0.0%) |
| Law Enforcement | 24 (68.6%) | 11 (31.4%) |
| Food Preparation & Serving | 118 (67.0%) | 58 (33.0%) |
| Cleaning & Maintenance | 7 (9.5%) | 67 (90.5%) |
| Personal Care & Service | 0 (0.0%) | 28 (100.0%) |
| Total (Category) | 162 (39.1%) | 252 (60.9%) |
| Total (Overall) | 1,373 (52.4%) | 1,245 (47.6%) |
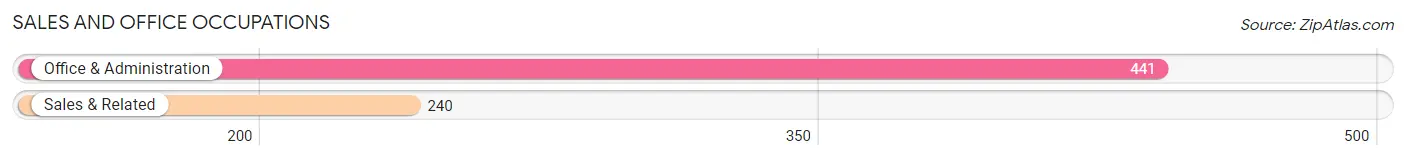
Sales and Office Occupations
The most common Sales and Office occupations in East Troy are Office & Administration (441 | 16.8%), and Sales & Related (240 | 9.2%).
Sales and Office Occupations by Sex

| Occupation | Male | Female |
| Sales & Related | 102 (42.5%) | 138 (57.5%) |
| Office & Administration | 83 (18.8%) | 358 (81.2%) |
| Total (Category) | 185 (27.2%) | 496 (72.8%) |
| Total (Overall) | 1,373 (52.4%) | 1,245 (47.6%) |
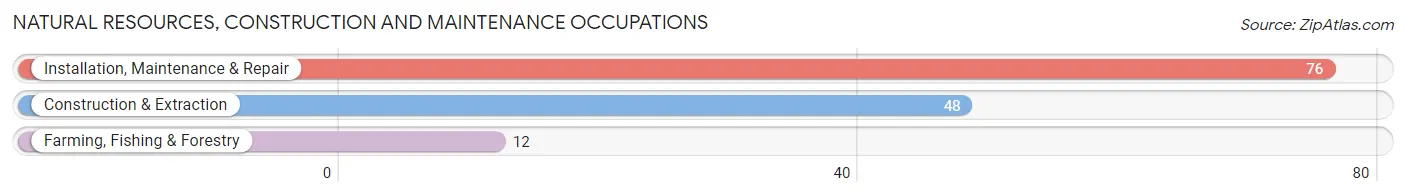
Natural Resources, Construction and Maintenance Occupations
The most common Natural Resources, Construction and Maintenance occupations in East Troy are Installation, Maintenance & Repair (76 | 2.9%), Construction & Extraction (48 | 1.8%), and Farming, Fishing & Forestry (12 | 0.5%).
Natural Resources, Construction and Maintenance Occupations by Sex
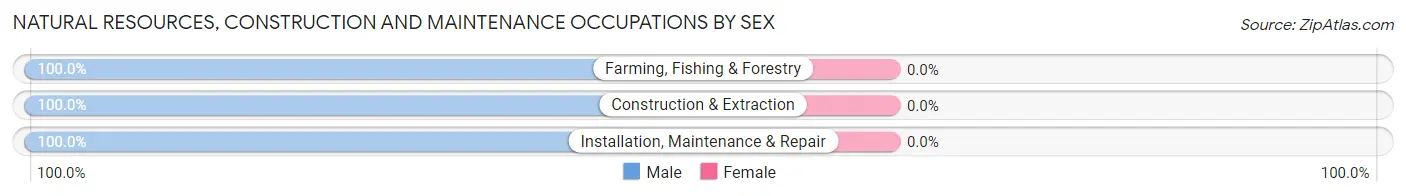
| Occupation | Male | Female |
| Farming, Fishing & Forestry | 12 (100.0%) | 0 (0.0%) |
| Construction & Extraction | 48 (100.0%) | 0 (0.0%) |
| Installation, Maintenance & Repair | 76 (100.0%) | 0 (0.0%) |
| Total (Category) | 136 (100.0%) | 0 (0.0%) |
| Total (Overall) | 1,373 (52.4%) | 1,245 (47.6%) |
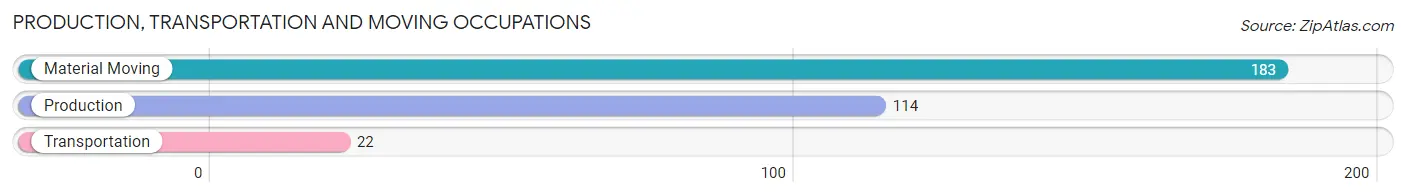
Production, Transportation and Moving Occupations
The most common Production, Transportation and Moving occupations in East Troy are Material Moving (183 | 7.0%), Production (114 | 4.3%), and Transportation (22 | 0.8%).
Production, Transportation and Moving Occupations by Sex
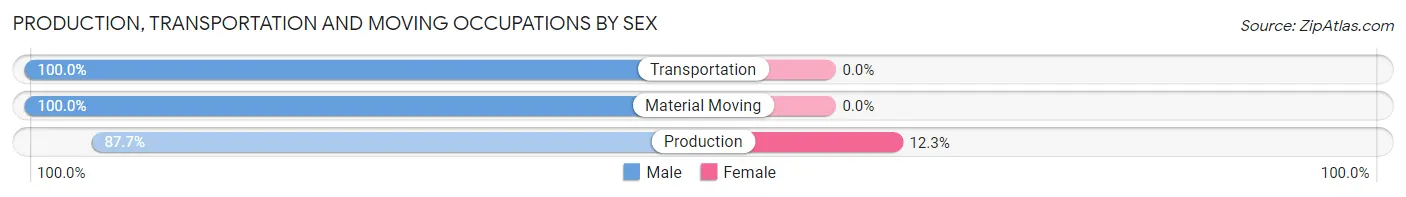
| Occupation | Male | Female |
| Production | 100 (87.7%) | 14 (12.3%) |
| Transportation | 22 (100.0%) | 0 (0.0%) |
| Material Moving | 183 (100.0%) | 0 (0.0%) |
| Total (Category) | 305 (95.6%) | 14 (4.4%) |
| Total (Overall) | 1,373 (52.4%) | 1,245 (47.6%) |
Employment Industries by Sex in East Troy
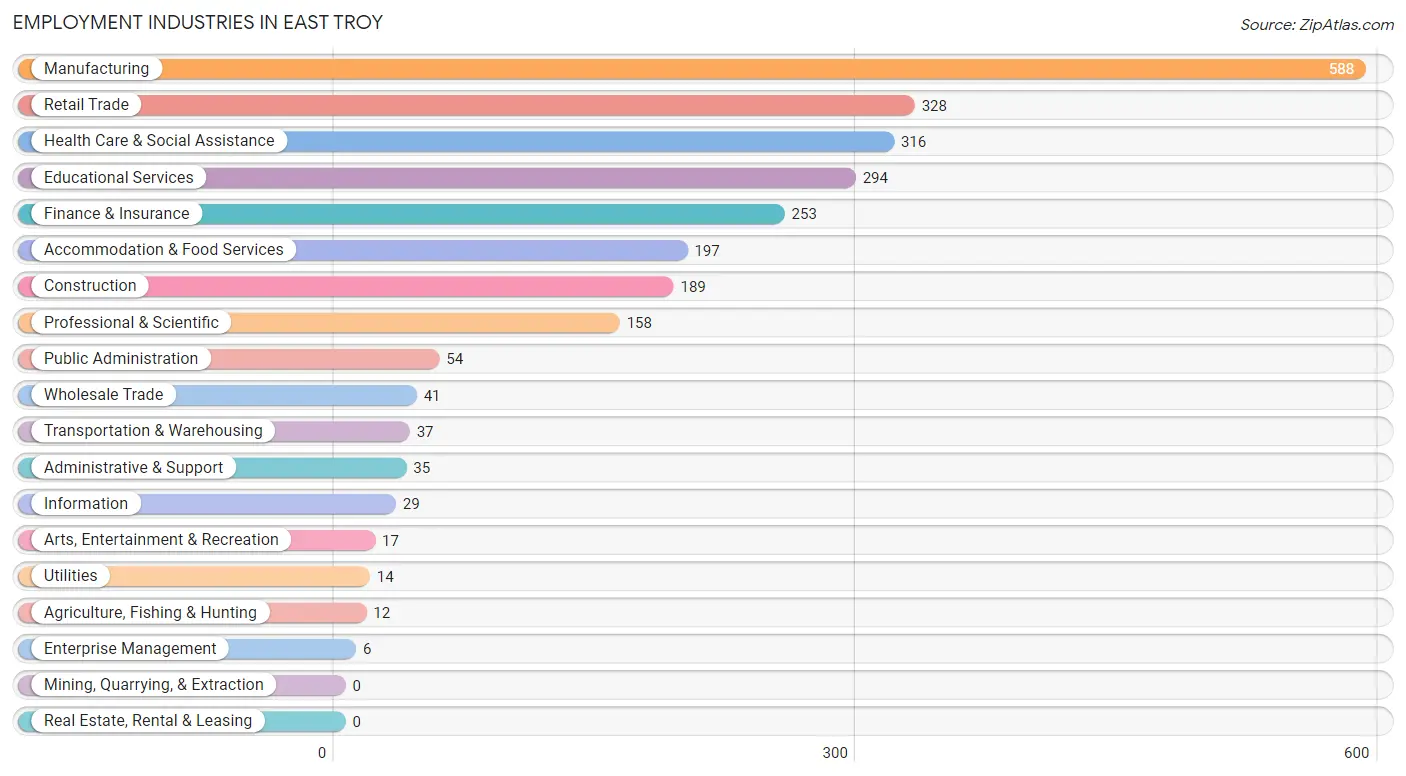
Employment Industries in East Troy
The major employment industries in East Troy include Manufacturing (588 | 22.5%), Retail Trade (328 | 12.5%), Health Care & Social Assistance (316 | 12.1%), Educational Services (294 | 11.2%), and Finance & Insurance (253 | 9.7%).
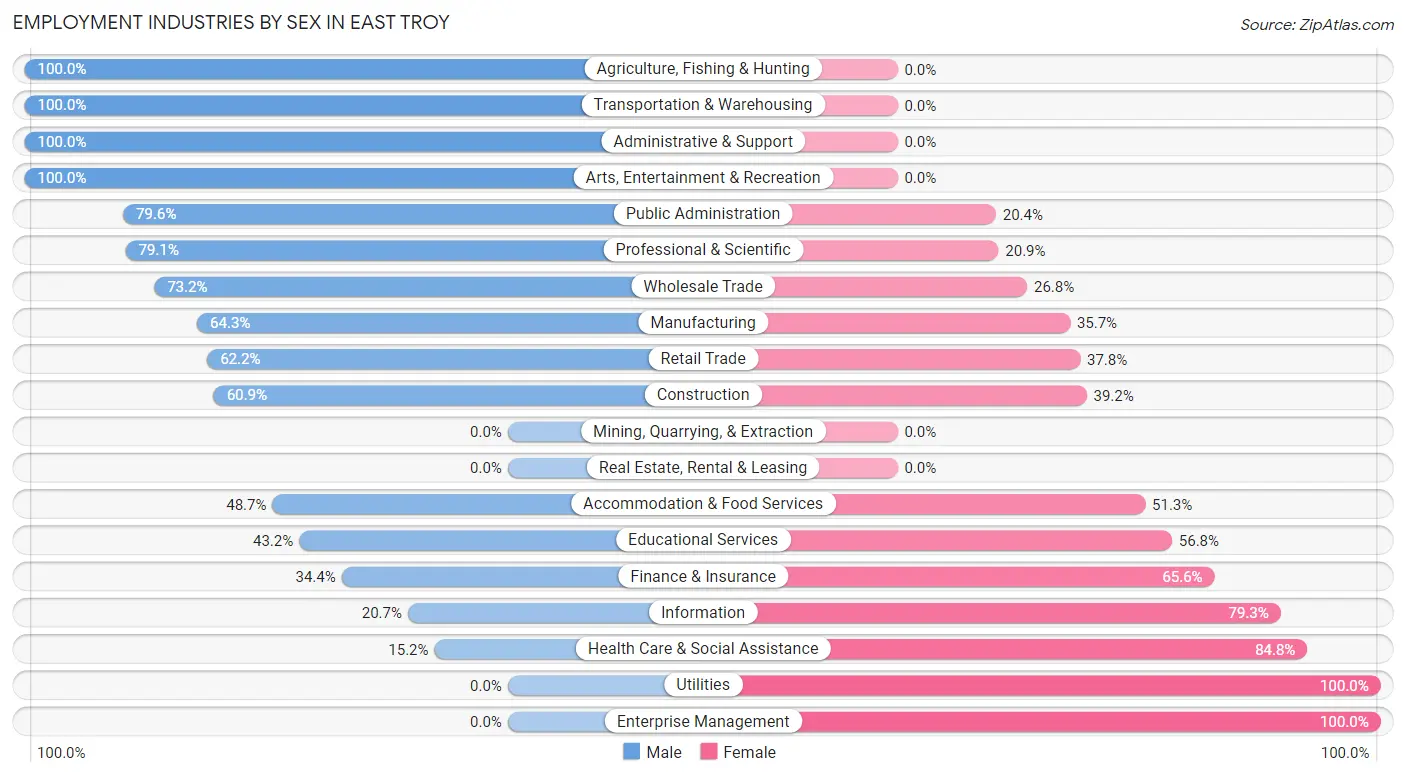
Employment Industries by Sex in East Troy
The East Troy industries that see more men than women are Agriculture, Fishing & Hunting (100.0%), Transportation & Warehousing (100.0%), and Administrative & Support (100.0%), whereas the industries that tend to have a higher number of women are Utilities (100.0%), Enterprise Management (100.0%), and Health Care & Social Assistance (84.8%).
| Industry | Male | Female |
| Agriculture, Fishing & Hunting | 12 (100.0%) | 0 (0.0%) |
| Mining, Quarrying, & Extraction | 0 (0.0%) | 0 (0.0%) |
| Construction | 115 (60.9%) | 74 (39.2%) |
| Manufacturing | 378 (64.3%) | 210 (35.7%) |
| Wholesale Trade | 30 (73.2%) | 11 (26.8%) |
| Retail Trade | 204 (62.2%) | 124 (37.8%) |
| Transportation & Warehousing | 37 (100.0%) | 0 (0.0%) |
| Utilities | 0 (0.0%) | 14 (100.0%) |
| Information | 6 (20.7%) | 23 (79.3%) |
| Finance & Insurance | 87 (34.4%) | 166 (65.6%) |
| Real Estate, Rental & Leasing | 0 (0.0%) | 0 (0.0%) |
| Professional & Scientific | 125 (79.1%) | 33 (20.9%) |
| Enterprise Management | 0 (0.0%) | 6 (100.0%) |
| Administrative & Support | 35 (100.0%) | 0 (0.0%) |
| Educational Services | 127 (43.2%) | 167 (56.8%) |
| Health Care & Social Assistance | 48 (15.2%) | 268 (84.8%) |
| Arts, Entertainment & Recreation | 17 (100.0%) | 0 (0.0%) |
| Accommodation & Food Services | 96 (48.7%) | 101 (51.3%) |
| Public Administration | 43 (79.6%) | 11 (20.4%) |
| Total | 1,373 (52.4%) | 1,245 (47.6%) |
Education in East Troy
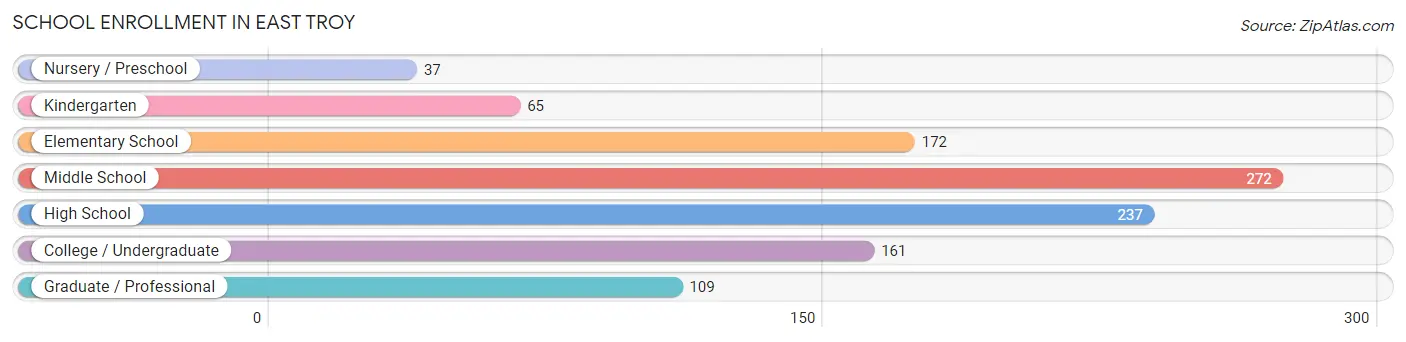
School Enrollment in East Troy
The most common levels of schooling among the 1,053 students in East Troy are middle school (272 | 25.8%), high school (237 | 22.5%), and elementary school (172 | 16.3%).
| School Level | # Students | % Students |
| Nursery / Preschool | 37 | 3.5% |
| Kindergarten | 65 | 6.2% |
| Elementary School | 172 | 16.3% |
| Middle School | 272 | 25.8% |
| High School | 237 | 22.5% |
| College / Undergraduate | 161 | 15.3% |
| Graduate / Professional | 109 | 10.3% |
| Total | 1,053 | 100.0% |
School Enrollment by Age by Funding Source in East Troy
Out of a total of 1,053 students who are enrolled in schools in East Troy, 76 (7.2%) attend a private institution, while the remaining 977 (92.8%) are enrolled in public schools. The age group of 3 to 4 year olds has the highest likelihood of being enrolled in private schools, with 28 (100.0% in the age bracket) enrolled. Conversely, the age group of 15 to 17 year olds has the lowest likelihood of being enrolled in a private school, with 199 (100.0% in the age bracket) attending a public institution.
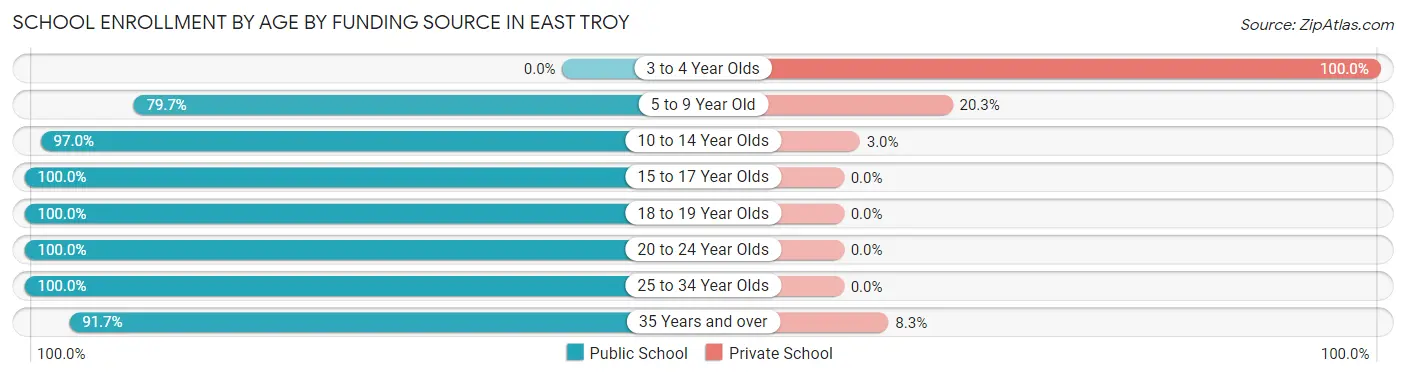
| Age Bracket | Public School | Private School |
| 3 to 4 Year Olds | 0 (0.0%) | 28 (100.0%) |
| 5 to 9 Year Old | 114 (79.7%) | 29 (20.3%) |
| 10 to 14 Year Olds | 420 (97.0%) | 13 (3.0%) |
| 15 to 17 Year Olds | 199 (100.0%) | 0 (0.0%) |
| 18 to 19 Year Olds | 55 (100.0%) | 0 (0.0%) |
| 20 to 24 Year Olds | 116 (100.0%) | 0 (0.0%) |
| 25 to 34 Year Olds | 7 (100.0%) | 0 (0.0%) |
| 35 Years and over | 66 (91.7%) | 6 (8.3%) |
| Total | 977 (92.8%) | 76 (7.2%) |
Educational Attainment by Field of Study in East Troy
Education (218 | 19.1%), business (196 | 17.2%), social sciences (112 | 9.8%), science & technology (102 | 8.9%), and computers & mathematics (98 | 8.6%) are the most common fields of study among 1,141 individuals in East Troy who have obtained a bachelor's degree or higher.
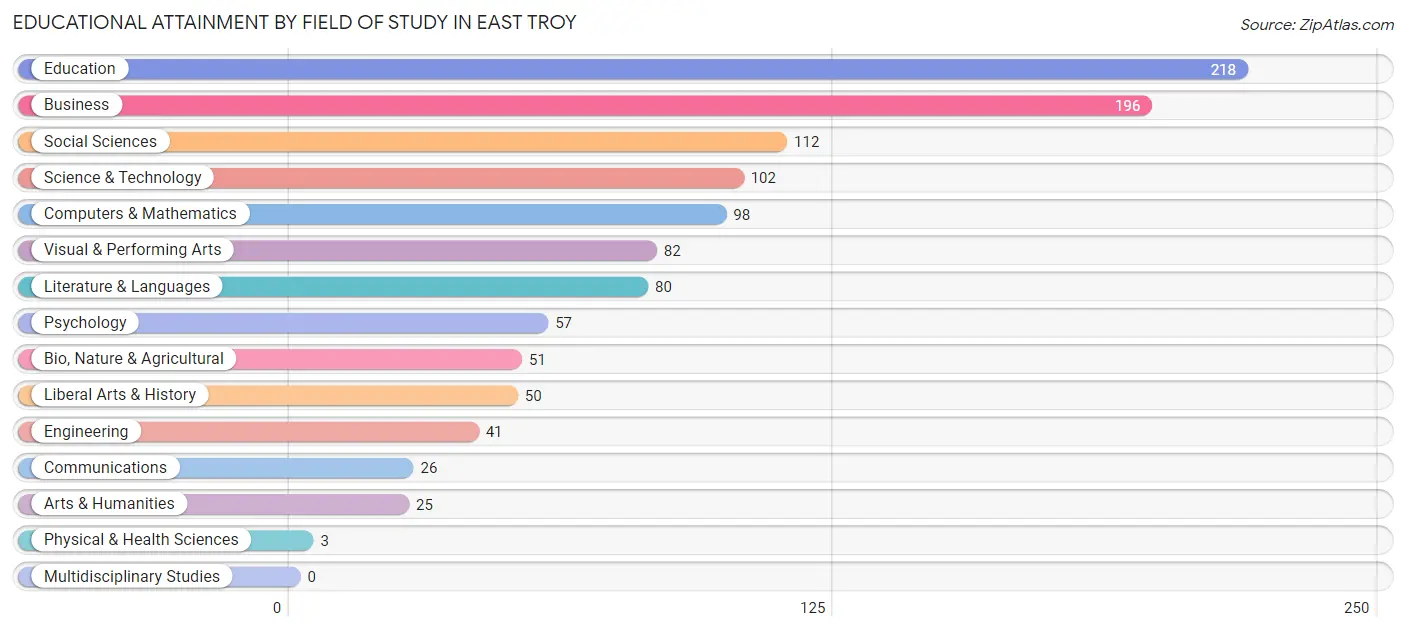
| Field of Study | # Graduates | % Graduates |
| Computers & Mathematics | 98 | 8.6% |
| Bio, Nature & Agricultural | 51 | 4.5% |
| Physical & Health Sciences | 3 | 0.3% |
| Psychology | 57 | 5.0% |
| Social Sciences | 112 | 9.8% |
| Engineering | 41 | 3.6% |
| Multidisciplinary Studies | 0 | 0.0% |
| Science & Technology | 102 | 8.9% |
| Business | 196 | 17.2% |
| Education | 218 | 19.1% |
| Literature & Languages | 80 | 7.0% |
| Liberal Arts & History | 50 | 4.4% |
| Visual & Performing Arts | 82 | 7.2% |
| Communications | 26 | 2.3% |
| Arts & Humanities | 25 | 2.2% |
| Total | 1,141 | 100.0% |
Transportation & Commute in East Troy
Vehicle Availability by Sex in East Troy
The most prevalent vehicle ownership categories in East Troy are males with 2 vehicles (813, accounting for 59.2%) and females with 2 vehicles (742, making up 66.0%).
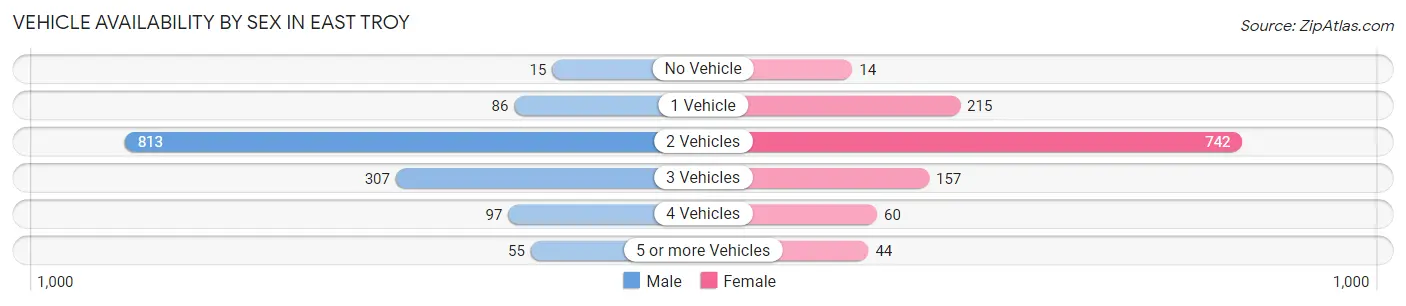
| Vehicles Available | Male | Female |
| No Vehicle | 15 (1.1%) | 14 (1.1%) |
| 1 Vehicle | 86 (6.3%) | 215 (17.4%) |
| 2 Vehicles | 813 (59.2%) | 742 (60.2%) |
| 3 Vehicles | 307 (22.4%) | 157 (12.7%) |
| 4 Vehicles | 97 (7.1%) | 60 (4.9%) |
| 5 or more Vehicles | 55 (4.0%) | 44 (3.6%) |
| Total | 1,373 (100.0%) | 1,232 (100.0%) |
Commute Time in East Troy
The most frequently occuring commute durations in East Troy are 30 to 34 minutes (347 commuters, 15.1%), 5 to 9 minutes (318 commuters, 13.8%), and 15 to 19 minutes (279 commuters, 12.1%).
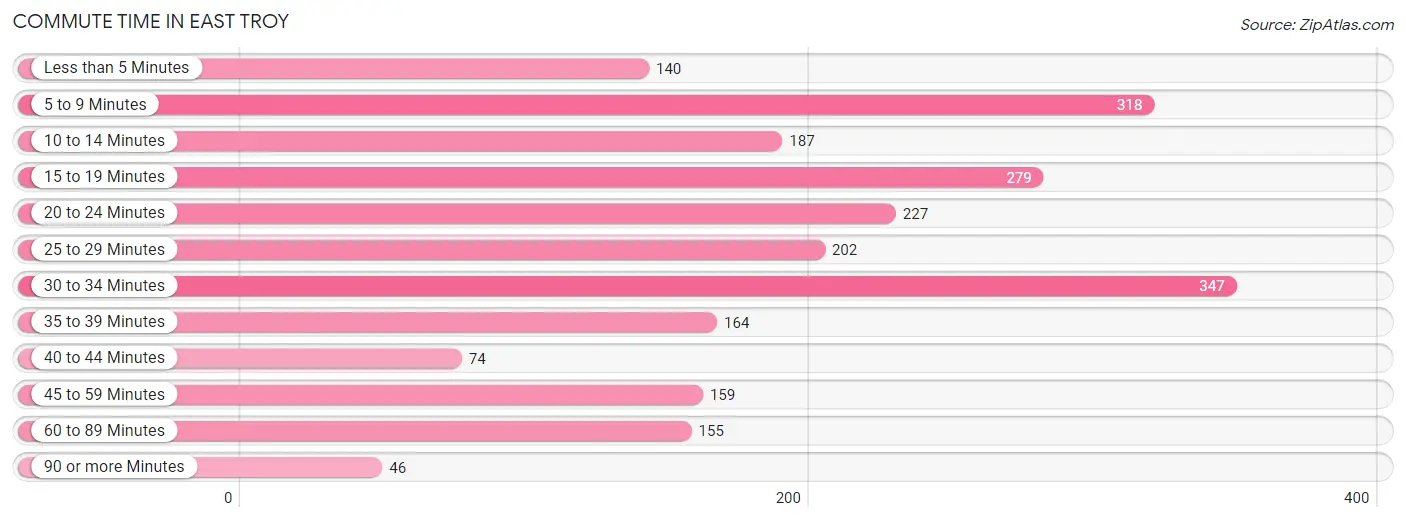
| Commute Time | # Commuters | % Commuters |
| Less than 5 Minutes | 140 | 6.1% |
| 5 to 9 Minutes | 318 | 13.8% |
| 10 to 14 Minutes | 187 | 8.1% |
| 15 to 19 Minutes | 279 | 12.1% |
| 20 to 24 Minutes | 227 | 9.9% |
| 25 to 29 Minutes | 202 | 8.8% |
| 30 to 34 Minutes | 347 | 15.1% |
| 35 to 39 Minutes | 164 | 7.1% |
| 40 to 44 Minutes | 74 | 3.2% |
| 45 to 59 Minutes | 159 | 6.9% |
| 60 to 89 Minutes | 155 | 6.7% |
| 90 or more Minutes | 46 | 2.0% |
Commute Time by Sex in East Troy
The most common commute times in East Troy are 25 to 29 minutes (179 commuters, 14.5%) for males and 5 to 9 minutes (210 commuters, 19.8%) for females.
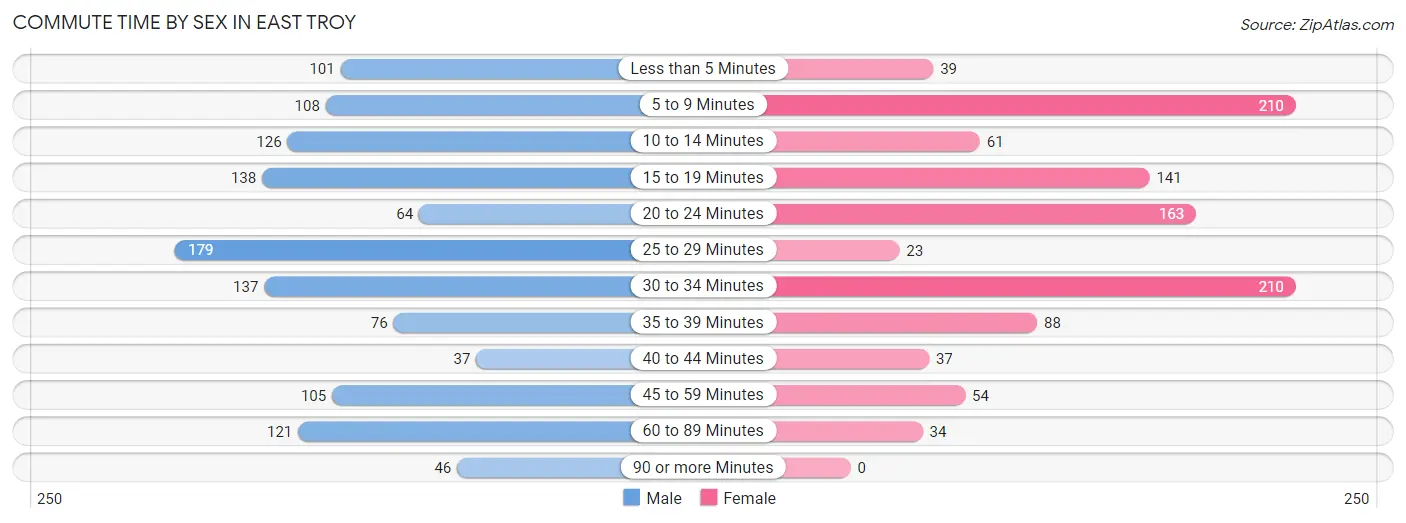
| Commute Time | Male | Female |
| Less than 5 Minutes | 101 (8.2%) | 39 (3.7%) |
| 5 to 9 Minutes | 108 (8.7%) | 210 (19.8%) |
| 10 to 14 Minutes | 126 (10.2%) | 61 (5.8%) |
| 15 to 19 Minutes | 138 (11.2%) | 141 (13.3%) |
| 20 to 24 Minutes | 64 (5.2%) | 163 (15.4%) |
| 25 to 29 Minutes | 179 (14.5%) | 23 (2.2%) |
| 30 to 34 Minutes | 137 (11.1%) | 210 (19.8%) |
| 35 to 39 Minutes | 76 (6.1%) | 88 (8.3%) |
| 40 to 44 Minutes | 37 (3.0%) | 37 (3.5%) |
| 45 to 59 Minutes | 105 (8.5%) | 54 (5.1%) |
| 60 to 89 Minutes | 121 (9.8%) | 34 (3.2%) |
| 90 or more Minutes | 46 (3.7%) | 0 (0.0%) |
Time of Departure to Work by Sex in East Troy
The most frequent times of departure to work in East Troy are 5:30 AM to 5:59 AM (159, 12.8%) for males and 7:00 AM to 7:29 AM (277, 26.1%) for females.
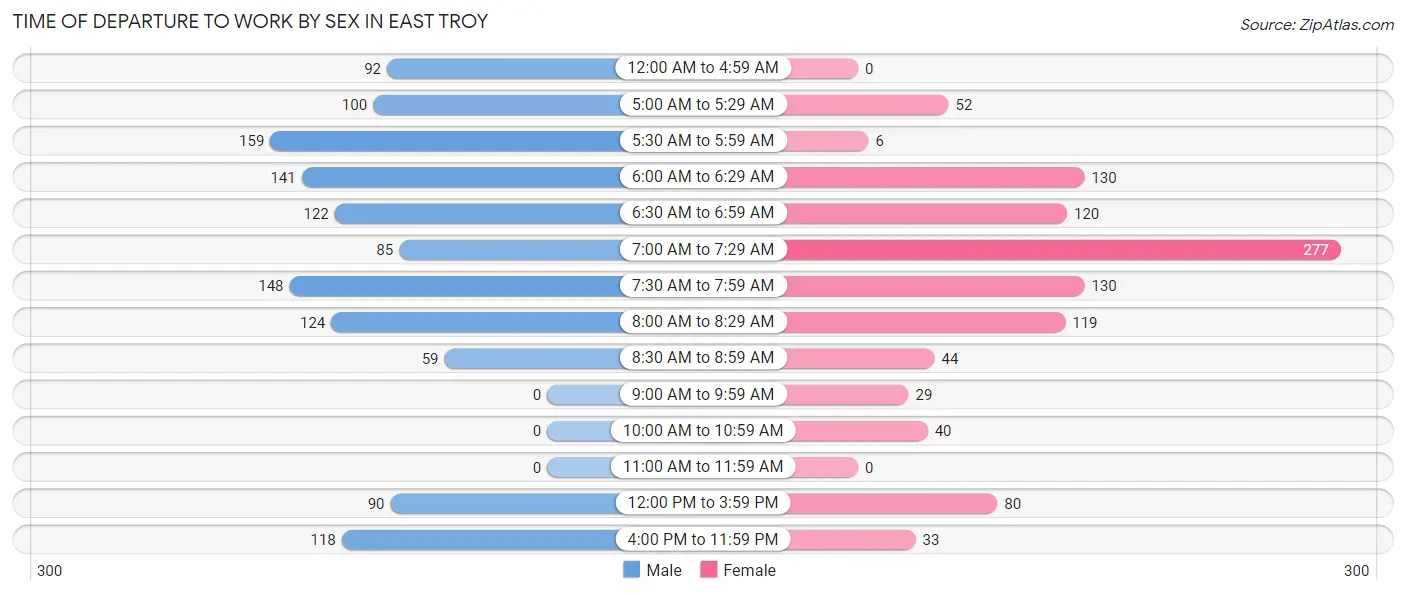
| Time of Departure | Male | Female |
| 12:00 AM to 4:59 AM | 92 (7.4%) | 0 (0.0%) |
| 5:00 AM to 5:29 AM | 100 (8.1%) | 52 (4.9%) |
| 5:30 AM to 5:59 AM | 159 (12.8%) | 6 (0.6%) |
| 6:00 AM to 6:29 AM | 141 (11.4%) | 130 (12.3%) |
| 6:30 AM to 6:59 AM | 122 (9.9%) | 120 (11.3%) |
| 7:00 AM to 7:29 AM | 85 (6.9%) | 277 (26.1%) |
| 7:30 AM to 7:59 AM | 148 (11.9%) | 130 (12.3%) |
| 8:00 AM to 8:29 AM | 124 (10.0%) | 119 (11.2%) |
| 8:30 AM to 8:59 AM | 59 (4.8%) | 44 (4.2%) |
| 9:00 AM to 9:59 AM | 0 (0.0%) | 29 (2.7%) |
| 10:00 AM to 10:59 AM | 0 (0.0%) | 40 (3.8%) |
| 11:00 AM to 11:59 AM | 0 (0.0%) | 0 (0.0%) |
| 12:00 PM to 3:59 PM | 90 (7.3%) | 80 (7.5%) |
| 4:00 PM to 11:59 PM | 118 (9.5%) | 33 (3.1%) |
| Total | 1,238 (100.0%) | 1,060 (100.0%) |
Housing Occupancy in East Troy
Occupancy by Ownership in East Troy
Of the total 2,055 dwellings in East Troy, owner-occupied units account for 1,278 (62.2%), while renter-occupied units make up 777 (37.8%).
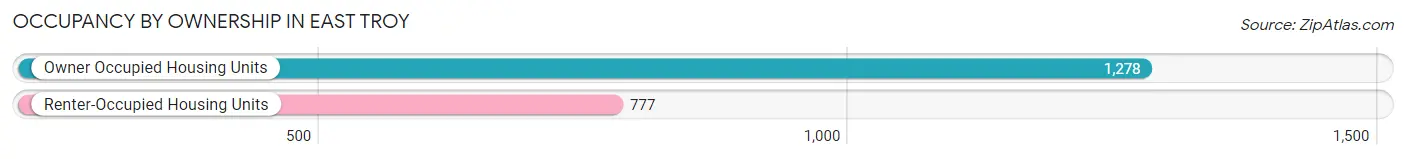
| Occupancy | # Housing Units | % Housing Units |
| Owner Occupied Housing Units | 1,278 | 62.2% |
| Renter-Occupied Housing Units | 777 | 37.8% |
| Total Occupied Housing Units | 2,055 | 100.0% |
Occupancy by Household Size in East Troy
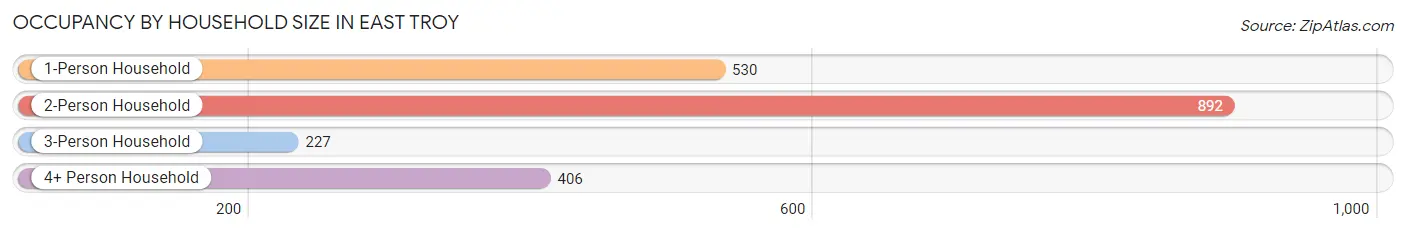
| Household Size | # Housing Units | % Housing Units |
| 1-Person Household | 530 | 25.8% |
| 2-Person Household | 892 | 43.4% |
| 3-Person Household | 227 | 11.1% |
| 4+ Person Household | 406 | 19.8% |
| Total Housing Units | 2,055 | 100.0% |
Occupancy by Ownership by Household Size in East Troy
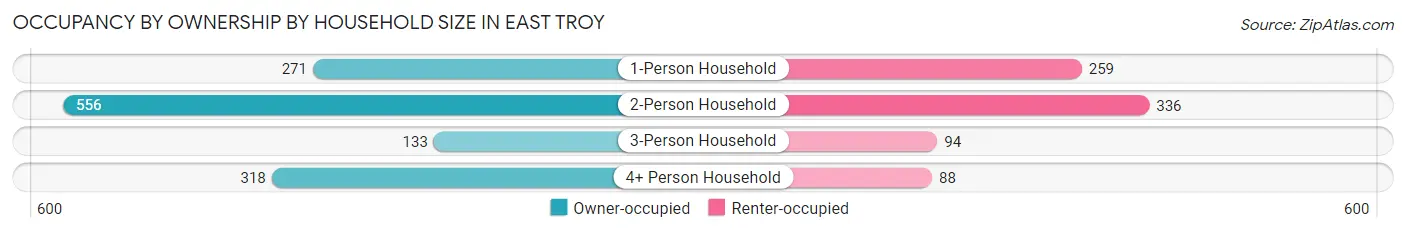
| Household Size | Owner-occupied | Renter-occupied |
| 1-Person Household | 271 (51.1%) | 259 (48.9%) |
| 2-Person Household | 556 (62.3%) | 336 (37.7%) |
| 3-Person Household | 133 (58.6%) | 94 (41.4%) |
| 4+ Person Household | 318 (78.3%) | 88 (21.7%) |
| Total Housing Units | 1,278 (62.2%) | 777 (37.8%) |
Occupancy by Educational Attainment in East Troy
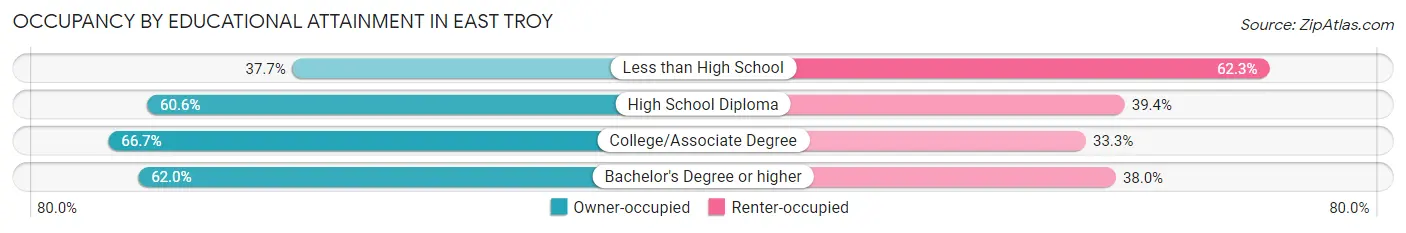
| Household Size | Owner-occupied | Renter-occupied |
| Less than High School | 29 (37.7%) | 48 (62.3%) |
| High School Diploma | 410 (60.6%) | 267 (39.4%) |
| College/Associate Degree | 461 (66.7%) | 230 (33.3%) |
| Bachelor's Degree or higher | 378 (62.0%) | 232 (38.0%) |
Occupancy by Age of Householder in East Troy
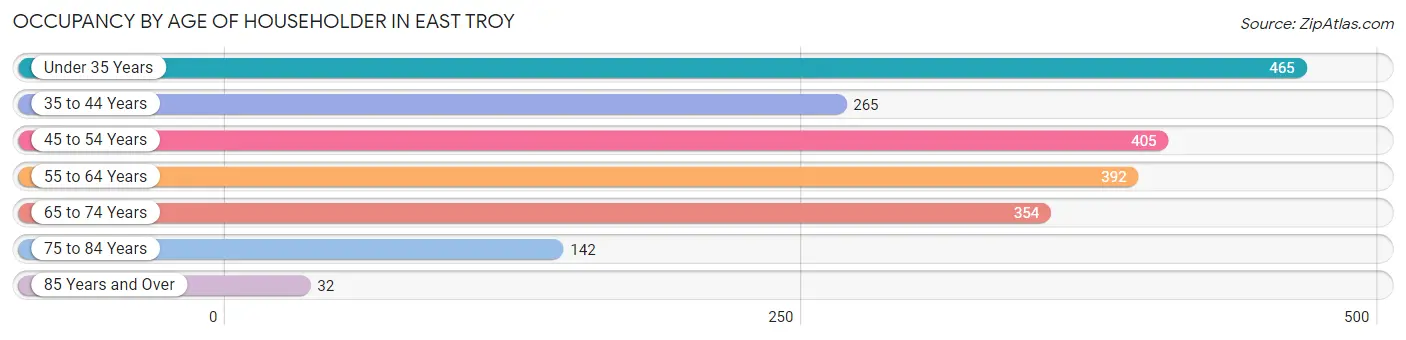
| Age Bracket | # Households | % Households |
| Under 35 Years | 465 | 22.6% |
| 35 to 44 Years | 265 | 12.9% |
| 45 to 54 Years | 405 | 19.7% |
| 55 to 64 Years | 392 | 19.1% |
| 65 to 74 Years | 354 | 17.2% |
| 75 to 84 Years | 142 | 6.9% |
| 85 Years and Over | 32 | 1.6% |
| Total | 2,055 | 100.0% |
Housing Finances in East Troy
Median Income by Occupancy in East Troy
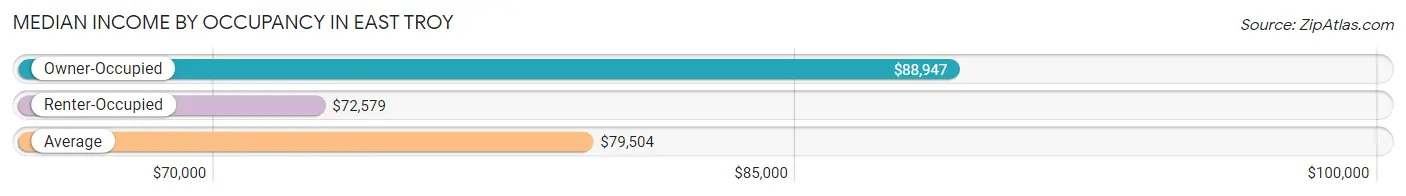
| Occupancy Type | # Households | Median Income |
| Owner-Occupied | 1,278 (62.2%) | $88,947 |
| Renter-Occupied | 777 (37.8%) | $72,579 |
| Average | 2,055 (100.0%) | $79,504 |
Occupancy by Householder Income Bracket in East Troy
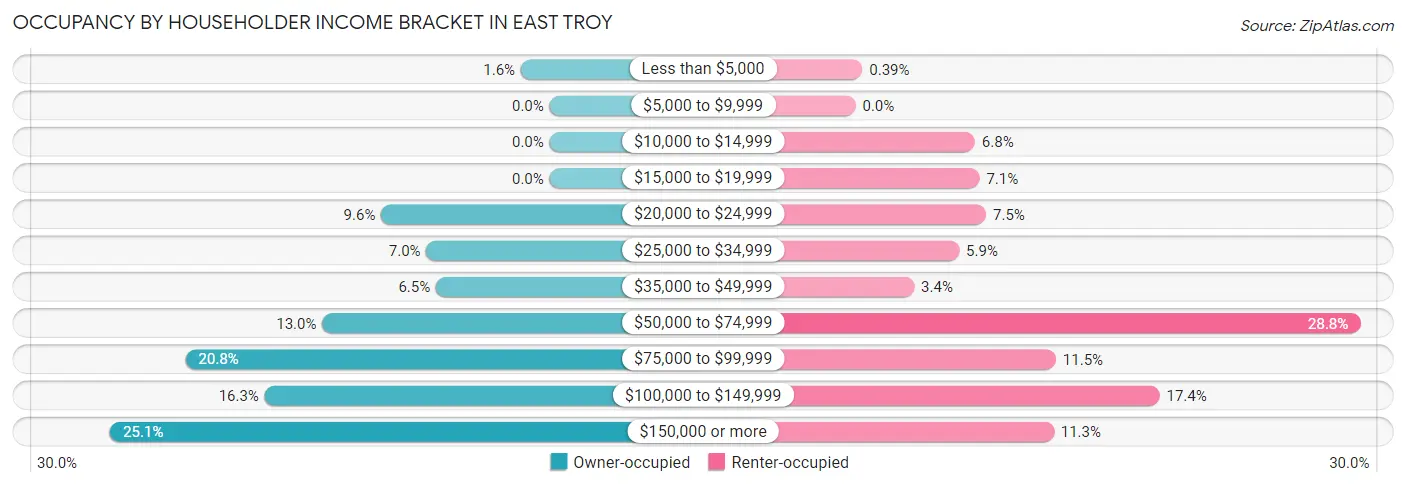
| Income Bracket | Owner-occupied | Renter-occupied |
| Less than $5,000 | 21 (1.6%) | 3 (0.4%) |
| $5,000 to $9,999 | 0 (0.0%) | 0 (0.0%) |
| $10,000 to $14,999 | 0 (0.0%) | 53 (6.8%) |
| $15,000 to $19,999 | 0 (0.0%) | 55 (7.1%) |
| $20,000 to $24,999 | 123 (9.6%) | 58 (7.5%) |
| $25,000 to $34,999 | 90 (7.0%) | 46 (5.9%) |
| $35,000 to $49,999 | 83 (6.5%) | 26 (3.4%) |
| $50,000 to $74,999 | 166 (13.0%) | 224 (28.8%) |
| $75,000 to $99,999 | 266 (20.8%) | 89 (11.5%) |
| $100,000 to $149,999 | 208 (16.3%) | 135 (17.4%) |
| $150,000 or more | 321 (25.1%) | 88 (11.3%) |
| Total | 1,278 (100.0%) | 777 (100.0%) |
Monthly Housing Cost Tiers in East Troy
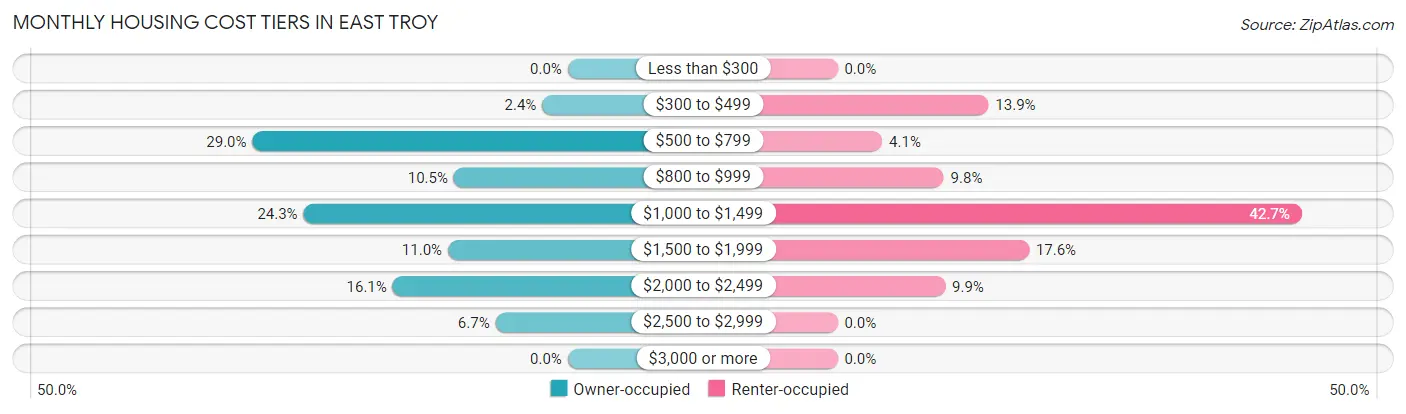
| Monthly Cost | Owner-occupied | Renter-occupied |
| Less than $300 | 0 (0.0%) | 0 (0.0%) |
| $300 to $499 | 30 (2.4%) | 108 (13.9%) |
| $500 to $799 | 371 (29.0%) | 32 (4.1%) |
| $800 to $999 | 134 (10.5%) | 76 (9.8%) |
| $1,000 to $1,499 | 311 (24.3%) | 332 (42.7%) |
| $1,500 to $1,999 | 141 (11.0%) | 137 (17.6%) |
| $2,000 to $2,499 | 206 (16.1%) | 77 (9.9%) |
| $2,500 to $2,999 | 85 (6.7%) | 0 (0.0%) |
| $3,000 or more | 0 (0.0%) | 0 (0.0%) |
| Total | 1,278 (100.0%) | 777 (100.0%) |
Physical Housing Characteristics in East Troy
Housing Structures in East Troy
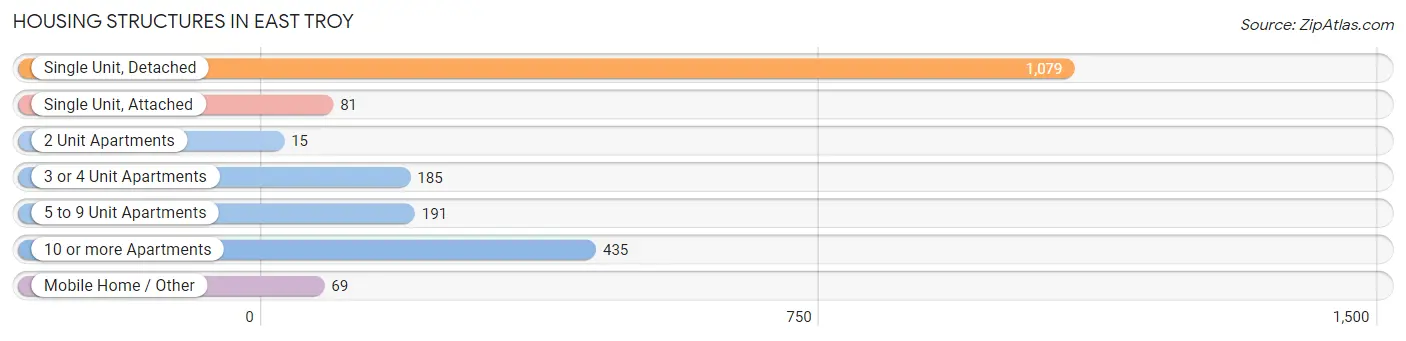
| Structure Type | # Housing Units | % Housing Units |
| Single Unit, Detached | 1,079 | 52.5% |
| Single Unit, Attached | 81 | 3.9% |
| 2 Unit Apartments | 15 | 0.7% |
| 3 or 4 Unit Apartments | 185 | 9.0% |
| 5 to 9 Unit Apartments | 191 | 9.3% |
| 10 or more Apartments | 435 | 21.2% |
| Mobile Home / Other | 69 | 3.4% |
| Total | 2,055 | 100.0% |
Housing Structures by Occupancy in East Troy
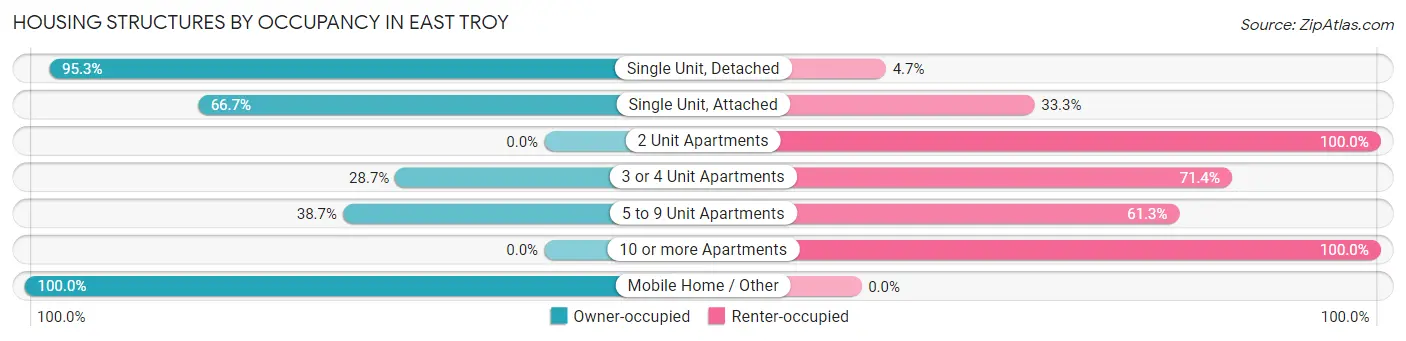
| Structure Type | Owner-occupied | Renter-occupied |
| Single Unit, Detached | 1,028 (95.3%) | 51 (4.7%) |
| Single Unit, Attached | 54 (66.7%) | 27 (33.3%) |
| 2 Unit Apartments | 0 (0.0%) | 15 (100.0%) |
| 3 or 4 Unit Apartments | 53 (28.6%) | 132 (71.4%) |
| 5 to 9 Unit Apartments | 74 (38.7%) | 117 (61.3%) |
| 10 or more Apartments | 0 (0.0%) | 435 (100.0%) |
| Mobile Home / Other | 69 (100.0%) | 0 (0.0%) |
| Total | 1,278 (62.2%) | 777 (37.8%) |
Housing Structures by Number of Rooms in East Troy
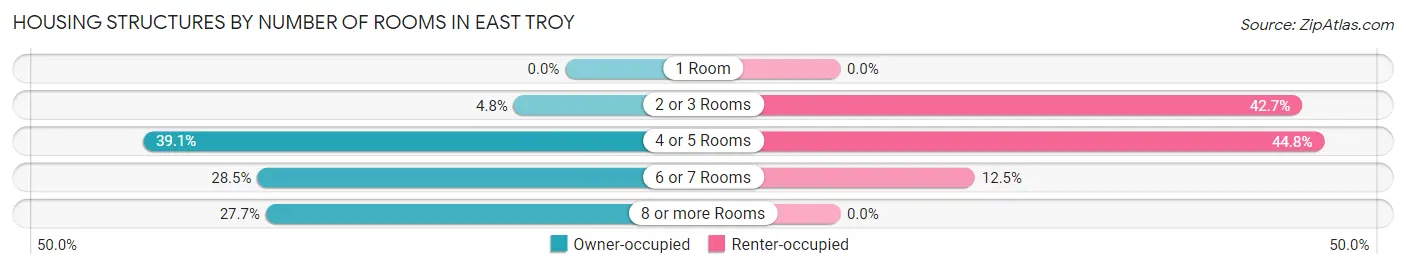
| Number of Rooms | Owner-occupied | Renter-occupied |
| 1 Room | 0 (0.0%) | 0 (0.0%) |
| 2 or 3 Rooms | 61 (4.8%) | 332 (42.7%) |
| 4 or 5 Rooms | 499 (39.1%) | 348 (44.8%) |
| 6 or 7 Rooms | 364 (28.5%) | 97 (12.5%) |
| 8 or more Rooms | 354 (27.7%) | 0 (0.0%) |
| Total | 1,278 (100.0%) | 777 (100.0%) |
Housing Structure by Heating Type in East Troy
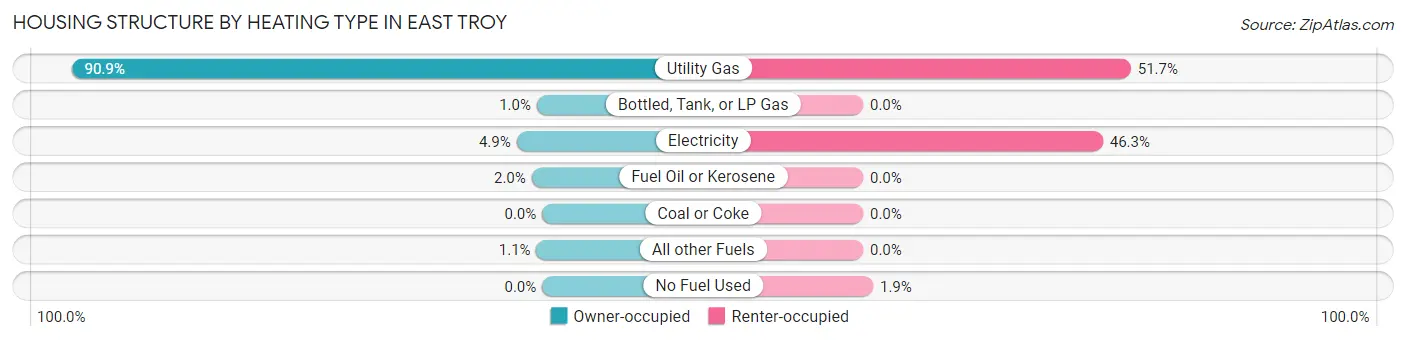
| Heating Type | Owner-occupied | Renter-occupied |
| Utility Gas | 1,162 (90.9%) | 402 (51.7%) |
| Bottled, Tank, or LP Gas | 13 (1.0%) | 0 (0.0%) |
| Electricity | 63 (4.9%) | 360 (46.3%) |
| Fuel Oil or Kerosene | 26 (2.0%) | 0 (0.0%) |
| Coal or Coke | 0 (0.0%) | 0 (0.0%) |
| All other Fuels | 14 (1.1%) | 0 (0.0%) |
| No Fuel Used | 0 (0.0%) | 15 (1.9%) |
| Total | 1,278 (100.0%) | 777 (100.0%) |
Household Vehicle Usage in East Troy
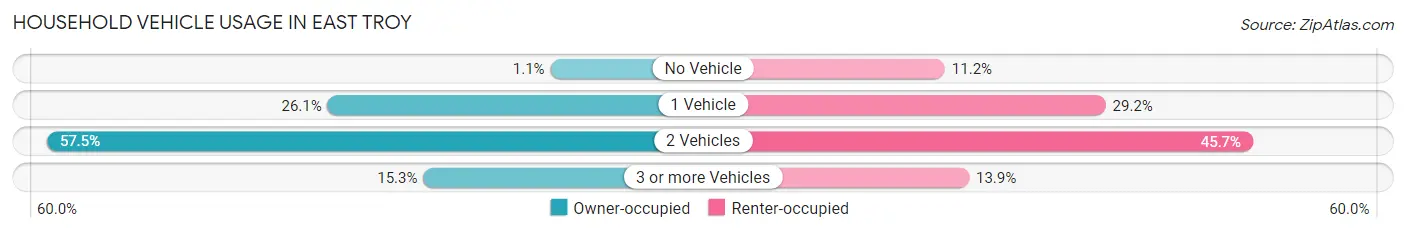
| Vehicles per Household | Owner-occupied | Renter-occupied |
| No Vehicle | 14 (1.1%) | 87 (11.2%) |
| 1 Vehicle | 333 (26.1%) | 227 (29.2%) |
| 2 Vehicles | 735 (57.5%) | 355 (45.7%) |
| 3 or more Vehicles | 196 (15.3%) | 108 (13.9%) |
| Total | 1,278 (100.0%) | 777 (100.0%) |
Real Estate & Mortgages in East Troy
Real Estate and Mortgage Overview in East Troy
| Characteristic | Without Mortgage | With Mortgage |
| Housing Units | 464 | 814 |
| Median Property Value | $247,400 | $241,500 |
| Median Household Income | $77,704 | $207 |
| Monthly Housing Costs | $750 | $0 |
| Real Estate Taxes | $4,391 | $0 |
Property Value by Mortgage Status in East Troy
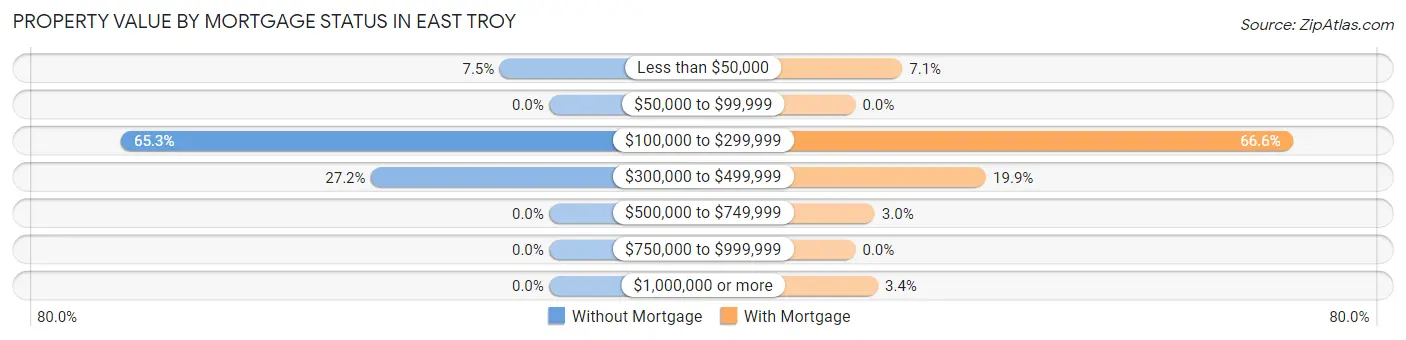
| Property Value | Without Mortgage | With Mortgage |
| Less than $50,000 | 35 (7.5%) | 58 (7.1%) |
| $50,000 to $99,999 | 0 (0.0%) | 0 (0.0%) |
| $100,000 to $299,999 | 303 (65.3%) | 542 (66.6%) |
| $300,000 to $499,999 | 126 (27.2%) | 162 (19.9%) |
| $500,000 to $749,999 | 0 (0.0%) | 24 (2.9%) |
| $750,000 to $999,999 | 0 (0.0%) | 0 (0.0%) |
| $1,000,000 or more | 0 (0.0%) | 28 (3.4%) |
| Total | 464 (100.0%) | 814 (100.0%) |
Household Income by Mortgage Status in East Troy
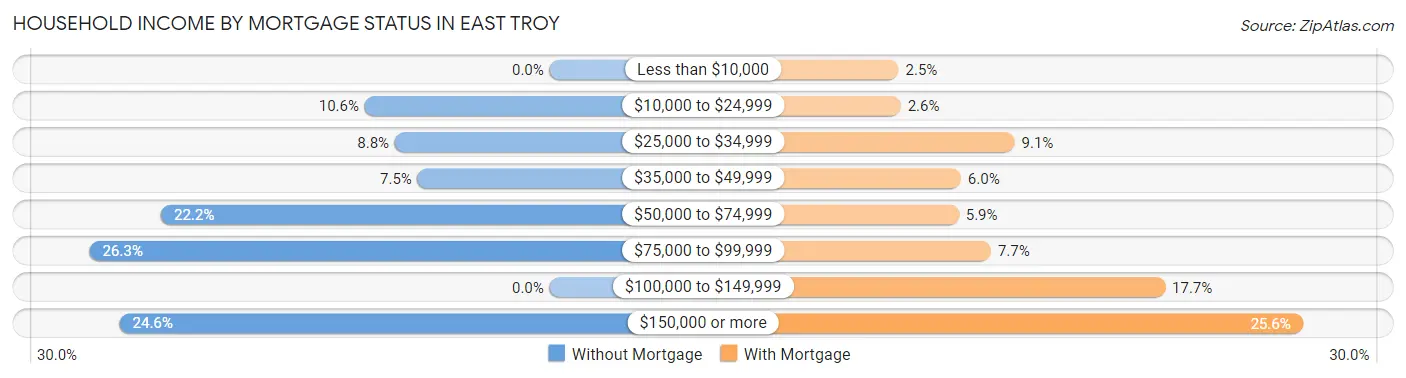
| Household Income | Without Mortgage | With Mortgage |
| Less than $10,000 | 0 (0.0%) | 20 (2.5%) |
| $10,000 to $24,999 | 49 (10.6%) | 21 (2.6%) |
| $25,000 to $34,999 | 41 (8.8%) | 74 (9.1%) |
| $35,000 to $49,999 | 35 (7.5%) | 49 (6.0%) |
| $50,000 to $74,999 | 103 (22.2%) | 48 (5.9%) |
| $75,000 to $99,999 | 122 (26.3%) | 63 (7.7%) |
| $100,000 to $149,999 | 0 (0.0%) | 144 (17.7%) |
| $150,000 or more | 114 (24.6%) | 208 (25.6%) |
| Total | 464 (100.0%) | 814 (100.0%) |
Property Value to Household Income Ratio in East Troy
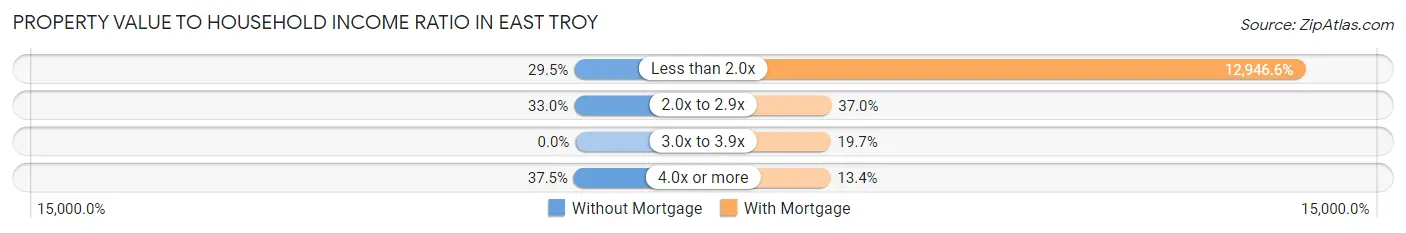
| Value-to-Income Ratio | Without Mortgage | With Mortgage |
| Less than 2.0x | 137 (29.5%) | 105,385 (12,946.6%) |
| 2.0x to 2.9x | 153 (33.0%) | 301 (37.0%) |
| 3.0x to 3.9x | 0 (0.0%) | 160 (19.7%) |
| 4.0x or more | 174 (37.5%) | 109 (13.4%) |
| Total | 464 (100.0%) | 814 (100.0%) |
Real Estate Taxes by Mortgage Status in East Troy
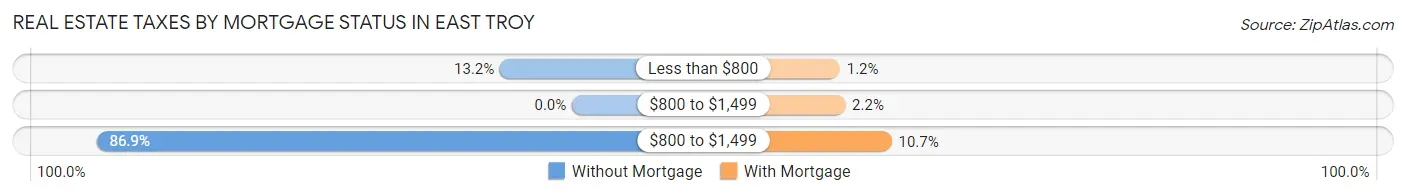
| Property Taxes | Without Mortgage | With Mortgage |
| Less than $800 | 61 (13.2%) | 10 (1.2%) |
| $800 to $1,499 | 0 (0.0%) | 18 (2.2%) |
| $800 to $1,499 | 403 (86.9%) | 87 (10.7%) |
| Total | 464 (100.0%) | 814 (100.0%) |
Health & Disability in East Troy
Health Insurance Coverage by Age in East Troy
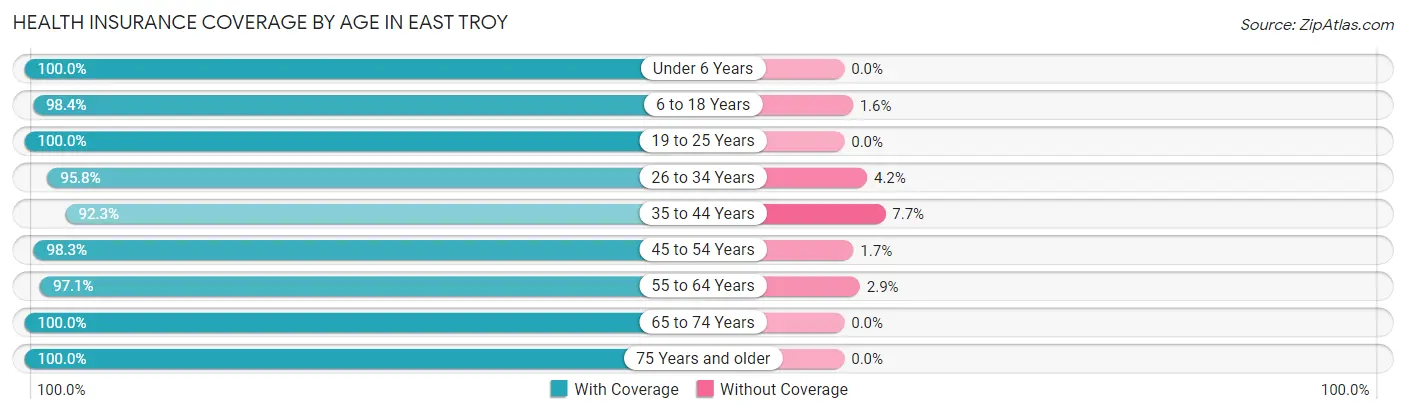
| Age Bracket | With Coverage | Without Coverage |
| Under 6 Years | 286 (100.0%) | 0 (0.0%) |
| 6 to 18 Years | 754 (98.4%) | 12 (1.6%) |
| 19 to 25 Years | 526 (100.0%) | 0 (0.0%) |
| 26 to 34 Years | 497 (95.8%) | 22 (4.2%) |
| 35 to 44 Years | 398 (92.3%) | 33 (7.7%) |
| 45 to 54 Years | 752 (98.3%) | 13 (1.7%) |
| 55 to 64 Years | 637 (97.1%) | 19 (2.9%) |
| 65 to 74 Years | 461 (100.0%) | 0 (0.0%) |
| 75 Years and older | 215 (100.0%) | 0 (0.0%) |
| Total | 4,526 (97.9%) | 99 (2.1%) |
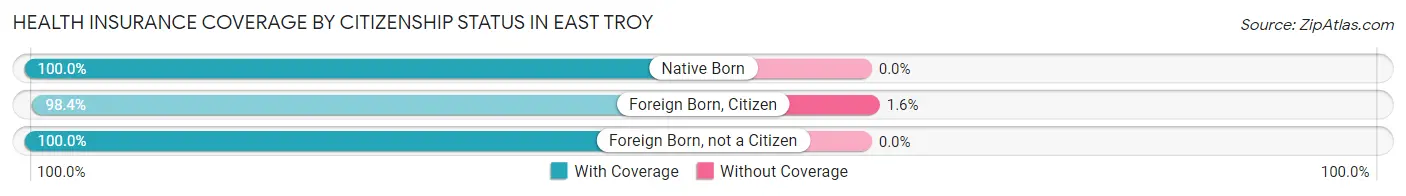
Health Insurance Coverage by Citizenship Status in East Troy
| Citizenship Status | With Coverage | Without Coverage |
| Native Born | 286 (100.0%) | 0 (0.0%) |
| Foreign Born, Citizen | 754 (98.4%) | 12 (1.6%) |
| Foreign Born, not a Citizen | 526 (100.0%) | 0 (0.0%) |
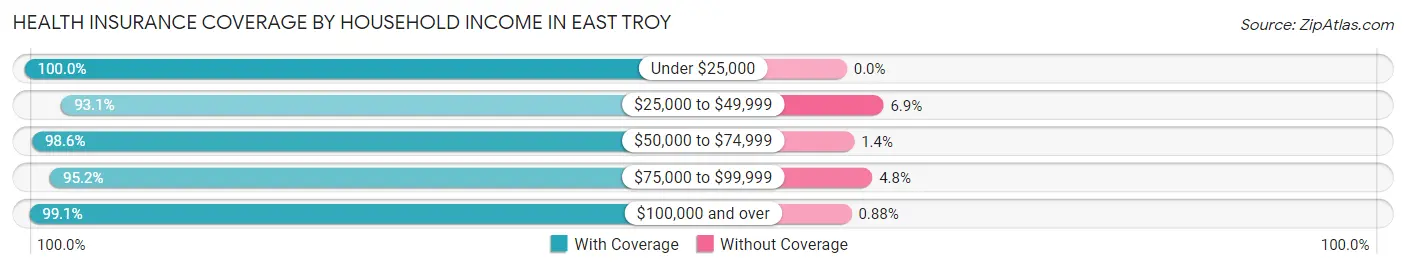
Health Insurance Coverage by Household Income in East Troy
| Household Income | With Coverage | Without Coverage |
| Under $25,000 | 387 (100.0%) | 0 (0.0%) |
| $25,000 to $49,999 | 420 (93.1%) | 31 (6.9%) |
| $50,000 to $74,999 | 711 (98.6%) | 10 (1.4%) |
| $75,000 to $99,999 | 759 (95.2%) | 38 (4.8%) |
| $100,000 and over | 2,246 (99.1%) | 20 (0.9%) |
Public vs Private Health Insurance Coverage by Age in East Troy
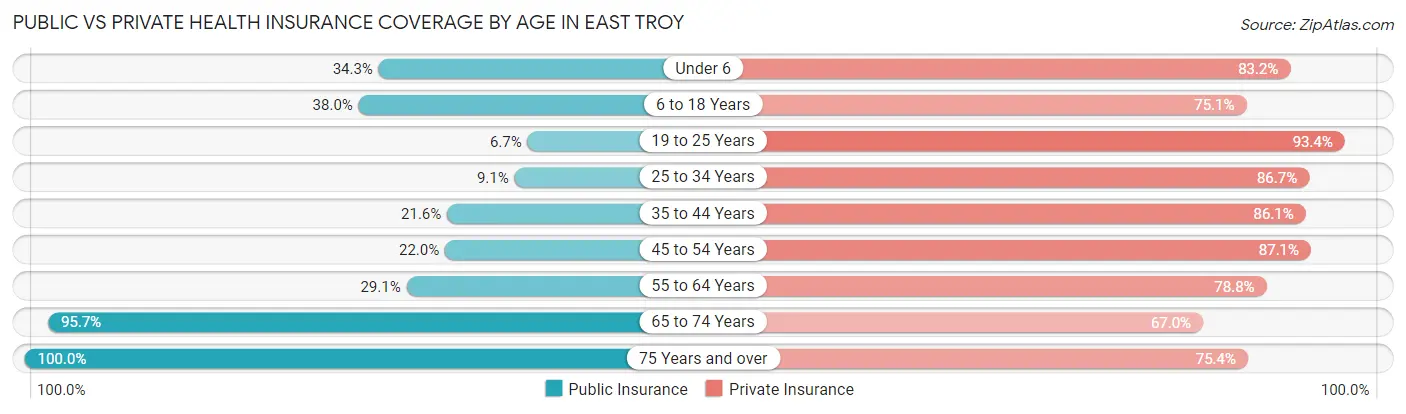
| Age Bracket | Public Insurance | Private Insurance |
| Under 6 | 98 (34.3%) | 238 (83.2%) |
| 6 to 18 Years | 291 (38.0%) | 575 (75.1%) |
| 19 to 25 Years | 35 (6.7%) | 491 (93.3%) |
| 25 to 34 Years | 47 (9.1%) | 450 (86.7%) |
| 35 to 44 Years | 93 (21.6%) | 371 (86.1%) |
| 45 to 54 Years | 168 (22.0%) | 666 (87.1%) |
| 55 to 64 Years | 191 (29.1%) | 517 (78.8%) |
| 65 to 74 Years | 441 (95.7%) | 309 (67.0%) |
| 75 Years and over | 215 (100.0%) | 162 (75.3%) |
| Total | 1,579 (34.1%) | 3,779 (81.7%) |
Disability Status by Sex by Age in East Troy
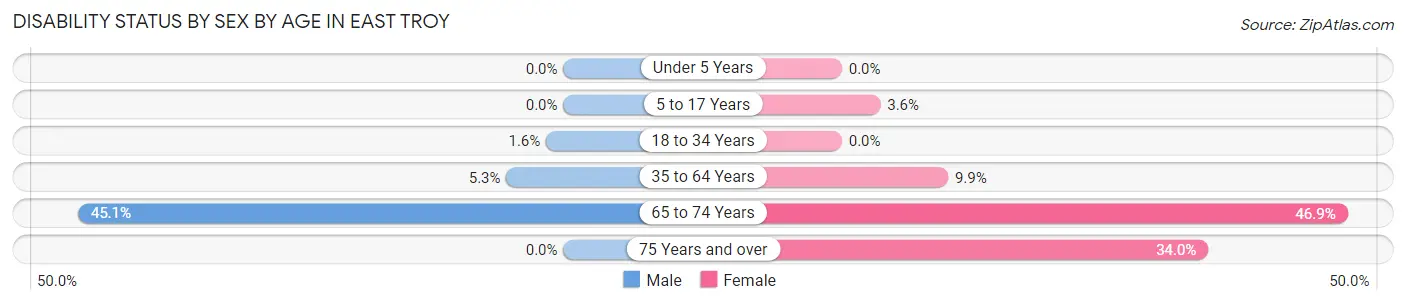
| Age Bracket | Male | Female |
| Under 5 Years | 0 (0.0%) | 0 (0.0%) |
| 5 to 17 Years | 0 (0.0%) | 13 (3.6%) |
| 18 to 34 Years | 8 (1.6%) | 0 (0.0%) |
| 35 to 64 Years | 47 (5.3%) | 95 (9.9%) |
| 65 to 74 Years | 105 (45.1%) | 107 (46.9%) |
| 75 Years and over | 0 (0.0%) | 51 (34.0%) |
Disability Class by Sex by Age in East Troy
Disability Class: Hearing Difficulty
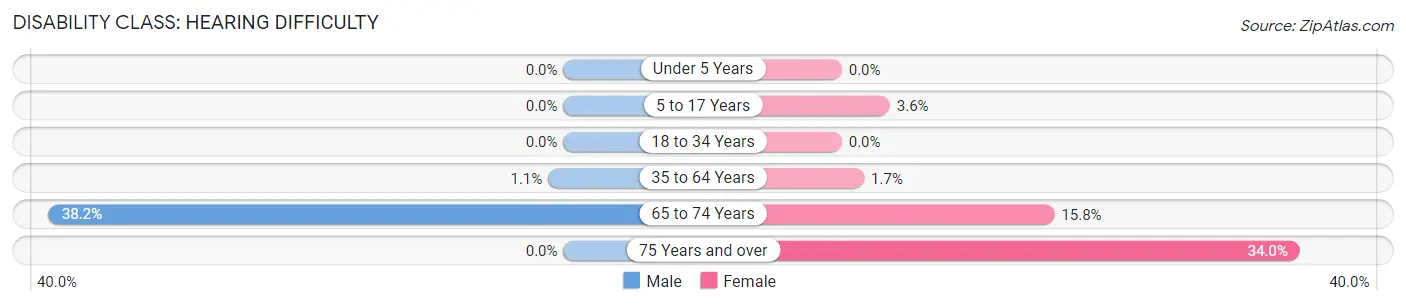
| Age Bracket | Male | Female |
| Under 5 Years | 0 (0.0%) | 0 (0.0%) |
| 5 to 17 Years | 0 (0.0%) | 13 (3.6%) |
| 18 to 34 Years | 0 (0.0%) | 0 (0.0%) |
| 35 to 64 Years | 10 (1.1%) | 16 (1.7%) |
| 65 to 74 Years | 89 (38.2%) | 36 (15.8%) |
| 75 Years and over | 0 (0.0%) | 51 (34.0%) |
Disability Class: Vision Difficulty
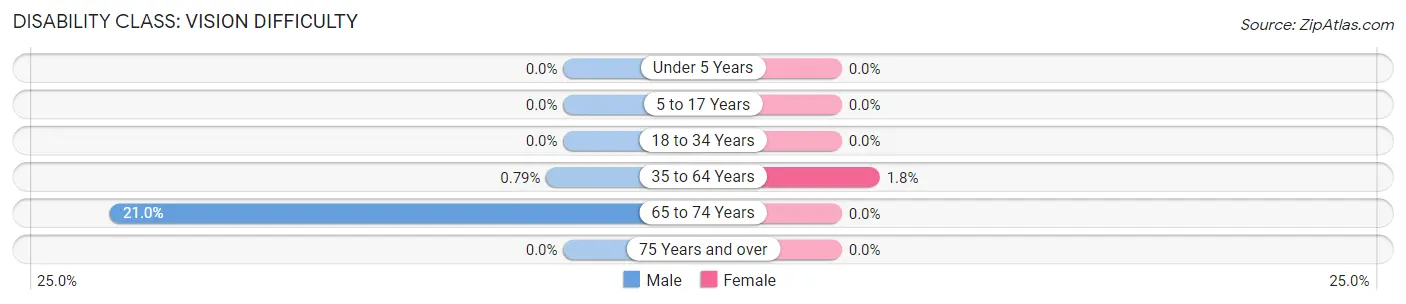
| Age Bracket | Male | Female |
| Under 5 Years | 0 (0.0%) | 0 (0.0%) |
| 5 to 17 Years | 0 (0.0%) | 0 (0.0%) |
| 18 to 34 Years | 0 (0.0%) | 0 (0.0%) |
| 35 to 64 Years | 7 (0.8%) | 17 (1.8%) |
| 65 to 74 Years | 49 (21.0%) | 0 (0.0%) |
| 75 Years and over | 0 (0.0%) | 0 (0.0%) |
Disability Class: Cognitive Difficulty
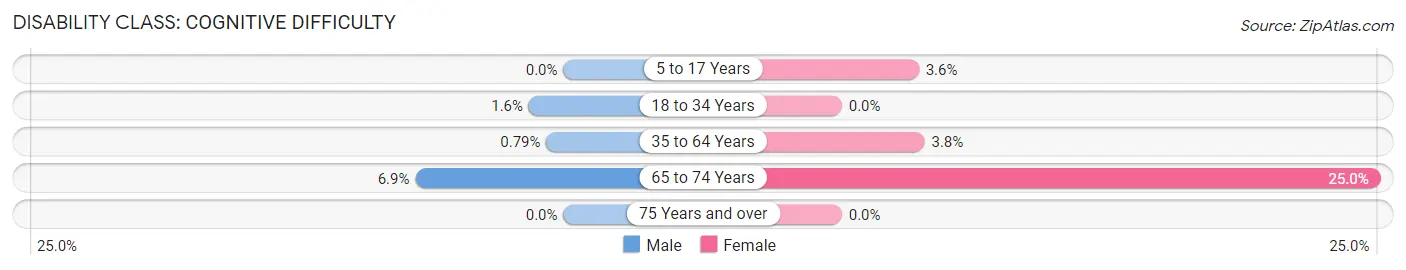
| Age Bracket | Male | Female |
| 5 to 17 Years | 0 (0.0%) | 13 (3.6%) |
| 18 to 34 Years | 8 (1.6%) | 0 (0.0%) |
| 35 to 64 Years | 7 (0.8%) | 37 (3.8%) |
| 65 to 74 Years | 16 (6.9%) | 57 (25.0%) |
| 75 Years and over | 0 (0.0%) | 0 (0.0%) |
Disability Class: Ambulatory Difficulty
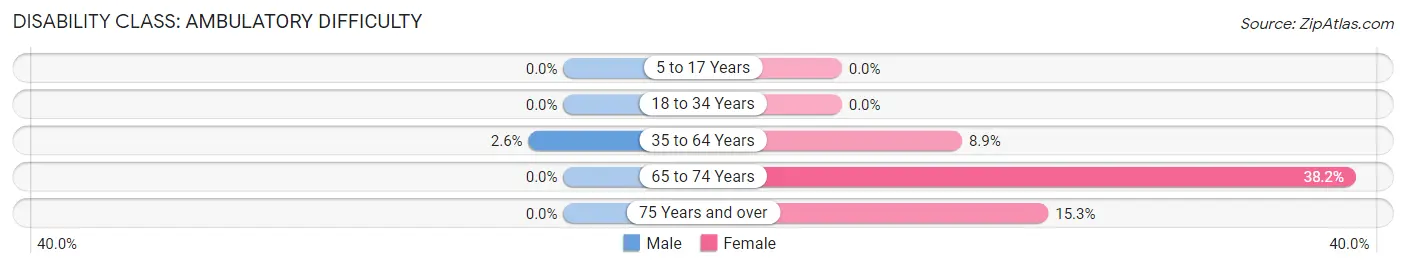
| Age Bracket | Male | Female |
| 5 to 17 Years | 0 (0.0%) | 0 (0.0%) |
| 18 to 34 Years | 0 (0.0%) | 0 (0.0%) |
| 35 to 64 Years | 23 (2.6%) | 86 (8.9%) |
| 65 to 74 Years | 0 (0.0%) | 87 (38.2%) |
| 75 Years and over | 0 (0.0%) | 23 (15.3%) |
Disability Class: Self-Care Difficulty
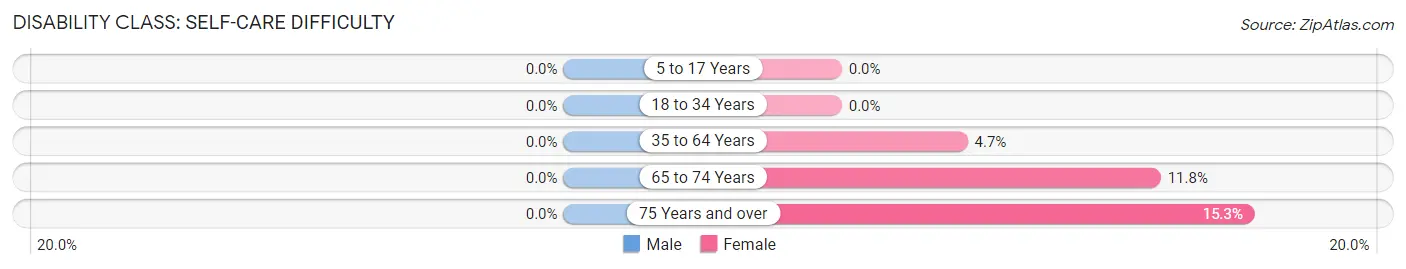
| Age Bracket | Male | Female |
| 5 to 17 Years | 0 (0.0%) | 0 (0.0%) |
| 18 to 34 Years | 0 (0.0%) | 0 (0.0%) |
| 35 to 64 Years | 0 (0.0%) | 45 (4.7%) |
| 65 to 74 Years | 0 (0.0%) | 27 (11.8%) |
| 75 Years and over | 0 (0.0%) | 23 (15.3%) |
Technology Access in East Troy
Computing Device Access in East Troy
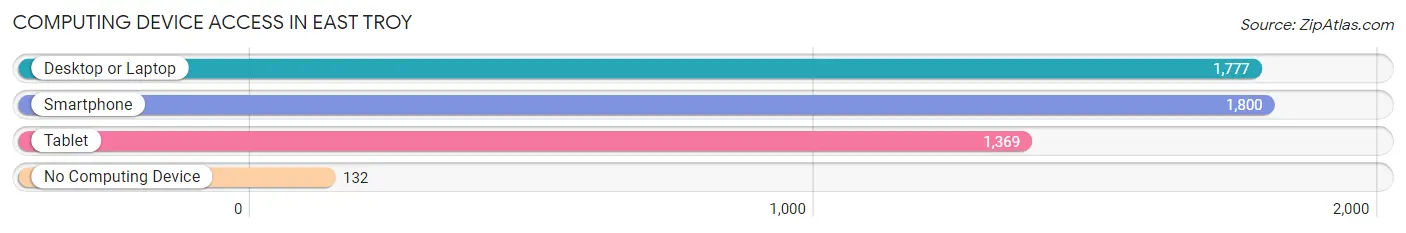
| Device Type | # Households | % Households |
| Desktop or Laptop | 1,777 | 86.5% |
| Smartphone | 1,800 | 87.6% |
| Tablet | 1,369 | 66.6% |
| No Computing Device | 132 | 6.4% |
| Total | 2,055 | 100.0% |
Internet Access in East Troy
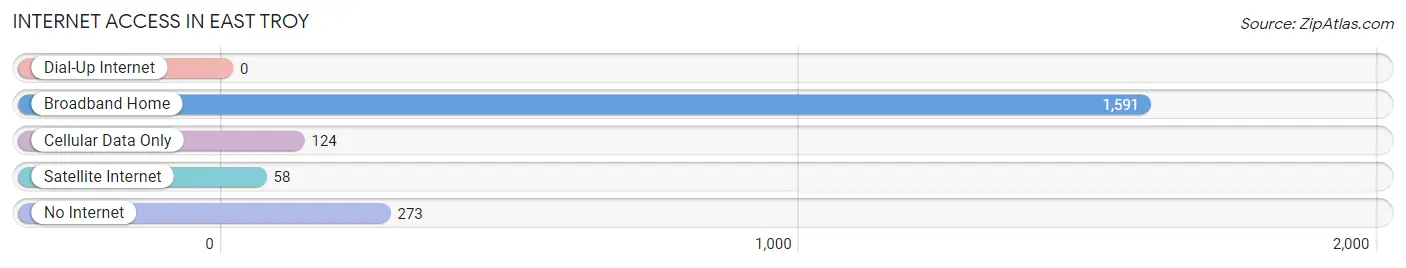
| Internet Type | # Households | % Households |
| Dial-Up Internet | 0 | 0.0% |
| Broadband Home | 1,591 | 77.4% |
| Cellular Data Only | 124 | 6.0% |
| Satellite Internet | 58 | 2.8% |
| No Internet | 273 | 13.3% |
| Total | 2,055 | 100.0% |
East Troy Summary
History
East Troy, Wisconsin is a small village located in Walworth County, Wisconsin. It is situated on the banks of the Fox River and is part of the Milwaukee metropolitan area. The village was first settled in 1836 by a group of settlers from New York. The settlers were attracted to the area due to its fertile soil and abundant natural resources. The village was originally known as Troy Center, but was later changed to East Troy in 1845.
The village was officially incorporated in 1846 and quickly grew in population and size. The village was home to a variety of businesses, including a sawmill, a gristmill, a blacksmith shop, and a general store. The village also had a post office, a school, and a church.
In the late 19th century, East Troy began to experience a period of growth and prosperity. The village was home to several factories, including a cheese factory, a canning factory, and a brickyard. The village also had a railroad station, which allowed for the transportation of goods and people.
In the early 20th century, East Troy continued to grow and prosper. The village was home to several businesses, including a bank, a hotel, a movie theater, and a variety of shops. The village also had a public library, a fire department, and a police department.
Geography
East Troy is located in Walworth County, Wisconsin. It is situated on the banks of the Fox River and is part of the Milwaukee metropolitan area. The village is located approximately 25 miles southwest of Milwaukee and 40 miles northwest of Chicago.
The village is located in a rural area and is surrounded by rolling hills and farmland. The village is located in a temperate climate, with hot summers and cold winters. The average annual temperature is around 50 degrees Fahrenheit.
Economy
East Troy is a small village with a population of approximately 4,000 people. The village is home to a variety of businesses, including a bank, a hotel, a movie theater, and a variety of shops. The village also has a public library, a fire department, and a police department.
The village is home to several factories, including a cheese factory, a canning factory, and a brickyard. The village also has a railroad station, which allows for the transportation of goods and people.
The village is home to several small businesses, including restaurants, bars, and retail stores. The village also has a variety of recreational activities, including golf courses, parks, and trails.
Demographics
As of the 2010 census, the population of East Troy was 4,281. The population is predominantly white, with a small percentage of African Americans, Asians, and Hispanics. The median age of the population is 43.7 years.
The median household income in East Troy is $50,945. The median home value is $179,400. The village has a high rate of homeownership, with approximately 75% of the population owning their own homes.
The village has a low unemployment rate, with only 4.2% of the population unemployed. The village also has a low poverty rate, with only 8.3% of the population living below the poverty line.
Common Questions
What is Per Capita Income in East Troy?
Per Capita income in East Troy is $42,350.
What is the Median Family Income in East Troy?
Median Family Income in East Troy is $93,269.
What is the Median Household income in East Troy?
Median Household Income in East Troy is $79,504.
What is Income or Wage Gap in East Troy?
Income or Wage Gap in East Troy is 37.5%.
Women in East Troy earn 62.5 cents for every dollar earned by a man.
What is Inequality or Gini Index in East Troy?
Inequality or Gini Index in East Troy is 0.39.
What is the Total Population of East Troy?
Total Population of East Troy is 4,669.
What is the Total Male Population of East Troy?
Total Male Population of East Troy is 2,330.
What is the Total Female Population of East Troy?
Total Female Population of East Troy is 2,339.
What is the Ratio of Males per 100 Females in East Troy?
There are 99.62 Males per 100 Females in East Troy.
What is the Ratio of Females per 100 Males in East Troy?
There are 100.39 Females per 100 Males in East Troy.
What is the Median Population Age in East Troy?
Median Population Age in East Troy is 38.7 Years.
What is the Average Family Size in East Troy
Average Family Size in East Troy is 2.7 People.
What is the Average Household Size in East Troy
Average Household Size in East Troy is 2.2 People.
How Large is the Labor Force in East Troy?
There are 2,671 People in the Labor Forcein in East Troy.
What is the Percentage of People in the Labor Force in East Troy?
70.0% of People are in the Labor Force in East Troy.
What is the Unemployment Rate in East Troy?
Unemployment Rate in East Troy is 2.0%.