Durand, WI Map & Demographics
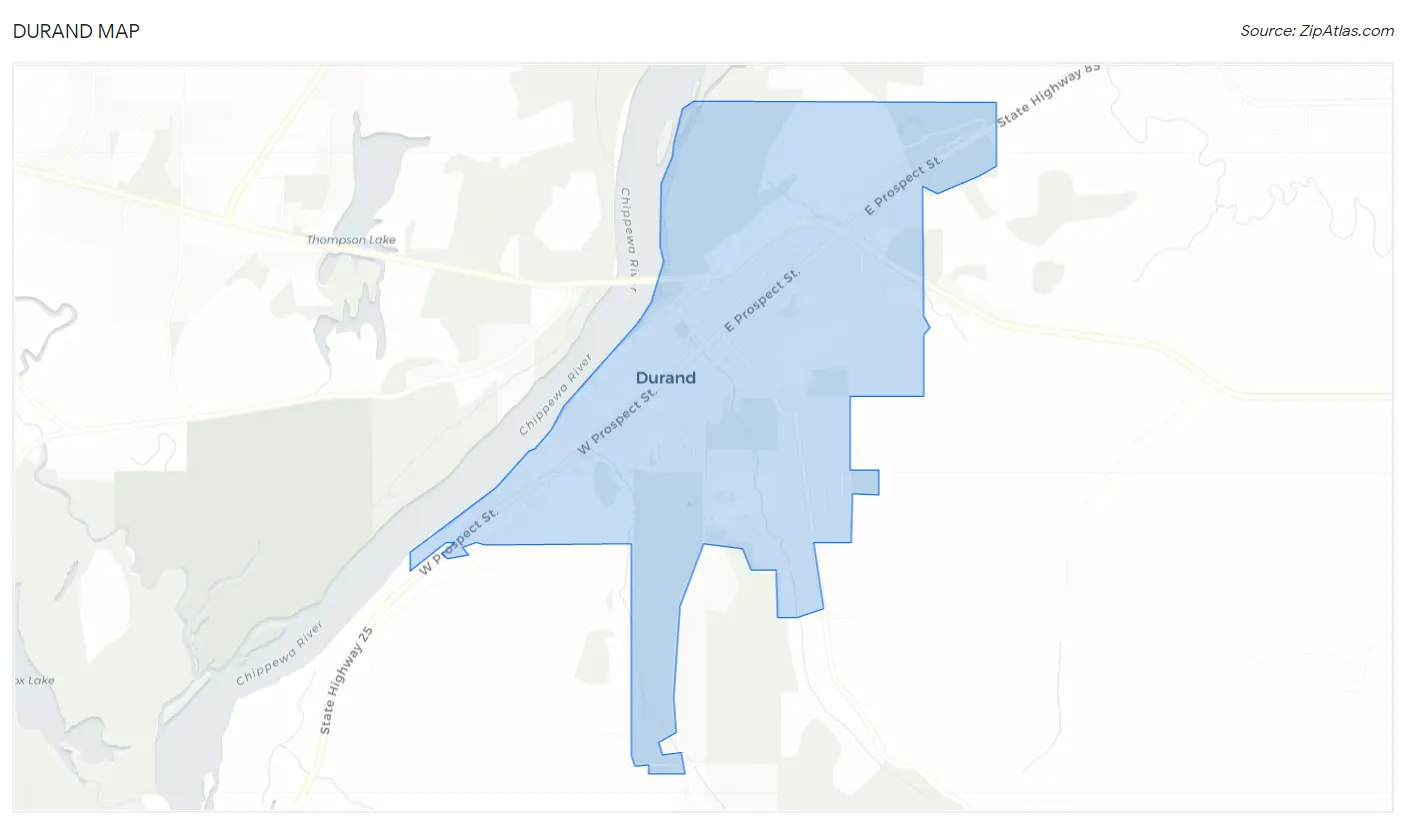
Durand Map
Durand Overview
$34,784
PER CAPITA INCOME
$77,204
AVG FAMILY INCOME
$54,237
AVG HOUSEHOLD INCOME
29.7%
WAGE / INCOME GAP [ % ]
70.3¢/ $1
WAGE / INCOME GAP [ $ ]
0.37
INEQUALITY / GINI INDEX
1,735
TOTAL POPULATION
758
MALE POPULATION
977
FEMALE POPULATION
77.58
MALES / 100 FEMALES
128.89
FEMALES / 100 MALES
46.9
MEDIAN AGE
2.6
AVG FAMILY SIZE
2.0
AVG HOUSEHOLD SIZE
836
LABOR FORCE [ PEOPLE ]
57.8%
PERCENT IN LABOR FORCE
1.7%
UNEMPLOYMENT RATE
Durand Zip Codes
Durand Area Codes
Income in Durand
Income Overview in Durand
Per Capita Income in Durand is $34,784, while median incomes of families and households are $77,204 and $54,237 respectively.
| Characteristic | Number | Measure |
| Per Capita Income | 1,735 | $34,784 |
| Median Family Income | 471 | $77,204 |
| Mean Family Income | 471 | $84,802 |
| Median Household Income | 856 | $54,237 |
| Mean Household Income | 856 | $70,654 |
| Income Deficit | 471 | $0 |
| Wage / Income Gap (%) | 1,735 | 29.66% |
| Wage / Income Gap ($) | 1,735 | 70.34¢ per $1 |
| Gini / Inequality Index | 1,735 | 0.37 |
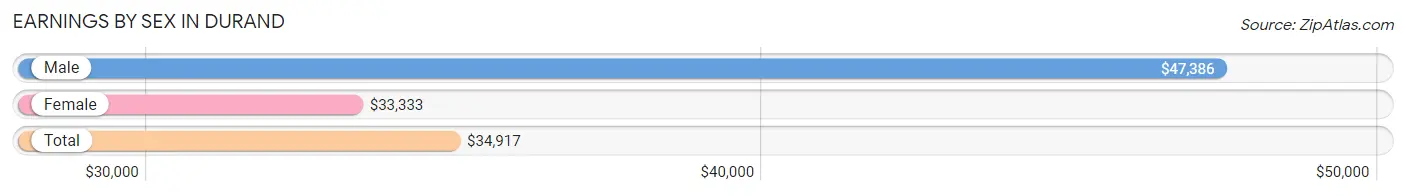
Earnings by Sex in Durand
Average Earnings in Durand are $34,917, $47,386 for men and $33,333 for women, a difference of 29.7%.
| Sex | Number | Average Earnings |
| Male | 418 (45.8%) | $47,386 |
| Female | 494 (54.2%) | $33,333 |
| Total | 912 (100.0%) | $34,917 |
Earnings by Sex by Income Bracket in Durand
The most common earnings brackets in Durand are $65,000 to $74,999 for men (56 | 13.4%) and $30,000 to $34,999 for women (114 | 23.1%).
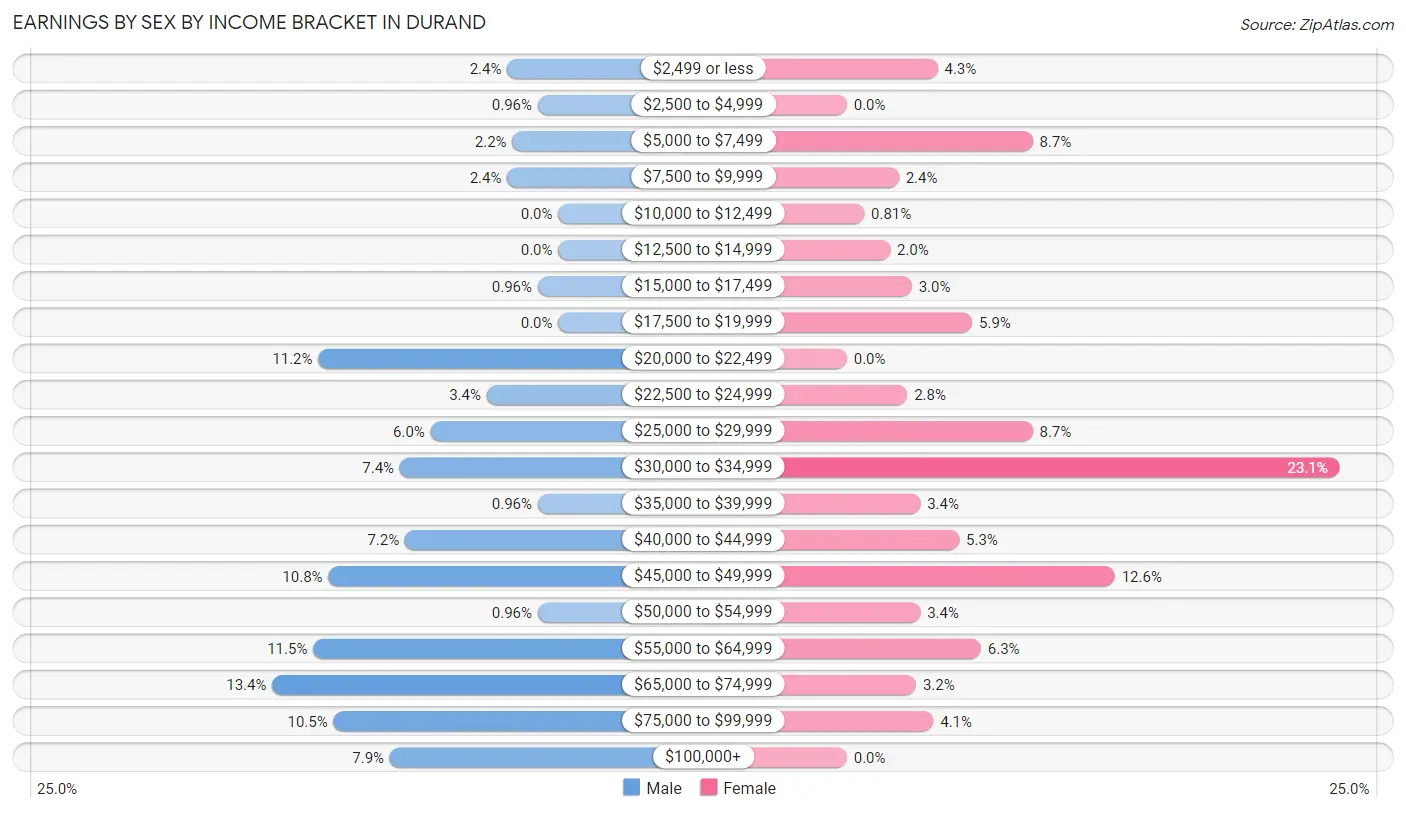
| Income | Male | Female |
| $2,499 or less | 10 (2.4%) | 21 (4.3%) |
| $2,500 to $4,999 | 4 (1.0%) | 0 (0.0%) |
| $5,000 to $7,499 | 9 (2.1%) | 43 (8.7%) |
| $7,500 to $9,999 | 10 (2.4%) | 12 (2.4%) |
| $10,000 to $12,499 | 0 (0.0%) | 4 (0.8%) |
| $12,500 to $14,999 | 0 (0.0%) | 10 (2.0%) |
| $15,000 to $17,499 | 4 (1.0%) | 15 (3.0%) |
| $17,500 to $19,999 | 0 (0.0%) | 29 (5.9%) |
| $20,000 to $22,499 | 47 (11.2%) | 0 (0.0%) |
| $22,500 to $24,999 | 14 (3.4%) | 14 (2.8%) |
| $25,000 to $29,999 | 25 (6.0%) | 43 (8.7%) |
| $30,000 to $34,999 | 31 (7.4%) | 114 (23.1%) |
| $35,000 to $39,999 | 4 (1.0%) | 17 (3.4%) |
| $40,000 to $44,999 | 30 (7.2%) | 26 (5.3%) |
| $45,000 to $49,999 | 45 (10.8%) | 62 (12.6%) |
| $50,000 to $54,999 | 4 (1.0%) | 17 (3.4%) |
| $55,000 to $64,999 | 48 (11.5%) | 31 (6.3%) |
| $65,000 to $74,999 | 56 (13.4%) | 16 (3.2%) |
| $75,000 to $99,999 | 44 (10.5%) | 20 (4.1%) |
| $100,000+ | 33 (7.9%) | 0 (0.0%) |
| Total | 418 (100.0%) | 494 (100.0%) |
Earnings by Sex by Educational Attainment in Durand
Average earnings in Durand are $48,516 for men and $34,710 for women, a difference of 28.5%. Men with an educational attainment of college or associate's degree enjoy the highest average annual earnings of $63,542, while those with high school diploma education earn the least with $37,500. Women with an educational attainment of graduate degree earn the most with the average annual earnings of $70,000, while those with high school diploma education have the smallest earnings of $29,688.
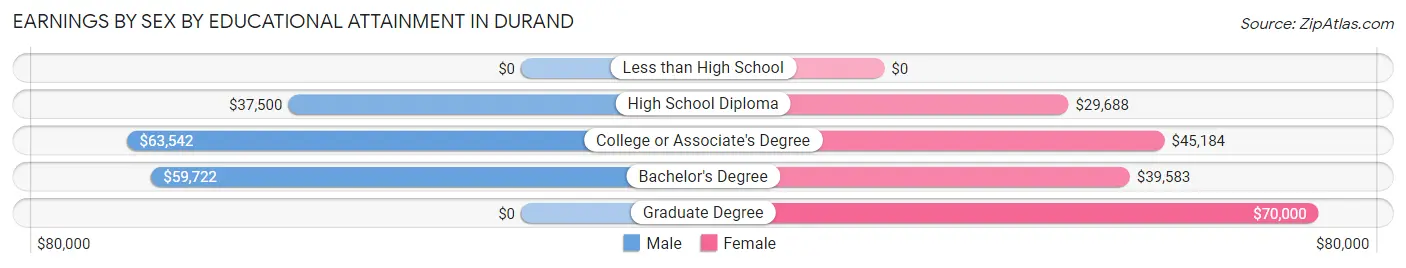
| Educational Attainment | Male Income | Female Income |
| Less than High School | - | - |
| High School Diploma | $37,500 | $29,688 |
| College or Associate's Degree | $63,542 | $45,184 |
| Bachelor's Degree | $59,722 | $39,583 |
| Graduate Degree | - | - |
| Total | $48,516 | $34,710 |
Family Income in Durand
Family Income Brackets in Durand
According to the Durand family income data, there are 136 families falling into the $75,000 to $99,999 income range, which is the most common income bracket and makes up 28.9% of all families.
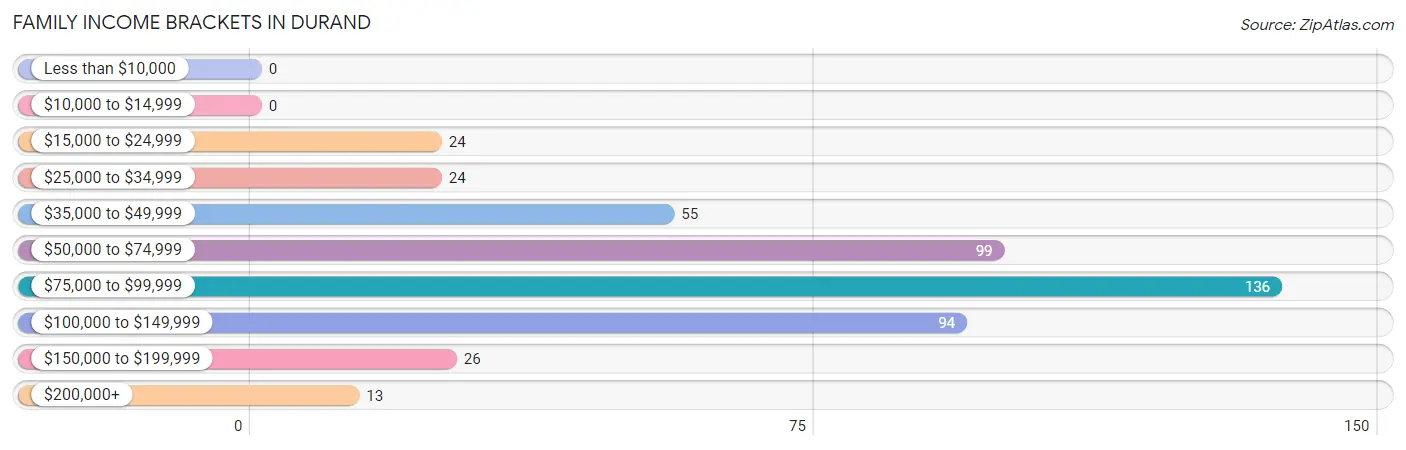
| Income Bracket | # Families | % Families |
| Less than $10,000 | 0 | 0.0% |
| $10,000 to $14,999 | 0 | 0.0% |
| $15,000 to $24,999 | 24 | 5.1% |
| $25,000 to $34,999 | 24 | 5.1% |
| $35,000 to $49,999 | 55 | 11.7% |
| $50,000 to $74,999 | 99 | 21.0% |
| $75,000 to $99,999 | 136 | 28.9% |
| $100,000 to $149,999 | 94 | 20.0% |
| $150,000 to $199,999 | 26 | 5.5% |
| $200,000+ | 13 | 2.8% |
Family Income by Famaliy Size in Durand
6-person families (17 | 3.6%) account for the highest median family income in Durand with $157,750 per family, while 2-person families (281 | 59.7%) have the highest median income of $38,686 per family member.
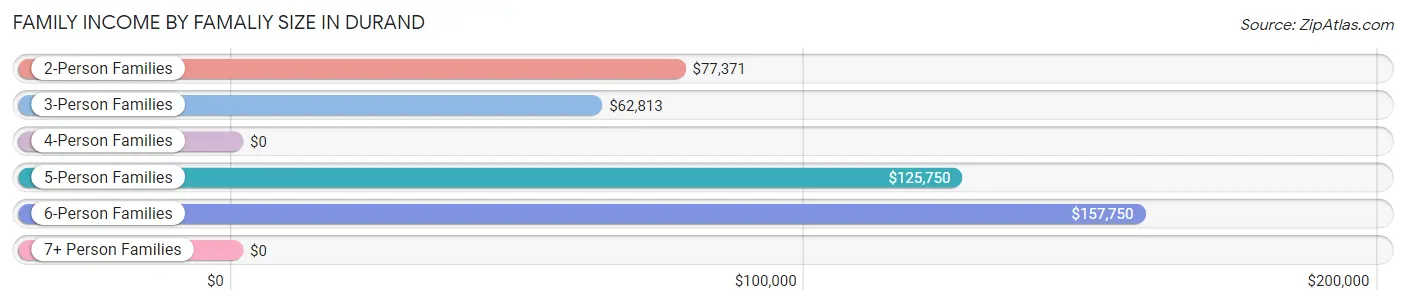
| Income Bracket | # Families | Median Income |
| 2-Person Families | 281 (59.7%) | $77,371 |
| 3-Person Families | 103 (21.9%) | $62,813 |
| 4-Person Families | 47 (10.0%) | $0 |
| 5-Person Families | 23 (4.9%) | $125,750 |
| 6-Person Families | 17 (3.6%) | $157,750 |
| 7+ Person Families | 0 (0.0%) | $0 |
| Total | 471 (100.0%) | $77,204 |
Family Income by Number of Earners in Durand
The median family income in Durand is $77,204, with families comprising 3+ earners (27) having the highest median family income of $104,844, while families with no earners (71) have the lowest median family income of $46,250, accounting for 5.7% and 15.1% of families, respectively.
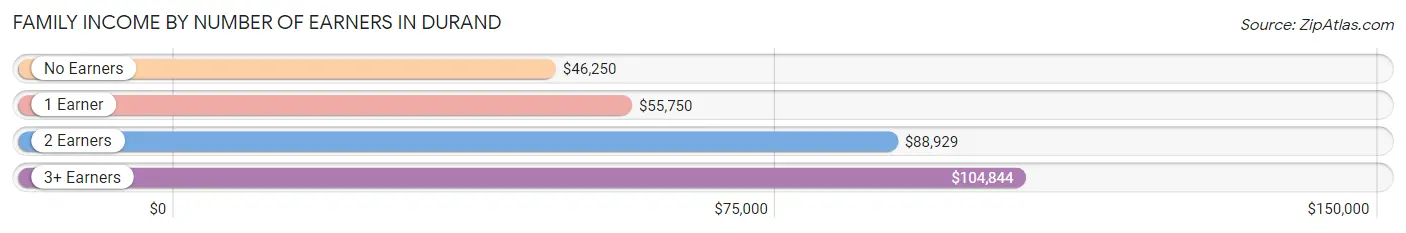
| Number of Earners | # Families | Median Income |
| No Earners | 71 (15.1%) | $46,250 |
| 1 Earner | 165 (35.0%) | $55,750 |
| 2 Earners | 208 (44.2%) | $88,929 |
| 3+ Earners | 27 (5.7%) | $104,844 |
| Total | 471 (100.0%) | $77,204 |
Household Income in Durand
Household Income Brackets in Durand
With 204 households falling in the category, the $50,000 to $74,999 income range is the most frequent in Durand, accounting for 23.8% of all households. In contrast, only 9 households (1.1%) fall into the less than $10,000 income bracket, making it the least populous group.
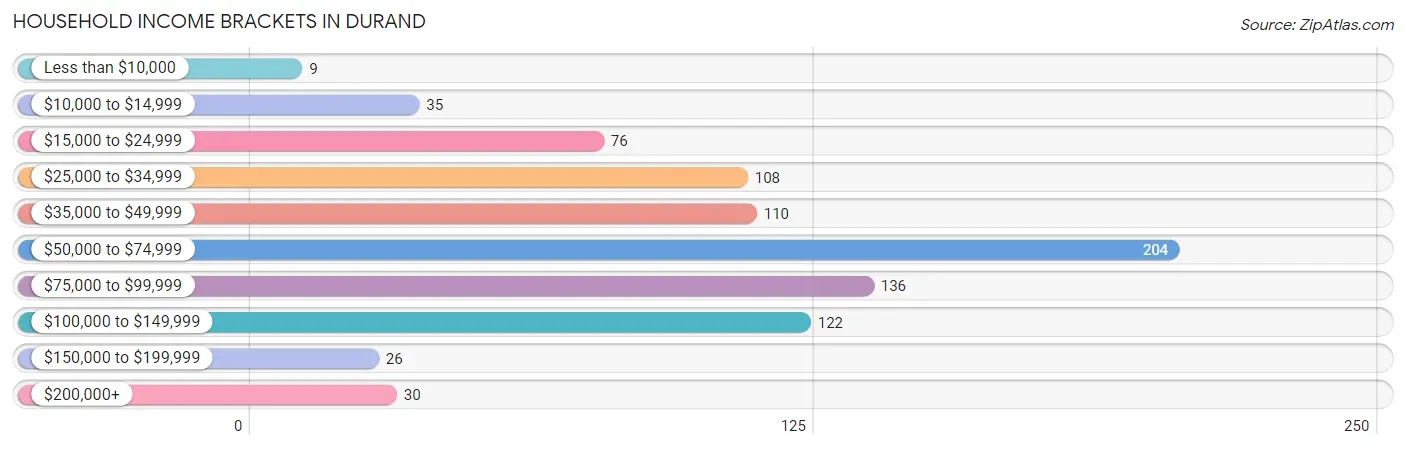
| Income Bracket | # Households | % Households |
| Less than $10,000 | 9 | 1.1% |
| $10,000 to $14,999 | 35 | 4.1% |
| $15,000 to $24,999 | 76 | 8.9% |
| $25,000 to $34,999 | 108 | 12.6% |
| $35,000 to $49,999 | 110 | 12.9% |
| $50,000 to $74,999 | 204 | 23.8% |
| $75,000 to $99,999 | 136 | 15.9% |
| $100,000 to $149,999 | 122 | 14.3% |
| $150,000 to $199,999 | 26 | 3.0% |
| $200,000+ | 30 | 3.5% |
Household Income by Householder Age in Durand
The median household income in Durand is $54,237, with the highest median household income of $75,150 found in the 45 to 64 years age bracket for the primary householder. A total of 227 households (26.5%) fall into this category. Meanwhile, the 15 to 24 years age bracket for the primary householder has the lowest median household income of $34,032, with 62 households (7.2%) in this group.
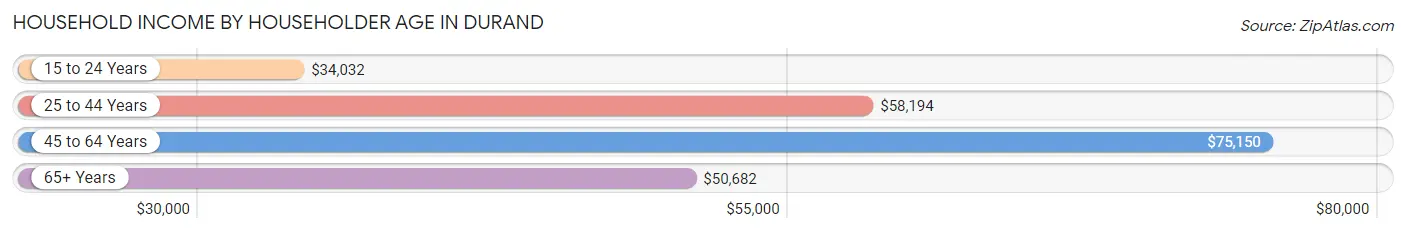
| Income Bracket | # Households | Median Income |
| 15 to 24 Years | 62 (7.2%) | $34,032 |
| 25 to 44 Years | 223 (26.1%) | $58,194 |
| 45 to 64 Years | 227 (26.5%) | $75,150 |
| 65+ Years | 344 (40.2%) | $50,682 |
| Total | 856 (100.0%) | $54,237 |
Poverty in Durand
Income Below Poverty by Sex and Age in Durand
With 4.6% poverty level for males and 9.3% for females among the residents of Durand, under 5 year old males and 25 to 34 year old females are the most vulnerable to poverty, with 14 males (26.9%) and 28 females (31.5%) in their respective age groups living below the poverty level.
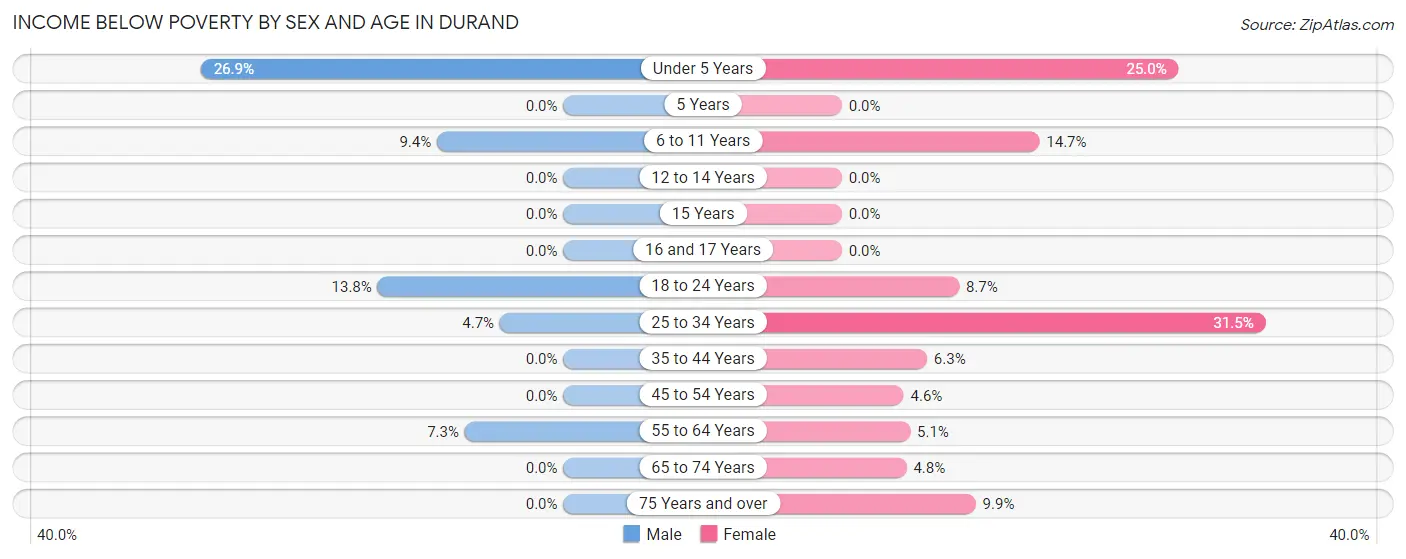
| Age Bracket | Male | Female |
| Under 5 Years | 14 (26.9%) | 4 (25.0%) |
| 5 Years | 0 (0.0%) | 0 (0.0%) |
| 6 to 11 Years | 6 (9.4%) | 11 (14.7%) |
| 12 to 14 Years | 0 (0.0%) | 0 (0.0%) |
| 15 Years | 0 (0.0%) | 0 (0.0%) |
| 16 and 17 Years | 0 (0.0%) | 0 (0.0%) |
| 18 to 24 Years | 4 (13.8%) | 8 (8.7%) |
| 25 to 34 Years | 4 (4.7%) | 28 (31.5%) |
| 35 to 44 Years | 0 (0.0%) | 6 (6.3%) |
| 45 to 54 Years | 0 (0.0%) | 5 (4.6%) |
| 55 to 64 Years | 6 (7.3%) | 7 (5.1%) |
| 65 to 74 Years | 0 (0.0%) | 6 (4.8%) |
| 75 Years and over | 0 (0.0%) | 16 (9.9%) |
| Total | 34 (4.6%) | 91 (9.3%) |
Income Above Poverty by Sex and Age in Durand
According to the poverty statistics in Durand, males aged 12 to 14 years and females aged 5 years are the age groups that are most secure financially, with 100.0% of males and 100.0% of females in these age groups living above the poverty line.
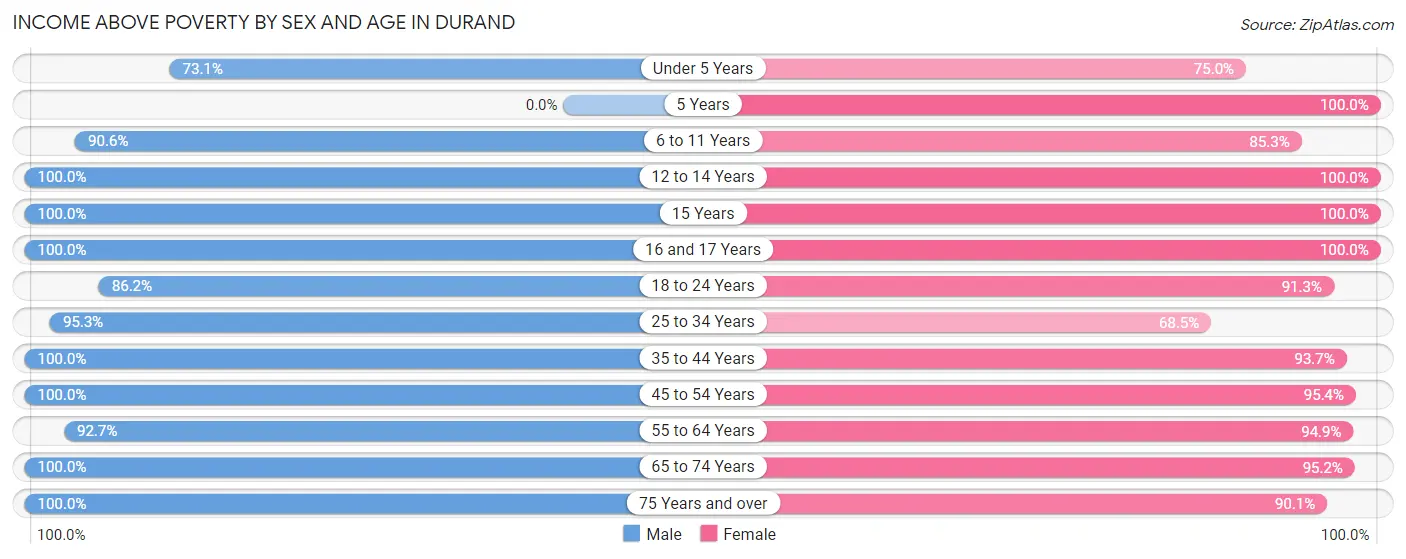
| Age Bracket | Male | Female |
| Under 5 Years | 38 (73.1%) | 12 (75.0%) |
| 5 Years | 0 (0.0%) | 14 (100.0%) |
| 6 to 11 Years | 58 (90.6%) | 64 (85.3%) |
| 12 to 14 Years | 24 (100.0%) | 30 (100.0%) |
| 15 Years | 4 (100.0%) | 10 (100.0%) |
| 16 and 17 Years | 10 (100.0%) | 21 (100.0%) |
| 18 to 24 Years | 25 (86.2%) | 84 (91.3%) |
| 25 to 34 Years | 81 (95.3%) | 61 (68.5%) |
| 35 to 44 Years | 99 (100.0%) | 89 (93.7%) |
| 45 to 54 Years | 87 (100.0%) | 104 (95.4%) |
| 55 to 64 Years | 76 (92.7%) | 131 (94.9%) |
| 65 to 74 Years | 109 (100.0%) | 119 (95.2%) |
| 75 Years and over | 91 (100.0%) | 145 (90.1%) |
| Total | 702 (95.4%) | 884 (90.7%) |
Income Below Poverty Among Married-Couple Families in Durand
The poverty statistics for married-couple families in Durand show that 1.1% or 4 of the total 375 families live below the poverty line. Families with 1 or 2 children have the highest poverty rate of 5.1%, comprising of 4 families. On the other hand, families with no children have the lowest poverty rate of 0.0%, which includes 0 families.
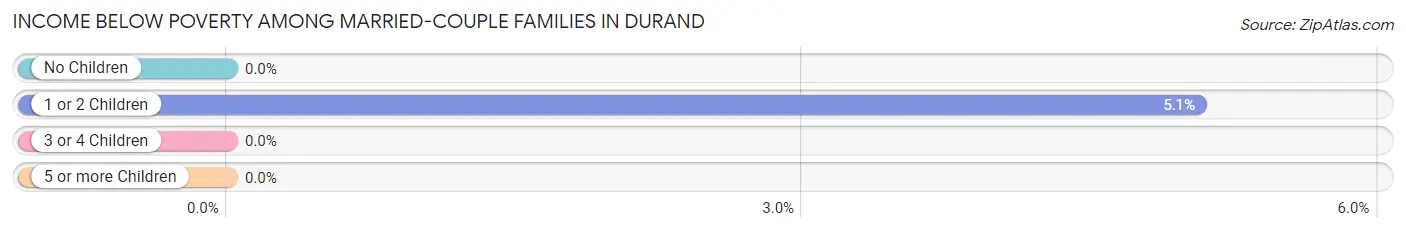
| Children | Above Poverty | Below Poverty |
| No Children | 266 (100.0%) | 0 (0.0%) |
| 1 or 2 Children | 75 (94.9%) | 4 (5.1%) |
| 3 or 4 Children | 30 (100.0%) | 0 (0.0%) |
| 5 or more Children | 0 (0.0%) | 0 (0.0%) |
| Total | 371 (98.9%) | 4 (1.1%) |
Income Below Poverty Among Single-Parent Households in Durand
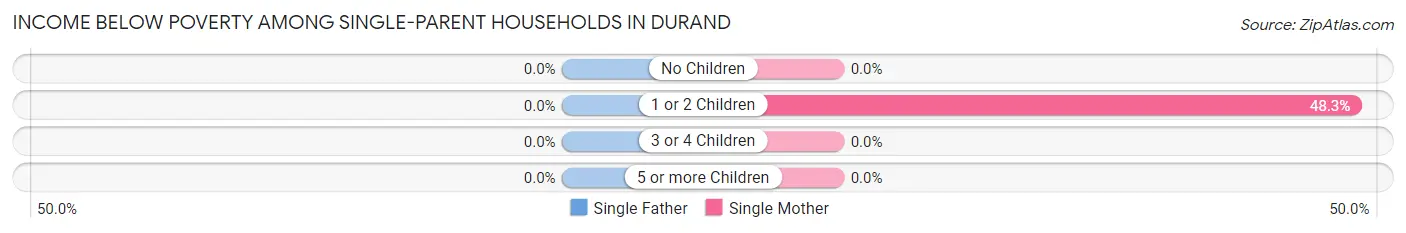
| Children | Single Father | Single Mother |
| No Children | 0 (0.0%) | 0 (0.0%) |
| 1 or 2 Children | 0 (0.0%) | 14 (48.3%) |
| 3 or 4 Children | 0 (0.0%) | 0 (0.0%) |
| 5 or more Children | 0 (0.0%) | 0 (0.0%) |
| Total | 0 (0.0%) | 14 (25.9%) |
Income Below Poverty Among Married-Couple vs Single-Parent Households in Durand
The poverty data for Durand shows that 4 of the married-couple family households (1.1%) and 14 of the single-parent households (14.6%) are living below the poverty level. Within the married-couple family households, those with 1 or 2 children have the highest poverty rate, with 4 households (5.1%) falling below the poverty line. Among the single-parent households, those with 1 or 2 children have the highest poverty rate, with 14 household (26.4%) living below poverty.
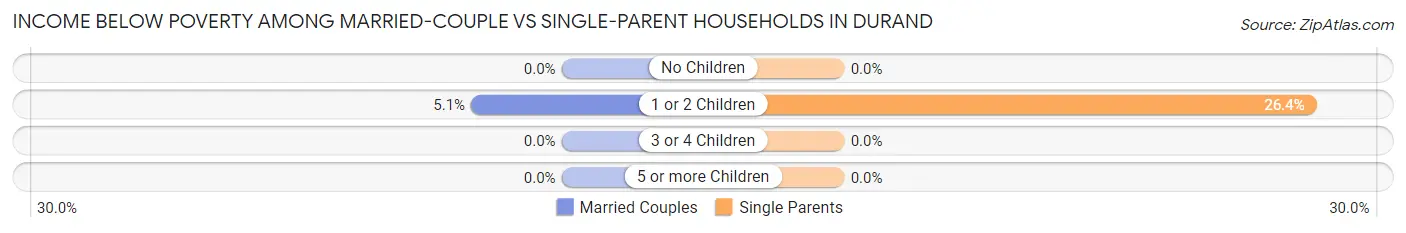
| Children | Married-Couple Families | Single-Parent Households |
| No Children | 0 (0.0%) | 0 (0.0%) |
| 1 or 2 Children | 4 (5.1%) | 14 (26.4%) |
| 3 or 4 Children | 0 (0.0%) | 0 (0.0%) |
| 5 or more Children | 0 (0.0%) | 0 (0.0%) |
| Total | 4 (1.1%) | 14 (14.6%) |
Race in Durand
The most populous races in Durand are White / Caucasian (1,641 | 94.6%), Hispanic or Latino (33 | 1.9%), and Two or more Races (33 | 1.9%).
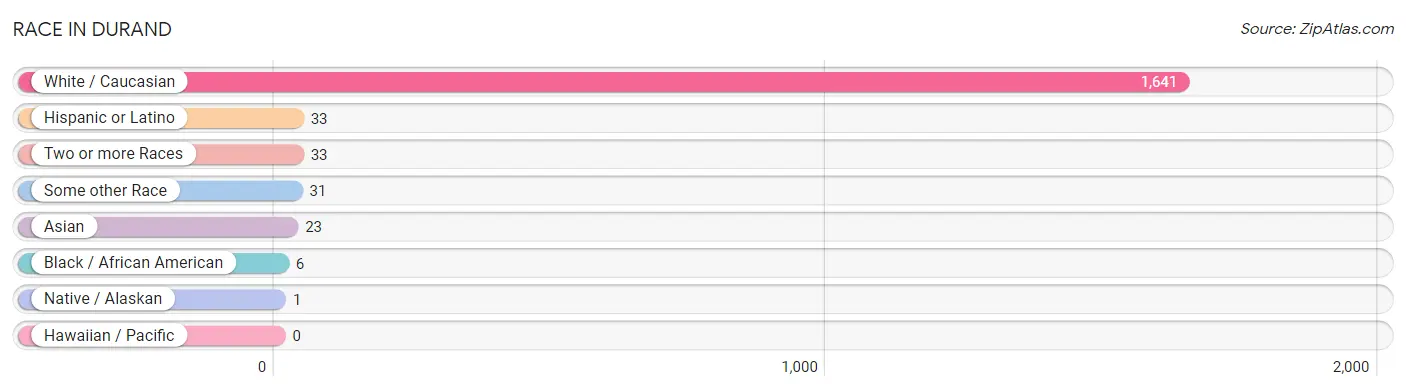
| Race | # Population | % Population |
| Asian | 23 | 1.3% |
| Black / African American | 6 | 0.4% |
| Hawaiian / Pacific | 0 | 0.0% |
| Hispanic or Latino | 33 | 1.9% |
| Native / Alaskan | 1 | 0.1% |
| White / Caucasian | 1,641 | 94.6% |
| Two or more Races | 33 | 1.9% |
| Some other Race | 31 | 1.8% |
| Total | 1,735 | 100.0% |
Ancestry in Durand
The most populous ancestries reported in Durand are German (816 | 47.0%), Irish (255 | 14.7%), Austrian (221 | 12.7%), Norwegian (177 | 10.2%), and French (101 | 5.8%), together accounting for 90.5% of all Durand residents.
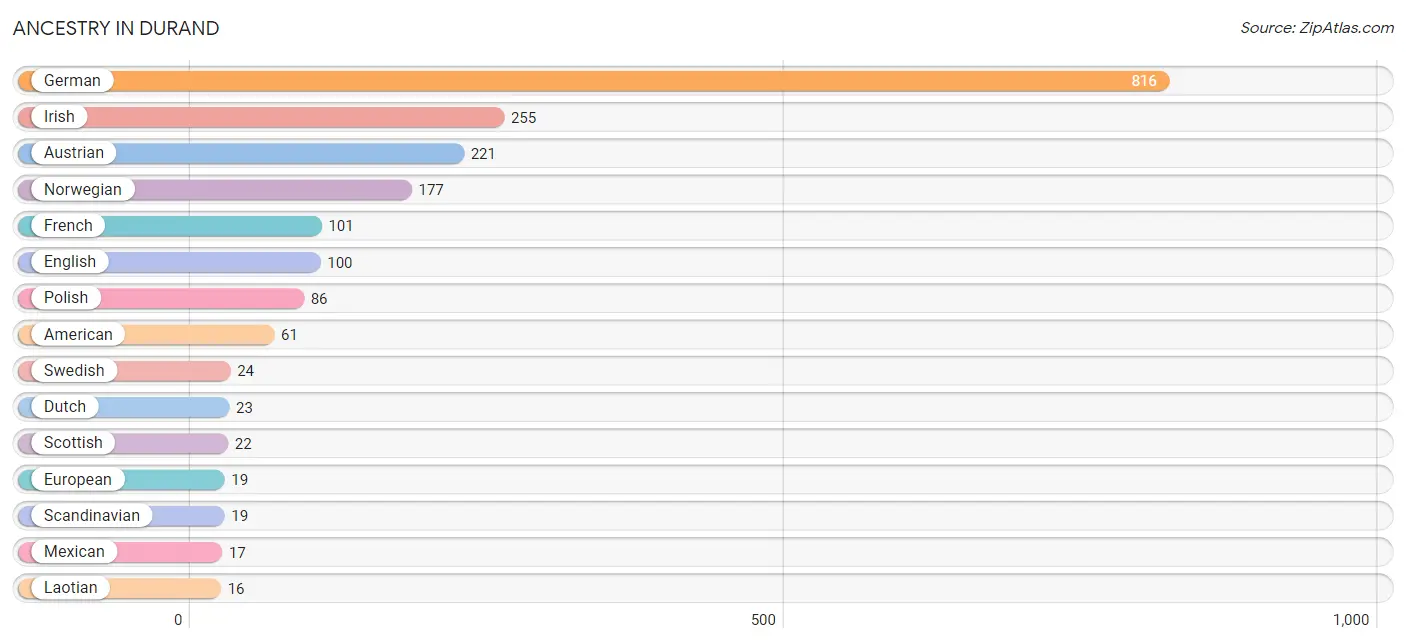
| Ancestry | # Population | % Population |
| American | 61 | 3.5% |
| Austrian | 221 | 12.7% |
| British | 4 | 0.2% |
| Canadian | 5 | 0.3% |
| Chippewa | 1 | 0.1% |
| Danish | 13 | 0.7% |
| Dutch | 23 | 1.3% |
| English | 100 | 5.8% |
| European | 19 | 1.1% |
| Finnish | 13 | 0.7% |
| French | 101 | 5.8% |
| French Canadian | 12 | 0.7% |
| German | 816 | 47.0% |
| Irish | 255 | 14.7% |
| Italian | 15 | 0.9% |
| Korean | 7 | 0.4% |
| Laotian | 16 | 0.9% |
| Mexican | 17 | 1.0% |
| Norwegian | 177 | 10.2% |
| Polish | 86 | 5.0% |
| Scandinavian | 19 | 1.1% |
| Scottish | 22 | 1.3% |
| Swedish | 24 | 1.4% |
| Swiss | 6 | 0.4% |
| Welsh | 5 | 0.3% |
| Yugoslavian | 9 | 0.5% | View All 26 Rows |
Immigrants in Durand
The most numerous immigrant groups reported in Durand came from Asia (23 | 1.3%), South Eastern Asia (23 | 1.3%), Indonesia (16 | 0.9%), Philippines (7 | 0.4%), and Europe (3 | 0.2%), together accounting for 4.2% of all Durand residents.
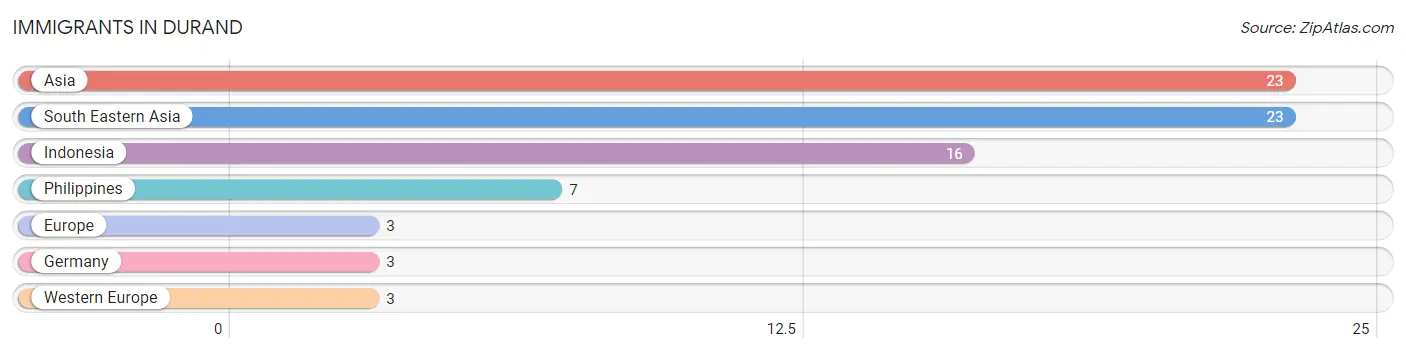
| Immigration Origin | # Population | % Population |
| Asia | 23 | 1.3% |
| Europe | 3 | 0.2% |
| Germany | 3 | 0.2% |
| Indonesia | 16 | 0.9% |
| Philippines | 7 | 0.4% |
| South Eastern Asia | 23 | 1.3% |
| Western Europe | 3 | 0.2% | View All 7 Rows |
Sex and Age in Durand
Sex and Age in Durand
The most populous age groups in Durand are 65 to 69 Years (81 | 10.7%) for men and 80 to 84 Years (106 | 10.8%) for women.
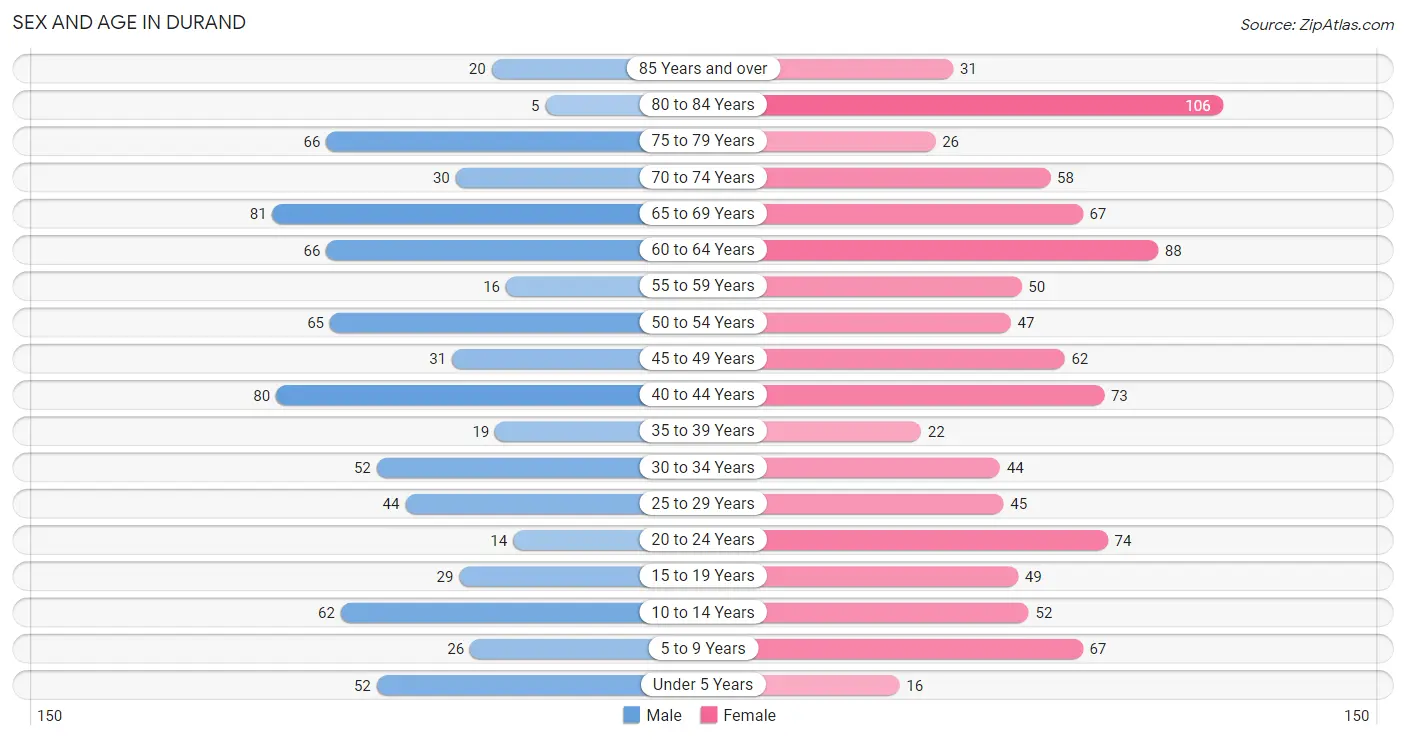
| Age Bracket | Male | Female |
| Under 5 Years | 52 (6.9%) | 16 (1.6%) |
| 5 to 9 Years | 26 (3.4%) | 67 (6.9%) |
| 10 to 14 Years | 62 (8.2%) | 52 (5.3%) |
| 15 to 19 Years | 29 (3.8%) | 49 (5.0%) |
| 20 to 24 Years | 14 (1.8%) | 74 (7.6%) |
| 25 to 29 Years | 44 (5.8%) | 45 (4.6%) |
| 30 to 34 Years | 52 (6.9%) | 44 (4.5%) |
| 35 to 39 Years | 19 (2.5%) | 22 (2.2%) |
| 40 to 44 Years | 80 (10.5%) | 73 (7.5%) |
| 45 to 49 Years | 31 (4.1%) | 62 (6.4%) |
| 50 to 54 Years | 65 (8.6%) | 47 (4.8%) |
| 55 to 59 Years | 16 (2.1%) | 50 (5.1%) |
| 60 to 64 Years | 66 (8.7%) | 88 (9.0%) |
| 65 to 69 Years | 81 (10.7%) | 67 (6.9%) |
| 70 to 74 Years | 30 (4.0%) | 58 (5.9%) |
| 75 to 79 Years | 66 (8.7%) | 26 (2.7%) |
| 80 to 84 Years | 5 (0.7%) | 106 (10.8%) |
| 85 Years and over | 20 (2.6%) | 31 (3.2%) |
| Total | 758 (100.0%) | 977 (100.0%) |
Families and Households in Durand
Median Family Size in Durand
The median family size in Durand is 2.62 persons per family, with single male/father families (42 | 8.9%) accounting for the largest median family size of 3.24 persons per family. On the other hand, married-couple families (375 | 79.6%) represent the smallest median family size with 2.55 persons per family.
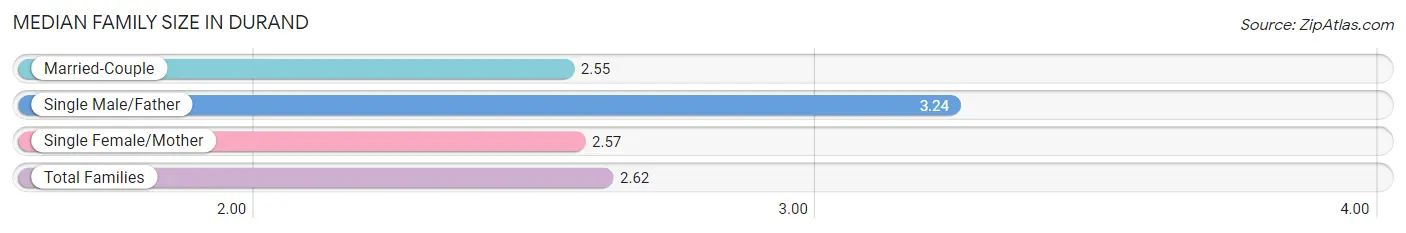
| Family Type | # Families | Family Size |
| Married-Couple | 375 (79.6%) | 2.55 |
| Single Male/Father | 42 (8.9%) | 3.24 |
| Single Female/Mother | 54 (11.5%) | 2.57 |
| Total Families | 471 (100.0%) | 2.62 |
Median Household Size in Durand
The median household size in Durand is 1.98 persons per household, with single male/father households (42 | 4.9%) accounting for the largest median household size of 3.55 persons per household. non-family households (385 | 45.0%) represent the smallest median household size with 1.15 persons per household.
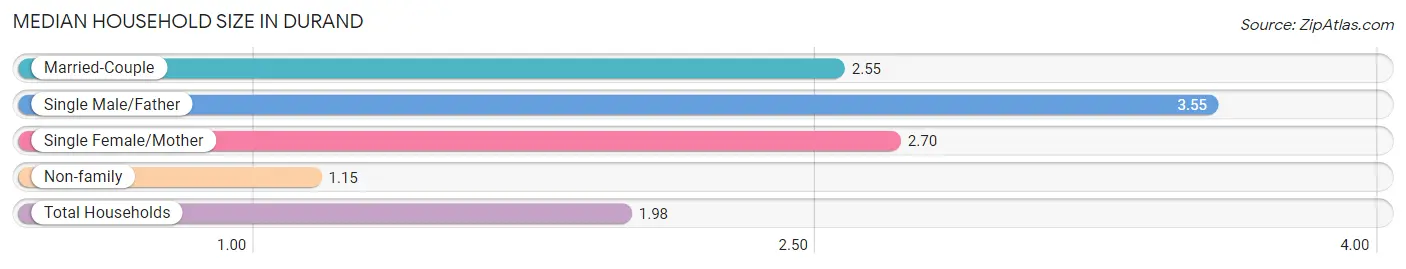
| Household Type | # Households | Household Size |
| Married-Couple | 375 (43.8%) | 2.55 |
| Single Male/Father | 42 (4.9%) | 3.55 |
| Single Female/Mother | 54 (6.3%) | 2.70 |
| Non-family | 385 (45.0%) | 1.15 |
| Total Households | 856 (100.0%) | 1.98 |
Household Size by Marriage Status in Durand
Out of a total of 856 households in Durand, 471 (55.0%) are family households, while 385 (45.0%) are nonfamily households. The most numerous type of family households are 2-person households, comprising 275, and the most common type of nonfamily households are 1-person households, comprising 339.
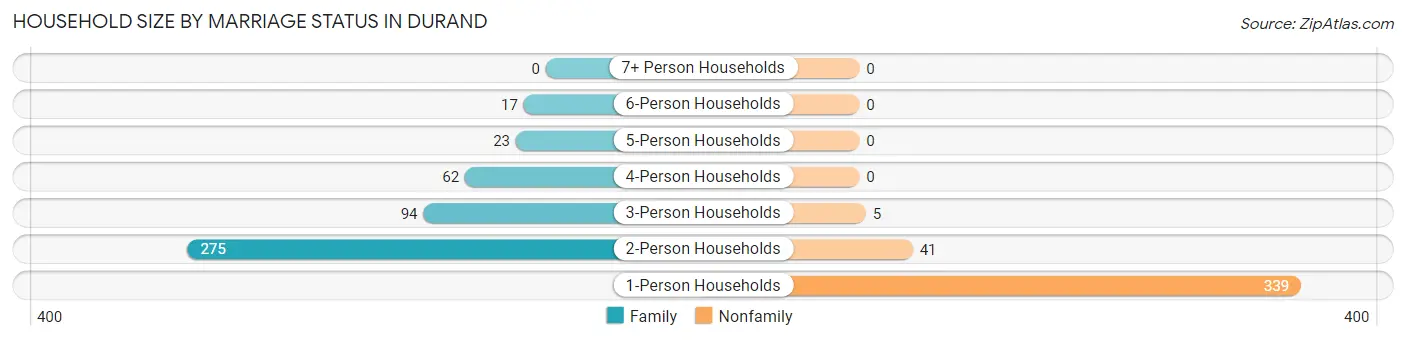
| Household Size | Family Households | Nonfamily Households |
| 1-Person Households | - | 339 (39.6%) |
| 2-Person Households | 275 (32.1%) | 41 (4.8%) |
| 3-Person Households | 94 (11.0%) | 5 (0.6%) |
| 4-Person Households | 62 (7.2%) | 0 (0.0%) |
| 5-Person Households | 23 (2.7%) | 0 (0.0%) |
| 6-Person Households | 17 (2.0%) | 0 (0.0%) |
| 7+ Person Households | 0 (0.0%) | 0 (0.0%) |
| Total | 471 (55.0%) | 385 (45.0%) |
Female Fertility in Durand
Fertility by Age in Durand
Average fertility rate in Durand is 58.0 births per 1,000 women. Women in the age bracket of 20 to 34 years have the highest fertility rate with 135.0 births per 1,000 women. Women in the age bracket of 20 to 34 years acount for 100.0% of all women with births.
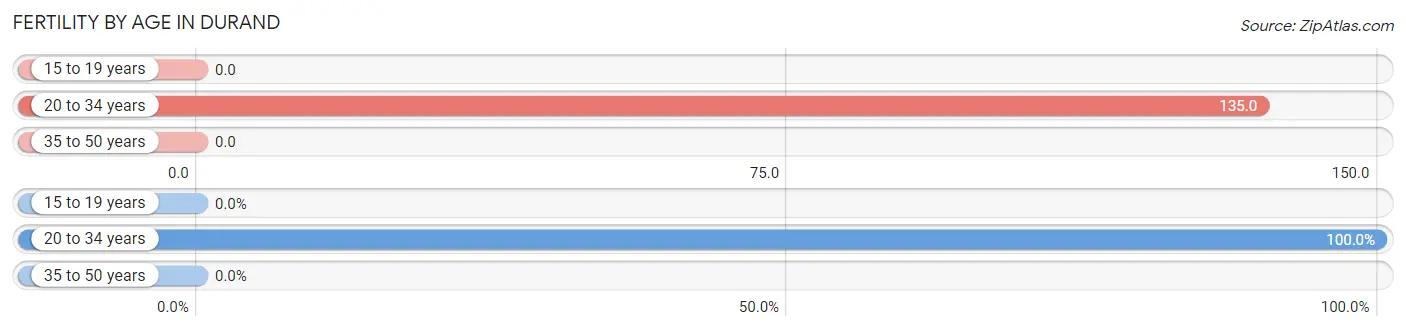
| Age Bracket | Women with Births | Births / 1,000 Women |
| 15 to 19 years | 0 (0.0%) | 0.0 |
| 20 to 34 years | 22 (100.0%) | 135.0 |
| 35 to 50 years | 0 (0.0%) | 0.0 |
| Total | 22 (100.0%) | 58.0 |
Fertility by Age by Marriage Status in Durand
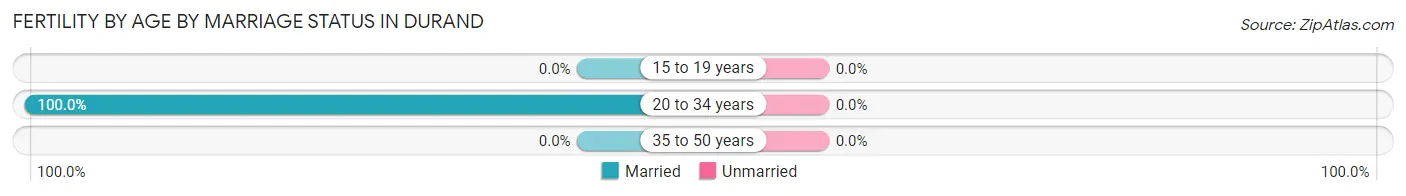
| Age Bracket | Married | Unmarried |
| 15 to 19 years | 0 (0.0%) | 0 (0.0%) |
| 20 to 34 years | 22 (100.0%) | 0 (0.0%) |
| 35 to 50 years | 0 (0.0%) | 0 (0.0%) |
| Total | 22 (100.0%) | 0 (0.0%) |
Fertility by Education in Durand
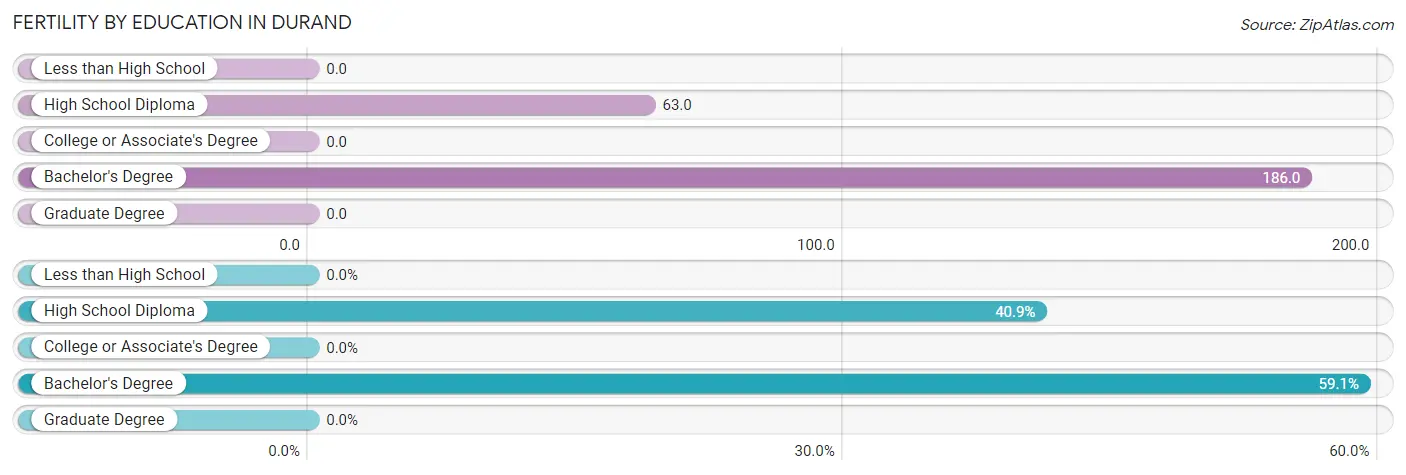
| Educational Attainment | Women with Births | Births / 1,000 Women |
| Less than High School | 0 (0.0%) | 0.0 |
| High School Diploma | 9 (40.9%) | 63.0 |
| College or Associate's Degree | 0 (0.0%) | 0.0 |
| Bachelor's Degree | 13 (59.1%) | 186.0 |
| Graduate Degree | 0 (0.0%) | 0.0 |
| Total | 22 (100.0%) | 58.0 |
Fertility by Education by Marriage Status in Durand
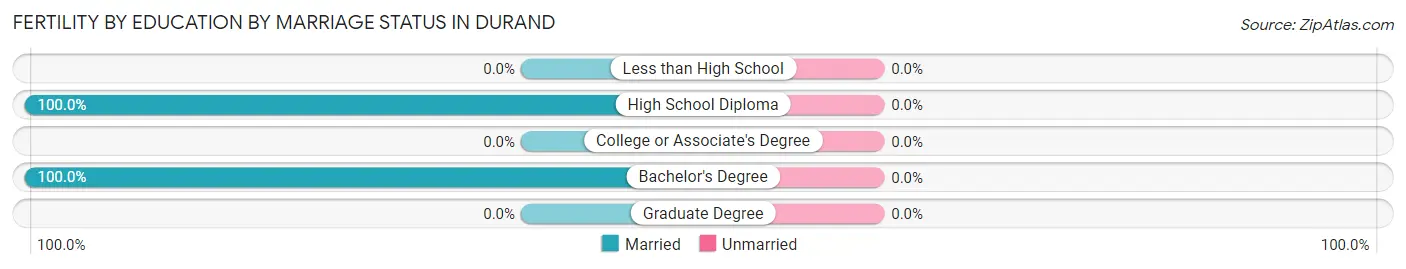
| Educational Attainment | Married | Unmarried |
| Less than High School | 0 (0.0%) | 0 (0.0%) |
| High School Diploma | 9 (100.0%) | 0 (0.0%) |
| College or Associate's Degree | 0 (0.0%) | 0 (0.0%) |
| Bachelor's Degree | 13 (100.0%) | 0 (0.0%) |
| Graduate Degree | 0 (0.0%) | 0 (0.0%) |
| Total | 22 (100.0%) | 0 (0.0%) |
Employment Characteristics in Durand
Employment by Class of Employer in Durand
Among the 805 employed individuals in Durand, private company employees (457 | 56.8%), local government employees (120 | 14.9%), and not-for-profit organizations (83 | 10.3%) make up the most common classes of employment.
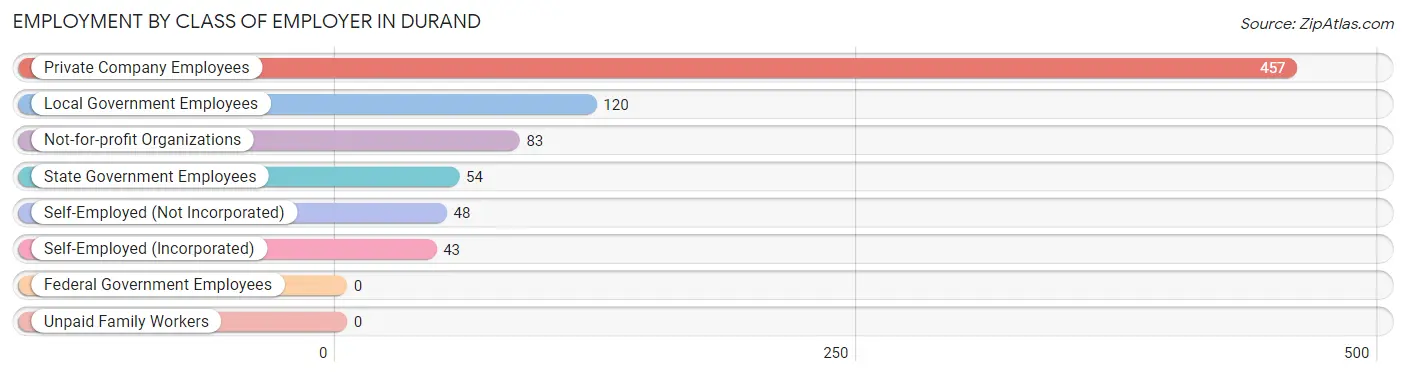
| Employer Class | # Employees | % Employees |
| Private Company Employees | 457 | 56.8% |
| Self-Employed (Incorporated) | 43 | 5.3% |
| Self-Employed (Not Incorporated) | 48 | 6.0% |
| Not-for-profit Organizations | 83 | 10.3% |
| Local Government Employees | 120 | 14.9% |
| State Government Employees | 54 | 6.7% |
| Federal Government Employees | 0 | 0.0% |
| Unpaid Family Workers | 0 | 0.0% |
| Total | 805 | 100.0% |
Employment Status by Age in Durand
According to the labor force statistics for Durand, out of the total population over 16 years of age (1,446), 57.8% or 836 individuals are in the labor force, with 1.7% or 14 of them unemployed. The age group with the highest labor force participation rate is 25 to 29 years, with 100.0% or 89 individuals in the labor force. Within the labor force, the 65 to 74 years age range has the highest percentage of unemployed individuals, with 12.7% or 8 of them being unemployed.
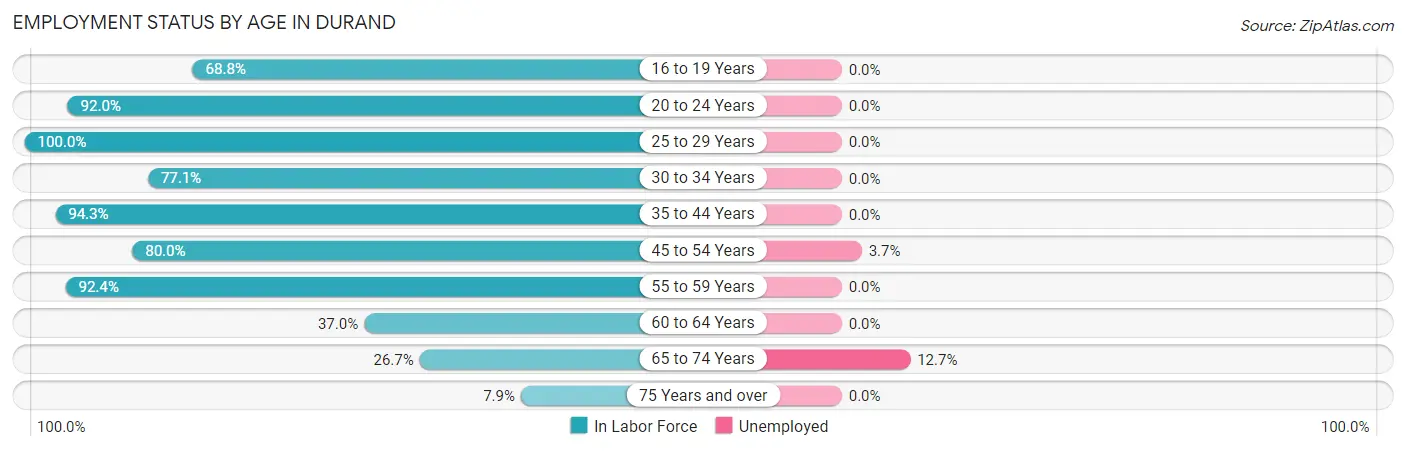
| Age Bracket | In Labor Force | Unemployed |
| 16 to 19 Years | 44 (68.8%) | 0 (0.0%) |
| 20 to 24 Years | 81 (92.0%) | 0 (0.0%) |
| 25 to 29 Years | 89 (100.0%) | 0 (0.0%) |
| 30 to 34 Years | 74 (77.1%) | 0 (0.0%) |
| 35 to 44 Years | 183 (94.3%) | 0 (0.0%) |
| 45 to 54 Years | 164 (80.0%) | 6 (3.7%) |
| 55 to 59 Years | 61 (92.4%) | 0 (0.0%) |
| 60 to 64 Years | 57 (37.0%) | 0 (0.0%) |
| 65 to 74 Years | 63 (26.7%) | 8 (12.7%) |
| 75 Years and over | 20 (7.9%) | 0 (0.0%) |
| Total | 836 (57.8%) | 14 (1.7%) |
Employment Status by Educational Attainment in Durand
According to labor force statistics for Durand, 78.1% of individuals (628) out of the total population between 25 and 64 years of age (804) are in the labor force, with 1.0% or 6 of them being unemployed. The group with the highest labor force participation rate are those with the educational attainment of bachelor's degree or higher, with 88.3% or 174 individuals in the labor force. Within the labor force, individuals with college / associate degree education have the highest percentage of unemployment, with 3.0% or 6 of them being unemployed.
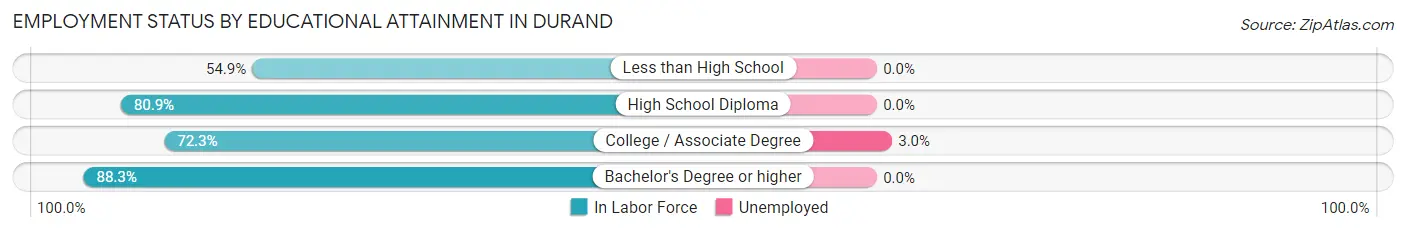
| Educational Attainment | In Labor Force | Unemployed |
| Less than High School | 28 (54.9%) | 0 (0.0%) |
| High School Diploma | 225 (80.9%) | 0 (0.0%) |
| College / Associate Degree | 201 (72.3%) | 8 (3.0%) |
| Bachelor's Degree or higher | 174 (88.3%) | 0 (0.0%) |
| Total | 628 (78.1%) | 8 (1.0%) |
Employment Occupations by Sex in Durand
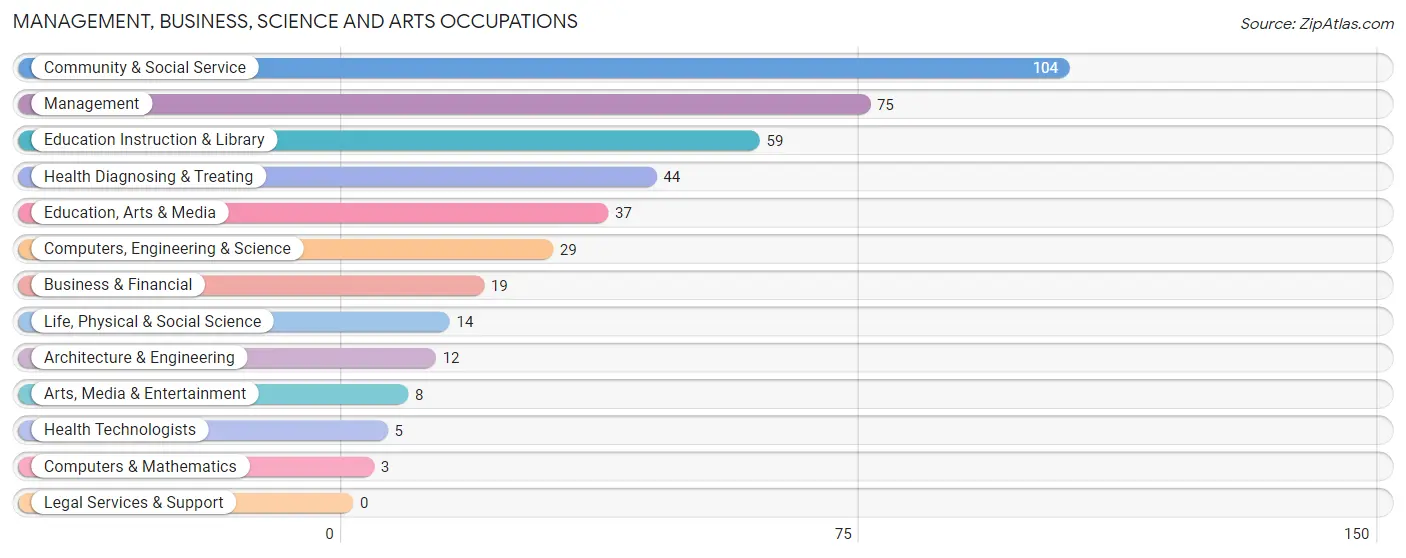
Management, Business, Science and Arts Occupations
The most common Management, Business, Science and Arts occupations in Durand are Community & Social Service (104 | 12.7%), Management (75 | 9.1%), Education Instruction & Library (59 | 7.2%), Health Diagnosing & Treating (44 | 5.3%), and Education, Arts & Media (37 | 4.5%).
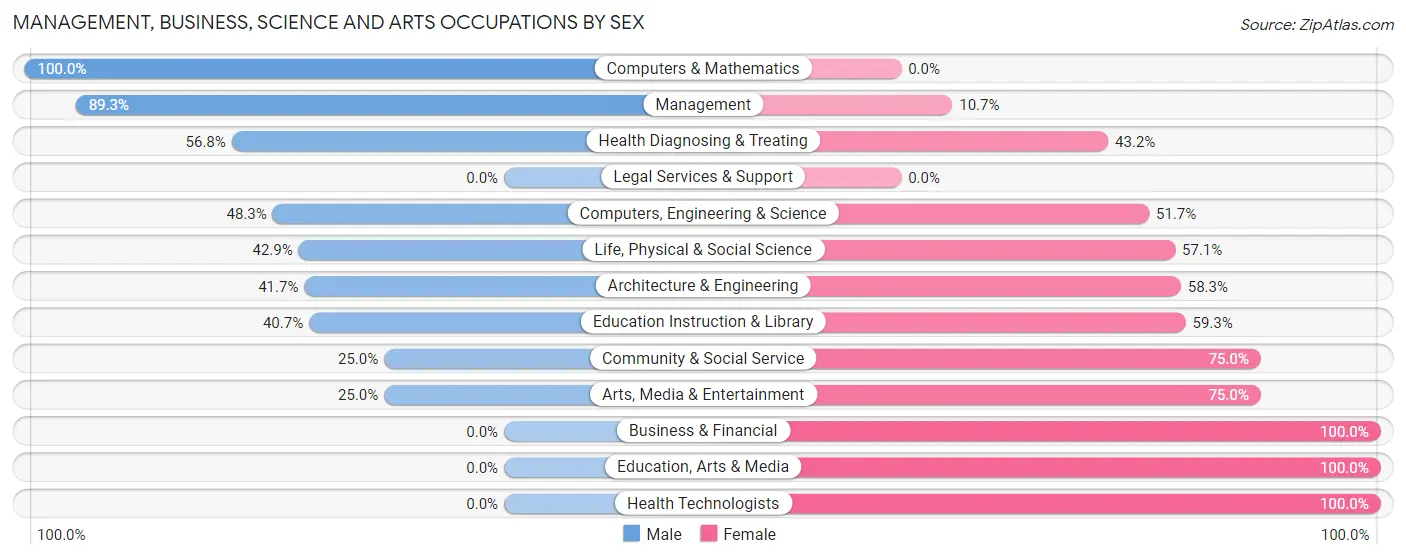
Management, Business, Science and Arts Occupations by Sex
Within the Management, Business, Science and Arts occupations in Durand, the most male-oriented occupations are Computers & Mathematics (100.0%), Management (89.3%), and Health Diagnosing & Treating (56.8%), while the most female-oriented occupations are Business & Financial (100.0%), Education, Arts & Media (100.0%), and Health Technologists (100.0%).
| Occupation | Male | Female |
| Management | 67 (89.3%) | 8 (10.7%) |
| Business & Financial | 0 (0.0%) | 19 (100.0%) |
| Computers, Engineering & Science | 14 (48.3%) | 15 (51.7%) |
| Computers & Mathematics | 3 (100.0%) | 0 (0.0%) |
| Architecture & Engineering | 5 (41.7%) | 7 (58.3%) |
| Life, Physical & Social Science | 6 (42.9%) | 8 (57.1%) |
| Community & Social Service | 26 (25.0%) | 78 (75.0%) |
| Education, Arts & Media | 0 (0.0%) | 37 (100.0%) |
| Legal Services & Support | 0 (0.0%) | 0 (0.0%) |
| Education Instruction & Library | 24 (40.7%) | 35 (59.3%) |
| Arts, Media & Entertainment | 2 (25.0%) | 6 (75.0%) |
| Health Diagnosing & Treating | 25 (56.8%) | 19 (43.2%) |
| Health Technologists | 0 (0.0%) | 5 (100.0%) |
| Total (Category) | 132 (48.7%) | 139 (51.3%) |
| Total (Overall) | 371 (45.1%) | 451 (54.9%) |
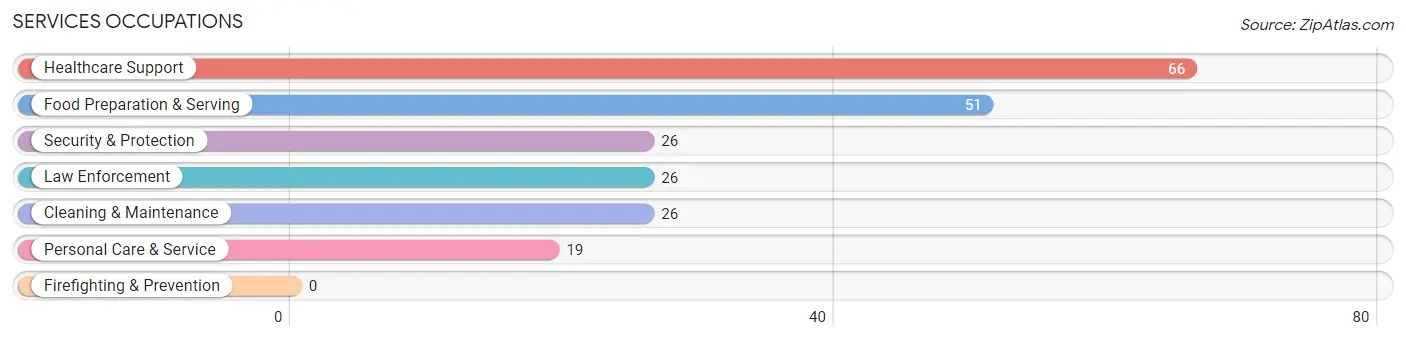
Services Occupations
The most common Services occupations in Durand are Healthcare Support (66 | 8.0%), Food Preparation & Serving (51 | 6.2%), Security & Protection (26 | 3.2%), Law Enforcement (26 | 3.2%), and Cleaning & Maintenance (26 | 3.2%).
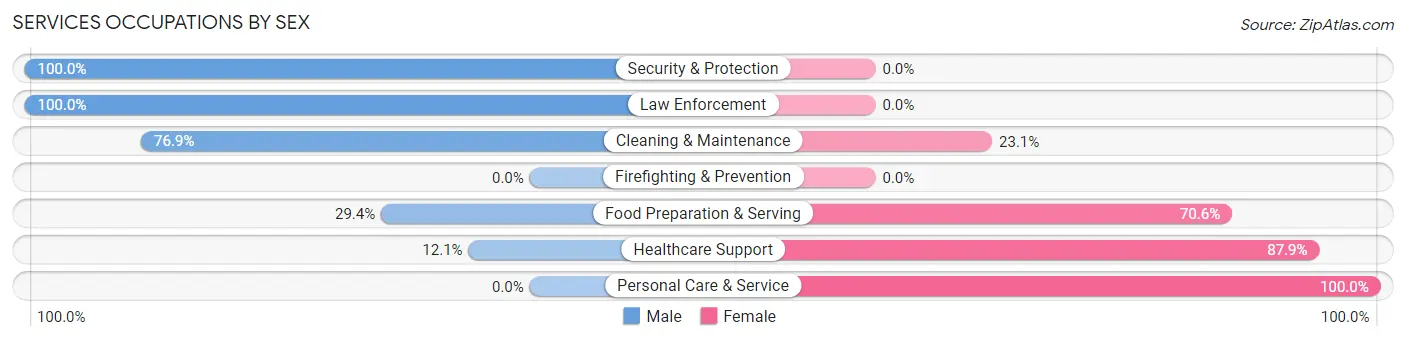
Services Occupations by Sex
Within the Services occupations in Durand, the most male-oriented occupations are Security & Protection (100.0%), Law Enforcement (100.0%), and Cleaning & Maintenance (76.9%), while the most female-oriented occupations are Personal Care & Service (100.0%), Healthcare Support (87.9%), and Food Preparation & Serving (70.6%).
| Occupation | Male | Female |
| Healthcare Support | 8 (12.1%) | 58 (87.9%) |
| Security & Protection | 26 (100.0%) | 0 (0.0%) |
| Firefighting & Prevention | 0 (0.0%) | 0 (0.0%) |
| Law Enforcement | 26 (100.0%) | 0 (0.0%) |
| Food Preparation & Serving | 15 (29.4%) | 36 (70.6%) |
| Cleaning & Maintenance | 20 (76.9%) | 6 (23.1%) |
| Personal Care & Service | 0 (0.0%) | 19 (100.0%) |
| Total (Category) | 69 (36.7%) | 119 (63.3%) |
| Total (Overall) | 371 (45.1%) | 451 (54.9%) |
Sales and Office Occupations
The most common Sales and Office occupations in Durand are Office & Administration (133 | 16.2%), and Sales & Related (26 | 3.2%).
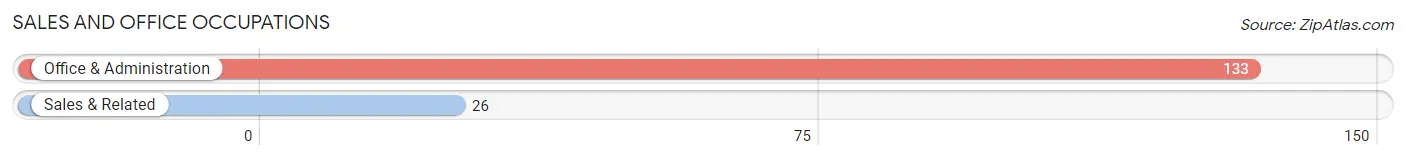
Sales and Office Occupations by Sex
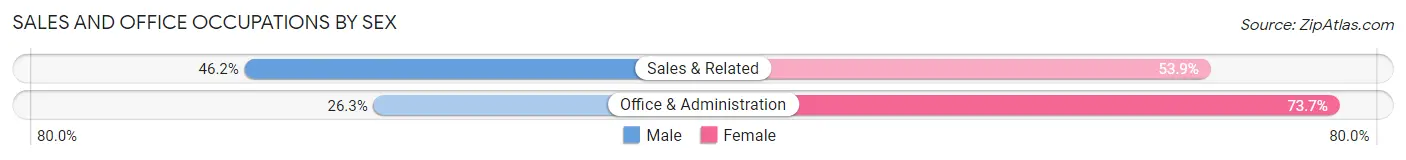
| Occupation | Male | Female |
| Sales & Related | 12 (46.2%) | 14 (53.8%) |
| Office & Administration | 35 (26.3%) | 98 (73.7%) |
| Total (Category) | 47 (29.6%) | 112 (70.4%) |
| Total (Overall) | 371 (45.1%) | 451 (54.9%) |
Natural Resources, Construction and Maintenance Occupations
The most common Natural Resources, Construction and Maintenance occupations in Durand are Construction & Extraction (15 | 1.8%), Installation, Maintenance & Repair (11 | 1.3%), and Farming, Fishing & Forestry (3 | 0.4%).
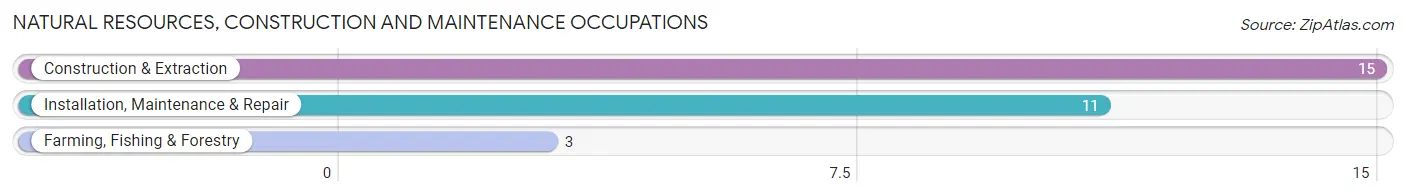
Natural Resources, Construction and Maintenance Occupations by Sex
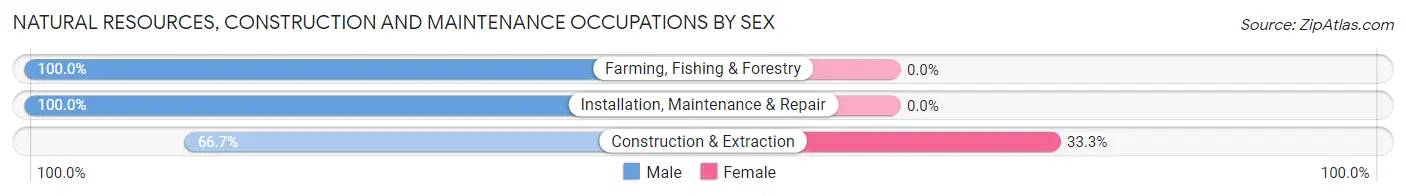
| Occupation | Male | Female |
| Farming, Fishing & Forestry | 3 (100.0%) | 0 (0.0%) |
| Construction & Extraction | 10 (66.7%) | 5 (33.3%) |
| Installation, Maintenance & Repair | 11 (100.0%) | 0 (0.0%) |
| Total (Category) | 24 (82.8%) | 5 (17.2%) |
| Total (Overall) | 371 (45.1%) | 451 (54.9%) |
Production, Transportation and Moving Occupations
The most common Production, Transportation and Moving occupations in Durand are Production (119 | 14.5%), Transportation (28 | 3.4%), and Material Moving (28 | 3.4%).
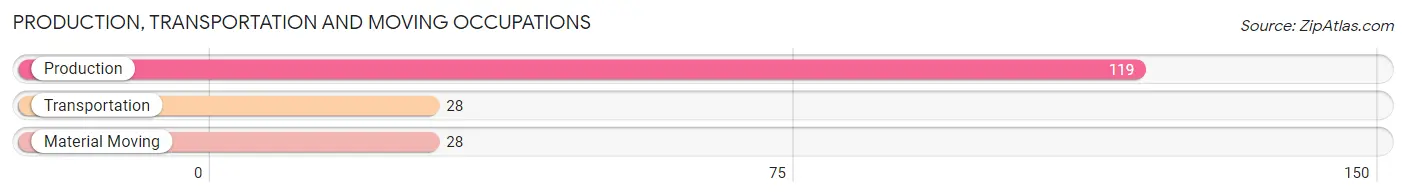
Production, Transportation and Moving Occupations by Sex
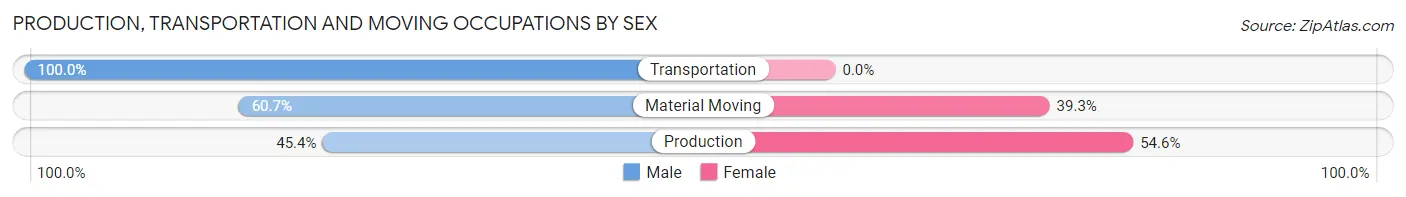
| Occupation | Male | Female |
| Production | 54 (45.4%) | 65 (54.6%) |
| Transportation | 28 (100.0%) | 0 (0.0%) |
| Material Moving | 17 (60.7%) | 11 (39.3%) |
| Total (Category) | 99 (56.6%) | 76 (43.4%) |
| Total (Overall) | 371 (45.1%) | 451 (54.9%) |
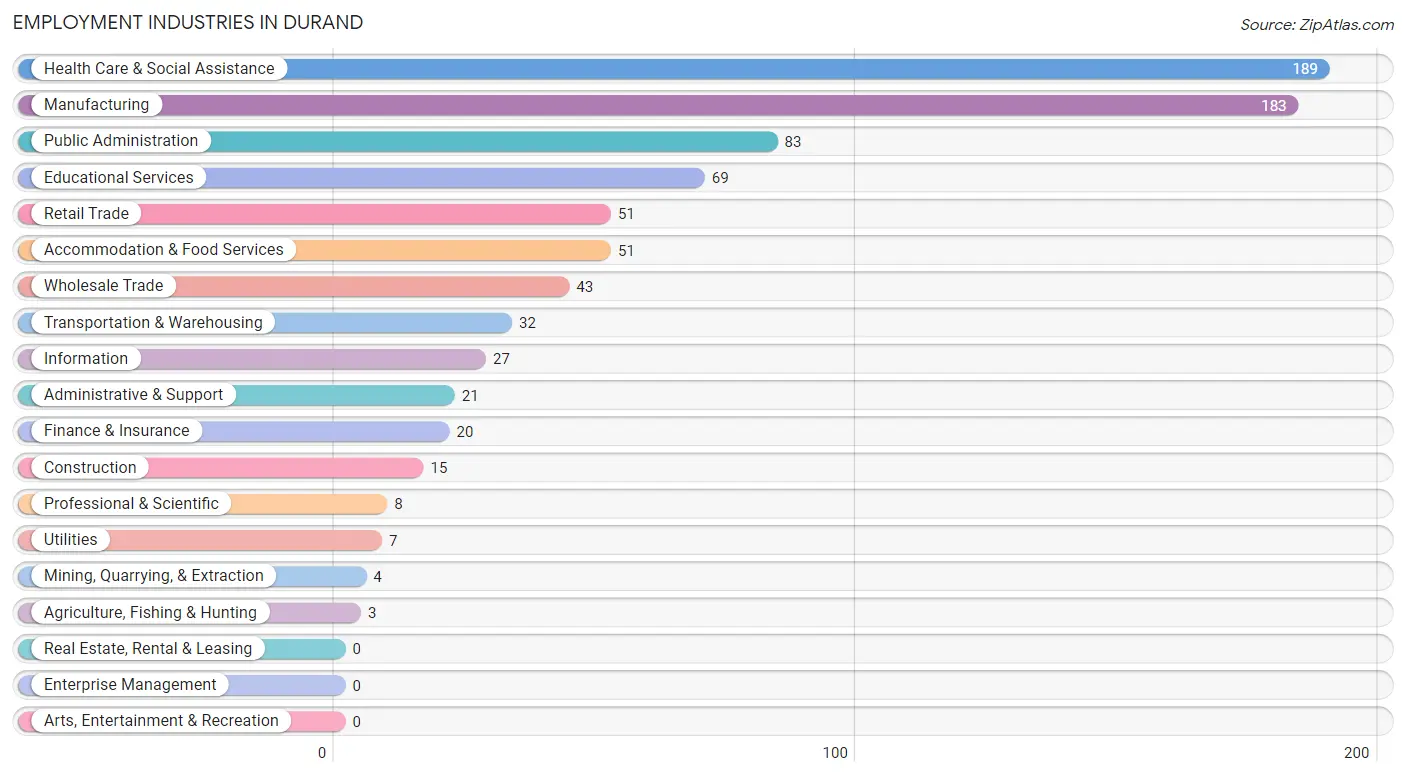
Employment Industries by Sex in Durand
Employment Industries in Durand
The major employment industries in Durand include Health Care & Social Assistance (189 | 23.0%), Manufacturing (183 | 22.3%), Public Administration (83 | 10.1%), Educational Services (69 | 8.4%), and Retail Trade (51 | 6.2%).
Employment Industries by Sex in Durand
The Durand industries that see more men than women are Agriculture, Fishing & Hunting (100.0%), Mining, Quarrying, & Extraction (100.0%), and Transportation & Warehousing (100.0%), whereas the industries that tend to have a higher number of women are Finance & Insurance (100.0%), Health Care & Social Assistance (82.5%), and Retail Trade (70.6%).
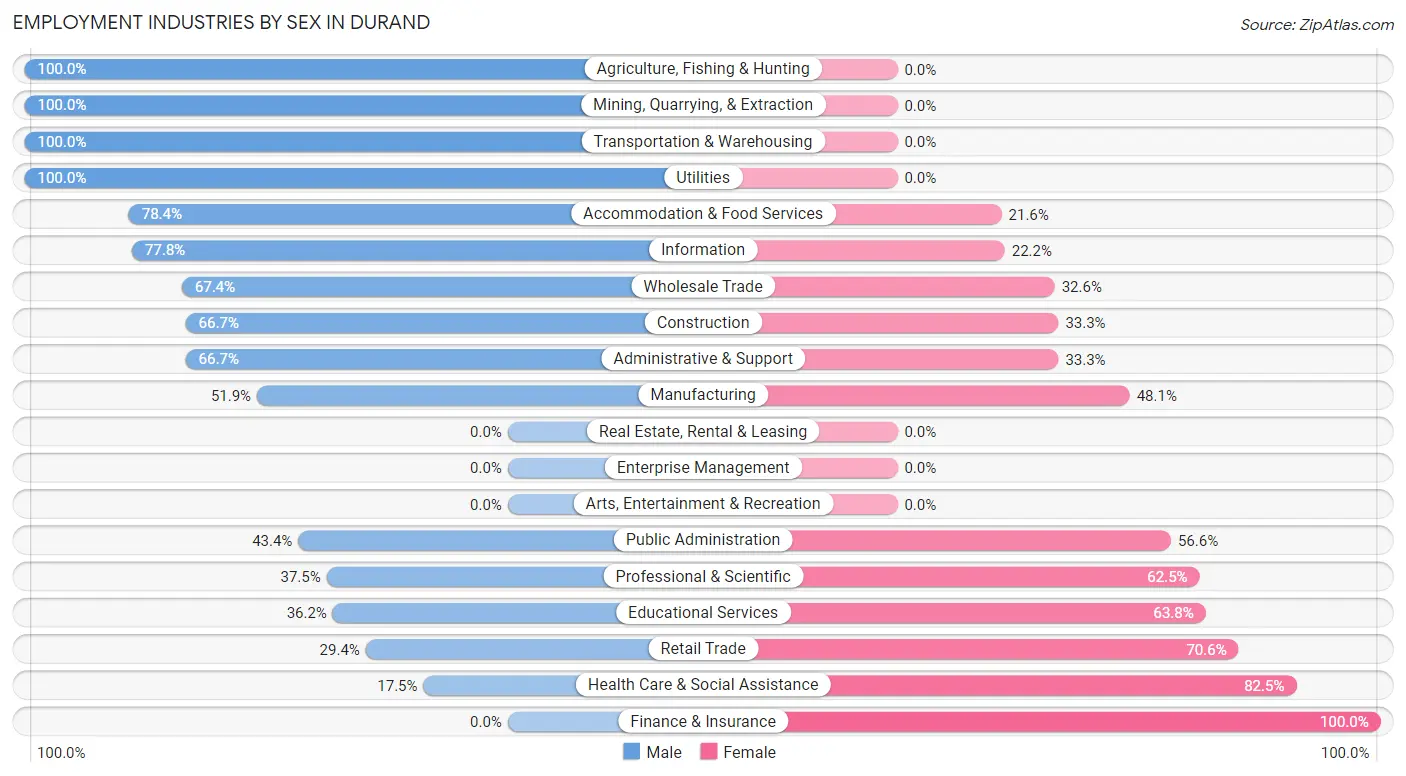
| Industry | Male | Female |
| Agriculture, Fishing & Hunting | 3 (100.0%) | 0 (0.0%) |
| Mining, Quarrying, & Extraction | 4 (100.0%) | 0 (0.0%) |
| Construction | 10 (66.7%) | 5 (33.3%) |
| Manufacturing | 95 (51.9%) | 88 (48.1%) |
| Wholesale Trade | 29 (67.4%) | 14 (32.6%) |
| Retail Trade | 15 (29.4%) | 36 (70.6%) |
| Transportation & Warehousing | 32 (100.0%) | 0 (0.0%) |
| Utilities | 7 (100.0%) | 0 (0.0%) |
| Information | 21 (77.8%) | 6 (22.2%) |
| Finance & Insurance | 0 (0.0%) | 20 (100.0%) |
| Real Estate, Rental & Leasing | 0 (0.0%) | 0 (0.0%) |
| Professional & Scientific | 3 (37.5%) | 5 (62.5%) |
| Enterprise Management | 0 (0.0%) | 0 (0.0%) |
| Administrative & Support | 14 (66.7%) | 7 (33.3%) |
| Educational Services | 25 (36.2%) | 44 (63.8%) |
| Health Care & Social Assistance | 33 (17.5%) | 156 (82.5%) |
| Arts, Entertainment & Recreation | 0 (0.0%) | 0 (0.0%) |
| Accommodation & Food Services | 40 (78.4%) | 11 (21.6%) |
| Public Administration | 36 (43.4%) | 47 (56.6%) |
| Total | 371 (45.1%) | 451 (54.9%) |
Education in Durand
School Enrollment in Durand
The most common levels of schooling among the 321 students in Durand are elementary school (105 | 32.7%), high school (71 | 22.1%), and middle school (69 | 21.5%).
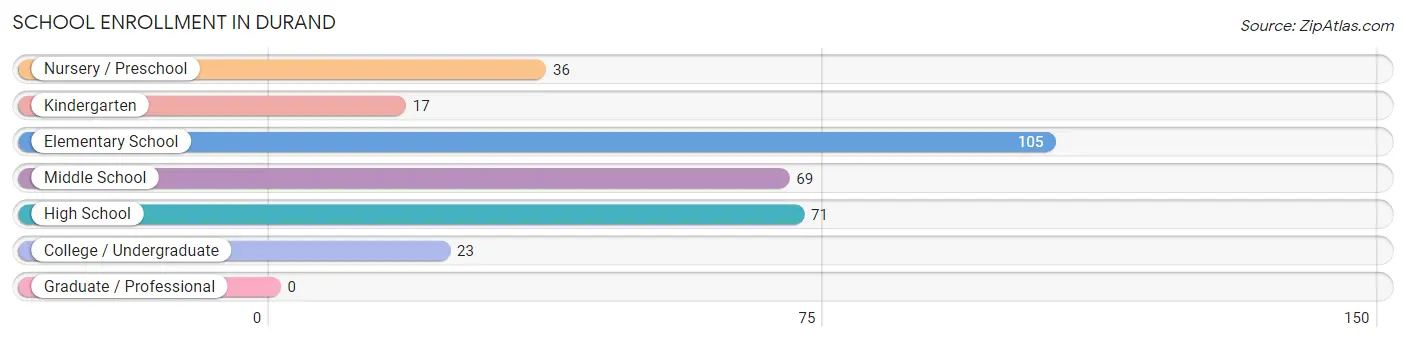
| School Level | # Students | % Students |
| Nursery / Preschool | 36 | 11.2% |
| Kindergarten | 17 | 5.3% |
| Elementary School | 105 | 32.7% |
| Middle School | 69 | 21.5% |
| High School | 71 | 22.1% |
| College / Undergraduate | 23 | 7.2% |
| Graduate / Professional | 0 | 0.0% |
| Total | 321 | 100.0% |
School Enrollment by Age by Funding Source in Durand
Out of a total of 321 students who are enrolled in schools in Durand, 31 (9.7%) attend a private institution, while the remaining 290 (90.3%) are enrolled in public schools. The age group of 3 to 4 year olds has the highest likelihood of being enrolled in private schools, with 16 (48.5% in the age bracket) enrolled. Conversely, the age group of 15 to 17 year olds has the lowest likelihood of being enrolled in a private school, with 45 (100.0% in the age bracket) attending a public institution.
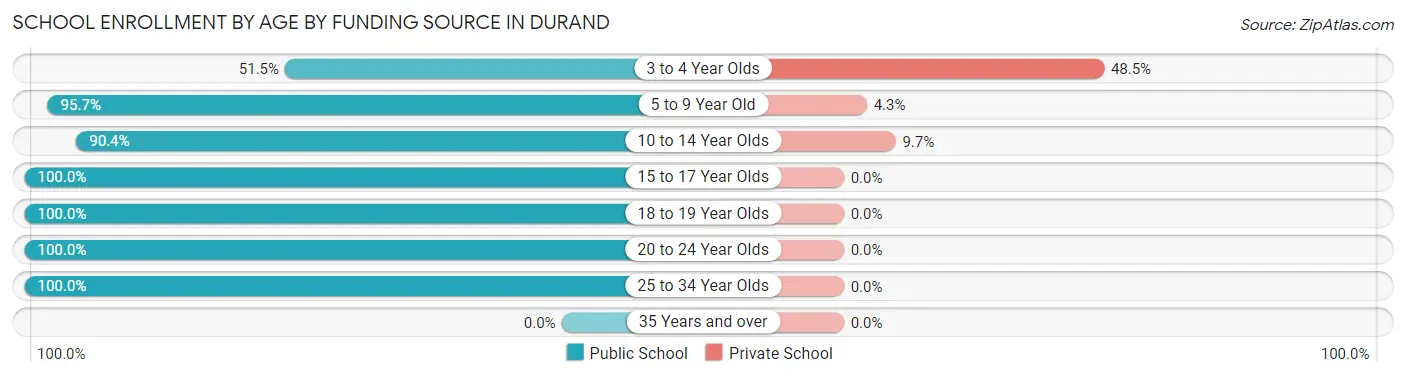
| Age Bracket | Public School | Private School |
| 3 to 4 Year Olds | 17 (51.5%) | 16 (48.5%) |
| 5 to 9 Year Old | 89 (95.7%) | 4 (4.3%) |
| 10 to 14 Year Olds | 103 (90.3%) | 11 (9.7%) |
| 15 to 17 Year Olds | 45 (100.0%) | 0 (0.0%) |
| 18 to 19 Year Olds | 13 (100.0%) | 0 (0.0%) |
| 20 to 24 Year Olds | 19 (100.0%) | 0 (0.0%) |
| 25 to 34 Year Olds | 4 (100.0%) | 0 (0.0%) |
| 35 Years and over | 0 (0.0%) | 0 (0.0%) |
| Total | 290 (90.3%) | 31 (9.7%) |
Educational Attainment by Field of Study in Durand
Business (87 | 23.3%), education (77 | 20.6%), science & technology (58 | 15.5%), arts & humanities (36 | 9.7%), and bio, nature & agricultural (26 | 7.0%) are the most common fields of study among 373 individuals in Durand who have obtained a bachelor's degree or higher.
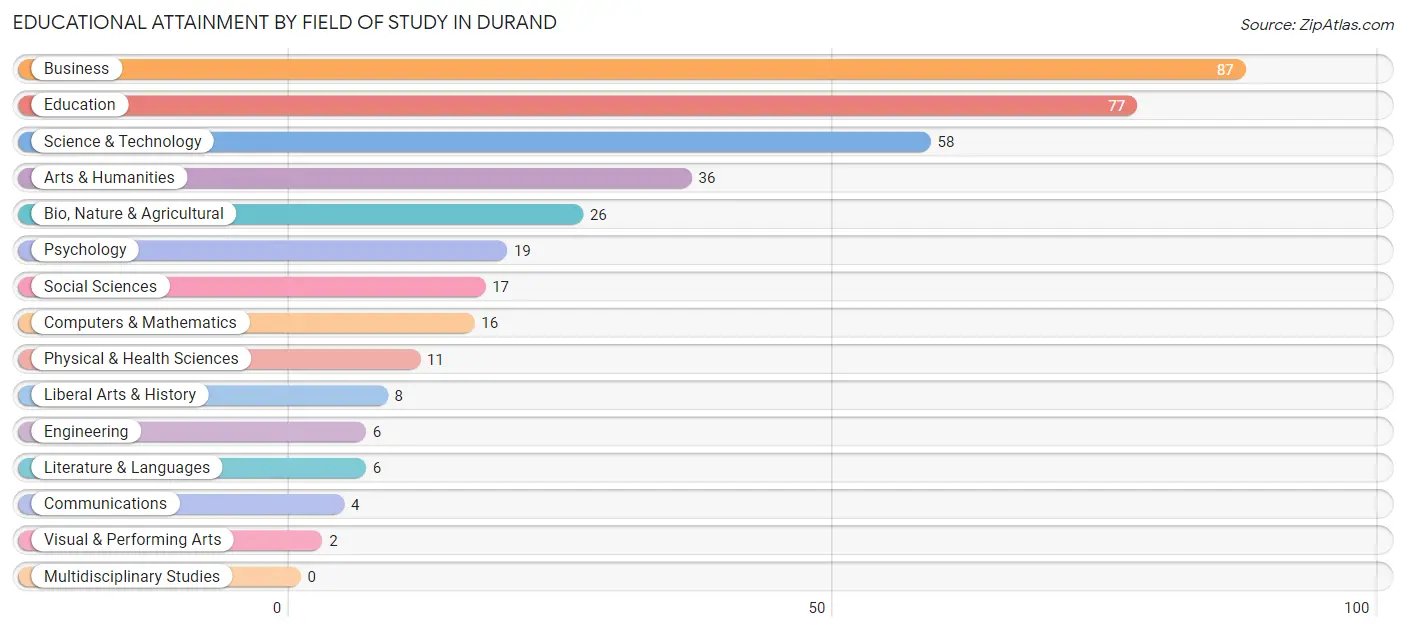
| Field of Study | # Graduates | % Graduates |
| Computers & Mathematics | 16 | 4.3% |
| Bio, Nature & Agricultural | 26 | 7.0% |
| Physical & Health Sciences | 11 | 2.9% |
| Psychology | 19 | 5.1% |
| Social Sciences | 17 | 4.6% |
| Engineering | 6 | 1.6% |
| Multidisciplinary Studies | 0 | 0.0% |
| Science & Technology | 58 | 15.5% |
| Business | 87 | 23.3% |
| Education | 77 | 20.6% |
| Literature & Languages | 6 | 1.6% |
| Liberal Arts & History | 8 | 2.1% |
| Visual & Performing Arts | 2 | 0.5% |
| Communications | 4 | 1.1% |
| Arts & Humanities | 36 | 9.7% |
| Total | 373 | 100.0% |
Transportation & Commute in Durand
Vehicle Availability by Sex in Durand
The most prevalent vehicle ownership categories in Durand are males with 2 vehicles (174, accounting for 48.9%) and females with 2 vehicles (184, making up 39.0%).
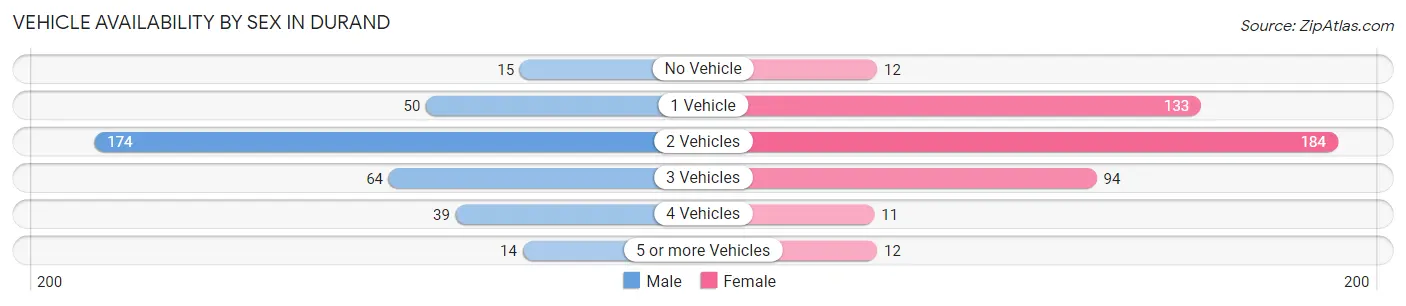
| Vehicles Available | Male | Female |
| No Vehicle | 15 (4.2%) | 12 (2.7%) |
| 1 Vehicle | 50 (14.0%) | 133 (29.8%) |
| 2 Vehicles | 174 (48.9%) | 184 (41.3%) |
| 3 Vehicles | 64 (18.0%) | 94 (21.1%) |
| 4 Vehicles | 39 (11.0%) | 11 (2.5%) |
| 5 or more Vehicles | 14 (3.9%) | 12 (2.7%) |
| Total | 356 (100.0%) | 446 (100.0%) |
Commute Time in Durand
The most frequently occuring commute durations in Durand are 5 to 9 minutes (164 commuters, 23.8%), less than 5 minutes (98 commuters, 14.2%), and 10 to 14 minutes (94 commuters, 13.7%).
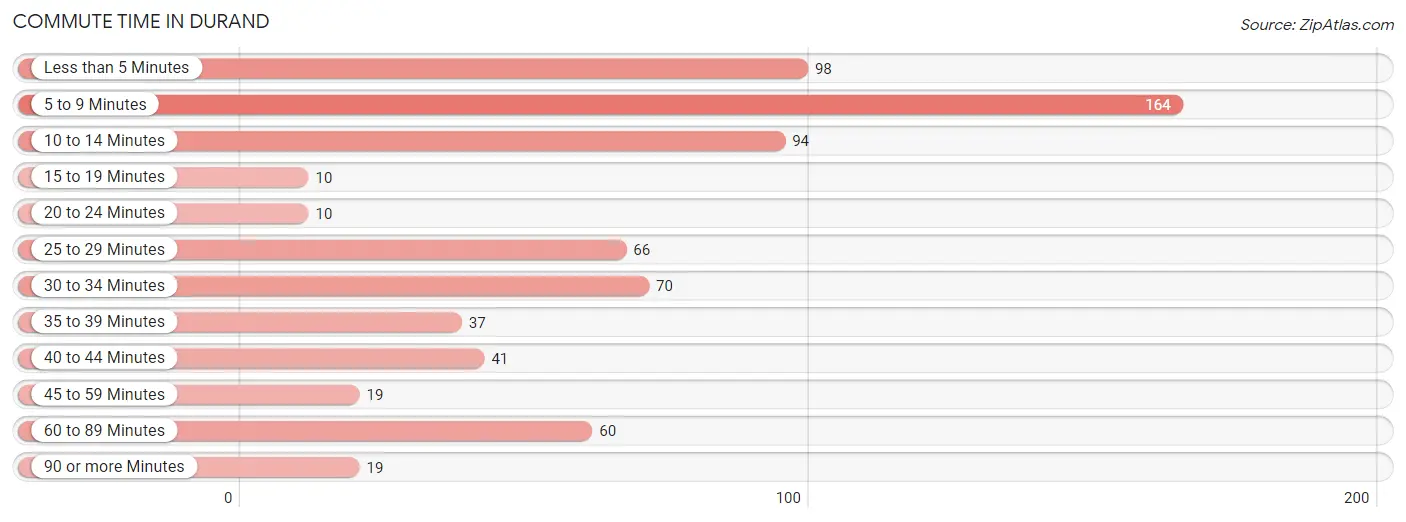
| Commute Time | # Commuters | % Commuters |
| Less than 5 Minutes | 98 | 14.2% |
| 5 to 9 Minutes | 164 | 23.8% |
| 10 to 14 Minutes | 94 | 13.7% |
| 15 to 19 Minutes | 10 | 1.5% |
| 20 to 24 Minutes | 10 | 1.5% |
| 25 to 29 Minutes | 66 | 9.6% |
| 30 to 34 Minutes | 70 | 10.2% |
| 35 to 39 Minutes | 37 | 5.4% |
| 40 to 44 Minutes | 41 | 6.0% |
| 45 to 59 Minutes | 19 | 2.8% |
| 60 to 89 Minutes | 60 | 8.7% |
| 90 or more Minutes | 19 | 2.8% |
Commute Time by Sex in Durand
The most common commute times in Durand are 5 to 9 minutes (113 commuters, 34.4%) for males and 5 to 9 minutes (51 commuters, 14.2%) for females.
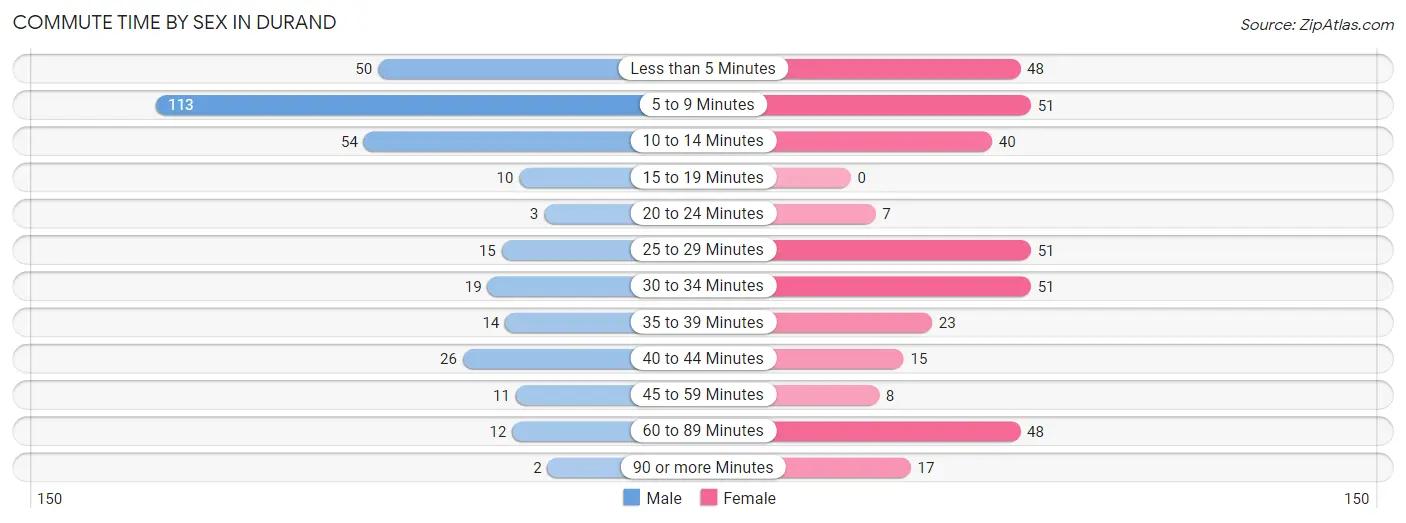
| Commute Time | Male | Female |
| Less than 5 Minutes | 50 (15.2%) | 48 (13.4%) |
| 5 to 9 Minutes | 113 (34.4%) | 51 (14.2%) |
| 10 to 14 Minutes | 54 (16.4%) | 40 (11.1%) |
| 15 to 19 Minutes | 10 (3.0%) | 0 (0.0%) |
| 20 to 24 Minutes | 3 (0.9%) | 7 (1.9%) |
| 25 to 29 Minutes | 15 (4.6%) | 51 (14.2%) |
| 30 to 34 Minutes | 19 (5.8%) | 51 (14.2%) |
| 35 to 39 Minutes | 14 (4.3%) | 23 (6.4%) |
| 40 to 44 Minutes | 26 (7.9%) | 15 (4.2%) |
| 45 to 59 Minutes | 11 (3.3%) | 8 (2.2%) |
| 60 to 89 Minutes | 12 (3.6%) | 48 (13.4%) |
| 90 or more Minutes | 2 (0.6%) | 17 (4.7%) |
Time of Departure to Work by Sex in Durand
The most frequent times of departure to work in Durand are 7:00 AM to 7:29 AM (57, 17.3%) for males and 7:30 AM to 7:59 AM (72, 20.1%) for females.
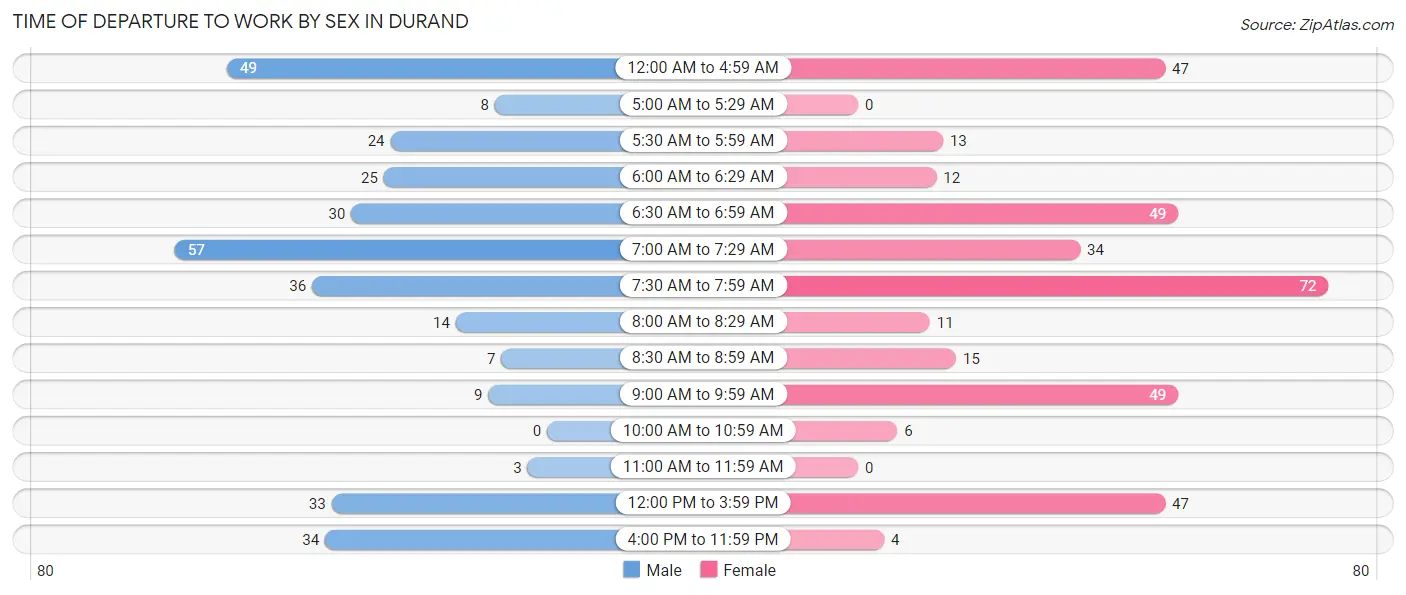
| Time of Departure | Male | Female |
| 12:00 AM to 4:59 AM | 49 (14.9%) | 47 (13.1%) |
| 5:00 AM to 5:29 AM | 8 (2.4%) | 0 (0.0%) |
| 5:30 AM to 5:59 AM | 24 (7.3%) | 13 (3.6%) |
| 6:00 AM to 6:29 AM | 25 (7.6%) | 12 (3.3%) |
| 6:30 AM to 6:59 AM | 30 (9.1%) | 49 (13.7%) |
| 7:00 AM to 7:29 AM | 57 (17.3%) | 34 (9.5%) |
| 7:30 AM to 7:59 AM | 36 (10.9%) | 72 (20.1%) |
| 8:00 AM to 8:29 AM | 14 (4.3%) | 11 (3.1%) |
| 8:30 AM to 8:59 AM | 7 (2.1%) | 15 (4.2%) |
| 9:00 AM to 9:59 AM | 9 (2.7%) | 49 (13.7%) |
| 10:00 AM to 10:59 AM | 0 (0.0%) | 6 (1.7%) |
| 11:00 AM to 11:59 AM | 3 (0.9%) | 0 (0.0%) |
| 12:00 PM to 3:59 PM | 33 (10.0%) | 47 (13.1%) |
| 4:00 PM to 11:59 PM | 34 (10.3%) | 4 (1.1%) |
| Total | 329 (100.0%) | 359 (100.0%) |
Housing Occupancy in Durand
Occupancy by Ownership in Durand
Of the total 856 dwellings in Durand, owner-occupied units account for 626 (73.1%), while renter-occupied units make up 230 (26.9%).
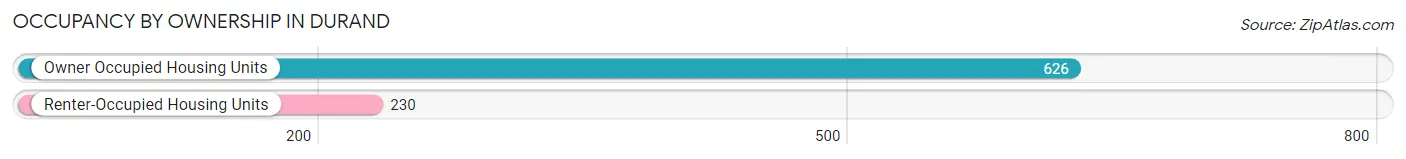
| Occupancy | # Housing Units | % Housing Units |
| Owner Occupied Housing Units | 626 | 73.1% |
| Renter-Occupied Housing Units | 230 | 26.9% |
| Total Occupied Housing Units | 856 | 100.0% |
Occupancy by Household Size in Durand
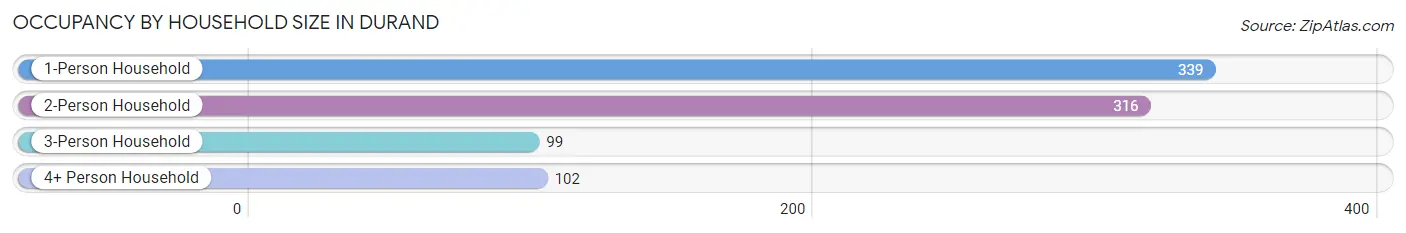
| Household Size | # Housing Units | % Housing Units |
| 1-Person Household | 339 | 39.6% |
| 2-Person Household | 316 | 36.9% |
| 3-Person Household | 99 | 11.6% |
| 4+ Person Household | 102 | 11.9% |
| Total Housing Units | 856 | 100.0% |
Occupancy by Ownership by Household Size in Durand
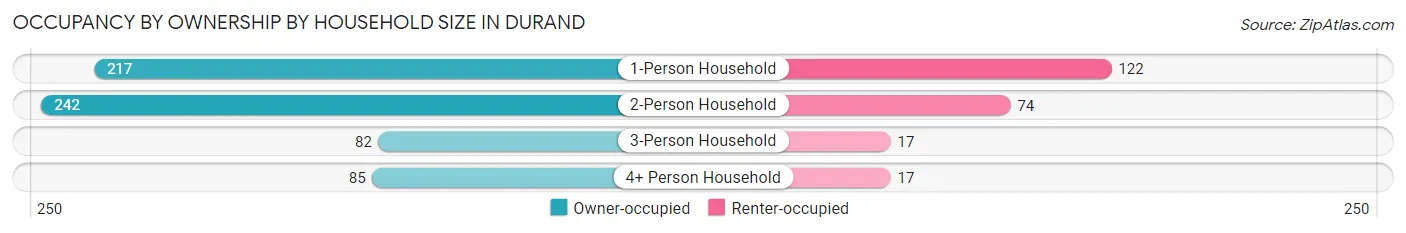
| Household Size | Owner-occupied | Renter-occupied |
| 1-Person Household | 217 (64.0%) | 122 (36.0%) |
| 2-Person Household | 242 (76.6%) | 74 (23.4%) |
| 3-Person Household | 82 (82.8%) | 17 (17.2%) |
| 4+ Person Household | 85 (83.3%) | 17 (16.7%) |
| Total Housing Units | 626 (73.1%) | 230 (26.9%) |
Occupancy by Educational Attainment in Durand
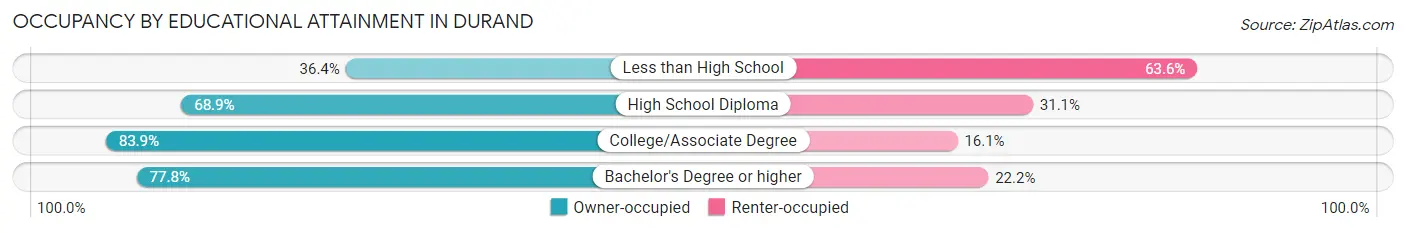
| Household Size | Owner-occupied | Renter-occupied |
| Less than High School | 20 (36.4%) | 35 (63.6%) |
| High School Diploma | 233 (68.9%) | 105 (31.1%) |
| College/Associate Degree | 177 (83.9%) | 34 (16.1%) |
| Bachelor's Degree or higher | 196 (77.8%) | 56 (22.2%) |
Occupancy by Age of Householder in Durand
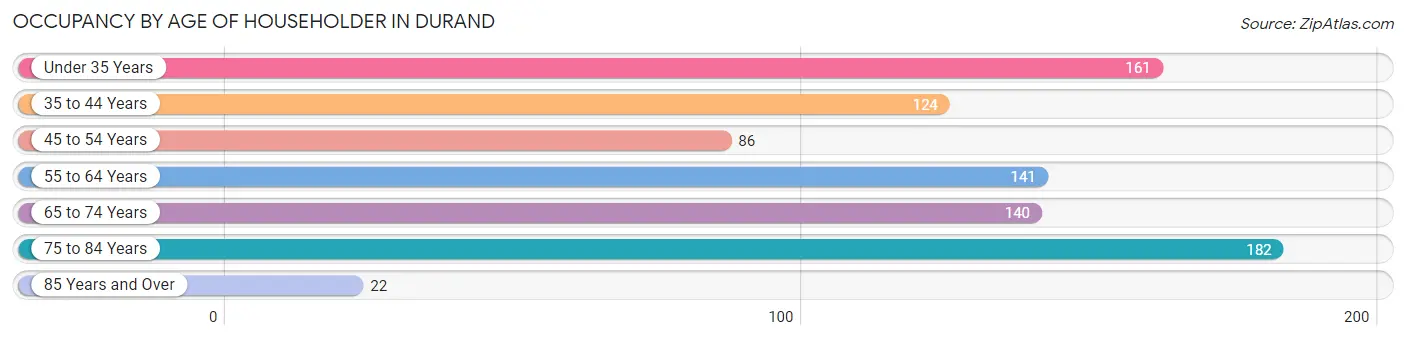
| Age Bracket | # Households | % Households |
| Under 35 Years | 161 | 18.8% |
| 35 to 44 Years | 124 | 14.5% |
| 45 to 54 Years | 86 | 10.1% |
| 55 to 64 Years | 141 | 16.5% |
| 65 to 74 Years | 140 | 16.4% |
| 75 to 84 Years | 182 | 21.3% |
| 85 Years and Over | 22 | 2.6% |
| Total | 856 | 100.0% |
Housing Finances in Durand
Median Income by Occupancy in Durand
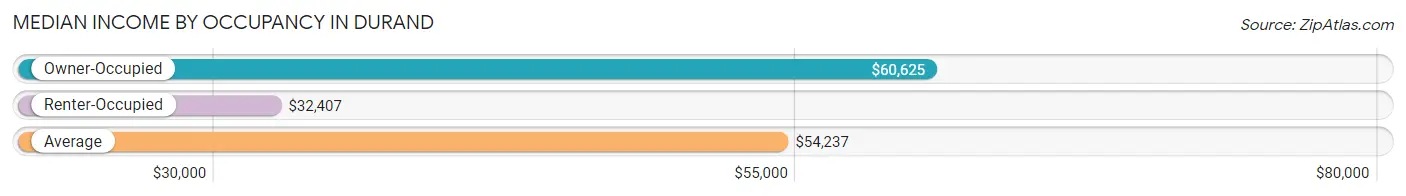
| Occupancy Type | # Households | Median Income |
| Owner-Occupied | 626 (73.1%) | $60,625 |
| Renter-Occupied | 230 (26.9%) | $32,407 |
| Average | 856 (100.0%) | $54,237 |
Occupancy by Householder Income Bracket in Durand
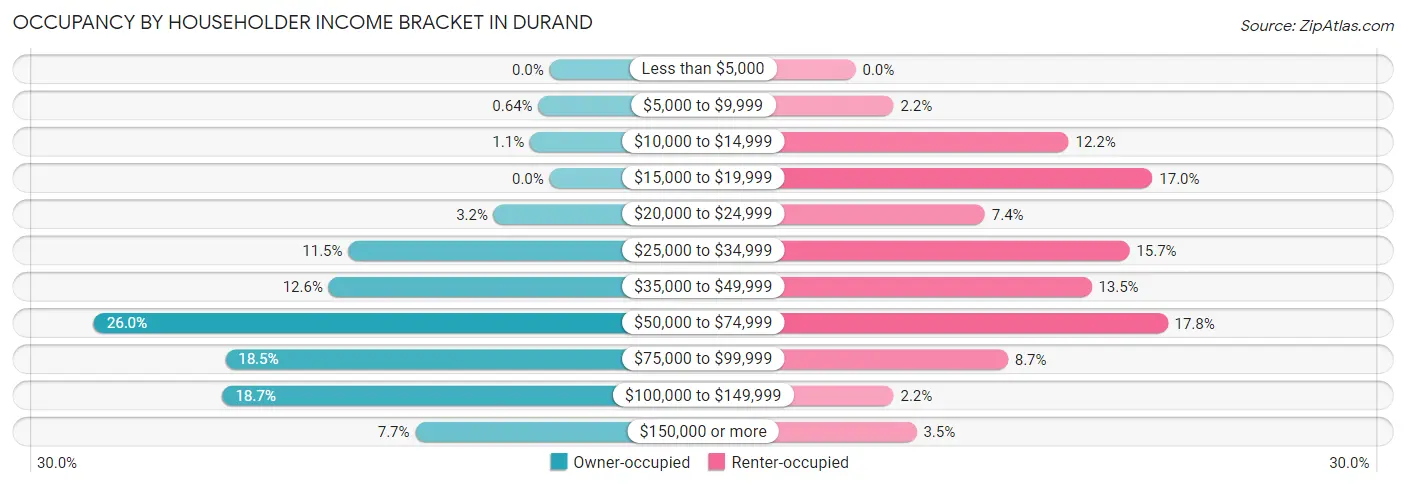
| Income Bracket | Owner-occupied | Renter-occupied |
| Less than $5,000 | 0 (0.0%) | 0 (0.0%) |
| $5,000 to $9,999 | 4 (0.6%) | 5 (2.2%) |
| $10,000 to $14,999 | 7 (1.1%) | 28 (12.2%) |
| $15,000 to $19,999 | 0 (0.0%) | 39 (17.0%) |
| $20,000 to $24,999 | 20 (3.2%) | 17 (7.4%) |
| $25,000 to $34,999 | 72 (11.5%) | 36 (15.7%) |
| $35,000 to $49,999 | 79 (12.6%) | 31 (13.5%) |
| $50,000 to $74,999 | 163 (26.0%) | 41 (17.8%) |
| $75,000 to $99,999 | 116 (18.5%) | 20 (8.7%) |
| $100,000 to $149,999 | 117 (18.7%) | 5 (2.2%) |
| $150,000 or more | 48 (7.7%) | 8 (3.5%) |
| Total | 626 (100.0%) | 230 (100.0%) |
Monthly Housing Cost Tiers in Durand
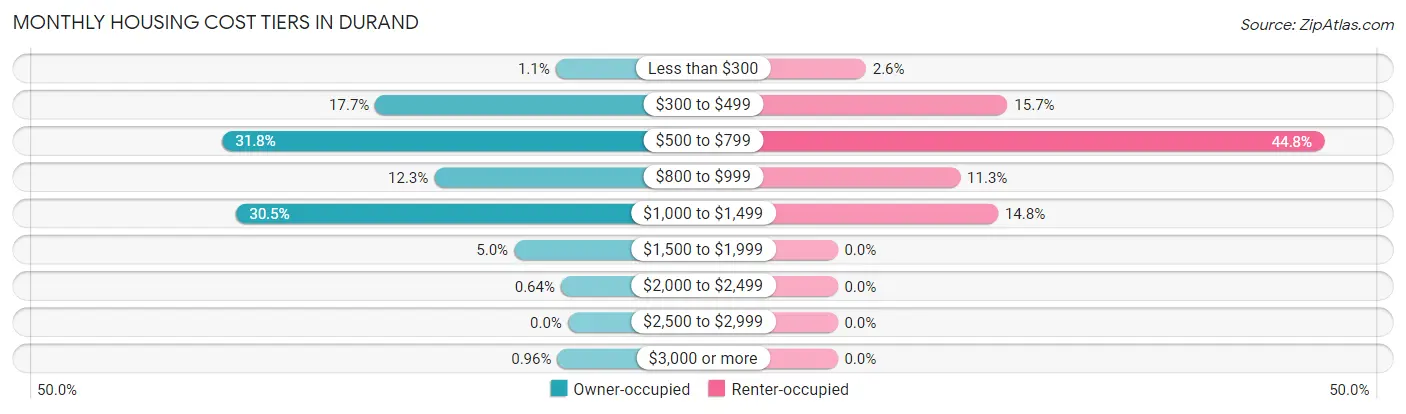
| Monthly Cost | Owner-occupied | Renter-occupied |
| Less than $300 | 7 (1.1%) | 6 (2.6%) |
| $300 to $499 | 111 (17.7%) | 36 (15.7%) |
| $500 to $799 | 199 (31.8%) | 103 (44.8%) |
| $800 to $999 | 77 (12.3%) | 26 (11.3%) |
| $1,000 to $1,499 | 191 (30.5%) | 34 (14.8%) |
| $1,500 to $1,999 | 31 (5.0%) | 0 (0.0%) |
| $2,000 to $2,499 | 4 (0.6%) | 0 (0.0%) |
| $2,500 to $2,999 | 0 (0.0%) | 0 (0.0%) |
| $3,000 or more | 6 (1.0%) | 0 (0.0%) |
| Total | 626 (100.0%) | 230 (100.0%) |
Physical Housing Characteristics in Durand
Housing Structures in Durand
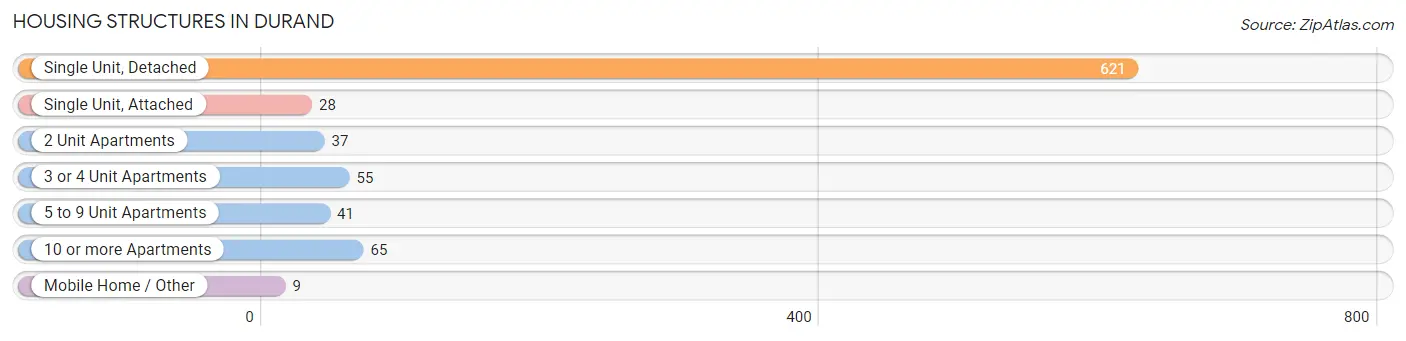
| Structure Type | # Housing Units | % Housing Units |
| Single Unit, Detached | 621 | 72.6% |
| Single Unit, Attached | 28 | 3.3% |
| 2 Unit Apartments | 37 | 4.3% |
| 3 or 4 Unit Apartments | 55 | 6.4% |
| 5 to 9 Unit Apartments | 41 | 4.8% |
| 10 or more Apartments | 65 | 7.6% |
| Mobile Home / Other | 9 | 1.1% |
| Total | 856 | 100.0% |
Housing Structures by Occupancy in Durand
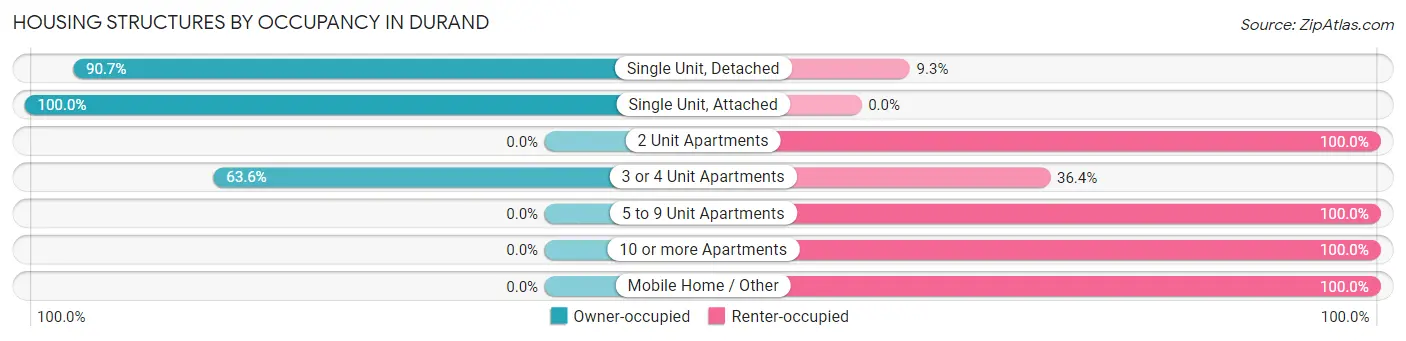
| Structure Type | Owner-occupied | Renter-occupied |
| Single Unit, Detached | 563 (90.7%) | 58 (9.3%) |
| Single Unit, Attached | 28 (100.0%) | 0 (0.0%) |
| 2 Unit Apartments | 0 (0.0%) | 37 (100.0%) |
| 3 or 4 Unit Apartments | 35 (63.6%) | 20 (36.4%) |
| 5 to 9 Unit Apartments | 0 (0.0%) | 41 (100.0%) |
| 10 or more Apartments | 0 (0.0%) | 65 (100.0%) |
| Mobile Home / Other | 0 (0.0%) | 9 (100.0%) |
| Total | 626 (73.1%) | 230 (26.9%) |
Housing Structures by Number of Rooms in Durand
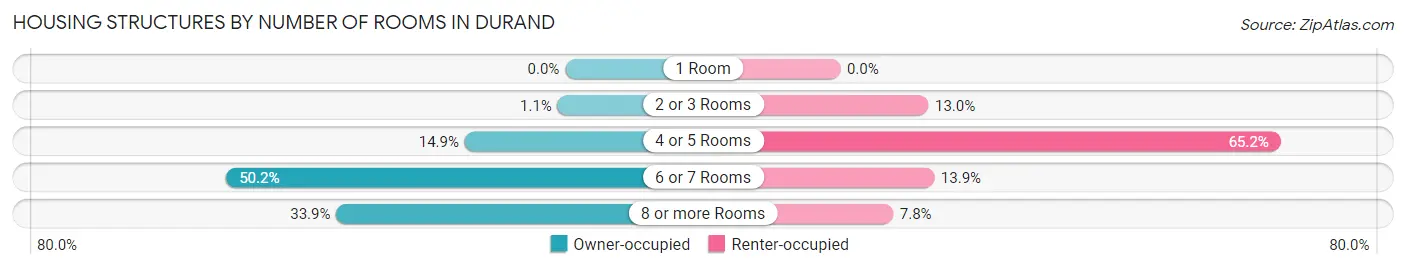
| Number of Rooms | Owner-occupied | Renter-occupied |
| 1 Room | 0 (0.0%) | 0 (0.0%) |
| 2 or 3 Rooms | 7 (1.1%) | 30 (13.0%) |
| 4 or 5 Rooms | 93 (14.9%) | 150 (65.2%) |
| 6 or 7 Rooms | 314 (50.2%) | 32 (13.9%) |
| 8 or more Rooms | 212 (33.9%) | 18 (7.8%) |
| Total | 626 (100.0%) | 230 (100.0%) |
Housing Structure by Heating Type in Durand
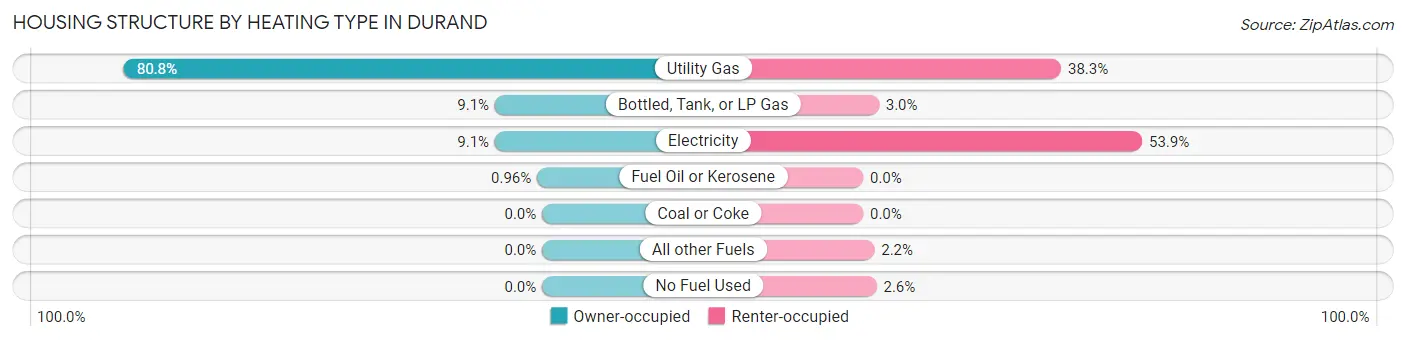
| Heating Type | Owner-occupied | Renter-occupied |
| Utility Gas | 506 (80.8%) | 88 (38.3%) |
| Bottled, Tank, or LP Gas | 57 (9.1%) | 7 (3.0%) |
| Electricity | 57 (9.1%) | 124 (53.9%) |
| Fuel Oil or Kerosene | 6 (1.0%) | 0 (0.0%) |
| Coal or Coke | 0 (0.0%) | 0 (0.0%) |
| All other Fuels | 0 (0.0%) | 5 (2.2%) |
| No Fuel Used | 0 (0.0%) | 6 (2.6%) |
| Total | 626 (100.0%) | 230 (100.0%) |
Household Vehicle Usage in Durand
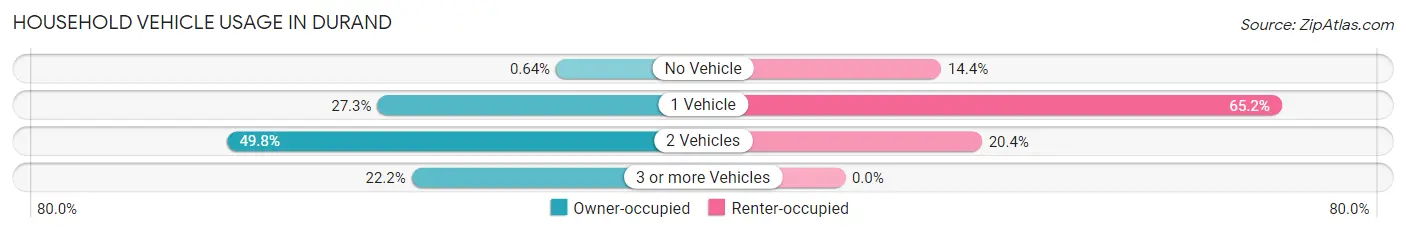
| Vehicles per Household | Owner-occupied | Renter-occupied |
| No Vehicle | 4 (0.6%) | 33 (14.3%) |
| 1 Vehicle | 171 (27.3%) | 150 (65.2%) |
| 2 Vehicles | 312 (49.8%) | 47 (20.4%) |
| 3 or more Vehicles | 139 (22.2%) | 0 (0.0%) |
| Total | 626 (100.0%) | 230 (100.0%) |
Real Estate & Mortgages in Durand
Real Estate and Mortgage Overview in Durand
| Characteristic | Without Mortgage | With Mortgage |
| Housing Units | 306 | 320 |
| Median Property Value | $132,100 | $121,600 |
| Median Household Income | $53,852 | $21 |
| Monthly Housing Costs | $545 | $6 |
| Real Estate Taxes | $2,440 | $30 |
Property Value by Mortgage Status in Durand
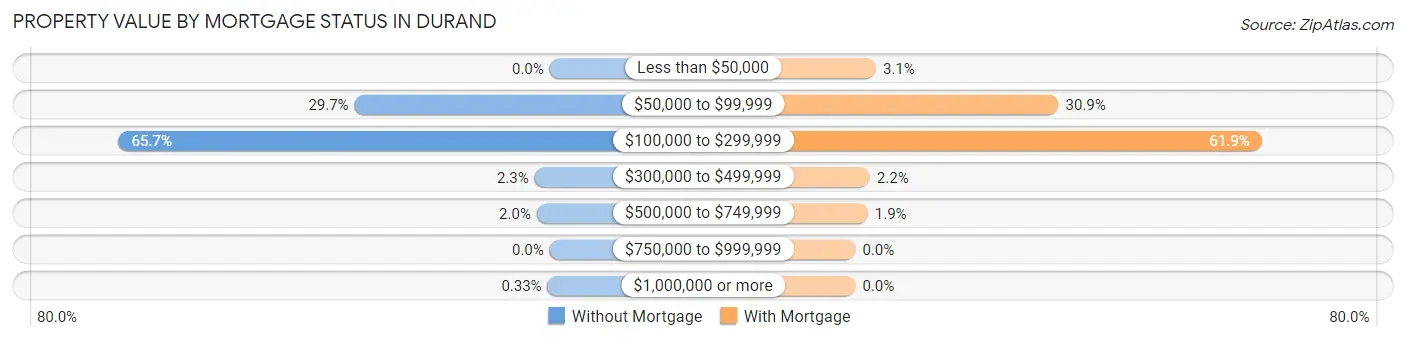
| Property Value | Without Mortgage | With Mortgage |
| Less than $50,000 | 0 (0.0%) | 10 (3.1%) |
| $50,000 to $99,999 | 91 (29.7%) | 99 (30.9%) |
| $100,000 to $299,999 | 201 (65.7%) | 198 (61.9%) |
| $300,000 to $499,999 | 7 (2.3%) | 7 (2.2%) |
| $500,000 to $749,999 | 6 (2.0%) | 6 (1.9%) |
| $750,000 to $999,999 | 0 (0.0%) | 0 (0.0%) |
| $1,000,000 or more | 1 (0.3%) | 0 (0.0%) |
| Total | 306 (100.0%) | 320 (100.0%) |
Household Income by Mortgage Status in Durand
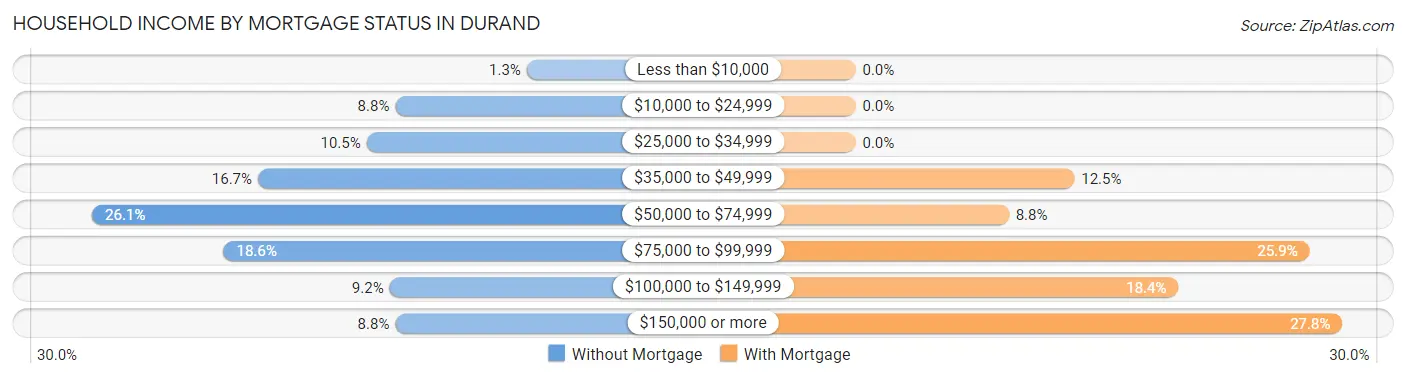
| Household Income | Without Mortgage | With Mortgage |
| Less than $10,000 | 4 (1.3%) | 0 (0.0%) |
| $10,000 to $24,999 | 27 (8.8%) | 0 (0.0%) |
| $25,000 to $34,999 | 32 (10.5%) | 0 (0.0%) |
| $35,000 to $49,999 | 51 (16.7%) | 40 (12.5%) |
| $50,000 to $74,999 | 80 (26.1%) | 28 (8.7%) |
| $75,000 to $99,999 | 57 (18.6%) | 83 (25.9%) |
| $100,000 to $149,999 | 28 (9.1%) | 59 (18.4%) |
| $150,000 or more | 27 (8.8%) | 89 (27.8%) |
| Total | 306 (100.0%) | 320 (100.0%) |
Property Value to Household Income Ratio in Durand
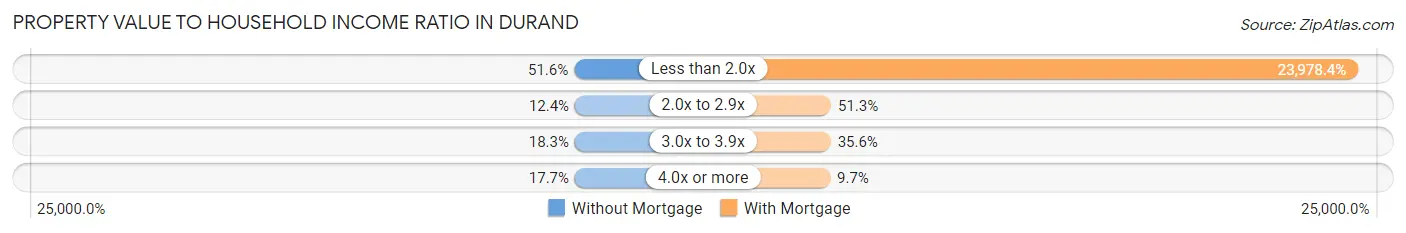
| Value-to-Income Ratio | Without Mortgage | With Mortgage |
| Less than 2.0x | 158 (51.6%) | 76,731 (23,978.4%) |
| 2.0x to 2.9x | 38 (12.4%) | 164 (51.2%) |
| 3.0x to 3.9x | 56 (18.3%) | 114 (35.6%) |
| 4.0x or more | 54 (17.6%) | 31 (9.7%) |
| Total | 306 (100.0%) | 320 (100.0%) |
Real Estate Taxes by Mortgage Status in Durand
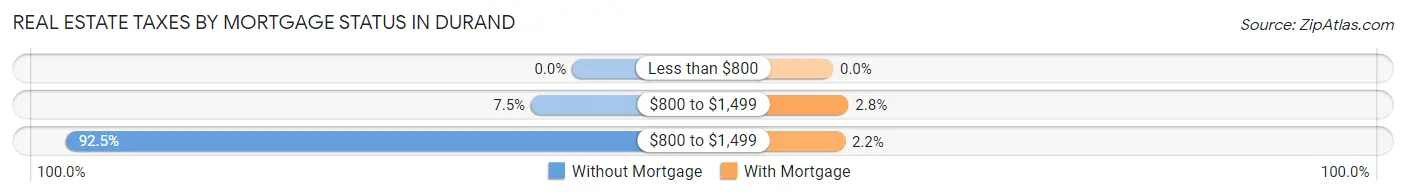
| Property Taxes | Without Mortgage | With Mortgage |
| Less than $800 | 0 (0.0%) | 0 (0.0%) |
| $800 to $1,499 | 23 (7.5%) | 9 (2.8%) |
| $800 to $1,499 | 283 (92.5%) | 7 (2.2%) |
| Total | 306 (100.0%) | 320 (100.0%) |
Health & Disability in Durand
Health Insurance Coverage by Age in Durand
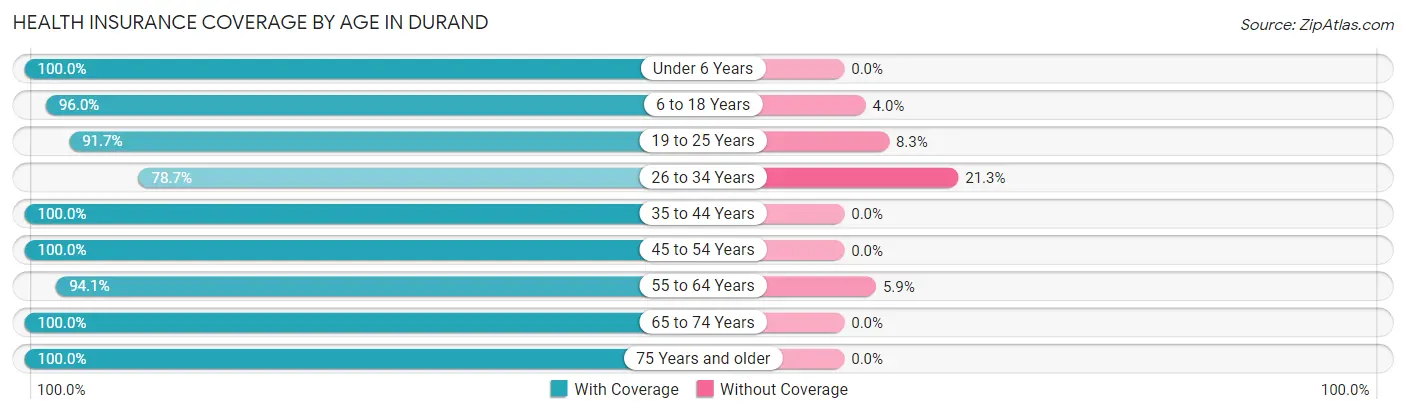
| Age Bracket | With Coverage | Without Coverage |
| Under 6 Years | 82 (100.0%) | 0 (0.0%) |
| 6 to 18 Years | 241 (96.0%) | 10 (4.0%) |
| 19 to 25 Years | 99 (91.7%) | 9 (8.3%) |
| 26 to 34 Years | 137 (78.7%) | 37 (21.3%) |
| 35 to 44 Years | 194 (100.0%) | 0 (0.0%) |
| 45 to 54 Years | 196 (100.0%) | 0 (0.0%) |
| 55 to 64 Years | 207 (94.1%) | 13 (5.9%) |
| 65 to 74 Years | 234 (100.0%) | 0 (0.0%) |
| 75 Years and older | 252 (100.0%) | 0 (0.0%) |
| Total | 1,642 (96.0%) | 69 (4.0%) |
Health Insurance Coverage by Citizenship Status in Durand
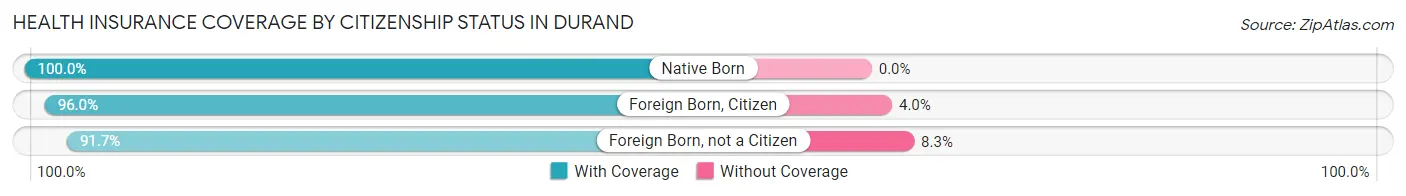
| Citizenship Status | With Coverage | Without Coverage |
| Native Born | 82 (100.0%) | 0 (0.0%) |
| Foreign Born, Citizen | 241 (96.0%) | 10 (4.0%) |
| Foreign Born, not a Citizen | 99 (91.7%) | 9 (8.3%) |
Health Insurance Coverage by Household Income in Durand

| Household Income | With Coverage | Without Coverage |
| Under $25,000 | 167 (100.0%) | 0 (0.0%) |
| $25,000 to $49,999 | 342 (96.9%) | 11 (3.1%) |
| $50,000 to $74,999 | 355 (93.4%) | 25 (6.6%) |
| $75,000 to $99,999 | 330 (92.2%) | 28 (7.8%) |
| $100,000 and over | 432 (98.9%) | 5 (1.1%) |
Public vs Private Health Insurance Coverage by Age in Durand
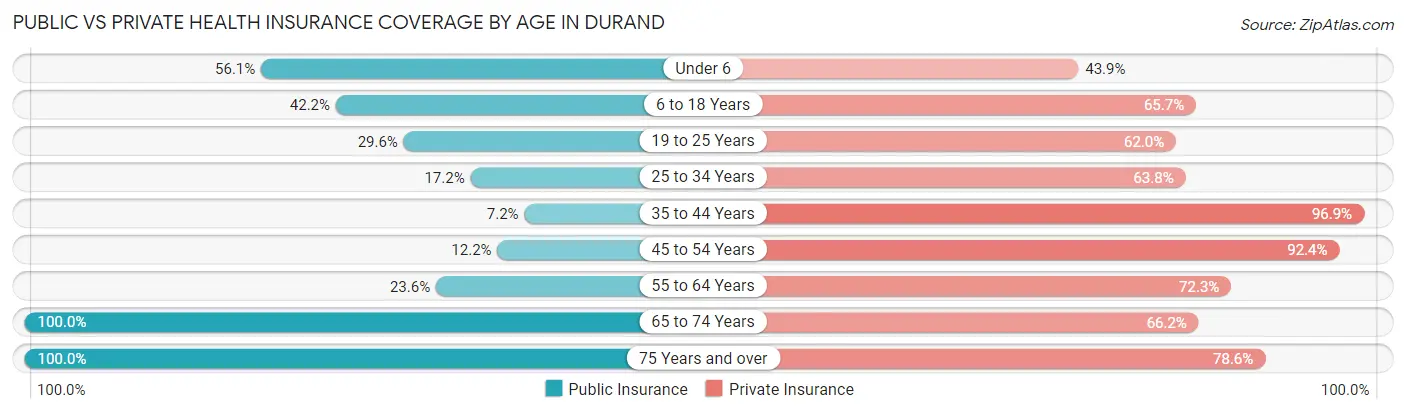
| Age Bracket | Public Insurance | Private Insurance |
| Under 6 | 46 (56.1%) | 36 (43.9%) |
| 6 to 18 Years | 106 (42.2%) | 165 (65.7%) |
| 19 to 25 Years | 32 (29.6%) | 67 (62.0%) |
| 25 to 34 Years | 30 (17.2%) | 111 (63.8%) |
| 35 to 44 Years | 14 (7.2%) | 188 (96.9%) |
| 45 to 54 Years | 24 (12.2%) | 181 (92.3%) |
| 55 to 64 Years | 52 (23.6%) | 159 (72.3%) |
| 65 to 74 Years | 234 (100.0%) | 155 (66.2%) |
| 75 Years and over | 252 (100.0%) | 198 (78.6%) |
| Total | 790 (46.2%) | 1,260 (73.6%) |
Disability Status by Sex by Age in Durand
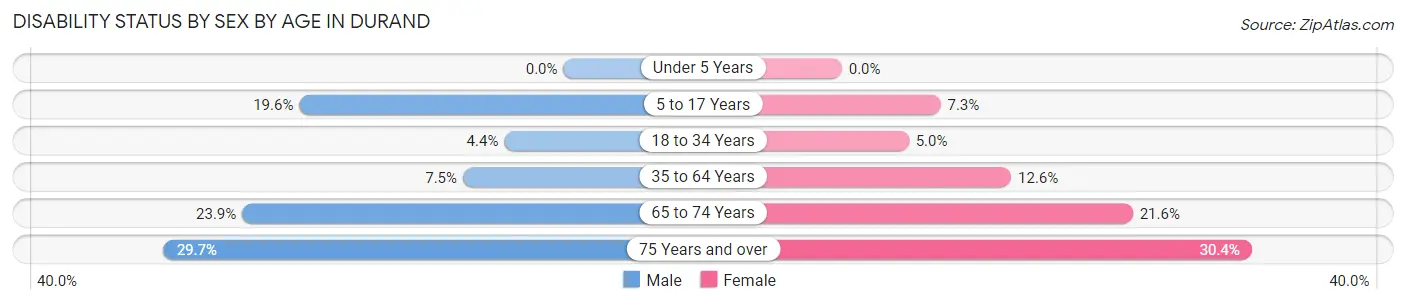
| Age Bracket | Male | Female |
| Under 5 Years | 0 (0.0%) | 0 (0.0%) |
| 5 to 17 Years | 20 (19.6%) | 11 (7.3%) |
| 18 to 34 Years | 5 (4.4%) | 9 (5.0%) |
| 35 to 64 Years | 20 (7.5%) | 43 (12.6%) |
| 65 to 74 Years | 26 (23.8%) | 27 (21.6%) |
| 75 Years and over | 27 (29.7%) | 49 (30.4%) |
Disability Class by Sex by Age in Durand
Disability Class: Hearing Difficulty
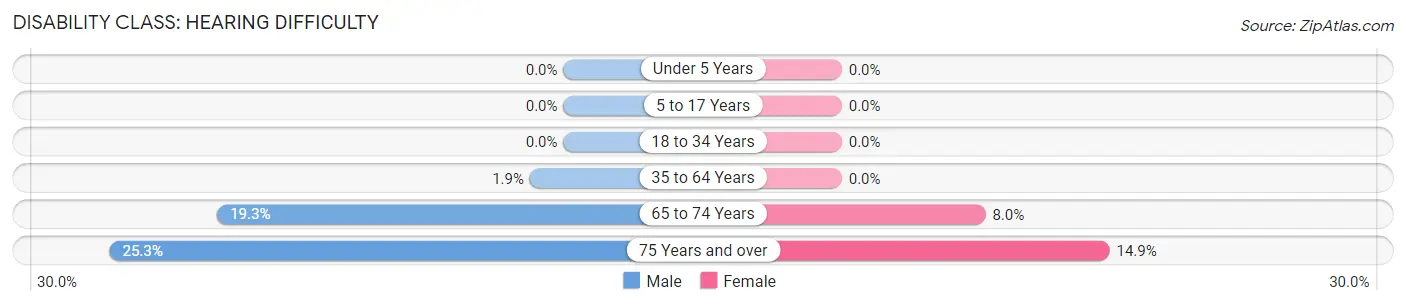
| Age Bracket | Male | Female |
| Under 5 Years | 0 (0.0%) | 0 (0.0%) |
| 5 to 17 Years | 0 (0.0%) | 0 (0.0%) |
| 18 to 34 Years | 0 (0.0%) | 0 (0.0%) |
| 35 to 64 Years | 5 (1.9%) | 0 (0.0%) |
| 65 to 74 Years | 21 (19.3%) | 10 (8.0%) |
| 75 Years and over | 23 (25.3%) | 24 (14.9%) |
Disability Class: Vision Difficulty
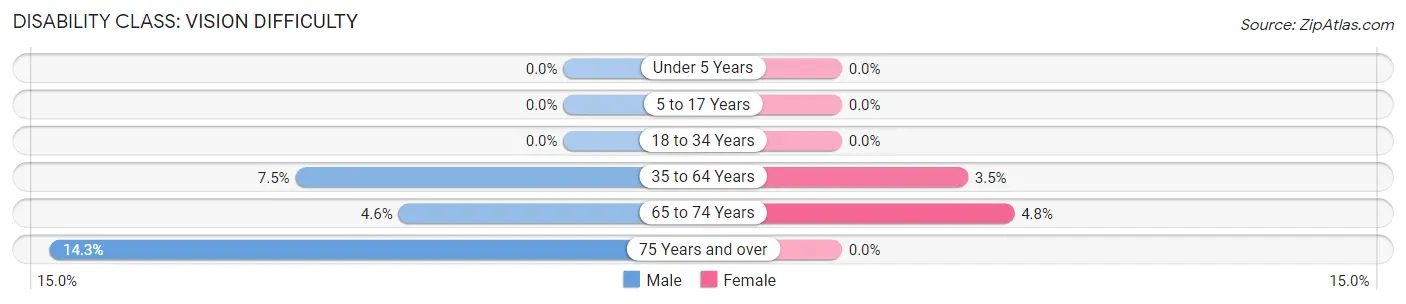
| Age Bracket | Male | Female |
| Under 5 Years | 0 (0.0%) | 0 (0.0%) |
| 5 to 17 Years | 0 (0.0%) | 0 (0.0%) |
| 18 to 34 Years | 0 (0.0%) | 0 (0.0%) |
| 35 to 64 Years | 20 (7.5%) | 12 (3.5%) |
| 65 to 74 Years | 5 (4.6%) | 6 (4.8%) |
| 75 Years and over | 13 (14.3%) | 0 (0.0%) |
Disability Class: Cognitive Difficulty
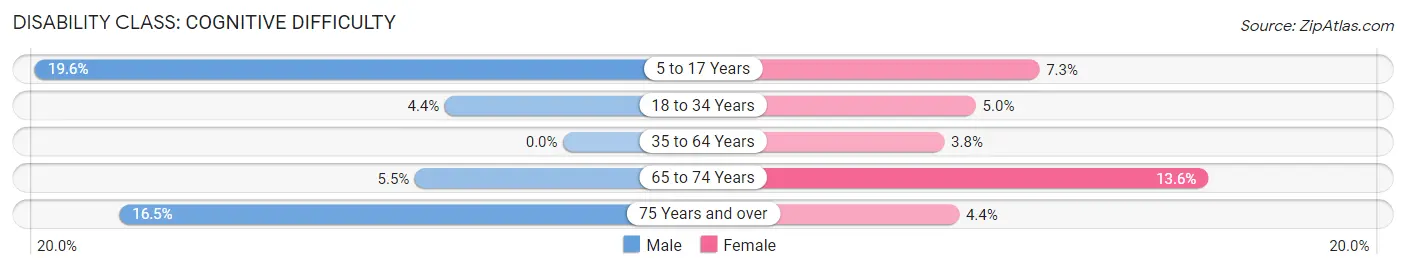
| Age Bracket | Male | Female |
| 5 to 17 Years | 20 (19.6%) | 11 (7.3%) |
| 18 to 34 Years | 5 (4.4%) | 9 (5.0%) |
| 35 to 64 Years | 0 (0.0%) | 13 (3.8%) |
| 65 to 74 Years | 6 (5.5%) | 17 (13.6%) |
| 75 Years and over | 15 (16.5%) | 7 (4.3%) |
Disability Class: Ambulatory Difficulty
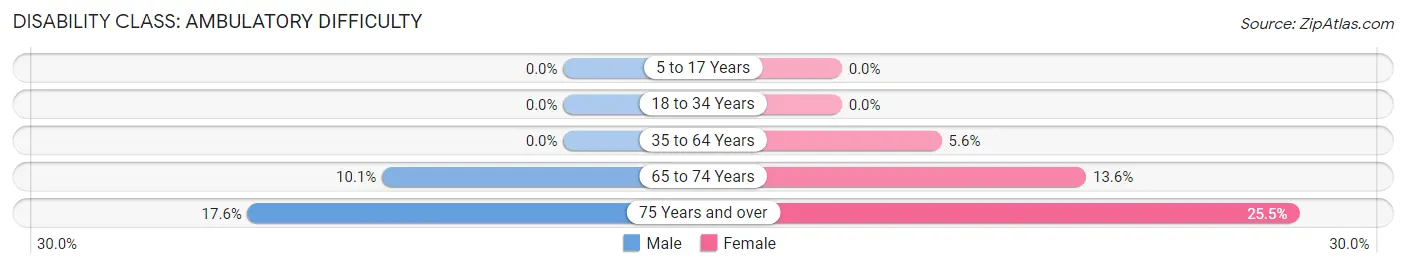
| Age Bracket | Male | Female |
| 5 to 17 Years | 0 (0.0%) | 0 (0.0%) |
| 18 to 34 Years | 0 (0.0%) | 0 (0.0%) |
| 35 to 64 Years | 0 (0.0%) | 19 (5.6%) |
| 65 to 74 Years | 11 (10.1%) | 17 (13.6%) |
| 75 Years and over | 16 (17.6%) | 41 (25.5%) |
Disability Class: Self-Care Difficulty
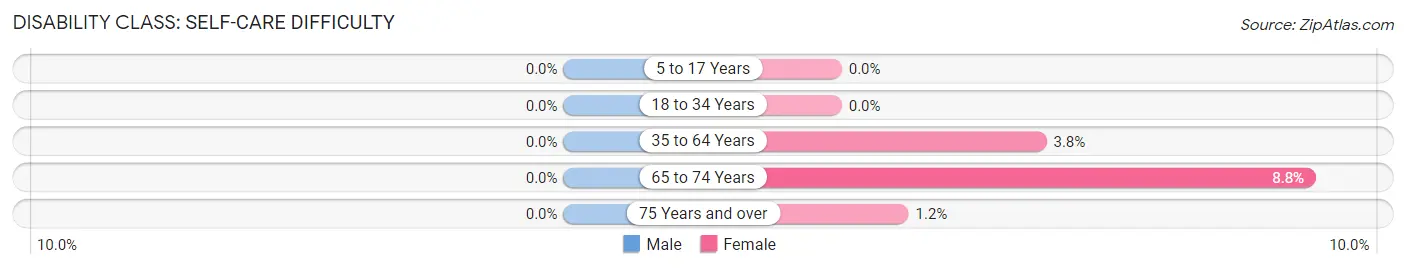
| Age Bracket | Male | Female |
| 5 to 17 Years | 0 (0.0%) | 0 (0.0%) |
| 18 to 34 Years | 0 (0.0%) | 0 (0.0%) |
| 35 to 64 Years | 0 (0.0%) | 13 (3.8%) |
| 65 to 74 Years | 0 (0.0%) | 11 (8.8%) |
| 75 Years and over | 0 (0.0%) | 2 (1.2%) |
Technology Access in Durand
Computing Device Access in Durand
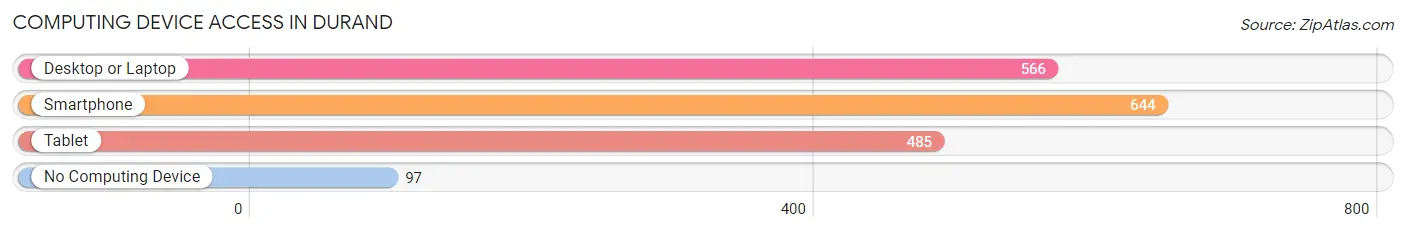
| Device Type | # Households | % Households |
| Desktop or Laptop | 566 | 66.1% |
| Smartphone | 644 | 75.2% |
| Tablet | 485 | 56.7% |
| No Computing Device | 97 | 11.3% |
| Total | 856 | 100.0% |
Internet Access in Durand
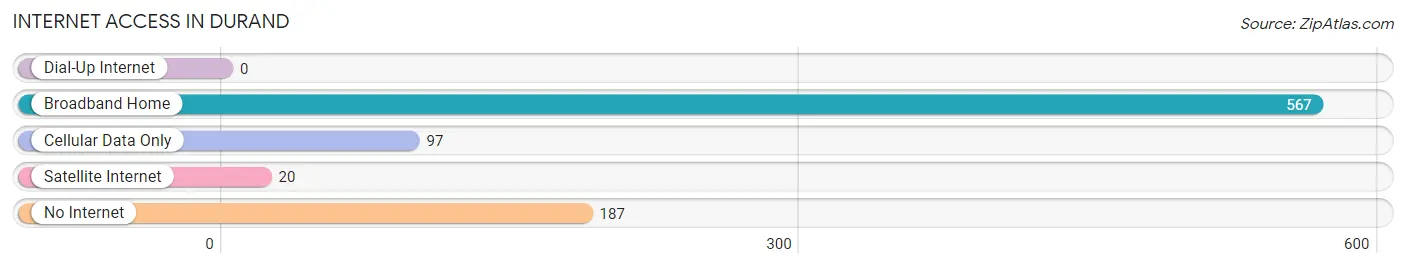
| Internet Type | # Households | % Households |
| Dial-Up Internet | 0 | 0.0% |
| Broadband Home | 567 | 66.2% |
| Cellular Data Only | 97 | 11.3% |
| Satellite Internet | 20 | 2.3% |
| No Internet | 187 | 21.8% |
| Total | 856 | 100.0% |
Durand Summary
Durand, Wisconsin is a small city located in Pepin County, Wisconsin. It is situated on the banks of the Chippewa River, about 25 miles east of Eau Claire. The city has a population of approximately 2,500 people and is the county seat of Pepin County.
History
Durand was founded in 1856 by a group of settlers from New York. The city was named after the French explorer, Pierre Esprit Radisson, who explored the area in the late 1600s. The city was incorporated in 1872 and was the first city in Pepin County.
Durand was an important stop on the Chicago, St. Paul, Minneapolis and Omaha Railroad, which ran through the city in the late 1800s. The railroad brought many new settlers to the area and helped to spur the growth of the city.
In the early 1900s, Durand was a thriving agricultural community. The city was home to several large farms and was known for its production of dairy products, vegetables, and grains. The city also had a thriving lumber industry, which provided jobs for many of the city’s residents.
Geography
Durand is located in the western part of Wisconsin, about 25 miles east of Eau Claire. The city is situated on the banks of the Chippewa River and is surrounded by rolling hills and forests. The city has a total area of 2.2 square miles, all of which is land.
Economy
Durand’s economy is largely based on agriculture and tourism. The city is home to several large farms, which produce dairy products, vegetables, and grains. The city also has a thriving lumber industry, which provides jobs for many of the city’s residents.
In addition to agriculture and lumber, Durand is also home to several small businesses, including restaurants, retail stores, and service providers. The city is also home to a number of tourist attractions, including the Durand Railroad Museum and the Durand Historical Society.
Demographics
As of the 2010 census, Durand had a population of 2,500 people. The racial makeup of the city was 97.2% White, 0.4% African American, 0.2% Native American, 0.4% Asian, 0.2% from other races, and 1.6% from two or more races. Hispanic or Latino of any race were 1.2% of the population.
The median income for a household in Durand was $41,250, and the median income for a family was $50,000. The per capita income for the city was $20,845. About 8.2% of families and 10.2% of the population were below the poverty line, including 14.2% of those under age 18 and 6.2% of those age 65 or over.
Common Questions
What is Per Capita Income in Durand?
Per Capita income in Durand is $34,784.
What is the Median Family Income in Durand?
Median Family Income in Durand is $77,204.
What is the Median Household income in Durand?
Median Household Income in Durand is $54,237.
What is Income or Wage Gap in Durand?
Income or Wage Gap in Durand is 29.7%.
Women in Durand earn 70.3 cents for every dollar earned by a man.
What is Inequality or Gini Index in Durand?
Inequality or Gini Index in Durand is 0.37.
What is the Total Population of Durand?
Total Population of Durand is 1,735.
What is the Total Male Population of Durand?
Total Male Population of Durand is 758.
What is the Total Female Population of Durand?
Total Female Population of Durand is 977.
What is the Ratio of Males per 100 Females in Durand?
There are 77.58 Males per 100 Females in Durand.
What is the Ratio of Females per 100 Males in Durand?
There are 128.89 Females per 100 Males in Durand.
What is the Median Population Age in Durand?
Median Population Age in Durand is 46.9 Years.
What is the Average Family Size in Durand
Average Family Size in Durand is 2.6 People.
What is the Average Household Size in Durand
Average Household Size in Durand is 2.0 People.
How Large is the Labor Force in Durand?
There are 836 People in the Labor Forcein in Durand.
What is the Percentage of People in the Labor Force in Durand?
57.8% of People are in the Labor Force in Durand.
What is the Unemployment Rate in Durand?
Unemployment Rate in Durand is 1.7%.