Dousman, WI Map & Demographics
Dousman Map
Dousman Overview
$40,610
PER CAPITA INCOME
$98,750
AVG FAMILY INCOME
$85,909
AVG HOUSEHOLD INCOME
31.8%
WAGE / INCOME GAP [ % ]
68.2¢/ $1
WAGE / INCOME GAP [ $ ]
0.39
INEQUALITY / GINI INDEX
2,099
TOTAL POPULATION
1,022
MALE POPULATION
1,077
FEMALE POPULATION
94.89
MALES / 100 FEMALES
105.38
FEMALES / 100 MALES
42.6
MEDIAN AGE
3.0
AVG FAMILY SIZE
2.5
AVG HOUSEHOLD SIZE
1,014
LABOR FORCE [ PEOPLE ]
61.1%
PERCENT IN LABOR FORCE
1.6%
UNEMPLOYMENT RATE
Dousman Zip Codes
Dousman Area Codes
Income in Dousman
Income Overview in Dousman
Per Capita Income in Dousman is $40,610, while median incomes of families and households are $98,750 and $85,909 respectively.
| Characteristic | Number | Measure |
| Per Capita Income | 2,099 | $40,610 |
| Median Family Income | 555 | $98,750 |
| Mean Family Income | 555 | $121,800 |
| Median Household Income | 802 | $85,909 |
| Mean Household Income | 802 | $102,153 |
| Income Deficit | 555 | $0 |
| Wage / Income Gap (%) | 2,099 | 31.84% |
| Wage / Income Gap ($) | 2,099 | 68.16¢ per $1 |
| Gini / Inequality Index | 2,099 | 0.39 |
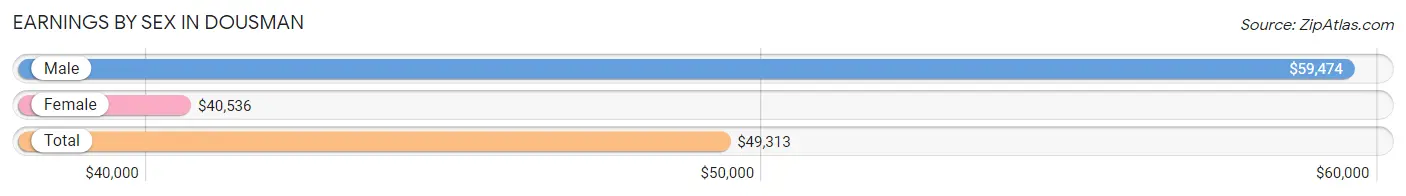
Earnings by Sex in Dousman
Average Earnings in Dousman are $49,313, $59,474 for men and $40,536 for women, a difference of 31.8%.
| Sex | Number | Average Earnings |
| Male | 550 (51.8%) | $59,474 |
| Female | 512 (48.2%) | $40,536 |
| Total | 1,062 (100.0%) | $49,313 |
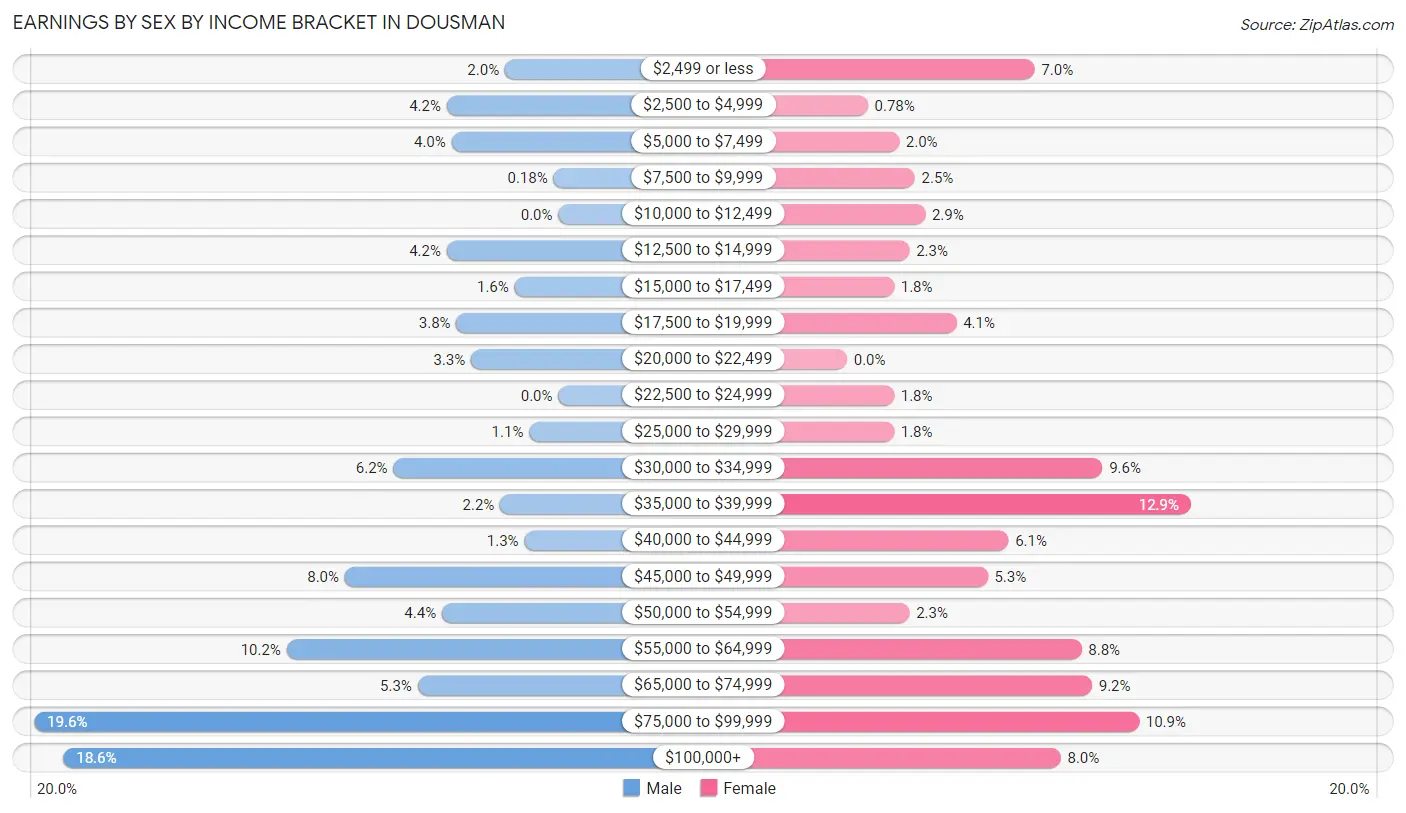
Earnings by Sex by Income Bracket in Dousman
The most common earnings brackets in Dousman are $75,000 to $99,999 for men (108 | 19.6%) and $35,000 to $39,999 for women (66 | 12.9%).
| Income | Male | Female |
| $2,499 or less | 11 (2.0%) | 36 (7.0%) |
| $2,500 to $4,999 | 23 (4.2%) | 4 (0.8%) |
| $5,000 to $7,499 | 22 (4.0%) | 10 (1.9%) |
| $7,500 to $9,999 | 1 (0.2%) | 13 (2.5%) |
| $10,000 to $12,499 | 0 (0.0%) | 15 (2.9%) |
| $12,500 to $14,999 | 23 (4.2%) | 12 (2.3%) |
| $15,000 to $17,499 | 9 (1.6%) | 9 (1.8%) |
| $17,500 to $19,999 | 21 (3.8%) | 21 (4.1%) |
| $20,000 to $22,499 | 18 (3.3%) | 0 (0.0%) |
| $22,500 to $24,999 | 0 (0.0%) | 9 (1.8%) |
| $25,000 to $29,999 | 6 (1.1%) | 9 (1.8%) |
| $30,000 to $34,999 | 34 (6.2%) | 49 (9.6%) |
| $35,000 to $39,999 | 12 (2.2%) | 66 (12.9%) |
| $40,000 to $44,999 | 7 (1.3%) | 31 (6.0%) |
| $45,000 to $49,999 | 44 (8.0%) | 27 (5.3%) |
| $50,000 to $54,999 | 24 (4.4%) | 12 (2.3%) |
| $55,000 to $64,999 | 56 (10.2%) | 45 (8.8%) |
| $65,000 to $74,999 | 29 (5.3%) | 47 (9.2%) |
| $75,000 to $99,999 | 108 (19.6%) | 56 (10.9%) |
| $100,000+ | 102 (18.5%) | 41 (8.0%) |
| Total | 550 (100.0%) | 512 (100.0%) |
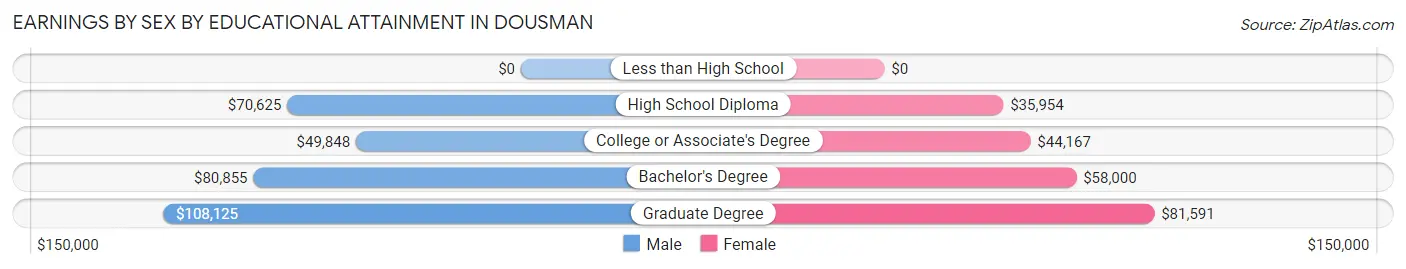
Earnings by Sex by Educational Attainment in Dousman
Average earnings in Dousman are $70,104 for men and $43,824 for women, a difference of 37.5%. Men with an educational attainment of graduate degree enjoy the highest average annual earnings of $108,125, while those with college or associate's degree education earn the least with $49,848. Women with an educational attainment of graduate degree earn the most with the average annual earnings of $81,591, while those with high school diploma education have the smallest earnings of $35,954.
| Educational Attainment | Male Income | Female Income |
| Less than High School | - | - |
| High School Diploma | $70,625 | $35,954 |
| College or Associate's Degree | $49,848 | $44,167 |
| Bachelor's Degree | $80,855 | $58,000 |
| Graduate Degree | $108,125 | $81,591 |
| Total | $70,104 | $43,824 |
Family Income in Dousman
Family Income Brackets in Dousman
According to the Dousman family income data, there are 169 families falling into the $75,000 to $99,999 income range, which is the most common income bracket and makes up 30.4% of all families.
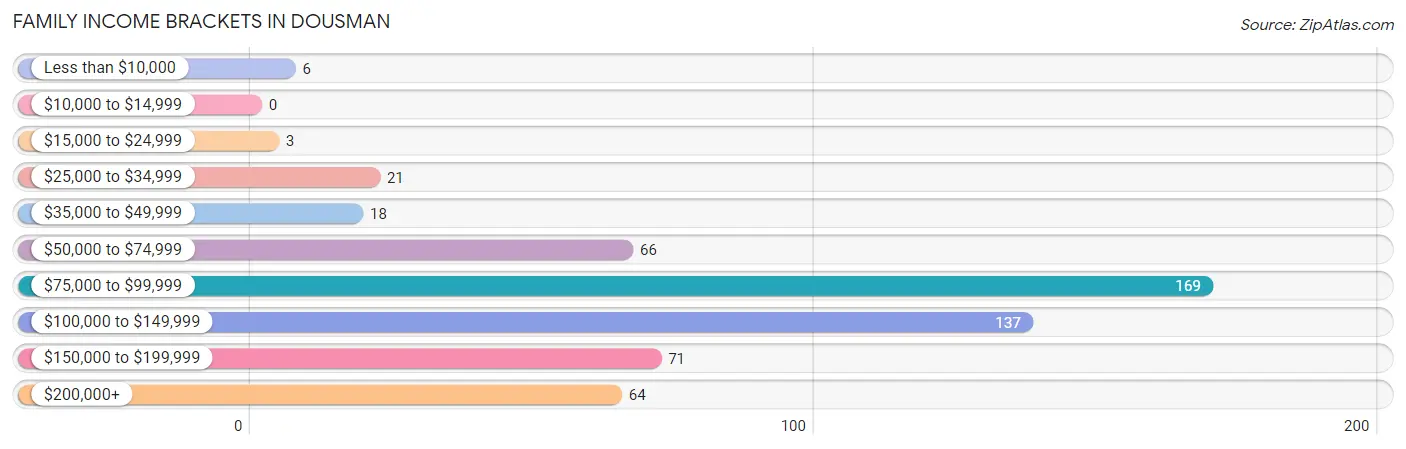
| Income Bracket | # Families | % Families |
| Less than $10,000 | 6 | 1.1% |
| $10,000 to $14,999 | 0 | 0.0% |
| $15,000 to $24,999 | 3 | 0.5% |
| $25,000 to $34,999 | 21 | 3.8% |
| $35,000 to $49,999 | 18 | 3.2% |
| $50,000 to $74,999 | 66 | 11.9% |
| $75,000 to $99,999 | 169 | 30.5% |
| $100,000 to $149,999 | 137 | 24.7% |
| $150,000 to $199,999 | 71 | 12.8% |
| $200,000+ | 64 | 11.5% |
Family Income by Famaliy Size in Dousman
4-person families (99 | 17.8%) account for the highest median family income in Dousman with $141,250 per family, while 2-person families (299 | 53.9%) have the highest median income of $47,380 per family member.
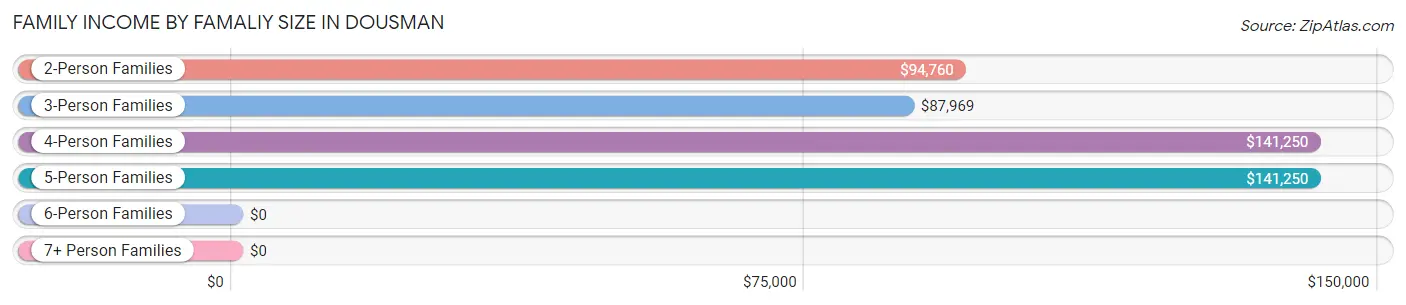
| Income Bracket | # Families | Median Income |
| 2-Person Families | 299 (53.9%) | $94,760 |
| 3-Person Families | 95 (17.1%) | $87,969 |
| 4-Person Families | 99 (17.8%) | $141,250 |
| 5-Person Families | 58 (10.4%) | $141,250 |
| 6-Person Families | 4 (0.7%) | $0 |
| 7+ Person Families | 0 (0.0%) | $0 |
| Total | 555 (100.0%) | $98,750 |
Family Income by Number of Earners in Dousman
The median family income in Dousman is $98,750, with families comprising 3+ earners (37) having the highest median family income of $161,458, while families with 1 earner (148) have the lowest median family income of $75,208, accounting for 6.7% and 26.7% of families, respectively.
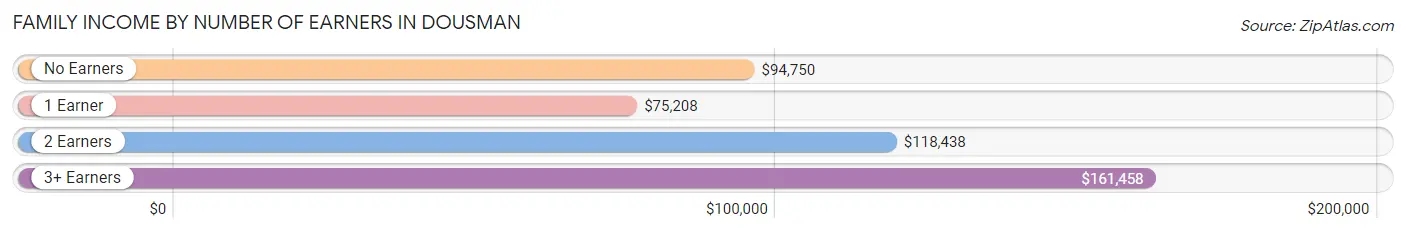
| Number of Earners | # Families | Median Income |
| No Earners | 67 (12.1%) | $94,750 |
| 1 Earner | 148 (26.7%) | $75,208 |
| 2 Earners | 303 (54.6%) | $118,438 |
| 3+ Earners | 37 (6.7%) | $161,458 |
| Total | 555 (100.0%) | $98,750 |
Household Income in Dousman
Household Income Brackets in Dousman
With 202 households falling in the category, the $75,000 to $99,999 income range is the most frequent in Dousman, accounting for 25.2% of all households. In contrast, only 13 households (1.6%) fall into the $10,000 to $14,999 income bracket, making it the least populous group.
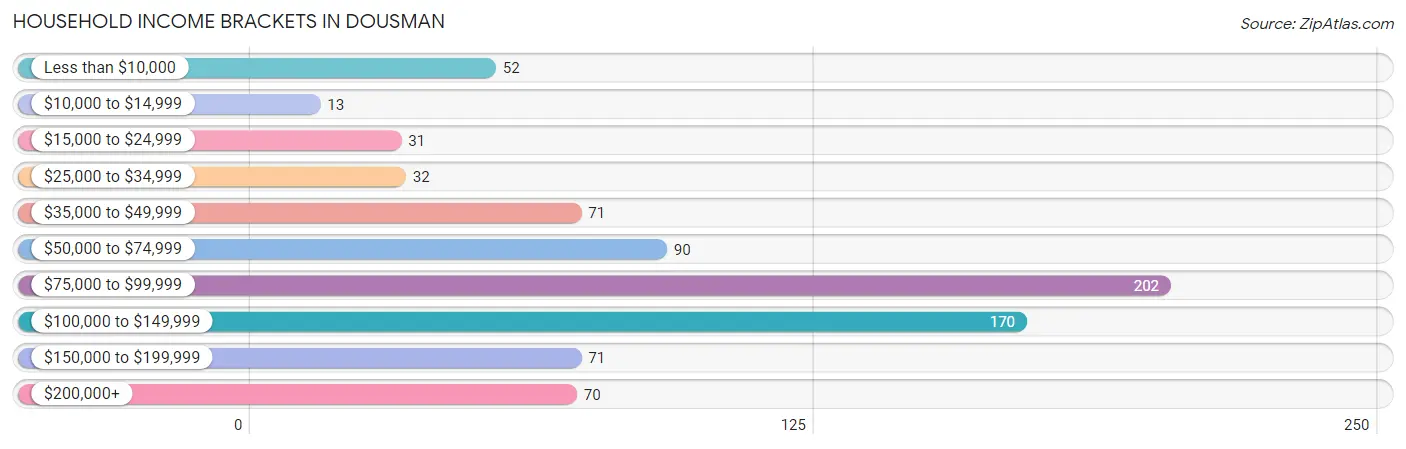
| Income Bracket | # Households | % Households |
| Less than $10,000 | 52 | 6.5% |
| $10,000 to $14,999 | 13 | 1.6% |
| $15,000 to $24,999 | 31 | 3.9% |
| $25,000 to $34,999 | 32 | 4.0% |
| $35,000 to $49,999 | 71 | 8.9% |
| $50,000 to $74,999 | 90 | 11.2% |
| $75,000 to $99,999 | 202 | 25.2% |
| $100,000 to $149,999 | 170 | 21.2% |
| $150,000 to $199,999 | 71 | 8.9% |
| $200,000+ | 70 | 8.7% |
Household Income by Householder Age in Dousman
The median household income in Dousman is $85,909, with the highest median household income of $117,500 found in the 25 to 44 years age bracket for the primary householder. A total of 218 households (27.2%) fall into this category. Meanwhile, the 15 to 24 years age bracket for the primary householder has the lowest median household income of $0, with 7 households (0.9%) in this group.
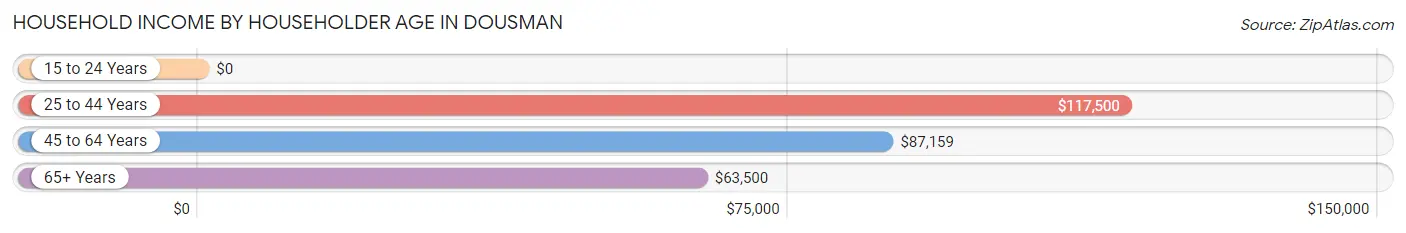
| Income Bracket | # Households | Median Income |
| 15 to 24 Years | 7 (0.9%) | $0 |
| 25 to 44 Years | 218 (27.2%) | $117,500 |
| 45 to 64 Years | 343 (42.8%) | $87,159 |
| 65+ Years | 234 (29.2%) | $63,500 |
| Total | 802 (100.0%) | $85,909 |
Poverty in Dousman
Income Below Poverty by Sex and Age in Dousman
With 5.6% poverty level for males and 8.6% for females among the residents of Dousman, 15 year old males and 75 year old and over females are the most vulnerable to poverty, with 6 males (50.0%) and 35 females (29.9%) in their respective age groups living below the poverty level.
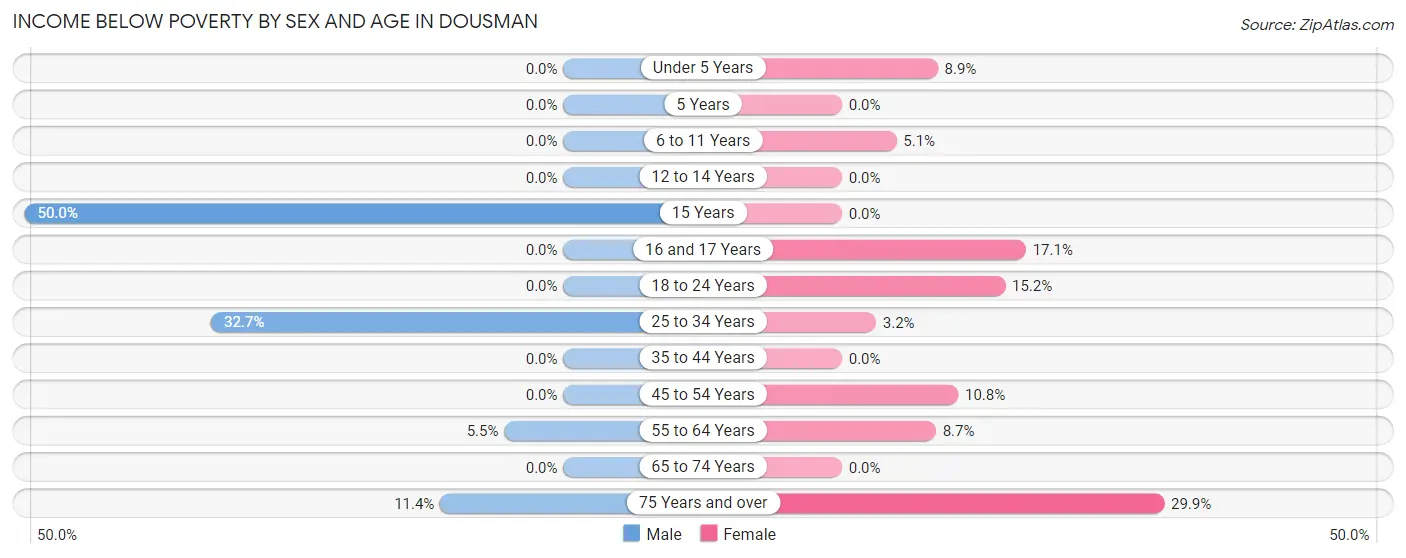
| Age Bracket | Male | Female |
| Under 5 Years | 0 (0.0%) | 4 (8.9%) |
| 5 Years | 0 (0.0%) | 0 (0.0%) |
| 6 to 11 Years | 0 (0.0%) | 4 (5.1%) |
| 12 to 14 Years | 0 (0.0%) | 0 (0.0%) |
| 15 Years | 6 (50.0%) | 0 (0.0%) |
| 16 and 17 Years | 0 (0.0%) | 7 (17.1%) |
| 18 to 24 Years | 0 (0.0%) | 5 (15.1%) |
| 25 to 34 Years | 34 (32.7%) | 3 (3.2%) |
| 35 to 44 Years | 0 (0.0%) | 0 (0.0%) |
| 45 to 54 Years | 0 (0.0%) | 15 (10.8%) |
| 55 to 64 Years | 8 (5.5%) | 13 (8.7%) |
| 65 to 74 Years | 0 (0.0%) | 0 (0.0%) |
| 75 Years and over | 8 (11.4%) | 35 (29.9%) |
| Total | 56 (5.6%) | 86 (8.6%) |
Income Above Poverty by Sex and Age in Dousman
According to the poverty statistics in Dousman, males aged under 5 years and females aged 5 years are the age groups that are most secure financially, with 100.0% of males and 100.0% of females in these age groups living above the poverty line.
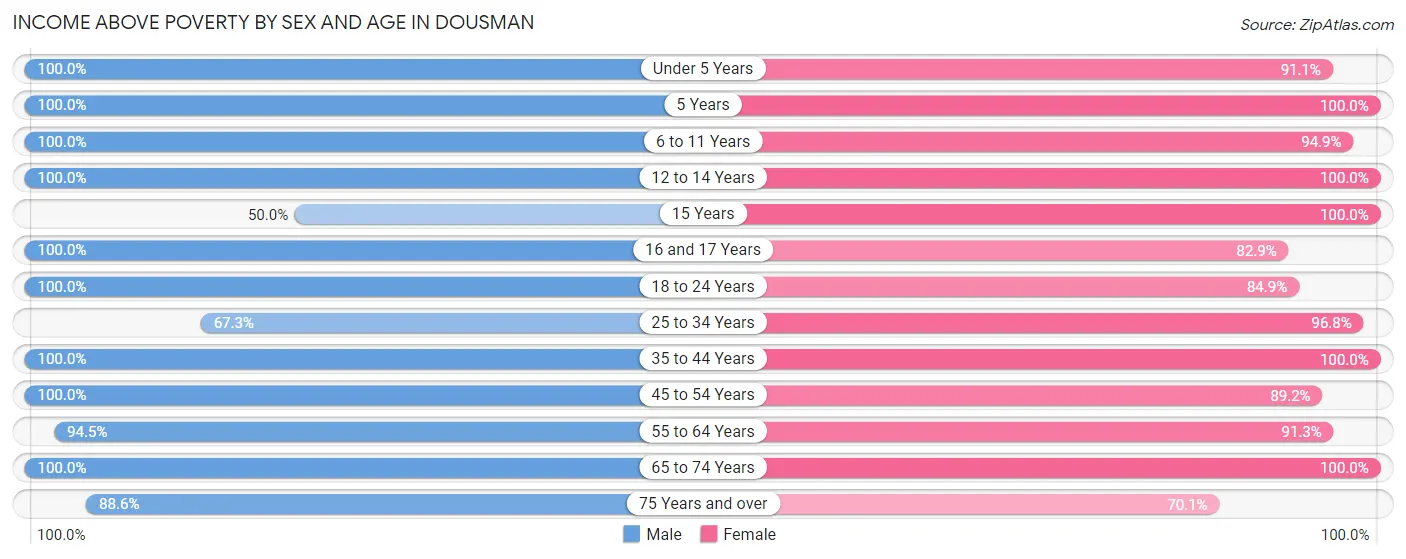
| Age Bracket | Male | Female |
| Under 5 Years | 29 (100.0%) | 41 (91.1%) |
| 5 Years | 9 (100.0%) | 17 (100.0%) |
| 6 to 11 Years | 69 (100.0%) | 75 (94.9%) |
| 12 to 14 Years | 79 (100.0%) | 70 (100.0%) |
| 15 Years | 6 (50.0%) | 12 (100.0%) |
| 16 and 17 Years | 17 (100.0%) | 34 (82.9%) |
| 18 to 24 Years | 120 (100.0%) | 28 (84.9%) |
| 25 to 34 Years | 70 (67.3%) | 92 (96.8%) |
| 35 to 44 Years | 143 (100.0%) | 112 (100.0%) |
| 45 to 54 Years | 127 (100.0%) | 124 (89.2%) |
| 55 to 64 Years | 138 (94.5%) | 136 (91.3%) |
| 65 to 74 Years | 81 (100.0%) | 91 (100.0%) |
| 75 Years and over | 62 (88.6%) | 82 (70.1%) |
| Total | 950 (94.4%) | 914 (91.4%) |
Income Below Poverty Among Married-Couple Families in Dousman
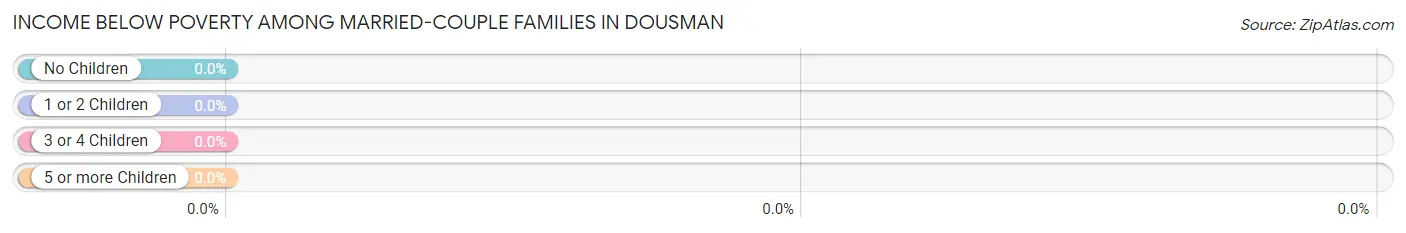
| Children | Above Poverty | Below Poverty |
| No Children | 255 (100.0%) | 0 (0.0%) |
| 1 or 2 Children | 117 (100.0%) | 0 (0.0%) |
| 3 or 4 Children | 42 (100.0%) | 0 (0.0%) |
| 5 or more Children | 0 (0.0%) | 0 (0.0%) |
| Total | 414 (100.0%) | 0 (0.0%) |
Income Below Poverty Among Single-Parent Households in Dousman
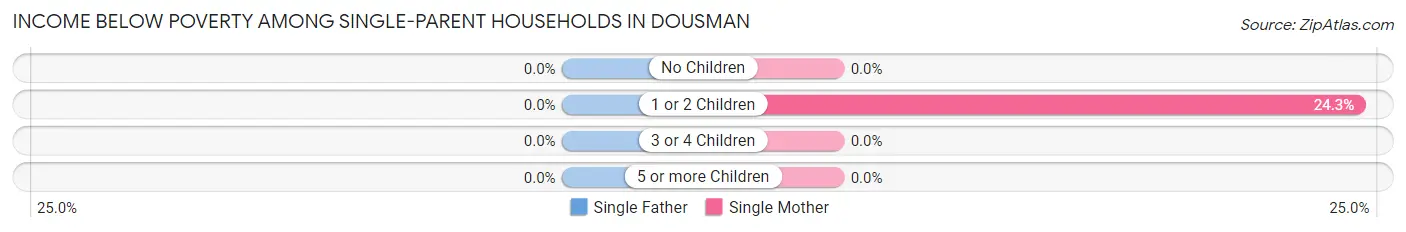
| Children | Single Father | Single Mother |
| No Children | 0 (0.0%) | 0 (0.0%) |
| 1 or 2 Children | 0 (0.0%) | 9 (24.3%) |
| 3 or 4 Children | 0 (0.0%) | 0 (0.0%) |
| 5 or more Children | 0 (0.0%) | 0 (0.0%) |
| Total | 0 (0.0%) | 9 (8.7%) |
Income Below Poverty Among Married-Couple vs Single-Parent Households in Dousman
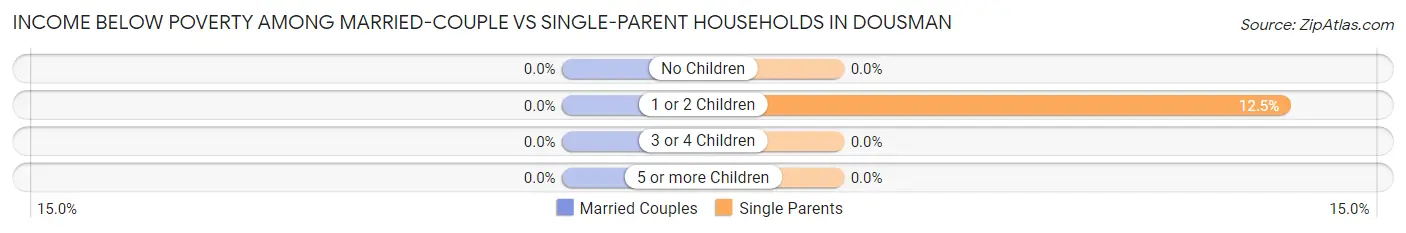
| Children | Married-Couple Families | Single-Parent Households |
| No Children | 0 (0.0%) | 0 (0.0%) |
| 1 or 2 Children | 0 (0.0%) | 9 (12.5%) |
| 3 or 4 Children | 0 (0.0%) | 0 (0.0%) |
| 5 or more Children | 0 (0.0%) | 0 (0.0%) |
| Total | 0 (0.0%) | 9 (6.4%) |
Race in Dousman
The most populous races in Dousman are White / Caucasian (1,990 | 94.8%), Two or more Races (52 | 2.5%), and Asian (40 | 1.9%).
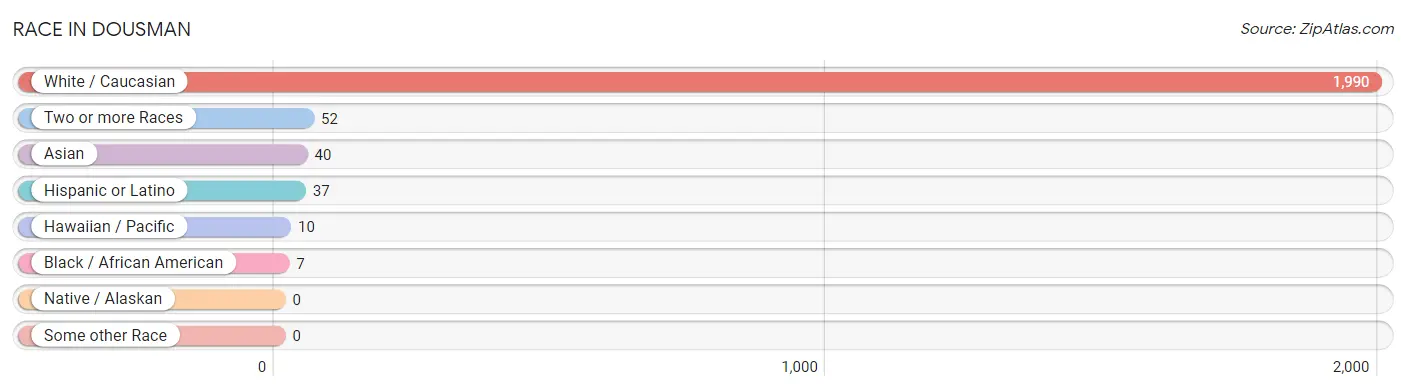
| Race | # Population | % Population |
| Asian | 40 | 1.9% |
| Black / African American | 7 | 0.3% |
| Hawaiian / Pacific | 10 | 0.5% |
| Hispanic or Latino | 37 | 1.8% |
| Native / Alaskan | 0 | 0.0% |
| White / Caucasian | 1,990 | 94.8% |
| Two or more Races | 52 | 2.5% |
| Some other Race | 0 | 0.0% |
| Total | 2,099 | 100.0% |
Ancestry in Dousman
The most populous ancestries reported in Dousman are German (898 | 42.8%), Irish (329 | 15.7%), Polish (217 | 10.3%), English (163 | 7.8%), and Italian (125 | 6.0%), together accounting for 82.5% of all Dousman residents.
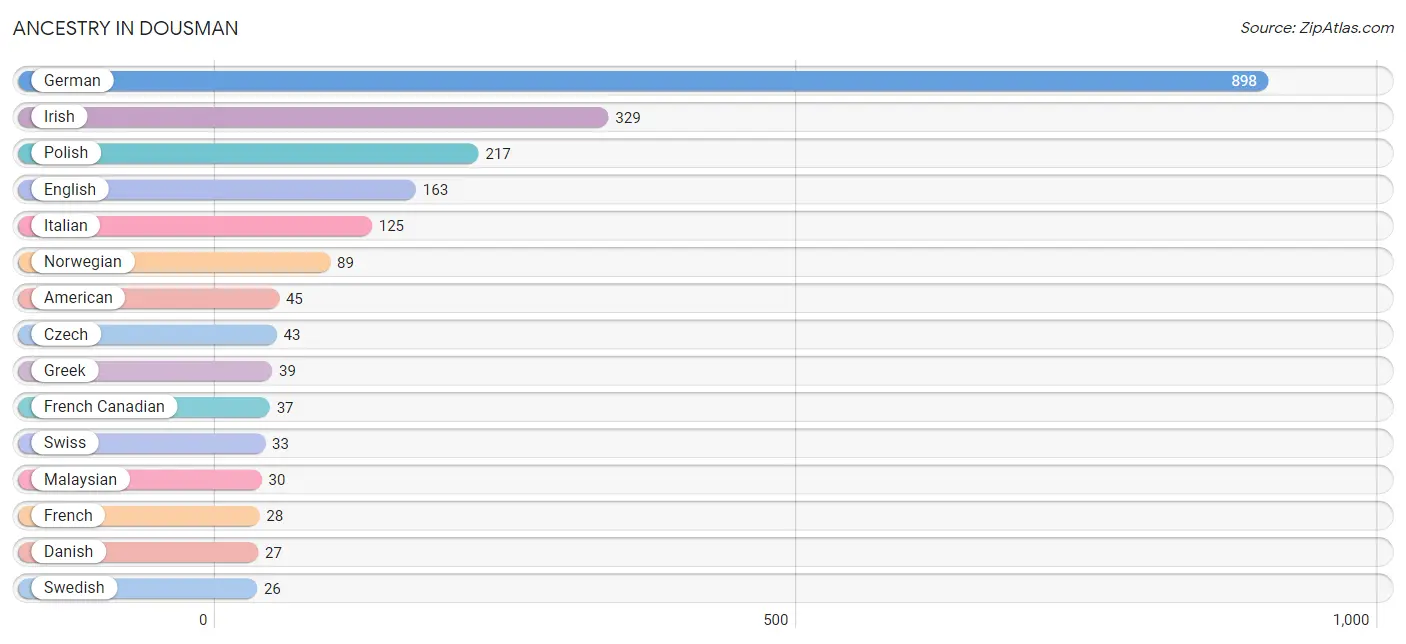
| Ancestry | # Population | % Population |
| American | 45 | 2.1% |
| Austrian | 1 | 0.1% |
| Croatian | 5 | 0.2% |
| Cuban | 8 | 0.4% |
| Czech | 43 | 2.1% |
| Danish | 27 | 1.3% |
| Dutch | 22 | 1.1% |
| Eastern European | 4 | 0.2% |
| English | 163 | 7.8% |
| European | 3 | 0.1% |
| French | 28 | 1.3% |
| French Canadian | 37 | 1.8% |
| German | 898 | 42.8% |
| Greek | 39 | 1.9% |
| Indian (Asian) | 2 | 0.1% |
| Indonesian | 8 | 0.4% |
| Irish | 329 | 15.7% |
| Italian | 125 | 6.0% |
| Latvian | 4 | 0.2% |
| Lithuanian | 6 | 0.3% |
| Malaysian | 30 | 1.4% |
| Mexican | 19 | 0.9% |
| Norwegian | 89 | 4.2% |
| Polish | 217 | 10.3% |
| Puerto Rican | 4 | 0.2% |
| Russian | 9 | 0.4% |
| Scandinavian | 9 | 0.4% |
| Scottish | 25 | 1.2% |
| Serbian | 15 | 0.7% |
| Slovene | 4 | 0.2% |
| Spaniard | 6 | 0.3% |
| Swedish | 26 | 1.2% |
| Swiss | 33 | 1.6% |
| Welsh | 6 | 0.3% | View All 34 Rows |
Immigrants in Dousman
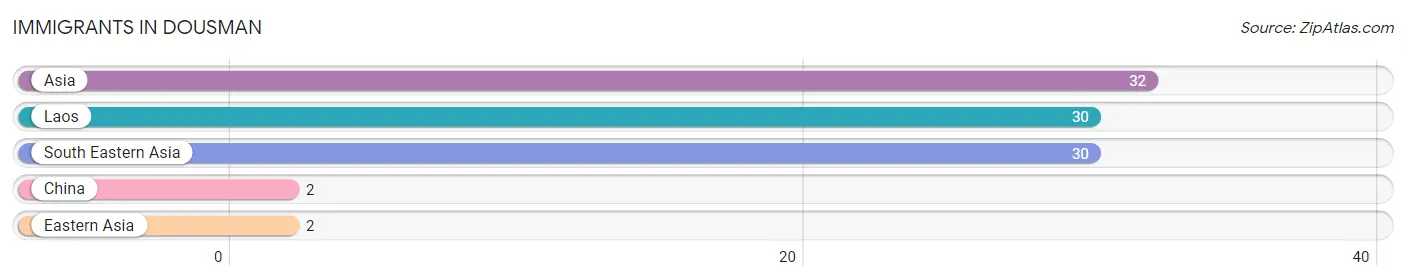
The most numerous immigrant groups reported in Dousman came from Asia (32 | 1.5%), Laos (30 | 1.4%), South Eastern Asia (30 | 1.4%), China (2 | 0.1%), and Eastern Asia (2 | 0.1%), together accounting for 4.6% of all Dousman residents.
| Immigration Origin | # Population | % Population |
| Asia | 32 | 1.5% |
| China | 2 | 0.1% |
| Eastern Asia | 2 | 0.1% |
| Laos | 30 | 1.4% |
| South Eastern Asia | 30 | 1.4% | View All 5 Rows |
Sex and Age in Dousman
Sex and Age in Dousman
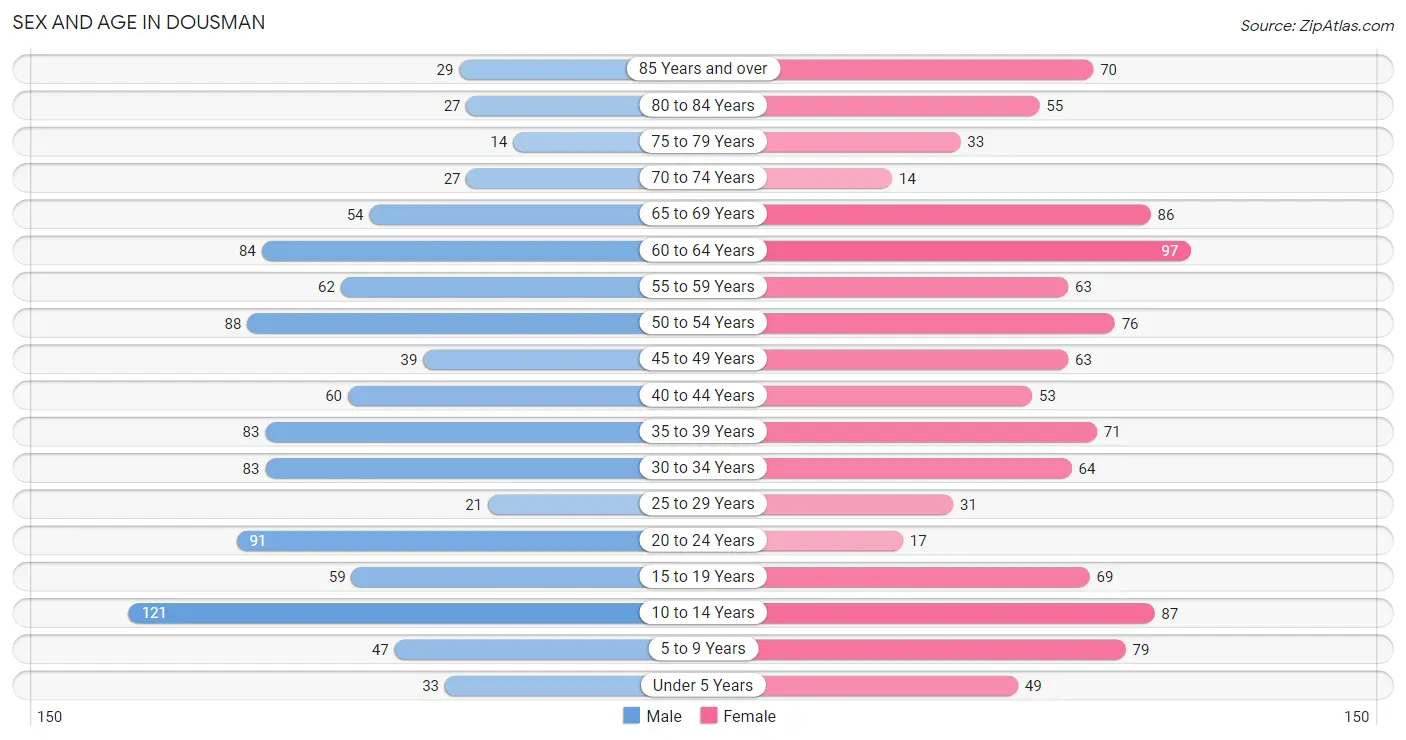
The most populous age groups in Dousman are 10 to 14 Years (121 | 11.8%) for men and 60 to 64 Years (97 | 9.0%) for women.
| Age Bracket | Male | Female |
| Under 5 Years | 33 (3.2%) | 49 (4.5%) |
| 5 to 9 Years | 47 (4.6%) | 79 (7.3%) |
| 10 to 14 Years | 121 (11.8%) | 87 (8.1%) |
| 15 to 19 Years | 59 (5.8%) | 69 (6.4%) |
| 20 to 24 Years | 91 (8.9%) | 17 (1.6%) |
| 25 to 29 Years | 21 (2.1%) | 31 (2.9%) |
| 30 to 34 Years | 83 (8.1%) | 64 (5.9%) |
| 35 to 39 Years | 83 (8.1%) | 71 (6.6%) |
| 40 to 44 Years | 60 (5.9%) | 53 (4.9%) |
| 45 to 49 Years | 39 (3.8%) | 63 (5.9%) |
| 50 to 54 Years | 88 (8.6%) | 76 (7.1%) |
| 55 to 59 Years | 62 (6.1%) | 63 (5.9%) |
| 60 to 64 Years | 84 (8.2%) | 97 (9.0%) |
| 65 to 69 Years | 54 (5.3%) | 86 (8.0%) |
| 70 to 74 Years | 27 (2.6%) | 14 (1.3%) |
| 75 to 79 Years | 14 (1.4%) | 33 (3.1%) |
| 80 to 84 Years | 27 (2.6%) | 55 (5.1%) |
| 85 Years and over | 29 (2.8%) | 70 (6.5%) |
| Total | 1,022 (100.0%) | 1,077 (100.0%) |
Families and Households in Dousman
Median Family Size in Dousman
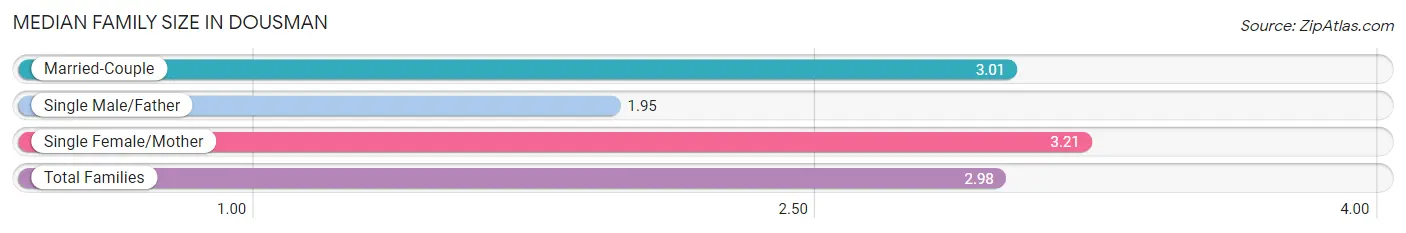
The median family size in Dousman is 2.98 persons per family, with single female/mother families (103 | 18.6%) accounting for the largest median family size of 3.21 persons per family. On the other hand, single male/father families (38 | 6.9%) represent the smallest median family size with 1.95 persons per family.
| Family Type | # Families | Family Size |
| Married-Couple | 414 (74.6%) | 3.01 |
| Single Male/Father | 38 (6.9%) | 1.95 |
| Single Female/Mother | 103 (18.6%) | 3.21 |
| Total Families | 555 (100.0%) | 2.98 |
Median Household Size in Dousman
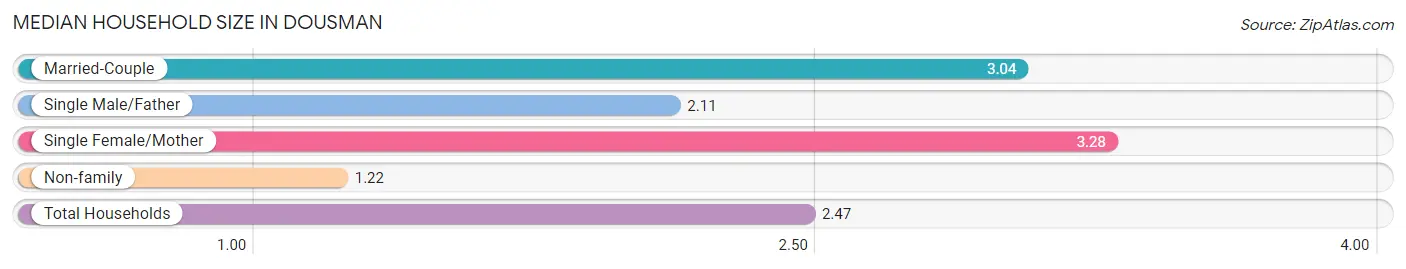
The median household size in Dousman is 2.47 persons per household, with single female/mother households (103 | 12.8%) accounting for the largest median household size of 3.28 persons per household. non-family households (247 | 30.8%) represent the smallest median household size with 1.22 persons per household.
| Household Type | # Households | Household Size |
| Married-Couple | 414 (51.6%) | 3.04 |
| Single Male/Father | 38 (4.7%) | 2.11 |
| Single Female/Mother | 103 (12.8%) | 3.28 |
| Non-family | 247 (30.8%) | 1.22 |
| Total Households | 802 (100.0%) | 2.47 |
Household Size by Marriage Status in Dousman
Out of a total of 802 households in Dousman, 555 (69.2%) are family households, while 247 (30.8%) are nonfamily households. The most numerous type of family households are 2-person households, comprising 286, and the most common type of nonfamily households are 1-person households, comprising 201.
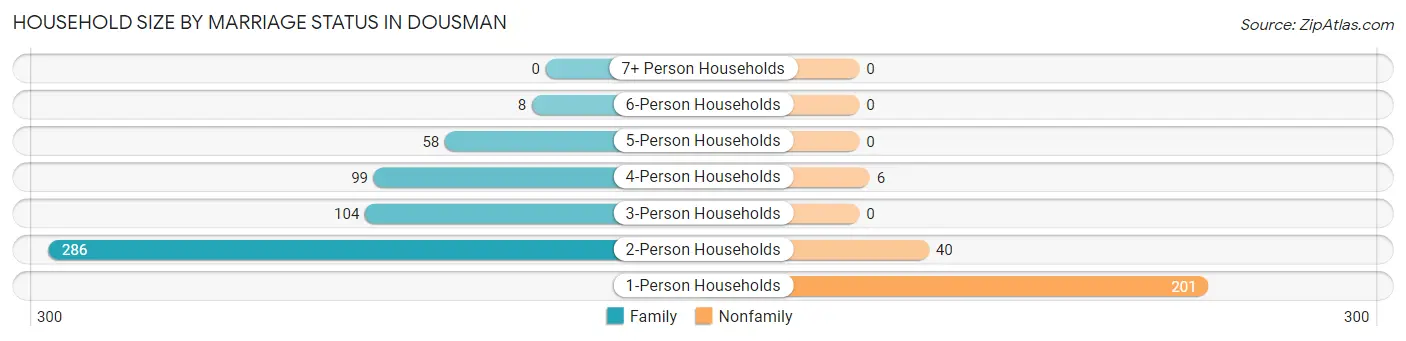
| Household Size | Family Households | Nonfamily Households |
| 1-Person Households | - | 201 (25.1%) |
| 2-Person Households | 286 (35.7%) | 40 (5.0%) |
| 3-Person Households | 104 (13.0%) | 0 (0.0%) |
| 4-Person Households | 99 (12.3%) | 6 (0.7%) |
| 5-Person Households | 58 (7.2%) | 0 (0.0%) |
| 6-Person Households | 8 (1.0%) | 0 (0.0%) |
| 7+ Person Households | 0 (0.0%) | 0 (0.0%) |
| Total | 555 (69.2%) | 247 (30.8%) |
Female Fertility in Dousman
Fertility by Age in Dousman
Average fertility rate in Dousman is 52.0 births per 1,000 women. Women in the age bracket of 20 to 34 years have the highest fertility rate with 179.0 births per 1,000 women. Women in the age bracket of 20 to 34 years acount for 100.0% of all women with births.
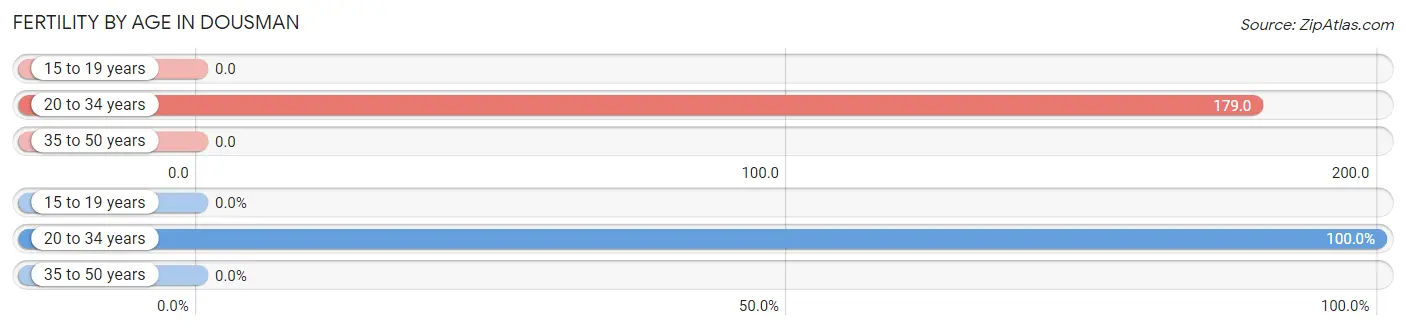
| Age Bracket | Women with Births | Births / 1,000 Women |
| 15 to 19 years | 0 (0.0%) | 0.0 |
| 20 to 34 years | 20 (100.0%) | 179.0 |
| 35 to 50 years | 0 (0.0%) | 0.0 |
| Total | 20 (100.0%) | 52.0 |
Fertility by Age by Marriage Status in Dousman
85.0% of women with births (20) in Dousman are married. The highest percentage of unmarried women with births falls into 20 to 34 years age bracket with 15.0% of them unmarried at the time of birth, while the lowest percentage of unmarried women with births belong to 20 to 34 years age bracket with 15.0% of them unmarried.
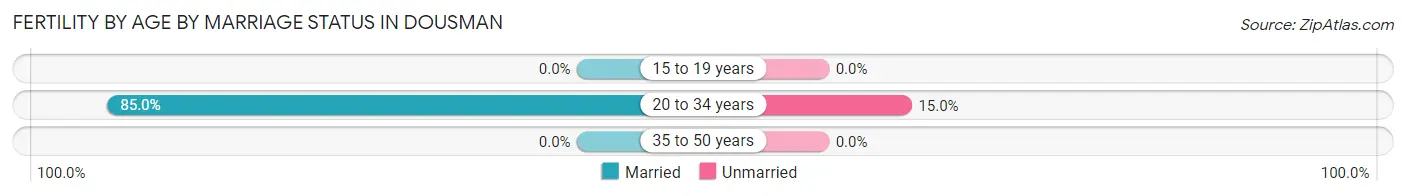
| Age Bracket | Married | Unmarried |
| 15 to 19 years | 0 (0.0%) | 0 (0.0%) |
| 20 to 34 years | 17 (85.0%) | 3 (15.0%) |
| 35 to 50 years | 0 (0.0%) | 0 (0.0%) |
| Total | 17 (85.0%) | 3 (15.0%) |
Fertility by Education in Dousman
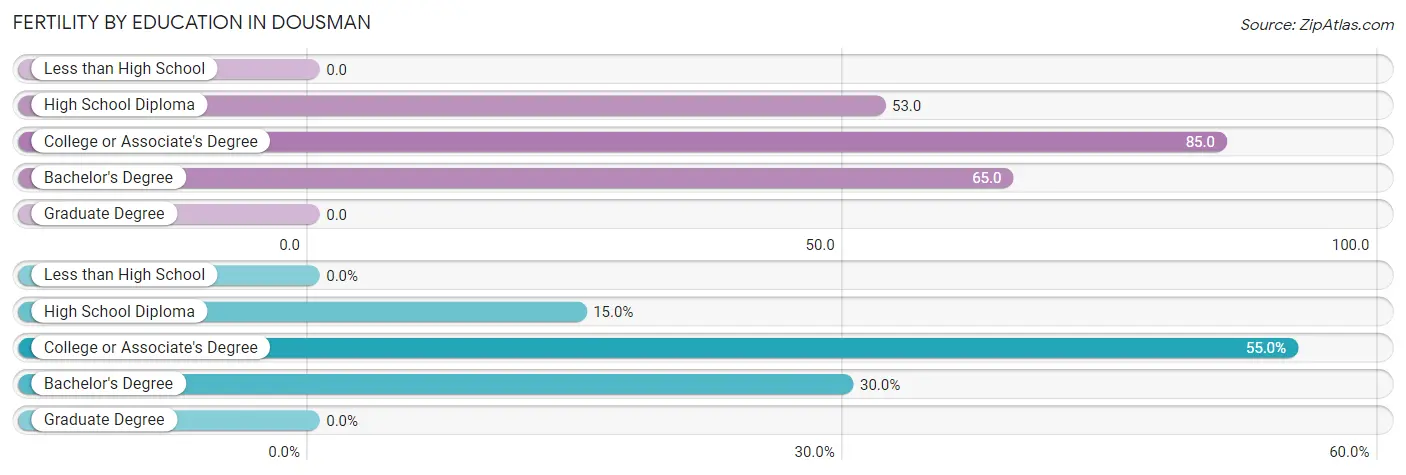
| Educational Attainment | Women with Births | Births / 1,000 Women |
| Less than High School | 0 (0.0%) | 0.0 |
| High School Diploma | 3 (15.0%) | 53.0 |
| College or Associate's Degree | 11 (55.0%) | 85.0 |
| Bachelor's Degree | 6 (30.0%) | 65.0 |
| Graduate Degree | 0 (0.0%) | 0.0 |
| Total | 20 (100.0%) | 52.0 |
Fertility by Education by Marriage Status in Dousman
15.0% of women with births in Dousman are unmarried. Women with the educational attainment of college or associate's degree are most likely to be married with 100.0% of them married at childbirth, while women with the educational attainment of high school diploma are least likely to be married with 100.0% of them unmarried at childbirth.
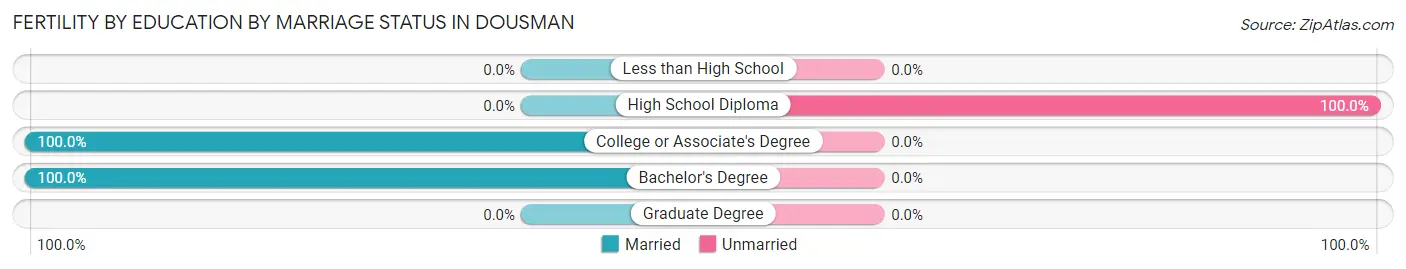
| Educational Attainment | Married | Unmarried |
| Less than High School | 0 (0.0%) | 0 (0.0%) |
| High School Diploma | 0 (0.0%) | 3 (100.0%) |
| College or Associate's Degree | 11 (100.0%) | 0 (0.0%) |
| Bachelor's Degree | 6 (100.0%) | 0 (0.0%) |
| Graduate Degree | 0 (0.0%) | 0 (0.0%) |
| Total | 17 (85.0%) | 3 (15.0%) |
Employment Characteristics in Dousman
Employment by Class of Employer in Dousman
Among the 995 employed individuals in Dousman, private company employees (778 | 78.2%), not-for-profit organizations (60 | 6.0%), and local government employees (56 | 5.6%) make up the most common classes of employment.
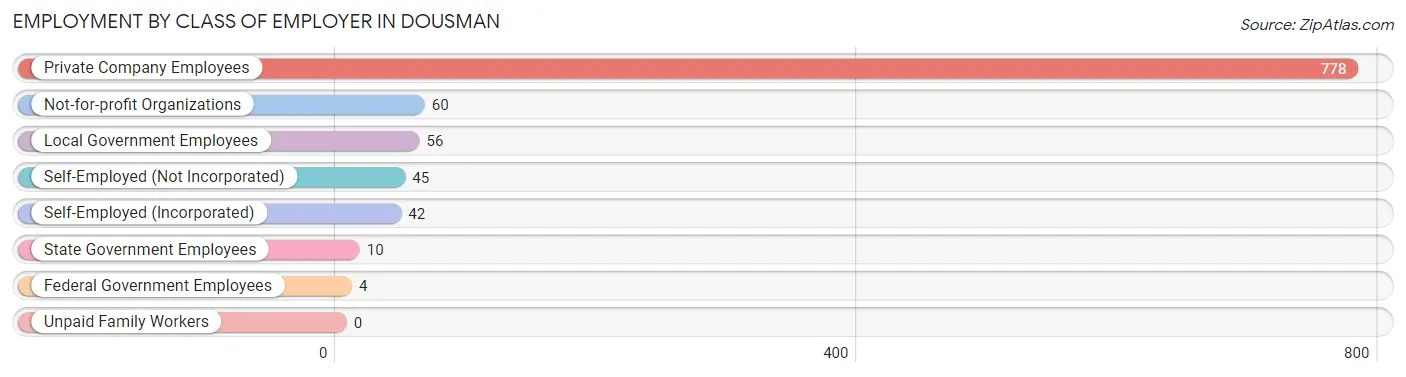
| Employer Class | # Employees | % Employees |
| Private Company Employees | 778 | 78.2% |
| Self-Employed (Incorporated) | 42 | 4.2% |
| Self-Employed (Not Incorporated) | 45 | 4.5% |
| Not-for-profit Organizations | 60 | 6.0% |
| Local Government Employees | 56 | 5.6% |
| State Government Employees | 10 | 1.0% |
| Federal Government Employees | 4 | 0.4% |
| Unpaid Family Workers | 0 | 0.0% |
| Total | 995 | 100.0% |
Employment Status by Age in Dousman
According to the labor force statistics for Dousman, out of the total population over 16 years of age (1,659), 61.1% or 1,014 individuals are in the labor force, with 1.6% or 16 of them unemployed. The age group with the highest labor force participation rate is 25 to 29 years, with 100.0% or 52 individuals in the labor force. Within the labor force, the 20 to 24 years age range has the highest percentage of unemployed individuals, with 11.1% or 10 of them being unemployed.
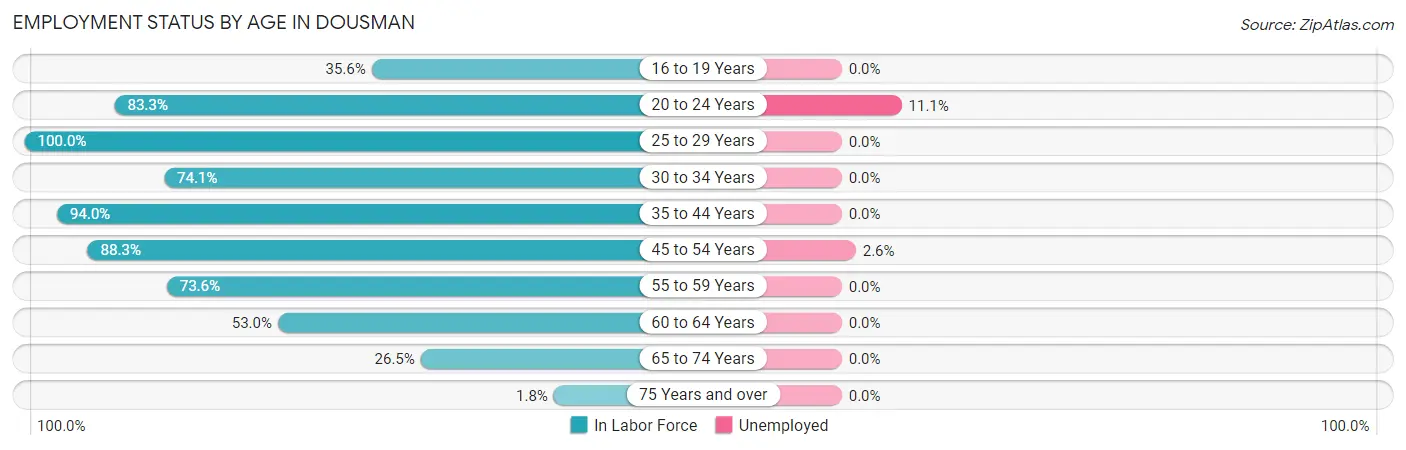
| Age Bracket | In Labor Force | Unemployed |
| 16 to 19 Years | 37 (35.6%) | 0 (0.0%) |
| 20 to 24 Years | 90 (83.3%) | 10 (11.1%) |
| 25 to 29 Years | 52 (100.0%) | 0 (0.0%) |
| 30 to 34 Years | 109 (74.1%) | 0 (0.0%) |
| 35 to 44 Years | 251 (94.0%) | 0 (0.0%) |
| 45 to 54 Years | 235 (88.3%) | 6 (2.6%) |
| 55 to 59 Years | 92 (73.6%) | 0 (0.0%) |
| 60 to 64 Years | 96 (53.0%) | 0 (0.0%) |
| 65 to 74 Years | 48 (26.5%) | 0 (0.0%) |
| 75 Years and over | 4 (1.8%) | 0 (0.0%) |
| Total | 1,014 (61.1%) | 16 (1.6%) |
Employment Status by Educational Attainment in Dousman
According to labor force statistics for Dousman, 80.4% of individuals (835) out of the total population between 25 and 64 years of age (1,038) are in the labor force, with 0.7% or 6 of them being unemployed. The group with the highest labor force participation rate are those with the educational attainment of college / associate degree, with 90.3% or 317 individuals in the labor force. Within the labor force, individuals with bachelor's degree or higher education have the highest percentage of unemployment, with 1.9% or 6 of them being unemployed.
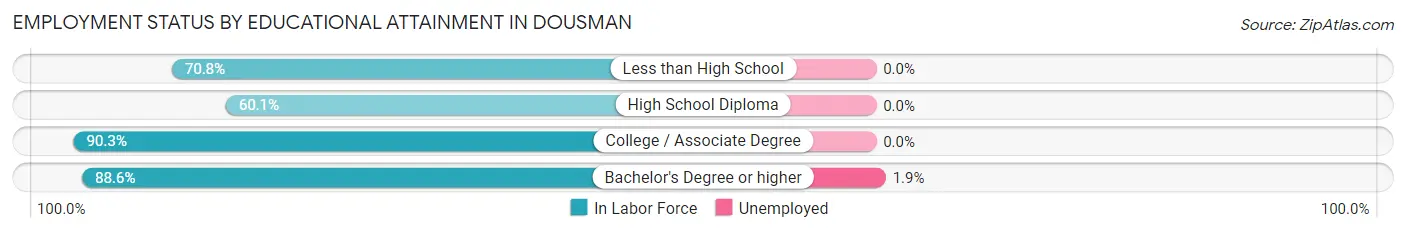
| Educational Attainment | In Labor Force | Unemployed |
| Less than High School | 34 (70.8%) | 0 (0.0%) |
| High School Diploma | 173 (60.1%) | 0 (0.0%) |
| College / Associate Degree | 317 (90.3%) | 0 (0.0%) |
| Bachelor's Degree or higher | 311 (88.6%) | 7 (1.9%) |
| Total | 835 (80.4%) | 7 (0.7%) |
Employment Occupations by Sex in Dousman
Management, Business, Science and Arts Occupations
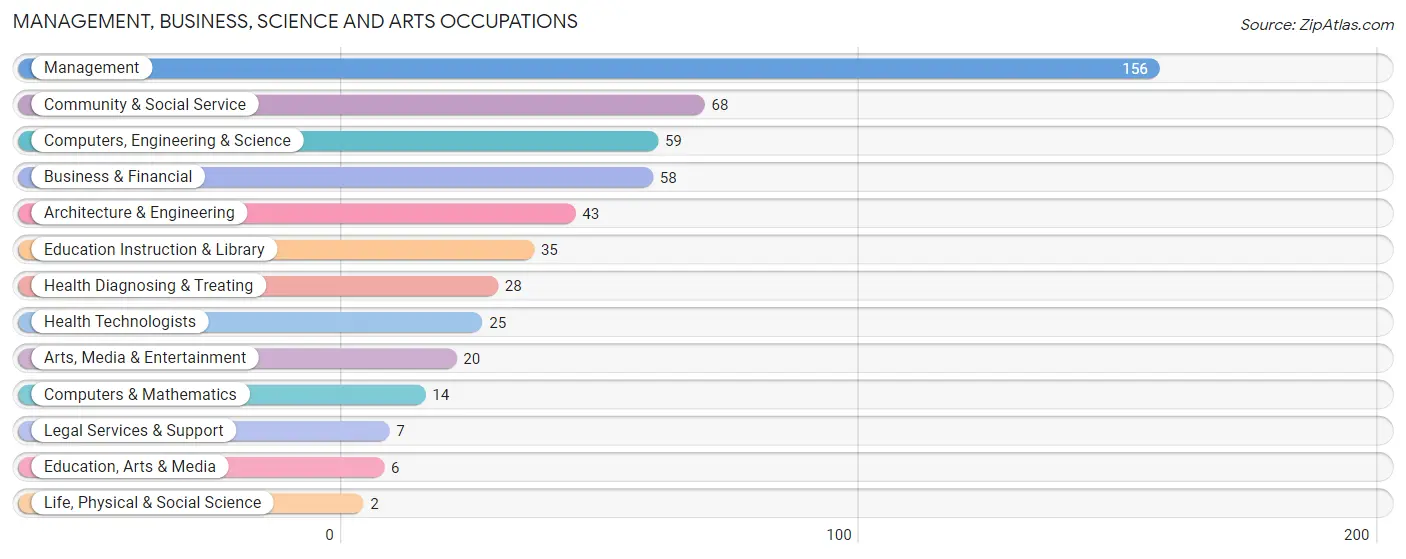
The most common Management, Business, Science and Arts occupations in Dousman are Management (156 | 15.6%), Community & Social Service (68 | 6.8%), Computers, Engineering & Science (59 | 5.9%), Business & Financial (58 | 5.8%), and Architecture & Engineering (43 | 4.3%).
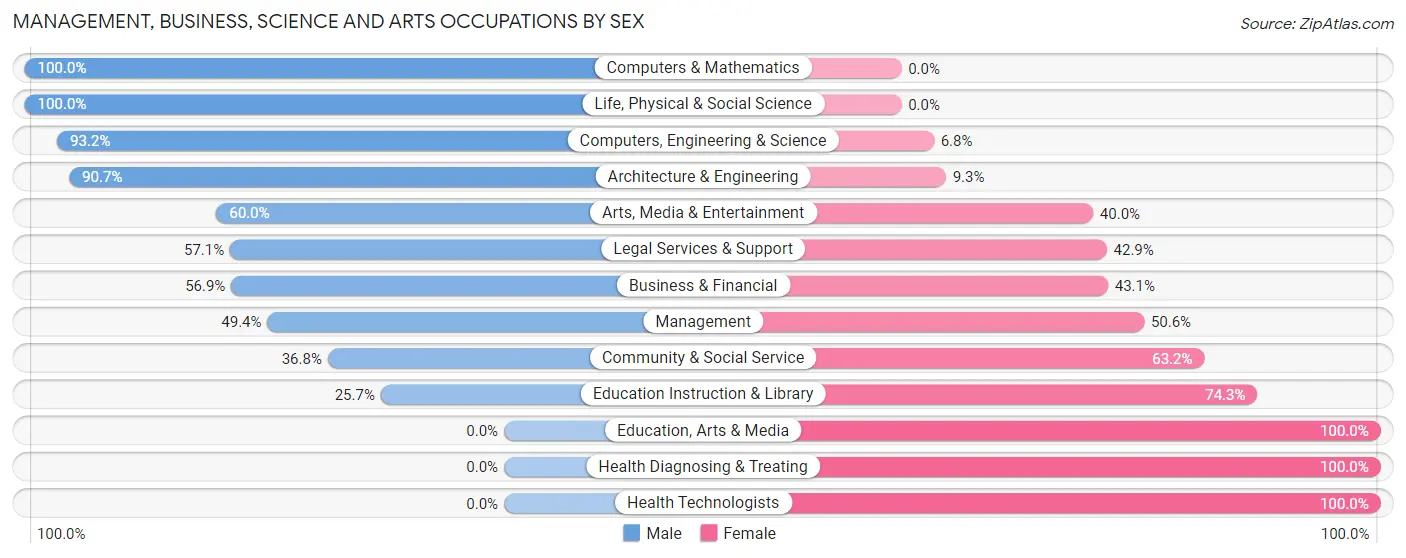
Management, Business, Science and Arts Occupations by Sex
Within the Management, Business, Science and Arts occupations in Dousman, the most male-oriented occupations are Computers & Mathematics (100.0%), Life, Physical & Social Science (100.0%), and Computers, Engineering & Science (93.2%), while the most female-oriented occupations are Education, Arts & Media (100.0%), Health Diagnosing & Treating (100.0%), and Health Technologists (100.0%).
| Occupation | Male | Female |
| Management | 77 (49.4%) | 79 (50.6%) |
| Business & Financial | 33 (56.9%) | 25 (43.1%) |
| Computers, Engineering & Science | 55 (93.2%) | 4 (6.8%) |
| Computers & Mathematics | 14 (100.0%) | 0 (0.0%) |
| Architecture & Engineering | 39 (90.7%) | 4 (9.3%) |
| Life, Physical & Social Science | 2 (100.0%) | 0 (0.0%) |
| Community & Social Service | 25 (36.8%) | 43 (63.2%) |
| Education, Arts & Media | 0 (0.0%) | 6 (100.0%) |
| Legal Services & Support | 4 (57.1%) | 3 (42.9%) |
| Education Instruction & Library | 9 (25.7%) | 26 (74.3%) |
| Arts, Media & Entertainment | 12 (60.0%) | 8 (40.0%) |
| Health Diagnosing & Treating | 0 (0.0%) | 28 (100.0%) |
| Health Technologists | 0 (0.0%) | 25 (100.0%) |
| Total (Category) | 190 (51.5%) | 179 (48.5%) |
| Total (Overall) | 524 (52.5%) | 474 (47.5%) |
Services Occupations
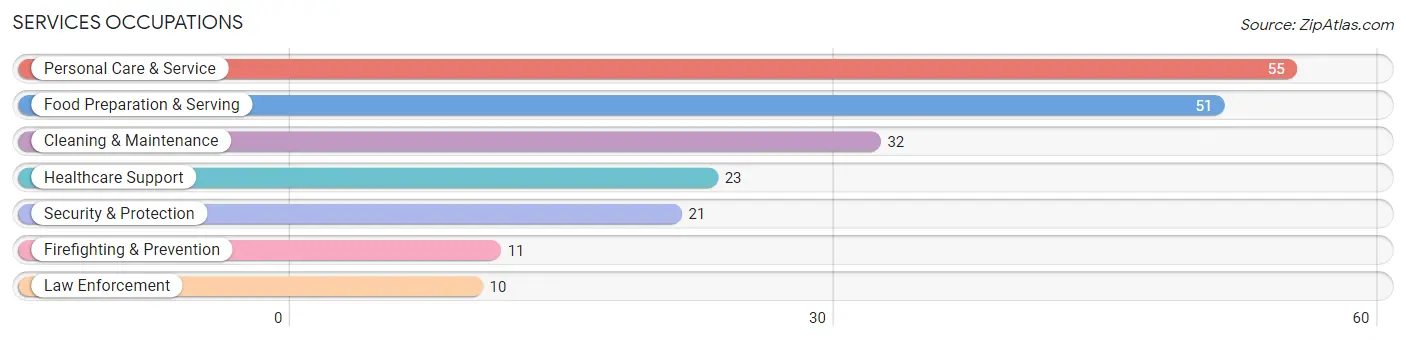
The most common Services occupations in Dousman are Personal Care & Service (55 | 5.5%), Food Preparation & Serving (51 | 5.1%), Cleaning & Maintenance (32 | 3.2%), Healthcare Support (23 | 2.3%), and Security & Protection (21 | 2.1%).
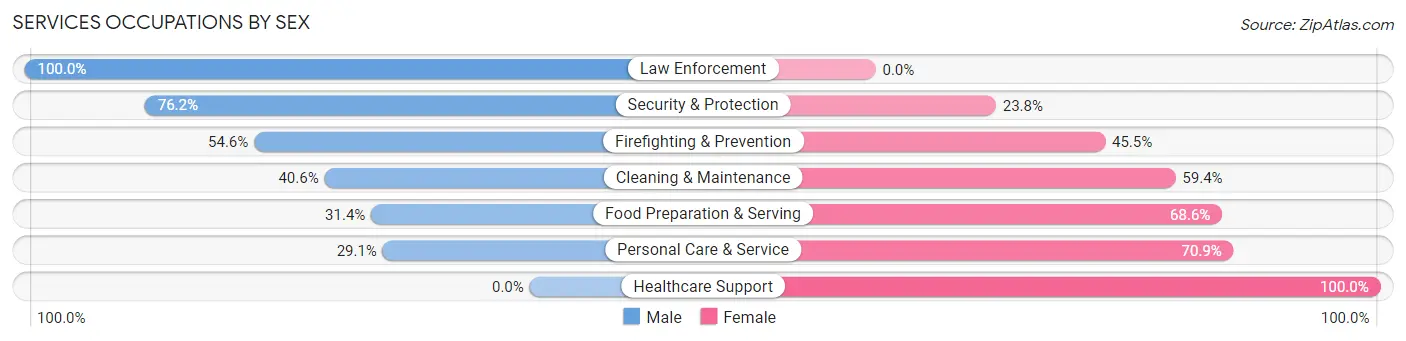
Services Occupations by Sex
Within the Services occupations in Dousman, the most male-oriented occupations are Law Enforcement (100.0%), Security & Protection (76.2%), and Firefighting & Prevention (54.5%), while the most female-oriented occupations are Healthcare Support (100.0%), Personal Care & Service (70.9%), and Food Preparation & Serving (68.6%).
| Occupation | Male | Female |
| Healthcare Support | 0 (0.0%) | 23 (100.0%) |
| Security & Protection | 16 (76.2%) | 5 (23.8%) |
| Firefighting & Prevention | 6 (54.5%) | 5 (45.5%) |
| Law Enforcement | 10 (100.0%) | 0 (0.0%) |
| Food Preparation & Serving | 16 (31.4%) | 35 (68.6%) |
| Cleaning & Maintenance | 13 (40.6%) | 19 (59.4%) |
| Personal Care & Service | 16 (29.1%) | 39 (70.9%) |
| Total (Category) | 61 (33.5%) | 121 (66.5%) |
| Total (Overall) | 524 (52.5%) | 474 (47.5%) |
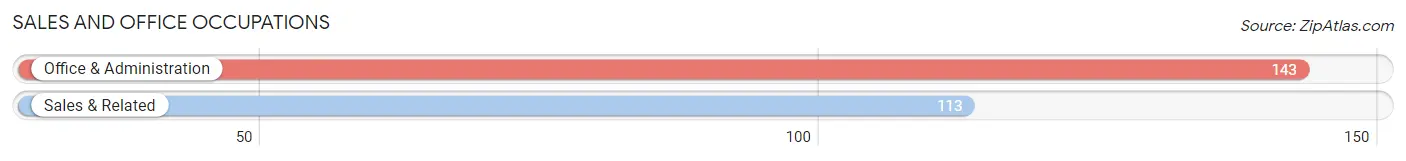
Sales and Office Occupations
The most common Sales and Office occupations in Dousman are Office & Administration (143 | 14.3%), and Sales & Related (113 | 11.3%).
Sales and Office Occupations by Sex
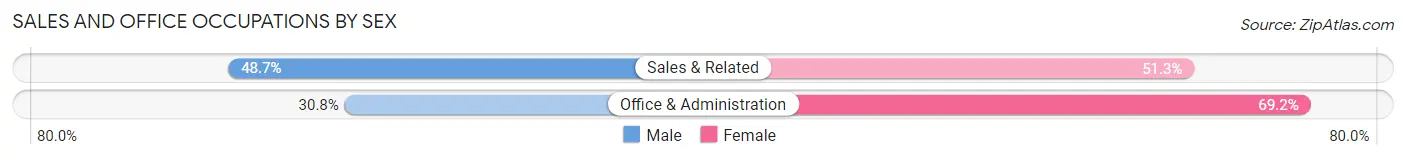
| Occupation | Male | Female |
| Sales & Related | 55 (48.7%) | 58 (51.3%) |
| Office & Administration | 44 (30.8%) | 99 (69.2%) |
| Total (Category) | 99 (38.7%) | 157 (61.3%) |
| Total (Overall) | 524 (52.5%) | 474 (47.5%) |
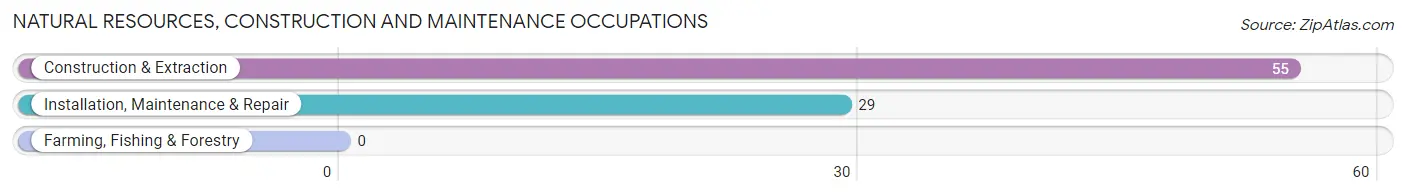
Natural Resources, Construction and Maintenance Occupations
The most common Natural Resources, Construction and Maintenance occupations in Dousman are Construction & Extraction (55 | 5.5%), and Installation, Maintenance & Repair (29 | 2.9%).
Natural Resources, Construction and Maintenance Occupations by Sex
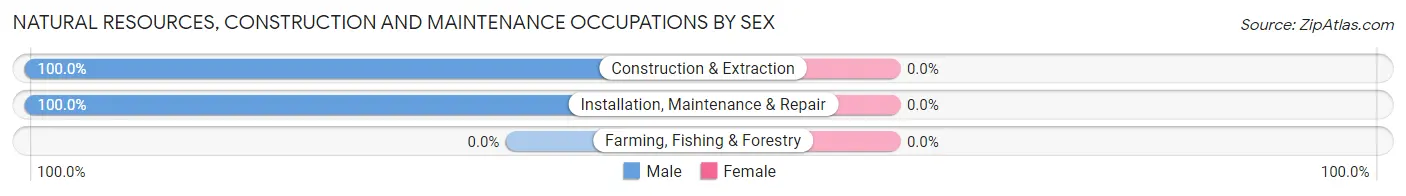
| Occupation | Male | Female |
| Farming, Fishing & Forestry | 0 (0.0%) | 0 (0.0%) |
| Construction & Extraction | 55 (100.0%) | 0 (0.0%) |
| Installation, Maintenance & Repair | 29 (100.0%) | 0 (0.0%) |
| Total (Category) | 84 (100.0%) | 0 (0.0%) |
| Total (Overall) | 524 (52.5%) | 474 (47.5%) |
Production, Transportation and Moving Occupations
The most common Production, Transportation and Moving occupations in Dousman are Production (41 | 4.1%), Material Moving (37 | 3.7%), and Transportation (29 | 2.9%).
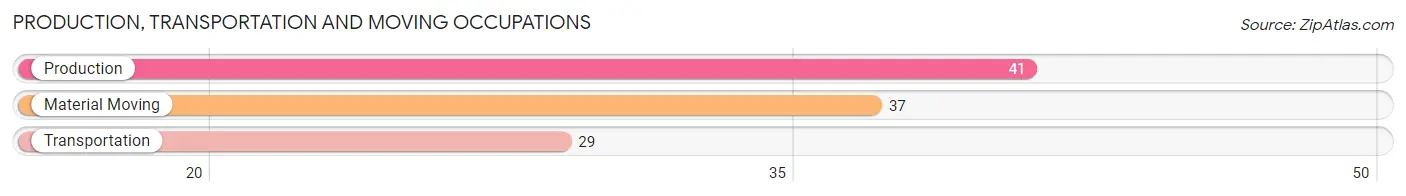
Production, Transportation and Moving Occupations by Sex
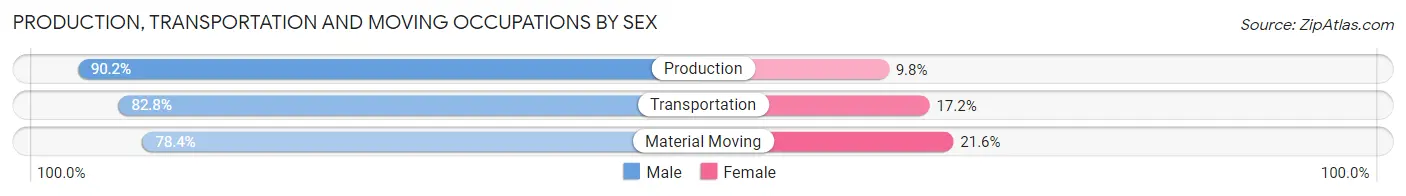
| Occupation | Male | Female |
| Production | 37 (90.2%) | 4 (9.8%) |
| Transportation | 24 (82.8%) | 5 (17.2%) |
| Material Moving | 29 (78.4%) | 8 (21.6%) |
| Total (Category) | 90 (84.1%) | 17 (15.9%) |
| Total (Overall) | 524 (52.5%) | 474 (47.5%) |
Employment Industries by Sex in Dousman
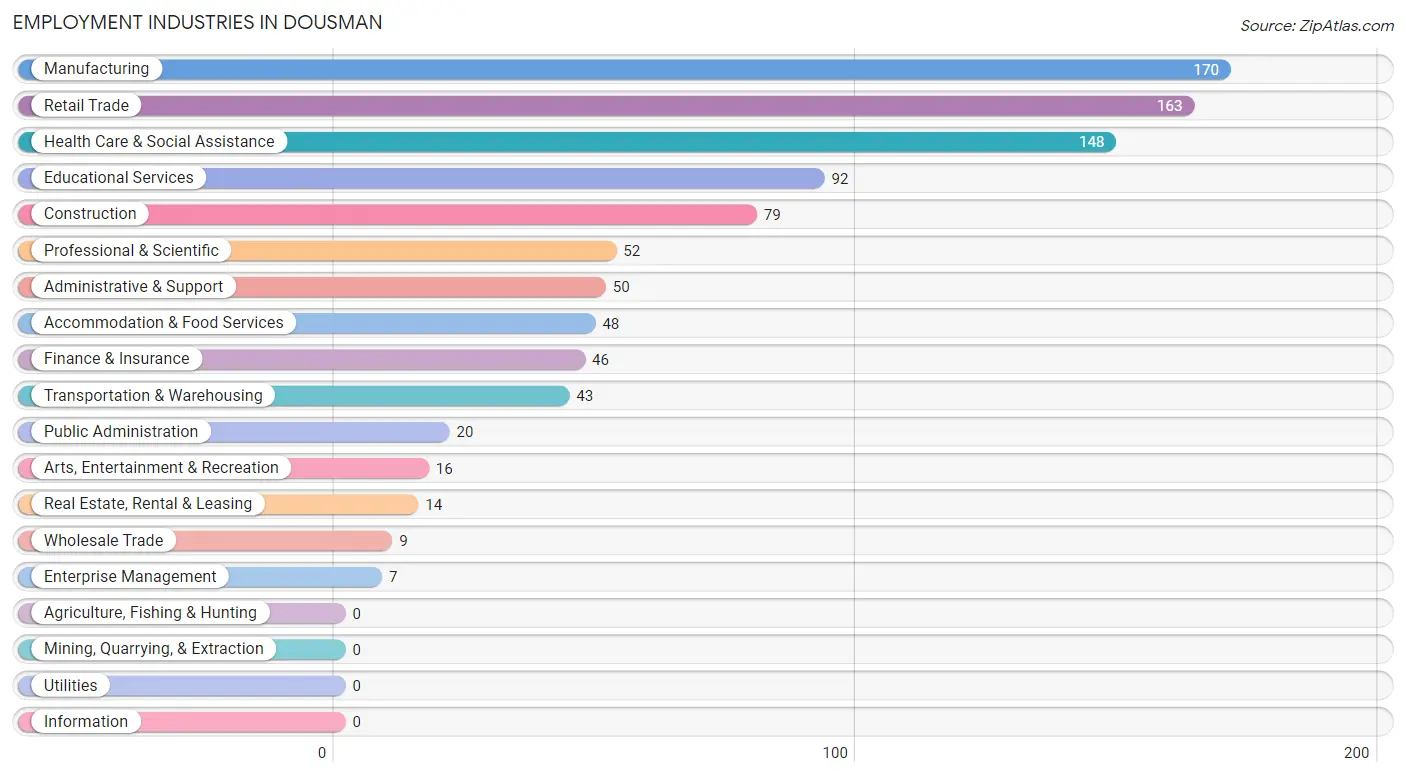
Employment Industries in Dousman
The major employment industries in Dousman include Manufacturing (170 | 17.0%), Retail Trade (163 | 16.3%), Health Care & Social Assistance (148 | 14.8%), Educational Services (92 | 9.2%), and Construction (79 | 7.9%).
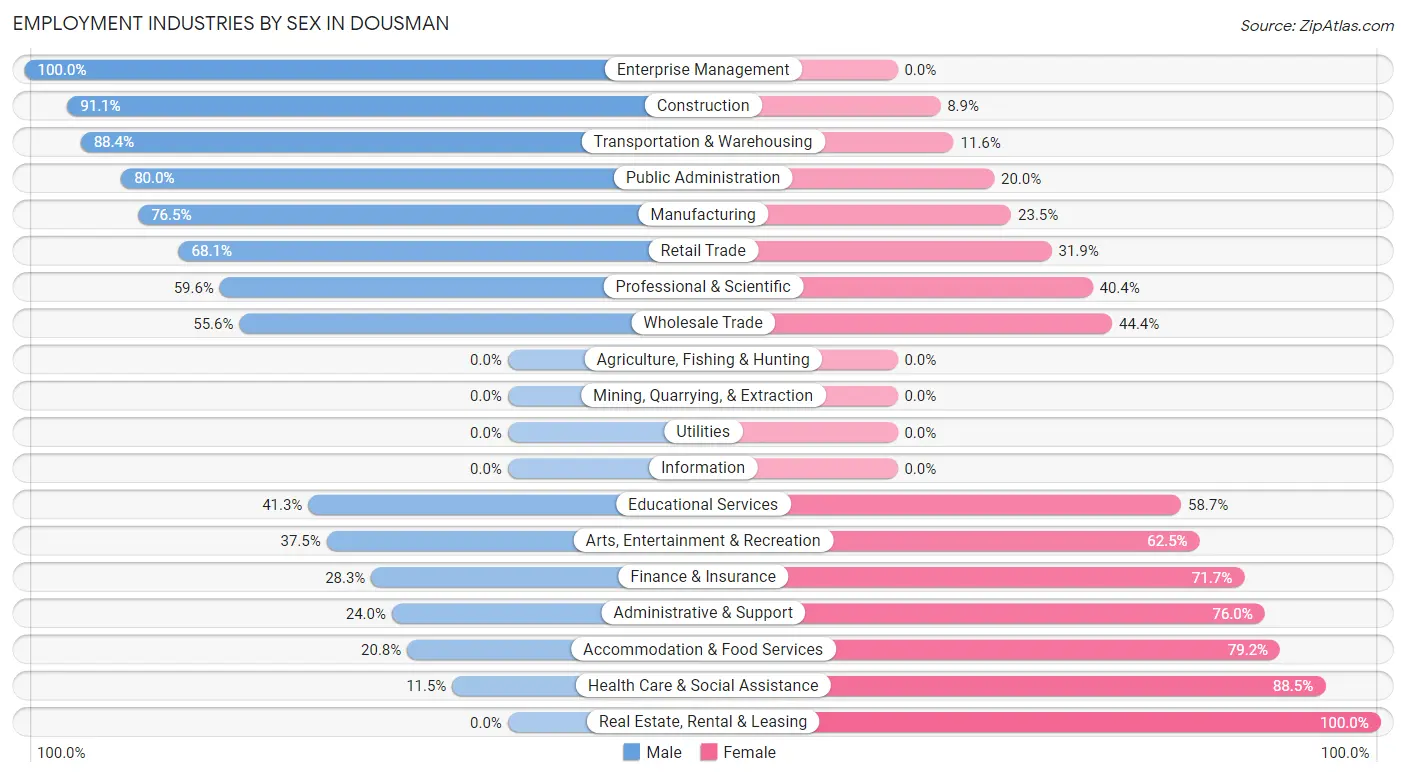
Employment Industries by Sex in Dousman
The Dousman industries that see more men than women are Enterprise Management (100.0%), Construction (91.1%), and Transportation & Warehousing (88.4%), whereas the industries that tend to have a higher number of women are Real Estate, Rental & Leasing (100.0%), Health Care & Social Assistance (88.5%), and Accommodation & Food Services (79.2%).
| Industry | Male | Female |
| Agriculture, Fishing & Hunting | 0 (0.0%) | 0 (0.0%) |
| Mining, Quarrying, & Extraction | 0 (0.0%) | 0 (0.0%) |
| Construction | 72 (91.1%) | 7 (8.9%) |
| Manufacturing | 130 (76.5%) | 40 (23.5%) |
| Wholesale Trade | 5 (55.6%) | 4 (44.4%) |
| Retail Trade | 111 (68.1%) | 52 (31.9%) |
| Transportation & Warehousing | 38 (88.4%) | 5 (11.6%) |
| Utilities | 0 (0.0%) | 0 (0.0%) |
| Information | 0 (0.0%) | 0 (0.0%) |
| Finance & Insurance | 13 (28.3%) | 33 (71.7%) |
| Real Estate, Rental & Leasing | 0 (0.0%) | 14 (100.0%) |
| Professional & Scientific | 31 (59.6%) | 21 (40.4%) |
| Enterprise Management | 7 (100.0%) | 0 (0.0%) |
| Administrative & Support | 12 (24.0%) | 38 (76.0%) |
| Educational Services | 38 (41.3%) | 54 (58.7%) |
| Health Care & Social Assistance | 17 (11.5%) | 131 (88.5%) |
| Arts, Entertainment & Recreation | 6 (37.5%) | 10 (62.5%) |
| Accommodation & Food Services | 10 (20.8%) | 38 (79.2%) |
| Public Administration | 16 (80.0%) | 4 (20.0%) |
| Total | 524 (52.5%) | 474 (47.5%) |
Education in Dousman
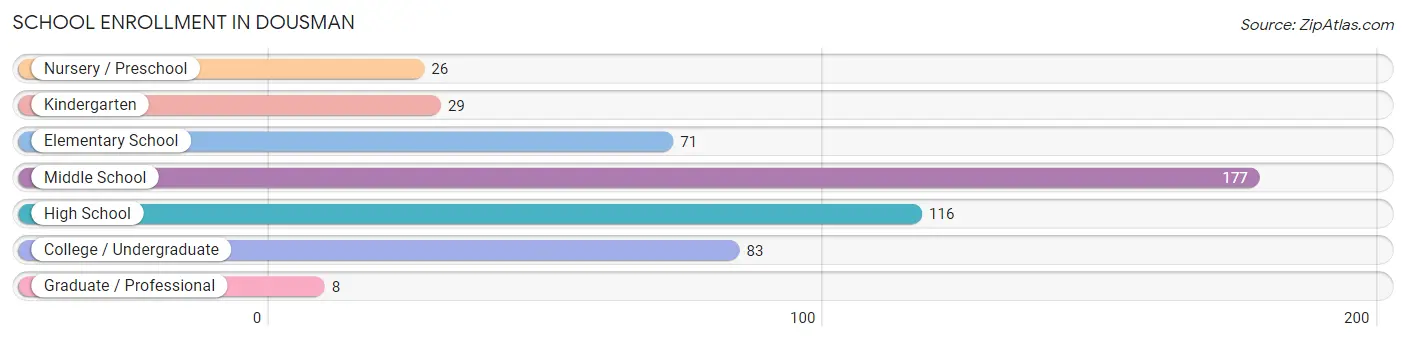
School Enrollment in Dousman
The most common levels of schooling among the 510 students in Dousman are middle school (177 | 34.7%), high school (116 | 22.8%), and college / undergraduate (83 | 16.3%).
| School Level | # Students | % Students |
| Nursery / Preschool | 26 | 5.1% |
| Kindergarten | 29 | 5.7% |
| Elementary School | 71 | 13.9% |
| Middle School | 177 | 34.7% |
| High School | 116 | 22.8% |
| College / Undergraduate | 83 | 16.3% |
| Graduate / Professional | 8 | 1.6% |
| Total | 510 | 100.0% |
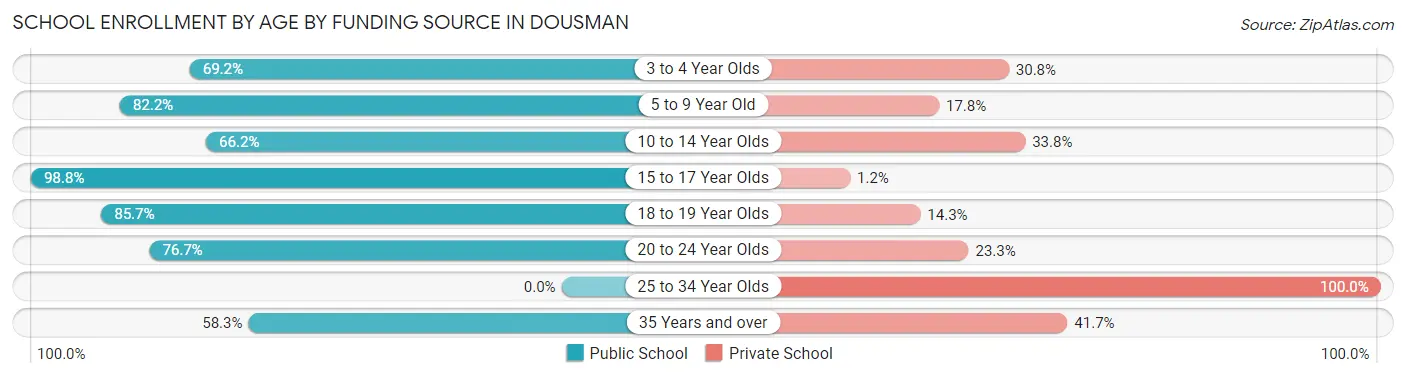
School Enrollment by Age by Funding Source in Dousman
Out of a total of 510 students who are enrolled in schools in Dousman, 120 (23.5%) attend a private institution, while the remaining 390 (76.5%) are enrolled in public schools. The age group of 25 to 34 year olds has the highest likelihood of being enrolled in private schools, with 6 (100.0% in the age bracket) enrolled. Conversely, the age group of 15 to 17 year olds has the lowest likelihood of being enrolled in a private school, with 82 (98.8% in the age bracket) attending a public institution.
| Age Bracket | Public School | Private School |
| 3 to 4 Year Olds | 9 (69.2%) | 4 (30.8%) |
| 5 to 9 Year Old | 88 (82.2%) | 19 (17.8%) |
| 10 to 14 Year Olds | 135 (66.2%) | 69 (33.8%) |
| 15 to 17 Year Olds | 82 (98.8%) | 1 (1.2%) |
| 18 to 19 Year Olds | 36 (85.7%) | 6 (14.3%) |
| 20 to 24 Year Olds | 33 (76.7%) | 10 (23.3%) |
| 25 to 34 Year Olds | 0 (0.0%) | 6 (100.0%) |
| 35 Years and over | 7 (58.3%) | 5 (41.7%) |
| Total | 390 (76.5%) | 120 (23.5%) |
Educational Attainment by Field of Study in Dousman
Business (150 | 30.1%), science & technology (74 | 14.8%), education (69 | 13.8%), engineering (41 | 8.2%), and arts & humanities (39 | 7.8%) are the most common fields of study among 499 individuals in Dousman who have obtained a bachelor's degree or higher.
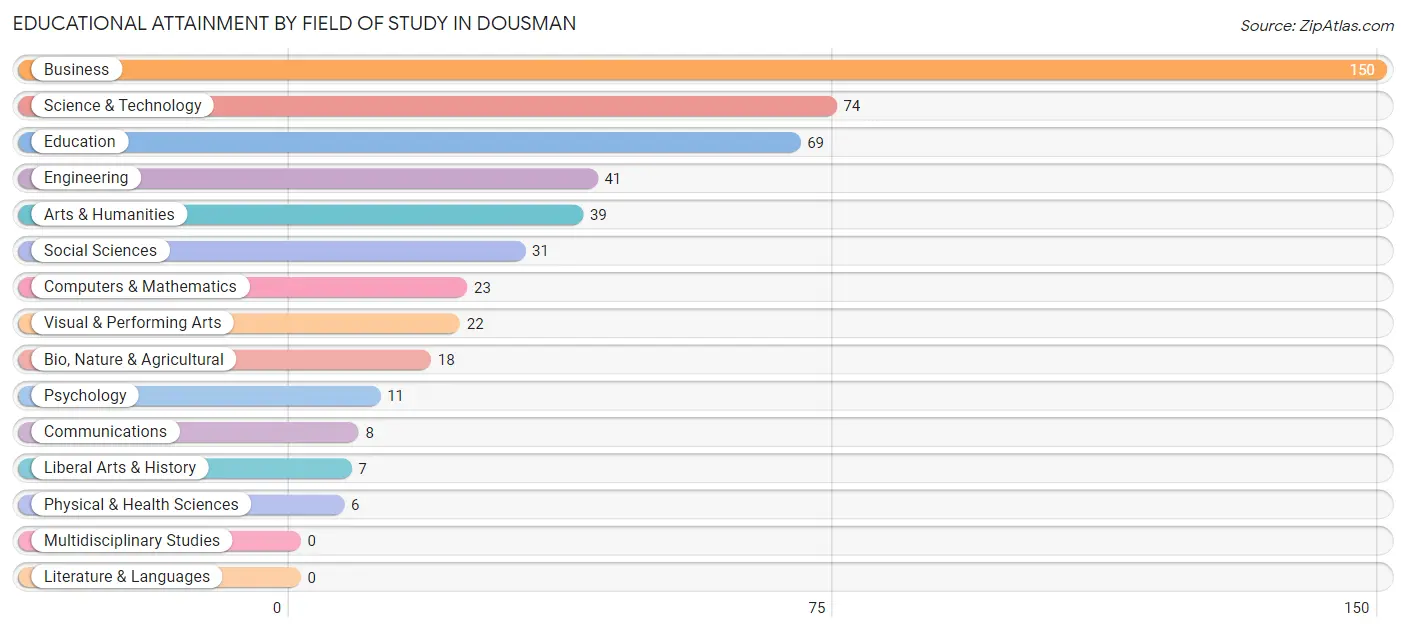
| Field of Study | # Graduates | % Graduates |
| Computers & Mathematics | 23 | 4.6% |
| Bio, Nature & Agricultural | 18 | 3.6% |
| Physical & Health Sciences | 6 | 1.2% |
| Psychology | 11 | 2.2% |
| Social Sciences | 31 | 6.2% |
| Engineering | 41 | 8.2% |
| Multidisciplinary Studies | 0 | 0.0% |
| Science & Technology | 74 | 14.8% |
| Business | 150 | 30.1% |
| Education | 69 | 13.8% |
| Literature & Languages | 0 | 0.0% |
| Liberal Arts & History | 7 | 1.4% |
| Visual & Performing Arts | 22 | 4.4% |
| Communications | 8 | 1.6% |
| Arts & Humanities | 39 | 7.8% |
| Total | 499 | 100.0% |
Transportation & Commute in Dousman
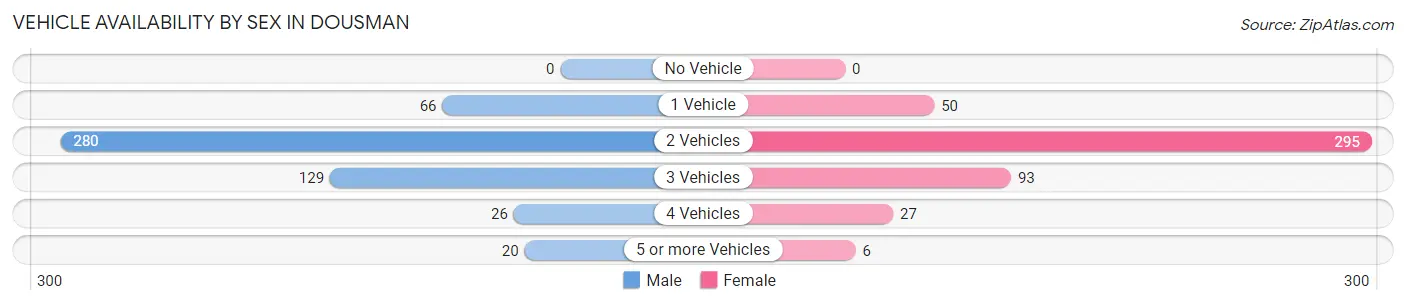
Vehicle Availability by Sex in Dousman
The most prevalent vehicle ownership categories in Dousman are males with 2 vehicles (280, accounting for 53.7%) and females with 2 vehicles (295, making up 59.5%).
| Vehicles Available | Male | Female |
| No Vehicle | 0 (0.0%) | 0 (0.0%) |
| 1 Vehicle | 66 (12.7%) | 50 (10.6%) |
| 2 Vehicles | 280 (53.7%) | 295 (62.6%) |
| 3 Vehicles | 129 (24.8%) | 93 (19.8%) |
| 4 Vehicles | 26 (5.0%) | 27 (5.7%) |
| 5 or more Vehicles | 20 (3.8%) | 6 (1.3%) |
| Total | 521 (100.0%) | 471 (100.0%) |
Commute Time in Dousman
The most frequently occuring commute durations in Dousman are 20 to 24 minutes (172 commuters, 19.7%), 15 to 19 minutes (134 commuters, 15.3%), and 30 to 34 minutes (100 commuters, 11.4%).
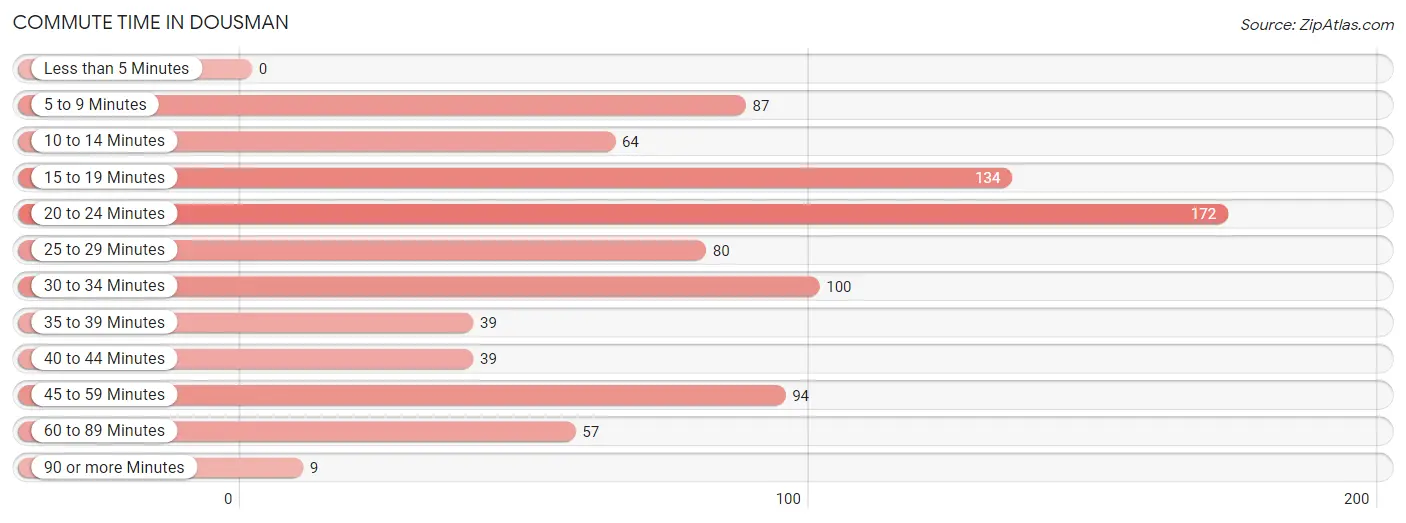
| Commute Time | # Commuters | % Commuters |
| Less than 5 Minutes | 0 | 0.0% |
| 5 to 9 Minutes | 87 | 9.9% |
| 10 to 14 Minutes | 64 | 7.3% |
| 15 to 19 Minutes | 134 | 15.3% |
| 20 to 24 Minutes | 172 | 19.7% |
| 25 to 29 Minutes | 80 | 9.1% |
| 30 to 34 Minutes | 100 | 11.4% |
| 35 to 39 Minutes | 39 | 4.5% |
| 40 to 44 Minutes | 39 | 4.5% |
| 45 to 59 Minutes | 94 | 10.7% |
| 60 to 89 Minutes | 57 | 6.5% |
| 90 or more Minutes | 9 | 1.0% |
Commute Time by Sex in Dousman
The most common commute times in Dousman are 20 to 24 minutes (108 commuters, 22.6%) for males and 15 to 19 minutes (74 commuters, 18.6%) for females.
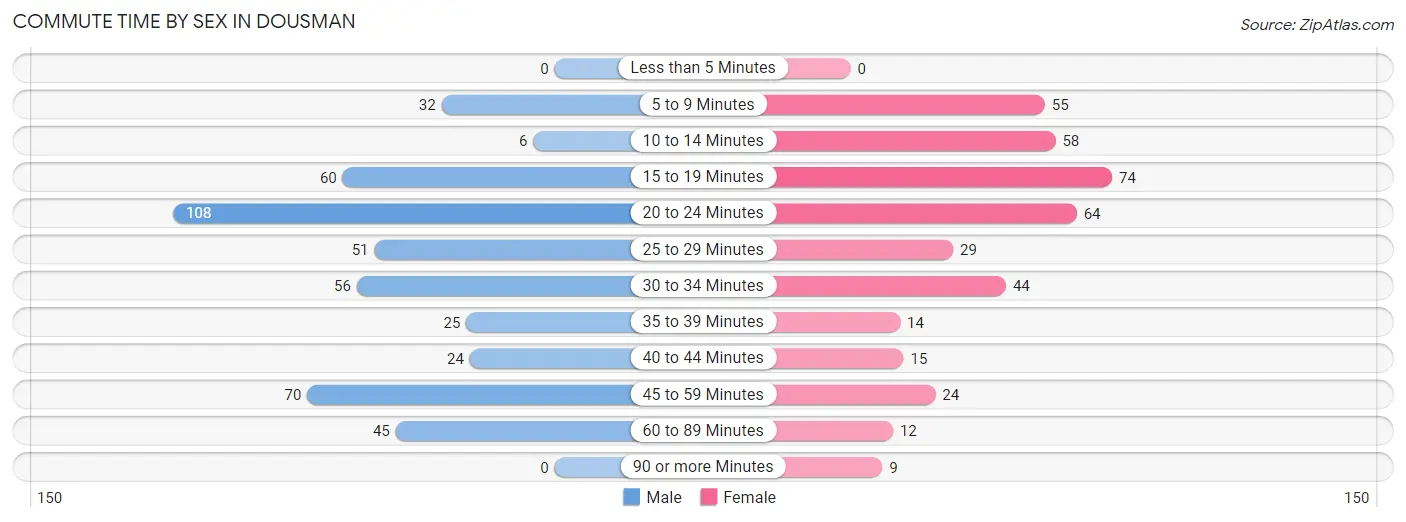
| Commute Time | Male | Female |
| Less than 5 Minutes | 0 (0.0%) | 0 (0.0%) |
| 5 to 9 Minutes | 32 (6.7%) | 55 (13.8%) |
| 10 to 14 Minutes | 6 (1.3%) | 58 (14.6%) |
| 15 to 19 Minutes | 60 (12.6%) | 74 (18.6%) |
| 20 to 24 Minutes | 108 (22.6%) | 64 (16.1%) |
| 25 to 29 Minutes | 51 (10.7%) | 29 (7.3%) |
| 30 to 34 Minutes | 56 (11.7%) | 44 (11.1%) |
| 35 to 39 Minutes | 25 (5.2%) | 14 (3.5%) |
| 40 to 44 Minutes | 24 (5.0%) | 15 (3.8%) |
| 45 to 59 Minutes | 70 (14.7%) | 24 (6.0%) |
| 60 to 89 Minutes | 45 (9.4%) | 12 (3.0%) |
| 90 or more Minutes | 0 (0.0%) | 9 (2.3%) |
Time of Departure to Work by Sex in Dousman
The most frequent times of departure to work in Dousman are 6:30 AM to 6:59 AM (72, 15.1%) for males and 7:00 AM to 7:29 AM (74, 18.6%) for females.
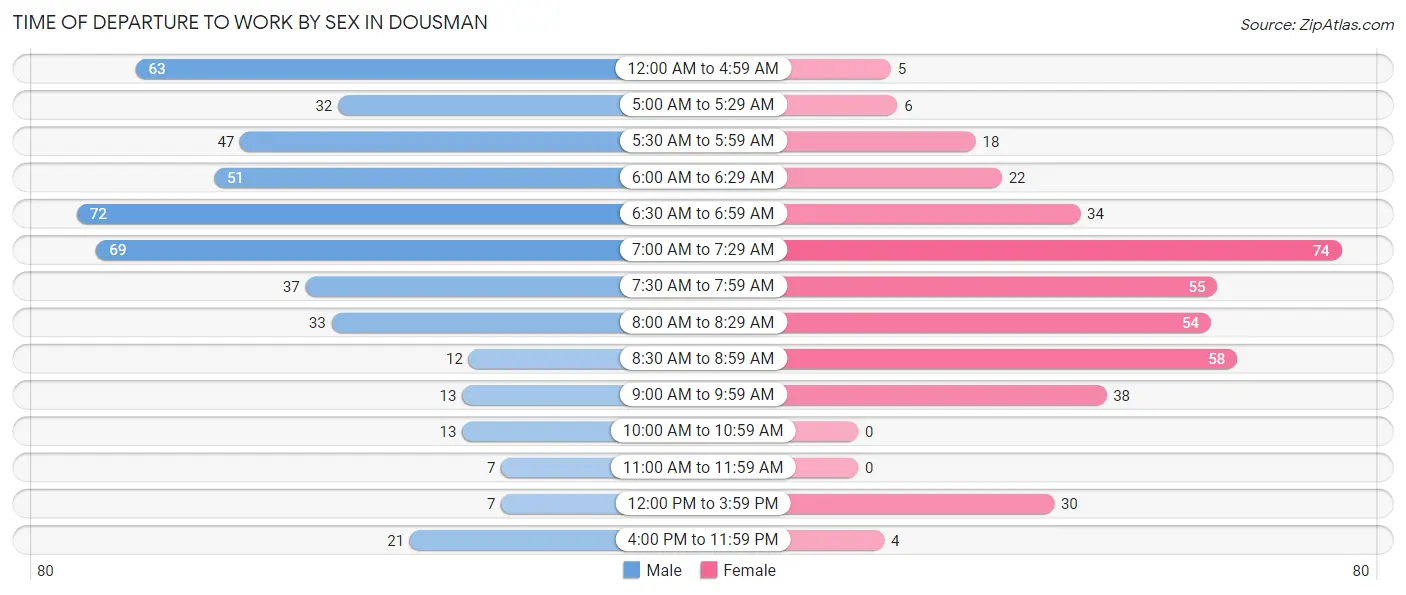
| Time of Departure | Male | Female |
| 12:00 AM to 4:59 AM | 63 (13.2%) | 5 (1.3%) |
| 5:00 AM to 5:29 AM | 32 (6.7%) | 6 (1.5%) |
| 5:30 AM to 5:59 AM | 47 (9.9%) | 18 (4.5%) |
| 6:00 AM to 6:29 AM | 51 (10.7%) | 22 (5.5%) |
| 6:30 AM to 6:59 AM | 72 (15.1%) | 34 (8.5%) |
| 7:00 AM to 7:29 AM | 69 (14.5%) | 74 (18.6%) |
| 7:30 AM to 7:59 AM | 37 (7.8%) | 55 (13.8%) |
| 8:00 AM to 8:29 AM | 33 (6.9%) | 54 (13.6%) |
| 8:30 AM to 8:59 AM | 12 (2.5%) | 58 (14.6%) |
| 9:00 AM to 9:59 AM | 13 (2.7%) | 38 (9.6%) |
| 10:00 AM to 10:59 AM | 13 (2.7%) | 0 (0.0%) |
| 11:00 AM to 11:59 AM | 7 (1.5%) | 0 (0.0%) |
| 12:00 PM to 3:59 PM | 7 (1.5%) | 30 (7.5%) |
| 4:00 PM to 11:59 PM | 21 (4.4%) | 4 (1.0%) |
| Total | 477 (100.0%) | 398 (100.0%) |
Housing Occupancy in Dousman
Occupancy by Ownership in Dousman
Of the total 802 dwellings in Dousman, owner-occupied units account for 475 (59.2%), while renter-occupied units make up 327 (40.8%).
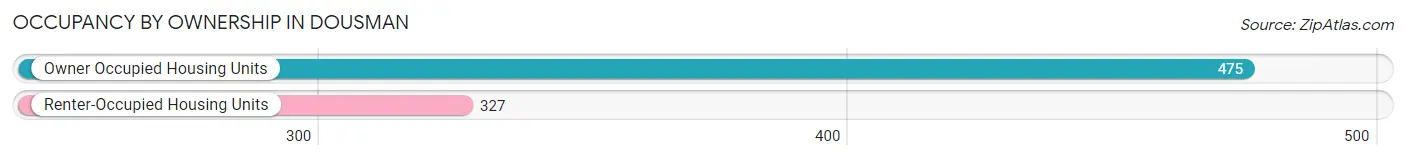
| Occupancy | # Housing Units | % Housing Units |
| Owner Occupied Housing Units | 475 | 59.2% |
| Renter-Occupied Housing Units | 327 | 40.8% |
| Total Occupied Housing Units | 802 | 100.0% |
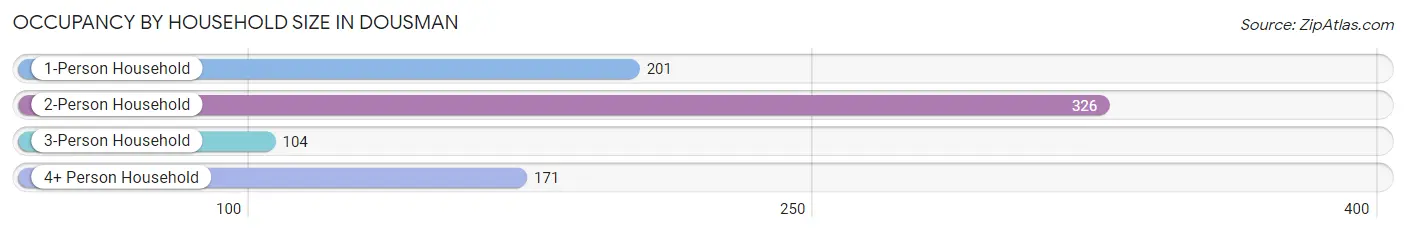
Occupancy by Household Size in Dousman
| Household Size | # Housing Units | % Housing Units |
| 1-Person Household | 201 | 25.1% |
| 2-Person Household | 326 | 40.6% |
| 3-Person Household | 104 | 13.0% |
| 4+ Person Household | 171 | 21.3% |
| Total Housing Units | 802 | 100.0% |
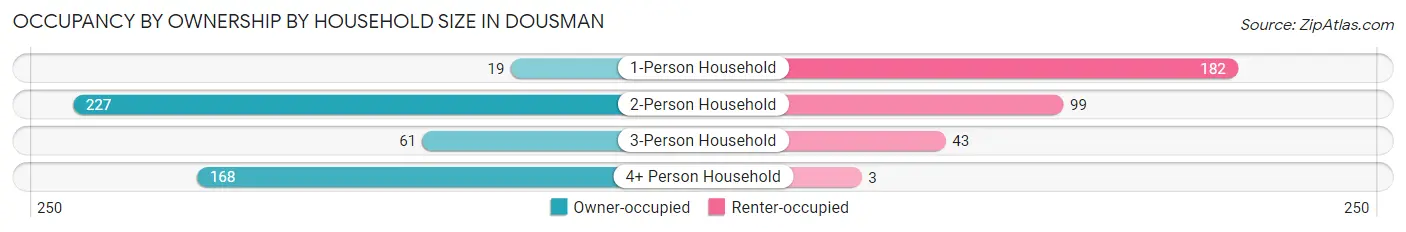
Occupancy by Ownership by Household Size in Dousman
| Household Size | Owner-occupied | Renter-occupied |
| 1-Person Household | 19 (9.5%) | 182 (90.5%) |
| 2-Person Household | 227 (69.6%) | 99 (30.4%) |
| 3-Person Household | 61 (58.7%) | 43 (41.3%) |
| 4+ Person Household | 168 (98.3%) | 3 (1.8%) |
| Total Housing Units | 475 (59.2%) | 327 (40.8%) |
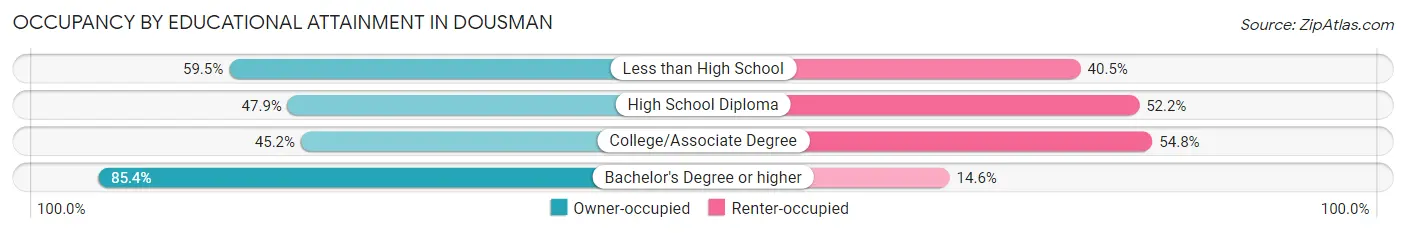
Occupancy by Educational Attainment in Dousman
| Household Size | Owner-occupied | Renter-occupied |
| Less than High School | 22 (59.5%) | 15 (40.5%) |
| High School Diploma | 89 (47.8%) | 97 (52.1%) |
| College/Associate Degree | 147 (45.2%) | 178 (54.8%) |
| Bachelor's Degree or higher | 217 (85.4%) | 37 (14.6%) |
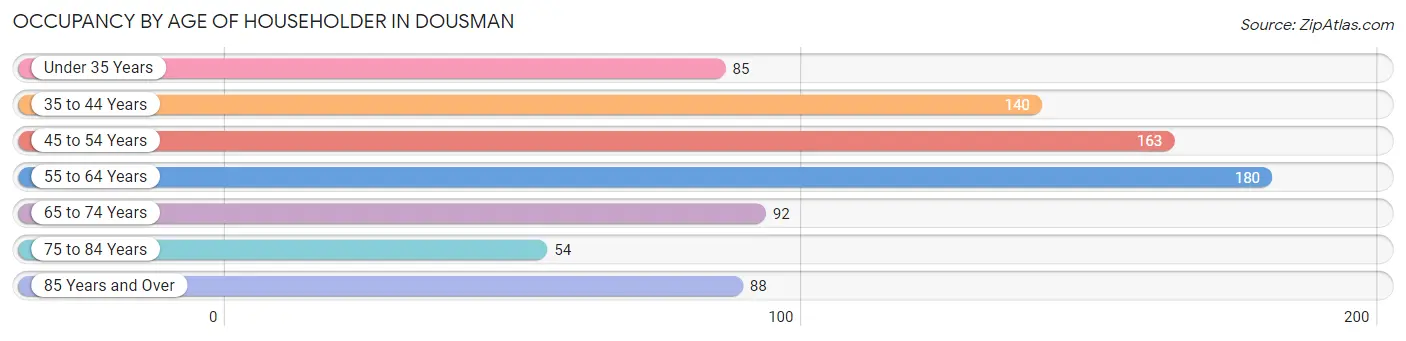
Occupancy by Age of Householder in Dousman
| Age Bracket | # Households | % Households |
| Under 35 Years | 85 | 10.6% |
| 35 to 44 Years | 140 | 17.5% |
| 45 to 54 Years | 163 | 20.3% |
| 55 to 64 Years | 180 | 22.4% |
| 65 to 74 Years | 92 | 11.5% |
| 75 to 84 Years | 54 | 6.7% |
| 85 Years and Over | 88 | 11.0% |
| Total | 802 | 100.0% |
Housing Finances in Dousman
Median Income by Occupancy in Dousman
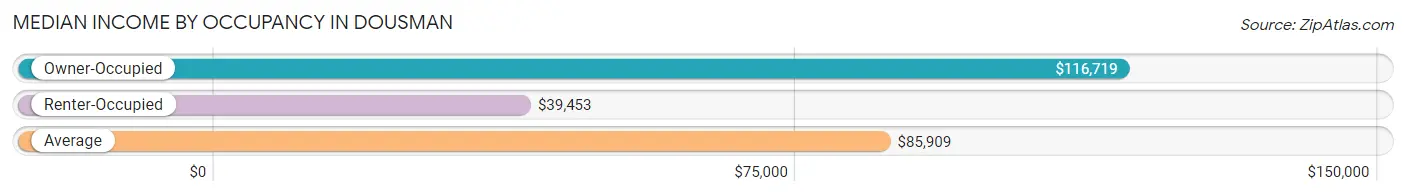
| Occupancy Type | # Households | Median Income |
| Owner-Occupied | 475 (59.2%) | $116,719 |
| Renter-Occupied | 327 (40.8%) | $39,453 |
| Average | 802 (100.0%) | $85,909 |
Occupancy by Householder Income Bracket in Dousman
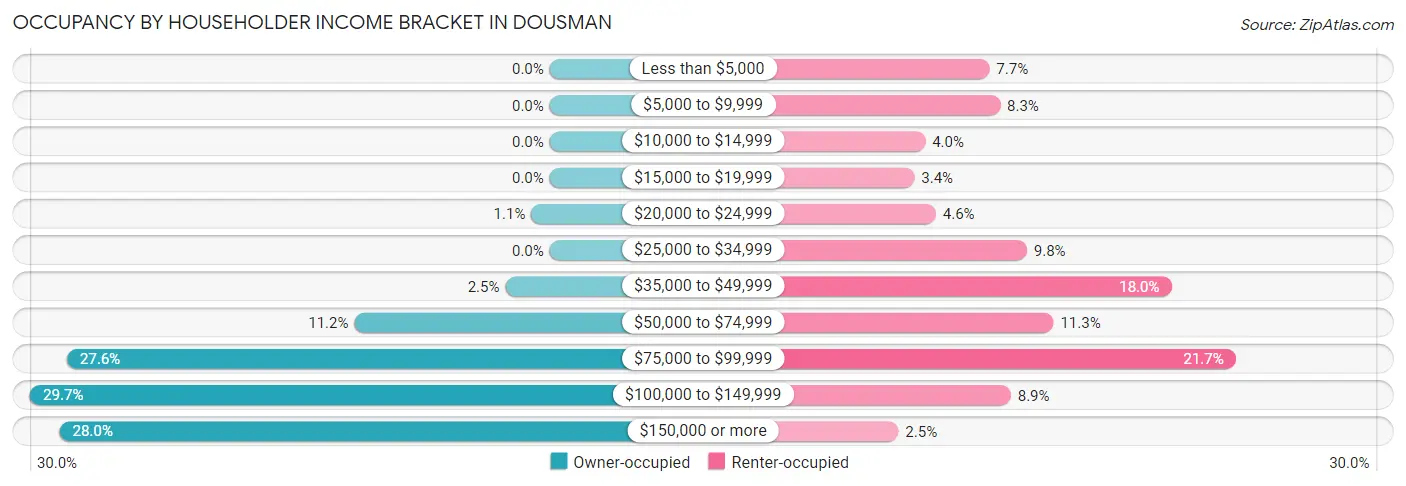
| Income Bracket | Owner-occupied | Renter-occupied |
| Less than $5,000 | 0 (0.0%) | 25 (7.6%) |
| $5,000 to $9,999 | 0 (0.0%) | 27 (8.3%) |
| $10,000 to $14,999 | 0 (0.0%) | 13 (4.0%) |
| $15,000 to $19,999 | 0 (0.0%) | 11 (3.4%) |
| $20,000 to $24,999 | 5 (1.1%) | 15 (4.6%) |
| $25,000 to $34,999 | 0 (0.0%) | 32 (9.8%) |
| $35,000 to $49,999 | 12 (2.5%) | 59 (18.0%) |
| $50,000 to $74,999 | 53 (11.2%) | 37 (11.3%) |
| $75,000 to $99,999 | 131 (27.6%) | 71 (21.7%) |
| $100,000 to $149,999 | 141 (29.7%) | 29 (8.9%) |
| $150,000 or more | 133 (28.0%) | 8 (2.5%) |
| Total | 475 (100.0%) | 327 (100.0%) |
Monthly Housing Cost Tiers in Dousman
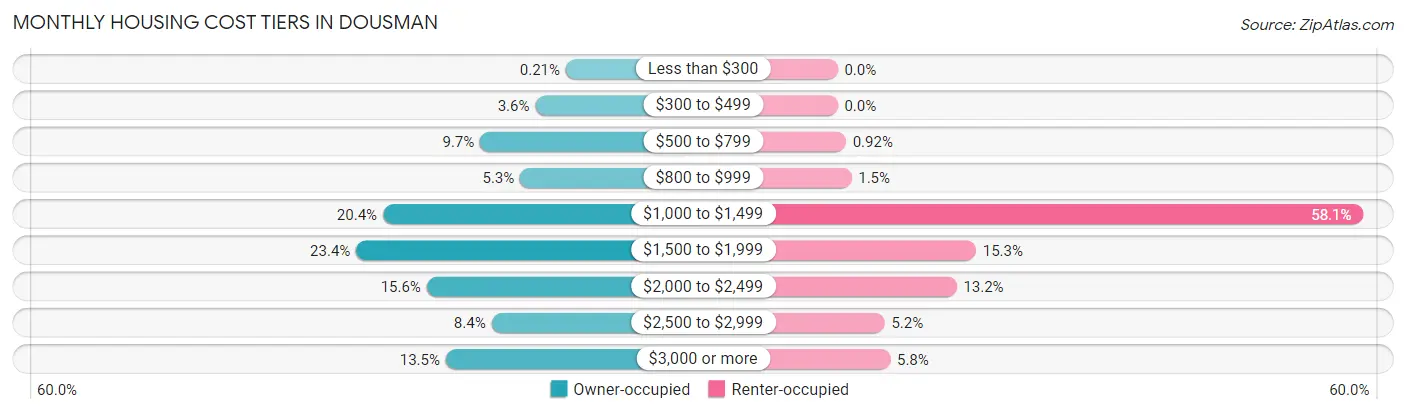
| Monthly Cost | Owner-occupied | Renter-occupied |
| Less than $300 | 1 (0.2%) | 0 (0.0%) |
| $300 to $499 | 17 (3.6%) | 0 (0.0%) |
| $500 to $799 | 46 (9.7%) | 3 (0.9%) |
| $800 to $999 | 25 (5.3%) | 5 (1.5%) |
| $1,000 to $1,499 | 97 (20.4%) | 190 (58.1%) |
| $1,500 to $1,999 | 111 (23.4%) | 50 (15.3%) |
| $2,000 to $2,499 | 74 (15.6%) | 43 (13.2%) |
| $2,500 to $2,999 | 40 (8.4%) | 17 (5.2%) |
| $3,000 or more | 64 (13.5%) | 19 (5.8%) |
| Total | 475 (100.0%) | 327 (100.0%) |
Physical Housing Characteristics in Dousman
Housing Structures in Dousman
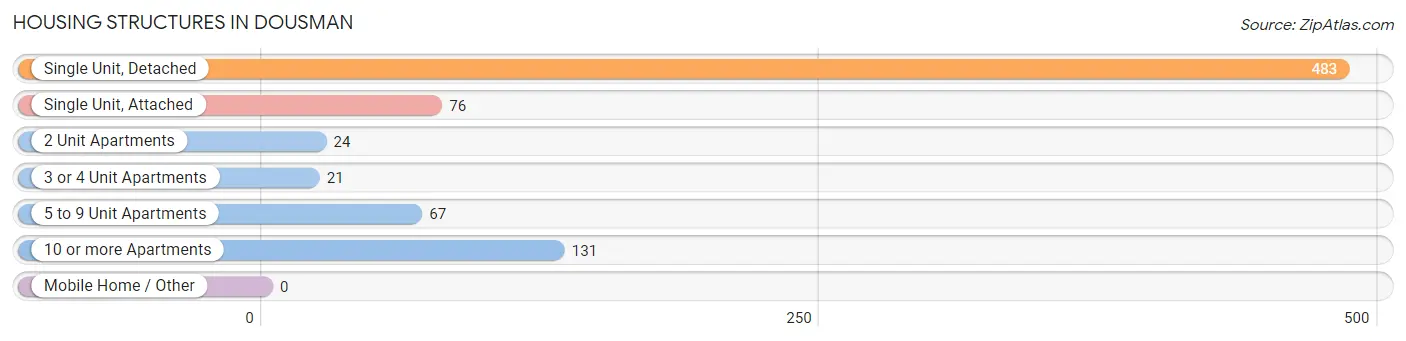
| Structure Type | # Housing Units | % Housing Units |
| Single Unit, Detached | 483 | 60.2% |
| Single Unit, Attached | 76 | 9.5% |
| 2 Unit Apartments | 24 | 3.0% |
| 3 or 4 Unit Apartments | 21 | 2.6% |
| 5 to 9 Unit Apartments | 67 | 8.4% |
| 10 or more Apartments | 131 | 16.3% |
| Mobile Home / Other | 0 | 0.0% |
| Total | 802 | 100.0% |
Housing Structures by Occupancy in Dousman
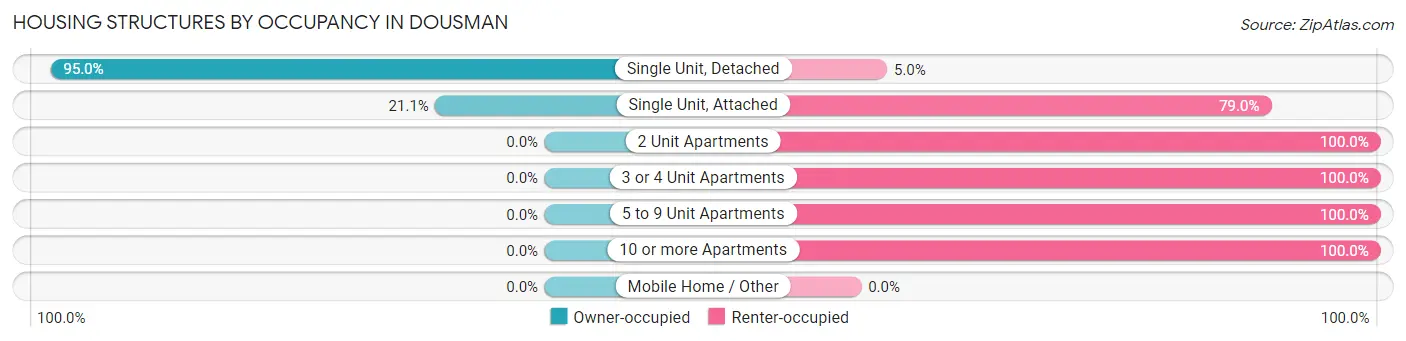
| Structure Type | Owner-occupied | Renter-occupied |
| Single Unit, Detached | 459 (95.0%) | 24 (5.0%) |
| Single Unit, Attached | 16 (21.0%) | 60 (78.9%) |
| 2 Unit Apartments | 0 (0.0%) | 24 (100.0%) |
| 3 or 4 Unit Apartments | 0 (0.0%) | 21 (100.0%) |
| 5 to 9 Unit Apartments | 0 (0.0%) | 67 (100.0%) |
| 10 or more Apartments | 0 (0.0%) | 131 (100.0%) |
| Mobile Home / Other | 0 (0.0%) | 0 (0.0%) |
| Total | 475 (59.2%) | 327 (40.8%) |
Housing Structures by Number of Rooms in Dousman
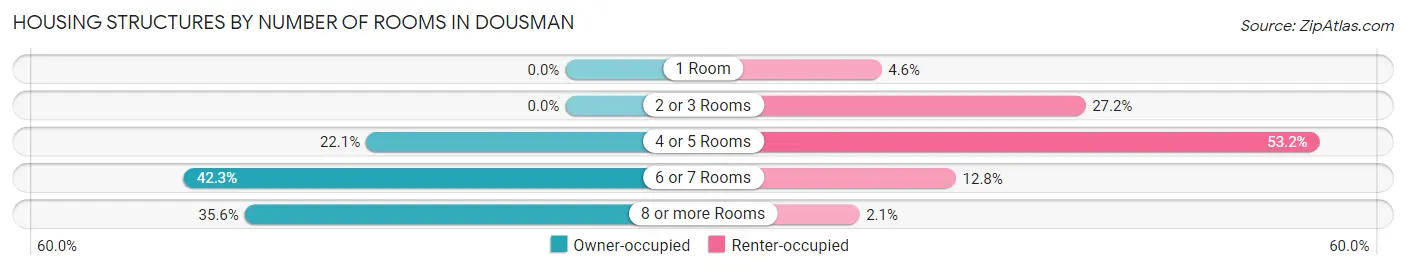
| Number of Rooms | Owner-occupied | Renter-occupied |
| 1 Room | 0 (0.0%) | 15 (4.6%) |
| 2 or 3 Rooms | 0 (0.0%) | 89 (27.2%) |
| 4 or 5 Rooms | 105 (22.1%) | 174 (53.2%) |
| 6 or 7 Rooms | 201 (42.3%) | 42 (12.8%) |
| 8 or more Rooms | 169 (35.6%) | 7 (2.1%) |
| Total | 475 (100.0%) | 327 (100.0%) |
Housing Structure by Heating Type in Dousman
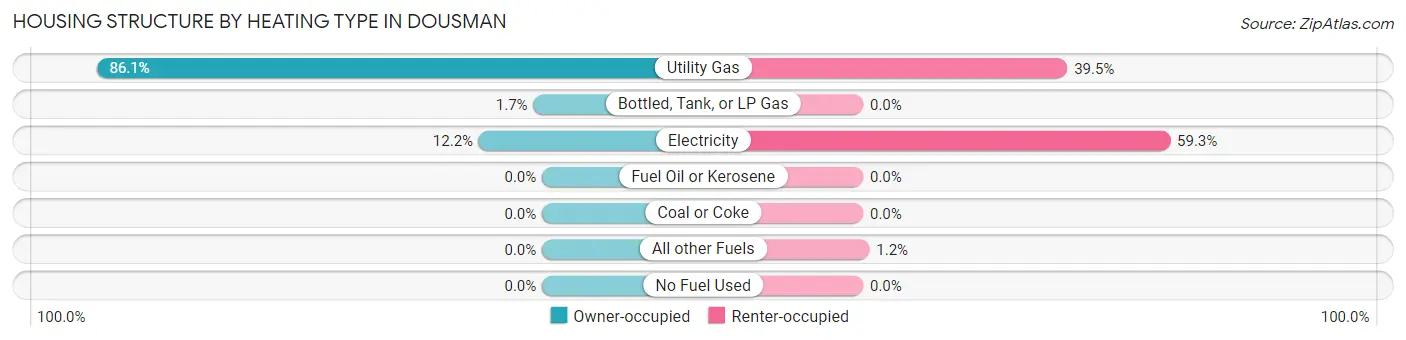
| Heating Type | Owner-occupied | Renter-occupied |
| Utility Gas | 409 (86.1%) | 129 (39.5%) |
| Bottled, Tank, or LP Gas | 8 (1.7%) | 0 (0.0%) |
| Electricity | 58 (12.2%) | 194 (59.3%) |
| Fuel Oil or Kerosene | 0 (0.0%) | 0 (0.0%) |
| Coal or Coke | 0 (0.0%) | 0 (0.0%) |
| All other Fuels | 0 (0.0%) | 4 (1.2%) |
| No Fuel Used | 0 (0.0%) | 0 (0.0%) |
| Total | 475 (100.0%) | 327 (100.0%) |
Household Vehicle Usage in Dousman
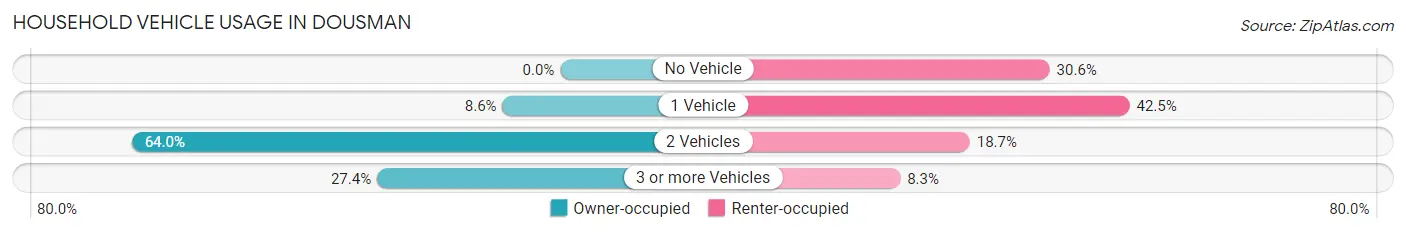
| Vehicles per Household | Owner-occupied | Renter-occupied |
| No Vehicle | 0 (0.0%) | 100 (30.6%) |
| 1 Vehicle | 41 (8.6%) | 139 (42.5%) |
| 2 Vehicles | 304 (64.0%) | 61 (18.6%) |
| 3 or more Vehicles | 130 (27.4%) | 27 (8.3%) |
| Total | 475 (100.0%) | 327 (100.0%) |
Real Estate & Mortgages in Dousman
Real Estate and Mortgage Overview in Dousman
| Characteristic | Without Mortgage | With Mortgage |
| Housing Units | 111 | 364 |
| Median Property Value | $359,700 | $368,300 |
| Median Household Income | $89,779 | $117 |
| Monthly Housing Costs | $695 | $64 |
| Real Estate Taxes | $4,529 | $0 |
Property Value by Mortgage Status in Dousman
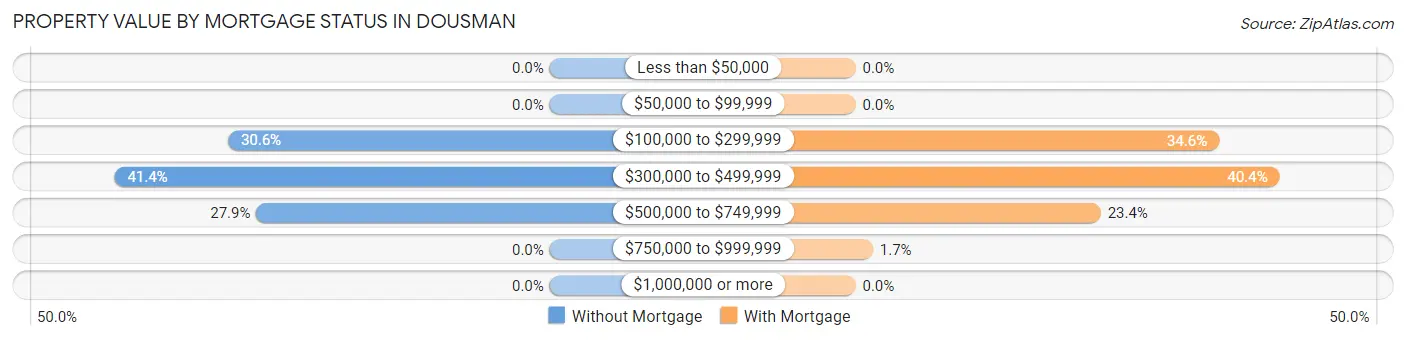
| Property Value | Without Mortgage | With Mortgage |
| Less than $50,000 | 0 (0.0%) | 0 (0.0%) |
| $50,000 to $99,999 | 0 (0.0%) | 0 (0.0%) |
| $100,000 to $299,999 | 34 (30.6%) | 126 (34.6%) |
| $300,000 to $499,999 | 46 (41.4%) | 147 (40.4%) |
| $500,000 to $749,999 | 31 (27.9%) | 85 (23.4%) |
| $750,000 to $999,999 | 0 (0.0%) | 6 (1.7%) |
| $1,000,000 or more | 0 (0.0%) | 0 (0.0%) |
| Total | 111 (100.0%) | 364 (100.0%) |
Household Income by Mortgage Status in Dousman
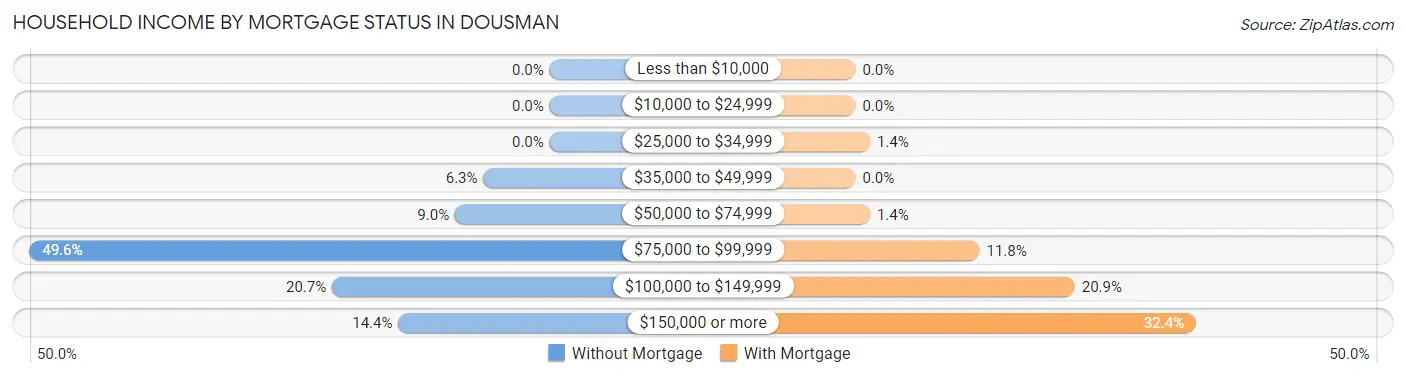
| Household Income | Without Mortgage | With Mortgage |
| Less than $10,000 | 0 (0.0%) | 0 (0.0%) |
| $10,000 to $24,999 | 0 (0.0%) | 0 (0.0%) |
| $25,000 to $34,999 | 0 (0.0%) | 5 (1.4%) |
| $35,000 to $49,999 | 7 (6.3%) | 0 (0.0%) |
| $50,000 to $74,999 | 10 (9.0%) | 5 (1.4%) |
| $75,000 to $99,999 | 55 (49.5%) | 43 (11.8%) |
| $100,000 to $149,999 | 23 (20.7%) | 76 (20.9%) |
| $150,000 or more | 16 (14.4%) | 118 (32.4%) |
| Total | 111 (100.0%) | 364 (100.0%) |
Property Value to Household Income Ratio in Dousman
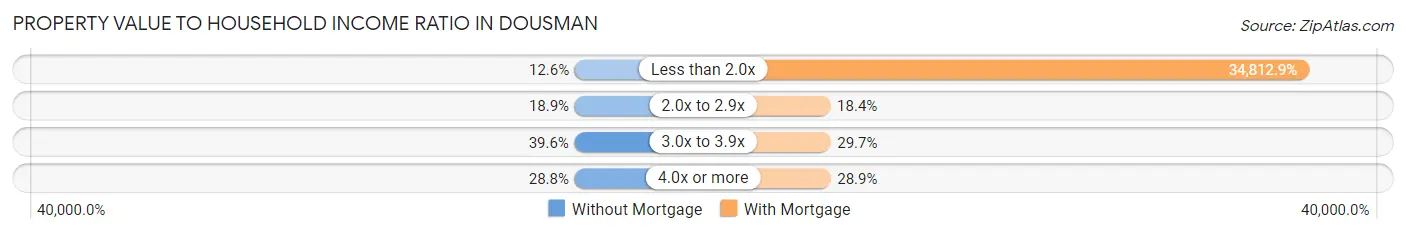
| Value-to-Income Ratio | Without Mortgage | With Mortgage |
| Less than 2.0x | 14 (12.6%) | 126,719 (34,812.9%) |
| 2.0x to 2.9x | 21 (18.9%) | 67 (18.4%) |
| 3.0x to 3.9x | 44 (39.6%) | 108 (29.7%) |
| 4.0x or more | 32 (28.8%) | 105 (28.8%) |
| Total | 111 (100.0%) | 364 (100.0%) |
Real Estate Taxes by Mortgage Status in Dousman
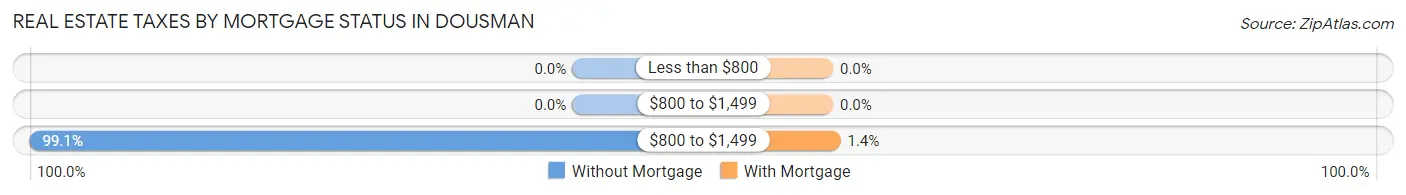
| Property Taxes | Without Mortgage | With Mortgage |
| Less than $800 | 0 (0.0%) | 0 (0.0%) |
| $800 to $1,499 | 0 (0.0%) | 0 (0.0%) |
| $800 to $1,499 | 110 (99.1%) | 5 (1.4%) |
| Total | 111 (100.0%) | 364 (100.0%) |
Health & Disability in Dousman
Health Insurance Coverage by Age in Dousman
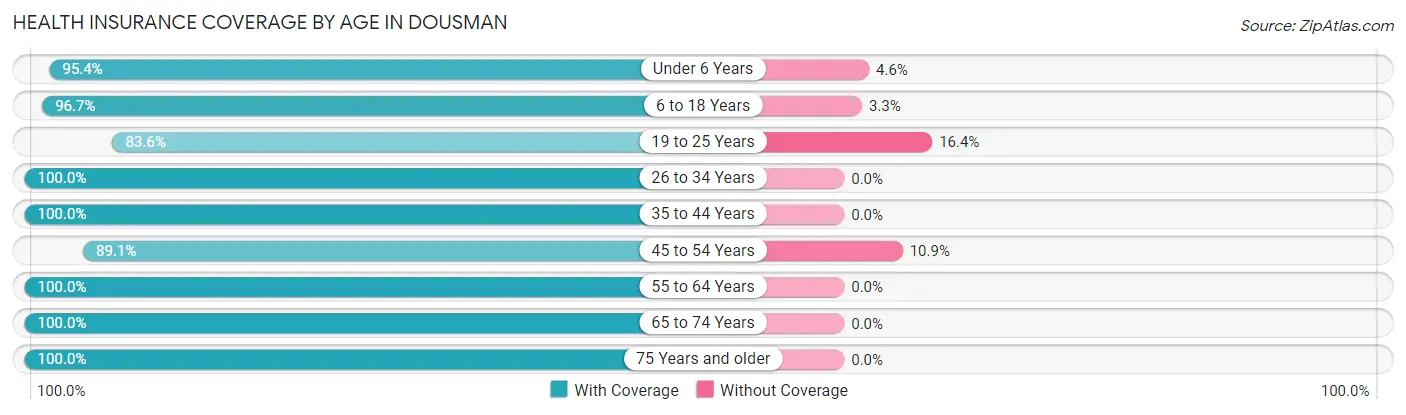
| Age Bracket | With Coverage | Without Coverage |
| Under 6 Years | 103 (95.4%) | 5 (4.6%) |
| 6 to 18 Years | 411 (96.7%) | 14 (3.3%) |
| 19 to 25 Years | 102 (83.6%) | 20 (16.4%) |
| 26 to 34 Years | 194 (100.0%) | 0 (0.0%) |
| 35 to 44 Years | 255 (100.0%) | 0 (0.0%) |
| 45 to 54 Years | 237 (89.1%) | 29 (10.9%) |
| 55 to 64 Years | 295 (100.0%) | 0 (0.0%) |
| 65 to 74 Years | 172 (100.0%) | 0 (0.0%) |
| 75 Years and older | 187 (100.0%) | 0 (0.0%) |
| Total | 1,956 (96.6%) | 68 (3.4%) |
Health Insurance Coverage by Citizenship Status in Dousman
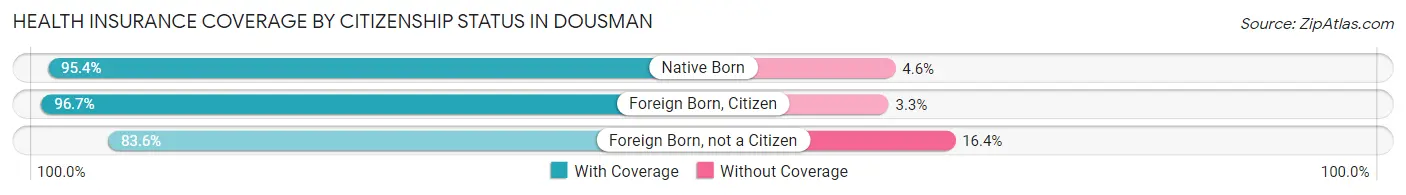
| Citizenship Status | With Coverage | Without Coverage |
| Native Born | 103 (95.4%) | 5 (4.6%) |
| Foreign Born, Citizen | 411 (96.7%) | 14 (3.3%) |
| Foreign Born, not a Citizen | 102 (83.6%) | 20 (16.4%) |
Health Insurance Coverage by Household Income in Dousman
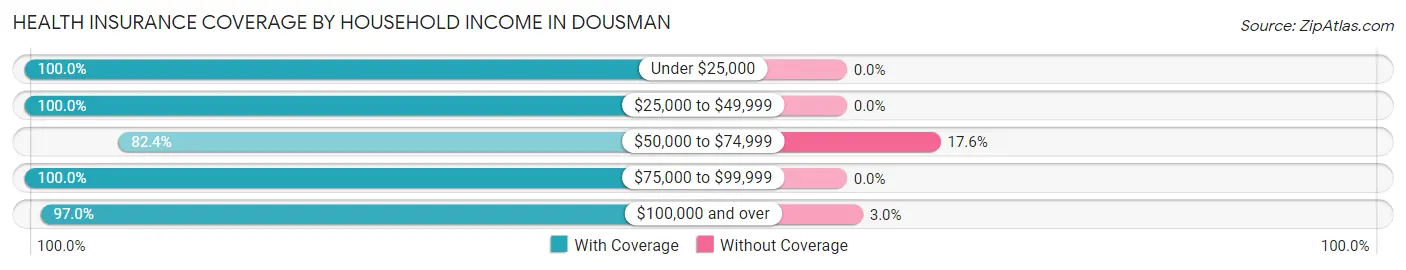
| Household Income | With Coverage | Without Coverage |
| Under $25,000 | 104 (100.0%) | 0 (0.0%) |
| $25,000 to $49,999 | 139 (100.0%) | 0 (0.0%) |
| $50,000 to $74,999 | 183 (82.4%) | 39 (17.6%) |
| $75,000 to $99,999 | 546 (100.0%) | 0 (0.0%) |
| $100,000 and over | 938 (97.0%) | 29 (3.0%) |
Public vs Private Health Insurance Coverage by Age in Dousman
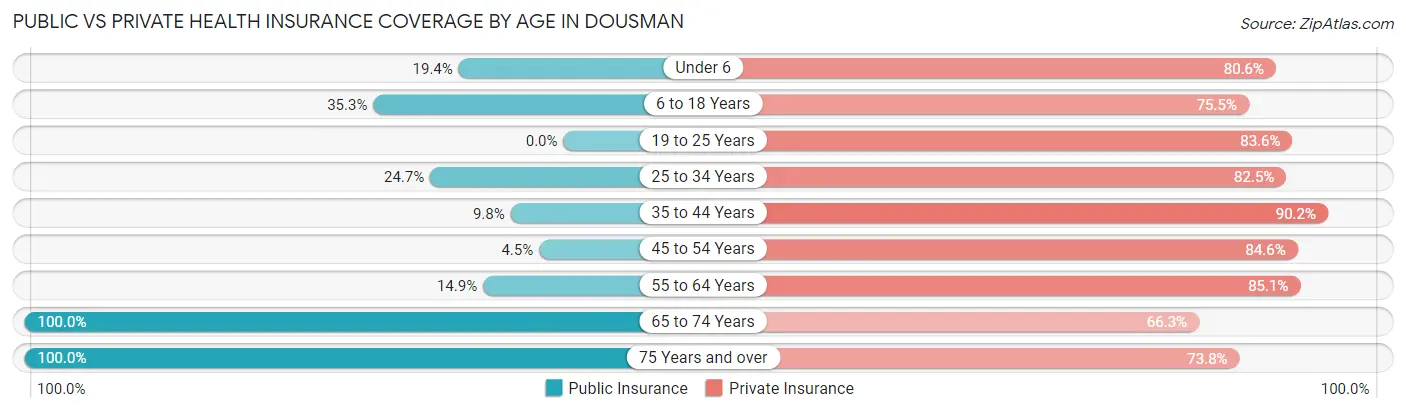
| Age Bracket | Public Insurance | Private Insurance |
| Under 6 | 21 (19.4%) | 87 (80.6%) |
| 6 to 18 Years | 150 (35.3%) | 321 (75.5%) |
| 19 to 25 Years | 0 (0.0%) | 102 (83.6%) |
| 25 to 34 Years | 48 (24.7%) | 160 (82.5%) |
| 35 to 44 Years | 25 (9.8%) | 230 (90.2%) |
| 45 to 54 Years | 12 (4.5%) | 225 (84.6%) |
| 55 to 64 Years | 44 (14.9%) | 251 (85.1%) |
| 65 to 74 Years | 172 (100.0%) | 114 (66.3%) |
| 75 Years and over | 187 (100.0%) | 138 (73.8%) |
| Total | 659 (32.6%) | 1,628 (80.4%) |
Disability Status by Sex by Age in Dousman
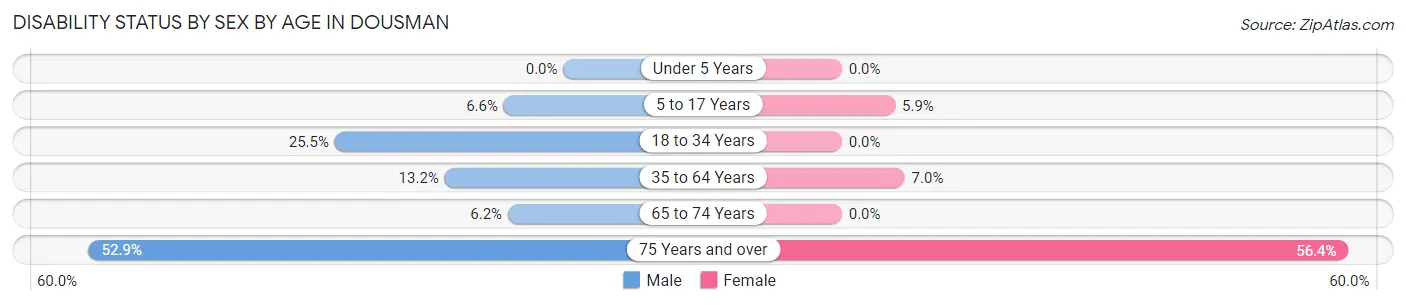
| Age Bracket | Male | Female |
| Under 5 Years | 0 (0.0%) | 0 (0.0%) |
| 5 to 17 Years | 13 (6.6%) | 13 (5.9%) |
| 18 to 34 Years | 57 (25.5%) | 0 (0.0%) |
| 35 to 64 Years | 55 (13.2%) | 28 (7.0%) |
| 65 to 74 Years | 5 (6.2%) | 0 (0.0%) |
| 75 Years and over | 37 (52.9%) | 66 (56.4%) |
Disability Class by Sex by Age in Dousman
Disability Class: Hearing Difficulty
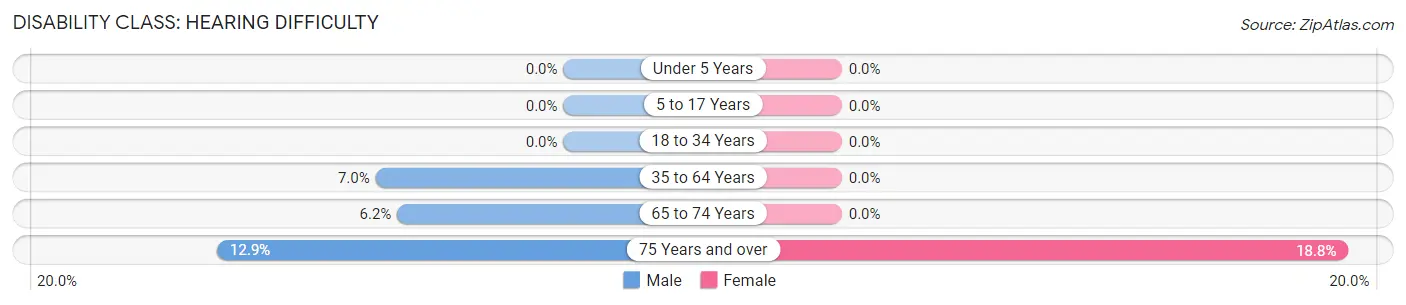
| Age Bracket | Male | Female |
| Under 5 Years | 0 (0.0%) | 0 (0.0%) |
| 5 to 17 Years | 0 (0.0%) | 0 (0.0%) |
| 18 to 34 Years | 0 (0.0%) | 0 (0.0%) |
| 35 to 64 Years | 29 (7.0%) | 0 (0.0%) |
| 65 to 74 Years | 5 (6.2%) | 0 (0.0%) |
| 75 Years and over | 9 (12.9%) | 22 (18.8%) |
Disability Class: Vision Difficulty
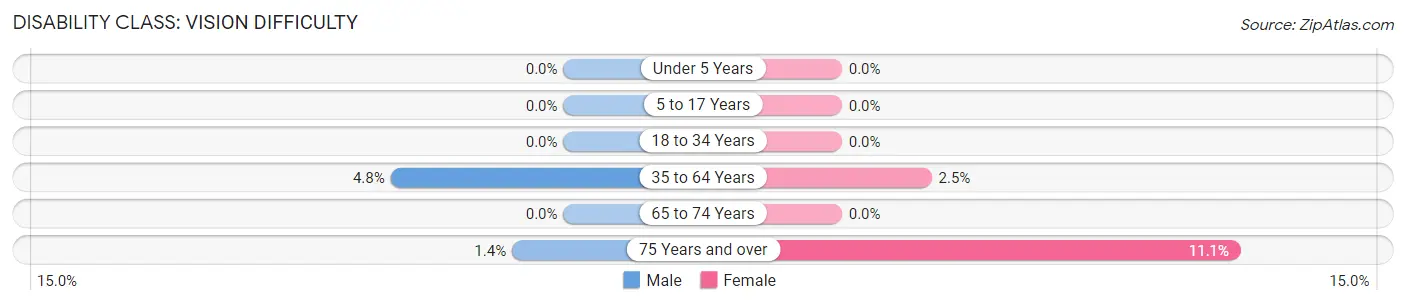
| Age Bracket | Male | Female |
| Under 5 Years | 0 (0.0%) | 0 (0.0%) |
| 5 to 17 Years | 0 (0.0%) | 0 (0.0%) |
| 18 to 34 Years | 0 (0.0%) | 0 (0.0%) |
| 35 to 64 Years | 20 (4.8%) | 10 (2.5%) |
| 65 to 74 Years | 0 (0.0%) | 0 (0.0%) |
| 75 Years and over | 1 (1.4%) | 13 (11.1%) |
Disability Class: Cognitive Difficulty
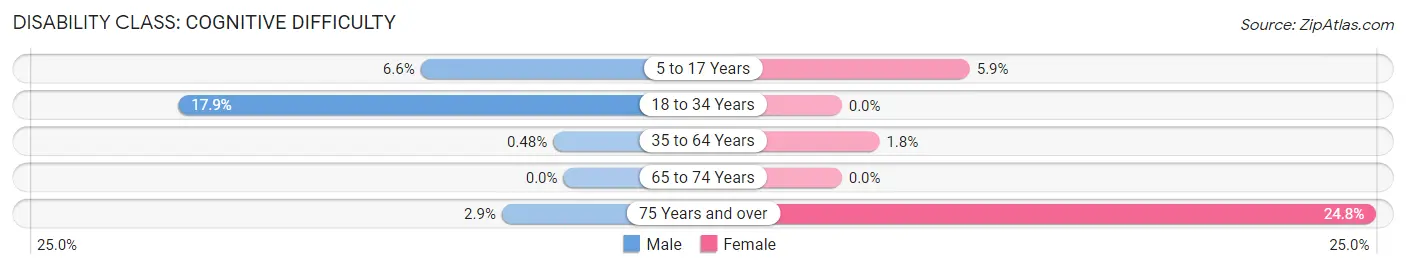
| Age Bracket | Male | Female |
| 5 to 17 Years | 13 (6.6%) | 13 (5.9%) |
| 18 to 34 Years | 40 (17.9%) | 0 (0.0%) |
| 35 to 64 Years | 2 (0.5%) | 7 (1.8%) |
| 65 to 74 Years | 0 (0.0%) | 0 (0.0%) |
| 75 Years and over | 2 (2.9%) | 29 (24.8%) |
Disability Class: Ambulatory Difficulty
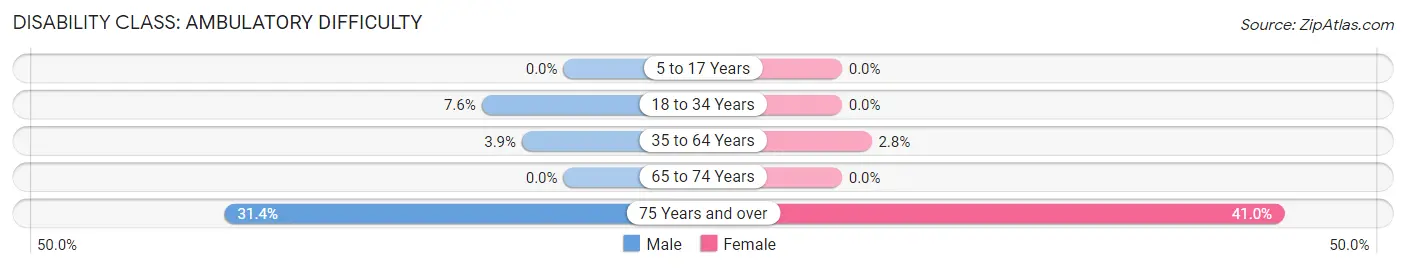
| Age Bracket | Male | Female |
| 5 to 17 Years | 0 (0.0%) | 0 (0.0%) |
| 18 to 34 Years | 17 (7.6%) | 0 (0.0%) |
| 35 to 64 Years | 16 (3.8%) | 11 (2.8%) |
| 65 to 74 Years | 0 (0.0%) | 0 (0.0%) |
| 75 Years and over | 22 (31.4%) | 48 (41.0%) |
Disability Class: Self-Care Difficulty
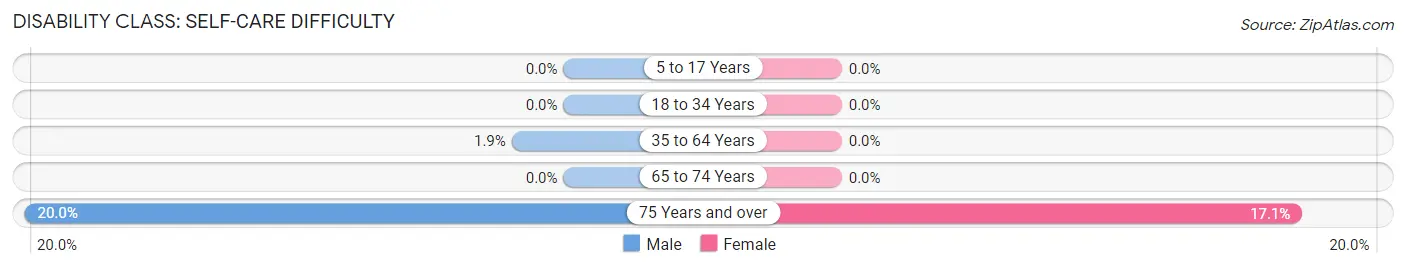
| Age Bracket | Male | Female |
| 5 to 17 Years | 0 (0.0%) | 0 (0.0%) |
| 18 to 34 Years | 0 (0.0%) | 0 (0.0%) |
| 35 to 64 Years | 8 (1.9%) | 0 (0.0%) |
| 65 to 74 Years | 0 (0.0%) | 0 (0.0%) |
| 75 Years and over | 14 (20.0%) | 20 (17.1%) |
Technology Access in Dousman
Computing Device Access in Dousman
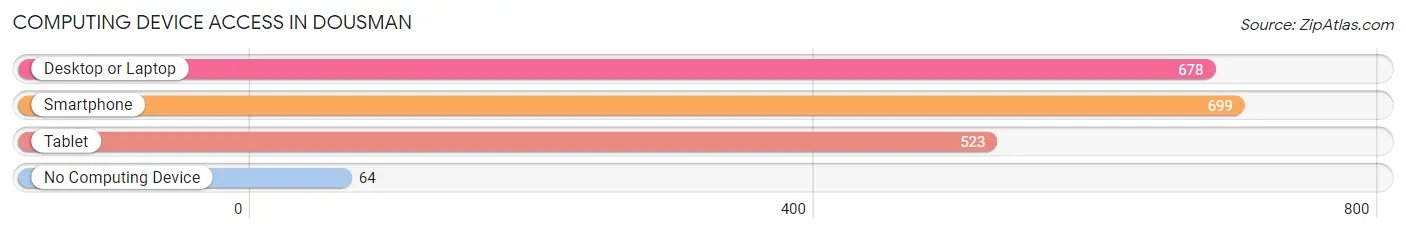
| Device Type | # Households | % Households |
| Desktop or Laptop | 678 | 84.5% |
| Smartphone | 699 | 87.2% |
| Tablet | 523 | 65.2% |
| No Computing Device | 64 | 8.0% |
| Total | 802 | 100.0% |
Internet Access in Dousman
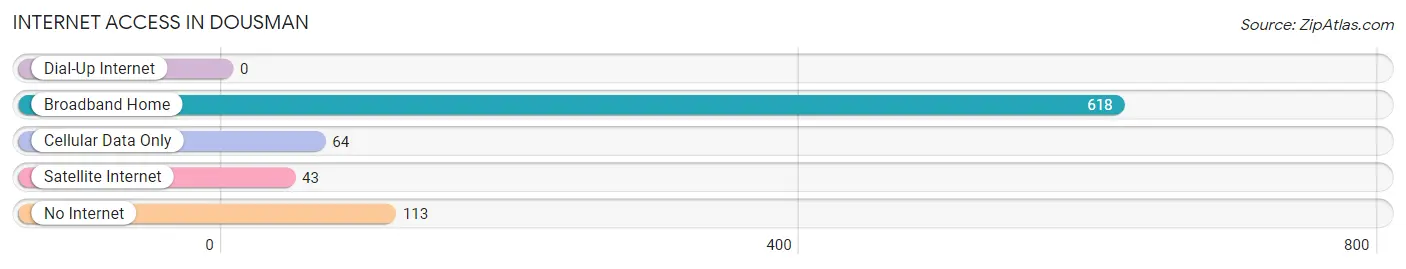
| Internet Type | # Households | % Households |
| Dial-Up Internet | 0 | 0.0% |
| Broadband Home | 618 | 77.1% |
| Cellular Data Only | 64 | 8.0% |
| Satellite Internet | 43 | 5.4% |
| No Internet | 113 | 14.1% |
| Total | 802 | 100.0% |
Dousman Summary
Dousman, Wisconsin is a small village located in Waukesha County, Wisconsin. It is situated on the banks of the Fox River, about 25 miles west of Milwaukee. The village has a population of 1,845 people, according to the 2010 census.
History
The area that is now Dousman was first settled in 1836 by a group of settlers from New York. The village was originally known as “Dousmanville”, named after the first settler, William Dousman. The village was officially incorporated in 1845.
In the late 19th century, Dousman was a thriving agricultural community. The village was home to several mills, including a flour mill, a sawmill, and a grist mill. The village also had a blacksmith shop, a general store, and a post office.
In the early 20th century, Dousman began to experience a decline in population as many of its residents moved to larger cities in search of better job opportunities. The village was also affected by the Great Depression, which caused many businesses to close.
Geography
Dousman is located in Waukesha County, Wisconsin. It is situated on the banks of the Fox River, about 25 miles west of Milwaukee. The village has a total area of 1.2 square miles, all of which is land.
The village is located in the Kettle Moraine State Forest, which is a popular destination for outdoor recreation. The forest is home to several hiking trails, camping sites, and lakes.
Economy
The economy of Dousman is largely based on agriculture and tourism. The village is home to several farms, which produce a variety of crops, including corn, soybeans, and hay. The village also has several small businesses, including restaurants, shops, and a gas station.
The village is also a popular destination for tourists, who come to enjoy the natural beauty of the Kettle Moraine State Forest. The village is home to several bed and breakfasts, as well as a few small hotels.
Demographics
According to the 2010 census, the population of Dousman was 1,845 people. The racial makeup of the village was 97.3% White, 0.7% African American, 0.3% Native American, 0.3% Asian, 0.2% from other races, and 1.2% from two or more races.
The median household income in Dousman was $50,972, and the median family income was $60,972. The per capita income was $25,972. About 4.3% of families and 5.3% of the population were below the poverty line.
Conclusion
Dousman is a small village located in Waukesha County, Wisconsin. It is situated on the banks of the Fox River, about 25 miles west of Milwaukee. The village has a population of 1,845 people, according to the 2010 census. The economy of Dousman is largely based on agriculture and tourism. The village is home to several farms, which produce a variety of crops, and is a popular destination for tourists who come to enjoy the natural beauty of the Kettle Moraine State Forest. The racial makeup of the village was 97.3% White, 0.7% African American, 0.3% Native American, 0.3% Asian, 0.2% from other races, and 1.2% from two or more races. The median household income in Dousman was $50,972, and the median family income was $60,972.
Common Questions
What is Per Capita Income in Dousman?
Per Capita income in Dousman is $40,610.
What is the Median Family Income in Dousman?
Median Family Income in Dousman is $98,750.
What is the Median Household income in Dousman?
Median Household Income in Dousman is $85,909.
What is Income or Wage Gap in Dousman?
Income or Wage Gap in Dousman is 31.8%.
Women in Dousman earn 68.2 cents for every dollar earned by a man.
What is Inequality or Gini Index in Dousman?
Inequality or Gini Index in Dousman is 0.39.
What is the Total Population of Dousman?
Total Population of Dousman is 2,099.
What is the Total Male Population of Dousman?
Total Male Population of Dousman is 1,022.
What is the Total Female Population of Dousman?
Total Female Population of Dousman is 1,077.
What is the Ratio of Males per 100 Females in Dousman?
There are 94.89 Males per 100 Females in Dousman.
What is the Ratio of Females per 100 Males in Dousman?
There are 105.38 Females per 100 Males in Dousman.
What is the Median Population Age in Dousman?
Median Population Age in Dousman is 42.6 Years.
What is the Average Family Size in Dousman
Average Family Size in Dousman is 3.0 People.
What is the Average Household Size in Dousman
Average Household Size in Dousman is 2.5 People.
How Large is the Labor Force in Dousman?
There are 1,014 People in the Labor Forcein in Dousman.
What is the Percentage of People in the Labor Force in Dousman?
61.1% of People are in the Labor Force in Dousman.
What is the Unemployment Rate in Dousman?
Unemployment Rate in Dousman is 1.6%.