Deerfield, WI Map & Demographics
Deerfield Map
Deerfield Overview
$36,766
PER CAPITA INCOME
$86,071
AVG FAMILY INCOME
$83,264
AVG HOUSEHOLD INCOME
28.7%
WAGE / INCOME GAP [ % ]
71.3¢/ $1
WAGE / INCOME GAP [ $ ]
$14,264
FAMILY INCOME DEFICIT
0.34
INEQUALITY / GINI INDEX
2,207
TOTAL POPULATION
1,177
MALE POPULATION
1,030
FEMALE POPULATION
114.27
MALES / 100 FEMALES
87.51
FEMALES / 100 MALES
33.2
MEDIAN AGE
3.2
AVG FAMILY SIZE
2.5
AVG HOUSEHOLD SIZE
1,226
LABOR FORCE [ PEOPLE ]
79.4%
PERCENT IN LABOR FORCE
2.2%
UNEMPLOYMENT RATE
Deerfield Zip Codes
Deerfield Area Codes
Income in Deerfield
Income Overview in Deerfield
Per Capita Income in Deerfield is $36,766, while median incomes of families and households are $86,071 and $83,264 respectively.
| Characteristic | Number | Measure |
| Per Capita Income | 2,207 | $36,766 |
| Median Family Income | 546 | $86,071 |
| Mean Family Income | 546 | $108,532 |
| Median Household Income | 876 | $83,264 |
| Mean Household Income | 876 | $94,167 |
| Income Deficit | 546 | $14,264 |
| Wage / Income Gap (%) | 2,207 | 28.70% |
| Wage / Income Gap ($) | 2,207 | 71.30¢ per $1 |
| Gini / Inequality Index | 2,207 | 0.34 |
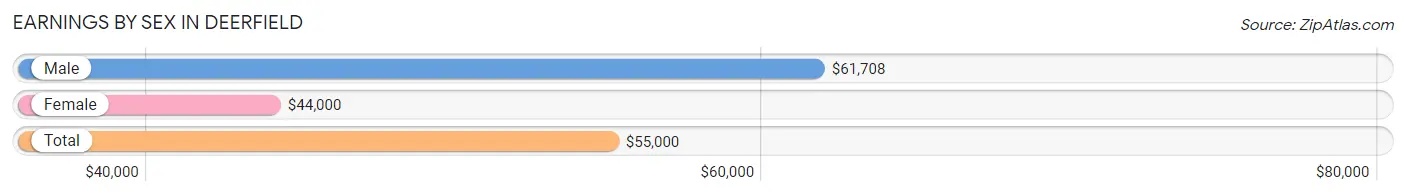
Earnings by Sex in Deerfield
Average Earnings in Deerfield are $55,000, $61,708 for men and $44,000 for women, a difference of 28.7%.
| Sex | Number | Average Earnings |
| Male | 698 (54.2%) | $61,708 |
| Female | 590 (45.8%) | $44,000 |
| Total | 1,288 (100.0%) | $55,000 |
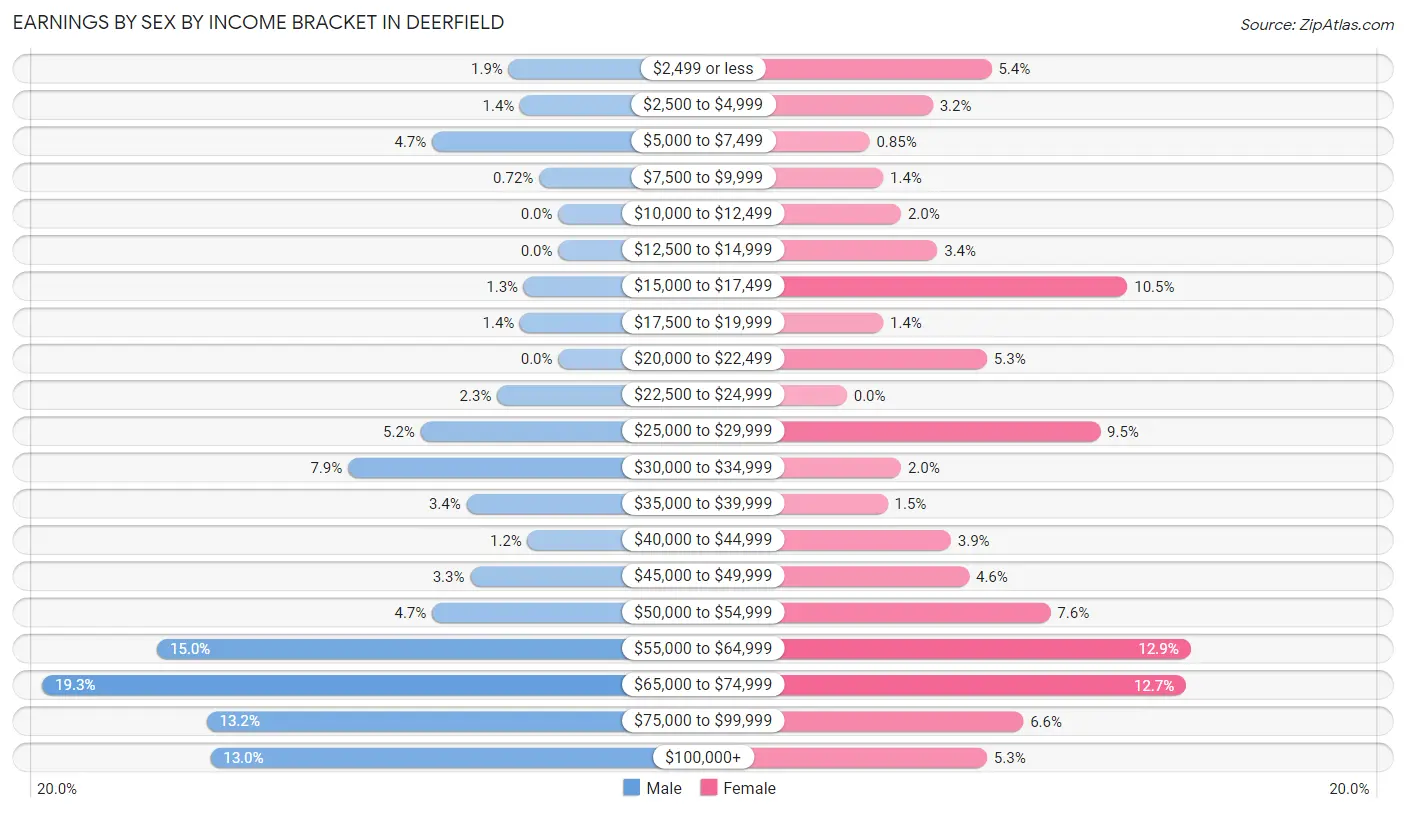
Earnings by Sex by Income Bracket in Deerfield
The most common earnings brackets in Deerfield are $65,000 to $74,999 for men (135 | 19.3%) and $55,000 to $64,999 for women (76 | 12.9%).
| Income | Male | Female |
| $2,499 or less | 13 (1.9%) | 32 (5.4%) |
| $2,500 to $4,999 | 10 (1.4%) | 19 (3.2%) |
| $5,000 to $7,499 | 33 (4.7%) | 5 (0.9%) |
| $7,500 to $9,999 | 5 (0.7%) | 8 (1.4%) |
| $10,000 to $12,499 | 0 (0.0%) | 12 (2.0%) |
| $12,500 to $14,999 | 0 (0.0%) | 20 (3.4%) |
| $15,000 to $17,499 | 9 (1.3%) | 62 (10.5%) |
| $17,500 to $19,999 | 10 (1.4%) | 8 (1.4%) |
| $20,000 to $22,499 | 0 (0.0%) | 31 (5.2%) |
| $22,500 to $24,999 | 16 (2.3%) | 0 (0.0%) |
| $25,000 to $29,999 | 36 (5.2%) | 56 (9.5%) |
| $30,000 to $34,999 | 55 (7.9%) | 12 (2.0%) |
| $35,000 to $39,999 | 24 (3.4%) | 9 (1.5%) |
| $40,000 to $44,999 | 8 (1.1%) | 23 (3.9%) |
| $45,000 to $49,999 | 23 (3.3%) | 27 (4.6%) |
| $50,000 to $54,999 | 33 (4.7%) | 45 (7.6%) |
| $55,000 to $64,999 | 105 (15.0%) | 76 (12.9%) |
| $65,000 to $74,999 | 135 (19.3%) | 75 (12.7%) |
| $75,000 to $99,999 | 92 (13.2%) | 39 (6.6%) |
| $100,000+ | 91 (13.0%) | 31 (5.2%) |
| Total | 698 (100.0%) | 590 (100.0%) |
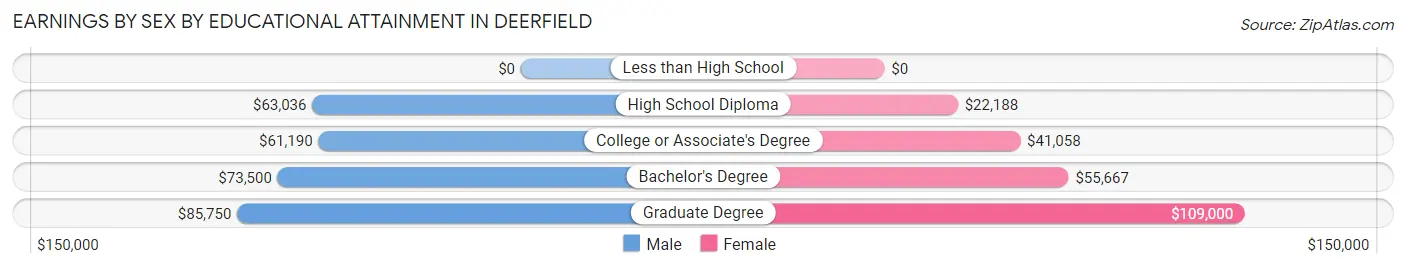
Earnings by Sex by Educational Attainment in Deerfield
Average earnings in Deerfield are $67,900 for men and $51,023 for women, a difference of 24.9%. Men with an educational attainment of graduate degree enjoy the highest average annual earnings of $85,750, while those with college or associate's degree education earn the least with $61,190. Women with an educational attainment of graduate degree earn the most with the average annual earnings of $109,000, while those with high school diploma education have the smallest earnings of $22,188.
| Educational Attainment | Male Income | Female Income |
| Less than High School | - | - |
| High School Diploma | $63,036 | $22,188 |
| College or Associate's Degree | $61,190 | $41,058 |
| Bachelor's Degree | $73,500 | $55,667 |
| Graduate Degree | $85,750 | $109,000 |
| Total | $67,900 | $51,023 |
Family Income in Deerfield
Family Income Brackets in Deerfield
According to the Deerfield family income data, there are 136 families falling into the $100,000 to $149,999 income range, which is the most common income bracket and makes up 24.9% of all families.
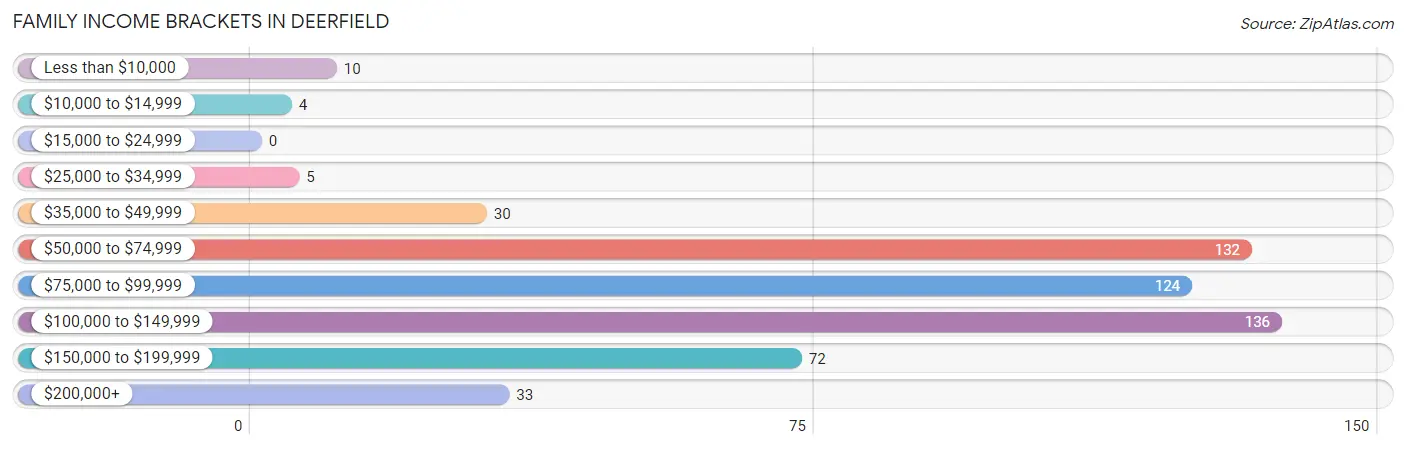
| Income Bracket | # Families | % Families |
| Less than $10,000 | 10 | 1.8% |
| $10,000 to $14,999 | 4 | 0.7% |
| $15,000 to $24,999 | 0 | 0.0% |
| $25,000 to $34,999 | 5 | 0.9% |
| $35,000 to $49,999 | 30 | 5.5% |
| $50,000 to $74,999 | 132 | 24.2% |
| $75,000 to $99,999 | 124 | 22.7% |
| $100,000 to $149,999 | 136 | 24.9% |
| $150,000 to $199,999 | 72 | 13.2% |
| $200,000+ | 33 | 6.0% |
Family Income by Famaliy Size in Deerfield
6-person families (12 | 2.2%) account for the highest median family income in Deerfield with $148,500 per family, while 3-person families (73 | 13.4%) have the highest median income of $39,479 per family member.
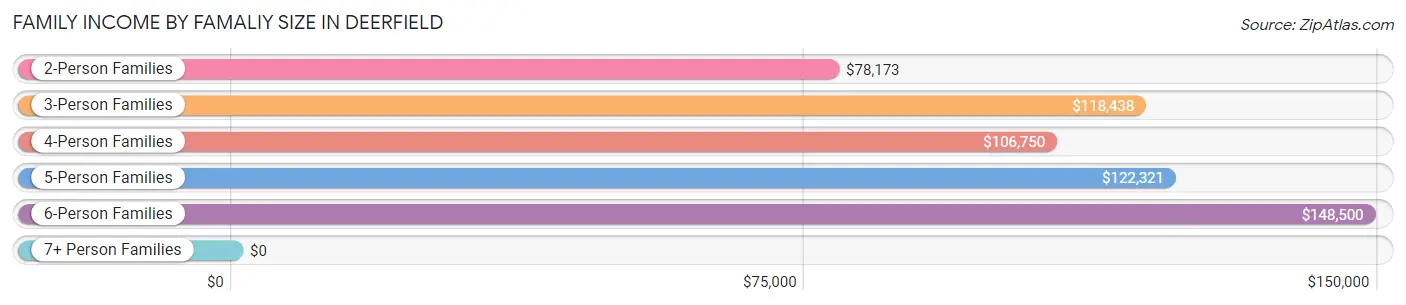
| Income Bracket | # Families | Median Income |
| 2-Person Families | 285 (52.2%) | $78,173 |
| 3-Person Families | 73 (13.4%) | $118,438 |
| 4-Person Families | 119 (21.8%) | $106,750 |
| 5-Person Families | 43 (7.9%) | $122,321 |
| 6-Person Families | 12 (2.2%) | $148,500 |
| 7+ Person Families | 14 (2.6%) | $0 |
| Total | 546 (100.0%) | $86,071 |
Family Income by Number of Earners in Deerfield
The median family income in Deerfield is $86,071, with families comprising 3+ earners (54) having the highest median family income of $166,750, while families with 1 earner (170) have the lowest median family income of $73,768, accounting for 9.9% and 31.1% of families, respectively.
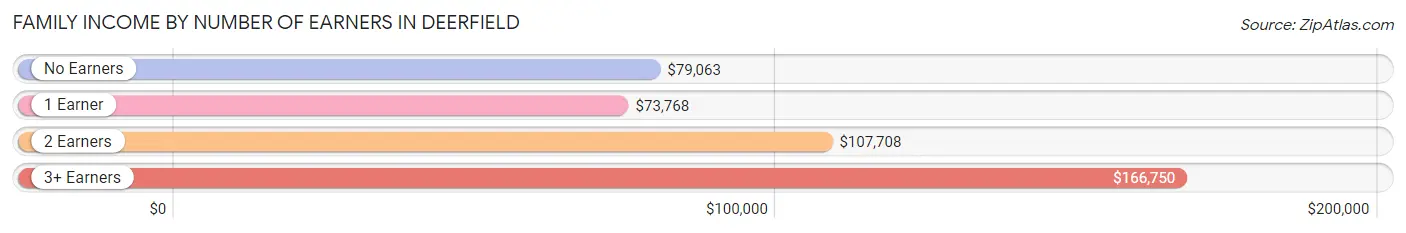
| Number of Earners | # Families | Median Income |
| No Earners | 45 (8.2%) | $79,063 |
| 1 Earner | 170 (31.1%) | $73,768 |
| 2 Earners | 277 (50.7%) | $107,708 |
| 3+ Earners | 54 (9.9%) | $166,750 |
| Total | 546 (100.0%) | $86,071 |
Household Income in Deerfield
Household Income Brackets in Deerfield
With 236 households falling in the category, the $100,000 to $149,999 income range is the most frequent in Deerfield, accounting for 26.9% of all households. In contrast, only 4 households (0.5%) fall into the $10,000 to $14,999 income bracket, making it the least populous group.
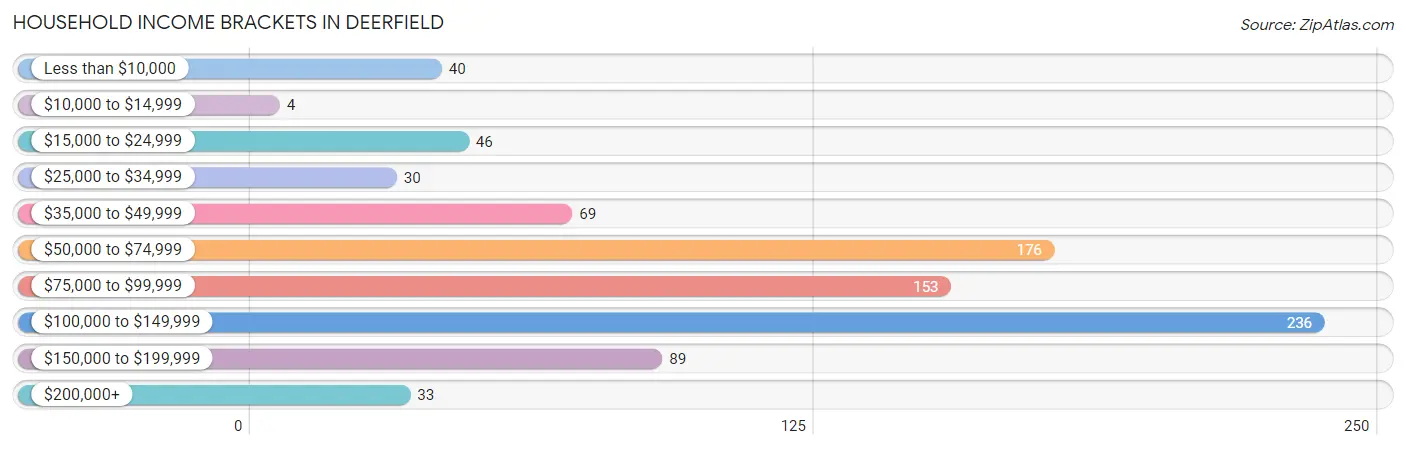
| Income Bracket | # Households | % Households |
| Less than $10,000 | 40 | 4.6% |
| $10,000 to $14,999 | 4 | 0.5% |
| $15,000 to $24,999 | 46 | 5.3% |
| $25,000 to $34,999 | 30 | 3.4% |
| $35,000 to $49,999 | 69 | 7.9% |
| $50,000 to $74,999 | 176 | 20.1% |
| $75,000 to $99,999 | 153 | 17.5% |
| $100,000 to $149,999 | 236 | 26.9% |
| $150,000 to $199,999 | 89 | 10.2% |
| $200,000+ | 33 | 3.8% |
Household Income by Householder Age in Deerfield
The median household income in Deerfield is $83,264, with the highest median household income of $106,500 found in the 25 to 44 years age bracket for the primary householder. A total of 416 households (47.5%) fall into this category. Meanwhile, the 15 to 24 years age bracket for the primary householder has the lowest median household income of $0, with 34 households (3.9%) in this group.
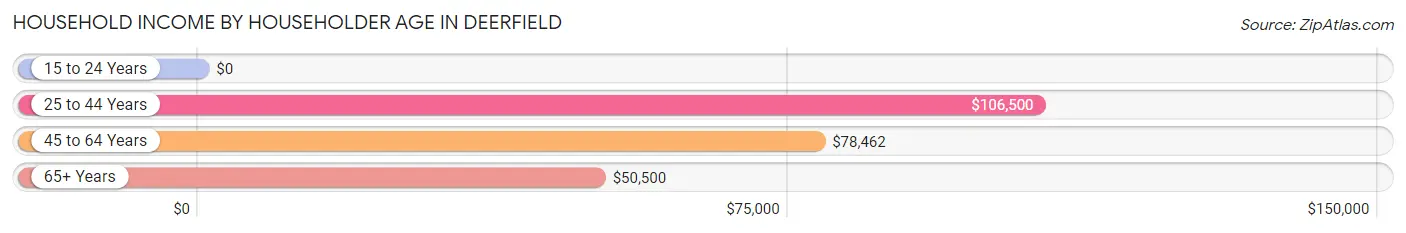
| Income Bracket | # Households | Median Income |
| 15 to 24 Years | 34 (3.9%) | $0 |
| 25 to 44 Years | 416 (47.5%) | $106,500 |
| 45 to 64 Years | 268 (30.6%) | $78,462 |
| 65+ Years | 158 (18.0%) | $50,500 |
| Total | 876 (100.0%) | $83,264 |
Poverty in Deerfield
Income Below Poverty by Sex and Age in Deerfield
With 3.7% poverty level for males and 4.3% for females among the residents of Deerfield, 45 to 54 year old males and 5 year old females are the most vulnerable to poverty, with 22 males (23.4%) and 4 females (44.4%) in their respective age groups living below the poverty level.
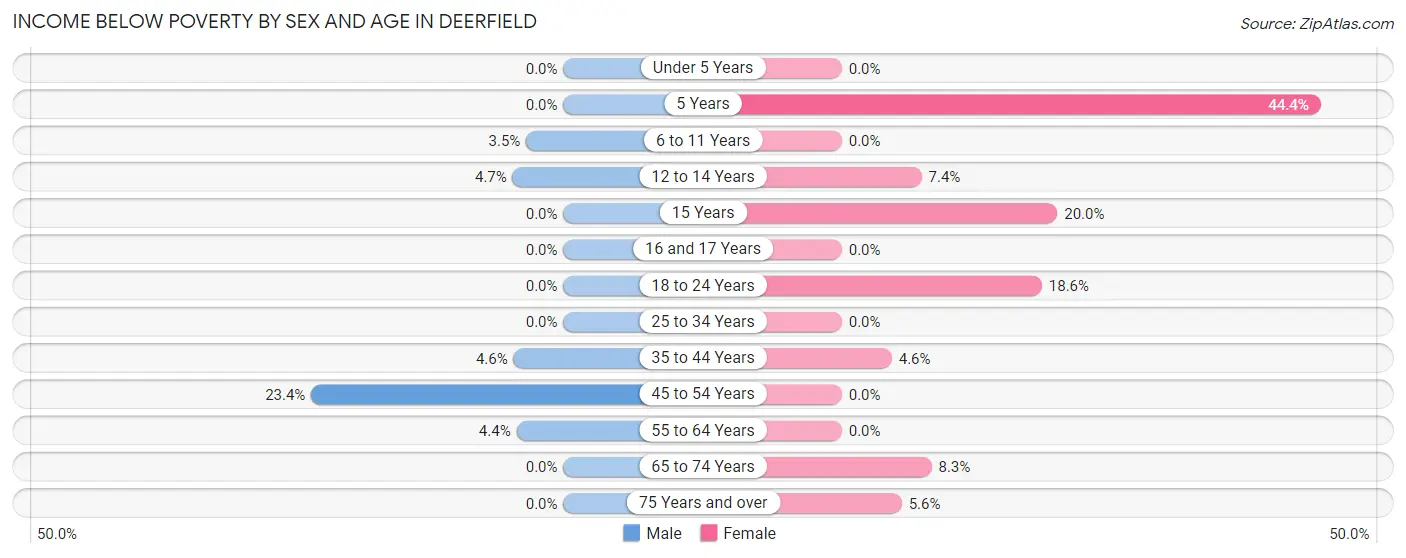
| Age Bracket | Male | Female |
| Under 5 Years | 0 (0.0%) | 0 (0.0%) |
| 5 Years | 0 (0.0%) | 4 (44.4%) |
| 6 to 11 Years | 4 (3.5%) | 0 (0.0%) |
| 12 to 14 Years | 4 (4.7%) | 4 (7.4%) |
| 15 Years | 0 (0.0%) | 4 (20.0%) |
| 16 and 17 Years | 0 (0.0%) | 0 (0.0%) |
| 18 to 24 Years | 0 (0.0%) | 13 (18.6%) |
| 25 to 34 Years | 0 (0.0%) | 0 (0.0%) |
| 35 to 44 Years | 9 (4.6%) | 9 (4.6%) |
| 45 to 54 Years | 22 (23.4%) | 0 (0.0%) |
| 55 to 64 Years | 5 (4.3%) | 0 (0.0%) |
| 65 to 74 Years | 0 (0.0%) | 5 (8.3%) |
| 75 Years and over | 0 (0.0%) | 5 (5.6%) |
| Total | 44 (3.7%) | 44 (4.3%) |
Income Above Poverty by Sex and Age in Deerfield
According to the poverty statistics in Deerfield, males aged under 5 years and females aged under 5 years are the age groups that are most secure financially, with 100.0% of males and 100.0% of females in these age groups living above the poverty line.
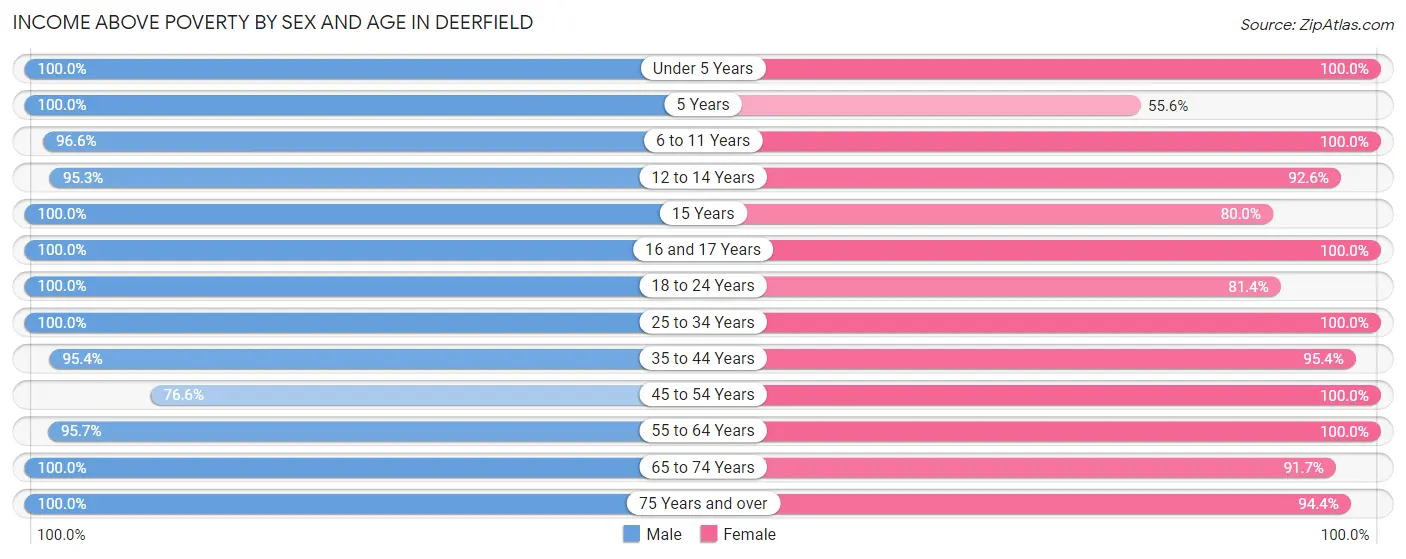
| Age Bracket | Male | Female |
| Under 5 Years | 165 (100.0%) | 110 (100.0%) |
| 5 Years | 21 (100.0%) | 5 (55.6%) |
| 6 to 11 Years | 112 (96.6%) | 66 (100.0%) |
| 12 to 14 Years | 81 (95.3%) | 50 (92.6%) |
| 15 Years | 17 (100.0%) | 16 (80.0%) |
| 16 and 17 Years | 26 (100.0%) | 4 (100.0%) |
| 18 to 24 Years | 71 (100.0%) | 57 (81.4%) |
| 25 to 34 Years | 167 (100.0%) | 143 (100.0%) |
| 35 to 44 Years | 186 (95.4%) | 185 (95.4%) |
| 45 to 54 Years | 72 (76.6%) | 98 (100.0%) |
| 55 to 64 Years | 110 (95.7%) | 112 (100.0%) |
| 65 to 74 Years | 74 (100.0%) | 55 (91.7%) |
| 75 Years and over | 31 (100.0%) | 85 (94.4%) |
| Total | 1,133 (96.3%) | 986 (95.7%) |
Income Below Poverty Among Married-Couple Families in Deerfield
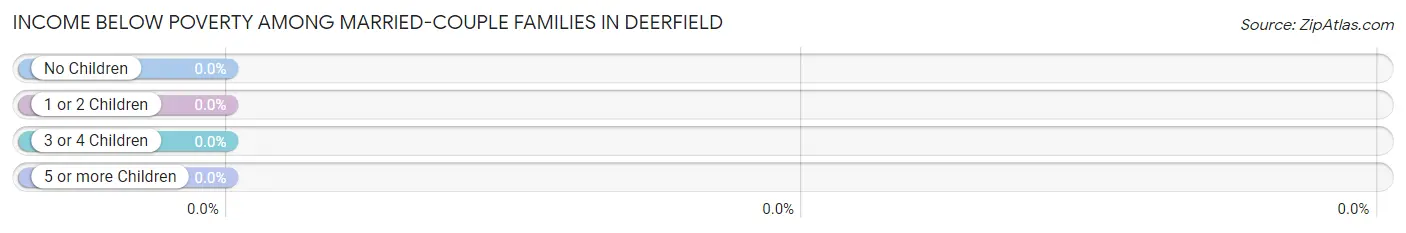
| Children | Above Poverty | Below Poverty |
| No Children | 169 (100.0%) | 0 (0.0%) |
| 1 or 2 Children | 143 (100.0%) | 0 (0.0%) |
| 3 or 4 Children | 43 (100.0%) | 0 (0.0%) |
| 5 or more Children | 14 (100.0%) | 0 (0.0%) |
| Total | 369 (100.0%) | 0 (0.0%) |
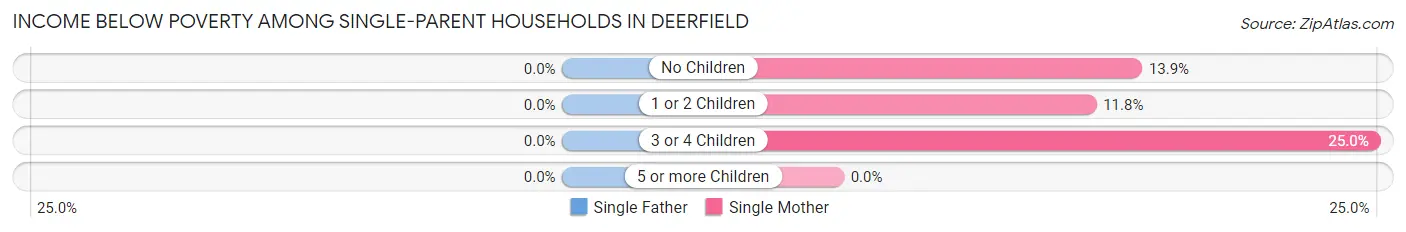
Income Below Poverty Among Single-Parent Households in Deerfield
| Children | Single Father | Single Mother |
| No Children | 0 (0.0%) | 5 (13.9%) |
| 1 or 2 Children | 0 (0.0%) | 4 (11.8%) |
| 3 or 4 Children | 0 (0.0%) | 5 (25.0%) |
| 5 or more Children | 0 (0.0%) | 0 (0.0%) |
| Total | 0 (0.0%) | 14 (15.6%) |
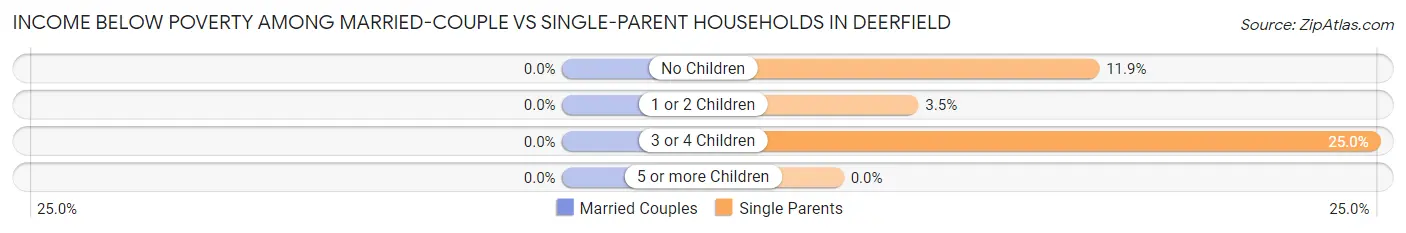
Income Below Poverty Among Married-Couple vs Single-Parent Households in Deerfield
| Children | Married-Couple Families | Single-Parent Households |
| No Children | 0 (0.0%) | 5 (11.9%) |
| 1 or 2 Children | 0 (0.0%) | 4 (3.5%) |
| 3 or 4 Children | 0 (0.0%) | 5 (25.0%) |
| 5 or more Children | 0 (0.0%) | 0 (0.0%) |
| Total | 0 (0.0%) | 14 (7.9%) |
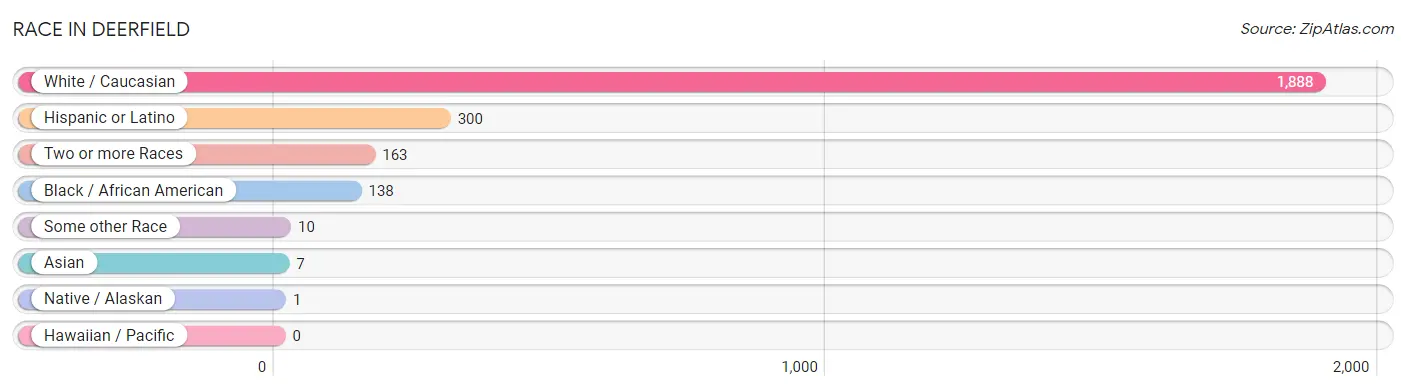
Race in Deerfield
The most populous races in Deerfield are White / Caucasian (1,888 | 85.6%), Hispanic or Latino (300 | 13.6%), and Two or more Races (163 | 7.4%).
| Race | # Population | % Population |
| Asian | 7 | 0.3% |
| Black / African American | 138 | 6.2% |
| Hawaiian / Pacific | 0 | 0.0% |
| Hispanic or Latino | 300 | 13.6% |
| Native / Alaskan | 1 | 0.1% |
| White / Caucasian | 1,888 | 85.6% |
| Two or more Races | 163 | 7.4% |
| Some other Race | 10 | 0.4% |
| Total | 2,207 | 100.0% |
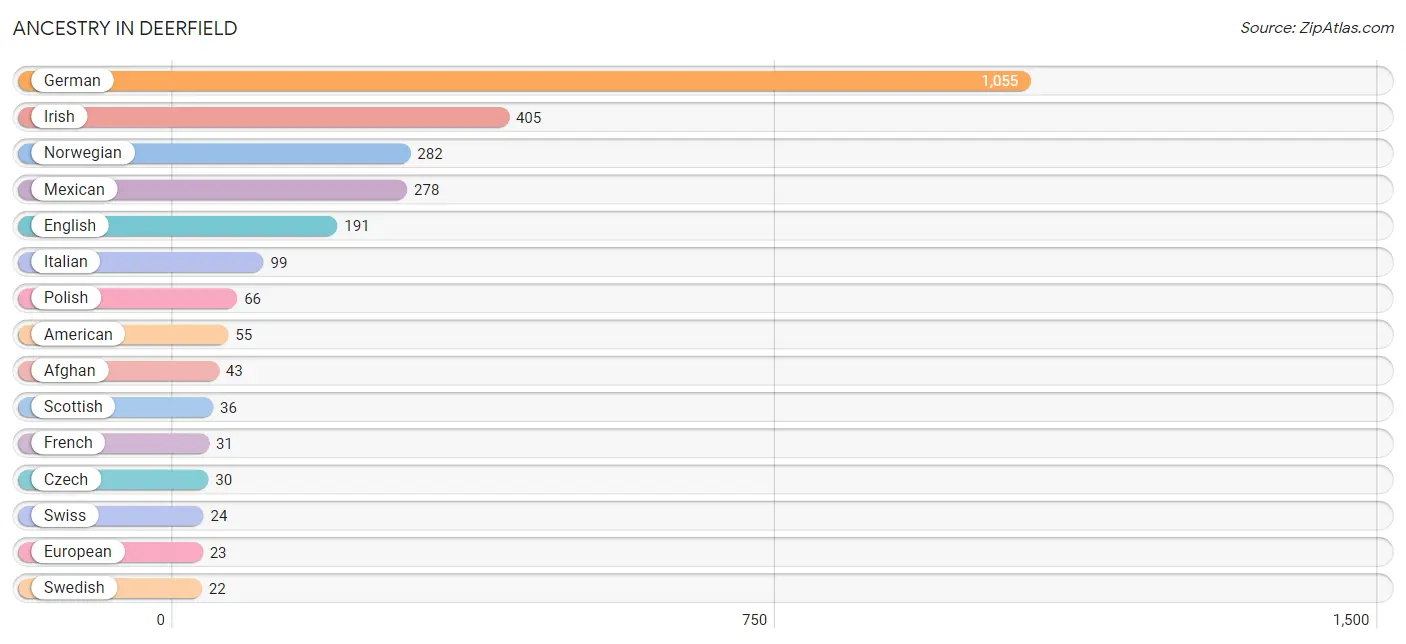
Ancestry in Deerfield
The most populous ancestries reported in Deerfield are German (1,055 | 47.8%), Irish (405 | 18.3%), Norwegian (282 | 12.8%), Mexican (278 | 12.6%), and English (191 | 8.6%), together accounting for 100.2% of all Deerfield residents.
| Ancestry | # Population | % Population |
| Afghan | 43 | 1.9% |
| American | 55 | 2.5% |
| Arab | 12 | 0.5% |
| Austrian | 17 | 0.8% |
| Belgian | 13 | 0.6% |
| Bhutanese | 13 | 0.6% |
| British | 4 | 0.2% |
| Central American | 14 | 0.6% |
| Croatian | 9 | 0.4% |
| Czech | 30 | 1.4% |
| Danish | 3 | 0.1% |
| Dutch | 20 | 0.9% |
| Eastern European | 8 | 0.4% |
| English | 191 | 8.6% |
| European | 23 | 1.0% |
| French | 31 | 1.4% |
| French Canadian | 6 | 0.3% |
| German | 1,055 | 47.8% |
| Greek | 4 | 0.2% |
| Honduran | 14 | 0.6% |
| Hungarian | 19 | 0.9% |
| Indian (Asian) | 13 | 0.6% |
| Irish | 405 | 18.3% |
| Italian | 99 | 4.5% |
| Mexican | 278 | 12.6% |
| Northern European | 10 | 0.4% |
| Norwegian | 282 | 12.8% |
| Polish | 66 | 3.0% |
| Portuguese | 4 | 0.2% |
| Scandinavian | 4 | 0.2% |
| Scotch-Irish | 5 | 0.2% |
| Scottish | 36 | 1.6% |
| Sioux | 1 | 0.1% |
| Slavic | 4 | 0.2% |
| Spanish | 8 | 0.4% |
| Swedish | 22 | 1.0% |
| Swiss | 24 | 1.1% |
| Syrian | 5 | 0.2% |
| Welsh | 11 | 0.5% | View All 39 Rows |
Immigrants in Deerfield
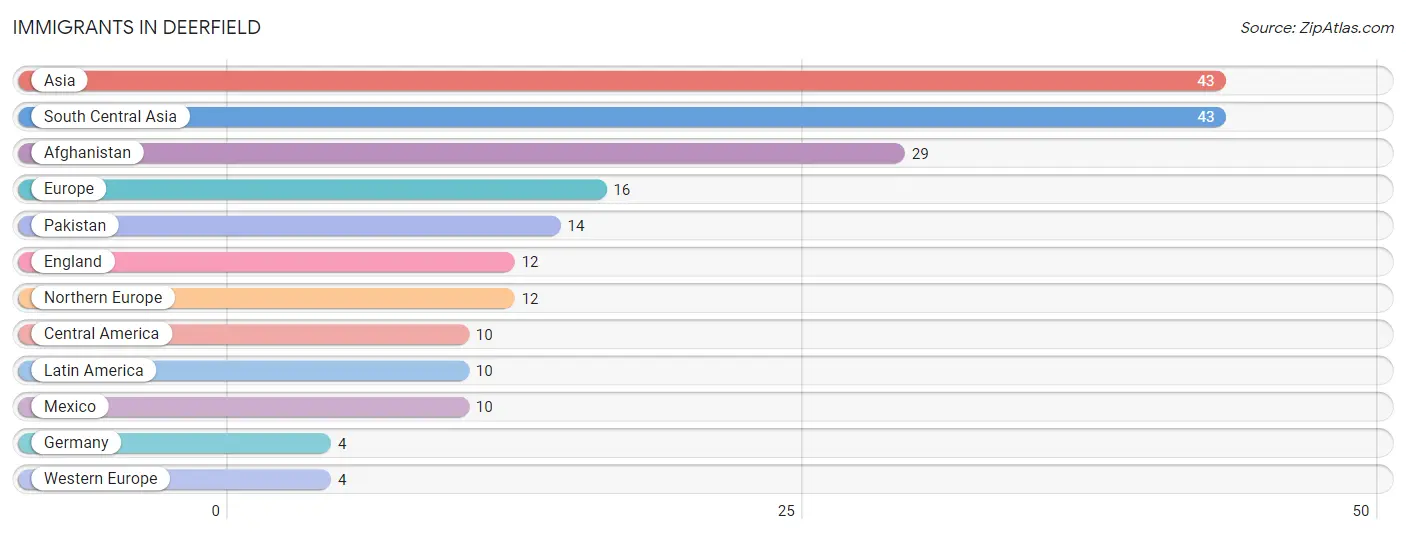
The most numerous immigrant groups reported in Deerfield came from Asia (43 | 1.9%), South Central Asia (43 | 1.9%), Afghanistan (29 | 1.3%), Europe (16 | 0.7%), and Pakistan (14 | 0.6%), together accounting for 6.6% of all Deerfield residents.
| Immigration Origin | # Population | % Population |
| Afghanistan | 29 | 1.3% |
| Asia | 43 | 1.9% |
| Central America | 10 | 0.4% |
| England | 12 | 0.5% |
| Europe | 16 | 0.7% |
| Germany | 4 | 0.2% |
| Latin America | 10 | 0.4% |
| Mexico | 10 | 0.4% |
| Northern Europe | 12 | 0.5% |
| Pakistan | 14 | 0.6% |
| South Central Asia | 43 | 1.9% |
| Western Europe | 4 | 0.2% | View All 12 Rows |
Sex and Age in Deerfield
Sex and Age in Deerfield
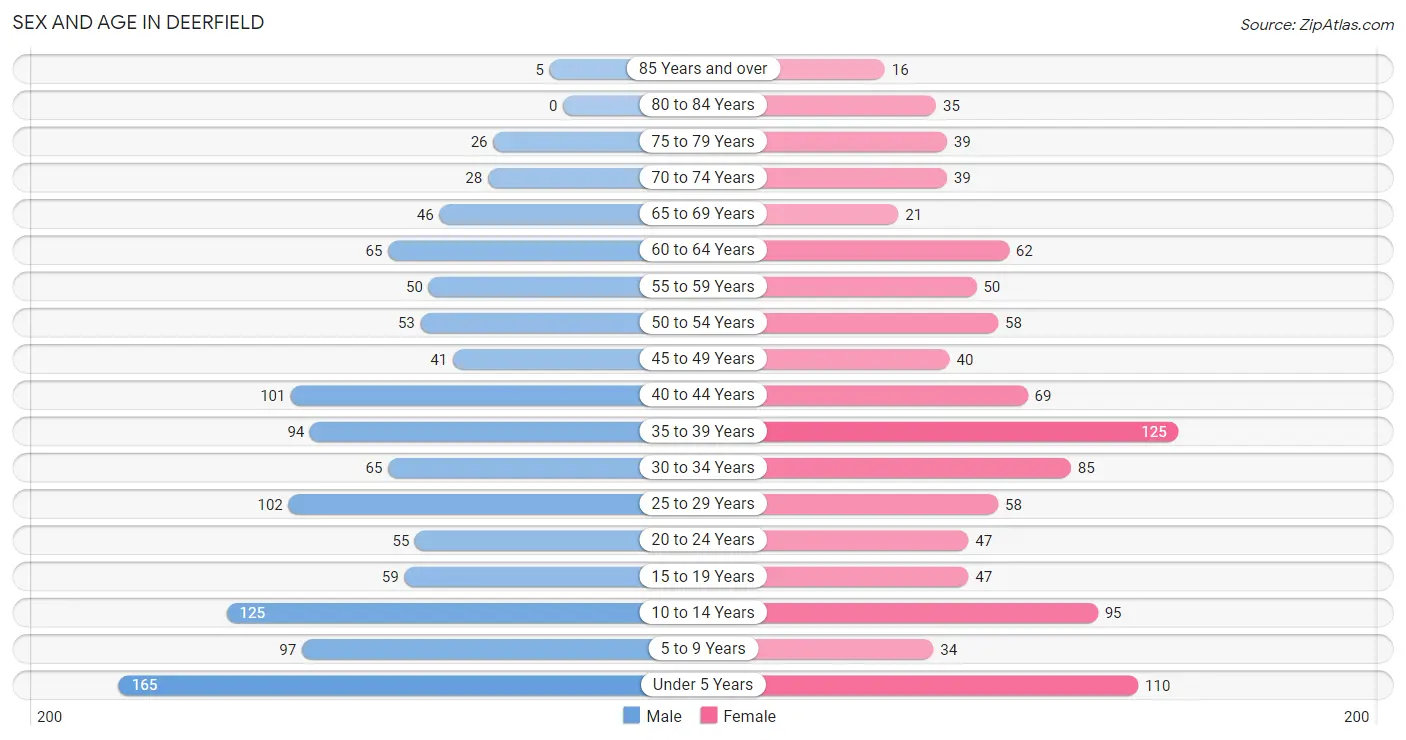
The most populous age groups in Deerfield are Under 5 Years (165 | 14.0%) for men and 35 to 39 Years (125 | 12.1%) for women.
| Age Bracket | Male | Female |
| Under 5 Years | 165 (14.0%) | 110 (10.7%) |
| 5 to 9 Years | 97 (8.2%) | 34 (3.3%) |
| 10 to 14 Years | 125 (10.6%) | 95 (9.2%) |
| 15 to 19 Years | 59 (5.0%) | 47 (4.6%) |
| 20 to 24 Years | 55 (4.7%) | 47 (4.6%) |
| 25 to 29 Years | 102 (8.7%) | 58 (5.6%) |
| 30 to 34 Years | 65 (5.5%) | 85 (8.3%) |
| 35 to 39 Years | 94 (8.0%) | 125 (12.1%) |
| 40 to 44 Years | 101 (8.6%) | 69 (6.7%) |
| 45 to 49 Years | 41 (3.5%) | 40 (3.9%) |
| 50 to 54 Years | 53 (4.5%) | 58 (5.6%) |
| 55 to 59 Years | 50 (4.3%) | 50 (4.9%) |
| 60 to 64 Years | 65 (5.5%) | 62 (6.0%) |
| 65 to 69 Years | 46 (3.9%) | 21 (2.0%) |
| 70 to 74 Years | 28 (2.4%) | 39 (3.8%) |
| 75 to 79 Years | 26 (2.2%) | 39 (3.8%) |
| 80 to 84 Years | 0 (0.0%) | 35 (3.4%) |
| 85 Years and over | 5 (0.4%) | 16 (1.5%) |
| Total | 1,177 (100.0%) | 1,030 (100.0%) |
Families and Households in Deerfield
Median Family Size in Deerfield
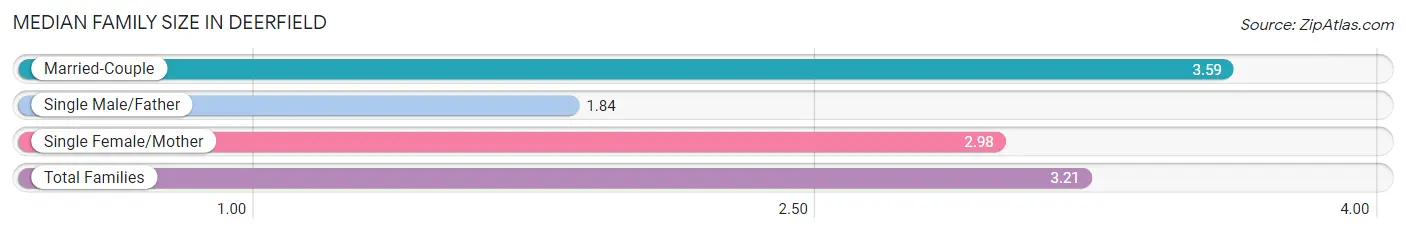
The median family size in Deerfield is 3.21 persons per family, with married-couple families (369 | 67.6%) accounting for the largest median family size of 3.59 persons per family. On the other hand, single male/father families (87 | 15.9%) represent the smallest median family size with 1.84 persons per family.
| Family Type | # Families | Family Size |
| Married-Couple | 369 (67.6%) | 3.59 |
| Single Male/Father | 87 (15.9%) | 1.84 |
| Single Female/Mother | 90 (16.5%) | 2.98 |
| Total Families | 546 (100.0%) | 3.21 |
Median Household Size in Deerfield
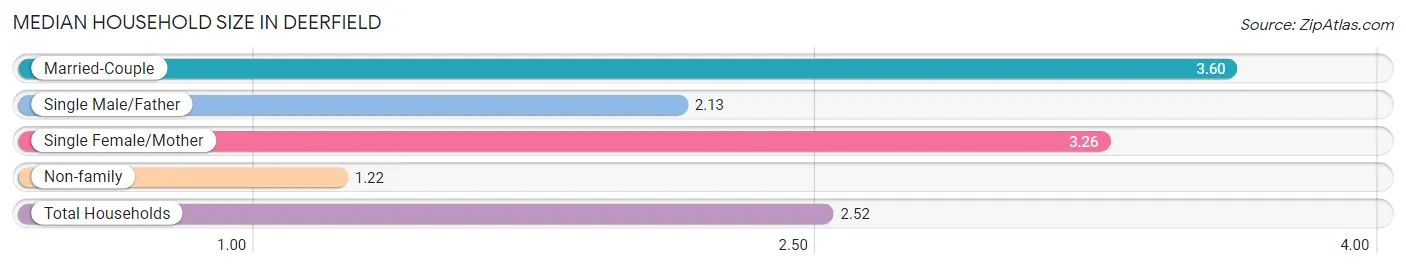
The median household size in Deerfield is 2.52 persons per household, with married-couple households (369 | 42.1%) accounting for the largest median household size of 3.6 persons per household. non-family households (330 | 37.7%) represent the smallest median household size with 1.22 persons per household.
| Household Type | # Households | Household Size |
| Married-Couple | 369 (42.1%) | 3.60 |
| Single Male/Father | 87 (9.9%) | 2.13 |
| Single Female/Mother | 90 (10.3%) | 3.26 |
| Non-family | 330 (37.7%) | 1.22 |
| Total Households | 876 (100.0%) | 2.52 |
Household Size by Marriage Status in Deerfield
Out of a total of 876 households in Deerfield, 546 (62.3%) are family households, while 330 (37.7%) are nonfamily households. The most numerous type of family households are 2-person households, comprising 206, and the most common type of nonfamily households are 1-person households, comprising 264.
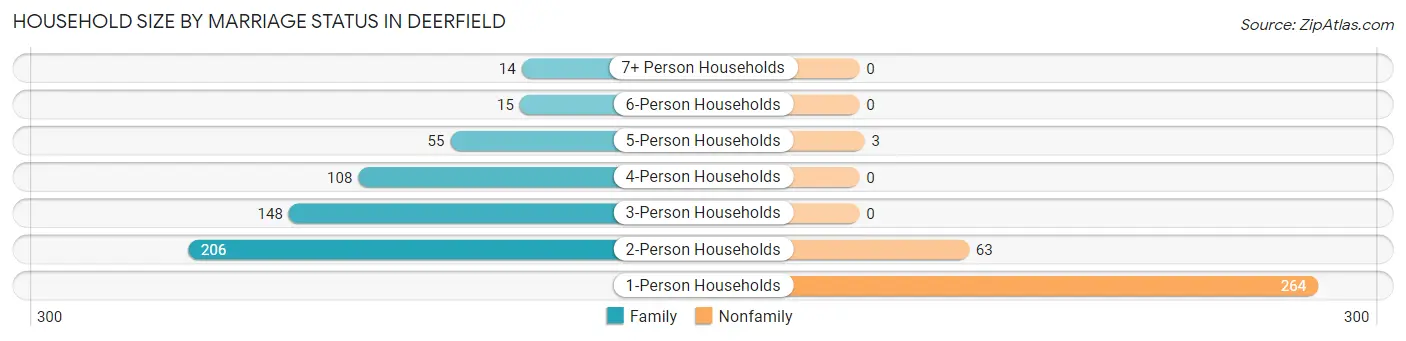
| Household Size | Family Households | Nonfamily Households |
| 1-Person Households | - | 264 (30.1%) |
| 2-Person Households | 206 (23.5%) | 63 (7.2%) |
| 3-Person Households | 148 (16.9%) | 0 (0.0%) |
| 4-Person Households | 108 (12.3%) | 0 (0.0%) |
| 5-Person Households | 55 (6.3%) | 3 (0.3%) |
| 6-Person Households | 15 (1.7%) | 0 (0.0%) |
| 7+ Person Households | 14 (1.6%) | 0 (0.0%) |
| Total | 546 (62.3%) | 330 (37.7%) |
Female Fertility in Deerfield
Fertility by Age in Deerfield
Average fertility rate in Deerfield is 109.0 births per 1,000 women. Women in the age bracket of 20 to 34 years have the highest fertility rate with 268.0 births per 1,000 women. Women in the age bracket of 20 to 34 years acount for 94.4% of all women with births.
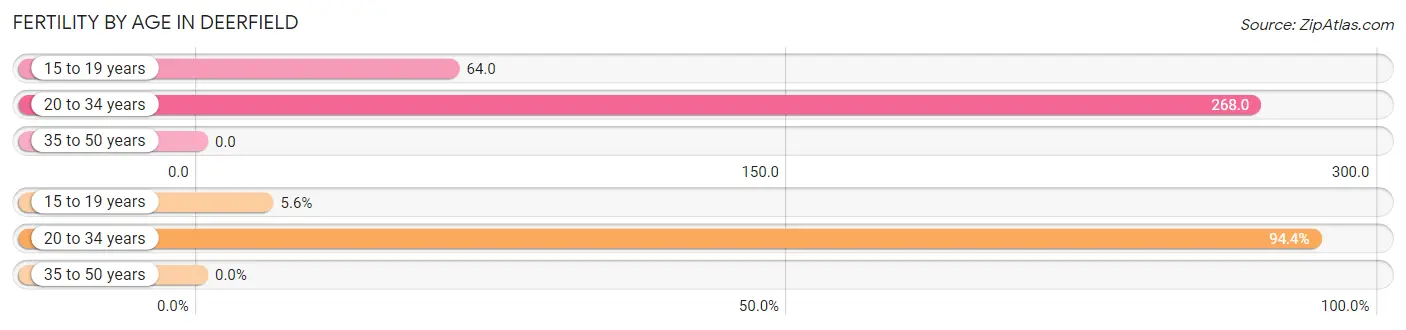
| Age Bracket | Women with Births | Births / 1,000 Women |
| 15 to 19 years | 3 (5.6%) | 64.0 |
| 20 to 34 years | 51 (94.4%) | 268.0 |
| 35 to 50 years | 0 (0.0%) | 0.0 |
| Total | 54 (100.0%) | 109.0 |
Fertility by Age by Marriage Status in Deerfield
94.4% of women with births (54) in Deerfield are married. The highest percentage of unmarried women with births falls into 15 to 19 years age bracket with 100.0% of them unmarried at the time of birth, while the lowest percentage of unmarried women with births belong to 20 to 34 years age bracket with 0.0% of them unmarried.
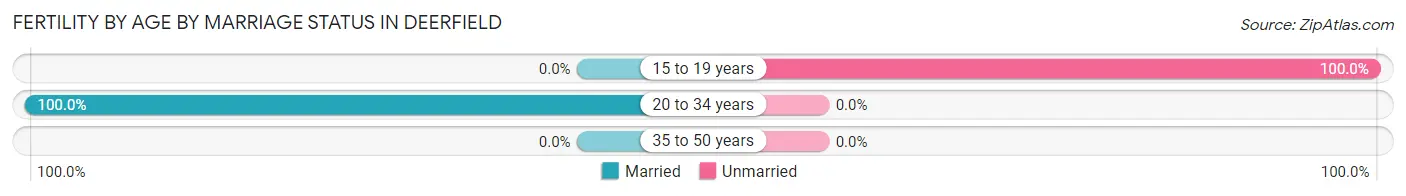
| Age Bracket | Married | Unmarried |
| 15 to 19 years | 0 (0.0%) | 3 (100.0%) |
| 20 to 34 years | 51 (100.0%) | 0 (0.0%) |
| 35 to 50 years | 0 (0.0%) | 0 (0.0%) |
| Total | 51 (94.4%) | 3 (5.6%) |
Fertility by Education in Deerfield
Average fertility rate in Deerfield is 109.0 births per 1,000 women. Women with the education attainment of high school diploma have the highest fertility rate of 120.0 births per 1,000 women, while women with the education attainment of less than high school have the lowest fertility at 73.0 births per 1,000 women. Women with the education attainment of college or associate's degree represent 35.2% of all women with births.
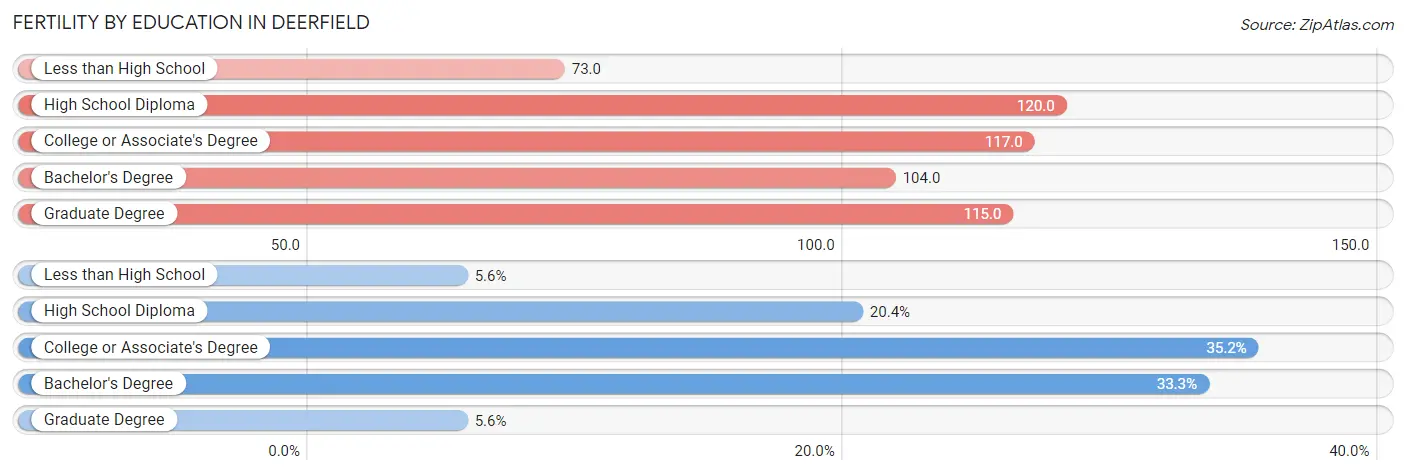
| Educational Attainment | Women with Births | Births / 1,000 Women |
| Less than High School | 3 (5.6%) | 73.0 |
| High School Diploma | 11 (20.4%) | 120.0 |
| College or Associate's Degree | 19 (35.2%) | 117.0 |
| Bachelor's Degree | 18 (33.3%) | 104.0 |
| Graduate Degree | 3 (5.6%) | 115.0 |
| Total | 54 (100.0%) | 109.0 |
Fertility by Education by Marriage Status in Deerfield
5.6% of women with births in Deerfield are unmarried. Women with the educational attainment of high school diploma are most likely to be married with 100.0% of them married at childbirth, while women with the educational attainment of less than high school are least likely to be married with 100.0% of them unmarried at childbirth.
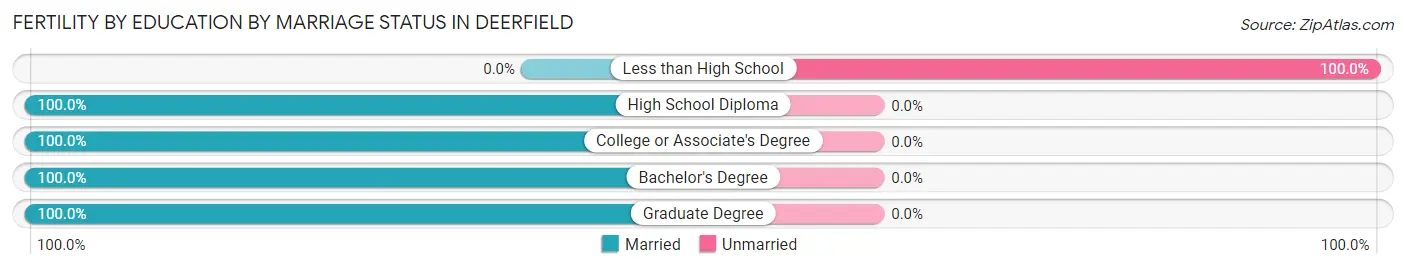
| Educational Attainment | Married | Unmarried |
| Less than High School | 0 (0.0%) | 3 (100.0%) |
| High School Diploma | 11 (100.0%) | 0 (0.0%) |
| College or Associate's Degree | 19 (100.0%) | 0 (0.0%) |
| Bachelor's Degree | 18 (100.0%) | 0 (0.0%) |
| Graduate Degree | 3 (100.0%) | 0 (0.0%) |
| Total | 51 (94.4%) | 3 (5.6%) |
Employment Characteristics in Deerfield
Employment by Class of Employer in Deerfield
Among the 1,196 employed individuals in Deerfield, private company employees (893 | 74.7%), not-for-profit organizations (82 | 6.9%), and state government employees (82 | 6.9%) make up the most common classes of employment.
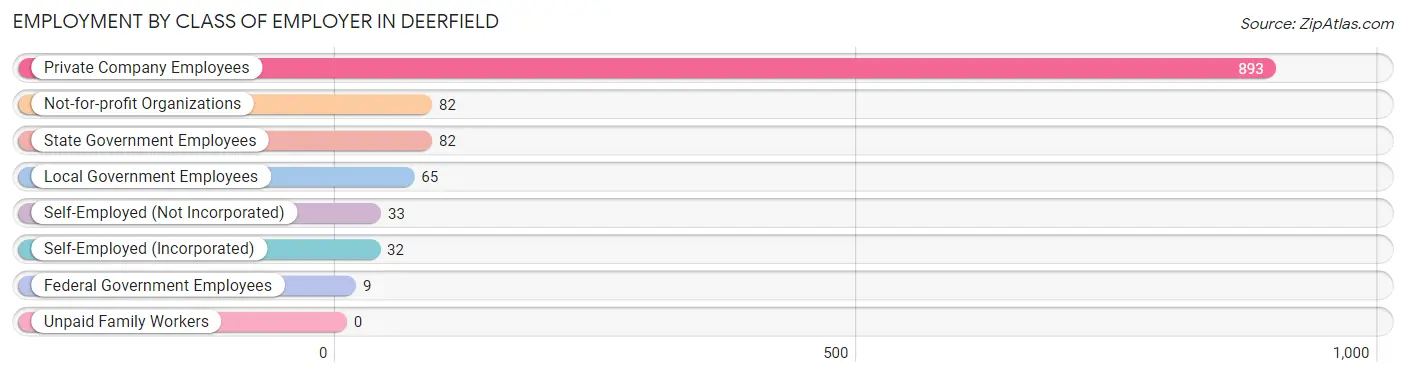
| Employer Class | # Employees | % Employees |
| Private Company Employees | 893 | 74.7% |
| Self-Employed (Incorporated) | 32 | 2.7% |
| Self-Employed (Not Incorporated) | 33 | 2.8% |
| Not-for-profit Organizations | 82 | 6.9% |
| Local Government Employees | 65 | 5.4% |
| State Government Employees | 82 | 6.9% |
| Federal Government Employees | 9 | 0.7% |
| Unpaid Family Workers | 0 | 0.0% |
| Total | 1,196 | 100.0% |
Employment Status by Age in Deerfield
According to the labor force statistics for Deerfield, out of the total population over 16 years of age (1,544), 79.4% or 1,226 individuals are in the labor force, with 2.2% or 27 of them unemployed. The age group with the highest labor force participation rate is 20 to 24 years, with 100.0% or 102 individuals in the labor force. Within the labor force, the 16 to 19 years age range has the highest percentage of unemployed individuals, with 19.5% or 8 of them being unemployed.
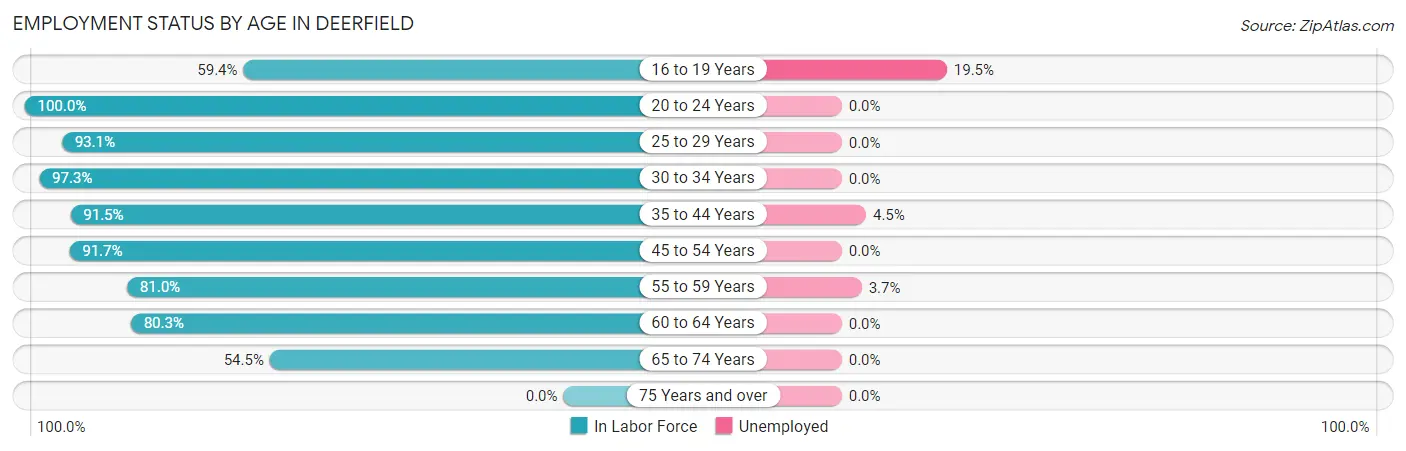
| Age Bracket | In Labor Force | Unemployed |
| 16 to 19 Years | 41 (59.4%) | 8 (19.5%) |
| 20 to 24 Years | 102 (100.0%) | 0 (0.0%) |
| 25 to 29 Years | 149 (93.1%) | 0 (0.0%) |
| 30 to 34 Years | 146 (97.3%) | 0 (0.0%) |
| 35 to 44 Years | 356 (91.5%) | 16 (4.5%) |
| 45 to 54 Years | 176 (91.7%) | 0 (0.0%) |
| 55 to 59 Years | 81 (81.0%) | 3 (3.7%) |
| 60 to 64 Years | 102 (80.3%) | 0 (0.0%) |
| 65 to 74 Years | 73 (54.5%) | 0 (0.0%) |
| 75 Years and over | 0 (0.0%) | 0 (0.0%) |
| Total | 1,226 (79.4%) | 27 (2.2%) |
Employment Status by Educational Attainment in Deerfield
According to labor force statistics for Deerfield, 90.3% of individuals (1,010) out of the total population between 25 and 64 years of age (1,118) are in the labor force, with 1.9% or 19 of them being unemployed. The group with the highest labor force participation rate are those with the educational attainment of bachelor's degree or higher, with 94.5% or 460 individuals in the labor force. Within the labor force, individuals with high school diploma education have the highest percentage of unemployment, with 5.8% or 11 of them being unemployed.
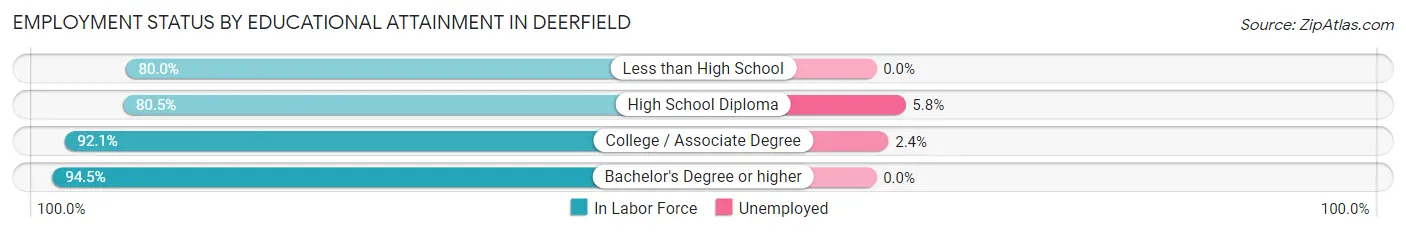
| Educational Attainment | In Labor Force | Unemployed |
| Less than High School | 24 (80.0%) | 0 (0.0%) |
| High School Diploma | 190 (80.5%) | 14 (5.8%) |
| College / Associate Degree | 336 (92.1%) | 9 (2.4%) |
| Bachelor's Degree or higher | 460 (94.5%) | 0 (0.0%) |
| Total | 1,010 (90.3%) | 21 (1.9%) |
Employment Occupations by Sex in Deerfield
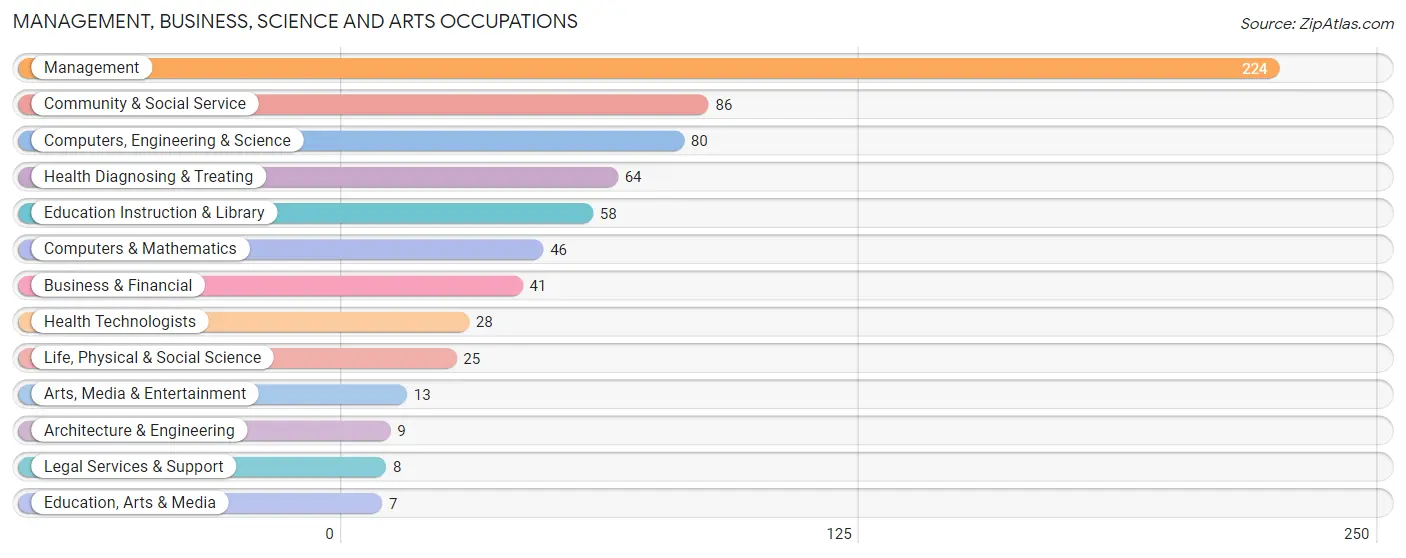
Management, Business, Science and Arts Occupations
The most common Management, Business, Science and Arts occupations in Deerfield are Management (224 | 18.8%), Community & Social Service (86 | 7.2%), Computers, Engineering & Science (80 | 6.7%), Health Diagnosing & Treating (64 | 5.4%), and Education Instruction & Library (58 | 4.9%).
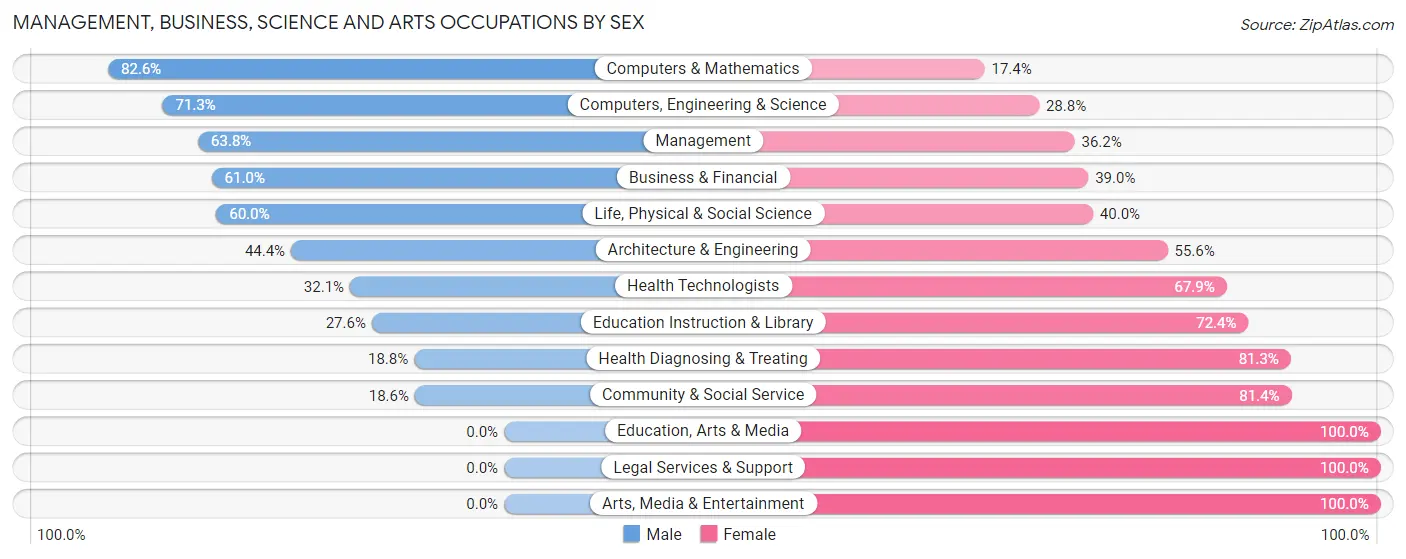
Management, Business, Science and Arts Occupations by Sex
Within the Management, Business, Science and Arts occupations in Deerfield, the most male-oriented occupations are Computers & Mathematics (82.6%), Computers, Engineering & Science (71.3%), and Management (63.8%), while the most female-oriented occupations are Education, Arts & Media (100.0%), Legal Services & Support (100.0%), and Arts, Media & Entertainment (100.0%).
| Occupation | Male | Female |
| Management | 143 (63.8%) | 81 (36.2%) |
| Business & Financial | 25 (61.0%) | 16 (39.0%) |
| Computers, Engineering & Science | 57 (71.3%) | 23 (28.7%) |
| Computers & Mathematics | 38 (82.6%) | 8 (17.4%) |
| Architecture & Engineering | 4 (44.4%) | 5 (55.6%) |
| Life, Physical & Social Science | 15 (60.0%) | 10 (40.0%) |
| Community & Social Service | 16 (18.6%) | 70 (81.4%) |
| Education, Arts & Media | 0 (0.0%) | 7 (100.0%) |
| Legal Services & Support | 0 (0.0%) | 8 (100.0%) |
| Education Instruction & Library | 16 (27.6%) | 42 (72.4%) |
| Arts, Media & Entertainment | 0 (0.0%) | 13 (100.0%) |
| Health Diagnosing & Treating | 12 (18.8%) | 52 (81.2%) |
| Health Technologists | 9 (32.1%) | 19 (67.9%) |
| Total (Category) | 253 (51.1%) | 242 (48.9%) |
| Total (Overall) | 644 (53.9%) | 550 (46.1%) |
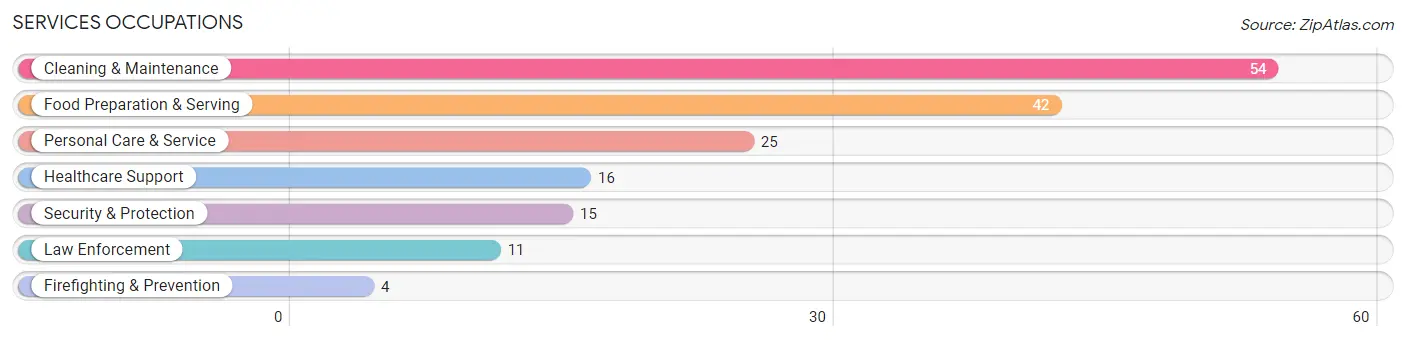
Services Occupations
The most common Services occupations in Deerfield are Cleaning & Maintenance (54 | 4.5%), Food Preparation & Serving (42 | 3.5%), Personal Care & Service (25 | 2.1%), Healthcare Support (16 | 1.3%), and Security & Protection (15 | 1.3%).
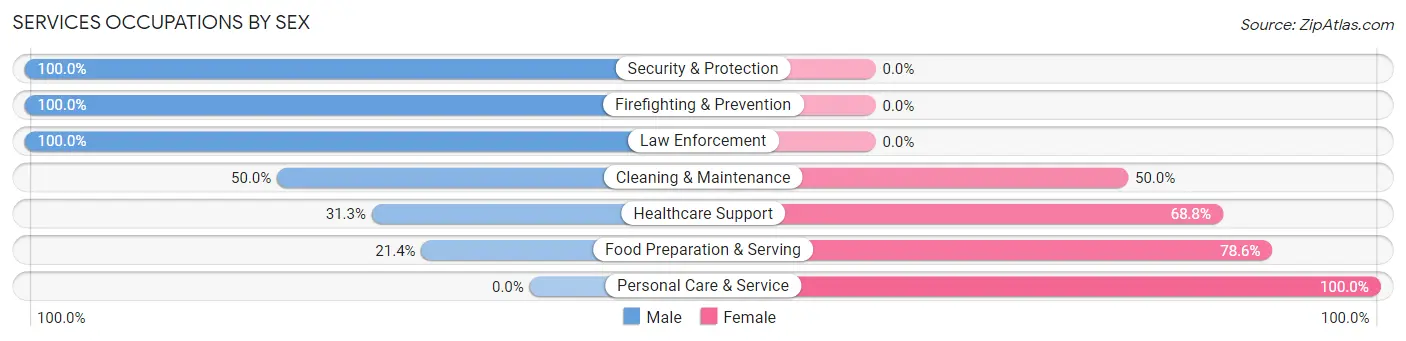
Services Occupations by Sex
Within the Services occupations in Deerfield, the most male-oriented occupations are Security & Protection (100.0%), Firefighting & Prevention (100.0%), and Law Enforcement (100.0%), while the most female-oriented occupations are Personal Care & Service (100.0%), Food Preparation & Serving (78.6%), and Healthcare Support (68.8%).
| Occupation | Male | Female |
| Healthcare Support | 5 (31.2%) | 11 (68.8%) |
| Security & Protection | 15 (100.0%) | 0 (0.0%) |
| Firefighting & Prevention | 4 (100.0%) | 0 (0.0%) |
| Law Enforcement | 11 (100.0%) | 0 (0.0%) |
| Food Preparation & Serving | 9 (21.4%) | 33 (78.6%) |
| Cleaning & Maintenance | 27 (50.0%) | 27 (50.0%) |
| Personal Care & Service | 0 (0.0%) | 25 (100.0%) |
| Total (Category) | 56 (36.8%) | 96 (63.2%) |
| Total (Overall) | 644 (53.9%) | 550 (46.1%) |
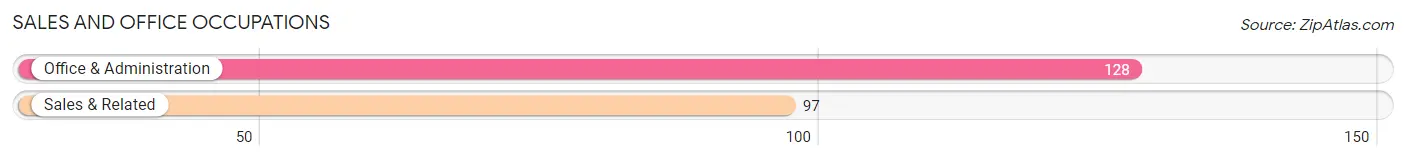
Sales and Office Occupations
The most common Sales and Office occupations in Deerfield are Office & Administration (128 | 10.7%), and Sales & Related (97 | 8.1%).
Sales and Office Occupations by Sex
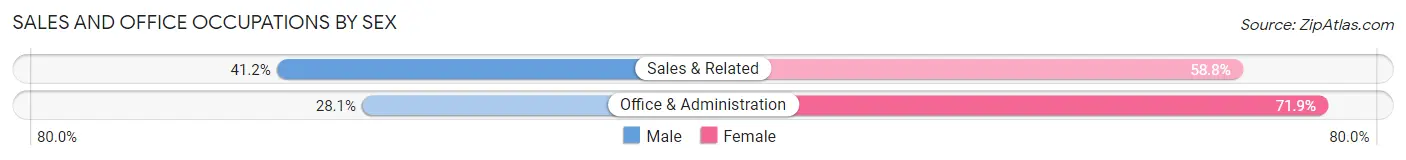
| Occupation | Male | Female |
| Sales & Related | 40 (41.2%) | 57 (58.8%) |
| Office & Administration | 36 (28.1%) | 92 (71.9%) |
| Total (Category) | 76 (33.8%) | 149 (66.2%) |
| Total (Overall) | 644 (53.9%) | 550 (46.1%) |
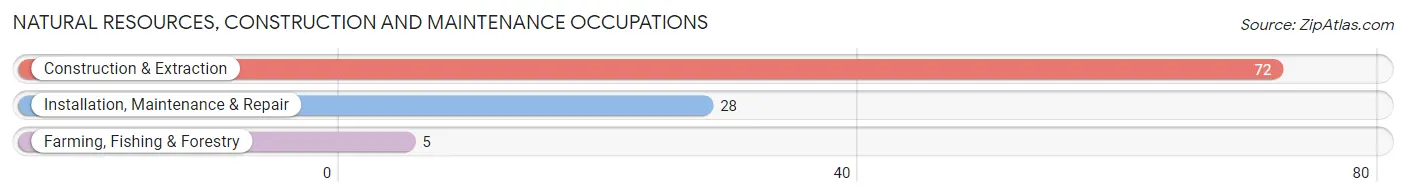
Natural Resources, Construction and Maintenance Occupations
The most common Natural Resources, Construction and Maintenance occupations in Deerfield are Construction & Extraction (72 | 6.0%), Installation, Maintenance & Repair (28 | 2.4%), and Farming, Fishing & Forestry (5 | 0.4%).
Natural Resources, Construction and Maintenance Occupations by Sex
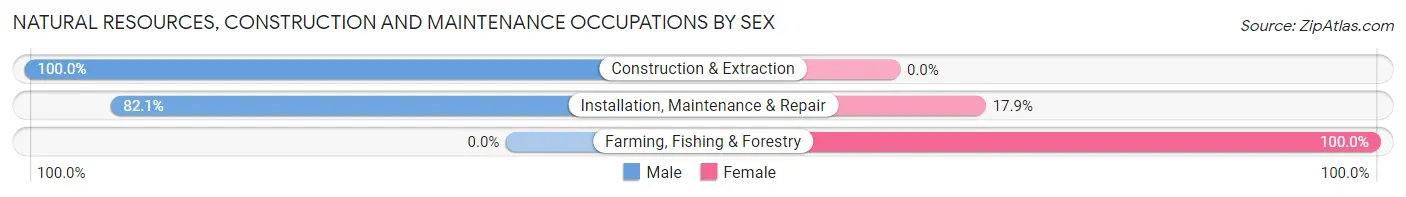
| Occupation | Male | Female |
| Farming, Fishing & Forestry | 0 (0.0%) | 5 (100.0%) |
| Construction & Extraction | 72 (100.0%) | 0 (0.0%) |
| Installation, Maintenance & Repair | 23 (82.1%) | 5 (17.9%) |
| Total (Category) | 95 (90.5%) | 10 (9.5%) |
| Total (Overall) | 644 (53.9%) | 550 (46.1%) |
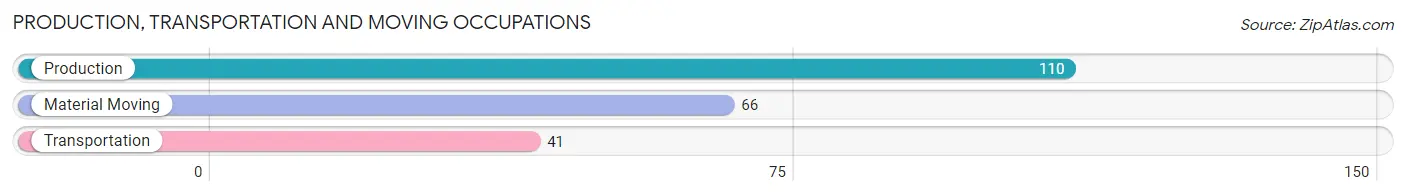
Production, Transportation and Moving Occupations
The most common Production, Transportation and Moving occupations in Deerfield are Production (110 | 9.2%), Material Moving (66 | 5.5%), and Transportation (41 | 3.4%).
Production, Transportation and Moving Occupations by Sex
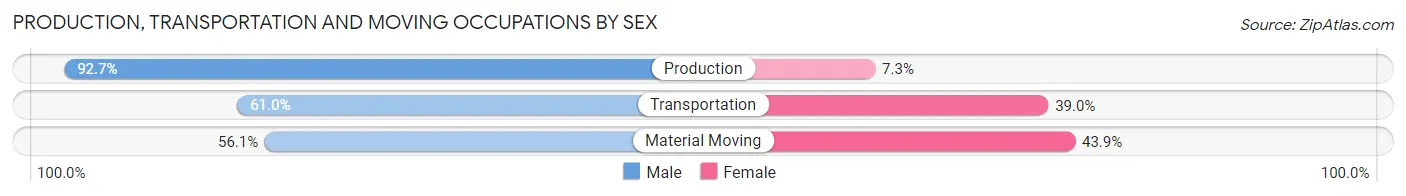
| Occupation | Male | Female |
| Production | 102 (92.7%) | 8 (7.3%) |
| Transportation | 25 (61.0%) | 16 (39.0%) |
| Material Moving | 37 (56.1%) | 29 (43.9%) |
| Total (Category) | 164 (75.6%) | 53 (24.4%) |
| Total (Overall) | 644 (53.9%) | 550 (46.1%) |
Employment Industries by Sex in Deerfield
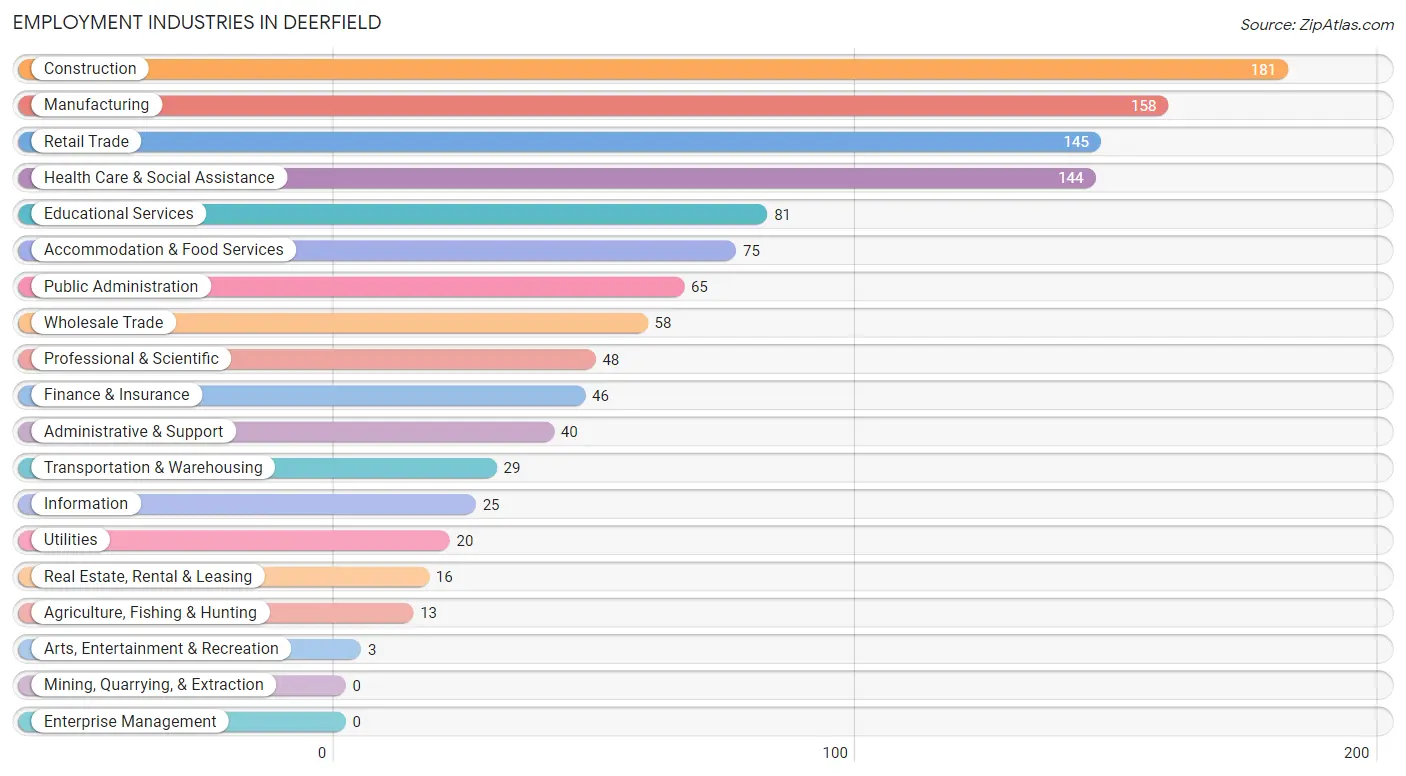
Employment Industries in Deerfield
The major employment industries in Deerfield include Construction (181 | 15.2%), Manufacturing (158 | 13.2%), Retail Trade (145 | 12.1%), Health Care & Social Assistance (144 | 12.1%), and Educational Services (81 | 6.8%).
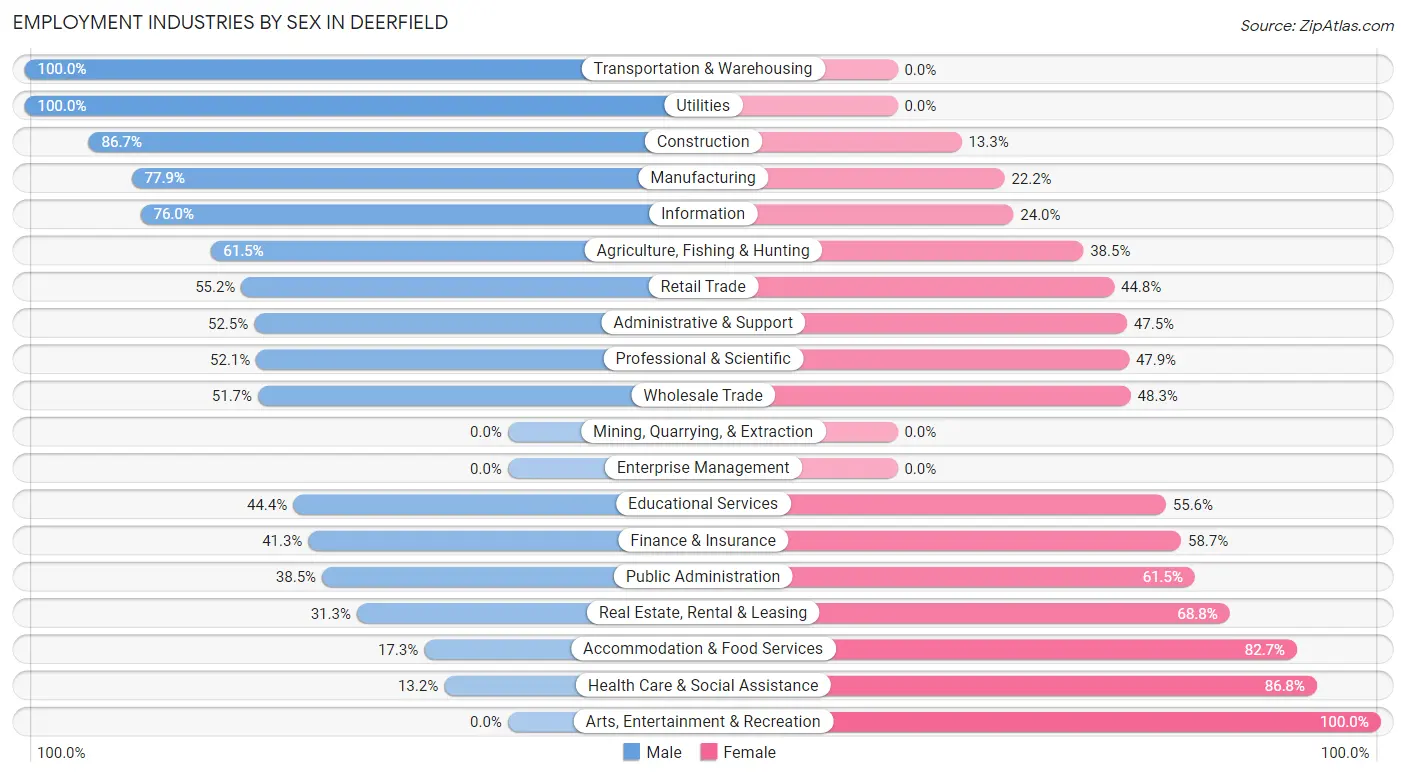
Employment Industries by Sex in Deerfield
The Deerfield industries that see more men than women are Transportation & Warehousing (100.0%), Utilities (100.0%), and Construction (86.7%), whereas the industries that tend to have a higher number of women are Arts, Entertainment & Recreation (100.0%), Health Care & Social Assistance (86.8%), and Accommodation & Food Services (82.7%).
| Industry | Male | Female |
| Agriculture, Fishing & Hunting | 8 (61.5%) | 5 (38.5%) |
| Mining, Quarrying, & Extraction | 0 (0.0%) | 0 (0.0%) |
| Construction | 157 (86.7%) | 24 (13.3%) |
| Manufacturing | 123 (77.8%) | 35 (22.2%) |
| Wholesale Trade | 30 (51.7%) | 28 (48.3%) |
| Retail Trade | 80 (55.2%) | 65 (44.8%) |
| Transportation & Warehousing | 29 (100.0%) | 0 (0.0%) |
| Utilities | 20 (100.0%) | 0 (0.0%) |
| Information | 19 (76.0%) | 6 (24.0%) |
| Finance & Insurance | 19 (41.3%) | 27 (58.7%) |
| Real Estate, Rental & Leasing | 5 (31.2%) | 11 (68.8%) |
| Professional & Scientific | 25 (52.1%) | 23 (47.9%) |
| Enterprise Management | 0 (0.0%) | 0 (0.0%) |
| Administrative & Support | 21 (52.5%) | 19 (47.5%) |
| Educational Services | 36 (44.4%) | 45 (55.6%) |
| Health Care & Social Assistance | 19 (13.2%) | 125 (86.8%) |
| Arts, Entertainment & Recreation | 0 (0.0%) | 3 (100.0%) |
| Accommodation & Food Services | 13 (17.3%) | 62 (82.7%) |
| Public Administration | 25 (38.5%) | 40 (61.5%) |
| Total | 644 (53.9%) | 550 (46.1%) |
Education in Deerfield
School Enrollment in Deerfield
The most common levels of schooling among the 522 students in Deerfield are middle school (183 | 35.1%), elementary school (108 | 20.7%), and high school (101 | 19.4%).
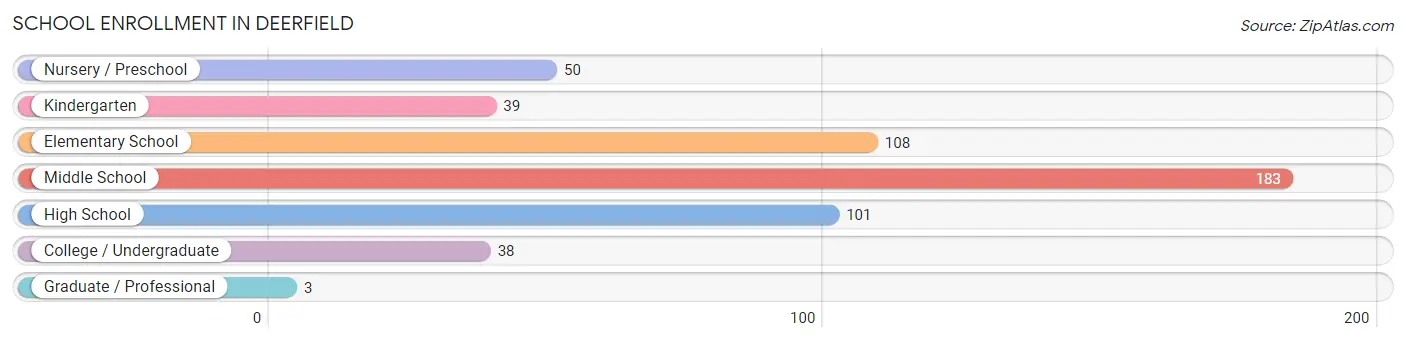
| School Level | # Students | % Students |
| Nursery / Preschool | 50 | 9.6% |
| Kindergarten | 39 | 7.5% |
| Elementary School | 108 | 20.7% |
| Middle School | 183 | 35.1% |
| High School | 101 | 19.4% |
| College / Undergraduate | 38 | 7.3% |
| Graduate / Professional | 3 | 0.6% |
| Total | 522 | 100.0% |
School Enrollment by Age by Funding Source in Deerfield
Out of a total of 522 students who are enrolled in schools in Deerfield, 12 (2.3%) attend a private institution, while the remaining 510 (97.7%) are enrolled in public schools. The age group of 18 to 19 year olds has the highest likelihood of being enrolled in private schools, with 8 (44.4% in the age bracket) enrolled. Conversely, the age group of 5 to 9 year old has the lowest likelihood of being enrolled in a private school, with 131 (100.0% in the age bracket) attending a public institution.
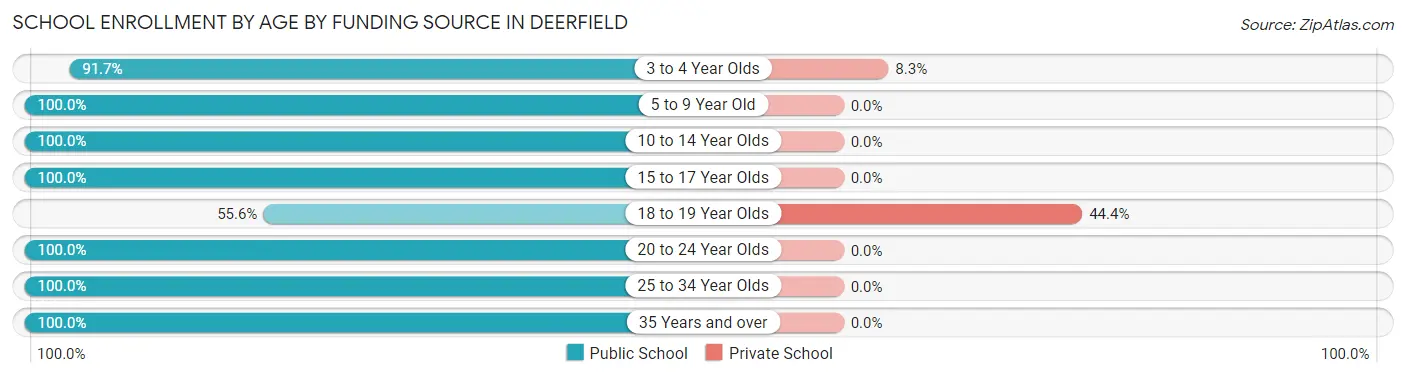
| Age Bracket | Public School | Private School |
| 3 to 4 Year Olds | 44 (91.7%) | 4 (8.3%) |
| 5 to 9 Year Old | 131 (100.0%) | 0 (0.0%) |
| 10 to 14 Year Olds | 220 (100.0%) | 0 (0.0%) |
| 15 to 17 Year Olds | 67 (100.0%) | 0 (0.0%) |
| 18 to 19 Year Olds | 10 (55.6%) | 8 (44.4%) |
| 20 to 24 Year Olds | 23 (100.0%) | 0 (0.0%) |
| 25 to 34 Year Olds | 3 (100.0%) | 0 (0.0%) |
| 35 Years and over | 12 (100.0%) | 0 (0.0%) |
| Total | 510 (97.7%) | 12 (2.3%) |
Educational Attainment by Field of Study in Deerfield
Business (159 | 27.0%), education (69 | 11.7%), bio, nature & agricultural (62 | 10.5%), computers & mathematics (45 | 7.6%), and social sciences (44 | 7.5%) are the most common fields of study among 588 individuals in Deerfield who have obtained a bachelor's degree or higher.
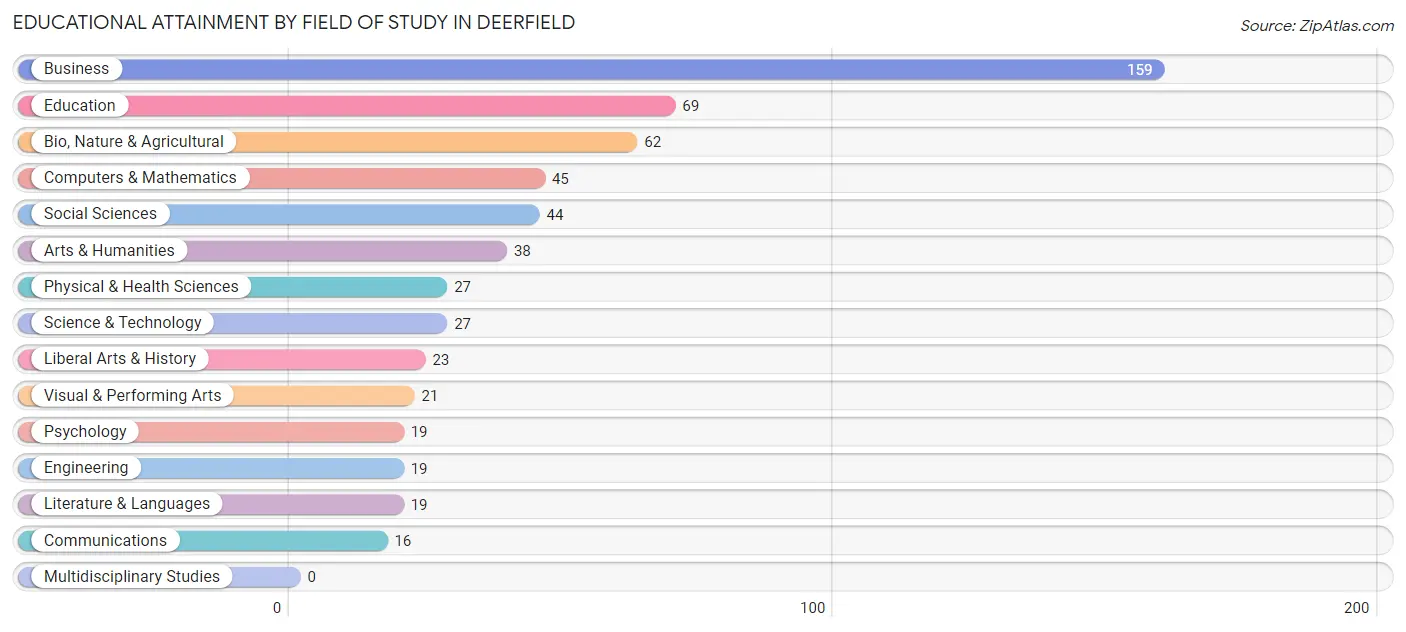
| Field of Study | # Graduates | % Graduates |
| Computers & Mathematics | 45 | 7.6% |
| Bio, Nature & Agricultural | 62 | 10.5% |
| Physical & Health Sciences | 27 | 4.6% |
| Psychology | 19 | 3.2% |
| Social Sciences | 44 | 7.5% |
| Engineering | 19 | 3.2% |
| Multidisciplinary Studies | 0 | 0.0% |
| Science & Technology | 27 | 4.6% |
| Business | 159 | 27.0% |
| Education | 69 | 11.7% |
| Literature & Languages | 19 | 3.2% |
| Liberal Arts & History | 23 | 3.9% |
| Visual & Performing Arts | 21 | 3.6% |
| Communications | 16 | 2.7% |
| Arts & Humanities | 38 | 6.5% |
| Total | 588 | 100.0% |
Transportation & Commute in Deerfield
Vehicle Availability by Sex in Deerfield
The most prevalent vehicle ownership categories in Deerfield are males with 2 vehicles (401, accounting for 61.8%) and females with 2 vehicles (278, making up 73.3%).
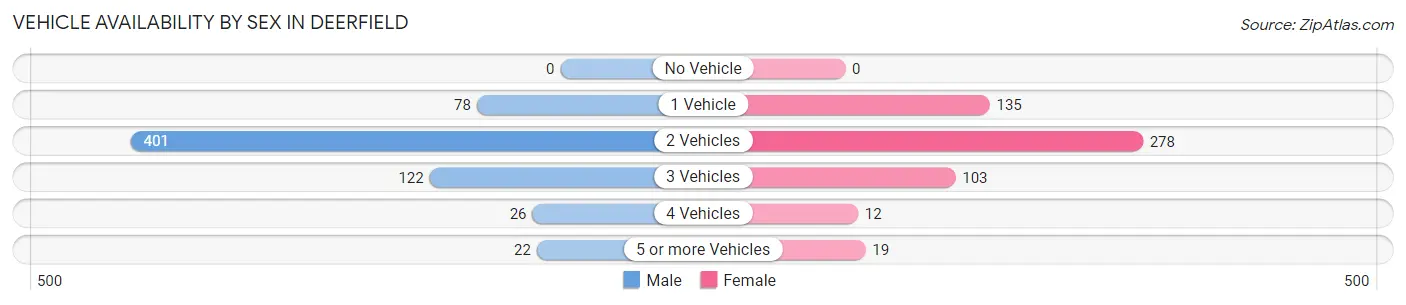
| Vehicles Available | Male | Female |
| No Vehicle | 0 (0.0%) | 0 (0.0%) |
| 1 Vehicle | 78 (12.0%) | 135 (24.7%) |
| 2 Vehicles | 401 (61.8%) | 278 (50.8%) |
| 3 Vehicles | 122 (18.8%) | 103 (18.8%) |
| 4 Vehicles | 26 (4.0%) | 12 (2.2%) |
| 5 or more Vehicles | 22 (3.4%) | 19 (3.5%) |
| Total | 649 (100.0%) | 547 (100.0%) |
Commute Time in Deerfield
The most frequently occuring commute durations in Deerfield are 30 to 34 minutes (262 commuters, 24.2%), 20 to 24 minutes (226 commuters, 20.8%), and 25 to 29 minutes (164 commuters, 15.1%).
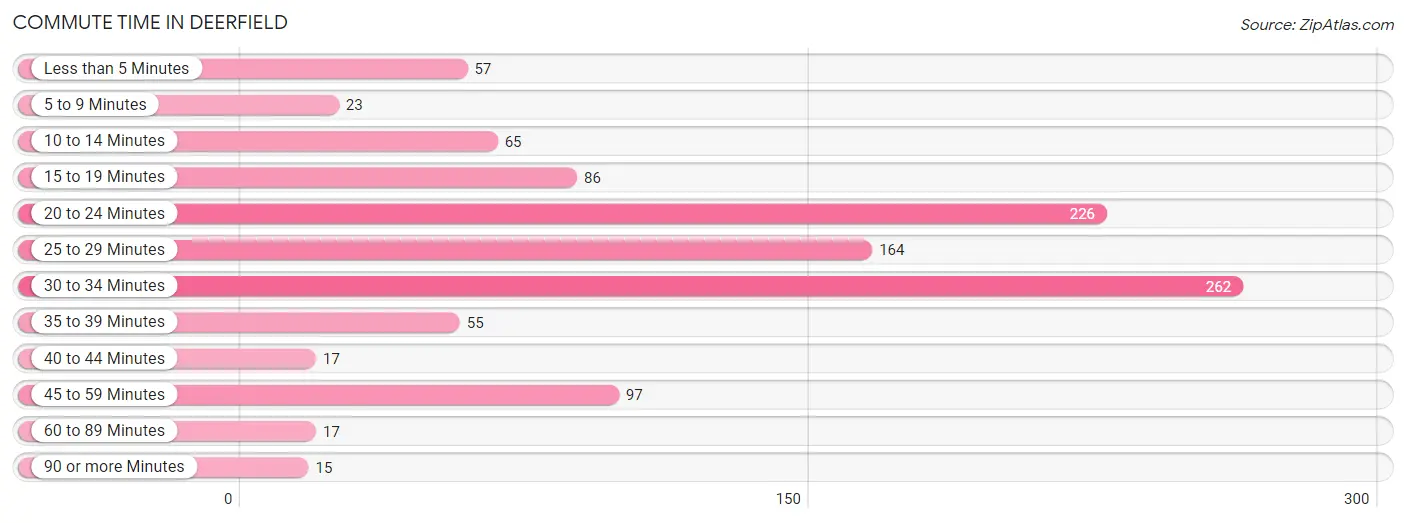
| Commute Time | # Commuters | % Commuters |
| Less than 5 Minutes | 57 | 5.3% |
| 5 to 9 Minutes | 23 | 2.1% |
| 10 to 14 Minutes | 65 | 6.0% |
| 15 to 19 Minutes | 86 | 7.9% |
| 20 to 24 Minutes | 226 | 20.8% |
| 25 to 29 Minutes | 164 | 15.1% |
| 30 to 34 Minutes | 262 | 24.2% |
| 35 to 39 Minutes | 55 | 5.1% |
| 40 to 44 Minutes | 17 | 1.6% |
| 45 to 59 Minutes | 97 | 8.9% |
| 60 to 89 Minutes | 17 | 1.6% |
| 90 or more Minutes | 15 | 1.4% |
Commute Time by Sex in Deerfield
The most common commute times in Deerfield are 30 to 34 minutes (167 commuters, 27.5%) for males and 20 to 24 minutes (126 commuters, 26.5%) for females.
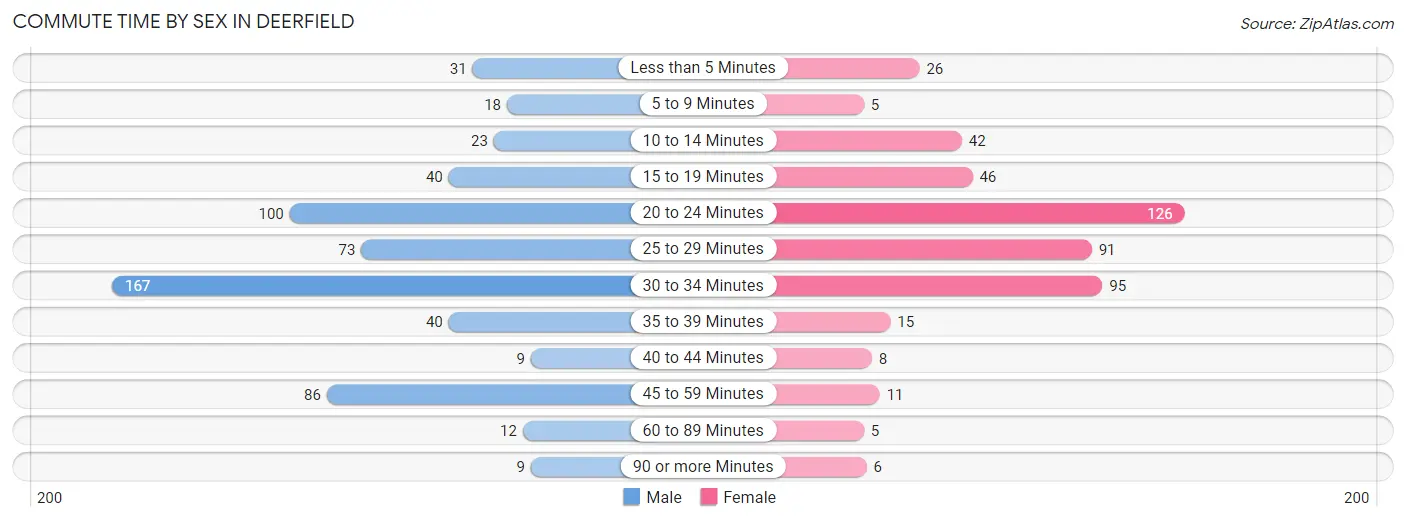
| Commute Time | Male | Female |
| Less than 5 Minutes | 31 (5.1%) | 26 (5.5%) |
| 5 to 9 Minutes | 18 (3.0%) | 5 (1.1%) |
| 10 to 14 Minutes | 23 (3.8%) | 42 (8.8%) |
| 15 to 19 Minutes | 40 (6.6%) | 46 (9.7%) |
| 20 to 24 Minutes | 100 (16.5%) | 126 (26.5%) |
| 25 to 29 Minutes | 73 (12.0%) | 91 (19.1%) |
| 30 to 34 Minutes | 167 (27.5%) | 95 (20.0%) |
| 35 to 39 Minutes | 40 (6.6%) | 15 (3.2%) |
| 40 to 44 Minutes | 9 (1.5%) | 8 (1.7%) |
| 45 to 59 Minutes | 86 (14.1%) | 11 (2.3%) |
| 60 to 89 Minutes | 12 (2.0%) | 5 (1.1%) |
| 90 or more Minutes | 9 (1.5%) | 6 (1.3%) |
Time of Departure to Work by Sex in Deerfield
The most frequent times of departure to work in Deerfield are 8:00 AM to 8:29 AM (97, 16.0%) for males and 7:30 AM to 7:59 AM (94, 19.8%) for females.
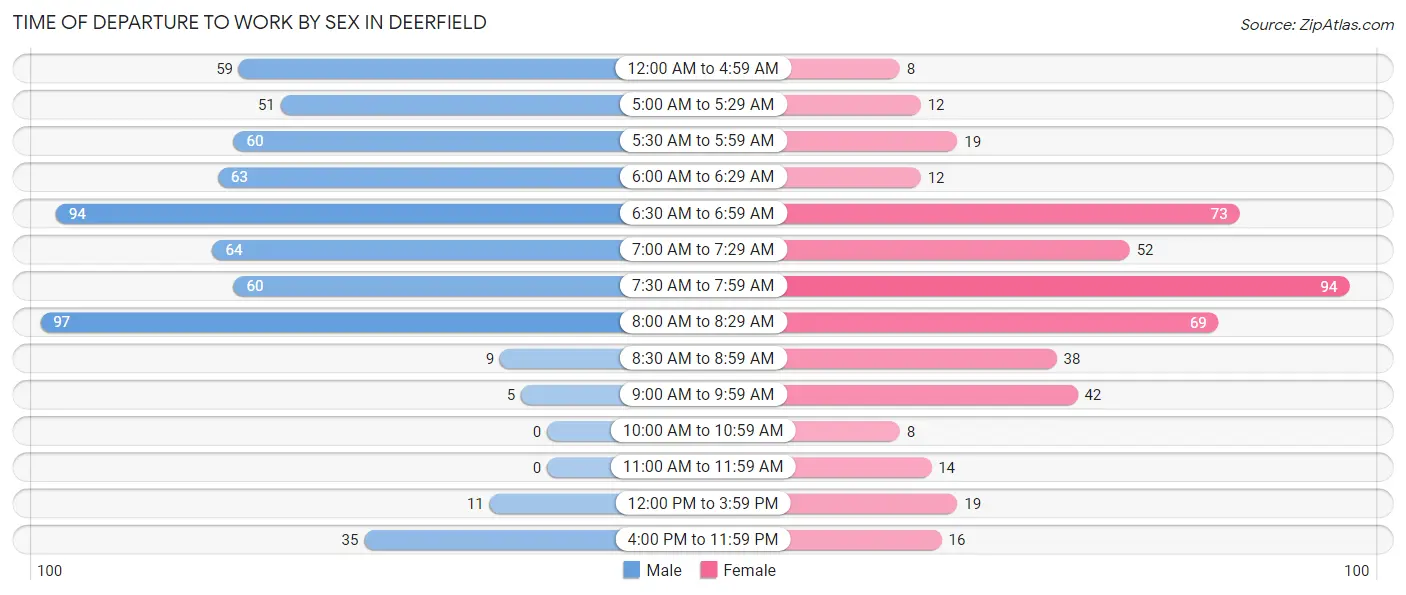
| Time of Departure | Male | Female |
| 12:00 AM to 4:59 AM | 59 (9.7%) | 8 (1.7%) |
| 5:00 AM to 5:29 AM | 51 (8.4%) | 12 (2.5%) |
| 5:30 AM to 5:59 AM | 60 (9.9%) | 19 (4.0%) |
| 6:00 AM to 6:29 AM | 63 (10.4%) | 12 (2.5%) |
| 6:30 AM to 6:59 AM | 94 (15.5%) | 73 (15.3%) |
| 7:00 AM to 7:29 AM | 64 (10.5%) | 52 (10.9%) |
| 7:30 AM to 7:59 AM | 60 (9.9%) | 94 (19.8%) |
| 8:00 AM to 8:29 AM | 97 (16.0%) | 69 (14.5%) |
| 8:30 AM to 8:59 AM | 9 (1.5%) | 38 (8.0%) |
| 9:00 AM to 9:59 AM | 5 (0.8%) | 42 (8.8%) |
| 10:00 AM to 10:59 AM | 0 (0.0%) | 8 (1.7%) |
| 11:00 AM to 11:59 AM | 0 (0.0%) | 14 (2.9%) |
| 12:00 PM to 3:59 PM | 11 (1.8%) | 19 (4.0%) |
| 4:00 PM to 11:59 PM | 35 (5.8%) | 16 (3.4%) |
| Total | 608 (100.0%) | 476 (100.0%) |
Housing Occupancy in Deerfield
Occupancy by Ownership in Deerfield
Of the total 876 dwellings in Deerfield, owner-occupied units account for 679 (77.5%), while renter-occupied units make up 197 (22.5%).
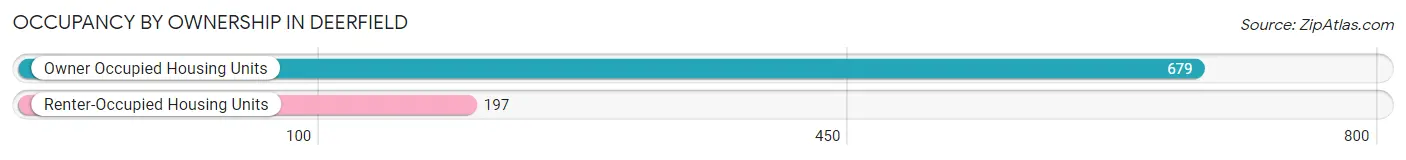
| Occupancy | # Housing Units | % Housing Units |
| Owner Occupied Housing Units | 679 | 77.5% |
| Renter-Occupied Housing Units | 197 | 22.5% |
| Total Occupied Housing Units | 876 | 100.0% |
Occupancy by Household Size in Deerfield
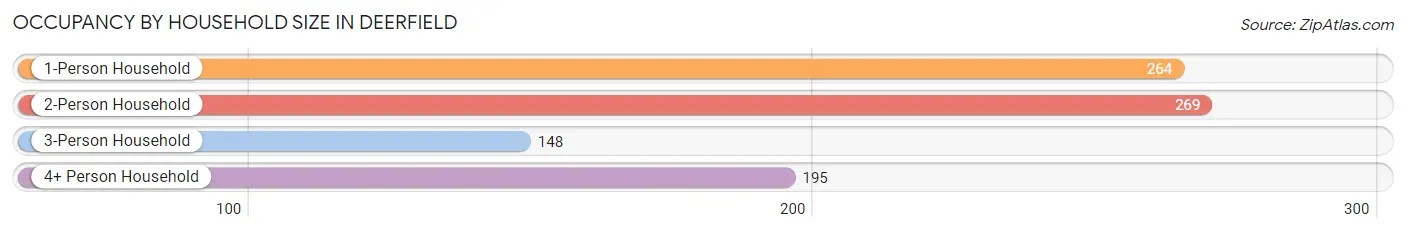
| Household Size | # Housing Units | % Housing Units |
| 1-Person Household | 264 | 30.1% |
| 2-Person Household | 269 | 30.7% |
| 3-Person Household | 148 | 16.9% |
| 4+ Person Household | 195 | 22.3% |
| Total Housing Units | 876 | 100.0% |
Occupancy by Ownership by Household Size in Deerfield
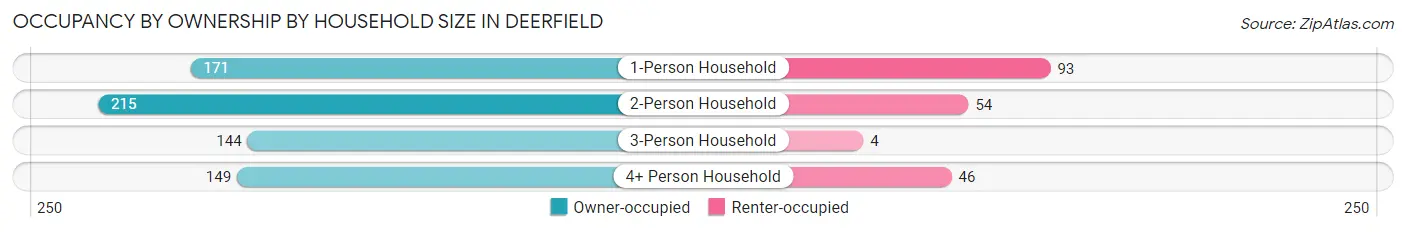
| Household Size | Owner-occupied | Renter-occupied |
| 1-Person Household | 171 (64.8%) | 93 (35.2%) |
| 2-Person Household | 215 (79.9%) | 54 (20.1%) |
| 3-Person Household | 144 (97.3%) | 4 (2.7%) |
| 4+ Person Household | 149 (76.4%) | 46 (23.6%) |
| Total Housing Units | 679 (77.5%) | 197 (22.5%) |
Occupancy by Educational Attainment in Deerfield
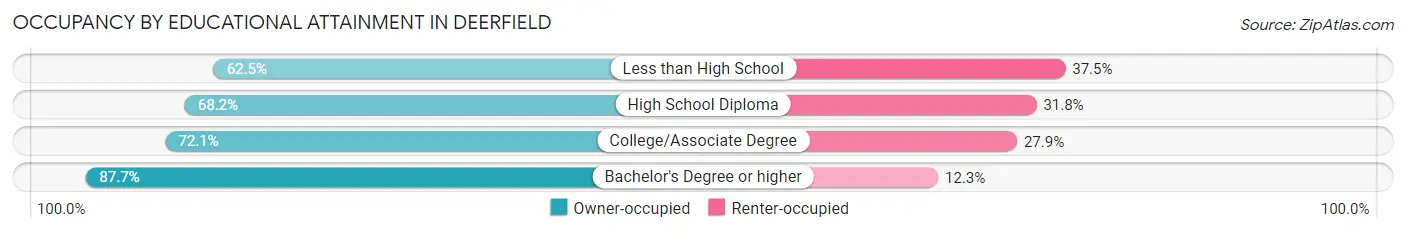
| Household Size | Owner-occupied | Renter-occupied |
| Less than High School | 5 (62.5%) | 3 (37.5%) |
| High School Diploma | 161 (68.2%) | 75 (31.8%) |
| College/Associate Degree | 191 (72.1%) | 74 (27.9%) |
| Bachelor's Degree or higher | 322 (87.7%) | 45 (12.3%) |
Occupancy by Age of Householder in Deerfield
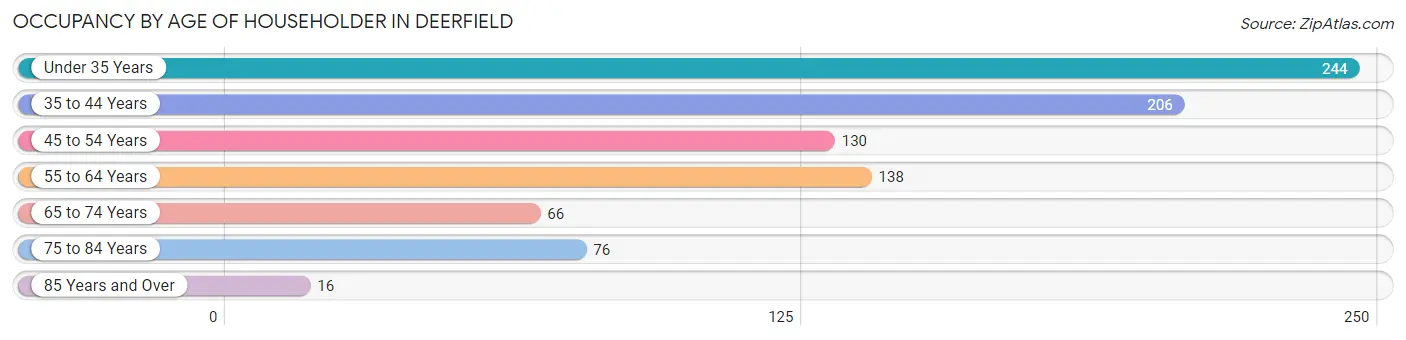
| Age Bracket | # Households | % Households |
| Under 35 Years | 244 | 27.9% |
| 35 to 44 Years | 206 | 23.5% |
| 45 to 54 Years | 130 | 14.8% |
| 55 to 64 Years | 138 | 15.8% |
| 65 to 74 Years | 66 | 7.5% |
| 75 to 84 Years | 76 | 8.7% |
| 85 Years and Over | 16 | 1.8% |
| Total | 876 | 100.0% |
Housing Finances in Deerfield
Median Income by Occupancy in Deerfield
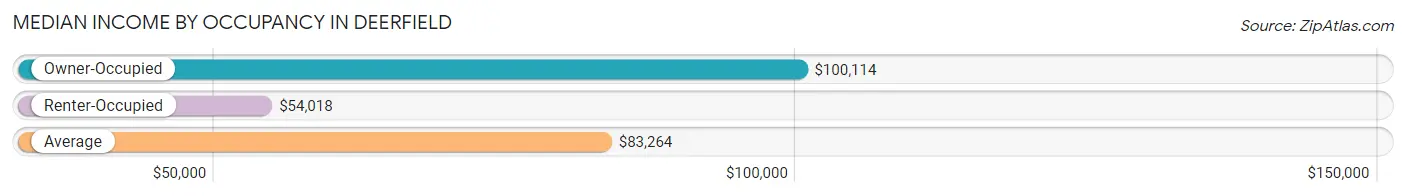
| Occupancy Type | # Households | Median Income |
| Owner-Occupied | 679 (77.5%) | $100,114 |
| Renter-Occupied | 197 (22.5%) | $54,018 |
| Average | 876 (100.0%) | $83,264 |
Occupancy by Householder Income Bracket in Deerfield
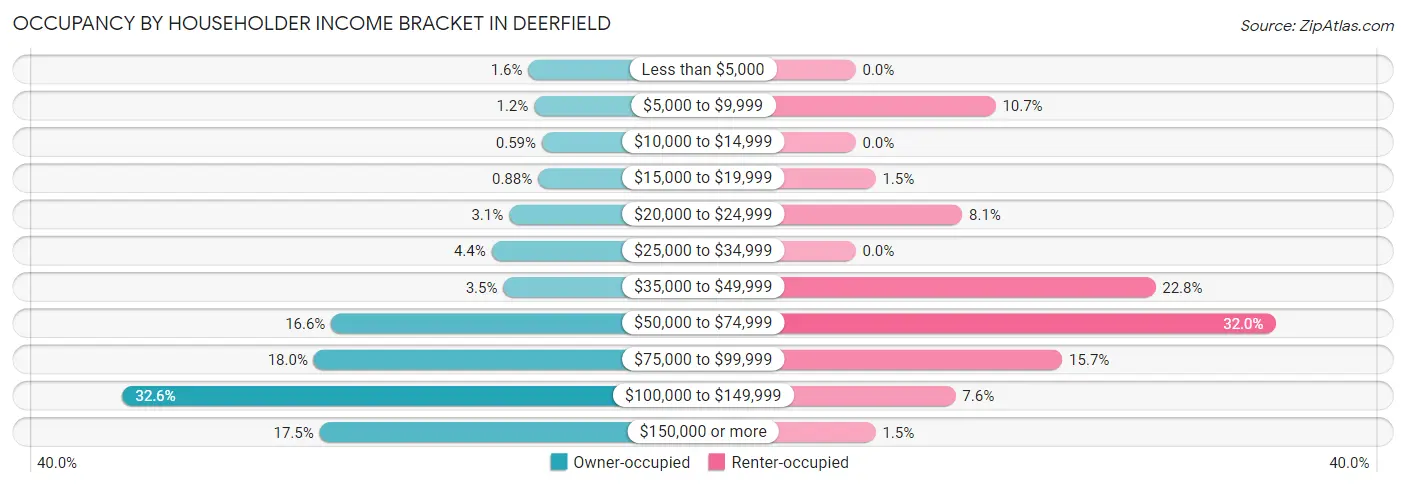
| Income Bracket | Owner-occupied | Renter-occupied |
| Less than $5,000 | 11 (1.6%) | 0 (0.0%) |
| $5,000 to $9,999 | 8 (1.2%) | 21 (10.7%) |
| $10,000 to $14,999 | 4 (0.6%) | 0 (0.0%) |
| $15,000 to $19,999 | 6 (0.9%) | 3 (1.5%) |
| $20,000 to $24,999 | 21 (3.1%) | 16 (8.1%) |
| $25,000 to $34,999 | 30 (4.4%) | 0 (0.0%) |
| $35,000 to $49,999 | 24 (3.5%) | 45 (22.8%) |
| $50,000 to $74,999 | 113 (16.6%) | 63 (32.0%) |
| $75,000 to $99,999 | 122 (18.0%) | 31 (15.7%) |
| $100,000 to $149,999 | 221 (32.6%) | 15 (7.6%) |
| $150,000 or more | 119 (17.5%) | 3 (1.5%) |
| Total | 679 (100.0%) | 197 (100.0%) |
Monthly Housing Cost Tiers in Deerfield
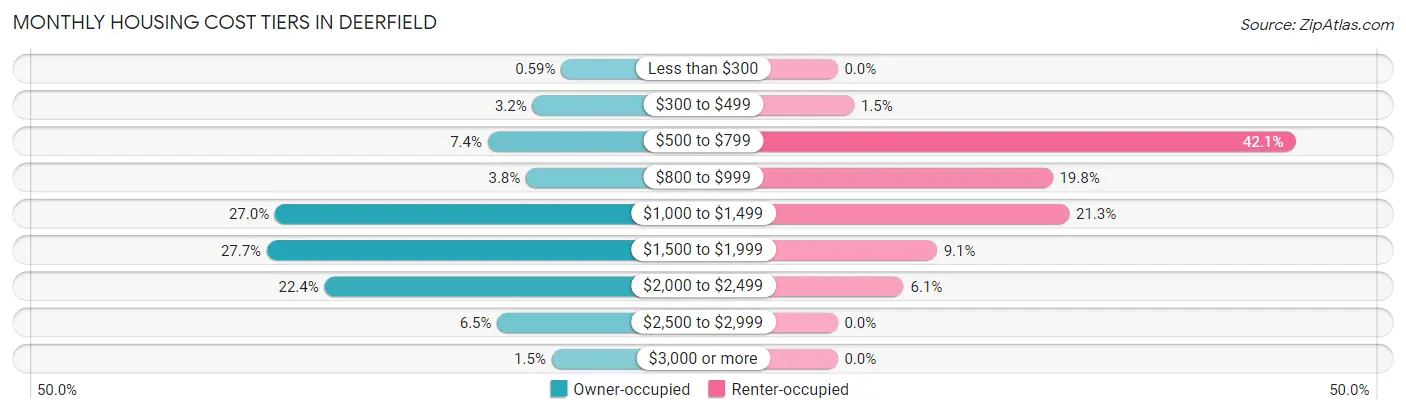
| Monthly Cost | Owner-occupied | Renter-occupied |
| Less than $300 | 4 (0.6%) | 0 (0.0%) |
| $300 to $499 | 22 (3.2%) | 3 (1.5%) |
| $500 to $799 | 50 (7.4%) | 83 (42.1%) |
| $800 to $999 | 26 (3.8%) | 39 (19.8%) |
| $1,000 to $1,499 | 183 (27.0%) | 42 (21.3%) |
| $1,500 to $1,999 | 188 (27.7%) | 18 (9.1%) |
| $2,000 to $2,499 | 152 (22.4%) | 12 (6.1%) |
| $2,500 to $2,999 | 44 (6.5%) | 0 (0.0%) |
| $3,000 or more | 10 (1.5%) | 0 (0.0%) |
| Total | 679 (100.0%) | 197 (100.0%) |
Physical Housing Characteristics in Deerfield
Housing Structures in Deerfield
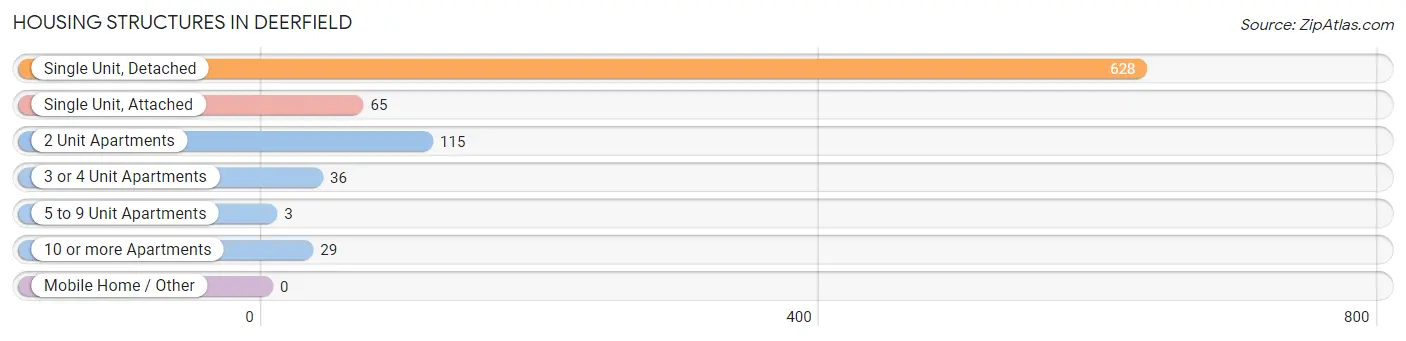
| Structure Type | # Housing Units | % Housing Units |
| Single Unit, Detached | 628 | 71.7% |
| Single Unit, Attached | 65 | 7.4% |
| 2 Unit Apartments | 115 | 13.1% |
| 3 or 4 Unit Apartments | 36 | 4.1% |
| 5 to 9 Unit Apartments | 3 | 0.3% |
| 10 or more Apartments | 29 | 3.3% |
| Mobile Home / Other | 0 | 0.0% |
| Total | 876 | 100.0% |
Housing Structures by Occupancy in Deerfield
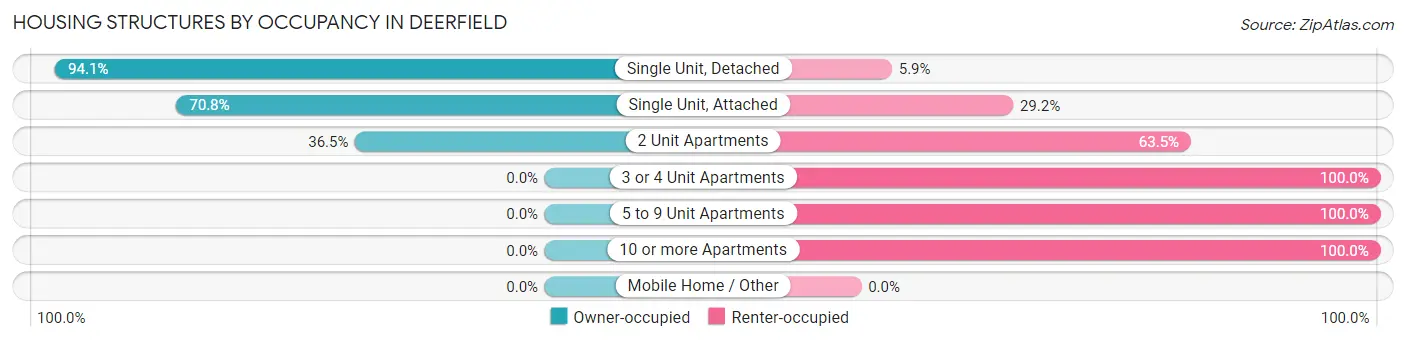
| Structure Type | Owner-occupied | Renter-occupied |
| Single Unit, Detached | 591 (94.1%) | 37 (5.9%) |
| Single Unit, Attached | 46 (70.8%) | 19 (29.2%) |
| 2 Unit Apartments | 42 (36.5%) | 73 (63.5%) |
| 3 or 4 Unit Apartments | 0 (0.0%) | 36 (100.0%) |
| 5 to 9 Unit Apartments | 0 (0.0%) | 3 (100.0%) |
| 10 or more Apartments | 0 (0.0%) | 29 (100.0%) |
| Mobile Home / Other | 0 (0.0%) | 0 (0.0%) |
| Total | 679 (77.5%) | 197 (22.5%) |
Housing Structures by Number of Rooms in Deerfield
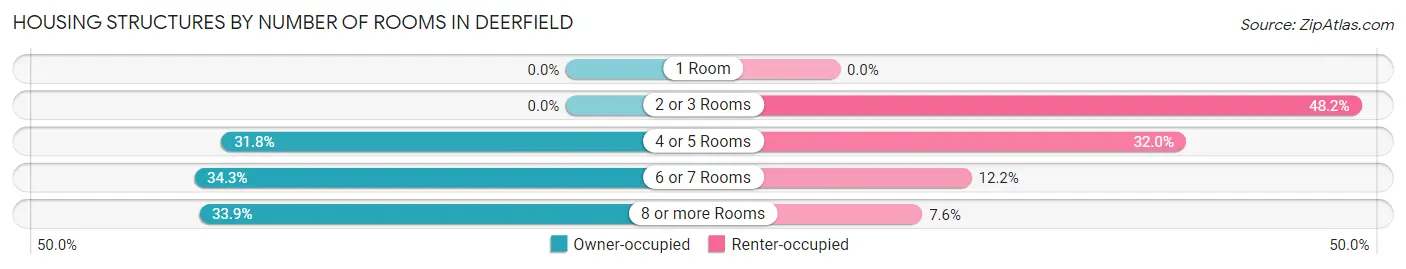
| Number of Rooms | Owner-occupied | Renter-occupied |
| 1 Room | 0 (0.0%) | 0 (0.0%) |
| 2 or 3 Rooms | 0 (0.0%) | 95 (48.2%) |
| 4 or 5 Rooms | 216 (31.8%) | 63 (32.0%) |
| 6 or 7 Rooms | 233 (34.3%) | 24 (12.2%) |
| 8 or more Rooms | 230 (33.9%) | 15 (7.6%) |
| Total | 679 (100.0%) | 197 (100.0%) |
Housing Structure by Heating Type in Deerfield
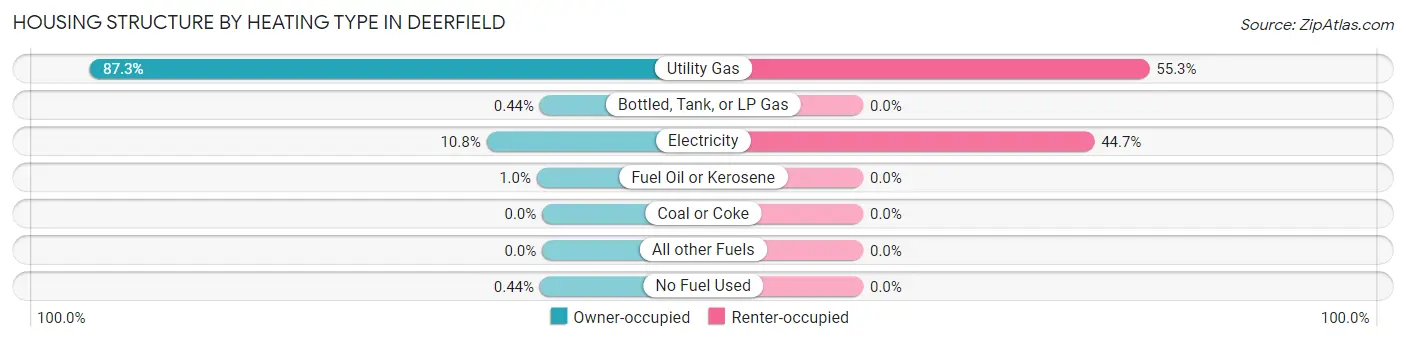
| Heating Type | Owner-occupied | Renter-occupied |
| Utility Gas | 593 (87.3%) | 109 (55.3%) |
| Bottled, Tank, or LP Gas | 3 (0.4%) | 0 (0.0%) |
| Electricity | 73 (10.7%) | 88 (44.7%) |
| Fuel Oil or Kerosene | 7 (1.0%) | 0 (0.0%) |
| Coal or Coke | 0 (0.0%) | 0 (0.0%) |
| All other Fuels | 0 (0.0%) | 0 (0.0%) |
| No Fuel Used | 3 (0.4%) | 0 (0.0%) |
| Total | 679 (100.0%) | 197 (100.0%) |
Household Vehicle Usage in Deerfield
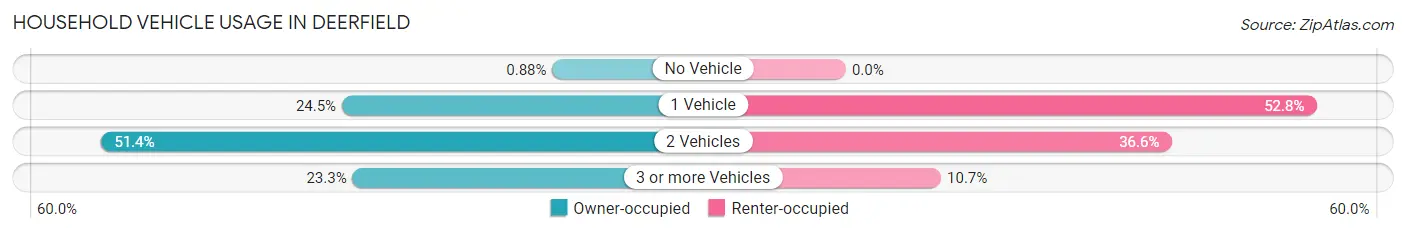
| Vehicles per Household | Owner-occupied | Renter-occupied |
| No Vehicle | 6 (0.9%) | 0 (0.0%) |
| 1 Vehicle | 166 (24.4%) | 104 (52.8%) |
| 2 Vehicles | 349 (51.4%) | 72 (36.5%) |
| 3 or more Vehicles | 158 (23.3%) | 21 (10.7%) |
| Total | 679 (100.0%) | 197 (100.0%) |
Real Estate & Mortgages in Deerfield
Real Estate and Mortgage Overview in Deerfield
| Characteristic | Without Mortgage | With Mortgage |
| Housing Units | 102 | 577 |
| Median Property Value | $252,000 | $288,100 |
| Median Household Income | $88,750 | $100 |
| Monthly Housing Costs | $655 | $10 |
| Real Estate Taxes | $4,138 | $0 |
Property Value by Mortgage Status in Deerfield
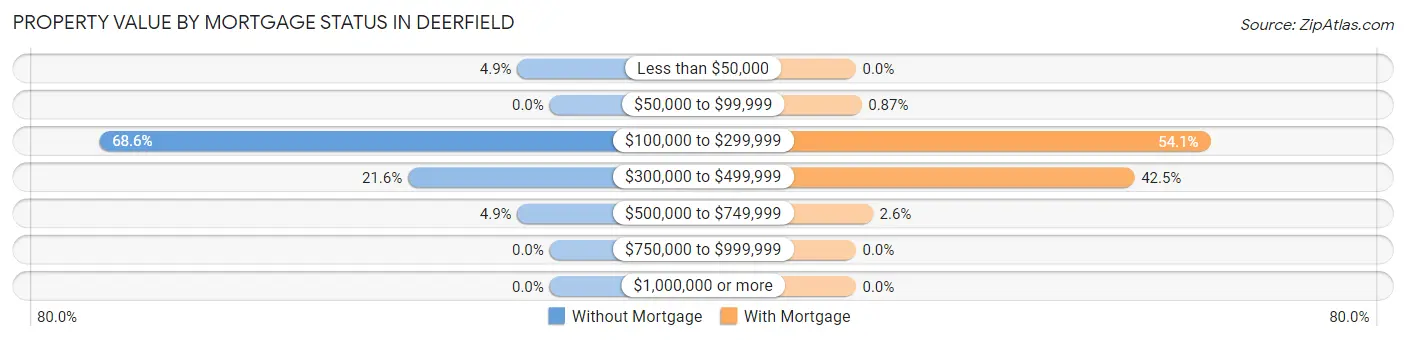
| Property Value | Without Mortgage | With Mortgage |
| Less than $50,000 | 5 (4.9%) | 0 (0.0%) |
| $50,000 to $99,999 | 0 (0.0%) | 5 (0.9%) |
| $100,000 to $299,999 | 70 (68.6%) | 312 (54.1%) |
| $300,000 to $499,999 | 22 (21.6%) | 245 (42.5%) |
| $500,000 to $749,999 | 5 (4.9%) | 15 (2.6%) |
| $750,000 to $999,999 | 0 (0.0%) | 0 (0.0%) |
| $1,000,000 or more | 0 (0.0%) | 0 (0.0%) |
| Total | 102 (100.0%) | 577 (100.0%) |
Household Income by Mortgage Status in Deerfield
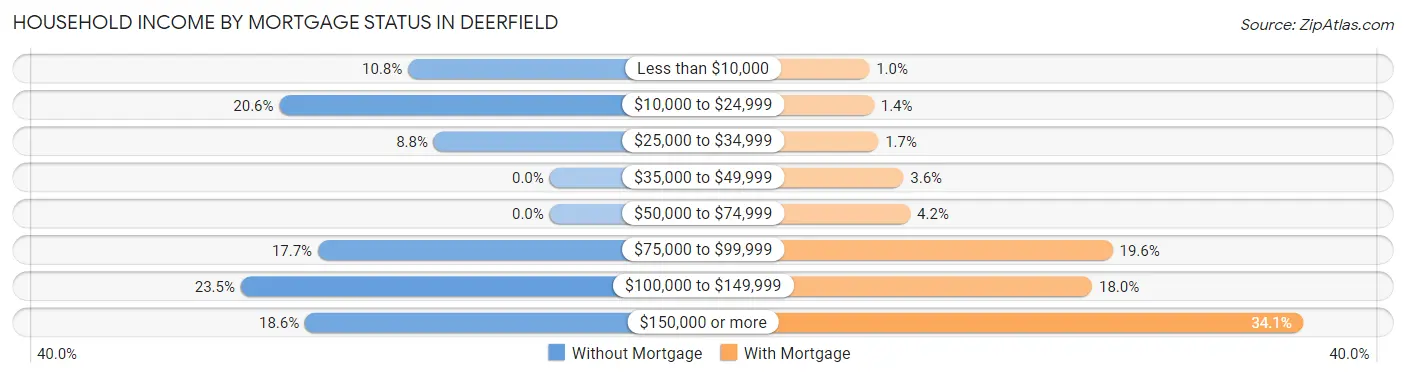
| Household Income | Without Mortgage | With Mortgage |
| Less than $10,000 | 11 (10.8%) | 6 (1.0%) |
| $10,000 to $24,999 | 21 (20.6%) | 8 (1.4%) |
| $25,000 to $34,999 | 9 (8.8%) | 10 (1.7%) |
| $35,000 to $49,999 | 0 (0.0%) | 21 (3.6%) |
| $50,000 to $74,999 | 0 (0.0%) | 24 (4.2%) |
| $75,000 to $99,999 | 18 (17.6%) | 113 (19.6%) |
| $100,000 to $149,999 | 24 (23.5%) | 104 (18.0%) |
| $150,000 or more | 19 (18.6%) | 197 (34.1%) |
| Total | 102 (100.0%) | 577 (100.0%) |
Property Value to Household Income Ratio in Deerfield
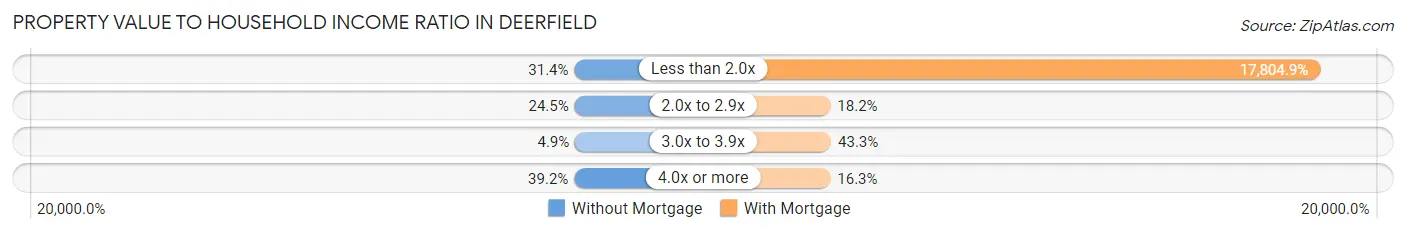
| Value-to-Income Ratio | Without Mortgage | With Mortgage |
| Less than 2.0x | 32 (31.4%) | 102,734 (17,804.8%) |
| 2.0x to 2.9x | 25 (24.5%) | 105 (18.2%) |
| 3.0x to 3.9x | 5 (4.9%) | 250 (43.3%) |
| 4.0x or more | 40 (39.2%) | 94 (16.3%) |
| Total | 102 (100.0%) | 577 (100.0%) |
Real Estate Taxes by Mortgage Status in Deerfield
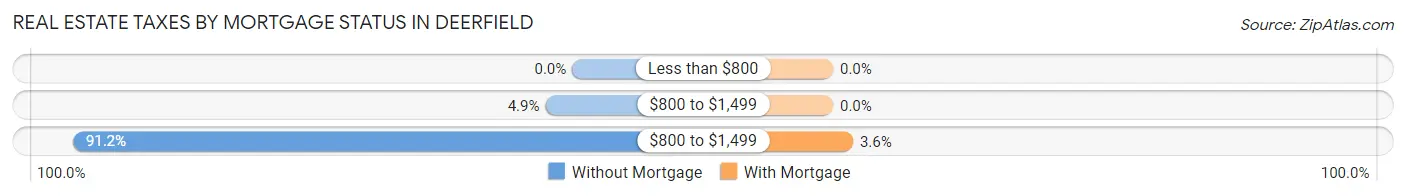
| Property Taxes | Without Mortgage | With Mortgage |
| Less than $800 | 0 (0.0%) | 0 (0.0%) |
| $800 to $1,499 | 5 (4.9%) | 0 (0.0%) |
| $800 to $1,499 | 93 (91.2%) | 21 (3.6%) |
| Total | 102 (100.0%) | 577 (100.0%) |
Health & Disability in Deerfield
Health Insurance Coverage by Age in Deerfield
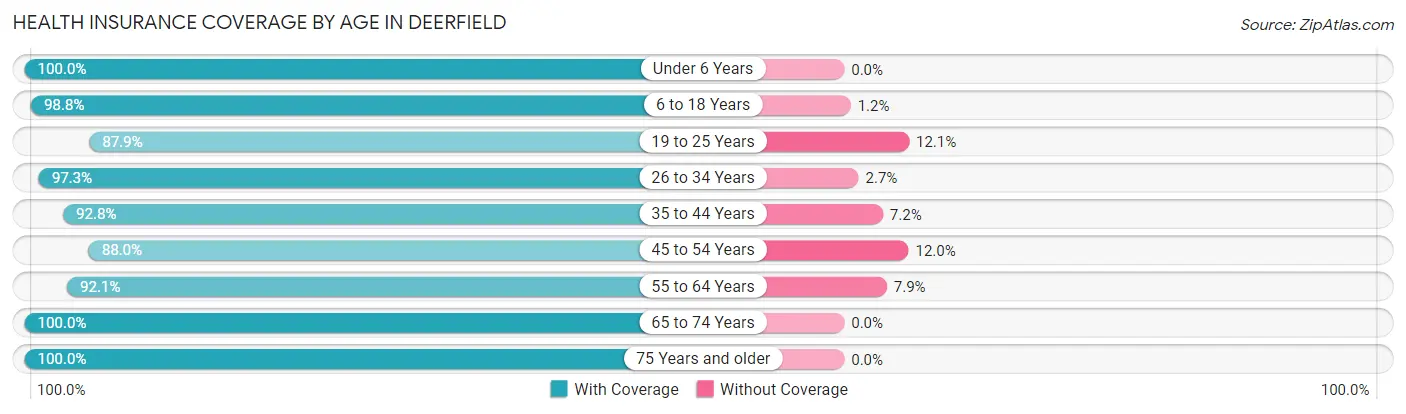
| Age Bracket | With Coverage | Without Coverage |
| Under 6 Years | 305 (100.0%) | 0 (0.0%) |
| 6 to 18 Years | 412 (98.8%) | 5 (1.2%) |
| 19 to 25 Years | 102 (87.9%) | 14 (12.1%) |
| 26 to 34 Years | 293 (97.3%) | 8 (2.7%) |
| 35 to 44 Years | 361 (92.8%) | 28 (7.2%) |
| 45 to 54 Years | 169 (88.0%) | 23 (12.0%) |
| 55 to 64 Years | 209 (92.1%) | 18 (7.9%) |
| 65 to 74 Years | 134 (100.0%) | 0 (0.0%) |
| 75 Years and older | 121 (100.0%) | 0 (0.0%) |
| Total | 2,106 (95.6%) | 96 (4.4%) |
Health Insurance Coverage by Citizenship Status in Deerfield
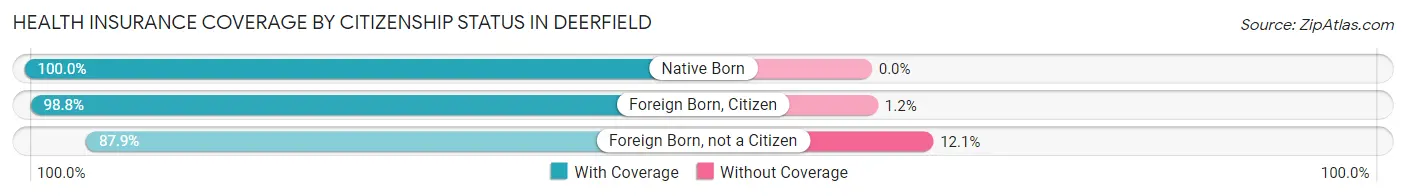
| Citizenship Status | With Coverage | Without Coverage |
| Native Born | 305 (100.0%) | 0 (0.0%) |
| Foreign Born, Citizen | 412 (98.8%) | 5 (1.2%) |
| Foreign Born, not a Citizen | 102 (87.9%) | 14 (12.1%) |
Health Insurance Coverage by Household Income in Deerfield
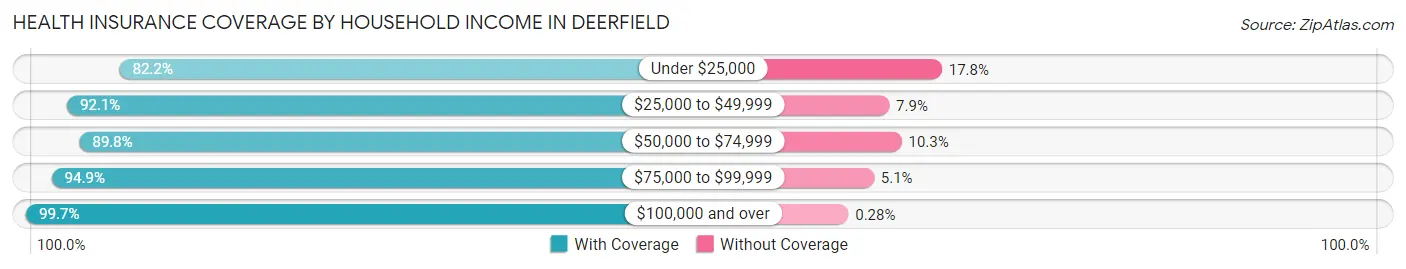
| Household Income | With Coverage | Without Coverage |
| Under $25,000 | 97 (82.2%) | 21 (17.8%) |
| $25,000 to $49,999 | 174 (92.1%) | 15 (7.9%) |
| $50,000 to $74,999 | 254 (89.7%) | 29 (10.2%) |
| $75,000 to $99,999 | 524 (94.9%) | 28 (5.1%) |
| $100,000 and over | 1,057 (99.7%) | 3 (0.3%) |
Public vs Private Health Insurance Coverage by Age in Deerfield
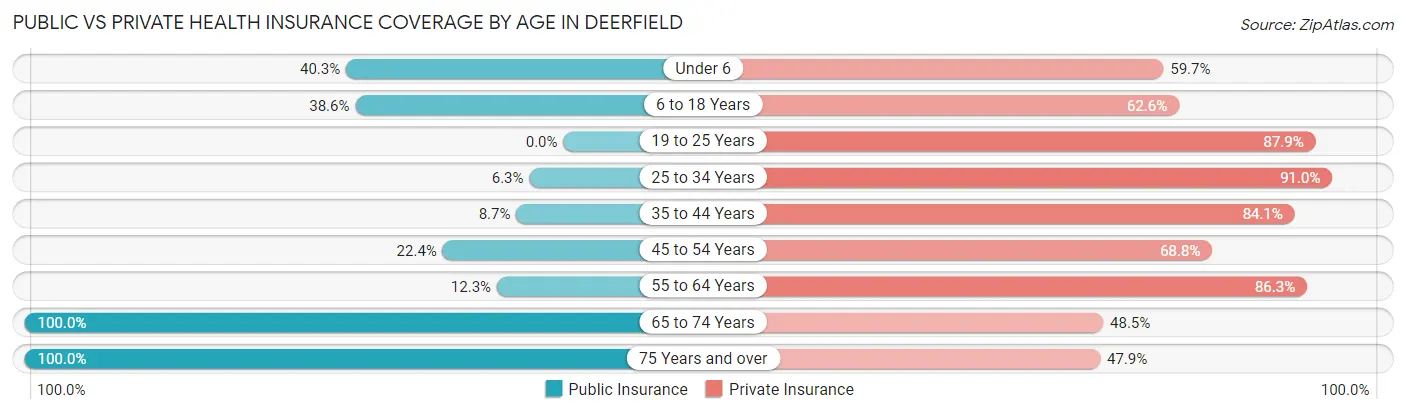
| Age Bracket | Public Insurance | Private Insurance |
| Under 6 | 123 (40.3%) | 182 (59.7%) |
| 6 to 18 Years | 161 (38.6%) | 261 (62.6%) |
| 19 to 25 Years | 0 (0.0%) | 102 (87.9%) |
| 25 to 34 Years | 19 (6.3%) | 274 (91.0%) |
| 35 to 44 Years | 34 (8.7%) | 327 (84.1%) |
| 45 to 54 Years | 43 (22.4%) | 132 (68.8%) |
| 55 to 64 Years | 28 (12.3%) | 196 (86.3%) |
| 65 to 74 Years | 134 (100.0%) | 65 (48.5%) |
| 75 Years and over | 121 (100.0%) | 58 (47.9%) |
| Total | 663 (30.1%) | 1,597 (72.5%) |
Disability Status by Sex by Age in Deerfield
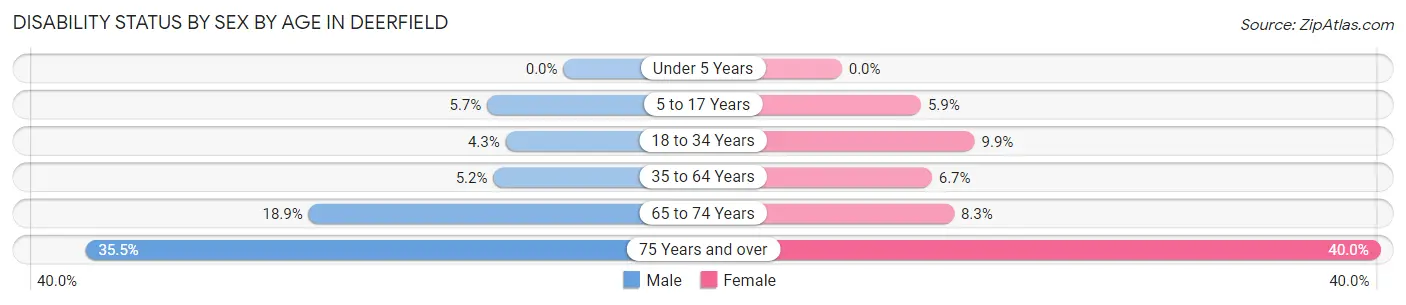
| Age Bracket | Male | Female |
| Under 5 Years | 0 (0.0%) | 0 (0.0%) |
| 5 to 17 Years | 15 (5.7%) | 9 (5.9%) |
| 18 to 34 Years | 10 (4.3%) | 21 (9.9%) |
| 35 to 64 Years | 21 (5.2%) | 27 (6.7%) |
| 65 to 74 Years | 14 (18.9%) | 5 (8.3%) |
| 75 Years and over | 11 (35.5%) | 36 (40.0%) |
Disability Class by Sex by Age in Deerfield
Disability Class: Hearing Difficulty
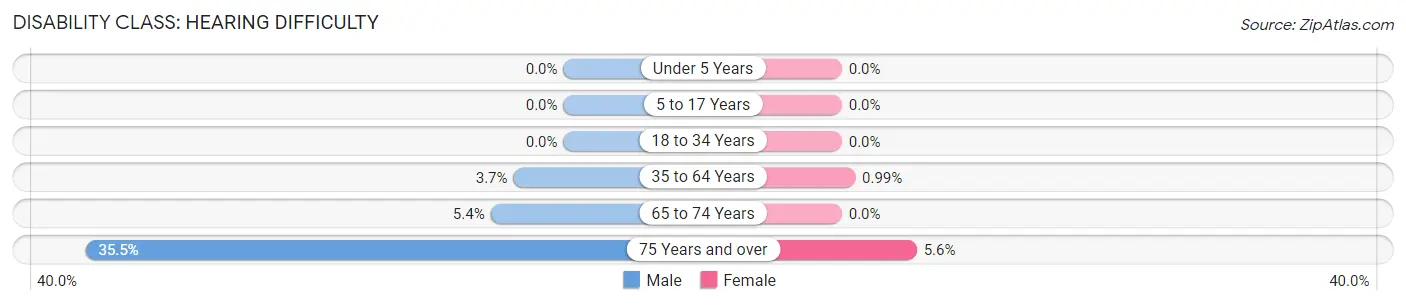
| Age Bracket | Male | Female |
| Under 5 Years | 0 (0.0%) | 0 (0.0%) |
| 5 to 17 Years | 0 (0.0%) | 0 (0.0%) |
| 18 to 34 Years | 0 (0.0%) | 0 (0.0%) |
| 35 to 64 Years | 15 (3.7%) | 4 (1.0%) |
| 65 to 74 Years | 4 (5.4%) | 0 (0.0%) |
| 75 Years and over | 11 (35.5%) | 5 (5.6%) |
Disability Class: Vision Difficulty
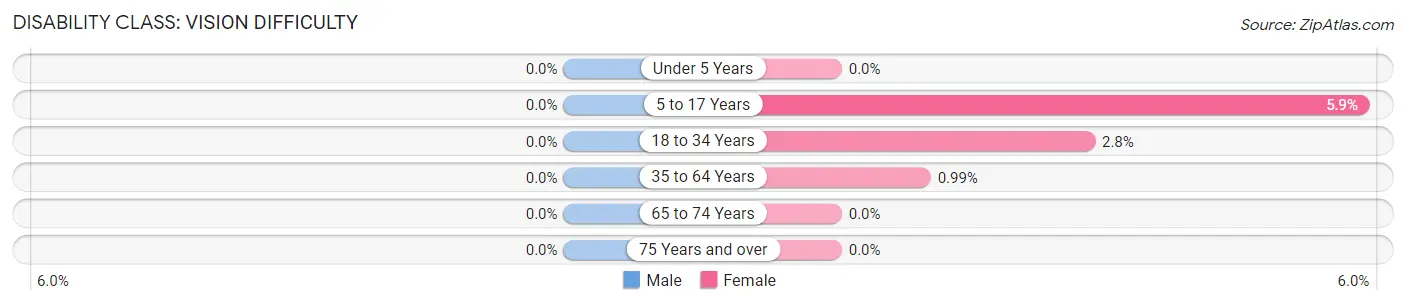
| Age Bracket | Male | Female |
| Under 5 Years | 0 (0.0%) | 0 (0.0%) |
| 5 to 17 Years | 0 (0.0%) | 9 (5.9%) |
| 18 to 34 Years | 0 (0.0%) | 6 (2.8%) |
| 35 to 64 Years | 0 (0.0%) | 4 (1.0%) |
| 65 to 74 Years | 0 (0.0%) | 0 (0.0%) |
| 75 Years and over | 0 (0.0%) | 0 (0.0%) |
Disability Class: Cognitive Difficulty
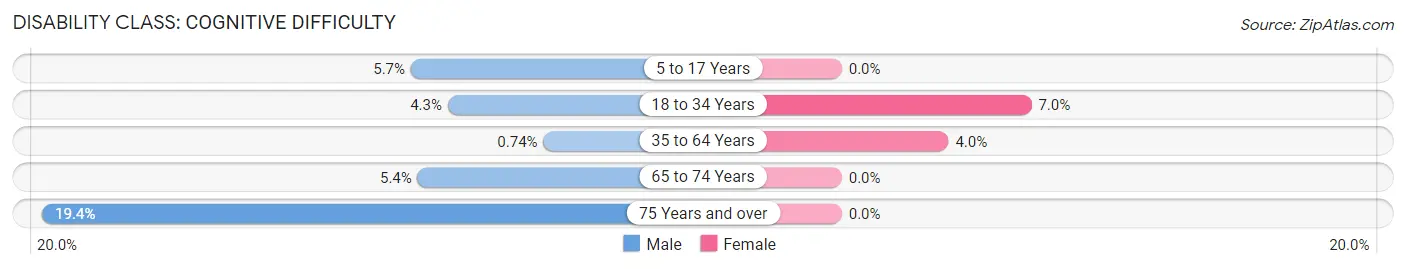
| Age Bracket | Male | Female |
| 5 to 17 Years | 15 (5.7%) | 0 (0.0%) |
| 18 to 34 Years | 10 (4.3%) | 15 (7.0%) |
| 35 to 64 Years | 3 (0.7%) | 16 (4.0%) |
| 65 to 74 Years | 4 (5.4%) | 0 (0.0%) |
| 75 Years and over | 6 (19.4%) | 0 (0.0%) |
Disability Class: Ambulatory Difficulty
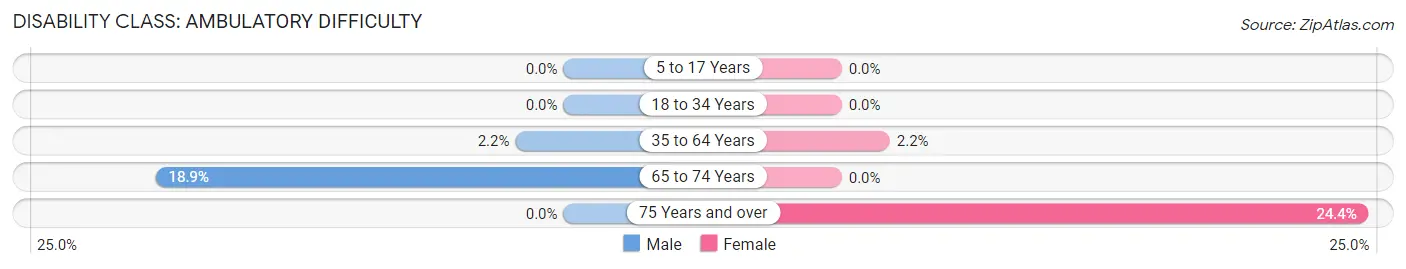
| Age Bracket | Male | Female |
| 5 to 17 Years | 0 (0.0%) | 0 (0.0%) |
| 18 to 34 Years | 0 (0.0%) | 0 (0.0%) |
| 35 to 64 Years | 9 (2.2%) | 9 (2.2%) |
| 65 to 74 Years | 14 (18.9%) | 0 (0.0%) |
| 75 Years and over | 0 (0.0%) | 22 (24.4%) |
Disability Class: Self-Care Difficulty
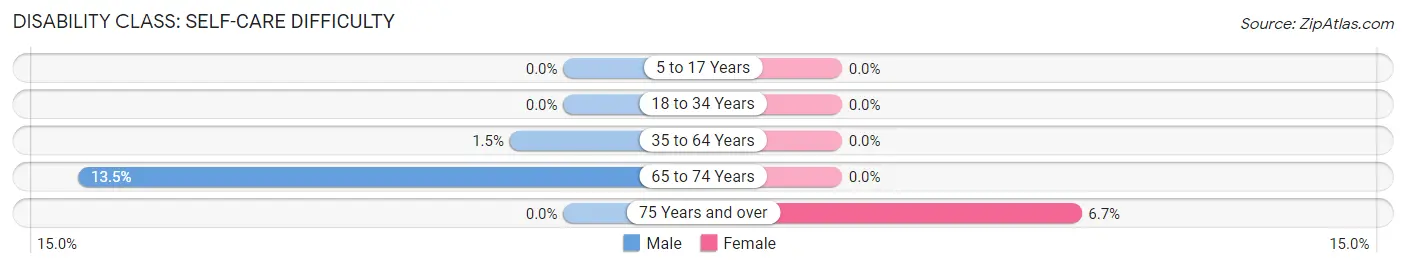
| Age Bracket | Male | Female |
| 5 to 17 Years | 0 (0.0%) | 0 (0.0%) |
| 18 to 34 Years | 0 (0.0%) | 0 (0.0%) |
| 35 to 64 Years | 6 (1.5%) | 0 (0.0%) |
| 65 to 74 Years | 10 (13.5%) | 0 (0.0%) |
| 75 Years and over | 0 (0.0%) | 6 (6.7%) |
Technology Access in Deerfield
Computing Device Access in Deerfield
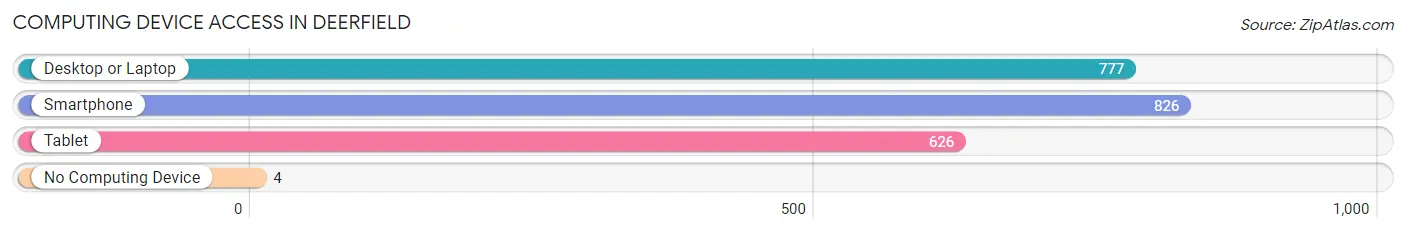
| Device Type | # Households | % Households |
| Desktop or Laptop | 777 | 88.7% |
| Smartphone | 826 | 94.3% |
| Tablet | 626 | 71.5% |
| No Computing Device | 4 | 0.5% |
| Total | 876 | 100.0% |
Internet Access in Deerfield
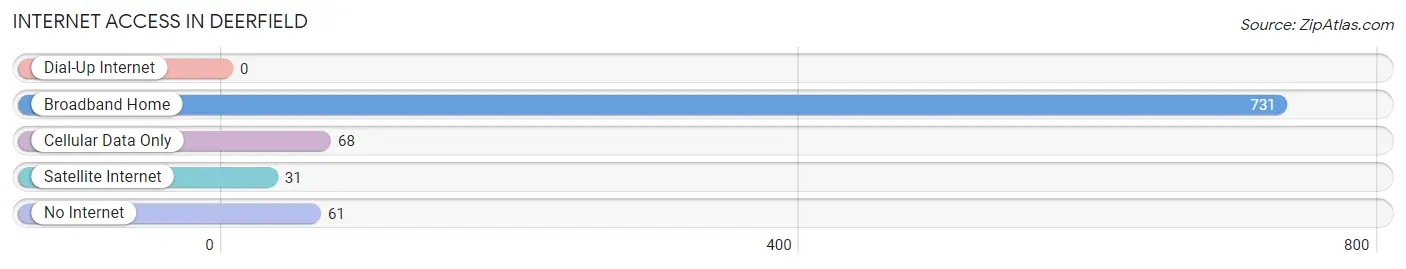
| Internet Type | # Households | % Households |
| Dial-Up Internet | 0 | 0.0% |
| Broadband Home | 731 | 83.5% |
| Cellular Data Only | 68 | 7.8% |
| Satellite Internet | 31 | 3.5% |
| No Internet | 61 | 7.0% |
| Total | 876 | 100.0% |
Deerfield Summary
Deerfield, Wisconsin is a small village located in Dane County, Wisconsin. It is situated on the banks of the Yahara River, about 15 miles north of Madison. The village has a population of about 2,500 people and covers an area of about 2.5 square miles.
History
Deerfield was first settled in 1845 by a group of settlers from New York. The village was originally called “Deerfield Station” because of its location on the Milwaukee and Mississippi Railroad. The village was officially incorporated in 1856.
In the late 19th century, Deerfield was a thriving agricultural community. The village was home to several cheese factories, a creamery, a flour mill, and a sawmill. The village also had a blacksmith, a general store, and a post office.
In the early 20th century, Deerfield began to experience a decline in population as people moved away to larger cities. The village was also affected by the Great Depression, which caused many businesses to close.
Geography
Deerfield is located in Dane County, Wisconsin. It is situated on the banks of the Yahara River, about 15 miles north of Madison. The village has a total area of 2.5 square miles, all of which is land.
The village is located in a rural area, surrounded by rolling hills and farmland. The terrain is mostly flat, with some areas of higher elevation. The village is located in the Central Plain region of Wisconsin, which is characterized by flat terrain and fertile soil.
Economy
Deerfield’s economy is largely based on agriculture. The village is home to several dairy farms, as well as a number of other farms that produce corn, soybeans, and other crops.
The village also has a few small businesses, including a grocery store, a hardware store, and a few restaurants. The village also has a few small manufacturing companies that produce furniture and other products.
Demographics
As of the 2010 census, Deerfield had a population of 2,500 people. The racial makeup of the village was 97.2% White, 0.8% African American, 0.4% Native American, 0.4% Asian, and 0.2% from other races.
The median household income in Deerfield was $50,000, and the median family income was $54,000. The per capita income was $21,000. About 8.5% of the population was below the poverty line.
Conclusion
Deerfield, Wisconsin is a small village located in Dane County, Wisconsin. It is situated on the banks of the Yahara River, about 15 miles north of Madison. The village has a population of about 2,500 people and covers an area of about 2.5 square miles. Deerfield’s economy is largely based on agriculture, and the village also has a few small businesses. The racial makeup of the village is mostly White, with a small percentage of African American, Native American, and Asian residents. The median household income in Deerfield is $50,000, and the per capita income is $21,000.
Common Questions
What is Per Capita Income in Deerfield?
Per Capita income in Deerfield is $36,766.
What is the Median Family Income in Deerfield?
Median Family Income in Deerfield is $86,071.
What is the Median Household income in Deerfield?
Median Household Income in Deerfield is $83,264.
What is Income or Wage Gap in Deerfield?
Income or Wage Gap in Deerfield is 28.7%.
Women in Deerfield earn 71.3 cents for every dollar earned by a man.
What is Family Income Deficit in Deerfield?
Family Income Deficit in Deerfield is $14,264.
Families that are below poverty line in Deerfield earn $14,264 less on average than the poverty threshold level.
What is Inequality or Gini Index in Deerfield?
Inequality or Gini Index in Deerfield is 0.34.
What is the Total Population of Deerfield?
Total Population of Deerfield is 2,207.
What is the Total Male Population of Deerfield?
Total Male Population of Deerfield is 1,177.
What is the Total Female Population of Deerfield?
Total Female Population of Deerfield is 1,030.
What is the Ratio of Males per 100 Females in Deerfield?
There are 114.27 Males per 100 Females in Deerfield.
What is the Ratio of Females per 100 Males in Deerfield?
There are 87.51 Females per 100 Males in Deerfield.
What is the Median Population Age in Deerfield?
Median Population Age in Deerfield is 33.2 Years.
What is the Average Family Size in Deerfield
Average Family Size in Deerfield is 3.2 People.
What is the Average Household Size in Deerfield
Average Household Size in Deerfield is 2.5 People.
How Large is the Labor Force in Deerfield?
There are 1,226 People in the Labor Forcein in Deerfield.
What is the Percentage of People in the Labor Force in Deerfield?
79.4% of People are in the Labor Force in Deerfield.
What is the Unemployment Rate in Deerfield?
Unemployment Rate in Deerfield is 2.2%.