Darlington, WI Map & Demographics
Darlington Map
Darlington Overview
$31,120
PER CAPITA INCOME
$76,295
AVG FAMILY INCOME
$60,682
AVG HOUSEHOLD INCOME
22.5%
WAGE / INCOME GAP [ % ]
77.5¢/ $1
WAGE / INCOME GAP [ $ ]
0.40
INEQUALITY / GINI INDEX
2,462
TOTAL POPULATION
1,303
MALE POPULATION
1,159
FEMALE POPULATION
112.42
MALES / 100 FEMALES
88.95
FEMALES / 100 MALES
42.1
MEDIAN AGE
3.0
AVG FAMILY SIZE
2.3
AVG HOUSEHOLD SIZE
1,197
LABOR FORCE [ PEOPLE ]
64.0%
PERCENT IN LABOR FORCE
1.9%
UNEMPLOYMENT RATE
Darlington Zip Codes
Darlington Area Codes
Income in Darlington
Income Overview in Darlington
Per Capita Income in Darlington is $31,120, while median incomes of families and households are $76,295 and $60,682 respectively.
| Characteristic | Number | Measure |
| Per Capita Income | 2,462 | $31,120 |
| Median Family Income | 617 | $76,295 |
| Mean Family Income | 617 | $77,414 |
| Median Household Income | 1,024 | $60,682 |
| Mean Household Income | 1,024 | $72,192 |
| Income Deficit | 617 | $0 |
| Wage / Income Gap (%) | 2,462 | 22.52% |
| Wage / Income Gap ($) | 2,462 | 77.48¢ per $1 |
| Gini / Inequality Index | 2,462 | 0.40 |
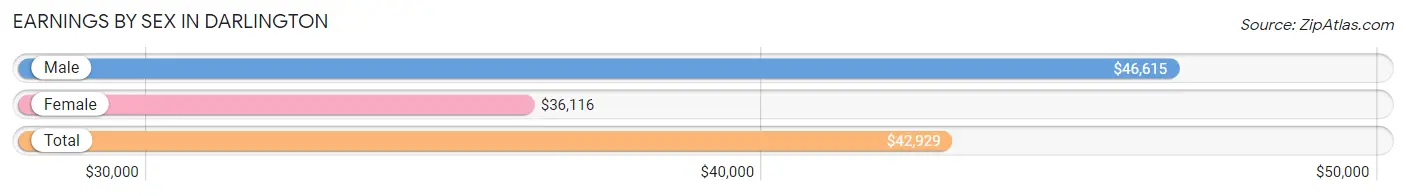
Earnings by Sex in Darlington
Average Earnings in Darlington are $42,929, $46,615 for men and $36,116 for women, a difference of 22.5%.
| Sex | Number | Average Earnings |
| Male | 679 (56.3%) | $46,615 |
| Female | 527 (43.7%) | $36,116 |
| Total | 1,206 (100.0%) | $42,929 |
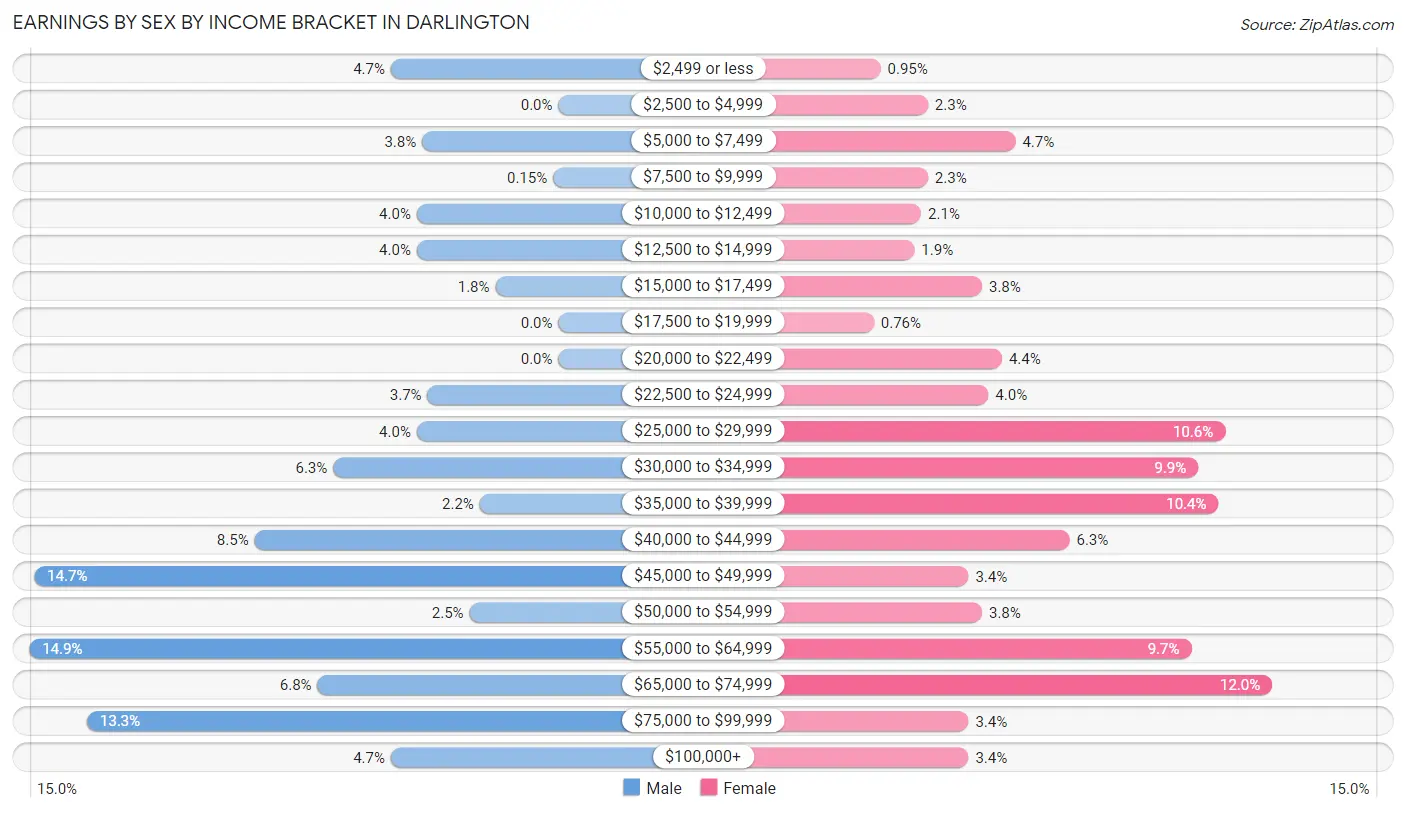
Earnings by Sex by Income Bracket in Darlington
The most common earnings brackets in Darlington are $55,000 to $64,999 for men (101 | 14.9%) and $65,000 to $74,999 for women (63 | 11.9%).
| Income | Male | Female |
| $2,499 or less | 32 (4.7%) | 5 (0.9%) |
| $2,500 to $4,999 | 0 (0.0%) | 12 (2.3%) |
| $5,000 to $7,499 | 26 (3.8%) | 25 (4.7%) |
| $7,500 to $9,999 | 1 (0.2%) | 12 (2.3%) |
| $10,000 to $12,499 | 27 (4.0%) | 11 (2.1%) |
| $12,500 to $14,999 | 27 (4.0%) | 10 (1.9%) |
| $15,000 to $17,499 | 12 (1.8%) | 20 (3.8%) |
| $17,500 to $19,999 | 0 (0.0%) | 4 (0.8%) |
| $20,000 to $22,499 | 0 (0.0%) | 23 (4.4%) |
| $22,500 to $24,999 | 25 (3.7%) | 21 (4.0%) |
| $25,000 to $29,999 | 27 (4.0%) | 56 (10.6%) |
| $30,000 to $34,999 | 43 (6.3%) | 52 (9.9%) |
| $35,000 to $39,999 | 15 (2.2%) | 55 (10.4%) |
| $40,000 to $44,999 | 58 (8.5%) | 33 (6.3%) |
| $45,000 to $49,999 | 100 (14.7%) | 18 (3.4%) |
| $50,000 to $54,999 | 17 (2.5%) | 20 (3.8%) |
| $55,000 to $64,999 | 101 (14.9%) | 51 (9.7%) |
| $65,000 to $74,999 | 46 (6.8%) | 63 (11.9%) |
| $75,000 to $99,999 | 90 (13.3%) | 18 (3.4%) |
| $100,000+ | 32 (4.7%) | 18 (3.4%) |
| Total | 679 (100.0%) | 527 (100.0%) |
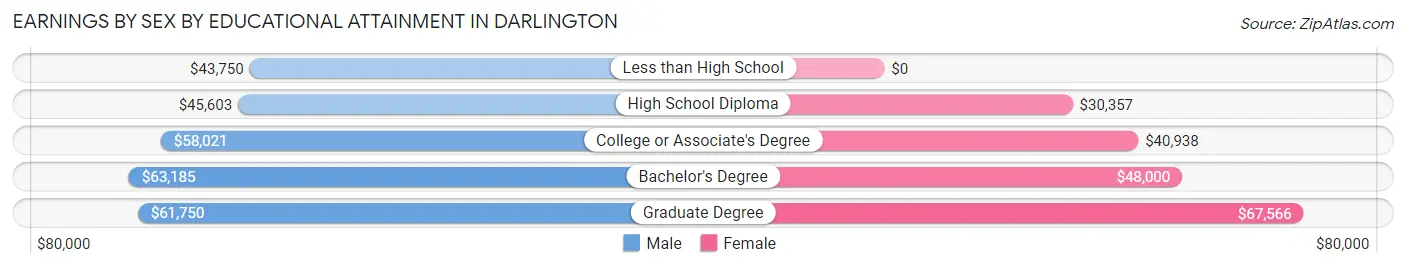
Earnings by Sex by Educational Attainment in Darlington
Average earnings in Darlington are $47,319 for men and $38,935 for women, a difference of 17.7%. Men with an educational attainment of bachelor's degree enjoy the highest average annual earnings of $63,185, while those with less than high school education earn the least with $43,750. Women with an educational attainment of graduate degree earn the most with the average annual earnings of $67,566, while those with high school diploma education have the smallest earnings of $30,357.
| Educational Attainment | Male Income | Female Income |
| Less than High School | $43,750 | $0 |
| High School Diploma | $45,603 | $30,357 |
| College or Associate's Degree | $58,021 | $40,938 |
| Bachelor's Degree | $63,185 | $48,000 |
| Graduate Degree | $61,750 | $67,566 |
| Total | $47,319 | $38,935 |
Family Income in Darlington
Family Income Brackets in Darlington
According to the Darlington family income data, there are 155 families falling into the $75,000 to $99,999 income range, which is the most common income bracket and makes up 25.1% of all families.
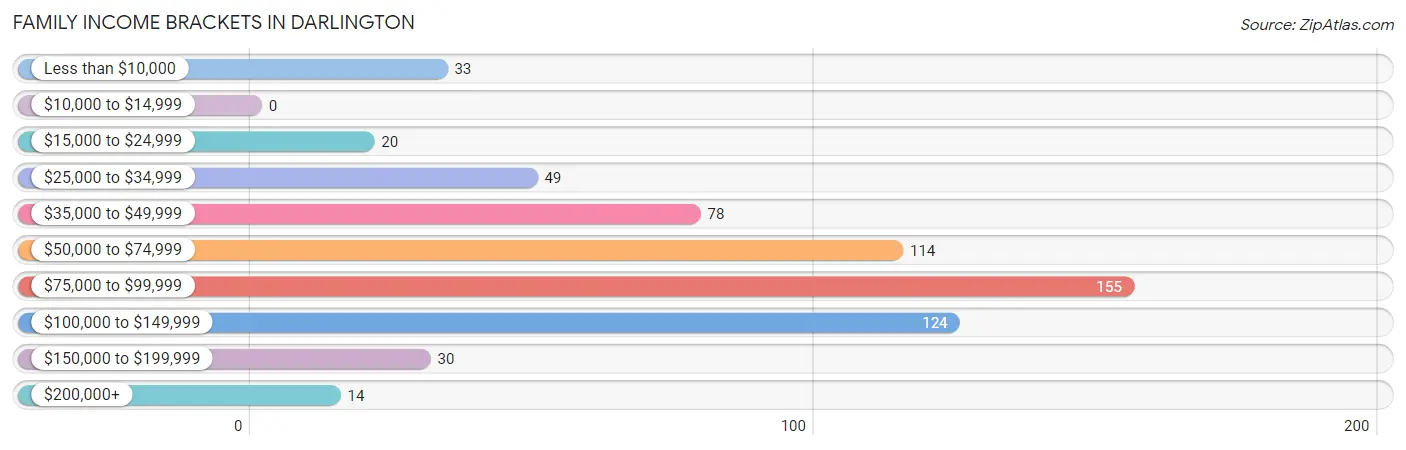
| Income Bracket | # Families | % Families |
| Less than $10,000 | 33 | 5.3% |
| $10,000 to $14,999 | 0 | 0.0% |
| $15,000 to $24,999 | 20 | 3.2% |
| $25,000 to $34,999 | 49 | 7.9% |
| $35,000 to $49,999 | 78 | 12.6% |
| $50,000 to $74,999 | 114 | 18.5% |
| $75,000 to $99,999 | 155 | 25.1% |
| $100,000 to $149,999 | 124 | 20.1% |
| $150,000 to $199,999 | 30 | 4.9% |
| $200,000+ | 14 | 2.3% |
Family Income by Famaliy Size in Darlington
2-person families (396 | 64.2%) account for the highest median family income in Darlington with $77,935 per family, while 2-person families (396 | 64.2%) have the highest median income of $38,968 per family member.
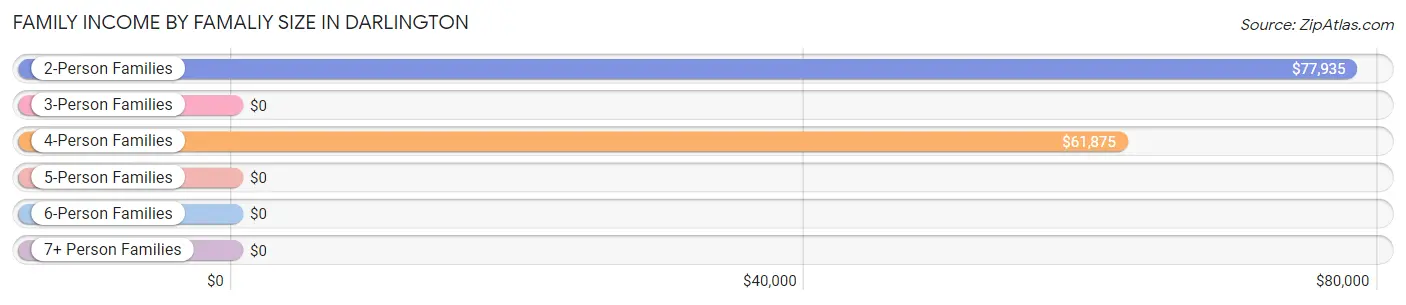
| Income Bracket | # Families | Median Income |
| 2-Person Families | 396 (64.2%) | $77,935 |
| 3-Person Families | 58 (9.4%) | $0 |
| 4-Person Families | 90 (14.6%) | $61,875 |
| 5-Person Families | 42 (6.8%) | $0 |
| 6-Person Families | 13 (2.1%) | $0 |
| 7+ Person Families | 18 (2.9%) | $0 |
| Total | 617 (100.0%) | $76,295 |
Family Income by Number of Earners in Darlington
The median family income in Darlington is $76,295, with families comprising 3+ earners (23) having the highest median family income of $138,295, while families with no earners (100) have the lowest median family income of $45,000, accounting for 3.7% and 16.2% of families, respectively.
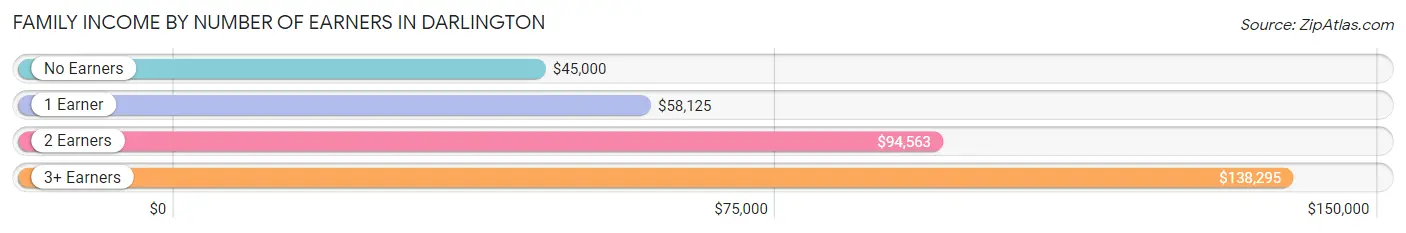
| Number of Earners | # Families | Median Income |
| No Earners | 100 (16.2%) | $45,000 |
| 1 Earner | 223 (36.1%) | $58,125 |
| 2 Earners | 271 (43.9%) | $94,563 |
| 3+ Earners | 23 (3.7%) | $138,295 |
| Total | 617 (100.0%) | $76,295 |
Household Income in Darlington
Household Income Brackets in Darlington
With 179 households falling in the category, the $75,000 to $99,999 income range is the most frequent in Darlington, accounting for 17.5% of all households. In contrast, only 31 households (3.0%) fall into the $10,000 to $14,999 income bracket, making it the least populous group.
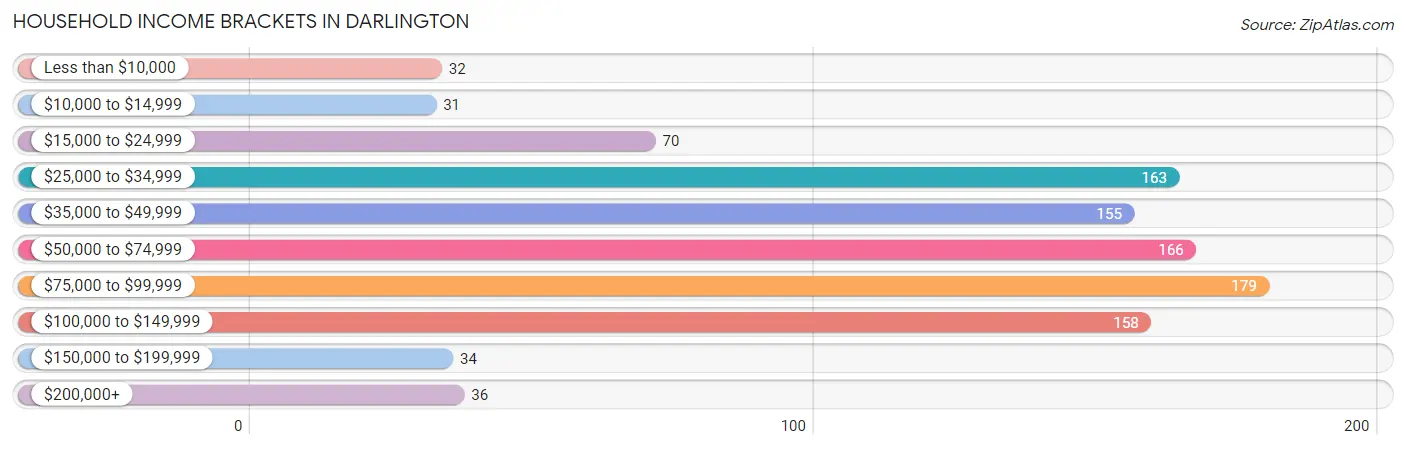
| Income Bracket | # Households | % Households |
| Less than $10,000 | 32 | 3.1% |
| $10,000 to $14,999 | 31 | 3.0% |
| $15,000 to $24,999 | 70 | 6.8% |
| $25,000 to $34,999 | 163 | 15.9% |
| $35,000 to $49,999 | 155 | 15.1% |
| $50,000 to $74,999 | 166 | 16.2% |
| $75,000 to $99,999 | 179 | 17.5% |
| $100,000 to $149,999 | 158 | 15.4% |
| $150,000 to $199,999 | 34 | 3.3% |
| $200,000+ | 36 | 3.5% |
Household Income by Householder Age in Darlington
The median household income in Darlington is $60,682, with the highest median household income of $79,083 found in the 45 to 64 years age bracket for the primary householder. A total of 333 households (32.5%) fall into this category. Meanwhile, the 65+ years age bracket for the primary householder has the lowest median household income of $32,019, with 377 households (36.8%) in this group.
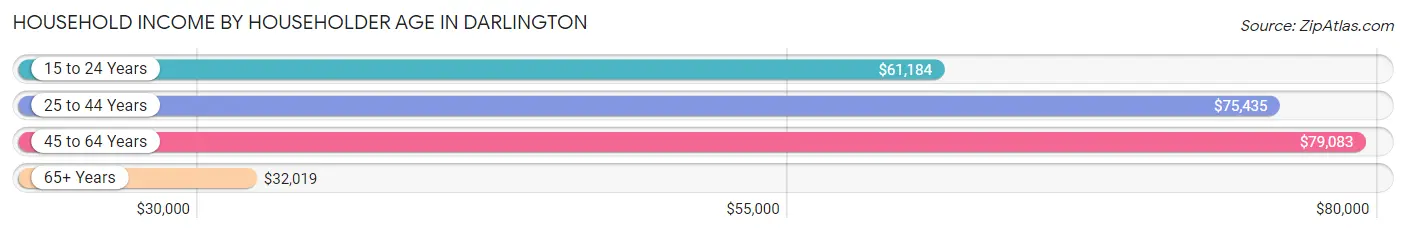
| Income Bracket | # Households | Median Income |
| 15 to 24 Years | 56 (5.5%) | $61,184 |
| 25 to 44 Years | 258 (25.2%) | $75,435 |
| 45 to 64 Years | 333 (32.5%) | $79,083 |
| 65+ Years | 377 (36.8%) | $32,019 |
| Total | 1,024 (100.0%) | $60,682 |
Poverty in Darlington
Income Below Poverty by Sex and Age in Darlington
With 9.4% poverty level for males and 11.0% for females among the residents of Darlington, 15 year old males and 15 year old females are the most vulnerable to poverty, with 26 males (60.5%) and 14 females (70.0%) in their respective age groups living below the poverty level.
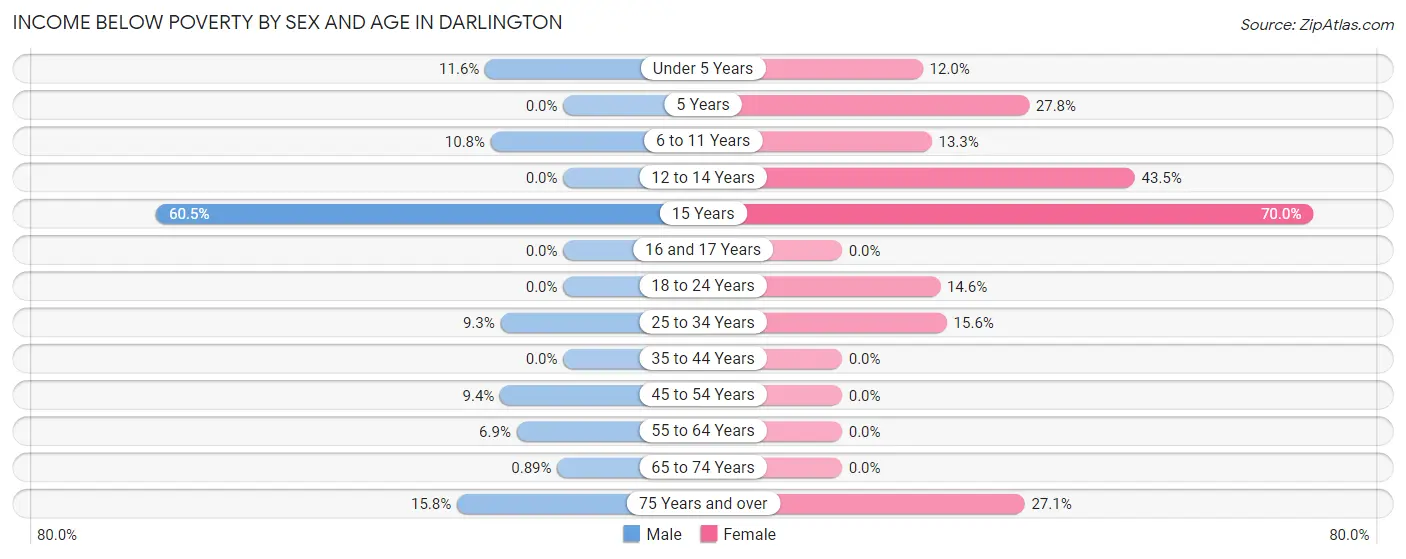
| Age Bracket | Male | Female |
| Under 5 Years | 13 (11.6%) | 12 (12.0%) |
| 5 Years | 0 (0.0%) | 10 (27.8%) |
| 6 to 11 Years | 17 (10.8%) | 10 (13.3%) |
| 12 to 14 Years | 0 (0.0%) | 10 (43.5%) |
| 15 Years | 26 (60.5%) | 14 (70.0%) |
| 16 and 17 Years | 0 (0.0%) | 0 (0.0%) |
| 18 to 24 Years | 0 (0.0%) | 7 (14.6%) |
| 25 to 34 Years | 15 (9.3%) | 26 (15.6%) |
| 35 to 44 Years | 0 (0.0%) | 0 (0.0%) |
| 45 to 54 Years | 15 (9.4%) | 0 (0.0%) |
| 55 to 64 Years | 11 (6.9%) | 0 (0.0%) |
| 65 to 74 Years | 1 (0.9%) | 0 (0.0%) |
| 75 Years and over | 21 (15.8%) | 35 (27.1%) |
| Total | 119 (9.4%) | 124 (11.0%) |
Income Above Poverty by Sex and Age in Darlington
According to the poverty statistics in Darlington, males aged 5 years and females aged 16 and 17 years are the age groups that are most secure financially, with 100.0% of males and 100.0% of females in these age groups living above the poverty line.
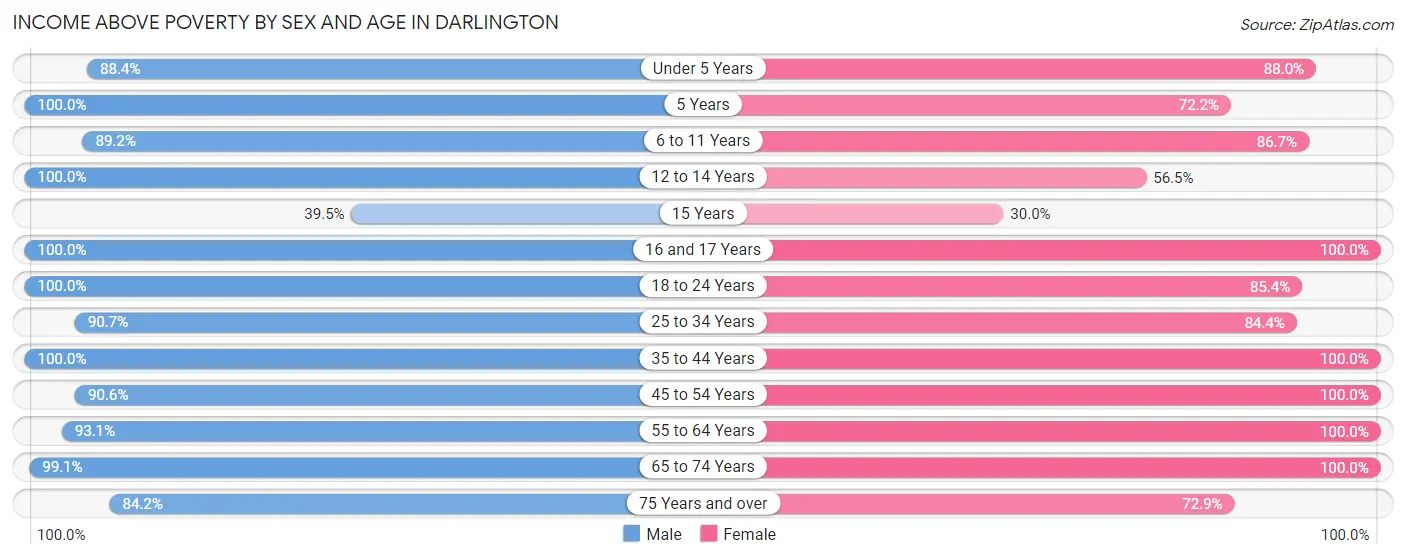
| Age Bracket | Male | Female |
| Under 5 Years | 99 (88.4%) | 88 (88.0%) |
| 5 Years | 4 (100.0%) | 26 (72.2%) |
| 6 to 11 Years | 141 (89.2%) | 65 (86.7%) |
| 12 to 14 Years | 21 (100.0%) | 13 (56.5%) |
| 15 Years | 17 (39.5%) | 6 (30.0%) |
| 16 and 17 Years | 14 (100.0%) | 19 (100.0%) |
| 18 to 24 Years | 99 (100.0%) | 41 (85.4%) |
| 25 to 34 Years | 146 (90.7%) | 141 (84.4%) |
| 35 to 44 Years | 89 (100.0%) | 100 (100.0%) |
| 45 to 54 Years | 145 (90.6%) | 138 (100.0%) |
| 55 to 64 Years | 148 (93.1%) | 137 (100.0%) |
| 65 to 74 Years | 111 (99.1%) | 135 (100.0%) |
| 75 Years and over | 112 (84.2%) | 94 (72.9%) |
| Total | 1,146 (90.6%) | 1,003 (89.0%) |
Income Below Poverty Among Married-Couple Families in Darlington
The poverty statistics for married-couple families in Darlington show that 6.8% or 32 of the total 468 families live below the poverty line. Families with 3 or 4 children have the highest poverty rate of 28.6%, comprising of 10 families. On the other hand, families with 1 or 2 children have the lowest poverty rate of 0.0%, which includes 0 families.
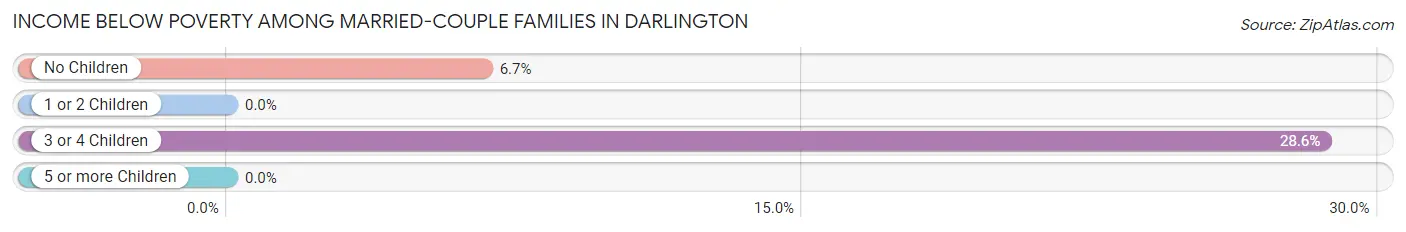
| Children | Above Poverty | Below Poverty |
| No Children | 309 (93.3%) | 22 (6.7%) |
| 1 or 2 Children | 84 (100.0%) | 0 (0.0%) |
| 3 or 4 Children | 25 (71.4%) | 10 (28.6%) |
| 5 or more Children | 18 (100.0%) | 0 (0.0%) |
| Total | 436 (93.2%) | 32 (6.8%) |
Income Below Poverty Among Single-Parent Households in Darlington
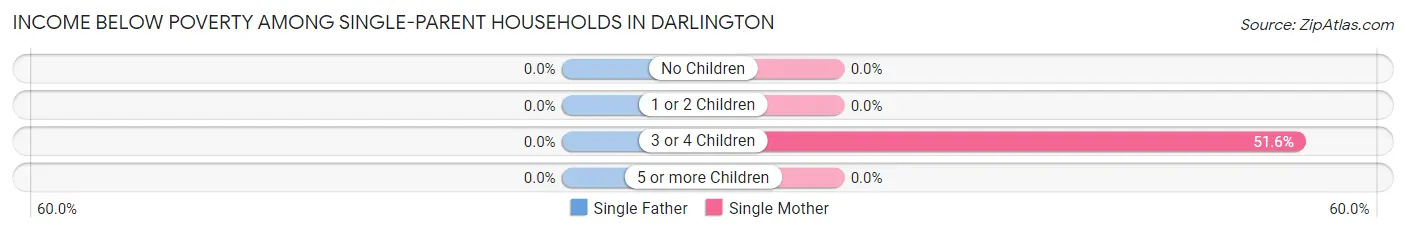
| Children | Single Father | Single Mother |
| No Children | 0 (0.0%) | 0 (0.0%) |
| 1 or 2 Children | 0 (0.0%) | 0 (0.0%) |
| 3 or 4 Children | 0 (0.0%) | 16 (51.6%) |
| 5 or more Children | 0 (0.0%) | 0 (0.0%) |
| Total | 0 (0.0%) | 16 (16.5%) |
Income Below Poverty Among Married-Couple vs Single-Parent Households in Darlington
The poverty data for Darlington shows that 32 of the married-couple family households (6.8%) and 16 of the single-parent households (10.7%) are living below the poverty level. Within the married-couple family households, those with 3 or 4 children have the highest poverty rate, with 10 households (28.6%) falling below the poverty line. Among the single-parent households, those with 3 or 4 children have the highest poverty rate, with 16 household (43.2%) living below poverty.
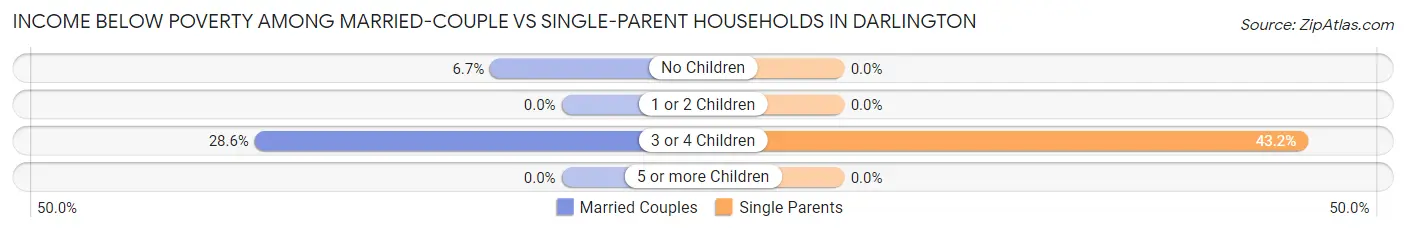
| Children | Married-Couple Families | Single-Parent Households |
| No Children | 22 (6.7%) | 0 (0.0%) |
| 1 or 2 Children | 0 (0.0%) | 0 (0.0%) |
| 3 or 4 Children | 10 (28.6%) | 16 (43.2%) |
| 5 or more Children | 0 (0.0%) | 0 (0.0%) |
| Total | 32 (6.8%) | 16 (10.7%) |
Race in Darlington
The most populous races in Darlington are White / Caucasian (2,164 | 87.9%), Hispanic or Latino (304 | 12.3%), and Two or more Races (207 | 8.4%).
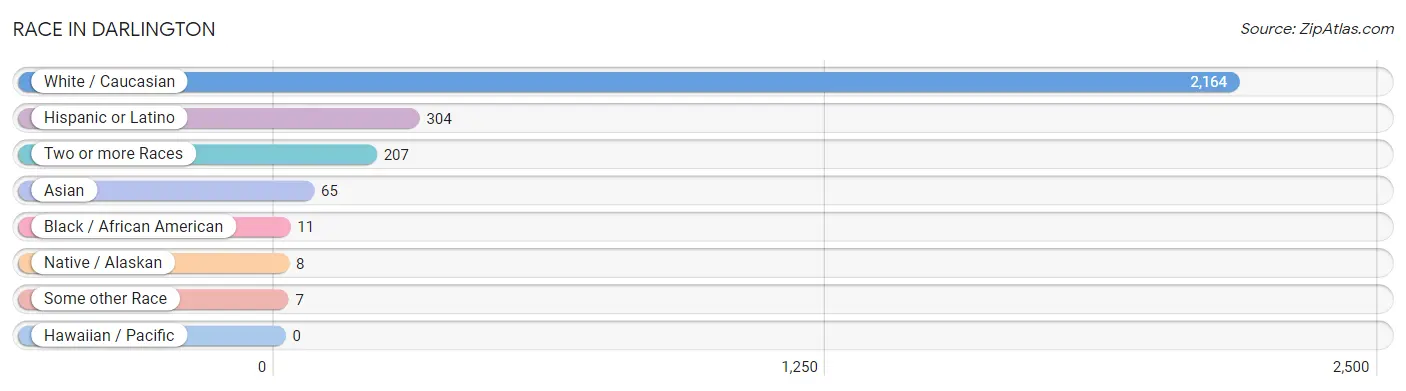
| Race | # Population | % Population |
| Asian | 65 | 2.6% |
| Black / African American | 11 | 0.4% |
| Hawaiian / Pacific | 0 | 0.0% |
| Hispanic or Latino | 304 | 12.3% |
| Native / Alaskan | 8 | 0.3% |
| White / Caucasian | 2,164 | 87.9% |
| Two or more Races | 207 | 8.4% |
| Some other Race | 7 | 0.3% |
| Total | 2,462 | 100.0% |
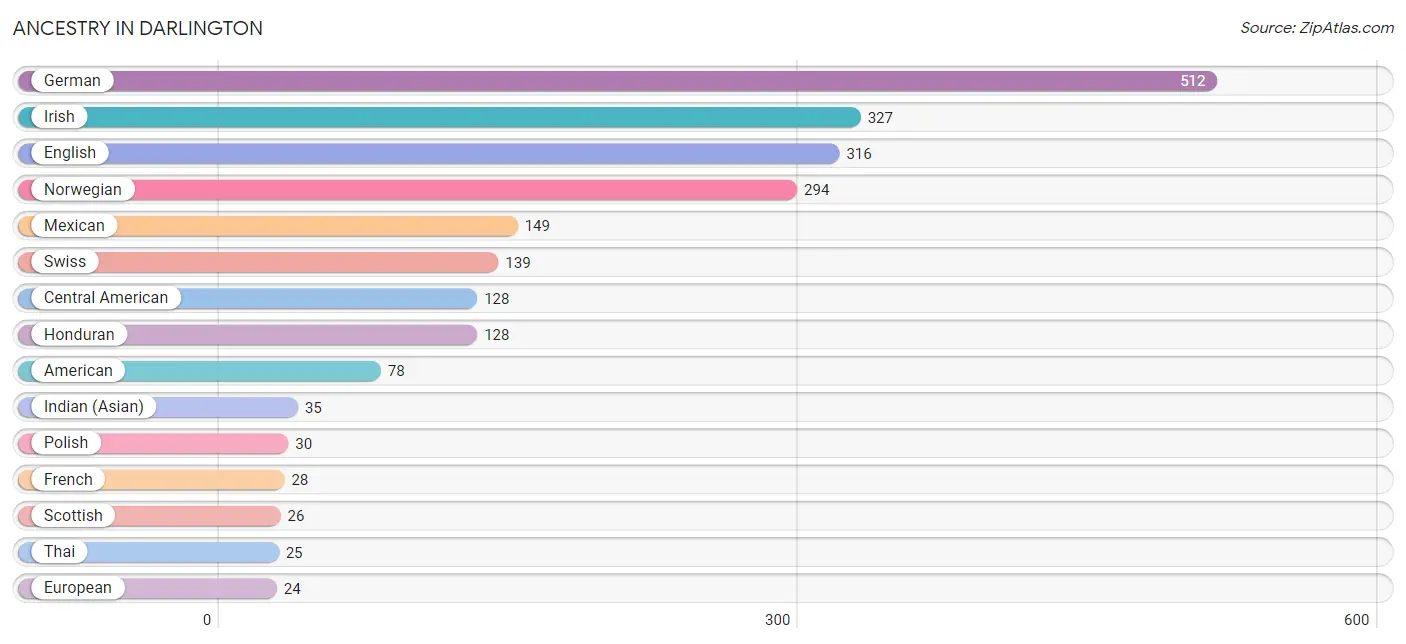
Ancestry in Darlington
The most populous ancestries reported in Darlington are German (512 | 20.8%), Irish (327 | 13.3%), English (316 | 12.8%), Norwegian (294 | 11.9%), and Mexican (149 | 6.0%), together accounting for 64.9% of all Darlington residents.
| Ancestry | # Population | % Population |
| American | 78 | 3.2% |
| British | 6 | 0.2% |
| Central American | 128 | 5.2% |
| Cherokee | 8 | 0.3% |
| Danish | 6 | 0.2% |
| Dutch | 4 | 0.2% |
| Eastern European | 4 | 0.2% |
| English | 316 | 12.8% |
| European | 24 | 1.0% |
| French | 28 | 1.1% |
| German | 512 | 20.8% |
| Honduran | 128 | 5.2% |
| Indian (Asian) | 35 | 1.4% |
| Irish | 327 | 13.3% |
| Italian | 6 | 0.2% |
| Korean | 5 | 0.2% |
| Menominee | 8 | 0.3% |
| Mexican | 149 | 6.0% |
| Norwegian | 294 | 11.9% |
| Pennsylvania German | 5 | 0.2% |
| Peruvian | 5 | 0.2% |
| Polish | 30 | 1.2% |
| Russian | 14 | 0.6% |
| Scandinavian | 20 | 0.8% |
| Scotch-Irish | 8 | 0.3% |
| Scottish | 26 | 1.1% |
| Sioux | 1 | 0.0% |
| South American | 5 | 0.2% |
| Swedish | 16 | 0.6% |
| Swiss | 139 | 5.7% |
| Thai | 25 | 1.0% |
| Yugoslavian | 1 | 0.0% | View All 32 Rows |
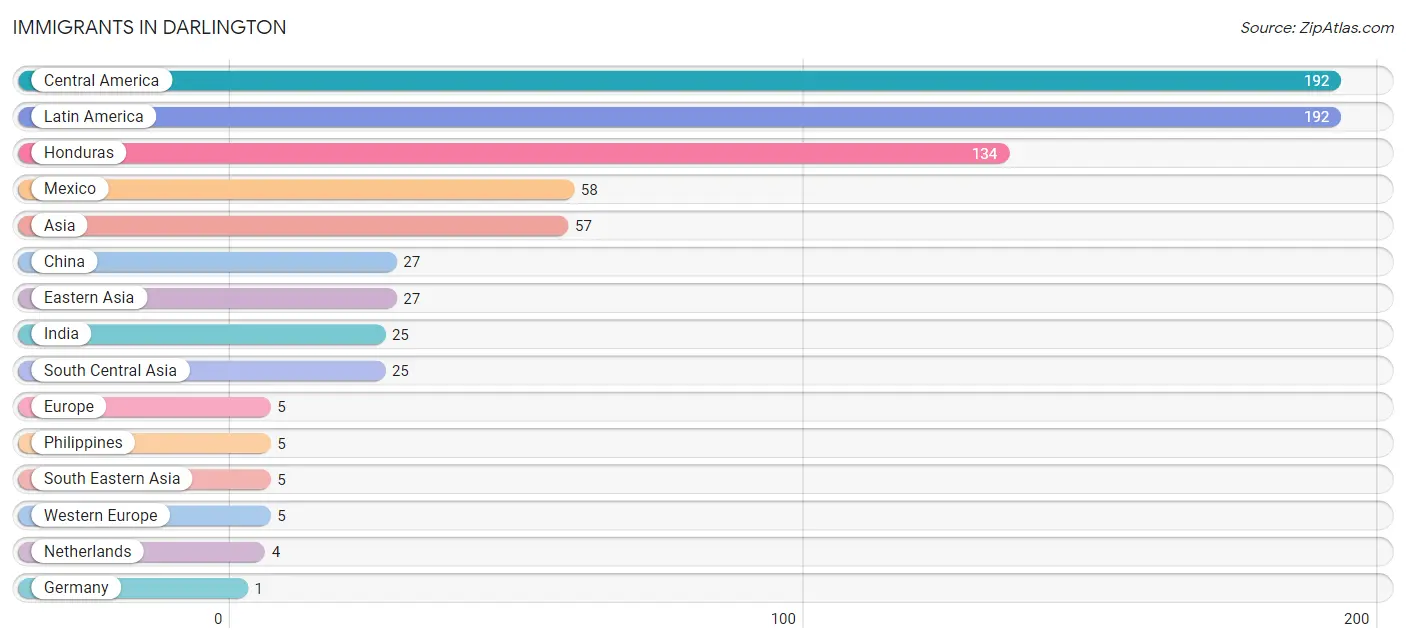
Immigrants in Darlington
The most numerous immigrant groups reported in Darlington came from Central America (192 | 7.8%), Latin America (192 | 7.8%), Honduras (134 | 5.4%), Mexico (58 | 2.4%), and Asia (57 | 2.3%), together accounting for 25.7% of all Darlington residents.
| Immigration Origin | # Population | % Population |
| Asia | 57 | 2.3% |
| Central America | 192 | 7.8% |
| China | 27 | 1.1% |
| Eastern Asia | 27 | 1.1% |
| Europe | 5 | 0.2% |
| Germany | 1 | 0.0% |
| Honduras | 134 | 5.4% |
| India | 25 | 1.0% |
| Latin America | 192 | 7.8% |
| Mexico | 58 | 2.4% |
| Netherlands | 4 | 0.2% |
| Philippines | 5 | 0.2% |
| South Central Asia | 25 | 1.0% |
| South Eastern Asia | 5 | 0.2% |
| Western Europe | 5 | 0.2% | View All 15 Rows |
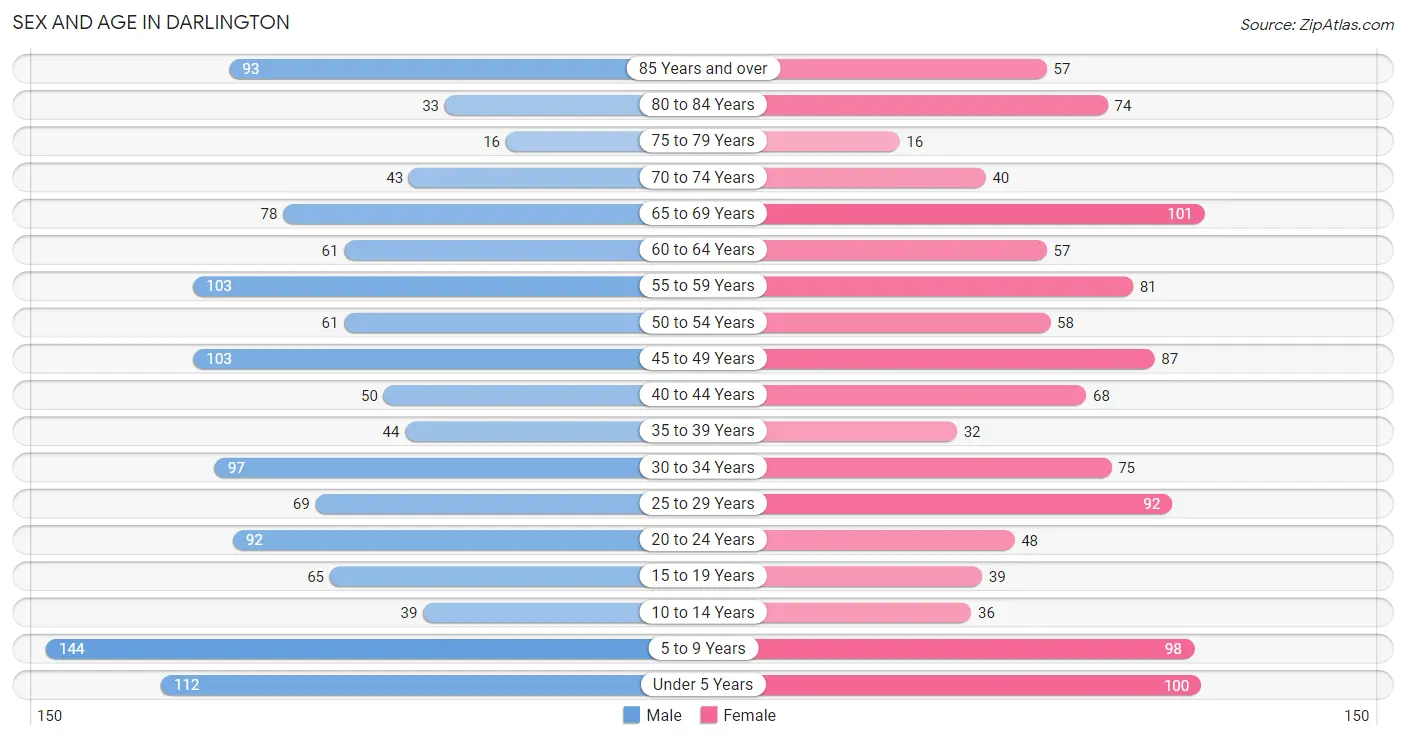
Sex and Age in Darlington
Sex and Age in Darlington
The most populous age groups in Darlington are 5 to 9 Years (144 | 11.1%) for men and 65 to 69 Years (101 | 8.7%) for women.
| Age Bracket | Male | Female |
| Under 5 Years | 112 (8.6%) | 100 (8.6%) |
| 5 to 9 Years | 144 (11.1%) | 98 (8.5%) |
| 10 to 14 Years | 39 (3.0%) | 36 (3.1%) |
| 15 to 19 Years | 65 (5.0%) | 39 (3.4%) |
| 20 to 24 Years | 92 (7.1%) | 48 (4.1%) |
| 25 to 29 Years | 69 (5.3%) | 92 (7.9%) |
| 30 to 34 Years | 97 (7.4%) | 75 (6.5%) |
| 35 to 39 Years | 44 (3.4%) | 32 (2.8%) |
| 40 to 44 Years | 50 (3.8%) | 68 (5.9%) |
| 45 to 49 Years | 103 (7.9%) | 87 (7.5%) |
| 50 to 54 Years | 61 (4.7%) | 58 (5.0%) |
| 55 to 59 Years | 103 (7.9%) | 81 (7.0%) |
| 60 to 64 Years | 61 (4.7%) | 57 (4.9%) |
| 65 to 69 Years | 78 (6.0%) | 101 (8.7%) |
| 70 to 74 Years | 43 (3.3%) | 40 (3.5%) |
| 75 to 79 Years | 16 (1.2%) | 16 (1.4%) |
| 80 to 84 Years | 33 (2.5%) | 74 (6.4%) |
| 85 Years and over | 93 (7.1%) | 57 (4.9%) |
| Total | 1,303 (100.0%) | 1,159 (100.0%) |
Families and Households in Darlington
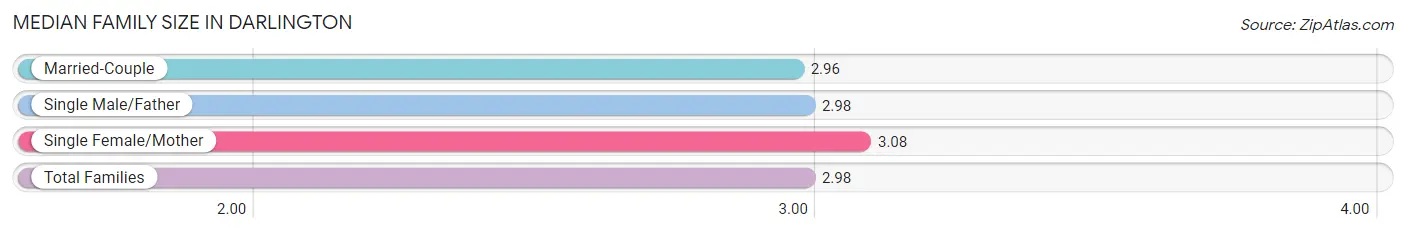
Median Family Size in Darlington
The median family size in Darlington is 2.98 persons per family, with single female/mother families (97 | 15.7%) accounting for the largest median family size of 3.08 persons per family. On the other hand, married-couple families (468 | 75.8%) represent the smallest median family size with 2.96 persons per family.
| Family Type | # Families | Family Size |
| Married-Couple | 468 (75.8%) | 2.96 |
| Single Male/Father | 52 (8.4%) | 2.98 |
| Single Female/Mother | 97 (15.7%) | 3.08 |
| Total Families | 617 (100.0%) | 2.98 |
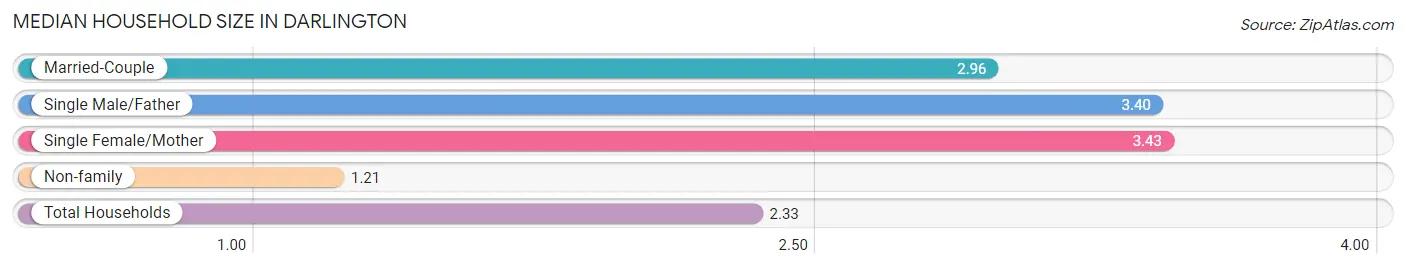
Median Household Size in Darlington
The median household size in Darlington is 2.33 persons per household, with single female/mother households (97 | 9.5%) accounting for the largest median household size of 3.43 persons per household. non-family households (407 | 39.8%) represent the smallest median household size with 1.21 persons per household.
| Household Type | # Households | Household Size |
| Married-Couple | 468 (45.7%) | 2.96 |
| Single Male/Father | 52 (5.1%) | 3.40 |
| Single Female/Mother | 97 (9.5%) | 3.43 |
| Non-family | 407 (39.8%) | 1.21 |
| Total Households | 1,024 (100.0%) | 2.33 |
Household Size by Marriage Status in Darlington
Out of a total of 1,024 households in Darlington, 617 (60.3%) are family households, while 407 (39.8%) are nonfamily households. The most numerous type of family households are 2-person households, comprising 390, and the most common type of nonfamily households are 1-person households, comprising 343.
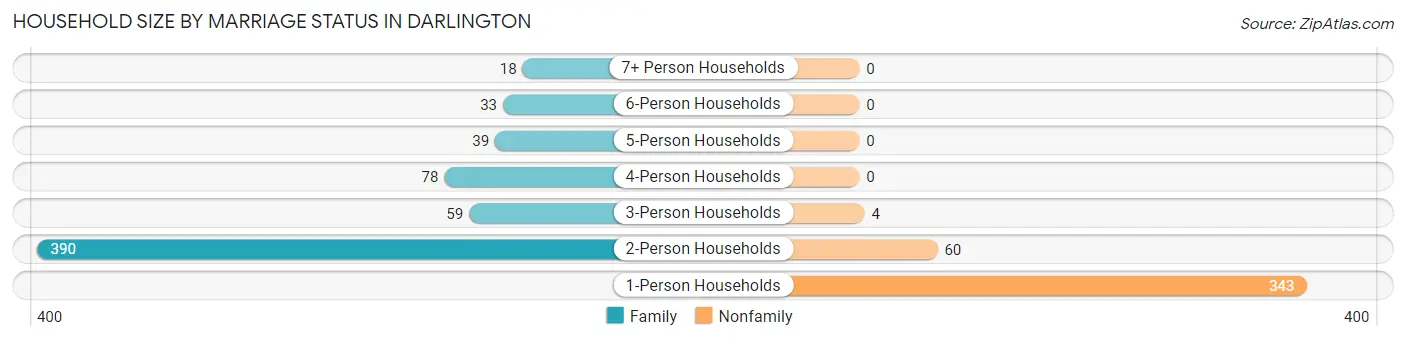
| Household Size | Family Households | Nonfamily Households |
| 1-Person Households | - | 343 (33.5%) |
| 2-Person Households | 390 (38.1%) | 60 (5.9%) |
| 3-Person Households | 59 (5.8%) | 4 (0.4%) |
| 4-Person Households | 78 (7.6%) | 0 (0.0%) |
| 5-Person Households | 39 (3.8%) | 0 (0.0%) |
| 6-Person Households | 33 (3.2%) | 0 (0.0%) |
| 7+ Person Households | 18 (1.8%) | 0 (0.0%) |
| Total | 617 (60.3%) | 407 (39.8%) |
Female Fertility in Darlington
Fertility by Age in Darlington
Average fertility rate in Darlington is 54.0 births per 1,000 women. Women in the age bracket of 20 to 34 years have the highest fertility rate with 93.0 births per 1,000 women. Women in the age bracket of 20 to 34 years acount for 83.3% of all women with births.
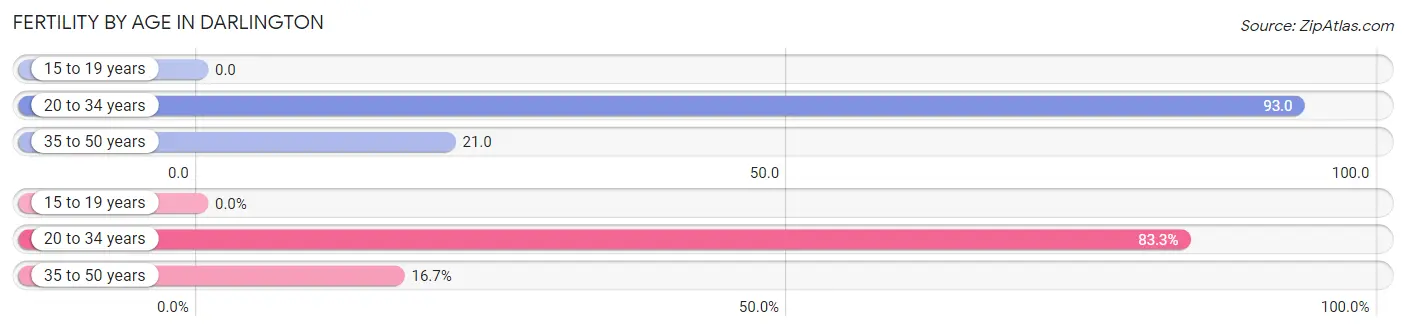
| Age Bracket | Women with Births | Births / 1,000 Women |
| 15 to 19 years | 0 (0.0%) | 0.0 |
| 20 to 34 years | 20 (83.3%) | 93.0 |
| 35 to 50 years | 4 (16.7%) | 21.0 |
| Total | 24 (100.0%) | 54.0 |
Fertility by Age by Marriage Status in Darlington
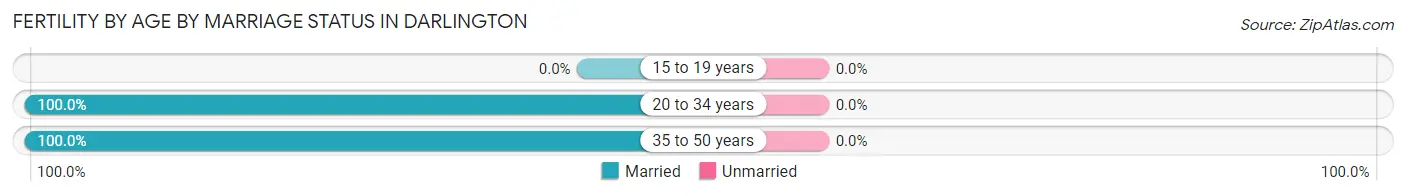
| Age Bracket | Married | Unmarried |
| 15 to 19 years | 0 (0.0%) | 0 (0.0%) |
| 20 to 34 years | 20 (100.0%) | 0 (0.0%) |
| 35 to 50 years | 4 (100.0%) | 0 (0.0%) |
| Total | 24 (100.0%) | 0 (0.0%) |
Fertility by Education in Darlington
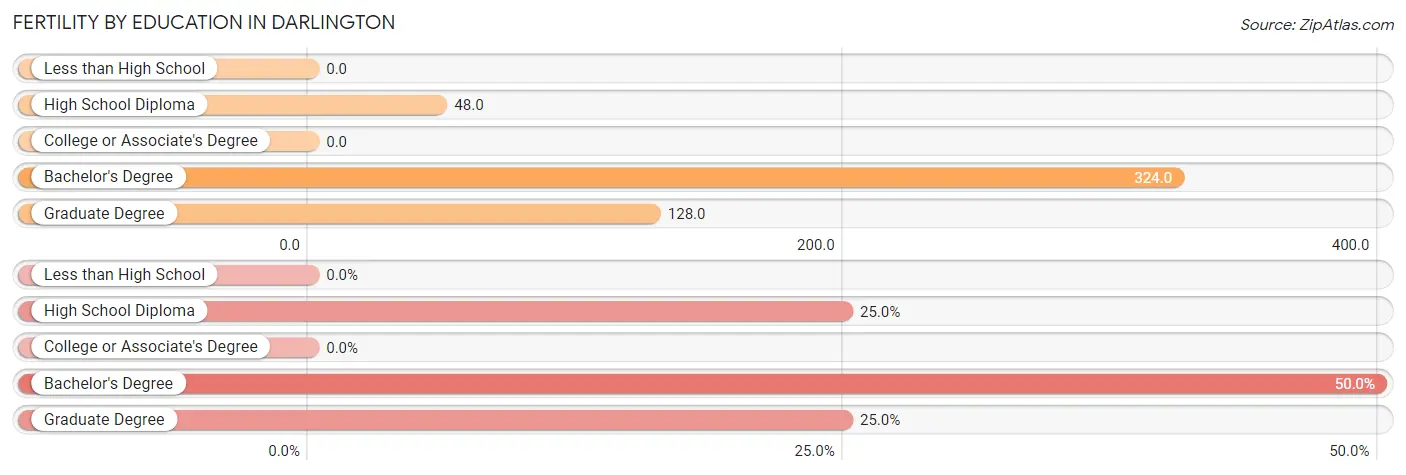
| Educational Attainment | Women with Births | Births / 1,000 Women |
| Less than High School | 0 (0.0%) | 0.0 |
| High School Diploma | 6 (25.0%) | 48.0 |
| College or Associate's Degree | 0 (0.0%) | 0.0 |
| Bachelor's Degree | 12 (50.0%) | 324.0 |
| Graduate Degree | 6 (25.0%) | 128.0 |
| Total | 24 (100.0%) | 54.0 |
Fertility by Education by Marriage Status in Darlington
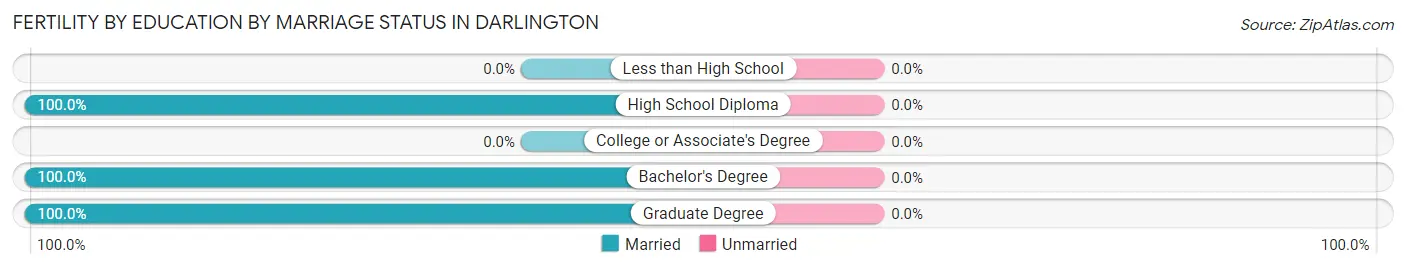
| Educational Attainment | Married | Unmarried |
| Less than High School | 0 (0.0%) | 0 (0.0%) |
| High School Diploma | 6 (100.0%) | 0 (0.0%) |
| College or Associate's Degree | 0 (0.0%) | 0 (0.0%) |
| Bachelor's Degree | 12 (100.0%) | 0 (0.0%) |
| Graduate Degree | 6 (100.0%) | 0 (0.0%) |
| Total | 24 (100.0%) | 0 (0.0%) |
Employment Characteristics in Darlington
Employment by Class of Employer in Darlington
Among the 1,148 employed individuals in Darlington, private company employees (836 | 72.8%), local government employees (117 | 10.2%), and state government employees (72 | 6.3%) make up the most common classes of employment.
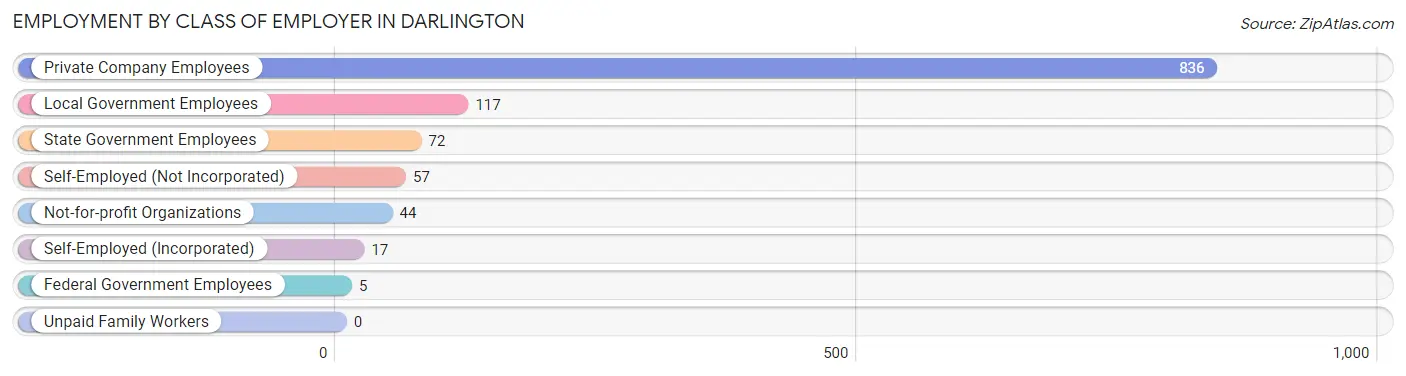
| Employer Class | # Employees | % Employees |
| Private Company Employees | 836 | 72.8% |
| Self-Employed (Incorporated) | 17 | 1.5% |
| Self-Employed (Not Incorporated) | 57 | 5.0% |
| Not-for-profit Organizations | 44 | 3.8% |
| Local Government Employees | 117 | 10.2% |
| State Government Employees | 72 | 6.3% |
| Federal Government Employees | 5 | 0.4% |
| Unpaid Family Workers | 0 | 0.0% |
| Total | 1,148 | 100.0% |
Employment Status by Age in Darlington
According to the labor force statistics for Darlington, out of the total population over 16 years of age (1,870), 64.0% or 1,197 individuals are in the labor force, with 1.9% or 23 of them unemployed. The age group with the highest labor force participation rate is 20 to 24 years, with 99.3% or 139 individuals in the labor force. Within the labor force, the 25 to 29 years age range has the highest percentage of unemployed individuals, with 12.5% or 14 of them being unemployed.
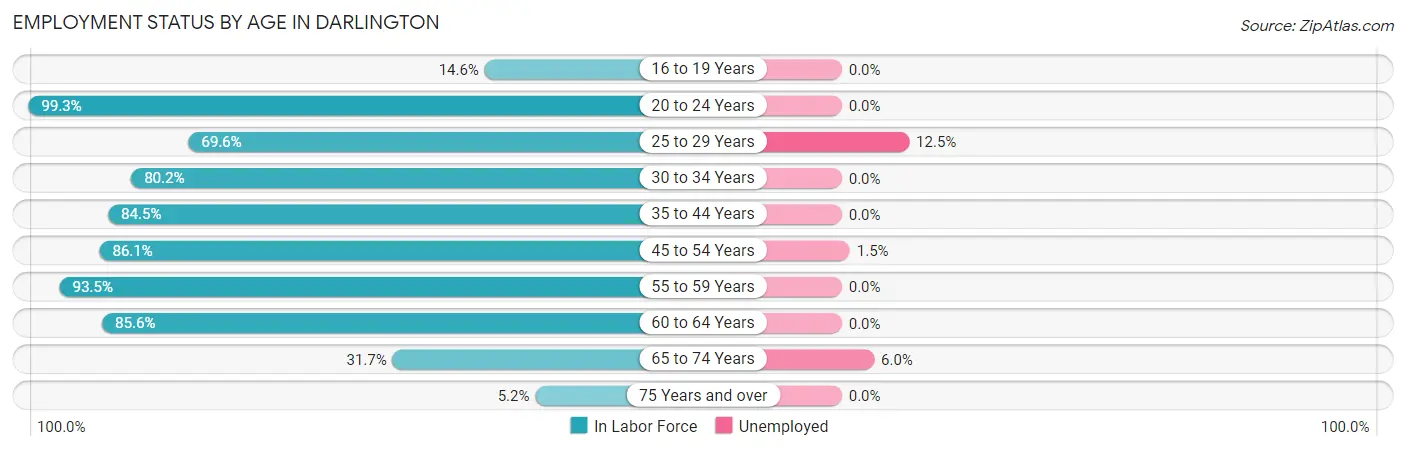
| Age Bracket | In Labor Force | Unemployed |
| 16 to 19 Years | 6 (14.6%) | 0 (0.0%) |
| 20 to 24 Years | 139 (99.3%) | 0 (0.0%) |
| 25 to 29 Years | 112 (69.6%) | 14 (12.5%) |
| 30 to 34 Years | 138 (80.2%) | 0 (0.0%) |
| 35 to 44 Years | 164 (84.5%) | 0 (0.0%) |
| 45 to 54 Years | 266 (86.1%) | 4 (1.5%) |
| 55 to 59 Years | 172 (93.5%) | 0 (0.0%) |
| 60 to 64 Years | 101 (85.6%) | 0 (0.0%) |
| 65 to 74 Years | 83 (31.7%) | 5 (6.0%) |
| 75 Years and over | 15 (5.2%) | 0 (0.0%) |
| Total | 1,197 (64.0%) | 23 (1.9%) |
Employment Status by Educational Attainment in Darlington
According to labor force statistics for Darlington, 83.7% of individuals (953) out of the total population between 25 and 64 years of age (1,138) are in the labor force, with 1.9% or 18 of them being unemployed. The group with the highest labor force participation rate are those with the educational attainment of bachelor's degree or higher, with 98.8% or 240 individuals in the labor force. Within the labor force, individuals with bachelor's degree or higher education have the highest percentage of unemployment, with 3.3% or 8 of them being unemployed.
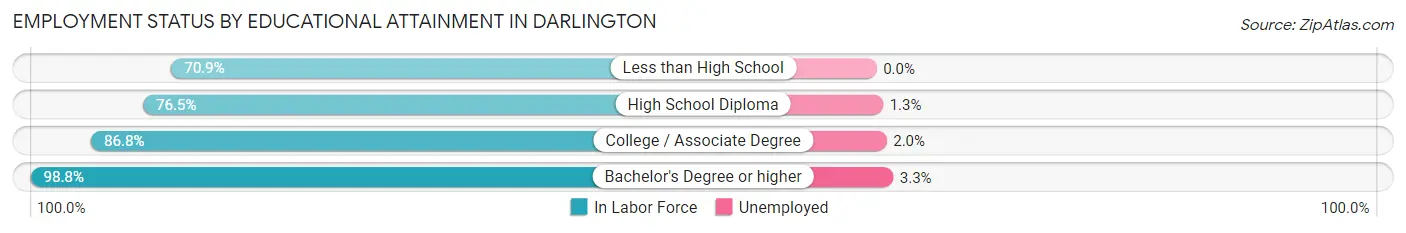
| Educational Attainment | In Labor Force | Unemployed |
| Less than High School | 95 (70.9%) | 0 (0.0%) |
| High School Diploma | 315 (76.5%) | 5 (1.3%) |
| College / Associate Degree | 303 (86.8%) | 7 (2.0%) |
| Bachelor's Degree or higher | 240 (98.8%) | 8 (3.3%) |
| Total | 953 (83.7%) | 22 (1.9%) |
Employment Occupations by Sex in Darlington
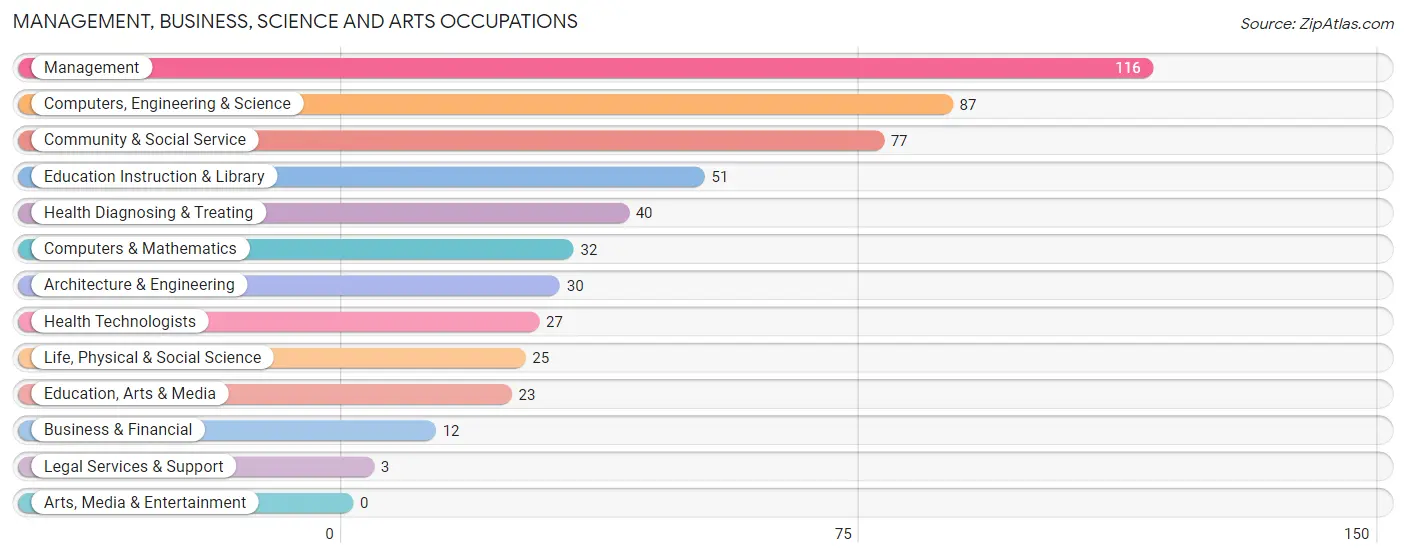
Management, Business, Science and Arts Occupations
The most common Management, Business, Science and Arts occupations in Darlington are Management (116 | 9.9%), Computers, Engineering & Science (87 | 7.4%), Community & Social Service (77 | 6.6%), Education Instruction & Library (51 | 4.3%), and Health Diagnosing & Treating (40 | 3.4%).
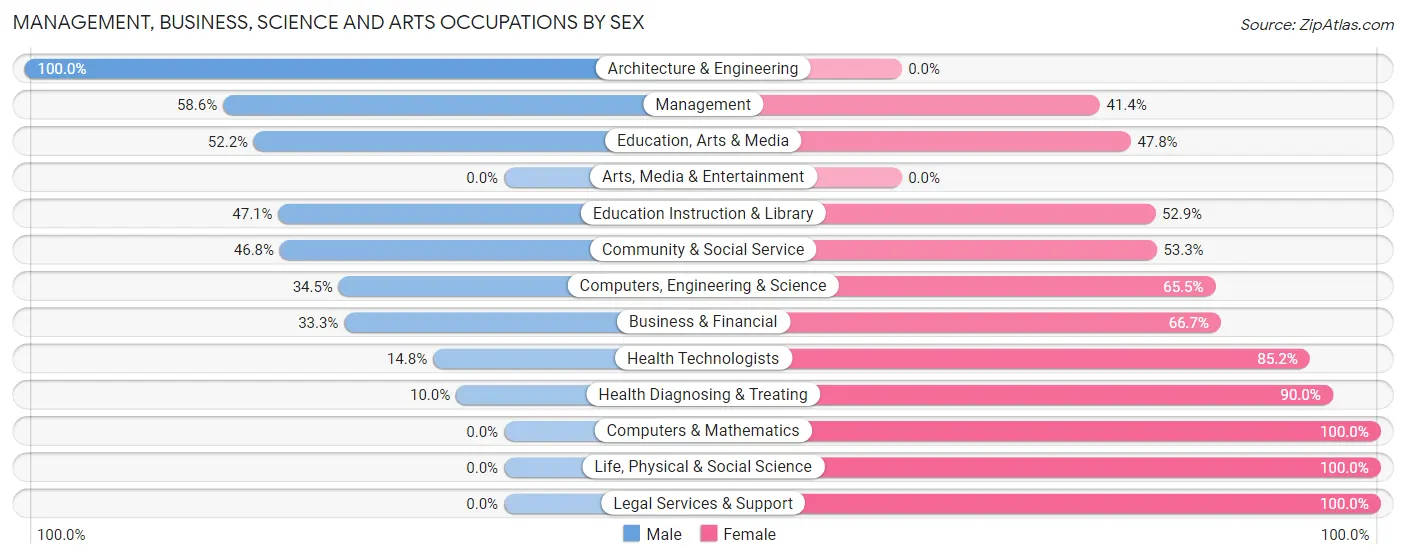
Management, Business, Science and Arts Occupations by Sex
Within the Management, Business, Science and Arts occupations in Darlington, the most male-oriented occupations are Architecture & Engineering (100.0%), Management (58.6%), and Education, Arts & Media (52.2%), while the most female-oriented occupations are Computers & Mathematics (100.0%), Life, Physical & Social Science (100.0%), and Legal Services & Support (100.0%).
| Occupation | Male | Female |
| Management | 68 (58.6%) | 48 (41.4%) |
| Business & Financial | 4 (33.3%) | 8 (66.7%) |
| Computers, Engineering & Science | 30 (34.5%) | 57 (65.5%) |
| Computers & Mathematics | 0 (0.0%) | 32 (100.0%) |
| Architecture & Engineering | 30 (100.0%) | 0 (0.0%) |
| Life, Physical & Social Science | 0 (0.0%) | 25 (100.0%) |
| Community & Social Service | 36 (46.8%) | 41 (53.2%) |
| Education, Arts & Media | 12 (52.2%) | 11 (47.8%) |
| Legal Services & Support | 0 (0.0%) | 3 (100.0%) |
| Education Instruction & Library | 24 (47.1%) | 27 (52.9%) |
| Arts, Media & Entertainment | 0 (0.0%) | 0 (0.0%) |
| Health Diagnosing & Treating | 4 (10.0%) | 36 (90.0%) |
| Health Technologists | 4 (14.8%) | 23 (85.2%) |
| Total (Category) | 142 (42.8%) | 190 (57.2%) |
| Total (Overall) | 660 (56.3%) | 513 (43.7%) |
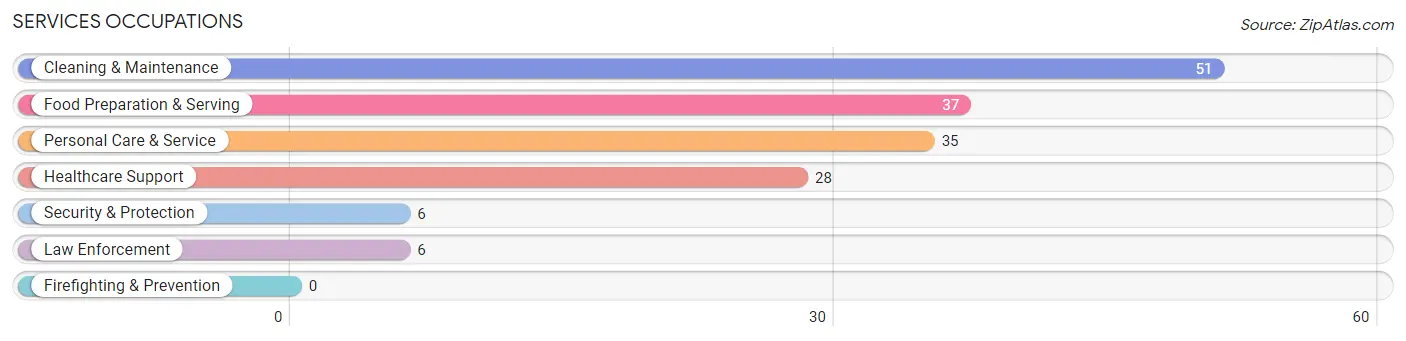
Services Occupations
The most common Services occupations in Darlington are Cleaning & Maintenance (51 | 4.3%), Food Preparation & Serving (37 | 3.2%), Personal Care & Service (35 | 3.0%), Healthcare Support (28 | 2.4%), and Security & Protection (6 | 0.5%).
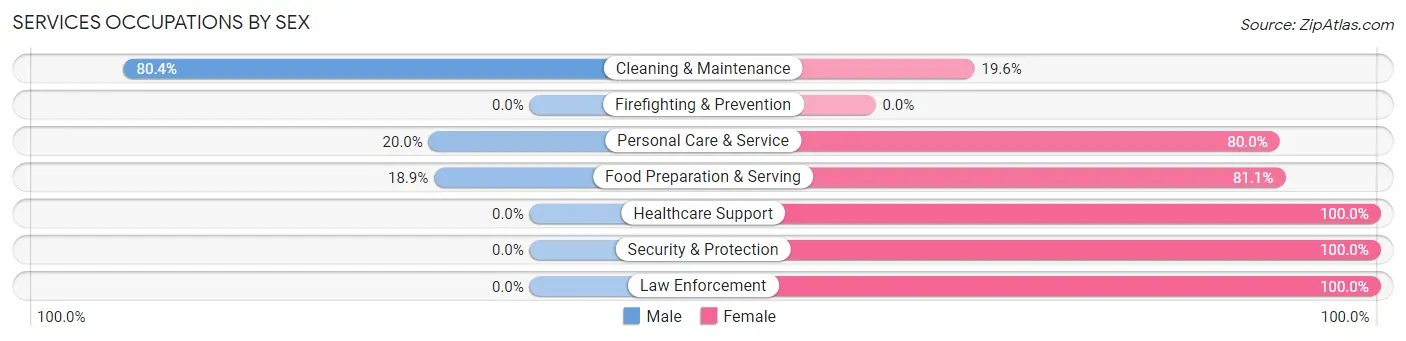
Services Occupations by Sex
Within the Services occupations in Darlington, the most male-oriented occupations are Cleaning & Maintenance (80.4%), Personal Care & Service (20.0%), and Food Preparation & Serving (18.9%), while the most female-oriented occupations are Healthcare Support (100.0%), Security & Protection (100.0%), and Law Enforcement (100.0%).
| Occupation | Male | Female |
| Healthcare Support | 0 (0.0%) | 28 (100.0%) |
| Security & Protection | 0 (0.0%) | 6 (100.0%) |
| Firefighting & Prevention | 0 (0.0%) | 0 (0.0%) |
| Law Enforcement | 0 (0.0%) | 6 (100.0%) |
| Food Preparation & Serving | 7 (18.9%) | 30 (81.1%) |
| Cleaning & Maintenance | 41 (80.4%) | 10 (19.6%) |
| Personal Care & Service | 7 (20.0%) | 28 (80.0%) |
| Total (Category) | 55 (35.0%) | 102 (65.0%) |
| Total (Overall) | 660 (56.3%) | 513 (43.7%) |
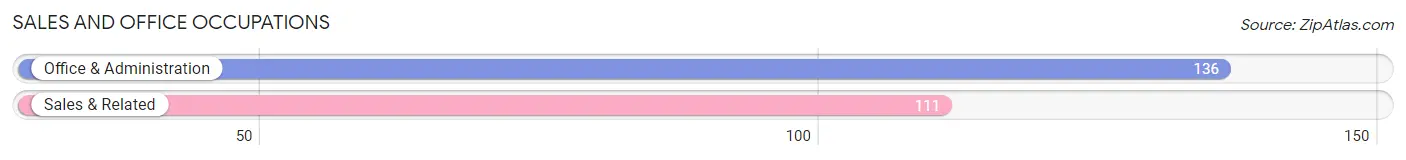
Sales and Office Occupations
The most common Sales and Office occupations in Darlington are Office & Administration (136 | 11.6%), and Sales & Related (111 | 9.5%).
Sales and Office Occupations by Sex
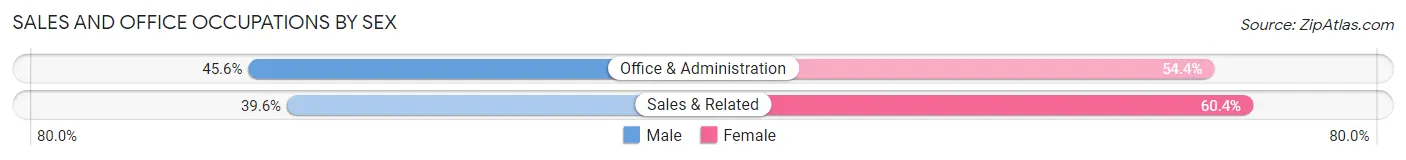
| Occupation | Male | Female |
| Sales & Related | 44 (39.6%) | 67 (60.4%) |
| Office & Administration | 62 (45.6%) | 74 (54.4%) |
| Total (Category) | 106 (42.9%) | 141 (57.1%) |
| Total (Overall) | 660 (56.3%) | 513 (43.7%) |
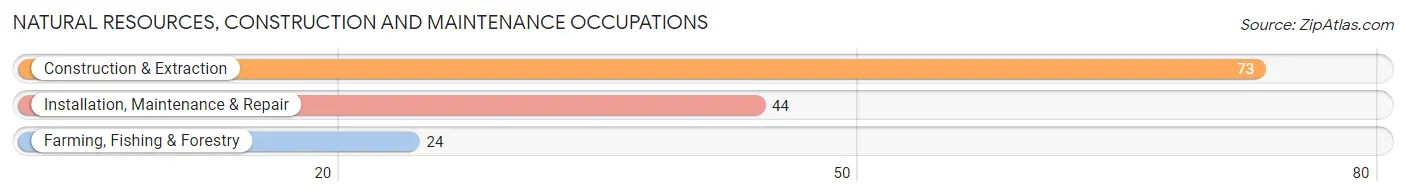
Natural Resources, Construction and Maintenance Occupations
The most common Natural Resources, Construction and Maintenance occupations in Darlington are Construction & Extraction (73 | 6.2%), Installation, Maintenance & Repair (44 | 3.7%), and Farming, Fishing & Forestry (24 | 2.1%).
Natural Resources, Construction and Maintenance Occupations by Sex
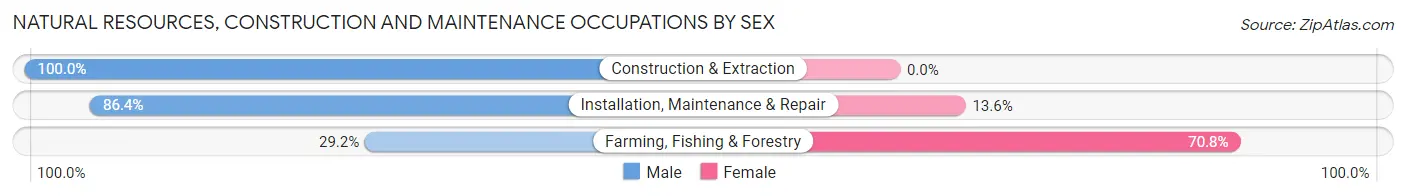
| Occupation | Male | Female |
| Farming, Fishing & Forestry | 7 (29.2%) | 17 (70.8%) |
| Construction & Extraction | 73 (100.0%) | 0 (0.0%) |
| Installation, Maintenance & Repair | 38 (86.4%) | 6 (13.6%) |
| Total (Category) | 118 (83.7%) | 23 (16.3%) |
| Total (Overall) | 660 (56.3%) | 513 (43.7%) |
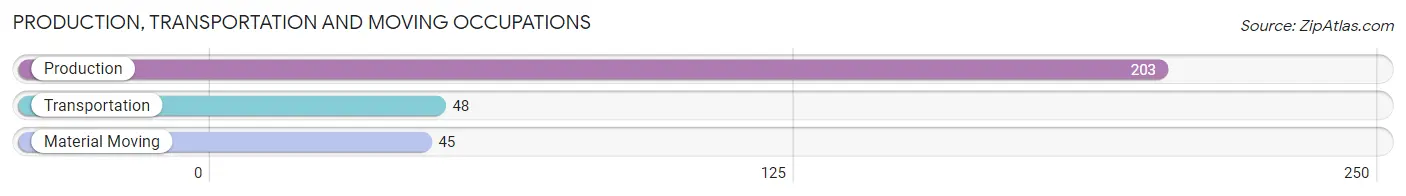
Production, Transportation and Moving Occupations
The most common Production, Transportation and Moving occupations in Darlington are Production (203 | 17.3%), Transportation (48 | 4.1%), and Material Moving (45 | 3.8%).
Production, Transportation and Moving Occupations by Sex
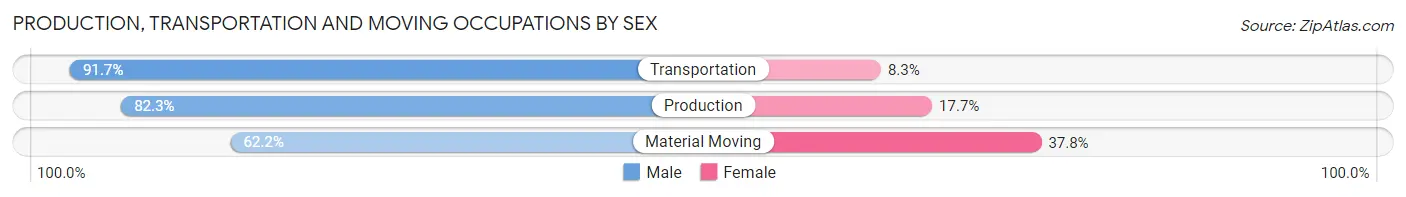
| Occupation | Male | Female |
| Production | 167 (82.3%) | 36 (17.7%) |
| Transportation | 44 (91.7%) | 4 (8.3%) |
| Material Moving | 28 (62.2%) | 17 (37.8%) |
| Total (Category) | 239 (80.7%) | 57 (19.3%) |
| Total (Overall) | 660 (56.3%) | 513 (43.7%) |
Employment Industries by Sex in Darlington
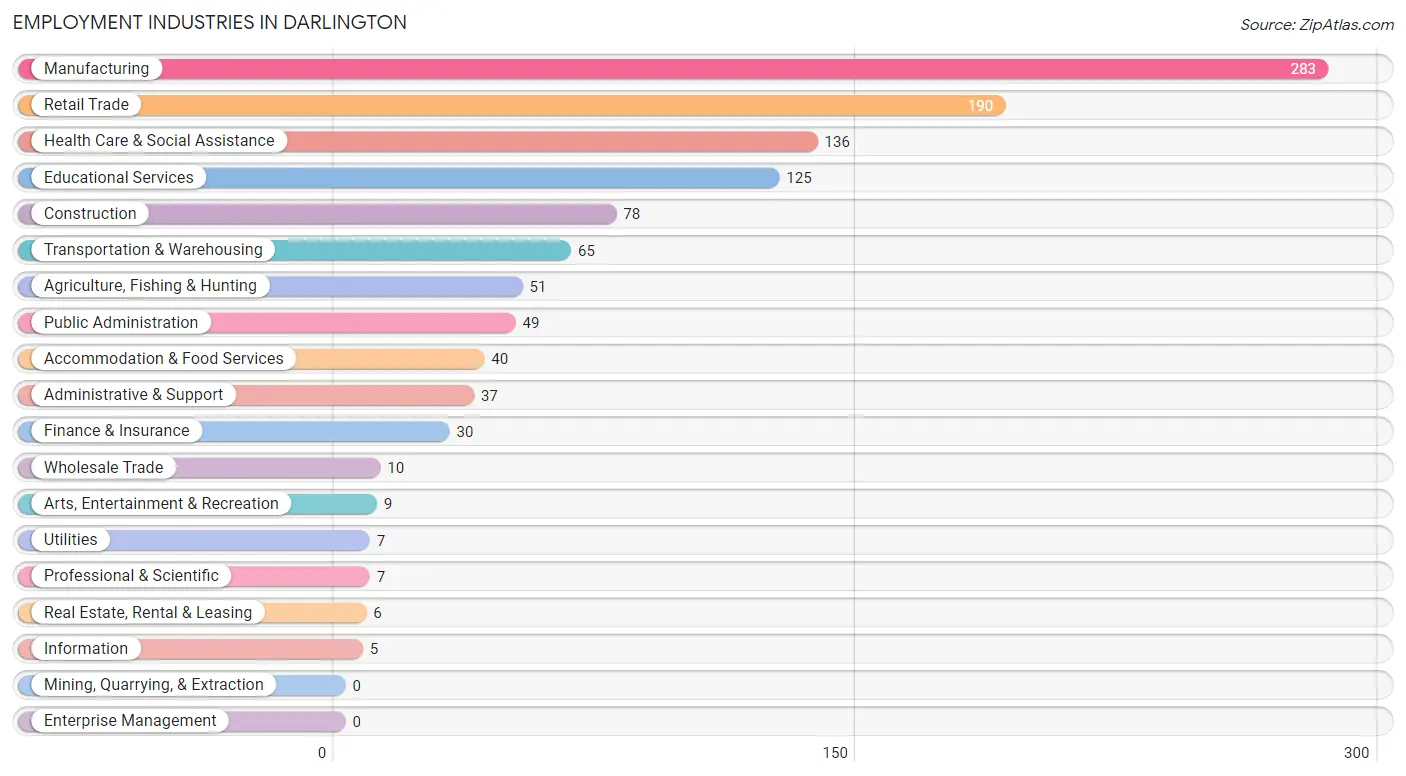
Employment Industries in Darlington
The major employment industries in Darlington include Manufacturing (283 | 24.1%), Retail Trade (190 | 16.2%), Health Care & Social Assistance (136 | 11.6%), Educational Services (125 | 10.7%), and Construction (78 | 6.7%).
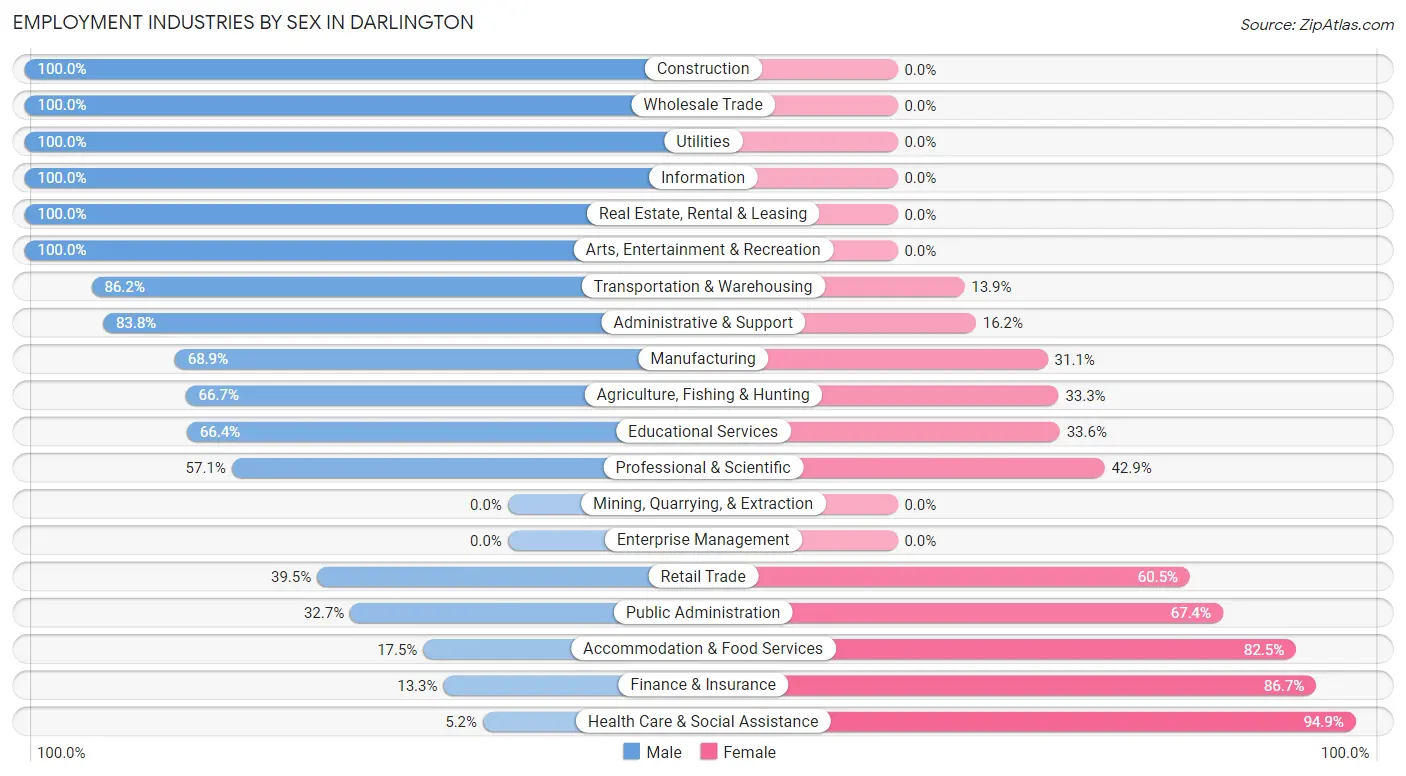
Employment Industries by Sex in Darlington
The Darlington industries that see more men than women are Construction (100.0%), Wholesale Trade (100.0%), and Utilities (100.0%), whereas the industries that tend to have a higher number of women are Health Care & Social Assistance (94.9%), Finance & Insurance (86.7%), and Accommodation & Food Services (82.5%).
| Industry | Male | Female |
| Agriculture, Fishing & Hunting | 34 (66.7%) | 17 (33.3%) |
| Mining, Quarrying, & Extraction | 0 (0.0%) | 0 (0.0%) |
| Construction | 78 (100.0%) | 0 (0.0%) |
| Manufacturing | 195 (68.9%) | 88 (31.1%) |
| Wholesale Trade | 10 (100.0%) | 0 (0.0%) |
| Retail Trade | 75 (39.5%) | 115 (60.5%) |
| Transportation & Warehousing | 56 (86.2%) | 9 (13.9%) |
| Utilities | 7 (100.0%) | 0 (0.0%) |
| Information | 5 (100.0%) | 0 (0.0%) |
| Finance & Insurance | 4 (13.3%) | 26 (86.7%) |
| Real Estate, Rental & Leasing | 6 (100.0%) | 0 (0.0%) |
| Professional & Scientific | 4 (57.1%) | 3 (42.9%) |
| Enterprise Management | 0 (0.0%) | 0 (0.0%) |
| Administrative & Support | 31 (83.8%) | 6 (16.2%) |
| Educational Services | 83 (66.4%) | 42 (33.6%) |
| Health Care & Social Assistance | 7 (5.1%) | 129 (94.9%) |
| Arts, Entertainment & Recreation | 9 (100.0%) | 0 (0.0%) |
| Accommodation & Food Services | 7 (17.5%) | 33 (82.5%) |
| Public Administration | 16 (32.7%) | 33 (67.3%) |
| Total | 660 (56.3%) | 513 (43.7%) |
Education in Darlington
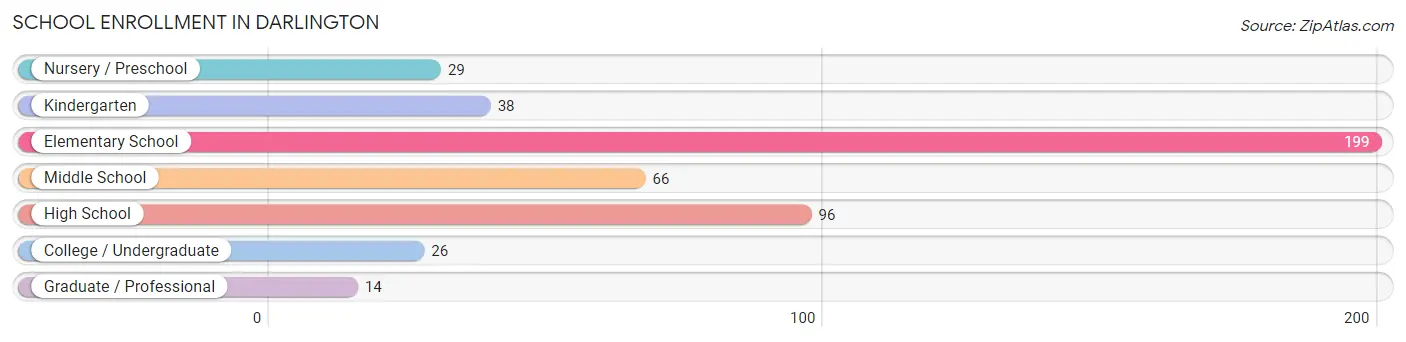
School Enrollment in Darlington
The most common levels of schooling among the 468 students in Darlington are elementary school (199 | 42.5%), high school (96 | 20.5%), and middle school (66 | 14.1%).
| School Level | # Students | % Students |
| Nursery / Preschool | 29 | 6.2% |
| Kindergarten | 38 | 8.1% |
| Elementary School | 199 | 42.5% |
| Middle School | 66 | 14.1% |
| High School | 96 | 20.5% |
| College / Undergraduate | 26 | 5.6% |
| Graduate / Professional | 14 | 3.0% |
| Total | 468 | 100.0% |
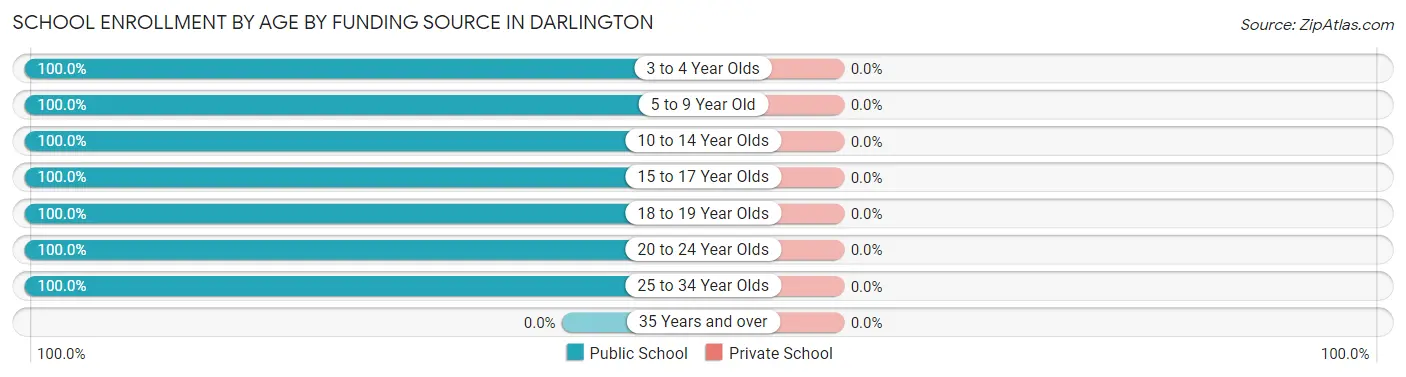
School Enrollment by Age by Funding Source in Darlington
| Age Bracket | Public School | Private School |
| 3 to 4 Year Olds | 19 (100.0%) | 0 (0.0%) |
| 5 to 9 Year Old | 238 (100.0%) | 0 (0.0%) |
| 10 to 14 Year Olds | 75 (100.0%) | 0 (0.0%) |
| 15 to 17 Year Olds | 96 (100.0%) | 0 (0.0%) |
| 18 to 19 Year Olds | 8 (100.0%) | 0 (0.0%) |
| 20 to 24 Year Olds | 10 (100.0%) | 0 (0.0%) |
| 25 to 34 Year Olds | 22 (100.0%) | 0 (0.0%) |
| 35 Years and over | 0 (0.0%) | 0 (0.0%) |
| Total | 468 (100.0%) | 0 (0.0%) |
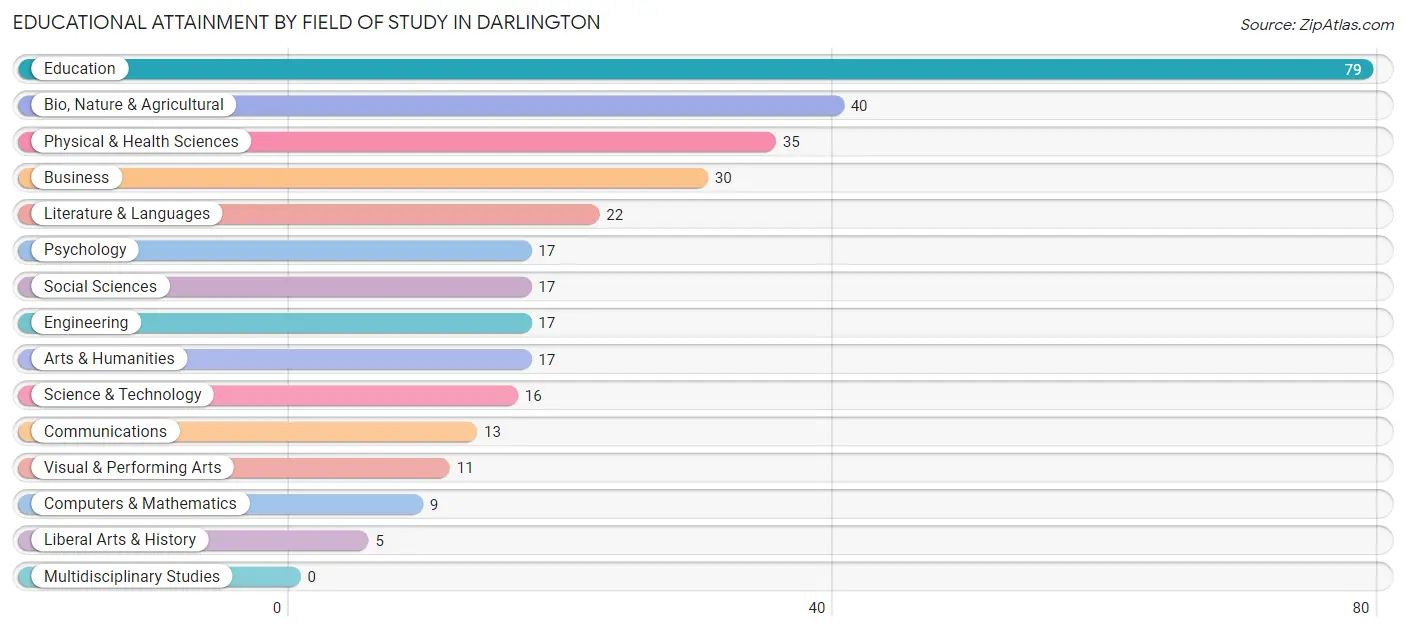
Educational Attainment by Field of Study in Darlington
Education (79 | 24.1%), bio, nature & agricultural (40 | 12.2%), physical & health sciences (35 | 10.7%), business (30 | 9.1%), and literature & languages (22 | 6.7%) are the most common fields of study among 328 individuals in Darlington who have obtained a bachelor's degree or higher.
| Field of Study | # Graduates | % Graduates |
| Computers & Mathematics | 9 | 2.7% |
| Bio, Nature & Agricultural | 40 | 12.2% |
| Physical & Health Sciences | 35 | 10.7% |
| Psychology | 17 | 5.2% |
| Social Sciences | 17 | 5.2% |
| Engineering | 17 | 5.2% |
| Multidisciplinary Studies | 0 | 0.0% |
| Science & Technology | 16 | 4.9% |
| Business | 30 | 9.1% |
| Education | 79 | 24.1% |
| Literature & Languages | 22 | 6.7% |
| Liberal Arts & History | 5 | 1.5% |
| Visual & Performing Arts | 11 | 3.4% |
| Communications | 13 | 4.0% |
| Arts & Humanities | 17 | 5.2% |
| Total | 328 | 100.0% |
Transportation & Commute in Darlington
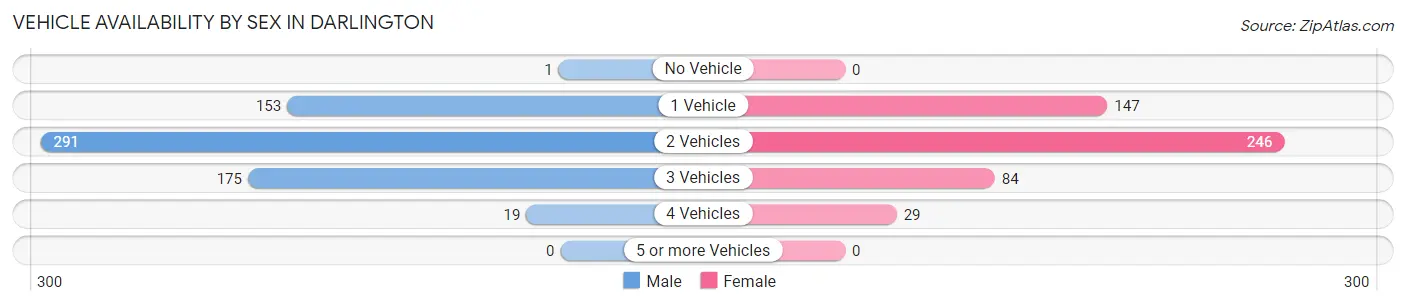
Vehicle Availability by Sex in Darlington
The most prevalent vehicle ownership categories in Darlington are males with 2 vehicles (291, accounting for 45.5%) and females with 2 vehicles (246, making up 57.5%).
| Vehicles Available | Male | Female |
| No Vehicle | 1 (0.2%) | 0 (0.0%) |
| 1 Vehicle | 153 (23.9%) | 147 (29.0%) |
| 2 Vehicles | 291 (45.5%) | 246 (48.6%) |
| 3 Vehicles | 175 (27.4%) | 84 (16.6%) |
| 4 Vehicles | 19 (3.0%) | 29 (5.7%) |
| 5 or more Vehicles | 0 (0.0%) | 0 (0.0%) |
| Total | 639 (100.0%) | 506 (100.0%) |
Commute Time in Darlington
The most frequently occuring commute durations in Darlington are 5 to 9 minutes (399 commuters, 37.6%), 10 to 14 minutes (127 commuters, 12.0%), and 15 to 19 minutes (101 commuters, 9.5%).
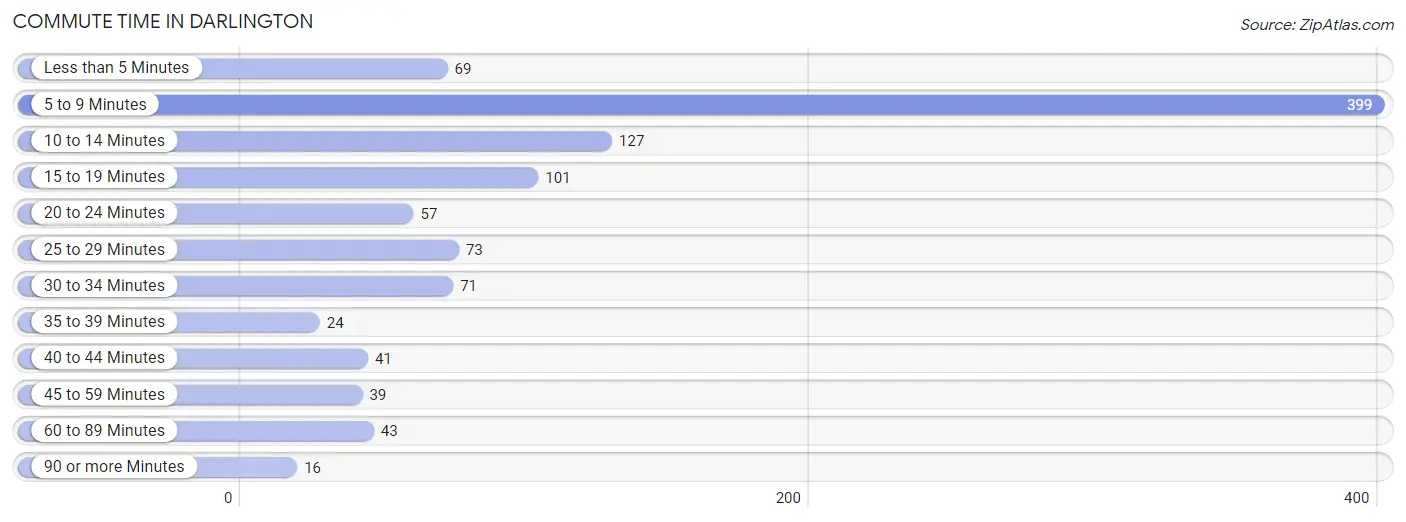
| Commute Time | # Commuters | % Commuters |
| Less than 5 Minutes | 69 | 6.5% |
| 5 to 9 Minutes | 399 | 37.6% |
| 10 to 14 Minutes | 127 | 12.0% |
| 15 to 19 Minutes | 101 | 9.5% |
| 20 to 24 Minutes | 57 | 5.4% |
| 25 to 29 Minutes | 73 | 6.9% |
| 30 to 34 Minutes | 71 | 6.7% |
| 35 to 39 Minutes | 24 | 2.3% |
| 40 to 44 Minutes | 41 | 3.9% |
| 45 to 59 Minutes | 39 | 3.7% |
| 60 to 89 Minutes | 43 | 4.1% |
| 90 or more Minutes | 16 | 1.5% |
Commute Time by Sex in Darlington
The most common commute times in Darlington are 5 to 9 minutes (211 commuters, 34.5%) for males and 5 to 9 minutes (188 commuters, 41.9%) for females.
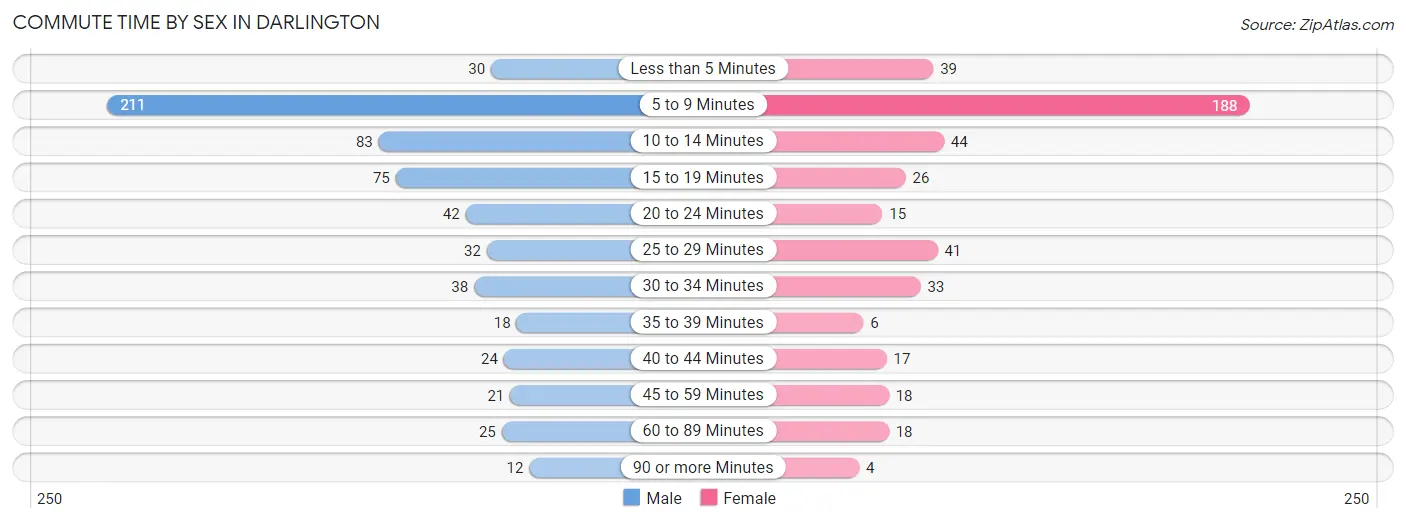
| Commute Time | Male | Female |
| Less than 5 Minutes | 30 (4.9%) | 39 (8.7%) |
| 5 to 9 Minutes | 211 (34.5%) | 188 (41.9%) |
| 10 to 14 Minutes | 83 (13.6%) | 44 (9.8%) |
| 15 to 19 Minutes | 75 (12.3%) | 26 (5.8%) |
| 20 to 24 Minutes | 42 (6.9%) | 15 (3.3%) |
| 25 to 29 Minutes | 32 (5.2%) | 41 (9.1%) |
| 30 to 34 Minutes | 38 (6.2%) | 33 (7.3%) |
| 35 to 39 Minutes | 18 (2.9%) | 6 (1.3%) |
| 40 to 44 Minutes | 24 (3.9%) | 17 (3.8%) |
| 45 to 59 Minutes | 21 (3.4%) | 18 (4.0%) |
| 60 to 89 Minutes | 25 (4.1%) | 18 (4.0%) |
| 90 or more Minutes | 12 (2.0%) | 4 (0.9%) |
Time of Departure to Work by Sex in Darlington
The most frequent times of departure to work in Darlington are 7:30 AM to 7:59 AM (105, 17.2%) for males and 7:00 AM to 7:29 AM (121, 27.0%) for females.
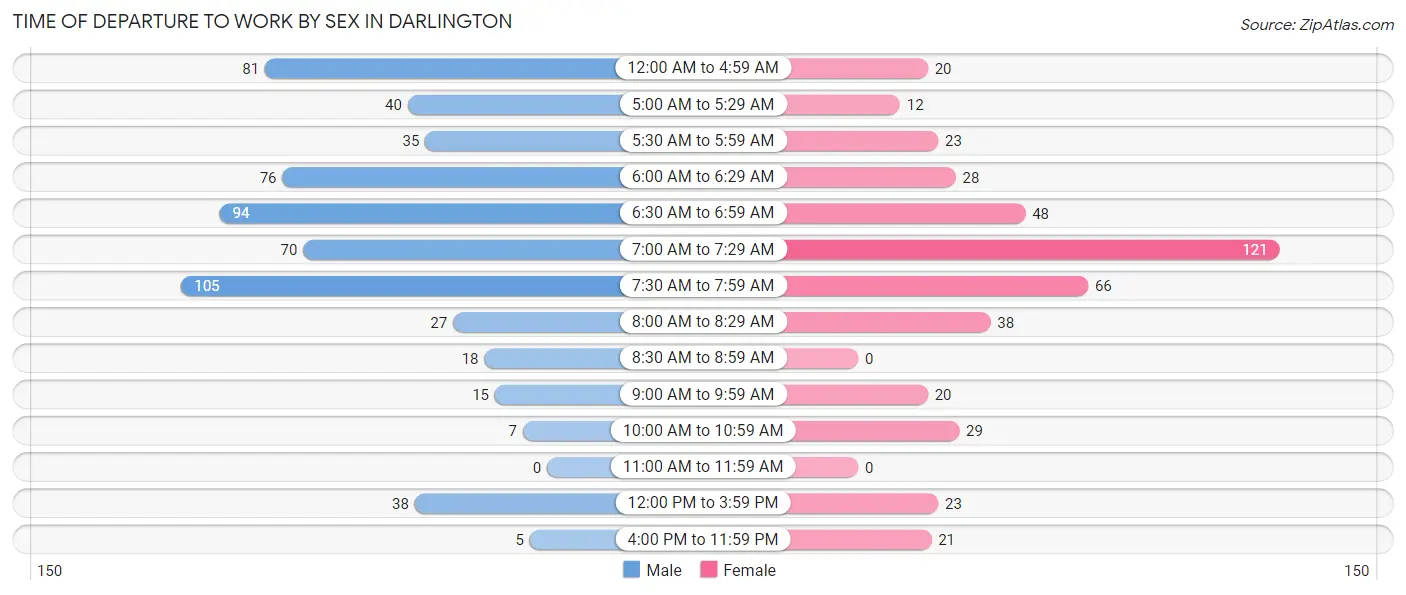
| Time of Departure | Male | Female |
| 12:00 AM to 4:59 AM | 81 (13.3%) | 20 (4.4%) |
| 5:00 AM to 5:29 AM | 40 (6.6%) | 12 (2.7%) |
| 5:30 AM to 5:59 AM | 35 (5.7%) | 23 (5.1%) |
| 6:00 AM to 6:29 AM | 76 (12.4%) | 28 (6.2%) |
| 6:30 AM to 6:59 AM | 94 (15.4%) | 48 (10.7%) |
| 7:00 AM to 7:29 AM | 70 (11.5%) | 121 (27.0%) |
| 7:30 AM to 7:59 AM | 105 (17.2%) | 66 (14.7%) |
| 8:00 AM to 8:29 AM | 27 (4.4%) | 38 (8.5%) |
| 8:30 AM to 8:59 AM | 18 (2.9%) | 0 (0.0%) |
| 9:00 AM to 9:59 AM | 15 (2.5%) | 20 (4.4%) |
| 10:00 AM to 10:59 AM | 7 (1.1%) | 29 (6.5%) |
| 11:00 AM to 11:59 AM | 0 (0.0%) | 0 (0.0%) |
| 12:00 PM to 3:59 PM | 38 (6.2%) | 23 (5.1%) |
| 4:00 PM to 11:59 PM | 5 (0.8%) | 21 (4.7%) |
| Total | 611 (100.0%) | 449 (100.0%) |
Housing Occupancy in Darlington
Occupancy by Ownership in Darlington
Of the total 1,024 dwellings in Darlington, owner-occupied units account for 694 (67.8%), while renter-occupied units make up 330 (32.2%).
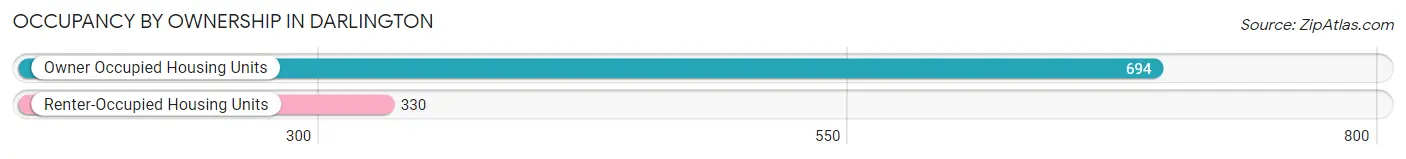
| Occupancy | # Housing Units | % Housing Units |
| Owner Occupied Housing Units | 694 | 67.8% |
| Renter-Occupied Housing Units | 330 | 32.2% |
| Total Occupied Housing Units | 1,024 | 100.0% |
Occupancy by Household Size in Darlington
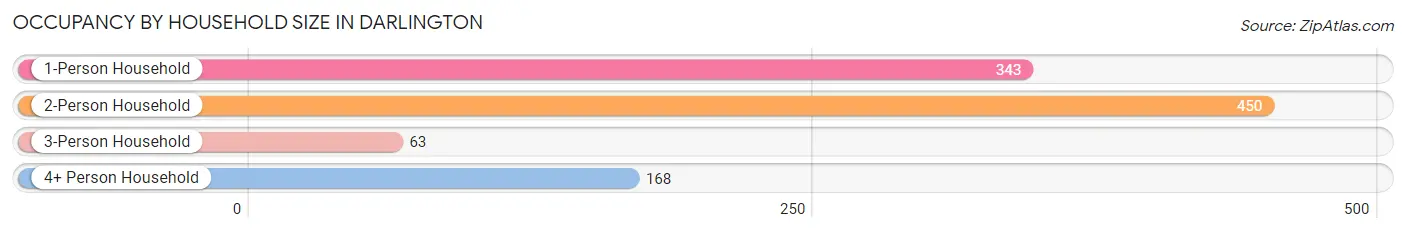
| Household Size | # Housing Units | % Housing Units |
| 1-Person Household | 343 | 33.5% |
| 2-Person Household | 450 | 44.0% |
| 3-Person Household | 63 | 6.1% |
| 4+ Person Household | 168 | 16.4% |
| Total Housing Units | 1,024 | 100.0% |
Occupancy by Ownership by Household Size in Darlington
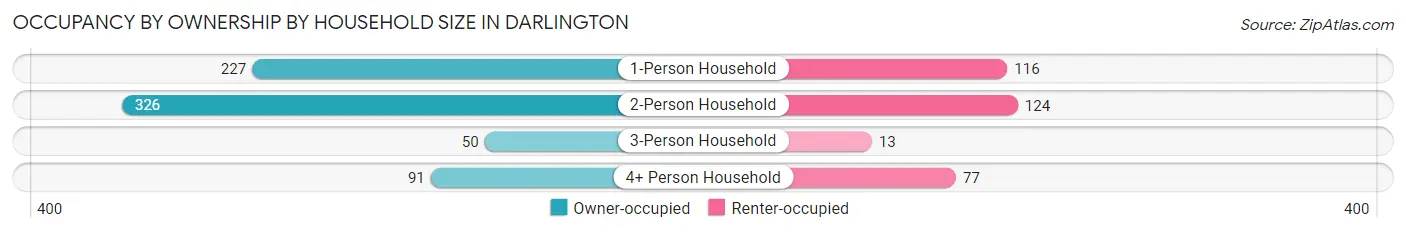
| Household Size | Owner-occupied | Renter-occupied |
| 1-Person Household | 227 (66.2%) | 116 (33.8%) |
| 2-Person Household | 326 (72.4%) | 124 (27.6%) |
| 3-Person Household | 50 (79.4%) | 13 (20.6%) |
| 4+ Person Household | 91 (54.2%) | 77 (45.8%) |
| Total Housing Units | 694 (67.8%) | 330 (32.2%) |
Occupancy by Educational Attainment in Darlington
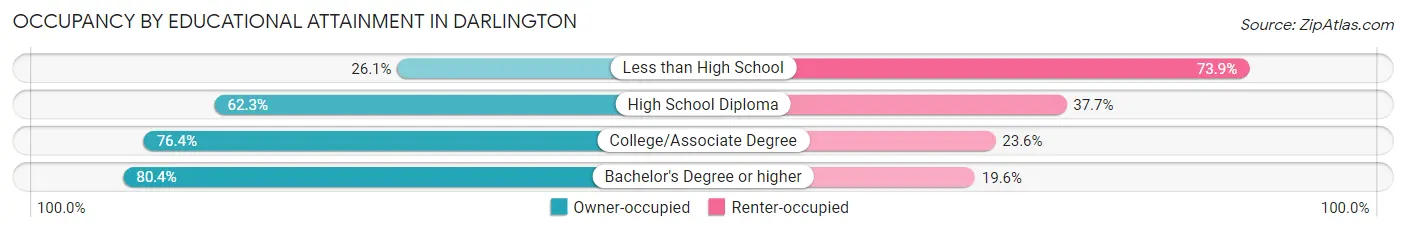
| Household Size | Owner-occupied | Renter-occupied |
| Less than High School | 30 (26.1%) | 85 (73.9%) |
| High School Diploma | 167 (62.3%) | 101 (37.7%) |
| College/Associate Degree | 349 (76.4%) | 108 (23.6%) |
| Bachelor's Degree or higher | 148 (80.4%) | 36 (19.6%) |
Occupancy by Age of Householder in Darlington
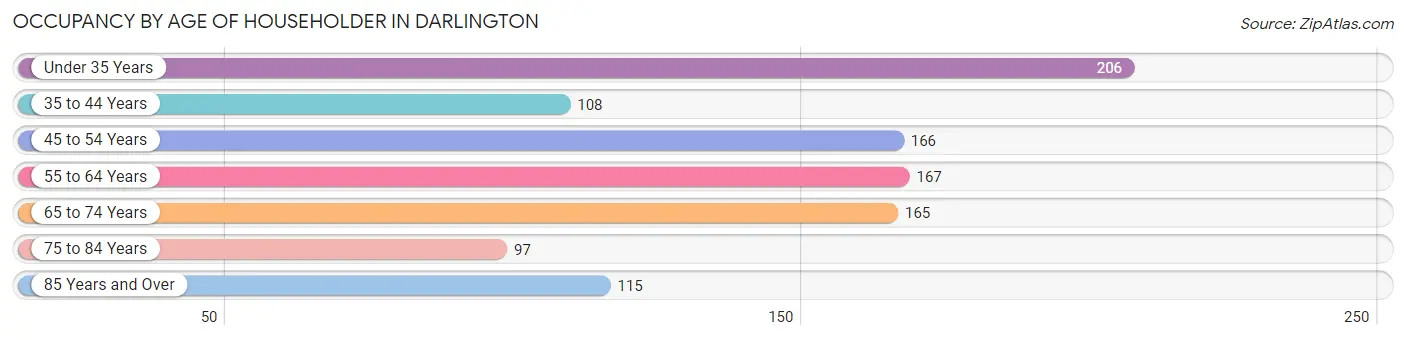
| Age Bracket | # Households | % Households |
| Under 35 Years | 206 | 20.1% |
| 35 to 44 Years | 108 | 10.5% |
| 45 to 54 Years | 166 | 16.2% |
| 55 to 64 Years | 167 | 16.3% |
| 65 to 74 Years | 165 | 16.1% |
| 75 to 84 Years | 97 | 9.5% |
| 85 Years and Over | 115 | 11.2% |
| Total | 1,024 | 100.0% |
Housing Finances in Darlington
Median Income by Occupancy in Darlington
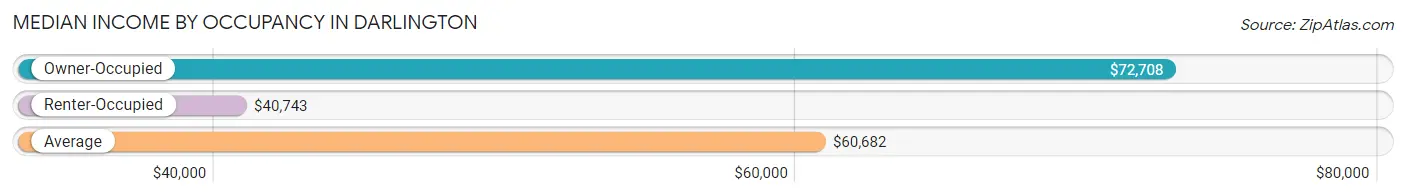
| Occupancy Type | # Households | Median Income |
| Owner-Occupied | 694 (67.8%) | $72,708 |
| Renter-Occupied | 330 (32.2%) | $40,743 |
| Average | 1,024 (100.0%) | $60,682 |
Occupancy by Householder Income Bracket in Darlington
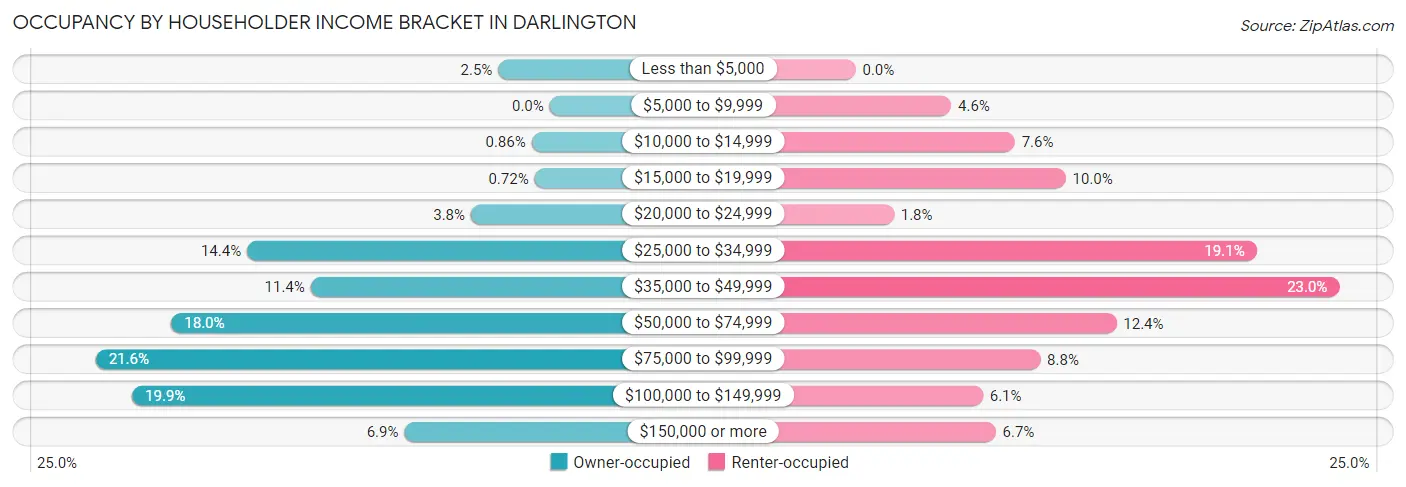
| Income Bracket | Owner-occupied | Renter-occupied |
| Less than $5,000 | 17 (2.5%) | 0 (0.0%) |
| $5,000 to $9,999 | 0 (0.0%) | 15 (4.5%) |
| $10,000 to $14,999 | 6 (0.9%) | 25 (7.6%) |
| $15,000 to $19,999 | 5 (0.7%) | 33 (10.0%) |
| $20,000 to $24,999 | 26 (3.7%) | 6 (1.8%) |
| $25,000 to $34,999 | 100 (14.4%) | 63 (19.1%) |
| $35,000 to $49,999 | 79 (11.4%) | 76 (23.0%) |
| $50,000 to $74,999 | 125 (18.0%) | 41 (12.4%) |
| $75,000 to $99,999 | 150 (21.6%) | 29 (8.8%) |
| $100,000 to $149,999 | 138 (19.9%) | 20 (6.1%) |
| $150,000 or more | 48 (6.9%) | 22 (6.7%) |
| Total | 694 (100.0%) | 330 (100.0%) |
Monthly Housing Cost Tiers in Darlington
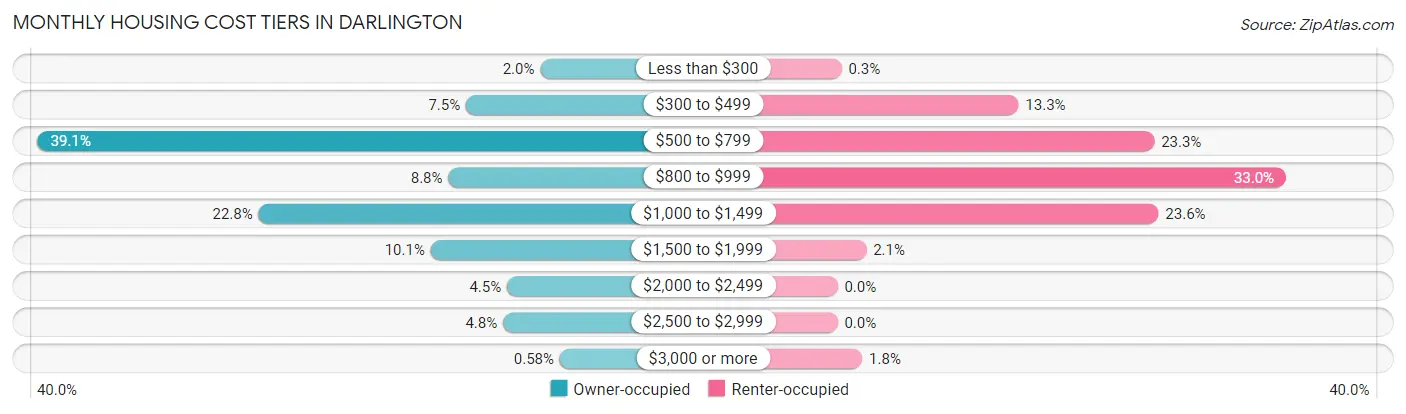
| Monthly Cost | Owner-occupied | Renter-occupied |
| Less than $300 | 14 (2.0%) | 1 (0.3%) |
| $300 to $499 | 52 (7.5%) | 44 (13.3%) |
| $500 to $799 | 271 (39.1%) | 77 (23.3%) |
| $800 to $999 | 61 (8.8%) | 109 (33.0%) |
| $1,000 to $1,499 | 158 (22.8%) | 78 (23.6%) |
| $1,500 to $1,999 | 70 (10.1%) | 7 (2.1%) |
| $2,000 to $2,499 | 31 (4.5%) | 0 (0.0%) |
| $2,500 to $2,999 | 33 (4.8%) | 0 (0.0%) |
| $3,000 or more | 4 (0.6%) | 6 (1.8%) |
| Total | 694 (100.0%) | 330 (100.0%) |
Physical Housing Characteristics in Darlington
Housing Structures in Darlington
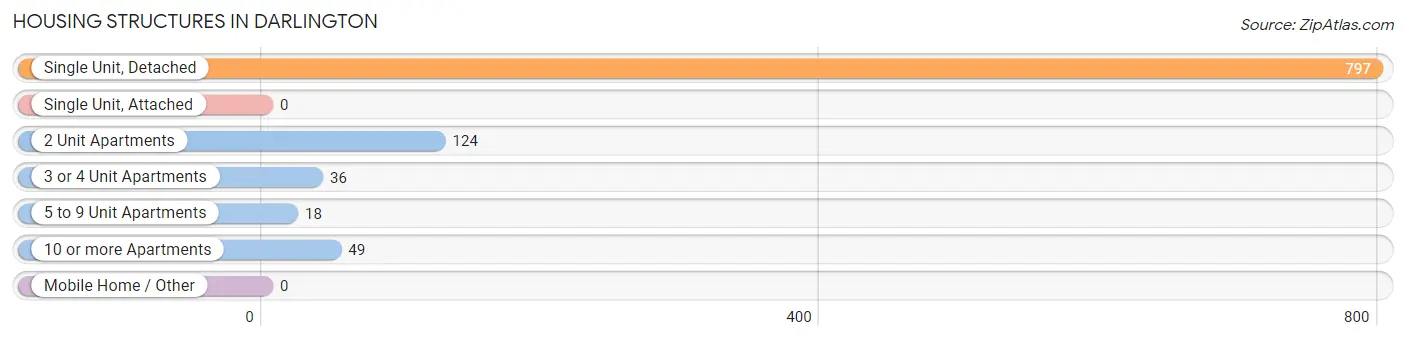
| Structure Type | # Housing Units | % Housing Units |
| Single Unit, Detached | 797 | 77.8% |
| Single Unit, Attached | 0 | 0.0% |
| 2 Unit Apartments | 124 | 12.1% |
| 3 or 4 Unit Apartments | 36 | 3.5% |
| 5 to 9 Unit Apartments | 18 | 1.8% |
| 10 or more Apartments | 49 | 4.8% |
| Mobile Home / Other | 0 | 0.0% |
| Total | 1,024 | 100.0% |
Housing Structures by Occupancy in Darlington
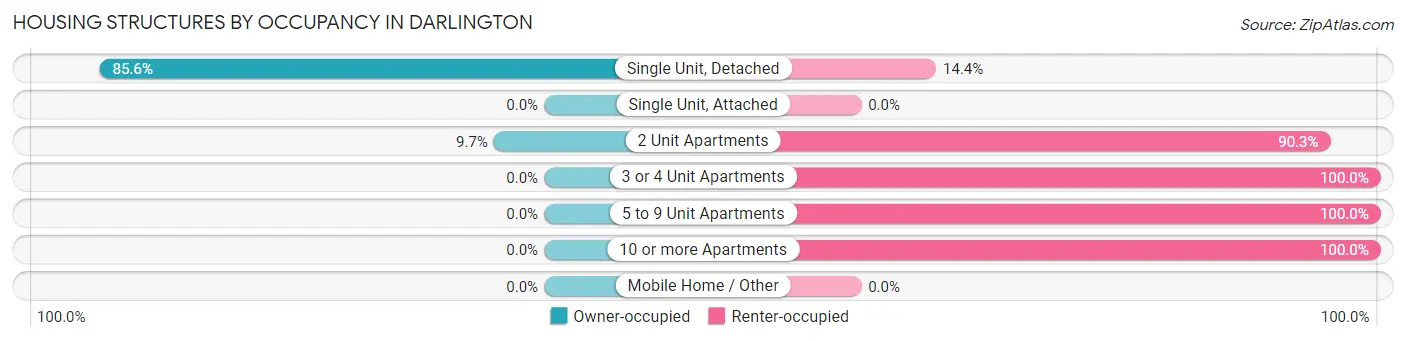
| Structure Type | Owner-occupied | Renter-occupied |
| Single Unit, Detached | 682 (85.6%) | 115 (14.4%) |
| Single Unit, Attached | 0 (0.0%) | 0 (0.0%) |
| 2 Unit Apartments | 12 (9.7%) | 112 (90.3%) |
| 3 or 4 Unit Apartments | 0 (0.0%) | 36 (100.0%) |
| 5 to 9 Unit Apartments | 0 (0.0%) | 18 (100.0%) |
| 10 or more Apartments | 0 (0.0%) | 49 (100.0%) |
| Mobile Home / Other | 0 (0.0%) | 0 (0.0%) |
| Total | 694 (67.8%) | 330 (32.2%) |
Housing Structures by Number of Rooms in Darlington
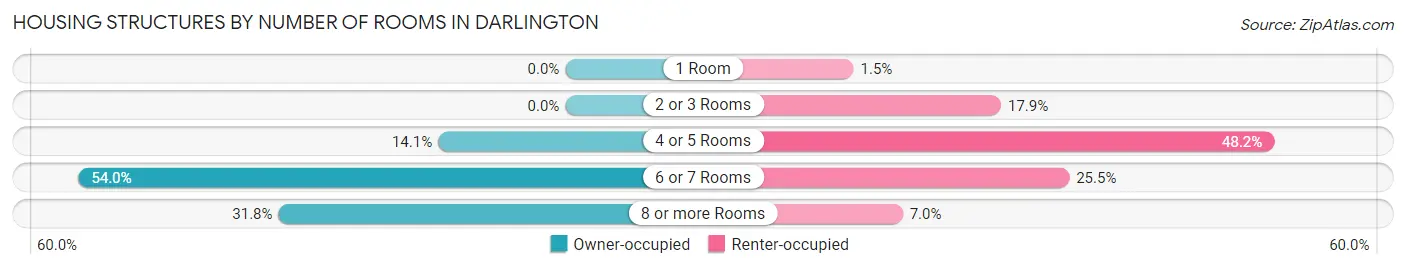
| Number of Rooms | Owner-occupied | Renter-occupied |
| 1 Room | 0 (0.0%) | 5 (1.5%) |
| 2 or 3 Rooms | 0 (0.0%) | 59 (17.9%) |
| 4 or 5 Rooms | 98 (14.1%) | 159 (48.2%) |
| 6 or 7 Rooms | 375 (54.0%) | 84 (25.5%) |
| 8 or more Rooms | 221 (31.8%) | 23 (7.0%) |
| Total | 694 (100.0%) | 330 (100.0%) |
Housing Structure by Heating Type in Darlington
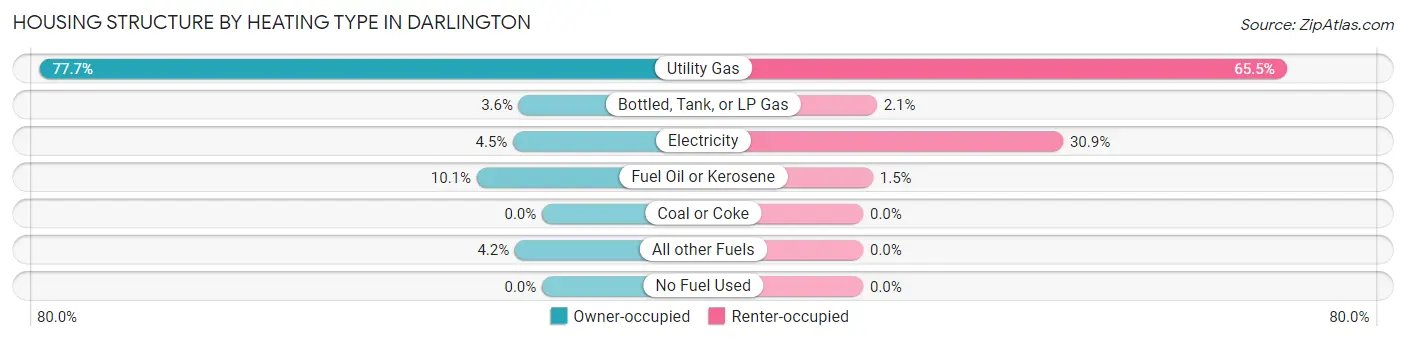
| Heating Type | Owner-occupied | Renter-occupied |
| Utility Gas | 539 (77.7%) | 216 (65.4%) |
| Bottled, Tank, or LP Gas | 25 (3.6%) | 7 (2.1%) |
| Electricity | 31 (4.5%) | 102 (30.9%) |
| Fuel Oil or Kerosene | 70 (10.1%) | 5 (1.5%) |
| Coal or Coke | 0 (0.0%) | 0 (0.0%) |
| All other Fuels | 29 (4.2%) | 0 (0.0%) |
| No Fuel Used | 0 (0.0%) | 0 (0.0%) |
| Total | 694 (100.0%) | 330 (100.0%) |
Household Vehicle Usage in Darlington
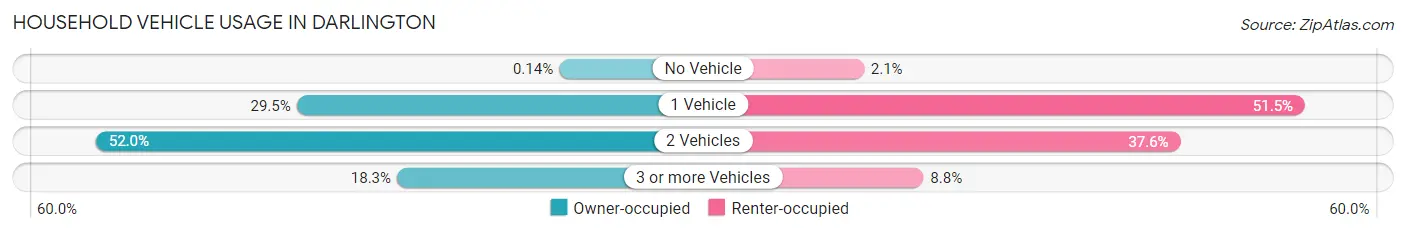
| Vehicles per Household | Owner-occupied | Renter-occupied |
| No Vehicle | 1 (0.1%) | 7 (2.1%) |
| 1 Vehicle | 205 (29.5%) | 170 (51.5%) |
| 2 Vehicles | 361 (52.0%) | 124 (37.6%) |
| 3 or more Vehicles | 127 (18.3%) | 29 (8.8%) |
| Total | 694 (100.0%) | 330 (100.0%) |
Real Estate & Mortgages in Darlington
Real Estate and Mortgage Overview in Darlington
| Characteristic | Without Mortgage | With Mortgage |
| Housing Units | 318 | 376 |
| Median Property Value | $119,700 | $119,000 |
| Median Household Income | $48,214 | $30 |
| Monthly Housing Costs | $563 | $4 |
| Real Estate Taxes | $3,228 | $4 |
Property Value by Mortgage Status in Darlington
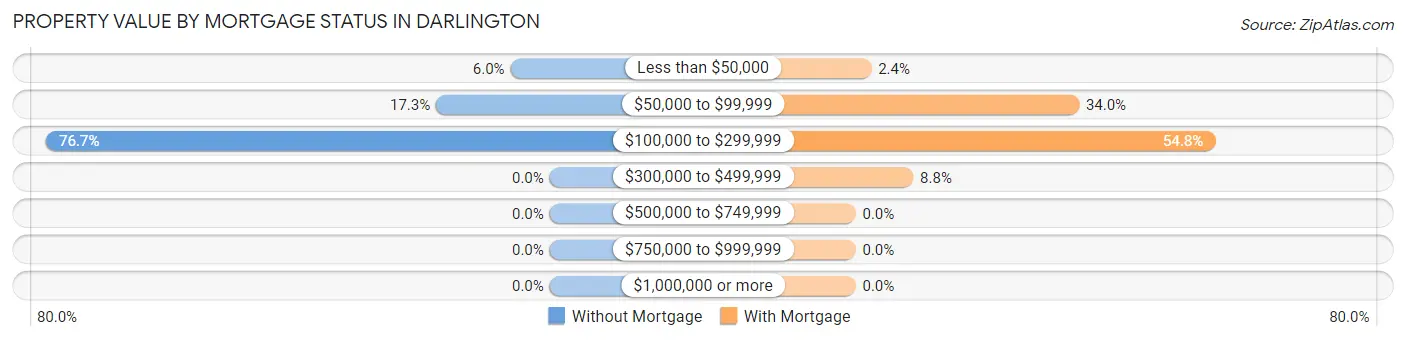
| Property Value | Without Mortgage | With Mortgage |
| Less than $50,000 | 19 (6.0%) | 9 (2.4%) |
| $50,000 to $99,999 | 55 (17.3%) | 128 (34.0%) |
| $100,000 to $299,999 | 244 (76.7%) | 206 (54.8%) |
| $300,000 to $499,999 | 0 (0.0%) | 33 (8.8%) |
| $500,000 to $749,999 | 0 (0.0%) | 0 (0.0%) |
| $750,000 to $999,999 | 0 (0.0%) | 0 (0.0%) |
| $1,000,000 or more | 0 (0.0%) | 0 (0.0%) |
| Total | 318 (100.0%) | 376 (100.0%) |
Household Income by Mortgage Status in Darlington
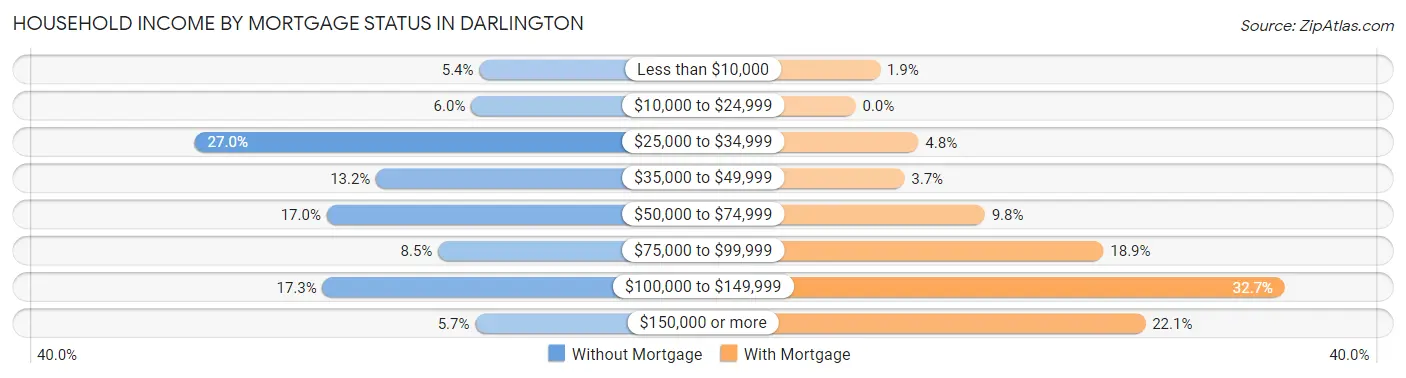
| Household Income | Without Mortgage | With Mortgage |
| Less than $10,000 | 17 (5.3%) | 7 (1.9%) |
| $10,000 to $24,999 | 19 (6.0%) | 0 (0.0%) |
| $25,000 to $34,999 | 86 (27.0%) | 18 (4.8%) |
| $35,000 to $49,999 | 42 (13.2%) | 14 (3.7%) |
| $50,000 to $74,999 | 54 (17.0%) | 37 (9.8%) |
| $75,000 to $99,999 | 27 (8.5%) | 71 (18.9%) |
| $100,000 to $149,999 | 55 (17.3%) | 123 (32.7%) |
| $150,000 or more | 18 (5.7%) | 83 (22.1%) |
| Total | 318 (100.0%) | 376 (100.0%) |
Property Value to Household Income Ratio in Darlington
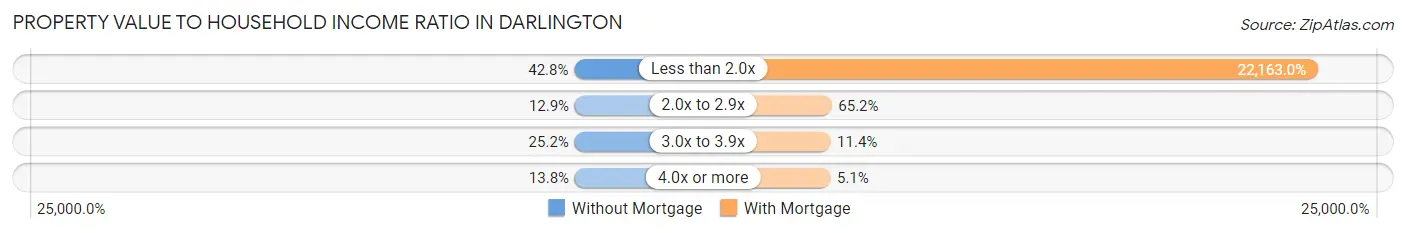
| Value-to-Income Ratio | Without Mortgage | With Mortgage |
| Less than 2.0x | 136 (42.8%) | 83,333 (22,163.0%) |
| 2.0x to 2.9x | 41 (12.9%) | 245 (65.2%) |
| 3.0x to 3.9x | 80 (25.2%) | 43 (11.4%) |
| 4.0x or more | 44 (13.8%) | 19 (5.1%) |
| Total | 318 (100.0%) | 376 (100.0%) |
Real Estate Taxes by Mortgage Status in Darlington
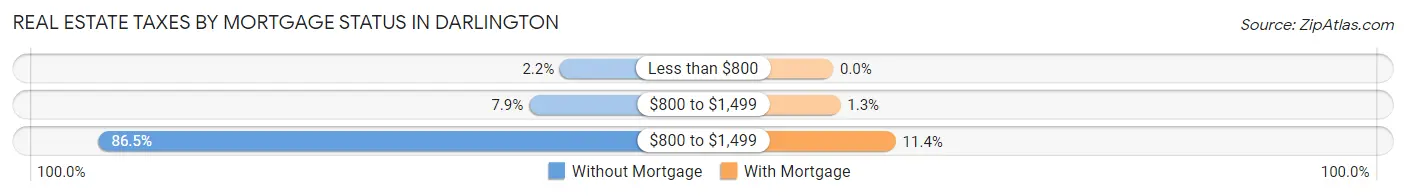
| Property Taxes | Without Mortgage | With Mortgage |
| Less than $800 | 7 (2.2%) | 0 (0.0%) |
| $800 to $1,499 | 25 (7.9%) | 5 (1.3%) |
| $800 to $1,499 | 275 (86.5%) | 43 (11.4%) |
| Total | 318 (100.0%) | 376 (100.0%) |
Health & Disability in Darlington
Health Insurance Coverage by Age in Darlington
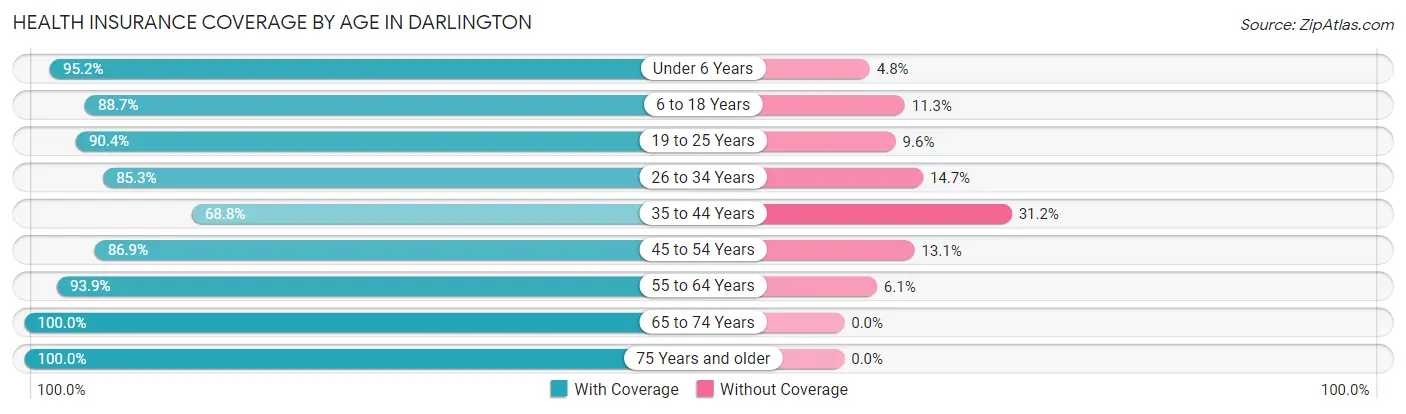
| Age Bracket | With Coverage | Without Coverage |
| Under 6 Years | 240 (95.2%) | 12 (4.8%) |
| 6 to 18 Years | 338 (88.7%) | 43 (11.3%) |
| 19 to 25 Years | 151 (90.4%) | 16 (9.6%) |
| 26 to 34 Years | 256 (85.3%) | 44 (14.7%) |
| 35 to 44 Years | 130 (68.8%) | 59 (31.2%) |
| 45 to 54 Years | 259 (86.9%) | 39 (13.1%) |
| 55 to 64 Years | 278 (93.9%) | 18 (6.1%) |
| 65 to 74 Years | 247 (100.0%) | 0 (0.0%) |
| 75 Years and older | 262 (100.0%) | 0 (0.0%) |
| Total | 2,161 (90.3%) | 231 (9.7%) |
Health Insurance Coverage by Citizenship Status in Darlington
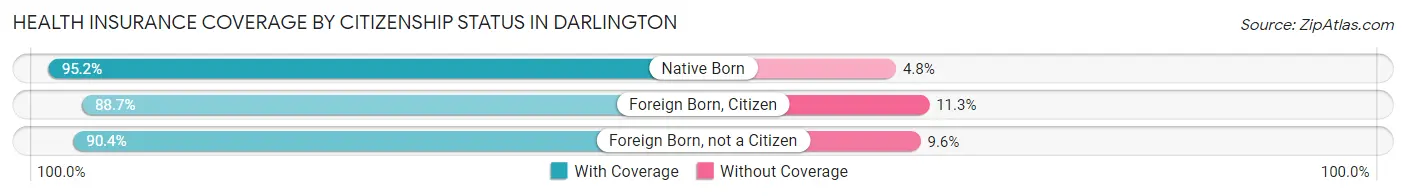
| Citizenship Status | With Coverage | Without Coverage |
| Native Born | 240 (95.2%) | 12 (4.8%) |
| Foreign Born, Citizen | 338 (88.7%) | 43 (11.3%) |
| Foreign Born, not a Citizen | 151 (90.4%) | 16 (9.6%) |
Health Insurance Coverage by Household Income in Darlington
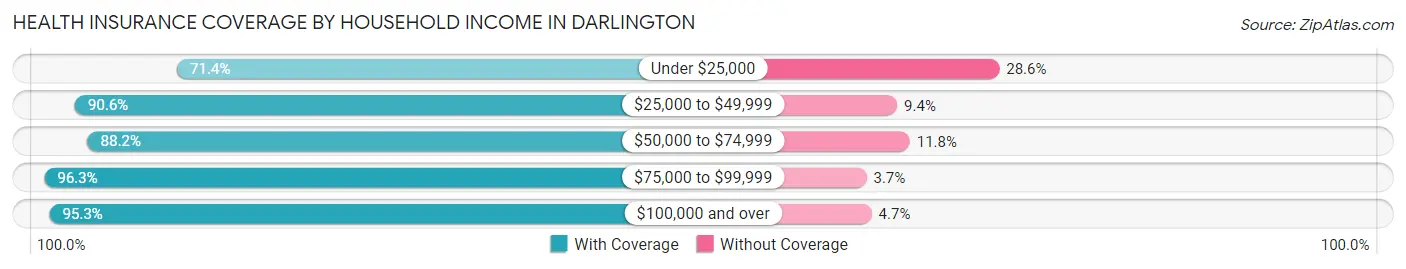
| Household Income | With Coverage | Without Coverage |
| Under $25,000 | 210 (71.4%) | 84 (28.6%) |
| $25,000 to $49,999 | 461 (90.6%) | 48 (9.4%) |
| $50,000 to $74,999 | 381 (88.2%) | 51 (11.8%) |
| $75,000 to $99,999 | 572 (96.3%) | 22 (3.7%) |
| $100,000 and over | 532 (95.3%) | 26 (4.7%) |
Public vs Private Health Insurance Coverage by Age in Darlington
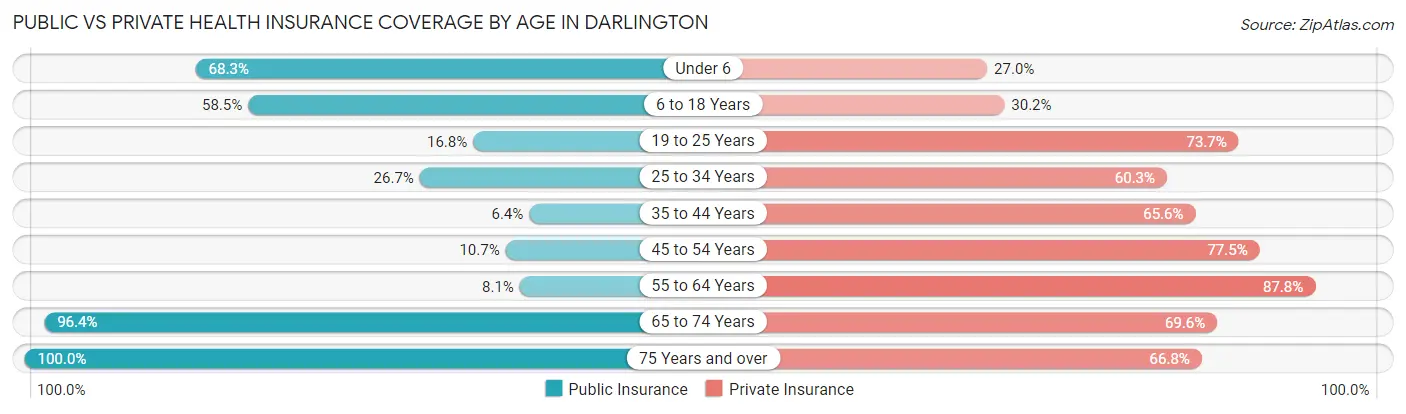
| Age Bracket | Public Insurance | Private Insurance |
| Under 6 | 172 (68.2%) | 68 (27.0%) |
| 6 to 18 Years | 223 (58.5%) | 115 (30.2%) |
| 19 to 25 Years | 28 (16.8%) | 123 (73.7%) |
| 25 to 34 Years | 80 (26.7%) | 181 (60.3%) |
| 35 to 44 Years | 12 (6.4%) | 124 (65.6%) |
| 45 to 54 Years | 32 (10.7%) | 231 (77.5%) |
| 55 to 64 Years | 24 (8.1%) | 260 (87.8%) |
| 65 to 74 Years | 238 (96.4%) | 172 (69.6%) |
| 75 Years and over | 262 (100.0%) | 175 (66.8%) |
| Total | 1,071 (44.8%) | 1,449 (60.6%) |
Disability Status by Sex by Age in Darlington
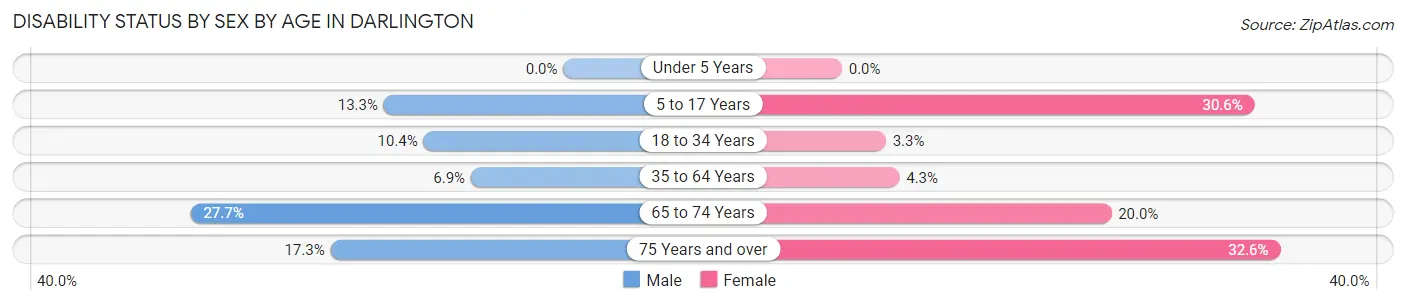
| Age Bracket | Male | Female |
| Under 5 Years | 0 (0.0%) | 0 (0.0%) |
| 5 to 17 Years | 32 (13.3%) | 53 (30.6%) |
| 18 to 34 Years | 27 (10.4%) | 7 (3.3%) |
| 35 to 64 Years | 28 (6.9%) | 16 (4.3%) |
| 65 to 74 Years | 31 (27.7%) | 27 (20.0%) |
| 75 Years and over | 23 (17.3%) | 42 (32.6%) |
Disability Class by Sex by Age in Darlington
Disability Class: Hearing Difficulty
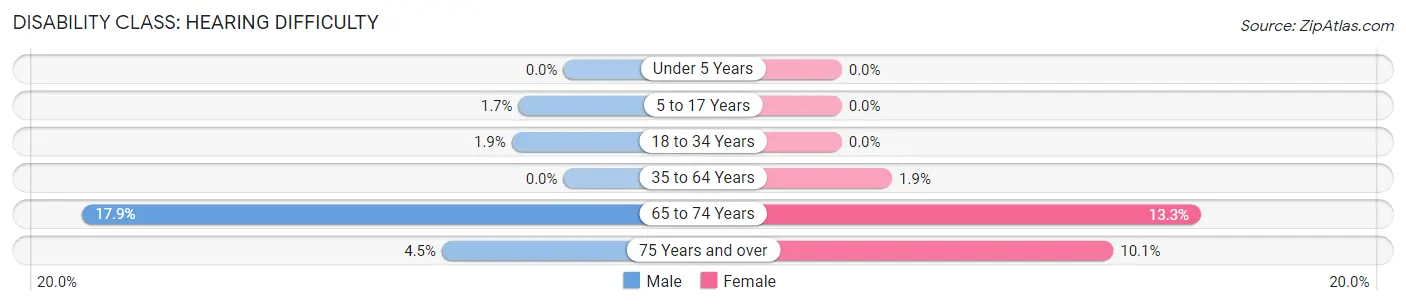
| Age Bracket | Male | Female |
| Under 5 Years | 0 (0.0%) | 0 (0.0%) |
| 5 to 17 Years | 4 (1.7%) | 0 (0.0%) |
| 18 to 34 Years | 5 (1.9%) | 0 (0.0%) |
| 35 to 64 Years | 0 (0.0%) | 7 (1.9%) |
| 65 to 74 Years | 20 (17.9%) | 18 (13.3%) |
| 75 Years and over | 6 (4.5%) | 13 (10.1%) |
Disability Class: Vision Difficulty
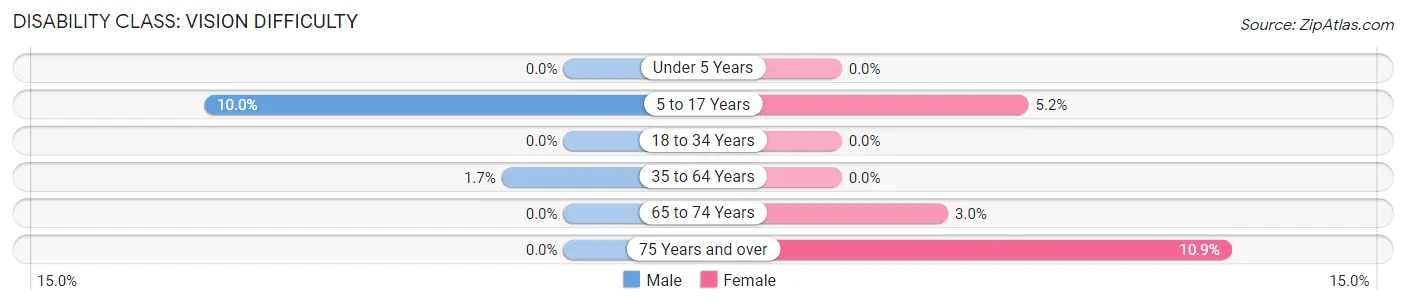
| Age Bracket | Male | Female |
| Under 5 Years | 0 (0.0%) | 0 (0.0%) |
| 5 to 17 Years | 24 (10.0%) | 9 (5.2%) |
| 18 to 34 Years | 0 (0.0%) | 0 (0.0%) |
| 35 to 64 Years | 7 (1.7%) | 0 (0.0%) |
| 65 to 74 Years | 0 (0.0%) | 4 (3.0%) |
| 75 Years and over | 0 (0.0%) | 14 (10.8%) |
Disability Class: Cognitive Difficulty
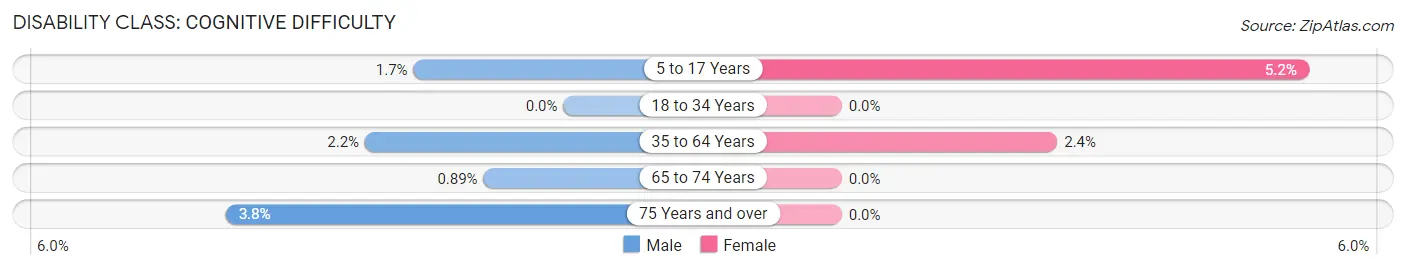
| Age Bracket | Male | Female |
| 5 to 17 Years | 4 (1.7%) | 9 (5.2%) |
| 18 to 34 Years | 0 (0.0%) | 0 (0.0%) |
| 35 to 64 Years | 9 (2.2%) | 9 (2.4%) |
| 65 to 74 Years | 1 (0.9%) | 0 (0.0%) |
| 75 Years and over | 5 (3.8%) | 0 (0.0%) |
Disability Class: Ambulatory Difficulty
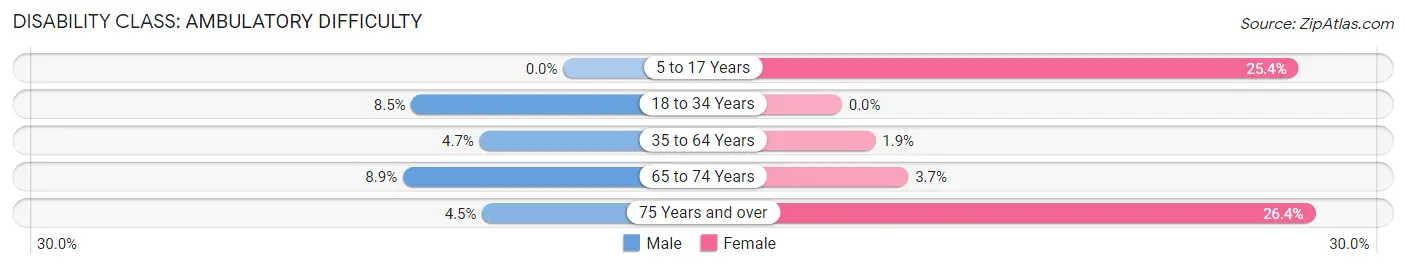
| Age Bracket | Male | Female |
| 5 to 17 Years | 0 (0.0%) | 44 (25.4%) |
| 18 to 34 Years | 22 (8.5%) | 0 (0.0%) |
| 35 to 64 Years | 19 (4.7%) | 7 (1.9%) |
| 65 to 74 Years | 10 (8.9%) | 5 (3.7%) |
| 75 Years and over | 6 (4.5%) | 34 (26.4%) |
Disability Class: Self-Care Difficulty
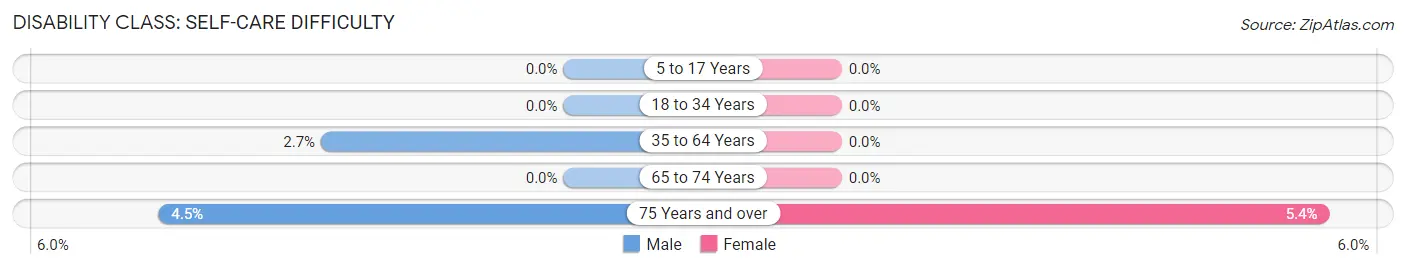
| Age Bracket | Male | Female |
| 5 to 17 Years | 0 (0.0%) | 0 (0.0%) |
| 18 to 34 Years | 0 (0.0%) | 0 (0.0%) |
| 35 to 64 Years | 11 (2.7%) | 0 (0.0%) |
| 65 to 74 Years | 0 (0.0%) | 0 (0.0%) |
| 75 Years and over | 6 (4.5%) | 7 (5.4%) |
Technology Access in Darlington
Computing Device Access in Darlington
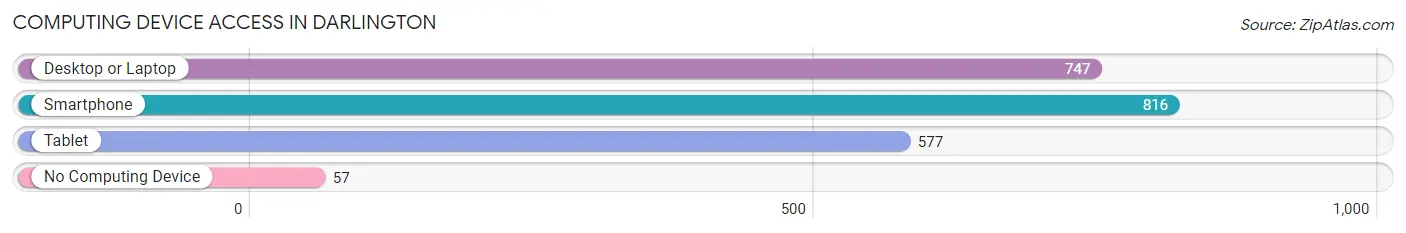
| Device Type | # Households | % Households |
| Desktop or Laptop | 747 | 73.0% |
| Smartphone | 816 | 79.7% |
| Tablet | 577 | 56.4% |
| No Computing Device | 57 | 5.6% |
| Total | 1,024 | 100.0% |
Internet Access in Darlington
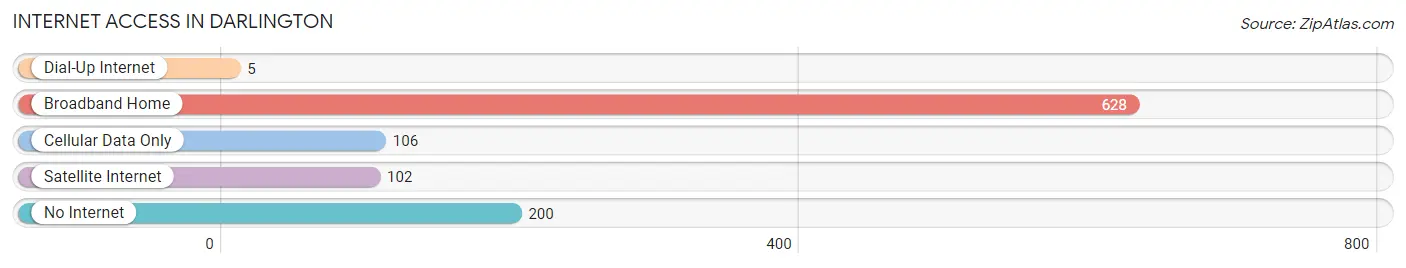
| Internet Type | # Households | % Households |
| Dial-Up Internet | 5 | 0.5% |
| Broadband Home | 628 | 61.3% |
| Cellular Data Only | 106 | 10.3% |
| Satellite Internet | 102 | 10.0% |
| No Internet | 200 | 19.5% |
| Total | 1,024 | 100.0% |
Darlington Summary
Darlington, Wisconsin is a small city located in Lafayette County, in the southwestern corner of the state. It is situated on the banks of the Pecatonica River, and is the county seat of Lafayette County. The city has a population of approximately 2,500 people, and is part of the larger Dubuque, Iowa metropolitan area.
History
The area that is now Darlington was first settled in 1837 by a group of settlers from New York. The settlement was originally known as “Pecatonica”, after the river that runs through the area. In 1845, the settlement was renamed “Darlington”, after the town of Darlington in England. The city was officially incorporated in 1856.
In the late 19th century, Darlington was a major center for the lumber industry. The city was home to several sawmills, and the lumber industry was the primary source of employment for the city’s residents. The city also had a thriving agricultural industry, and was home to several grain elevators.
In the early 20th century, Darlington began to experience a decline in its economy. The lumber industry had largely moved out of the area, and the city’s agricultural industry was in decline. The city’s population began to decline as well, and by the 1950s, the city’s population had dropped to just over 1,000 people.
In the late 20th century, Darlington began to experience a resurgence. The city’s economy began to diversify, and new businesses began to move into the area. The city’s population began to grow again, and by the 2000 census, the city’s population had grown to over 2,500 people.
Geography
Darlington is located in southwestern Wisconsin, in Lafayette County. The city is situated on the banks of the Pecatonica River, and is surrounded by rolling hills and farmland. The city is located approximately 25 miles east of Dubuque, Iowa, and approximately 50 miles west of Madison, Wisconsin.
The city has a total area of 2.2 square miles, all of which is land. The city has a humid continental climate, with cold winters and hot, humid summers. The average annual temperature is around 50 degrees Fahrenheit, and the average annual precipitation is around 35 inches.
Economy
Darlington’s economy is largely based on agriculture and manufacturing. The city is home to several grain elevators, and the surrounding area is home to several dairy farms. The city is also home to several manufacturing companies, including a plastics manufacturer and a metal fabrication company.
The city is also home to several retail stores, restaurants, and other businesses. The city is home to several banks, and the city’s downtown area is home to several antique stores and other specialty shops.
Demographics
As of the 2010 census, the city of Darlington had a population of 2,521 people. The racial makeup of the city was 97.2% White, 0.7% African American, 0.3% Native American, 0.3% Asian, 0.2% from other races, and 1.5% from two or more races. Hispanic or Latino of any race were 1.2% of the population.
The median income for a household in the city was $37,917, and the median income for a family was $45,938. The per capita income for the city was $18,945. About 11.2% of families and 14.2% of the population were below the poverty line, including 19.2% of those under age 18 and 8.2% of those age 65 or over.
Common Questions
What is Per Capita Income in Darlington?
Per Capita income in Darlington is $31,120.
What is the Median Family Income in Darlington?
Median Family Income in Darlington is $76,295.
What is the Median Household income in Darlington?
Median Household Income in Darlington is $60,682.
What is Income or Wage Gap in Darlington?
Income or Wage Gap in Darlington is 22.5%.
Women in Darlington earn 77.5 cents for every dollar earned by a man.
What is Inequality or Gini Index in Darlington?
Inequality or Gini Index in Darlington is 0.40.
What is the Total Population of Darlington?
Total Population of Darlington is 2,462.
What is the Total Male Population of Darlington?
Total Male Population of Darlington is 1,303.
What is the Total Female Population of Darlington?
Total Female Population of Darlington is 1,159.
What is the Ratio of Males per 100 Females in Darlington?
There are 112.42 Males per 100 Females in Darlington.
What is the Ratio of Females per 100 Males in Darlington?
There are 88.95 Females per 100 Males in Darlington.
What is the Median Population Age in Darlington?
Median Population Age in Darlington is 42.1 Years.
What is the Average Family Size in Darlington
Average Family Size in Darlington is 3.0 People.
What is the Average Household Size in Darlington
Average Household Size in Darlington is 2.3 People.
How Large is the Labor Force in Darlington?
There are 1,197 People in the Labor Forcein in Darlington.
What is the Percentage of People in the Labor Force in Darlington?
64.0% of People are in the Labor Force in Darlington.
What is the Unemployment Rate in Darlington?
Unemployment Rate in Darlington is 1.9%.