Darien, WI Map & Demographics
Darien Map
Darien Overview
$26,168
PER CAPITA INCOME
$70,833
AVG FAMILY INCOME
$62,333
AVG HOUSEHOLD INCOME
22.8%
WAGE / INCOME GAP [ % ]
77.2¢/ $1
WAGE / INCOME GAP [ $ ]
0.41
INEQUALITY / GINI INDEX
1,271
TOTAL POPULATION
616
MALE POPULATION
655
FEMALE POPULATION
94.05
MALES / 100 FEMALES
106.33
FEMALES / 100 MALES
42.3
MEDIAN AGE
3.0
AVG FAMILY SIZE
2.5
AVG HOUSEHOLD SIZE
712
LABOR FORCE [ PEOPLE ]
69.7%
PERCENT IN LABOR FORCE
3.1%
UNEMPLOYMENT RATE
Darien Zip Codes
Income in Darien
Income Overview in Darien
Per Capita Income in Darien is $26,168, while median incomes of families and households are $70,833 and $62,333 respectively.
| Characteristic | Number | Measure |
| Per Capita Income | 1,271 | $26,168 |
| Median Family Income | 354 | $70,833 |
| Mean Family Income | 354 | $81,439 |
| Median Household Income | 516 | $62,333 |
| Mean Household Income | 516 | $64,025 |
| Income Deficit | 354 | $0 |
| Wage / Income Gap (%) | 1,271 | 22.77% |
| Wage / Income Gap ($) | 1,271 | 77.23¢ per $1 |
| Gini / Inequality Index | 1,271 | 0.41 |
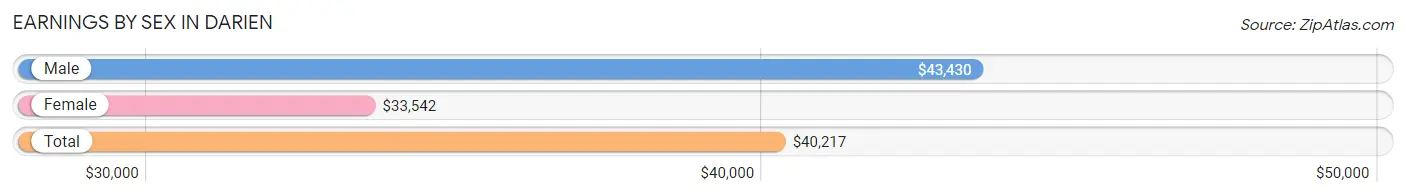
Earnings by Sex in Darien
Average Earnings in Darien are $40,217, $43,430 for men and $33,542 for women, a difference of 22.8%.
| Sex | Number | Average Earnings |
| Male | 406 (54.9%) | $43,430 |
| Female | 334 (45.1%) | $33,542 |
| Total | 740 (100.0%) | $40,217 |
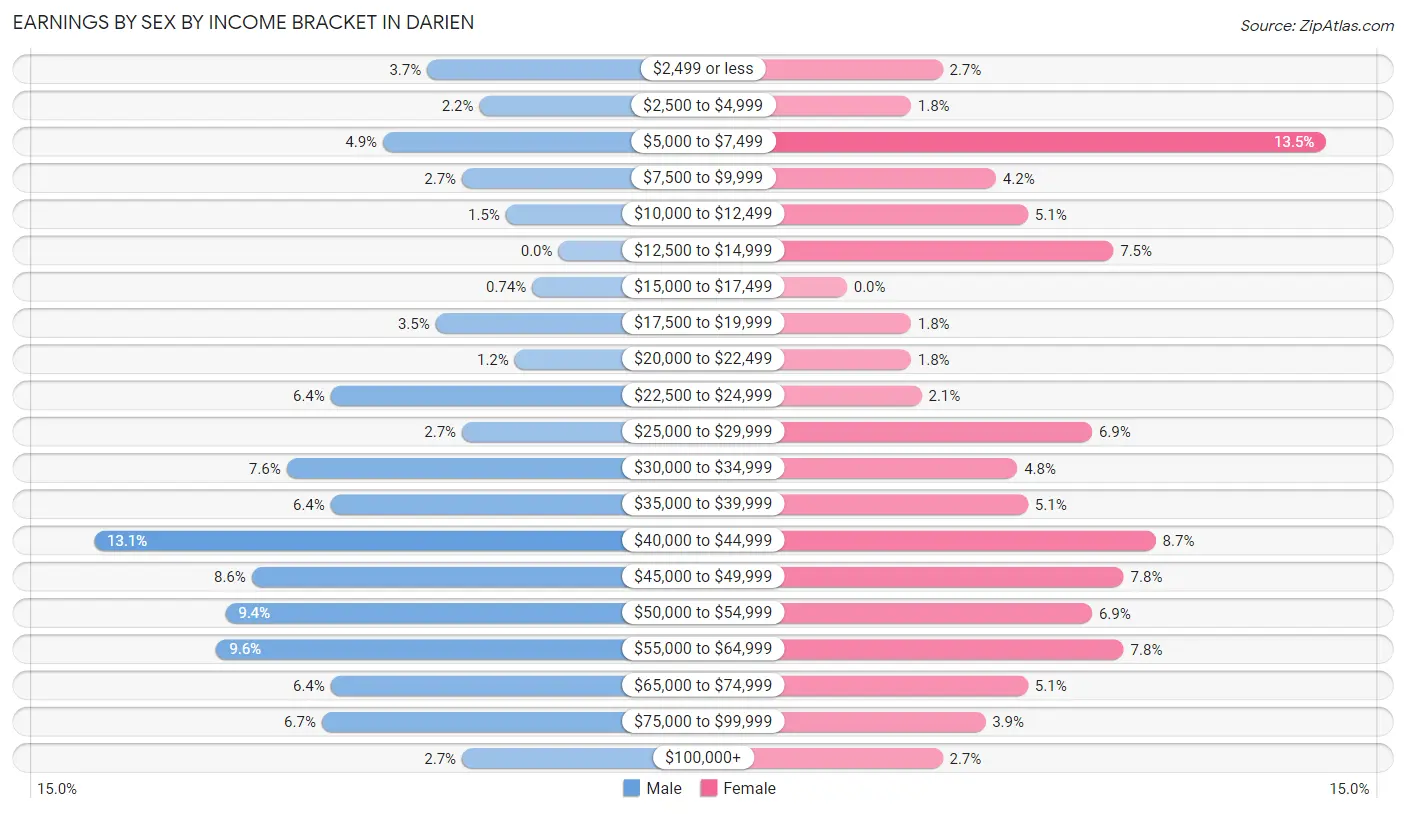
Earnings by Sex by Income Bracket in Darien
The most common earnings brackets in Darien are $40,000 to $44,999 for men (53 | 13.1%) and $5,000 to $7,499 for women (45 | 13.5%).
| Income | Male | Female |
| $2,499 or less | 15 (3.7%) | 9 (2.7%) |
| $2,500 to $4,999 | 9 (2.2%) | 6 (1.8%) |
| $5,000 to $7,499 | 20 (4.9%) | 45 (13.5%) |
| $7,500 to $9,999 | 11 (2.7%) | 14 (4.2%) |
| $10,000 to $12,499 | 6 (1.5%) | 17 (5.1%) |
| $12,500 to $14,999 | 0 (0.0%) | 25 (7.5%) |
| $15,000 to $17,499 | 3 (0.7%) | 0 (0.0%) |
| $17,500 to $19,999 | 14 (3.5%) | 6 (1.8%) |
| $20,000 to $22,499 | 5 (1.2%) | 6 (1.8%) |
| $22,500 to $24,999 | 26 (6.4%) | 7 (2.1%) |
| $25,000 to $29,999 | 11 (2.7%) | 23 (6.9%) |
| $30,000 to $34,999 | 31 (7.6%) | 16 (4.8%) |
| $35,000 to $39,999 | 26 (6.4%) | 17 (5.1%) |
| $40,000 to $44,999 | 53 (13.1%) | 29 (8.7%) |
| $45,000 to $49,999 | 35 (8.6%) | 26 (7.8%) |
| $50,000 to $54,999 | 38 (9.4%) | 23 (6.9%) |
| $55,000 to $64,999 | 39 (9.6%) | 26 (7.8%) |
| $65,000 to $74,999 | 26 (6.4%) | 17 (5.1%) |
| $75,000 to $99,999 | 27 (6.7%) | 13 (3.9%) |
| $100,000+ | 11 (2.7%) | 9 (2.7%) |
| Total | 406 (100.0%) | 334 (100.0%) |
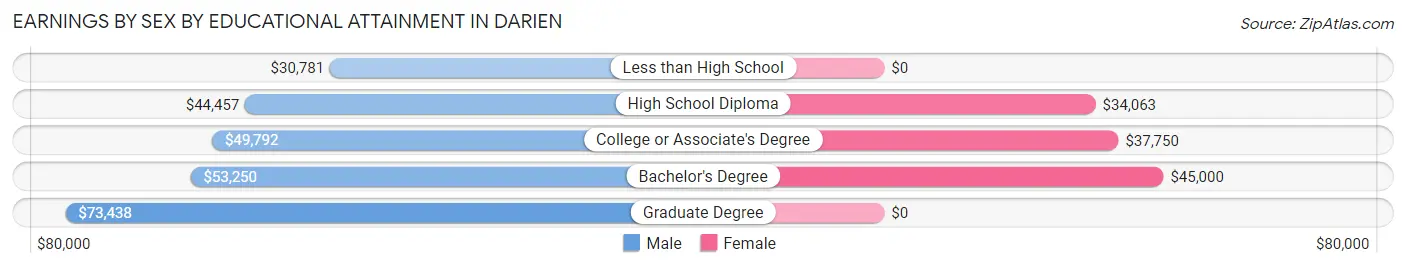
Earnings by Sex by Educational Attainment in Darien
Average earnings in Darien are $45,172 for men and $35,469 for women, a difference of 21.5%. Men with an educational attainment of graduate degree enjoy the highest average annual earnings of $73,438, while those with less than high school education earn the least with $30,781. Women with an educational attainment of bachelor's degree earn the most with the average annual earnings of $45,000, while those with high school diploma education have the smallest earnings of $34,063.
| Educational Attainment | Male Income | Female Income |
| Less than High School | $30,781 | $0 |
| High School Diploma | $44,457 | $34,063 |
| College or Associate's Degree | $49,792 | $37,750 |
| Bachelor's Degree | $53,250 | $45,000 |
| Graduate Degree | $73,438 | $0 |
| Total | $45,172 | $35,469 |
Family Income in Darien
Family Income Brackets in Darien
According to the Darien family income data, there are 109 families falling into the $50,000 to $74,999 income range, which is the most common income bracket and makes up 30.8% of all families. Conversely, the $200,000+ income bracket is the least frequent group with only 3 families (0.9%) belonging to this category.
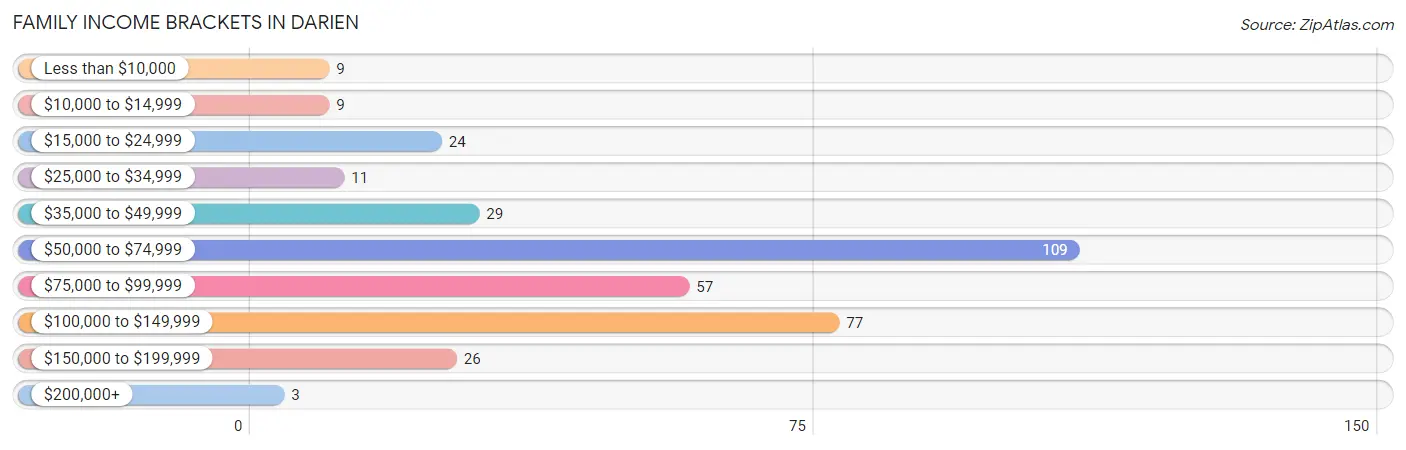
| Income Bracket | # Families | % Families |
| Less than $10,000 | 9 | 2.5% |
| $10,000 to $14,999 | 9 | 2.5% |
| $15,000 to $24,999 | 24 | 6.8% |
| $25,000 to $34,999 | 11 | 3.1% |
| $35,000 to $49,999 | 29 | 8.2% |
| $50,000 to $74,999 | 109 | 30.8% |
| $75,000 to $99,999 | 57 | 16.1% |
| $100,000 to $149,999 | 77 | 21.8% |
| $150,000 to $199,999 | 26 | 7.3% |
| $200,000+ | 3 | 0.8% |
Family Income by Famaliy Size in Darien
7+ person families (6 | 1.7%) account for the highest median family income in Darien with $151,250 per family, while 2-person families (153 | 43.2%) have the highest median income of $33,693 per family member.
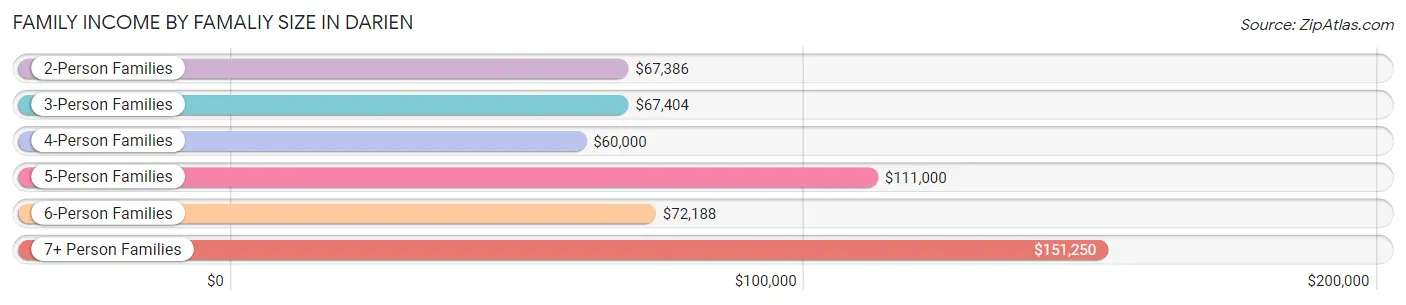
| Income Bracket | # Families | Median Income |
| 2-Person Families | 153 (43.2%) | $67,386 |
| 3-Person Families | 120 (33.9%) | $67,404 |
| 4-Person Families | 44 (12.4%) | $60,000 |
| 5-Person Families | 18 (5.1%) | $111,000 |
| 6-Person Families | 13 (3.7%) | $72,188 |
| 7+ Person Families | 6 (1.7%) | $151,250 |
| Total | 354 (100.0%) | $70,833 |
Family Income by Number of Earners in Darien
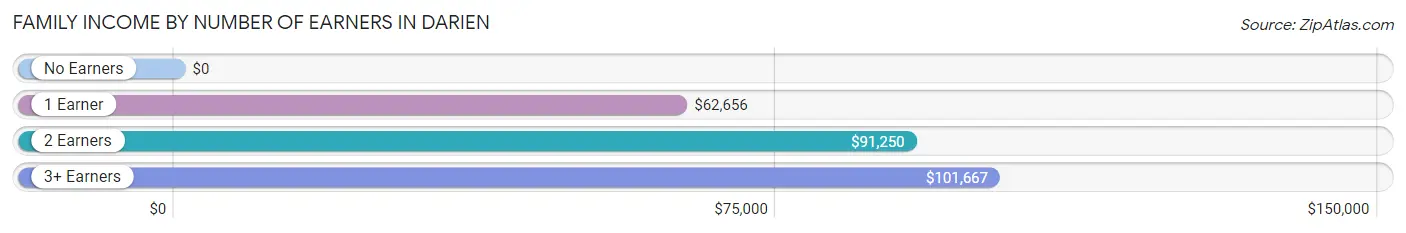
| Number of Earners | # Families | Median Income |
| No Earners | 31 (8.8%) | $0 |
| 1 Earner | 103 (29.1%) | $62,656 |
| 2 Earners | 168 (47.5%) | $91,250 |
| 3+ Earners | 52 (14.7%) | $101,667 |
| Total | 354 (100.0%) | $70,833 |
Household Income in Darien
Household Income Brackets in Darien
With 147 households falling in the category, the $50,000 to $74,999 income range is the most frequent in Darien, accounting for 28.5% of all households. In contrast, only 3 households (0.6%) fall into the $200,000+ income bracket, making it the least populous group.
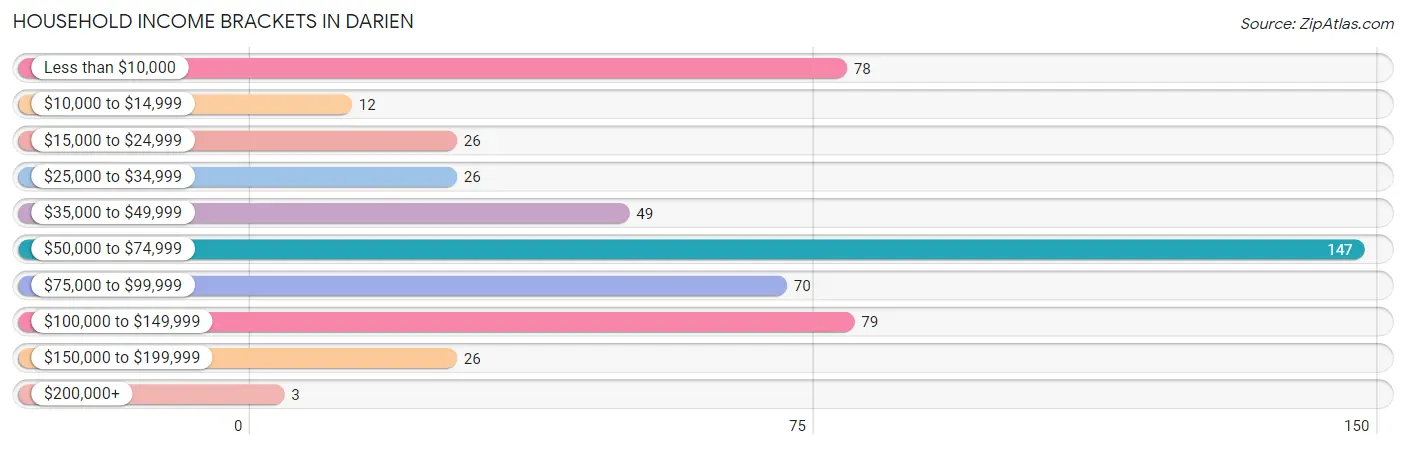
| Income Bracket | # Households | % Households |
| Less than $10,000 | 78 | 15.1% |
| $10,000 to $14,999 | 12 | 2.3% |
| $15,000 to $24,999 | 26 | 5.0% |
| $25,000 to $34,999 | 26 | 5.0% |
| $35,000 to $49,999 | 49 | 9.5% |
| $50,000 to $74,999 | 147 | 28.5% |
| $75,000 to $99,999 | 70 | 13.6% |
| $100,000 to $149,999 | 79 | 15.3% |
| $150,000 to $199,999 | 26 | 5.0% |
| $200,000+ | 3 | 0.6% |
Household Income by Householder Age in Darien
The median household income in Darien is $62,333, with the highest median household income of $72,083 found in the 25 to 44 years age bracket for the primary householder. A total of 153 households (29.6%) fall into this category. Meanwhile, the 15 to 24 years age bracket for the primary householder has the lowest median household income of $0, with 7 households (1.4%) in this group.
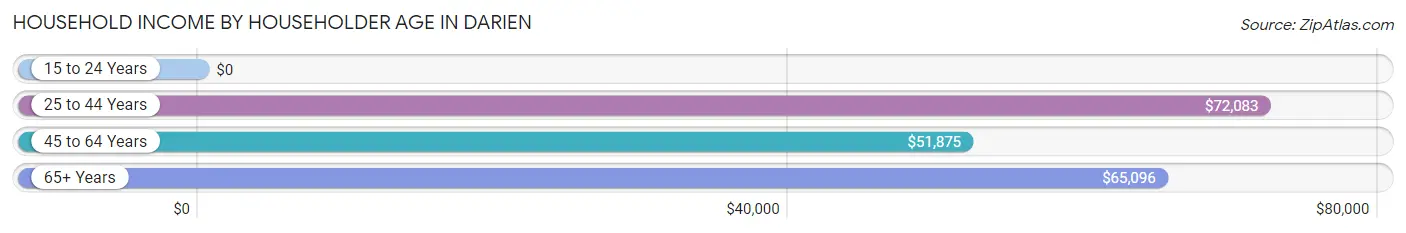
| Income Bracket | # Households | Median Income |
| 15 to 24 Years | 7 (1.4%) | $0 |
| 25 to 44 Years | 153 (29.6%) | $72,083 |
| 45 to 64 Years | 252 (48.8%) | $51,875 |
| 65+ Years | 104 (20.2%) | $65,096 |
| Total | 516 (100.0%) | $62,333 |
Poverty in Darien
Income Below Poverty by Sex and Age in Darien
With 8.8% poverty level for males and 21.2% for females among the residents of Darien, 6 to 11 year old males and 55 to 64 year old females are the most vulnerable to poverty, with 27 males (44.3%) and 74 females (51.4%) in their respective age groups living below the poverty level.
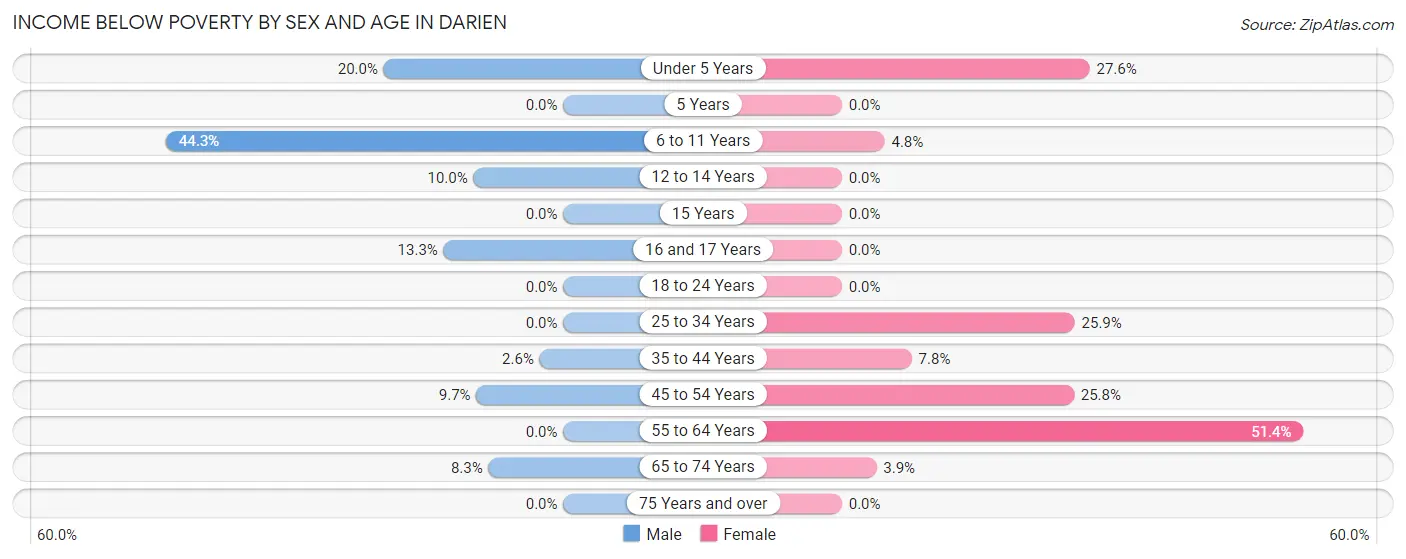
| Age Bracket | Male | Female |
| Under 5 Years | 6 (20.0%) | 8 (27.6%) |
| 5 Years | 0 (0.0%) | 0 (0.0%) |
| 6 to 11 Years | 27 (44.3%) | 3 (4.8%) |
| 12 to 14 Years | 3 (10.0%) | 0 (0.0%) |
| 15 Years | 0 (0.0%) | 0 (0.0%) |
| 16 and 17 Years | 4 (13.3%) | 0 (0.0%) |
| 18 to 24 Years | 0 (0.0%) | 0 (0.0%) |
| 25 to 34 Years | 0 (0.0%) | 21 (25.9%) |
| 35 to 44 Years | 2 (2.6%) | 7 (7.8%) |
| 45 to 54 Years | 9 (9.7%) | 23 (25.8%) |
| 55 to 64 Years | 0 (0.0%) | 74 (51.4%) |
| 65 to 74 Years | 3 (8.3%) | 3 (3.8%) |
| 75 Years and over | 0 (0.0%) | 0 (0.0%) |
| Total | 54 (8.8%) | 139 (21.2%) |
Income Above Poverty by Sex and Age in Darien
According to the poverty statistics in Darien, males aged 5 years and females aged 5 years are the age groups that are most secure financially, with 100.0% of males and 100.0% of females in these age groups living above the poverty line.
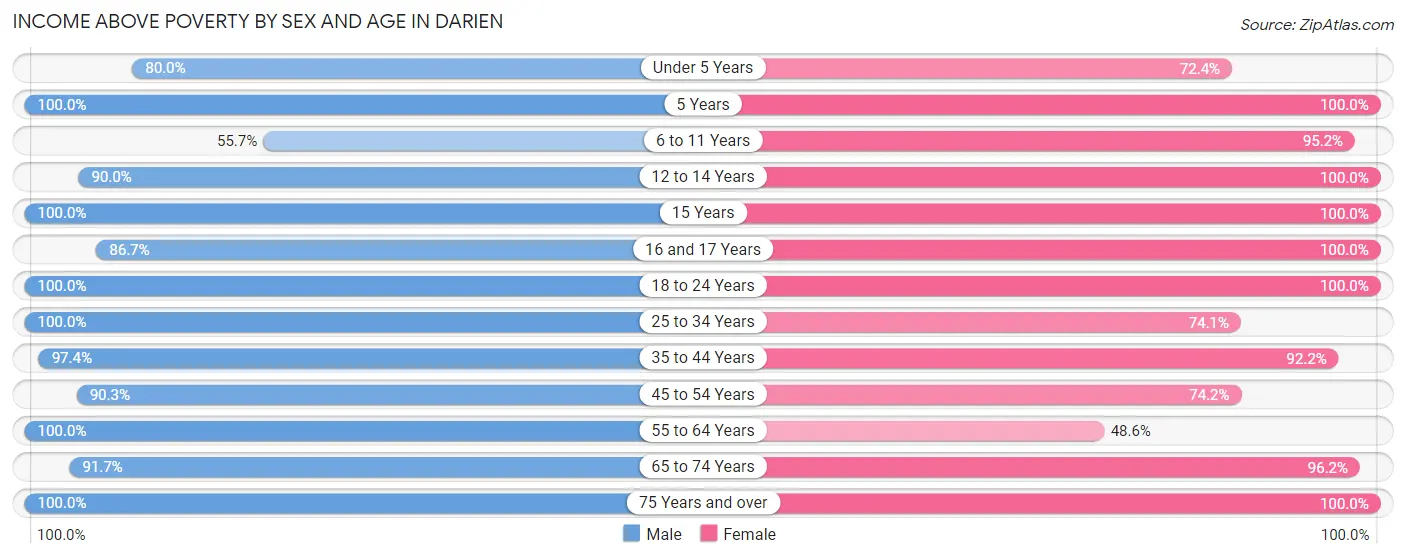
| Age Bracket | Male | Female |
| Under 5 Years | 24 (80.0%) | 21 (72.4%) |
| 5 Years | 5 (100.0%) | 3 (100.0%) |
| 6 to 11 Years | 34 (55.7%) | 60 (95.2%) |
| 12 to 14 Years | 27 (90.0%) | 9 (100.0%) |
| 15 Years | 13 (100.0%) | 7 (100.0%) |
| 16 and 17 Years | 26 (86.7%) | 7 (100.0%) |
| 18 to 24 Years | 43 (100.0%) | 23 (100.0%) |
| 25 to 34 Years | 104 (100.0%) | 60 (74.1%) |
| 35 to 44 Years | 74 (97.4%) | 83 (92.2%) |
| 45 to 54 Years | 84 (90.3%) | 66 (74.2%) |
| 55 to 64 Years | 66 (100.0%) | 70 (48.6%) |
| 65 to 74 Years | 33 (91.7%) | 75 (96.2%) |
| 75 Years and over | 29 (100.0%) | 32 (100.0%) |
| Total | 562 (91.2%) | 516 (78.8%) |
Income Below Poverty Among Married-Couple Families in Darien
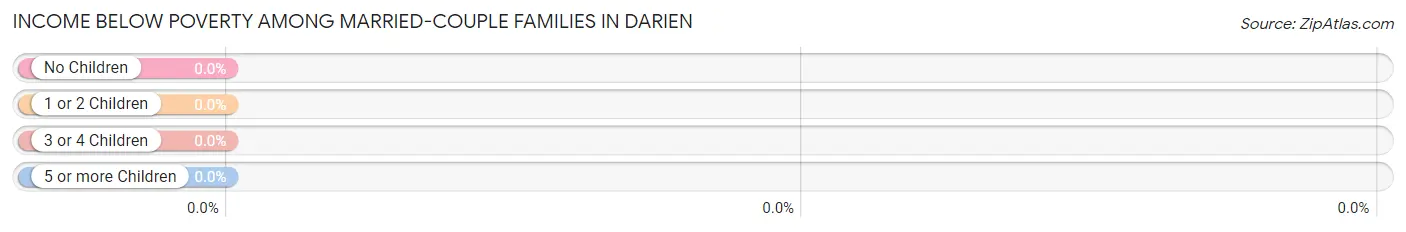
| Children | Above Poverty | Below Poverty |
| No Children | 192 (100.0%) | 0 (0.0%) |
| 1 or 2 Children | 64 (100.0%) | 0 (0.0%) |
| 3 or 4 Children | 24 (100.0%) | 0 (0.0%) |
| 5 or more Children | 0 (0.0%) | 0 (0.0%) |
| Total | 280 (100.0%) | 0 (0.0%) |
Income Below Poverty Among Single-Parent Households in Darien
According to the poverty data in Darien, 36.0% or 9 single-father households and 24.5% or 12 single-mother households are living below the poverty line. Among single-father households, those with 1 or 2 children have the highest poverty rate, with 9 households (52.9%) experiencing poverty. Likewise, among single-mother households, those with 3 or 4 children have the highest poverty rate, with 3 households (60.0%) falling below the poverty line.
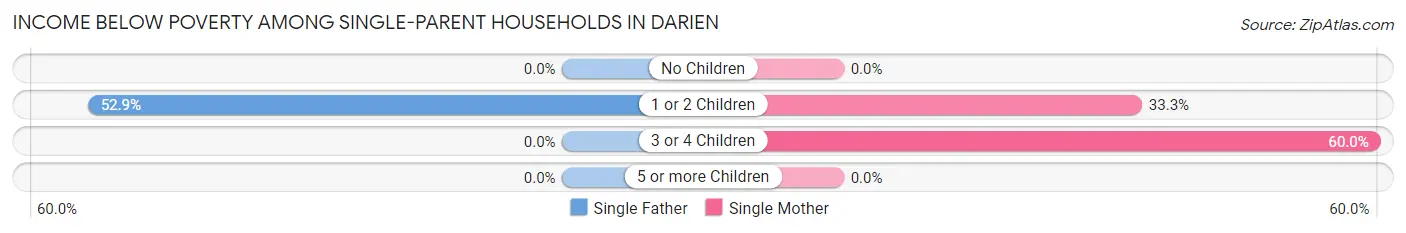
| Children | Single Father | Single Mother |
| No Children | 0 (0.0%) | 0 (0.0%) |
| 1 or 2 Children | 9 (52.9%) | 9 (33.3%) |
| 3 or 4 Children | 0 (0.0%) | 3 (60.0%) |
| 5 or more Children | 0 (0.0%) | 0 (0.0%) |
| Total | 9 (36.0%) | 12 (24.5%) |
Income Below Poverty Among Married-Couple vs Single-Parent Households in Darien
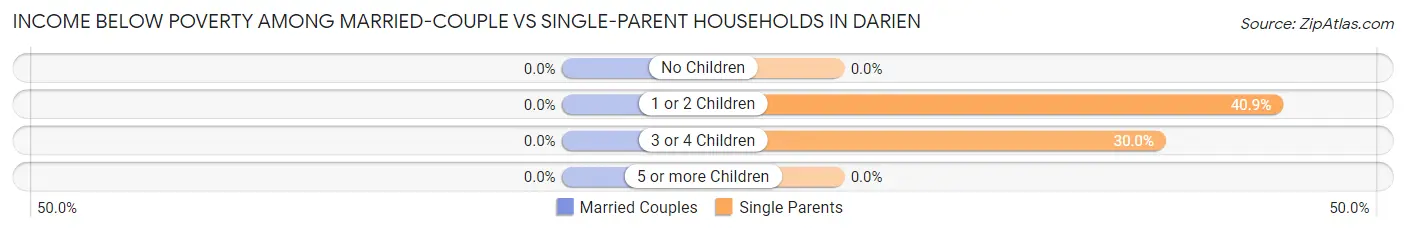
| Children | Married-Couple Families | Single-Parent Households |
| No Children | 0 (0.0%) | 0 (0.0%) |
| 1 or 2 Children | 0 (0.0%) | 18 (40.9%) |
| 3 or 4 Children | 0 (0.0%) | 3 (30.0%) |
| 5 or more Children | 0 (0.0%) | 0 (0.0%) |
| Total | 0 (0.0%) | 21 (28.4%) |
Race in Darien
The most populous races in Darien are White / Caucasian (1,046 | 82.3%), Hispanic or Latino (274 | 21.6%), and Some other Race (140 | 11.0%).
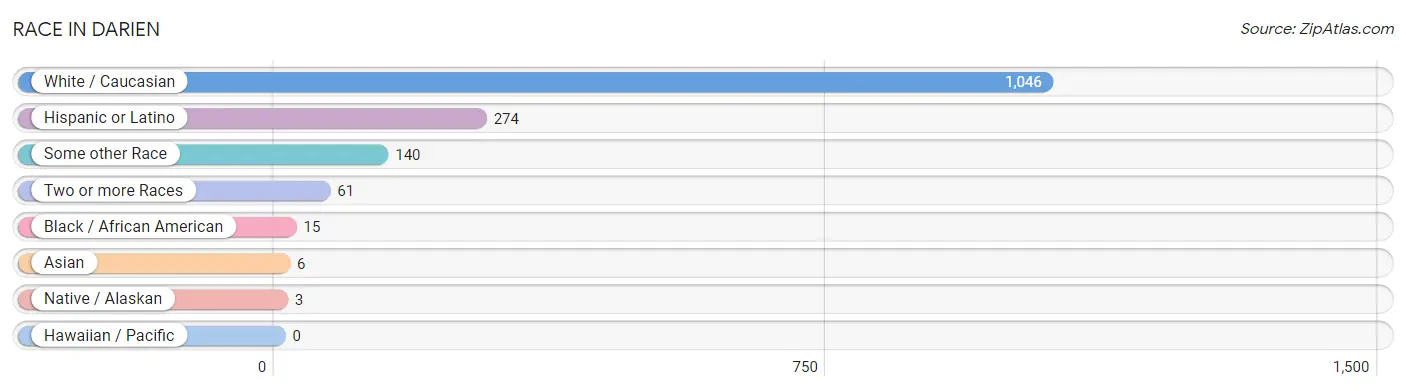
| Race | # Population | % Population |
| Asian | 6 | 0.5% |
| Black / African American | 15 | 1.2% |
| Hawaiian / Pacific | 0 | 0.0% |
| Hispanic or Latino | 274 | 21.6% |
| Native / Alaskan | 3 | 0.2% |
| White / Caucasian | 1,046 | 82.3% |
| Two or more Races | 61 | 4.8% |
| Some other Race | 140 | 11.0% |
| Total | 1,271 | 100.0% |
Ancestry in Darien
The most populous ancestries reported in Darien are German (407 | 32.0%), Mexican (231 | 18.2%), Norwegian (169 | 13.3%), English (128 | 10.1%), and Polish (79 | 6.2%), together accounting for 79.8% of all Darien residents.
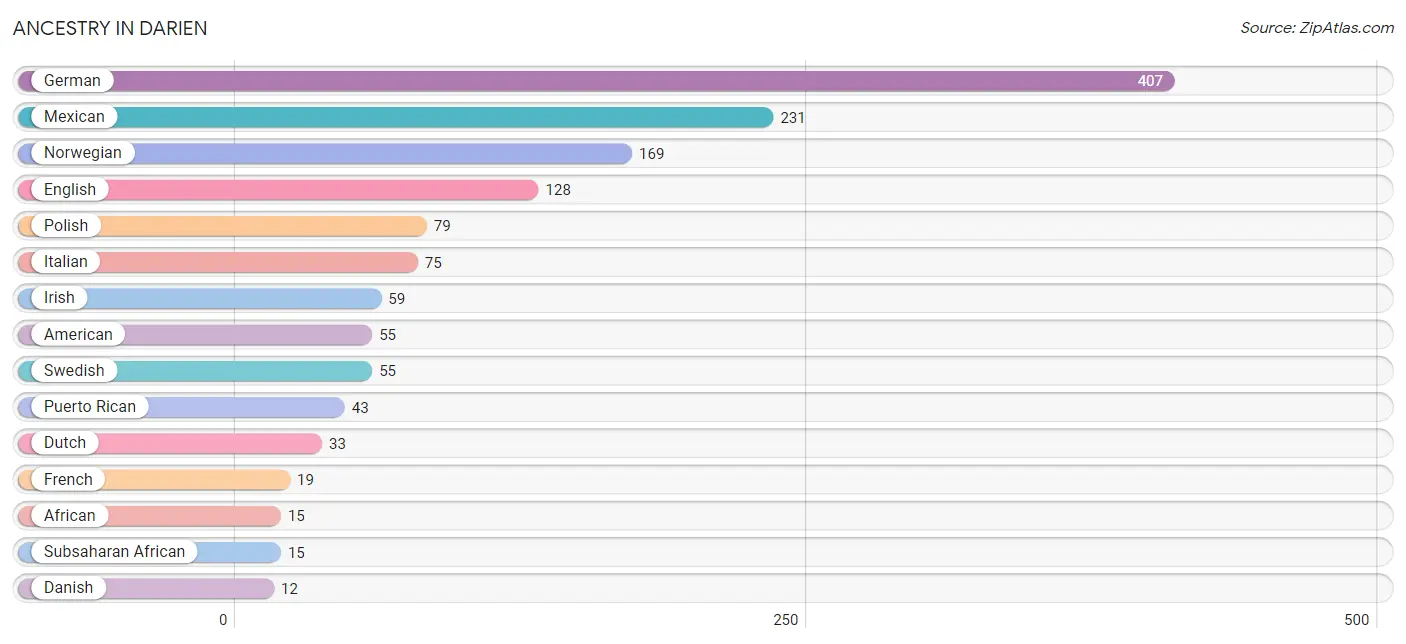
| Ancestry | # Population | % Population |
| African | 15 | 1.2% |
| American | 55 | 4.3% |
| Austrian | 10 | 0.8% |
| Czech | 8 | 0.6% |
| Danish | 12 | 0.9% |
| Dutch | 33 | 2.6% |
| Eastern European | 2 | 0.2% |
| English | 128 | 10.1% |
| European | 7 | 0.5% |
| French | 19 | 1.5% |
| French Canadian | 10 | 0.8% |
| German | 407 | 32.0% |
| Hungarian | 6 | 0.5% |
| Irish | 59 | 4.6% |
| Italian | 75 | 5.9% |
| Korean | 6 | 0.5% |
| Mexican | 231 | 18.2% |
| Northern European | 2 | 0.2% |
| Norwegian | 169 | 13.3% |
| Polish | 79 | 6.2% |
| Puerto Rican | 43 | 3.4% |
| Scandinavian | 2 | 0.2% |
| Scottish | 4 | 0.3% |
| Subsaharan African | 15 | 1.2% |
| Swedish | 55 | 4.3% |
| Swiss | 6 | 0.5% |
| Ukrainian | 6 | 0.5% |
| Welsh | 8 | 0.6% | View All 28 Rows |
Immigrants in Darien
The most numerous immigrant groups reported in Darien came from Central America (94 | 7.4%), Latin America (94 | 7.4%), Mexico (94 | 7.4%), Asia (6 | 0.5%), and Philippines (6 | 0.5%), together accounting for 23.1% of all Darien residents.
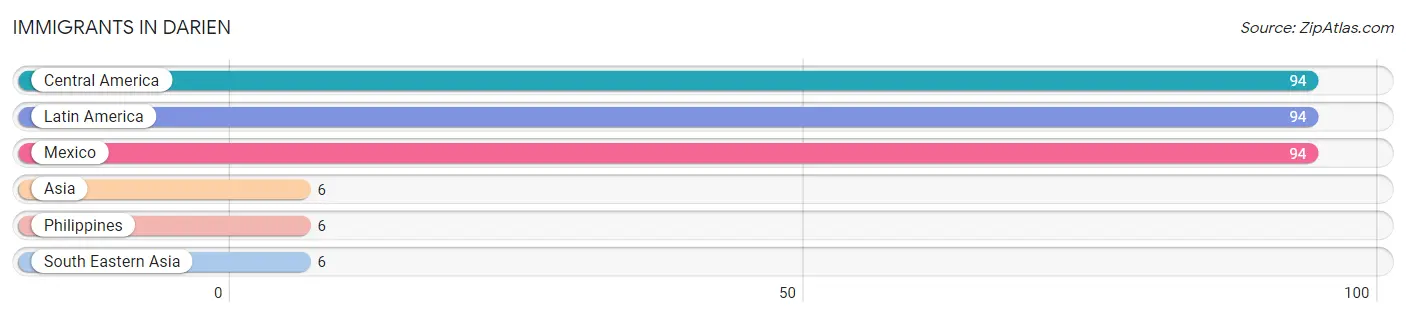
| Immigration Origin | # Population | % Population |
| Asia | 6 | 0.5% |
| Central America | 94 | 7.4% |
| Latin America | 94 | 7.4% |
| Mexico | 94 | 7.4% |
| Philippines | 6 | 0.5% |
| South Eastern Asia | 6 | 0.5% | View All 6 Rows |
Sex and Age in Darien
Sex and Age in Darien
The most populous age groups in Darien are 15 to 19 Years (72 | 11.7%) for men and 55 to 59 Years (96 | 14.7%) for women.
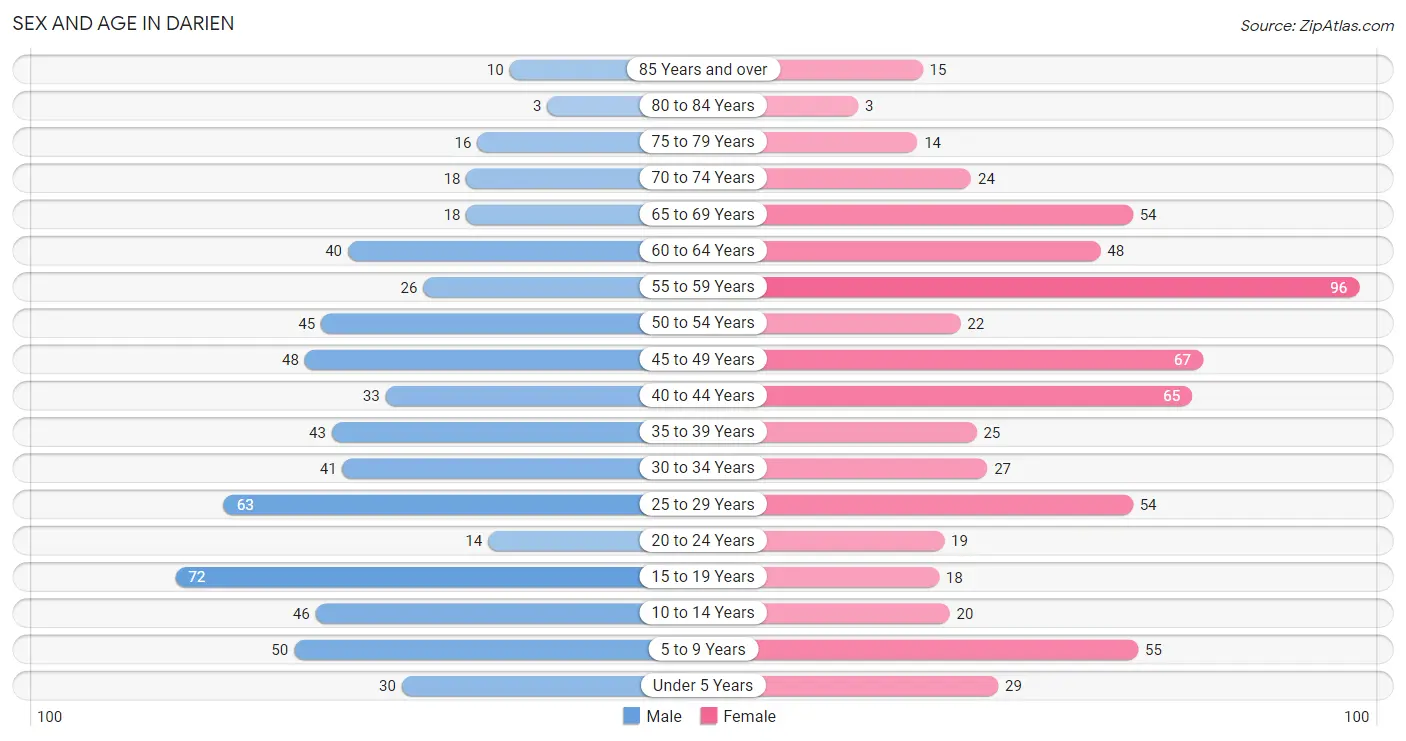
| Age Bracket | Male | Female |
| Under 5 Years | 30 (4.9%) | 29 (4.4%) |
| 5 to 9 Years | 50 (8.1%) | 55 (8.4%) |
| 10 to 14 Years | 46 (7.5%) | 20 (3.0%) |
| 15 to 19 Years | 72 (11.7%) | 18 (2.8%) |
| 20 to 24 Years | 14 (2.3%) | 19 (2.9%) |
| 25 to 29 Years | 63 (10.2%) | 54 (8.2%) |
| 30 to 34 Years | 41 (6.7%) | 27 (4.1%) |
| 35 to 39 Years | 43 (7.0%) | 25 (3.8%) |
| 40 to 44 Years | 33 (5.4%) | 65 (9.9%) |
| 45 to 49 Years | 48 (7.8%) | 67 (10.2%) |
| 50 to 54 Years | 45 (7.3%) | 22 (3.4%) |
| 55 to 59 Years | 26 (4.2%) | 96 (14.7%) |
| 60 to 64 Years | 40 (6.5%) | 48 (7.3%) |
| 65 to 69 Years | 18 (2.9%) | 54 (8.2%) |
| 70 to 74 Years | 18 (2.9%) | 24 (3.7%) |
| 75 to 79 Years | 16 (2.6%) | 14 (2.1%) |
| 80 to 84 Years | 3 (0.5%) | 3 (0.5%) |
| 85 Years and over | 10 (1.6%) | 15 (2.3%) |
| Total | 616 (100.0%) | 655 (100.0%) |
Families and Households in Darien
Median Family Size in Darien
The median family size in Darien is 2.97 persons per family, with single male/father families (25 | 7.1%) accounting for the largest median family size of 3.84 persons per family. On the other hand, married-couple families (280 | 79.1%) represent the smallest median family size with 2.84 persons per family.
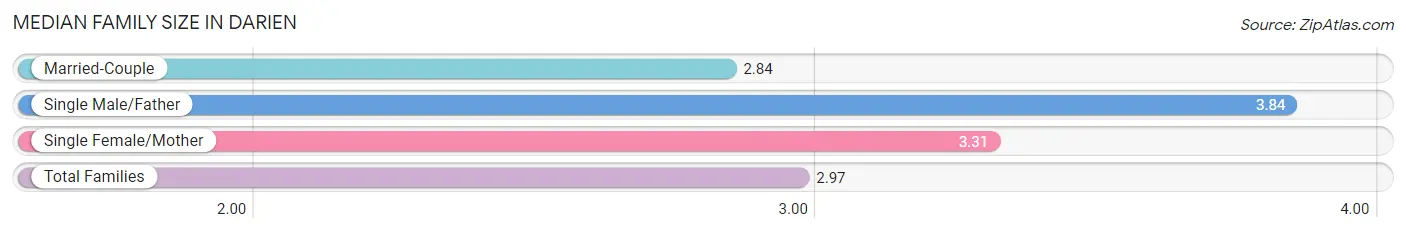
| Family Type | # Families | Family Size |
| Married-Couple | 280 (79.1%) | 2.84 |
| Single Male/Father | 25 (7.1%) | 3.84 |
| Single Female/Mother | 49 (13.8%) | 3.31 |
| Total Families | 354 (100.0%) | 2.97 |
Median Household Size in Darien
The median household size in Darien is 2.46 persons per household, with single male/father households (25 | 4.8%) accounting for the largest median household size of 3.96 persons per household. non-family households (162 | 31.4%) represent the smallest median household size with 1.23 persons per household.
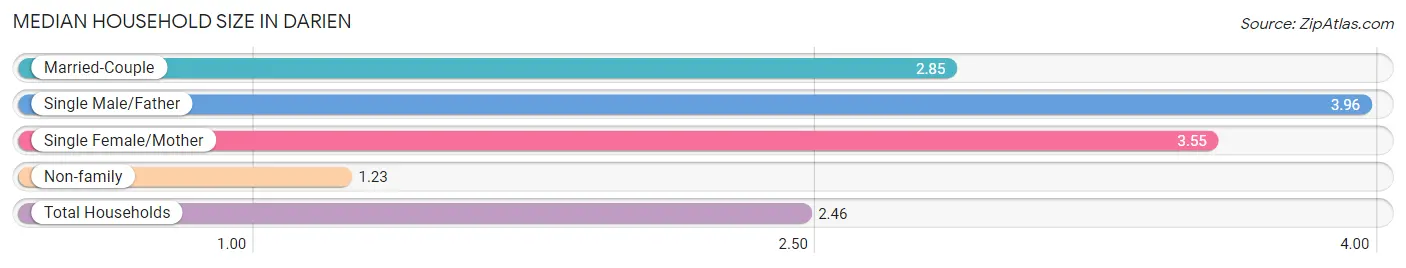
| Household Type | # Households | Household Size |
| Married-Couple | 280 (54.3%) | 2.85 |
| Single Male/Father | 25 (4.8%) | 3.96 |
| Single Female/Mother | 49 (9.5%) | 3.55 |
| Non-family | 162 (31.4%) | 1.23 |
| Total Households | 516 (100.0%) | 2.46 |
Household Size by Marriage Status in Darien
Out of a total of 516 households in Darien, 354 (68.6%) are family households, while 162 (31.4%) are nonfamily households. The most numerous type of family households are 2-person households, comprising 150, and the most common type of nonfamily households are 1-person households, comprising 130.
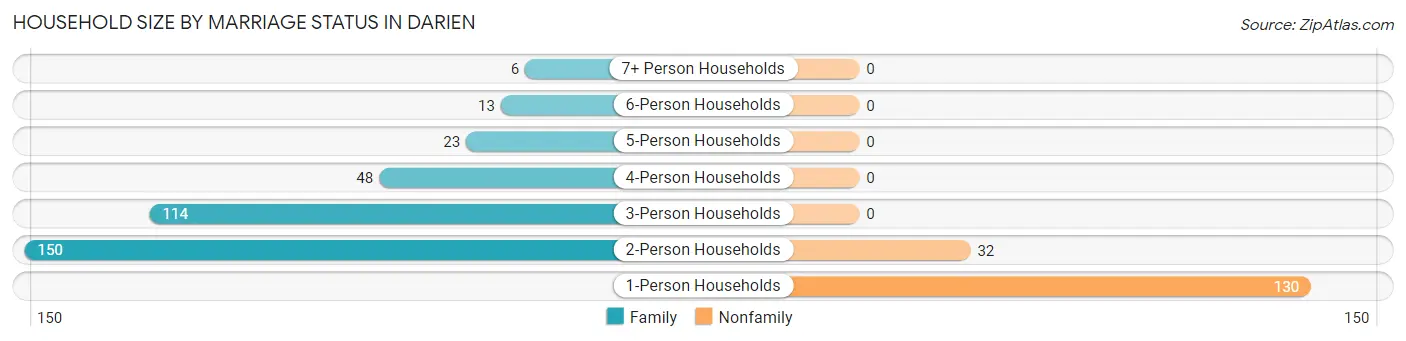
| Household Size | Family Households | Nonfamily Households |
| 1-Person Households | - | 130 (25.2%) |
| 2-Person Households | 150 (29.1%) | 32 (6.2%) |
| 3-Person Households | 114 (22.1%) | 0 (0.0%) |
| 4-Person Households | 48 (9.3%) | 0 (0.0%) |
| 5-Person Households | 23 (4.5%) | 0 (0.0%) |
| 6-Person Households | 13 (2.5%) | 0 (0.0%) |
| 7+ Person Households | 6 (1.2%) | 0 (0.0%) |
| Total | 354 (68.6%) | 162 (31.4%) |
Female Fertility in Darien
Fertility by Age in Darien
Average fertility rate in Darien is 54.0 births per 1,000 women. Women in the age bracket of 20 to 34 years have the highest fertility rate with 110.0 births per 1,000 women. Women in the age bracket of 20 to 34 years acount for 73.3% of all women with births.
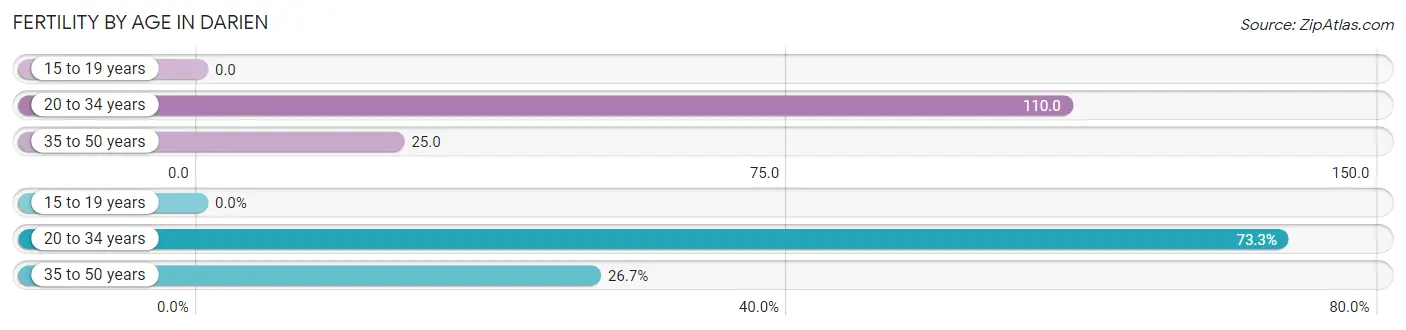
| Age Bracket | Women with Births | Births / 1,000 Women |
| 15 to 19 years | 0 (0.0%) | 0.0 |
| 20 to 34 years | 11 (73.3%) | 110.0 |
| 35 to 50 years | 4 (26.7%) | 25.0 |
| Total | 15 (100.0%) | 54.0 |
Fertility by Age by Marriage Status in Darien
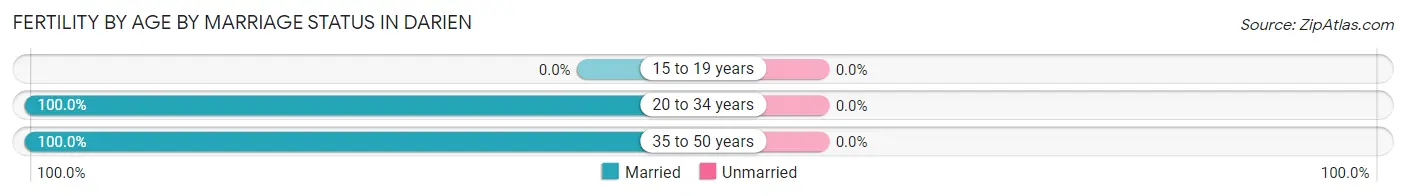
| Age Bracket | Married | Unmarried |
| 15 to 19 years | 0 (0.0%) | 0 (0.0%) |
| 20 to 34 years | 11 (100.0%) | 0 (0.0%) |
| 35 to 50 years | 4 (100.0%) | 0 (0.0%) |
| Total | 15 (100.0%) | 0 (0.0%) |
Fertility by Education in Darien
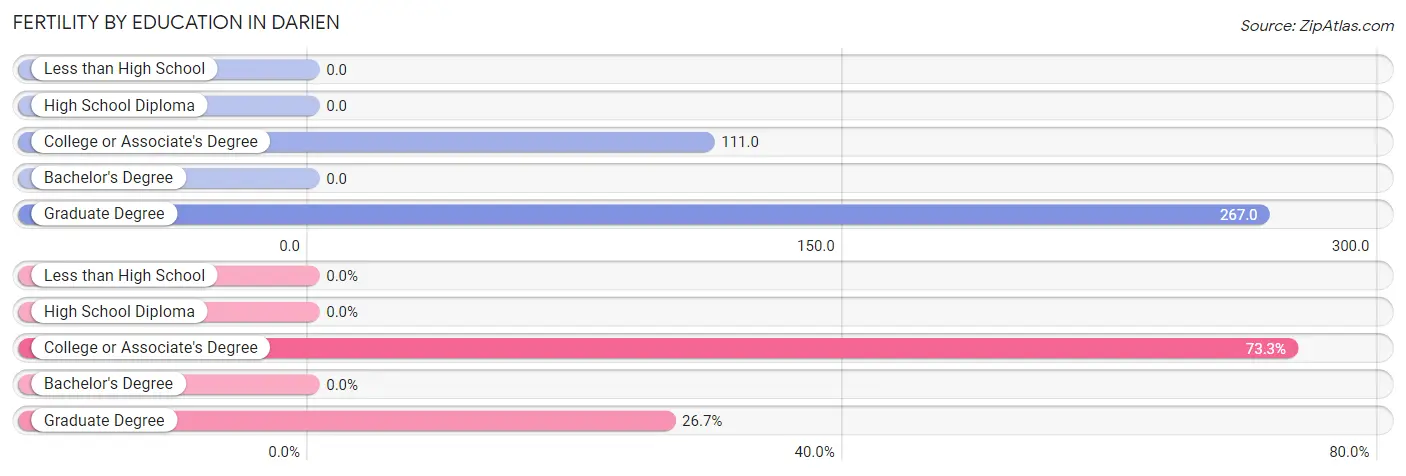
| Educational Attainment | Women with Births | Births / 1,000 Women |
| Less than High School | 0 (0.0%) | 0.0 |
| High School Diploma | 0 (0.0%) | 0.0 |
| College or Associate's Degree | 11 (73.3%) | 111.0 |
| Bachelor's Degree | 0 (0.0%) | 0.0 |
| Graduate Degree | 4 (26.7%) | 267.0 |
| Total | 15 (100.0%) | 54.0 |
Fertility by Education by Marriage Status in Darien
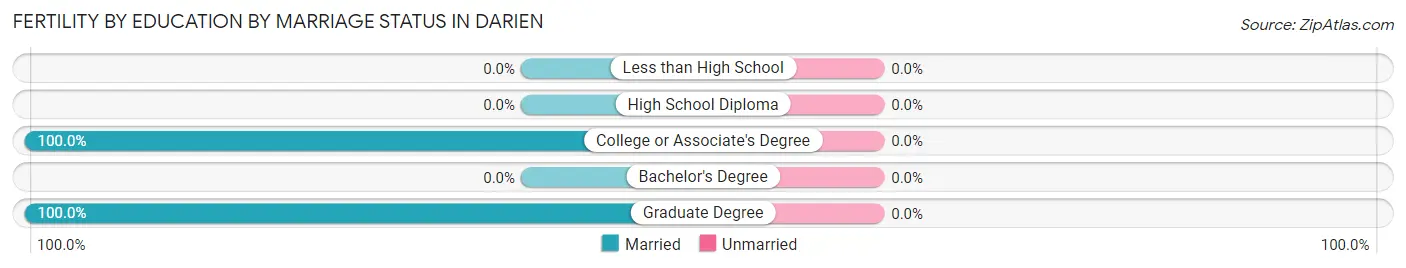
| Educational Attainment | Married | Unmarried |
| Less than High School | 0 (0.0%) | 0 (0.0%) |
| High School Diploma | 0 (0.0%) | 0 (0.0%) |
| College or Associate's Degree | 11 (100.0%) | 0 (0.0%) |
| Bachelor's Degree | 0 (0.0%) | 0 (0.0%) |
| Graduate Degree | 4 (100.0%) | 0 (0.0%) |
| Total | 15 (100.0%) | 0 (0.0%) |
Employment Characteristics in Darien
Employment by Class of Employer in Darien
Among the 690 employed individuals in Darien, private company employees (565 | 81.9%), local government employees (36 | 5.2%), and not-for-profit organizations (32 | 4.6%) make up the most common classes of employment.
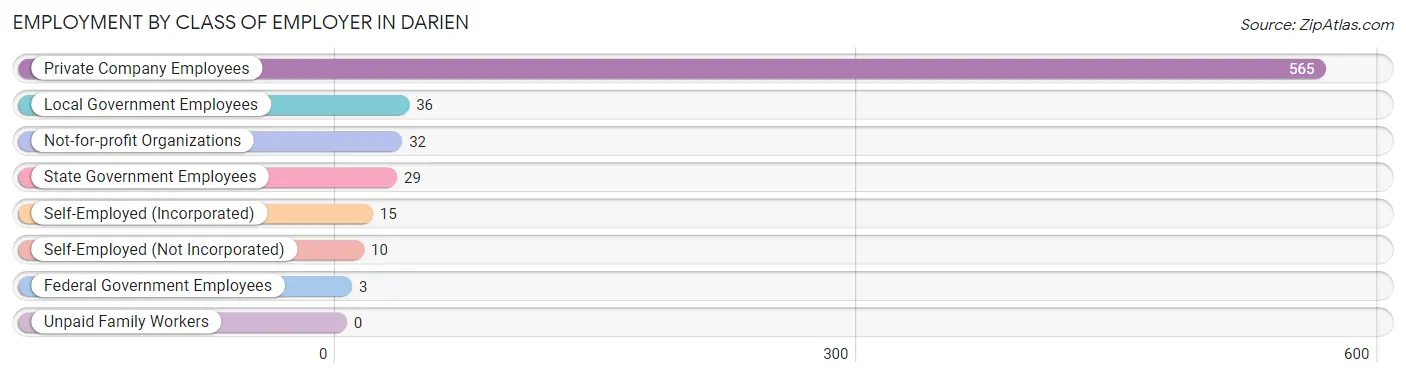
| Employer Class | # Employees | % Employees |
| Private Company Employees | 565 | 81.9% |
| Self-Employed (Incorporated) | 15 | 2.2% |
| Self-Employed (Not Incorporated) | 10 | 1.5% |
| Not-for-profit Organizations | 32 | 4.6% |
| Local Government Employees | 36 | 5.2% |
| State Government Employees | 29 | 4.2% |
| Federal Government Employees | 3 | 0.4% |
| Unpaid Family Workers | 0 | 0.0% |
| Total | 690 | 100.0% |
Employment Status by Age in Darien
According to the labor force statistics for Darien, out of the total population over 16 years of age (1,021), 69.7% or 712 individuals are in the labor force, with 3.1% or 22 of them unemployed. The age group with the highest labor force participation rate is 30 to 34 years, with 97.1% or 66 individuals in the labor force. Within the labor force, the 55 to 59 years age range has the highest percentage of unemployed individuals, with 18.6% or 8 of them being unemployed.
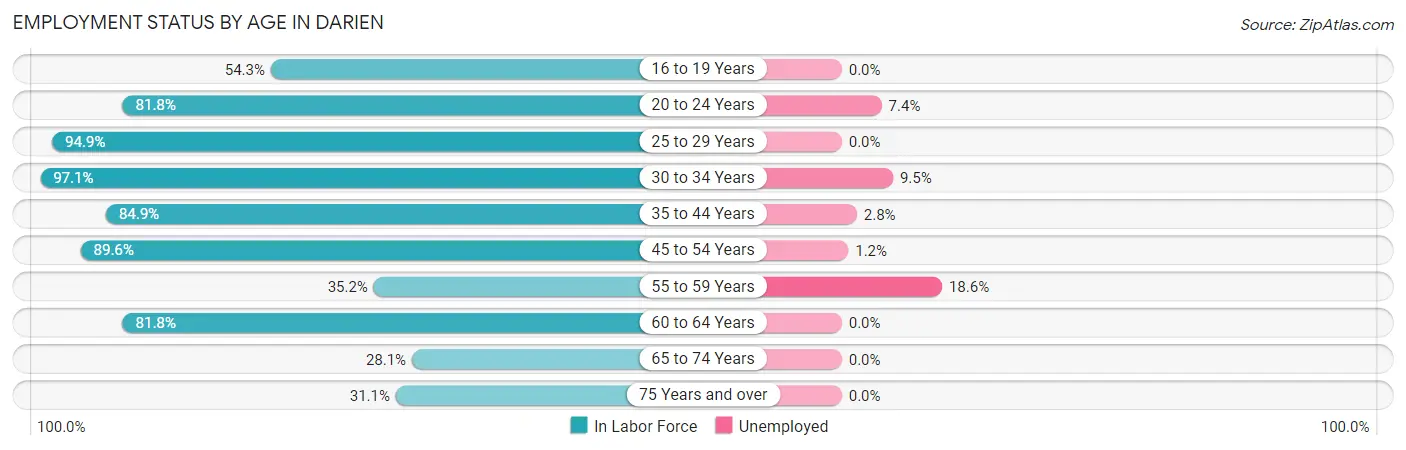
| Age Bracket | In Labor Force | Unemployed |
| 16 to 19 Years | 38 (54.3%) | 0 (0.0%) |
| 20 to 24 Years | 27 (81.8%) | 2 (7.4%) |
| 25 to 29 Years | 111 (94.9%) | 0 (0.0%) |
| 30 to 34 Years | 66 (97.1%) | 6 (9.5%) |
| 35 to 44 Years | 141 (84.9%) | 4 (2.8%) |
| 45 to 54 Years | 163 (89.6%) | 2 (1.2%) |
| 55 to 59 Years | 43 (35.2%) | 8 (18.6%) |
| 60 to 64 Years | 72 (81.8%) | 0 (0.0%) |
| 65 to 74 Years | 32 (28.1%) | 0 (0.0%) |
| 75 Years and over | 19 (31.1%) | 0 (0.0%) |
| Total | 712 (69.7%) | 22 (3.1%) |
Employment Status by Educational Attainment in Darien
According to labor force statistics for Darien, 80.2% of individuals (596) out of the total population between 25 and 64 years of age (743) are in the labor force, with 3.4% or 20 of them being unemployed. The group with the highest labor force participation rate are those with the educational attainment of high school diploma, with 95.6% or 241 individuals in the labor force. Within the labor force, individuals with less than high school education have the highest percentage of unemployment, with 12.0% or 6 of them being unemployed.
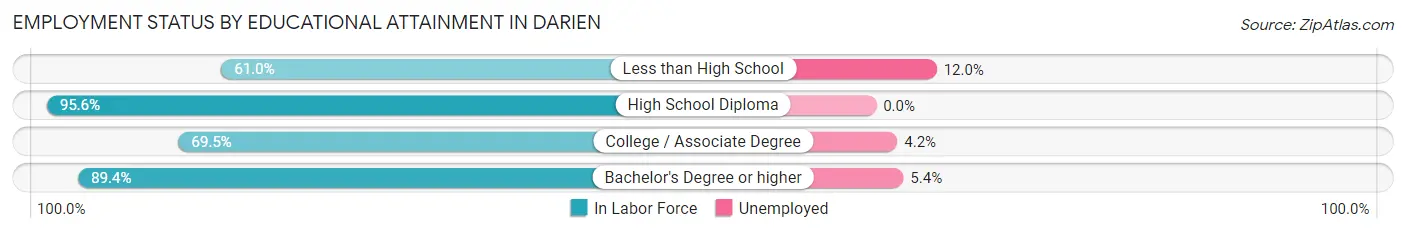
| Educational Attainment | In Labor Force | Unemployed |
| Less than High School | 50 (61.0%) | 10 (12.0%) |
| High School Diploma | 241 (95.6%) | 0 (0.0%) |
| College / Associate Degree | 212 (69.5%) | 13 (4.2%) |
| Bachelor's Degree or higher | 93 (89.4%) | 6 (5.4%) |
| Total | 596 (80.2%) | 25 (3.4%) |
Employment Occupations by Sex in Darien
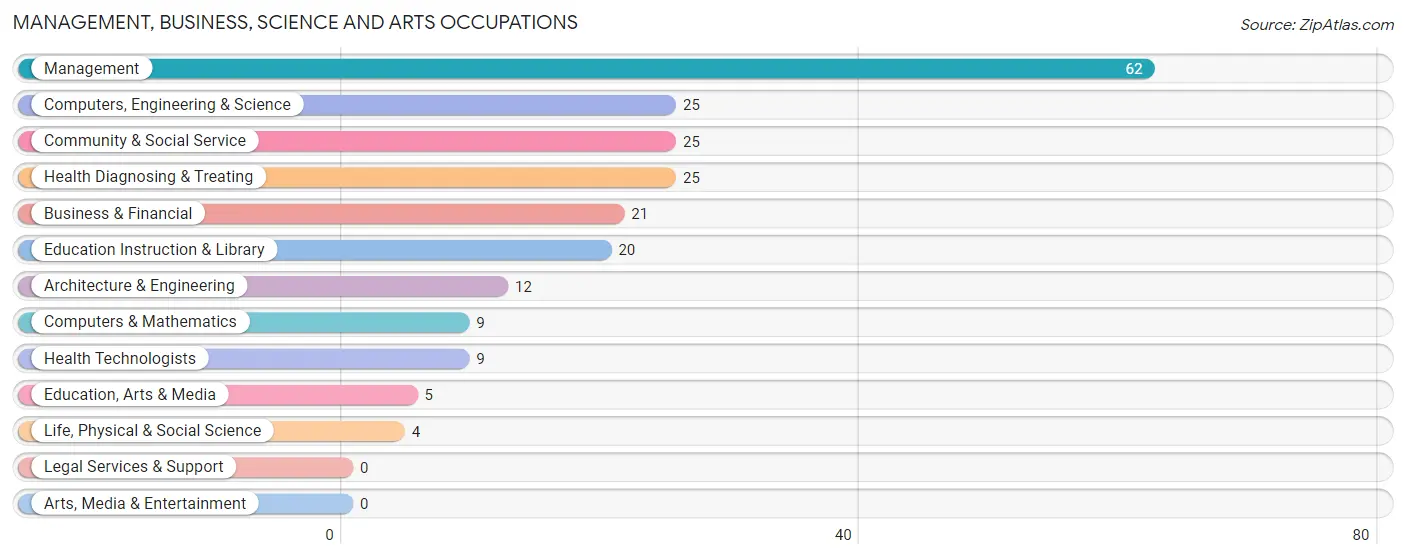
Management, Business, Science and Arts Occupations
The most common Management, Business, Science and Arts occupations in Darien are Management (62 | 9.0%), Computers, Engineering & Science (25 | 3.6%), Community & Social Service (25 | 3.6%), Health Diagnosing & Treating (25 | 3.6%), and Business & Financial (21 | 3.1%).
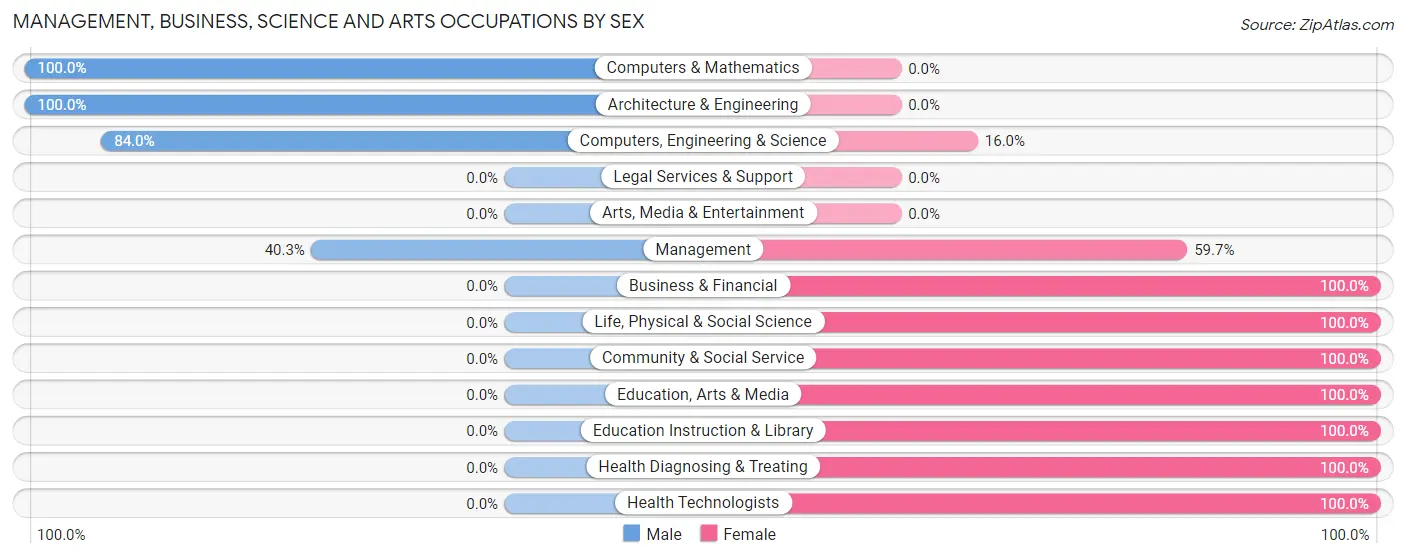
Management, Business, Science and Arts Occupations by Sex
Within the Management, Business, Science and Arts occupations in Darien, the most male-oriented occupations are Computers & Mathematics (100.0%), Architecture & Engineering (100.0%), and Computers, Engineering & Science (84.0%), while the most female-oriented occupations are Business & Financial (100.0%), Life, Physical & Social Science (100.0%), and Community & Social Service (100.0%).
| Occupation | Male | Female |
| Management | 25 (40.3%) | 37 (59.7%) |
| Business & Financial | 0 (0.0%) | 21 (100.0%) |
| Computers, Engineering & Science | 21 (84.0%) | 4 (16.0%) |
| Computers & Mathematics | 9 (100.0%) | 0 (0.0%) |
| Architecture & Engineering | 12 (100.0%) | 0 (0.0%) |
| Life, Physical & Social Science | 0 (0.0%) | 4 (100.0%) |
| Community & Social Service | 0 (0.0%) | 25 (100.0%) |
| Education, Arts & Media | 0 (0.0%) | 5 (100.0%) |
| Legal Services & Support | 0 (0.0%) | 0 (0.0%) |
| Education Instruction & Library | 0 (0.0%) | 20 (100.0%) |
| Arts, Media & Entertainment | 0 (0.0%) | 0 (0.0%) |
| Health Diagnosing & Treating | 0 (0.0%) | 25 (100.0%) |
| Health Technologists | 0 (0.0%) | 9 (100.0%) |
| Total (Category) | 46 (29.1%) | 112 (70.9%) |
| Total (Overall) | 376 (54.7%) | 311 (45.3%) |
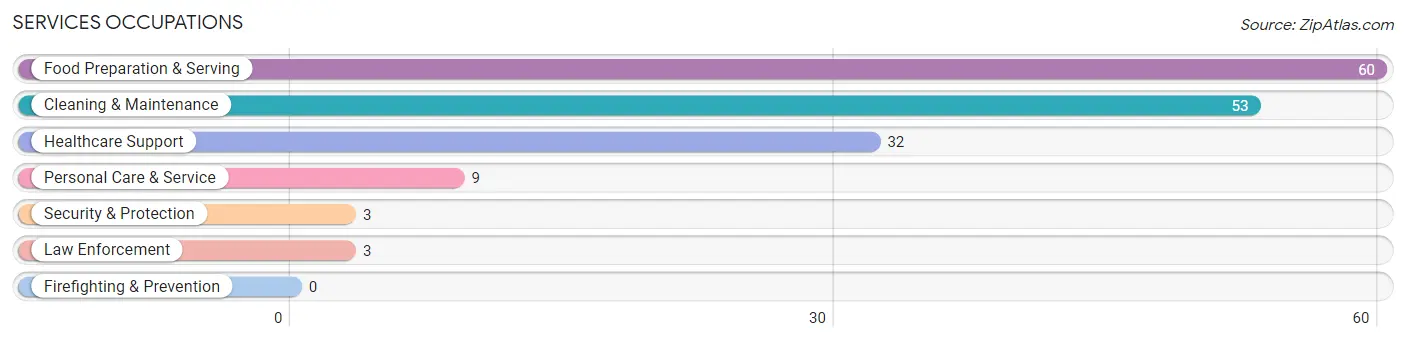
Services Occupations
The most common Services occupations in Darien are Food Preparation & Serving (60 | 8.7%), Cleaning & Maintenance (53 | 7.7%), Healthcare Support (32 | 4.7%), Personal Care & Service (9 | 1.3%), and Security & Protection (3 | 0.4%).
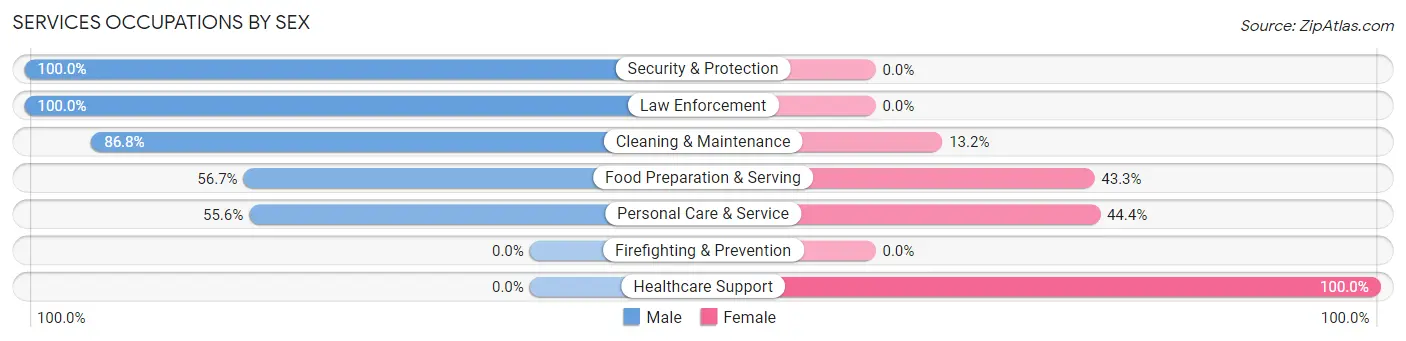
Services Occupations by Sex
Within the Services occupations in Darien, the most male-oriented occupations are Security & Protection (100.0%), Law Enforcement (100.0%), and Cleaning & Maintenance (86.8%), while the most female-oriented occupations are Healthcare Support (100.0%), Personal Care & Service (44.4%), and Food Preparation & Serving (43.3%).
| Occupation | Male | Female |
| Healthcare Support | 0 (0.0%) | 32 (100.0%) |
| Security & Protection | 3 (100.0%) | 0 (0.0%) |
| Firefighting & Prevention | 0 (0.0%) | 0 (0.0%) |
| Law Enforcement | 3 (100.0%) | 0 (0.0%) |
| Food Preparation & Serving | 34 (56.7%) | 26 (43.3%) |
| Cleaning & Maintenance | 46 (86.8%) | 7 (13.2%) |
| Personal Care & Service | 5 (55.6%) | 4 (44.4%) |
| Total (Category) | 88 (56.0%) | 69 (44.0%) |
| Total (Overall) | 376 (54.7%) | 311 (45.3%) |
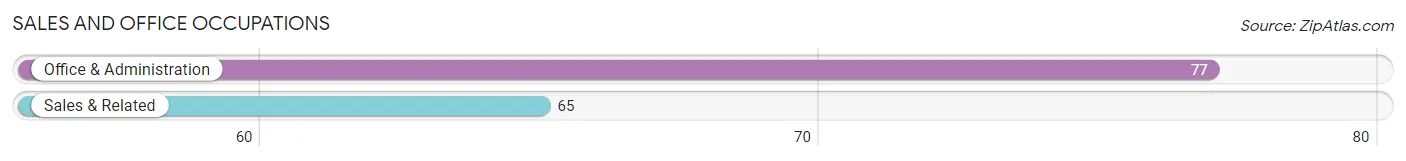
Sales and Office Occupations
The most common Sales and Office occupations in Darien are Office & Administration (77 | 11.2%), and Sales & Related (65 | 9.5%).
Sales and Office Occupations by Sex
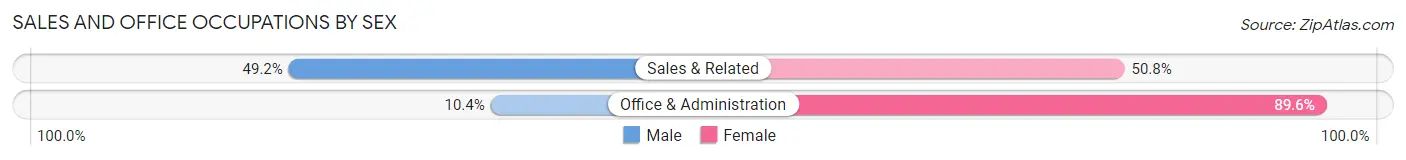
| Occupation | Male | Female |
| Sales & Related | 32 (49.2%) | 33 (50.8%) |
| Office & Administration | 8 (10.4%) | 69 (89.6%) |
| Total (Category) | 40 (28.2%) | 102 (71.8%) |
| Total (Overall) | 376 (54.7%) | 311 (45.3%) |
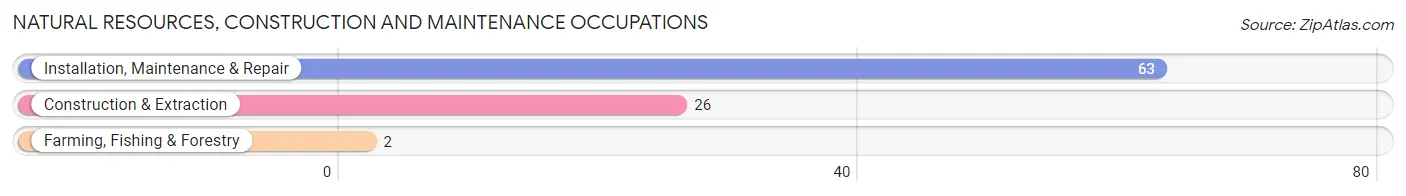
Natural Resources, Construction and Maintenance Occupations
The most common Natural Resources, Construction and Maintenance occupations in Darien are Installation, Maintenance & Repair (63 | 9.2%), Construction & Extraction (26 | 3.8%), and Farming, Fishing & Forestry (2 | 0.3%).
Natural Resources, Construction and Maintenance Occupations by Sex
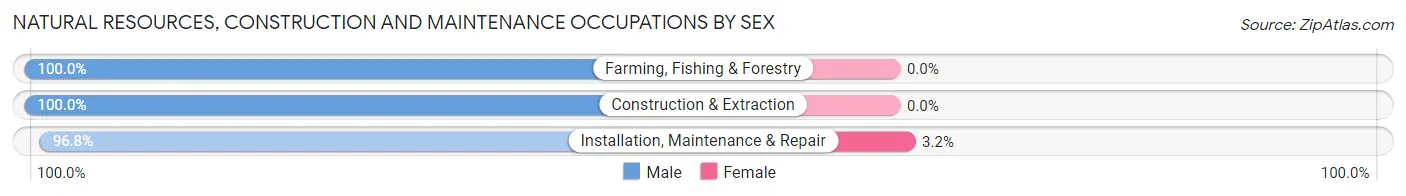
| Occupation | Male | Female |
| Farming, Fishing & Forestry | 2 (100.0%) | 0 (0.0%) |
| Construction & Extraction | 26 (100.0%) | 0 (0.0%) |
| Installation, Maintenance & Repair | 61 (96.8%) | 2 (3.2%) |
| Total (Category) | 89 (97.8%) | 2 (2.2%) |
| Total (Overall) | 376 (54.7%) | 311 (45.3%) |
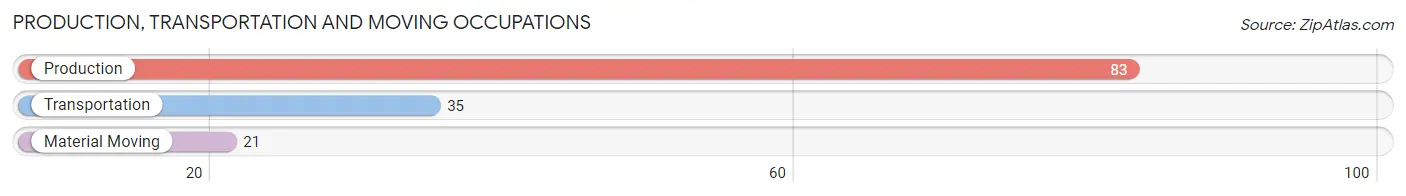
Production, Transportation and Moving Occupations
The most common Production, Transportation and Moving occupations in Darien are Production (83 | 12.1%), Transportation (35 | 5.1%), and Material Moving (21 | 3.1%).
Production, Transportation and Moving Occupations by Sex
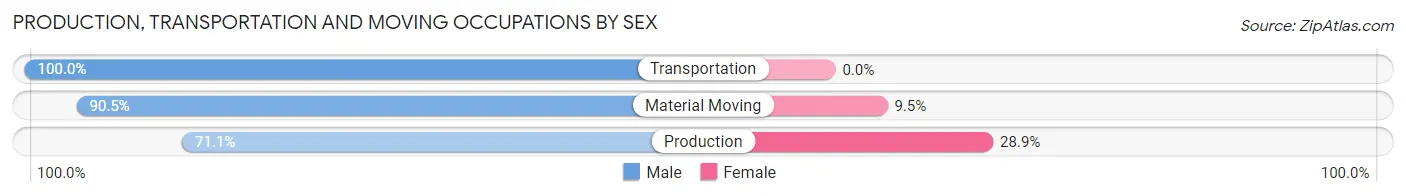
| Occupation | Male | Female |
| Production | 59 (71.1%) | 24 (28.9%) |
| Transportation | 35 (100.0%) | 0 (0.0%) |
| Material Moving | 19 (90.5%) | 2 (9.5%) |
| Total (Category) | 113 (81.3%) | 26 (18.7%) |
| Total (Overall) | 376 (54.7%) | 311 (45.3%) |
Employment Industries by Sex in Darien
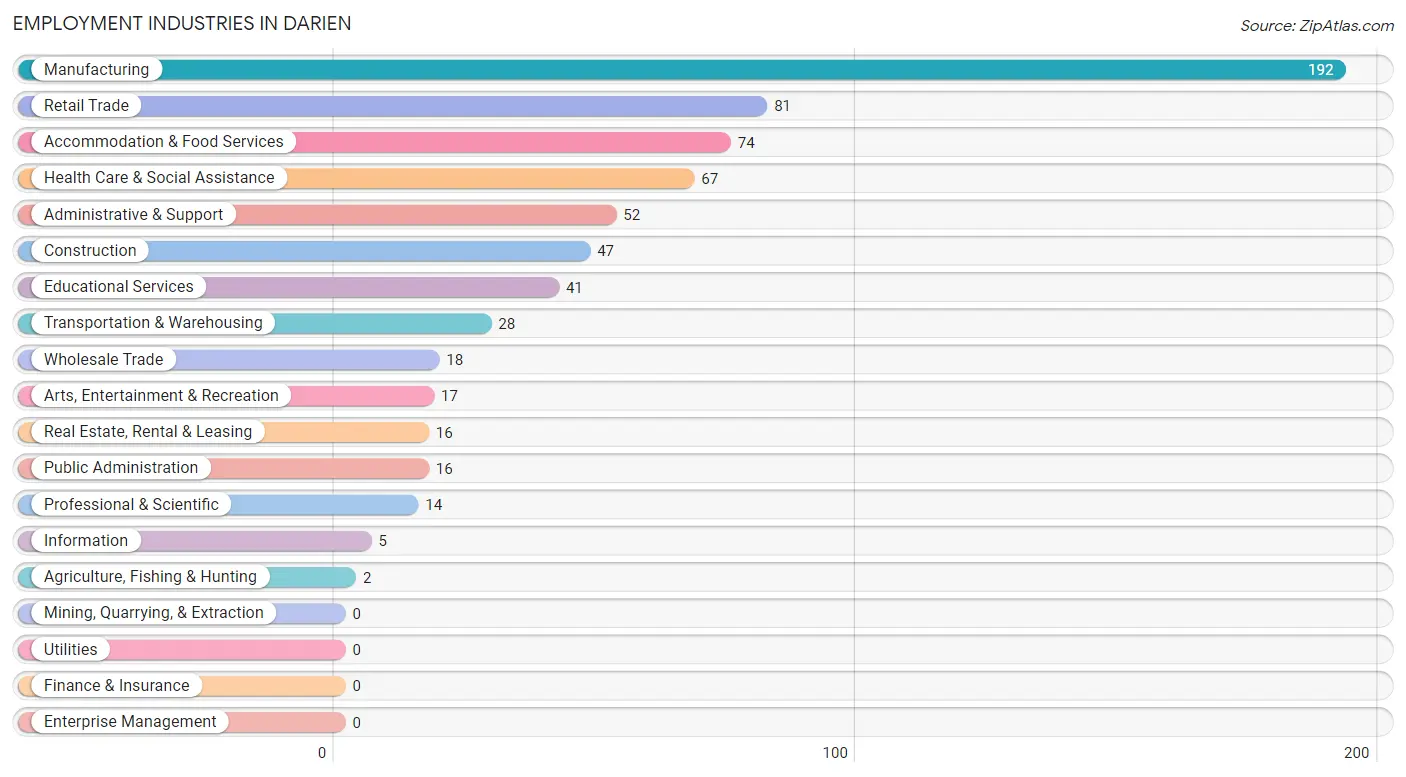
Employment Industries in Darien
The major employment industries in Darien include Manufacturing (192 | 28.0%), Retail Trade (81 | 11.8%), Accommodation & Food Services (74 | 10.8%), Health Care & Social Assistance (67 | 9.8%), and Administrative & Support (52 | 7.6%).
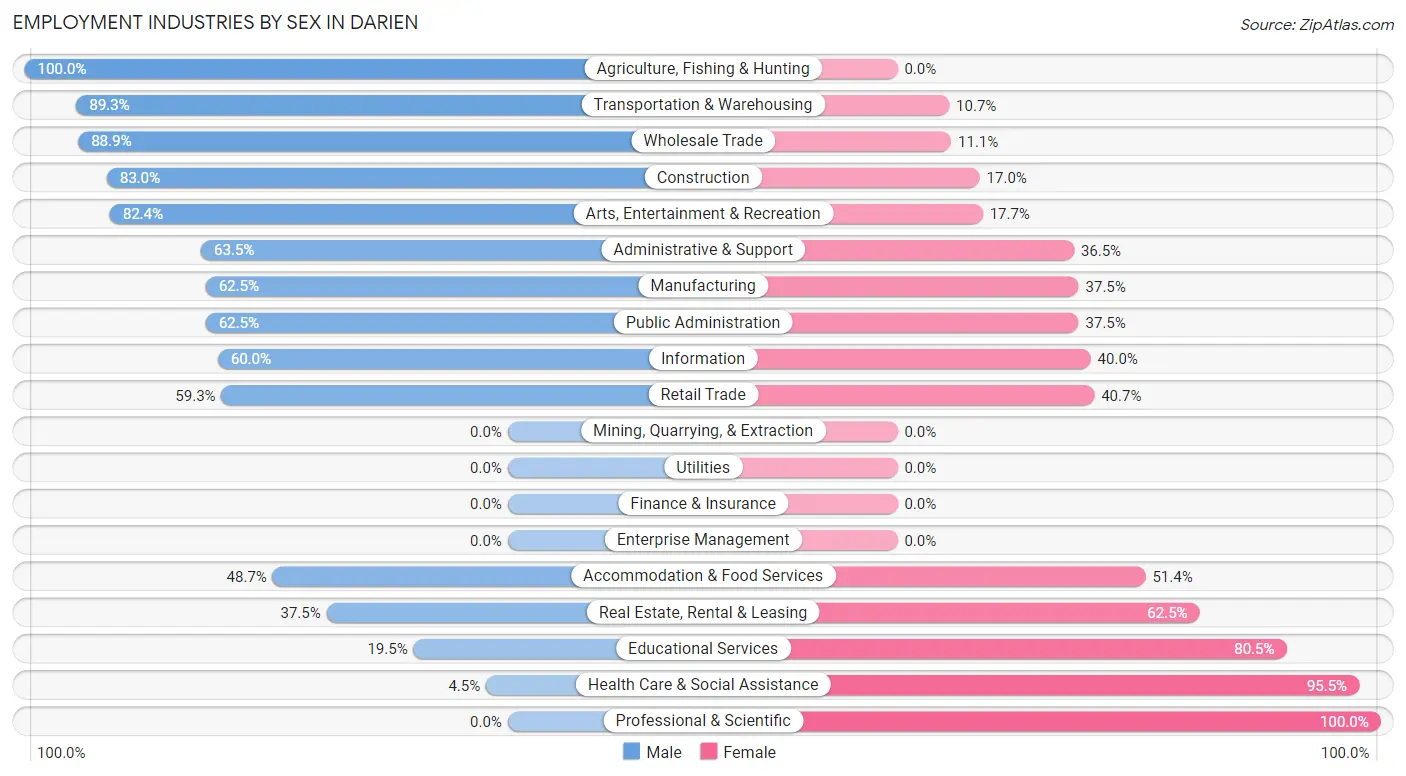
Employment Industries by Sex in Darien
The Darien industries that see more men than women are Agriculture, Fishing & Hunting (100.0%), Transportation & Warehousing (89.3%), and Wholesale Trade (88.9%), whereas the industries that tend to have a higher number of women are Professional & Scientific (100.0%), Health Care & Social Assistance (95.5%), and Educational Services (80.5%).
| Industry | Male | Female |
| Agriculture, Fishing & Hunting | 2 (100.0%) | 0 (0.0%) |
| Mining, Quarrying, & Extraction | 0 (0.0%) | 0 (0.0%) |
| Construction | 39 (83.0%) | 8 (17.0%) |
| Manufacturing | 120 (62.5%) | 72 (37.5%) |
| Wholesale Trade | 16 (88.9%) | 2 (11.1%) |
| Retail Trade | 48 (59.3%) | 33 (40.7%) |
| Transportation & Warehousing | 25 (89.3%) | 3 (10.7%) |
| Utilities | 0 (0.0%) | 0 (0.0%) |
| Information | 3 (60.0%) | 2 (40.0%) |
| Finance & Insurance | 0 (0.0%) | 0 (0.0%) |
| Real Estate, Rental & Leasing | 6 (37.5%) | 10 (62.5%) |
| Professional & Scientific | 0 (0.0%) | 14 (100.0%) |
| Enterprise Management | 0 (0.0%) | 0 (0.0%) |
| Administrative & Support | 33 (63.5%) | 19 (36.5%) |
| Educational Services | 8 (19.5%) | 33 (80.5%) |
| Health Care & Social Assistance | 3 (4.5%) | 64 (95.5%) |
| Arts, Entertainment & Recreation | 14 (82.4%) | 3 (17.6%) |
| Accommodation & Food Services | 36 (48.6%) | 38 (51.3%) |
| Public Administration | 10 (62.5%) | 6 (37.5%) |
| Total | 376 (54.7%) | 311 (45.3%) |
Education in Darien
School Enrollment in Darien
The most common levels of schooling among the 279 students in Darien are elementary school (89 | 31.9%), high school (68 | 24.4%), and middle school (66 | 23.7%).
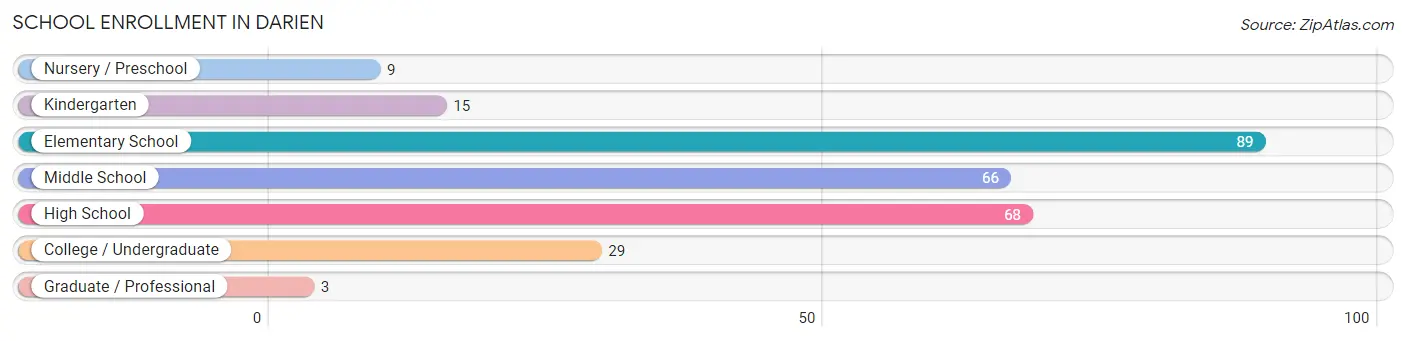
| School Level | # Students | % Students |
| Nursery / Preschool | 9 | 3.2% |
| Kindergarten | 15 | 5.4% |
| Elementary School | 89 | 31.9% |
| Middle School | 66 | 23.7% |
| High School | 68 | 24.4% |
| College / Undergraduate | 29 | 10.4% |
| Graduate / Professional | 3 | 1.1% |
| Total | 279 | 100.0% |
School Enrollment by Age by Funding Source in Darien
Out of a total of 279 students who are enrolled in schools in Darien, 35 (12.5%) attend a private institution, while the remaining 244 (87.5%) are enrolled in public schools. The age group of 25 to 34 year olds has the highest likelihood of being enrolled in private schools, with 3 (100.0% in the age bracket) enrolled. Conversely, the age group of 15 to 17 year olds has the lowest likelihood of being enrolled in a private school, with 53 (100.0% in the age bracket) attending a public institution.
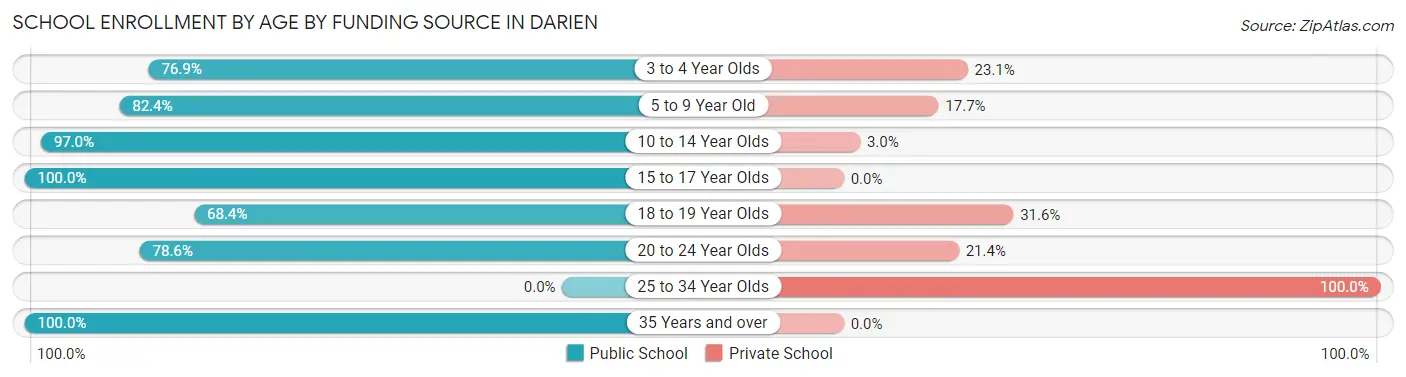
| Age Bracket | Public School | Private School |
| 3 to 4 Year Olds | 10 (76.9%) | 3 (23.1%) |
| 5 to 9 Year Old | 84 (82.4%) | 18 (17.6%) |
| 10 to 14 Year Olds | 64 (97.0%) | 2 (3.0%) |
| 15 to 17 Year Olds | 53 (100.0%) | 0 (0.0%) |
| 18 to 19 Year Olds | 13 (68.4%) | 6 (31.6%) |
| 20 to 24 Year Olds | 11 (78.6%) | 3 (21.4%) |
| 25 to 34 Year Olds | 0 (0.0%) | 3 (100.0%) |
| 35 Years and over | 9 (100.0%) | 0 (0.0%) |
| Total | 244 (87.5%) | 35 (12.5%) |
Educational Attainment by Field of Study in Darien
Science & technology (25 | 21.2%), liberal arts & history (16 | 13.6%), business (15 | 12.7%), education (13 | 11.0%), and social sciences (12 | 10.2%) are the most common fields of study among 118 individuals in Darien who have obtained a bachelor's degree or higher.
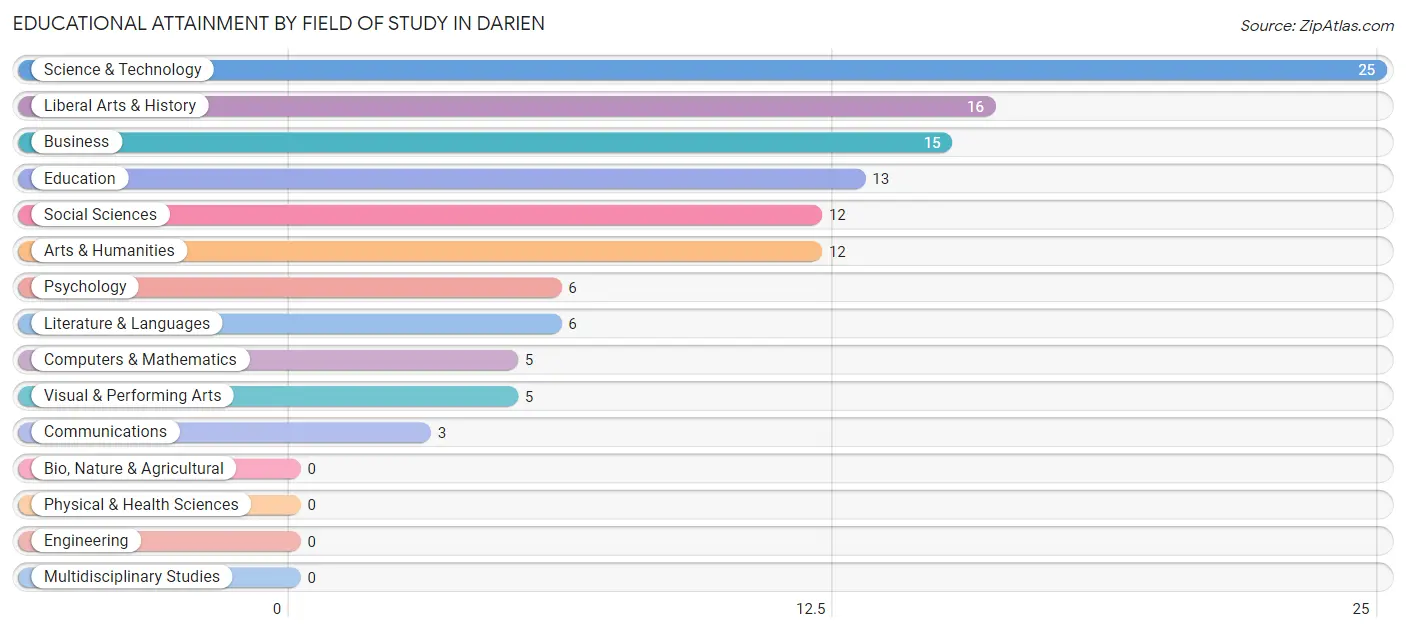
| Field of Study | # Graduates | % Graduates |
| Computers & Mathematics | 5 | 4.2% |
| Bio, Nature & Agricultural | 0 | 0.0% |
| Physical & Health Sciences | 0 | 0.0% |
| Psychology | 6 | 5.1% |
| Social Sciences | 12 | 10.2% |
| Engineering | 0 | 0.0% |
| Multidisciplinary Studies | 0 | 0.0% |
| Science & Technology | 25 | 21.2% |
| Business | 15 | 12.7% |
| Education | 13 | 11.0% |
| Literature & Languages | 6 | 5.1% |
| Liberal Arts & History | 16 | 13.6% |
| Visual & Performing Arts | 5 | 4.2% |
| Communications | 3 | 2.5% |
| Arts & Humanities | 12 | 10.2% |
| Total | 118 | 100.0% |
Transportation & Commute in Darien
Vehicle Availability by Sex in Darien
The most prevalent vehicle ownership categories in Darien are males with 2 vehicles (170, accounting for 44.9%) and females with 2 vehicles (179, making up 54.7%).
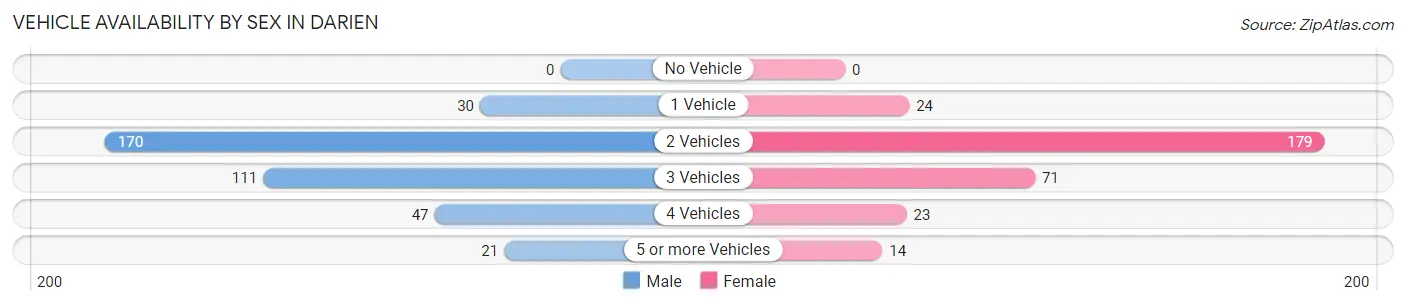
| Vehicles Available | Male | Female |
| No Vehicle | 0 (0.0%) | 0 (0.0%) |
| 1 Vehicle | 30 (7.9%) | 24 (7.7%) |
| 2 Vehicles | 170 (44.9%) | 179 (57.6%) |
| 3 Vehicles | 111 (29.3%) | 71 (22.8%) |
| 4 Vehicles | 47 (12.4%) | 23 (7.4%) |
| 5 or more Vehicles | 21 (5.5%) | 14 (4.5%) |
| Total | 379 (100.0%) | 311 (100.0%) |
Commute Time in Darien
The most frequently occuring commute durations in Darien are 15 to 19 minutes (156 commuters, 22.7%), 10 to 14 minutes (136 commuters, 19.8%), and 20 to 24 minutes (131 commuters, 19.0%).
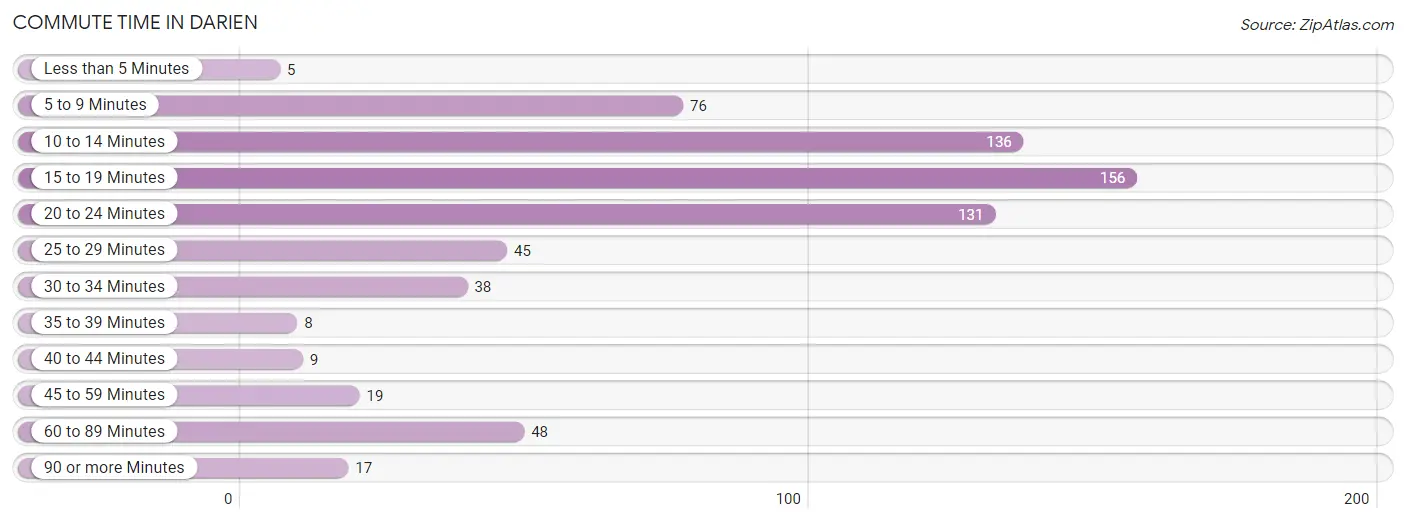
| Commute Time | # Commuters | % Commuters |
| Less than 5 Minutes | 5 | 0.7% |
| 5 to 9 Minutes | 76 | 11.1% |
| 10 to 14 Minutes | 136 | 19.8% |
| 15 to 19 Minutes | 156 | 22.7% |
| 20 to 24 Minutes | 131 | 19.0% |
| 25 to 29 Minutes | 45 | 6.5% |
| 30 to 34 Minutes | 38 | 5.5% |
| 35 to 39 Minutes | 8 | 1.2% |
| 40 to 44 Minutes | 9 | 1.3% |
| 45 to 59 Minutes | 19 | 2.8% |
| 60 to 89 Minutes | 48 | 7.0% |
| 90 or more Minutes | 17 | 2.5% |
Commute Time by Sex in Darien
The most common commute times in Darien are 15 to 19 minutes (89 commuters, 23.5%) for males and 10 to 14 minutes (69 commuters, 22.3%) for females.
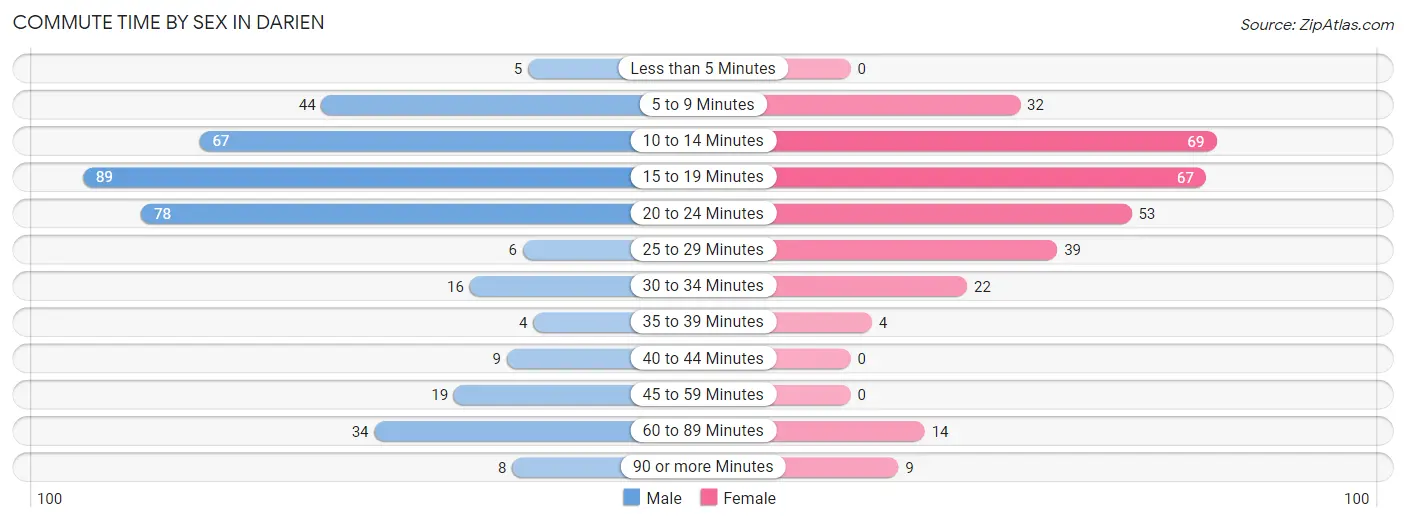
| Commute Time | Male | Female |
| Less than 5 Minutes | 5 (1.3%) | 0 (0.0%) |
| 5 to 9 Minutes | 44 (11.6%) | 32 (10.4%) |
| 10 to 14 Minutes | 67 (17.7%) | 69 (22.3%) |
| 15 to 19 Minutes | 89 (23.5%) | 67 (21.7%) |
| 20 to 24 Minutes | 78 (20.6%) | 53 (17.2%) |
| 25 to 29 Minutes | 6 (1.6%) | 39 (12.6%) |
| 30 to 34 Minutes | 16 (4.2%) | 22 (7.1%) |
| 35 to 39 Minutes | 4 (1.1%) | 4 (1.3%) |
| 40 to 44 Minutes | 9 (2.4%) | 0 (0.0%) |
| 45 to 59 Minutes | 19 (5.0%) | 0 (0.0%) |
| 60 to 89 Minutes | 34 (9.0%) | 14 (4.5%) |
| 90 or more Minutes | 8 (2.1%) | 9 (2.9%) |
Time of Departure to Work by Sex in Darien
The most frequent times of departure to work in Darien are 7:00 AM to 7:29 AM (80, 21.1%) for males and 7:30 AM to 7:59 AM (80, 25.9%) for females.
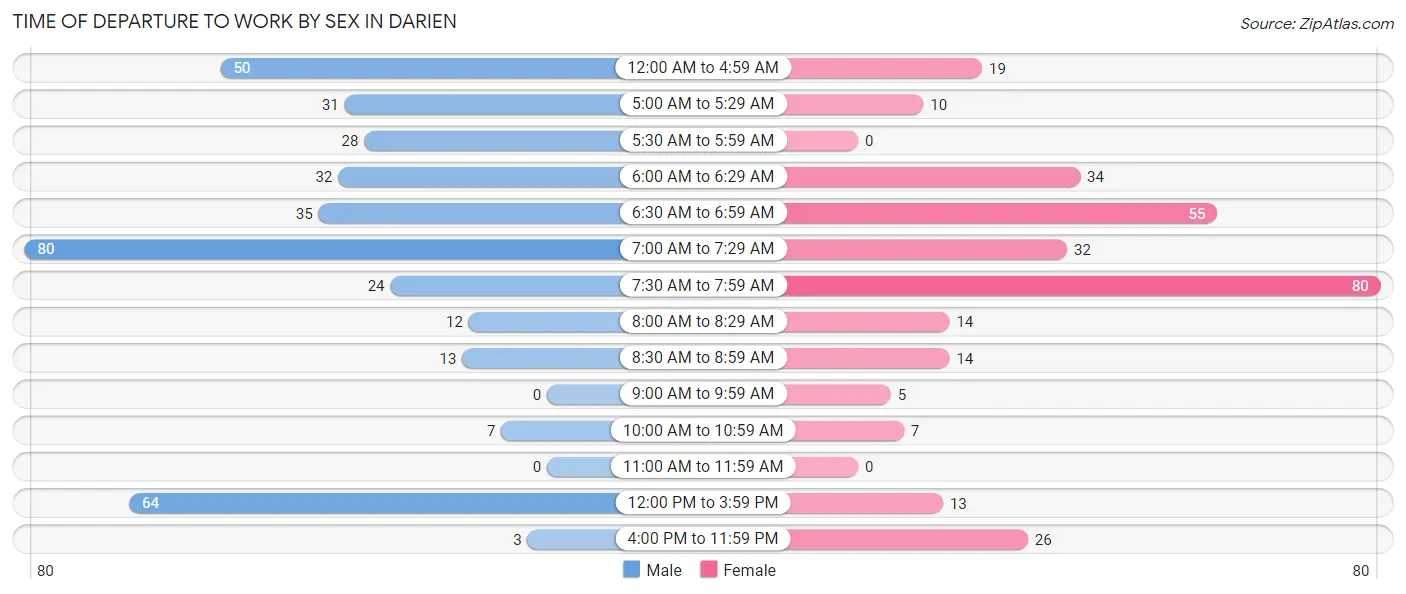
| Time of Departure | Male | Female |
| 12:00 AM to 4:59 AM | 50 (13.2%) | 19 (6.1%) |
| 5:00 AM to 5:29 AM | 31 (8.2%) | 10 (3.2%) |
| 5:30 AM to 5:59 AM | 28 (7.4%) | 0 (0.0%) |
| 6:00 AM to 6:29 AM | 32 (8.4%) | 34 (11.0%) |
| 6:30 AM to 6:59 AM | 35 (9.2%) | 55 (17.8%) |
| 7:00 AM to 7:29 AM | 80 (21.1%) | 32 (10.4%) |
| 7:30 AM to 7:59 AM | 24 (6.3%) | 80 (25.9%) |
| 8:00 AM to 8:29 AM | 12 (3.2%) | 14 (4.5%) |
| 8:30 AM to 8:59 AM | 13 (3.4%) | 14 (4.5%) |
| 9:00 AM to 9:59 AM | 0 (0.0%) | 5 (1.6%) |
| 10:00 AM to 10:59 AM | 7 (1.8%) | 7 (2.3%) |
| 11:00 AM to 11:59 AM | 0 (0.0%) | 0 (0.0%) |
| 12:00 PM to 3:59 PM | 64 (16.9%) | 13 (4.2%) |
| 4:00 PM to 11:59 PM | 3 (0.8%) | 26 (8.4%) |
| Total | 379 (100.0%) | 309 (100.0%) |
Housing Occupancy in Darien
Occupancy by Ownership in Darien
Of the total 516 dwellings in Darien, owner-occupied units account for 414 (80.2%), while renter-occupied units make up 102 (19.8%).
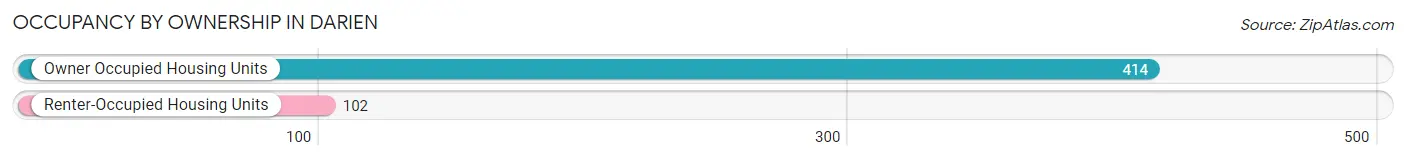
| Occupancy | # Housing Units | % Housing Units |
| Owner Occupied Housing Units | 414 | 80.2% |
| Renter-Occupied Housing Units | 102 | 19.8% |
| Total Occupied Housing Units | 516 | 100.0% |
Occupancy by Household Size in Darien
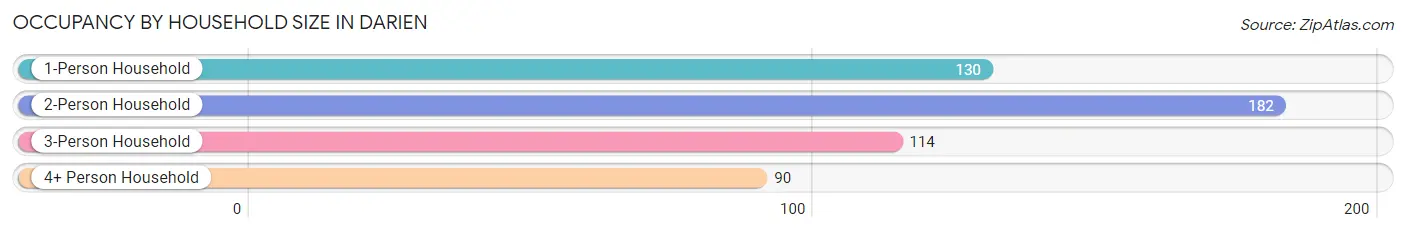
| Household Size | # Housing Units | % Housing Units |
| 1-Person Household | 130 | 25.2% |
| 2-Person Household | 182 | 35.3% |
| 3-Person Household | 114 | 22.1% |
| 4+ Person Household | 90 | 17.4% |
| Total Housing Units | 516 | 100.0% |
Occupancy by Ownership by Household Size in Darien
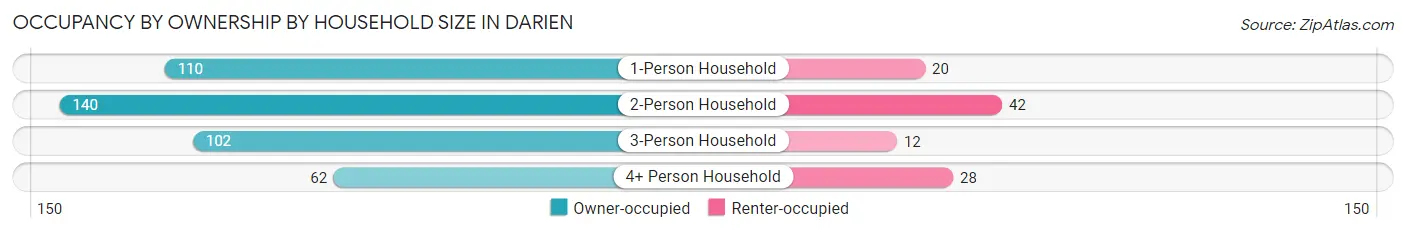
| Household Size | Owner-occupied | Renter-occupied |
| 1-Person Household | 110 (84.6%) | 20 (15.4%) |
| 2-Person Household | 140 (76.9%) | 42 (23.1%) |
| 3-Person Household | 102 (89.5%) | 12 (10.5%) |
| 4+ Person Household | 62 (68.9%) | 28 (31.1%) |
| Total Housing Units | 414 (80.2%) | 102 (19.8%) |
Occupancy by Educational Attainment in Darien
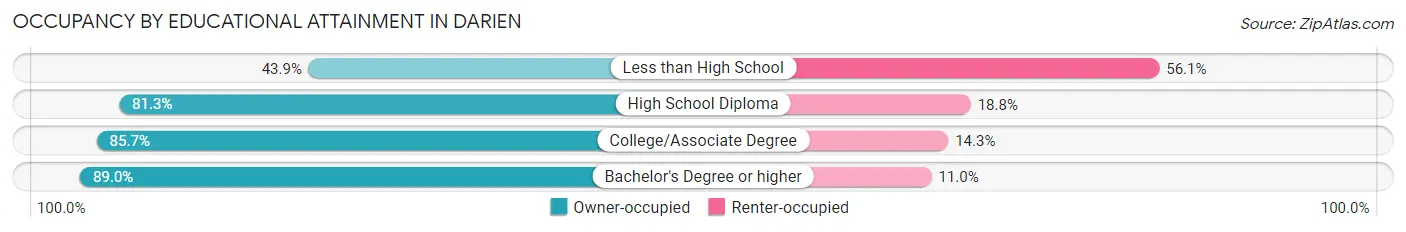
| Household Size | Owner-occupied | Renter-occupied |
| Less than High School | 25 (43.9%) | 32 (56.1%) |
| High School Diploma | 130 (81.2%) | 30 (18.8%) |
| College/Associate Degree | 186 (85.7%) | 31 (14.3%) |
| Bachelor's Degree or higher | 73 (89.0%) | 9 (11.0%) |
Occupancy by Age of Householder in Darien
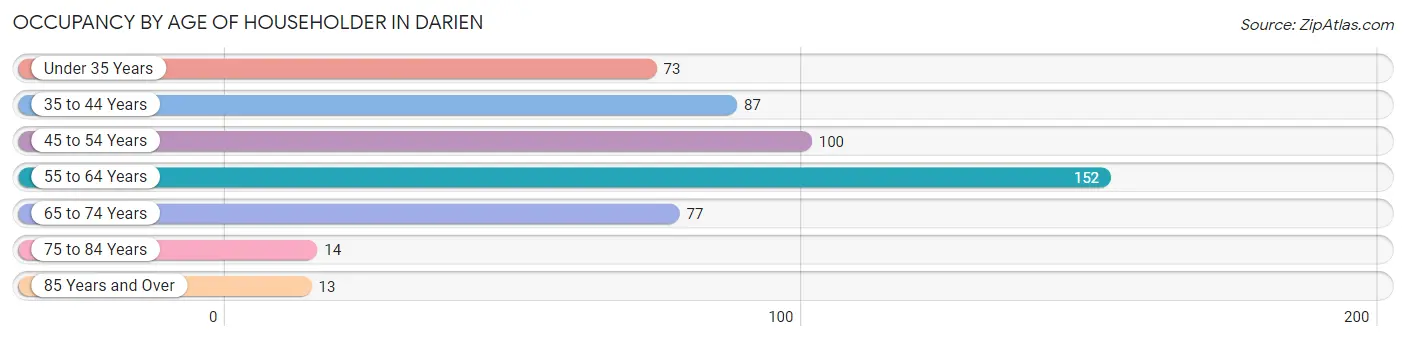
| Age Bracket | # Households | % Households |
| Under 35 Years | 73 | 14.1% |
| 35 to 44 Years | 87 | 16.9% |
| 45 to 54 Years | 100 | 19.4% |
| 55 to 64 Years | 152 | 29.5% |
| 65 to 74 Years | 77 | 14.9% |
| 75 to 84 Years | 14 | 2.7% |
| 85 Years and Over | 13 | 2.5% |
| Total | 516 | 100.0% |
Housing Finances in Darien
Median Income by Occupancy in Darien
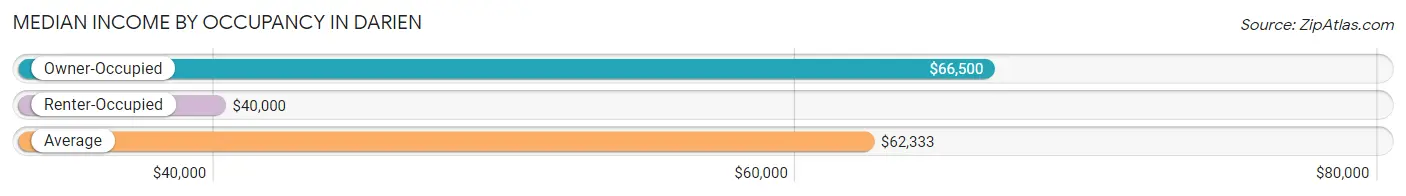
| Occupancy Type | # Households | Median Income |
| Owner-Occupied | 414 (80.2%) | $66,500 |
| Renter-Occupied | 102 (19.8%) | $40,000 |
| Average | 516 (100.0%) | $62,333 |
Occupancy by Householder Income Bracket in Darien
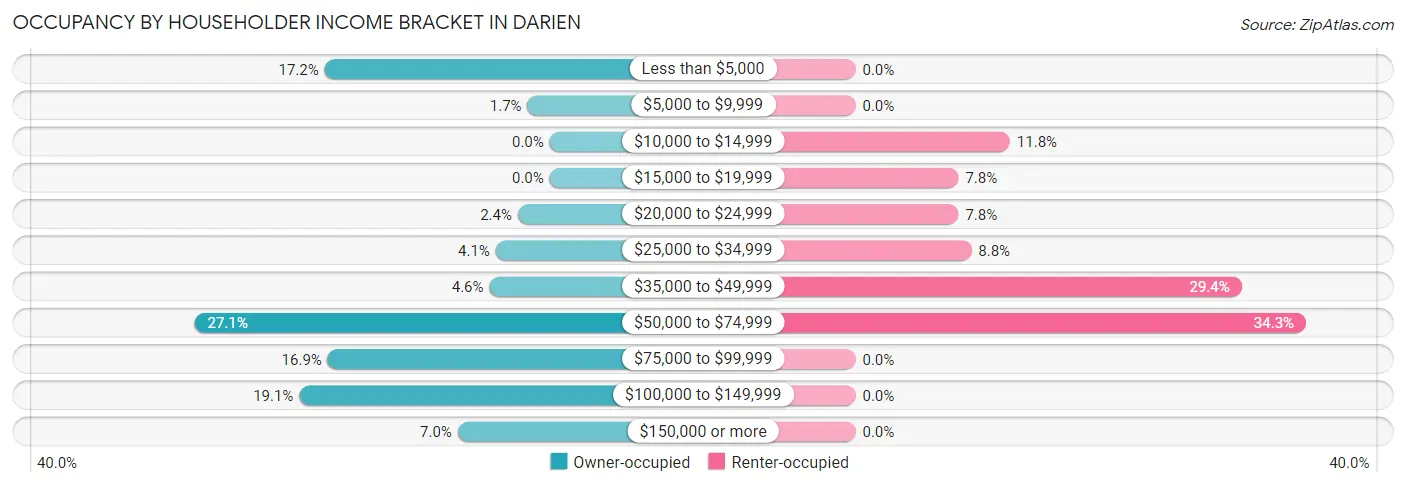
| Income Bracket | Owner-occupied | Renter-occupied |
| Less than $5,000 | 71 (17.2%) | 0 (0.0%) |
| $5,000 to $9,999 | 7 (1.7%) | 0 (0.0%) |
| $10,000 to $14,999 | 0 (0.0%) | 12 (11.8%) |
| $15,000 to $19,999 | 0 (0.0%) | 8 (7.8%) |
| $20,000 to $24,999 | 10 (2.4%) | 8 (7.8%) |
| $25,000 to $34,999 | 17 (4.1%) | 9 (8.8%) |
| $35,000 to $49,999 | 19 (4.6%) | 30 (29.4%) |
| $50,000 to $74,999 | 112 (27.1%) | 35 (34.3%) |
| $75,000 to $99,999 | 70 (16.9%) | 0 (0.0%) |
| $100,000 to $149,999 | 79 (19.1%) | 0 (0.0%) |
| $150,000 or more | 29 (7.0%) | 0 (0.0%) |
| Total | 414 (100.0%) | 102 (100.0%) |
Monthly Housing Cost Tiers in Darien
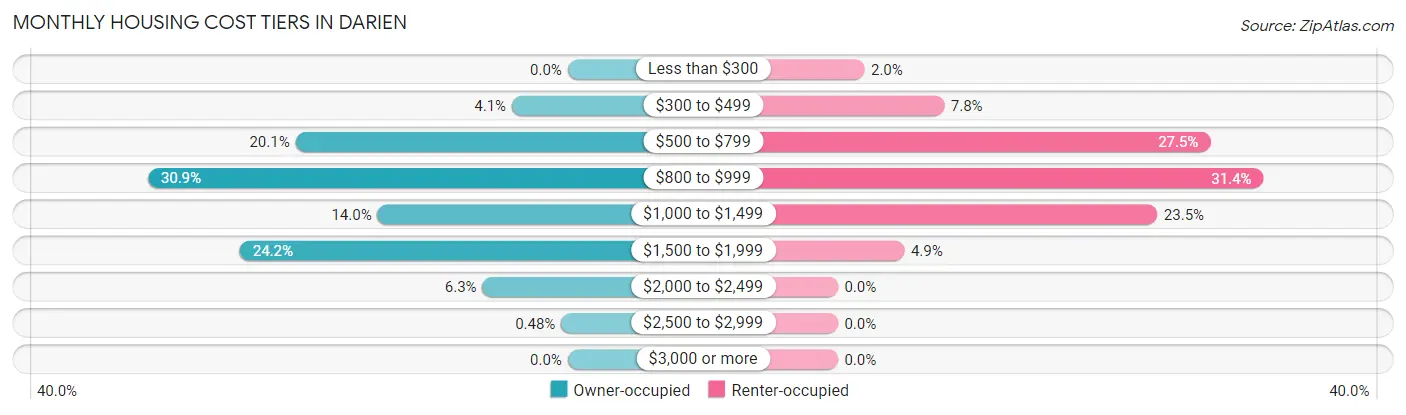
| Monthly Cost | Owner-occupied | Renter-occupied |
| Less than $300 | 0 (0.0%) | 2 (2.0%) |
| $300 to $499 | 17 (4.1%) | 8 (7.8%) |
| $500 to $799 | 83 (20.1%) | 28 (27.5%) |
| $800 to $999 | 128 (30.9%) | 32 (31.4%) |
| $1,000 to $1,499 | 58 (14.0%) | 24 (23.5%) |
| $1,500 to $1,999 | 100 (24.1%) | 5 (4.9%) |
| $2,000 to $2,499 | 26 (6.3%) | 0 (0.0%) |
| $2,500 to $2,999 | 2 (0.5%) | 0 (0.0%) |
| $3,000 or more | 0 (0.0%) | 0 (0.0%) |
| Total | 414 (100.0%) | 102 (100.0%) |
Physical Housing Characteristics in Darien
Housing Structures in Darien
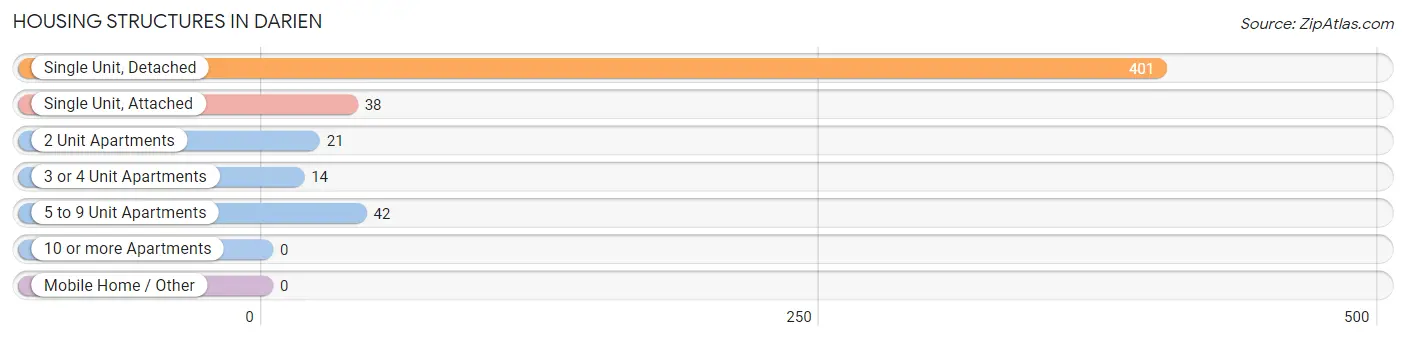
| Structure Type | # Housing Units | % Housing Units |
| Single Unit, Detached | 401 | 77.7% |
| Single Unit, Attached | 38 | 7.4% |
| 2 Unit Apartments | 21 | 4.1% |
| 3 or 4 Unit Apartments | 14 | 2.7% |
| 5 to 9 Unit Apartments | 42 | 8.1% |
| 10 or more Apartments | 0 | 0.0% |
| Mobile Home / Other | 0 | 0.0% |
| Total | 516 | 100.0% |
Housing Structures by Occupancy in Darien
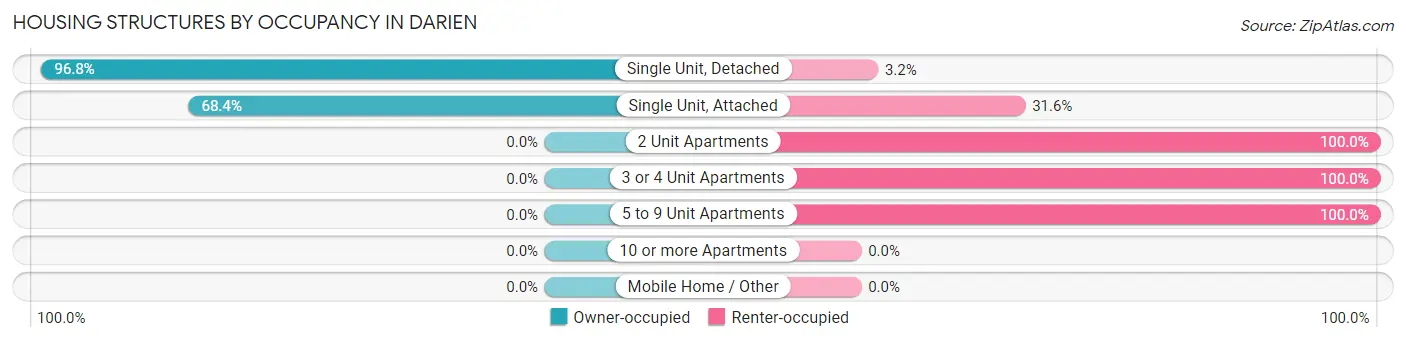
| Structure Type | Owner-occupied | Renter-occupied |
| Single Unit, Detached | 388 (96.8%) | 13 (3.2%) |
| Single Unit, Attached | 26 (68.4%) | 12 (31.6%) |
| 2 Unit Apartments | 0 (0.0%) | 21 (100.0%) |
| 3 or 4 Unit Apartments | 0 (0.0%) | 14 (100.0%) |
| 5 to 9 Unit Apartments | 0 (0.0%) | 42 (100.0%) |
| 10 or more Apartments | 0 (0.0%) | 0 (0.0%) |
| Mobile Home / Other | 0 (0.0%) | 0 (0.0%) |
| Total | 414 (80.2%) | 102 (19.8%) |
Housing Structures by Number of Rooms in Darien
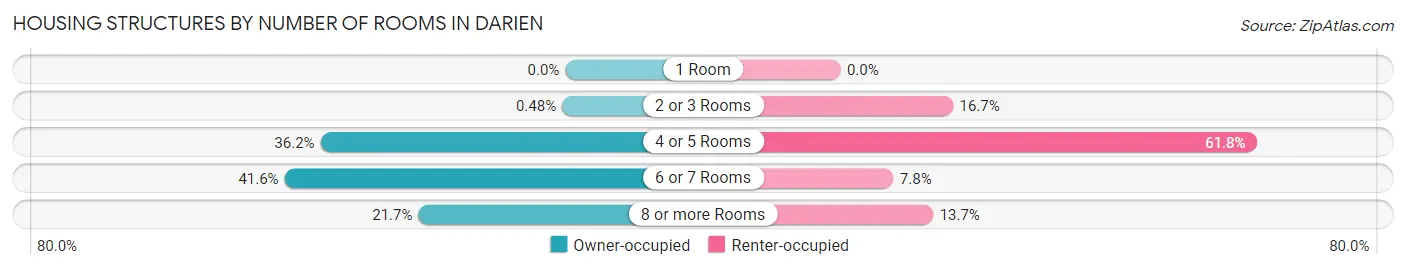
| Number of Rooms | Owner-occupied | Renter-occupied |
| 1 Room | 0 (0.0%) | 0 (0.0%) |
| 2 or 3 Rooms | 2 (0.5%) | 17 (16.7%) |
| 4 or 5 Rooms | 150 (36.2%) | 63 (61.8%) |
| 6 or 7 Rooms | 172 (41.5%) | 8 (7.8%) |
| 8 or more Rooms | 90 (21.7%) | 14 (13.7%) |
| Total | 414 (100.0%) | 102 (100.0%) |
Housing Structure by Heating Type in Darien
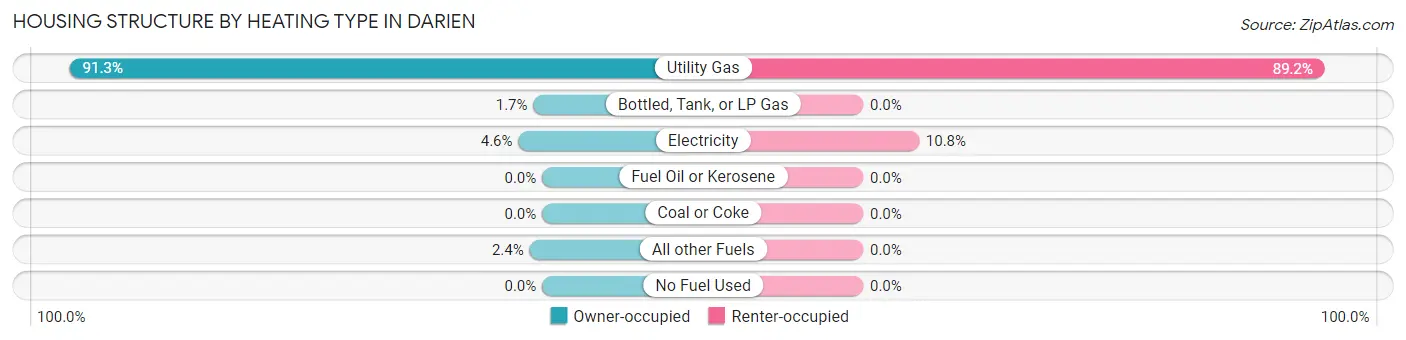
| Heating Type | Owner-occupied | Renter-occupied |
| Utility Gas | 378 (91.3%) | 91 (89.2%) |
| Bottled, Tank, or LP Gas | 7 (1.7%) | 0 (0.0%) |
| Electricity | 19 (4.6%) | 11 (10.8%) |
| Fuel Oil or Kerosene | 0 (0.0%) | 0 (0.0%) |
| Coal or Coke | 0 (0.0%) | 0 (0.0%) |
| All other Fuels | 10 (2.4%) | 0 (0.0%) |
| No Fuel Used | 0 (0.0%) | 0 (0.0%) |
| Total | 414 (100.0%) | 102 (100.0%) |
Household Vehicle Usage in Darien
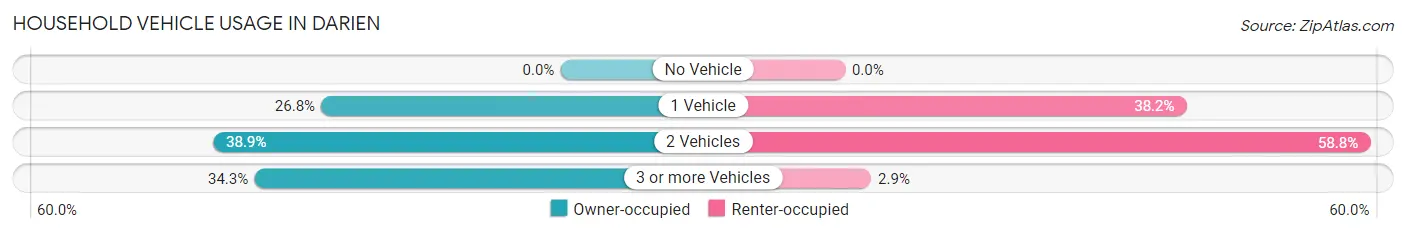
| Vehicles per Household | Owner-occupied | Renter-occupied |
| No Vehicle | 0 (0.0%) | 0 (0.0%) |
| 1 Vehicle | 111 (26.8%) | 39 (38.2%) |
| 2 Vehicles | 161 (38.9%) | 60 (58.8%) |
| 3 or more Vehicles | 142 (34.3%) | 3 (2.9%) |
| Total | 414 (100.0%) | 102 (100.0%) |
Real Estate & Mortgages in Darien
Real Estate and Mortgage Overview in Darien
| Characteristic | Without Mortgage | With Mortgage |
| Housing Units | 133 | 281 |
| Median Property Value | $187,500 | $171,100 |
| Median Household Income | $66,926 | $27 |
| Monthly Housing Costs | $709 | $0 |
| Real Estate Taxes | $3,808 | $0 |
Property Value by Mortgage Status in Darien
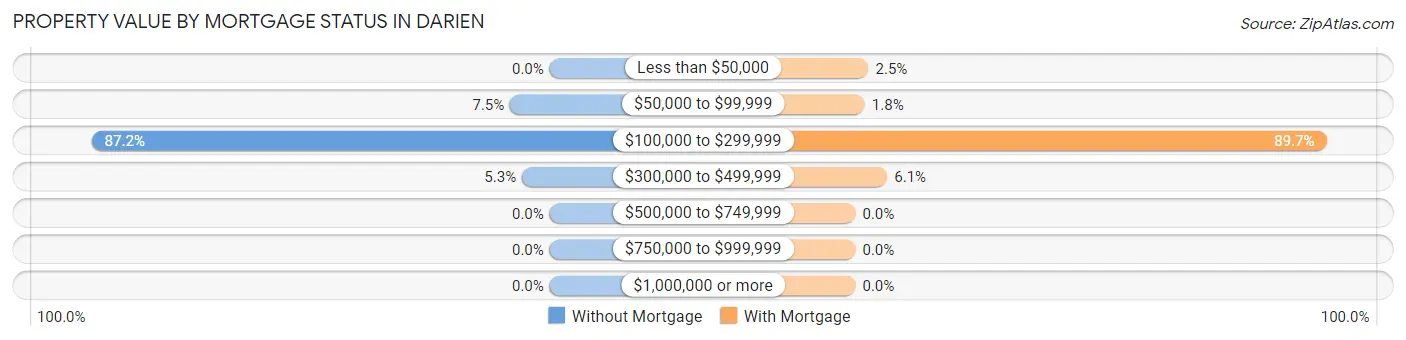
| Property Value | Without Mortgage | With Mortgage |
| Less than $50,000 | 0 (0.0%) | 7 (2.5%) |
| $50,000 to $99,999 | 10 (7.5%) | 5 (1.8%) |
| $100,000 to $299,999 | 116 (87.2%) | 252 (89.7%) |
| $300,000 to $499,999 | 7 (5.3%) | 17 (6.0%) |
| $500,000 to $749,999 | 0 (0.0%) | 0 (0.0%) |
| $750,000 to $999,999 | 0 (0.0%) | 0 (0.0%) |
| $1,000,000 or more | 0 (0.0%) | 0 (0.0%) |
| Total | 133 (100.0%) | 281 (100.0%) |
Household Income by Mortgage Status in Darien
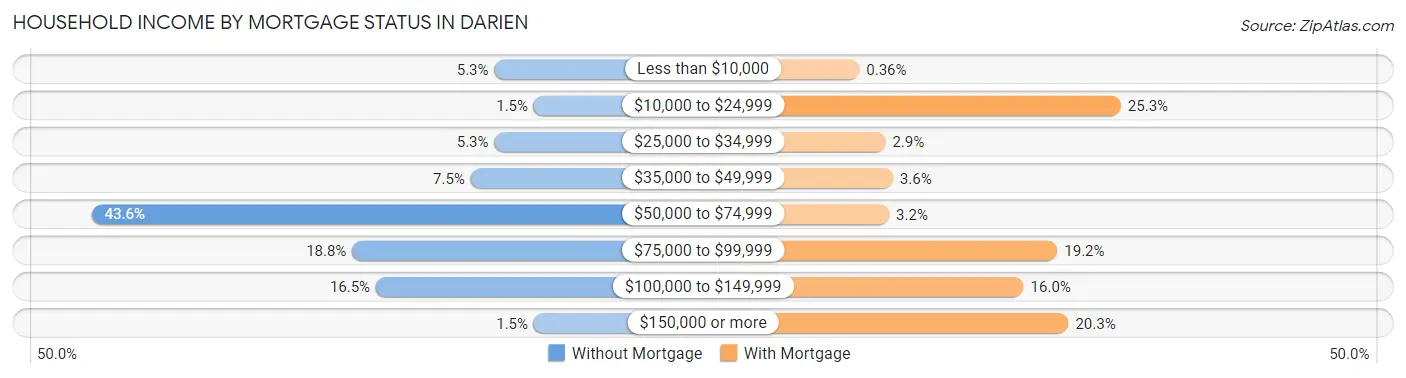
| Household Income | Without Mortgage | With Mortgage |
| Less than $10,000 | 7 (5.3%) | 1 (0.4%) |
| $10,000 to $24,999 | 2 (1.5%) | 71 (25.3%) |
| $25,000 to $34,999 | 7 (5.3%) | 8 (2.9%) |
| $35,000 to $49,999 | 10 (7.5%) | 10 (3.6%) |
| $50,000 to $74,999 | 58 (43.6%) | 9 (3.2%) |
| $75,000 to $99,999 | 25 (18.8%) | 54 (19.2%) |
| $100,000 to $149,999 | 22 (16.5%) | 45 (16.0%) |
| $150,000 or more | 2 (1.5%) | 57 (20.3%) |
| Total | 133 (100.0%) | 281 (100.0%) |
Property Value to Household Income Ratio in Darien
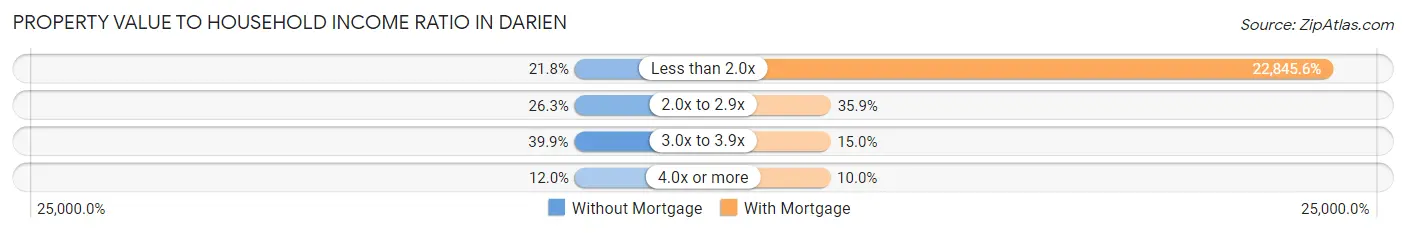
| Value-to-Income Ratio | Without Mortgage | With Mortgage |
| Less than 2.0x | 29 (21.8%) | 64,196 (22,845.6%) |
| 2.0x to 2.9x | 35 (26.3%) | 101 (35.9%) |
| 3.0x to 3.9x | 53 (39.9%) | 42 (14.9%) |
| 4.0x or more | 16 (12.0%) | 28 (10.0%) |
| Total | 133 (100.0%) | 281 (100.0%) |
Real Estate Taxes by Mortgage Status in Darien
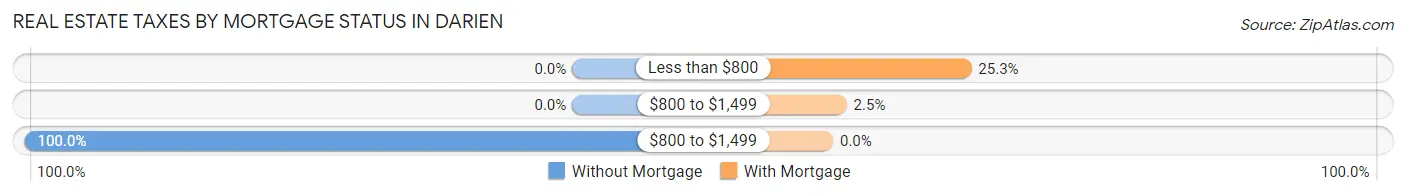
| Property Taxes | Without Mortgage | With Mortgage |
| Less than $800 | 0 (0.0%) | 71 (25.3%) |
| $800 to $1,499 | 0 (0.0%) | 7 (2.5%) |
| $800 to $1,499 | 133 (100.0%) | 0 (0.0%) |
| Total | 133 (100.0%) | 281 (100.0%) |
Health & Disability in Darien
Health Insurance Coverage by Age in Darien
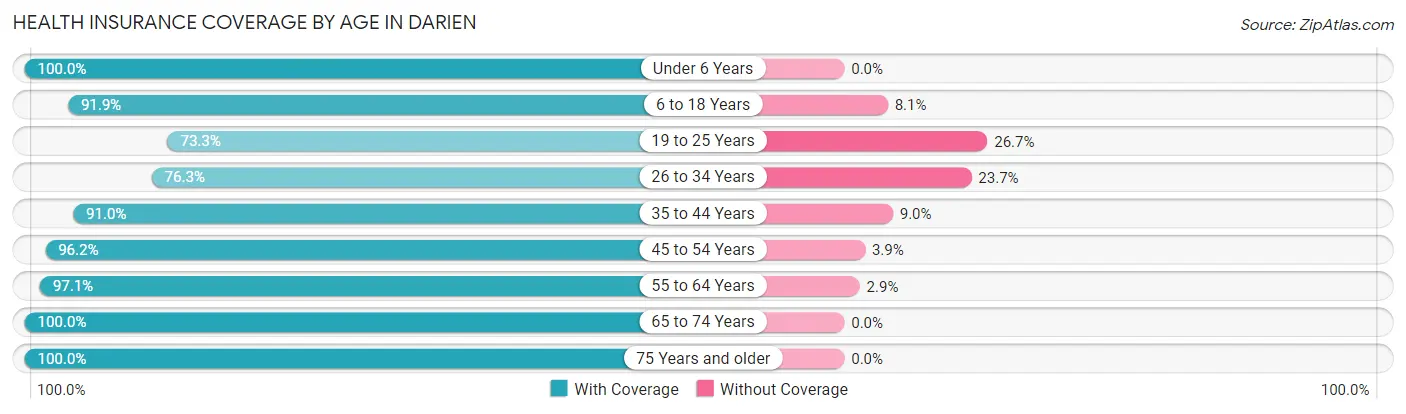
| Age Bracket | With Coverage | Without Coverage |
| Under 6 Years | 67 (100.0%) | 0 (0.0%) |
| 6 to 18 Years | 216 (91.9%) | 19 (8.1%) |
| 19 to 25 Years | 44 (73.3%) | 16 (26.7%) |
| 26 to 34 Years | 132 (76.3%) | 41 (23.7%) |
| 35 to 44 Years | 151 (91.0%) | 15 (9.0%) |
| 45 to 54 Years | 175 (96.2%) | 7 (3.8%) |
| 55 to 64 Years | 204 (97.1%) | 6 (2.9%) |
| 65 to 74 Years | 114 (100.0%) | 0 (0.0%) |
| 75 Years and older | 61 (100.0%) | 0 (0.0%) |
| Total | 1,164 (91.8%) | 104 (8.2%) |
Health Insurance Coverage by Citizenship Status in Darien
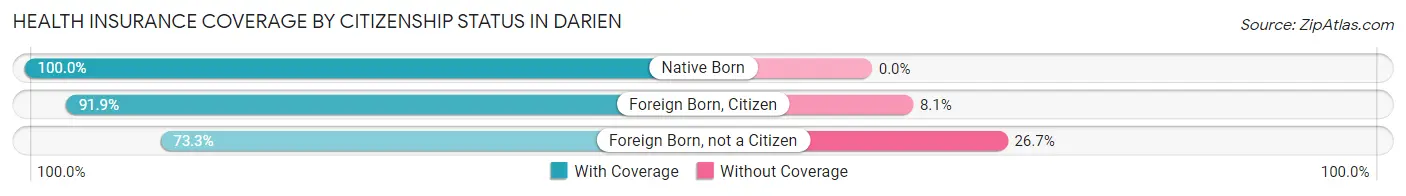
| Citizenship Status | With Coverage | Without Coverage |
| Native Born | 67 (100.0%) | 0 (0.0%) |
| Foreign Born, Citizen | 216 (91.9%) | 19 (8.1%) |
| Foreign Born, not a Citizen | 44 (73.3%) | 16 (26.7%) |
Health Insurance Coverage by Household Income in Darien
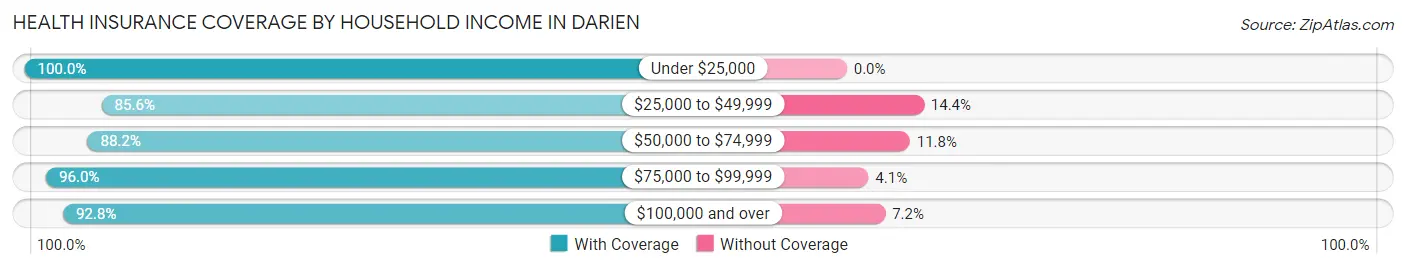
| Household Income | With Coverage | Without Coverage |
| Under $25,000 | 174 (100.0%) | 0 (0.0%) |
| $25,000 to $49,999 | 160 (85.6%) | 27 (14.4%) |
| $50,000 to $74,999 | 329 (88.2%) | 44 (11.8%) |
| $75,000 to $99,999 | 166 (96.0%) | 7 (4.1%) |
| $100,000 and over | 335 (92.8%) | 26 (7.2%) |
Public vs Private Health Insurance Coverage by Age in Darien
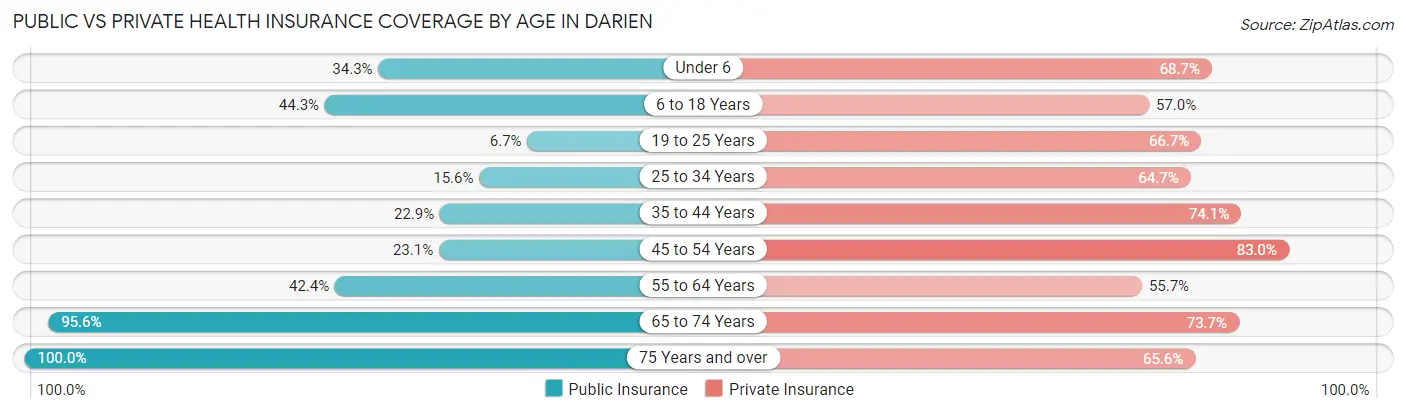
| Age Bracket | Public Insurance | Private Insurance |
| Under 6 | 23 (34.3%) | 46 (68.7%) |
| 6 to 18 Years | 104 (44.3%) | 134 (57.0%) |
| 19 to 25 Years | 4 (6.7%) | 40 (66.7%) |
| 25 to 34 Years | 27 (15.6%) | 112 (64.7%) |
| 35 to 44 Years | 38 (22.9%) | 123 (74.1%) |
| 45 to 54 Years | 42 (23.1%) | 151 (83.0%) |
| 55 to 64 Years | 89 (42.4%) | 117 (55.7%) |
| 65 to 74 Years | 109 (95.6%) | 84 (73.7%) |
| 75 Years and over | 61 (100.0%) | 40 (65.6%) |
| Total | 497 (39.2%) | 847 (66.8%) |
Disability Status by Sex by Age in Darien
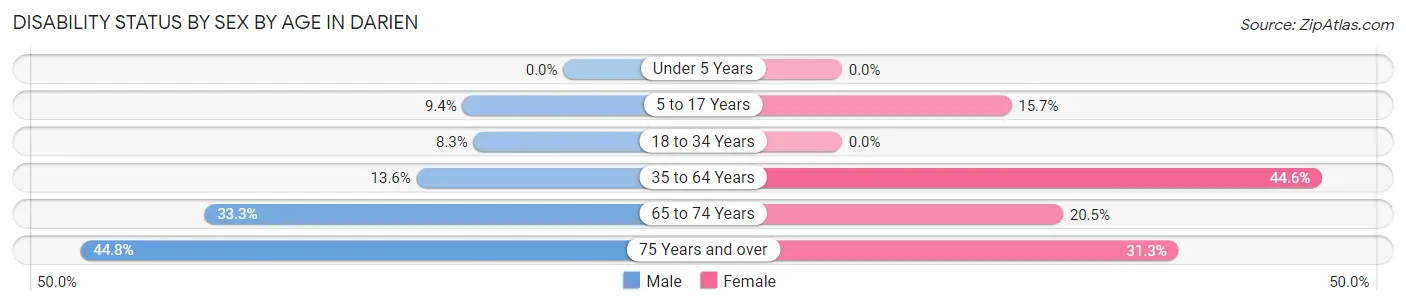
| Age Bracket | Male | Female |
| Under 5 Years | 0 (0.0%) | 0 (0.0%) |
| 5 to 17 Years | 13 (9.3%) | 14 (15.7%) |
| 18 to 34 Years | 12 (8.3%) | 0 (0.0%) |
| 35 to 64 Years | 32 (13.6%) | 144 (44.6%) |
| 65 to 74 Years | 12 (33.3%) | 16 (20.5%) |
| 75 Years and over | 13 (44.8%) | 10 (31.2%) |
Disability Class by Sex by Age in Darien
Disability Class: Hearing Difficulty
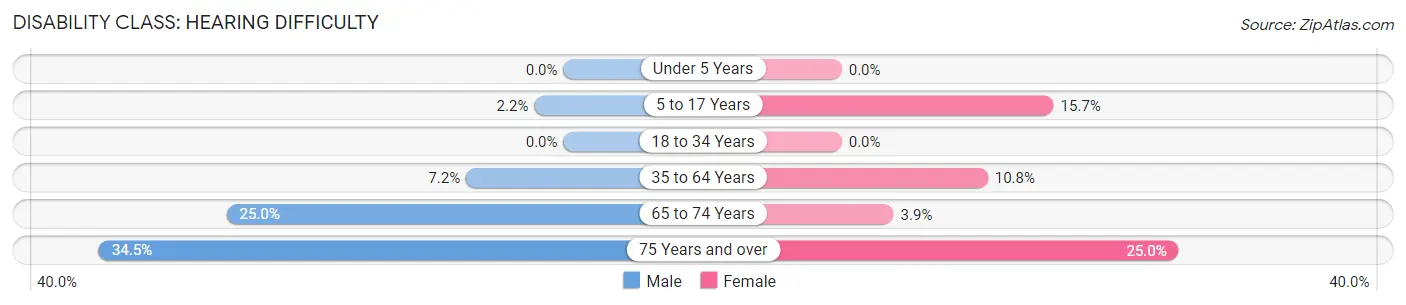
| Age Bracket | Male | Female |
| Under 5 Years | 0 (0.0%) | 0 (0.0%) |
| 5 to 17 Years | 3 (2.2%) | 14 (15.7%) |
| 18 to 34 Years | 0 (0.0%) | 0 (0.0%) |
| 35 to 64 Years | 17 (7.2%) | 35 (10.8%) |
| 65 to 74 Years | 9 (25.0%) | 3 (3.8%) |
| 75 Years and over | 10 (34.5%) | 8 (25.0%) |
Disability Class: Vision Difficulty
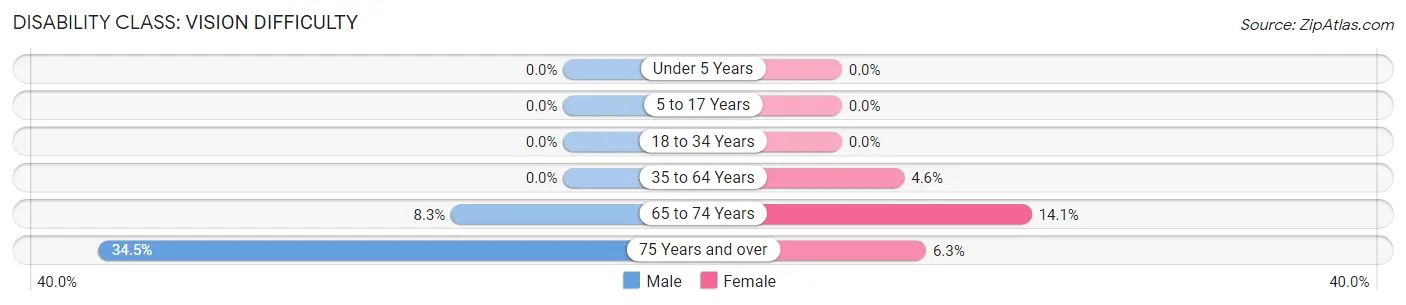
| Age Bracket | Male | Female |
| Under 5 Years | 0 (0.0%) | 0 (0.0%) |
| 5 to 17 Years | 0 (0.0%) | 0 (0.0%) |
| 18 to 34 Years | 0 (0.0%) | 0 (0.0%) |
| 35 to 64 Years | 0 (0.0%) | 15 (4.6%) |
| 65 to 74 Years | 3 (8.3%) | 11 (14.1%) |
| 75 Years and over | 10 (34.5%) | 2 (6.2%) |
Disability Class: Cognitive Difficulty
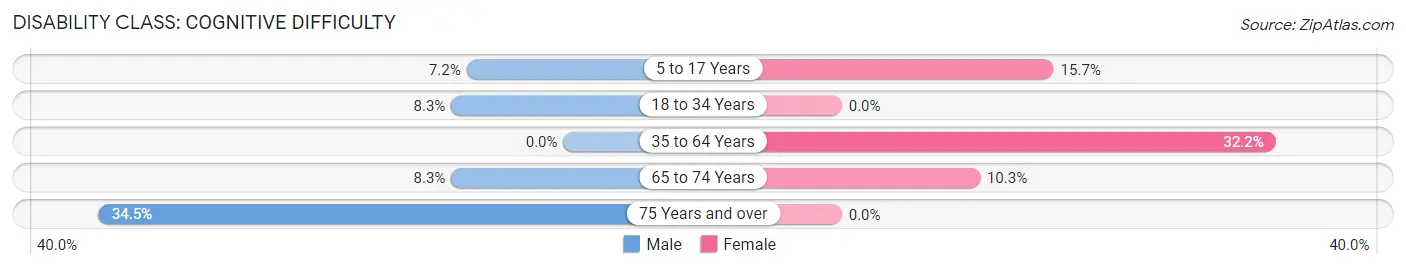
| Age Bracket | Male | Female |
| 5 to 17 Years | 10 (7.2%) | 14 (15.7%) |
| 18 to 34 Years | 12 (8.3%) | 0 (0.0%) |
| 35 to 64 Years | 0 (0.0%) | 104 (32.2%) |
| 65 to 74 Years | 3 (8.3%) | 8 (10.3%) |
| 75 Years and over | 10 (34.5%) | 0 (0.0%) |
Disability Class: Ambulatory Difficulty
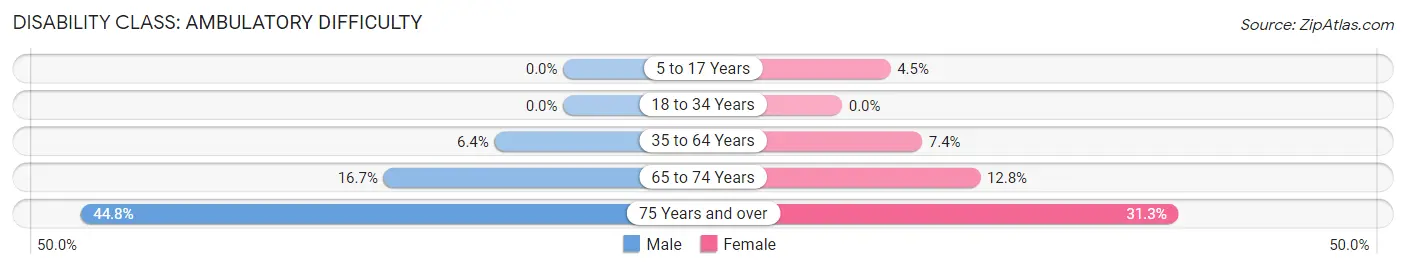
| Age Bracket | Male | Female |
| 5 to 17 Years | 0 (0.0%) | 4 (4.5%) |
| 18 to 34 Years | 0 (0.0%) | 0 (0.0%) |
| 35 to 64 Years | 15 (6.4%) | 24 (7.4%) |
| 65 to 74 Years | 6 (16.7%) | 10 (12.8%) |
| 75 Years and over | 13 (44.8%) | 10 (31.2%) |
Disability Class: Self-Care Difficulty
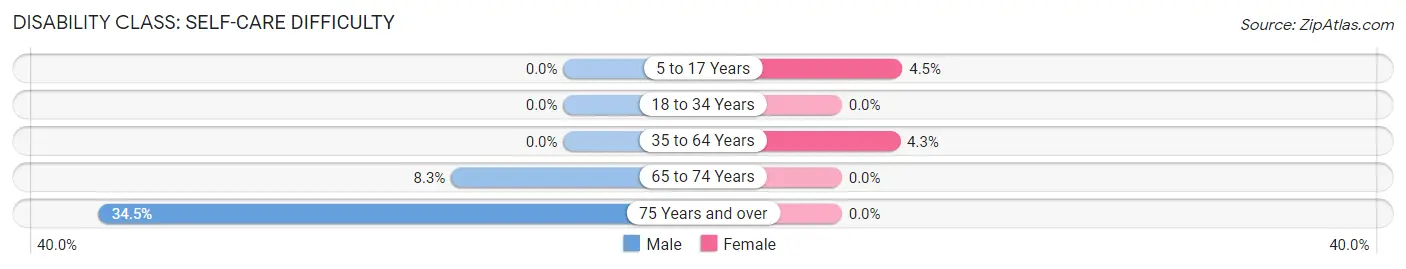
| Age Bracket | Male | Female |
| 5 to 17 Years | 0 (0.0%) | 4 (4.5%) |
| 18 to 34 Years | 0 (0.0%) | 0 (0.0%) |
| 35 to 64 Years | 0 (0.0%) | 14 (4.3%) |
| 65 to 74 Years | 3 (8.3%) | 0 (0.0%) |
| 75 Years and over | 10 (34.5%) | 0 (0.0%) |
Technology Access in Darien
Computing Device Access in Darien
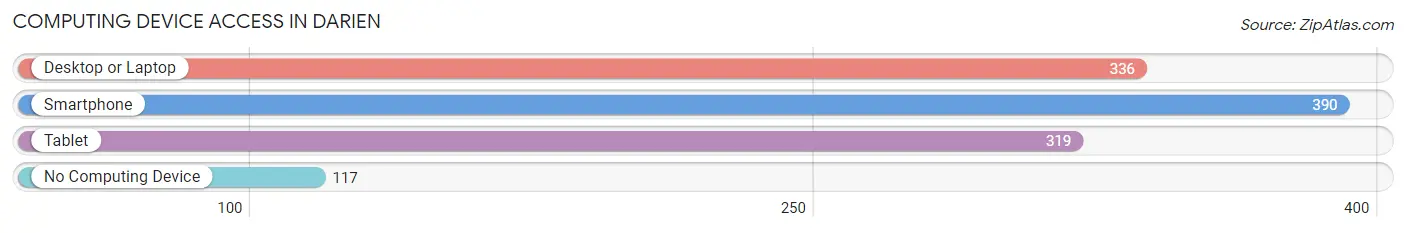
| Device Type | # Households | % Households |
| Desktop or Laptop | 336 | 65.1% |
| Smartphone | 390 | 75.6% |
| Tablet | 319 | 61.8% |
| No Computing Device | 117 | 22.7% |
| Total | 516 | 100.0% |
Internet Access in Darien
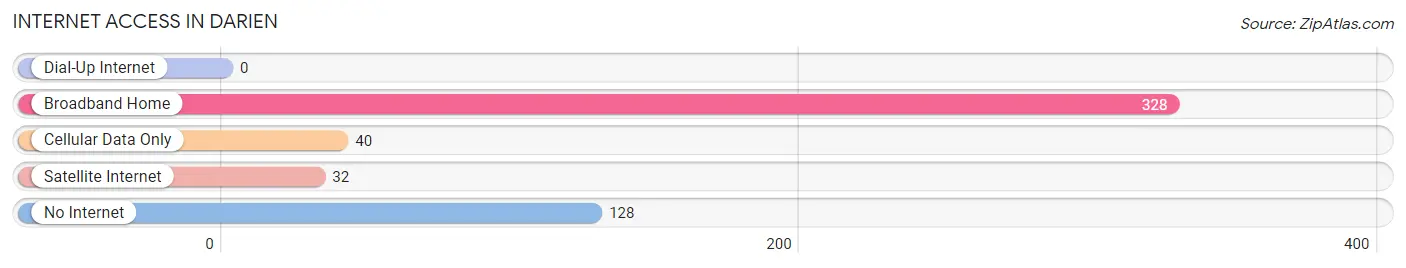
| Internet Type | # Households | % Households |
| Dial-Up Internet | 0 | 0.0% |
| Broadband Home | 328 | 63.6% |
| Cellular Data Only | 40 | 7.7% |
| Satellite Internet | 32 | 6.2% |
| No Internet | 128 | 24.8% |
| Total | 516 | 100.0% |
Darien Summary
Darien, Wisconsin is a small village located in Walworth County, Wisconsin. It is situated on the banks of the Fox River, about 25 miles southwest of Milwaukee. The village has a population of approximately 1,500 people and covers an area of 1.2 square miles.
History
The area that is now Darien was first settled in the early 1800s by settlers from New England. The first settler was a man named John Darien, who arrived in 1836. He built a log cabin and began farming the land. The village was officially incorporated in 1846 and was named after John Darien.
In the late 1800s, the village began to grow and prosper. The Fox River provided a source of power for the local mills and factories, and the village became a center of industry. The village also became a popular tourist destination, with many people coming to enjoy the scenic beauty of the Fox River.
Geography
Darien is located in southeastern Wisconsin, about 25 miles southwest of Milwaukee. The village is situated on the banks of the Fox River, which flows through the village and provides a source of power for the local mills and factories. The village is surrounded by rolling hills and farmland, and is home to several parks and nature preserves.
Economy
The economy of Darien is largely based on agriculture and tourism. The village is home to several farms, which produce a variety of crops, including corn, soybeans, and wheat. The village is also home to several small businesses, including restaurants, shops, and other services.
Tourism is also an important part of the local economy. The village is home to several parks and nature preserves, which attract visitors from all over the region. The Fox River also provides a source of recreation for visitors, with fishing, boating, and other activities available.
Demographics
As of the 2010 census, the population of Darien was 1,500 people. The racial makeup of the village was 97.3% White, 0.7% African American, 0.3% Native American, 0.3% Asian, and 1.3% from other races. The median household income was $50,000, and the median family income was $60,000.
Conclusion
Darien, Wisconsin is a small village located in Walworth County, Wisconsin. It is situated on the banks of the Fox River, about 25 miles southwest of Milwaukee. The village has a population of approximately 1,500 people and covers an area of 1.2 square miles. The economy of Darien is largely based on agriculture and tourism, and the village is home to several parks and nature preserves. The racial makeup of the village is 97.3% White, 0.7% African American, 0.3% Native American, 0.3% Asian, and 1.3% from other races. The median household income was $50,000, and the median family income was $60,000.
Common Questions
What is Per Capita Income in Darien?
Per Capita income in Darien is $26,168.
What is the Median Family Income in Darien?
Median Family Income in Darien is $70,833.
What is the Median Household income in Darien?
Median Household Income in Darien is $62,333.
What is Income or Wage Gap in Darien?
Income or Wage Gap in Darien is 22.8%.
Women in Darien earn 77.2 cents for every dollar earned by a man.
What is Inequality or Gini Index in Darien?
Inequality or Gini Index in Darien is 0.41.
What is the Total Population of Darien?
Total Population of Darien is 1,271.
What is the Total Male Population of Darien?
Total Male Population of Darien is 616.
What is the Total Female Population of Darien?
Total Female Population of Darien is 655.
What is the Ratio of Males per 100 Females in Darien?
There are 94.05 Males per 100 Females in Darien.
What is the Ratio of Females per 100 Males in Darien?
There are 106.33 Females per 100 Males in Darien.
What is the Median Population Age in Darien?
Median Population Age in Darien is 42.3 Years.
What is the Average Family Size in Darien
Average Family Size in Darien is 3.0 People.
What is the Average Household Size in Darien
Average Household Size in Darien is 2.5 People.
How Large is the Labor Force in Darien?
There are 712 People in the Labor Forcein in Darien.
What is the Percentage of People in the Labor Force in Darien?
69.7% of People are in the Labor Force in Darien.
What is the Unemployment Rate in Darien?
Unemployment Rate in Darien is 3.1%.