Dallas, WI Map & Demographics
Dallas Map
Dallas Overview
$26,613
PER CAPITA INCOME
$70,500
AVG FAMILY INCOME
$54,167
AVG HOUSEHOLD INCOME
40.7%
WAGE / INCOME GAP [ % ]
59.3¢/ $1
WAGE / INCOME GAP [ $ ]
0.38
INEQUALITY / GINI INDEX
379
TOTAL POPULATION
187
MALE POPULATION
192
FEMALE POPULATION
97.40
MALES / 100 FEMALES
102.67
FEMALES / 100 MALES
41.9
MEDIAN AGE
3.4
AVG FAMILY SIZE
2.6
AVG HOUSEHOLD SIZE
185
LABOR FORCE [ PEOPLE ]
58.5%
PERCENT IN LABOR FORCE
4.3%
UNEMPLOYMENT RATE
Dallas Zip Codes
Dallas Area Codes
Income in Dallas
Income Overview in Dallas
Per Capita Income in Dallas is $26,613, while median incomes of families and households are $70,500 and $54,167 respectively.
| Characteristic | Number | Measure |
| Per Capita Income | 379 | $26,613 |
| Median Family Income | 86 | $70,500 |
| Mean Family Income | 86 | $72,140 |
| Median Household Income | 136 | $54,167 |
| Mean Household Income | 136 | $66,775 |
| Income Deficit | 86 | $0 |
| Wage / Income Gap (%) | 379 | 40.67% |
| Wage / Income Gap ($) | 379 | 59.33¢ per $1 |
| Gini / Inequality Index | 379 | 0.38 |
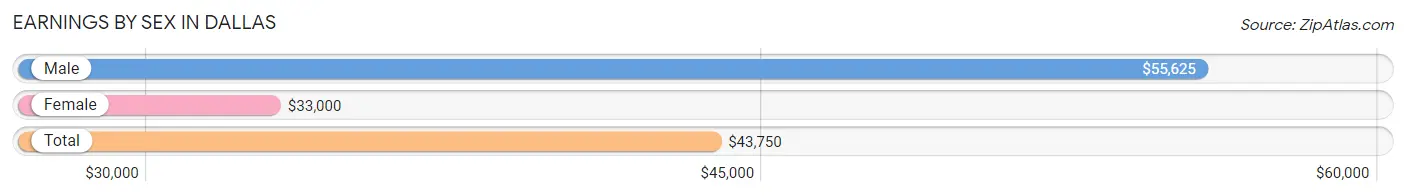
Earnings by Sex in Dallas
Average Earnings in Dallas are $43,750, $55,625 for men and $33,000 for women, a difference of 40.7%.
| Sex | Number | Average Earnings |
| Male | 98 (52.1%) | $55,625 |
| Female | 90 (47.9%) | $33,000 |
| Total | 188 (100.0%) | $43,750 |
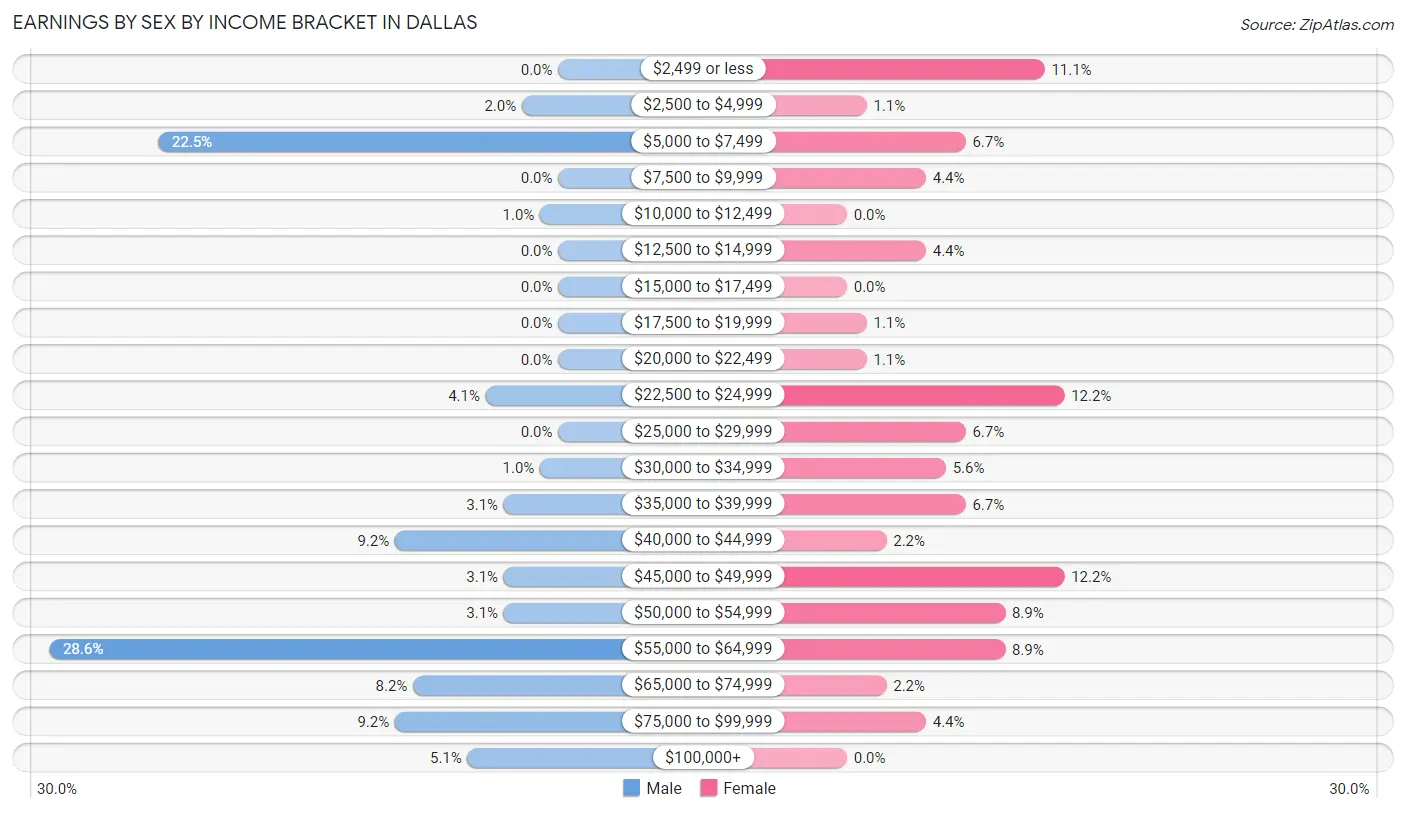
Earnings by Sex by Income Bracket in Dallas
The most common earnings brackets in Dallas are $55,000 to $64,999 for men (28 | 28.6%) and $22,500 to $24,999 for women (11 | 12.2%).
| Income | Male | Female |
| $2,499 or less | 0 (0.0%) | 10 (11.1%) |
| $2,500 to $4,999 | 2 (2.0%) | 1 (1.1%) |
| $5,000 to $7,499 | 22 (22.5%) | 6 (6.7%) |
| $7,500 to $9,999 | 0 (0.0%) | 4 (4.4%) |
| $10,000 to $12,499 | 1 (1.0%) | 0 (0.0%) |
| $12,500 to $14,999 | 0 (0.0%) | 4 (4.4%) |
| $15,000 to $17,499 | 0 (0.0%) | 0 (0.0%) |
| $17,500 to $19,999 | 0 (0.0%) | 1 (1.1%) |
| $20,000 to $22,499 | 0 (0.0%) | 1 (1.1%) |
| $22,500 to $24,999 | 4 (4.1%) | 11 (12.2%) |
| $25,000 to $29,999 | 0 (0.0%) | 6 (6.7%) |
| $30,000 to $34,999 | 1 (1.0%) | 5 (5.6%) |
| $35,000 to $39,999 | 3 (3.1%) | 6 (6.7%) |
| $40,000 to $44,999 | 9 (9.2%) | 2 (2.2%) |
| $45,000 to $49,999 | 3 (3.1%) | 11 (12.2%) |
| $50,000 to $54,999 | 3 (3.1%) | 8 (8.9%) |
| $55,000 to $64,999 | 28 (28.6%) | 8 (8.9%) |
| $65,000 to $74,999 | 8 (8.2%) | 2 (2.2%) |
| $75,000 to $99,999 | 9 (9.2%) | 4 (4.4%) |
| $100,000+ | 5 (5.1%) | 0 (0.0%) |
| Total | 98 (100.0%) | 90 (100.0%) |
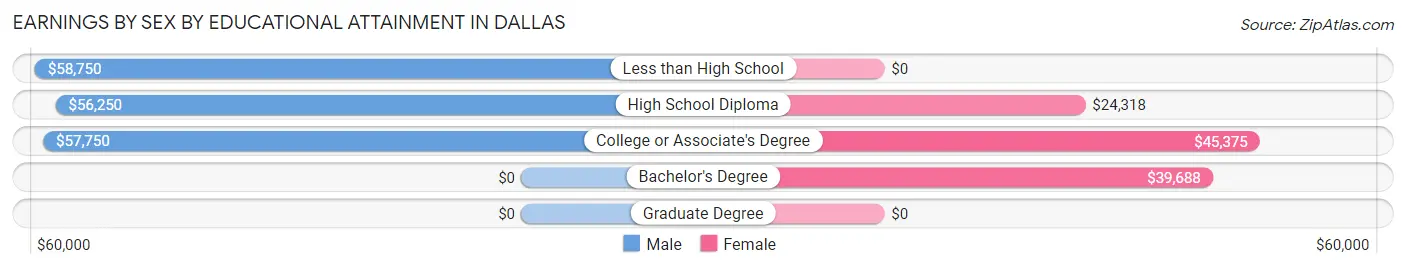
Earnings by Sex by Educational Attainment in Dallas
Average earnings in Dallas are $57,778 for men and $38,333 for women, a difference of 33.7%. Men with an educational attainment of less than high school enjoy the highest average annual earnings of $58,750, while those with high school diploma education earn the least with $56,250. Women with an educational attainment of college or associate's degree earn the most with the average annual earnings of $45,375, while those with high school diploma education have the smallest earnings of $24,318.
| Educational Attainment | Male Income | Female Income |
| Less than High School | $58,750 | $0 |
| High School Diploma | $56,250 | $24,318 |
| College or Associate's Degree | $57,750 | $45,375 |
| Bachelor's Degree | - | - |
| Graduate Degree | - | - |
| Total | $57,778 | $38,333 |
Family Income in Dallas
Family Income Brackets in Dallas
According to the Dallas family income data, there are 16 families falling into the $75,000 to $99,999 income range, which is the most common income bracket and makes up 18.6% of all families.
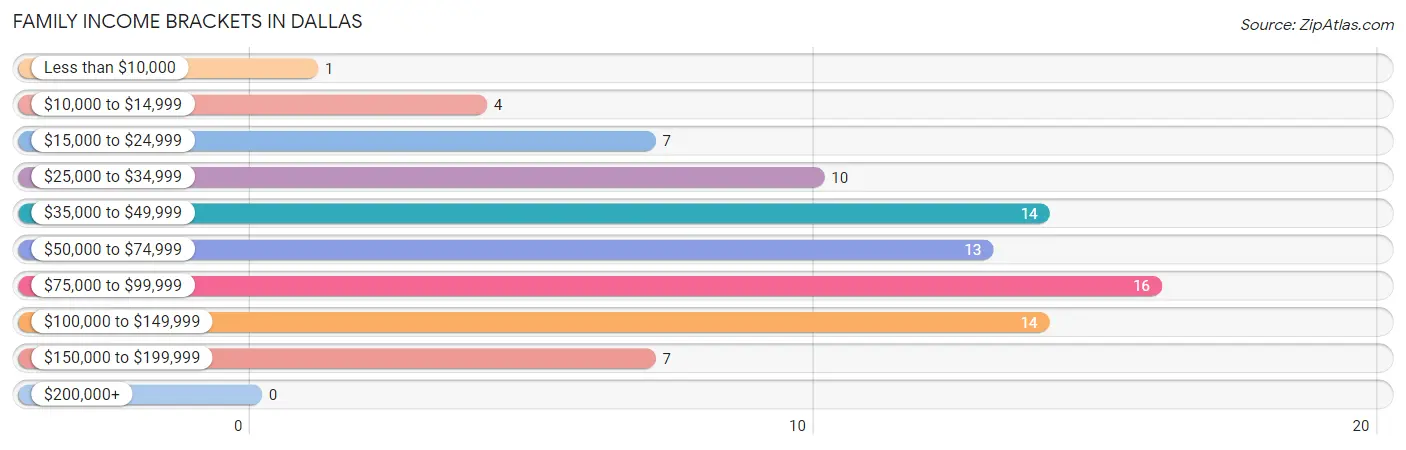
| Income Bracket | # Families | % Families |
| Less than $10,000 | 1 | 1.2% |
| $10,000 to $14,999 | 4 | 4.7% |
| $15,000 to $24,999 | 7 | 8.1% |
| $25,000 to $34,999 | 10 | 11.6% |
| $35,000 to $49,999 | 14 | 16.3% |
| $50,000 to $74,999 | 13 | 15.1% |
| $75,000 to $99,999 | 16 | 18.6% |
| $100,000 to $149,999 | 14 | 16.3% |
| $150,000 to $199,999 | 7 | 8.1% |
| $200,000+ | 0 | 0.0% |
Family Income by Famaliy Size in Dallas
5-person families (5 | 5.8%) account for the highest median family income in Dallas with $79,375 per family, while 3-person families (32 | 37.2%) have the highest median income of $25,000 per family member.
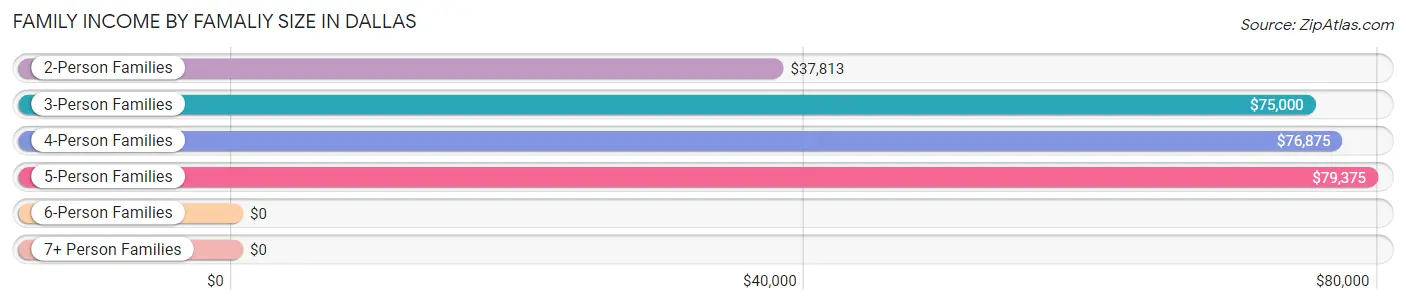
| Income Bracket | # Families | Median Income |
| 2-Person Families | 27 (31.4%) | $37,813 |
| 3-Person Families | 32 (37.2%) | $75,000 |
| 4-Person Families | 21 (24.4%) | $76,875 |
| 5-Person Families | 5 (5.8%) | $79,375 |
| 6-Person Families | 1 (1.2%) | $0 |
| 7+ Person Families | 0 (0.0%) | $0 |
| Total | 86 (100.0%) | $70,500 |
Family Income by Number of Earners in Dallas
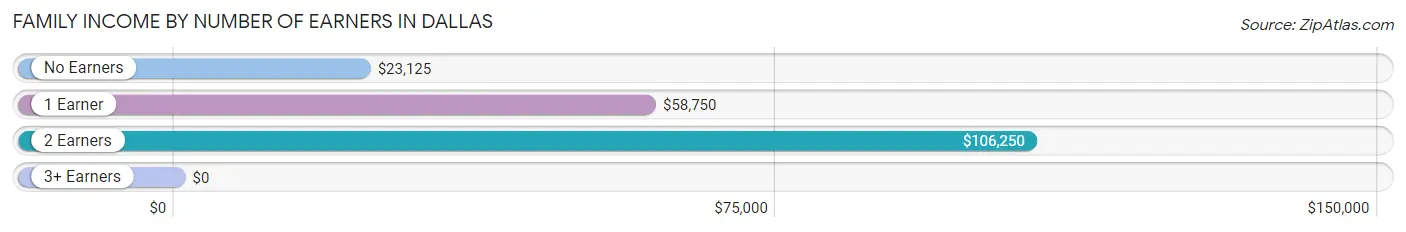
| Number of Earners | # Families | Median Income |
| No Earners | 15 (17.4%) | $23,125 |
| 1 Earner | 28 (32.6%) | $58,750 |
| 2 Earners | 34 (39.5%) | $106,250 |
| 3+ Earners | 9 (10.5%) | $0 |
| Total | 86 (100.0%) | $70,500 |
Household Income in Dallas
Household Income Brackets in Dallas
With 23 households falling in the category, the $50,000 to $74,999 income range is the most frequent in Dallas, accounting for 16.9% of all households.
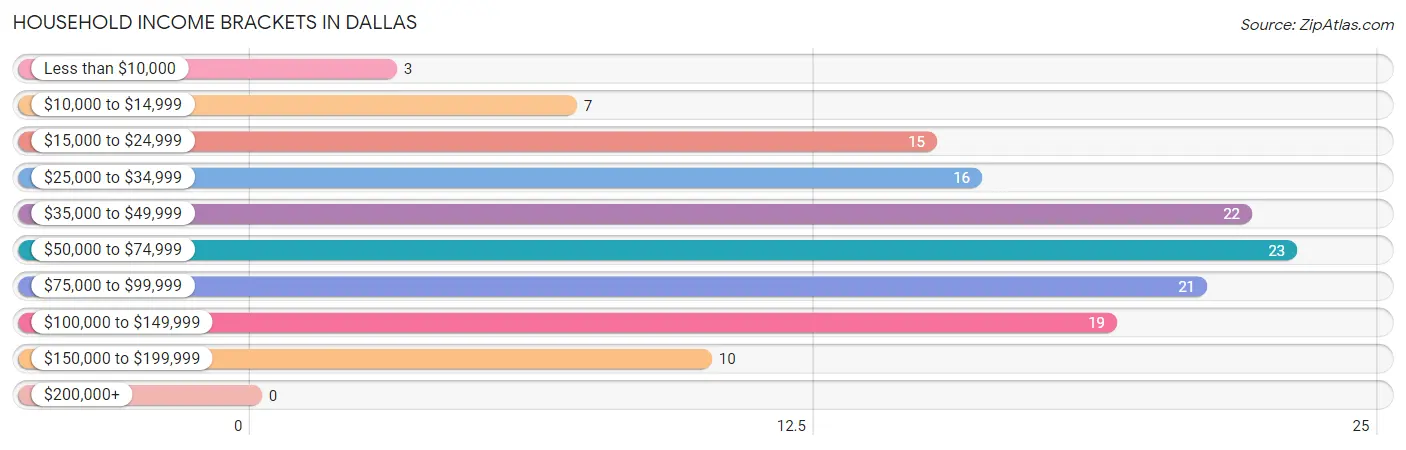
| Income Bracket | # Households | % Households |
| Less than $10,000 | 3 | 2.2% |
| $10,000 to $14,999 | 7 | 5.1% |
| $15,000 to $24,999 | 15 | 11.0% |
| $25,000 to $34,999 | 16 | 11.8% |
| $35,000 to $49,999 | 22 | 16.2% |
| $50,000 to $74,999 | 23 | 16.9% |
| $75,000 to $99,999 | 21 | 15.4% |
| $100,000 to $149,999 | 19 | 14.0% |
| $150,000 to $199,999 | 10 | 7.4% |
| $200,000+ | 0 | 0.0% |
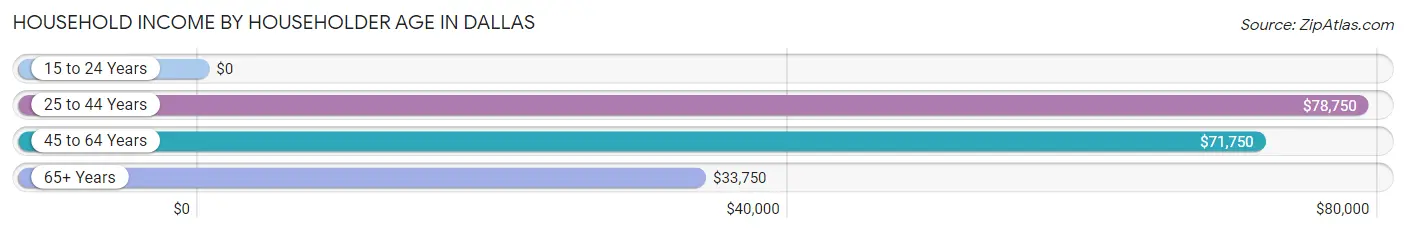
Household Income by Householder Age in Dallas
The median household income in Dallas is $54,167, with the highest median household income of $78,750 found in the 25 to 44 years age bracket for the primary householder. A total of 46 households (33.8%) fall into this category. Meanwhile, the 15 to 24 years age bracket for the primary householder has the lowest median household income of $0, with 5 households (3.7%) in this group.
| Income Bracket | # Households | Median Income |
| 15 to 24 Years | 5 (3.7%) | $0 |
| 25 to 44 Years | 46 (33.8%) | $78,750 |
| 45 to 64 Years | 45 (33.1%) | $71,750 |
| 65+ Years | 40 (29.4%) | $33,750 |
| Total | 136 (100.0%) | $54,167 |
Poverty in Dallas
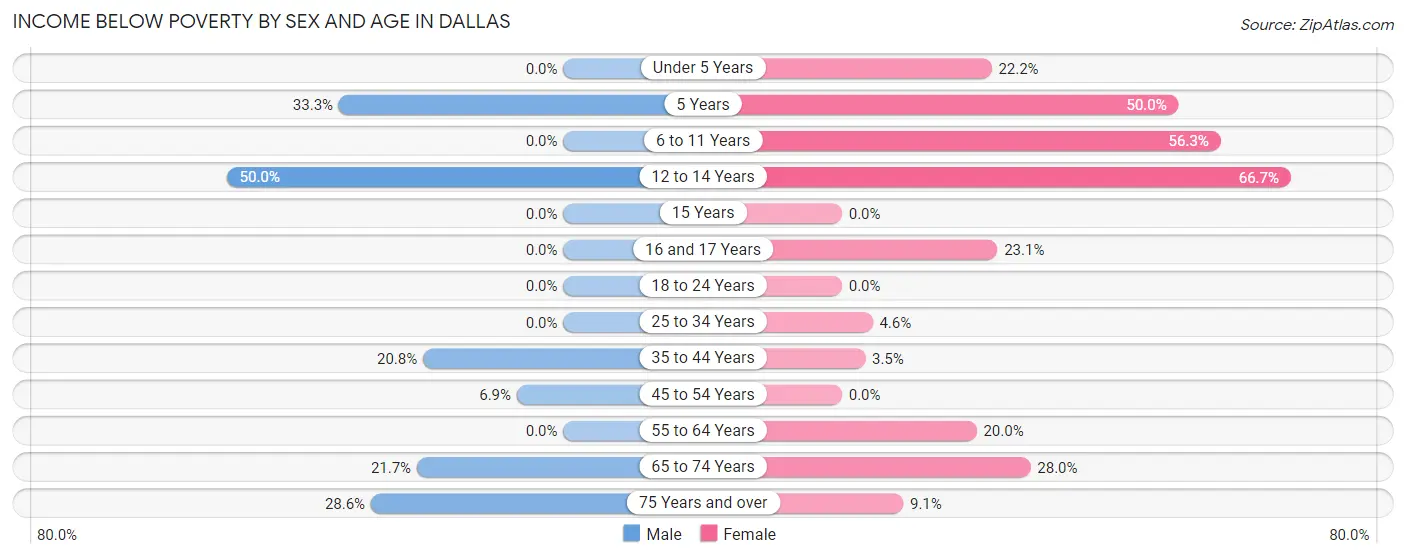
Income Below Poverty by Sex and Age in Dallas
With 8.9% poverty level for males and 17.3% for females among the residents of Dallas, 12 to 14 year old males and 12 to 14 year old females are the most vulnerable to poverty, with 1 males (50.0%) and 4 females (66.7%) in their respective age groups living below the poverty level.
| Age Bracket | Male | Female |
| Under 5 Years | 0 (0.0%) | 2 (22.2%) |
| 5 Years | 1 (33.3%) | 1 (50.0%) |
| 6 to 11 Years | 0 (0.0%) | 9 (56.2%) |
| 12 to 14 Years | 1 (50.0%) | 4 (66.7%) |
| 15 Years | 0 (0.0%) | 0 (0.0%) |
| 16 and 17 Years | 0 (0.0%) | 3 (23.1%) |
| 18 to 24 Years | 0 (0.0%) | 0 (0.0%) |
| 25 to 34 Years | 0 (0.0%) | 1 (4.5%) |
| 35 to 44 Years | 5 (20.8%) | 1 (3.5%) |
| 45 to 54 Years | 2 (6.9%) | 0 (0.0%) |
| 55 to 64 Years | 0 (0.0%) | 2 (20.0%) |
| 65 to 74 Years | 5 (21.7%) | 7 (28.0%) |
| 75 Years and over | 2 (28.6%) | 1 (9.1%) |
| Total | 16 (8.9%) | 31 (17.3%) |
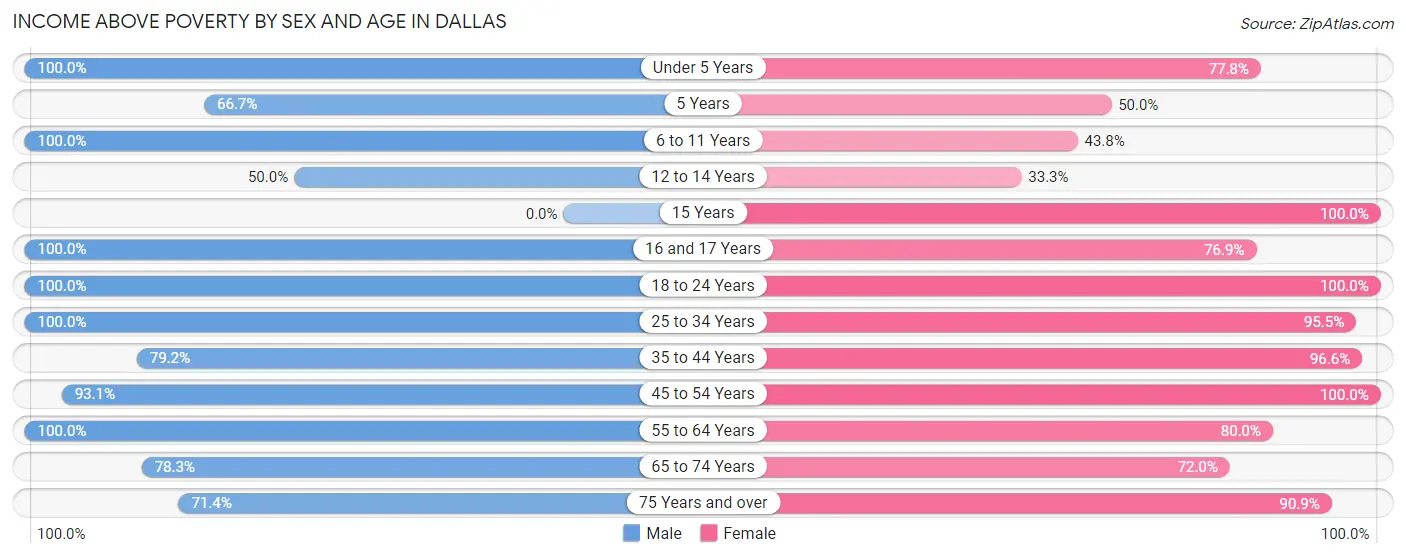
Income Above Poverty by Sex and Age in Dallas
According to the poverty statistics in Dallas, males aged under 5 years and females aged 15 years are the age groups that are most secure financially, with 100.0% of males and 100.0% of females in these age groups living above the poverty line.
| Age Bracket | Male | Female |
| Under 5 Years | 12 (100.0%) | 7 (77.8%) |
| 5 Years | 2 (66.7%) | 1 (50.0%) |
| 6 to 11 Years | 9 (100.0%) | 7 (43.8%) |
| 12 to 14 Years | 1 (50.0%) | 2 (33.3%) |
| 15 Years | 0 (0.0%) | 4 (100.0%) |
| 16 and 17 Years | 2 (100.0%) | 10 (76.9%) |
| 18 to 24 Years | 21 (100.0%) | 6 (100.0%) |
| 25 to 34 Years | 26 (100.0%) | 21 (95.5%) |
| 35 to 44 Years | 19 (79.2%) | 28 (96.6%) |
| 45 to 54 Years | 27 (93.1%) | 26 (100.0%) |
| 55 to 64 Years | 21 (100.0%) | 8 (80.0%) |
| 65 to 74 Years | 18 (78.3%) | 18 (72.0%) |
| 75 Years and over | 5 (71.4%) | 10 (90.9%) |
| Total | 163 (91.1%) | 148 (82.7%) |
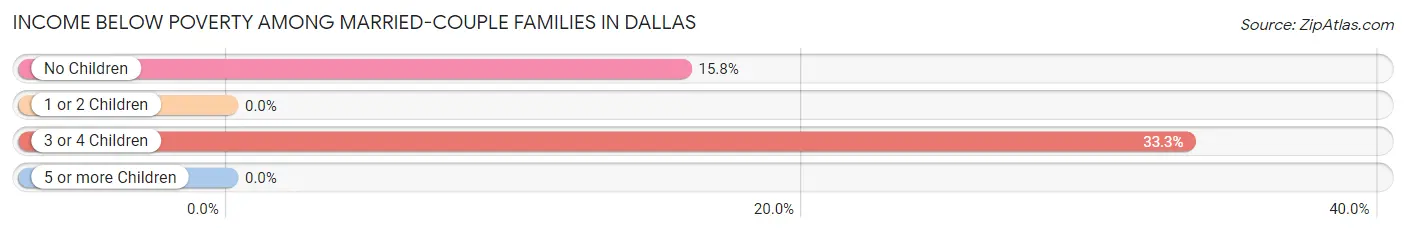
Income Below Poverty Among Married-Couple Families in Dallas
The poverty statistics for married-couple families in Dallas show that 11.1% or 7 of the total 63 families live below the poverty line. Families with 3 or 4 children have the highest poverty rate of 33.3%, comprising of 1 families. On the other hand, families with 1 or 2 children have the lowest poverty rate of 0.0%, which includes 0 families.
| Children | Above Poverty | Below Poverty |
| No Children | 32 (84.2%) | 6 (15.8%) |
| 1 or 2 Children | 22 (100.0%) | 0 (0.0%) |
| 3 or 4 Children | 2 (66.7%) | 1 (33.3%) |
| 5 or more Children | 0 (0.0%) | 0 (0.0%) |
| Total | 56 (88.9%) | 7 (11.1%) |
Income Below Poverty Among Single-Parent Households in Dallas
According to the poverty data in Dallas, 50.0% or 3 single-father households and 5.9% or 1 single-mother households are living below the poverty line. Among single-father households, those with 3 or 4 children have the highest poverty rate, with 3 households (100.0%) experiencing poverty. Likewise, among single-mother households, those with 5 or more children have the highest poverty rate, with 1 households (100.0%) falling below the poverty line.
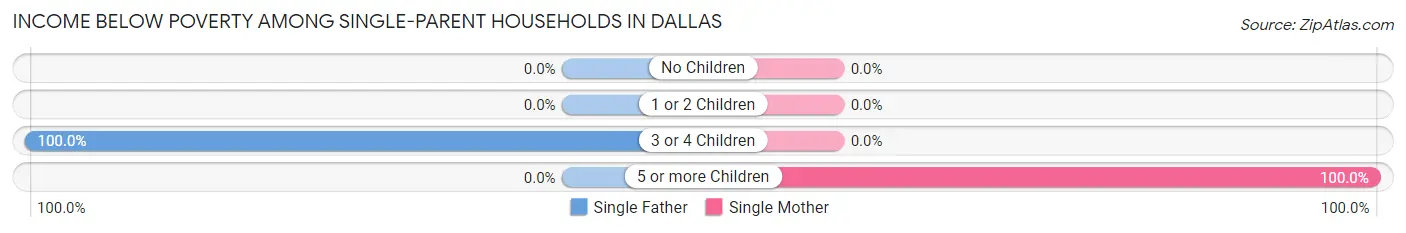
| Children | Single Father | Single Mother |
| No Children | 0 (0.0%) | 0 (0.0%) |
| 1 or 2 Children | 0 (0.0%) | 0 (0.0%) |
| 3 or 4 Children | 3 (100.0%) | 0 (0.0%) |
| 5 or more Children | 0 (0.0%) | 1 (100.0%) |
| Total | 3 (50.0%) | 1 (5.9%) |
Income Below Poverty Among Married-Couple vs Single-Parent Households in Dallas
The poverty data for Dallas shows that 7 of the married-couple family households (11.1%) and 4 of the single-parent households (17.4%) are living below the poverty level. Within the married-couple family households, those with 3 or 4 children have the highest poverty rate, with 1 households (33.3%) falling below the poverty line. Among the single-parent households, those with 5 or more children have the highest poverty rate, with 1 household (100.0%) living below poverty.
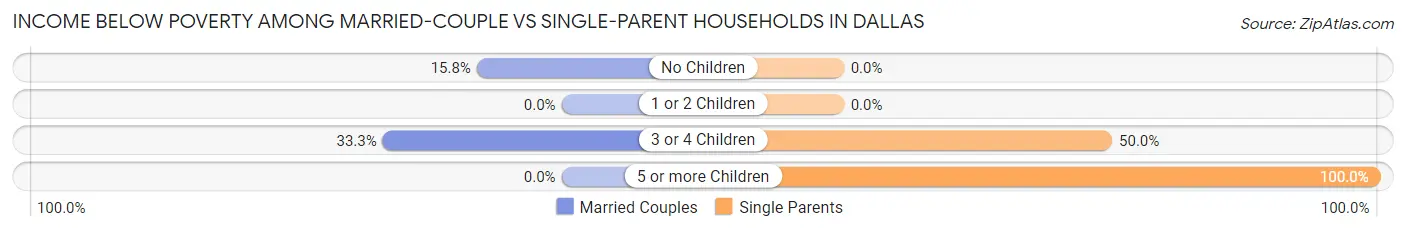
| Children | Married-Couple Families | Single-Parent Households |
| No Children | 6 (15.8%) | 0 (0.0%) |
| 1 or 2 Children | 0 (0.0%) | 0 (0.0%) |
| 3 or 4 Children | 1 (33.3%) | 3 (50.0%) |
| 5 or more Children | 0 (0.0%) | 1 (100.0%) |
| Total | 7 (11.1%) | 4 (17.4%) |
Race in Dallas
The most populous races in Dallas are White / Caucasian (361 | 95.3%), Hispanic or Latino (16 | 4.2%), and Two or more Races (10 | 2.6%).
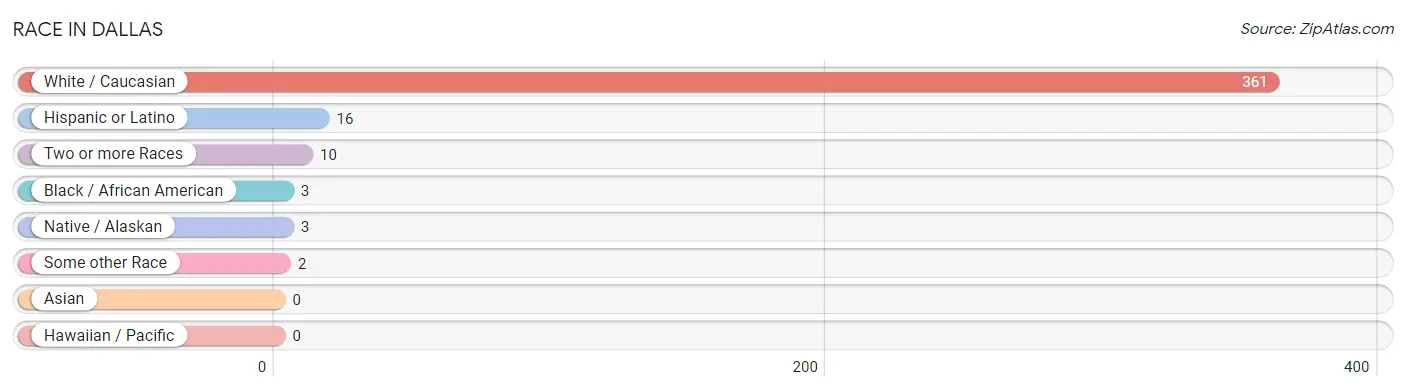
| Race | # Population | % Population |
| Asian | 0 | 0.0% |
| Black / African American | 3 | 0.8% |
| Hawaiian / Pacific | 0 | 0.0% |
| Hispanic or Latino | 16 | 4.2% |
| Native / Alaskan | 3 | 0.8% |
| White / Caucasian | 361 | 95.3% |
| Two or more Races | 10 | 2.6% |
| Some other Race | 2 | 0.5% |
| Total | 379 | 100.0% |
Ancestry in Dallas
The most populous ancestries reported in Dallas are German (110 | 29.0%), Norwegian (110 | 29.0%), Irish (33 | 8.7%), Swedish (22 | 5.8%), and English (19 | 5.0%), together accounting for 77.6% of all Dallas residents.
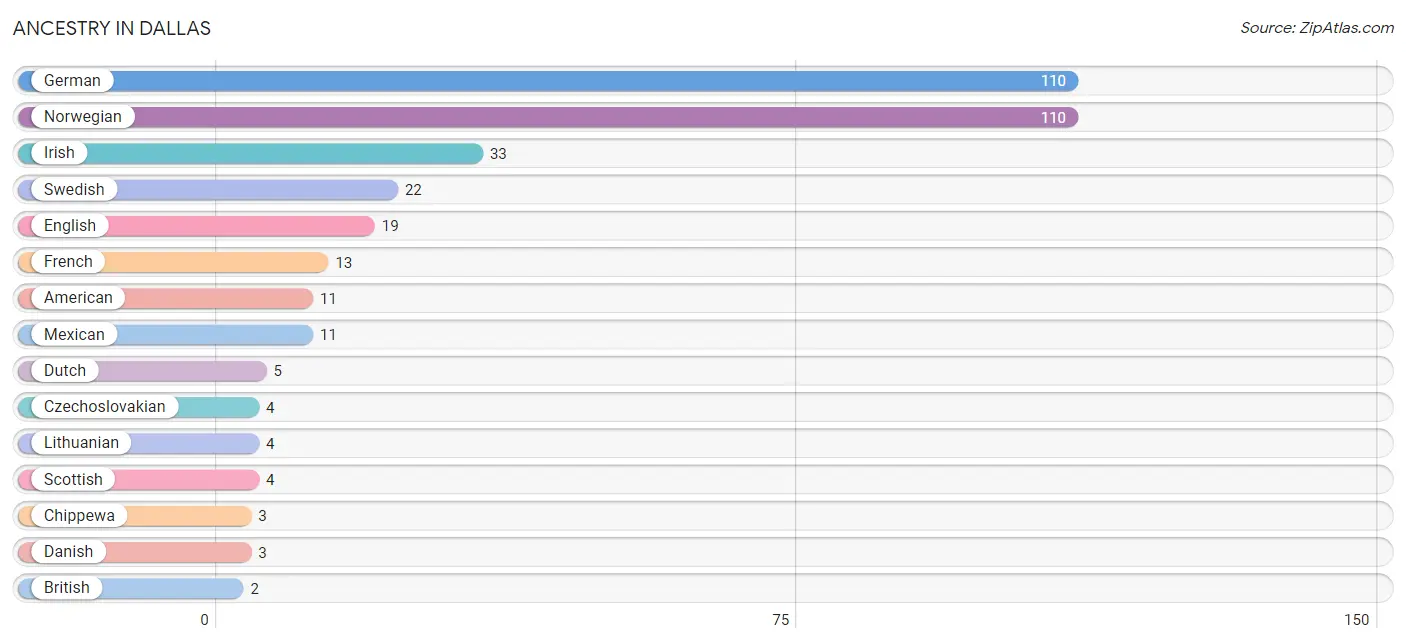
| Ancestry | # Population | % Population |
| American | 11 | 2.9% |
| British | 2 | 0.5% |
| Chippewa | 3 | 0.8% |
| Czech | 2 | 0.5% |
| Czechoslovakian | 4 | 1.1% |
| Danish | 3 | 0.8% |
| Dutch | 5 | 1.3% |
| English | 19 | 5.0% |
| European | 1 | 0.3% |
| French | 13 | 3.4% |
| German | 110 | 29.0% |
| Irish | 33 | 8.7% |
| Lithuanian | 4 | 1.1% |
| Mexican | 11 | 2.9% |
| Norwegian | 110 | 29.0% |
| Polish | 1 | 0.3% |
| Puerto Rican | 2 | 0.5% |
| Scottish | 4 | 1.1% |
| Swedish | 22 | 5.8% | View All 19 Rows |
Immigrants in Dallas

| Immigration Origin | # Population | % Population | View All 0 Rows |
Sex and Age in Dallas
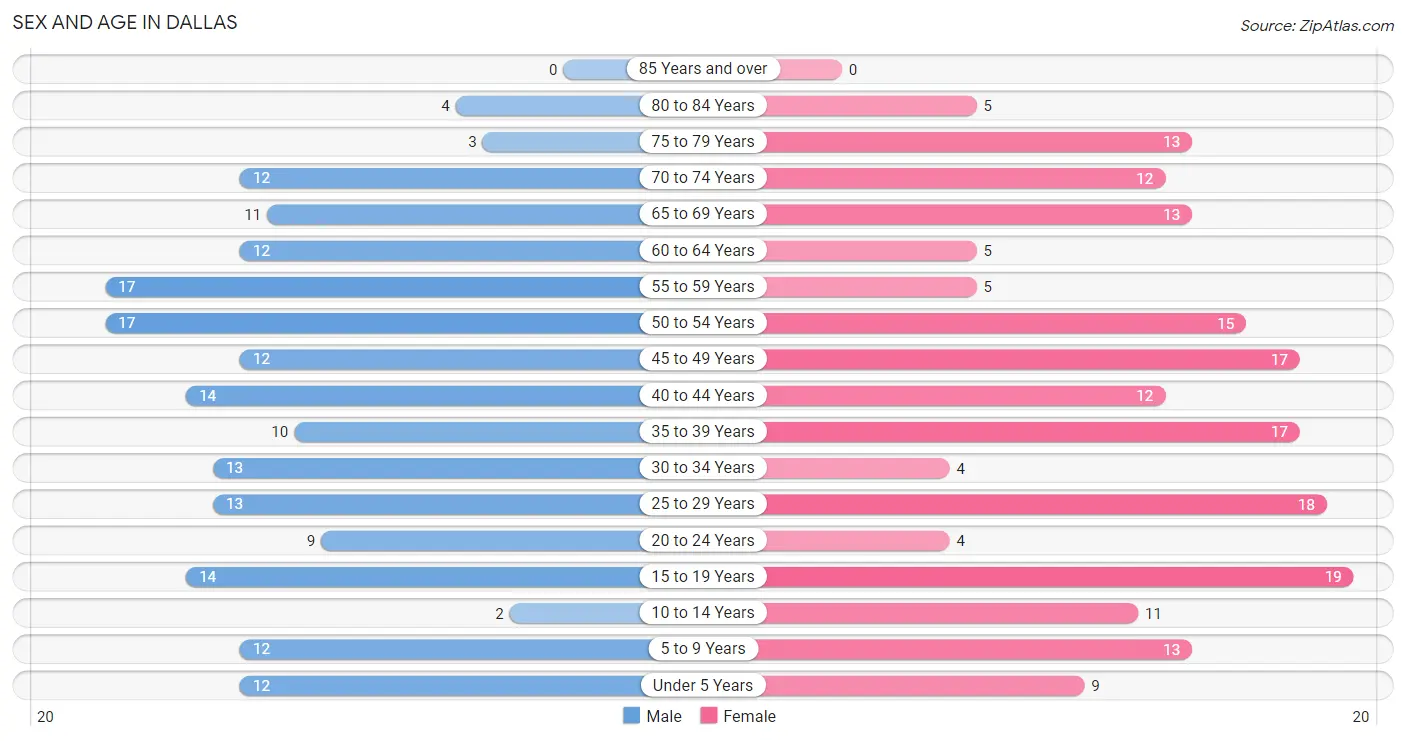
Sex and Age in Dallas
The most populous age groups in Dallas are 50 to 54 Years (17 | 9.1%) for men and 15 to 19 Years (19 | 9.9%) for women.
| Age Bracket | Male | Female |
| Under 5 Years | 12 (6.4%) | 9 (4.7%) |
| 5 to 9 Years | 12 (6.4%) | 13 (6.8%) |
| 10 to 14 Years | 2 (1.1%) | 11 (5.7%) |
| 15 to 19 Years | 14 (7.5%) | 19 (9.9%) |
| 20 to 24 Years | 9 (4.8%) | 4 (2.1%) |
| 25 to 29 Years | 13 (7.0%) | 18 (9.4%) |
| 30 to 34 Years | 13 (7.0%) | 4 (2.1%) |
| 35 to 39 Years | 10 (5.3%) | 17 (8.8%) |
| 40 to 44 Years | 14 (7.5%) | 12 (6.2%) |
| 45 to 49 Years | 12 (6.4%) | 17 (8.8%) |
| 50 to 54 Years | 17 (9.1%) | 15 (7.8%) |
| 55 to 59 Years | 17 (9.1%) | 5 (2.6%) |
| 60 to 64 Years | 12 (6.4%) | 5 (2.6%) |
| 65 to 69 Years | 11 (5.9%) | 13 (6.8%) |
| 70 to 74 Years | 12 (6.4%) | 12 (6.2%) |
| 75 to 79 Years | 3 (1.6%) | 13 (6.8%) |
| 80 to 84 Years | 4 (2.1%) | 5 (2.6%) |
| 85 Years and over | 0 (0.0%) | 0 (0.0%) |
| Total | 187 (100.0%) | 192 (100.0%) |
Families and Households in Dallas
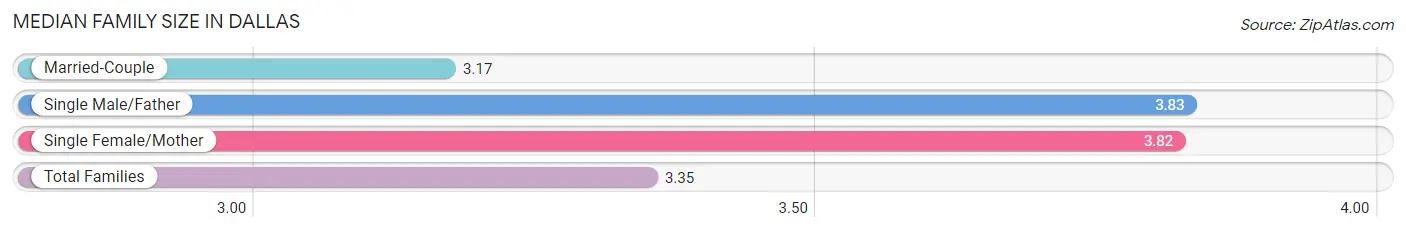
Median Family Size in Dallas
The median family size in Dallas is 3.35 persons per family, with single male/father families (6 | 7.0%) accounting for the largest median family size of 3.83 persons per family. On the other hand, married-couple families (63 | 73.3%) represent the smallest median family size with 3.17 persons per family.
| Family Type | # Families | Family Size |
| Married-Couple | 63 (73.3%) | 3.17 |
| Single Male/Father | 6 (7.0%) | 3.83 |
| Single Female/Mother | 17 (19.8%) | 3.82 |
| Total Families | 86 (100.0%) | 3.35 |
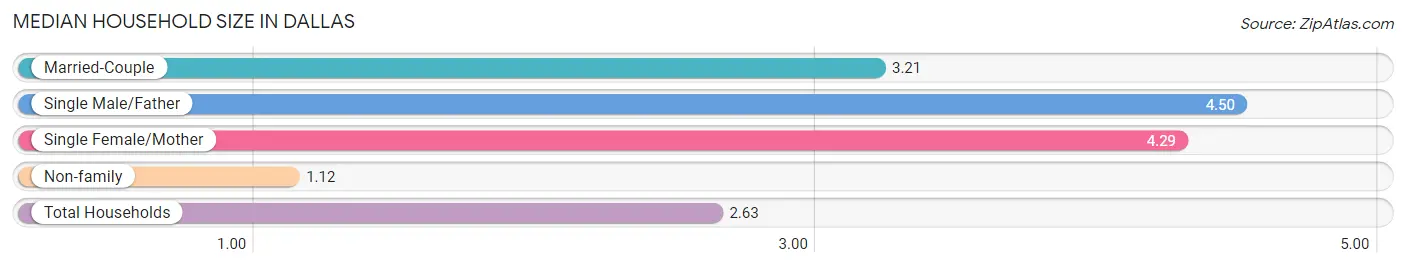
Median Household Size in Dallas
The median household size in Dallas is 2.63 persons per household, with single male/father households (6 | 4.4%) accounting for the largest median household size of 4.5 persons per household. non-family households (50 | 36.8%) represent the smallest median household size with 1.12 persons per household.
| Household Type | # Households | Household Size |
| Married-Couple | 63 (46.3%) | 3.21 |
| Single Male/Father | 6 (4.4%) | 4.50 |
| Single Female/Mother | 17 (12.5%) | 4.29 |
| Non-family | 50 (36.8%) | 1.12 |
| Total Households | 136 (100.0%) | 2.63 |
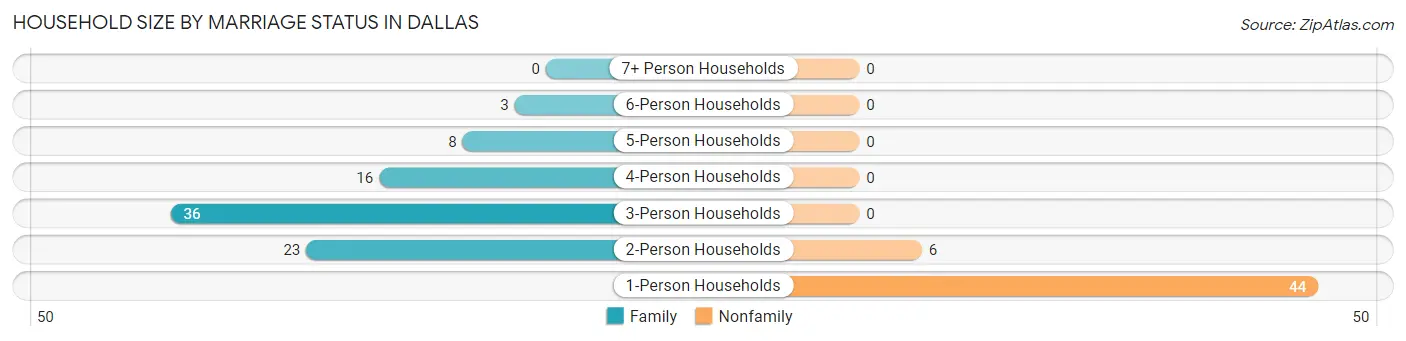
Household Size by Marriage Status in Dallas
Out of a total of 136 households in Dallas, 86 (63.2%) are family households, while 50 (36.8%) are nonfamily households. The most numerous type of family households are 3-person households, comprising 36, and the most common type of nonfamily households are 1-person households, comprising 44.
| Household Size | Family Households | Nonfamily Households |
| 1-Person Households | - | 44 (32.4%) |
| 2-Person Households | 23 (16.9%) | 6 (4.4%) |
| 3-Person Households | 36 (26.5%) | 0 (0.0%) |
| 4-Person Households | 16 (11.8%) | 0 (0.0%) |
| 5-Person Households | 8 (5.9%) | 0 (0.0%) |
| 6-Person Households | 3 (2.2%) | 0 (0.0%) |
| 7+ Person Households | 0 (0.0%) | 0 (0.0%) |
| Total | 86 (63.2%) | 50 (36.8%) |
Female Fertility in Dallas
Fertility by Age in Dallas
Average fertility rate in Dallas is 43.0 births per 1,000 women. Women in the age bracket of 20 to 34 years have the highest fertility rate with 154.0 births per 1,000 women. Women in the age bracket of 20 to 34 years acount for 100.0% of all women with births.
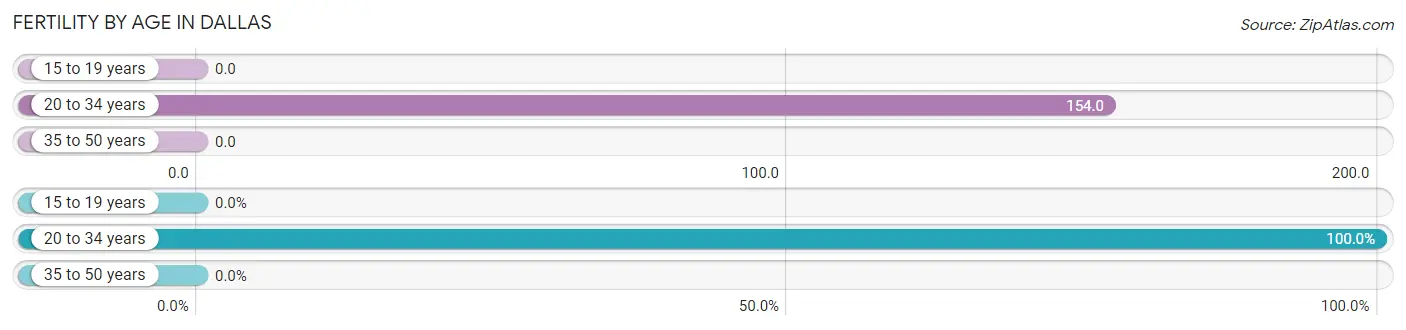
| Age Bracket | Women with Births | Births / 1,000 Women |
| 15 to 19 years | 0 (0.0%) | 0.0 |
| 20 to 34 years | 4 (100.0%) | 154.0 |
| 35 to 50 years | 0 (0.0%) | 0.0 |
| Total | 4 (100.0%) | 43.0 |
Fertility by Age by Marriage Status in Dallas
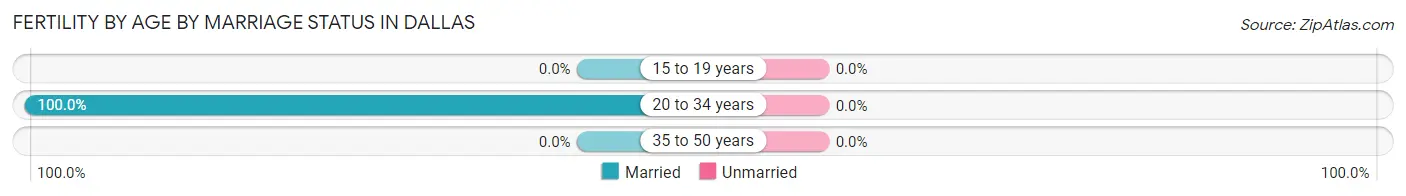
| Age Bracket | Married | Unmarried |
| 15 to 19 years | 0 (0.0%) | 0 (0.0%) |
| 20 to 34 years | 4 (100.0%) | 0 (0.0%) |
| 35 to 50 years | 0 (0.0%) | 0 (0.0%) |
| Total | 4 (100.0%) | 0 (0.0%) |
Fertility by Education in Dallas
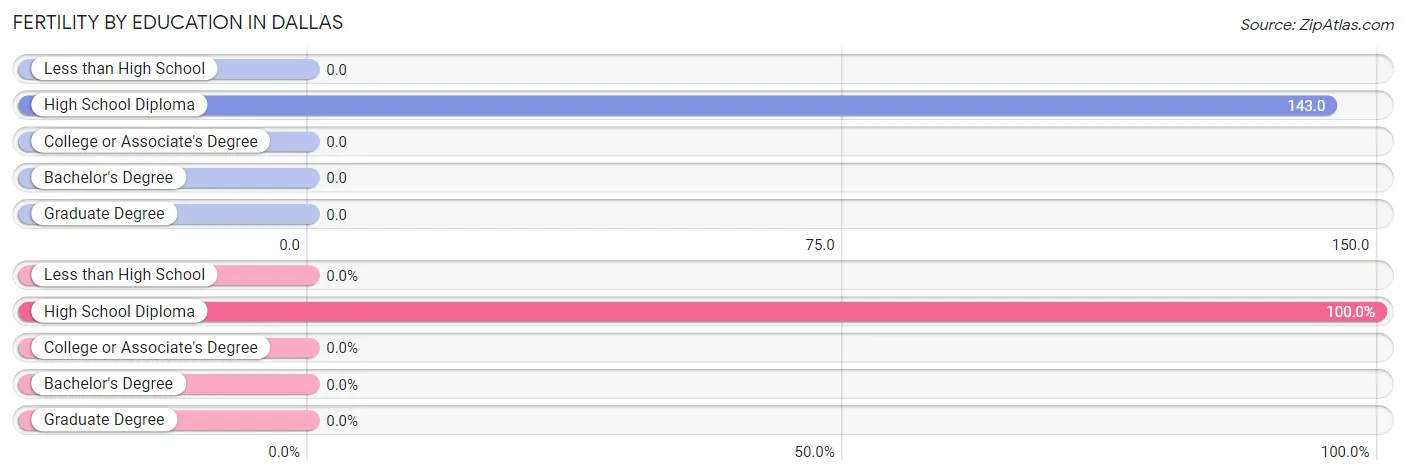
| Educational Attainment | Women with Births | Births / 1,000 Women |
| Less than High School | 0 (0.0%) | 0.0 |
| High School Diploma | 4 (100.0%) | 143.0 |
| College or Associate's Degree | 0 (0.0%) | 0.0 |
| Bachelor's Degree | 0 (0.0%) | 0.0 |
| Graduate Degree | 0 (0.0%) | 0.0 |
| Total | 4 (100.0%) | 43.0 |
Fertility by Education by Marriage Status in Dallas
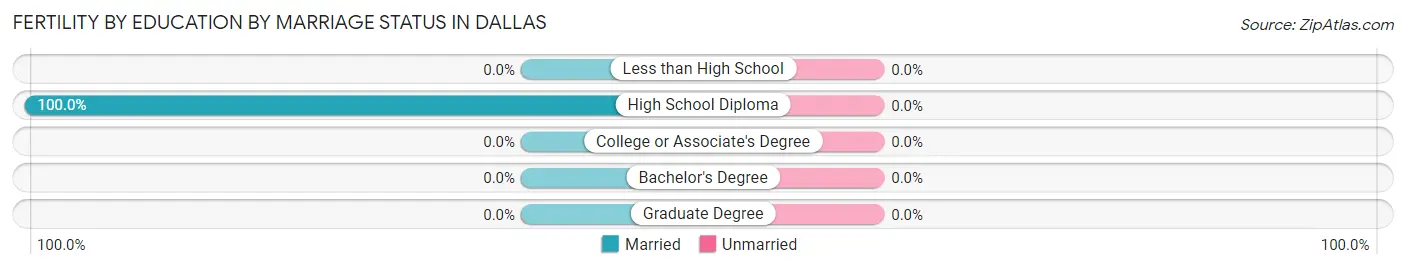
| Educational Attainment | Married | Unmarried |
| Less than High School | 0 (0.0%) | 0 (0.0%) |
| High School Diploma | 4 (100.0%) | 0 (0.0%) |
| College or Associate's Degree | 0 (0.0%) | 0 (0.0%) |
| Bachelor's Degree | 0 (0.0%) | 0 (0.0%) |
| Graduate Degree | 0 (0.0%) | 0 (0.0%) |
| Total | 4 (100.0%) | 0 (0.0%) |
Employment Characteristics in Dallas
Employment by Class of Employer in Dallas
Among the 168 employed individuals in Dallas, private company employees (127 | 75.6%), self-employed (incorporated) (10 | 5.9%), and not-for-profit organizations (10 | 5.9%) make up the most common classes of employment.
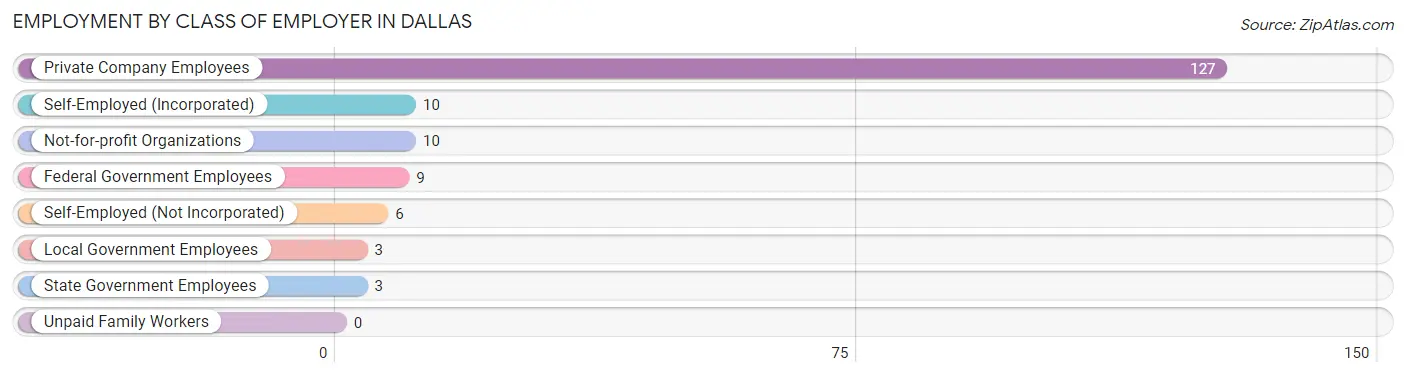
| Employer Class | # Employees | % Employees |
| Private Company Employees | 127 | 75.6% |
| Self-Employed (Incorporated) | 10 | 5.9% |
| Self-Employed (Not Incorporated) | 6 | 3.6% |
| Not-for-profit Organizations | 10 | 5.9% |
| Local Government Employees | 3 | 1.8% |
| State Government Employees | 3 | 1.8% |
| Federal Government Employees | 9 | 5.4% |
| Unpaid Family Workers | 0 | 0.0% |
| Total | 168 | 100.0% |
Employment Status by Age in Dallas
According to the labor force statistics for Dallas, out of the total population over 16 years of age (316), 58.5% or 185 individuals are in the labor force, with 4.3% or 8 of them unemployed. The age group with the highest labor force participation rate is 20 to 24 years, with 100.0% or 13 individuals in the labor force. Within the labor force, the 55 to 59 years age range has the highest percentage of unemployed individuals, with 50.0% or 4 of them being unemployed.
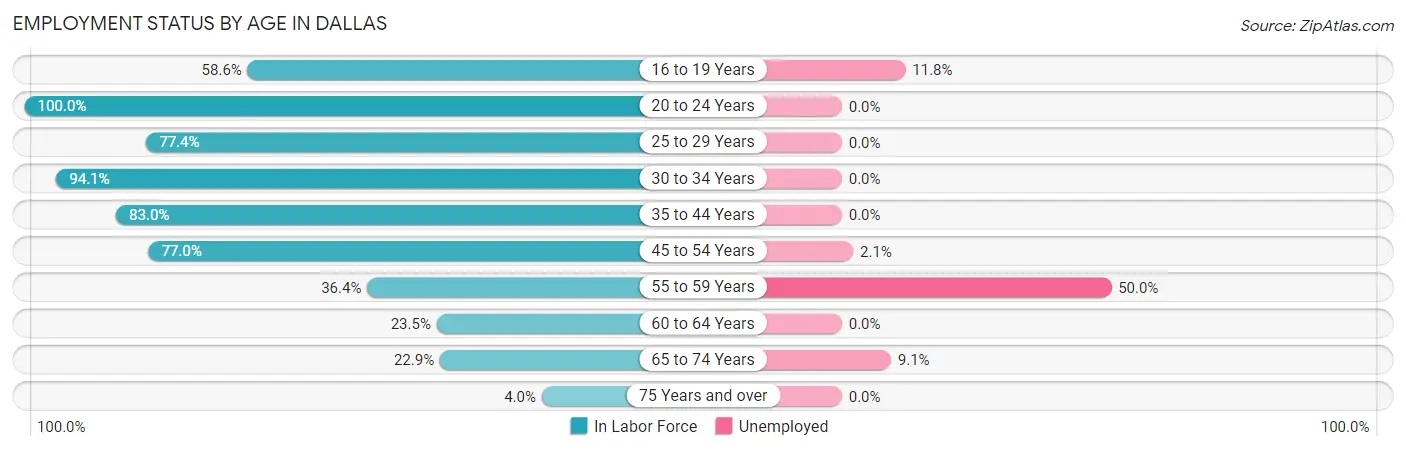
| Age Bracket | In Labor Force | Unemployed |
| 16 to 19 Years | 17 (58.6%) | 2 (11.8%) |
| 20 to 24 Years | 13 (100.0%) | 0 (0.0%) |
| 25 to 29 Years | 24 (77.4%) | 0 (0.0%) |
| 30 to 34 Years | 16 (94.1%) | 0 (0.0%) |
| 35 to 44 Years | 44 (83.0%) | 0 (0.0%) |
| 45 to 54 Years | 47 (77.0%) | 1 (2.1%) |
| 55 to 59 Years | 8 (36.4%) | 4 (50.0%) |
| 60 to 64 Years | 4 (23.5%) | 0 (0.0%) |
| 65 to 74 Years | 11 (22.9%) | 1 (9.1%) |
| 75 Years and over | 1 (4.0%) | 0 (0.0%) |
| Total | 185 (58.5%) | 8 (4.3%) |
Employment Status by Educational Attainment in Dallas
According to labor force statistics for Dallas, 71.1% of individuals (143) out of the total population between 25 and 64 years of age (201) are in the labor force, with 3.5% or 5 of them being unemployed. The group with the highest labor force participation rate are those with the educational attainment of college / associate degree, with 85.9% or 61 individuals in the labor force. Within the labor force, individuals with high school diploma education have the highest percentage of unemployment, with 7.7% or 5 of them being unemployed.
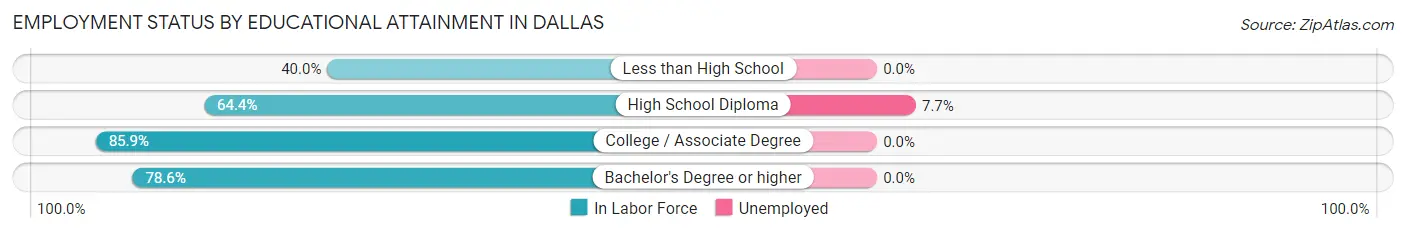
| Educational Attainment | In Labor Force | Unemployed |
| Less than High School | 6 (40.0%) | 0 (0.0%) |
| High School Diploma | 65 (64.4%) | 8 (7.7%) |
| College / Associate Degree | 61 (85.9%) | 0 (0.0%) |
| Bachelor's Degree or higher | 11 (78.6%) | 0 (0.0%) |
| Total | 143 (71.1%) | 7 (3.5%) |
Employment Occupations by Sex in Dallas
Management, Business, Science and Arts Occupations
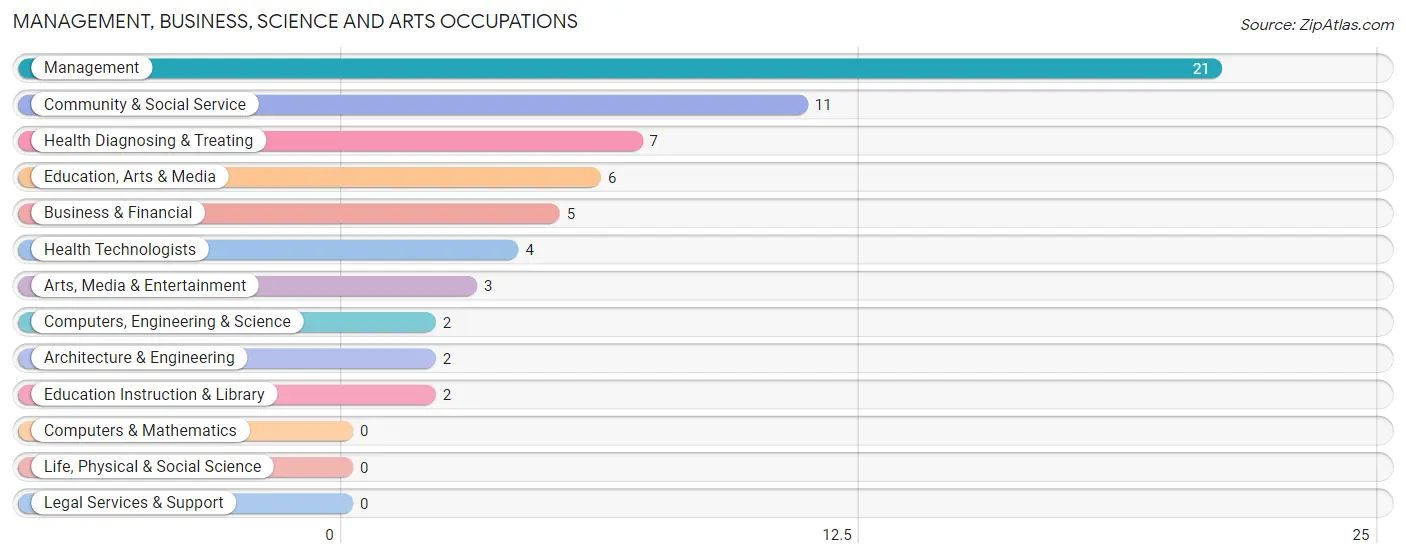
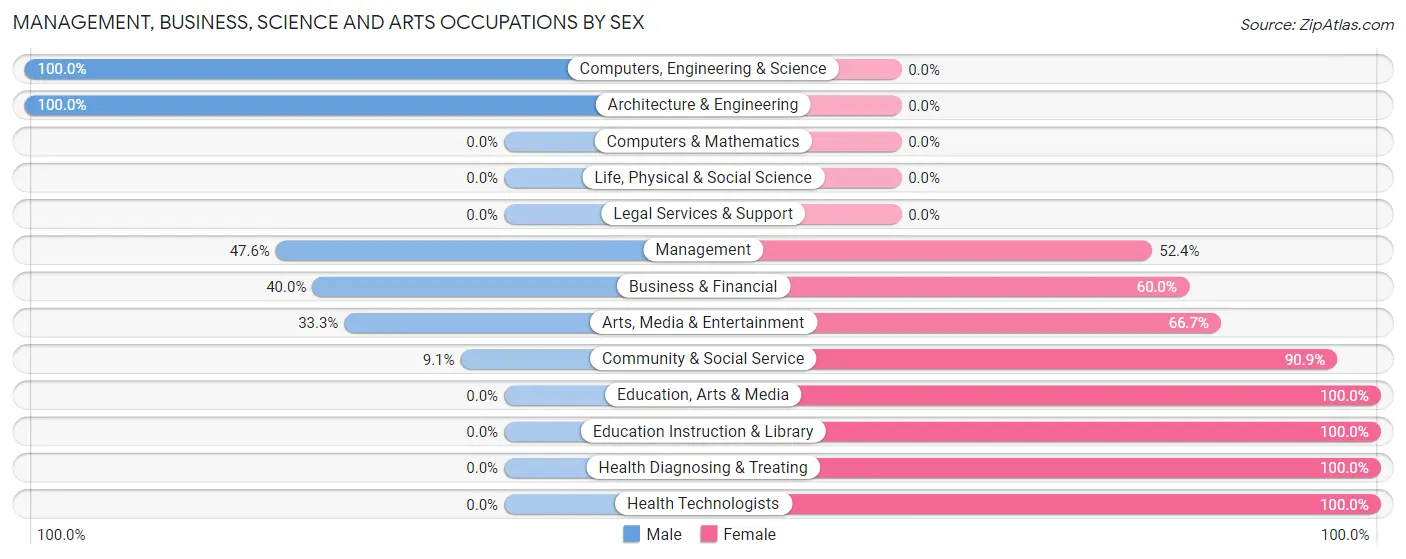
The most common Management, Business, Science and Arts occupations in Dallas are Management (21 | 11.9%), Community & Social Service (11 | 6.2%), Health Diagnosing & Treating (7 | 4.0%), Education, Arts & Media (6 | 3.4%), and Business & Financial (5 | 2.8%).
Management, Business, Science and Arts Occupations by Sex
Within the Management, Business, Science and Arts occupations in Dallas, the most male-oriented occupations are Computers, Engineering & Science (100.0%), Architecture & Engineering (100.0%), and Management (47.6%), while the most female-oriented occupations are Education, Arts & Media (100.0%), Education Instruction & Library (100.0%), and Health Diagnosing & Treating (100.0%).
| Occupation | Male | Female |
| Management | 10 (47.6%) | 11 (52.4%) |
| Business & Financial | 2 (40.0%) | 3 (60.0%) |
| Computers, Engineering & Science | 2 (100.0%) | 0 (0.0%) |
| Computers & Mathematics | 0 (0.0%) | 0 (0.0%) |
| Architecture & Engineering | 2 (100.0%) | 0 (0.0%) |
| Life, Physical & Social Science | 0 (0.0%) | 0 (0.0%) |
| Community & Social Service | 1 (9.1%) | 10 (90.9%) |
| Education, Arts & Media | 0 (0.0%) | 6 (100.0%) |
| Legal Services & Support | 0 (0.0%) | 0 (0.0%) |
| Education Instruction & Library | 0 (0.0%) | 2 (100.0%) |
| Arts, Media & Entertainment | 1 (33.3%) | 2 (66.7%) |
| Health Diagnosing & Treating | 0 (0.0%) | 7 (100.0%) |
| Health Technologists | 0 (0.0%) | 4 (100.0%) |
| Total (Category) | 15 (32.6%) | 31 (67.4%) |
| Total (Overall) | 95 (53.7%) | 82 (46.3%) |
Services Occupations
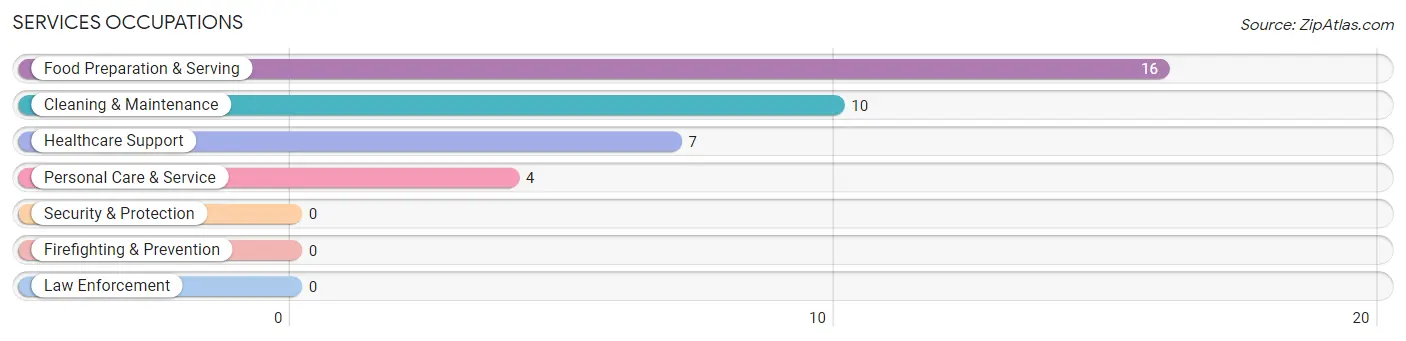
The most common Services occupations in Dallas are Food Preparation & Serving (16 | 9.0%), Cleaning & Maintenance (10 | 5.7%), Healthcare Support (7 | 4.0%), and Personal Care & Service (4 | 2.3%).
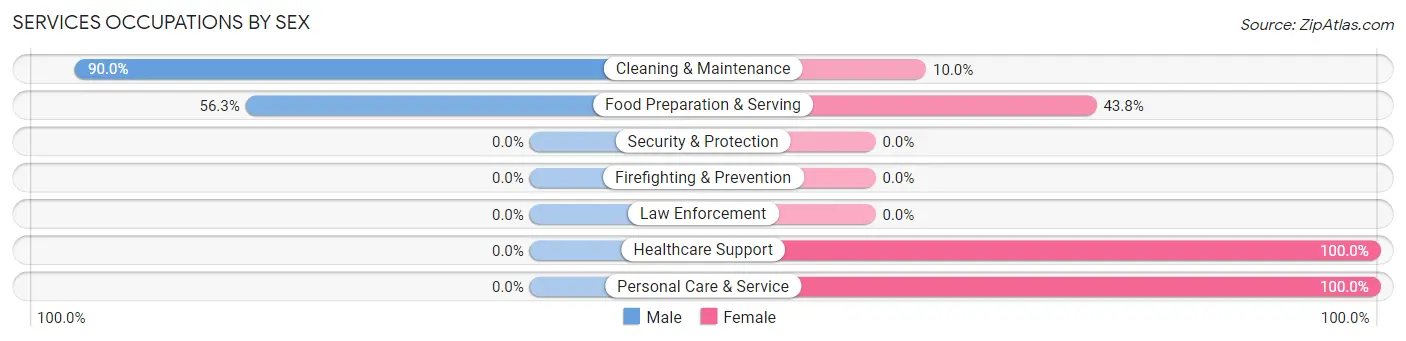
Services Occupations by Sex
Within the Services occupations in Dallas, the most male-oriented occupations are Cleaning & Maintenance (90.0%), and Food Preparation & Serving (56.2%), while the most female-oriented occupations are Healthcare Support (100.0%), Personal Care & Service (100.0%), and Food Preparation & Serving (43.8%).
| Occupation | Male | Female |
| Healthcare Support | 0 (0.0%) | 7 (100.0%) |
| Security & Protection | 0 (0.0%) | 0 (0.0%) |
| Firefighting & Prevention | 0 (0.0%) | 0 (0.0%) |
| Law Enforcement | 0 (0.0%) | 0 (0.0%) |
| Food Preparation & Serving | 9 (56.2%) | 7 (43.8%) |
| Cleaning & Maintenance | 9 (90.0%) | 1 (10.0%) |
| Personal Care & Service | 0 (0.0%) | 4 (100.0%) |
| Total (Category) | 18 (48.6%) | 19 (51.3%) |
| Total (Overall) | 95 (53.7%) | 82 (46.3%) |
Sales and Office Occupations
The most common Sales and Office occupations in Dallas are Office & Administration (14 | 7.9%), and Sales & Related (7 | 4.0%).

Sales and Office Occupations by Sex

| Occupation | Male | Female |
| Sales & Related | 5 (71.4%) | 2 (28.6%) |
| Office & Administration | 0 (0.0%) | 14 (100.0%) |
| Total (Category) | 5 (23.8%) | 16 (76.2%) |
| Total (Overall) | 95 (53.7%) | 82 (46.3%) |
Natural Resources, Construction and Maintenance Occupations
The most common Natural Resources, Construction and Maintenance occupations in Dallas are Installation, Maintenance & Repair (7 | 4.0%), Farming, Fishing & Forestry (6 | 3.4%), and Construction & Extraction (5 | 2.8%).

Natural Resources, Construction and Maintenance Occupations by Sex

| Occupation | Male | Female |
| Farming, Fishing & Forestry | 4 (66.7%) | 2 (33.3%) |
| Construction & Extraction | 5 (100.0%) | 0 (0.0%) |
| Installation, Maintenance & Repair | 7 (100.0%) | 0 (0.0%) |
| Total (Category) | 16 (88.9%) | 2 (11.1%) |
| Total (Overall) | 95 (53.7%) | 82 (46.3%) |
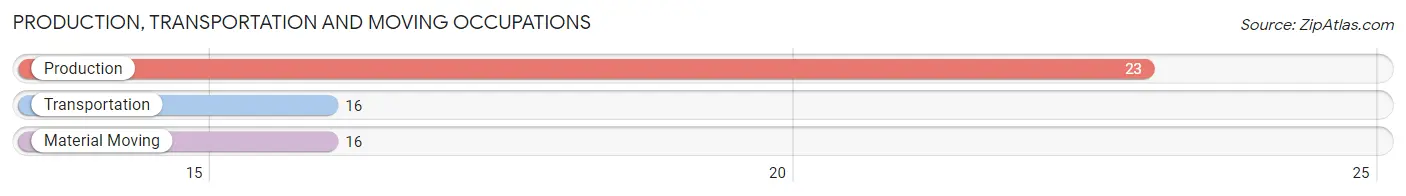
Production, Transportation and Moving Occupations
The most common Production, Transportation and Moving occupations in Dallas are Production (23 | 13.0%), Transportation (16 | 9.0%), and Material Moving (16 | 9.0%).
Production, Transportation and Moving Occupations by Sex
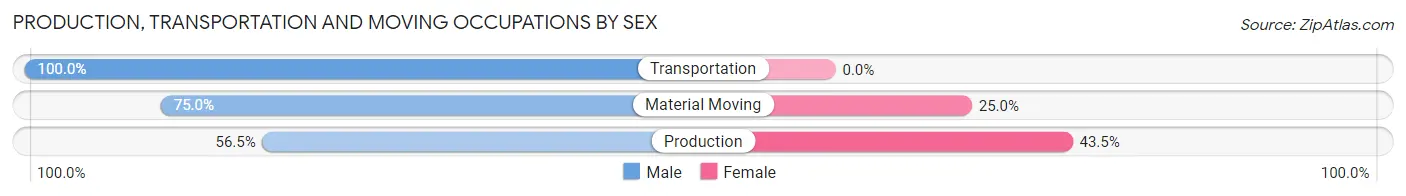
| Occupation | Male | Female |
| Production | 13 (56.5%) | 10 (43.5%) |
| Transportation | 16 (100.0%) | 0 (0.0%) |
| Material Moving | 12 (75.0%) | 4 (25.0%) |
| Total (Category) | 41 (74.6%) | 14 (25.5%) |
| Total (Overall) | 95 (53.7%) | 82 (46.3%) |
Employment Industries by Sex in Dallas
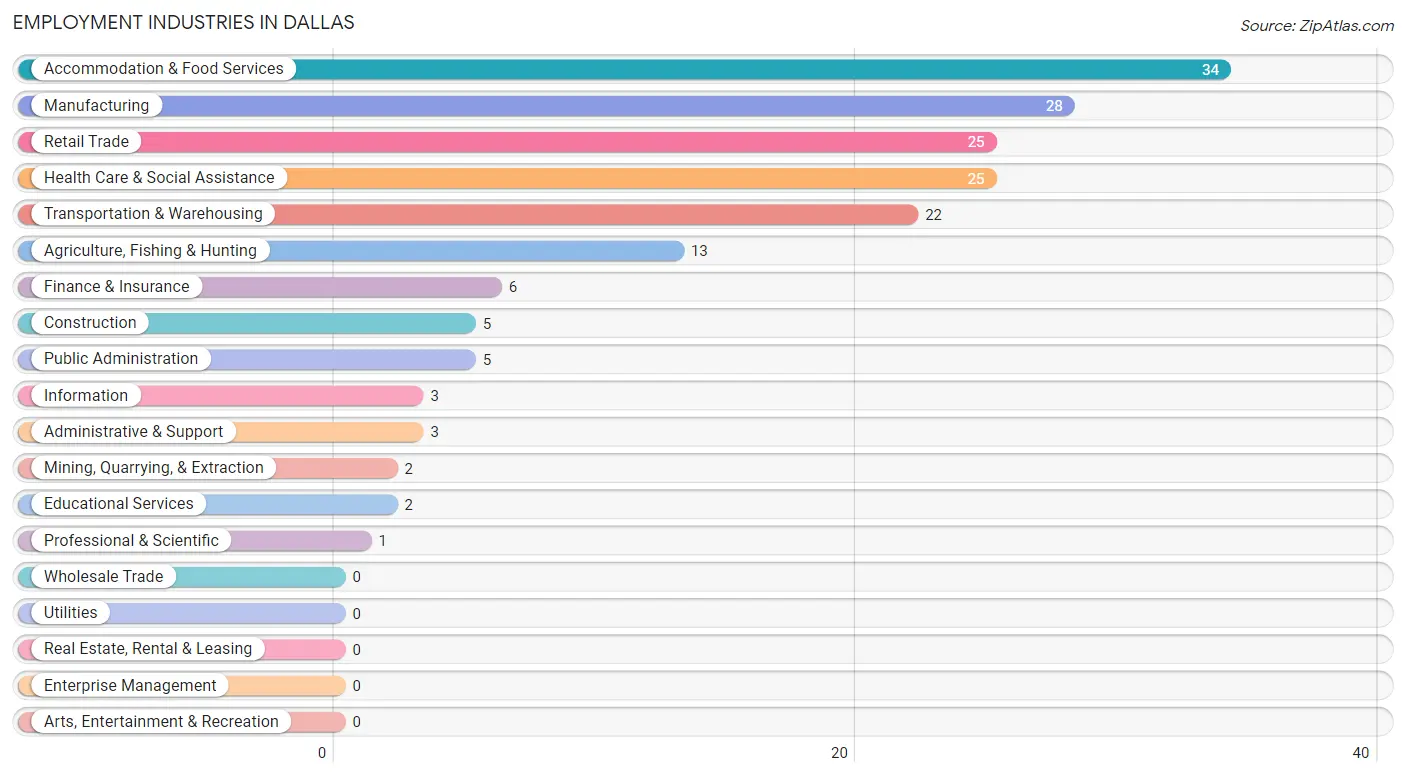
Employment Industries in Dallas
The major employment industries in Dallas include Accommodation & Food Services (34 | 19.2%), Manufacturing (28 | 15.8%), Retail Trade (25 | 14.1%), Health Care & Social Assistance (25 | 14.1%), and Transportation & Warehousing (22 | 12.4%).
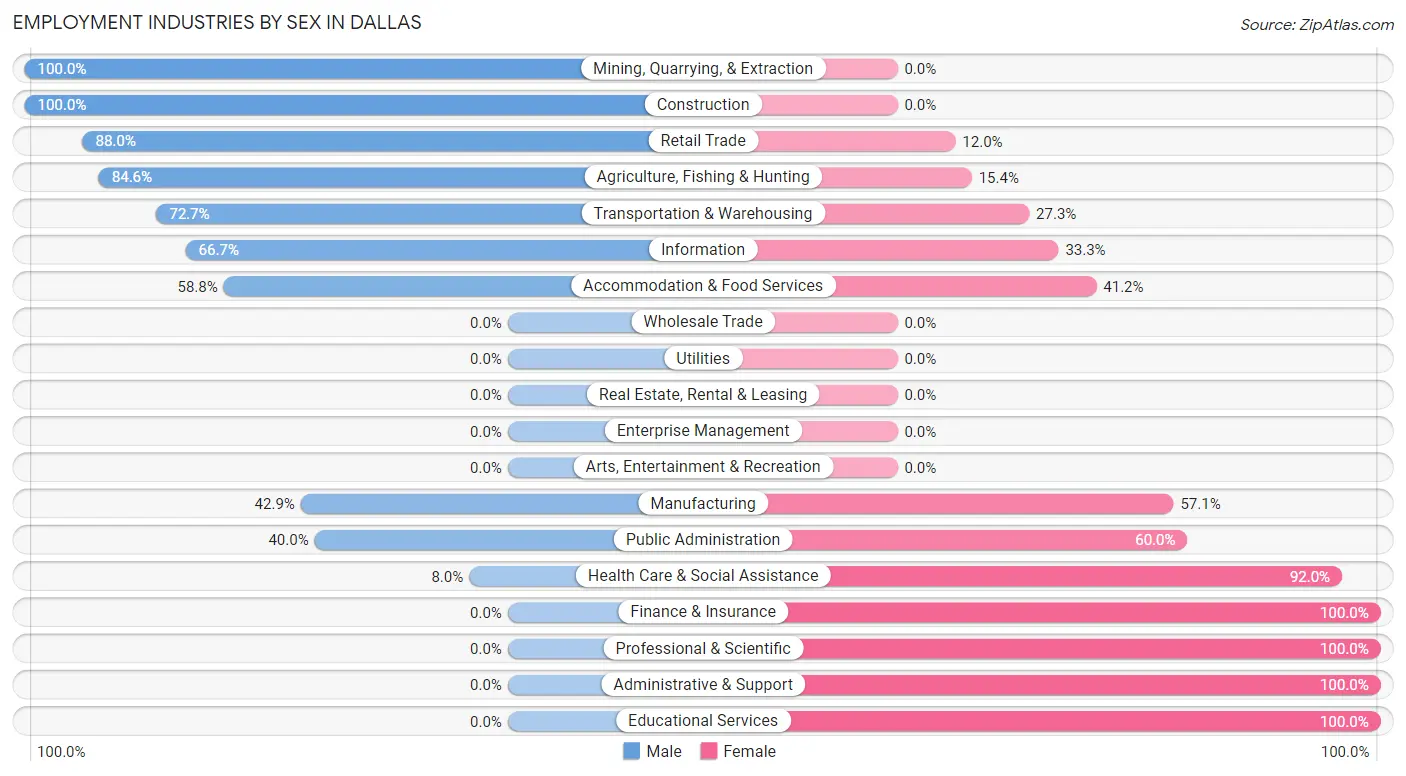
Employment Industries by Sex in Dallas
The Dallas industries that see more men than women are Mining, Quarrying, & Extraction (100.0%), Construction (100.0%), and Retail Trade (88.0%), whereas the industries that tend to have a higher number of women are Finance & Insurance (100.0%), Professional & Scientific (100.0%), and Administrative & Support (100.0%).
| Industry | Male | Female |
| Agriculture, Fishing & Hunting | 11 (84.6%) | 2 (15.4%) |
| Mining, Quarrying, & Extraction | 2 (100.0%) | 0 (0.0%) |
| Construction | 5 (100.0%) | 0 (0.0%) |
| Manufacturing | 12 (42.9%) | 16 (57.1%) |
| Wholesale Trade | 0 (0.0%) | 0 (0.0%) |
| Retail Trade | 22 (88.0%) | 3 (12.0%) |
| Transportation & Warehousing | 16 (72.7%) | 6 (27.3%) |
| Utilities | 0 (0.0%) | 0 (0.0%) |
| Information | 2 (66.7%) | 1 (33.3%) |
| Finance & Insurance | 0 (0.0%) | 6 (100.0%) |
| Real Estate, Rental & Leasing | 0 (0.0%) | 0 (0.0%) |
| Professional & Scientific | 0 (0.0%) | 1 (100.0%) |
| Enterprise Management | 0 (0.0%) | 0 (0.0%) |
| Administrative & Support | 0 (0.0%) | 3 (100.0%) |
| Educational Services | 0 (0.0%) | 2 (100.0%) |
| Health Care & Social Assistance | 2 (8.0%) | 23 (92.0%) |
| Arts, Entertainment & Recreation | 0 (0.0%) | 0 (0.0%) |
| Accommodation & Food Services | 20 (58.8%) | 14 (41.2%) |
| Public Administration | 2 (40.0%) | 3 (60.0%) |
| Total | 95 (53.7%) | 82 (46.3%) |
Education in Dallas
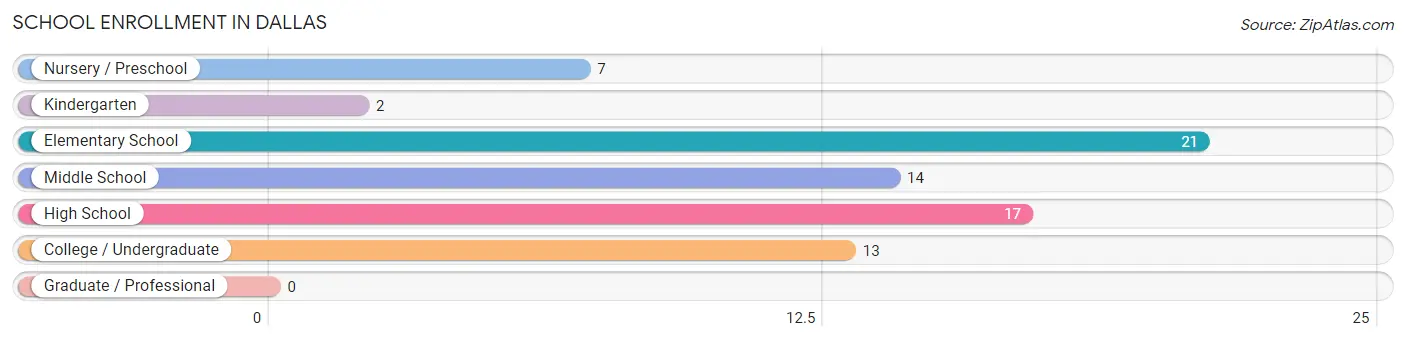
School Enrollment in Dallas
The most common levels of schooling among the 74 students in Dallas are elementary school (21 | 28.4%), high school (17 | 23.0%), and middle school (14 | 18.9%).
| School Level | # Students | % Students |
| Nursery / Preschool | 7 | 9.5% |
| Kindergarten | 2 | 2.7% |
| Elementary School | 21 | 28.4% |
| Middle School | 14 | 18.9% |
| High School | 17 | 23.0% |
| College / Undergraduate | 13 | 17.6% |
| Graduate / Professional | 0 | 0.0% |
| Total | 74 | 100.0% |
School Enrollment by Age by Funding Source in Dallas
Out of a total of 74 students who are enrolled in schools in Dallas, 7 (9.5%) attend a private institution, while the remaining 67 (90.5%) are enrolled in public schools. The age group of 15 to 17 year olds has the highest likelihood of being enrolled in private schools, with 6 (31.6% in the age bracket) enrolled. Conversely, the age group of 3 to 4 year olds has the lowest likelihood of being enrolled in a private school, with 4 (100.0% in the age bracket) attending a public institution.
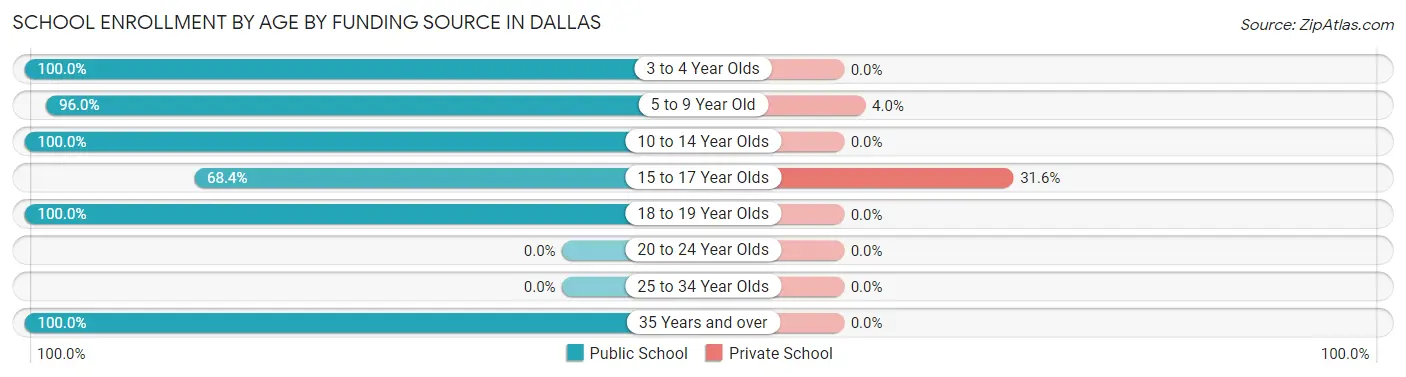
| Age Bracket | Public School | Private School |
| 3 to 4 Year Olds | 4 (100.0%) | 0 (0.0%) |
| 5 to 9 Year Old | 24 (96.0%) | 1 (4.0%) |
| 10 to 14 Year Olds | 13 (100.0%) | 0 (0.0%) |
| 15 to 17 Year Olds | 13 (68.4%) | 6 (31.6%) |
| 18 to 19 Year Olds | 9 (100.0%) | 0 (0.0%) |
| 20 to 24 Year Olds | 0 (0.0%) | 0 (0.0%) |
| 25 to 34 Year Olds | 0 (0.0%) | 0 (0.0%) |
| 35 Years and over | 4 (100.0%) | 0 (0.0%) |
| Total | 67 (90.5%) | 7 (9.5%) |
Educational Attainment by Field of Study in Dallas
Arts & humanities (7 | 30.4%), engineering (4 | 17.4%), bio, nature & agricultural (3 | 13.0%), education (3 | 13.0%), and communications (3 | 13.0%) are the most common fields of study among 23 individuals in Dallas who have obtained a bachelor's degree or higher.
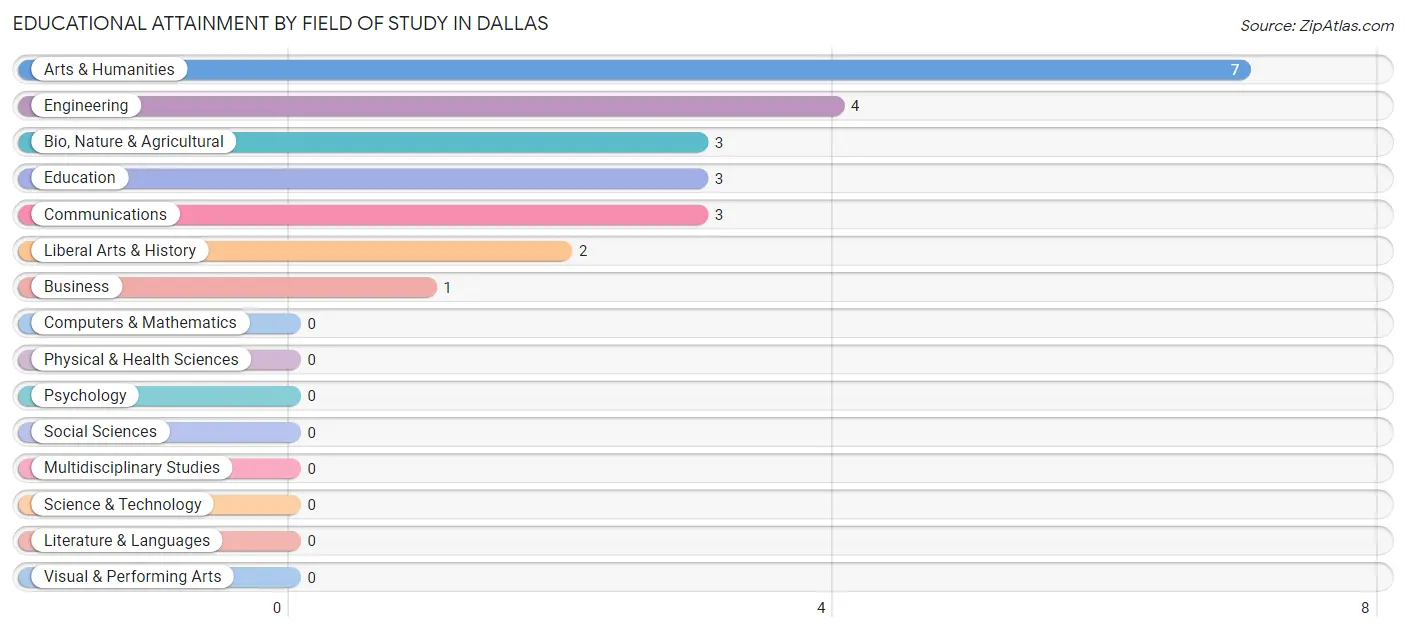
| Field of Study | # Graduates | % Graduates |
| Computers & Mathematics | 0 | 0.0% |
| Bio, Nature & Agricultural | 3 | 13.0% |
| Physical & Health Sciences | 0 | 0.0% |
| Psychology | 0 | 0.0% |
| Social Sciences | 0 | 0.0% |
| Engineering | 4 | 17.4% |
| Multidisciplinary Studies | 0 | 0.0% |
| Science & Technology | 0 | 0.0% |
| Business | 1 | 4.3% |
| Education | 3 | 13.0% |
| Literature & Languages | 0 | 0.0% |
| Liberal Arts & History | 2 | 8.7% |
| Visual & Performing Arts | 0 | 0.0% |
| Communications | 3 | 13.0% |
| Arts & Humanities | 7 | 30.4% |
| Total | 23 | 100.0% |
Transportation & Commute in Dallas
Vehicle Availability by Sex in Dallas
The most prevalent vehicle ownership categories in Dallas are males with 3 vehicles (25, accounting for 29.1%) and females with 3 vehicles (21, making up 30.5%).
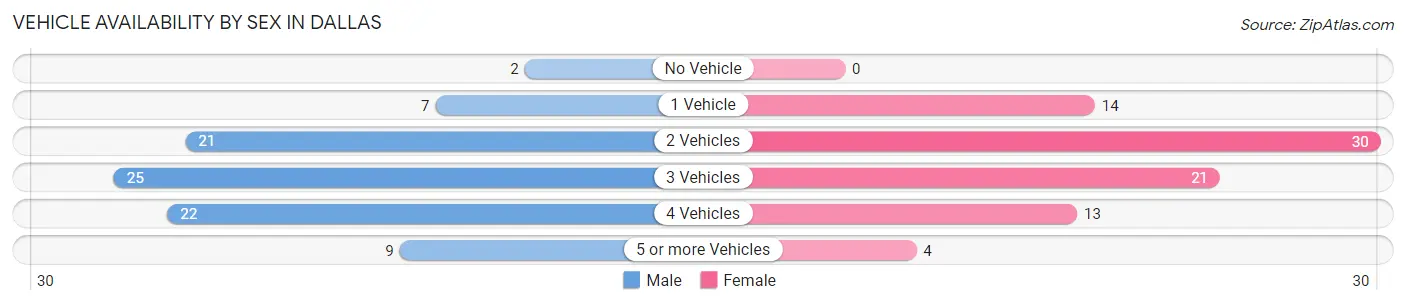
| Vehicles Available | Male | Female |
| No Vehicle | 2 (2.3%) | 0 (0.0%) |
| 1 Vehicle | 7 (8.1%) | 14 (17.1%) |
| 2 Vehicles | 21 (24.4%) | 30 (36.6%) |
| 3 Vehicles | 25 (29.1%) | 21 (25.6%) |
| 4 Vehicles | 22 (25.6%) | 13 (15.9%) |
| 5 or more Vehicles | 9 (10.5%) | 4 (4.9%) |
| Total | 86 (100.0%) | 82 (100.0%) |
Commute Time in Dallas
The most frequently occuring commute durations in Dallas are 15 to 19 minutes (30 commuters, 18.9%), 25 to 29 minutes (25 commuters, 15.7%), and 30 to 34 minutes (21 commuters, 13.2%).
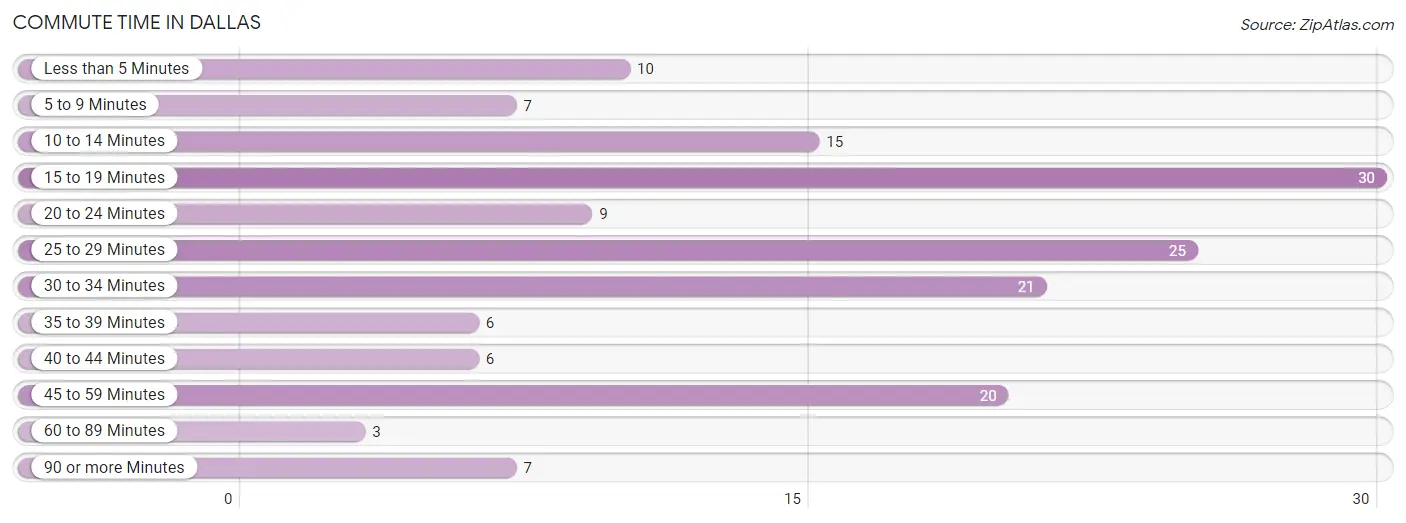
| Commute Time | # Commuters | % Commuters |
| Less than 5 Minutes | 10 | 6.3% |
| 5 to 9 Minutes | 7 | 4.4% |
| 10 to 14 Minutes | 15 | 9.4% |
| 15 to 19 Minutes | 30 | 18.9% |
| 20 to 24 Minutes | 9 | 5.7% |
| 25 to 29 Minutes | 25 | 15.7% |
| 30 to 34 Minutes | 21 | 13.2% |
| 35 to 39 Minutes | 6 | 3.8% |
| 40 to 44 Minutes | 6 | 3.8% |
| 45 to 59 Minutes | 20 | 12.6% |
| 60 to 89 Minutes | 3 | 1.9% |
| 90 or more Minutes | 7 | 4.4% |
Commute Time by Sex in Dallas
The most common commute times in Dallas are 30 to 34 minutes (15 commuters, 17.4%) for males and 15 to 19 minutes (17 commuters, 23.3%) for females.
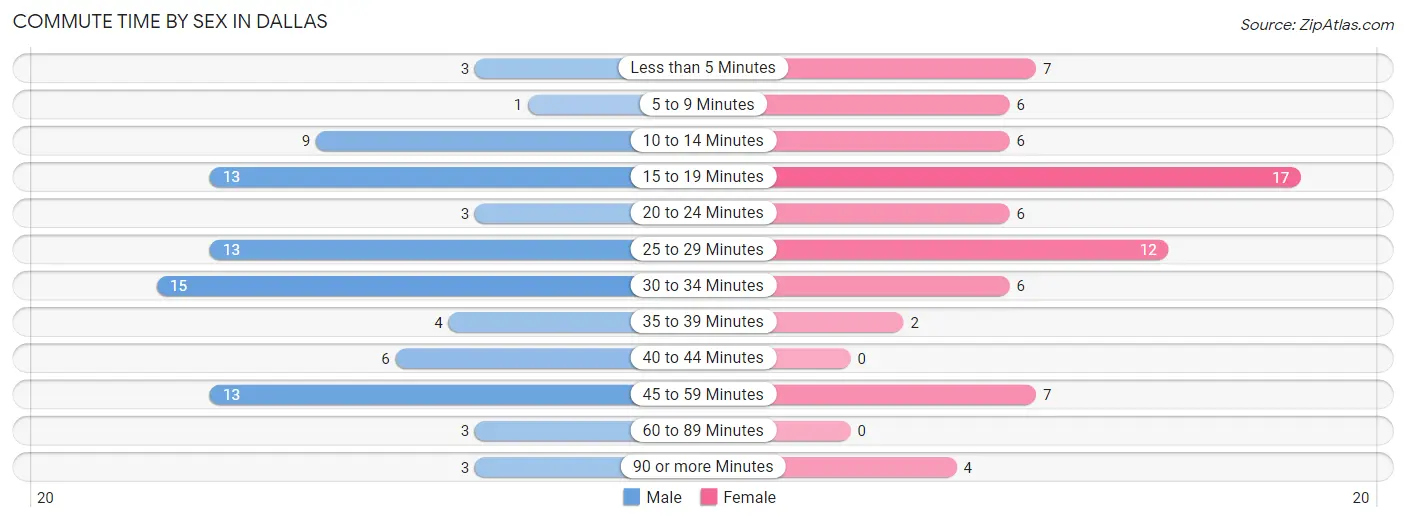
| Commute Time | Male | Female |
| Less than 5 Minutes | 3 (3.5%) | 7 (9.6%) |
| 5 to 9 Minutes | 1 (1.2%) | 6 (8.2%) |
| 10 to 14 Minutes | 9 (10.5%) | 6 (8.2%) |
| 15 to 19 Minutes | 13 (15.1%) | 17 (23.3%) |
| 20 to 24 Minutes | 3 (3.5%) | 6 (8.2%) |
| 25 to 29 Minutes | 13 (15.1%) | 12 (16.4%) |
| 30 to 34 Minutes | 15 (17.4%) | 6 (8.2%) |
| 35 to 39 Minutes | 4 (4.6%) | 2 (2.7%) |
| 40 to 44 Minutes | 6 (7.0%) | 0 (0.0%) |
| 45 to 59 Minutes | 13 (15.1%) | 7 (9.6%) |
| 60 to 89 Minutes | 3 (3.5%) | 0 (0.0%) |
| 90 or more Minutes | 3 (3.5%) | 4 (5.5%) |
Time of Departure to Work by Sex in Dallas
The most frequent times of departure to work in Dallas are 12:00 AM to 4:59 AM (20, 23.3%) for males and 8:00 AM to 8:29 AM (19, 26.0%) for females.
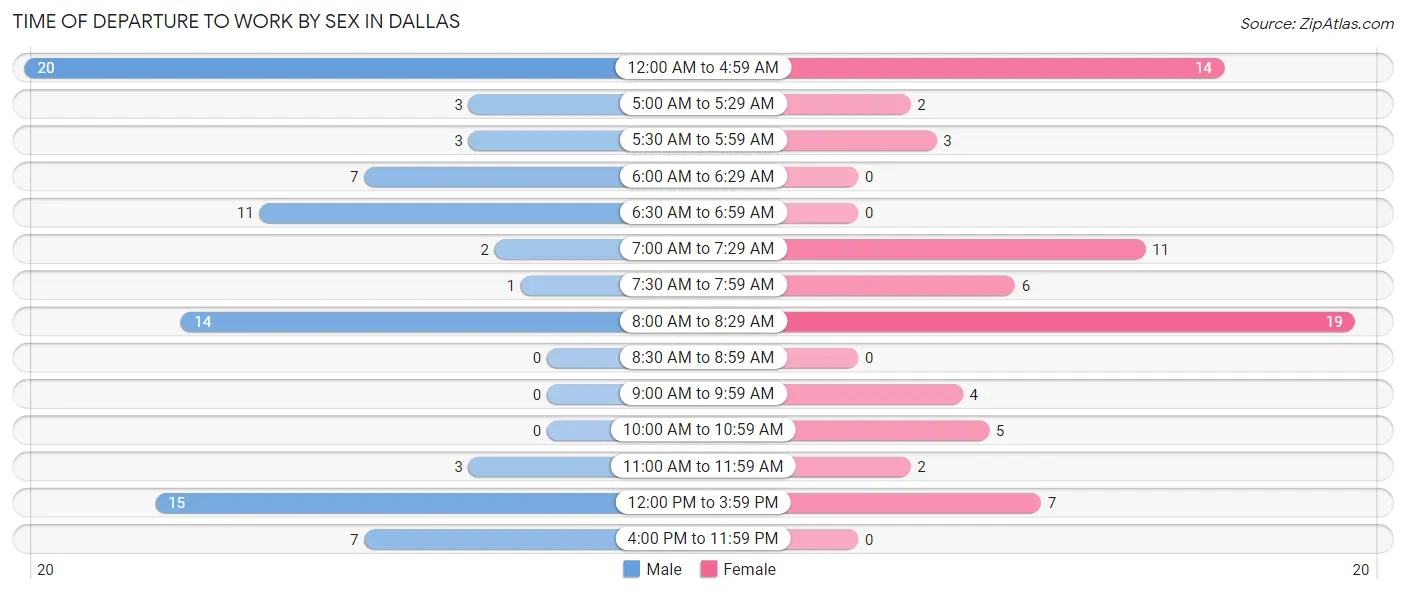
| Time of Departure | Male | Female |
| 12:00 AM to 4:59 AM | 20 (23.3%) | 14 (19.2%) |
| 5:00 AM to 5:29 AM | 3 (3.5%) | 2 (2.7%) |
| 5:30 AM to 5:59 AM | 3 (3.5%) | 3 (4.1%) |
| 6:00 AM to 6:29 AM | 7 (8.1%) | 0 (0.0%) |
| 6:30 AM to 6:59 AM | 11 (12.8%) | 0 (0.0%) |
| 7:00 AM to 7:29 AM | 2 (2.3%) | 11 (15.1%) |
| 7:30 AM to 7:59 AM | 1 (1.2%) | 6 (8.2%) |
| 8:00 AM to 8:29 AM | 14 (16.3%) | 19 (26.0%) |
| 8:30 AM to 8:59 AM | 0 (0.0%) | 0 (0.0%) |
| 9:00 AM to 9:59 AM | 0 (0.0%) | 4 (5.5%) |
| 10:00 AM to 10:59 AM | 0 (0.0%) | 5 (6.9%) |
| 11:00 AM to 11:59 AM | 3 (3.5%) | 2 (2.7%) |
| 12:00 PM to 3:59 PM | 15 (17.4%) | 7 (9.6%) |
| 4:00 PM to 11:59 PM | 7 (8.1%) | 0 (0.0%) |
| Total | 86 (100.0%) | 73 (100.0%) |
Housing Occupancy in Dallas
Occupancy by Ownership in Dallas
Of the total 136 dwellings in Dallas, owner-occupied units account for 104 (76.5%), while renter-occupied units make up 32 (23.5%).
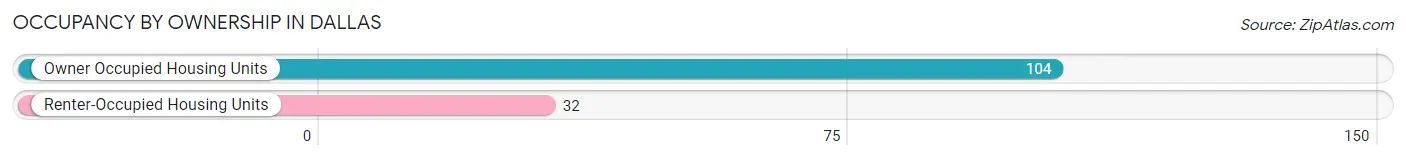
| Occupancy | # Housing Units | % Housing Units |
| Owner Occupied Housing Units | 104 | 76.5% |
| Renter-Occupied Housing Units | 32 | 23.5% |
| Total Occupied Housing Units | 136 | 100.0% |
Occupancy by Household Size in Dallas
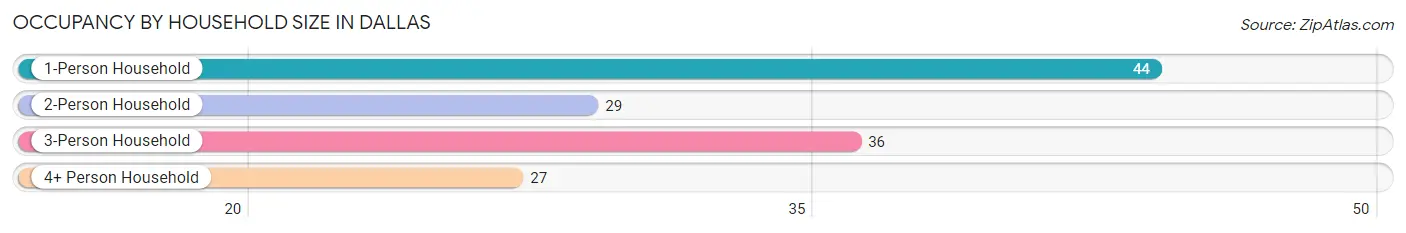
| Household Size | # Housing Units | % Housing Units |
| 1-Person Household | 44 | 32.4% |
| 2-Person Household | 29 | 21.3% |
| 3-Person Household | 36 | 26.5% |
| 4+ Person Household | 27 | 19.9% |
| Total Housing Units | 136 | 100.0% |
Occupancy by Ownership by Household Size in Dallas
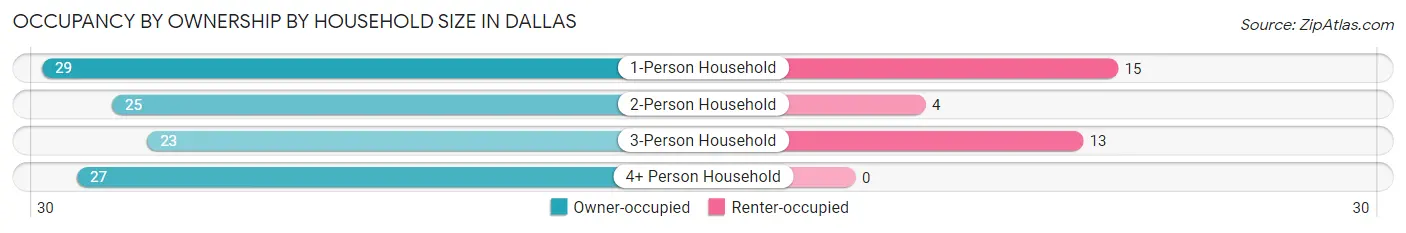
| Household Size | Owner-occupied | Renter-occupied |
| 1-Person Household | 29 (65.9%) | 15 (34.1%) |
| 2-Person Household | 25 (86.2%) | 4 (13.8%) |
| 3-Person Household | 23 (63.9%) | 13 (36.1%) |
| 4+ Person Household | 27 (100.0%) | 0 (0.0%) |
| Total Housing Units | 104 (76.5%) | 32 (23.5%) |
Occupancy by Educational Attainment in Dallas
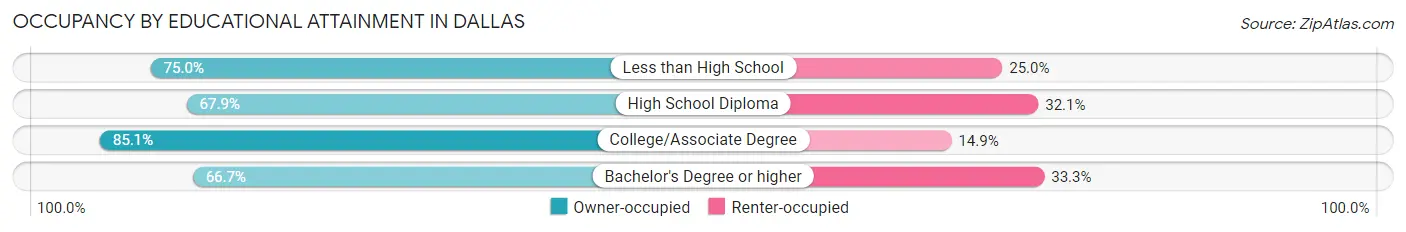
| Household Size | Owner-occupied | Renter-occupied |
| Less than High School | 3 (75.0%) | 1 (25.0%) |
| High School Diploma | 38 (67.9%) | 18 (32.1%) |
| College/Associate Degree | 57 (85.1%) | 10 (14.9%) |
| Bachelor's Degree or higher | 6 (66.7%) | 3 (33.3%) |
Occupancy by Age of Householder in Dallas
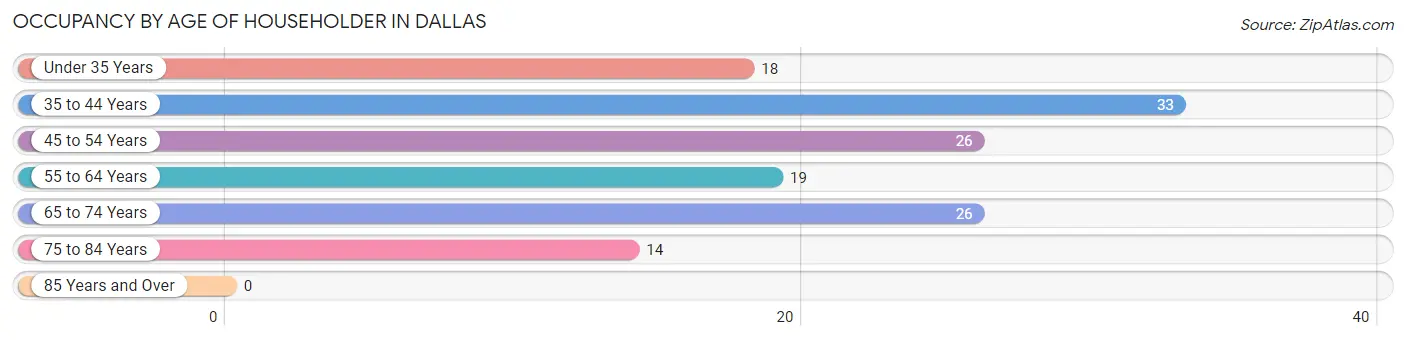
| Age Bracket | # Households | % Households |
| Under 35 Years | 18 | 13.2% |
| 35 to 44 Years | 33 | 24.3% |
| 45 to 54 Years | 26 | 19.1% |
| 55 to 64 Years | 19 | 14.0% |
| 65 to 74 Years | 26 | 19.1% |
| 75 to 84 Years | 14 | 10.3% |
| 85 Years and Over | 0 | 0.0% |
| Total | 136 | 100.0% |
Housing Finances in Dallas
Median Income by Occupancy in Dallas
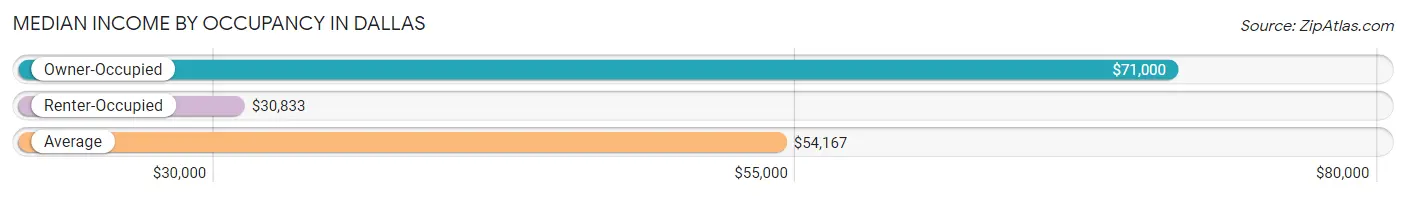
| Occupancy Type | # Households | Median Income |
| Owner-Occupied | 104 (76.5%) | $71,000 |
| Renter-Occupied | 32 (23.5%) | $30,833 |
| Average | 136 (100.0%) | $54,167 |
Occupancy by Householder Income Bracket in Dallas
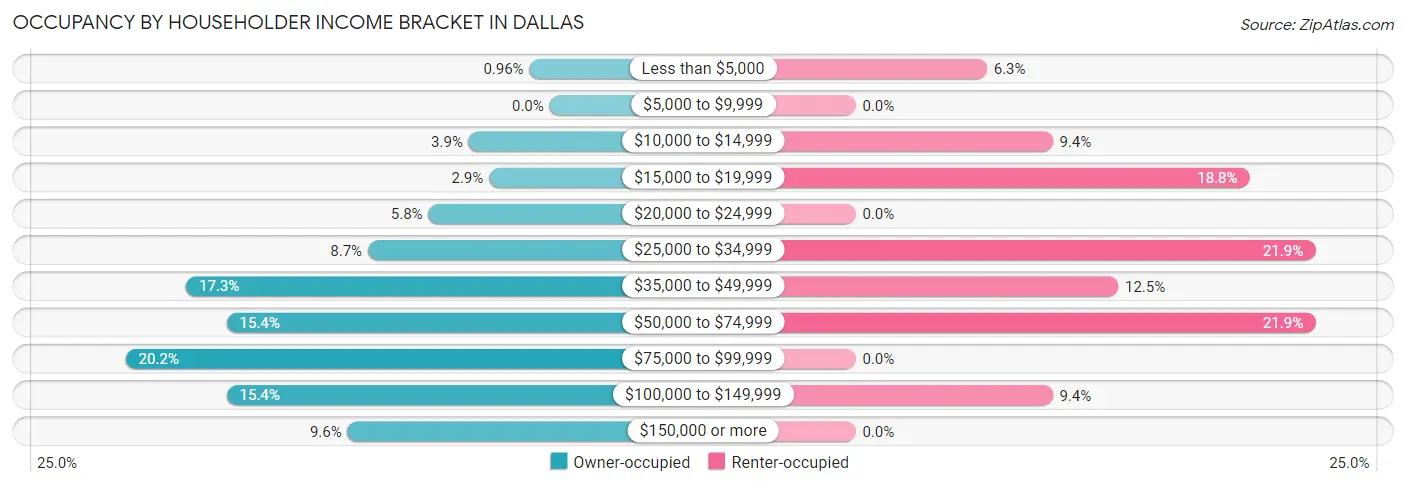
| Income Bracket | Owner-occupied | Renter-occupied |
| Less than $5,000 | 1 (1.0%) | 2 (6.2%) |
| $5,000 to $9,999 | 0 (0.0%) | 0 (0.0%) |
| $10,000 to $14,999 | 4 (3.8%) | 3 (9.4%) |
| $15,000 to $19,999 | 3 (2.9%) | 6 (18.8%) |
| $20,000 to $24,999 | 6 (5.8%) | 0 (0.0%) |
| $25,000 to $34,999 | 9 (8.6%) | 7 (21.9%) |
| $35,000 to $49,999 | 18 (17.3%) | 4 (12.5%) |
| $50,000 to $74,999 | 16 (15.4%) | 7 (21.9%) |
| $75,000 to $99,999 | 21 (20.2%) | 0 (0.0%) |
| $100,000 to $149,999 | 16 (15.4%) | 3 (9.4%) |
| $150,000 or more | 10 (9.6%) | 0 (0.0%) |
| Total | 104 (100.0%) | 32 (100.0%) |
Monthly Housing Cost Tiers in Dallas
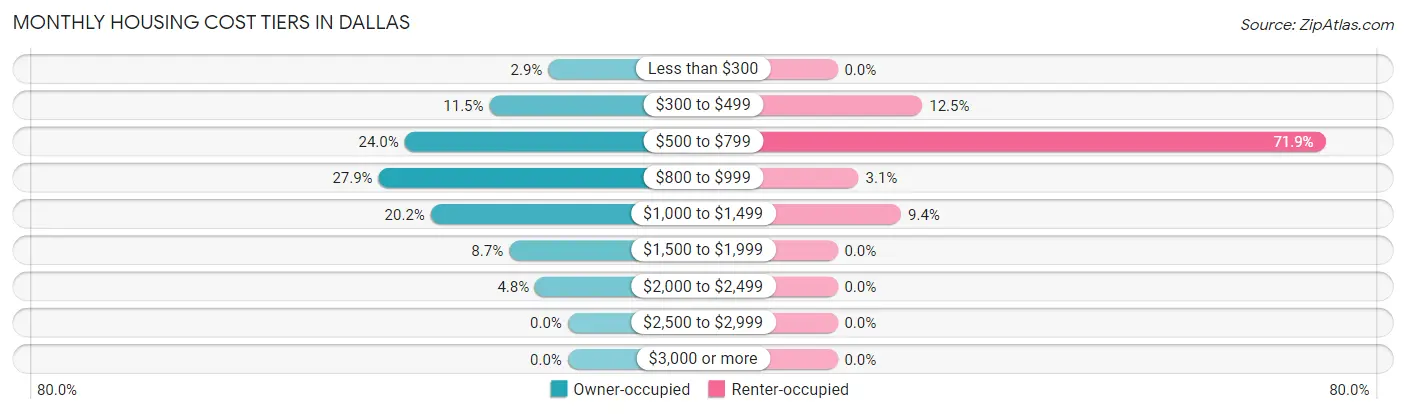
| Monthly Cost | Owner-occupied | Renter-occupied |
| Less than $300 | 3 (2.9%) | 0 (0.0%) |
| $300 to $499 | 12 (11.5%) | 4 (12.5%) |
| $500 to $799 | 25 (24.0%) | 23 (71.9%) |
| $800 to $999 | 29 (27.9%) | 1 (3.1%) |
| $1,000 to $1,499 | 21 (20.2%) | 3 (9.4%) |
| $1,500 to $1,999 | 9 (8.6%) | 0 (0.0%) |
| $2,000 to $2,499 | 5 (4.8%) | 0 (0.0%) |
| $2,500 to $2,999 | 0 (0.0%) | 0 (0.0%) |
| $3,000 or more | 0 (0.0%) | 0 (0.0%) |
| Total | 104 (100.0%) | 32 (100.0%) |
Physical Housing Characteristics in Dallas
Housing Structures in Dallas
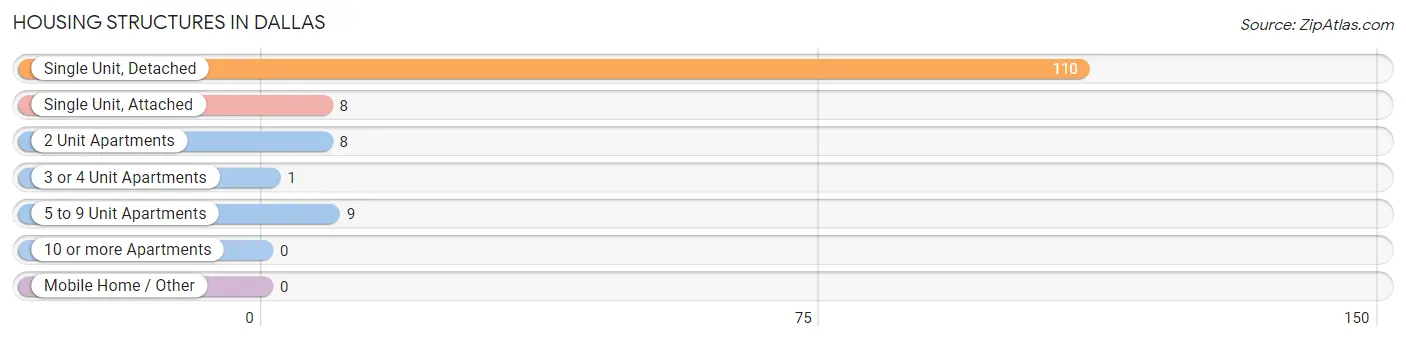
| Structure Type | # Housing Units | % Housing Units |
| Single Unit, Detached | 110 | 80.9% |
| Single Unit, Attached | 8 | 5.9% |
| 2 Unit Apartments | 8 | 5.9% |
| 3 or 4 Unit Apartments | 1 | 0.7% |
| 5 to 9 Unit Apartments | 9 | 6.6% |
| 10 or more Apartments | 0 | 0.0% |
| Mobile Home / Other | 0 | 0.0% |
| Total | 136 | 100.0% |
Housing Structures by Occupancy in Dallas
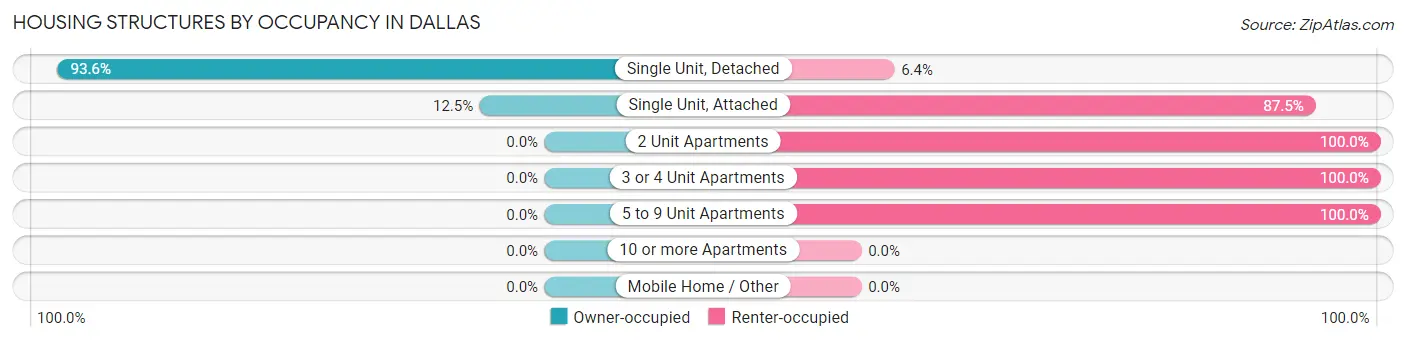
| Structure Type | Owner-occupied | Renter-occupied |
| Single Unit, Detached | 103 (93.6%) | 7 (6.4%) |
| Single Unit, Attached | 1 (12.5%) | 7 (87.5%) |
| 2 Unit Apartments | 0 (0.0%) | 8 (100.0%) |
| 3 or 4 Unit Apartments | 0 (0.0%) | 1 (100.0%) |
| 5 to 9 Unit Apartments | 0 (0.0%) | 9 (100.0%) |
| 10 or more Apartments | 0 (0.0%) | 0 (0.0%) |
| Mobile Home / Other | 0 (0.0%) | 0 (0.0%) |
| Total | 104 (76.5%) | 32 (23.5%) |
Housing Structures by Number of Rooms in Dallas
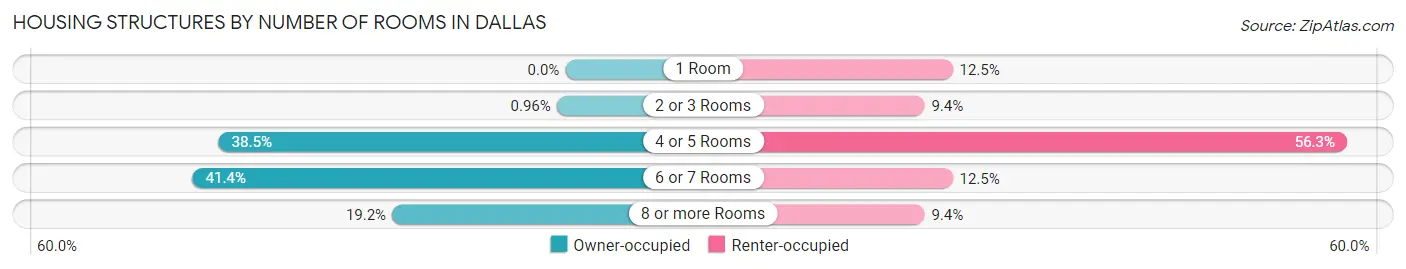
| Number of Rooms | Owner-occupied | Renter-occupied |
| 1 Room | 0 (0.0%) | 4 (12.5%) |
| 2 or 3 Rooms | 1 (1.0%) | 3 (9.4%) |
| 4 or 5 Rooms | 40 (38.5%) | 18 (56.2%) |
| 6 or 7 Rooms | 43 (41.3%) | 4 (12.5%) |
| 8 or more Rooms | 20 (19.2%) | 3 (9.4%) |
| Total | 104 (100.0%) | 32 (100.0%) |
Housing Structure by Heating Type in Dallas
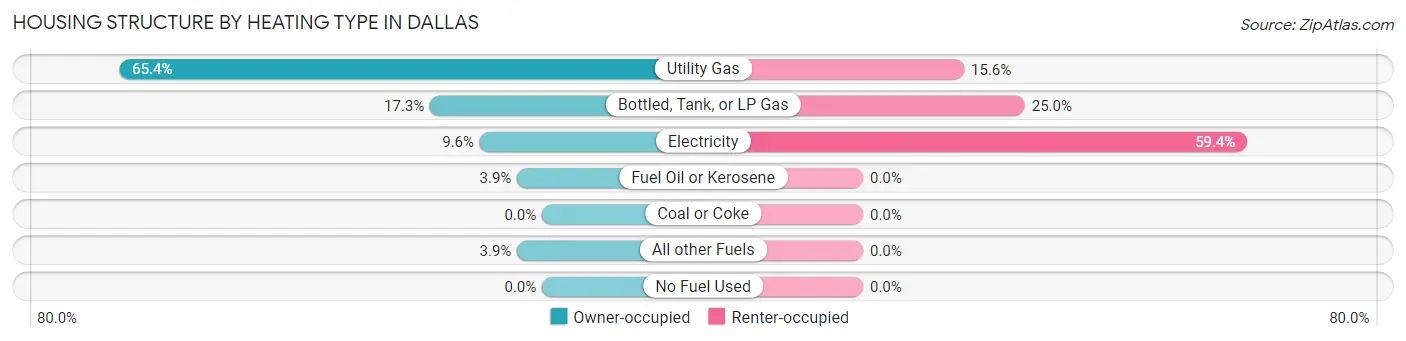
| Heating Type | Owner-occupied | Renter-occupied |
| Utility Gas | 68 (65.4%) | 5 (15.6%) |
| Bottled, Tank, or LP Gas | 18 (17.3%) | 8 (25.0%) |
| Electricity | 10 (9.6%) | 19 (59.4%) |
| Fuel Oil or Kerosene | 4 (3.8%) | 0 (0.0%) |
| Coal or Coke | 0 (0.0%) | 0 (0.0%) |
| All other Fuels | 4 (3.8%) | 0 (0.0%) |
| No Fuel Used | 0 (0.0%) | 0 (0.0%) |
| Total | 104 (100.0%) | 32 (100.0%) |
Household Vehicle Usage in Dallas
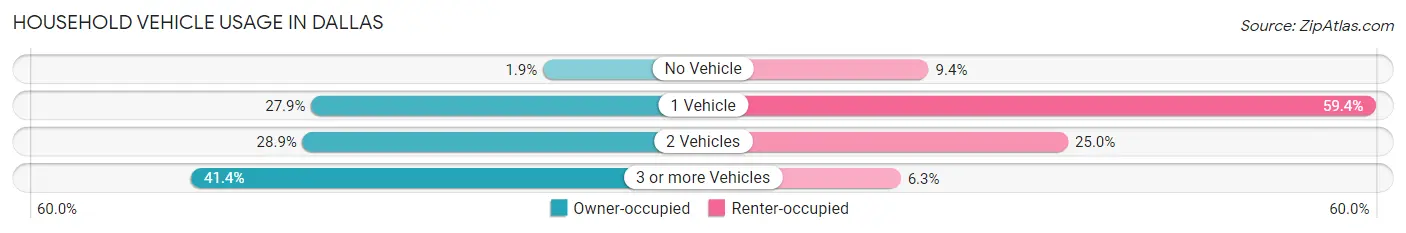
| Vehicles per Household | Owner-occupied | Renter-occupied |
| No Vehicle | 2 (1.9%) | 3 (9.4%) |
| 1 Vehicle | 29 (27.9%) | 19 (59.4%) |
| 2 Vehicles | 30 (28.8%) | 8 (25.0%) |
| 3 or more Vehicles | 43 (41.3%) | 2 (6.2%) |
| Total | 104 (100.0%) | 32 (100.0%) |
Real Estate & Mortgages in Dallas
Real Estate and Mortgage Overview in Dallas
| Characteristic | Without Mortgage | With Mortgage |
| Housing Units | 26 | 78 |
| Median Property Value | $118,200 | $109,700 |
| Median Household Income | $43,125 | $10 |
| Monthly Housing Costs | $488 | $0 |
| Real Estate Taxes | $1,667 | $0 |
Property Value by Mortgage Status in Dallas
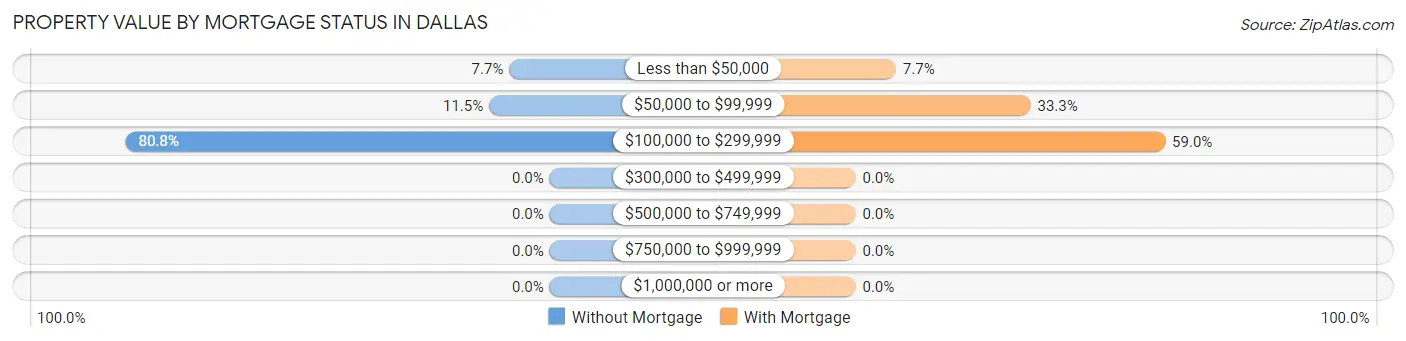
| Property Value | Without Mortgage | With Mortgage |
| Less than $50,000 | 2 (7.7%) | 6 (7.7%) |
| $50,000 to $99,999 | 3 (11.5%) | 26 (33.3%) |
| $100,000 to $299,999 | 21 (80.8%) | 46 (59.0%) |
| $300,000 to $499,999 | 0 (0.0%) | 0 (0.0%) |
| $500,000 to $749,999 | 0 (0.0%) | 0 (0.0%) |
| $750,000 to $999,999 | 0 (0.0%) | 0 (0.0%) |
| $1,000,000 or more | 0 (0.0%) | 0 (0.0%) |
| Total | 26 (100.0%) | 78 (100.0%) |
Household Income by Mortgage Status in Dallas
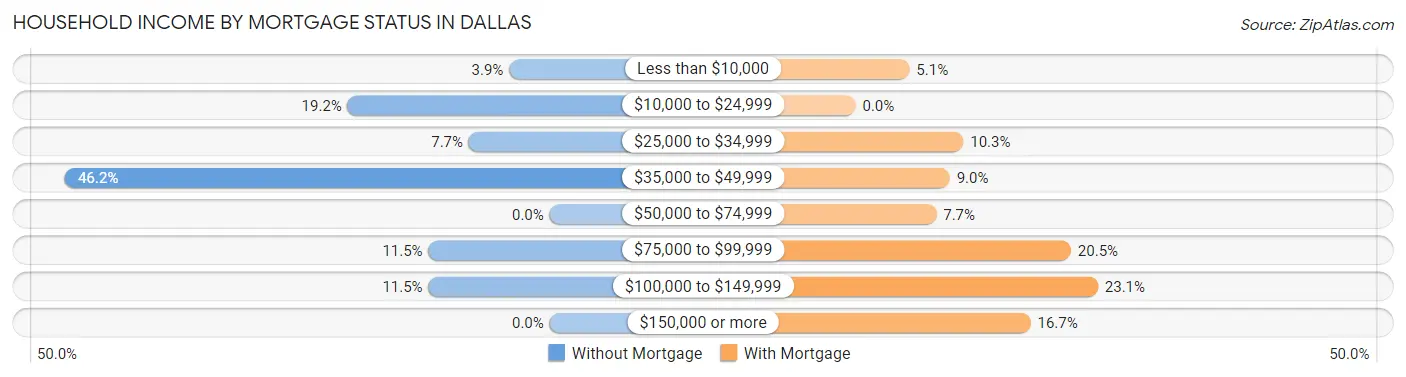
| Household Income | Without Mortgage | With Mortgage |
| Less than $10,000 | 1 (3.8%) | 4 (5.1%) |
| $10,000 to $24,999 | 5 (19.2%) | 0 (0.0%) |
| $25,000 to $34,999 | 2 (7.7%) | 8 (10.3%) |
| $35,000 to $49,999 | 12 (46.2%) | 7 (9.0%) |
| $50,000 to $74,999 | 0 (0.0%) | 6 (7.7%) |
| $75,000 to $99,999 | 3 (11.5%) | 16 (20.5%) |
| $100,000 to $149,999 | 3 (11.5%) | 18 (23.1%) |
| $150,000 or more | 0 (0.0%) | 13 (16.7%) |
| Total | 26 (100.0%) | 78 (100.0%) |
Property Value to Household Income Ratio in Dallas
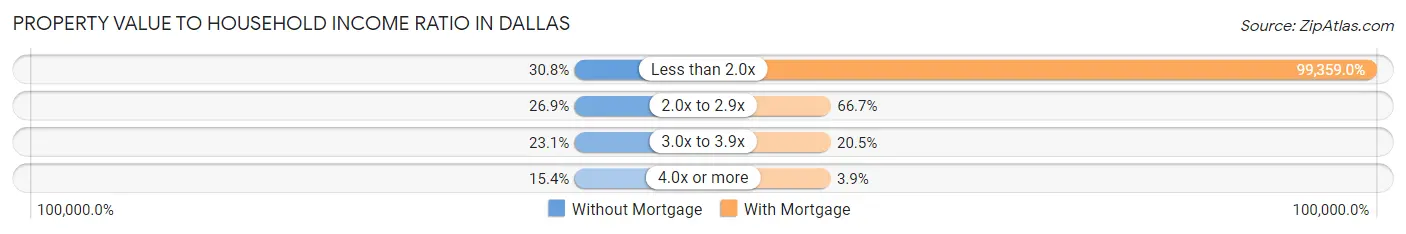
| Value-to-Income Ratio | Without Mortgage | With Mortgage |
| Less than 2.0x | 8 (30.8%) | 77,500 (99,359.0%) |
| 2.0x to 2.9x | 7 (26.9%) | 52 (66.7%) |
| 3.0x to 3.9x | 6 (23.1%) | 16 (20.5%) |
| 4.0x or more | 4 (15.4%) | 3 (3.8%) |
| Total | 26 (100.0%) | 78 (100.0%) |
Real Estate Taxes by Mortgage Status in Dallas
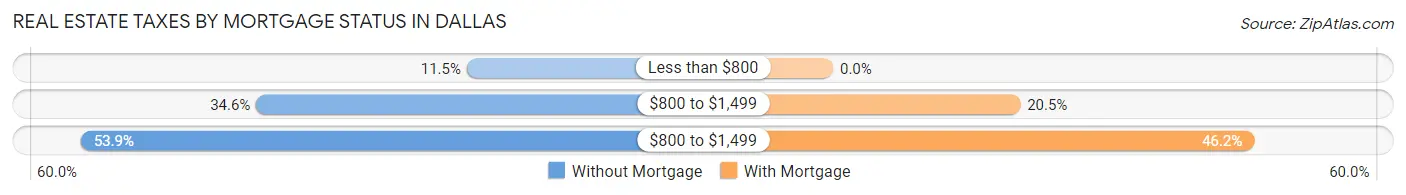
| Property Taxes | Without Mortgage | With Mortgage |
| Less than $800 | 3 (11.5%) | 0 (0.0%) |
| $800 to $1,499 | 9 (34.6%) | 16 (20.5%) |
| $800 to $1,499 | 14 (53.8%) | 36 (46.2%) |
| Total | 26 (100.0%) | 78 (100.0%) |
Health & Disability in Dallas
Health Insurance Coverage by Age in Dallas
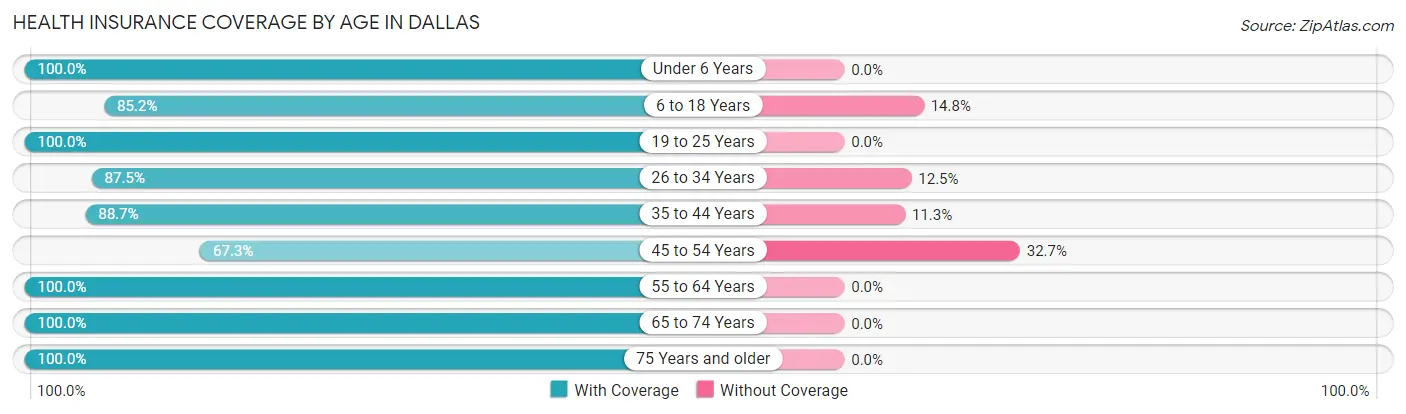
| Age Bracket | With Coverage | Without Coverage |
| Under 6 Years | 26 (100.0%) | 0 (0.0%) |
| 6 to 18 Years | 46 (85.2%) | 8 (14.8%) |
| 19 to 25 Years | 25 (100.0%) | 0 (0.0%) |
| 26 to 34 Years | 42 (87.5%) | 6 (12.5%) |
| 35 to 44 Years | 47 (88.7%) | 6 (11.3%) |
| 45 to 54 Years | 37 (67.3%) | 18 (32.7%) |
| 55 to 64 Years | 31 (100.0%) | 0 (0.0%) |
| 65 to 74 Years | 48 (100.0%) | 0 (0.0%) |
| 75 Years and older | 18 (100.0%) | 0 (0.0%) |
| Total | 320 (89.4%) | 38 (10.6%) |
Health Insurance Coverage by Citizenship Status in Dallas
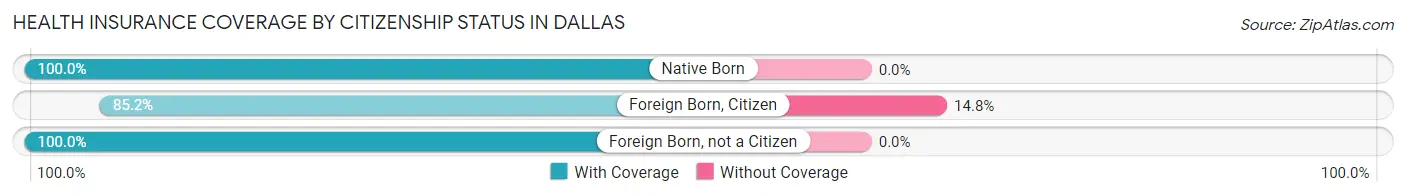
| Citizenship Status | With Coverage | Without Coverage |
| Native Born | 26 (100.0%) | 0 (0.0%) |
| Foreign Born, Citizen | 46 (85.2%) | 8 (14.8%) |
| Foreign Born, not a Citizen | 25 (100.0%) | 0 (0.0%) |
Health Insurance Coverage by Household Income in Dallas
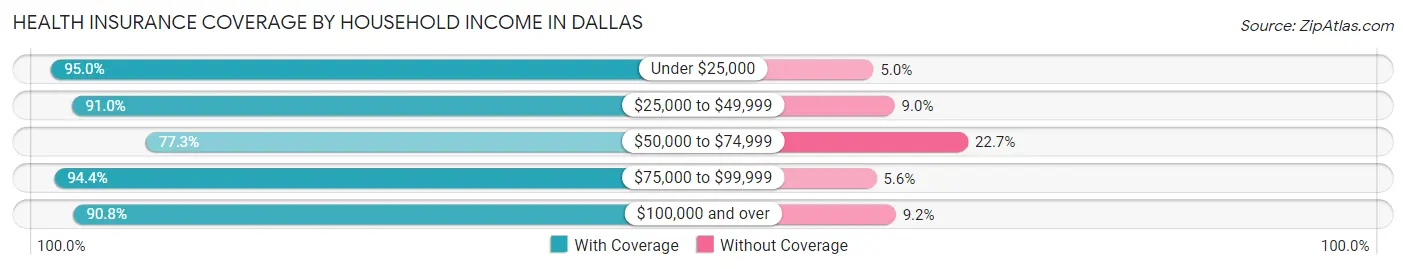
| Household Income | With Coverage | Without Coverage |
| Under $25,000 | 38 (95.0%) | 2 (5.0%) |
| $25,000 to $49,999 | 71 (91.0%) | 7 (9.0%) |
| $50,000 to $74,999 | 51 (77.3%) | 15 (22.7%) |
| $75,000 to $99,999 | 51 (94.4%) | 3 (5.6%) |
| $100,000 and over | 109 (90.8%) | 11 (9.2%) |
Public vs Private Health Insurance Coverage by Age in Dallas
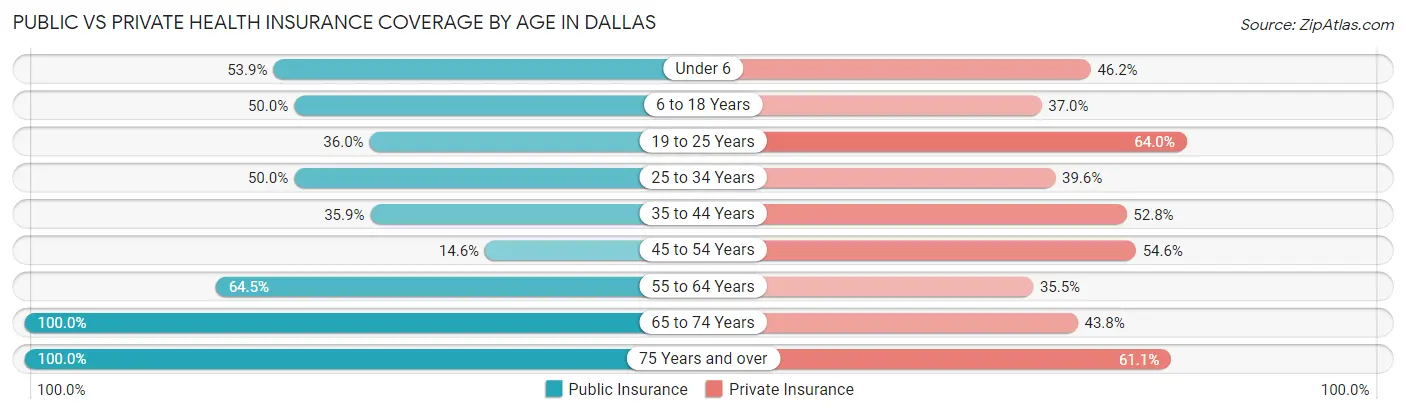
| Age Bracket | Public Insurance | Private Insurance |
| Under 6 | 14 (53.8%) | 12 (46.2%) |
| 6 to 18 Years | 27 (50.0%) | 20 (37.0%) |
| 19 to 25 Years | 9 (36.0%) | 16 (64.0%) |
| 25 to 34 Years | 24 (50.0%) | 19 (39.6%) |
| 35 to 44 Years | 19 (35.8%) | 28 (52.8%) |
| 45 to 54 Years | 8 (14.5%) | 30 (54.5%) |
| 55 to 64 Years | 20 (64.5%) | 11 (35.5%) |
| 65 to 74 Years | 48 (100.0%) | 21 (43.8%) |
| 75 Years and over | 18 (100.0%) | 11 (61.1%) |
| Total | 187 (52.2%) | 168 (46.9%) |
Disability Status by Sex by Age in Dallas
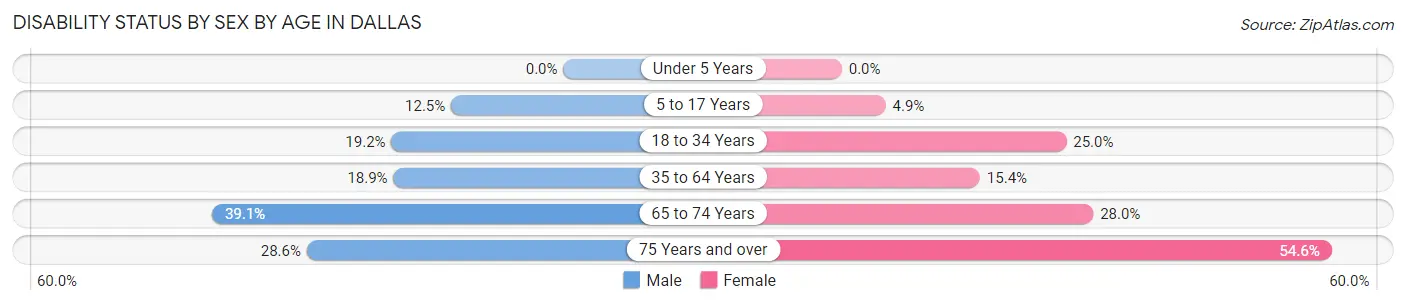
| Age Bracket | Male | Female |
| Under 5 Years | 0 (0.0%) | 0 (0.0%) |
| 5 to 17 Years | 2 (12.5%) | 2 (4.9%) |
| 18 to 34 Years | 9 (19.2%) | 7 (25.0%) |
| 35 to 64 Years | 14 (18.9%) | 10 (15.4%) |
| 65 to 74 Years | 9 (39.1%) | 7 (28.0%) |
| 75 Years and over | 2 (28.6%) | 6 (54.5%) |
Disability Class by Sex by Age in Dallas
Disability Class: Hearing Difficulty
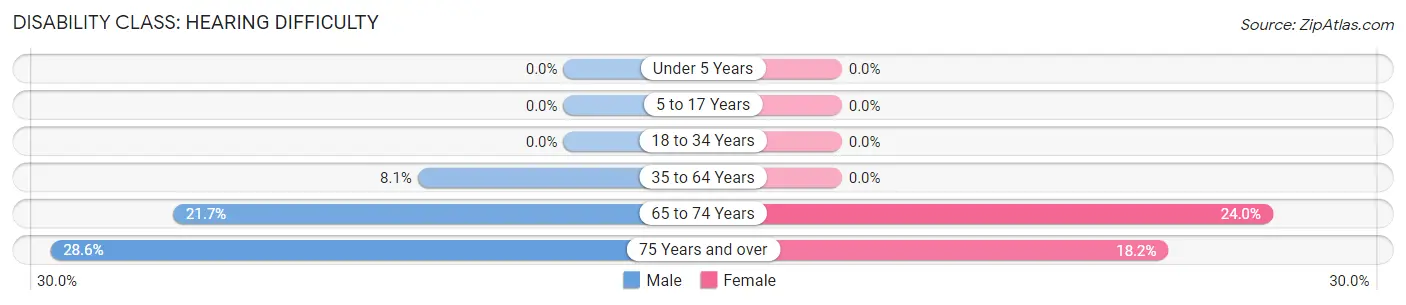
| Age Bracket | Male | Female |
| Under 5 Years | 0 (0.0%) | 0 (0.0%) |
| 5 to 17 Years | 0 (0.0%) | 0 (0.0%) |
| 18 to 34 Years | 0 (0.0%) | 0 (0.0%) |
| 35 to 64 Years | 6 (8.1%) | 0 (0.0%) |
| 65 to 74 Years | 5 (21.7%) | 6 (24.0%) |
| 75 Years and over | 2 (28.6%) | 2 (18.2%) |
Disability Class: Vision Difficulty
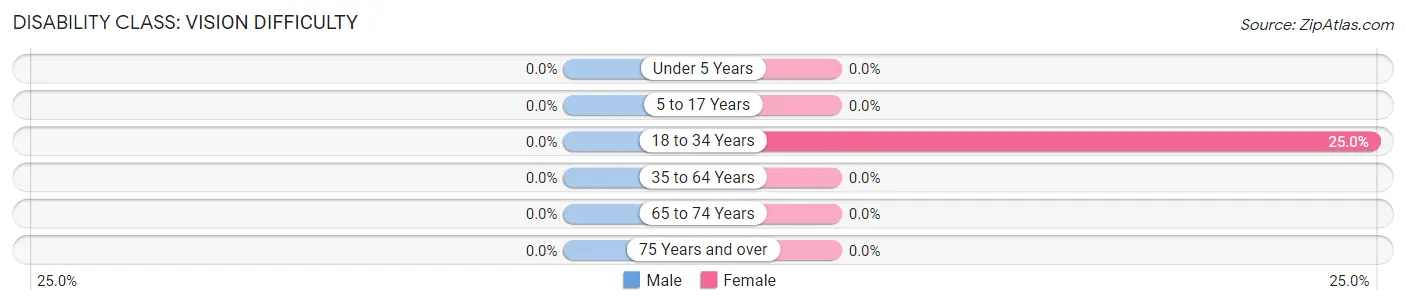
| Age Bracket | Male | Female |
| Under 5 Years | 0 (0.0%) | 0 (0.0%) |
| 5 to 17 Years | 0 (0.0%) | 0 (0.0%) |
| 18 to 34 Years | 0 (0.0%) | 7 (25.0%) |
| 35 to 64 Years | 0 (0.0%) | 0 (0.0%) |
| 65 to 74 Years | 0 (0.0%) | 0 (0.0%) |
| 75 Years and over | 0 (0.0%) | 0 (0.0%) |
Disability Class: Cognitive Difficulty
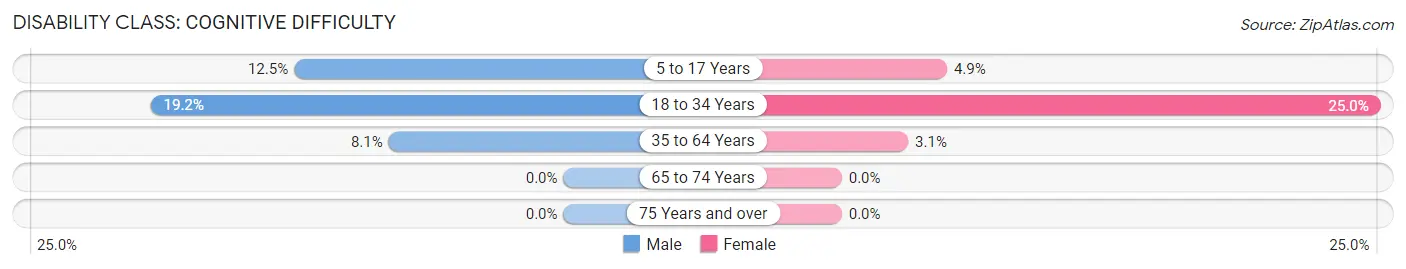
| Age Bracket | Male | Female |
| 5 to 17 Years | 2 (12.5%) | 2 (4.9%) |
| 18 to 34 Years | 9 (19.2%) | 7 (25.0%) |
| 35 to 64 Years | 6 (8.1%) | 2 (3.1%) |
| 65 to 74 Years | 0 (0.0%) | 0 (0.0%) |
| 75 Years and over | 0 (0.0%) | 0 (0.0%) |
Disability Class: Ambulatory Difficulty
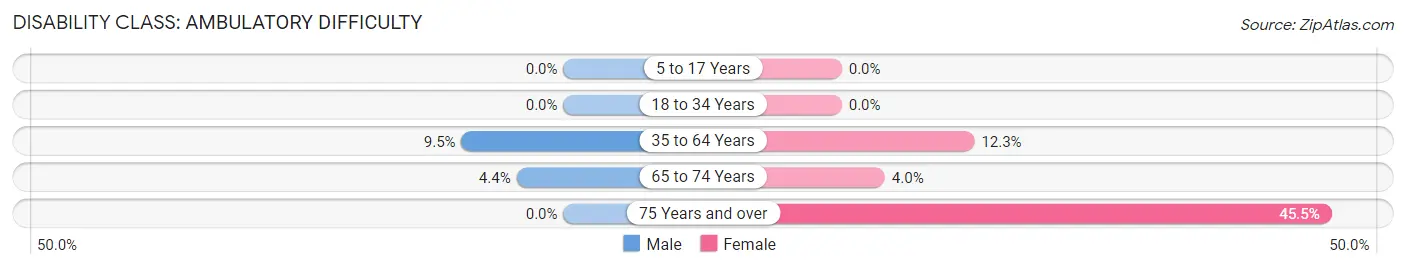
| Age Bracket | Male | Female |
| 5 to 17 Years | 0 (0.0%) | 0 (0.0%) |
| 18 to 34 Years | 0 (0.0%) | 0 (0.0%) |
| 35 to 64 Years | 7 (9.5%) | 8 (12.3%) |
| 65 to 74 Years | 1 (4.3%) | 1 (4.0%) |
| 75 Years and over | 0 (0.0%) | 5 (45.5%) |
Disability Class: Self-Care Difficulty
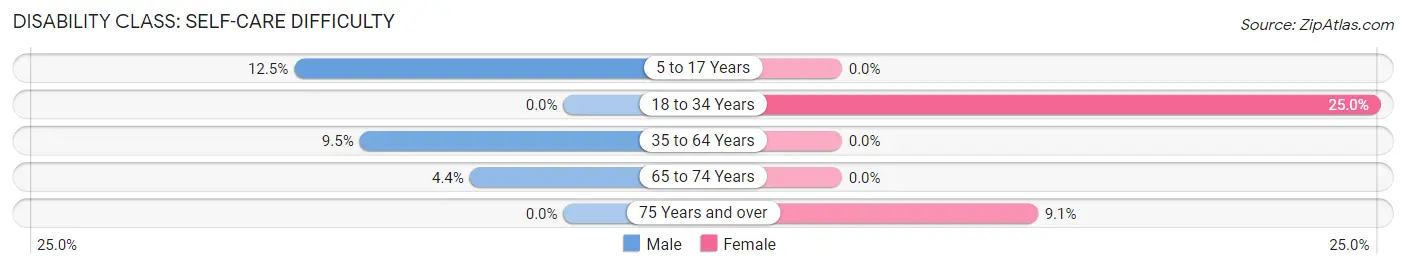
| Age Bracket | Male | Female |
| 5 to 17 Years | 2 (12.5%) | 0 (0.0%) |
| 18 to 34 Years | 0 (0.0%) | 7 (25.0%) |
| 35 to 64 Years | 7 (9.5%) | 0 (0.0%) |
| 65 to 74 Years | 1 (4.3%) | 0 (0.0%) |
| 75 Years and over | 0 (0.0%) | 1 (9.1%) |
Technology Access in Dallas
Computing Device Access in Dallas
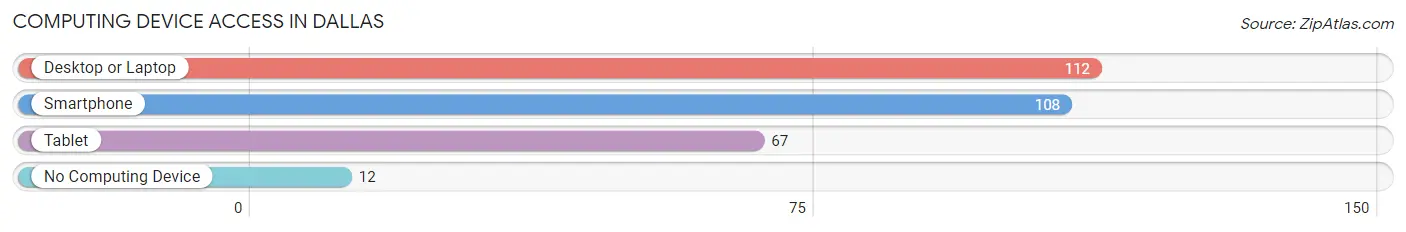
| Device Type | # Households | % Households |
| Desktop or Laptop | 112 | 82.4% |
| Smartphone | 108 | 79.4% |
| Tablet | 67 | 49.3% |
| No Computing Device | 12 | 8.8% |
| Total | 136 | 100.0% |
Internet Access in Dallas
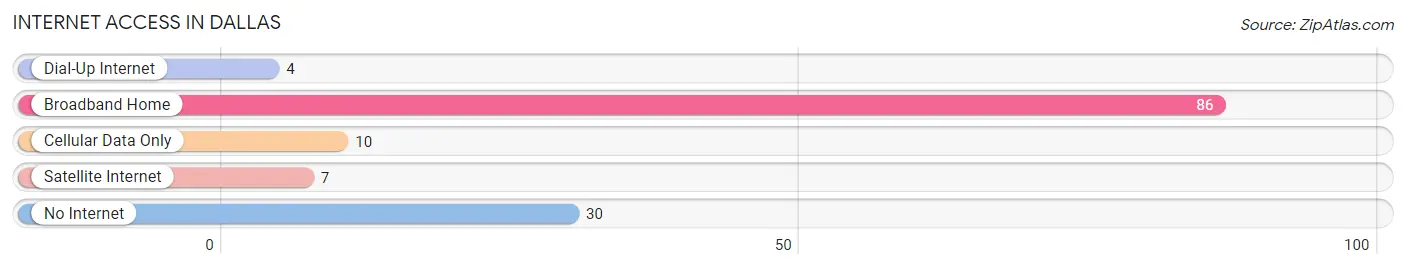
| Internet Type | # Households | % Households |
| Dial-Up Internet | 4 | 2.9% |
| Broadband Home | 86 | 63.2% |
| Cellular Data Only | 10 | 7.3% |
| Satellite Internet | 7 | 5.1% |
| No Internet | 30 | 22.1% |
| Total | 136 | 100.0% |
Dallas Summary
Dallas, Wisconsin is a small town located in Barron County, Wisconsin. It is situated on the banks of the Red Cedar River and is part of the Chippewa Valley region. The town was founded in 1856 and has a population of approximately 1,000 people.
Geography
Dallas is located in the northwest corner of Barron County, Wisconsin. It is situated on the banks of the Red Cedar River and is part of the Chippewa Valley region. The town is surrounded by rolling hills and is home to a variety of wildlife. The town is located approximately 30 miles from Eau Claire, Wisconsin and is about an hour and a half drive from Minneapolis, Minnesota.
The town of Dallas is located in a temperate climate zone and experiences four distinct seasons. Summers are warm and humid, while winters are cold and snowy. The average temperature in the summer is around 70 degrees Fahrenheit and the average temperature in the winter is around 20 degrees Fahrenheit.
Economy
The economy of Dallas is largely based on agriculture and tourism. The town is home to several dairy farms and is known for its production of cheese. The town also has a number of small businesses, including restaurants, retail stores, and service providers.
Tourism is also an important part of the economy of Dallas. The town is home to several parks and recreational areas, including the Red Cedar River State Park. The town also hosts a number of festivals and events throughout the year, including the Dallas Days Festival and the Dallas County Fair.
Demographics
As of the 2010 census, the population of Dallas was 1,000 people. The racial makeup of the town was 97.2% White, 0.3% African American, 0.2% Native American, 0.2% Asian, 0.1% Pacific Islander, 0.7% from other races, and 1.3% from two or more races. Hispanic or Latino of any race were 1.3% of the population.
The median income for a household in Dallas was $41,250, and the median income for a family was $50,000. The per capita income for the town was $20,845. About 8.2% of families and 10.2% of the population were below the poverty line, including 14.3% of those under age 18 and 6.7% of those age 65 or over.
History
The town of Dallas was founded in 1856 by settlers from New York. The town was named after George Mifflin Dallas, the 11th Vice President of the United States. The town was originally a farming community and was known for its production of cheese.
In the late 19th century, the town began to experience a period of growth and development. The town was home to several businesses, including a sawmill, a grist mill, and a cheese factory. The town also had a number of churches and schools.
In the early 20th century, the town experienced a period of decline. The sawmill and grist mill closed and the cheese factory moved to a larger city. The town also experienced a population decline as people moved away in search of better economic opportunities.
In recent years, the town has experienced a period of revitalization. The town has seen an influx of new businesses and residents, and the population has grown. The town is now home to a variety of businesses, including restaurants, retail stores, and service providers. The town also hosts a number of festivals and events throughout the year, including the Dallas Days Festival and the Dallas County Fair.
Common Questions
What is Per Capita Income in Dallas?
Per Capita income in Dallas is $26,613.
What is the Median Family Income in Dallas?
Median Family Income in Dallas is $70,500.
What is the Median Household income in Dallas?
Median Household Income in Dallas is $54,167.
What is Income or Wage Gap in Dallas?
Income or Wage Gap in Dallas is 40.7%.
Women in Dallas earn 59.3 cents for every dollar earned by a man.
What is Inequality or Gini Index in Dallas?
Inequality or Gini Index in Dallas is 0.38.
What is the Total Population of Dallas?
Total Population of Dallas is 379.
What is the Total Male Population of Dallas?
Total Male Population of Dallas is 187.
What is the Total Female Population of Dallas?
Total Female Population of Dallas is 192.
What is the Ratio of Males per 100 Females in Dallas?
There are 97.40 Males per 100 Females in Dallas.
What is the Ratio of Females per 100 Males in Dallas?
There are 102.67 Females per 100 Males in Dallas.
What is the Median Population Age in Dallas?
Median Population Age in Dallas is 41.9 Years.
What is the Average Family Size in Dallas
Average Family Size in Dallas is 3.4 People.
What is the Average Household Size in Dallas
Average Household Size in Dallas is 2.6 People.
How Large is the Labor Force in Dallas?
There are 185 People in the Labor Forcein in Dallas.
What is the Percentage of People in the Labor Force in Dallas?
58.5% of People are in the Labor Force in Dallas.
What is the Unemployment Rate in Dallas?
Unemployment Rate in Dallas is 4.3%.