Crandon, WI Map & Demographics
Crandon Map
Crandon Overview
$28,297
PER CAPITA INCOME
$54,471
AVG FAMILY INCOME
$47,083
AVG HOUSEHOLD INCOME
29.0%
WAGE / INCOME GAP [ % ]
71.0¢/ $1
WAGE / INCOME GAP [ $ ]
0.43
INEQUALITY / GINI INDEX
1,519
TOTAL POPULATION
769
MALE POPULATION
750
FEMALE POPULATION
102.53
MALES / 100 FEMALES
97.53
FEMALES / 100 MALES
42.3
MEDIAN AGE
2.7
AVG FAMILY SIZE
2.1
AVG HOUSEHOLD SIZE
762
LABOR FORCE [ PEOPLE ]
58.0%
PERCENT IN LABOR FORCE
1.3%
UNEMPLOYMENT RATE
Crandon Zip Codes
Crandon Area Codes
Income in Crandon
Income Overview in Crandon
Per Capita Income in Crandon is $28,297, while median incomes of families and households are $54,471 and $47,083 respectively.
| Characteristic | Number | Measure |
| Per Capita Income | 1,519 | $28,297 |
| Median Family Income | 379 | $54,471 |
| Mean Family Income | 379 | $68,897 |
| Median Household Income | 700 | $47,083 |
| Mean Household Income | 700 | $56,592 |
| Income Deficit | 379 | $0 |
| Wage / Income Gap (%) | 1,519 | 28.97% |
| Wage / Income Gap ($) | 1,519 | 71.03¢ per $1 |
| Gini / Inequality Index | 1,519 | 0.43 |
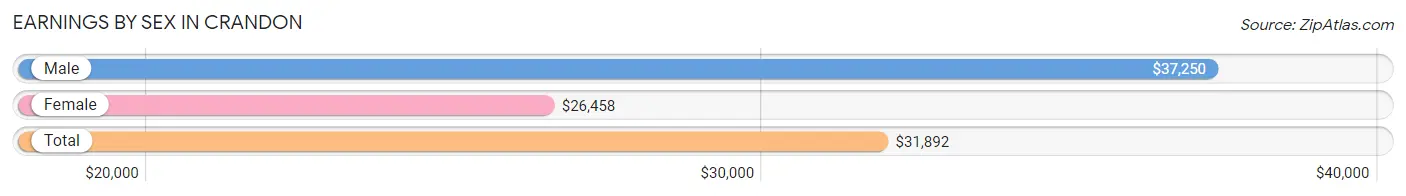
Earnings by Sex in Crandon
Average Earnings in Crandon are $31,892, $37,250 for men and $26,458 for women, a difference of 29.0%.
| Sex | Number | Average Earnings |
| Male | 474 (56.2%) | $37,250 |
| Female | 370 (43.8%) | $26,458 |
| Total | 844 (100.0%) | $31,892 |
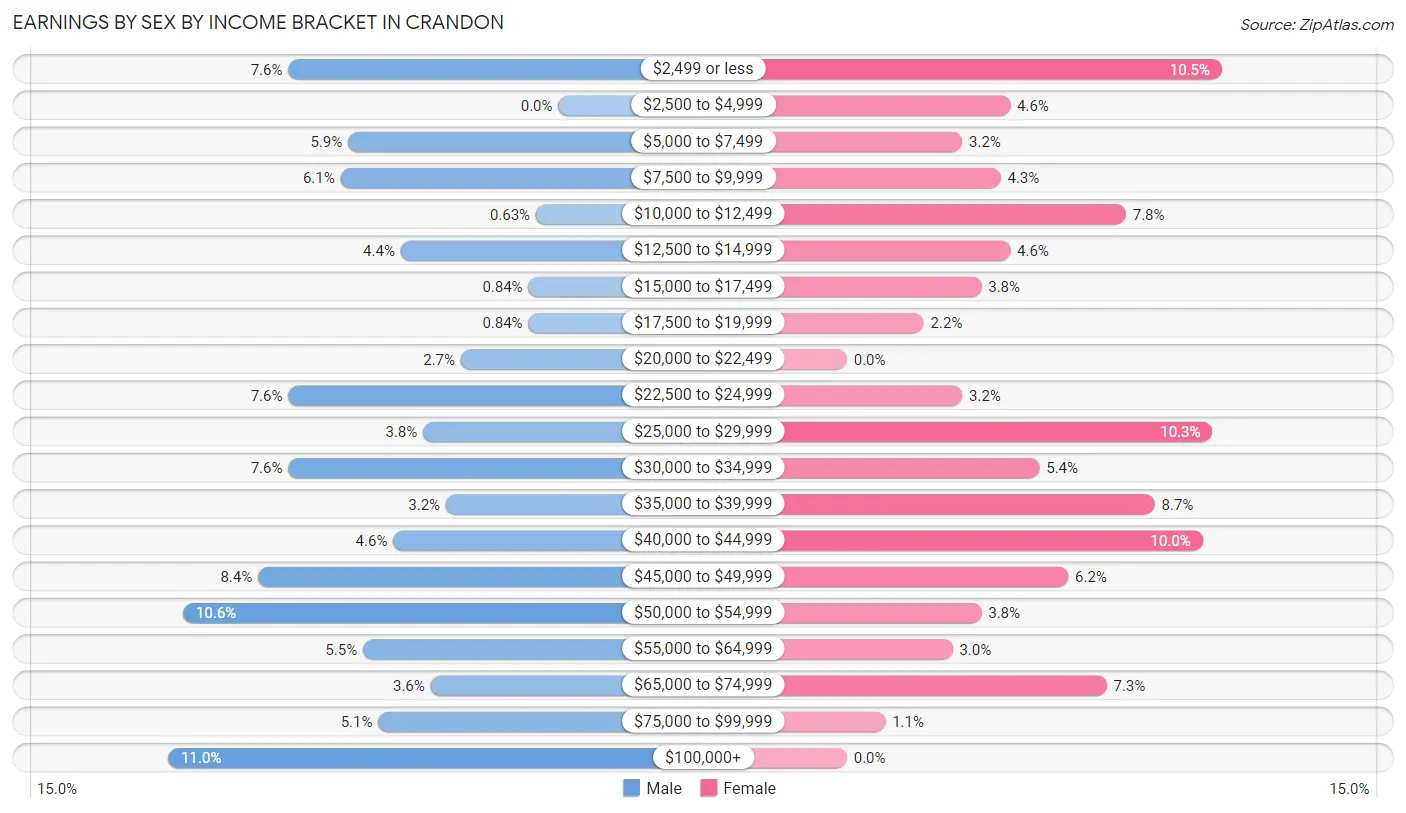
Earnings by Sex by Income Bracket in Crandon
The most common earnings brackets in Crandon are $100,000+ for men (52 | 11.0%) and $2,499 or less for women (39 | 10.5%).
| Income | Male | Female |
| $2,499 or less | 36 (7.6%) | 39 (10.5%) |
| $2,500 to $4,999 | 0 (0.0%) | 17 (4.6%) |
| $5,000 to $7,499 | 28 (5.9%) | 12 (3.2%) |
| $7,500 to $9,999 | 29 (6.1%) | 16 (4.3%) |
| $10,000 to $12,499 | 3 (0.6%) | 29 (7.8%) |
| $12,500 to $14,999 | 21 (4.4%) | 17 (4.6%) |
| $15,000 to $17,499 | 4 (0.8%) | 14 (3.8%) |
| $17,500 to $19,999 | 4 (0.8%) | 8 (2.2%) |
| $20,000 to $22,499 | 13 (2.7%) | 0 (0.0%) |
| $22,500 to $24,999 | 36 (7.6%) | 12 (3.2%) |
| $25,000 to $29,999 | 18 (3.8%) | 38 (10.3%) |
| $30,000 to $34,999 | 36 (7.6%) | 20 (5.4%) |
| $35,000 to $39,999 | 15 (3.2%) | 32 (8.6%) |
| $40,000 to $44,999 | 22 (4.6%) | 37 (10.0%) |
| $45,000 to $49,999 | 40 (8.4%) | 23 (6.2%) |
| $50,000 to $54,999 | 50 (10.5%) | 14 (3.8%) |
| $55,000 to $64,999 | 26 (5.5%) | 11 (3.0%) |
| $65,000 to $74,999 | 17 (3.6%) | 27 (7.3%) |
| $75,000 to $99,999 | 24 (5.1%) | 4 (1.1%) |
| $100,000+ | 52 (11.0%) | 0 (0.0%) |
| Total | 474 (100.0%) | 370 (100.0%) |
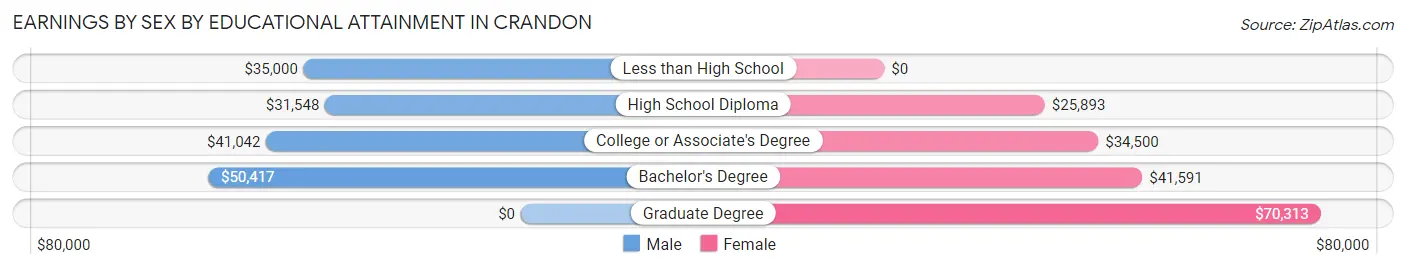
Earnings by Sex by Educational Attainment in Crandon
Average earnings in Crandon are $43,958 for men and $32,031 for women, a difference of 27.1%. Men with an educational attainment of bachelor's degree enjoy the highest average annual earnings of $50,417, while those with high school diploma education earn the least with $31,548. Women with an educational attainment of graduate degree earn the most with the average annual earnings of $70,313, while those with high school diploma education have the smallest earnings of $25,893.
| Educational Attainment | Male Income | Female Income |
| Less than High School | $35,000 | $0 |
| High School Diploma | $31,548 | $25,893 |
| College or Associate's Degree | $41,042 | $34,500 |
| Bachelor's Degree | $50,417 | $41,591 |
| Graduate Degree | - | - |
| Total | $43,958 | $32,031 |
Family Income in Crandon
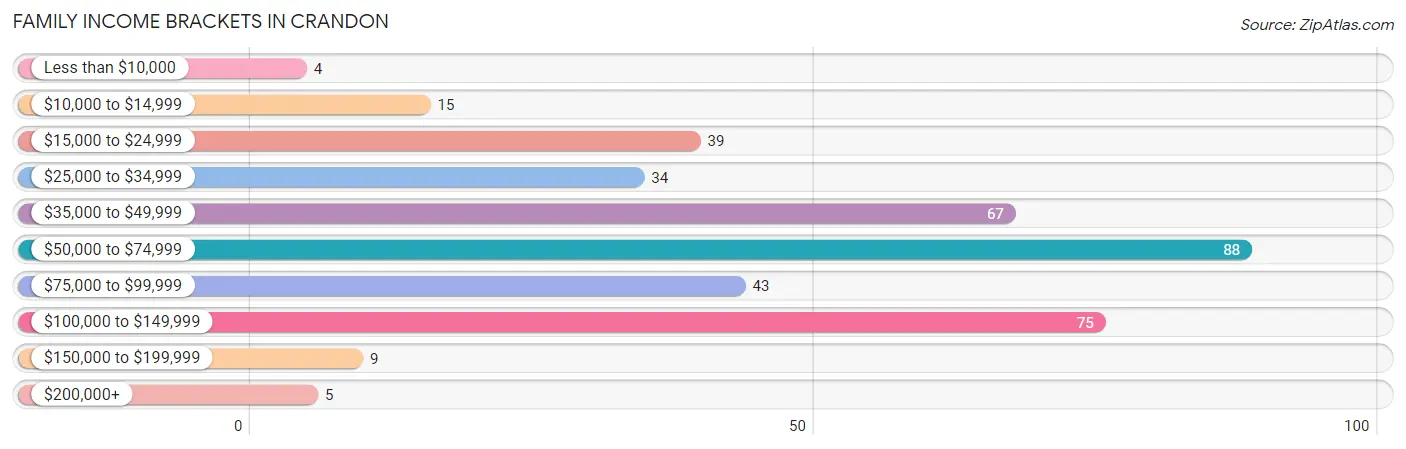
Family Income Brackets in Crandon
According to the Crandon family income data, there are 88 families falling into the $50,000 to $74,999 income range, which is the most common income bracket and makes up 23.2% of all families. Conversely, the less than $10,000 income bracket is the least frequent group with only 4 families (1.1%) belonging to this category.
| Income Bracket | # Families | % Families |
| Less than $10,000 | 4 | 1.1% |
| $10,000 to $14,999 | 15 | 4.0% |
| $15,000 to $24,999 | 39 | 10.3% |
| $25,000 to $34,999 | 34 | 9.0% |
| $35,000 to $49,999 | 67 | 17.7% |
| $50,000 to $74,999 | 88 | 23.2% |
| $75,000 to $99,999 | 43 | 11.3% |
| $100,000 to $149,999 | 75 | 19.8% |
| $150,000 to $199,999 | 9 | 2.4% |
| $200,000+ | 5 | 1.3% |
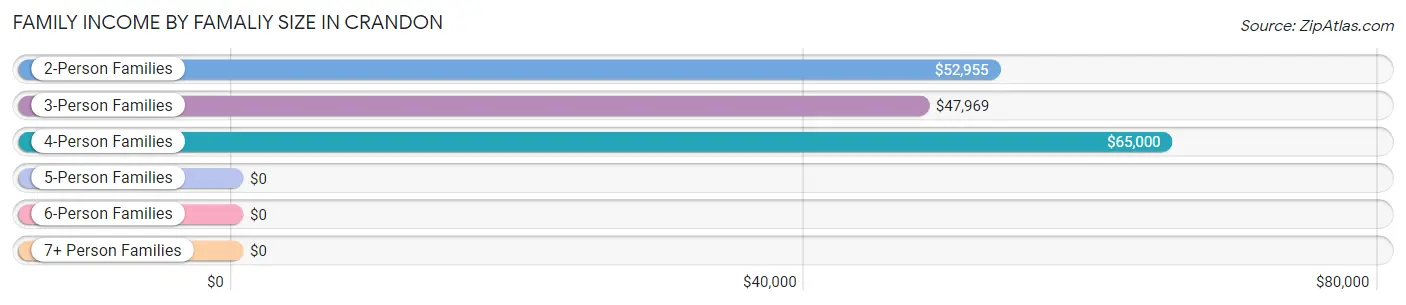
Family Income by Famaliy Size in Crandon
4-person families (30 | 7.9%) account for the highest median family income in Crandon with $65,000 per family, while 2-person families (246 | 64.9%) have the highest median income of $26,478 per family member.
| Income Bracket | # Families | Median Income |
| 2-Person Families | 246 (64.9%) | $52,955 |
| 3-Person Families | 87 (23.0%) | $47,969 |
| 4-Person Families | 30 (7.9%) | $65,000 |
| 5-Person Families | 9 (2.4%) | $0 |
| 6-Person Families | 7 (1.8%) | $0 |
| 7+ Person Families | 0 (0.0%) | $0 |
| Total | 379 (100.0%) | $54,471 |
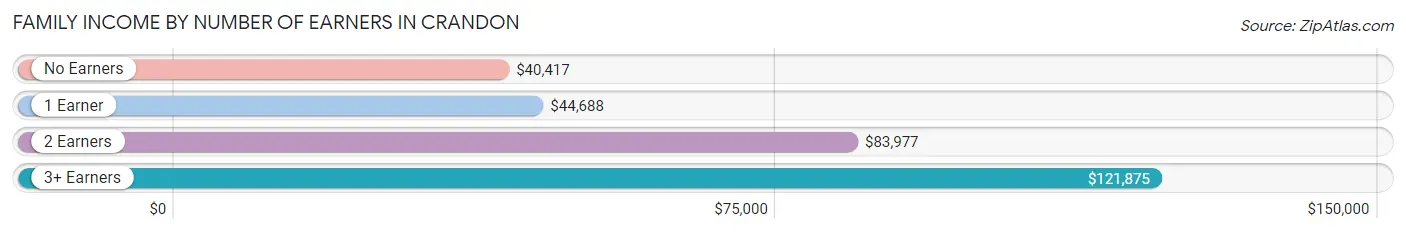
Family Income by Number of Earners in Crandon
The median family income in Crandon is $54,471, with families comprising 3+ earners (12) having the highest median family income of $121,875, while families with no earners (57) have the lowest median family income of $40,417, accounting for 3.2% and 15.0% of families, respectively.
| Number of Earners | # Families | Median Income |
| No Earners | 57 (15.0%) | $40,417 |
| 1 Earner | 163 (43.0%) | $44,688 |
| 2 Earners | 147 (38.8%) | $83,977 |
| 3+ Earners | 12 (3.2%) | $121,875 |
| Total | 379 (100.0%) | $54,471 |
Household Income in Crandon
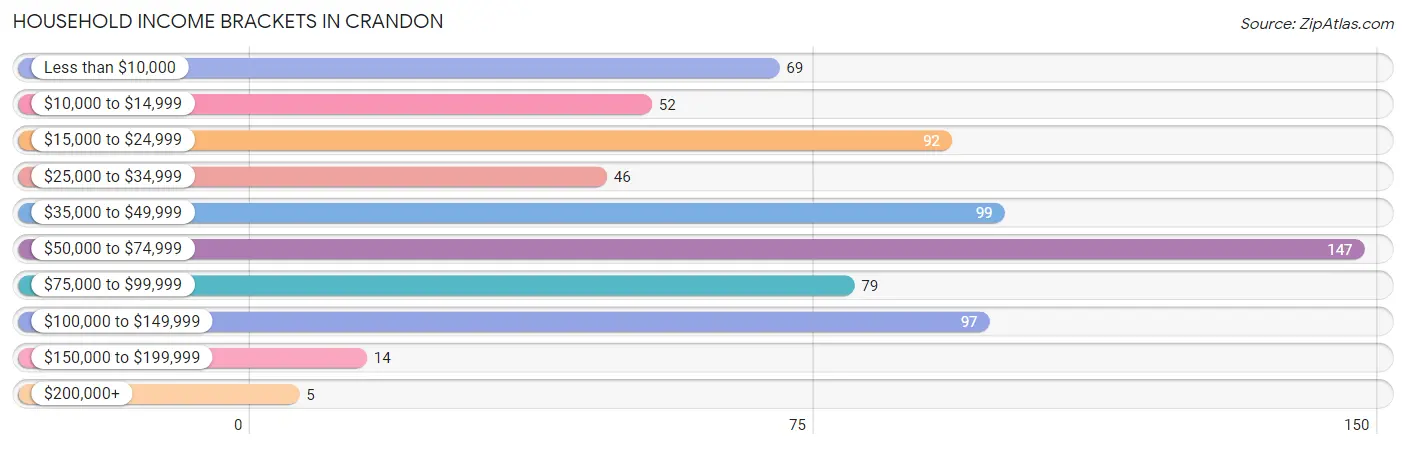
Household Income Brackets in Crandon
With 147 households falling in the category, the $50,000 to $74,999 income range is the most frequent in Crandon, accounting for 21.0% of all households. In contrast, only 5 households (0.7%) fall into the $200,000+ income bracket, making it the least populous group.
| Income Bracket | # Households | % Households |
| Less than $10,000 | 69 | 9.9% |
| $10,000 to $14,999 | 52 | 7.4% |
| $15,000 to $24,999 | 92 | 13.1% |
| $25,000 to $34,999 | 46 | 6.6% |
| $35,000 to $49,999 | 99 | 14.1% |
| $50,000 to $74,999 | 147 | 21.0% |
| $75,000 to $99,999 | 79 | 11.3% |
| $100,000 to $149,999 | 97 | 13.9% |
| $150,000 to $199,999 | 14 | 2.0% |
| $200,000+ | 5 | 0.7% |
Household Income by Householder Age in Crandon
The median household income in Crandon is $47,083, with the highest median household income of $65,417 found in the 45 to 64 years age bracket for the primary householder. A total of 249 households (35.6%) fall into this category. Meanwhile, the 65+ years age bracket for the primary householder has the lowest median household income of $24,306, with 190 households (27.1%) in this group.
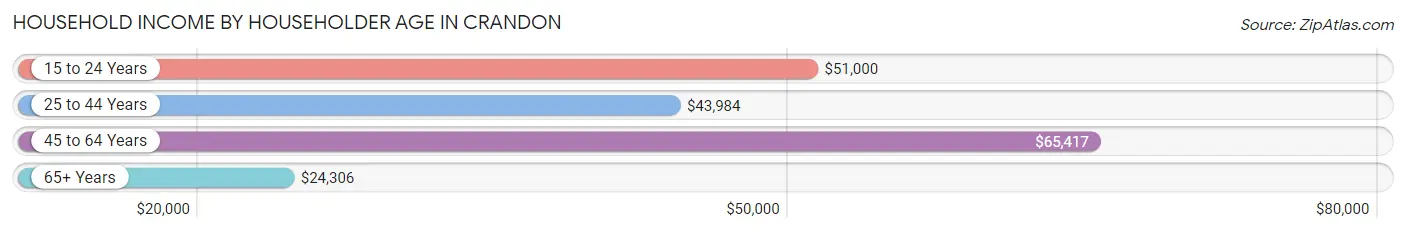
| Income Bracket | # Households | Median Income |
| 15 to 24 Years | 18 (2.6%) | $51,000 |
| 25 to 44 Years | 243 (34.7%) | $43,984 |
| 45 to 64 Years | 249 (35.6%) | $65,417 |
| 65+ Years | 190 (27.1%) | $24,306 |
| Total | 700 (100.0%) | $47,083 |
Poverty in Crandon
Income Below Poverty by Sex and Age in Crandon
With 14.1% poverty level for males and 17.8% for females among the residents of Crandon, 35 to 44 year old males and 35 to 44 year old females are the most vulnerable to poverty, with 41 males (38.3%) and 33 females (47.1%) in their respective age groups living below the poverty level.
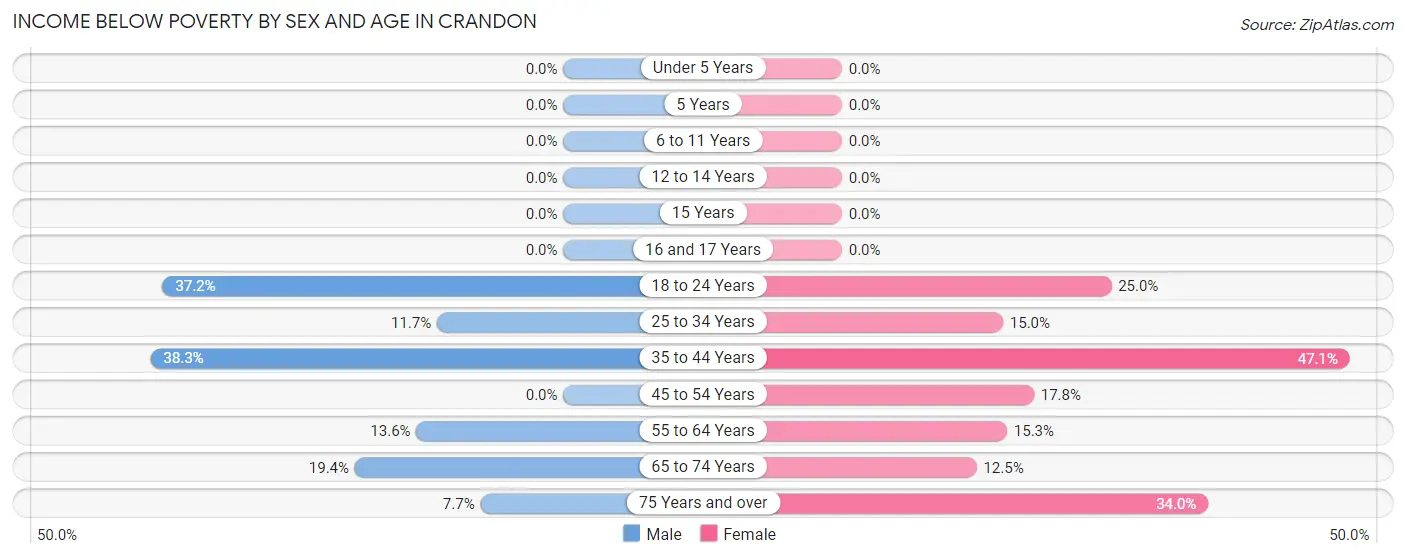
| Age Bracket | Male | Female |
| Under 5 Years | 0 (0.0%) | 0 (0.0%) |
| 5 Years | 0 (0.0%) | 0 (0.0%) |
| 6 to 11 Years | 0 (0.0%) | 0 (0.0%) |
| 12 to 14 Years | 0 (0.0%) | 0 (0.0%) |
| 15 Years | 0 (0.0%) | 0 (0.0%) |
| 16 and 17 Years | 0 (0.0%) | 0 (0.0%) |
| 18 to 24 Years | 16 (37.2%) | 17 (25.0%) |
| 25 to 34 Years | 15 (11.7%) | 16 (14.9%) |
| 35 to 44 Years | 41 (38.3%) | 33 (47.1%) |
| 45 to 54 Years | 0 (0.0%) | 18 (17.8%) |
| 55 to 64 Years | 15 (13.6%) | 19 (15.3%) |
| 65 to 74 Years | 12 (19.4%) | 11 (12.5%) |
| 75 Years and over | 4 (7.7%) | 17 (34.0%) |
| Total | 103 (14.1%) | 131 (17.8%) |
Income Above Poverty by Sex and Age in Crandon
According to the poverty statistics in Crandon, males aged under 5 years and females aged under 5 years are the age groups that are most secure financially, with 100.0% of males and 100.0% of females in these age groups living above the poverty line.
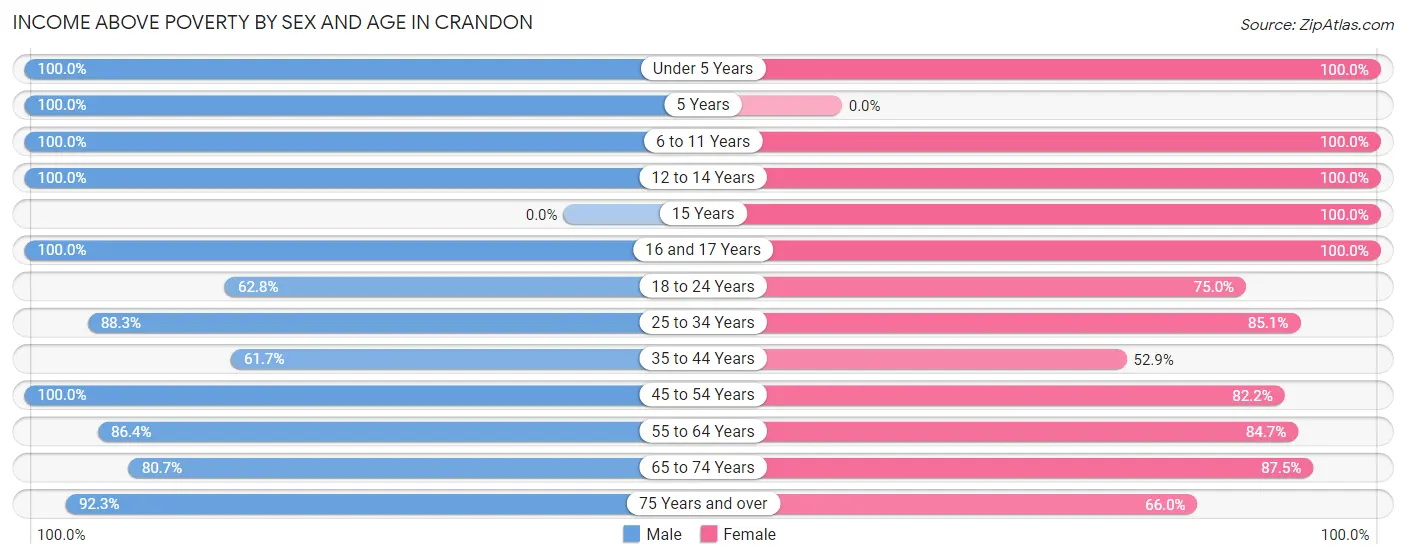
| Age Bracket | Male | Female |
| Under 5 Years | 27 (100.0%) | 62 (100.0%) |
| 5 Years | 4 (100.0%) | 0 (0.0%) |
| 6 to 11 Years | 25 (100.0%) | 25 (100.0%) |
| 12 to 14 Years | 32 (100.0%) | 8 (100.0%) |
| 15 Years | 0 (0.0%) | 22 (100.0%) |
| 16 and 17 Years | 47 (100.0%) | 9 (100.0%) |
| 18 to 24 Years | 27 (62.8%) | 51 (75.0%) |
| 25 to 34 Years | 113 (88.3%) | 91 (85.1%) |
| 35 to 44 Years | 66 (61.7%) | 37 (52.9%) |
| 45 to 54 Years | 94 (100.0%) | 83 (82.2%) |
| 55 to 64 Years | 95 (86.4%) | 105 (84.7%) |
| 65 to 74 Years | 50 (80.6%) | 77 (87.5%) |
| 75 Years and over | 48 (92.3%) | 33 (66.0%) |
| Total | 628 (85.9%) | 603 (82.2%) |
Income Below Poverty Among Married-Couple Families in Crandon
The poverty statistics for married-couple families in Crandon show that 8.6% or 22 of the total 257 families live below the poverty line. Families with no children have the highest poverty rate of 12.0%, comprising of 22 families. On the other hand, families with 1 or 2 children have the lowest poverty rate of 0.0%, which includes 0 families.
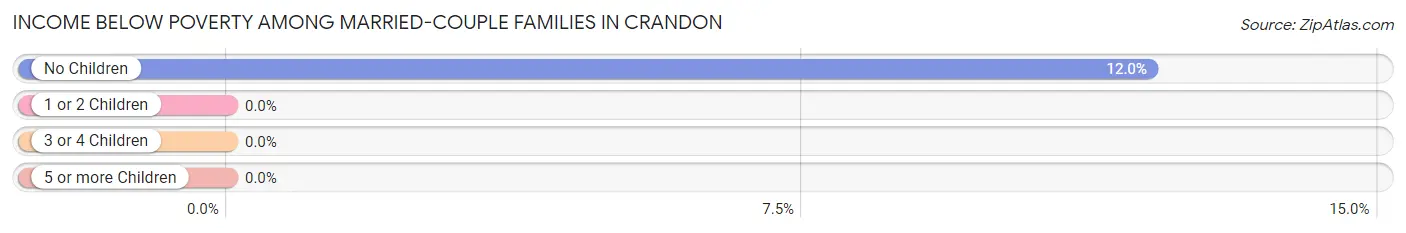
| Children | Above Poverty | Below Poverty |
| No Children | 161 (88.0%) | 22 (12.0%) |
| 1 or 2 Children | 58 (100.0%) | 0 (0.0%) |
| 3 or 4 Children | 16 (100.0%) | 0 (0.0%) |
| 5 or more Children | 0 (0.0%) | 0 (0.0%) |
| Total | 235 (91.4%) | 22 (8.6%) |
Income Below Poverty Among Single-Parent Households in Crandon
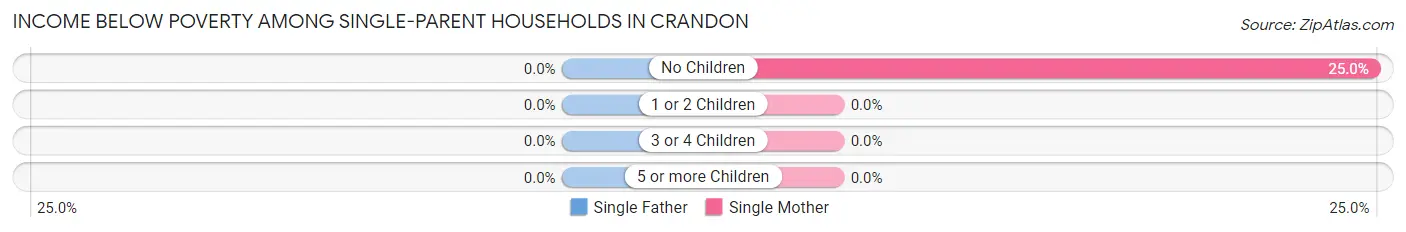
| Children | Single Father | Single Mother |
| No Children | 0 (0.0%) | 9 (25.0%) |
| 1 or 2 Children | 0 (0.0%) | 0 (0.0%) |
| 3 or 4 Children | 0 (0.0%) | 0 (0.0%) |
| 5 or more Children | 0 (0.0%) | 0 (0.0%) |
| Total | 0 (0.0%) | 9 (11.4%) |
Income Below Poverty Among Married-Couple vs Single-Parent Households in Crandon
The poverty data for Crandon shows that 22 of the married-couple family households (8.6%) and 9 of the single-parent households (7.4%) are living below the poverty level. Within the married-couple family households, those with no children have the highest poverty rate, with 22 households (12.0%) falling below the poverty line. Among the single-parent households, those with no children have the highest poverty rate, with 9 household (20.9%) living below poverty.
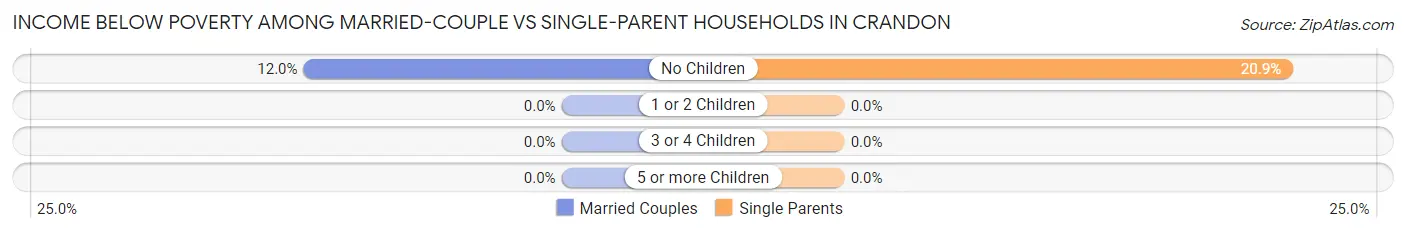
| Children | Married-Couple Families | Single-Parent Households |
| No Children | 22 (12.0%) | 9 (20.9%) |
| 1 or 2 Children | 0 (0.0%) | 0 (0.0%) |
| 3 or 4 Children | 0 (0.0%) | 0 (0.0%) |
| 5 or more Children | 0 (0.0%) | 0 (0.0%) |
| Total | 22 (8.6%) | 9 (7.4%) |
Race in Crandon
The most populous races in Crandon are White / Caucasian (1,295 | 85.3%), Native / Alaskan (162 | 10.7%), and Two or more Races (46 | 3.0%).
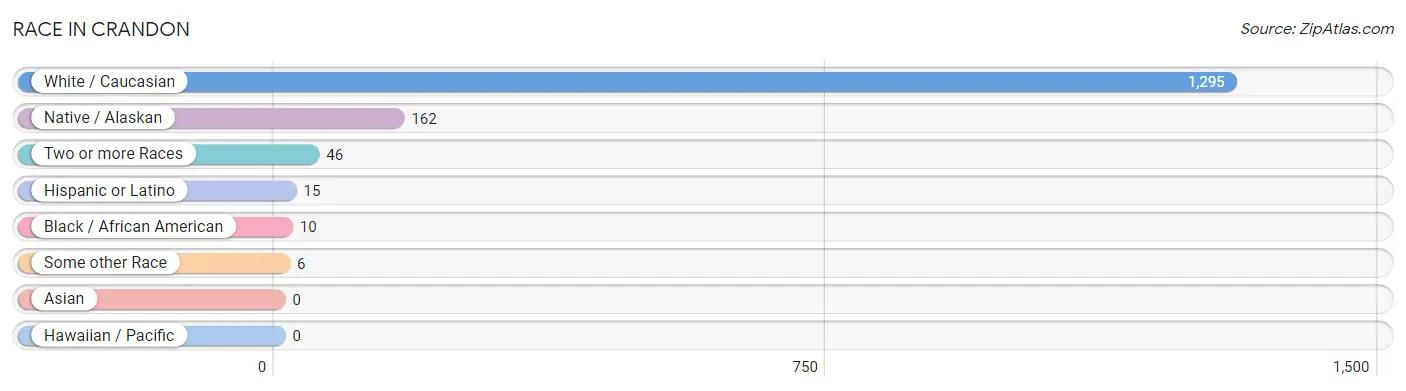
| Race | # Population | % Population |
| Asian | 0 | 0.0% |
| Black / African American | 10 | 0.7% |
| Hawaiian / Pacific | 0 | 0.0% |
| Hispanic or Latino | 15 | 1.0% |
| Native / Alaskan | 162 | 10.7% |
| White / Caucasian | 1,295 | 85.3% |
| Two or more Races | 46 | 3.0% |
| Some other Race | 6 | 0.4% |
| Total | 1,519 | 100.0% |
Ancestry in Crandon
The most populous ancestries reported in Crandon are German (509 | 33.5%), Polish (130 | 8.6%), Irish (129 | 8.5%), English (122 | 8.0%), and French (93 | 6.1%), together accounting for 64.7% of all Crandon residents.
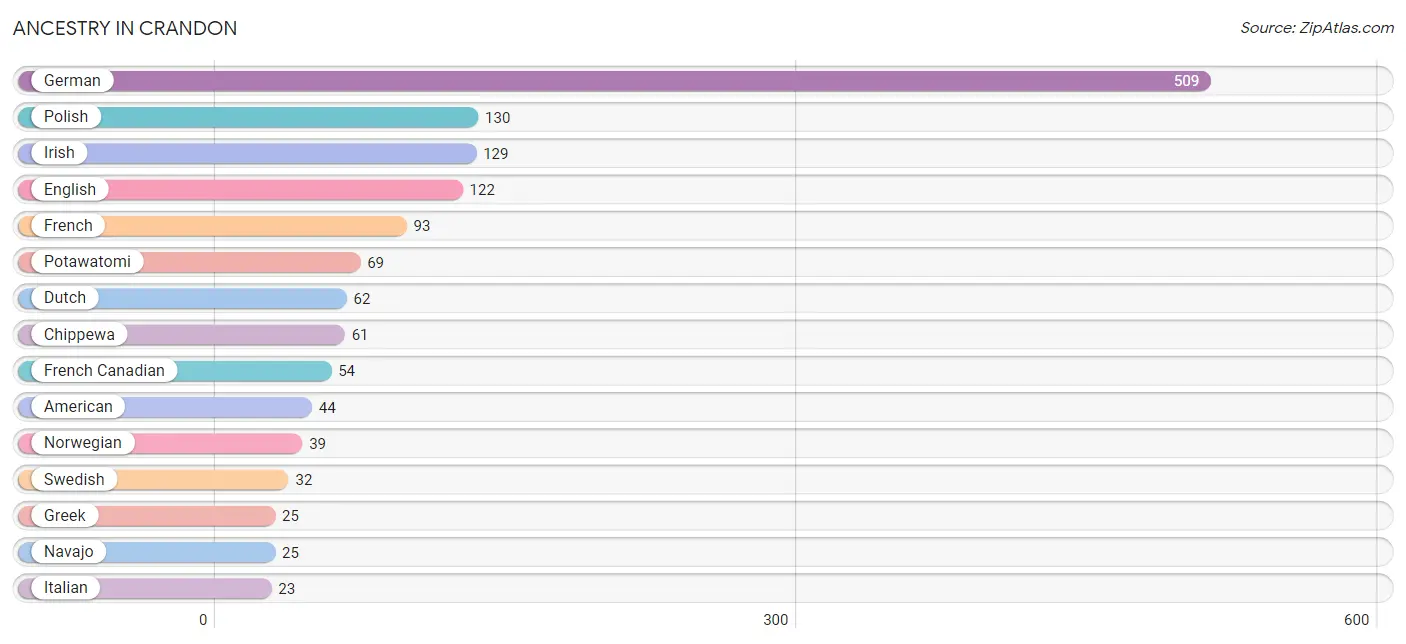
| Ancestry | # Population | % Population |
| American | 44 | 2.9% |
| Arab | 4 | 0.3% |
| Belgian | 4 | 0.3% |
| Blackfeet | 4 | 0.3% |
| British | 4 | 0.3% |
| Cherokee | 4 | 0.3% |
| Chippewa | 61 | 4.0% |
| Crow | 4 | 0.3% |
| Czech | 18 | 1.2% |
| Danish | 2 | 0.1% |
| Dutch | 62 | 4.1% |
| Eastern European | 12 | 0.8% |
| English | 122 | 8.0% |
| French | 93 | 6.1% |
| French Canadian | 54 | 3.5% |
| German | 509 | 33.5% |
| Greek | 25 | 1.7% |
| Hungarian | 9 | 0.6% |
| Irish | 129 | 8.5% |
| Italian | 23 | 1.5% |
| Menominee | 7 | 0.5% |
| Mexican | 15 | 1.0% |
| Navajo | 25 | 1.7% |
| Norwegian | 39 | 2.6% |
| Polish | 130 | 8.6% |
| Potawatomi | 69 | 4.5% |
| Russian | 16 | 1.1% |
| Scandinavian | 3 | 0.2% |
| Scottish | 22 | 1.5% |
| Sioux | 7 | 0.5% |
| Slovene | 8 | 0.5% |
| Swedish | 32 | 2.1% |
| Swiss | 5 | 0.3% |
| Welsh | 8 | 0.5% | View All 34 Rows |
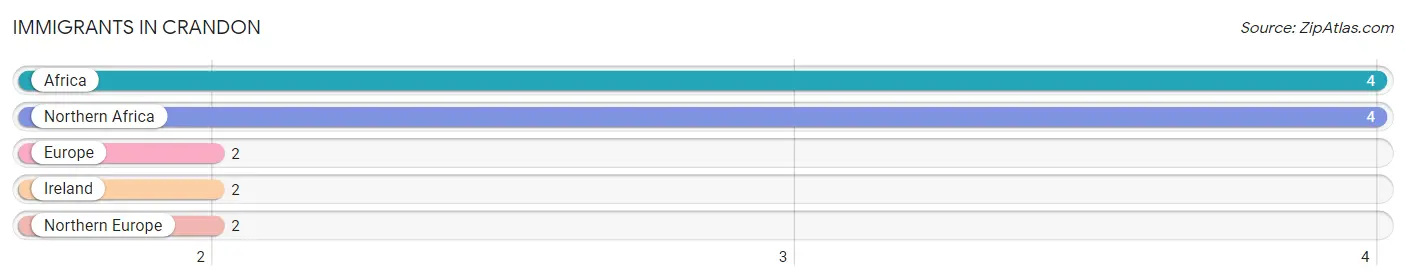
Immigrants in Crandon
The most numerous immigrant groups reported in Crandon came from Africa (4 | 0.3%), Northern Africa (4 | 0.3%), Europe (2 | 0.1%), Ireland (2 | 0.1%), and Northern Europe (2 | 0.1%), together accounting for 0.9% of all Crandon residents.
| Immigration Origin | # Population | % Population |
| Africa | 4 | 0.3% |
| Europe | 2 | 0.1% |
| Ireland | 2 | 0.1% |
| Northern Africa | 4 | 0.3% |
| Northern Europe | 2 | 0.1% | View All 5 Rows |
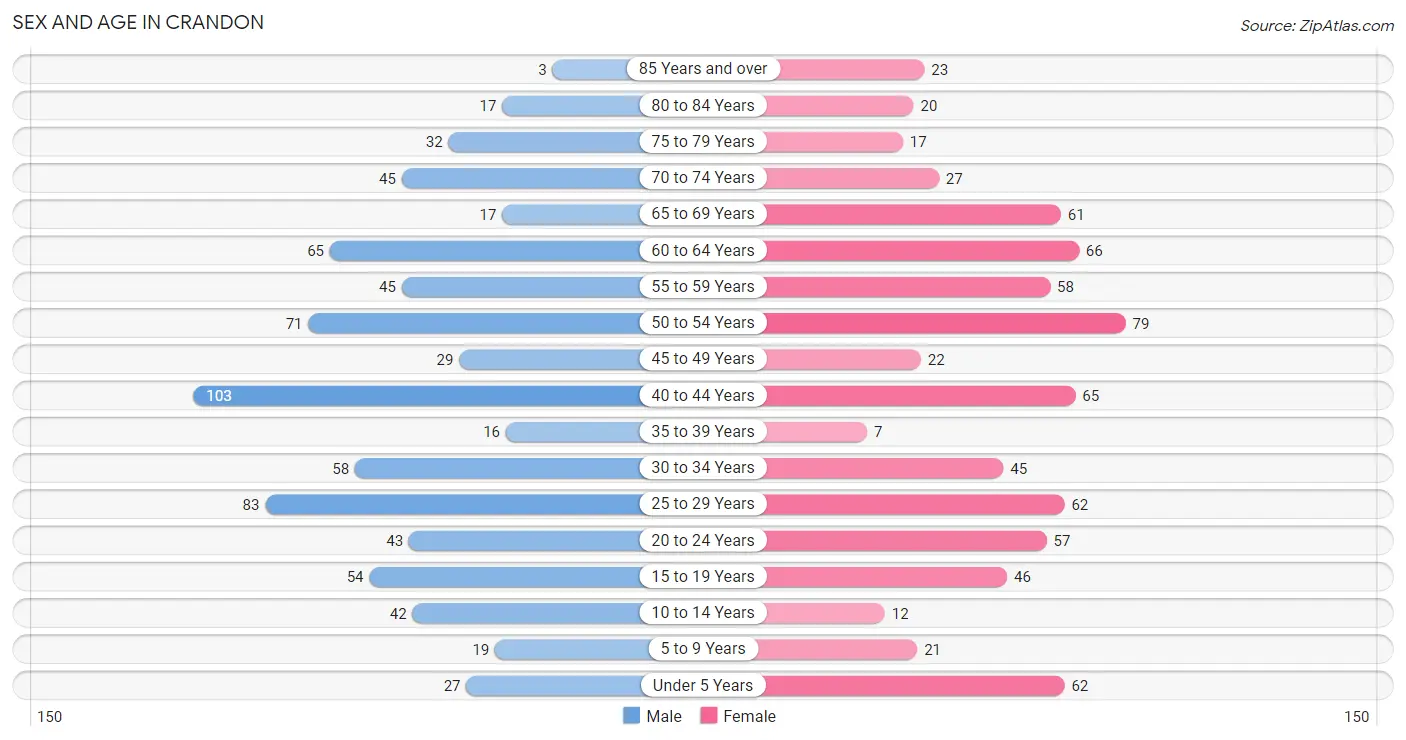
Sex and Age in Crandon
Sex and Age in Crandon
The most populous age groups in Crandon are 40 to 44 Years (103 | 13.4%) for men and 50 to 54 Years (79 | 10.5%) for women.
| Age Bracket | Male | Female |
| Under 5 Years | 27 (3.5%) | 62 (8.3%) |
| 5 to 9 Years | 19 (2.5%) | 21 (2.8%) |
| 10 to 14 Years | 42 (5.5%) | 12 (1.6%) |
| 15 to 19 Years | 54 (7.0%) | 46 (6.1%) |
| 20 to 24 Years | 43 (5.6%) | 57 (7.6%) |
| 25 to 29 Years | 83 (10.8%) | 62 (8.3%) |
| 30 to 34 Years | 58 (7.5%) | 45 (6.0%) |
| 35 to 39 Years | 16 (2.1%) | 7 (0.9%) |
| 40 to 44 Years | 103 (13.4%) | 65 (8.7%) |
| 45 to 49 Years | 29 (3.8%) | 22 (2.9%) |
| 50 to 54 Years | 71 (9.2%) | 79 (10.5%) |
| 55 to 59 Years | 45 (5.9%) | 58 (7.7%) |
| 60 to 64 Years | 65 (8.5%) | 66 (8.8%) |
| 65 to 69 Years | 17 (2.2%) | 61 (8.1%) |
| 70 to 74 Years | 45 (5.9%) | 27 (3.6%) |
| 75 to 79 Years | 32 (4.2%) | 17 (2.3%) |
| 80 to 84 Years | 17 (2.2%) | 20 (2.7%) |
| 85 Years and over | 3 (0.4%) | 23 (3.1%) |
| Total | 769 (100.0%) | 750 (100.0%) |
Families and Households in Crandon
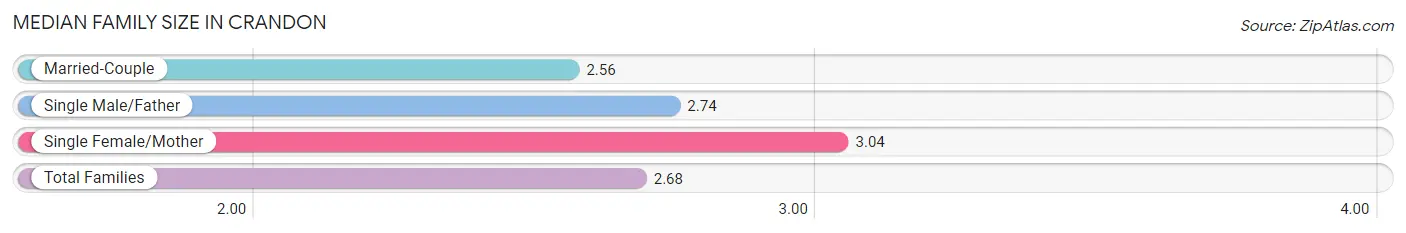
Median Family Size in Crandon
The median family size in Crandon is 2.68 persons per family, with single female/mother families (79 | 20.8%) accounting for the largest median family size of 3.04 persons per family. On the other hand, married-couple families (257 | 67.8%) represent the smallest median family size with 2.56 persons per family.
| Family Type | # Families | Family Size |
| Married-Couple | 257 (67.8%) | 2.56 |
| Single Male/Father | 43 (11.4%) | 2.74 |
| Single Female/Mother | 79 (20.8%) | 3.04 |
| Total Families | 379 (100.0%) | 2.68 |
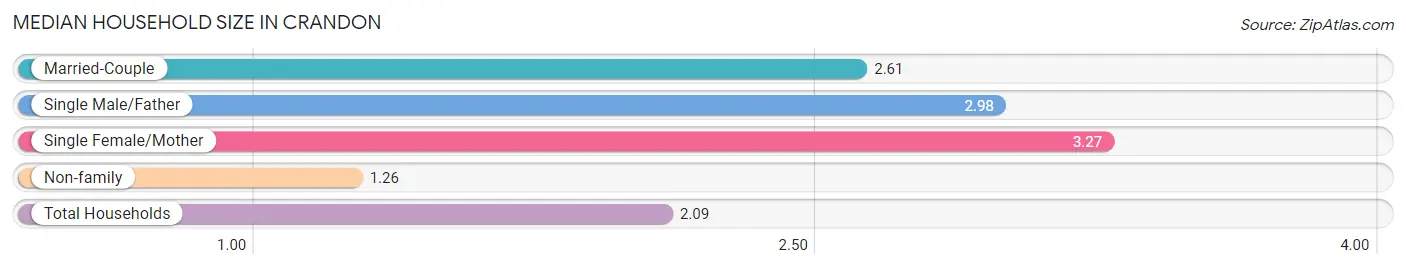
Median Household Size in Crandon
The median household size in Crandon is 2.09 persons per household, with single female/mother households (79 | 11.3%) accounting for the largest median household size of 3.27 persons per household. non-family households (321 | 45.9%) represent the smallest median household size with 1.26 persons per household.
| Household Type | # Households | Household Size |
| Married-Couple | 257 (36.7%) | 2.61 |
| Single Male/Father | 43 (6.1%) | 2.98 |
| Single Female/Mother | 79 (11.3%) | 3.27 |
| Non-family | 321 (45.9%) | 1.26 |
| Total Households | 700 (100.0%) | 2.09 |
Household Size by Marriage Status in Crandon
Out of a total of 700 households in Crandon, 379 (54.1%) are family households, while 321 (45.9%) are nonfamily households. The most numerous type of family households are 2-person households, comprising 239, and the most common type of nonfamily households are 1-person households, comprising 249.
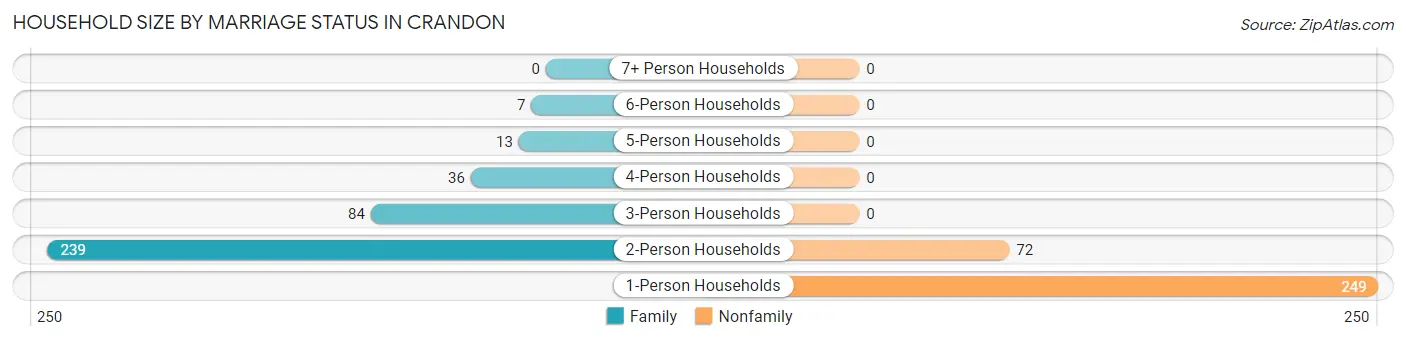
| Household Size | Family Households | Nonfamily Households |
| 1-Person Households | - | 249 (35.6%) |
| 2-Person Households | 239 (34.1%) | 72 (10.3%) |
| 3-Person Households | 84 (12.0%) | 0 (0.0%) |
| 4-Person Households | 36 (5.1%) | 0 (0.0%) |
| 5-Person Households | 13 (1.9%) | 0 (0.0%) |
| 6-Person Households | 7 (1.0%) | 0 (0.0%) |
| 7+ Person Households | 0 (0.0%) | 0 (0.0%) |
| Total | 379 (54.1%) | 321 (45.9%) |
Female Fertility in Crandon
Fertility by Age in Crandon
Average fertility rate in Crandon is 49.0 births per 1,000 women. Women in the age bracket of 20 to 34 years have the highest fertility rate with 98.0 births per 1,000 women. Women in the age bracket of 20 to 34 years acount for 100.0% of all women with births.
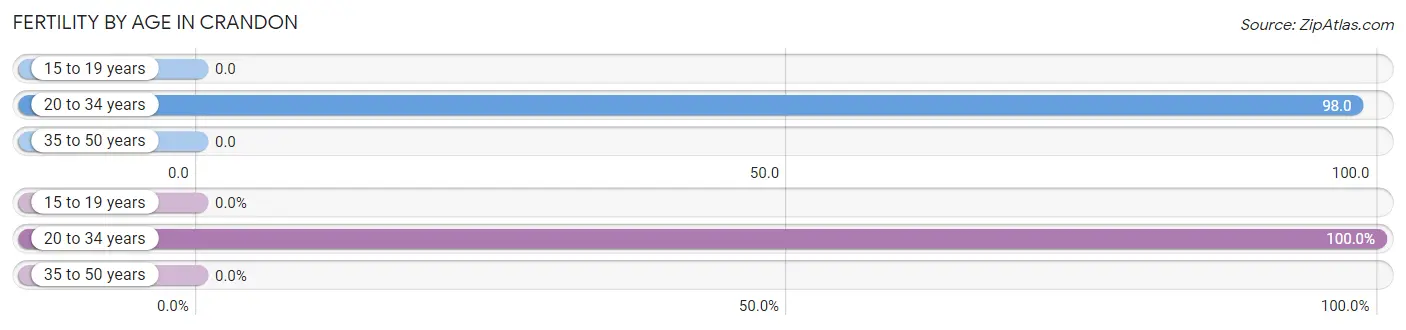
| Age Bracket | Women with Births | Births / 1,000 Women |
| 15 to 19 years | 0 (0.0%) | 0.0 |
| 20 to 34 years | 16 (100.0%) | 98.0 |
| 35 to 50 years | 0 (0.0%) | 0.0 |
| Total | 16 (100.0%) | 49.0 |
Fertility by Age by Marriage Status in Crandon
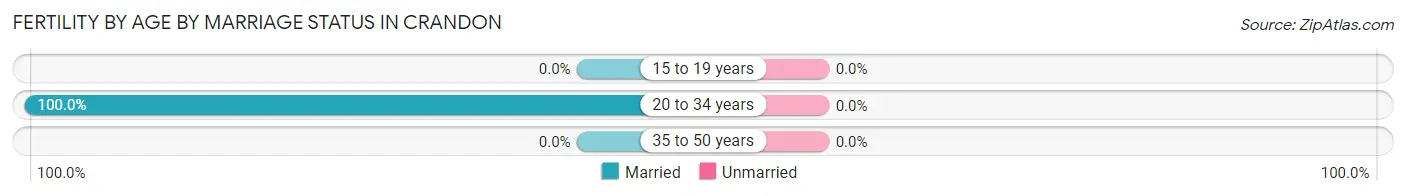
| Age Bracket | Married | Unmarried |
| 15 to 19 years | 0 (0.0%) | 0 (0.0%) |
| 20 to 34 years | 16 (100.0%) | 0 (0.0%) |
| 35 to 50 years | 0 (0.0%) | 0 (0.0%) |
| Total | 16 (100.0%) | 0 (0.0%) |
Fertility by Education in Crandon
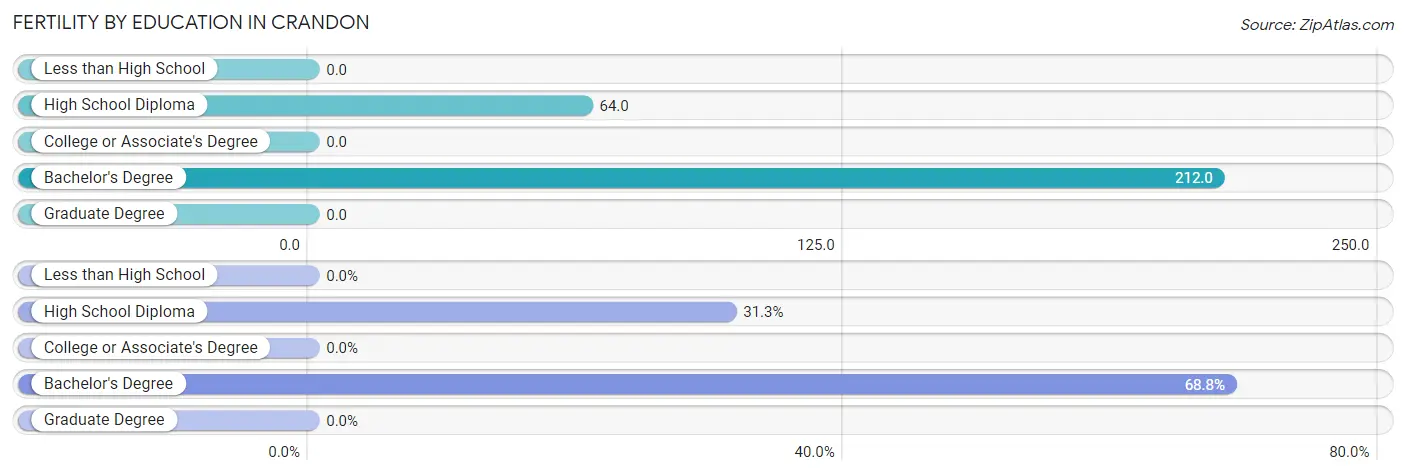
| Educational Attainment | Women with Births | Births / 1,000 Women |
| Less than High School | 0 (0.0%) | 0.0 |
| High School Diploma | 5 (31.2%) | 64.0 |
| College or Associate's Degree | 0 (0.0%) | 0.0 |
| Bachelor's Degree | 11 (68.8%) | 212.0 |
| Graduate Degree | 0 (0.0%) | 0.0 |
| Total | 16 (100.0%) | 49.0 |
Fertility by Education by Marriage Status in Crandon
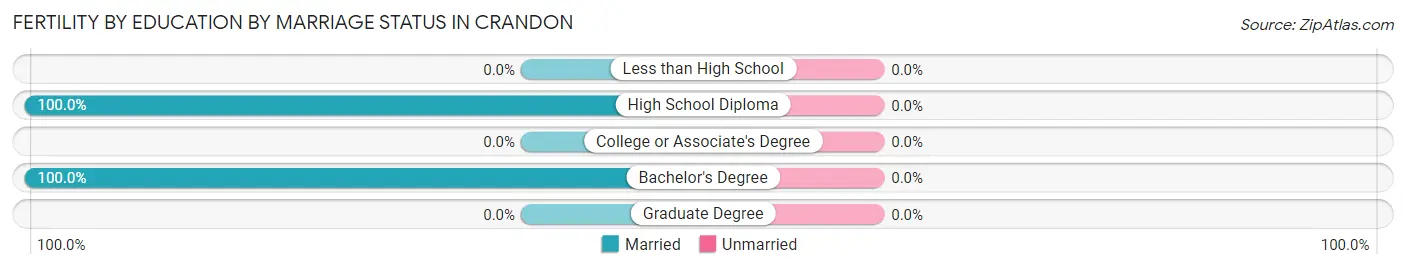
| Educational Attainment | Married | Unmarried |
| Less than High School | 0 (0.0%) | 0 (0.0%) |
| High School Diploma | 5 (100.0%) | 0 (0.0%) |
| College or Associate's Degree | 0 (0.0%) | 0 (0.0%) |
| Bachelor's Degree | 11 (100.0%) | 0 (0.0%) |
| Graduate Degree | 0 (0.0%) | 0 (0.0%) |
| Total | 16 (100.0%) | 0 (0.0%) |
Employment Characteristics in Crandon
Employment by Class of Employer in Crandon
Among the 750 employed individuals in Crandon, private company employees (459 | 61.2%), local government employees (158 | 21.1%), and federal government employees (42 | 5.6%) make up the most common classes of employment.
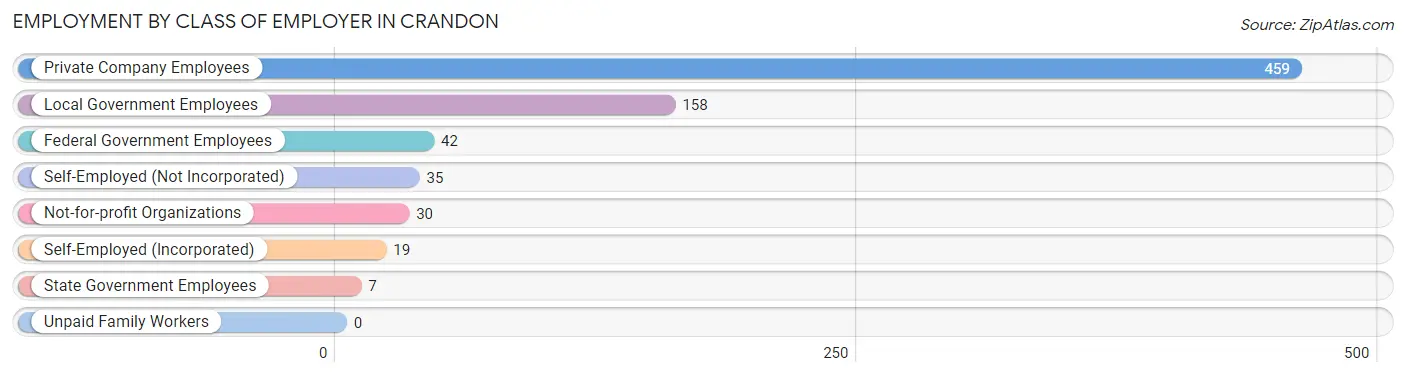
| Employer Class | # Employees | % Employees |
| Private Company Employees | 459 | 61.2% |
| Self-Employed (Incorporated) | 19 | 2.5% |
| Self-Employed (Not Incorporated) | 35 | 4.7% |
| Not-for-profit Organizations | 30 | 4.0% |
| Local Government Employees | 158 | 21.1% |
| State Government Employees | 7 | 0.9% |
| Federal Government Employees | 42 | 5.6% |
| Unpaid Family Workers | 0 | 0.0% |
| Total | 750 | 100.0% |
Employment Status by Age in Crandon
According to the labor force statistics for Crandon, out of the total population over 16 years of age (1,314), 58.0% or 762 individuals are in the labor force, with 1.3% or 10 of them unemployed. The age group with the highest labor force participation rate is 30 to 34 years, with 96.1% or 99 individuals in the labor force. Within the labor force, the 45 to 54 years age range has the highest percentage of unemployed individuals, with 4.9% or 7 of them being unemployed.
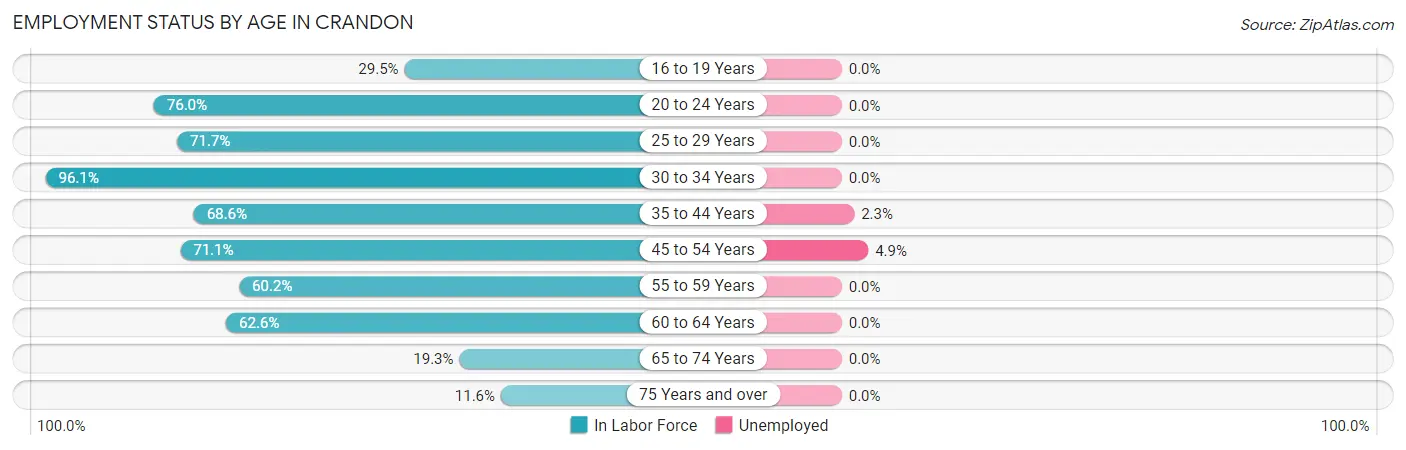
| Age Bracket | In Labor Force | Unemployed |
| 16 to 19 Years | 23 (29.5%) | 0 (0.0%) |
| 20 to 24 Years | 76 (76.0%) | 0 (0.0%) |
| 25 to 29 Years | 104 (71.7%) | 0 (0.0%) |
| 30 to 34 Years | 99 (96.1%) | 0 (0.0%) |
| 35 to 44 Years | 131 (68.6%) | 3 (2.3%) |
| 45 to 54 Years | 143 (71.1%) | 7 (4.9%) |
| 55 to 59 Years | 62 (60.2%) | 0 (0.0%) |
| 60 to 64 Years | 82 (62.6%) | 0 (0.0%) |
| 65 to 74 Years | 29 (19.3%) | 0 (0.0%) |
| 75 Years and over | 13 (11.6%) | 0 (0.0%) |
| Total | 762 (58.0%) | 10 (1.3%) |
Employment Status by Educational Attainment in Crandon
According to labor force statistics for Crandon, 71.1% of individuals (621) out of the total population between 25 and 64 years of age (874) are in the labor force, with 1.6% or 10 of them being unemployed. The group with the highest labor force participation rate are those with the educational attainment of high school diploma, with 73.4% or 235 individuals in the labor force. Within the labor force, individuals with less than high school education have the highest percentage of unemployment, with 17.6% or 3 of them being unemployed.
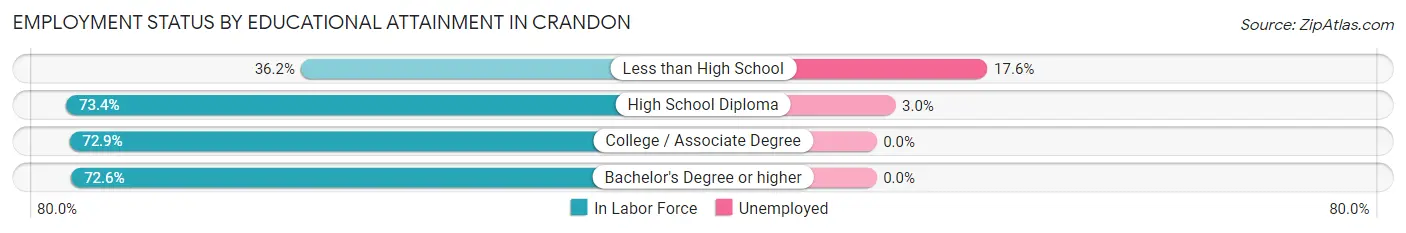
| Educational Attainment | In Labor Force | Unemployed |
| Less than High School | 17 (36.2%) | 8 (17.6%) |
| High School Diploma | 235 (73.4%) | 10 (3.0%) |
| College / Associate Degree | 263 (72.9%) | 0 (0.0%) |
| Bachelor's Degree or higher | 106 (72.6%) | 0 (0.0%) |
| Total | 621 (71.1%) | 14 (1.6%) |
Employment Occupations by Sex in Crandon
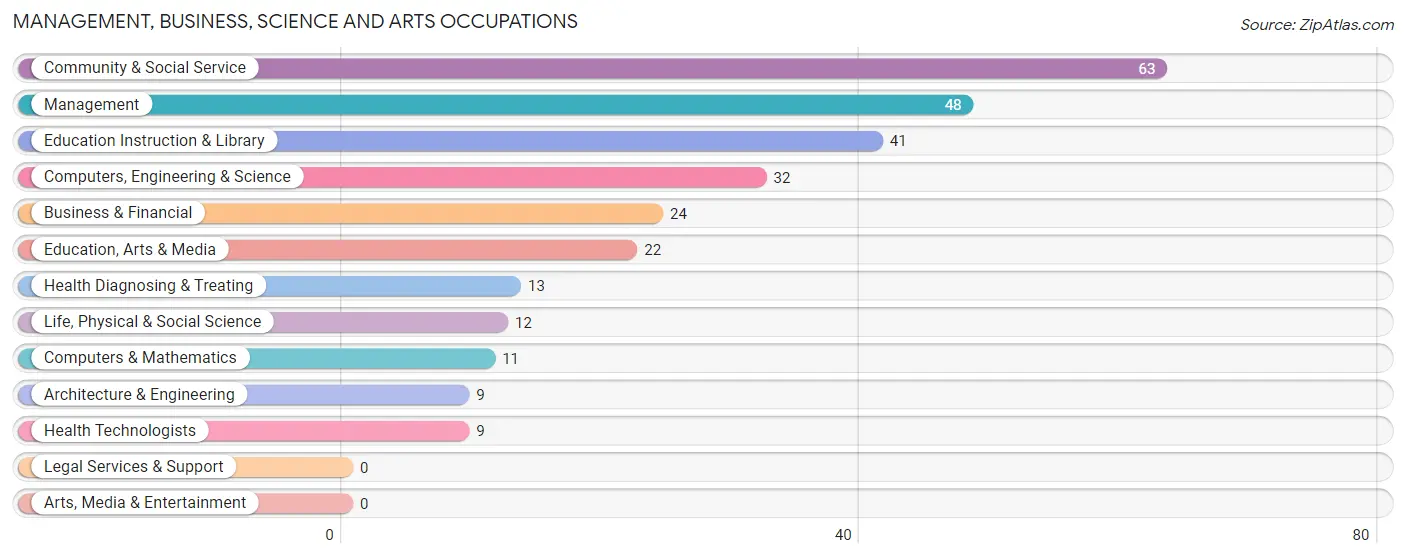
Management, Business, Science and Arts Occupations
The most common Management, Business, Science and Arts occupations in Crandon are Community & Social Service (63 | 8.4%), Management (48 | 6.4%), Education Instruction & Library (41 | 5.4%), Computers, Engineering & Science (32 | 4.3%), and Business & Financial (24 | 3.2%).
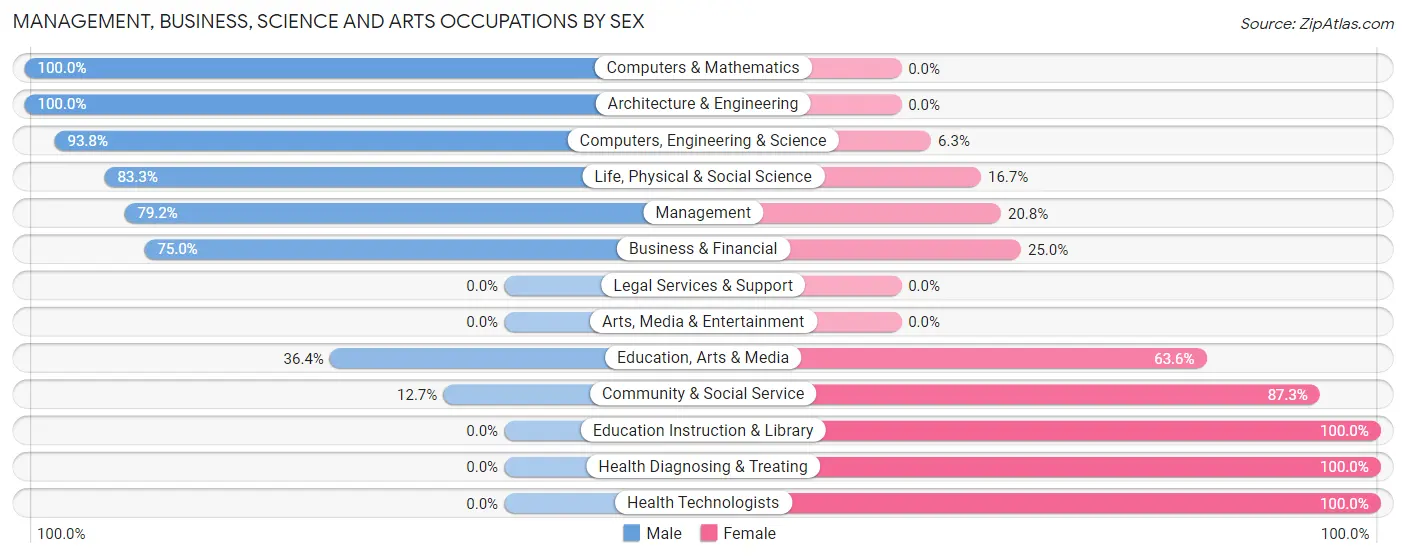
Management, Business, Science and Arts Occupations by Sex
Within the Management, Business, Science and Arts occupations in Crandon, the most male-oriented occupations are Computers & Mathematics (100.0%), Architecture & Engineering (100.0%), and Computers, Engineering & Science (93.8%), while the most female-oriented occupations are Education Instruction & Library (100.0%), Health Diagnosing & Treating (100.0%), and Health Technologists (100.0%).
| Occupation | Male | Female |
| Management | 38 (79.2%) | 10 (20.8%) |
| Business & Financial | 18 (75.0%) | 6 (25.0%) |
| Computers, Engineering & Science | 30 (93.8%) | 2 (6.2%) |
| Computers & Mathematics | 11 (100.0%) | 0 (0.0%) |
| Architecture & Engineering | 9 (100.0%) | 0 (0.0%) |
| Life, Physical & Social Science | 10 (83.3%) | 2 (16.7%) |
| Community & Social Service | 8 (12.7%) | 55 (87.3%) |
| Education, Arts & Media | 8 (36.4%) | 14 (63.6%) |
| Legal Services & Support | 0 (0.0%) | 0 (0.0%) |
| Education Instruction & Library | 0 (0.0%) | 41 (100.0%) |
| Arts, Media & Entertainment | 0 (0.0%) | 0 (0.0%) |
| Health Diagnosing & Treating | 0 (0.0%) | 13 (100.0%) |
| Health Technologists | 0 (0.0%) | 9 (100.0%) |
| Total (Category) | 94 (52.2%) | 86 (47.8%) |
| Total (Overall) | 430 (57.2%) | 322 (42.8%) |
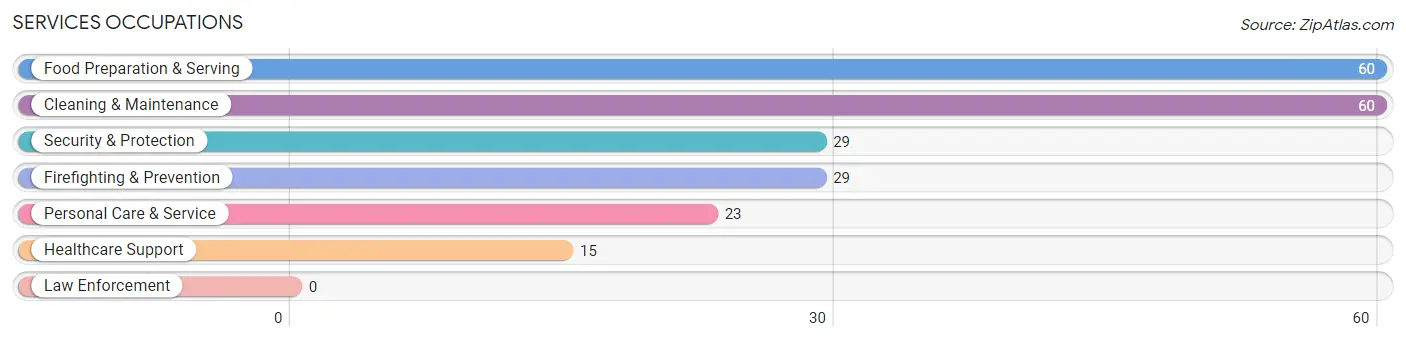
Services Occupations
The most common Services occupations in Crandon are Food Preparation & Serving (60 | 8.0%), Cleaning & Maintenance (60 | 8.0%), Security & Protection (29 | 3.9%), Firefighting & Prevention (29 | 3.9%), and Personal Care & Service (23 | 3.1%).
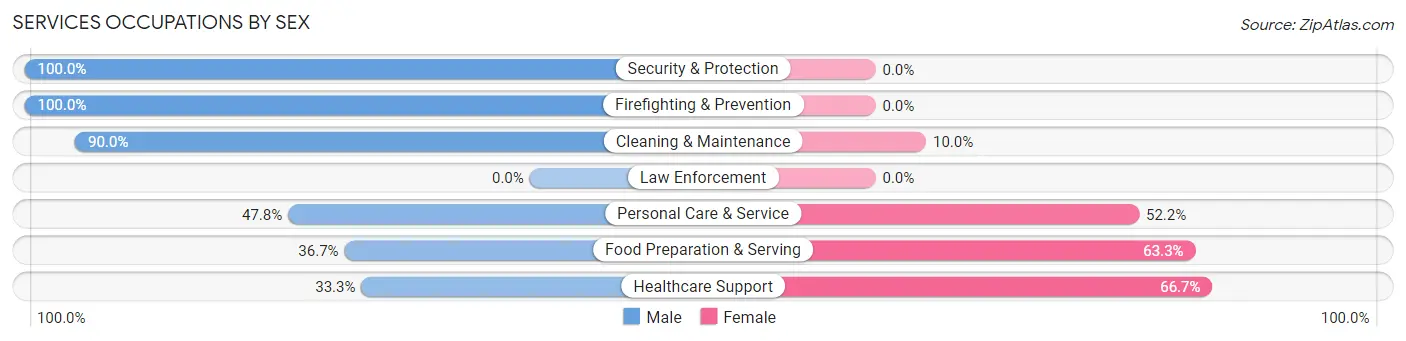
Services Occupations by Sex
Within the Services occupations in Crandon, the most male-oriented occupations are Security & Protection (100.0%), Firefighting & Prevention (100.0%), and Cleaning & Maintenance (90.0%), while the most female-oriented occupations are Healthcare Support (66.7%), Food Preparation & Serving (63.3%), and Personal Care & Service (52.2%).
| Occupation | Male | Female |
| Healthcare Support | 5 (33.3%) | 10 (66.7%) |
| Security & Protection | 29 (100.0%) | 0 (0.0%) |
| Firefighting & Prevention | 29 (100.0%) | 0 (0.0%) |
| Law Enforcement | 0 (0.0%) | 0 (0.0%) |
| Food Preparation & Serving | 22 (36.7%) | 38 (63.3%) |
| Cleaning & Maintenance | 54 (90.0%) | 6 (10.0%) |
| Personal Care & Service | 11 (47.8%) | 12 (52.2%) |
| Total (Category) | 121 (64.7%) | 66 (35.3%) |
| Total (Overall) | 430 (57.2%) | 322 (42.8%) |
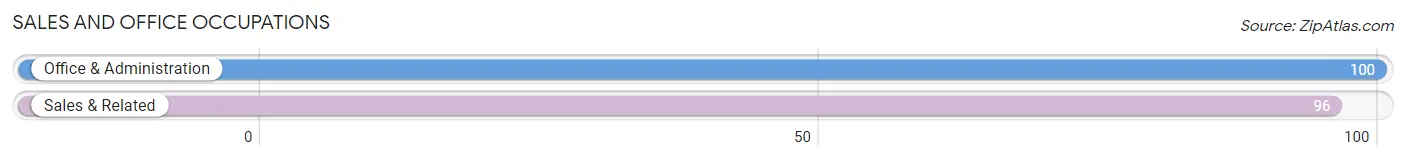
Sales and Office Occupations
The most common Sales and Office occupations in Crandon are Office & Administration (100 | 13.3%), and Sales & Related (96 | 12.8%).
Sales and Office Occupations by Sex
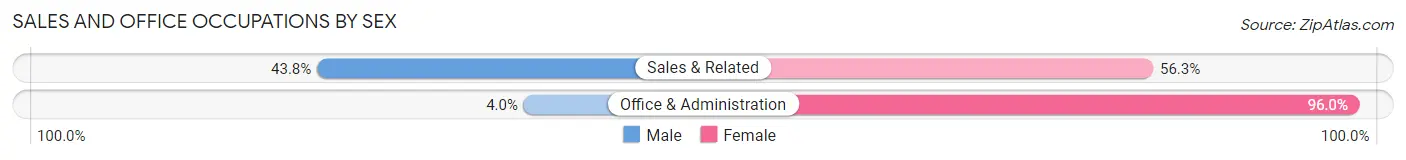
| Occupation | Male | Female |
| Sales & Related | 42 (43.8%) | 54 (56.2%) |
| Office & Administration | 4 (4.0%) | 96 (96.0%) |
| Total (Category) | 46 (23.5%) | 150 (76.5%) |
| Total (Overall) | 430 (57.2%) | 322 (42.8%) |
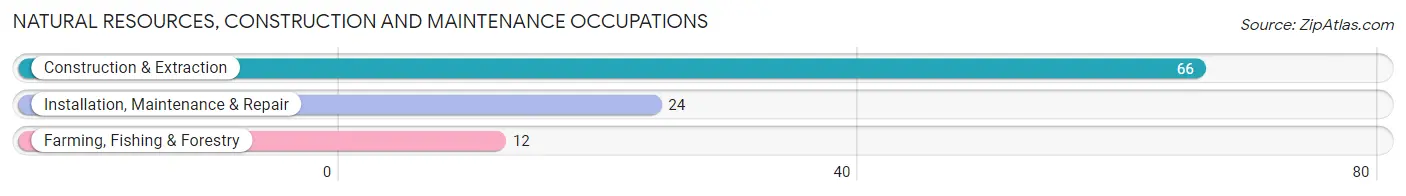
Natural Resources, Construction and Maintenance Occupations
The most common Natural Resources, Construction and Maintenance occupations in Crandon are Construction & Extraction (66 | 8.8%), Installation, Maintenance & Repair (24 | 3.2%), and Farming, Fishing & Forestry (12 | 1.6%).
Natural Resources, Construction and Maintenance Occupations by Sex
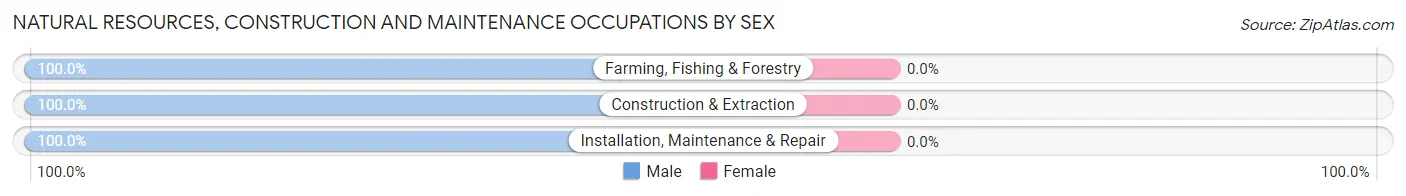
| Occupation | Male | Female |
| Farming, Fishing & Forestry | 12 (100.0%) | 0 (0.0%) |
| Construction & Extraction | 66 (100.0%) | 0 (0.0%) |
| Installation, Maintenance & Repair | 24 (100.0%) | 0 (0.0%) |
| Total (Category) | 102 (100.0%) | 0 (0.0%) |
| Total (Overall) | 430 (57.2%) | 322 (42.8%) |
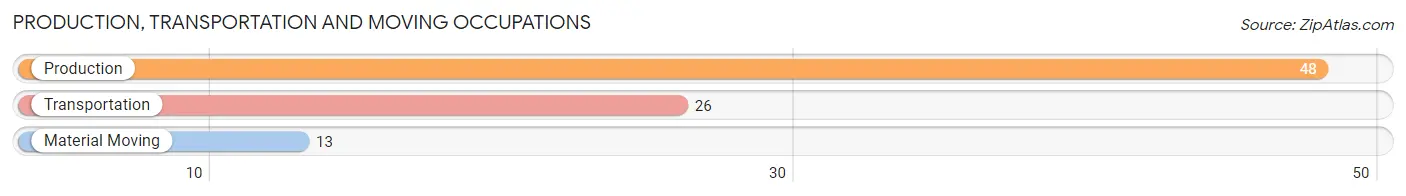
Production, Transportation and Moving Occupations
The most common Production, Transportation and Moving occupations in Crandon are Production (48 | 6.4%), Transportation (26 | 3.5%), and Material Moving (13 | 1.7%).
Production, Transportation and Moving Occupations by Sex
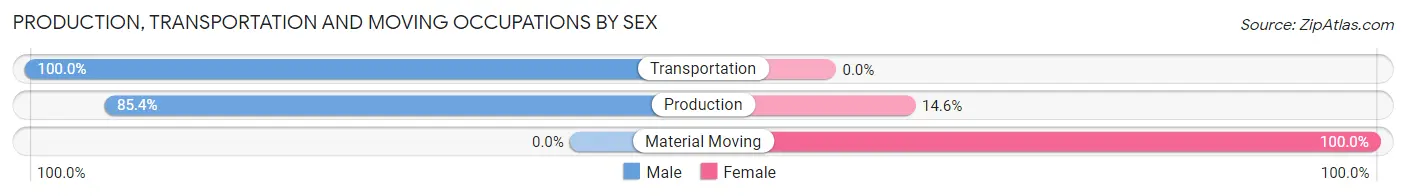
| Occupation | Male | Female |
| Production | 41 (85.4%) | 7 (14.6%) |
| Transportation | 26 (100.0%) | 0 (0.0%) |
| Material Moving | 0 (0.0%) | 13 (100.0%) |
| Total (Category) | 67 (77.0%) | 20 (23.0%) |
| Total (Overall) | 430 (57.2%) | 322 (42.8%) |
Employment Industries by Sex in Crandon
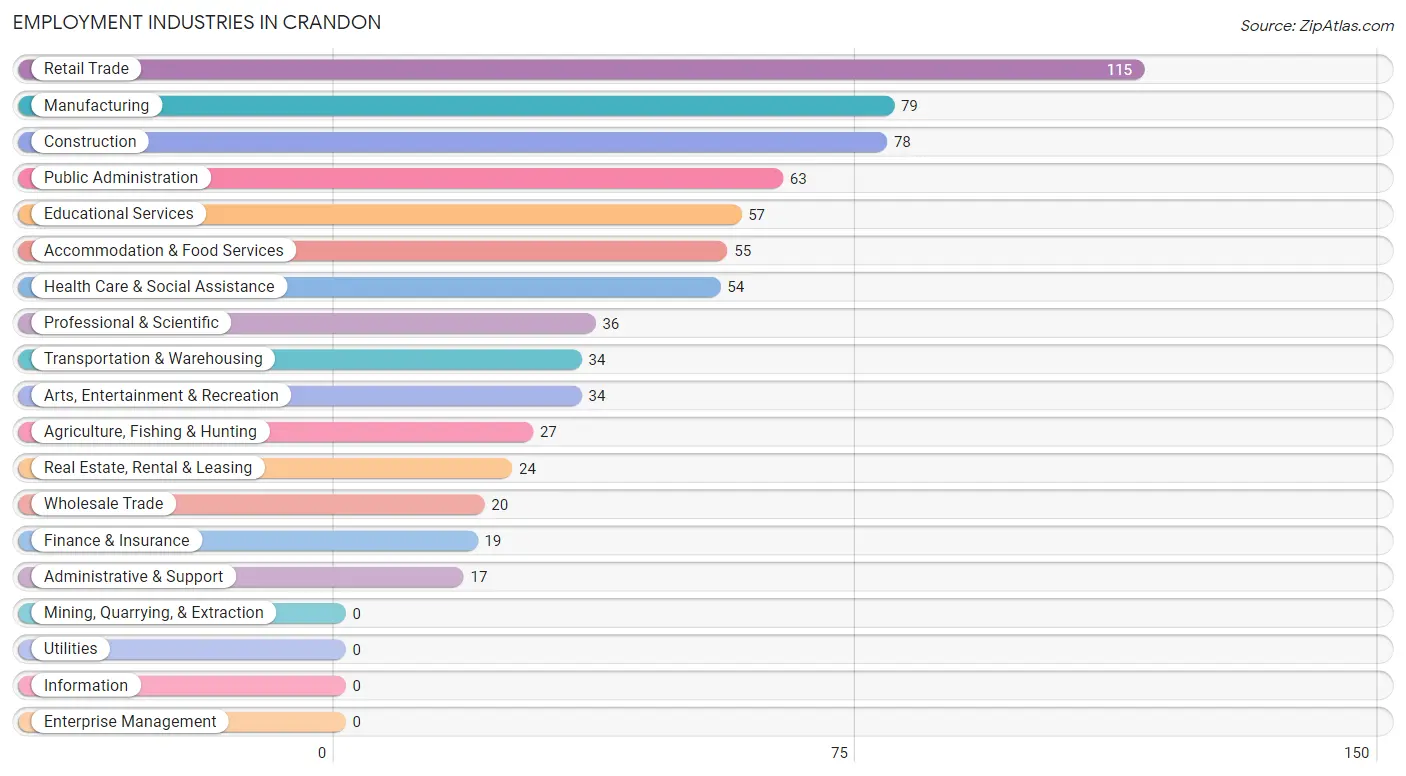
Employment Industries in Crandon
The major employment industries in Crandon include Retail Trade (115 | 15.3%), Manufacturing (79 | 10.5%), Construction (78 | 10.4%), Public Administration (63 | 8.4%), and Educational Services (57 | 7.6%).
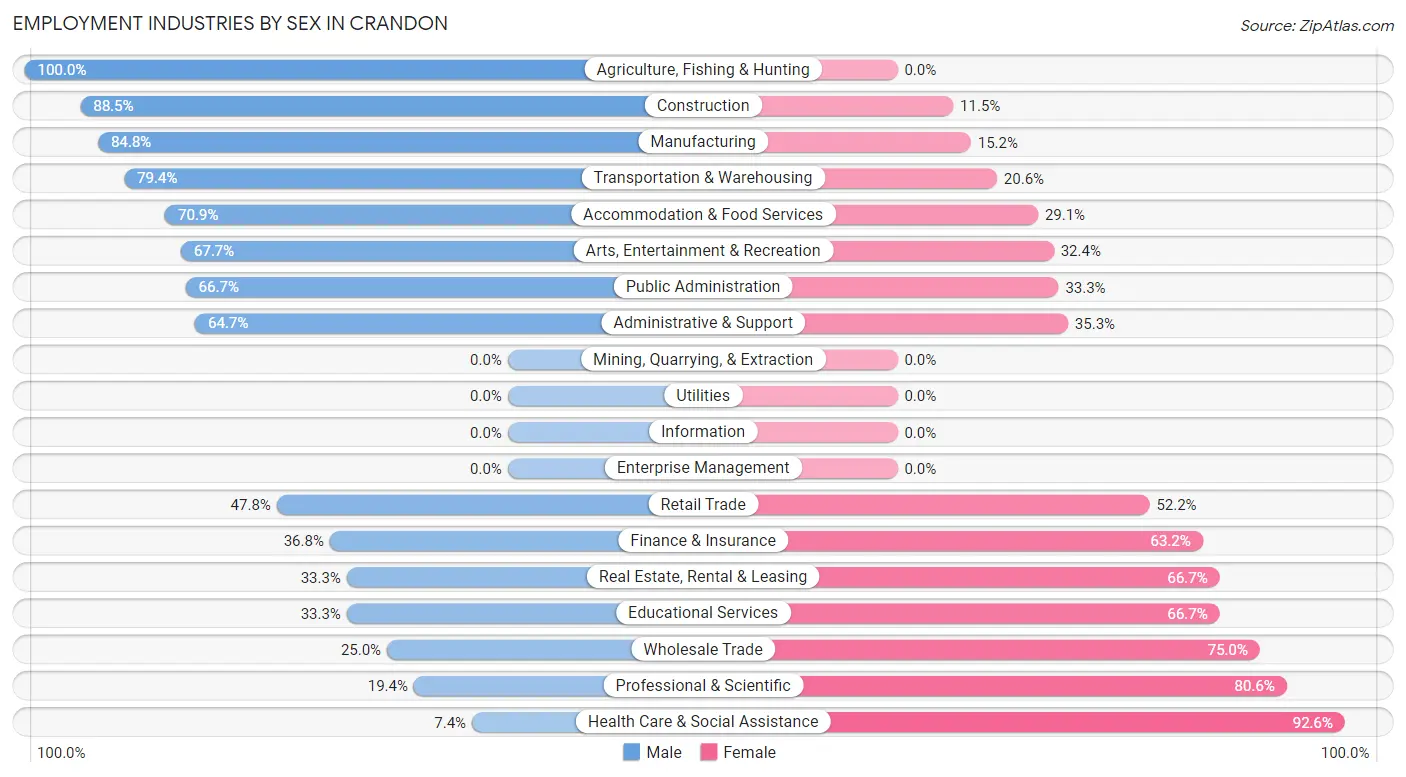
Employment Industries by Sex in Crandon
The Crandon industries that see more men than women are Agriculture, Fishing & Hunting (100.0%), Construction (88.5%), and Manufacturing (84.8%), whereas the industries that tend to have a higher number of women are Health Care & Social Assistance (92.6%), Professional & Scientific (80.6%), and Wholesale Trade (75.0%).
| Industry | Male | Female |
| Agriculture, Fishing & Hunting | 27 (100.0%) | 0 (0.0%) |
| Mining, Quarrying, & Extraction | 0 (0.0%) | 0 (0.0%) |
| Construction | 69 (88.5%) | 9 (11.5%) |
| Manufacturing | 67 (84.8%) | 12 (15.2%) |
| Wholesale Trade | 5 (25.0%) | 15 (75.0%) |
| Retail Trade | 55 (47.8%) | 60 (52.2%) |
| Transportation & Warehousing | 27 (79.4%) | 7 (20.6%) |
| Utilities | 0 (0.0%) | 0 (0.0%) |
| Information | 0 (0.0%) | 0 (0.0%) |
| Finance & Insurance | 7 (36.8%) | 12 (63.2%) |
| Real Estate, Rental & Leasing | 8 (33.3%) | 16 (66.7%) |
| Professional & Scientific | 7 (19.4%) | 29 (80.6%) |
| Enterprise Management | 0 (0.0%) | 0 (0.0%) |
| Administrative & Support | 11 (64.7%) | 6 (35.3%) |
| Educational Services | 19 (33.3%) | 38 (66.7%) |
| Health Care & Social Assistance | 4 (7.4%) | 50 (92.6%) |
| Arts, Entertainment & Recreation | 23 (67.6%) | 11 (32.4%) |
| Accommodation & Food Services | 39 (70.9%) | 16 (29.1%) |
| Public Administration | 42 (66.7%) | 21 (33.3%) |
| Total | 430 (57.2%) | 322 (42.8%) |
Education in Crandon
School Enrollment in Crandon
The most common levels of schooling among the 266 students in Crandon are high school (82 | 30.8%), college / undergraduate (62 | 23.3%), and middle school (57 | 21.4%).
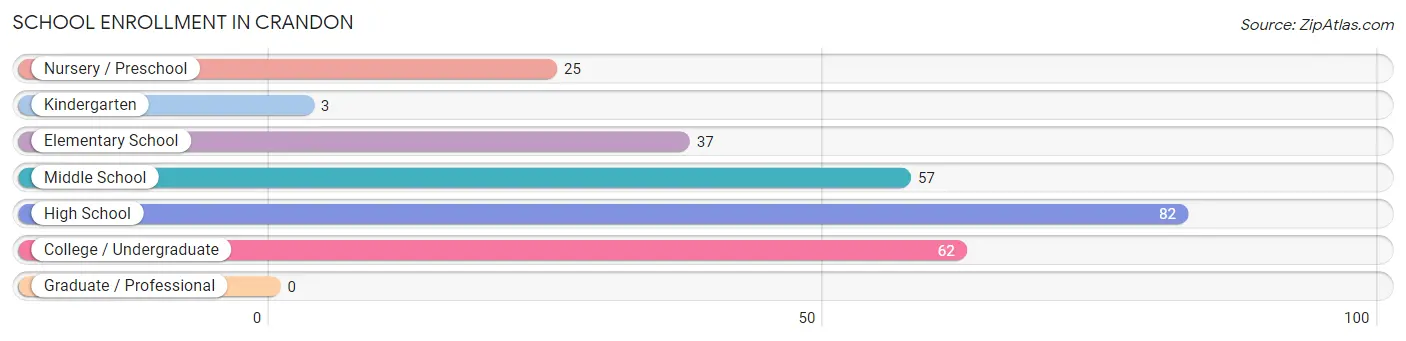
| School Level | # Students | % Students |
| Nursery / Preschool | 25 | 9.4% |
| Kindergarten | 3 | 1.1% |
| Elementary School | 37 | 13.9% |
| Middle School | 57 | 21.4% |
| High School | 82 | 30.8% |
| College / Undergraduate | 62 | 23.3% |
| Graduate / Professional | 0 | 0.0% |
| Total | 266 | 100.0% |
School Enrollment by Age by Funding Source in Crandon
Out of a total of 266 students who are enrolled in schools in Crandon, 11 (4.1%) attend a private institution, while the remaining 255 (95.9%) are enrolled in public schools. The age group of 35 years and over has the highest likelihood of being enrolled in private schools, with 11 (100.0% in the age bracket) enrolled. Conversely, the age group of 3 to 4 year olds has the lowest likelihood of being enrolled in a private school, with 25 (100.0% in the age bracket) attending a public institution.
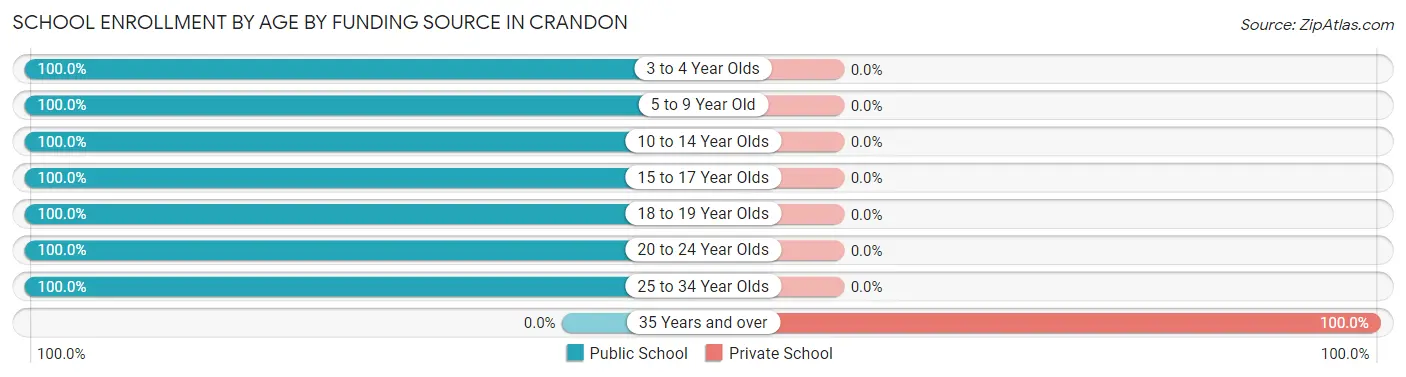
| Age Bracket | Public School | Private School |
| 3 to 4 Year Olds | 25 (100.0%) | 0 (0.0%) |
| 5 to 9 Year Old | 36 (100.0%) | 0 (0.0%) |
| 10 to 14 Year Olds | 54 (100.0%) | 0 (0.0%) |
| 15 to 17 Year Olds | 78 (100.0%) | 0 (0.0%) |
| 18 to 19 Year Olds | 20 (100.0%) | 0 (0.0%) |
| 20 to 24 Year Olds | 4 (100.0%) | 0 (0.0%) |
| 25 to 34 Year Olds | 38 (100.0%) | 0 (0.0%) |
| 35 Years and over | 0 (0.0%) | 11 (100.0%) |
| Total | 255 (95.9%) | 11 (4.1%) |
Educational Attainment by Field of Study in Crandon
Arts & humanities (37 | 17.9%), social sciences (33 | 15.9%), education (28 | 13.5%), bio, nature & agricultural (21 | 10.1%), and liberal arts & history (21 | 10.1%) are the most common fields of study among 207 individuals in Crandon who have obtained a bachelor's degree or higher.
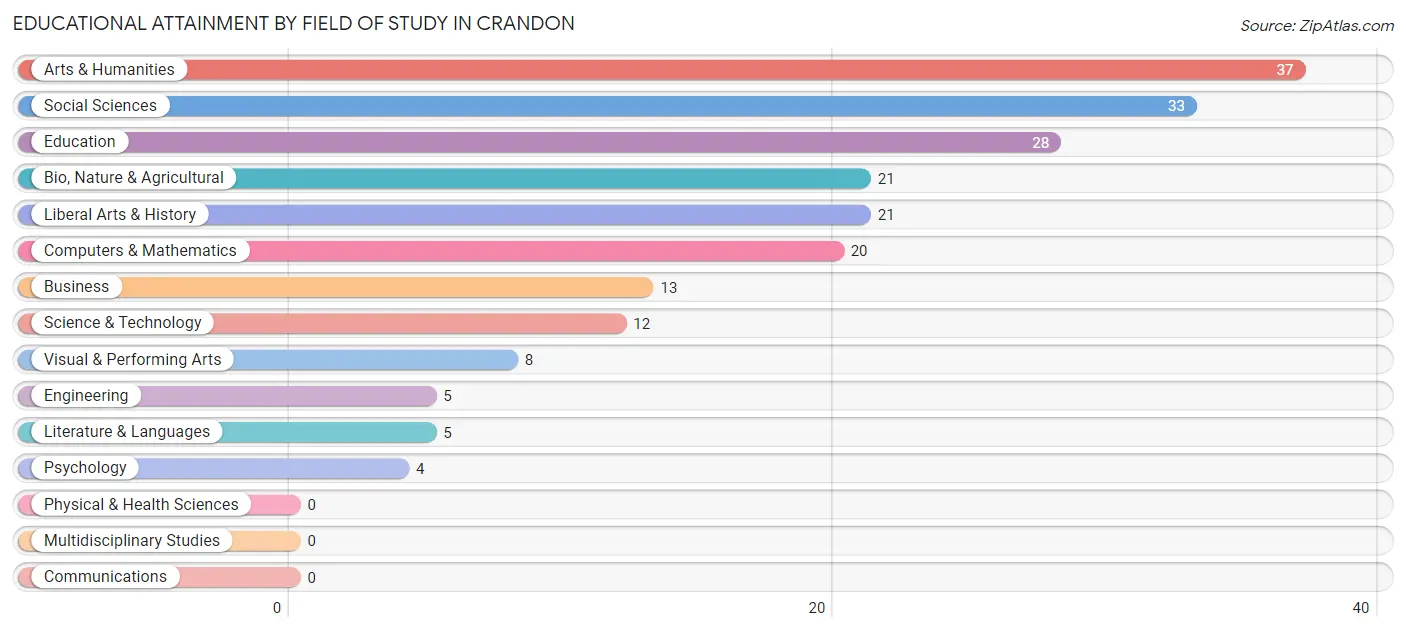
| Field of Study | # Graduates | % Graduates |
| Computers & Mathematics | 20 | 9.7% |
| Bio, Nature & Agricultural | 21 | 10.1% |
| Physical & Health Sciences | 0 | 0.0% |
| Psychology | 4 | 1.9% |
| Social Sciences | 33 | 15.9% |
| Engineering | 5 | 2.4% |
| Multidisciplinary Studies | 0 | 0.0% |
| Science & Technology | 12 | 5.8% |
| Business | 13 | 6.3% |
| Education | 28 | 13.5% |
| Literature & Languages | 5 | 2.4% |
| Liberal Arts & History | 21 | 10.1% |
| Visual & Performing Arts | 8 | 3.9% |
| Communications | 0 | 0.0% |
| Arts & Humanities | 37 | 17.9% |
| Total | 207 | 100.0% |
Transportation & Commute in Crandon
Vehicle Availability by Sex in Crandon
The most prevalent vehicle ownership categories in Crandon are males with 2 vehicles (179, accounting for 41.6%) and females with 2 vehicles (118, making up 55.9%).
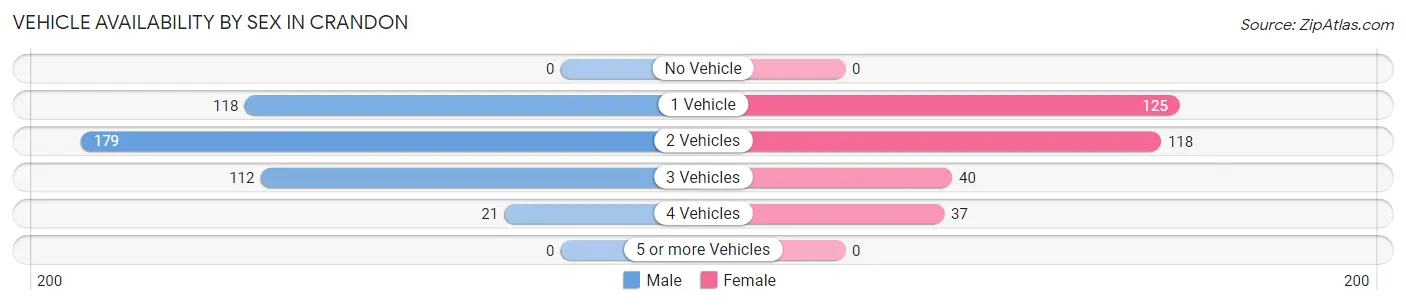
| Vehicles Available | Male | Female |
| No Vehicle | 0 (0.0%) | 0 (0.0%) |
| 1 Vehicle | 118 (27.4%) | 125 (39.1%) |
| 2 Vehicles | 179 (41.6%) | 118 (36.9%) |
| 3 Vehicles | 112 (26.1%) | 40 (12.5%) |
| 4 Vehicles | 21 (4.9%) | 37 (11.6%) |
| 5 or more Vehicles | 0 (0.0%) | 0 (0.0%) |
| Total | 430 (100.0%) | 320 (100.0%) |
Commute Time in Crandon
The most frequently occuring commute durations in Crandon are 5 to 9 minutes (149 commuters, 21.0%), less than 5 minutes (118 commuters, 16.6%), and 10 to 14 minutes (107 commuters, 15.0%).
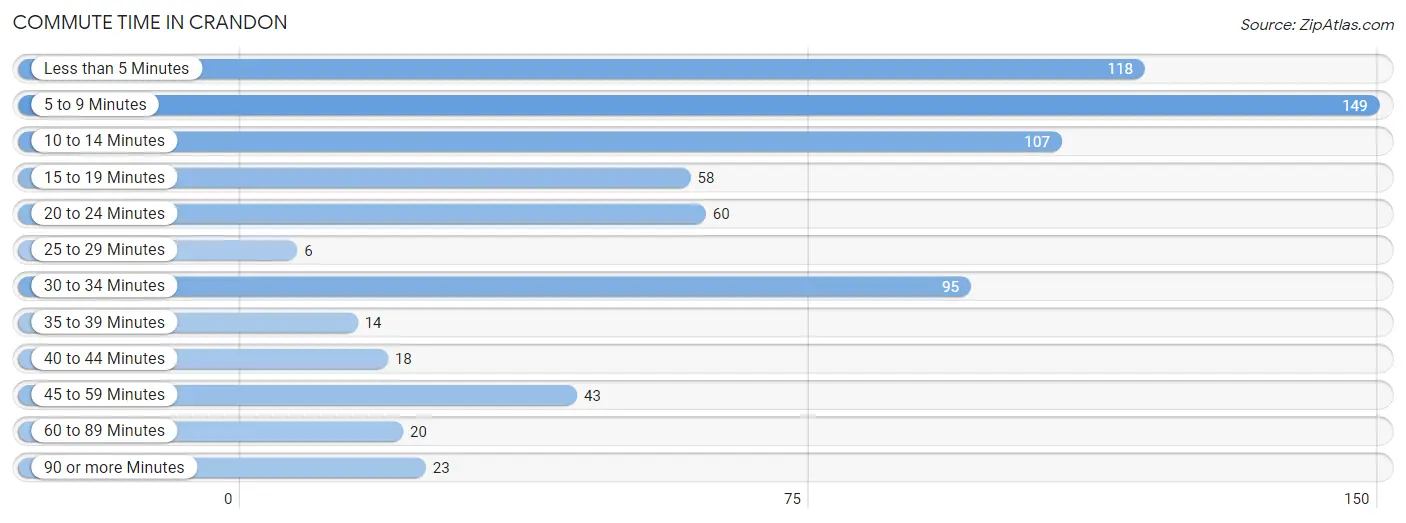
| Commute Time | # Commuters | % Commuters |
| Less than 5 Minutes | 118 | 16.6% |
| 5 to 9 Minutes | 149 | 21.0% |
| 10 to 14 Minutes | 107 | 15.0% |
| 15 to 19 Minutes | 58 | 8.2% |
| 20 to 24 Minutes | 60 | 8.4% |
| 25 to 29 Minutes | 6 | 0.8% |
| 30 to 34 Minutes | 95 | 13.4% |
| 35 to 39 Minutes | 14 | 2.0% |
| 40 to 44 Minutes | 18 | 2.5% |
| 45 to 59 Minutes | 43 | 6.0% |
| 60 to 89 Minutes | 20 | 2.8% |
| 90 or more Minutes | 23 | 3.2% |
Commute Time by Sex in Crandon
The most common commute times in Crandon are 5 to 9 minutes (80 commuters, 19.4%) for males and less than 5 minutes (90 commuters, 30.1%) for females.
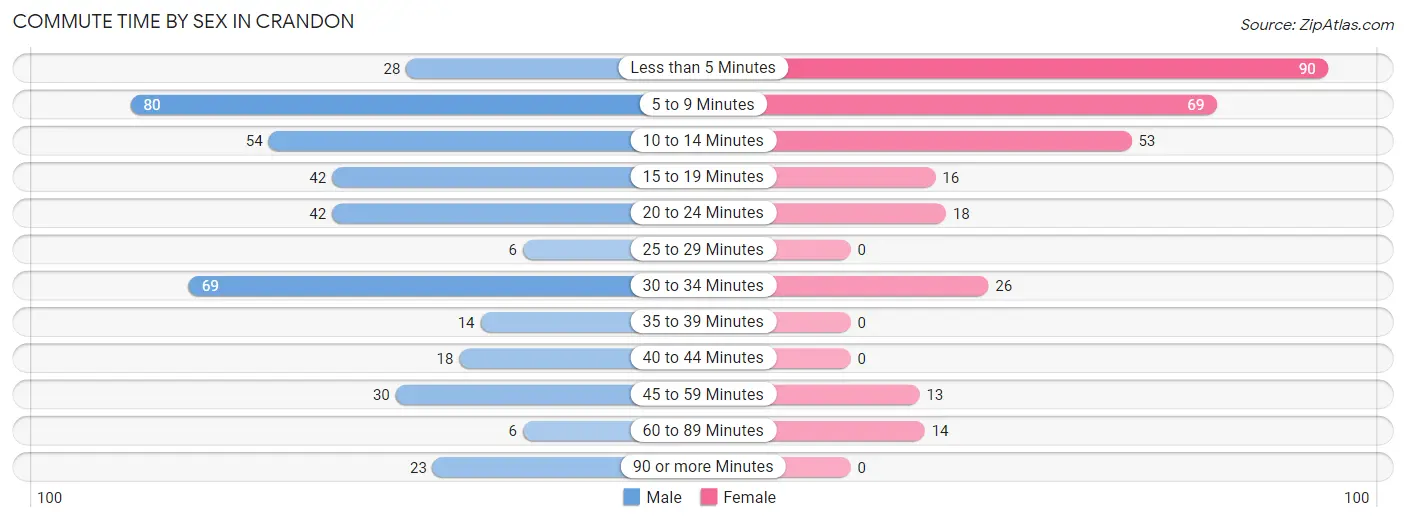
| Commute Time | Male | Female |
| Less than 5 Minutes | 28 (6.8%) | 90 (30.1%) |
| 5 to 9 Minutes | 80 (19.4%) | 69 (23.1%) |
| 10 to 14 Minutes | 54 (13.1%) | 53 (17.7%) |
| 15 to 19 Minutes | 42 (10.2%) | 16 (5.3%) |
| 20 to 24 Minutes | 42 (10.2%) | 18 (6.0%) |
| 25 to 29 Minutes | 6 (1.5%) | 0 (0.0%) |
| 30 to 34 Minutes | 69 (16.8%) | 26 (8.7%) |
| 35 to 39 Minutes | 14 (3.4%) | 0 (0.0%) |
| 40 to 44 Minutes | 18 (4.4%) | 0 (0.0%) |
| 45 to 59 Minutes | 30 (7.3%) | 13 (4.3%) |
| 60 to 89 Minutes | 6 (1.5%) | 14 (4.7%) |
| 90 or more Minutes | 23 (5.6%) | 0 (0.0%) |
Time of Departure to Work by Sex in Crandon
The most frequent times of departure to work in Crandon are 7:30 AM to 7:59 AM (93, 22.6%) for males and 7:00 AM to 7:29 AM (87, 29.1%) for females.
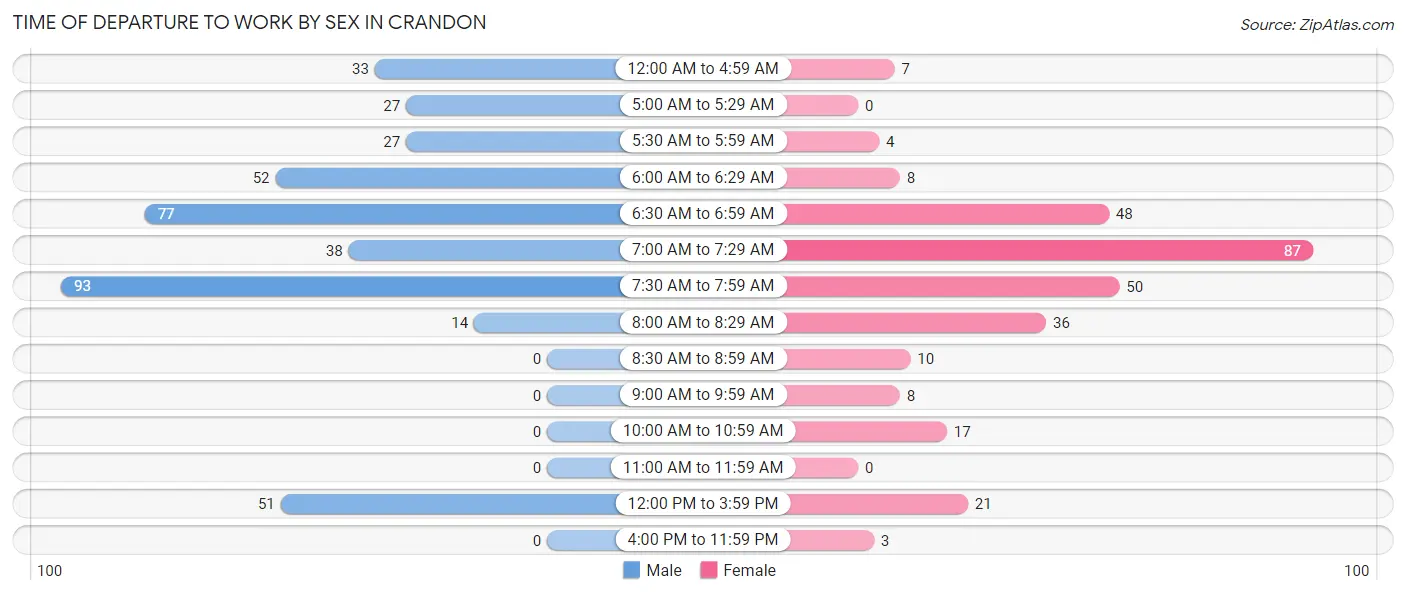
| Time of Departure | Male | Female |
| 12:00 AM to 4:59 AM | 33 (8.0%) | 7 (2.3%) |
| 5:00 AM to 5:29 AM | 27 (6.6%) | 0 (0.0%) |
| 5:30 AM to 5:59 AM | 27 (6.6%) | 4 (1.3%) |
| 6:00 AM to 6:29 AM | 52 (12.6%) | 8 (2.7%) |
| 6:30 AM to 6:59 AM | 77 (18.7%) | 48 (16.1%) |
| 7:00 AM to 7:29 AM | 38 (9.2%) | 87 (29.1%) |
| 7:30 AM to 7:59 AM | 93 (22.6%) | 50 (16.7%) |
| 8:00 AM to 8:29 AM | 14 (3.4%) | 36 (12.0%) |
| 8:30 AM to 8:59 AM | 0 (0.0%) | 10 (3.3%) |
| 9:00 AM to 9:59 AM | 0 (0.0%) | 8 (2.7%) |
| 10:00 AM to 10:59 AM | 0 (0.0%) | 17 (5.7%) |
| 11:00 AM to 11:59 AM | 0 (0.0%) | 0 (0.0%) |
| 12:00 PM to 3:59 PM | 51 (12.4%) | 21 (7.0%) |
| 4:00 PM to 11:59 PM | 0 (0.0%) | 3 (1.0%) |
| Total | 412 (100.0%) | 299 (100.0%) |
Housing Occupancy in Crandon
Occupancy by Ownership in Crandon
Of the total 700 dwellings in Crandon, owner-occupied units account for 446 (63.7%), while renter-occupied units make up 254 (36.3%).
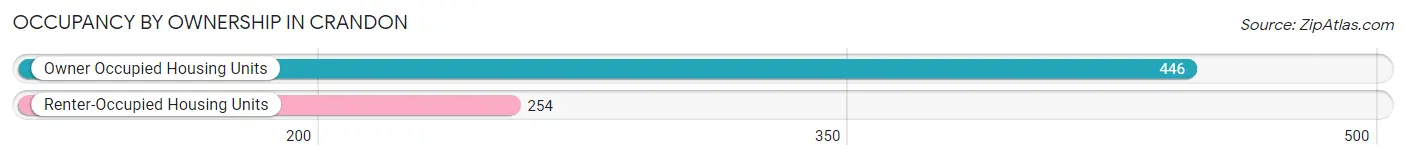
| Occupancy | # Housing Units | % Housing Units |
| Owner Occupied Housing Units | 446 | 63.7% |
| Renter-Occupied Housing Units | 254 | 36.3% |
| Total Occupied Housing Units | 700 | 100.0% |
Occupancy by Household Size in Crandon
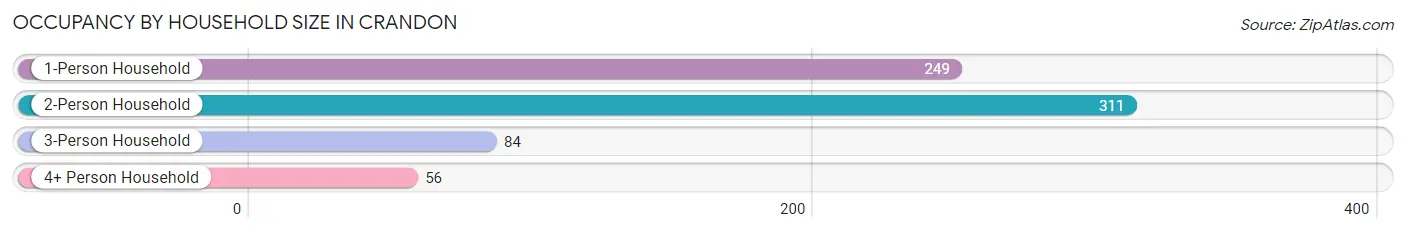
| Household Size | # Housing Units | % Housing Units |
| 1-Person Household | 249 | 35.6% |
| 2-Person Household | 311 | 44.4% |
| 3-Person Household | 84 | 12.0% |
| 4+ Person Household | 56 | 8.0% |
| Total Housing Units | 700 | 100.0% |
Occupancy by Ownership by Household Size in Crandon
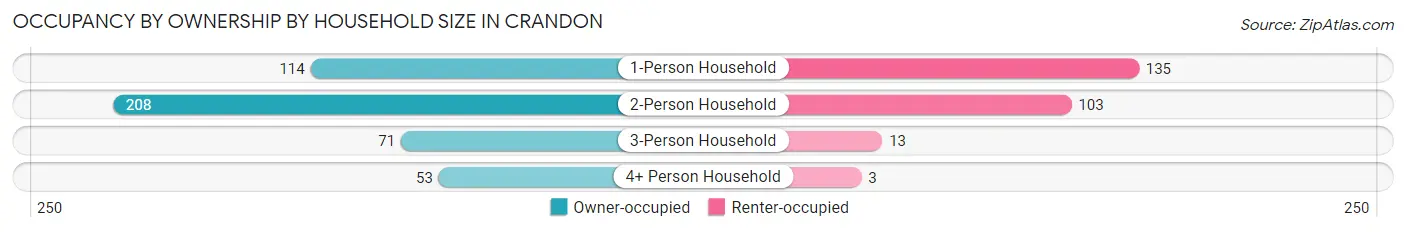
| Household Size | Owner-occupied | Renter-occupied |
| 1-Person Household | 114 (45.8%) | 135 (54.2%) |
| 2-Person Household | 208 (66.9%) | 103 (33.1%) |
| 3-Person Household | 71 (84.5%) | 13 (15.5%) |
| 4+ Person Household | 53 (94.6%) | 3 (5.4%) |
| Total Housing Units | 446 (63.7%) | 254 (36.3%) |
Occupancy by Educational Attainment in Crandon
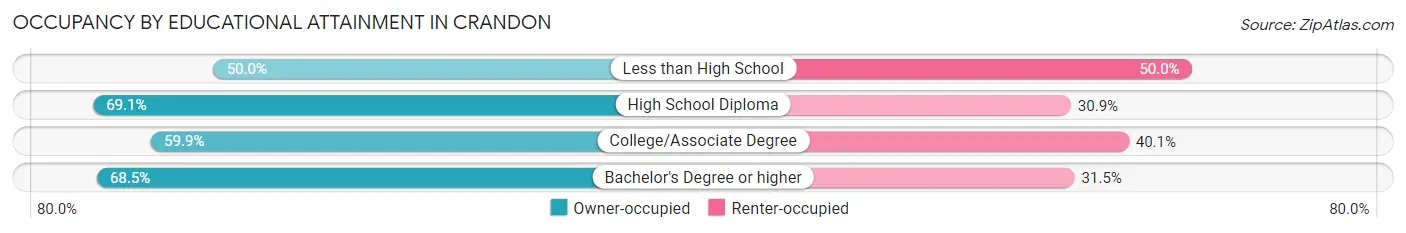
| Household Size | Owner-occupied | Renter-occupied |
| Less than High School | 33 (50.0%) | 33 (50.0%) |
| High School Diploma | 179 (69.1%) | 80 (30.9%) |
| College/Associate Degree | 160 (59.9%) | 107 (40.1%) |
| Bachelor's Degree or higher | 74 (68.5%) | 34 (31.5%) |
Occupancy by Age of Householder in Crandon
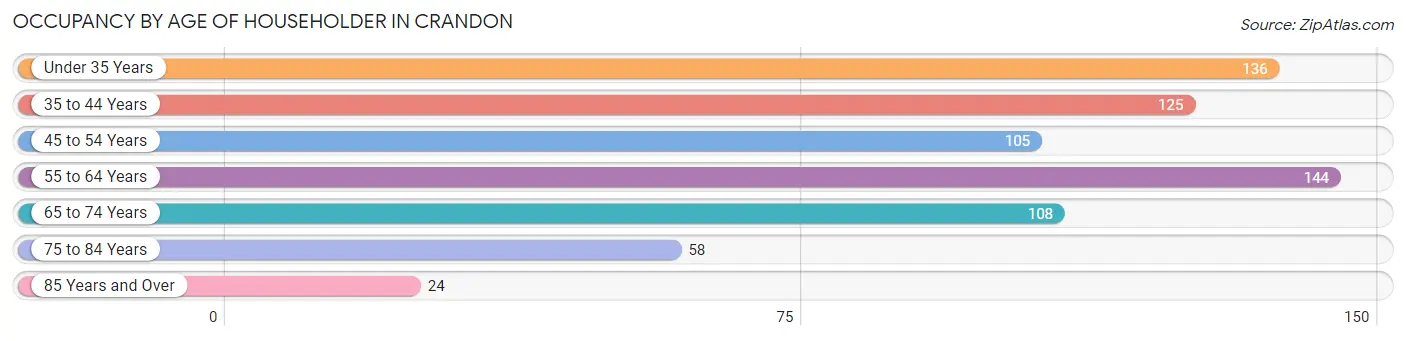
| Age Bracket | # Households | % Households |
| Under 35 Years | 136 | 19.4% |
| 35 to 44 Years | 125 | 17.9% |
| 45 to 54 Years | 105 | 15.0% |
| 55 to 64 Years | 144 | 20.6% |
| 65 to 74 Years | 108 | 15.4% |
| 75 to 84 Years | 58 | 8.3% |
| 85 Years and Over | 24 | 3.4% |
| Total | 700 | 100.0% |
Housing Finances in Crandon
Median Income by Occupancy in Crandon
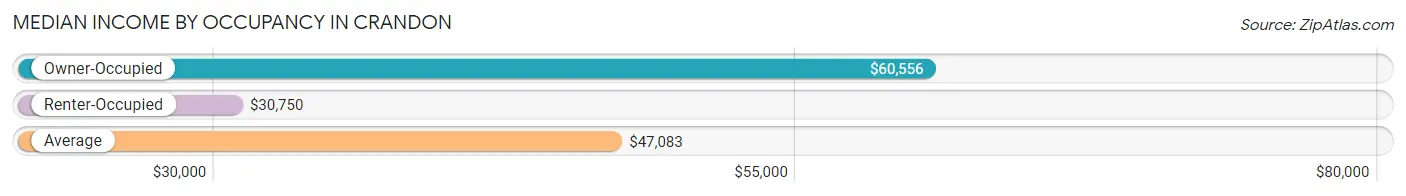
| Occupancy Type | # Households | Median Income |
| Owner-Occupied | 446 (63.7%) | $60,556 |
| Renter-Occupied | 254 (36.3%) | $30,750 |
| Average | 700 (100.0%) | $47,083 |
Occupancy by Householder Income Bracket in Crandon
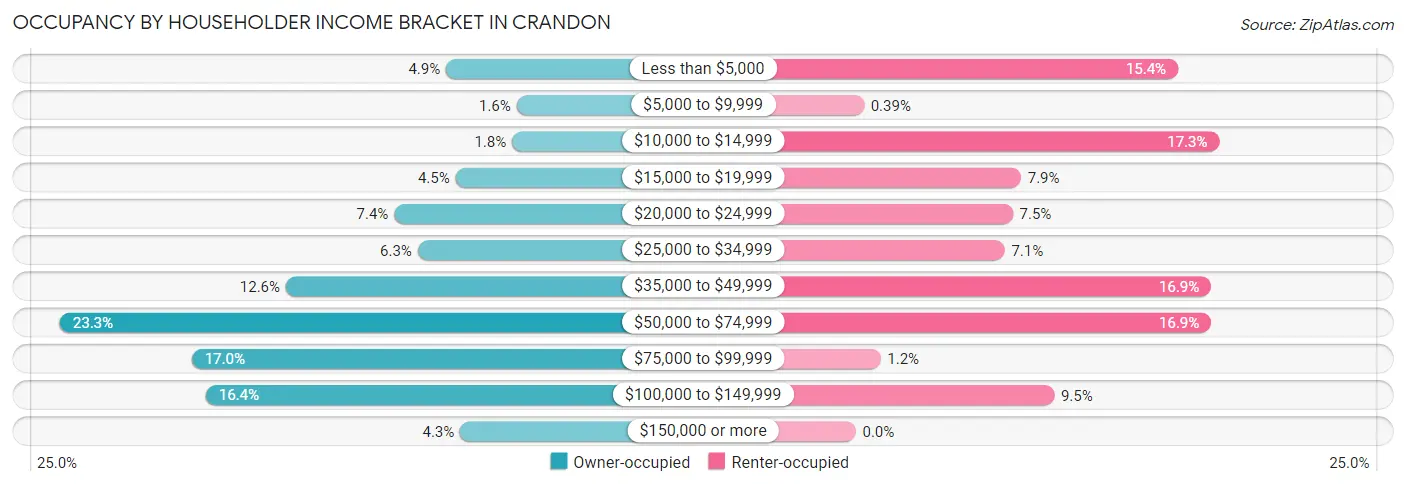
| Income Bracket | Owner-occupied | Renter-occupied |
| Less than $5,000 | 22 (4.9%) | 39 (15.3%) |
| $5,000 to $9,999 | 7 (1.6%) | 1 (0.4%) |
| $10,000 to $14,999 | 8 (1.8%) | 44 (17.3%) |
| $15,000 to $19,999 | 20 (4.5%) | 20 (7.9%) |
| $20,000 to $24,999 | 33 (7.4%) | 19 (7.5%) |
| $25,000 to $34,999 | 28 (6.3%) | 18 (7.1%) |
| $35,000 to $49,999 | 56 (12.6%) | 43 (16.9%) |
| $50,000 to $74,999 | 104 (23.3%) | 43 (16.9%) |
| $75,000 to $99,999 | 76 (17.0%) | 3 (1.2%) |
| $100,000 to $149,999 | 73 (16.4%) | 24 (9.5%) |
| $150,000 or more | 19 (4.3%) | 0 (0.0%) |
| Total | 446 (100.0%) | 254 (100.0%) |
Monthly Housing Cost Tiers in Crandon
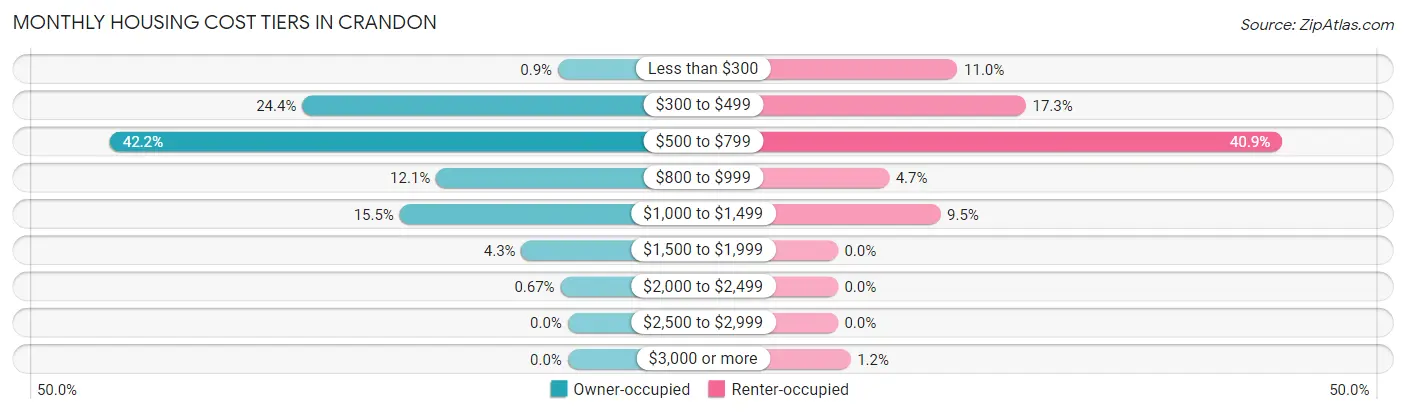
| Monthly Cost | Owner-occupied | Renter-occupied |
| Less than $300 | 4 (0.9%) | 28 (11.0%) |
| $300 to $499 | 109 (24.4%) | 44 (17.3%) |
| $500 to $799 | 188 (42.1%) | 104 (40.9%) |
| $800 to $999 | 54 (12.1%) | 12 (4.7%) |
| $1,000 to $1,499 | 69 (15.5%) | 24 (9.5%) |
| $1,500 to $1,999 | 19 (4.3%) | 0 (0.0%) |
| $2,000 to $2,499 | 3 (0.7%) | 0 (0.0%) |
| $2,500 to $2,999 | 0 (0.0%) | 0 (0.0%) |
| $3,000 or more | 0 (0.0%) | 3 (1.2%) |
| Total | 446 (100.0%) | 254 (100.0%) |
Physical Housing Characteristics in Crandon
Housing Structures in Crandon
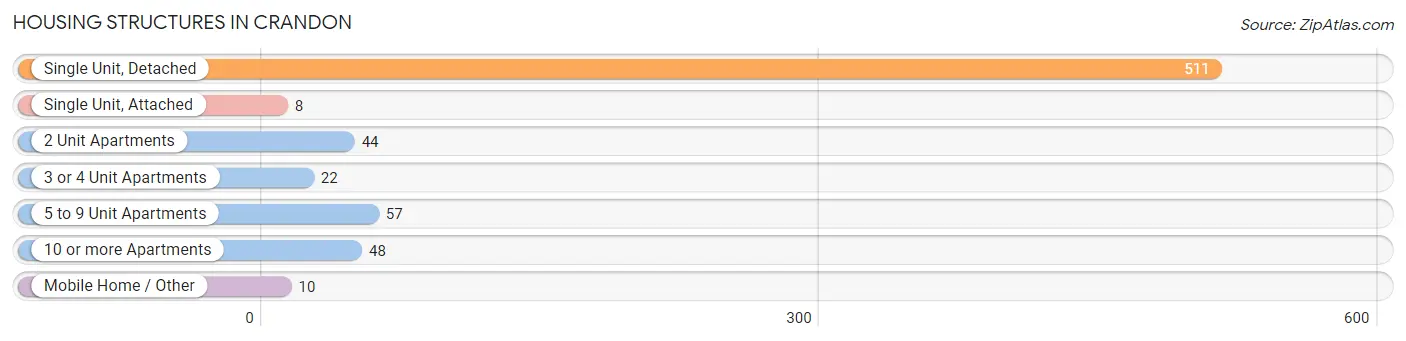
| Structure Type | # Housing Units | % Housing Units |
| Single Unit, Detached | 511 | 73.0% |
| Single Unit, Attached | 8 | 1.1% |
| 2 Unit Apartments | 44 | 6.3% |
| 3 or 4 Unit Apartments | 22 | 3.1% |
| 5 to 9 Unit Apartments | 57 | 8.1% |
| 10 or more Apartments | 48 | 6.9% |
| Mobile Home / Other | 10 | 1.4% |
| Total | 700 | 100.0% |
Housing Structures by Occupancy in Crandon
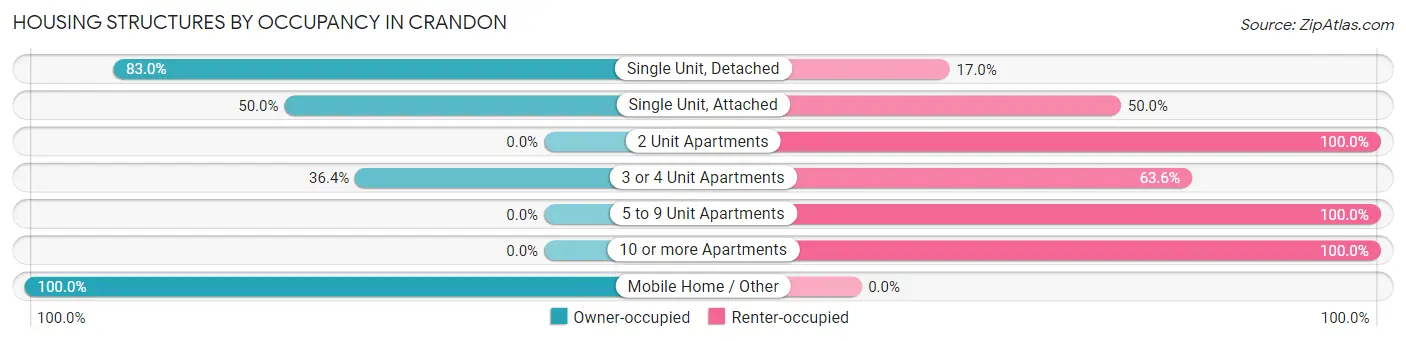
| Structure Type | Owner-occupied | Renter-occupied |
| Single Unit, Detached | 424 (83.0%) | 87 (17.0%) |
| Single Unit, Attached | 4 (50.0%) | 4 (50.0%) |
| 2 Unit Apartments | 0 (0.0%) | 44 (100.0%) |
| 3 or 4 Unit Apartments | 8 (36.4%) | 14 (63.6%) |
| 5 to 9 Unit Apartments | 0 (0.0%) | 57 (100.0%) |
| 10 or more Apartments | 0 (0.0%) | 48 (100.0%) |
| Mobile Home / Other | 10 (100.0%) | 0 (0.0%) |
| Total | 446 (63.7%) | 254 (36.3%) |
Housing Structures by Number of Rooms in Crandon
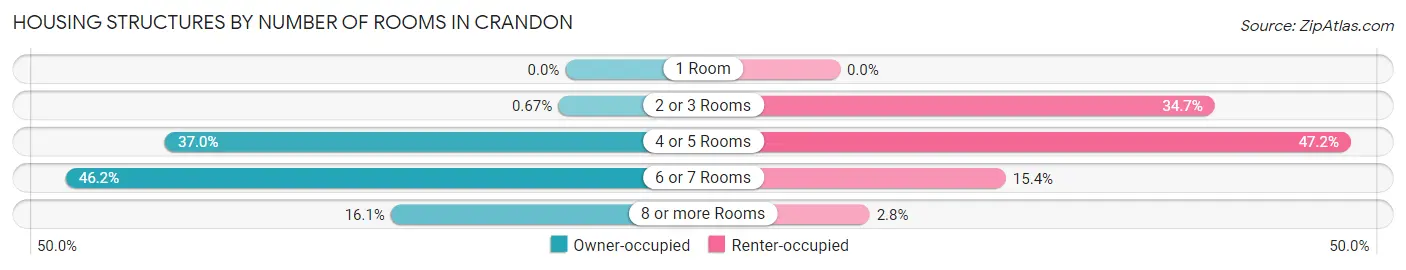
| Number of Rooms | Owner-occupied | Renter-occupied |
| 1 Room | 0 (0.0%) | 0 (0.0%) |
| 2 or 3 Rooms | 3 (0.7%) | 88 (34.6%) |
| 4 or 5 Rooms | 165 (37.0%) | 120 (47.2%) |
| 6 or 7 Rooms | 206 (46.2%) | 39 (15.3%) |
| 8 or more Rooms | 72 (16.1%) | 7 (2.8%) |
| Total | 446 (100.0%) | 254 (100.0%) |
Housing Structure by Heating Type in Crandon
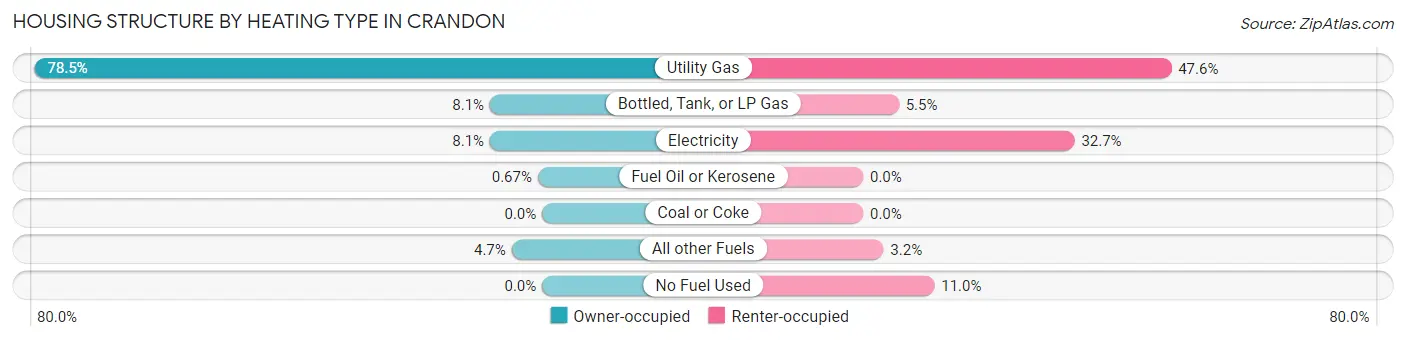
| Heating Type | Owner-occupied | Renter-occupied |
| Utility Gas | 350 (78.5%) | 121 (47.6%) |
| Bottled, Tank, or LP Gas | 36 (8.1%) | 14 (5.5%) |
| Electricity | 36 (8.1%) | 83 (32.7%) |
| Fuel Oil or Kerosene | 3 (0.7%) | 0 (0.0%) |
| Coal or Coke | 0 (0.0%) | 0 (0.0%) |
| All other Fuels | 21 (4.7%) | 8 (3.2%) |
| No Fuel Used | 0 (0.0%) | 28 (11.0%) |
| Total | 446 (100.0%) | 254 (100.0%) |
Household Vehicle Usage in Crandon
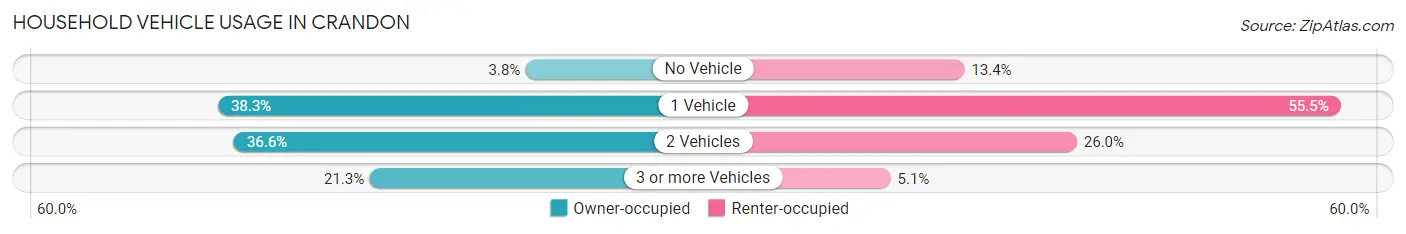
| Vehicles per Household | Owner-occupied | Renter-occupied |
| No Vehicle | 17 (3.8%) | 34 (13.4%) |
| 1 Vehicle | 171 (38.3%) | 141 (55.5%) |
| 2 Vehicles | 163 (36.5%) | 66 (26.0%) |
| 3 or more Vehicles | 95 (21.3%) | 13 (5.1%) |
| Total | 446 (100.0%) | 254 (100.0%) |
Real Estate & Mortgages in Crandon
Real Estate and Mortgage Overview in Crandon
| Characteristic | Without Mortgage | With Mortgage |
| Housing Units | 225 | 221 |
| Median Property Value | $143,200 | $97,000 |
| Median Household Income | $61,250 | $5 |
| Monthly Housing Costs | $505 | $0 |
| Real Estate Taxes | $2,392 | $0 |
Property Value by Mortgage Status in Crandon
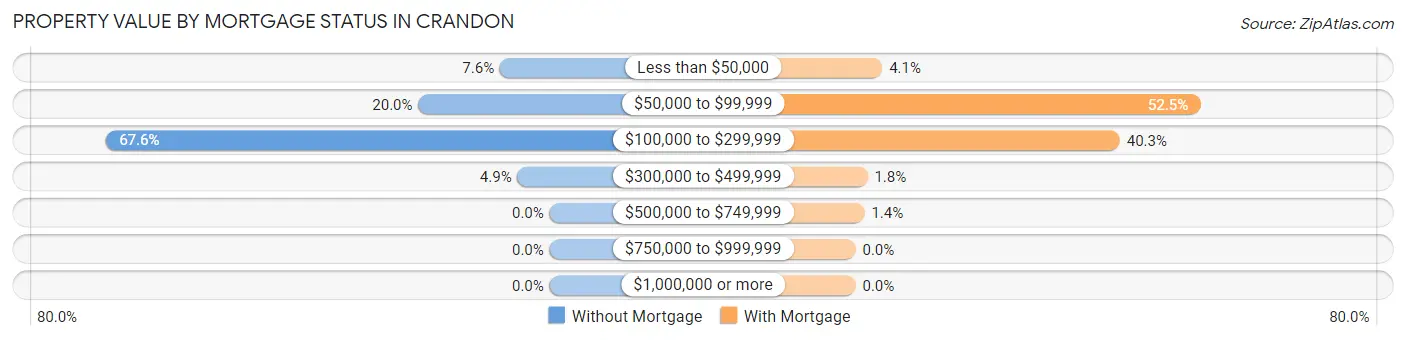
| Property Value | Without Mortgage | With Mortgage |
| Less than $50,000 | 17 (7.6%) | 9 (4.1%) |
| $50,000 to $99,999 | 45 (20.0%) | 116 (52.5%) |
| $100,000 to $299,999 | 152 (67.6%) | 89 (40.3%) |
| $300,000 to $499,999 | 11 (4.9%) | 4 (1.8%) |
| $500,000 to $749,999 | 0 (0.0%) | 3 (1.4%) |
| $750,000 to $999,999 | 0 (0.0%) | 0 (0.0%) |
| $1,000,000 or more | 0 (0.0%) | 0 (0.0%) |
| Total | 225 (100.0%) | 221 (100.0%) |
Household Income by Mortgage Status in Crandon
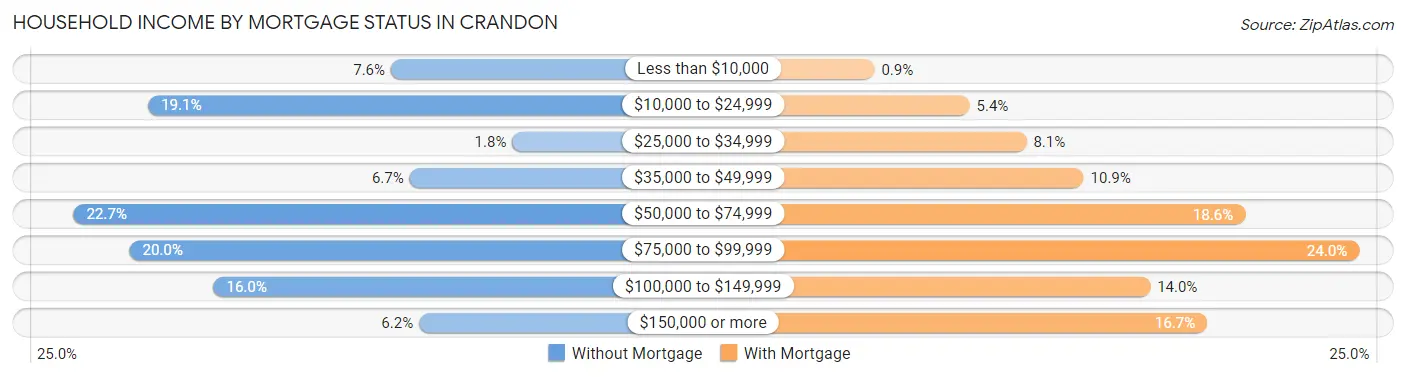
| Household Income | Without Mortgage | With Mortgage |
| Less than $10,000 | 17 (7.6%) | 2 (0.9%) |
| $10,000 to $24,999 | 43 (19.1%) | 12 (5.4%) |
| $25,000 to $34,999 | 4 (1.8%) | 18 (8.1%) |
| $35,000 to $49,999 | 15 (6.7%) | 24 (10.9%) |
| $50,000 to $74,999 | 51 (22.7%) | 41 (18.5%) |
| $75,000 to $99,999 | 45 (20.0%) | 53 (24.0%) |
| $100,000 to $149,999 | 36 (16.0%) | 31 (14.0%) |
| $150,000 or more | 14 (6.2%) | 37 (16.7%) |
| Total | 225 (100.0%) | 221 (100.0%) |
Property Value to Household Income Ratio in Crandon
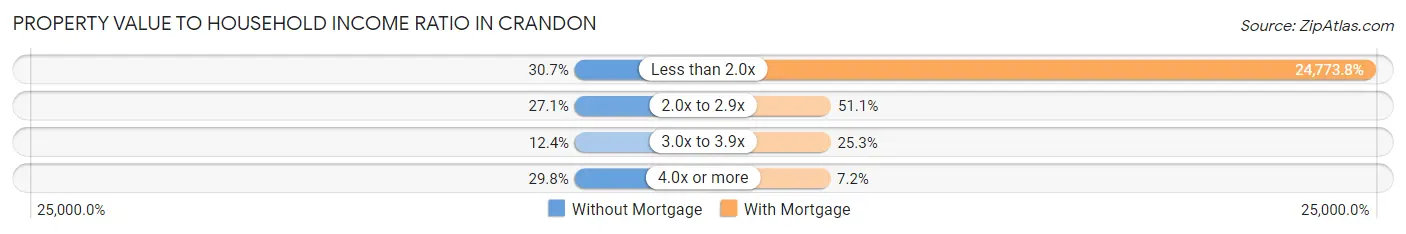
| Value-to-Income Ratio | Without Mortgage | With Mortgage |
| Less than 2.0x | 69 (30.7%) | 54,750 (24,773.8%) |
| 2.0x to 2.9x | 61 (27.1%) | 113 (51.1%) |
| 3.0x to 3.9x | 28 (12.4%) | 56 (25.3%) |
| 4.0x or more | 67 (29.8%) | 16 (7.2%) |
| Total | 225 (100.0%) | 221 (100.0%) |
Real Estate Taxes by Mortgage Status in Crandon
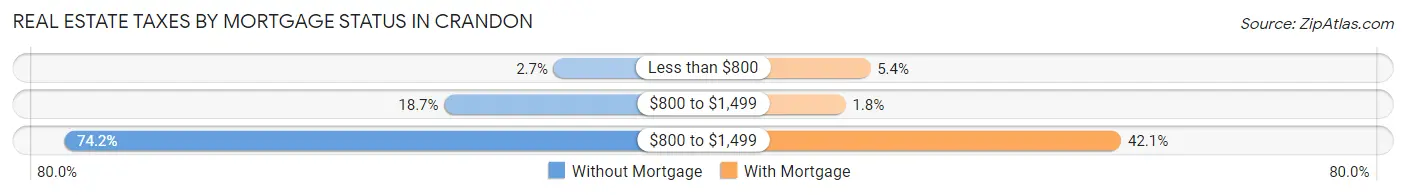
| Property Taxes | Without Mortgage | With Mortgage |
| Less than $800 | 6 (2.7%) | 12 (5.4%) |
| $800 to $1,499 | 42 (18.7%) | 4 (1.8%) |
| $800 to $1,499 | 167 (74.2%) | 93 (42.1%) |
| Total | 225 (100.0%) | 221 (100.0%) |
Health & Disability in Crandon
Health Insurance Coverage by Age in Crandon
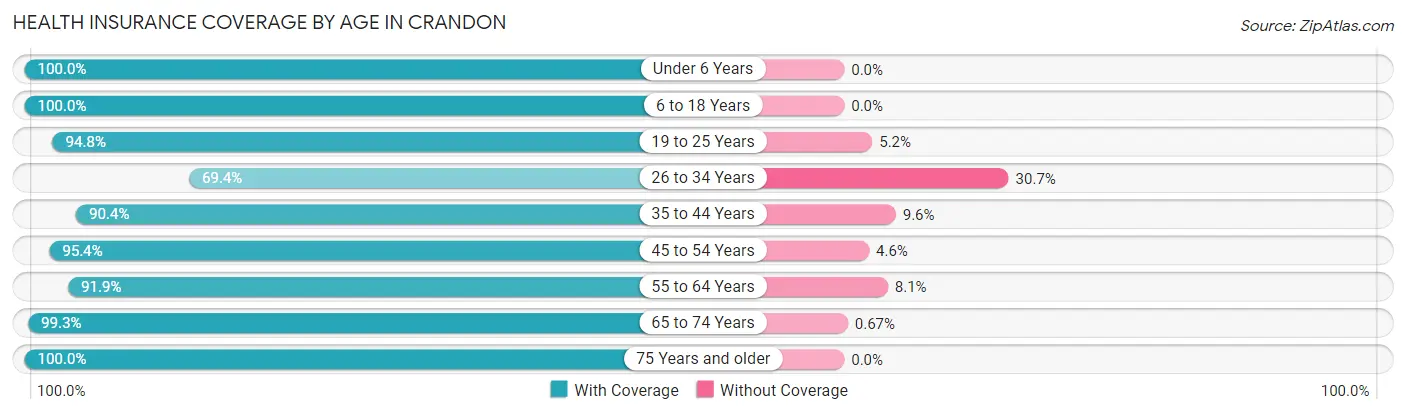
| Age Bracket | With Coverage | Without Coverage |
| Under 6 Years | 93 (100.0%) | 0 (0.0%) |
| 6 to 18 Years | 181 (100.0%) | 0 (0.0%) |
| 19 to 25 Years | 127 (94.8%) | 7 (5.2%) |
| 26 to 34 Years | 138 (69.4%) | 61 (30.6%) |
| 35 to 44 Years | 160 (90.4%) | 17 (9.6%) |
| 45 to 54 Years | 186 (95.4%) | 9 (4.6%) |
| 55 to 64 Years | 215 (91.9%) | 19 (8.1%) |
| 65 to 74 Years | 149 (99.3%) | 1 (0.7%) |
| 75 Years and older | 102 (100.0%) | 0 (0.0%) |
| Total | 1,351 (92.2%) | 114 (7.8%) |
Health Insurance Coverage by Citizenship Status in Crandon
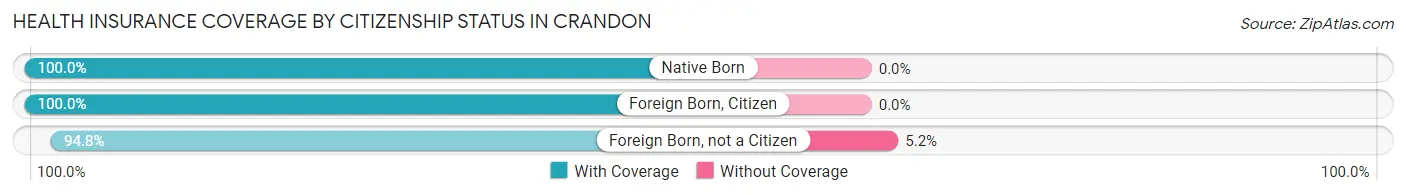
| Citizenship Status | With Coverage | Without Coverage |
| Native Born | 93 (100.0%) | 0 (0.0%) |
| Foreign Born, Citizen | 181 (100.0%) | 0 (0.0%) |
| Foreign Born, not a Citizen | 127 (94.8%) | 7 (5.2%) |
Health Insurance Coverage by Household Income in Crandon
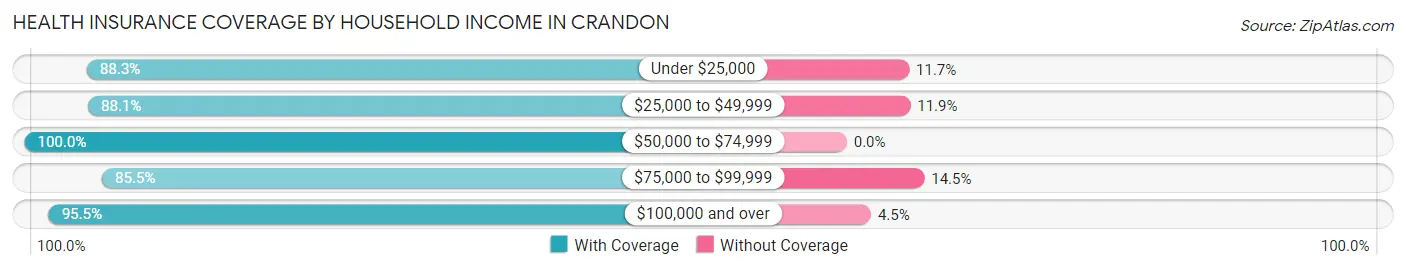
| Household Income | With Coverage | Without Coverage |
| Under $25,000 | 257 (88.3%) | 34 (11.7%) |
| $25,000 to $49,999 | 274 (88.1%) | 37 (11.9%) |
| $50,000 to $74,999 | 321 (100.0%) | 0 (0.0%) |
| $75,000 to $99,999 | 159 (85.5%) | 27 (14.5%) |
| $100,000 and over | 337 (95.5%) | 16 (4.5%) |
Public vs Private Health Insurance Coverage by Age in Crandon
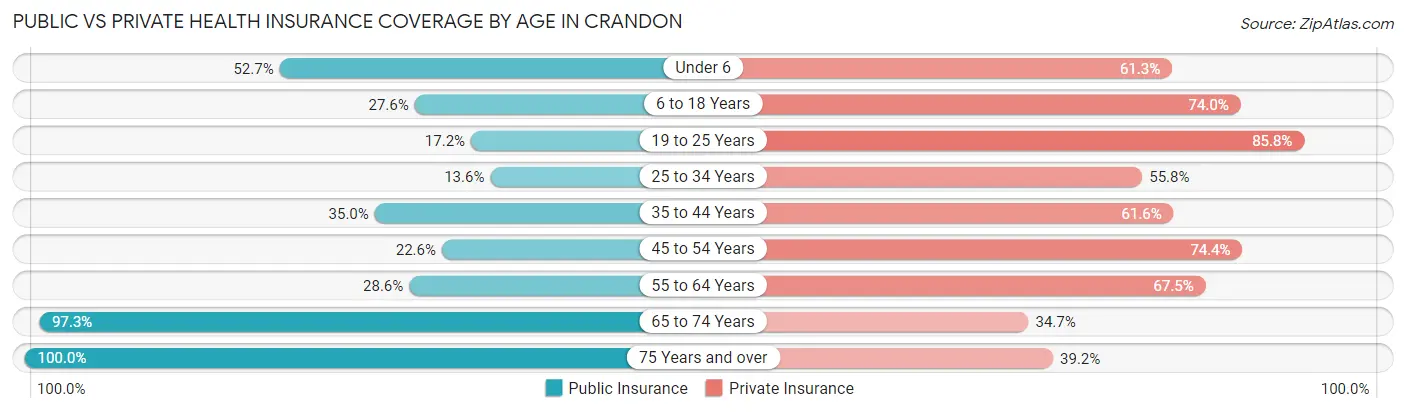
| Age Bracket | Public Insurance | Private Insurance |
| Under 6 | 49 (52.7%) | 57 (61.3%) |
| 6 to 18 Years | 50 (27.6%) | 134 (74.0%) |
| 19 to 25 Years | 23 (17.2%) | 115 (85.8%) |
| 25 to 34 Years | 27 (13.6%) | 111 (55.8%) |
| 35 to 44 Years | 62 (35.0%) | 109 (61.6%) |
| 45 to 54 Years | 44 (22.6%) | 145 (74.4%) |
| 55 to 64 Years | 67 (28.6%) | 158 (67.5%) |
| 65 to 74 Years | 146 (97.3%) | 52 (34.7%) |
| 75 Years and over | 102 (100.0%) | 40 (39.2%) |
| Total | 570 (38.9%) | 921 (62.9%) |
Disability Status by Sex by Age in Crandon
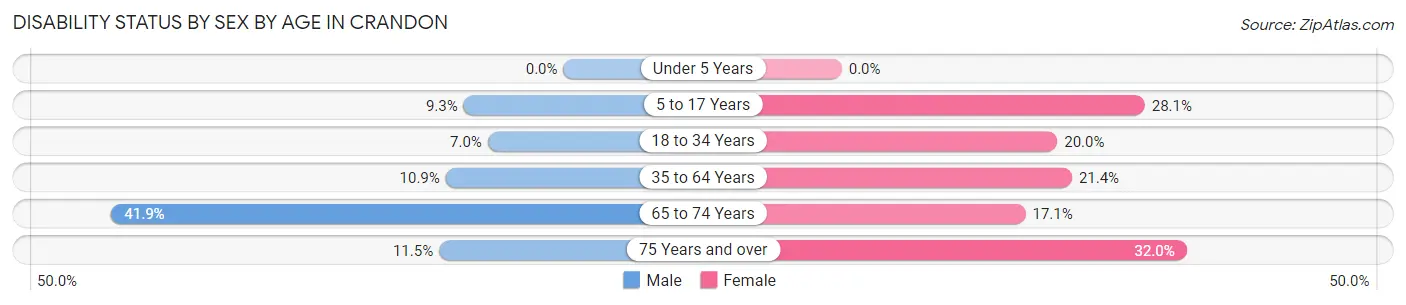
| Age Bracket | Male | Female |
| Under 5 Years | 0 (0.0%) | 0 (0.0%) |
| 5 to 17 Years | 10 (9.3%) | 18 (28.1%) |
| 18 to 34 Years | 12 (7.0%) | 35 (20.0%) |
| 35 to 64 Years | 34 (10.9%) | 63 (21.4%) |
| 65 to 74 Years | 26 (41.9%) | 15 (17.1%) |
| 75 Years and over | 6 (11.5%) | 16 (32.0%) |
Disability Class by Sex by Age in Crandon
Disability Class: Hearing Difficulty
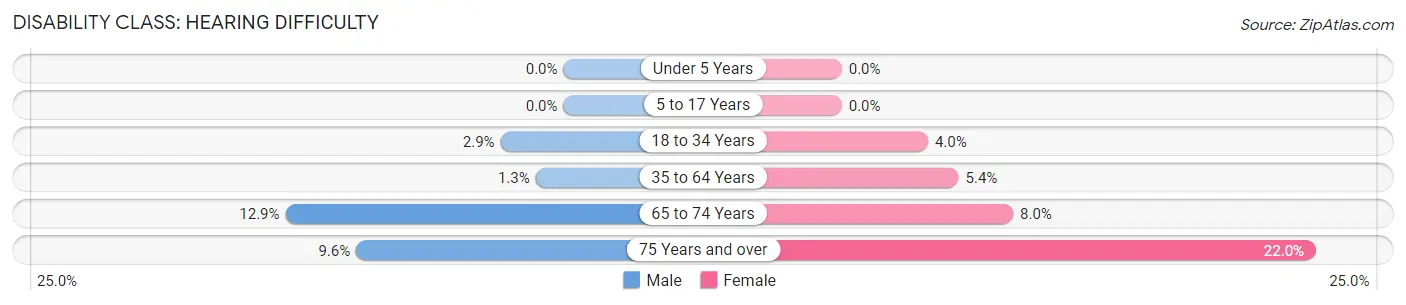
| Age Bracket | Male | Female |
| Under 5 Years | 0 (0.0%) | 0 (0.0%) |
| 5 to 17 Years | 0 (0.0%) | 0 (0.0%) |
| 18 to 34 Years | 5 (2.9%) | 7 (4.0%) |
| 35 to 64 Years | 4 (1.3%) | 16 (5.4%) |
| 65 to 74 Years | 8 (12.9%) | 7 (8.0%) |
| 75 Years and over | 5 (9.6%) | 11 (22.0%) |
Disability Class: Vision Difficulty
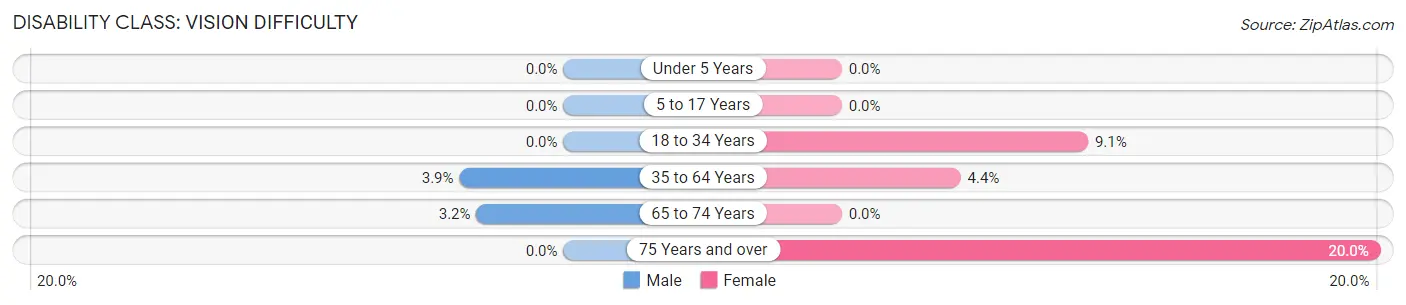
| Age Bracket | Male | Female |
| Under 5 Years | 0 (0.0%) | 0 (0.0%) |
| 5 to 17 Years | 0 (0.0%) | 0 (0.0%) |
| 18 to 34 Years | 0 (0.0%) | 16 (9.1%) |
| 35 to 64 Years | 12 (3.9%) | 13 (4.4%) |
| 65 to 74 Years | 2 (3.2%) | 0 (0.0%) |
| 75 Years and over | 0 (0.0%) | 10 (20.0%) |
Disability Class: Cognitive Difficulty
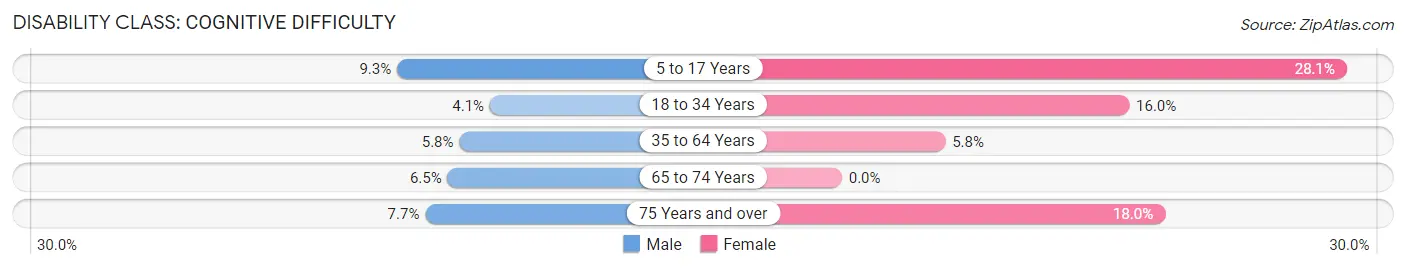
| Age Bracket | Male | Female |
| 5 to 17 Years | 10 (9.3%) | 18 (28.1%) |
| 18 to 34 Years | 7 (4.1%) | 28 (16.0%) |
| 35 to 64 Years | 18 (5.8%) | 17 (5.8%) |
| 65 to 74 Years | 4 (6.5%) | 0 (0.0%) |
| 75 Years and over | 4 (7.7%) | 9 (18.0%) |
Disability Class: Ambulatory Difficulty
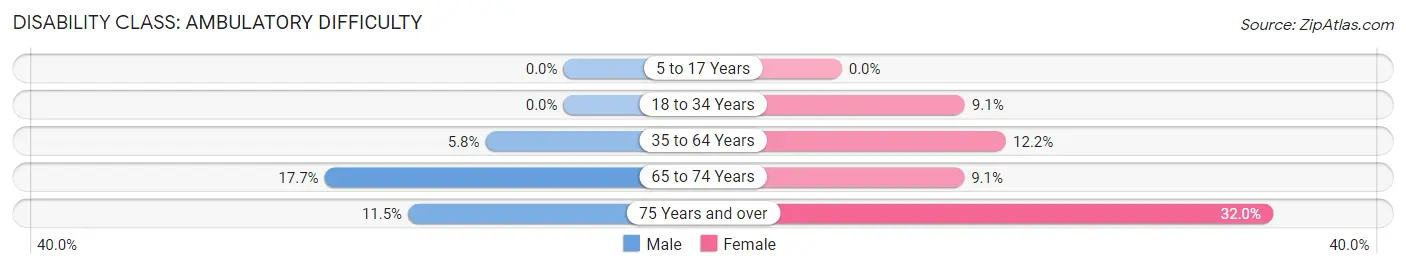
| Age Bracket | Male | Female |
| 5 to 17 Years | 0 (0.0%) | 0 (0.0%) |
| 18 to 34 Years | 0 (0.0%) | 16 (9.1%) |
| 35 to 64 Years | 18 (5.8%) | 36 (12.2%) |
| 65 to 74 Years | 11 (17.7%) | 8 (9.1%) |
| 75 Years and over | 6 (11.5%) | 16 (32.0%) |
Disability Class: Self-Care Difficulty
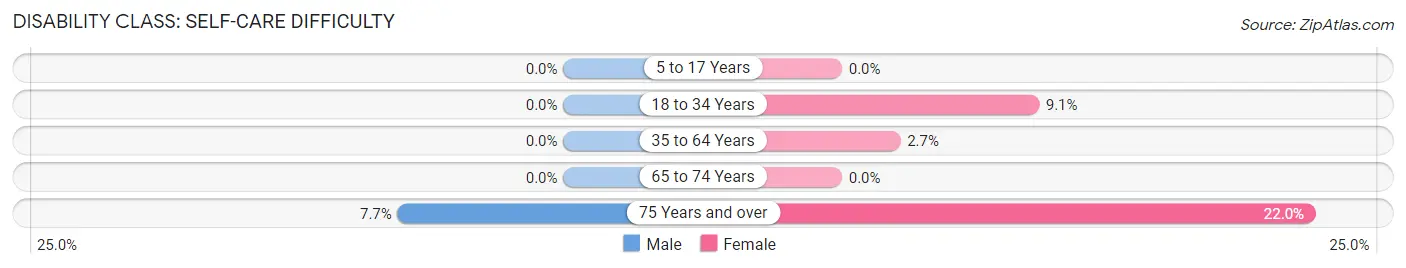
| Age Bracket | Male | Female |
| 5 to 17 Years | 0 (0.0%) | 0 (0.0%) |
| 18 to 34 Years | 0 (0.0%) | 16 (9.1%) |
| 35 to 64 Years | 0 (0.0%) | 8 (2.7%) |
| 65 to 74 Years | 0 (0.0%) | 0 (0.0%) |
| 75 Years and over | 4 (7.7%) | 11 (22.0%) |
Technology Access in Crandon
Computing Device Access in Crandon
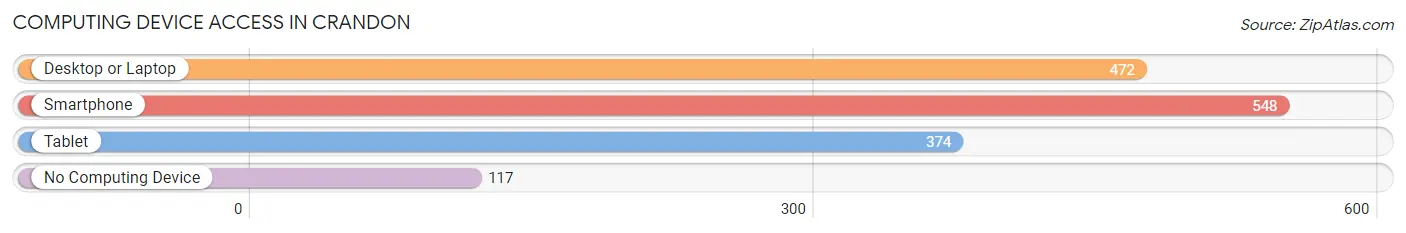
| Device Type | # Households | % Households |
| Desktop or Laptop | 472 | 67.4% |
| Smartphone | 548 | 78.3% |
| Tablet | 374 | 53.4% |
| No Computing Device | 117 | 16.7% |
| Total | 700 | 100.0% |
Internet Access in Crandon
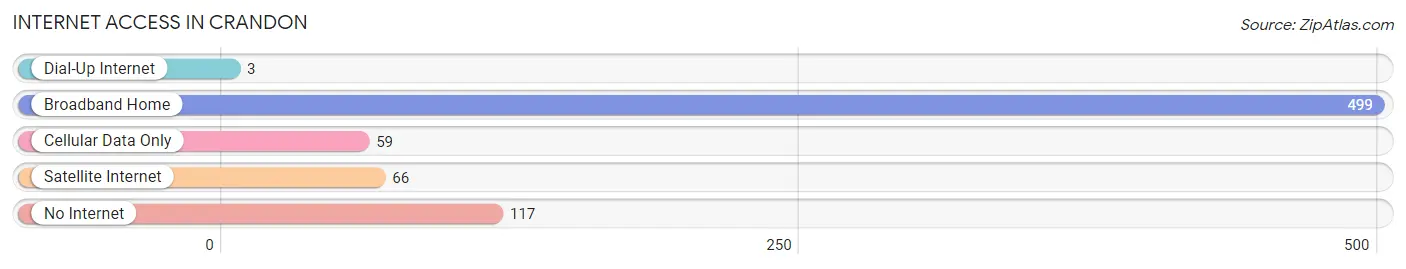
| Internet Type | # Households | % Households |
| Dial-Up Internet | 3 | 0.4% |
| Broadband Home | 499 | 71.3% |
| Cellular Data Only | 59 | 8.4% |
| Satellite Internet | 66 | 9.4% |
| No Internet | 117 | 16.7% |
| Total | 700 | 100.0% |
Crandon Summary
Crandon, Wisconsin is a small city located in Forest County, Wisconsin. It is situated on the shores of beautiful Lake Metonga and is surrounded by the Nicolet National Forest. The city has a population of 2,619 people, according to the 2010 census.
History
Crandon was founded in 1885 by a group of settlers from Michigan. The city was named after a local Native American chief, Chief Crandon. The settlers were attracted to the area due to its abundance of natural resources, including timber, fish, and game. The city was incorporated in 1891 and quickly became a hub for the lumber industry. The city was also home to a number of sawmills, which provided employment for many of the residents.
In the early 1900s, the city began to experience a decline in the lumber industry. This led to a shift in the economy, as the city began to focus more on tourism. The city was home to a number of resorts, which attracted visitors from all over the country. The city also became a popular destination for hunters and fishermen.
Geography
Crandon is located in the northern part of Wisconsin, in Forest County. The city is situated on the shores of Lake Metonga, which is a popular destination for fishing and boating. The city is surrounded by the Nicolet National Forest, which provides a beautiful backdrop for the city. The city is located approximately 90 miles north of Milwaukee and is accessible by car or train.
Economy
Crandon’s economy is largely based on tourism. The city is home to a number of resorts, which attract visitors from all over the country. The city is also home to a number of restaurants, bars, and shops, which provide employment for many of the residents. The city is also home to a number of manufacturing companies, which provide employment for many of the residents.
Demographics
According to the 2010 census, the population of Crandon was 2,619 people. The population is largely white, with a small percentage of African Americans, Native Americans, and Asians. The median household income is $37,941, and the median age is 44. The city has a high rate of homeownership, with over 70% of the population owning their own homes.
Crandon is a small city with a rich history and a vibrant economy. The city is home to a number of resorts, restaurants, and shops, which provide employment for many of the residents. The city is also home to a number of manufacturing companies, which provide employment for many of the residents. The city is surrounded by the Nicolet National Forest, which provides a beautiful backdrop for the city. The city has a population of 2,619 people, according to the 2010 census.
Common Questions
What is Per Capita Income in Crandon?
Per Capita income in Crandon is $28,297.
What is the Median Family Income in Crandon?
Median Family Income in Crandon is $54,471.
What is the Median Household income in Crandon?
Median Household Income in Crandon is $47,083.
What is Income or Wage Gap in Crandon?
Income or Wage Gap in Crandon is 29.0%.
Women in Crandon earn 71.0 cents for every dollar earned by a man.
What is Inequality or Gini Index in Crandon?
Inequality or Gini Index in Crandon is 0.43.
What is the Total Population of Crandon?
Total Population of Crandon is 1,519.
What is the Total Male Population of Crandon?
Total Male Population of Crandon is 769.
What is the Total Female Population of Crandon?
Total Female Population of Crandon is 750.
What is the Ratio of Males per 100 Females in Crandon?
There are 102.53 Males per 100 Females in Crandon.
What is the Ratio of Females per 100 Males in Crandon?
There are 97.53 Females per 100 Males in Crandon.
What is the Median Population Age in Crandon?
Median Population Age in Crandon is 42.3 Years.
What is the Average Family Size in Crandon
Average Family Size in Crandon is 2.7 People.
What is the Average Household Size in Crandon
Average Household Size in Crandon is 2.1 People.
How Large is the Labor Force in Crandon?
There are 762 People in the Labor Forcein in Crandon.
What is the Percentage of People in the Labor Force in Crandon?
58.0% of People are in the Labor Force in Crandon.
What is the Unemployment Rate in Crandon?
Unemployment Rate in Crandon is 1.3%.