Coon Valley, WI Map & Demographics
Coon Valley Map
Coon Valley Overview
$31,630
PER CAPITA INCOME
$82,500
AVG FAMILY INCOME
$53,958
AVG HOUSEHOLD INCOME
38.2%
WAGE / INCOME GAP [ % ]
61.8¢/ $1
WAGE / INCOME GAP [ $ ]
$6,623
FAMILY INCOME DEFICIT
0.47
INEQUALITY / GINI INDEX
914
TOTAL POPULATION
414
MALE POPULATION
500
FEMALE POPULATION
82.80
MALES / 100 FEMALES
120.77
FEMALES / 100 MALES
39.6
MEDIAN AGE
3.0
AVG FAMILY SIZE
2.4
AVG HOUSEHOLD SIZE
514
LABOR FORCE [ PEOPLE ]
67.5%
PERCENT IN LABOR FORCE
3.1%
UNEMPLOYMENT RATE
Coon Valley Zip Codes
Coon Valley Area Codes
Income in Coon Valley
Income Overview in Coon Valley
Per Capita Income in Coon Valley is $31,630, while median incomes of families and households are $82,500 and $53,958 respectively.
| Characteristic | Number | Measure |
| Per Capita Income | 914 | $31,630 |
| Median Family Income | 244 | $82,500 |
| Mean Family Income | 244 | $83,883 |
| Median Household Income | 376 | $53,958 |
| Mean Household Income | 376 | $75,760 |
| Income Deficit | 244 | $6,623 |
| Wage / Income Gap (%) | 914 | 38.22% |
| Wage / Income Gap ($) | 914 | 61.78¢ per $1 |
| Gini / Inequality Index | 914 | 0.47 |
Earnings by Sex in Coon Valley
Average Earnings in Coon Valley are $33,808, $43,500 for men and $26,875 for women, a difference of 38.2%.
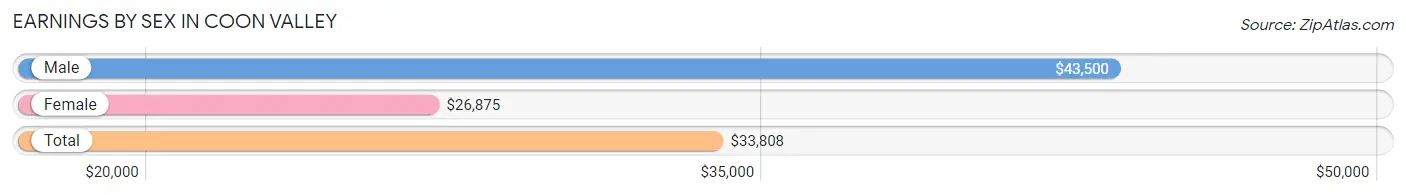
| Sex | Number | Average Earnings |
| Male | 244 (46.2%) | $43,500 |
| Female | 284 (53.8%) | $26,875 |
| Total | 528 (100.0%) | $33,808 |
Earnings by Sex by Income Bracket in Coon Valley
The most common earnings brackets in Coon Valley are $30,000 to $34,999 for men (40 | 16.4%) and $2,499 or less for women (55 | 19.4%).
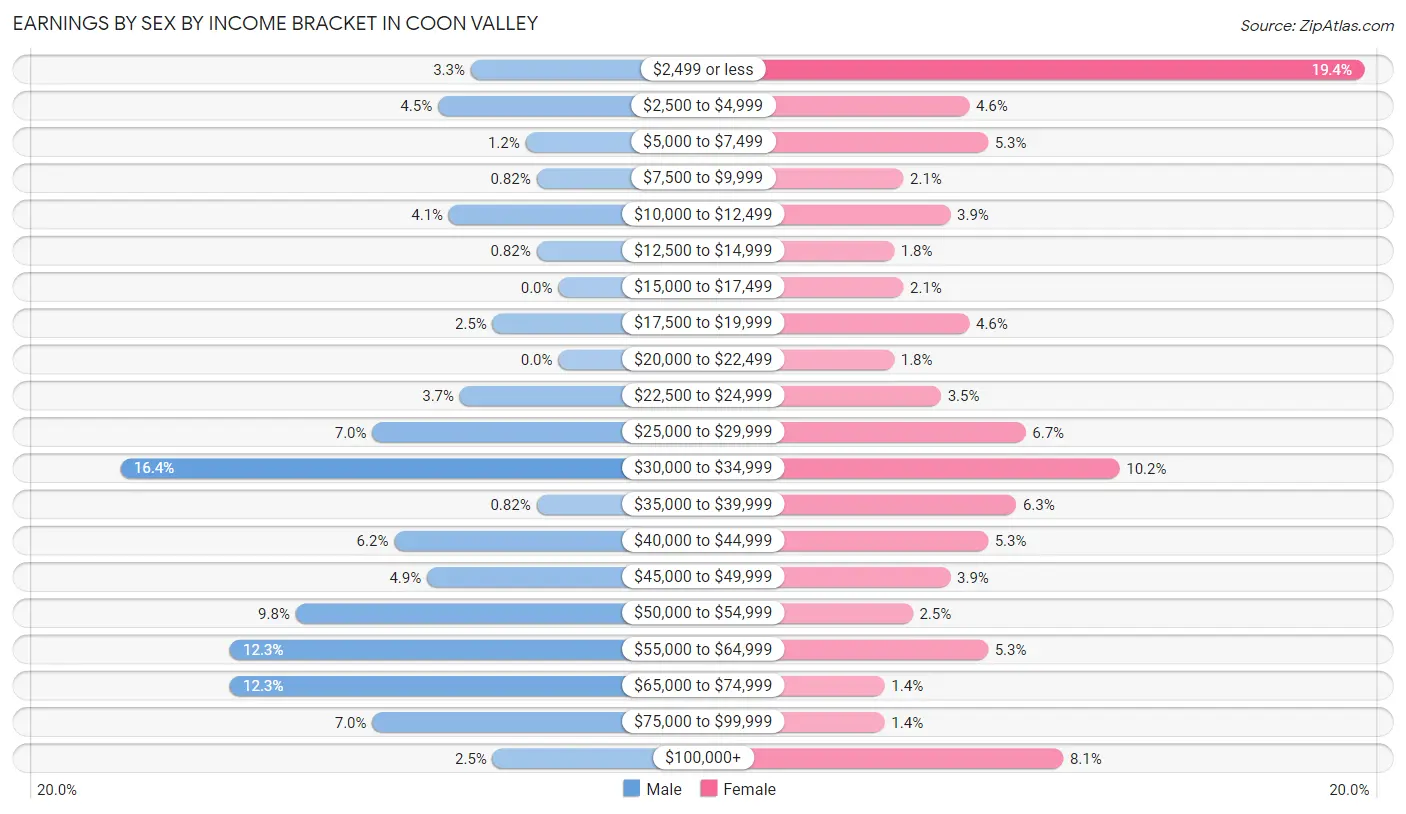
| Income | Male | Female |
| $2,499 or less | 8 (3.3%) | 55 (19.4%) |
| $2,500 to $4,999 | 11 (4.5%) | 13 (4.6%) |
| $5,000 to $7,499 | 3 (1.2%) | 15 (5.3%) |
| $7,500 to $9,999 | 2 (0.8%) | 6 (2.1%) |
| $10,000 to $12,499 | 10 (4.1%) | 11 (3.9%) |
| $12,500 to $14,999 | 2 (0.8%) | 5 (1.8%) |
| $15,000 to $17,499 | 0 (0.0%) | 6 (2.1%) |
| $17,500 to $19,999 | 6 (2.5%) | 13 (4.6%) |
| $20,000 to $22,499 | 0 (0.0%) | 5 (1.8%) |
| $22,500 to $24,999 | 9 (3.7%) | 10 (3.5%) |
| $25,000 to $29,999 | 17 (7.0%) | 19 (6.7%) |
| $30,000 to $34,999 | 40 (16.4%) | 29 (10.2%) |
| $35,000 to $39,999 | 2 (0.8%) | 18 (6.3%) |
| $40,000 to $44,999 | 15 (6.1%) | 15 (5.3%) |
| $45,000 to $49,999 | 12 (4.9%) | 11 (3.9%) |
| $50,000 to $54,999 | 24 (9.8%) | 7 (2.5%) |
| $55,000 to $64,999 | 30 (12.3%) | 15 (5.3%) |
| $65,000 to $74,999 | 30 (12.3%) | 4 (1.4%) |
| $75,000 to $99,999 | 17 (7.0%) | 4 (1.4%) |
| $100,000+ | 6 (2.5%) | 23 (8.1%) |
| Total | 244 (100.0%) | 284 (100.0%) |
Earnings by Sex by Educational Attainment in Coon Valley
Average earnings in Coon Valley are $44,250 for men and $35,833 for women, a difference of 19.0%. Men with an educational attainment of graduate degree enjoy the highest average annual earnings of $55,833, while those with bachelor's degree education earn the least with $34,200. Women with an educational attainment of graduate degree earn the most with the average annual earnings of $43,125, while those with high school diploma education have the smallest earnings of $18,750.
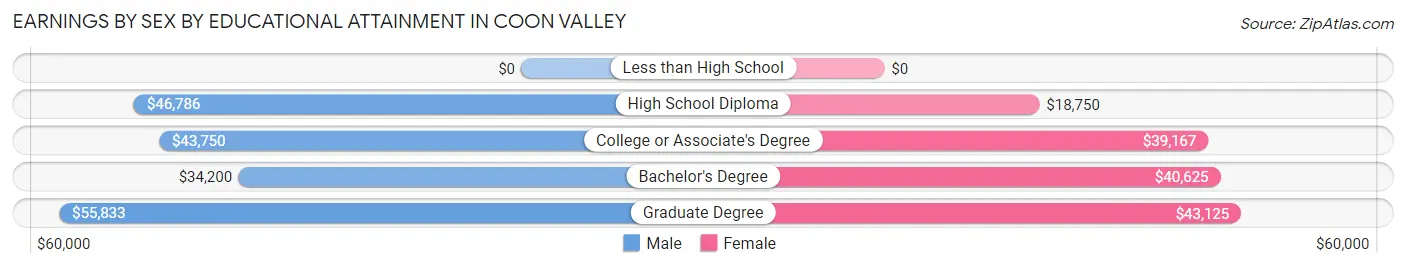
| Educational Attainment | Male Income | Female Income |
| Less than High School | - | - |
| High School Diploma | $46,786 | $18,750 |
| College or Associate's Degree | $43,750 | $39,167 |
| Bachelor's Degree | $34,200 | $40,625 |
| Graduate Degree | $55,833 | $43,125 |
| Total | $44,250 | $35,833 |
Family Income in Coon Valley
Family Income Brackets in Coon Valley
According to the Coon Valley family income data, there are 68 families falling into the $75,000 to $99,999 income range, which is the most common income bracket and makes up 27.9% of all families. Conversely, the less than $10,000 income bracket is the least frequent group with only 2 families (0.8%) belonging to this category.
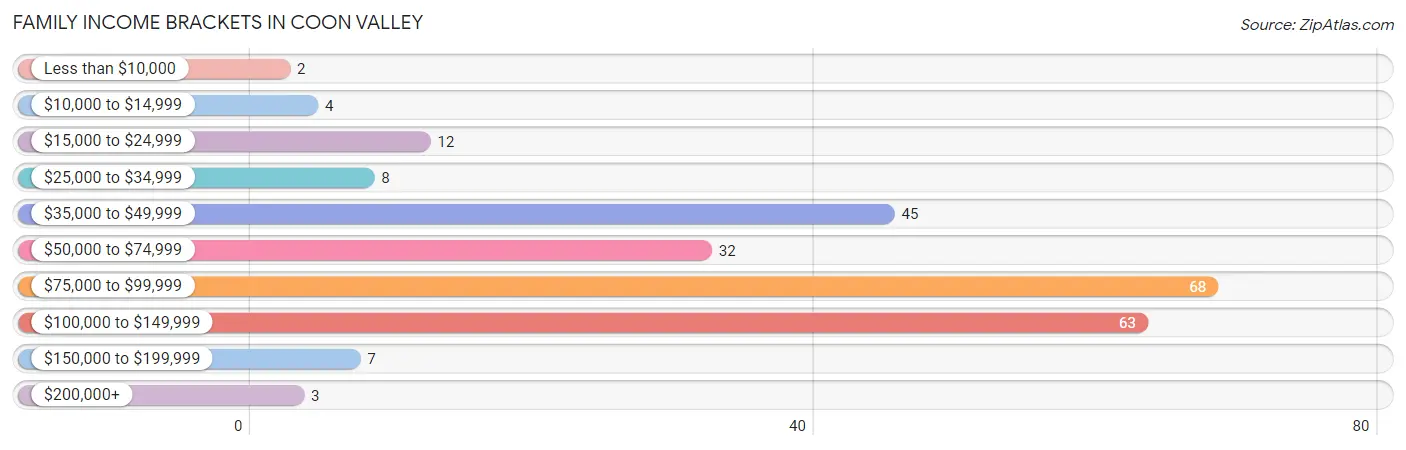
| Income Bracket | # Families | % Families |
| Less than $10,000 | 2 | 0.8% |
| $10,000 to $14,999 | 4 | 1.6% |
| $15,000 to $24,999 | 12 | 4.9% |
| $25,000 to $34,999 | 8 | 3.3% |
| $35,000 to $49,999 | 45 | 18.4% |
| $50,000 to $74,999 | 32 | 13.1% |
| $75,000 to $99,999 | 68 | 27.9% |
| $100,000 to $149,999 | 63 | 25.8% |
| $150,000 to $199,999 | 7 | 2.9% |
| $200,000+ | 3 | 1.2% |
Family Income by Famaliy Size in Coon Valley
3-person families (59 | 24.2%) account for the highest median family income in Coon Valley with $99,583 per family, while 2-person families (128 | 52.5%) have the highest median income of $34,643 per family member.
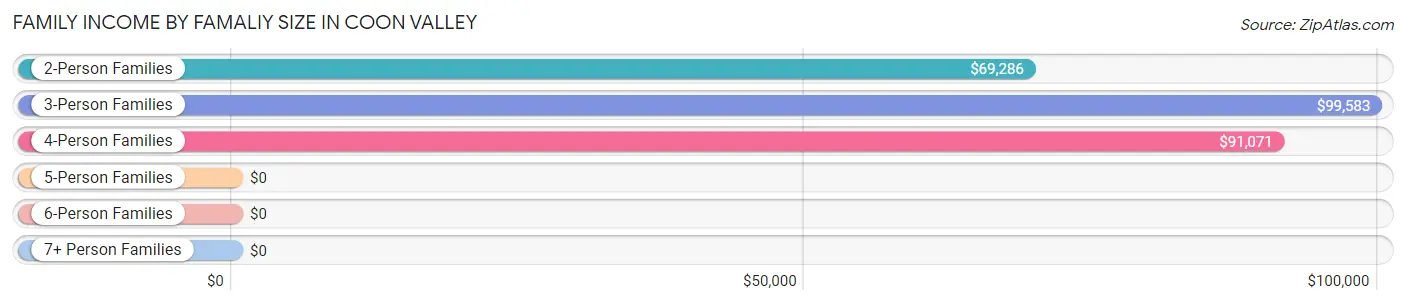
| Income Bracket | # Families | Median Income |
| 2-Person Families | 128 (52.5%) | $69,286 |
| 3-Person Families | 59 (24.2%) | $99,583 |
| 4-Person Families | 32 (13.1%) | $91,071 |
| 5-Person Families | 19 (7.8%) | $0 |
| 6-Person Families | 6 (2.5%) | $0 |
| 7+ Person Families | 0 (0.0%) | $0 |
| Total | 244 (100.0%) | $82,500 |
Family Income by Number of Earners in Coon Valley
The median family income in Coon Valley is $82,500, with families comprising 3+ earners (42) having the highest median family income of $147,841, while families with no earners (37) have the lowest median family income of $39,464, accounting for 17.2% and 15.2% of families, respectively.
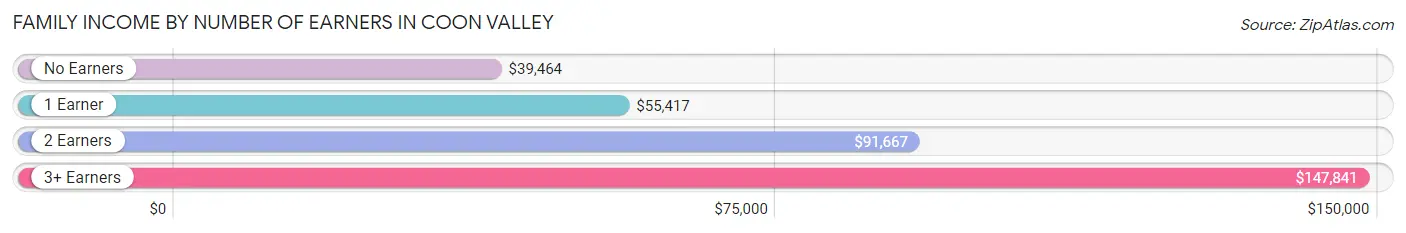
| Number of Earners | # Families | Median Income |
| No Earners | 37 (15.2%) | $39,464 |
| 1 Earner | 55 (22.5%) | $55,417 |
| 2 Earners | 110 (45.1%) | $91,667 |
| 3+ Earners | 42 (17.2%) | $147,841 |
| Total | 244 (100.0%) | $82,500 |
Household Income in Coon Valley
Household Income Brackets in Coon Valley
With 70 households falling in the category, the $75,000 to $99,999 income range is the most frequent in Coon Valley, accounting for 18.6% of all households. In contrast, only 7 households (1.9%) fall into the $150,000 to $199,999 income bracket, making it the least populous group.
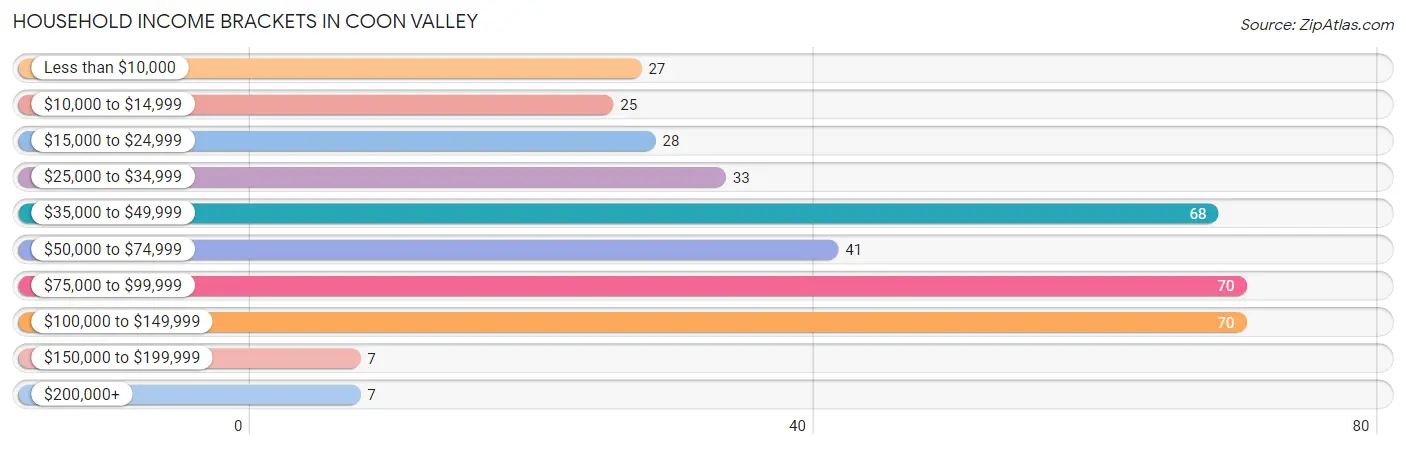
| Income Bracket | # Households | % Households |
| Less than $10,000 | 27 | 7.2% |
| $10,000 to $14,999 | 25 | 6.6% |
| $15,000 to $24,999 | 28 | 7.4% |
| $25,000 to $34,999 | 33 | 8.8% |
| $35,000 to $49,999 | 68 | 18.1% |
| $50,000 to $74,999 | 41 | 10.9% |
| $75,000 to $99,999 | 70 | 18.6% |
| $100,000 to $149,999 | 70 | 18.6% |
| $150,000 to $199,999 | 7 | 1.9% |
| $200,000+ | 7 | 1.9% |
Household Income by Householder Age in Coon Valley
The median household income in Coon Valley is $53,958, with the highest median household income of $82,500 found in the 45 to 64 years age bracket for the primary householder. A total of 106 households (28.2%) fall into this category. Meanwhile, the 65+ years age bracket for the primary householder has the lowest median household income of $38,182, with 128 households (34.0%) in this group.
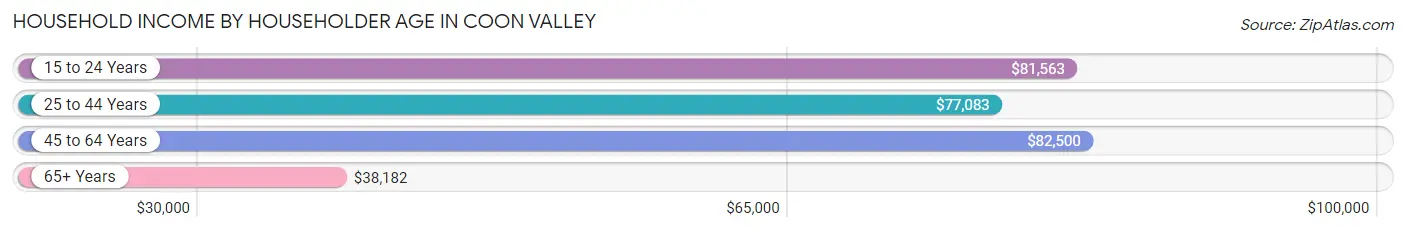
| Income Bracket | # Households | Median Income |
| 15 to 24 Years | 43 (11.4%) | $81,563 |
| 25 to 44 Years | 99 (26.3%) | $77,083 |
| 45 to 64 Years | 106 (28.2%) | $82,500 |
| 65+ Years | 128 (34.0%) | $38,182 |
| Total | 376 (100.0%) | $53,958 |
Poverty in Coon Valley
Income Below Poverty by Sex and Age in Coon Valley
With 11.8% poverty level for males and 13.0% for females among the residents of Coon Valley, 5 year old males and 6 to 11 year old females are the most vulnerable to poverty, with 3 males (50.0%) and 7 females (25.9%) in their respective age groups living below the poverty level.
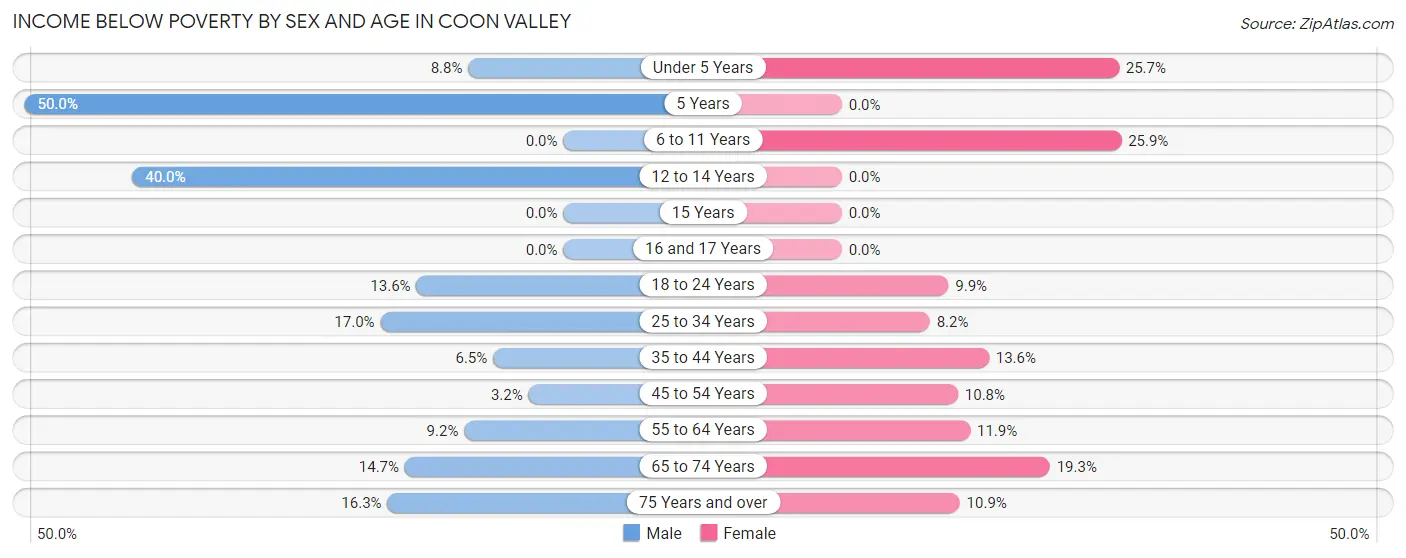
| Age Bracket | Male | Female |
| Under 5 Years | 3 (8.8%) | 9 (25.7%) |
| 5 Years | 3 (50.0%) | 0 (0.0%) |
| 6 to 11 Years | 0 (0.0%) | 7 (25.9%) |
| 12 to 14 Years | 6 (40.0%) | 0 (0.0%) |
| 15 Years | 0 (0.0%) | 0 (0.0%) |
| 16 and 17 Years | 0 (0.0%) | 0 (0.0%) |
| 18 to 24 Years | 3 (13.6%) | 9 (9.9%) |
| 25 to 34 Years | 9 (17.0%) | 4 (8.2%) |
| 35 to 44 Years | 3 (6.5%) | 6 (13.6%) |
| 45 to 54 Years | 1 (3.2%) | 7 (10.8%) |
| 55 to 64 Years | 8 (9.2%) | 5 (11.9%) |
| 65 to 74 Years | 5 (14.7%) | 11 (19.3%) |
| 75 Years and over | 8 (16.3%) | 7 (10.9%) |
| Total | 49 (11.8%) | 65 (13.0%) |
Income Above Poverty by Sex and Age in Coon Valley
According to the poverty statistics in Coon Valley, males aged 6 to 11 years and females aged 12 to 14 years are the age groups that are most secure financially, with 100.0% of males and 100.0% of females in these age groups living above the poverty line.
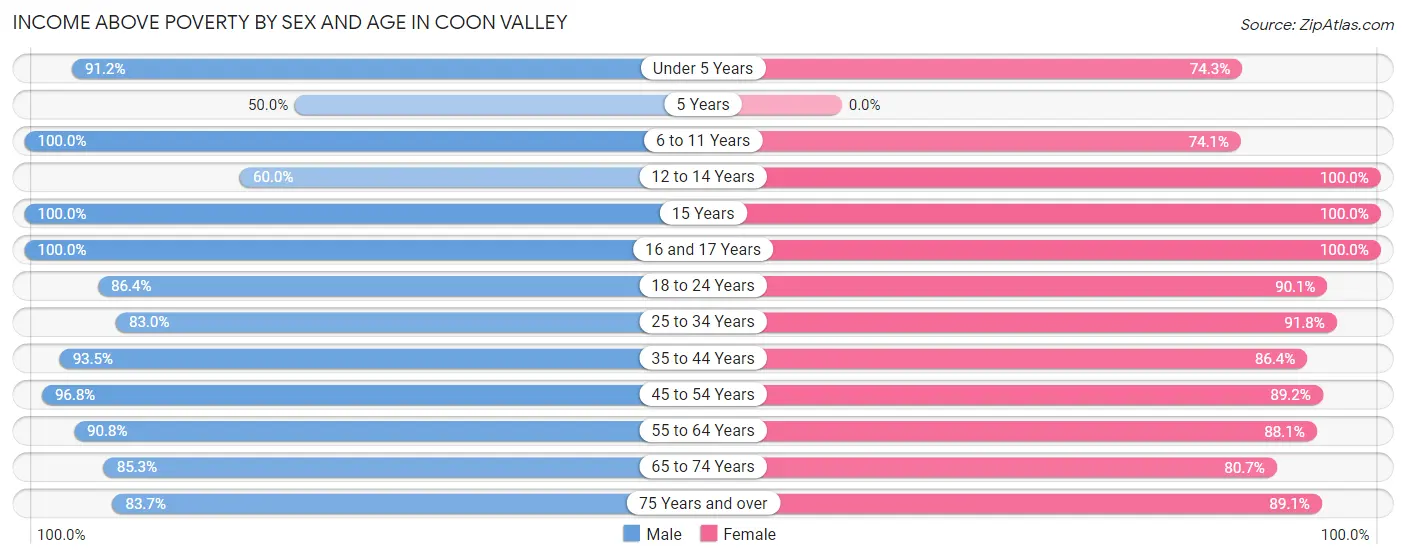
| Age Bracket | Male | Female |
| Under 5 Years | 31 (91.2%) | 26 (74.3%) |
| 5 Years | 3 (50.0%) | 0 (0.0%) |
| 6 to 11 Years | 22 (100.0%) | 20 (74.1%) |
| 12 to 14 Years | 9 (60.0%) | 7 (100.0%) |
| 15 Years | 3 (100.0%) | 4 (100.0%) |
| 16 and 17 Years | 12 (100.0%) | 15 (100.0%) |
| 18 to 24 Years | 19 (86.4%) | 82 (90.1%) |
| 25 to 34 Years | 44 (83.0%) | 45 (91.8%) |
| 35 to 44 Years | 43 (93.5%) | 38 (86.4%) |
| 45 to 54 Years | 30 (96.8%) | 58 (89.2%) |
| 55 to 64 Years | 79 (90.8%) | 37 (88.1%) |
| 65 to 74 Years | 29 (85.3%) | 46 (80.7%) |
| 75 Years and over | 41 (83.7%) | 57 (89.1%) |
| Total | 365 (88.2%) | 435 (87.0%) |
Income Below Poverty Among Married-Couple Families in Coon Valley
The poverty statistics for married-couple families in Coon Valley show that 2.8% or 6 of the total 213 families live below the poverty line. Families with 3 or 4 children have the highest poverty rate of 10.0%, comprising of 2 families. On the other hand, families with no children have the lowest poverty rate of 1.5%, which includes 2 families.
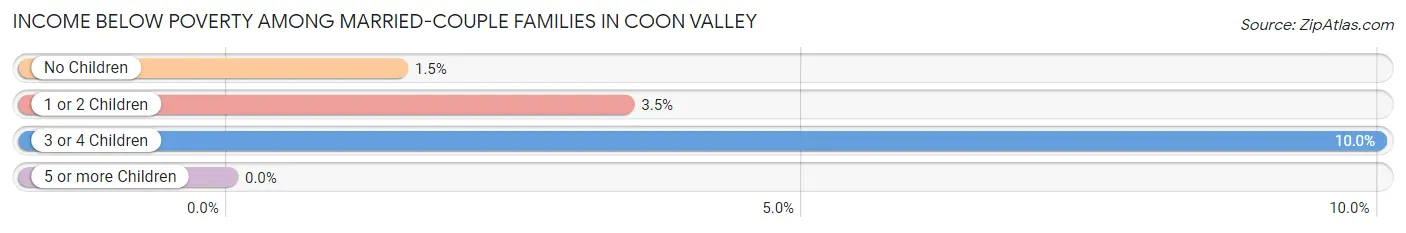
| Children | Above Poverty | Below Poverty |
| No Children | 133 (98.5%) | 2 (1.5%) |
| 1 or 2 Children | 56 (96.6%) | 2 (3.5%) |
| 3 or 4 Children | 18 (90.0%) | 2 (10.0%) |
| 5 or more Children | 0 (0.0%) | 0 (0.0%) |
| Total | 207 (97.2%) | 6 (2.8%) |
Income Below Poverty Among Single-Parent Households in Coon Valley
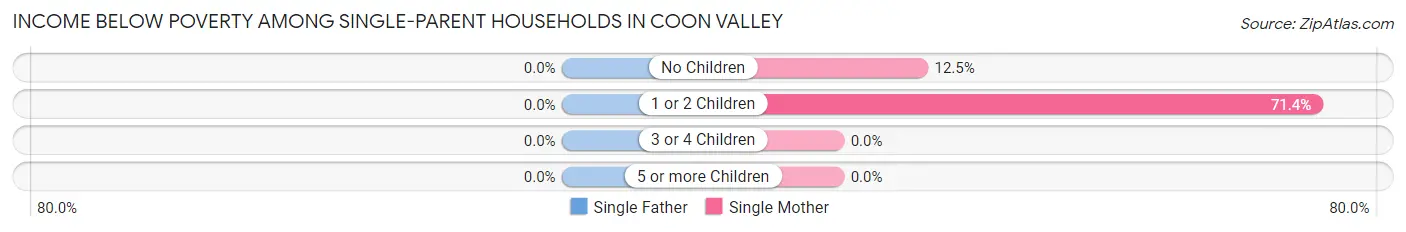
| Children | Single Father | Single Mother |
| No Children | 0 (0.0%) | 2 (12.5%) |
| 1 or 2 Children | 0 (0.0%) | 5 (71.4%) |
| 3 or 4 Children | 0 (0.0%) | 0 (0.0%) |
| 5 or more Children | 0 (0.0%) | 0 (0.0%) |
| Total | 0 (0.0%) | 7 (30.4%) |
Income Below Poverty Among Married-Couple vs Single-Parent Households in Coon Valley
The poverty data for Coon Valley shows that 6 of the married-couple family households (2.8%) and 7 of the single-parent households (22.6%) are living below the poverty level. Within the married-couple family households, those with 3 or 4 children have the highest poverty rate, with 2 households (10.0%) falling below the poverty line. Among the single-parent households, those with 1 or 2 children have the highest poverty rate, with 5 household (38.5%) living below poverty.
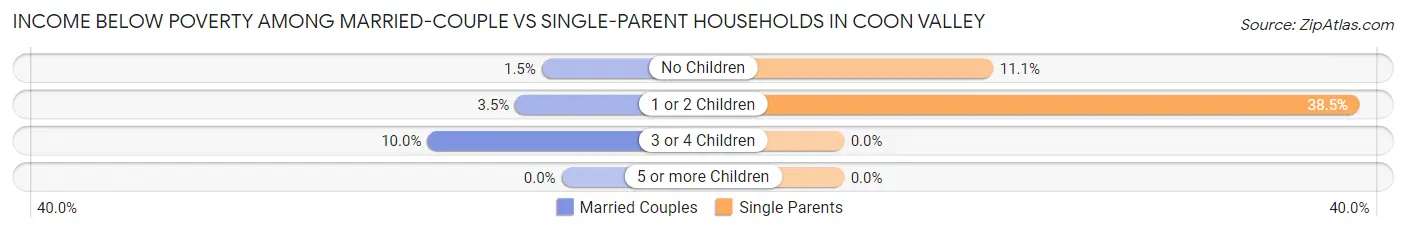
| Children | Married-Couple Families | Single-Parent Households |
| No Children | 2 (1.5%) | 2 (11.1%) |
| 1 or 2 Children | 2 (3.5%) | 5 (38.5%) |
| 3 or 4 Children | 2 (10.0%) | 0 (0.0%) |
| 5 or more Children | 0 (0.0%) | 0 (0.0%) |
| Total | 6 (2.8%) | 7 (22.6%) |
Race in Coon Valley
The most populous races in Coon Valley are White / Caucasian (877 | 96.0%), Two or more Races (25 | 2.7%), and Hispanic or Latino (14 | 1.5%).
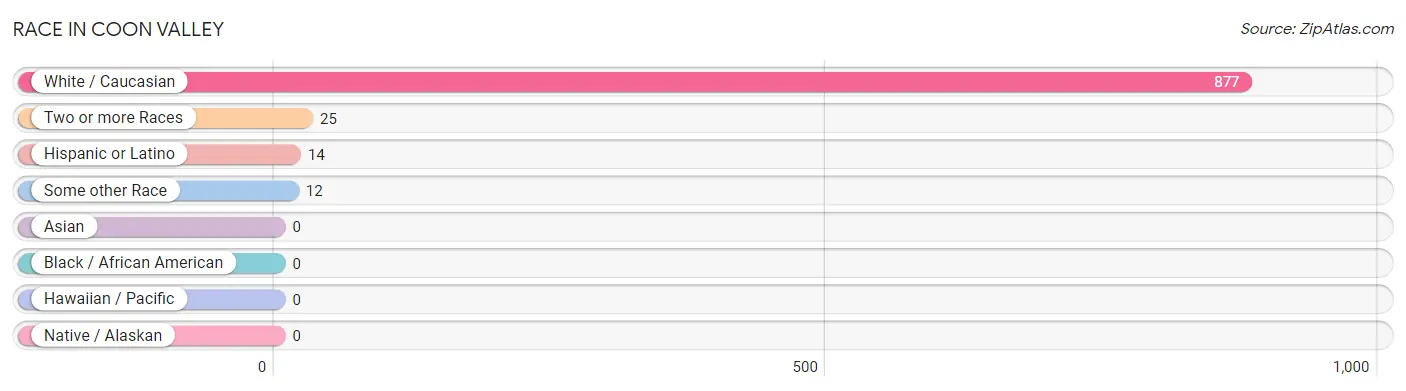
| Race | # Population | % Population |
| Asian | 0 | 0.0% |
| Black / African American | 0 | 0.0% |
| Hawaiian / Pacific | 0 | 0.0% |
| Hispanic or Latino | 14 | 1.5% |
| Native / Alaskan | 0 | 0.0% |
| White / Caucasian | 877 | 96.0% |
| Two or more Races | 25 | 2.7% |
| Some other Race | 12 | 1.3% |
| Total | 914 | 100.0% |
Ancestry in Coon Valley
The most populous ancestries reported in Coon Valley are Norwegian (440 | 48.1%), German (309 | 33.8%), Irish (60 | 6.6%), American (44 | 4.8%), and Polish (38 | 4.2%), together accounting for 97.5% of all Coon Valley residents.
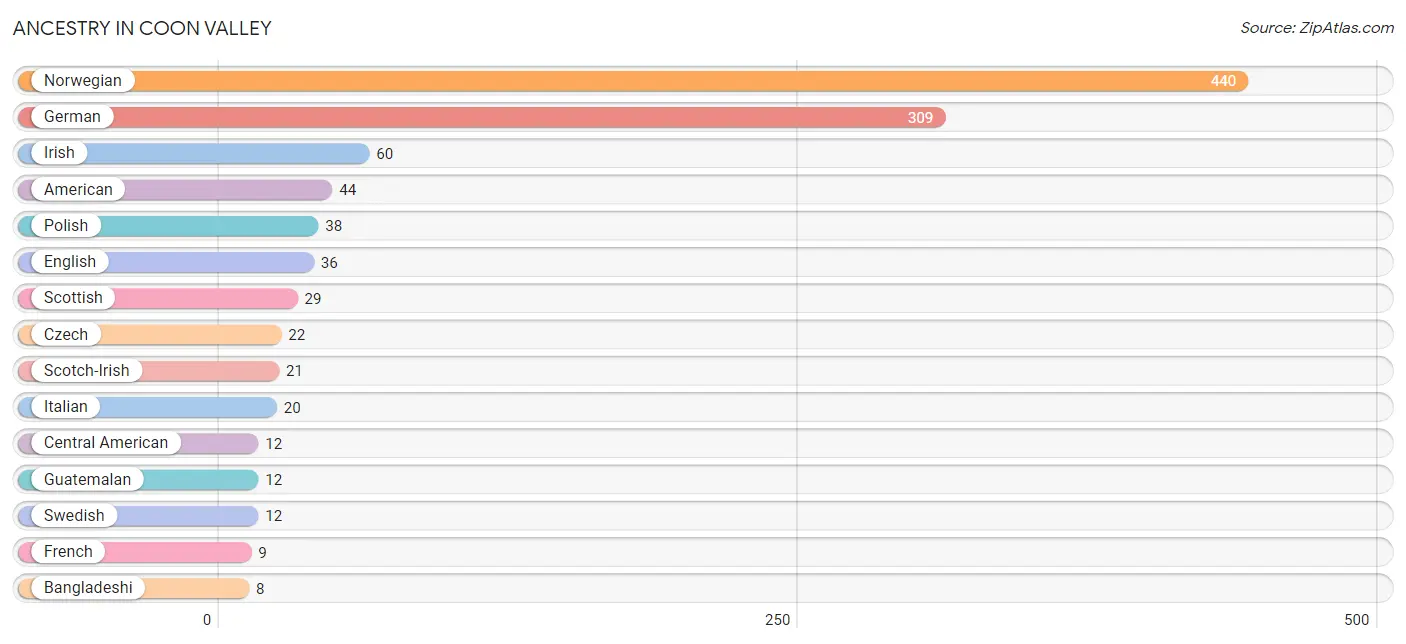
| Ancestry | # Population | % Population |
| American | 44 | 4.8% |
| Bangladeshi | 8 | 0.9% |
| British | 4 | 0.4% |
| Central American | 12 | 1.3% |
| Croatian | 2 | 0.2% |
| Czech | 22 | 2.4% |
| Czechoslovakian | 2 | 0.2% |
| Danish | 7 | 0.8% |
| Dominican | 2 | 0.2% |
| Dutch | 6 | 0.7% |
| English | 36 | 3.9% |
| European | 8 | 0.9% |
| French | 9 | 1.0% |
| French Canadian | 3 | 0.3% |
| German | 309 | 33.8% |
| Guatemalan | 12 | 1.3% |
| Icelander | 2 | 0.2% |
| Irish | 60 | 6.6% |
| Italian | 20 | 2.2% |
| Malaysian | 6 | 0.7% |
| Norwegian | 440 | 48.1% |
| Polish | 38 | 4.2% |
| Scotch-Irish | 21 | 2.3% |
| Scottish | 29 | 3.2% |
| Swedish | 12 | 1.3% | View All 25 Rows |
Immigrants in Coon Valley
The most numerous immigrant groups reported in Coon Valley came from Europe (2 | 0.2%), Germany (2 | 0.2%), and Western Europe (2 | 0.2%), together accounting for 0.7% of all Coon Valley residents.
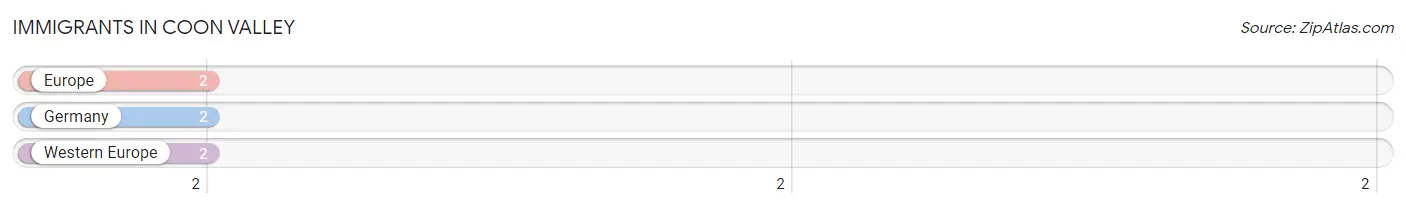
| Immigration Origin | # Population | % Population |
| Europe | 2 | 0.2% |
| Germany | 2 | 0.2% |
| Western Europe | 2 | 0.2% | View All 3 Rows |
Sex and Age in Coon Valley
Sex and Age in Coon Valley
The most populous age groups in Coon Valley are 55 to 59 Years (50 | 12.1%) for men and 15 to 19 Years (58 | 11.6%) for women.
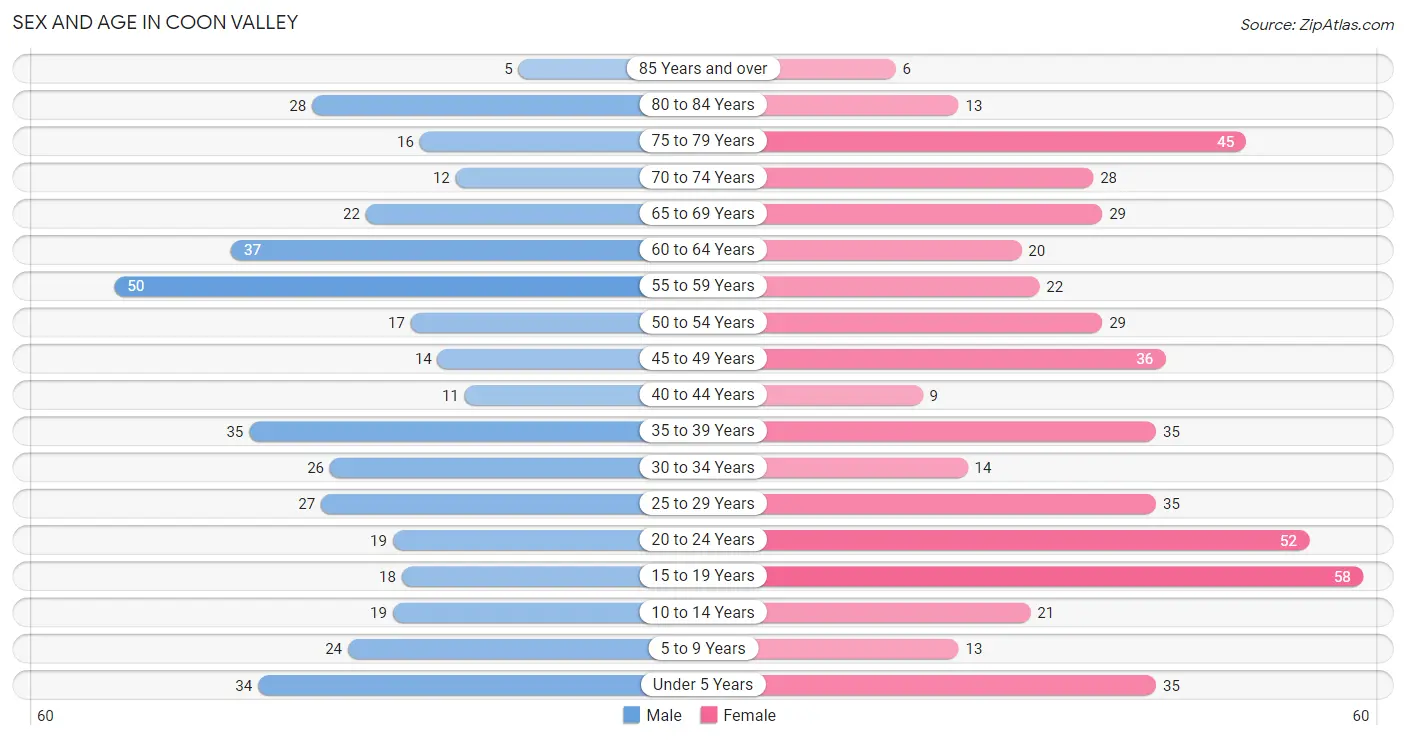
| Age Bracket | Male | Female |
| Under 5 Years | 34 (8.2%) | 35 (7.0%) |
| 5 to 9 Years | 24 (5.8%) | 13 (2.6%) |
| 10 to 14 Years | 19 (4.6%) | 21 (4.2%) |
| 15 to 19 Years | 18 (4.3%) | 58 (11.6%) |
| 20 to 24 Years | 19 (4.6%) | 52 (10.4%) |
| 25 to 29 Years | 27 (6.5%) | 35 (7.0%) |
| 30 to 34 Years | 26 (6.3%) | 14 (2.8%) |
| 35 to 39 Years | 35 (8.5%) | 35 (7.0%) |
| 40 to 44 Years | 11 (2.7%) | 9 (1.8%) |
| 45 to 49 Years | 14 (3.4%) | 36 (7.2%) |
| 50 to 54 Years | 17 (4.1%) | 29 (5.8%) |
| 55 to 59 Years | 50 (12.1%) | 22 (4.4%) |
| 60 to 64 Years | 37 (8.9%) | 20 (4.0%) |
| 65 to 69 Years | 22 (5.3%) | 29 (5.8%) |
| 70 to 74 Years | 12 (2.9%) | 28 (5.6%) |
| 75 to 79 Years | 16 (3.9%) | 45 (9.0%) |
| 80 to 84 Years | 28 (6.8%) | 13 (2.6%) |
| 85 Years and over | 5 (1.2%) | 6 (1.2%) |
| Total | 414 (100.0%) | 500 (100.0%) |
Families and Households in Coon Valley
Median Family Size in Coon Valley
The median family size in Coon Valley is 3.04 persons per family, with married-couple families (213 | 87.3%) accounting for the largest median family size of 3.11 persons per family. On the other hand, single male/father families (8 | 3.3%) represent the smallest median family size with 2.13 persons per family.
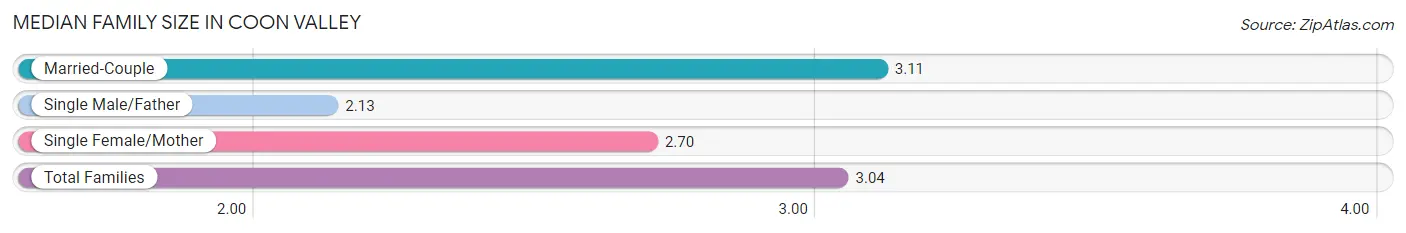
| Family Type | # Families | Family Size |
| Married-Couple | 213 (87.3%) | 3.11 |
| Single Male/Father | 8 (3.3%) | 2.13 |
| Single Female/Mother | 23 (9.4%) | 2.70 |
| Total Families | 244 (100.0%) | 3.04 |
Median Household Size in Coon Valley
The median household size in Coon Valley is 2.38 persons per household, with single female/mother households (23 | 6.1%) accounting for the largest median household size of 3.17 persons per household. non-family households (132 | 35.1%) represent the smallest median household size with 1.05 persons per household.
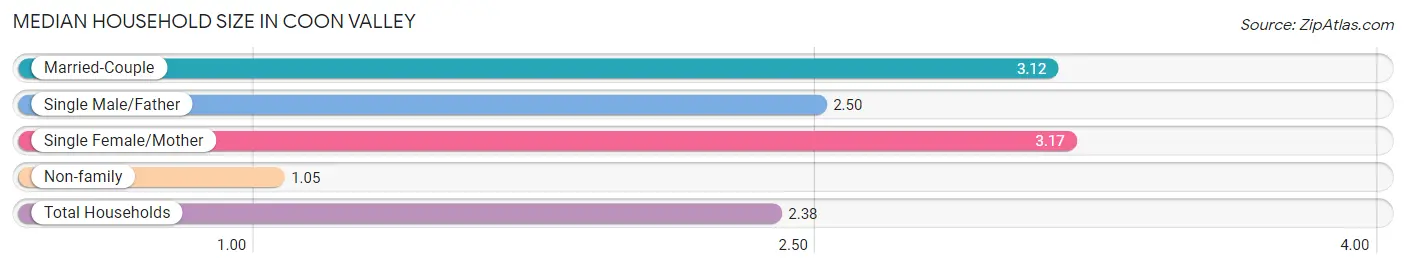
| Household Type | # Households | Household Size |
| Married-Couple | 213 (56.7%) | 3.12 |
| Single Male/Father | 8 (2.1%) | 2.50 |
| Single Female/Mother | 23 (6.1%) | 3.17 |
| Non-family | 132 (35.1%) | 1.05 |
| Total Households | 376 (100.0%) | 2.38 |
Household Size by Marriage Status in Coon Valley
Out of a total of 376 households in Coon Valley, 244 (64.9%) are family households, while 132 (35.1%) are nonfamily households. The most numerous type of family households are 2-person households, comprising 119, and the most common type of nonfamily households are 1-person households, comprising 125.
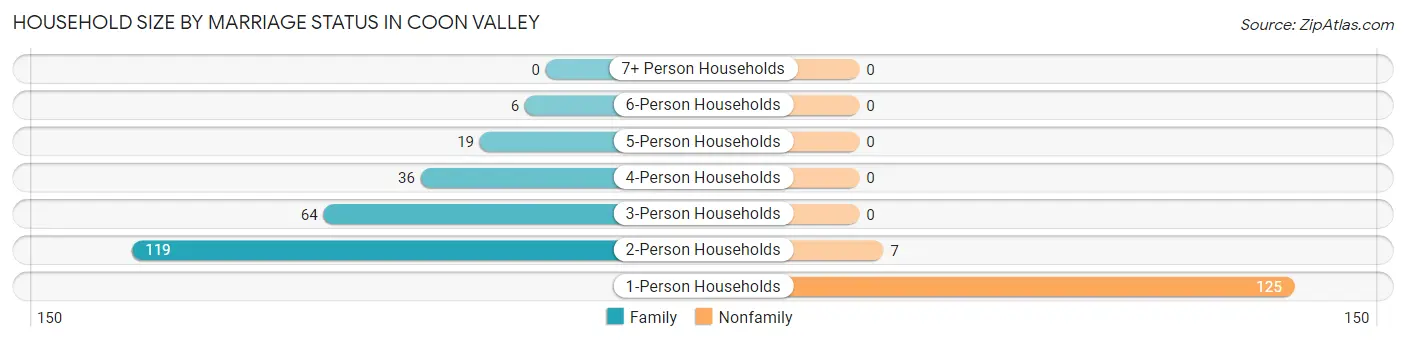
| Household Size | Family Households | Nonfamily Households |
| 1-Person Households | - | 125 (33.2%) |
| 2-Person Households | 119 (31.7%) | 7 (1.9%) |
| 3-Person Households | 64 (17.0%) | 0 (0.0%) |
| 4-Person Households | 36 (9.6%) | 0 (0.0%) |
| 5-Person Households | 19 (5.1%) | 0 (0.0%) |
| 6-Person Households | 6 (1.6%) | 0 (0.0%) |
| 7+ Person Households | 0 (0.0%) | 0 (0.0%) |
| Total | 244 (64.9%) | 132 (35.1%) |
Female Fertility in Coon Valley
Fertility by Age in Coon Valley
Average fertility rate in Coon Valley is 25.0 births per 1,000 women. Women in the age bracket of 20 to 34 years have the highest fertility rate with 40.0 births per 1,000 women. Women in the age bracket of 20 to 34 years acount for 66.7% of all women with births.
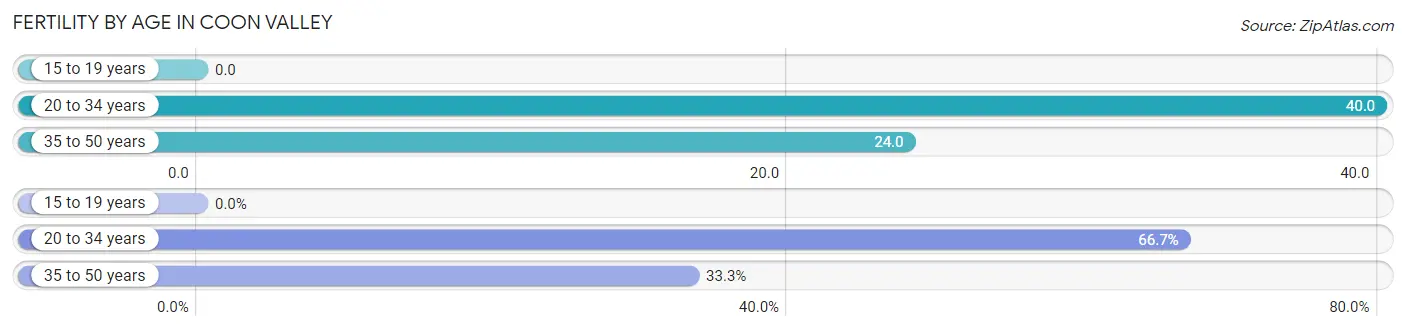
| Age Bracket | Women with Births | Births / 1,000 Women |
| 15 to 19 years | 0 (0.0%) | 0.0 |
| 20 to 34 years | 4 (66.7%) | 40.0 |
| 35 to 50 years | 2 (33.3%) | 24.0 |
| Total | 6 (100.0%) | 25.0 |
Fertility by Age by Marriage Status in Coon Valley
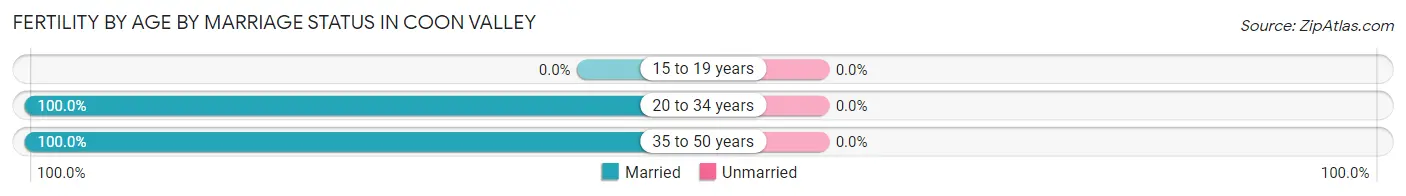
| Age Bracket | Married | Unmarried |
| 15 to 19 years | 0 (0.0%) | 0 (0.0%) |
| 20 to 34 years | 4 (100.0%) | 0 (0.0%) |
| 35 to 50 years | 2 (100.0%) | 0 (0.0%) |
| Total | 6 (100.0%) | 0 (0.0%) |
Fertility by Education in Coon Valley
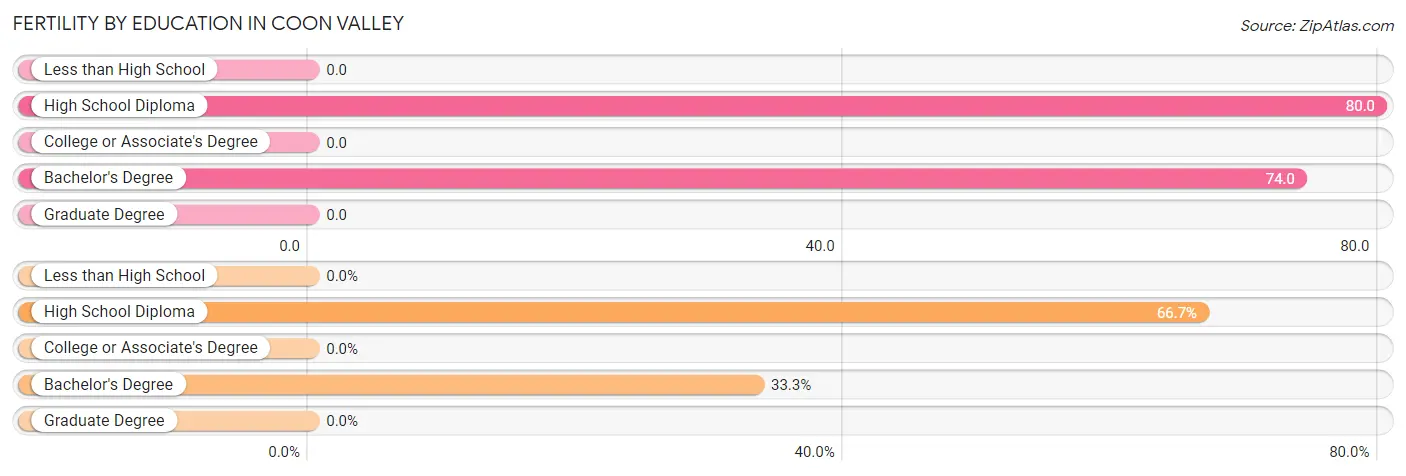
| Educational Attainment | Women with Births | Births / 1,000 Women |
| Less than High School | 0 (0.0%) | 0.0 |
| High School Diploma | 4 (66.7%) | 80.0 |
| College or Associate's Degree | 0 (0.0%) | 0.0 |
| Bachelor's Degree | 2 (33.3%) | 74.0 |
| Graduate Degree | 0 (0.0%) | 0.0 |
| Total | 6 (100.0%) | 25.0 |
Fertility by Education by Marriage Status in Coon Valley
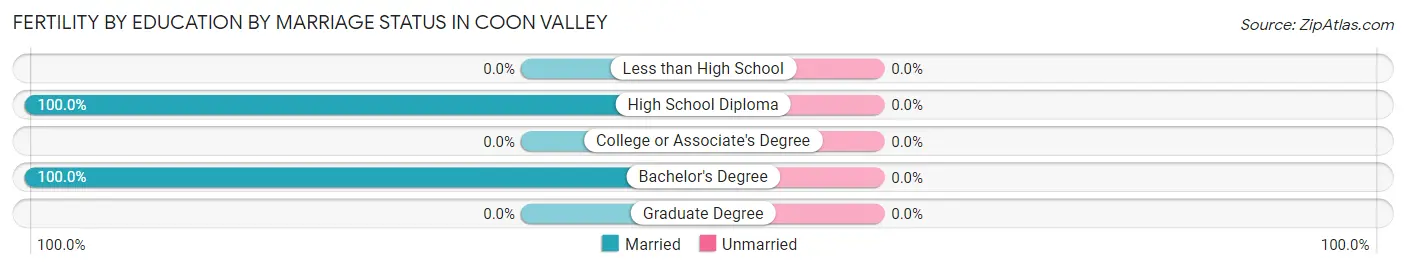
| Educational Attainment | Married | Unmarried |
| Less than High School | 0 (0.0%) | 0 (0.0%) |
| High School Diploma | 4 (100.0%) | 0 (0.0%) |
| College or Associate's Degree | 0 (0.0%) | 0 (0.0%) |
| Bachelor's Degree | 2 (100.0%) | 0 (0.0%) |
| Graduate Degree | 0 (0.0%) | 0 (0.0%) |
| Total | 6 (100.0%) | 0 (0.0%) |
Employment Characteristics in Coon Valley
Employment by Class of Employer in Coon Valley
Among the 498 employed individuals in Coon Valley, private company employees (282 | 56.6%), not-for-profit organizations (103 | 20.7%), and local government employees (33 | 6.6%) make up the most common classes of employment.
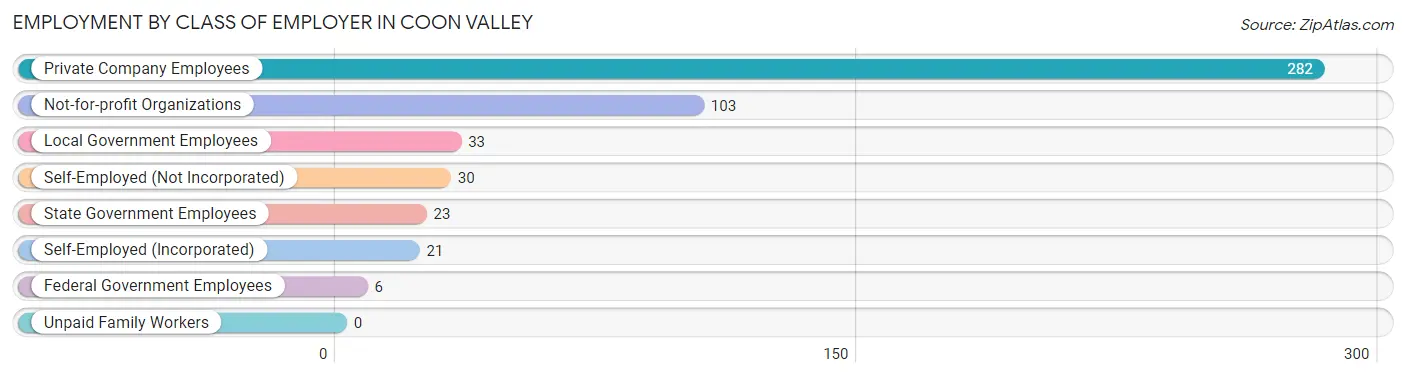
| Employer Class | # Employees | % Employees |
| Private Company Employees | 282 | 56.6% |
| Self-Employed (Incorporated) | 21 | 4.2% |
| Self-Employed (Not Incorporated) | 30 | 6.0% |
| Not-for-profit Organizations | 103 | 20.7% |
| Local Government Employees | 33 | 6.6% |
| State Government Employees | 23 | 4.6% |
| Federal Government Employees | 6 | 1.2% |
| Unpaid Family Workers | 0 | 0.0% |
| Total | 498 | 100.0% |
Employment Status by Age in Coon Valley
According to the labor force statistics for Coon Valley, out of the total population over 16 years of age (761), 67.5% or 514 individuals are in the labor force, with 3.1% or 16 of them unemployed. The age group with the highest labor force participation rate is 25 to 29 years, with 100.0% or 62 individuals in the labor force. Within the labor force, the 25 to 29 years age range has the highest percentage of unemployed individuals, with 11.3% or 7 of them being unemployed.
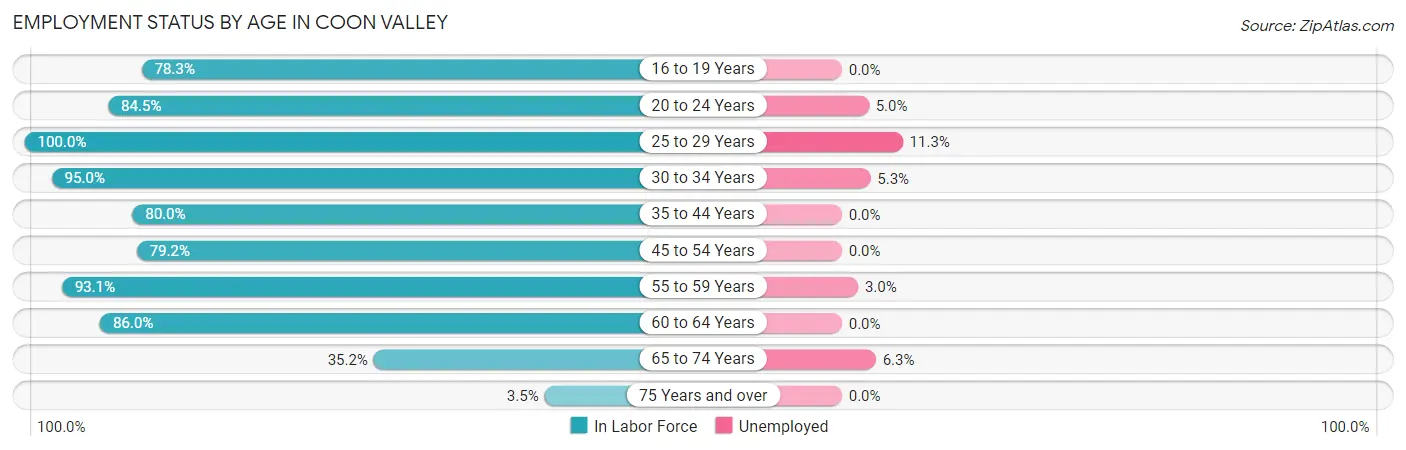
| Age Bracket | In Labor Force | Unemployed |
| 16 to 19 Years | 54 (78.3%) | 0 (0.0%) |
| 20 to 24 Years | 60 (84.5%) | 3 (5.0%) |
| 25 to 29 Years | 62 (100.0%) | 7 (11.3%) |
| 30 to 34 Years | 38 (95.0%) | 2 (5.3%) |
| 35 to 44 Years | 72 (80.0%) | 0 (0.0%) |
| 45 to 54 Years | 76 (79.2%) | 0 (0.0%) |
| 55 to 59 Years | 67 (93.1%) | 2 (3.0%) |
| 60 to 64 Years | 49 (86.0%) | 0 (0.0%) |
| 65 to 74 Years | 32 (35.2%) | 2 (6.3%) |
| 75 Years and over | 4 (3.5%) | 0 (0.0%) |
| Total | 514 (67.5%) | 16 (3.1%) |
Employment Status by Educational Attainment in Coon Valley
According to labor force statistics for Coon Valley, 87.3% of individuals (364) out of the total population between 25 and 64 years of age (417) are in the labor force, with 3.0% or 11 of them being unemployed. The group with the highest labor force participation rate are those with the educational attainment of bachelor's degree or higher, with 95.7% or 112 individuals in the labor force. Within the labor force, individuals with high school diploma education have the highest percentage of unemployment, with 8.5% or 7 of them being unemployed.
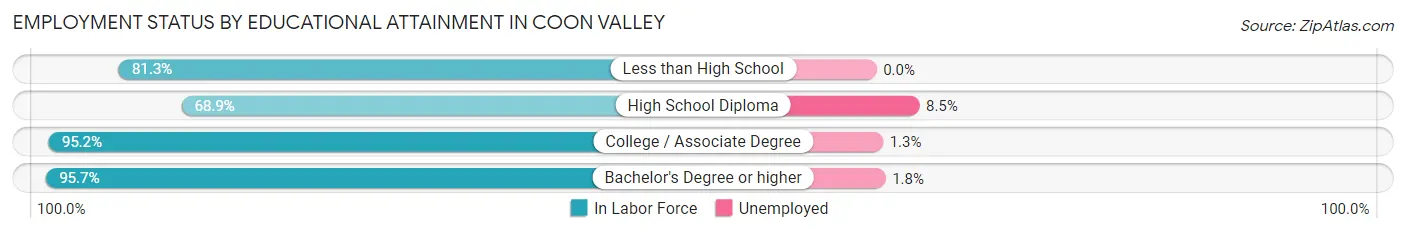
| Educational Attainment | In Labor Force | Unemployed |
| Less than High School | 13 (81.3%) | 0 (0.0%) |
| High School Diploma | 82 (68.9%) | 10 (8.5%) |
| College / Associate Degree | 157 (95.2%) | 2 (1.3%) |
| Bachelor's Degree or higher | 112 (95.7%) | 2 (1.8%) |
| Total | 364 (87.3%) | 13 (3.0%) |
Employment Occupations by Sex in Coon Valley
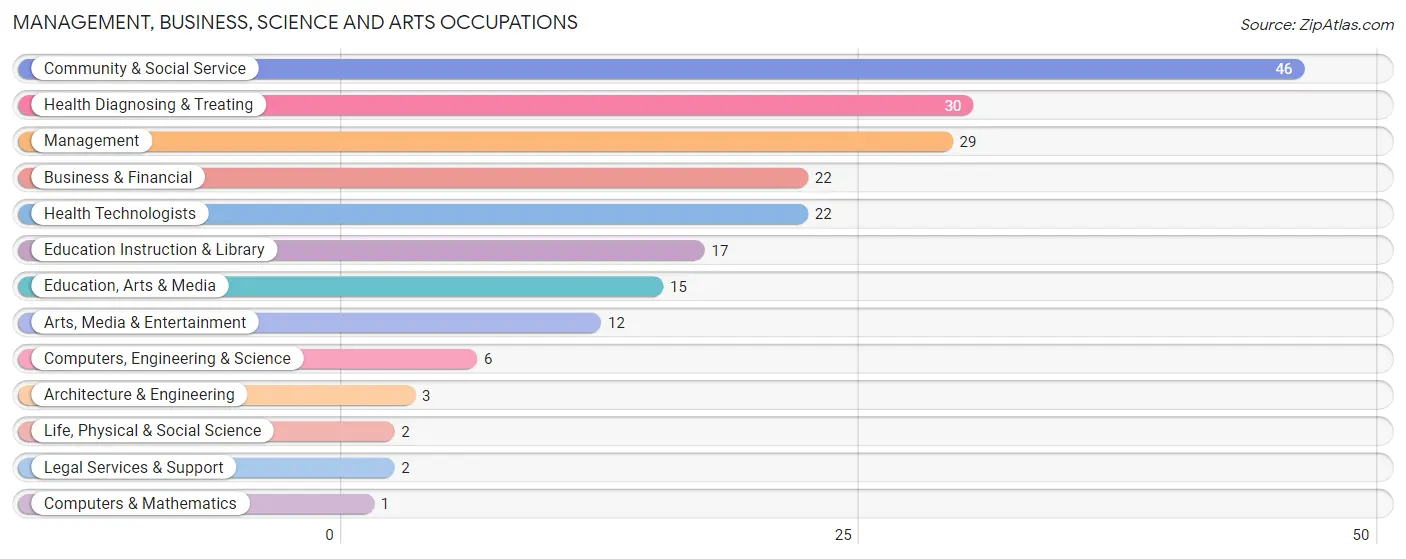
Management, Business, Science and Arts Occupations
The most common Management, Business, Science and Arts occupations in Coon Valley are Community & Social Service (46 | 9.2%), Health Diagnosing & Treating (30 | 6.0%), Management (29 | 5.8%), Business & Financial (22 | 4.4%), and Health Technologists (22 | 4.4%).
Management, Business, Science and Arts Occupations by Sex
Within the Management, Business, Science and Arts occupations in Coon Valley, the most male-oriented occupations are Computers, Engineering & Science (100.0%), Computers & Mathematics (100.0%), and Architecture & Engineering (100.0%), while the most female-oriented occupations are Legal Services & Support (100.0%), Health Diagnosing & Treating (86.7%), and Health Technologists (81.8%).
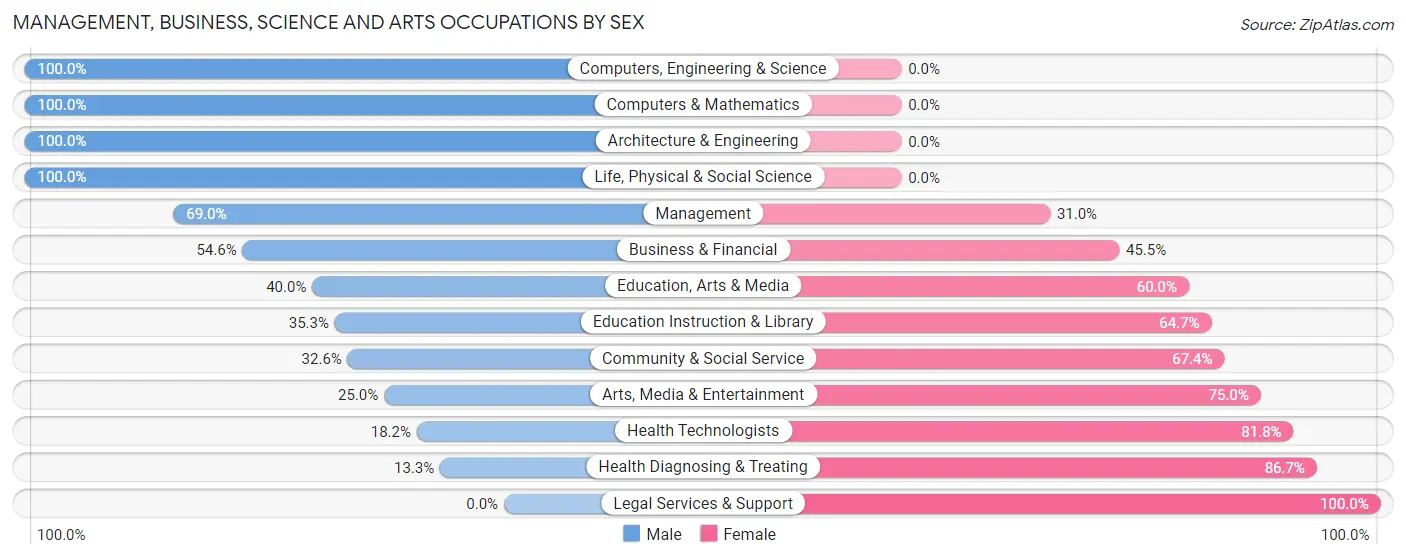
| Occupation | Male | Female |
| Management | 20 (69.0%) | 9 (31.0%) |
| Business & Financial | 12 (54.5%) | 10 (45.5%) |
| Computers, Engineering & Science | 6 (100.0%) | 0 (0.0%) |
| Computers & Mathematics | 1 (100.0%) | 0 (0.0%) |
| Architecture & Engineering | 3 (100.0%) | 0 (0.0%) |
| Life, Physical & Social Science | 2 (100.0%) | 0 (0.0%) |
| Community & Social Service | 15 (32.6%) | 31 (67.4%) |
| Education, Arts & Media | 6 (40.0%) | 9 (60.0%) |
| Legal Services & Support | 0 (0.0%) | 2 (100.0%) |
| Education Instruction & Library | 6 (35.3%) | 11 (64.7%) |
| Arts, Media & Entertainment | 3 (25.0%) | 9 (75.0%) |
| Health Diagnosing & Treating | 4 (13.3%) | 26 (86.7%) |
| Health Technologists | 4 (18.2%) | 18 (81.8%) |
| Total (Category) | 57 (42.9%) | 76 (57.1%) |
| Total (Overall) | 229 (46.0%) | 269 (54.0%) |
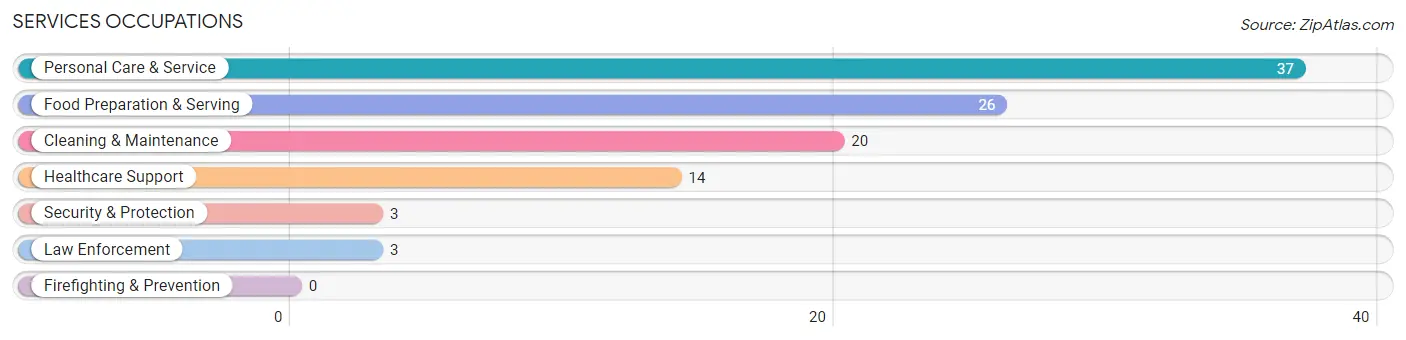
Services Occupations
The most common Services occupations in Coon Valley are Personal Care & Service (37 | 7.4%), Food Preparation & Serving (26 | 5.2%), Cleaning & Maintenance (20 | 4.0%), Healthcare Support (14 | 2.8%), and Security & Protection (3 | 0.6%).
Services Occupations by Sex
Within the Services occupations in Coon Valley, the most male-oriented occupations are Security & Protection (100.0%), Law Enforcement (100.0%), and Cleaning & Maintenance (65.0%), while the most female-oriented occupations are Healthcare Support (100.0%), Food Preparation & Serving (100.0%), and Personal Care & Service (94.6%).
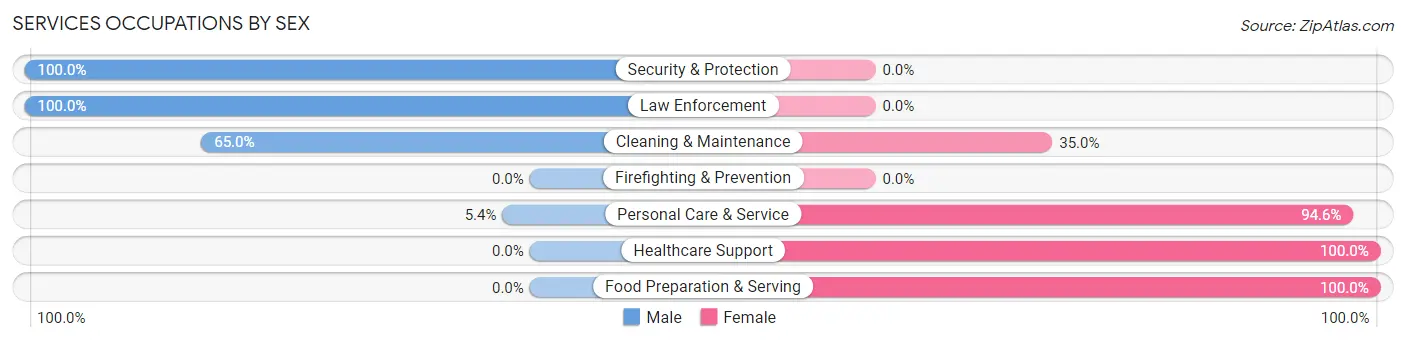
| Occupation | Male | Female |
| Healthcare Support | 0 (0.0%) | 14 (100.0%) |
| Security & Protection | 3 (100.0%) | 0 (0.0%) |
| Firefighting & Prevention | 0 (0.0%) | 0 (0.0%) |
| Law Enforcement | 3 (100.0%) | 0 (0.0%) |
| Food Preparation & Serving | 0 (0.0%) | 26 (100.0%) |
| Cleaning & Maintenance | 13 (65.0%) | 7 (35.0%) |
| Personal Care & Service | 2 (5.4%) | 35 (94.6%) |
| Total (Category) | 18 (18.0%) | 82 (82.0%) |
| Total (Overall) | 229 (46.0%) | 269 (54.0%) |
Sales and Office Occupations
The most common Sales and Office occupations in Coon Valley are Office & Administration (77 | 15.5%), and Sales & Related (64 | 12.9%).
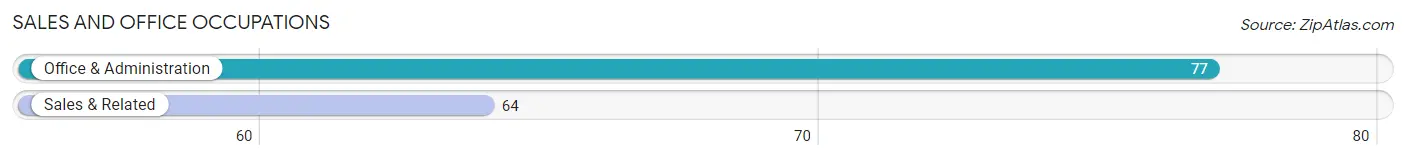
Sales and Office Occupations by Sex
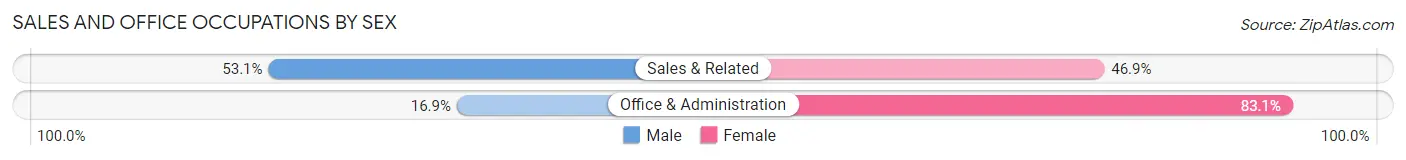
| Occupation | Male | Female |
| Sales & Related | 34 (53.1%) | 30 (46.9%) |
| Office & Administration | 13 (16.9%) | 64 (83.1%) |
| Total (Category) | 47 (33.3%) | 94 (66.7%) |
| Total (Overall) | 229 (46.0%) | 269 (54.0%) |
Natural Resources, Construction and Maintenance Occupations
The most common Natural Resources, Construction and Maintenance occupations in Coon Valley are Installation, Maintenance & Repair (15 | 3.0%), Construction & Extraction (11 | 2.2%), and Farming, Fishing & Forestry (2 | 0.4%).
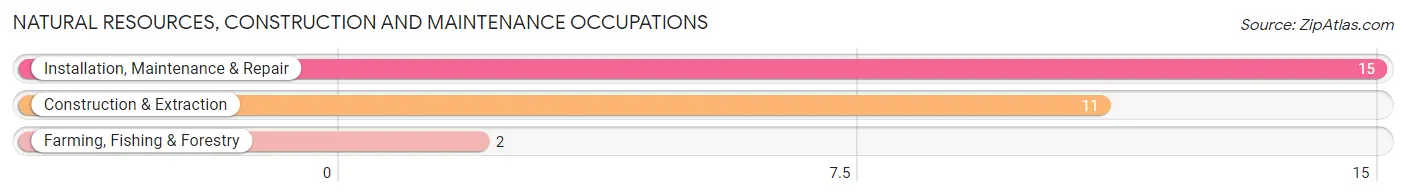
Natural Resources, Construction and Maintenance Occupations by Sex
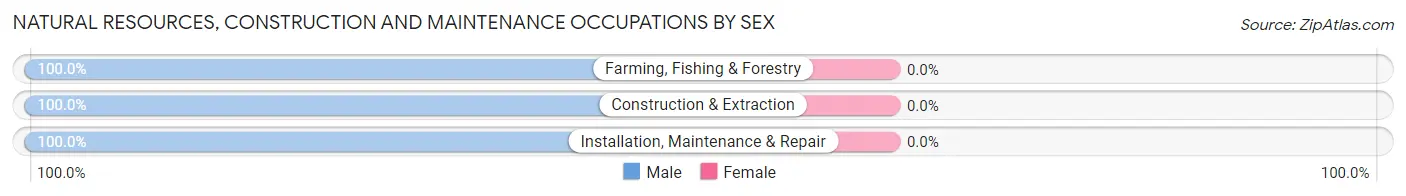
| Occupation | Male | Female |
| Farming, Fishing & Forestry | 2 (100.0%) | 0 (0.0%) |
| Construction & Extraction | 11 (100.0%) | 0 (0.0%) |
| Installation, Maintenance & Repair | 15 (100.0%) | 0 (0.0%) |
| Total (Category) | 28 (100.0%) | 0 (0.0%) |
| Total (Overall) | 229 (46.0%) | 269 (54.0%) |
Production, Transportation and Moving Occupations
The most common Production, Transportation and Moving occupations in Coon Valley are Production (44 | 8.8%), Material Moving (32 | 6.4%), and Transportation (20 | 4.0%).
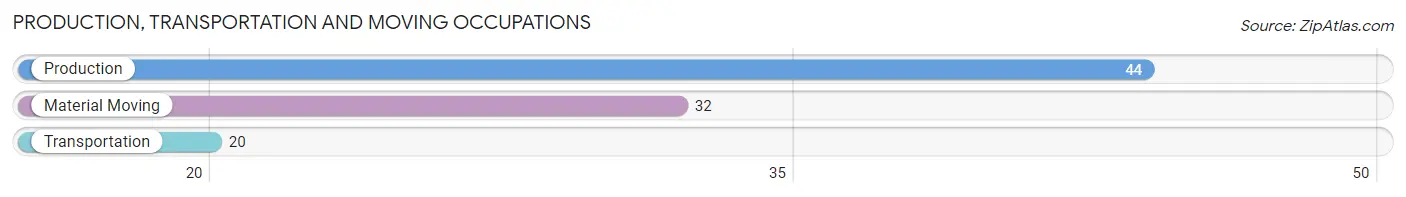
Production, Transportation and Moving Occupations by Sex
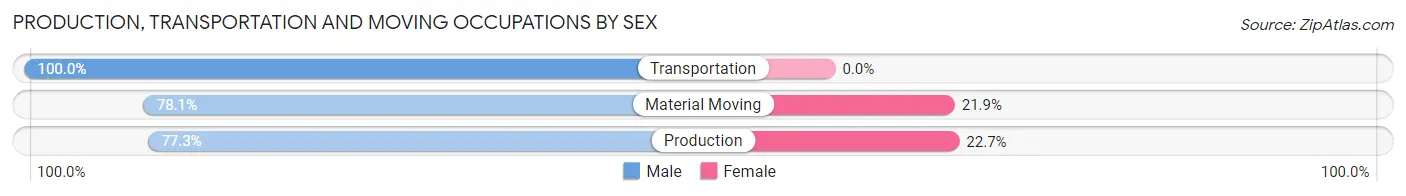
| Occupation | Male | Female |
| Production | 34 (77.3%) | 10 (22.7%) |
| Transportation | 20 (100.0%) | 0 (0.0%) |
| Material Moving | 25 (78.1%) | 7 (21.9%) |
| Total (Category) | 79 (82.3%) | 17 (17.7%) |
| Total (Overall) | 229 (46.0%) | 269 (54.0%) |
Employment Industries by Sex in Coon Valley
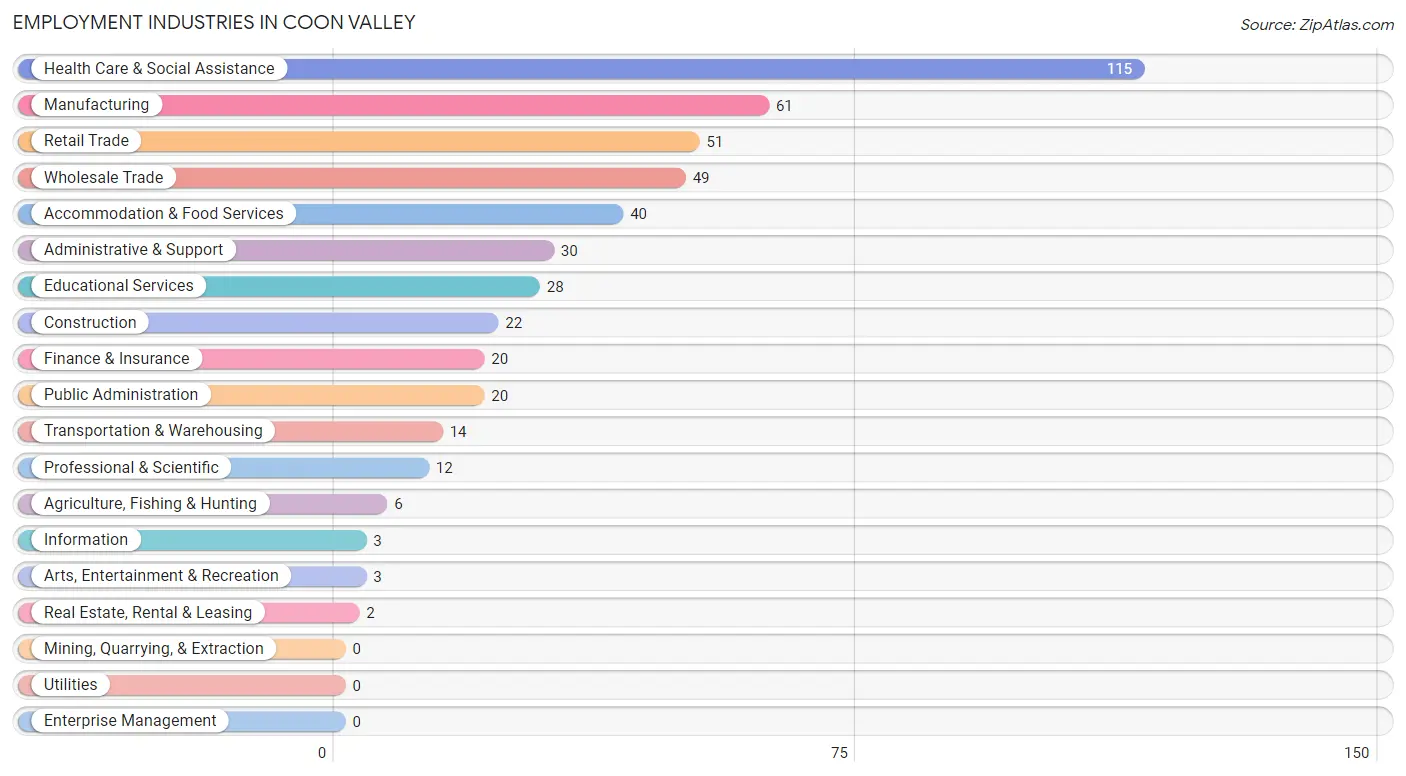
Employment Industries in Coon Valley
The major employment industries in Coon Valley include Health Care & Social Assistance (115 | 23.1%), Manufacturing (61 | 12.2%), Retail Trade (51 | 10.2%), Wholesale Trade (49 | 9.8%), and Accommodation & Food Services (40 | 8.0%).
Employment Industries by Sex in Coon Valley
The Coon Valley industries that see more men than women are Agriculture, Fishing & Hunting (100.0%), Construction (100.0%), and Information (100.0%), whereas the industries that tend to have a higher number of women are Real Estate, Rental & Leasing (100.0%), Arts, Entertainment & Recreation (100.0%), and Health Care & Social Assistance (93.9%).
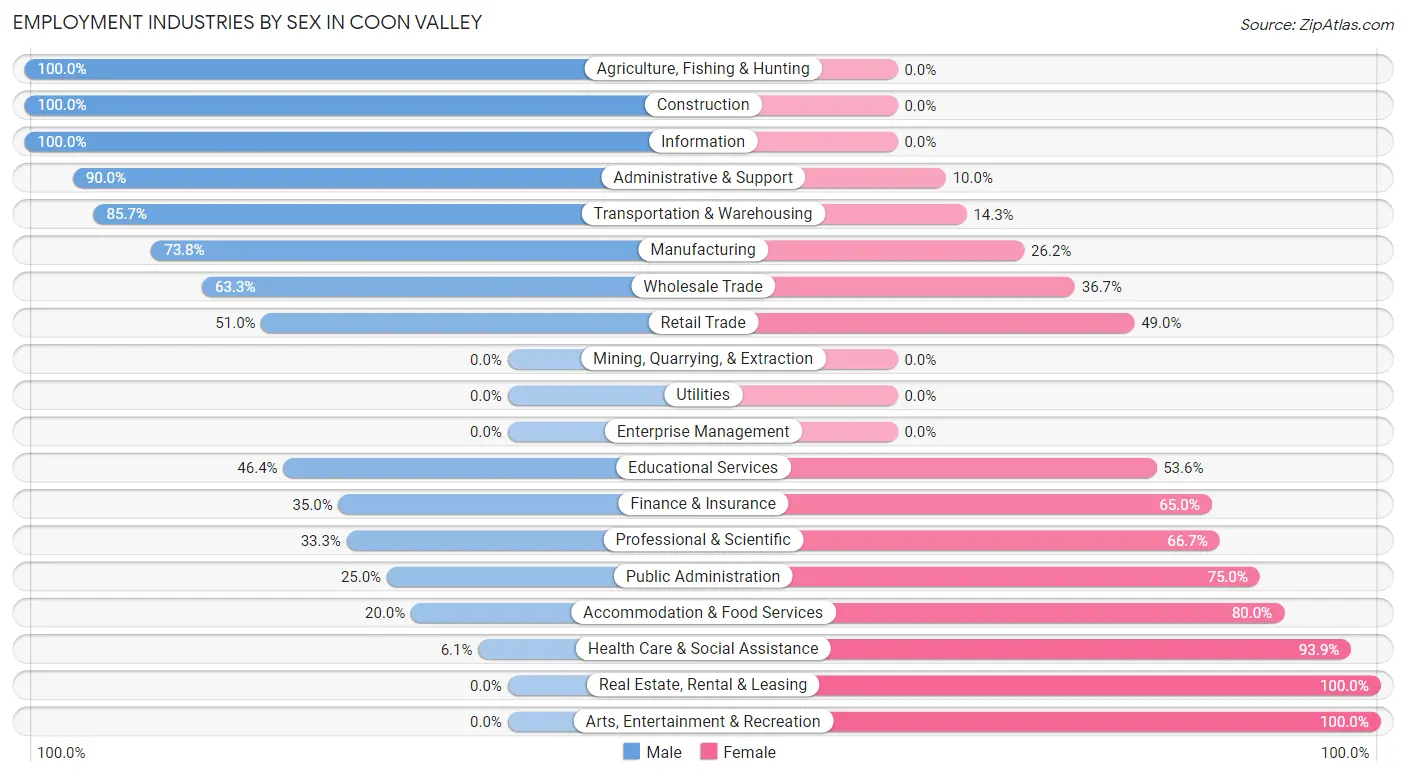
| Industry | Male | Female |
| Agriculture, Fishing & Hunting | 6 (100.0%) | 0 (0.0%) |
| Mining, Quarrying, & Extraction | 0 (0.0%) | 0 (0.0%) |
| Construction | 22 (100.0%) | 0 (0.0%) |
| Manufacturing | 45 (73.8%) | 16 (26.2%) |
| Wholesale Trade | 31 (63.3%) | 18 (36.7%) |
| Retail Trade | 26 (51.0%) | 25 (49.0%) |
| Transportation & Warehousing | 12 (85.7%) | 2 (14.3%) |
| Utilities | 0 (0.0%) | 0 (0.0%) |
| Information | 3 (100.0%) | 0 (0.0%) |
| Finance & Insurance | 7 (35.0%) | 13 (65.0%) |
| Real Estate, Rental & Leasing | 0 (0.0%) | 2 (100.0%) |
| Professional & Scientific | 4 (33.3%) | 8 (66.7%) |
| Enterprise Management | 0 (0.0%) | 0 (0.0%) |
| Administrative & Support | 27 (90.0%) | 3 (10.0%) |
| Educational Services | 13 (46.4%) | 15 (53.6%) |
| Health Care & Social Assistance | 7 (6.1%) | 108 (93.9%) |
| Arts, Entertainment & Recreation | 0 (0.0%) | 3 (100.0%) |
| Accommodation & Food Services | 8 (20.0%) | 32 (80.0%) |
| Public Administration | 5 (25.0%) | 15 (75.0%) |
| Total | 229 (46.0%) | 269 (54.0%) |
Education in Coon Valley
School Enrollment in Coon Valley
The most common levels of schooling among the 172 students in Coon Valley are college / undergraduate (45 | 26.2%), high school (43 | 25.0%), and elementary school (30 | 17.4%).
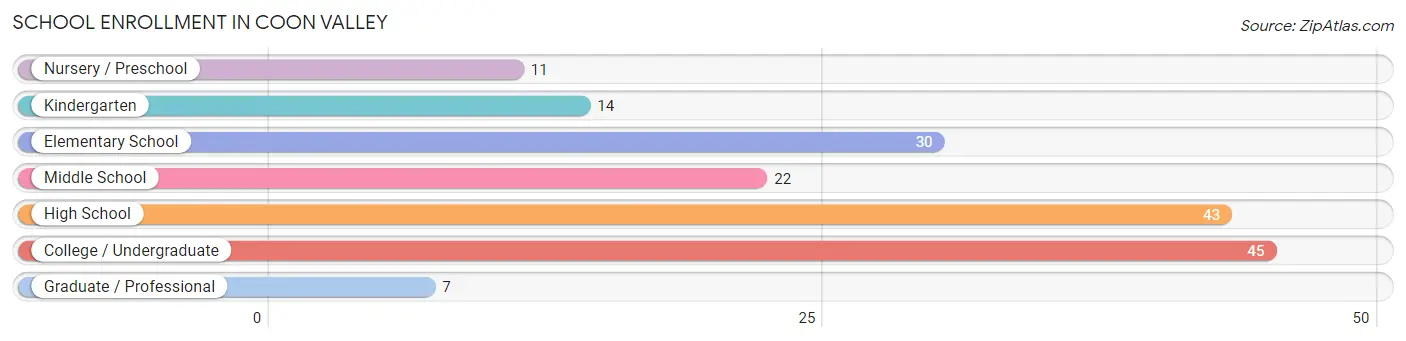
| School Level | # Students | % Students |
| Nursery / Preschool | 11 | 6.4% |
| Kindergarten | 14 | 8.1% |
| Elementary School | 30 | 17.4% |
| Middle School | 22 | 12.8% |
| High School | 43 | 25.0% |
| College / Undergraduate | 45 | 26.2% |
| Graduate / Professional | 7 | 4.1% |
| Total | 172 | 100.0% |
School Enrollment by Age by Funding Source in Coon Valley
Out of a total of 172 students who are enrolled in schools in Coon Valley, 9 (5.2%) attend a private institution, while the remaining 163 (94.8%) are enrolled in public schools. The age group of 20 to 24 year olds has the highest likelihood of being enrolled in private schools, with 9 (27.3% in the age bracket) enrolled. Conversely, the age group of 3 to 4 year olds has the lowest likelihood of being enrolled in a private school, with 9 (100.0% in the age bracket) attending a public institution.
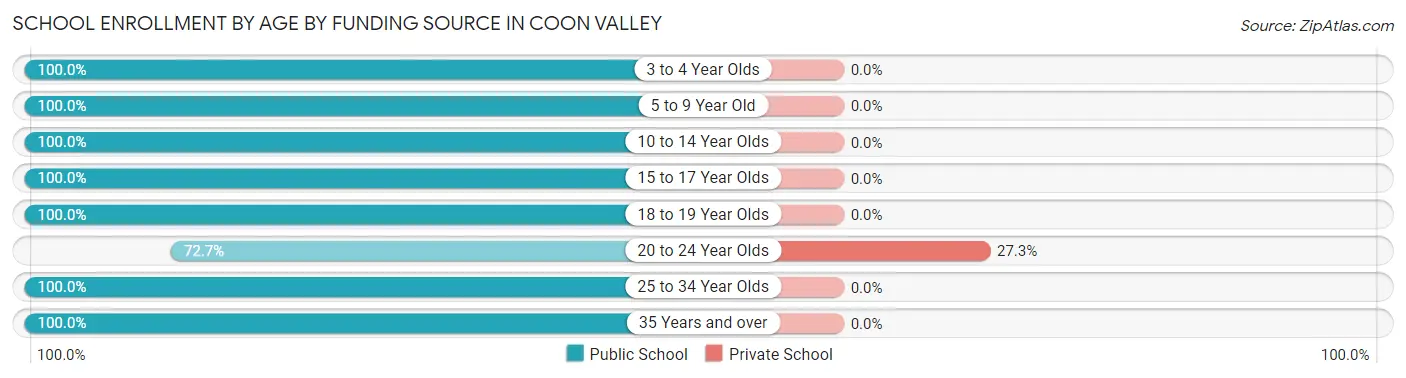
| Age Bracket | Public School | Private School |
| 3 to 4 Year Olds | 9 (100.0%) | 0 (0.0%) |
| 5 to 9 Year Old | 37 (100.0%) | 0 (0.0%) |
| 10 to 14 Year Olds | 40 (100.0%) | 0 (0.0%) |
| 15 to 17 Year Olds | 34 (100.0%) | 0 (0.0%) |
| 18 to 19 Year Olds | 6 (100.0%) | 0 (0.0%) |
| 20 to 24 Year Olds | 24 (72.7%) | 9 (27.3%) |
| 25 to 34 Year Olds | 9 (100.0%) | 0 (0.0%) |
| 35 Years and over | 4 (100.0%) | 0 (0.0%) |
| Total | 163 (94.8%) | 9 (5.2%) |
Educational Attainment by Field of Study in Coon Valley
Business (49 | 30.8%), education (24 | 15.1%), social sciences (18 | 11.3%), liberal arts & history (18 | 11.3%), and science & technology (10 | 6.3%) are the most common fields of study among 159 individuals in Coon Valley who have obtained a bachelor's degree or higher.
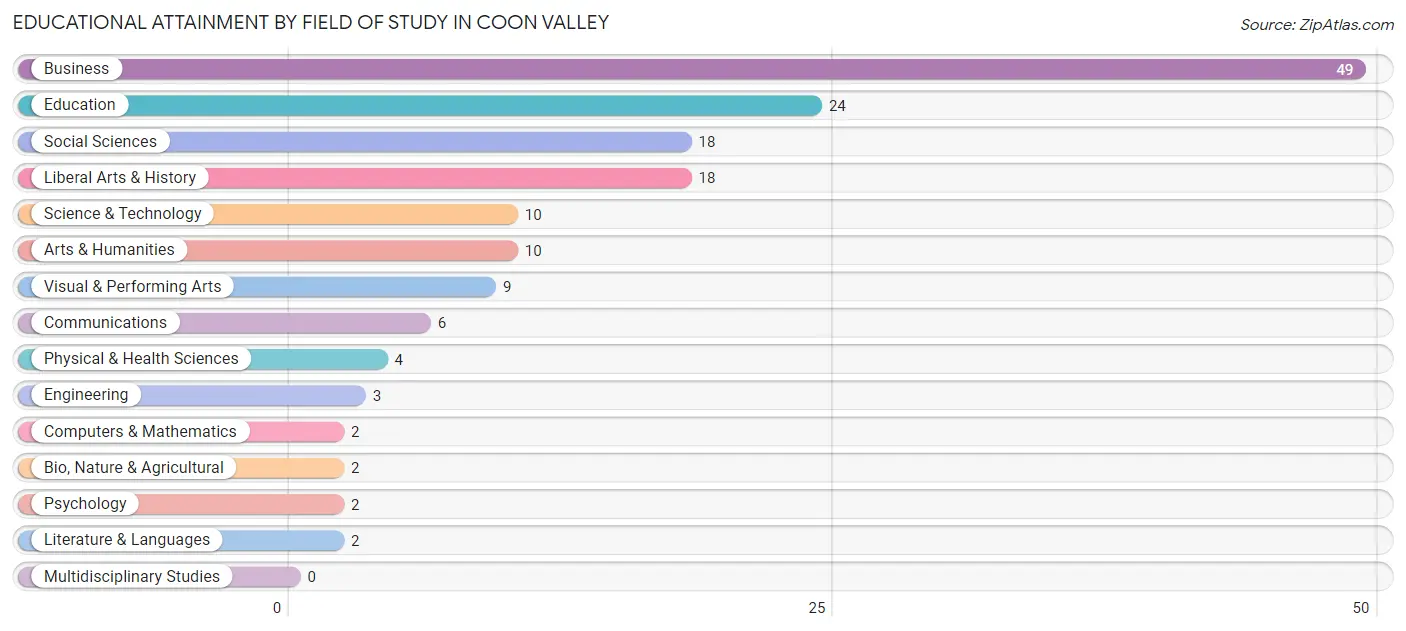
| Field of Study | # Graduates | % Graduates |
| Computers & Mathematics | 2 | 1.3% |
| Bio, Nature & Agricultural | 2 | 1.3% |
| Physical & Health Sciences | 4 | 2.5% |
| Psychology | 2 | 1.3% |
| Social Sciences | 18 | 11.3% |
| Engineering | 3 | 1.9% |
| Multidisciplinary Studies | 0 | 0.0% |
| Science & Technology | 10 | 6.3% |
| Business | 49 | 30.8% |
| Education | 24 | 15.1% |
| Literature & Languages | 2 | 1.3% |
| Liberal Arts & History | 18 | 11.3% |
| Visual & Performing Arts | 9 | 5.7% |
| Communications | 6 | 3.8% |
| Arts & Humanities | 10 | 6.3% |
| Total | 159 | 100.0% |
Transportation & Commute in Coon Valley
Vehicle Availability by Sex in Coon Valley
The most prevalent vehicle ownership categories in Coon Valley are males with 2 vehicles (120, accounting for 52.4%) and females with 2 vehicles (111, making up 45.1%).
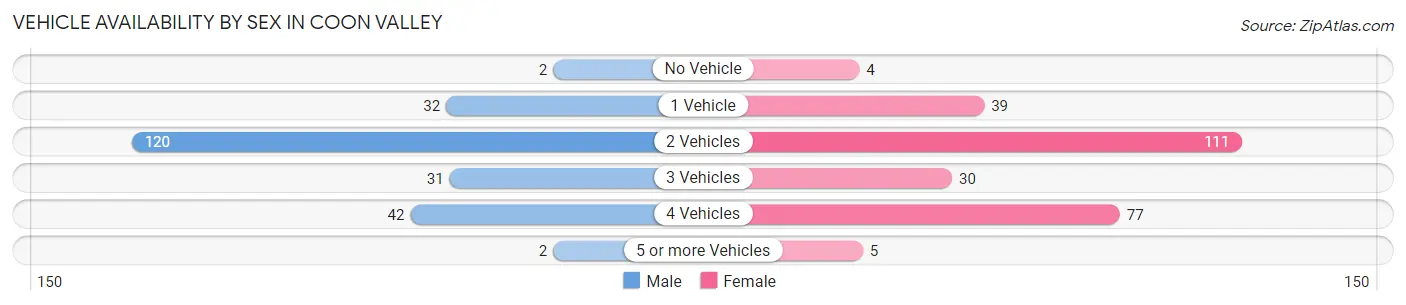
| Vehicles Available | Male | Female |
| No Vehicle | 2 (0.9%) | 4 (1.5%) |
| 1 Vehicle | 32 (14.0%) | 39 (14.7%) |
| 2 Vehicles | 120 (52.4%) | 111 (41.7%) |
| 3 Vehicles | 31 (13.5%) | 30 (11.3%) |
| 4 Vehicles | 42 (18.3%) | 77 (28.9%) |
| 5 or more Vehicles | 2 (0.9%) | 5 (1.9%) |
| Total | 229 (100.0%) | 266 (100.0%) |
Commute Time in Coon Valley
The most frequently occuring commute durations in Coon Valley are 30 to 34 minutes (107 commuters, 22.8%), 25 to 29 minutes (98 commuters, 20.9%), and 20 to 24 minutes (79 commuters, 16.8%).
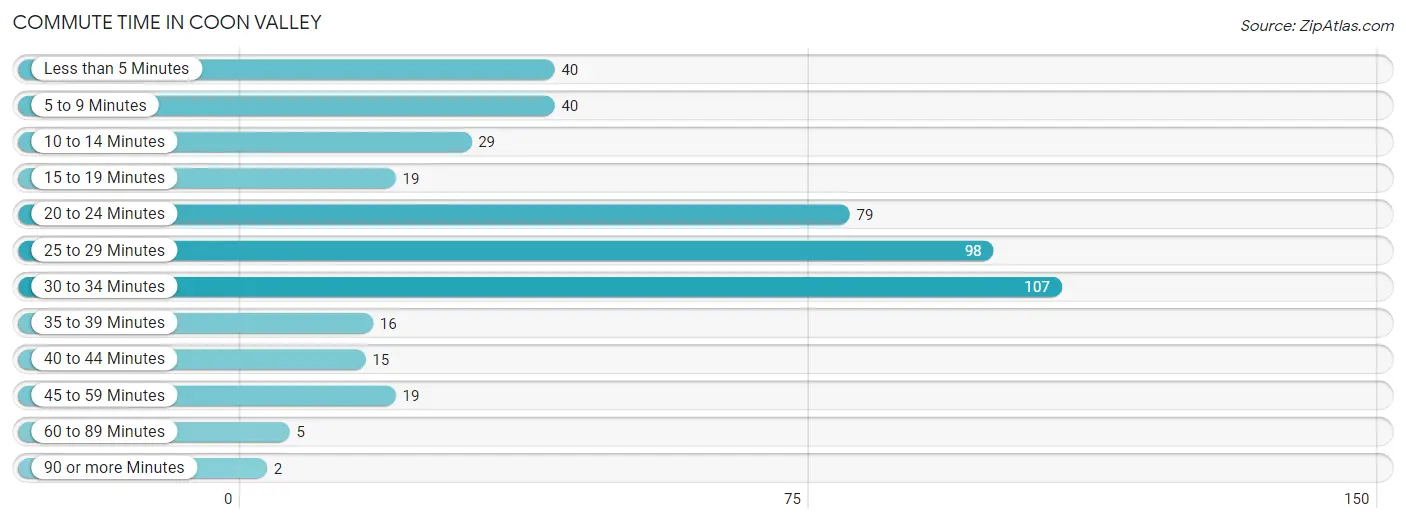
| Commute Time | # Commuters | % Commuters |
| Less than 5 Minutes | 40 | 8.5% |
| 5 to 9 Minutes | 40 | 8.5% |
| 10 to 14 Minutes | 29 | 6.2% |
| 15 to 19 Minutes | 19 | 4.1% |
| 20 to 24 Minutes | 79 | 16.8% |
| 25 to 29 Minutes | 98 | 20.9% |
| 30 to 34 Minutes | 107 | 22.8% |
| 35 to 39 Minutes | 16 | 3.4% |
| 40 to 44 Minutes | 15 | 3.2% |
| 45 to 59 Minutes | 19 | 4.1% |
| 60 to 89 Minutes | 5 | 1.1% |
| 90 or more Minutes | 2 | 0.4% |
Commute Time by Sex in Coon Valley
The most common commute times in Coon Valley are 20 to 24 minutes (50 commuters, 21.8%) for males and 25 to 29 minutes (62 commuters, 25.8%) for females.
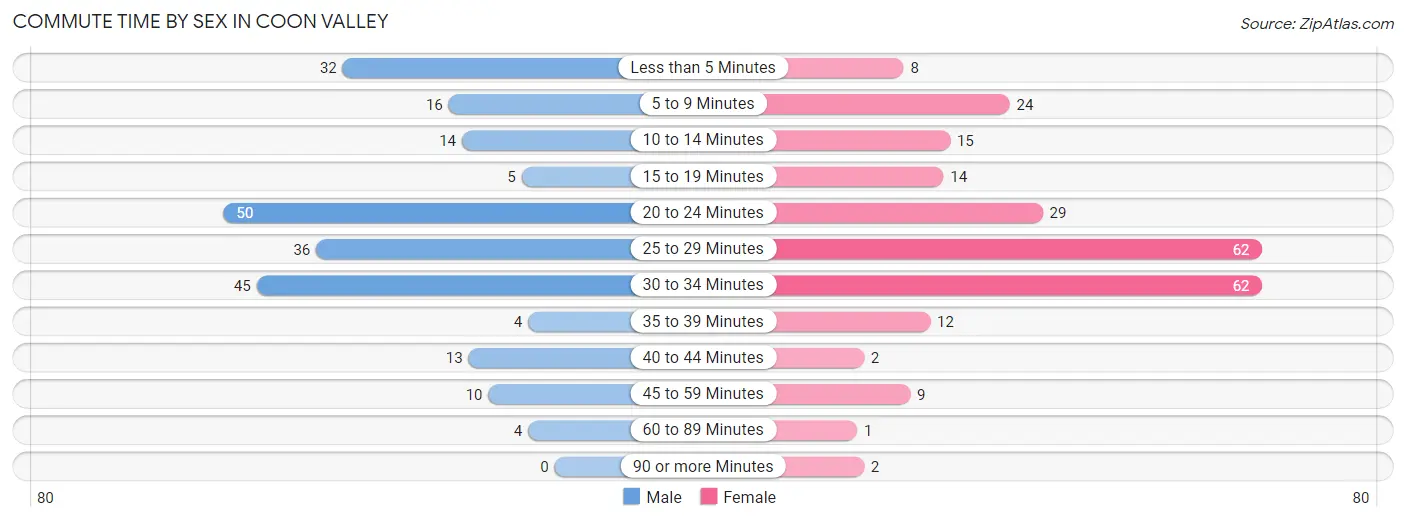
| Commute Time | Male | Female |
| Less than 5 Minutes | 32 (14.0%) | 8 (3.3%) |
| 5 to 9 Minutes | 16 (7.0%) | 24 (10.0%) |
| 10 to 14 Minutes | 14 (6.1%) | 15 (6.2%) |
| 15 to 19 Minutes | 5 (2.2%) | 14 (5.8%) |
| 20 to 24 Minutes | 50 (21.8%) | 29 (12.1%) |
| 25 to 29 Minutes | 36 (15.7%) | 62 (25.8%) |
| 30 to 34 Minutes | 45 (19.7%) | 62 (25.8%) |
| 35 to 39 Minutes | 4 (1.8%) | 12 (5.0%) |
| 40 to 44 Minutes | 13 (5.7%) | 2 (0.8%) |
| 45 to 59 Minutes | 10 (4.4%) | 9 (3.7%) |
| 60 to 89 Minutes | 4 (1.8%) | 1 (0.4%) |
| 90 or more Minutes | 0 (0.0%) | 2 (0.8%) |
Time of Departure to Work by Sex in Coon Valley
The most frequent times of departure to work in Coon Valley are 7:30 AM to 7:59 AM (45, 19.7%) for males and 7:00 AM to 7:29 AM (66, 27.5%) for females.
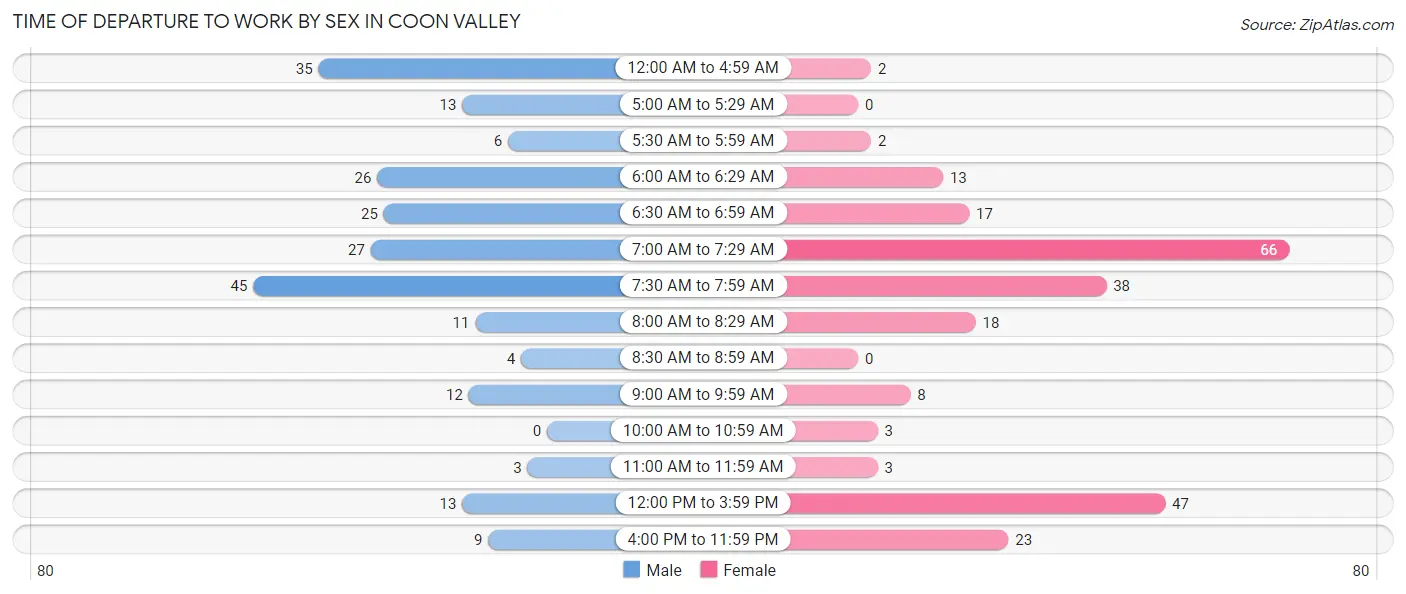
| Time of Departure | Male | Female |
| 12:00 AM to 4:59 AM | 35 (15.3%) | 2 (0.8%) |
| 5:00 AM to 5:29 AM | 13 (5.7%) | 0 (0.0%) |
| 5:30 AM to 5:59 AM | 6 (2.6%) | 2 (0.8%) |
| 6:00 AM to 6:29 AM | 26 (11.4%) | 13 (5.4%) |
| 6:30 AM to 6:59 AM | 25 (10.9%) | 17 (7.1%) |
| 7:00 AM to 7:29 AM | 27 (11.8%) | 66 (27.5%) |
| 7:30 AM to 7:59 AM | 45 (19.7%) | 38 (15.8%) |
| 8:00 AM to 8:29 AM | 11 (4.8%) | 18 (7.5%) |
| 8:30 AM to 8:59 AM | 4 (1.8%) | 0 (0.0%) |
| 9:00 AM to 9:59 AM | 12 (5.2%) | 8 (3.3%) |
| 10:00 AM to 10:59 AM | 0 (0.0%) | 3 (1.3%) |
| 11:00 AM to 11:59 AM | 3 (1.3%) | 3 (1.3%) |
| 12:00 PM to 3:59 PM | 13 (5.7%) | 47 (19.6%) |
| 4:00 PM to 11:59 PM | 9 (3.9%) | 23 (9.6%) |
| Total | 229 (100.0%) | 240 (100.0%) |
Housing Occupancy in Coon Valley
Occupancy by Ownership in Coon Valley
Of the total 376 dwellings in Coon Valley, owner-occupied units account for 295 (78.5%), while renter-occupied units make up 81 (21.5%).
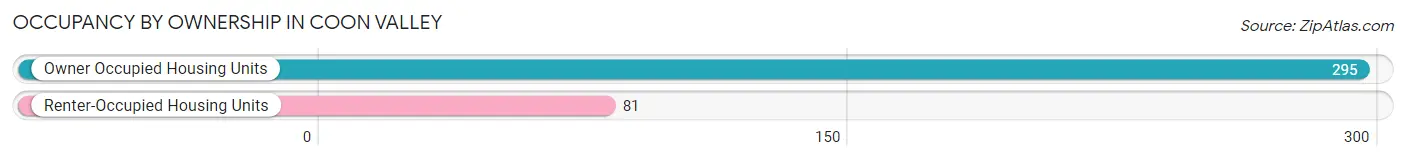
| Occupancy | # Housing Units | % Housing Units |
| Owner Occupied Housing Units | 295 | 78.5% |
| Renter-Occupied Housing Units | 81 | 21.5% |
| Total Occupied Housing Units | 376 | 100.0% |
Occupancy by Household Size in Coon Valley
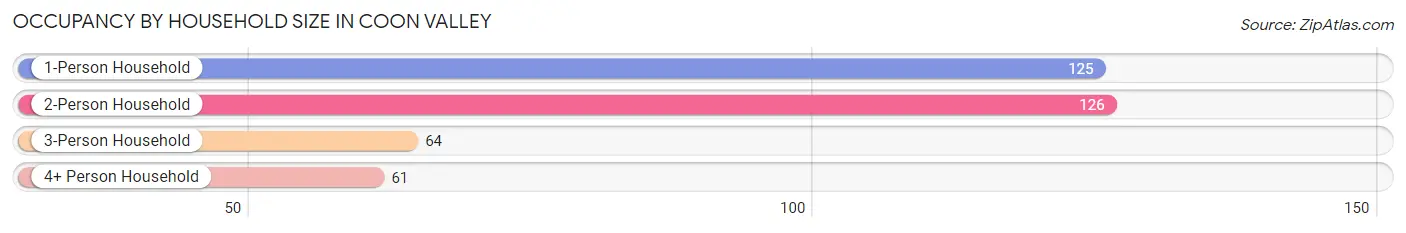
| Household Size | # Housing Units | % Housing Units |
| 1-Person Household | 125 | 33.2% |
| 2-Person Household | 126 | 33.5% |
| 3-Person Household | 64 | 17.0% |
| 4+ Person Household | 61 | 16.2% |
| Total Housing Units | 376 | 100.0% |
Occupancy by Ownership by Household Size in Coon Valley
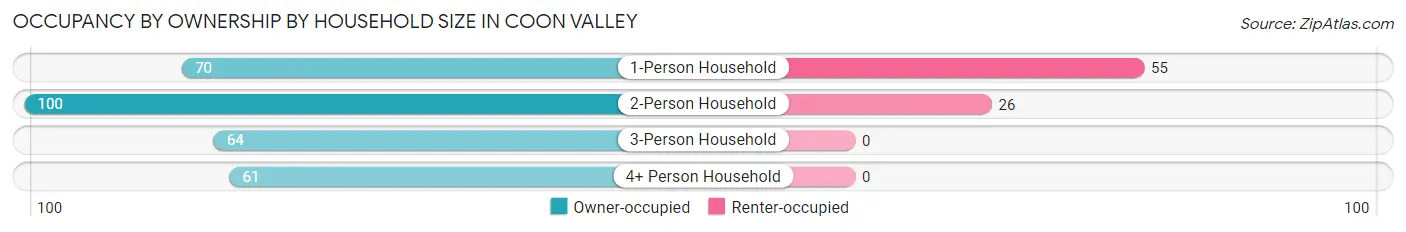
| Household Size | Owner-occupied | Renter-occupied |
| 1-Person Household | 70 (56.0%) | 55 (44.0%) |
| 2-Person Household | 100 (79.4%) | 26 (20.6%) |
| 3-Person Household | 64 (100.0%) | 0 (0.0%) |
| 4+ Person Household | 61 (100.0%) | 0 (0.0%) |
| Total Housing Units | 295 (78.5%) | 81 (21.5%) |
Occupancy by Educational Attainment in Coon Valley
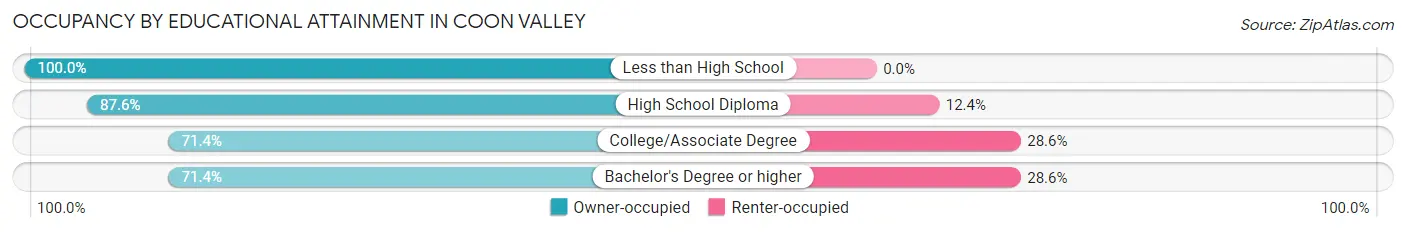
| Household Size | Owner-occupied | Renter-occupied |
| Less than High School | 15 (100.0%) | 0 (0.0%) |
| High School Diploma | 120 (87.6%) | 17 (12.4%) |
| College/Associate Degree | 80 (71.4%) | 32 (28.6%) |
| Bachelor's Degree or higher | 80 (71.4%) | 32 (28.6%) |
Occupancy by Age of Householder in Coon Valley
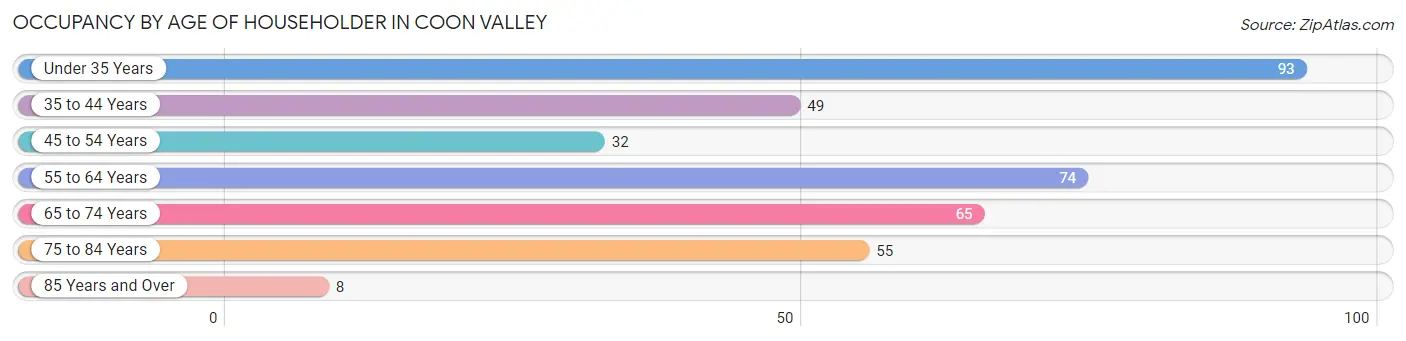
| Age Bracket | # Households | % Households |
| Under 35 Years | 93 | 24.7% |
| 35 to 44 Years | 49 | 13.0% |
| 45 to 54 Years | 32 | 8.5% |
| 55 to 64 Years | 74 | 19.7% |
| 65 to 74 Years | 65 | 17.3% |
| 75 to 84 Years | 55 | 14.6% |
| 85 Years and Over | 8 | 2.1% |
| Total | 376 | 100.0% |
Housing Finances in Coon Valley
Median Income by Occupancy in Coon Valley
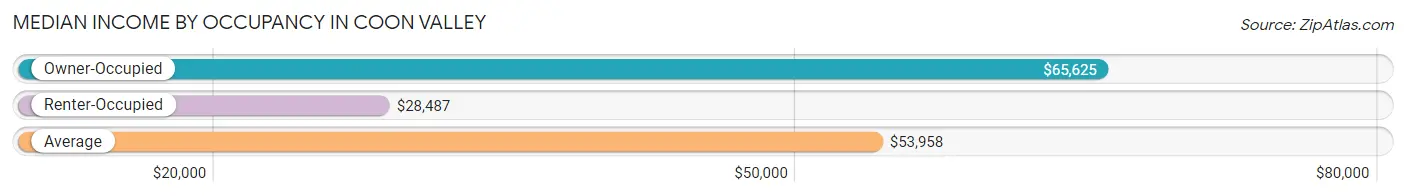
| Occupancy Type | # Households | Median Income |
| Owner-Occupied | 295 (78.5%) | $65,625 |
| Renter-Occupied | 81 (21.5%) | $28,487 |
| Average | 376 (100.0%) | $53,958 |
Occupancy by Householder Income Bracket in Coon Valley
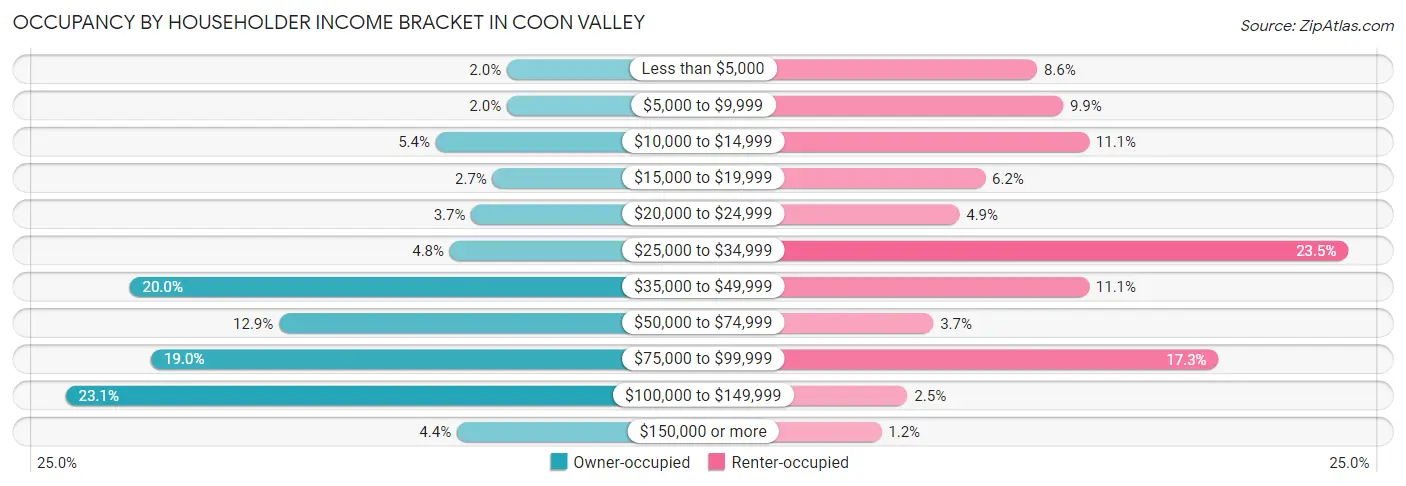
| Income Bracket | Owner-occupied | Renter-occupied |
| Less than $5,000 | 6 (2.0%) | 7 (8.6%) |
| $5,000 to $9,999 | 6 (2.0%) | 8 (9.9%) |
| $10,000 to $14,999 | 16 (5.4%) | 9 (11.1%) |
| $15,000 to $19,999 | 8 (2.7%) | 5 (6.2%) |
| $20,000 to $24,999 | 11 (3.7%) | 4 (4.9%) |
| $25,000 to $34,999 | 14 (4.8%) | 19 (23.5%) |
| $35,000 to $49,999 | 59 (20.0%) | 9 (11.1%) |
| $50,000 to $74,999 | 38 (12.9%) | 3 (3.7%) |
| $75,000 to $99,999 | 56 (19.0%) | 14 (17.3%) |
| $100,000 to $149,999 | 68 (23.1%) | 2 (2.5%) |
| $150,000 or more | 13 (4.4%) | 1 (1.2%) |
| Total | 295 (100.0%) | 81 (100.0%) |
Monthly Housing Cost Tiers in Coon Valley
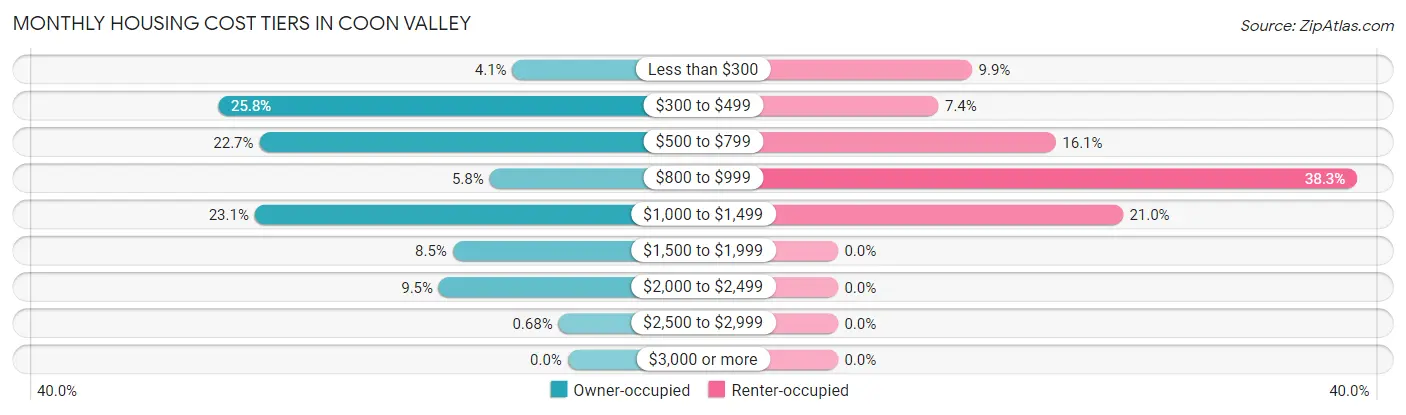
| Monthly Cost | Owner-occupied | Renter-occupied |
| Less than $300 | 12 (4.1%) | 8 (9.9%) |
| $300 to $499 | 76 (25.8%) | 6 (7.4%) |
| $500 to $799 | 67 (22.7%) | 13 (16.1%) |
| $800 to $999 | 17 (5.8%) | 31 (38.3%) |
| $1,000 to $1,499 | 68 (23.1%) | 17 (21.0%) |
| $1,500 to $1,999 | 25 (8.5%) | 0 (0.0%) |
| $2,000 to $2,499 | 28 (9.5%) | 0 (0.0%) |
| $2,500 to $2,999 | 2 (0.7%) | 0 (0.0%) |
| $3,000 or more | 0 (0.0%) | 0 (0.0%) |
| Total | 295 (100.0%) | 81 (100.0%) |
Physical Housing Characteristics in Coon Valley
Housing Structures in Coon Valley
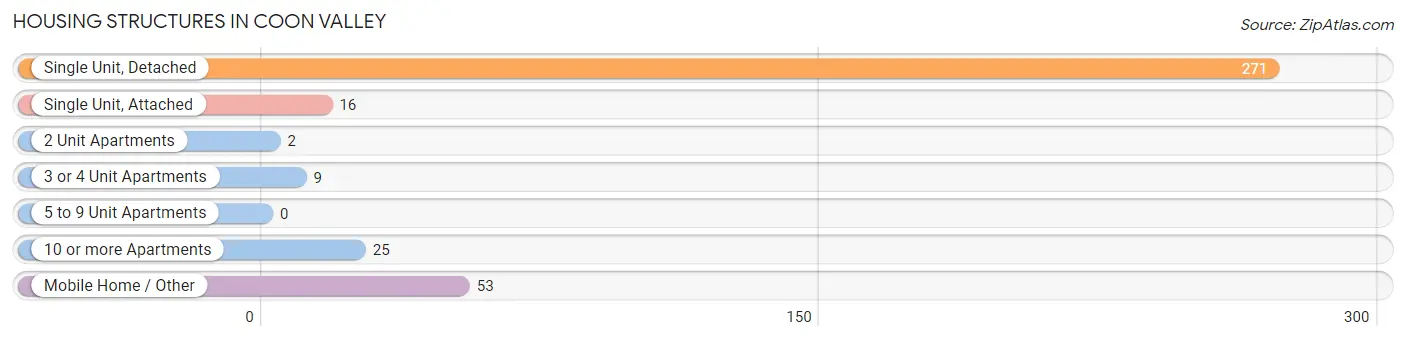
| Structure Type | # Housing Units | % Housing Units |
| Single Unit, Detached | 271 | 72.1% |
| Single Unit, Attached | 16 | 4.3% |
| 2 Unit Apartments | 2 | 0.5% |
| 3 or 4 Unit Apartments | 9 | 2.4% |
| 5 to 9 Unit Apartments | 0 | 0.0% |
| 10 or more Apartments | 25 | 6.7% |
| Mobile Home / Other | 53 | 14.1% |
| Total | 376 | 100.0% |
Housing Structures by Occupancy in Coon Valley
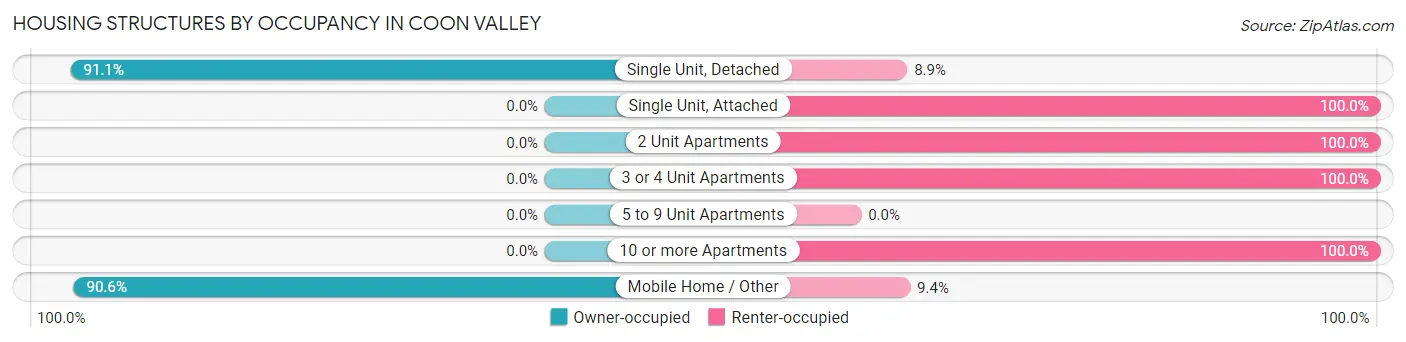
| Structure Type | Owner-occupied | Renter-occupied |
| Single Unit, Detached | 247 (91.1%) | 24 (8.9%) |
| Single Unit, Attached | 0 (0.0%) | 16 (100.0%) |
| 2 Unit Apartments | 0 (0.0%) | 2 (100.0%) |
| 3 or 4 Unit Apartments | 0 (0.0%) | 9 (100.0%) |
| 5 to 9 Unit Apartments | 0 (0.0%) | 0 (0.0%) |
| 10 or more Apartments | 0 (0.0%) | 25 (100.0%) |
| Mobile Home / Other | 48 (90.6%) | 5 (9.4%) |
| Total | 295 (78.5%) | 81 (21.5%) |
Housing Structures by Number of Rooms in Coon Valley
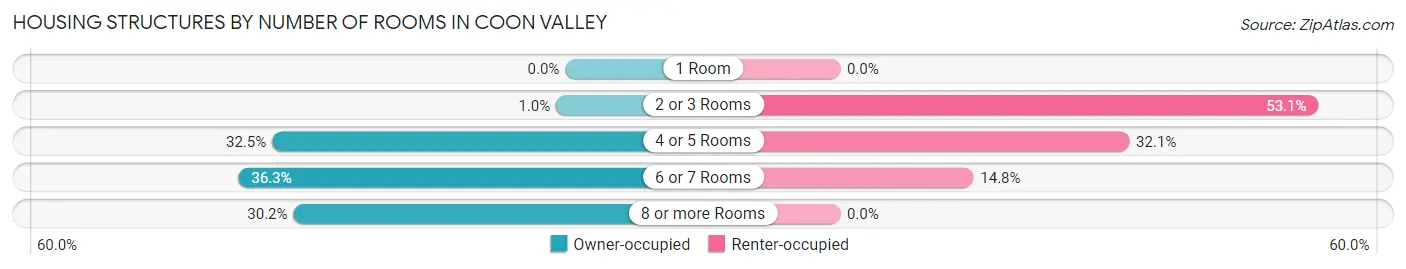
| Number of Rooms | Owner-occupied | Renter-occupied |
| 1 Room | 0 (0.0%) | 0 (0.0%) |
| 2 or 3 Rooms | 3 (1.0%) | 43 (53.1%) |
| 4 or 5 Rooms | 96 (32.5%) | 26 (32.1%) |
| 6 or 7 Rooms | 107 (36.3%) | 12 (14.8%) |
| 8 or more Rooms | 89 (30.2%) | 0 (0.0%) |
| Total | 295 (100.0%) | 81 (100.0%) |
Housing Structure by Heating Type in Coon Valley
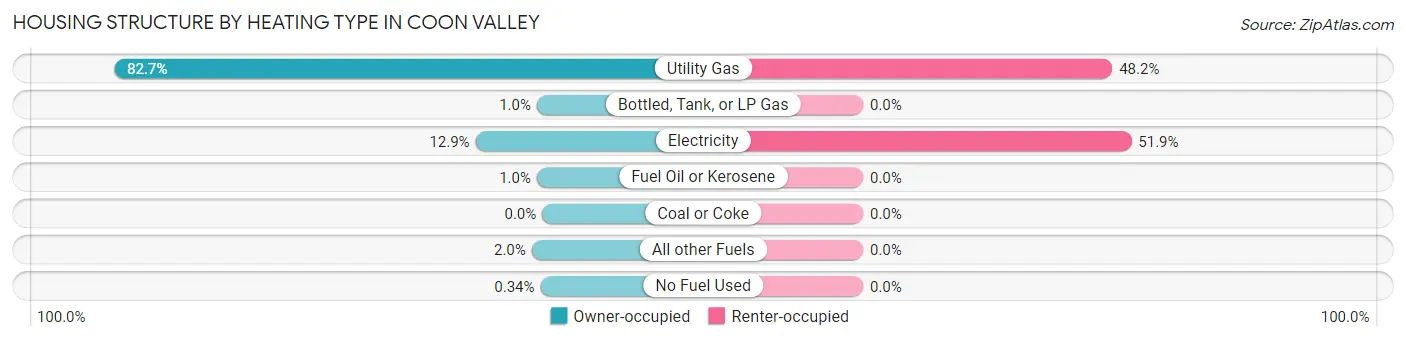
| Heating Type | Owner-occupied | Renter-occupied |
| Utility Gas | 244 (82.7%) | 39 (48.1%) |
| Bottled, Tank, or LP Gas | 3 (1.0%) | 0 (0.0%) |
| Electricity | 38 (12.9%) | 42 (51.8%) |
| Fuel Oil or Kerosene | 3 (1.0%) | 0 (0.0%) |
| Coal or Coke | 0 (0.0%) | 0 (0.0%) |
| All other Fuels | 6 (2.0%) | 0 (0.0%) |
| No Fuel Used | 1 (0.3%) | 0 (0.0%) |
| Total | 295 (100.0%) | 81 (100.0%) |
Household Vehicle Usage in Coon Valley
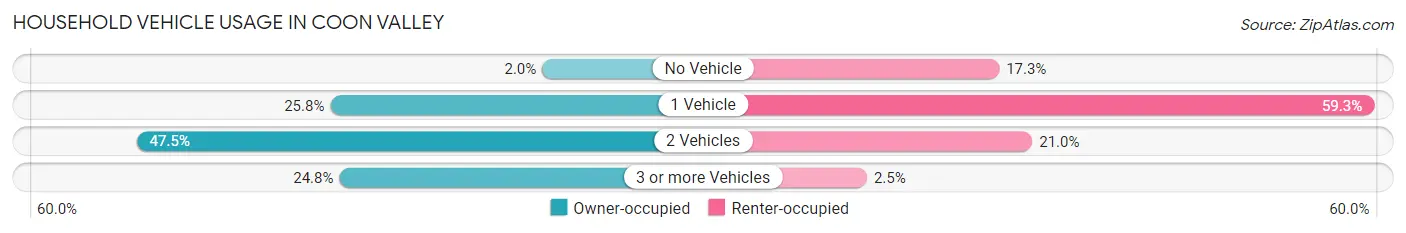
| Vehicles per Household | Owner-occupied | Renter-occupied |
| No Vehicle | 6 (2.0%) | 14 (17.3%) |
| 1 Vehicle | 76 (25.8%) | 48 (59.3%) |
| 2 Vehicles | 140 (47.5%) | 17 (21.0%) |
| 3 or more Vehicles | 73 (24.7%) | 2 (2.5%) |
| Total | 295 (100.0%) | 81 (100.0%) |
Real Estate & Mortgages in Coon Valley
Real Estate and Mortgage Overview in Coon Valley
| Characteristic | Without Mortgage | With Mortgage |
| Housing Units | 135 | 160 |
| Median Property Value | $131,300 | $186,200 |
| Median Household Income | $44,531 | $10 |
| Monthly Housing Costs | $486 | $0 |
| Real Estate Taxes | $2,291 | $0 |
Property Value by Mortgage Status in Coon Valley
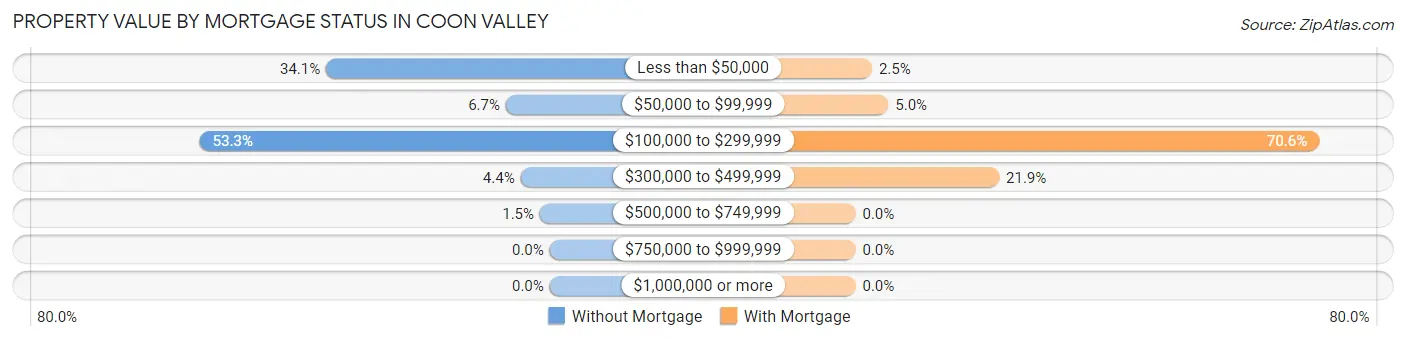
| Property Value | Without Mortgage | With Mortgage |
| Less than $50,000 | 46 (34.1%) | 4 (2.5%) |
| $50,000 to $99,999 | 9 (6.7%) | 8 (5.0%) |
| $100,000 to $299,999 | 72 (53.3%) | 113 (70.6%) |
| $300,000 to $499,999 | 6 (4.4%) | 35 (21.9%) |
| $500,000 to $749,999 | 2 (1.5%) | 0 (0.0%) |
| $750,000 to $999,999 | 0 (0.0%) | 0 (0.0%) |
| $1,000,000 or more | 0 (0.0%) | 0 (0.0%) |
| Total | 135 (100.0%) | 160 (100.0%) |
Household Income by Mortgage Status in Coon Valley
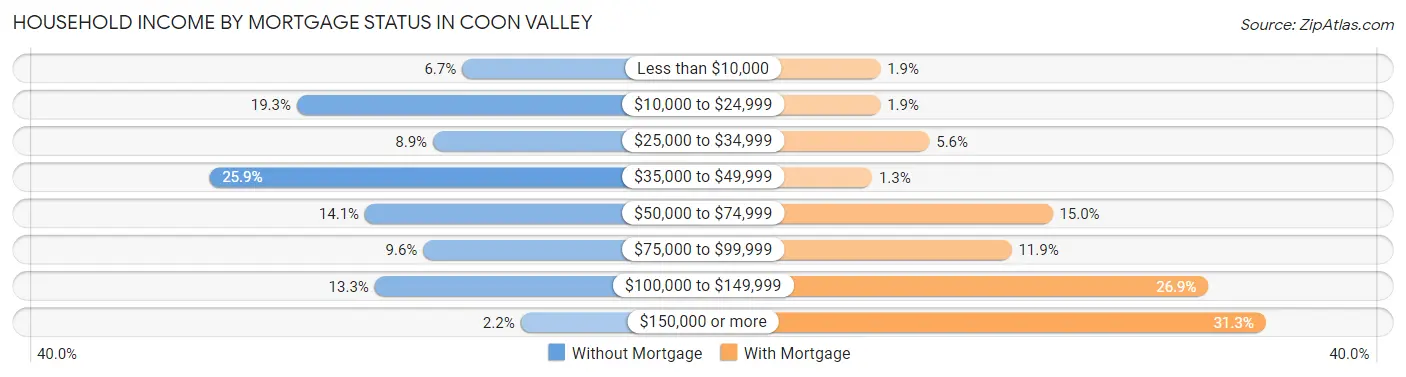
| Household Income | Without Mortgage | With Mortgage |
| Less than $10,000 | 9 (6.7%) | 3 (1.9%) |
| $10,000 to $24,999 | 26 (19.3%) | 3 (1.9%) |
| $25,000 to $34,999 | 12 (8.9%) | 9 (5.6%) |
| $35,000 to $49,999 | 35 (25.9%) | 2 (1.3%) |
| $50,000 to $74,999 | 19 (14.1%) | 24 (15.0%) |
| $75,000 to $99,999 | 13 (9.6%) | 19 (11.9%) |
| $100,000 to $149,999 | 18 (13.3%) | 43 (26.9%) |
| $150,000 or more | 3 (2.2%) | 50 (31.2%) |
| Total | 135 (100.0%) | 160 (100.0%) |
Property Value to Household Income Ratio in Coon Valley
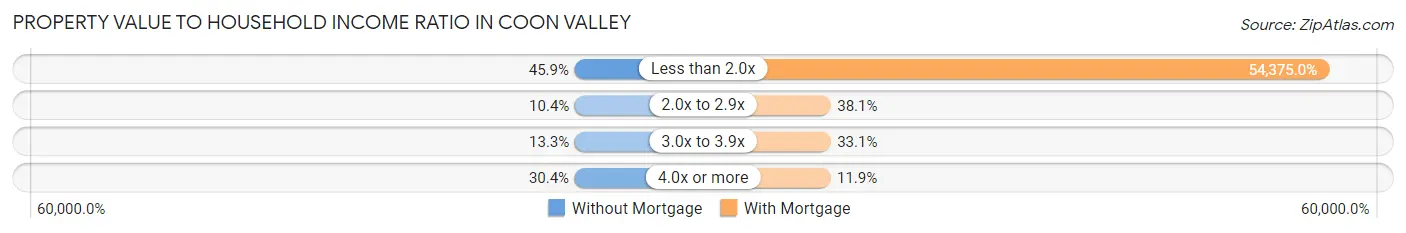
| Value-to-Income Ratio | Without Mortgage | With Mortgage |
| Less than 2.0x | 62 (45.9%) | 87,000 (54,375.0%) |
| 2.0x to 2.9x | 14 (10.4%) | 61 (38.1%) |
| 3.0x to 3.9x | 18 (13.3%) | 53 (33.1%) |
| 4.0x or more | 41 (30.4%) | 19 (11.9%) |
| Total | 135 (100.0%) | 160 (100.0%) |
Real Estate Taxes by Mortgage Status in Coon Valley
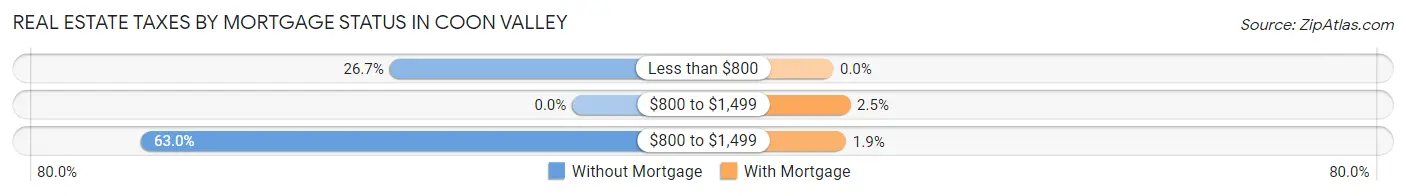
| Property Taxes | Without Mortgage | With Mortgage |
| Less than $800 | 36 (26.7%) | 0 (0.0%) |
| $800 to $1,499 | 0 (0.0%) | 4 (2.5%) |
| $800 to $1,499 | 85 (63.0%) | 3 (1.9%) |
| Total | 135 (100.0%) | 160 (100.0%) |
Health & Disability in Coon Valley
Health Insurance Coverage by Age in Coon Valley
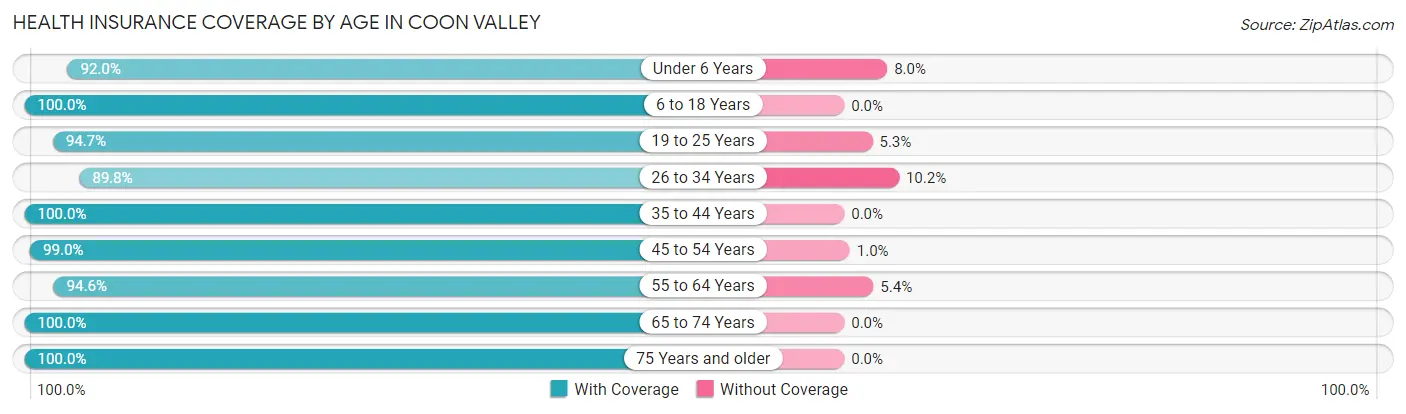
| Age Bracket | With Coverage | Without Coverage |
| Under 6 Years | 69 (92.0%) | 6 (8.0%) |
| 6 to 18 Years | 108 (100.0%) | 0 (0.0%) |
| 19 to 25 Years | 108 (94.7%) | 6 (5.3%) |
| 26 to 34 Years | 88 (89.8%) | 10 (10.2%) |
| 35 to 44 Years | 90 (100.0%) | 0 (0.0%) |
| 45 to 54 Years | 95 (99.0%) | 1 (1.0%) |
| 55 to 64 Years | 122 (94.6%) | 7 (5.4%) |
| 65 to 74 Years | 91 (100.0%) | 0 (0.0%) |
| 75 Years and older | 113 (100.0%) | 0 (0.0%) |
| Total | 884 (96.7%) | 30 (3.3%) |
Health Insurance Coverage by Citizenship Status in Coon Valley
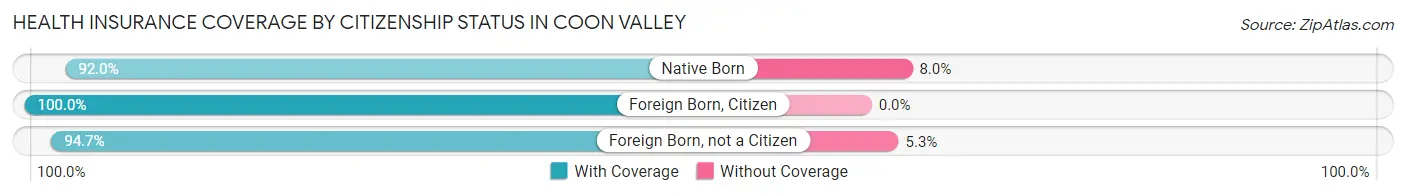
| Citizenship Status | With Coverage | Without Coverage |
| Native Born | 69 (92.0%) | 6 (8.0%) |
| Foreign Born, Citizen | 108 (100.0%) | 0 (0.0%) |
| Foreign Born, not a Citizen | 108 (94.7%) | 6 (5.3%) |
Health Insurance Coverage by Household Income in Coon Valley
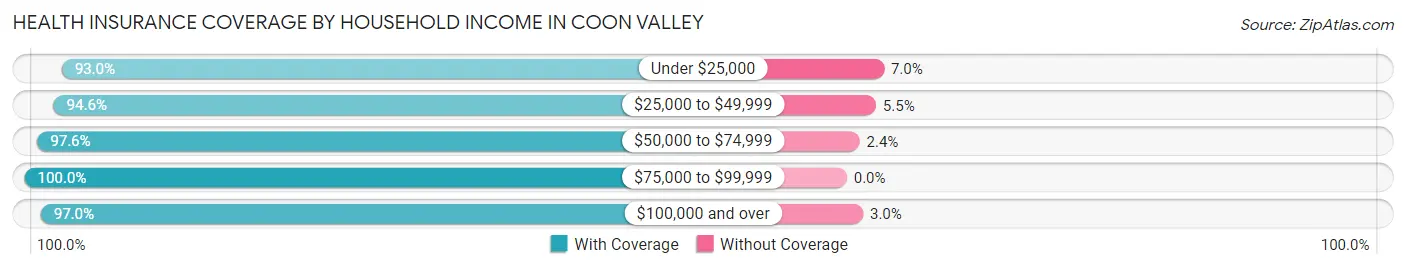
| Household Income | With Coverage | Without Coverage |
| Under $25,000 | 107 (93.0%) | 8 (7.0%) |
| $25,000 to $49,999 | 191 (94.6%) | 11 (5.4%) |
| $50,000 to $74,999 | 122 (97.6%) | 3 (2.4%) |
| $75,000 to $99,999 | 191 (100.0%) | 0 (0.0%) |
| $100,000 and over | 255 (97.0%) | 8 (3.0%) |
Public vs Private Health Insurance Coverage by Age in Coon Valley
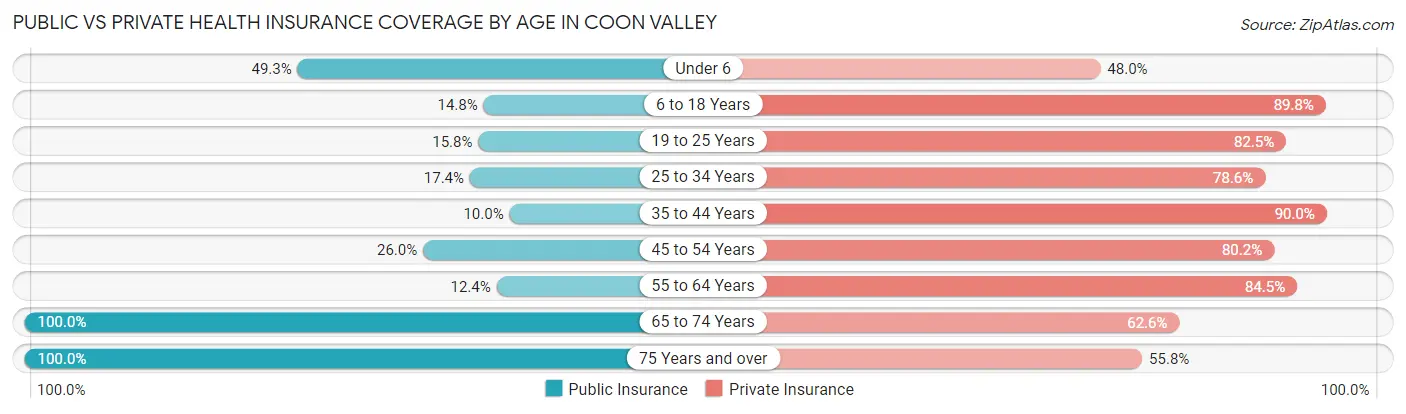
| Age Bracket | Public Insurance | Private Insurance |
| Under 6 | 37 (49.3%) | 36 (48.0%) |
| 6 to 18 Years | 16 (14.8%) | 97 (89.8%) |
| 19 to 25 Years | 18 (15.8%) | 94 (82.5%) |
| 25 to 34 Years | 17 (17.3%) | 77 (78.6%) |
| 35 to 44 Years | 9 (10.0%) | 81 (90.0%) |
| 45 to 54 Years | 25 (26.0%) | 77 (80.2%) |
| 55 to 64 Years | 16 (12.4%) | 109 (84.5%) |
| 65 to 74 Years | 91 (100.0%) | 57 (62.6%) |
| 75 Years and over | 113 (100.0%) | 63 (55.7%) |
| Total | 342 (37.4%) | 691 (75.6%) |
Disability Status by Sex by Age in Coon Valley
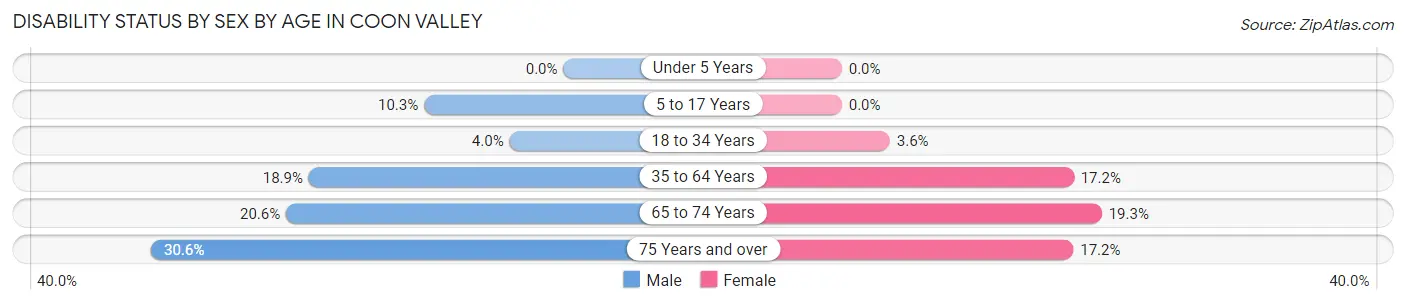
| Age Bracket | Male | Female |
| Under 5 Years | 0 (0.0%) | 0 (0.0%) |
| 5 to 17 Years | 6 (10.3%) | 0 (0.0%) |
| 18 to 34 Years | 3 (4.0%) | 5 (3.6%) |
| 35 to 64 Years | 31 (18.9%) | 26 (17.2%) |
| 65 to 74 Years | 7 (20.6%) | 11 (19.3%) |
| 75 Years and over | 15 (30.6%) | 11 (17.2%) |
Disability Class by Sex by Age in Coon Valley
Disability Class: Hearing Difficulty
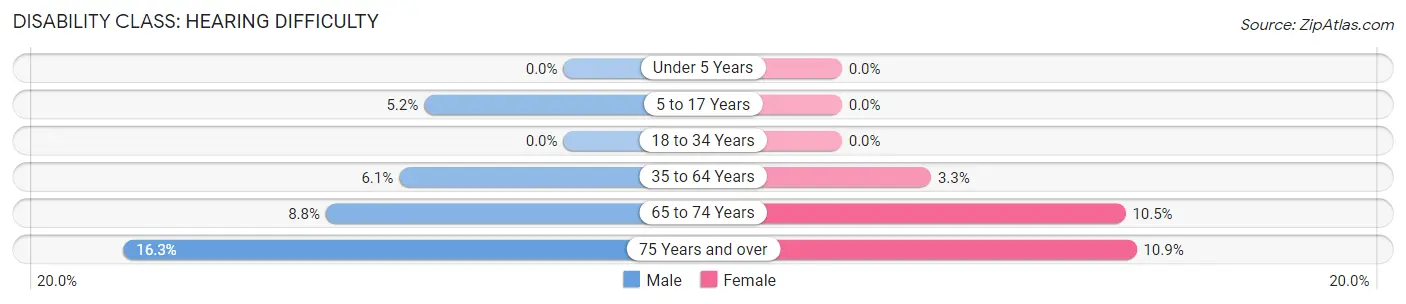
| Age Bracket | Male | Female |
| Under 5 Years | 0 (0.0%) | 0 (0.0%) |
| 5 to 17 Years | 3 (5.2%) | 0 (0.0%) |
| 18 to 34 Years | 0 (0.0%) | 0 (0.0%) |
| 35 to 64 Years | 10 (6.1%) | 5 (3.3%) |
| 65 to 74 Years | 3 (8.8%) | 6 (10.5%) |
| 75 Years and over | 8 (16.3%) | 7 (10.9%) |
Disability Class: Vision Difficulty
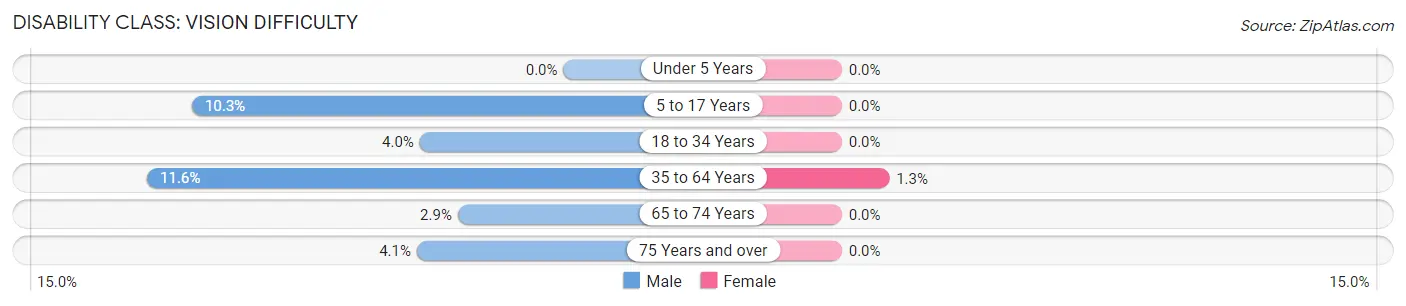
| Age Bracket | Male | Female |
| Under 5 Years | 0 (0.0%) | 0 (0.0%) |
| 5 to 17 Years | 6 (10.3%) | 0 (0.0%) |
| 18 to 34 Years | 3 (4.0%) | 0 (0.0%) |
| 35 to 64 Years | 19 (11.6%) | 2 (1.3%) |
| 65 to 74 Years | 1 (2.9%) | 0 (0.0%) |
| 75 Years and over | 2 (4.1%) | 0 (0.0%) |
Disability Class: Cognitive Difficulty
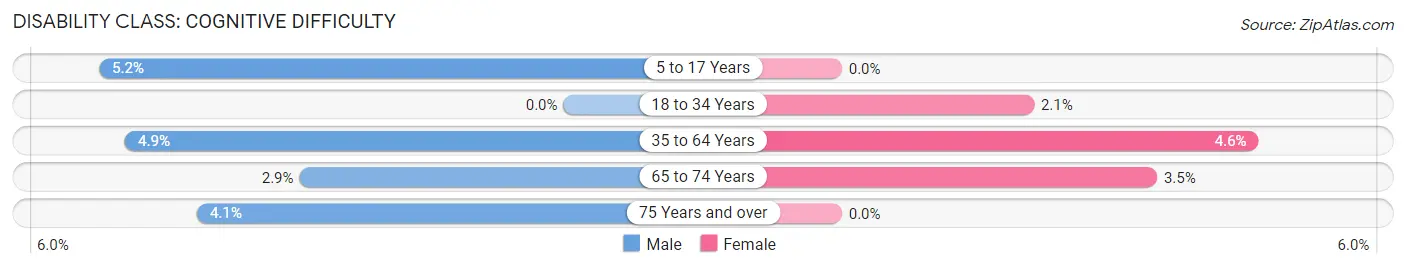
| Age Bracket | Male | Female |
| 5 to 17 Years | 3 (5.2%) | 0 (0.0%) |
| 18 to 34 Years | 0 (0.0%) | 3 (2.1%) |
| 35 to 64 Years | 8 (4.9%) | 7 (4.6%) |
| 65 to 74 Years | 1 (2.9%) | 2 (3.5%) |
| 75 Years and over | 2 (4.1%) | 0 (0.0%) |
Disability Class: Ambulatory Difficulty
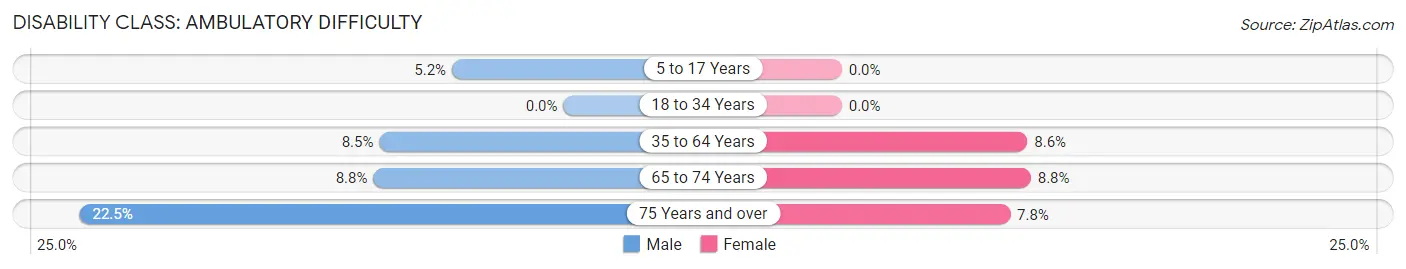
| Age Bracket | Male | Female |
| 5 to 17 Years | 3 (5.2%) | 0 (0.0%) |
| 18 to 34 Years | 0 (0.0%) | 0 (0.0%) |
| 35 to 64 Years | 14 (8.5%) | 13 (8.6%) |
| 65 to 74 Years | 3 (8.8%) | 5 (8.8%) |
| 75 Years and over | 11 (22.5%) | 5 (7.8%) |
Disability Class: Self-Care Difficulty
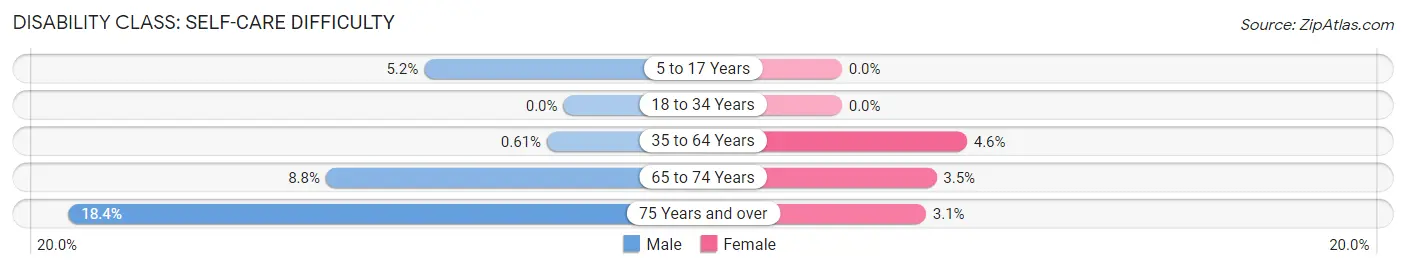
| Age Bracket | Male | Female |
| 5 to 17 Years | 3 (5.2%) | 0 (0.0%) |
| 18 to 34 Years | 0 (0.0%) | 0 (0.0%) |
| 35 to 64 Years | 1 (0.6%) | 7 (4.6%) |
| 65 to 74 Years | 3 (8.8%) | 2 (3.5%) |
| 75 Years and over | 9 (18.4%) | 2 (3.1%) |
Technology Access in Coon Valley
Computing Device Access in Coon Valley
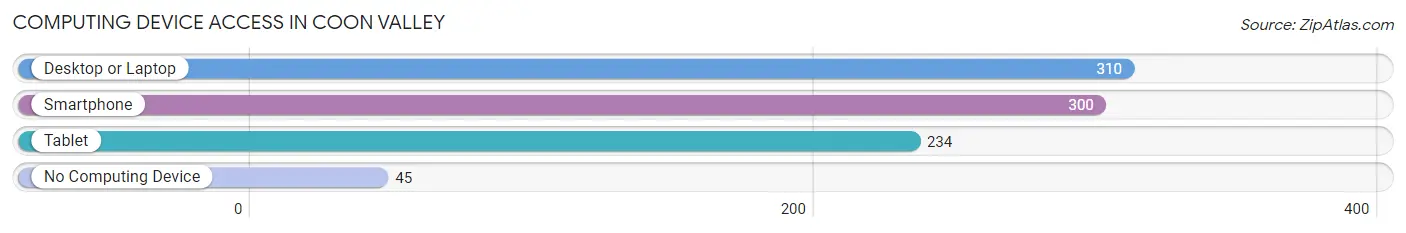
| Device Type | # Households | % Households |
| Desktop or Laptop | 310 | 82.5% |
| Smartphone | 300 | 79.8% |
| Tablet | 234 | 62.2% |
| No Computing Device | 45 | 12.0% |
| Total | 376 | 100.0% |
Internet Access in Coon Valley
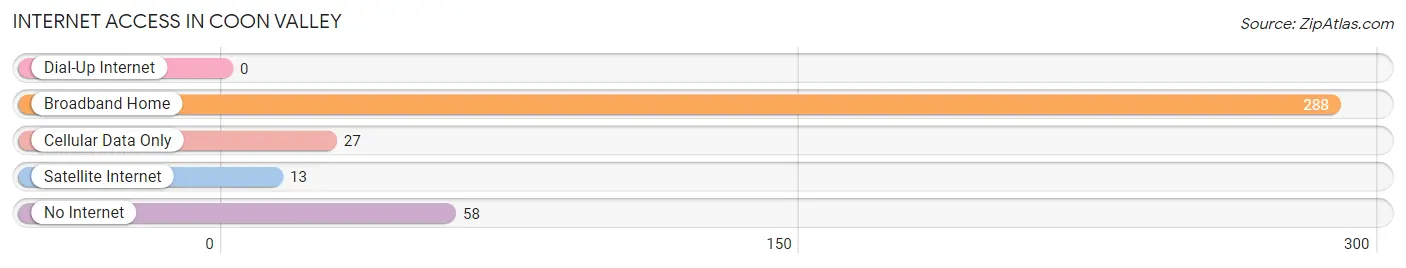
| Internet Type | # Households | % Households |
| Dial-Up Internet | 0 | 0.0% |
| Broadband Home | 288 | 76.6% |
| Cellular Data Only | 27 | 7.2% |
| Satellite Internet | 13 | 3.5% |
| No Internet | 58 | 15.4% |
| Total | 376 | 100.0% |
Coon Valley Summary
Coon Valley is a small village located in the southwestern corner of Wisconsin, in the heart of the Driftless Area. The village is situated in the La Crosse County, and is part of the La Crosse-Onalaska Metropolitan Statistical Area. The village has a population of 1,092 people, according to the 2010 census.
History
Coon Valley was first settled in 1851 by a group of Norwegian immigrants. The village was named after the Coon Creek, which runs through the area. The creek was named after the raccoon, which were abundant in the area at the time. The first settlers built a sawmill and a gristmill, which were the first industries in the area. The village was officially incorporated in 1872.
In the late 19th century, the village was a major center for the production of cheese. The cheese industry was so successful that the village was known as the “Cheese Capital of Wisconsin”. The cheese industry declined in the early 20th century, and the village shifted its focus to agriculture.
Geography
Coon Valley is located in the southwestern corner of Wisconsin, in the heart of the Driftless Area. The village is situated in the La Crosse County, and is part of the La Crosse-Onalaska Metropolitan Statistical Area. The village is located at the intersection of State Highway 33 and County Highway V.
The village is surrounded by rolling hills and valleys, and is located in a region of Wisconsin known for its scenic beauty. The village is located near the Mississippi River, and is within a few miles of the Wisconsin-Minnesota border.
Economy
The economy of Coon Valley is largely based on agriculture. The village is home to several dairy farms, as well as a number of small businesses. The village is also home to a number of tourist attractions, including the Coon Valley Cheese Factory, the Coon Valley Historical Society, and the Coon Valley Nature Center.
Demographics
According to the 2010 census, the population of Coon Valley was 1,092 people. The village has a median household income of $45,000, and a median home value of $150,000. The village is predominantly white, with 95.3% of the population identifying as white. The village also has a small Hispanic population, with 2.2% of the population identifying as Hispanic or Latino. The village has a low unemployment rate, with only 3.2% of the population unemployed.
Common Questions
What is Per Capita Income in Coon Valley?
Per Capita income in Coon Valley is $31,630.
What is the Median Family Income in Coon Valley?
Median Family Income in Coon Valley is $82,500.
What is the Median Household income in Coon Valley?
Median Household Income in Coon Valley is $53,958.
What is Income or Wage Gap in Coon Valley?
Income or Wage Gap in Coon Valley is 38.2%.
Women in Coon Valley earn 61.8 cents for every dollar earned by a man.
What is Family Income Deficit in Coon Valley?
Family Income Deficit in Coon Valley is $6,623.
Families that are below poverty line in Coon Valley earn $6,623 less on average than the poverty threshold level.
What is Inequality or Gini Index in Coon Valley?
Inequality or Gini Index in Coon Valley is 0.47.
What is the Total Population of Coon Valley?
Total Population of Coon Valley is 914.
What is the Total Male Population of Coon Valley?
Total Male Population of Coon Valley is 414.
What is the Total Female Population of Coon Valley?
Total Female Population of Coon Valley is 500.
What is the Ratio of Males per 100 Females in Coon Valley?
There are 82.80 Males per 100 Females in Coon Valley.
What is the Ratio of Females per 100 Males in Coon Valley?
There are 120.77 Females per 100 Males in Coon Valley.
What is the Median Population Age in Coon Valley?
Median Population Age in Coon Valley is 39.6 Years.
What is the Average Family Size in Coon Valley
Average Family Size in Coon Valley is 3.0 People.
What is the Average Household Size in Coon Valley
Average Household Size in Coon Valley is 2.4 People.
How Large is the Labor Force in Coon Valley?
There are 514 People in the Labor Forcein in Coon Valley.
What is the Percentage of People in the Labor Force in Coon Valley?
67.5% of People are in the Labor Force in Coon Valley.
What is the Unemployment Rate in Coon Valley?
Unemployment Rate in Coon Valley is 3.1%.