Columbus, WI Map & Demographics
Columbus Map
Columbus Overview
$39,917
PER CAPITA INCOME
$94,282
AVG FAMILY INCOME
$65,727
AVG HOUSEHOLD INCOME
35.9%
WAGE / INCOME GAP [ % ]
64.1¢/ $1
WAGE / INCOME GAP [ $ ]
0.38
INEQUALITY / GINI INDEX
5,481
TOTAL POPULATION
2,530
MALE POPULATION
2,951
FEMALE POPULATION
85.73
MALES / 100 FEMALES
116.64
FEMALES / 100 MALES
38.3
MEDIAN AGE
2.8
AVG FAMILY SIZE
2.2
AVG HOUSEHOLD SIZE
3,299
LABOR FORCE [ PEOPLE ]
74.4%
PERCENT IN LABOR FORCE
2.1%
UNEMPLOYMENT RATE
Columbus Zip Codes
Columbus Area Codes
Income in Columbus
Income Overview in Columbus
Per Capita Income in Columbus is $39,917, while median incomes of families and households are $94,282 and $65,727 respectively.
| Characteristic | Number | Measure |
| Per Capita Income | 5,481 | $39,917 |
| Median Family Income | 1,453 | $94,282 |
| Mean Family Income | 1,453 | $106,907 |
| Median Household Income | 2,467 | $65,727 |
| Mean Household Income | 2,467 | $85,616 |
| Income Deficit | 1,453 | $0 |
| Wage / Income Gap (%) | 5,481 | 35.85% |
| Wage / Income Gap ($) | 5,481 | 64.15¢ per $1 |
| Gini / Inequality Index | 5,481 | 0.38 |
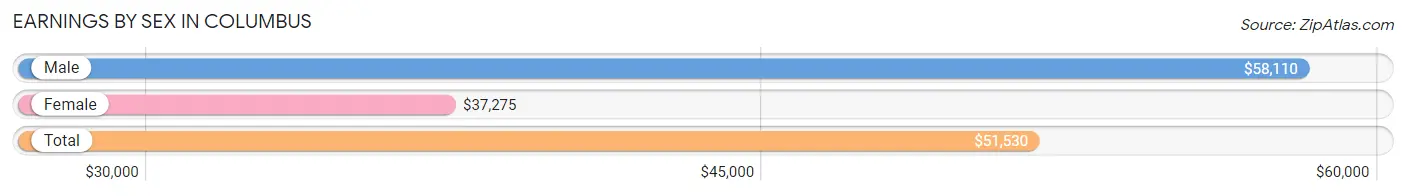
Earnings by Sex in Columbus
Average Earnings in Columbus are $51,530, $58,110 for men and $37,275 for women, a difference of 35.8%.
| Sex | Number | Average Earnings |
| Male | 1,750 (51.3%) | $58,110 |
| Female | 1,658 (48.6%) | $37,275 |
| Total | 3,408 (100.0%) | $51,530 |
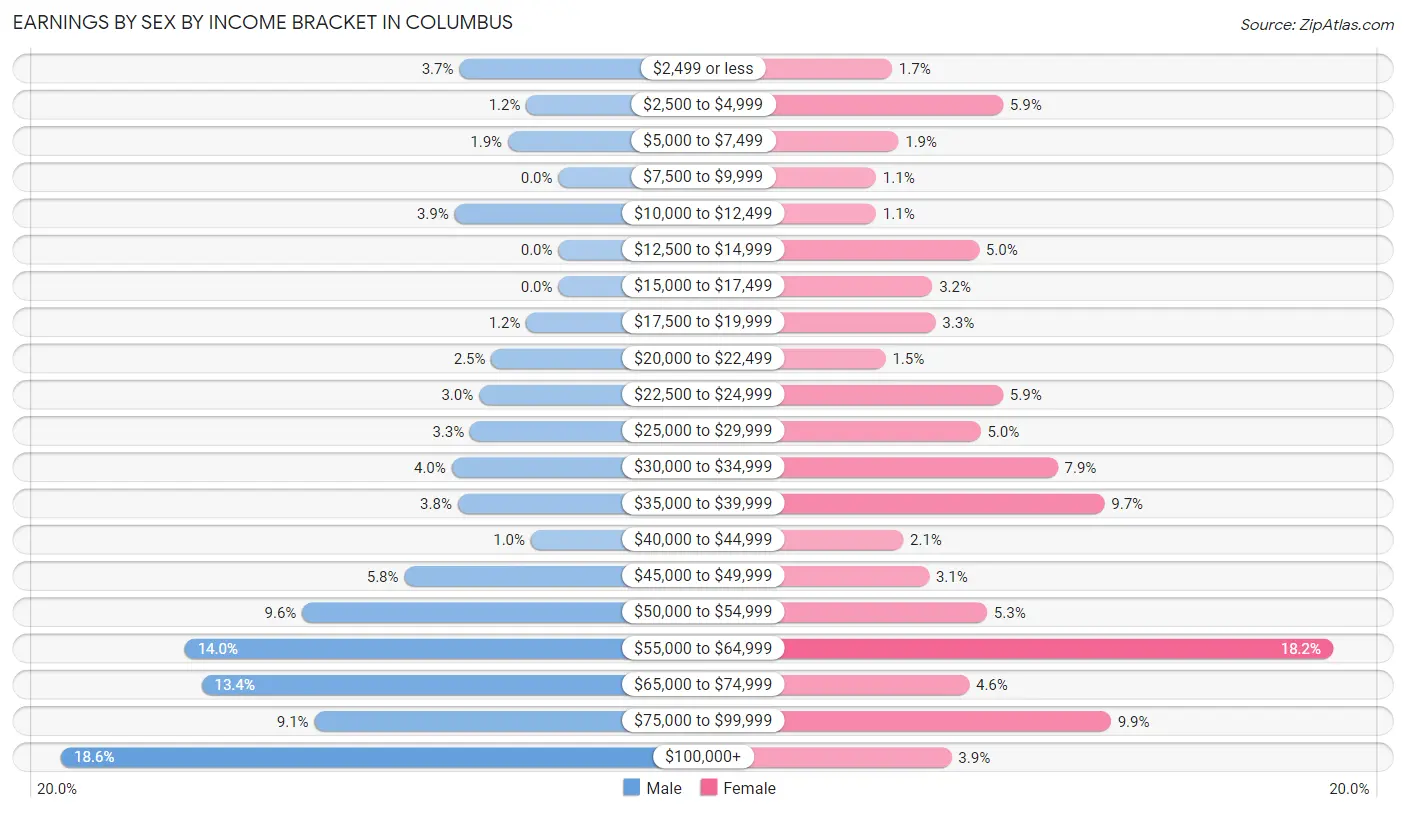
Earnings by Sex by Income Bracket in Columbus
The most common earnings brackets in Columbus are $100,000+ for men (326 | 18.6%) and $55,000 to $64,999 for women (302 | 18.2%).
| Income | Male | Female |
| $2,499 or less | 65 (3.7%) | 28 (1.7%) |
| $2,500 to $4,999 | 21 (1.2%) | 97 (5.9%) |
| $5,000 to $7,499 | 33 (1.9%) | 32 (1.9%) |
| $7,500 to $9,999 | 0 (0.0%) | 18 (1.1%) |
| $10,000 to $12,499 | 68 (3.9%) | 18 (1.1%) |
| $12,500 to $14,999 | 0 (0.0%) | 82 (5.0%) |
| $15,000 to $17,499 | 0 (0.0%) | 53 (3.2%) |
| $17,500 to $19,999 | 21 (1.2%) | 55 (3.3%) |
| $20,000 to $22,499 | 44 (2.5%) | 24 (1.5%) |
| $22,500 to $24,999 | 52 (3.0%) | 97 (5.9%) |
| $25,000 to $29,999 | 58 (3.3%) | 83 (5.0%) |
| $30,000 to $34,999 | 70 (4.0%) | 131 (7.9%) |
| $35,000 to $39,999 | 66 (3.8%) | 160 (9.7%) |
| $40,000 to $44,999 | 18 (1.0%) | 35 (2.1%) |
| $45,000 to $49,999 | 101 (5.8%) | 51 (3.1%) |
| $50,000 to $54,999 | 168 (9.6%) | 87 (5.2%) |
| $55,000 to $64,999 | 245 (14.0%) | 302 (18.2%) |
| $65,000 to $74,999 | 234 (13.4%) | 76 (4.6%) |
| $75,000 to $99,999 | 160 (9.1%) | 164 (9.9%) |
| $100,000+ | 326 (18.6%) | 65 (3.9%) |
| Total | 1,750 (100.0%) | 1,658 (100.0%) |
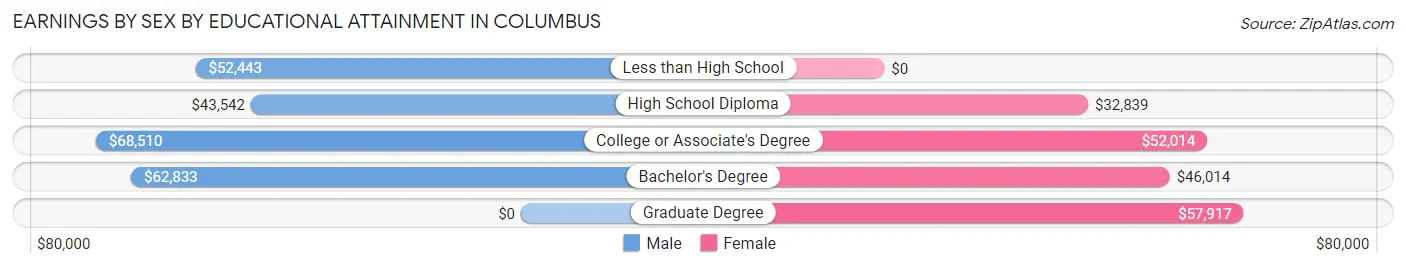
Earnings by Sex by Educational Attainment in Columbus
Average earnings in Columbus are $59,288 for men and $39,441 for women, a difference of 33.5%. Men with an educational attainment of college or associate's degree enjoy the highest average annual earnings of $68,510, while those with high school diploma education earn the least with $43,542. Women with an educational attainment of graduate degree earn the most with the average annual earnings of $57,917, while those with high school diploma education have the smallest earnings of $32,839.
| Educational Attainment | Male Income | Female Income |
| Less than High School | $52,443 | $0 |
| High School Diploma | $43,542 | $32,839 |
| College or Associate's Degree | $68,510 | $52,014 |
| Bachelor's Degree | $62,833 | $46,014 |
| Graduate Degree | - | - |
| Total | $59,288 | $39,441 |
Family Income in Columbus
Family Income Brackets in Columbus
According to the Columbus family income data, there are 432 families falling into the $100,000 to $149,999 income range, which is the most common income bracket and makes up 29.7% of all families.
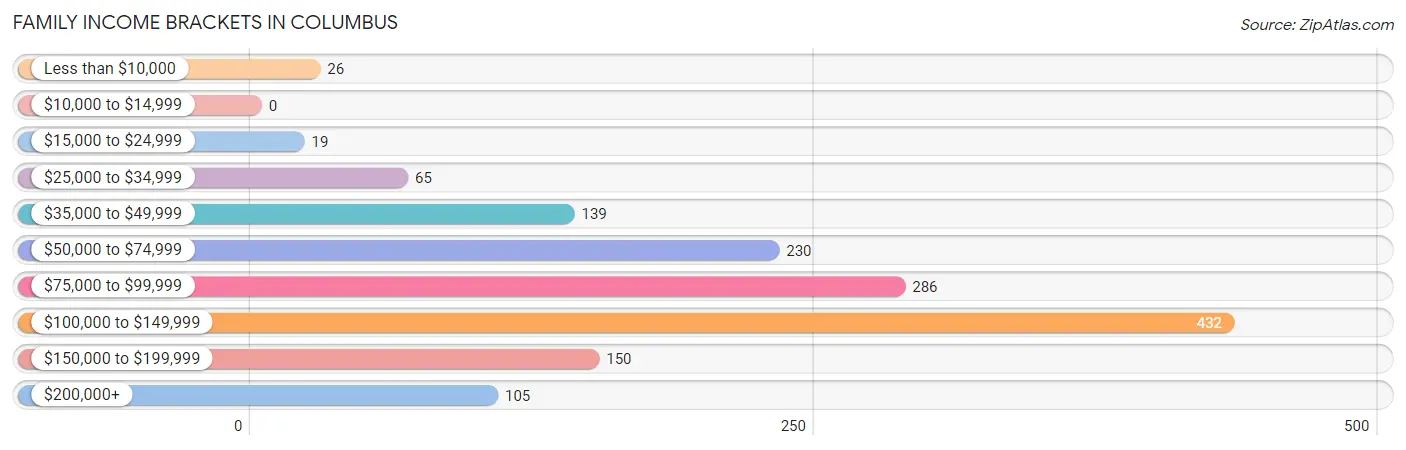
| Income Bracket | # Families | % Families |
| Less than $10,000 | 26 | 1.8% |
| $10,000 to $14,999 | 0 | 0.0% |
| $15,000 to $24,999 | 19 | 1.3% |
| $25,000 to $34,999 | 65 | 4.5% |
| $35,000 to $49,999 | 139 | 9.6% |
| $50,000 to $74,999 | 230 | 15.8% |
| $75,000 to $99,999 | 286 | 19.7% |
| $100,000 to $149,999 | 432 | 29.7% |
| $150,000 to $199,999 | 150 | 10.3% |
| $200,000+ | 105 | 7.2% |
Family Income by Famaliy Size in Columbus
4-person families (173 | 11.9%) account for the highest median family income in Columbus with $109,125 per family, while 2-person families (783 | 53.9%) have the highest median income of $45,625 per family member.
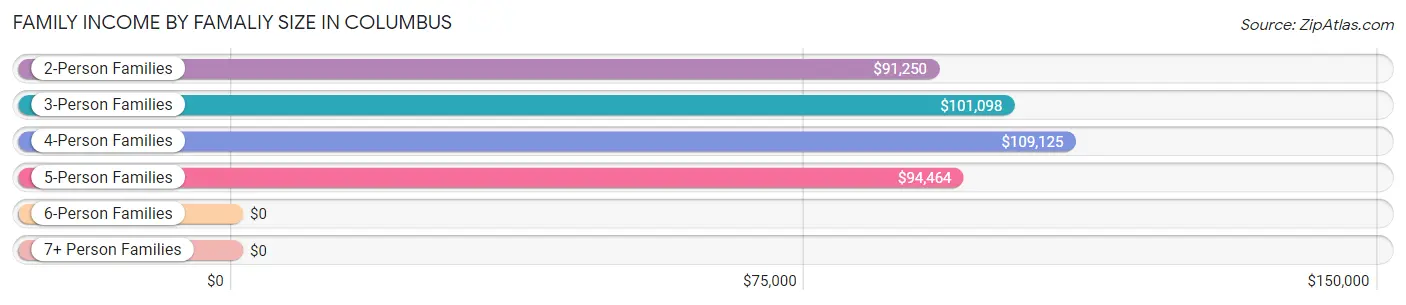
| Income Bracket | # Families | Median Income |
| 2-Person Families | 783 (53.9%) | $91,250 |
| 3-Person Families | 281 (19.3%) | $101,098 |
| 4-Person Families | 173 (11.9%) | $109,125 |
| 5-Person Families | 199 (13.7%) | $94,464 |
| 6-Person Families | 17 (1.2%) | $0 |
| 7+ Person Families | 0 (0.0%) | $0 |
| Total | 1,453 (100.0%) | $94,282 |
Family Income by Number of Earners in Columbus
The median family income in Columbus is $94,282, with families comprising 3+ earners (249) having the highest median family income of $145,677, while families with no earners (91) have the lowest median family income of $48,456, accounting for 17.1% and 6.3% of families, respectively.
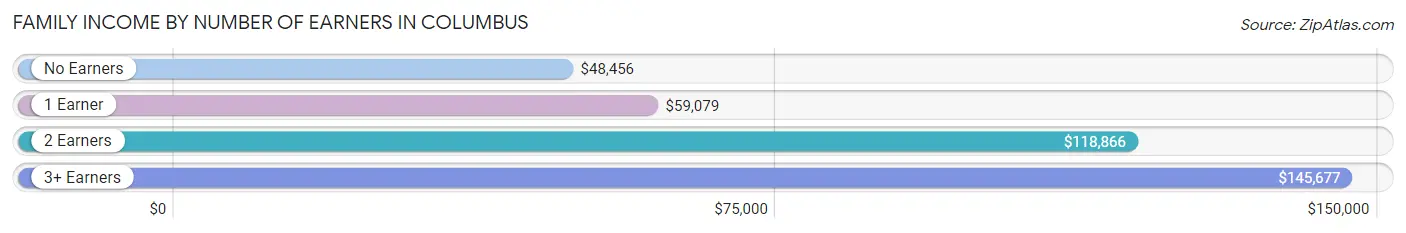
| Number of Earners | # Families | Median Income |
| No Earners | 91 (6.3%) | $48,456 |
| 1 Earner | 412 (28.4%) | $59,079 |
| 2 Earners | 701 (48.2%) | $118,866 |
| 3+ Earners | 249 (17.1%) | $145,677 |
| Total | 1,453 (100.0%) | $94,282 |
Household Income in Columbus
Household Income Brackets in Columbus
With 525 households falling in the category, the $100,000 to $149,999 income range is the most frequent in Columbus, accounting for 21.3% of all households. In contrast, only 37 households (1.5%) fall into the $10,000 to $14,999 income bracket, making it the least populous group.
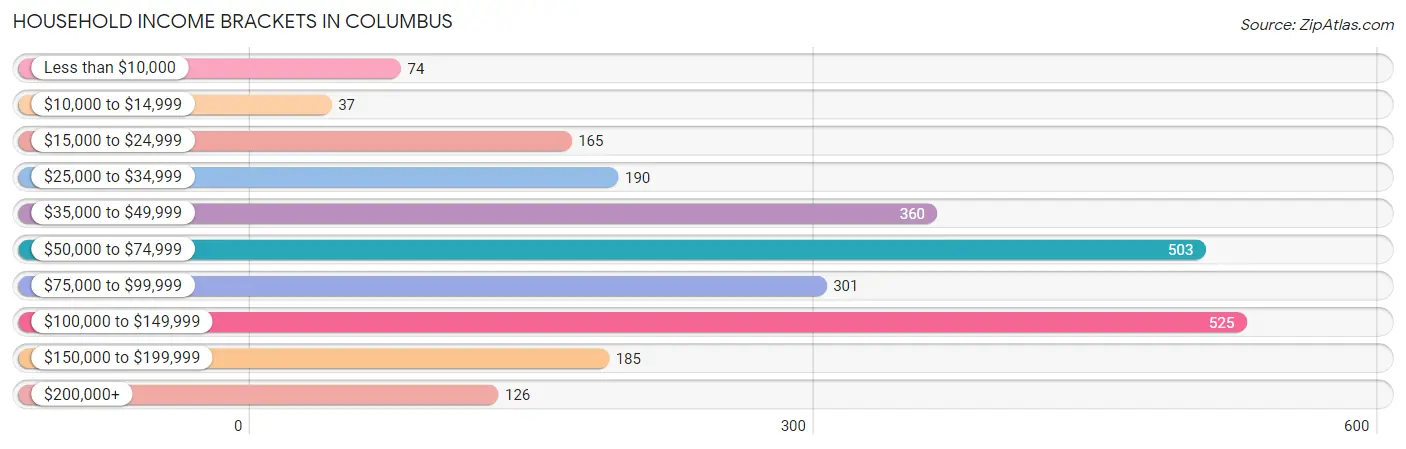
| Income Bracket | # Households | % Households |
| Less than $10,000 | 74 | 3.0% |
| $10,000 to $14,999 | 37 | 1.5% |
| $15,000 to $24,999 | 165 | 6.7% |
| $25,000 to $34,999 | 190 | 7.7% |
| $35,000 to $49,999 | 360 | 14.6% |
| $50,000 to $74,999 | 503 | 20.4% |
| $75,000 to $99,999 | 301 | 12.2% |
| $100,000 to $149,999 | 525 | 21.3% |
| $150,000 to $199,999 | 185 | 7.5% |
| $200,000+ | 126 | 5.1% |
Household Income by Householder Age in Columbus
The median household income in Columbus is $65,727, with the highest median household income of $118,333 found in the 45 to 64 years age bracket for the primary householder. A total of 776 households (31.5%) fall into this category. Meanwhile, the 65+ years age bracket for the primary householder has the lowest median household income of $42,813, with 655 households (26.6%) in this group.
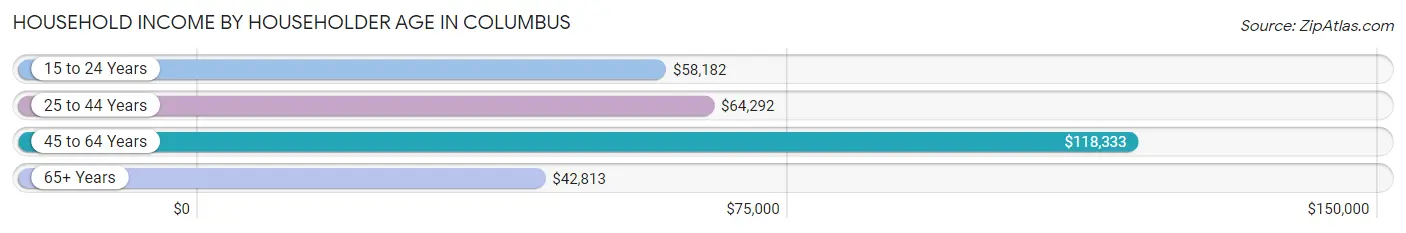
| Income Bracket | # Households | Median Income |
| 15 to 24 Years | 82 (3.3%) | $58,182 |
| 25 to 44 Years | 954 (38.7%) | $64,292 |
| 45 to 64 Years | 776 (31.5%) | $118,333 |
| 65+ Years | 655 (26.6%) | $42,813 |
| Total | 2,467 (100.0%) | $65,727 |
Poverty in Columbus
Income Below Poverty by Sex and Age in Columbus
With 6.6% poverty level for males and 9.7% for females among the residents of Columbus, 18 to 24 year old males and 65 to 74 year old females are the most vulnerable to poverty, with 63 males (67.7%) and 62 females (23.6%) in their respective age groups living below the poverty level.
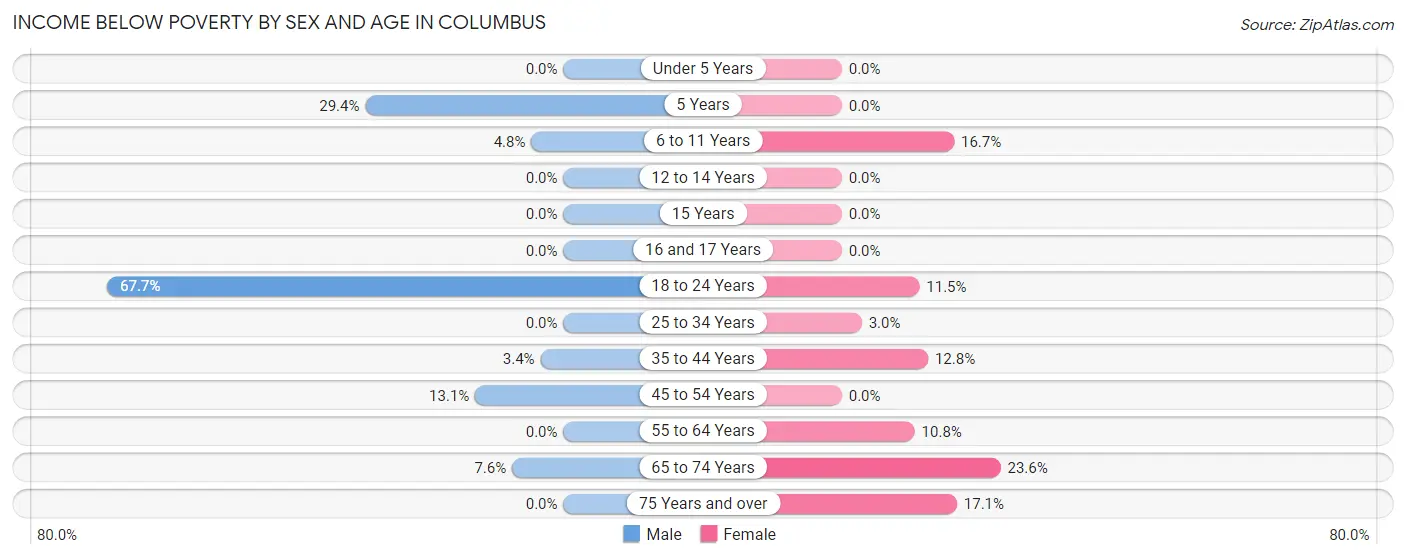
| Age Bracket | Male | Female |
| Under 5 Years | 0 (0.0%) | 0 (0.0%) |
| 5 Years | 20 (29.4%) | 0 (0.0%) |
| 6 to 11 Years | 10 (4.8%) | 48 (16.7%) |
| 12 to 14 Years | 0 (0.0%) | 0 (0.0%) |
| 15 Years | 0 (0.0%) | 0 (0.0%) |
| 16 and 17 Years | 0 (0.0%) | 0 (0.0%) |
| 18 to 24 Years | 63 (67.7%) | 31 (11.5%) |
| 25 to 34 Years | 0 (0.0%) | 16 (3.0%) |
| 35 to 44 Years | 12 (3.4%) | 37 (12.8%) |
| 45 to 54 Years | 44 (13.1%) | 0 (0.0%) |
| 55 to 64 Years | 0 (0.0%) | 37 (10.8%) |
| 65 to 74 Years | 16 (7.6%) | 62 (23.6%) |
| 75 Years and over | 0 (0.0%) | 54 (17.1%) |
| Total | 165 (6.6%) | 285 (9.7%) |
Income Above Poverty by Sex and Age in Columbus
According to the poverty statistics in Columbus, males aged under 5 years and females aged under 5 years are the age groups that are most secure financially, with 100.0% of males and 100.0% of females in these age groups living above the poverty line.
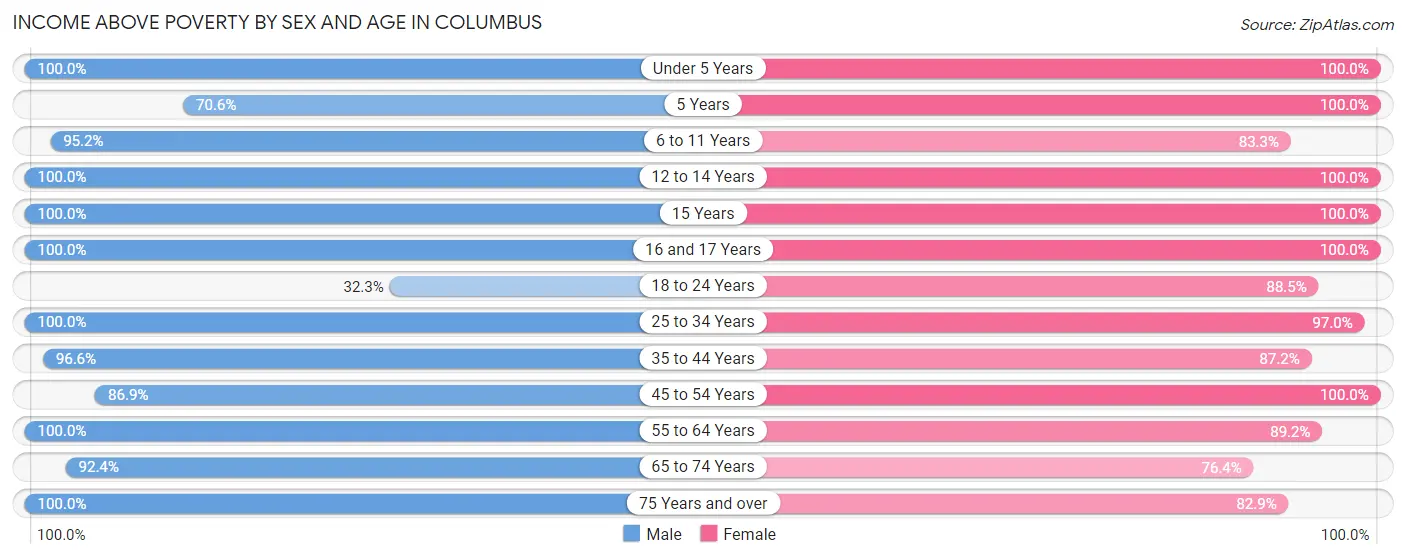
| Age Bracket | Male | Female |
| Under 5 Years | 74 (100.0%) | 158 (100.0%) |
| 5 Years | 48 (70.6%) | 8 (100.0%) |
| 6 to 11 Years | 200 (95.2%) | 240 (83.3%) |
| 12 to 14 Years | 84 (100.0%) | 82 (100.0%) |
| 15 Years | 27 (100.0%) | 30 (100.0%) |
| 16 and 17 Years | 95 (100.0%) | 80 (100.0%) |
| 18 to 24 Years | 30 (32.3%) | 238 (88.5%) |
| 25 to 34 Years | 440 (100.0%) | 524 (97.0%) |
| 35 to 44 Years | 341 (96.6%) | 252 (87.2%) |
| 45 to 54 Years | 292 (86.9%) | 266 (100.0%) |
| 55 to 64 Years | 427 (100.0%) | 305 (89.2%) |
| 65 to 74 Years | 194 (92.4%) | 201 (76.4%) |
| 75 Years and over | 67 (100.0%) | 262 (82.9%) |
| Total | 2,319 (93.4%) | 2,646 (90.3%) |
Income Below Poverty Among Married-Couple Families in Columbus
The poverty statistics for married-couple families in Columbus show that 1.2% or 12 of the total 1,035 families live below the poverty line. Families with 1 or 2 children have the highest poverty rate of 3.8%, comprising of 12 families. On the other hand, families with no children have the lowest poverty rate of 0.0%, which includes 0 families.
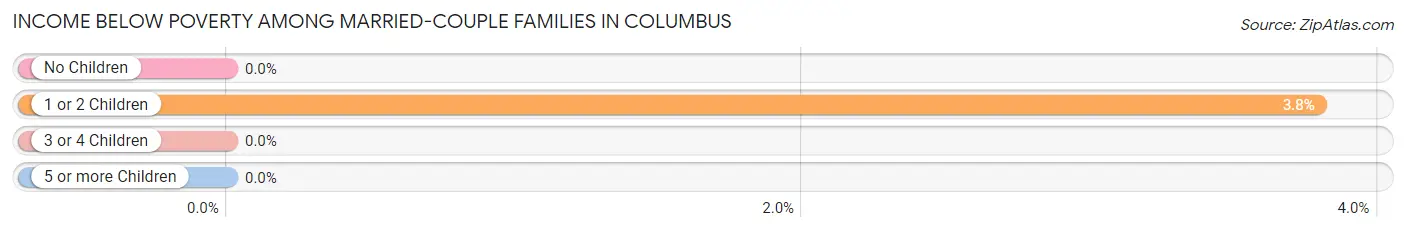
| Children | Above Poverty | Below Poverty |
| No Children | 600 (100.0%) | 0 (0.0%) |
| 1 or 2 Children | 305 (96.2%) | 12 (3.8%) |
| 3 or 4 Children | 118 (100.0%) | 0 (0.0%) |
| 5 or more Children | 0 (0.0%) | 0 (0.0%) |
| Total | 1,023 (98.8%) | 12 (1.2%) |
Income Below Poverty Among Single-Parent Households in Columbus
According to the poverty data in Columbus, 21.3% or 26 single-father households and 13.2% or 39 single-mother households are living below the poverty line. Among single-father households, those with 1 or 2 children have the highest poverty rate, with 26 households (38.2%) experiencing poverty. Likewise, among single-mother households, those with no children have the highest poverty rate, with 19 households (51.3%) falling below the poverty line.
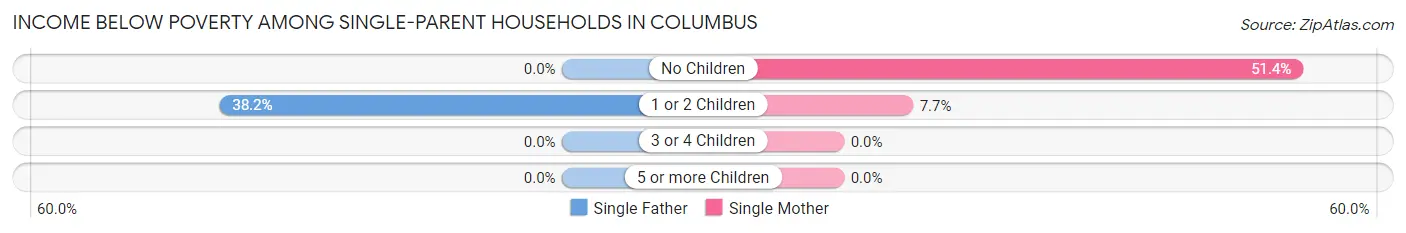
| Children | Single Father | Single Mother |
| No Children | 0 (0.0%) | 19 (51.3%) |
| 1 or 2 Children | 26 (38.2%) | 20 (7.7%) |
| 3 or 4 Children | 0 (0.0%) | 0 (0.0%) |
| 5 or more Children | 0 (0.0%) | 0 (0.0%) |
| Total | 26 (21.3%) | 39 (13.2%) |
Income Below Poverty Among Married-Couple vs Single-Parent Households in Columbus
The poverty data for Columbus shows that 12 of the married-couple family households (1.2%) and 65 of the single-parent households (15.5%) are living below the poverty level. Within the married-couple family households, those with 1 or 2 children have the highest poverty rate, with 12 households (3.8%) falling below the poverty line. Among the single-parent households, those with no children have the highest poverty rate, with 19 household (20.9%) living below poverty.
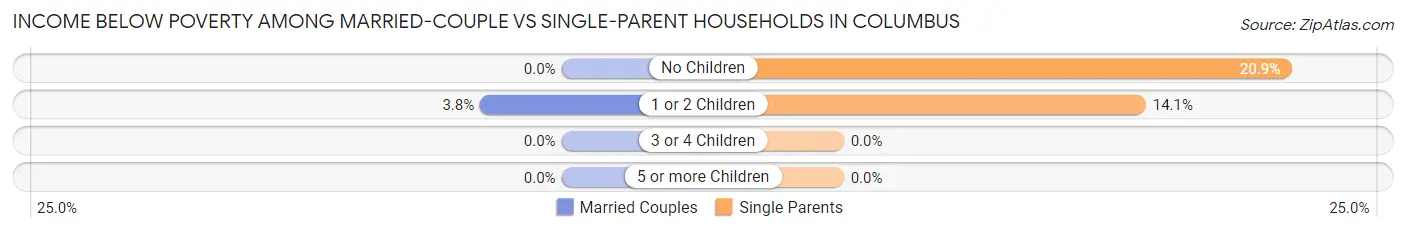
| Children | Married-Couple Families | Single-Parent Households |
| No Children | 0 (0.0%) | 19 (20.9%) |
| 1 or 2 Children | 12 (3.8%) | 46 (14.1%) |
| 3 or 4 Children | 0 (0.0%) | 0 (0.0%) |
| 5 or more Children | 0 (0.0%) | 0 (0.0%) |
| Total | 12 (1.2%) | 65 (15.5%) |
Race in Columbus
The most populous races in Columbus are White / Caucasian (5,082 | 92.7%), Asian (183 | 3.3%), and Black / African American (100 | 1.8%).
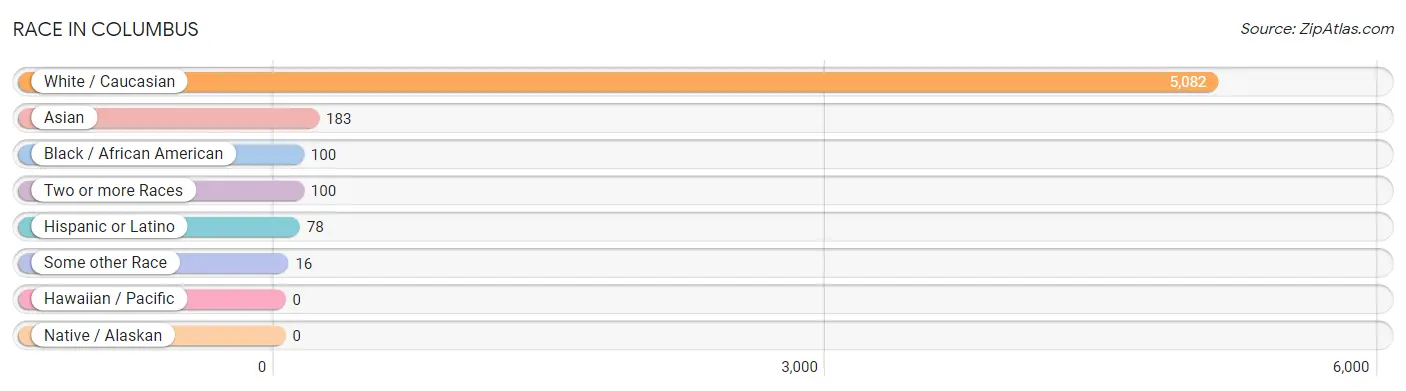
| Race | # Population | % Population |
| Asian | 183 | 3.3% |
| Black / African American | 100 | 1.8% |
| Hawaiian / Pacific | 0 | 0.0% |
| Hispanic or Latino | 78 | 1.4% |
| Native / Alaskan | 0 | 0.0% |
| White / Caucasian | 5,082 | 92.7% |
| Two or more Races | 100 | 1.8% |
| Some other Race | 16 | 0.3% |
| Total | 5,481 | 100.0% |
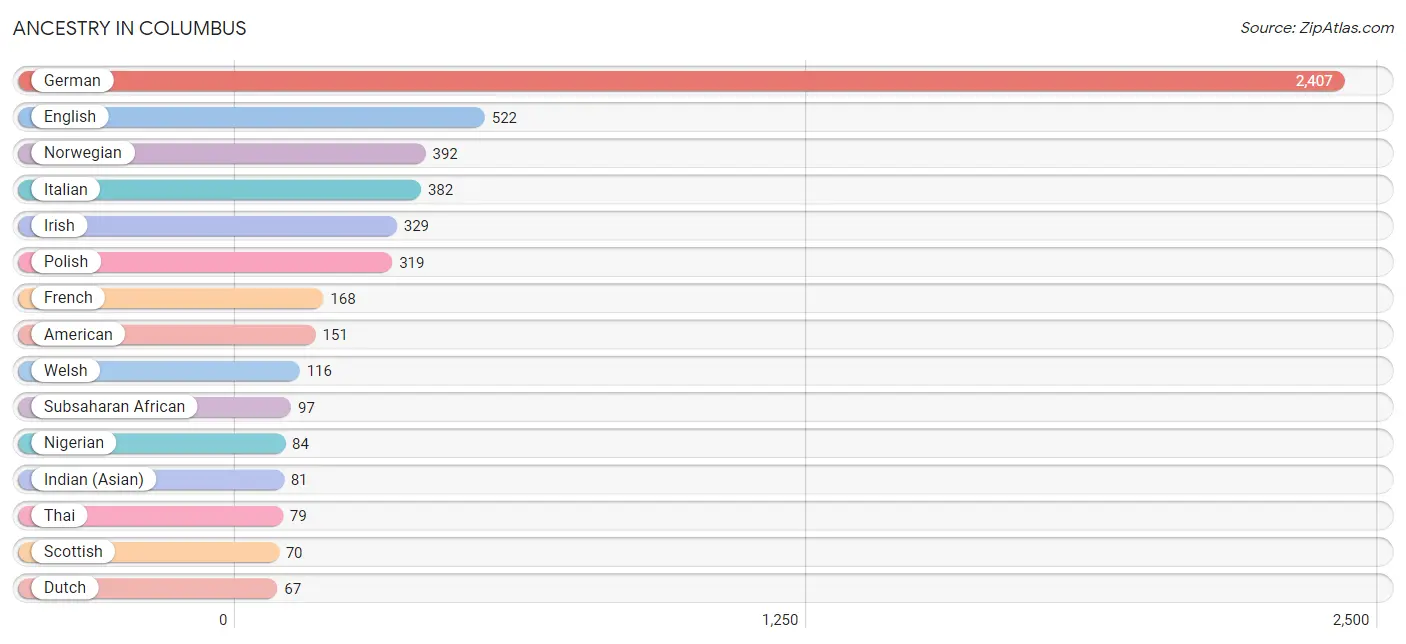
Ancestry in Columbus
The most populous ancestries reported in Columbus are German (2,407 | 43.9%), English (522 | 9.5%), Norwegian (392 | 7.1%), Italian (382 | 7.0%), and Irish (329 | 6.0%), together accounting for 73.6% of all Columbus residents.
| Ancestry | # Population | % Population |
| American | 151 | 2.8% |
| Bangladeshi | 23 | 0.4% |
| Chippewa | 5 | 0.1% |
| Cuban | 13 | 0.2% |
| Czech | 11 | 0.2% |
| Danish | 25 | 0.5% |
| Dutch | 67 | 1.2% |
| Eastern European | 18 | 0.3% |
| English | 522 | 9.5% |
| European | 56 | 1.0% |
| French | 168 | 3.1% |
| French Canadian | 35 | 0.6% |
| German | 2,407 | 43.9% |
| Hungarian | 12 | 0.2% |
| Indian (Asian) | 81 | 1.5% |
| Irish | 329 | 6.0% |
| Italian | 382 | 7.0% |
| Lithuanian | 25 | 0.5% |
| Mexican | 16 | 0.3% |
| Nigerian | 84 | 1.5% |
| Norwegian | 392 | 7.1% |
| Polish | 319 | 5.8% |
| Russian | 44 | 0.8% |
| Scandinavian | 45 | 0.8% |
| Scotch-Irish | 32 | 0.6% |
| Scottish | 70 | 1.3% |
| Sioux | 20 | 0.4% |
| South African | 13 | 0.2% |
| Spanish | 16 | 0.3% |
| Subsaharan African | 97 | 1.8% |
| Swedish | 50 | 0.9% |
| Swiss | 52 | 0.9% |
| Thai | 79 | 1.4% |
| Welsh | 116 | 2.1% | View All 34 Rows |
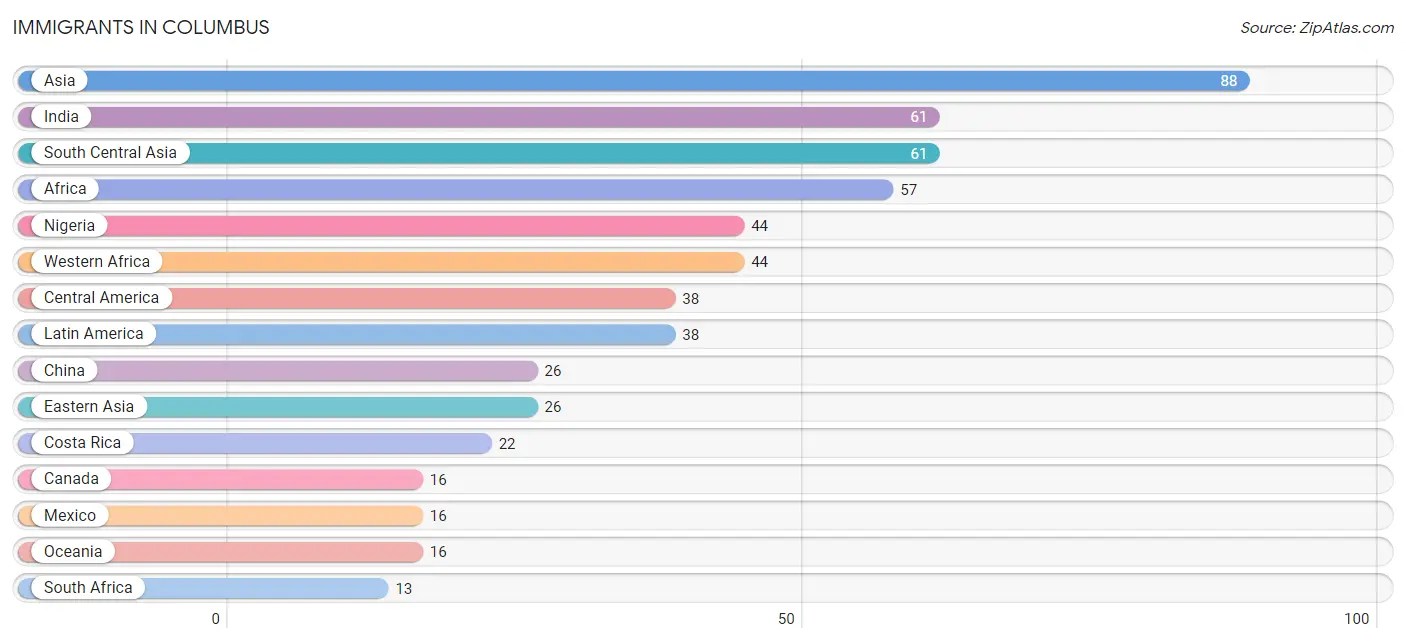
Immigrants in Columbus
The most numerous immigrant groups reported in Columbus came from Asia (88 | 1.6%), India (61 | 1.1%), South Central Asia (61 | 1.1%), Africa (57 | 1.0%), and Nigeria (44 | 0.8%), together accounting for 5.7% of all Columbus residents.
| Immigration Origin | # Population | % Population |
| Africa | 57 | 1.0% |
| Asia | 88 | 1.6% |
| Canada | 16 | 0.3% |
| Central America | 38 | 0.7% |
| China | 26 | 0.5% |
| Costa Rica | 22 | 0.4% |
| Eastern Asia | 26 | 0.5% |
| India | 61 | 1.1% |
| Laos | 1 | 0.0% |
| Latin America | 38 | 0.7% |
| Mexico | 16 | 0.3% |
| Nigeria | 44 | 0.8% |
| Oceania | 16 | 0.3% |
| South Africa | 13 | 0.2% |
| South Central Asia | 61 | 1.1% |
| South Eastern Asia | 1 | 0.0% |
| Western Africa | 44 | 0.8% | View All 17 Rows |
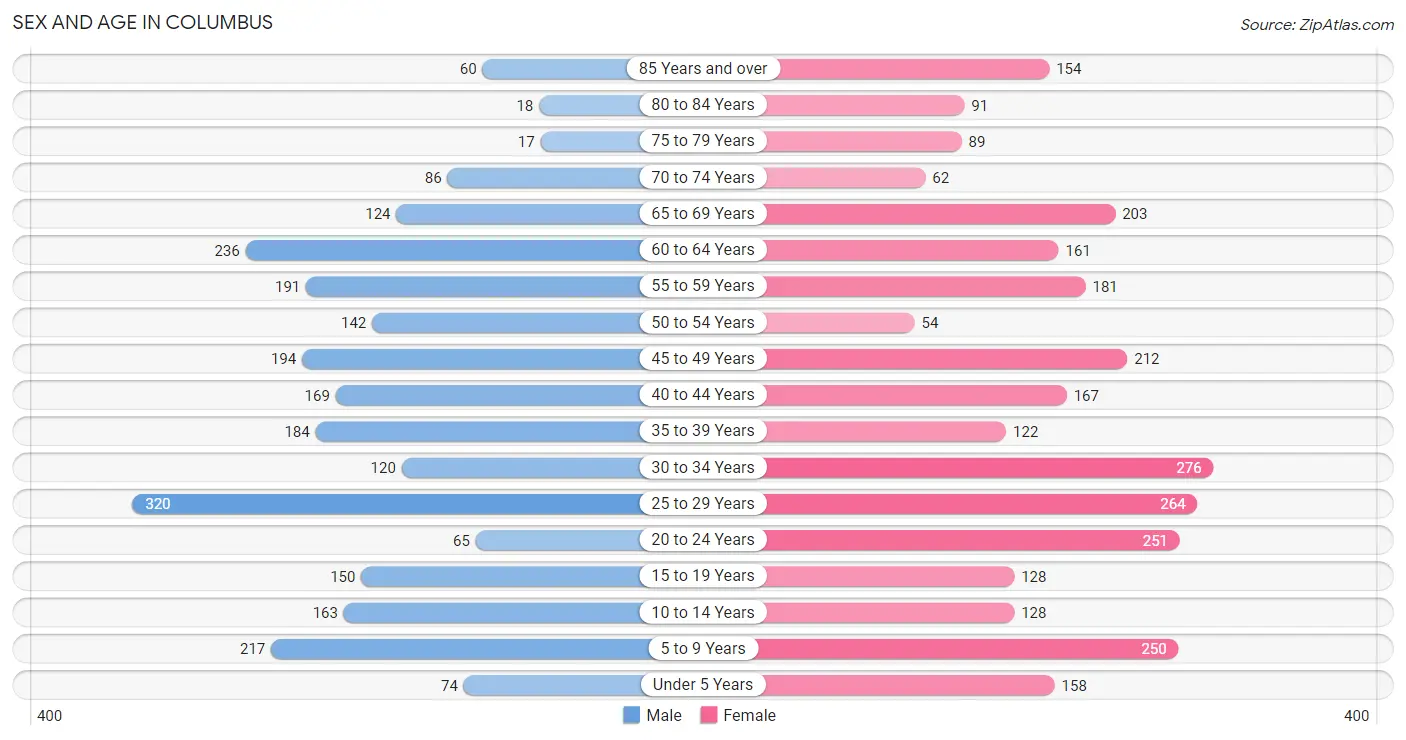
Sex and Age in Columbus
Sex and Age in Columbus
The most populous age groups in Columbus are 25 to 29 Years (320 | 12.7%) for men and 30 to 34 Years (276 | 9.3%) for women.
| Age Bracket | Male | Female |
| Under 5 Years | 74 (2.9%) | 158 (5.3%) |
| 5 to 9 Years | 217 (8.6%) | 250 (8.5%) |
| 10 to 14 Years | 163 (6.4%) | 128 (4.3%) |
| 15 to 19 Years | 150 (5.9%) | 128 (4.3%) |
| 20 to 24 Years | 65 (2.6%) | 251 (8.5%) |
| 25 to 29 Years | 320 (12.7%) | 264 (8.9%) |
| 30 to 34 Years | 120 (4.7%) | 276 (9.3%) |
| 35 to 39 Years | 184 (7.3%) | 122 (4.1%) |
| 40 to 44 Years | 169 (6.7%) | 167 (5.7%) |
| 45 to 49 Years | 194 (7.7%) | 212 (7.2%) |
| 50 to 54 Years | 142 (5.6%) | 54 (1.8%) |
| 55 to 59 Years | 191 (7.5%) | 181 (6.1%) |
| 60 to 64 Years | 236 (9.3%) | 161 (5.5%) |
| 65 to 69 Years | 124 (4.9%) | 203 (6.9%) |
| 70 to 74 Years | 86 (3.4%) | 62 (2.1%) |
| 75 to 79 Years | 17 (0.7%) | 89 (3.0%) |
| 80 to 84 Years | 18 (0.7%) | 91 (3.1%) |
| 85 Years and over | 60 (2.4%) | 154 (5.2%) |
| Total | 2,530 (100.0%) | 2,951 (100.0%) |
Families and Households in Columbus
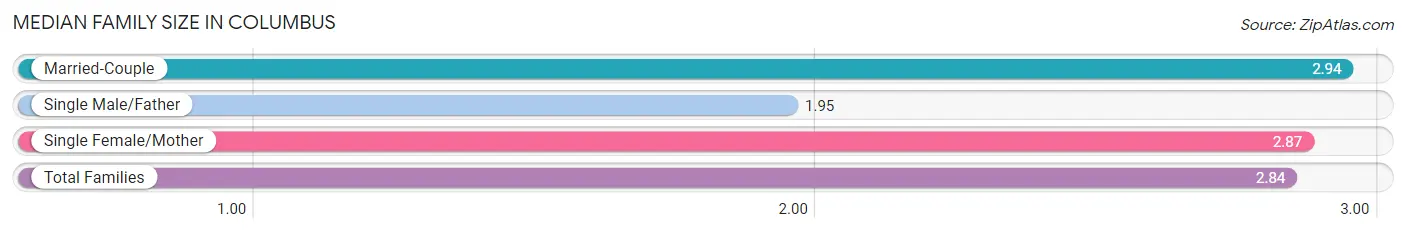
Median Family Size in Columbus
The median family size in Columbus is 2.84 persons per family, with married-couple families (1,035 | 71.2%) accounting for the largest median family size of 2.94 persons per family. On the other hand, single male/father families (122 | 8.4%) represent the smallest median family size with 1.95 persons per family.
| Family Type | # Families | Family Size |
| Married-Couple | 1,035 (71.2%) | 2.94 |
| Single Male/Father | 122 (8.4%) | 1.95 |
| Single Female/Mother | 296 (20.4%) | 2.87 |
| Total Families | 1,453 (100.0%) | 2.84 |
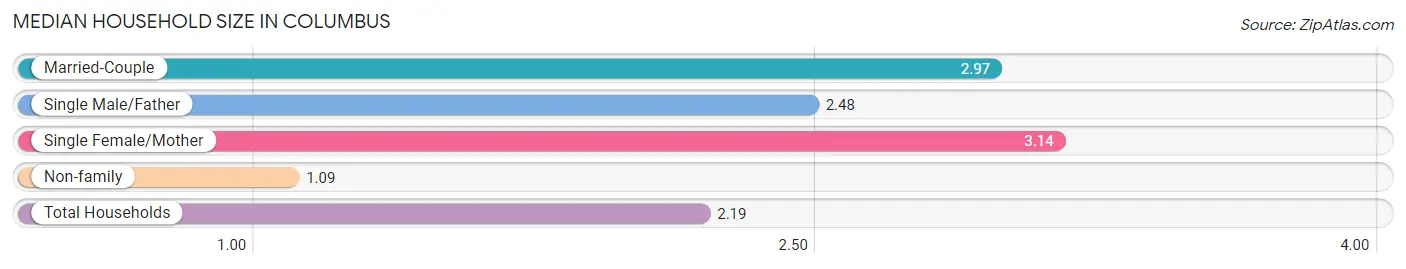
Median Household Size in Columbus
The median household size in Columbus is 2.19 persons per household, with single female/mother households (296 | 12.0%) accounting for the largest median household size of 3.14 persons per household. non-family households (1,014 | 41.1%) represent the smallest median household size with 1.09 persons per household.
| Household Type | # Households | Household Size |
| Married-Couple | 1,035 (41.9%) | 2.97 |
| Single Male/Father | 122 (5.0%) | 2.48 |
| Single Female/Mother | 296 (12.0%) | 3.14 |
| Non-family | 1,014 (41.1%) | 1.09 |
| Total Households | 2,467 (100.0%) | 2.19 |
Household Size by Marriage Status in Columbus
Out of a total of 2,467 households in Columbus, 1,453 (58.9%) are family households, while 1,014 (41.1%) are nonfamily households. The most numerous type of family households are 2-person households, comprising 741, and the most common type of nonfamily households are 1-person households, comprising 915.
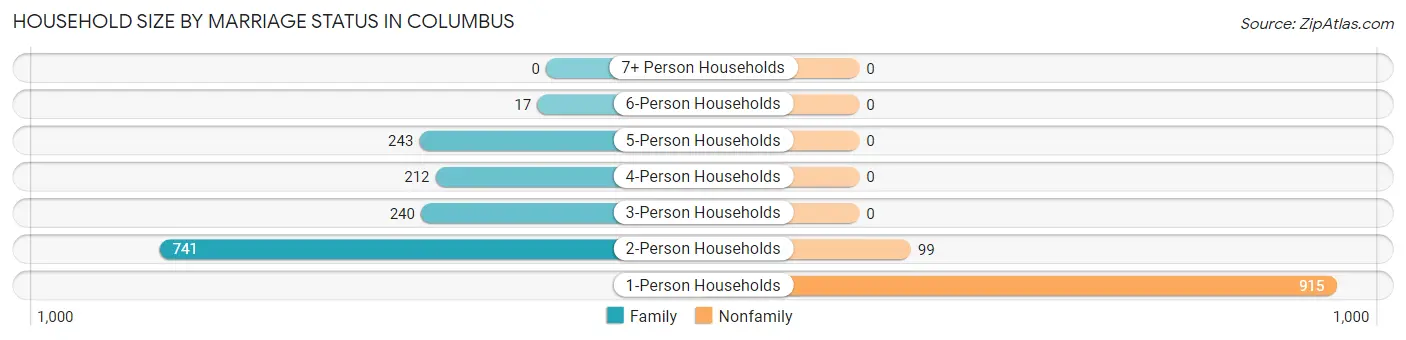
| Household Size | Family Households | Nonfamily Households |
| 1-Person Households | - | 915 (37.1%) |
| 2-Person Households | 741 (30.0%) | 99 (4.0%) |
| 3-Person Households | 240 (9.7%) | 0 (0.0%) |
| 4-Person Households | 212 (8.6%) | 0 (0.0%) |
| 5-Person Households | 243 (9.9%) | 0 (0.0%) |
| 6-Person Households | 17 (0.7%) | 0 (0.0%) |
| 7+ Person Households | 0 (0.0%) | 0 (0.0%) |
| Total | 1,453 (58.9%) | 1,014 (41.1%) |
Female Fertility in Columbus
Fertility by Age in Columbus
Average fertility rate in Columbus is 37.0 births per 1,000 women. Women in the age bracket of 20 to 34 years have the highest fertility rate with 67.0 births per 1,000 women. Women in the age bracket of 20 to 34 years acount for 100.0% of all women with births.
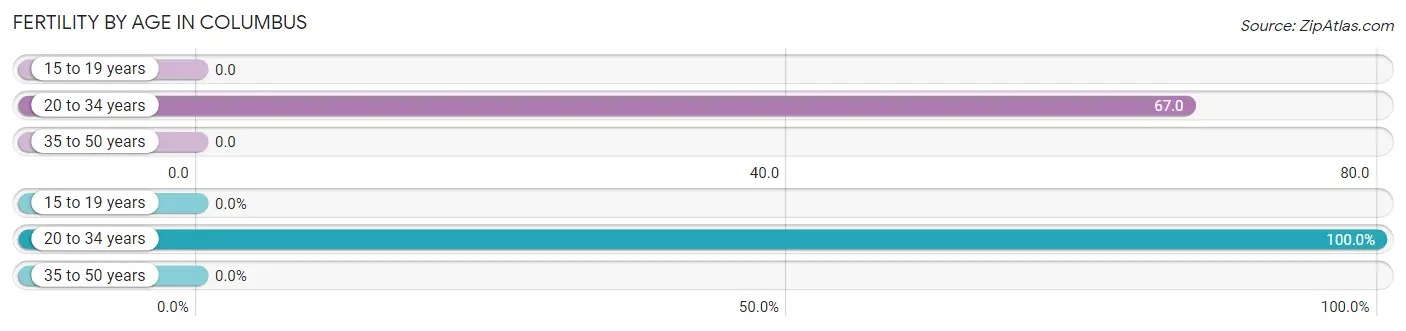
| Age Bracket | Women with Births | Births / 1,000 Women |
| 15 to 19 years | 0 (0.0%) | 0.0 |
| 20 to 34 years | 53 (100.0%) | 67.0 |
| 35 to 50 years | 0 (0.0%) | 0.0 |
| Total | 53 (100.0%) | 37.0 |
Fertility by Age by Marriage Status in Columbus
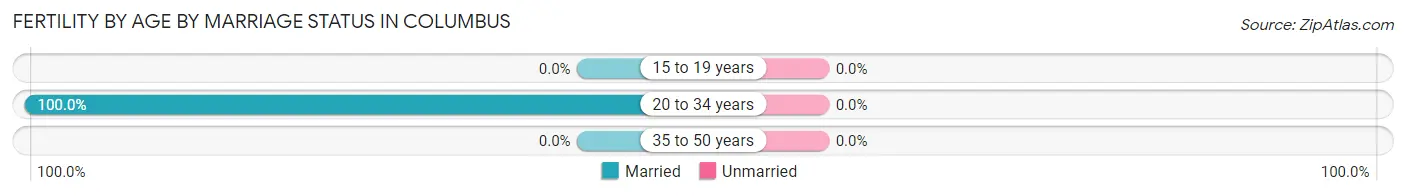
| Age Bracket | Married | Unmarried |
| 15 to 19 years | 0 (0.0%) | 0 (0.0%) |
| 20 to 34 years | 53 (100.0%) | 0 (0.0%) |
| 35 to 50 years | 0 (0.0%) | 0 (0.0%) |
| Total | 53 (100.0%) | 0 (0.0%) |
Fertility by Education in Columbus
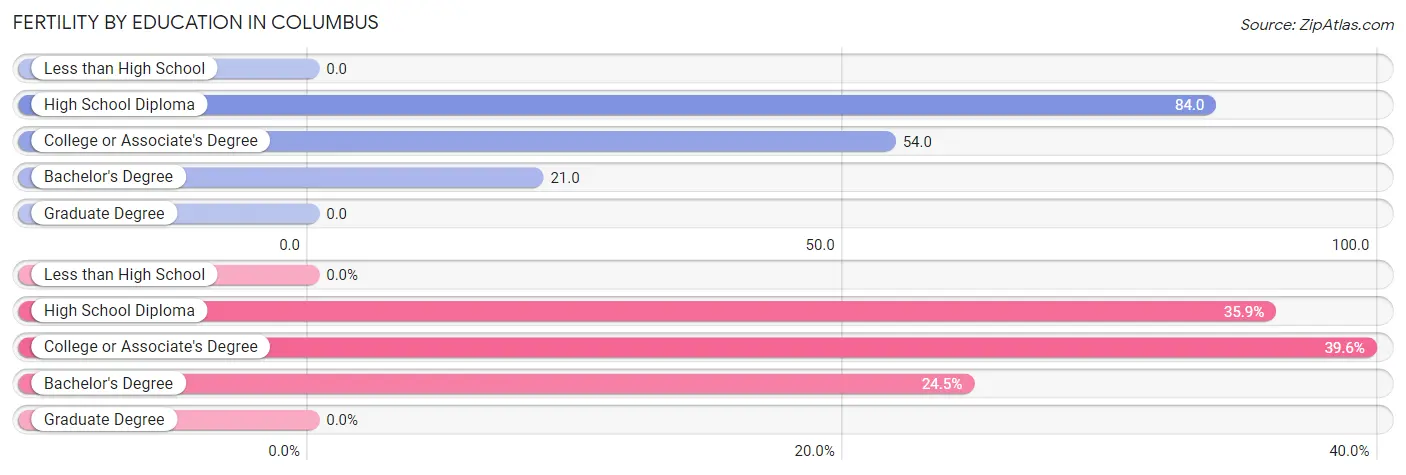
| Educational Attainment | Women with Births | Births / 1,000 Women |
| Less than High School | 0 (0.0%) | 0.0 |
| High School Diploma | 19 (35.8%) | 84.0 |
| College or Associate's Degree | 21 (39.6%) | 54.0 |
| Bachelor's Degree | 13 (24.5%) | 21.0 |
| Graduate Degree | 0 (0.0%) | 0.0 |
| Total | 53 (100.0%) | 37.0 |
Fertility by Education by Marriage Status in Columbus
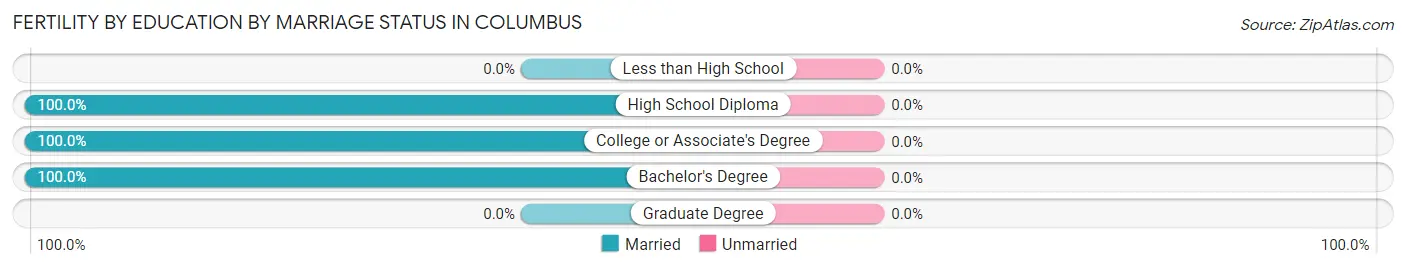
| Educational Attainment | Married | Unmarried |
| Less than High School | 0 (0.0%) | 0 (0.0%) |
| High School Diploma | 19 (100.0%) | 0 (0.0%) |
| College or Associate's Degree | 21 (100.0%) | 0 (0.0%) |
| Bachelor's Degree | 13 (100.0%) | 0 (0.0%) |
| Graduate Degree | 0 (0.0%) | 0 (0.0%) |
| Total | 53 (100.0%) | 0 (0.0%) |
Employment Characteristics in Columbus
Employment by Class of Employer in Columbus
Among the 3,156 employed individuals in Columbus, private company employees (2,244 | 71.1%), local government employees (245 | 7.8%), and not-for-profit organizations (206 | 6.5%) make up the most common classes of employment.
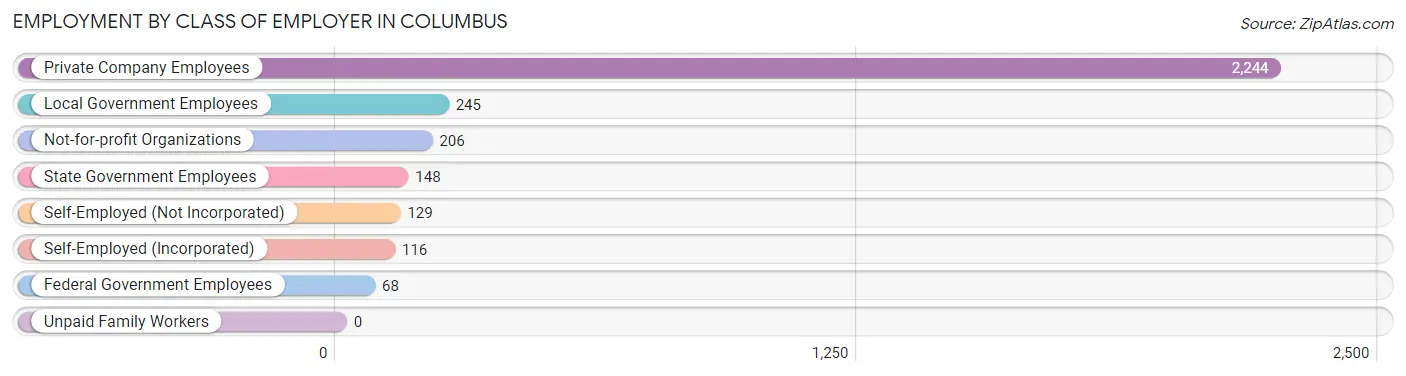
| Employer Class | # Employees | % Employees |
| Private Company Employees | 2,244 | 71.1% |
| Self-Employed (Incorporated) | 116 | 3.7% |
| Self-Employed (Not Incorporated) | 129 | 4.1% |
| Not-for-profit Organizations | 206 | 6.5% |
| Local Government Employees | 245 | 7.8% |
| State Government Employees | 148 | 4.7% |
| Federal Government Employees | 68 | 2.1% |
| Unpaid Family Workers | 0 | 0.0% |
| Total | 3,156 | 100.0% |
Employment Status by Age in Columbus
According to the labor force statistics for Columbus, out of the total population over 16 years of age (4,434), 74.4% or 3,299 individuals are in the labor force, with 2.1% or 69 of them unemployed. The age group with the highest labor force participation rate is 35 to 44 years, with 99.1% or 636 individuals in the labor force. Within the labor force, the 16 to 19 years age range has the highest percentage of unemployed individuals, with 20.3% or 14 of them being unemployed.
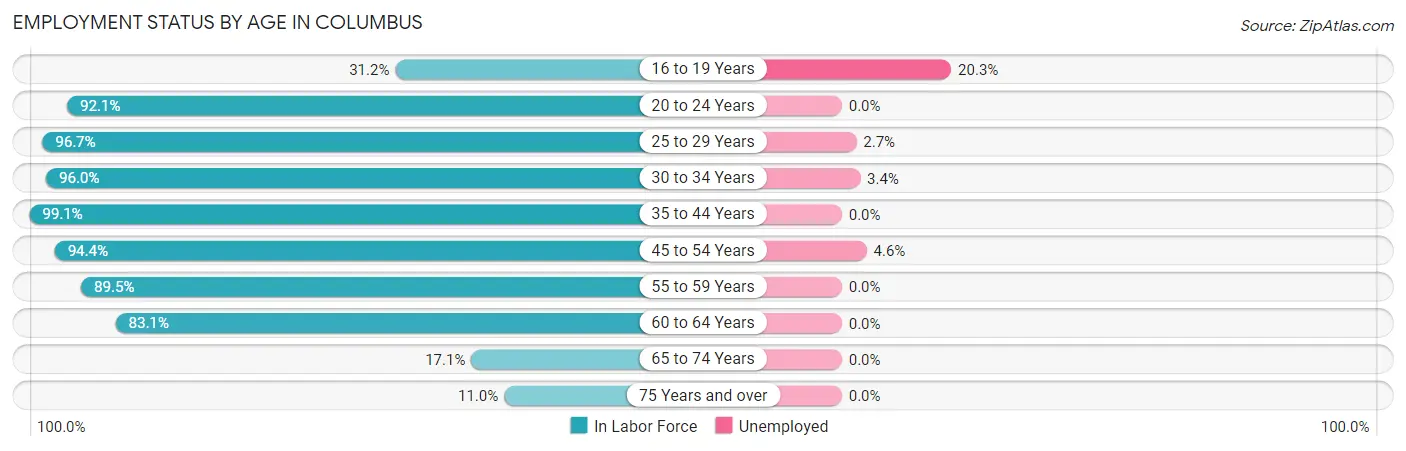
| Age Bracket | In Labor Force | Unemployed |
| 16 to 19 Years | 69 (31.2%) | 14 (20.3%) |
| 20 to 24 Years | 291 (92.1%) | 0 (0.0%) |
| 25 to 29 Years | 565 (96.7%) | 15 (2.7%) |
| 30 to 34 Years | 380 (96.0%) | 13 (3.4%) |
| 35 to 44 Years | 636 (99.1%) | 0 (0.0%) |
| 45 to 54 Years | 568 (94.4%) | 26 (4.6%) |
| 55 to 59 Years | 333 (89.5%) | 0 (0.0%) |
| 60 to 64 Years | 330 (83.1%) | 0 (0.0%) |
| 65 to 74 Years | 81 (17.1%) | 0 (0.0%) |
| 75 Years and over | 47 (11.0%) | 0 (0.0%) |
| Total | 3,299 (74.4%) | 69 (2.1%) |
Employment Status by Educational Attainment in Columbus
According to labor force statistics for Columbus, 94.0% of individuals (2,813) out of the total population between 25 and 64 years of age (2,993) are in the labor force, with 1.9% or 53 of them being unemployed. The group with the highest labor force participation rate are those with the educational attainment of college / associate degree, with 96.3% or 985 individuals in the labor force. Within the labor force, individuals with high school diploma education have the highest percentage of unemployment, with 5.4% or 41 of them being unemployed.
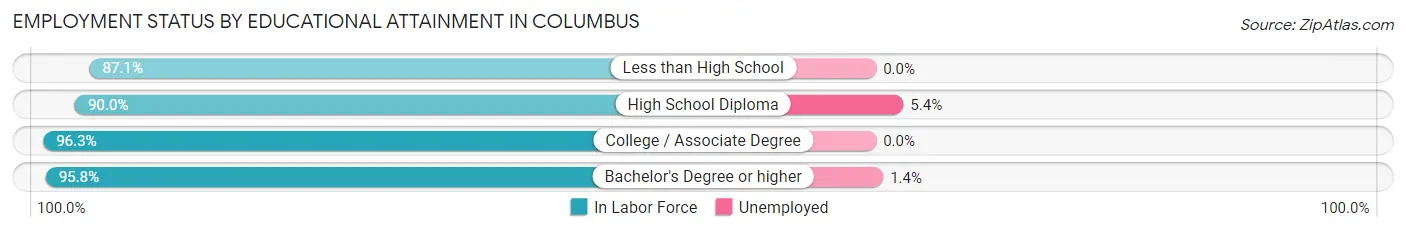
| Educational Attainment | In Labor Force | Unemployed |
| Less than High School | 115 (87.1%) | 0 (0.0%) |
| High School Diploma | 755 (90.0%) | 45 (5.4%) |
| College / Associate Degree | 985 (96.3%) | 0 (0.0%) |
| Bachelor's Degree or higher | 957 (95.8%) | 14 (1.4%) |
| Total | 2,813 (94.0%) | 57 (1.9%) |
Employment Occupations by Sex in Columbus
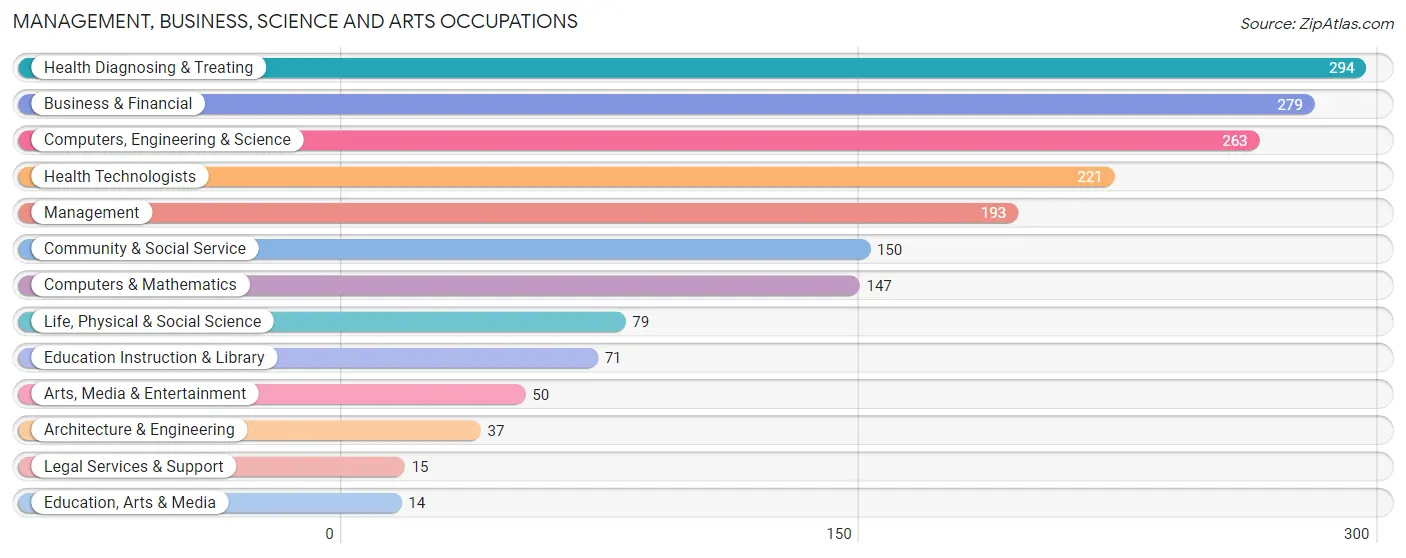
Management, Business, Science and Arts Occupations
The most common Management, Business, Science and Arts occupations in Columbus are Health Diagnosing & Treating (294 | 9.1%), Business & Financial (279 | 8.6%), Computers, Engineering & Science (263 | 8.1%), Health Technologists (221 | 6.8%), and Management (193 | 6.0%).
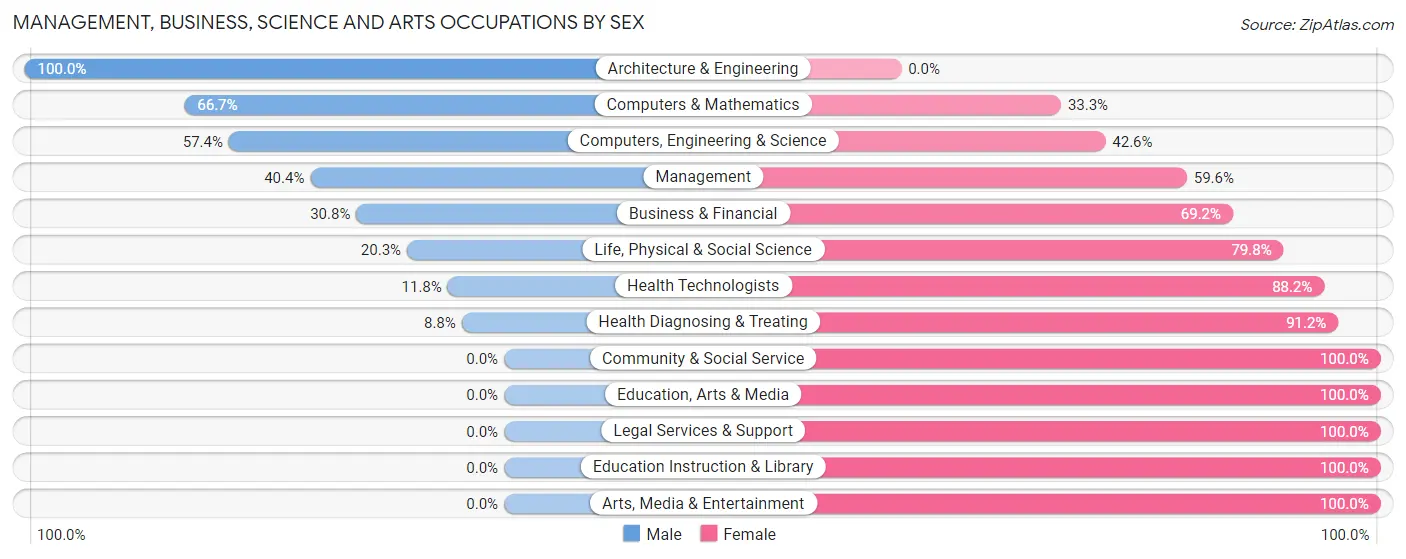
Management, Business, Science and Arts Occupations by Sex
Within the Management, Business, Science and Arts occupations in Columbus, the most male-oriented occupations are Architecture & Engineering (100.0%), Computers & Mathematics (66.7%), and Computers, Engineering & Science (57.4%), while the most female-oriented occupations are Community & Social Service (100.0%), Education, Arts & Media (100.0%), and Legal Services & Support (100.0%).
| Occupation | Male | Female |
| Management | 78 (40.4%) | 115 (59.6%) |
| Business & Financial | 86 (30.8%) | 193 (69.2%) |
| Computers, Engineering & Science | 151 (57.4%) | 112 (42.6%) |
| Computers & Mathematics | 98 (66.7%) | 49 (33.3%) |
| Architecture & Engineering | 37 (100.0%) | 0 (0.0%) |
| Life, Physical & Social Science | 16 (20.3%) | 63 (79.7%) |
| Community & Social Service | 0 (0.0%) | 150 (100.0%) |
| Education, Arts & Media | 0 (0.0%) | 14 (100.0%) |
| Legal Services & Support | 0 (0.0%) | 15 (100.0%) |
| Education Instruction & Library | 0 (0.0%) | 71 (100.0%) |
| Arts, Media & Entertainment | 0 (0.0%) | 50 (100.0%) |
| Health Diagnosing & Treating | 26 (8.8%) | 268 (91.2%) |
| Health Technologists | 26 (11.8%) | 195 (88.2%) |
| Total (Category) | 341 (28.9%) | 838 (71.1%) |
| Total (Overall) | 1,674 (51.8%) | 1,558 (48.2%) |
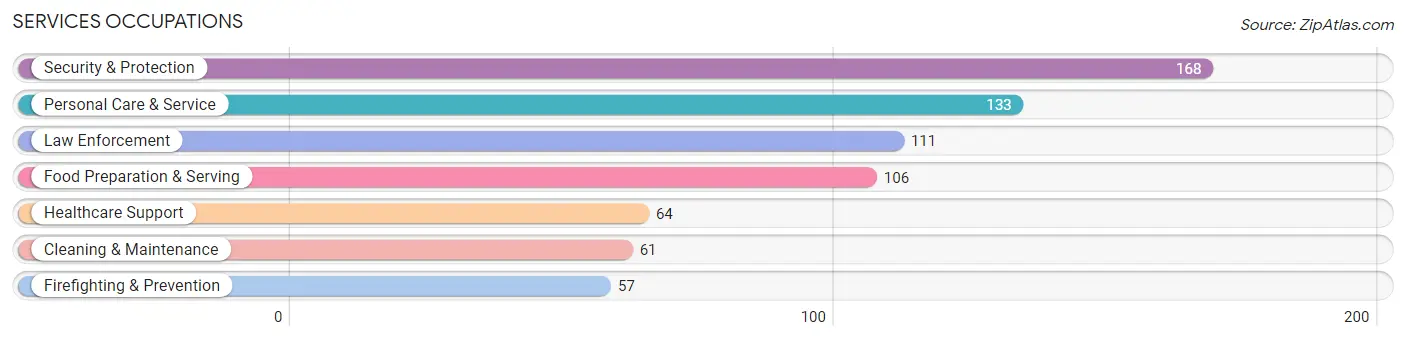
Services Occupations
The most common Services occupations in Columbus are Security & Protection (168 | 5.2%), Personal Care & Service (133 | 4.1%), Law Enforcement (111 | 3.4%), Food Preparation & Serving (106 | 3.3%), and Healthcare Support (64 | 2.0%).
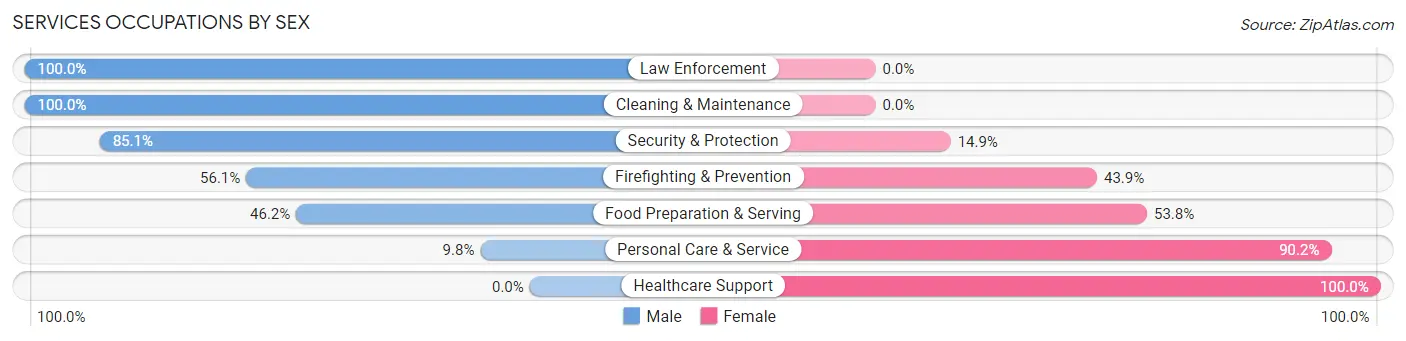
Services Occupations by Sex
Within the Services occupations in Columbus, the most male-oriented occupations are Law Enforcement (100.0%), Cleaning & Maintenance (100.0%), and Security & Protection (85.1%), while the most female-oriented occupations are Healthcare Support (100.0%), Personal Care & Service (90.2%), and Food Preparation & Serving (53.8%).
| Occupation | Male | Female |
| Healthcare Support | 0 (0.0%) | 64 (100.0%) |
| Security & Protection | 143 (85.1%) | 25 (14.9%) |
| Firefighting & Prevention | 32 (56.1%) | 25 (43.9%) |
| Law Enforcement | 111 (100.0%) | 0 (0.0%) |
| Food Preparation & Serving | 49 (46.2%) | 57 (53.8%) |
| Cleaning & Maintenance | 61 (100.0%) | 0 (0.0%) |
| Personal Care & Service | 13 (9.8%) | 120 (90.2%) |
| Total (Category) | 266 (50.0%) | 266 (50.0%) |
| Total (Overall) | 1,674 (51.8%) | 1,558 (48.2%) |
Sales and Office Occupations
The most common Sales and Office occupations in Columbus are Office & Administration (435 | 13.5%), and Sales & Related (204 | 6.3%).

Sales and Office Occupations by Sex

| Occupation | Male | Female |
| Sales & Related | 183 (89.7%) | 21 (10.3%) |
| Office & Administration | 148 (34.0%) | 287 (66.0%) |
| Total (Category) | 331 (51.8%) | 308 (48.2%) |
| Total (Overall) | 1,674 (51.8%) | 1,558 (48.2%) |
Natural Resources, Construction and Maintenance Occupations
The most common Natural Resources, Construction and Maintenance occupations in Columbus are Construction & Extraction (139 | 4.3%), and Installation, Maintenance & Repair (123 | 3.8%).
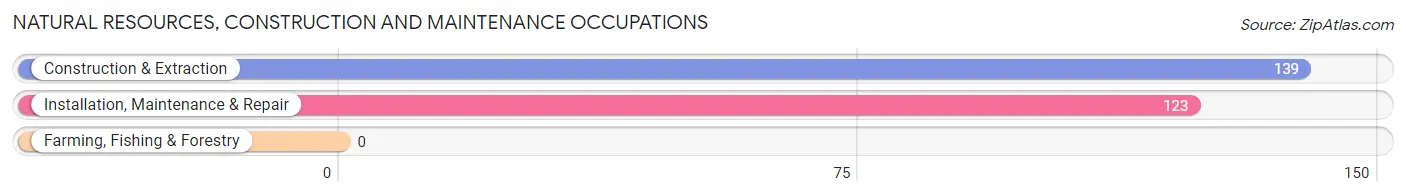
Natural Resources, Construction and Maintenance Occupations by Sex
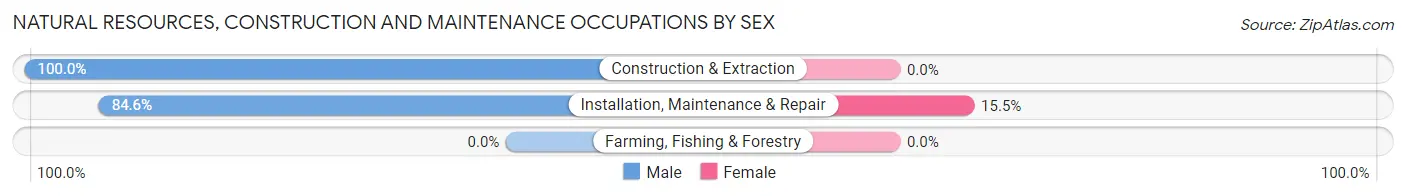
| Occupation | Male | Female |
| Farming, Fishing & Forestry | 0 (0.0%) | 0 (0.0%) |
| Construction & Extraction | 139 (100.0%) | 0 (0.0%) |
| Installation, Maintenance & Repair | 104 (84.6%) | 19 (15.4%) |
| Total (Category) | 243 (92.7%) | 19 (7.2%) |
| Total (Overall) | 1,674 (51.8%) | 1,558 (48.2%) |
Production, Transportation and Moving Occupations
The most common Production, Transportation and Moving occupations in Columbus are Production (291 | 9.0%), Transportation (186 | 5.8%), and Material Moving (143 | 4.4%).
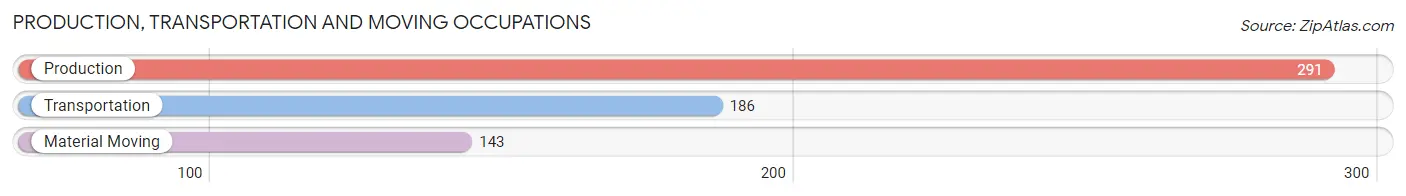
Production, Transportation and Moving Occupations by Sex

| Occupation | Male | Female |
| Production | 224 (77.0%) | 67 (23.0%) |
| Transportation | 186 (100.0%) | 0 (0.0%) |
| Material Moving | 83 (58.0%) | 60 (42.0%) |
| Total (Category) | 493 (79.5%) | 127 (20.5%) |
| Total (Overall) | 1,674 (51.8%) | 1,558 (48.2%) |
Employment Industries by Sex in Columbus
Employment Industries in Columbus
The major employment industries in Columbus include Manufacturing (572 | 17.7%), Health Care & Social Assistance (505 | 15.6%), Public Administration (294 | 9.1%), Finance & Insurance (273 | 8.5%), and Accommodation & Food Services (197 | 6.1%).
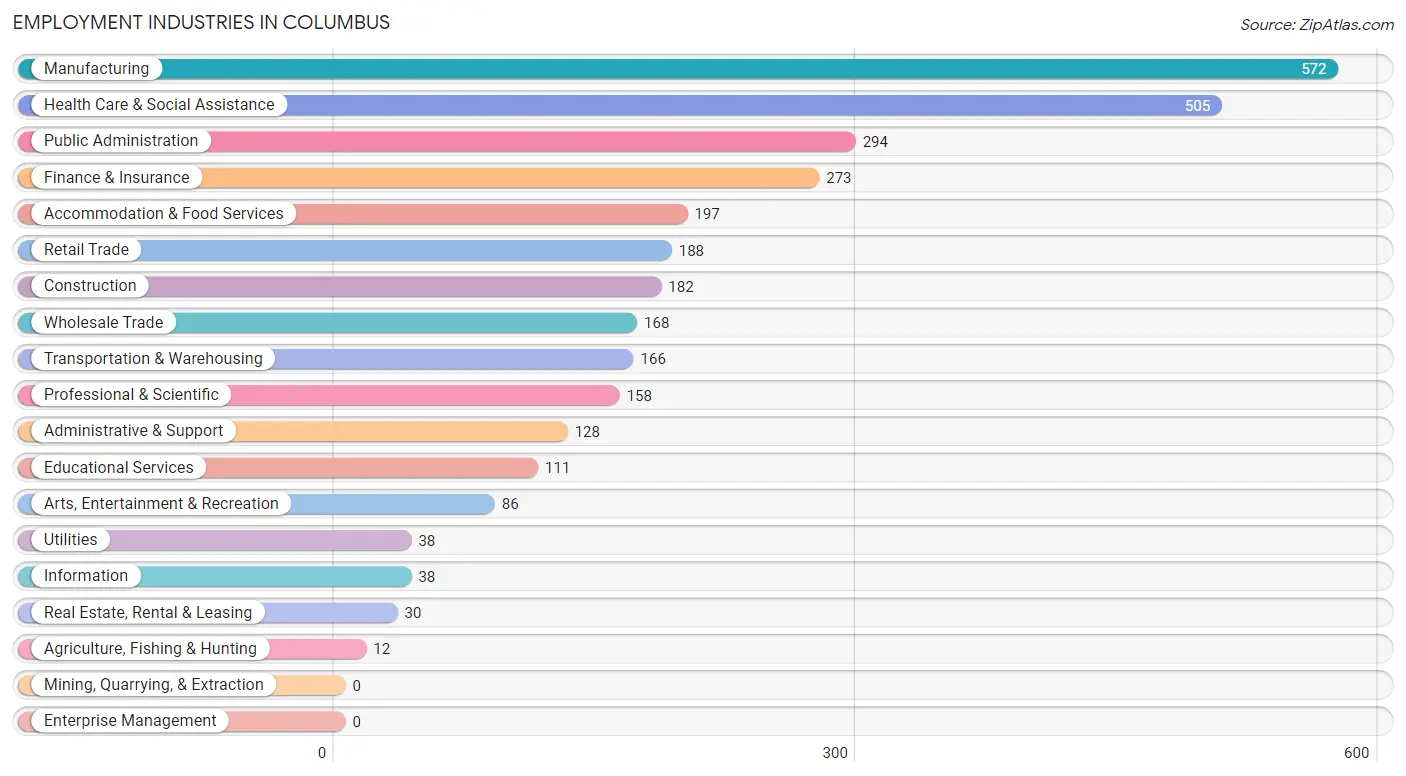
Employment Industries by Sex in Columbus
The Columbus industries that see more men than women are Construction (100.0%), Real Estate, Rental & Leasing (100.0%), and Manufacturing (80.2%), whereas the industries that tend to have a higher number of women are Agriculture, Fishing & Hunting (100.0%), Information (100.0%), and Arts, Entertainment & Recreation (100.0%).
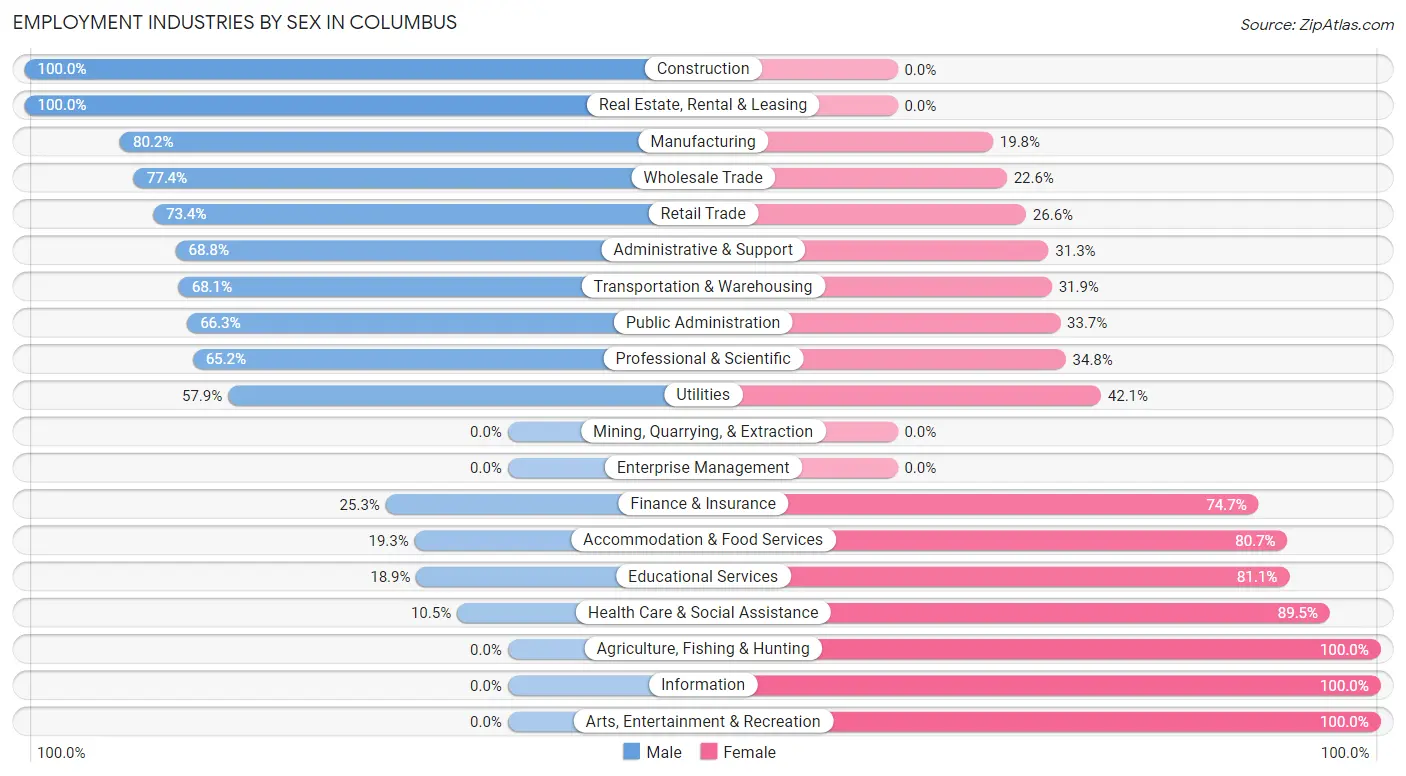
| Industry | Male | Female |
| Agriculture, Fishing & Hunting | 0 (0.0%) | 12 (100.0%) |
| Mining, Quarrying, & Extraction | 0 (0.0%) | 0 (0.0%) |
| Construction | 182 (100.0%) | 0 (0.0%) |
| Manufacturing | 459 (80.2%) | 113 (19.8%) |
| Wholesale Trade | 130 (77.4%) | 38 (22.6%) |
| Retail Trade | 138 (73.4%) | 50 (26.6%) |
| Transportation & Warehousing | 113 (68.1%) | 53 (31.9%) |
| Utilities | 22 (57.9%) | 16 (42.1%) |
| Information | 0 (0.0%) | 38 (100.0%) |
| Finance & Insurance | 69 (25.3%) | 204 (74.7%) |
| Real Estate, Rental & Leasing | 30 (100.0%) | 0 (0.0%) |
| Professional & Scientific | 103 (65.2%) | 55 (34.8%) |
| Enterprise Management | 0 (0.0%) | 0 (0.0%) |
| Administrative & Support | 88 (68.8%) | 40 (31.2%) |
| Educational Services | 21 (18.9%) | 90 (81.1%) |
| Health Care & Social Assistance | 53 (10.5%) | 452 (89.5%) |
| Arts, Entertainment & Recreation | 0 (0.0%) | 86 (100.0%) |
| Accommodation & Food Services | 38 (19.3%) | 159 (80.7%) |
| Public Administration | 195 (66.3%) | 99 (33.7%) |
| Total | 1,674 (51.8%) | 1,558 (48.2%) |
Education in Columbus
School Enrollment in Columbus
The most common levels of schooling among the 1,251 students in Columbus are elementary school (360 | 28.8%), middle school (302 | 24.1%), and high school (258 | 20.6%).
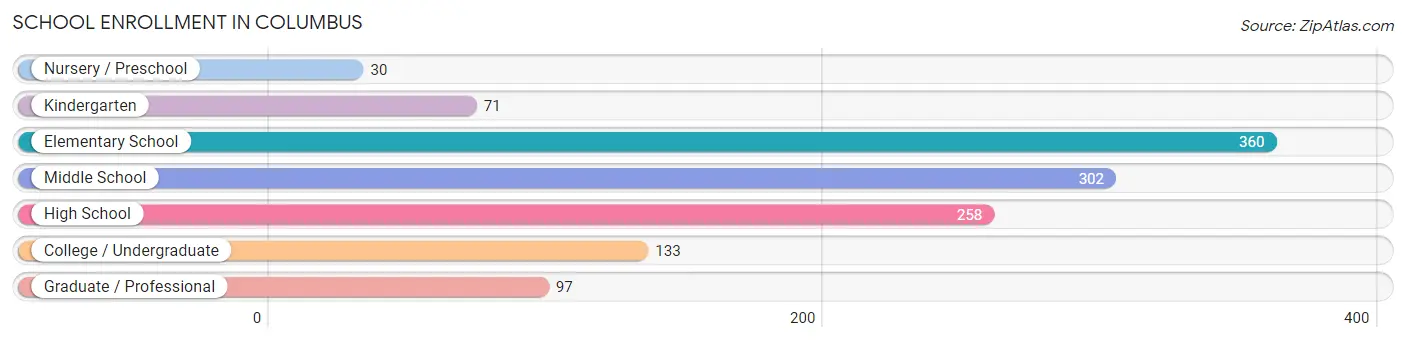
| School Level | # Students | % Students |
| Nursery / Preschool | 30 | 2.4% |
| Kindergarten | 71 | 5.7% |
| Elementary School | 360 | 28.8% |
| Middle School | 302 | 24.1% |
| High School | 258 | 20.6% |
| College / Undergraduate | 133 | 10.6% |
| Graduate / Professional | 97 | 7.7% |
| Total | 1,251 | 100.0% |
School Enrollment by Age by Funding Source in Columbus
Out of a total of 1,251 students who are enrolled in schools in Columbus, 278 (22.2%) attend a private institution, while the remaining 973 (77.8%) are enrolled in public schools. The age group of 20 to 24 year olds has the highest likelihood of being enrolled in private schools, with 47 (47.0% in the age bracket) enrolled. Conversely, the age group of 3 to 4 year olds has the lowest likelihood of being enrolled in a private school, with 30 (100.0% in the age bracket) attending a public institution.
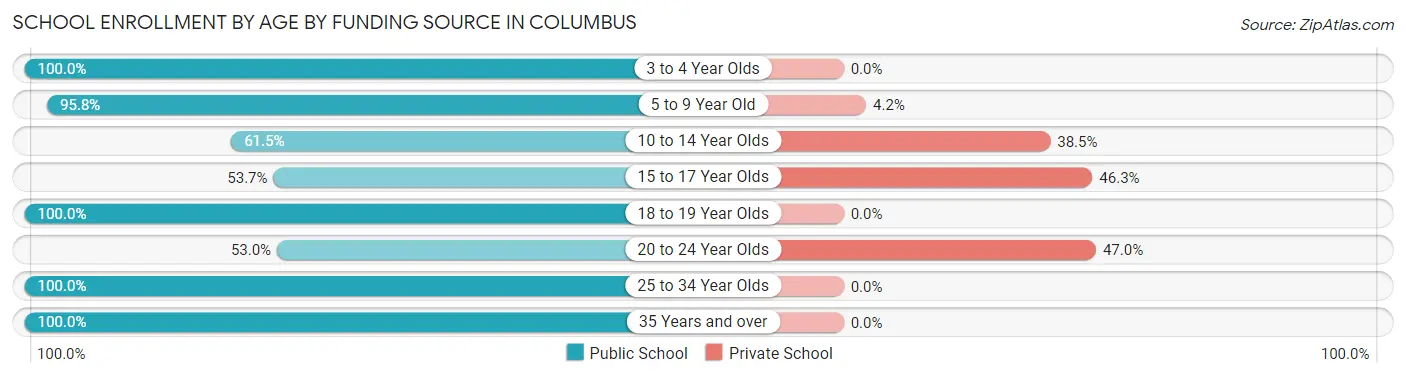
| Age Bracket | Public School | Private School |
| 3 to 4 Year Olds | 30 (100.0%) | 0 (0.0%) |
| 5 to 9 Year Old | 414 (95.8%) | 18 (4.2%) |
| 10 to 14 Year Olds | 179 (61.5%) | 112 (38.5%) |
| 15 to 17 Year Olds | 117 (53.7%) | 101 (46.3%) |
| 18 to 19 Year Olds | 46 (100.0%) | 0 (0.0%) |
| 20 to 24 Year Olds | 53 (53.0%) | 47 (47.0%) |
| 25 to 34 Year Olds | 51 (100.0%) | 0 (0.0%) |
| 35 Years and over | 83 (100.0%) | 0 (0.0%) |
| Total | 973 (77.8%) | 278 (22.2%) |
Educational Attainment by Field of Study in Columbus
Business (247 | 20.1%), education (198 | 16.1%), visual & performing arts (132 | 10.7%), psychology (115 | 9.3%), and science & technology (99 | 8.0%) are the most common fields of study among 1,231 individuals in Columbus who have obtained a bachelor's degree or higher.
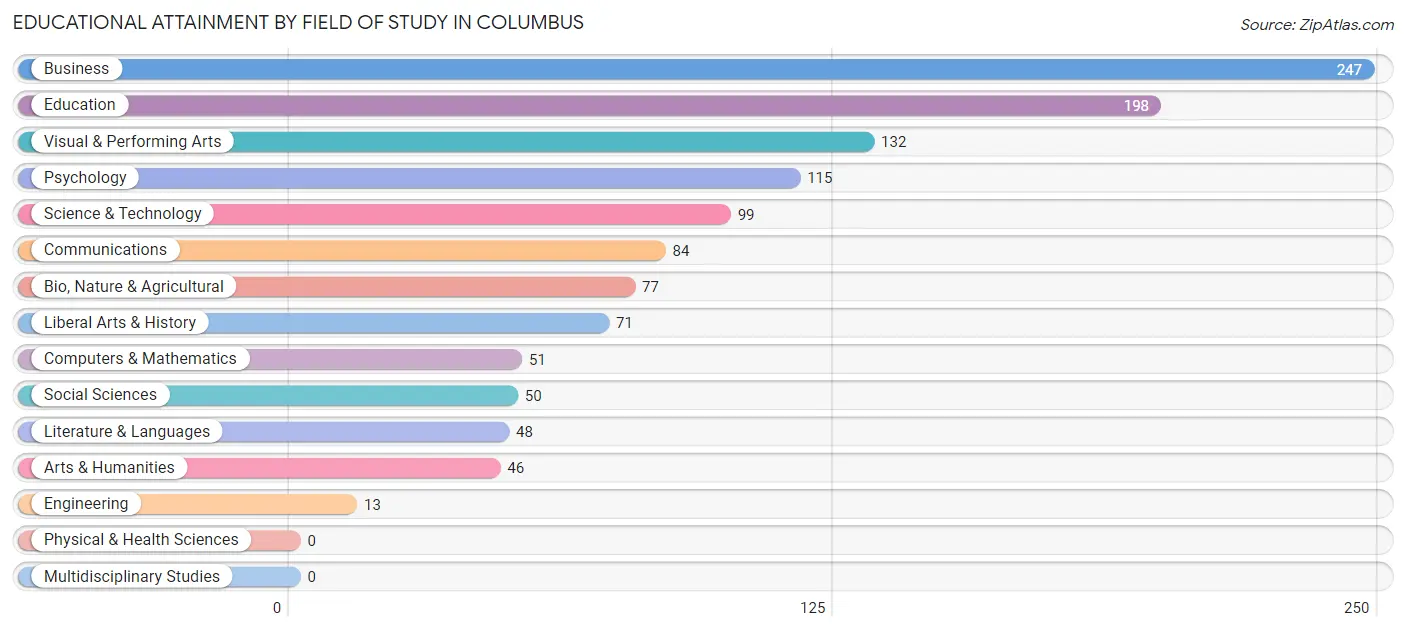
| Field of Study | # Graduates | % Graduates |
| Computers & Mathematics | 51 | 4.1% |
| Bio, Nature & Agricultural | 77 | 6.3% |
| Physical & Health Sciences | 0 | 0.0% |
| Psychology | 115 | 9.3% |
| Social Sciences | 50 | 4.1% |
| Engineering | 13 | 1.1% |
| Multidisciplinary Studies | 0 | 0.0% |
| Science & Technology | 99 | 8.0% |
| Business | 247 | 20.1% |
| Education | 198 | 16.1% |
| Literature & Languages | 48 | 3.9% |
| Liberal Arts & History | 71 | 5.8% |
| Visual & Performing Arts | 132 | 10.7% |
| Communications | 84 | 6.8% |
| Arts & Humanities | 46 | 3.7% |
| Total | 1,231 | 100.0% |
Transportation & Commute in Columbus
Vehicle Availability by Sex in Columbus
The most prevalent vehicle ownership categories in Columbus are males with 2 vehicles (858, accounting for 51.8%) and females with 2 vehicles (683, making up 57.2%).
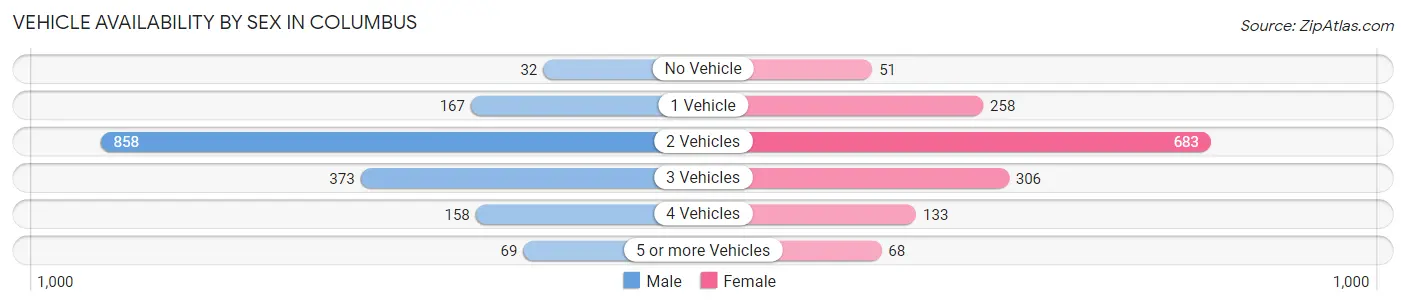
| Vehicles Available | Male | Female |
| No Vehicle | 32 (1.9%) | 51 (3.4%) |
| 1 Vehicle | 167 (10.1%) | 258 (17.2%) |
| 2 Vehicles | 858 (51.8%) | 683 (45.6%) |
| 3 Vehicles | 373 (22.5%) | 306 (20.4%) |
| 4 Vehicles | 158 (9.5%) | 133 (8.9%) |
| 5 or more Vehicles | 69 (4.2%) | 68 (4.5%) |
| Total | 1,657 (100.0%) | 1,499 (100.0%) |
Commute Time in Columbus
The most frequently occuring commute durations in Columbus are 5 to 9 minutes (537 commuters, 20.5%), 45 to 59 minutes (390 commuters, 14.9%), and 30 to 34 minutes (343 commuters, 13.1%).
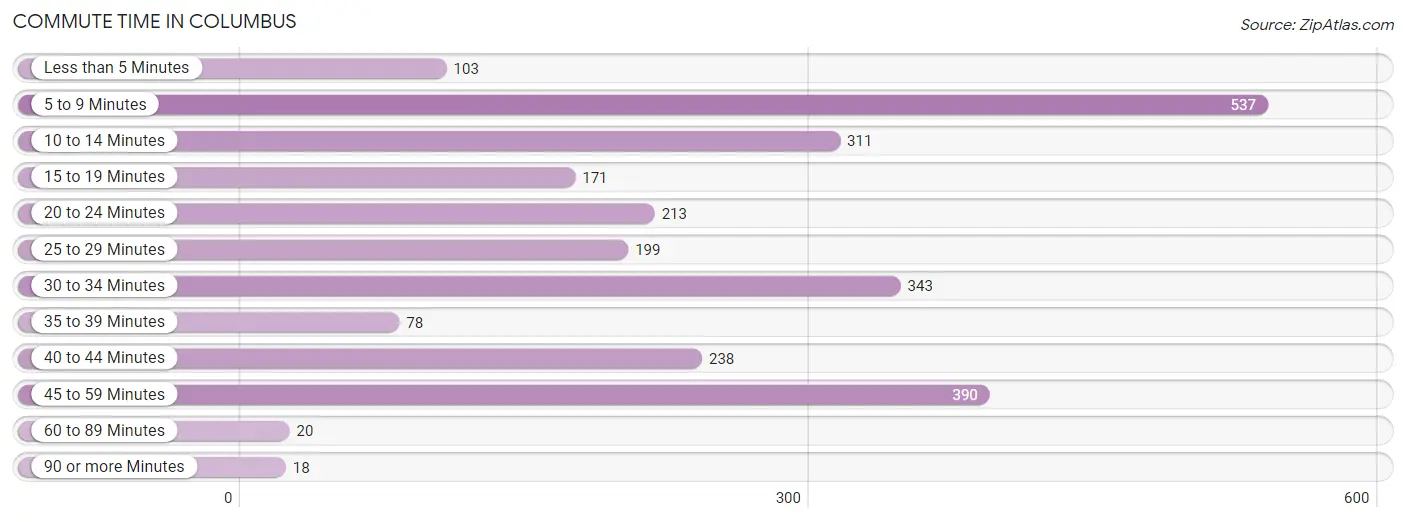
| Commute Time | # Commuters | % Commuters |
| Less than 5 Minutes | 103 | 3.9% |
| 5 to 9 Minutes | 537 | 20.5% |
| 10 to 14 Minutes | 311 | 11.9% |
| 15 to 19 Minutes | 171 | 6.5% |
| 20 to 24 Minutes | 213 | 8.1% |
| 25 to 29 Minutes | 199 | 7.6% |
| 30 to 34 Minutes | 343 | 13.1% |
| 35 to 39 Minutes | 78 | 3.0% |
| 40 to 44 Minutes | 238 | 9.1% |
| 45 to 59 Minutes | 390 | 14.9% |
| 60 to 89 Minutes | 20 | 0.8% |
| 90 or more Minutes | 18 | 0.7% |
Commute Time by Sex in Columbus
The most common commute times in Columbus are 5 to 9 minutes (241 commuters, 16.0%) for males and 5 to 9 minutes (296 commuters, 26.6%) for females.
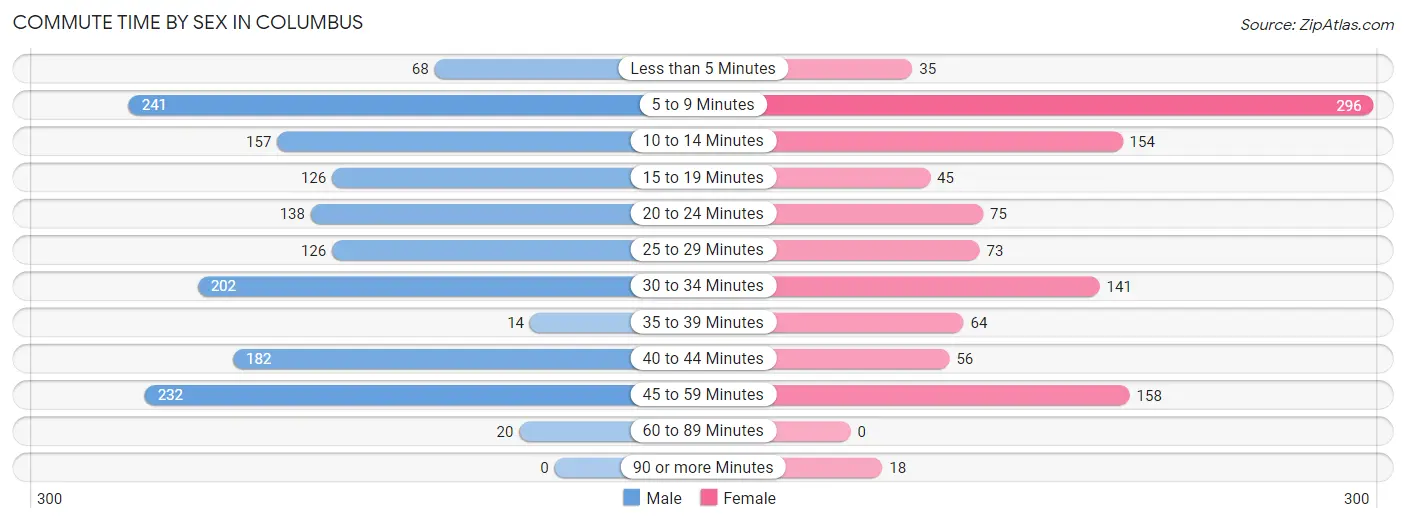
| Commute Time | Male | Female |
| Less than 5 Minutes | 68 (4.5%) | 35 (3.1%) |
| 5 to 9 Minutes | 241 (16.0%) | 296 (26.6%) |
| 10 to 14 Minutes | 157 (10.4%) | 154 (13.8%) |
| 15 to 19 Minutes | 126 (8.4%) | 45 (4.0%) |
| 20 to 24 Minutes | 138 (9.2%) | 75 (6.7%) |
| 25 to 29 Minutes | 126 (8.4%) | 73 (6.6%) |
| 30 to 34 Minutes | 202 (13.4%) | 141 (12.7%) |
| 35 to 39 Minutes | 14 (0.9%) | 64 (5.7%) |
| 40 to 44 Minutes | 182 (12.1%) | 56 (5.0%) |
| 45 to 59 Minutes | 232 (15.4%) | 158 (14.2%) |
| 60 to 89 Minutes | 20 (1.3%) | 0 (0.0%) |
| 90 or more Minutes | 0 (0.0%) | 18 (1.6%) |
Time of Departure to Work by Sex in Columbus
The most frequent times of departure to work in Columbus are 12:00 PM to 3:59 PM (192, 12.8%) for males and 6:30 AM to 6:59 AM (242, 21.7%) for females.
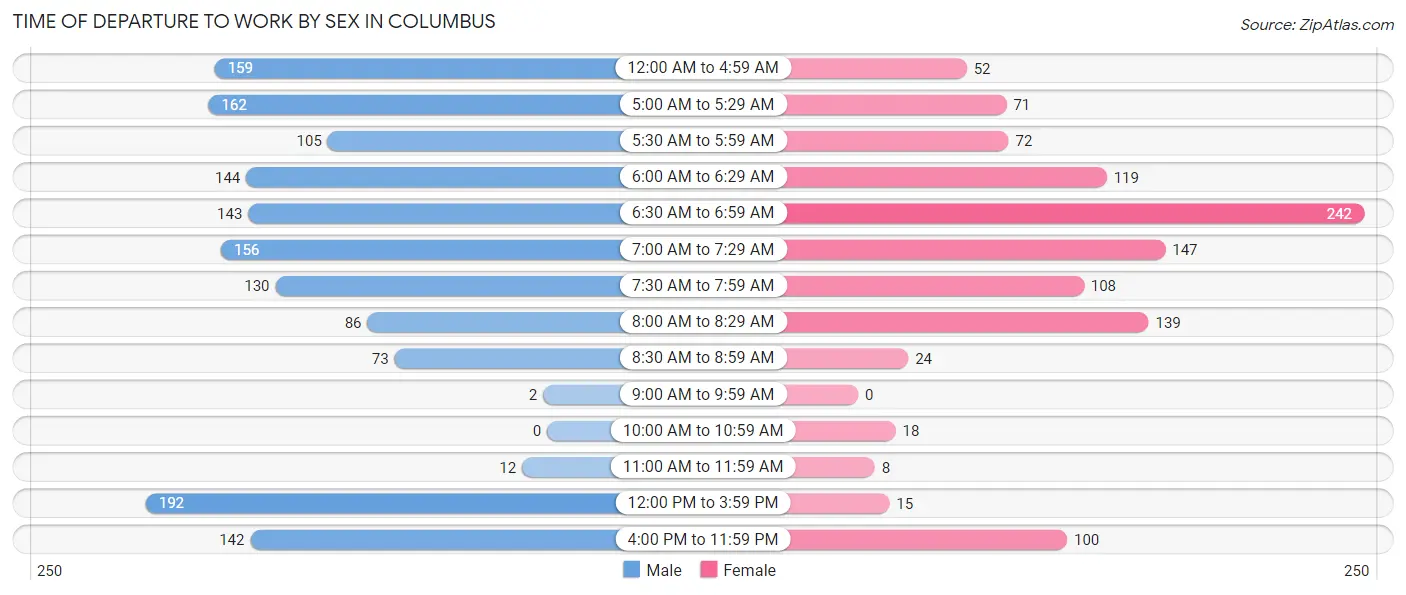
| Time of Departure | Male | Female |
| 12:00 AM to 4:59 AM | 159 (10.6%) | 52 (4.7%) |
| 5:00 AM to 5:29 AM | 162 (10.8%) | 71 (6.4%) |
| 5:30 AM to 5:59 AM | 105 (7.0%) | 72 (6.5%) |
| 6:00 AM to 6:29 AM | 144 (9.6%) | 119 (10.7%) |
| 6:30 AM to 6:59 AM | 143 (9.5%) | 242 (21.7%) |
| 7:00 AM to 7:29 AM | 156 (10.4%) | 147 (13.2%) |
| 7:30 AM to 7:59 AM | 130 (8.6%) | 108 (9.7%) |
| 8:00 AM to 8:29 AM | 86 (5.7%) | 139 (12.5%) |
| 8:30 AM to 8:59 AM | 73 (4.9%) | 24 (2.1%) |
| 9:00 AM to 9:59 AM | 2 (0.1%) | 0 (0.0%) |
| 10:00 AM to 10:59 AM | 0 (0.0%) | 18 (1.6%) |
| 11:00 AM to 11:59 AM | 12 (0.8%) | 8 (0.7%) |
| 12:00 PM to 3:59 PM | 192 (12.8%) | 15 (1.3%) |
| 4:00 PM to 11:59 PM | 142 (9.4%) | 100 (9.0%) |
| Total | 1,506 (100.0%) | 1,115 (100.0%) |
Housing Occupancy in Columbus
Occupancy by Ownership in Columbus
Of the total 2,467 dwellings in Columbus, owner-occupied units account for 1,530 (62.0%), while renter-occupied units make up 937 (38.0%).
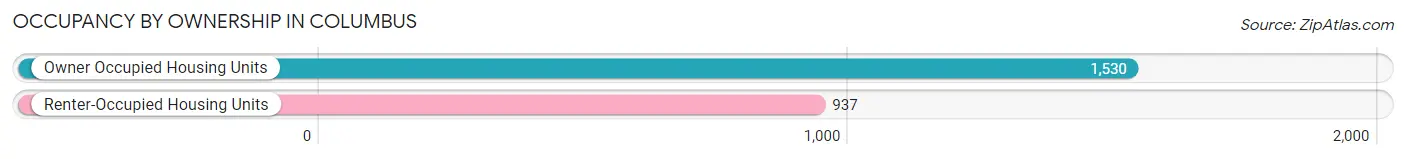
| Occupancy | # Housing Units | % Housing Units |
| Owner Occupied Housing Units | 1,530 | 62.0% |
| Renter-Occupied Housing Units | 937 | 38.0% |
| Total Occupied Housing Units | 2,467 | 100.0% |
Occupancy by Household Size in Columbus
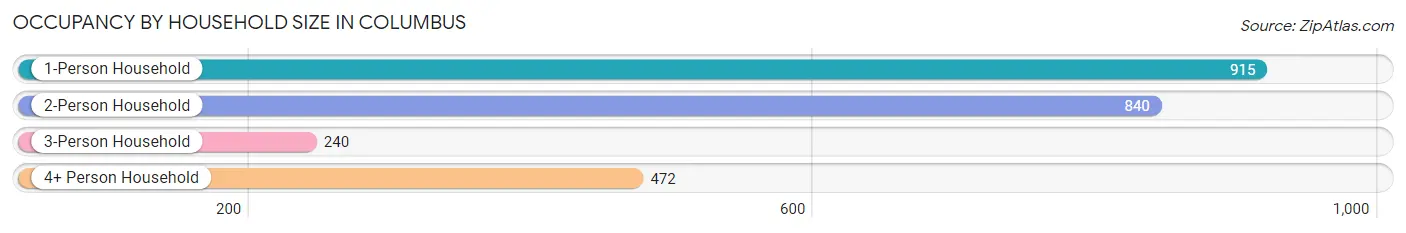
| Household Size | # Housing Units | % Housing Units |
| 1-Person Household | 915 | 37.1% |
| 2-Person Household | 840 | 34.1% |
| 3-Person Household | 240 | 9.7% |
| 4+ Person Household | 472 | 19.1% |
| Total Housing Units | 2,467 | 100.0% |
Occupancy by Ownership by Household Size in Columbus
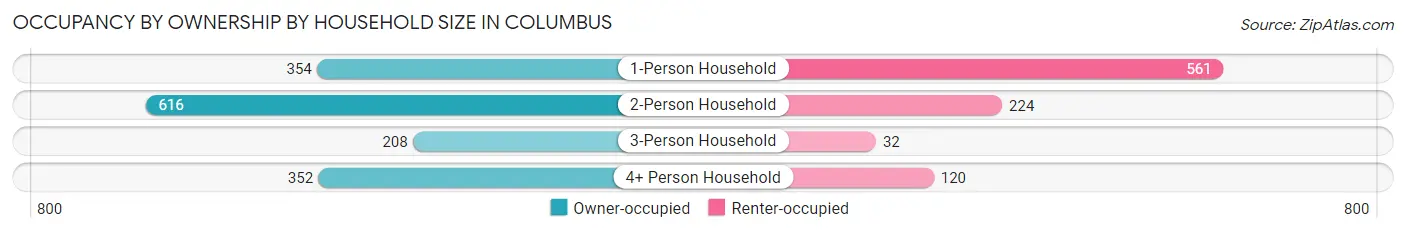
| Household Size | Owner-occupied | Renter-occupied |
| 1-Person Household | 354 (38.7%) | 561 (61.3%) |
| 2-Person Household | 616 (73.3%) | 224 (26.7%) |
| 3-Person Household | 208 (86.7%) | 32 (13.3%) |
| 4+ Person Household | 352 (74.6%) | 120 (25.4%) |
| Total Housing Units | 1,530 (62.0%) | 937 (38.0%) |
Occupancy by Educational Attainment in Columbus
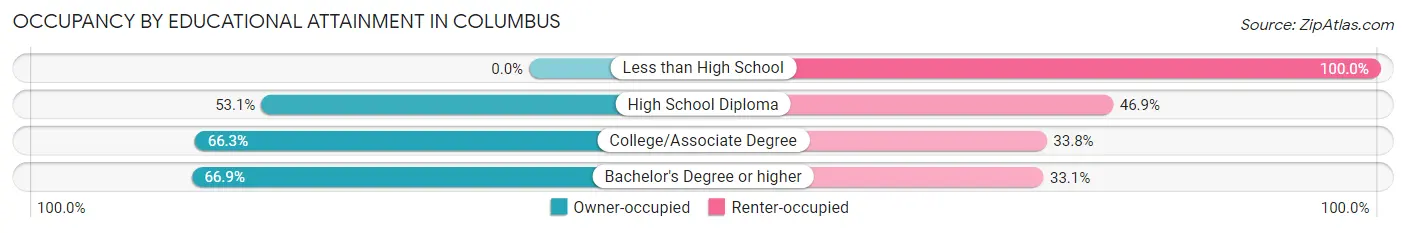
| Household Size | Owner-occupied | Renter-occupied |
| Less than High School | 0 (0.0%) | 53 (100.0%) |
| High School Diploma | 301 (53.1%) | 266 (46.9%) |
| College/Associate Degree | 683 (66.2%) | 348 (33.8%) |
| Bachelor's Degree or higher | 546 (66.9%) | 270 (33.1%) |
Occupancy by Age of Householder in Columbus
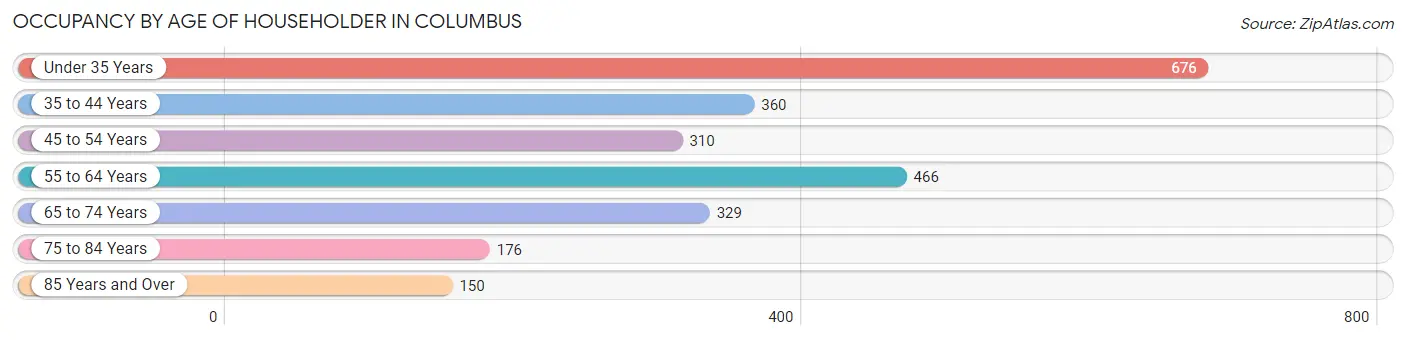
| Age Bracket | # Households | % Households |
| Under 35 Years | 676 | 27.4% |
| 35 to 44 Years | 360 | 14.6% |
| 45 to 54 Years | 310 | 12.6% |
| 55 to 64 Years | 466 | 18.9% |
| 65 to 74 Years | 329 | 13.3% |
| 75 to 84 Years | 176 | 7.1% |
| 85 Years and Over | 150 | 6.1% |
| Total | 2,467 | 100.0% |
Housing Finances in Columbus
Median Income by Occupancy in Columbus
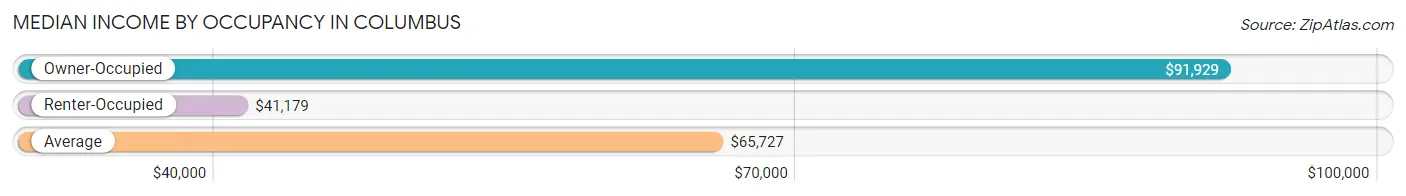
| Occupancy Type | # Households | Median Income |
| Owner-Occupied | 1,530 (62.0%) | $91,929 |
| Renter-Occupied | 937 (38.0%) | $41,179 |
| Average | 2,467 (100.0%) | $65,727 |
Occupancy by Householder Income Bracket in Columbus
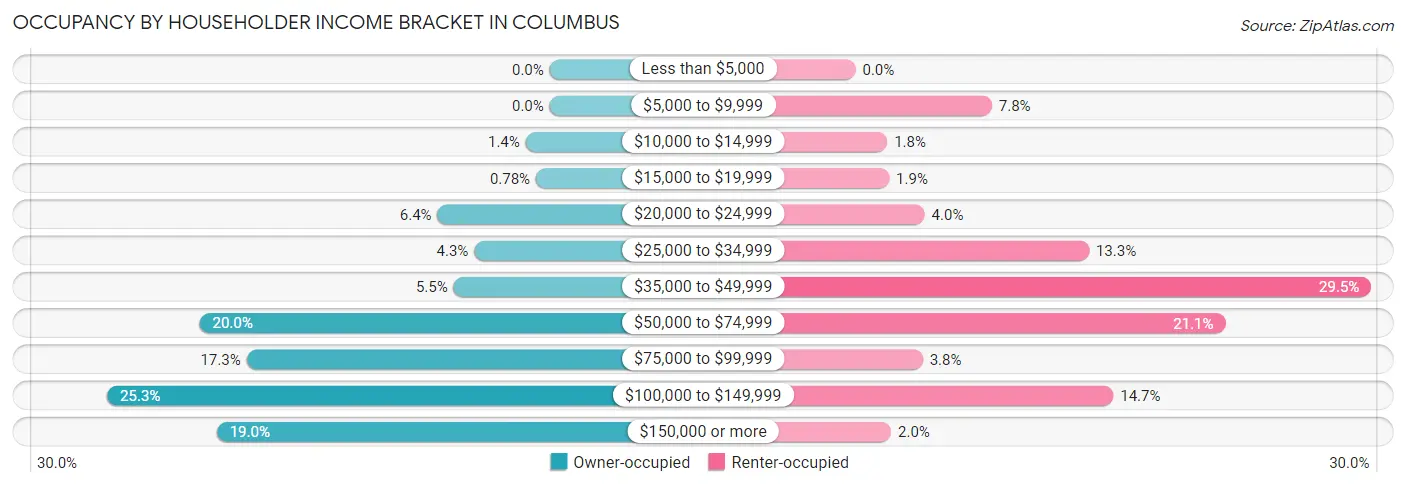
| Income Bracket | Owner-occupied | Renter-occupied |
| Less than $5,000 | 0 (0.0%) | 0 (0.0%) |
| $5,000 to $9,999 | 0 (0.0%) | 73 (7.8%) |
| $10,000 to $14,999 | 21 (1.4%) | 17 (1.8%) |
| $15,000 to $19,999 | 12 (0.8%) | 18 (1.9%) |
| $20,000 to $24,999 | 98 (6.4%) | 37 (4.0%) |
| $25,000 to $34,999 | 66 (4.3%) | 125 (13.3%) |
| $35,000 to $49,999 | 84 (5.5%) | 276 (29.5%) |
| $50,000 to $74,999 | 306 (20.0%) | 198 (21.1%) |
| $75,000 to $99,999 | 265 (17.3%) | 36 (3.8%) |
| $100,000 to $149,999 | 387 (25.3%) | 138 (14.7%) |
| $150,000 or more | 291 (19.0%) | 19 (2.0%) |
| Total | 1,530 (100.0%) | 937 (100.0%) |
Monthly Housing Cost Tiers in Columbus
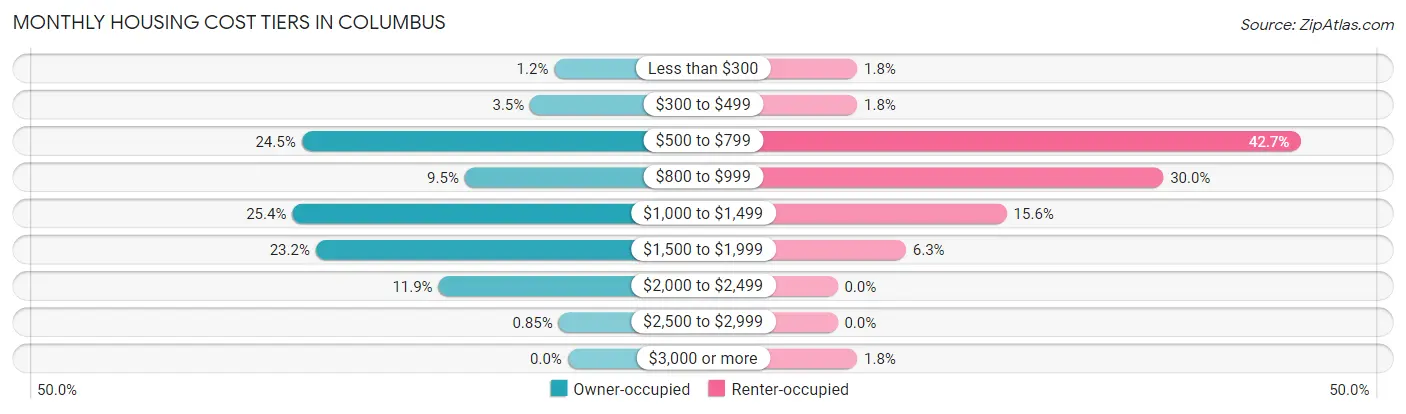
| Monthly Cost | Owner-occupied | Renter-occupied |
| Less than $300 | 19 (1.2%) | 17 (1.8%) |
| $300 to $499 | 53 (3.5%) | 17 (1.8%) |
| $500 to $799 | 375 (24.5%) | 400 (42.7%) |
| $800 to $999 | 145 (9.5%) | 281 (30.0%) |
| $1,000 to $1,499 | 388 (25.4%) | 146 (15.6%) |
| $1,500 to $1,999 | 355 (23.2%) | 59 (6.3%) |
| $2,000 to $2,499 | 182 (11.9%) | 0 (0.0%) |
| $2,500 to $2,999 | 13 (0.9%) | 0 (0.0%) |
| $3,000 or more | 0 (0.0%) | 17 (1.8%) |
| Total | 1,530 (100.0%) | 937 (100.0%) |
Physical Housing Characteristics in Columbus
Housing Structures in Columbus
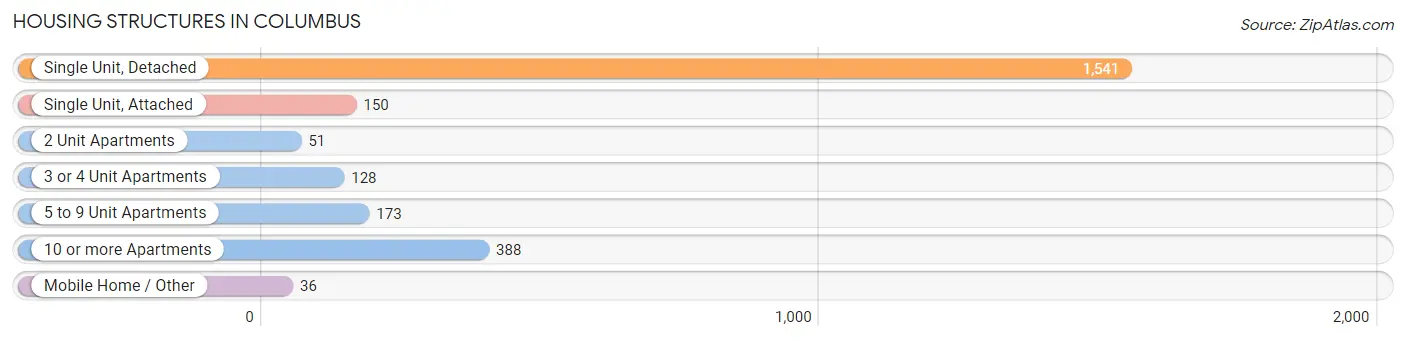
| Structure Type | # Housing Units | % Housing Units |
| Single Unit, Detached | 1,541 | 62.5% |
| Single Unit, Attached | 150 | 6.1% |
| 2 Unit Apartments | 51 | 2.1% |
| 3 or 4 Unit Apartments | 128 | 5.2% |
| 5 to 9 Unit Apartments | 173 | 7.0% |
| 10 or more Apartments | 388 | 15.7% |
| Mobile Home / Other | 36 | 1.5% |
| Total | 2,467 | 100.0% |
Housing Structures by Occupancy in Columbus
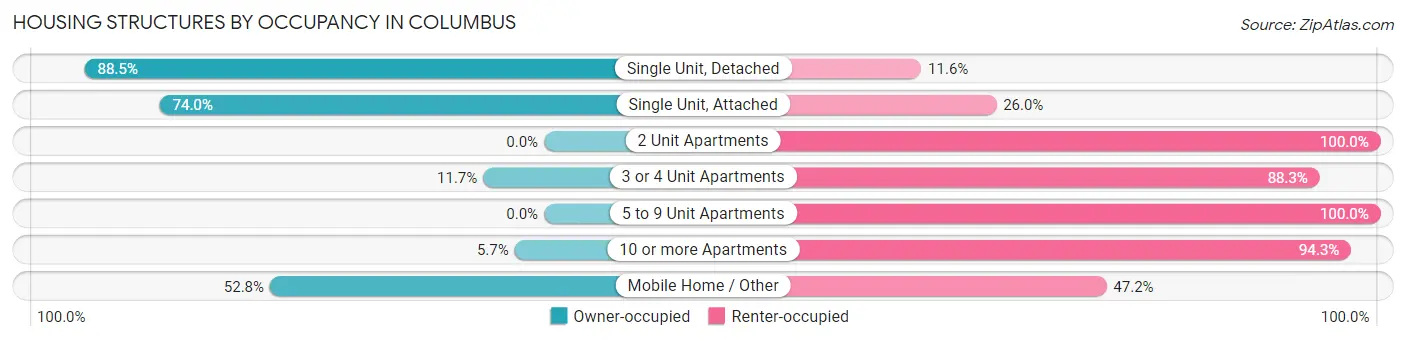
| Structure Type | Owner-occupied | Renter-occupied |
| Single Unit, Detached | 1,363 (88.4%) | 178 (11.6%) |
| Single Unit, Attached | 111 (74.0%) | 39 (26.0%) |
| 2 Unit Apartments | 0 (0.0%) | 51 (100.0%) |
| 3 or 4 Unit Apartments | 15 (11.7%) | 113 (88.3%) |
| 5 to 9 Unit Apartments | 0 (0.0%) | 173 (100.0%) |
| 10 or more Apartments | 22 (5.7%) | 366 (94.3%) |
| Mobile Home / Other | 19 (52.8%) | 17 (47.2%) |
| Total | 1,530 (62.0%) | 937 (38.0%) |
Housing Structures by Number of Rooms in Columbus
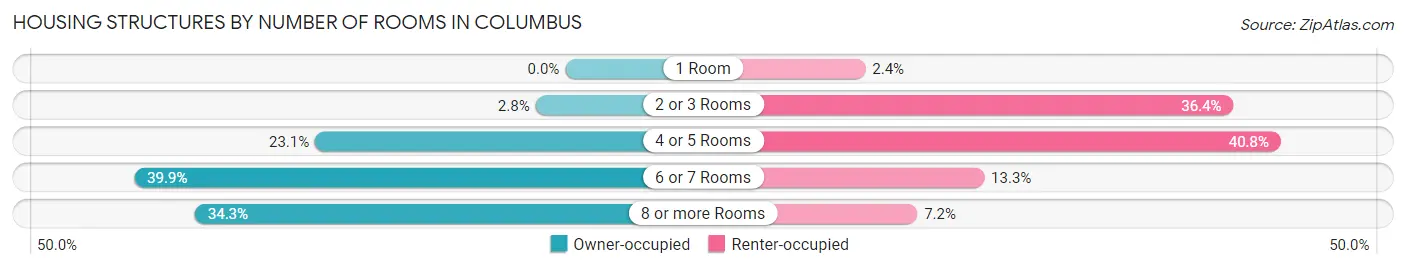
| Number of Rooms | Owner-occupied | Renter-occupied |
| 1 Room | 0 (0.0%) | 22 (2.4%) |
| 2 or 3 Rooms | 42 (2.8%) | 341 (36.4%) |
| 4 or 5 Rooms | 354 (23.1%) | 382 (40.8%) |
| 6 or 7 Rooms | 610 (39.9%) | 125 (13.3%) |
| 8 or more Rooms | 524 (34.3%) | 67 (7.1%) |
| Total | 1,530 (100.0%) | 937 (100.0%) |
Housing Structure by Heating Type in Columbus
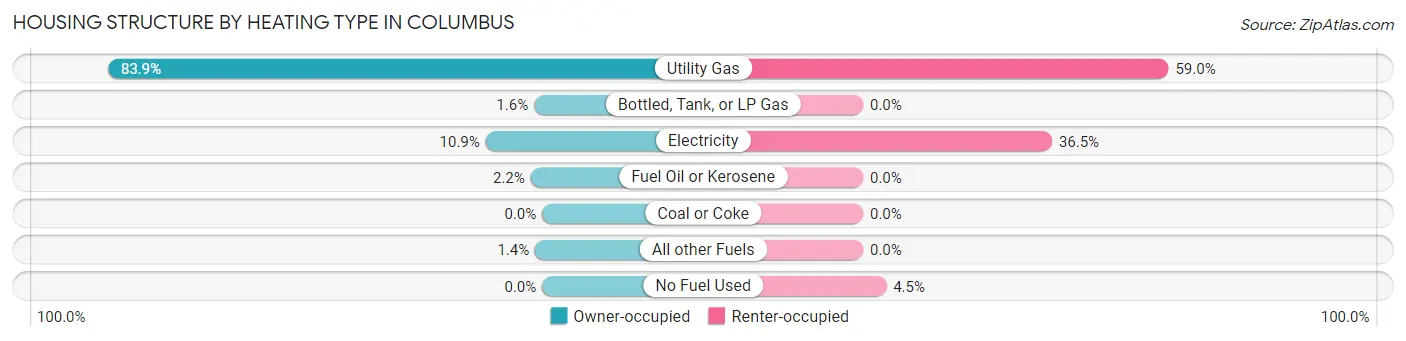
| Heating Type | Owner-occupied | Renter-occupied |
| Utility Gas | 1,284 (83.9%) | 553 (59.0%) |
| Bottled, Tank, or LP Gas | 24 (1.6%) | 0 (0.0%) |
| Electricity | 167 (10.9%) | 342 (36.5%) |
| Fuel Oil or Kerosene | 34 (2.2%) | 0 (0.0%) |
| Coal or Coke | 0 (0.0%) | 0 (0.0%) |
| All other Fuels | 21 (1.4%) | 0 (0.0%) |
| No Fuel Used | 0 (0.0%) | 42 (4.5%) |
| Total | 1,530 (100.0%) | 937 (100.0%) |
Household Vehicle Usage in Columbus
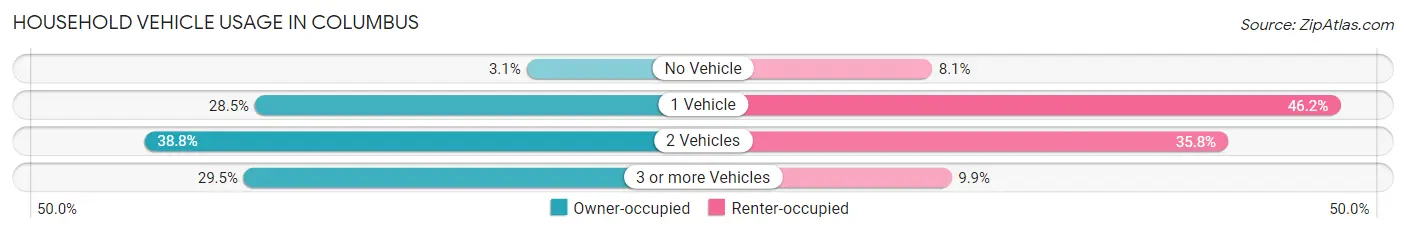
| Vehicles per Household | Owner-occupied | Renter-occupied |
| No Vehicle | 48 (3.1%) | 76 (8.1%) |
| 1 Vehicle | 436 (28.5%) | 433 (46.2%) |
| 2 Vehicles | 594 (38.8%) | 335 (35.7%) |
| 3 or more Vehicles | 452 (29.5%) | 93 (9.9%) |
| Total | 1,530 (100.0%) | 937 (100.0%) |
Real Estate & Mortgages in Columbus
Real Estate and Mortgage Overview in Columbus
| Characteristic | Without Mortgage | With Mortgage |
| Housing Units | 501 | 1,029 |
| Median Property Value | $215,400 | $208,000 |
| Median Household Income | $86,063 | $210 |
| Monthly Housing Costs | $646 | $0 |
| Real Estate Taxes | $4,401 | $13 |
Property Value by Mortgage Status in Columbus
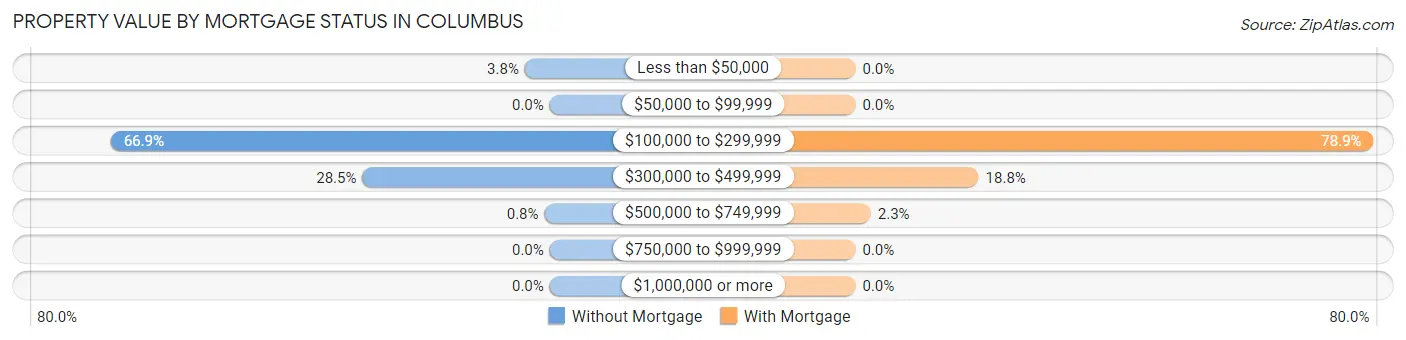
| Property Value | Without Mortgage | With Mortgage |
| Less than $50,000 | 19 (3.8%) | 0 (0.0%) |
| $50,000 to $99,999 | 0 (0.0%) | 0 (0.0%) |
| $100,000 to $299,999 | 335 (66.9%) | 812 (78.9%) |
| $300,000 to $499,999 | 143 (28.5%) | 193 (18.8%) |
| $500,000 to $749,999 | 4 (0.8%) | 24 (2.3%) |
| $750,000 to $999,999 | 0 (0.0%) | 0 (0.0%) |
| $1,000,000 or more | 0 (0.0%) | 0 (0.0%) |
| Total | 501 (100.0%) | 1,029 (100.0%) |
Household Income by Mortgage Status in Columbus
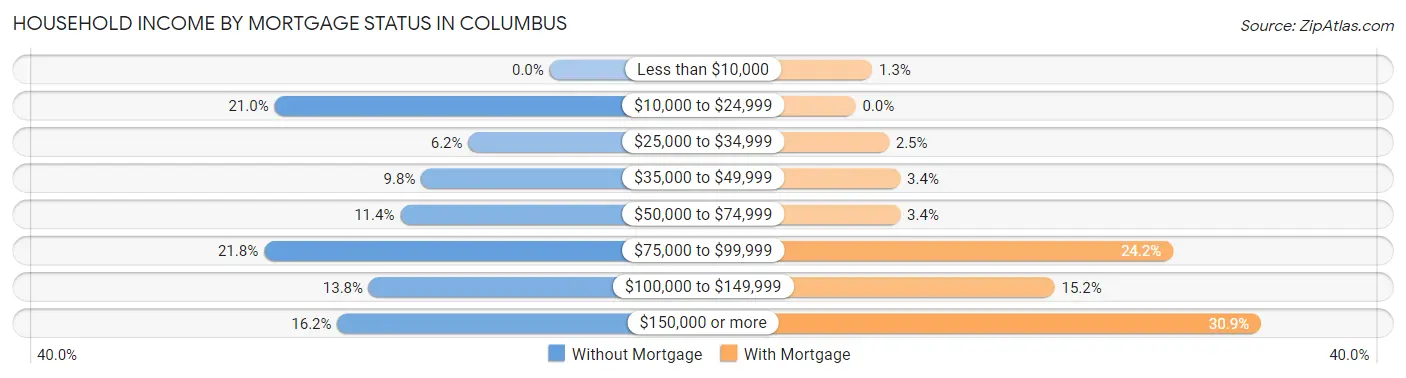
| Household Income | Without Mortgage | With Mortgage |
| Less than $10,000 | 0 (0.0%) | 13 (1.3%) |
| $10,000 to $24,999 | 105 (21.0%) | 0 (0.0%) |
| $25,000 to $34,999 | 31 (6.2%) | 26 (2.5%) |
| $35,000 to $49,999 | 49 (9.8%) | 35 (3.4%) |
| $50,000 to $74,999 | 57 (11.4%) | 35 (3.4%) |
| $75,000 to $99,999 | 109 (21.8%) | 249 (24.2%) |
| $100,000 to $149,999 | 69 (13.8%) | 156 (15.2%) |
| $150,000 or more | 81 (16.2%) | 318 (30.9%) |
| Total | 501 (100.0%) | 1,029 (100.0%) |
Property Value to Household Income Ratio in Columbus
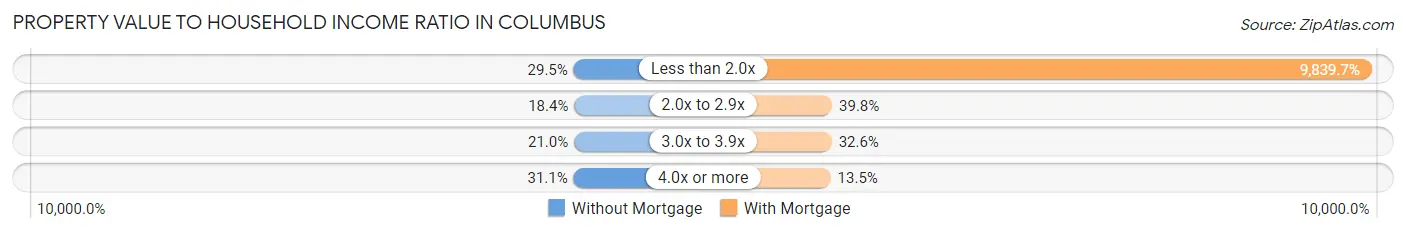
| Value-to-Income Ratio | Without Mortgage | With Mortgage |
| Less than 2.0x | 148 (29.5%) | 101,250 (9,839.7%) |
| 2.0x to 2.9x | 92 (18.4%) | 409 (39.8%) |
| 3.0x to 3.9x | 105 (21.0%) | 335 (32.6%) |
| 4.0x or more | 156 (31.1%) | 139 (13.5%) |
| Total | 501 (100.0%) | 1,029 (100.0%) |
Real Estate Taxes by Mortgage Status in Columbus
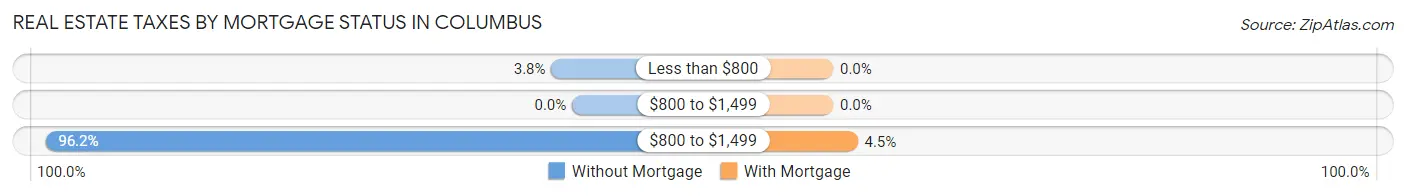
| Property Taxes | Without Mortgage | With Mortgage |
| Less than $800 | 19 (3.8%) | 0 (0.0%) |
| $800 to $1,499 | 0 (0.0%) | 0 (0.0%) |
| $800 to $1,499 | 482 (96.2%) | 46 (4.5%) |
| Total | 501 (100.0%) | 1,029 (100.0%) |
Health & Disability in Columbus
Health Insurance Coverage by Age in Columbus
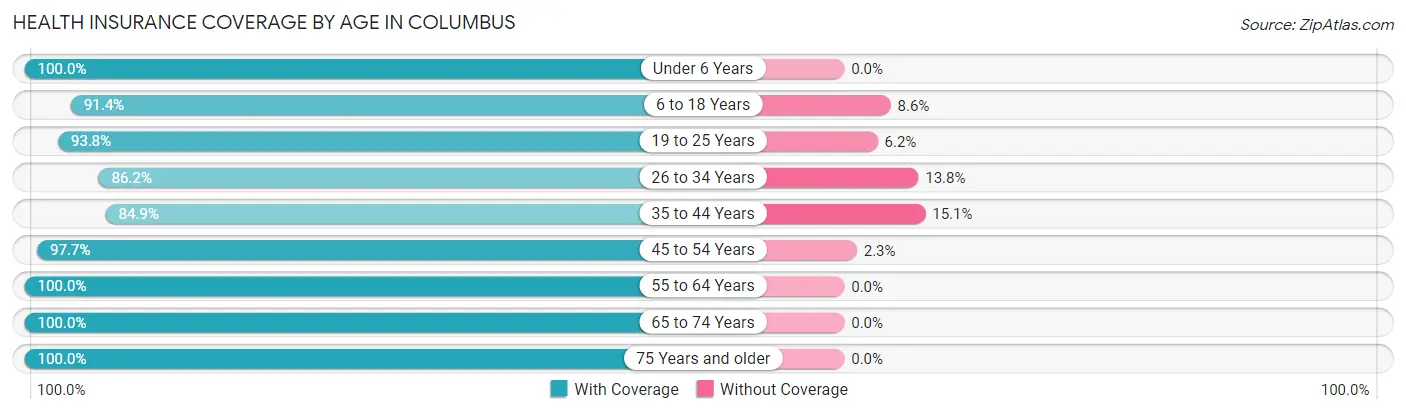
| Age Bracket | With Coverage | Without Coverage |
| Under 6 Years | 308 (100.0%) | 0 (0.0%) |
| 6 to 18 Years | 835 (91.4%) | 79 (8.6%) |
| 19 to 25 Years | 423 (93.8%) | 28 (6.2%) |
| 26 to 34 Years | 768 (86.2%) | 123 (13.8%) |
| 35 to 44 Years | 545 (84.9%) | 97 (15.1%) |
| 45 to 54 Years | 588 (97.7%) | 14 (2.3%) |
| 55 to 64 Years | 769 (100.0%) | 0 (0.0%) |
| 65 to 74 Years | 473 (100.0%) | 0 (0.0%) |
| 75 Years and older | 383 (100.0%) | 0 (0.0%) |
| Total | 5,092 (93.7%) | 341 (6.3%) |
Health Insurance Coverage by Citizenship Status in Columbus
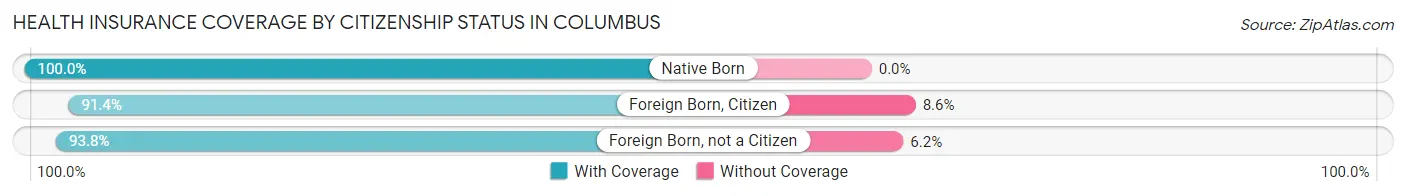
| Citizenship Status | With Coverage | Without Coverage |
| Native Born | 308 (100.0%) | 0 (0.0%) |
| Foreign Born, Citizen | 835 (91.4%) | 79 (8.6%) |
| Foreign Born, not a Citizen | 423 (93.8%) | 28 (6.2%) |
Health Insurance Coverage by Household Income in Columbus
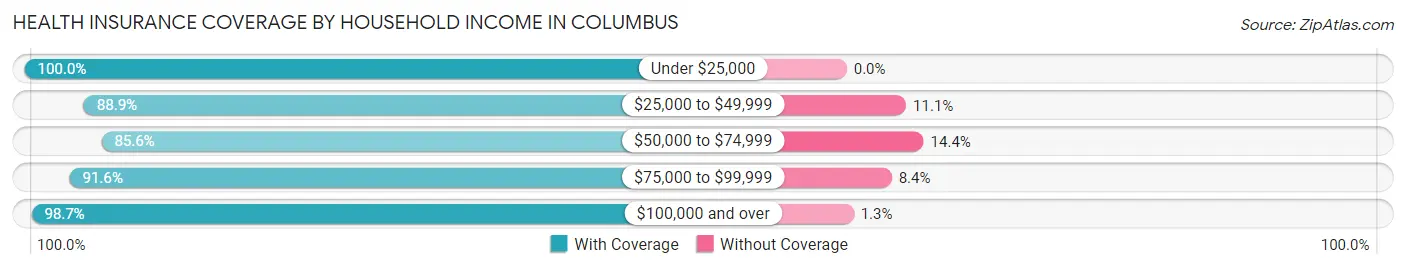
| Household Income | With Coverage | Without Coverage |
| Under $25,000 | 276 (100.0%) | 0 (0.0%) |
| $25,000 to $49,999 | 855 (88.9%) | 107 (11.1%) |
| $50,000 to $74,999 | 767 (85.6%) | 129 (14.4%) |
| $75,000 to $99,999 | 805 (91.6%) | 74 (8.4%) |
| $100,000 and over | 2,366 (98.7%) | 31 (1.3%) |
Public vs Private Health Insurance Coverage by Age in Columbus
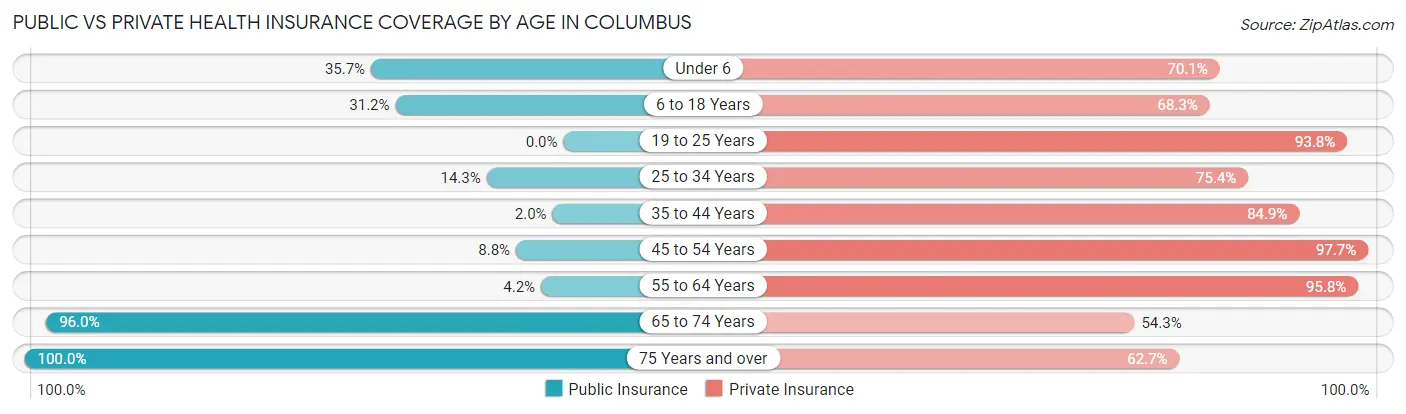
| Age Bracket | Public Insurance | Private Insurance |
| Under 6 | 110 (35.7%) | 216 (70.1%) |
| 6 to 18 Years | 285 (31.2%) | 624 (68.3%) |
| 19 to 25 Years | 0 (0.0%) | 423 (93.8%) |
| 25 to 34 Years | 127 (14.2%) | 672 (75.4%) |
| 35 to 44 Years | 13 (2.0%) | 545 (84.9%) |
| 45 to 54 Years | 53 (8.8%) | 588 (97.7%) |
| 55 to 64 Years | 32 (4.2%) | 737 (95.8%) |
| 65 to 74 Years | 454 (96.0%) | 257 (54.3%) |
| 75 Years and over | 383 (100.0%) | 240 (62.7%) |
| Total | 1,457 (26.8%) | 4,302 (79.2%) |
Disability Status by Sex by Age in Columbus
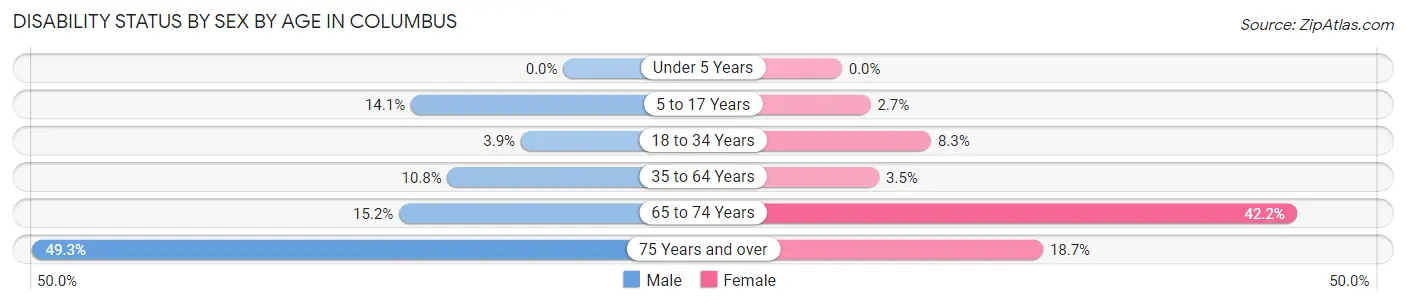
| Age Bracket | Male | Female |
| Under 5 Years | 0 (0.0%) | 0 (0.0%) |
| 5 to 17 Years | 71 (14.1%) | 13 (2.7%) |
| 18 to 34 Years | 21 (3.9%) | 67 (8.3%) |
| 35 to 64 Years | 120 (10.7%) | 31 (3.5%) |
| 65 to 74 Years | 32 (15.2%) | 111 (42.2%) |
| 75 Years and over | 33 (49.2%) | 59 (18.7%) |
Disability Class by Sex by Age in Columbus
Disability Class: Hearing Difficulty
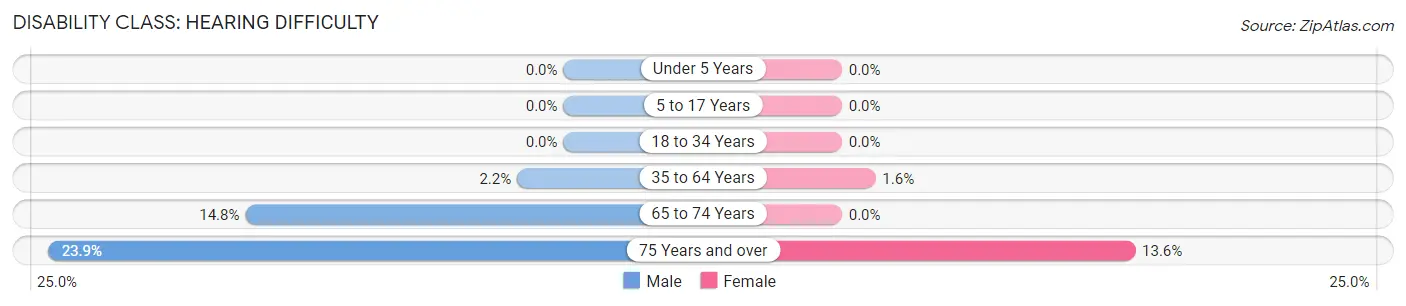
| Age Bracket | Male | Female |
| Under 5 Years | 0 (0.0%) | 0 (0.0%) |
| 5 to 17 Years | 0 (0.0%) | 0 (0.0%) |
| 18 to 34 Years | 0 (0.0%) | 0 (0.0%) |
| 35 to 64 Years | 24 (2.1%) | 14 (1.6%) |
| 65 to 74 Years | 31 (14.8%) | 0 (0.0%) |
| 75 Years and over | 16 (23.9%) | 43 (13.6%) |
Disability Class: Vision Difficulty
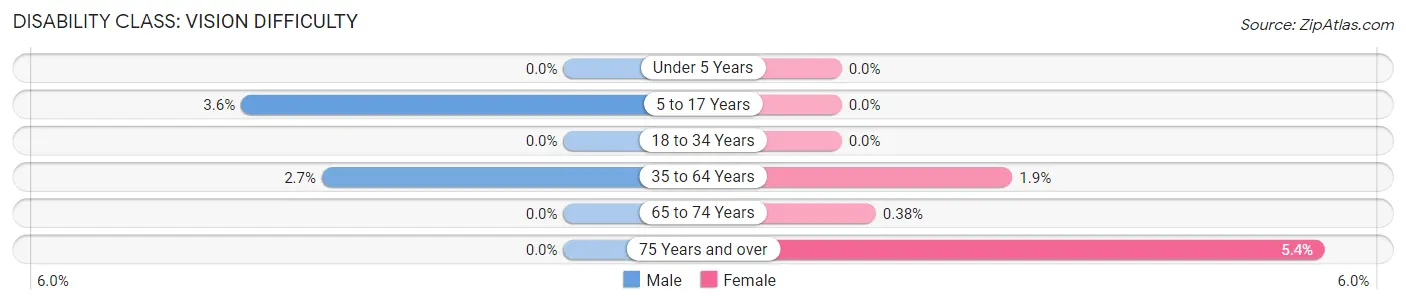
| Age Bracket | Male | Female |
| Under 5 Years | 0 (0.0%) | 0 (0.0%) |
| 5 to 17 Years | 18 (3.6%) | 0 (0.0%) |
| 18 to 34 Years | 0 (0.0%) | 0 (0.0%) |
| 35 to 64 Years | 30 (2.7%) | 17 (1.9%) |
| 65 to 74 Years | 0 (0.0%) | 1 (0.4%) |
| 75 Years and over | 0 (0.0%) | 17 (5.4%) |
Disability Class: Cognitive Difficulty
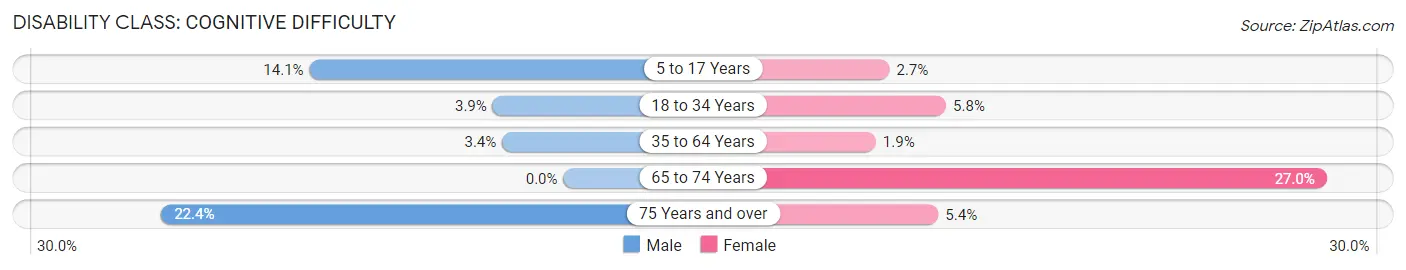
| Age Bracket | Male | Female |
| 5 to 17 Years | 71 (14.1%) | 13 (2.7%) |
| 18 to 34 Years | 21 (3.9%) | 47 (5.8%) |
| 35 to 64 Years | 38 (3.4%) | 17 (1.9%) |
| 65 to 74 Years | 0 (0.0%) | 71 (27.0%) |
| 75 Years and over | 15 (22.4%) | 17 (5.4%) |
Disability Class: Ambulatory Difficulty
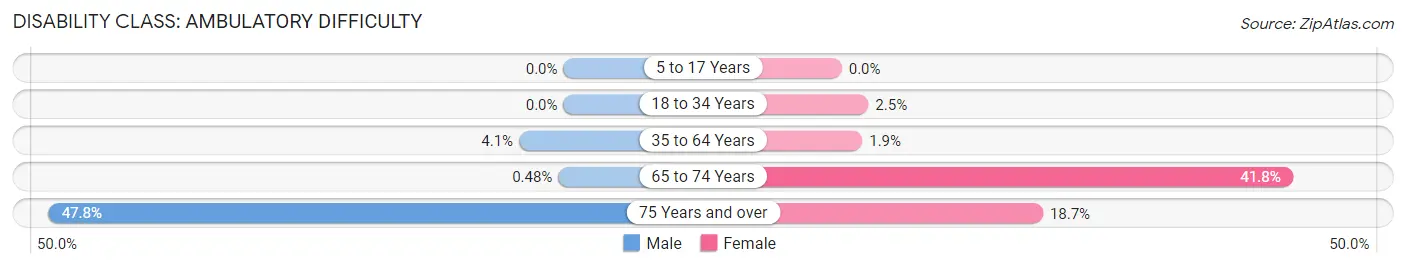
| Age Bracket | Male | Female |
| 5 to 17 Years | 0 (0.0%) | 0 (0.0%) |
| 18 to 34 Years | 0 (0.0%) | 20 (2.5%) |
| 35 to 64 Years | 46 (4.1%) | 17 (1.9%) |
| 65 to 74 Years | 1 (0.5%) | 110 (41.8%) |
| 75 Years and over | 32 (47.8%) | 59 (18.7%) |
Disability Class: Self-Care Difficulty
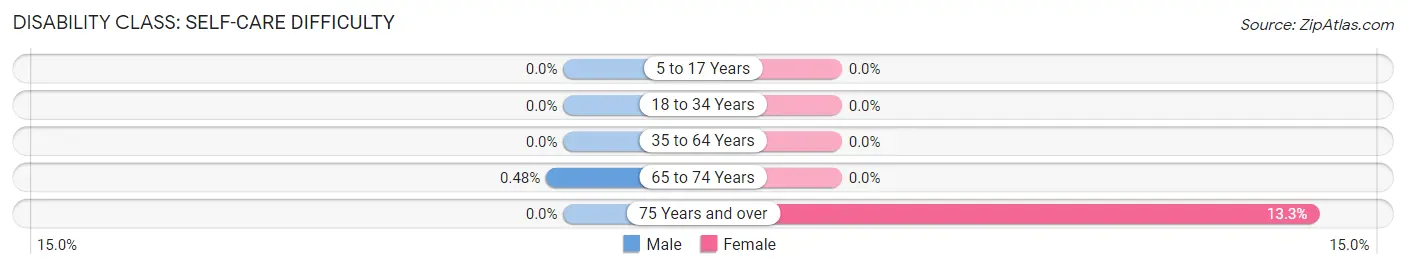
| Age Bracket | Male | Female |
| 5 to 17 Years | 0 (0.0%) | 0 (0.0%) |
| 18 to 34 Years | 0 (0.0%) | 0 (0.0%) |
| 35 to 64 Years | 0 (0.0%) | 0 (0.0%) |
| 65 to 74 Years | 1 (0.5%) | 0 (0.0%) |
| 75 Years and over | 0 (0.0%) | 42 (13.3%) |
Technology Access in Columbus
Computing Device Access in Columbus
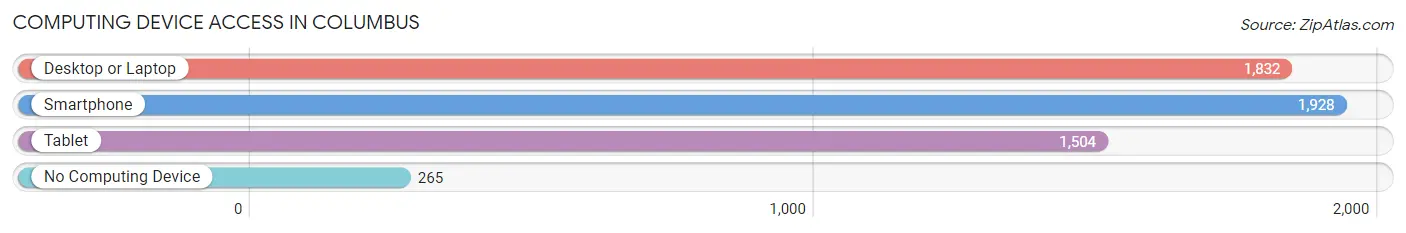
| Device Type | # Households | % Households |
| Desktop or Laptop | 1,832 | 74.3% |
| Smartphone | 1,928 | 78.1% |
| Tablet | 1,504 | 61.0% |
| No Computing Device | 265 | 10.7% |
| Total | 2,467 | 100.0% |
Internet Access in Columbus
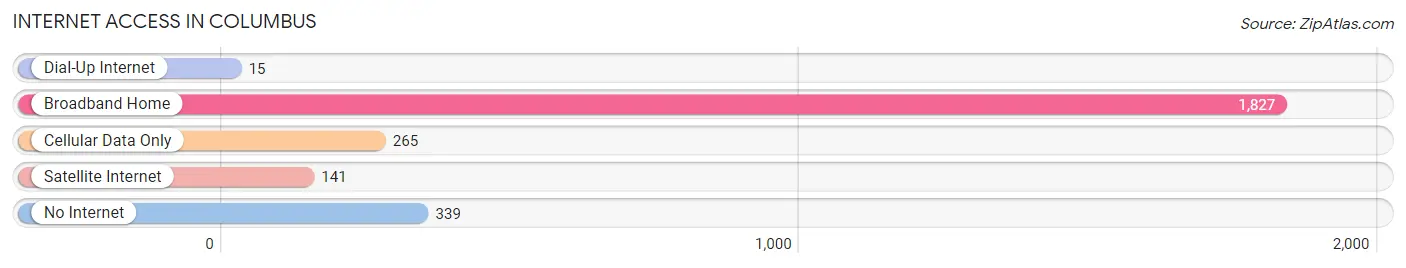
| Internet Type | # Households | % Households |
| Dial-Up Internet | 15 | 0.6% |
| Broadband Home | 1,827 | 74.1% |
| Cellular Data Only | 265 | 10.7% |
| Satellite Internet | 141 | 5.7% |
| No Internet | 339 | 13.7% |
| Total | 2,467 | 100.0% |
Columbus Summary
Columbus, Wisconsin is a small city located in Columbia County, Wisconsin. It is situated on the Crawfish River, about 25 miles northeast of Madison. The city has a population of 4,945 people, according to the 2010 census.
History
The area that is now Columbus was first settled in 1845 by a group of settlers from New York. The city was originally named Crawfish, after the river that runs through it. In 1851, the name was changed to Columbus, after Christopher Columbus. The city was incorporated in 1854.
In the late 19th century, Columbus was a major center for the lumber industry. The city was home to several sawmills and lumber yards. The city also had a thriving brick-making industry.
Geography
Columbus is located in Columbia County, Wisconsin. It is situated on the Crawfish River, about 25 miles northeast of Madison. The city has a total area of 4.2 square miles, all of which is land.
The city is located in the Central Plain region of Wisconsin. The terrain is mostly flat, with some rolling hills. The climate is humid continental, with cold winters and hot, humid summers.
Economy
The economy of Columbus is largely based on agriculture and manufacturing. The city is home to several large farms, as well as several food processing plants. The city is also home to several manufacturing companies, including a paper mill and a plastics factory.
The city is also home to several retail stores, restaurants, and other businesses. The city is served by the Columbus Municipal Airport, which provides general aviation services.
Demographics
According to the 2010 census, the population of Columbus was 4,945 people. The racial makeup of the city was 95.3% White, 0.7% African American, 0.3% Native American, 0.7% Asian, 0.1% Pacific Islander, 1.2% from other races, and 1.7% from two or more races. Hispanic or Latino of any race were 3.2% of the population.
The median household income in Columbus was $45,945, and the median family income was $54,945. The per capita income was $21,945. About 8.3% of families and 10.2% of the population were below the poverty line, including 14.2% of those under age 18 and 6.2% of those age 65 or over.
The city is served by the Columbus School District, which includes two elementary schools, one middle school, and one high school. The city is also home to several private schools, including a Catholic school and a Lutheran school.
Common Questions
What is Per Capita Income in Columbus?
Per Capita income in Columbus is $39,917.
What is the Median Family Income in Columbus?
Median Family Income in Columbus is $94,282.
What is the Median Household income in Columbus?
Median Household Income in Columbus is $65,727.
What is Income or Wage Gap in Columbus?
Income or Wage Gap in Columbus is 35.9%.
Women in Columbus earn 64.1 cents for every dollar earned by a man.
What is Inequality or Gini Index in Columbus?
Inequality or Gini Index in Columbus is 0.38.
What is the Total Population of Columbus?
Total Population of Columbus is 5,481.
What is the Total Male Population of Columbus?
Total Male Population of Columbus is 2,530.
What is the Total Female Population of Columbus?
Total Female Population of Columbus is 2,951.
What is the Ratio of Males per 100 Females in Columbus?
There are 85.73 Males per 100 Females in Columbus.
What is the Ratio of Females per 100 Males in Columbus?
There are 116.64 Females per 100 Males in Columbus.
What is the Median Population Age in Columbus?
Median Population Age in Columbus is 38.3 Years.
What is the Average Family Size in Columbus
Average Family Size in Columbus is 2.8 People.
What is the Average Household Size in Columbus
Average Household Size in Columbus is 2.2 People.
How Large is the Labor Force in Columbus?
There are 3,299 People in the Labor Forcein in Columbus.
What is the Percentage of People in the Labor Force in Columbus?
74.4% of People are in the Labor Force in Columbus.
What is the Unemployment Rate in Columbus?
Unemployment Rate in Columbus is 2.1%.