Colby, WI Map & Demographics
Colby Map
Colby Overview
$24,334
PER CAPITA INCOME
$58,971
AVG FAMILY INCOME
$51,176
AVG HOUSEHOLD INCOME
42.3%
WAGE / INCOME GAP [ % ]
57.7¢/ $1
WAGE / INCOME GAP [ $ ]
0.41
INEQUALITY / GINI INDEX
2,132
TOTAL POPULATION
1,099
MALE POPULATION
1,033
FEMALE POPULATION
106.39
MALES / 100 FEMALES
93.99
FEMALES / 100 MALES
38.2
MEDIAN AGE
3.1
AVG FAMILY SIZE
2.7
AVG HOUSEHOLD SIZE
981
LABOR FORCE [ PEOPLE ]
58.9%
PERCENT IN LABOR FORCE
3.9%
UNEMPLOYMENT RATE
Colby Zip Codes
Colby Area Codes
Income in Colby
Income Overview in Colby
Per Capita Income in Colby is $24,334, while median incomes of families and households are $58,971 and $51,176 respectively.
| Characteristic | Number | Measure |
| Per Capita Income | 2,132 | $24,334 |
| Median Family Income | 472 | $58,971 |
| Mean Family Income | 472 | $77,032 |
| Median Household Income | 738 | $51,176 |
| Mean Household Income | 738 | $64,917 |
| Income Deficit | 472 | $0 |
| Wage / Income Gap (%) | 2,132 | 42.28% |
| Wage / Income Gap ($) | 2,132 | 57.72¢ per $1 |
| Gini / Inequality Index | 2,132 | 0.41 |
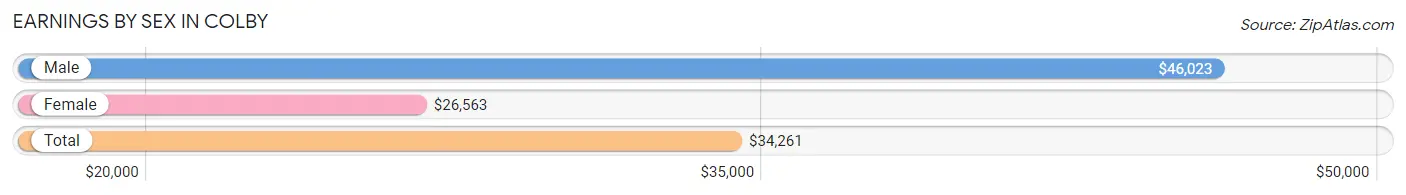
Earnings by Sex in Colby
Average Earnings in Colby are $34,261, $46,023 for men and $26,563 for women, a difference of 42.3%.
| Sex | Number | Average Earnings |
| Male | 534 (51.4%) | $46,023 |
| Female | 505 (48.6%) | $26,563 |
| Total | 1,039 (100.0%) | $34,261 |
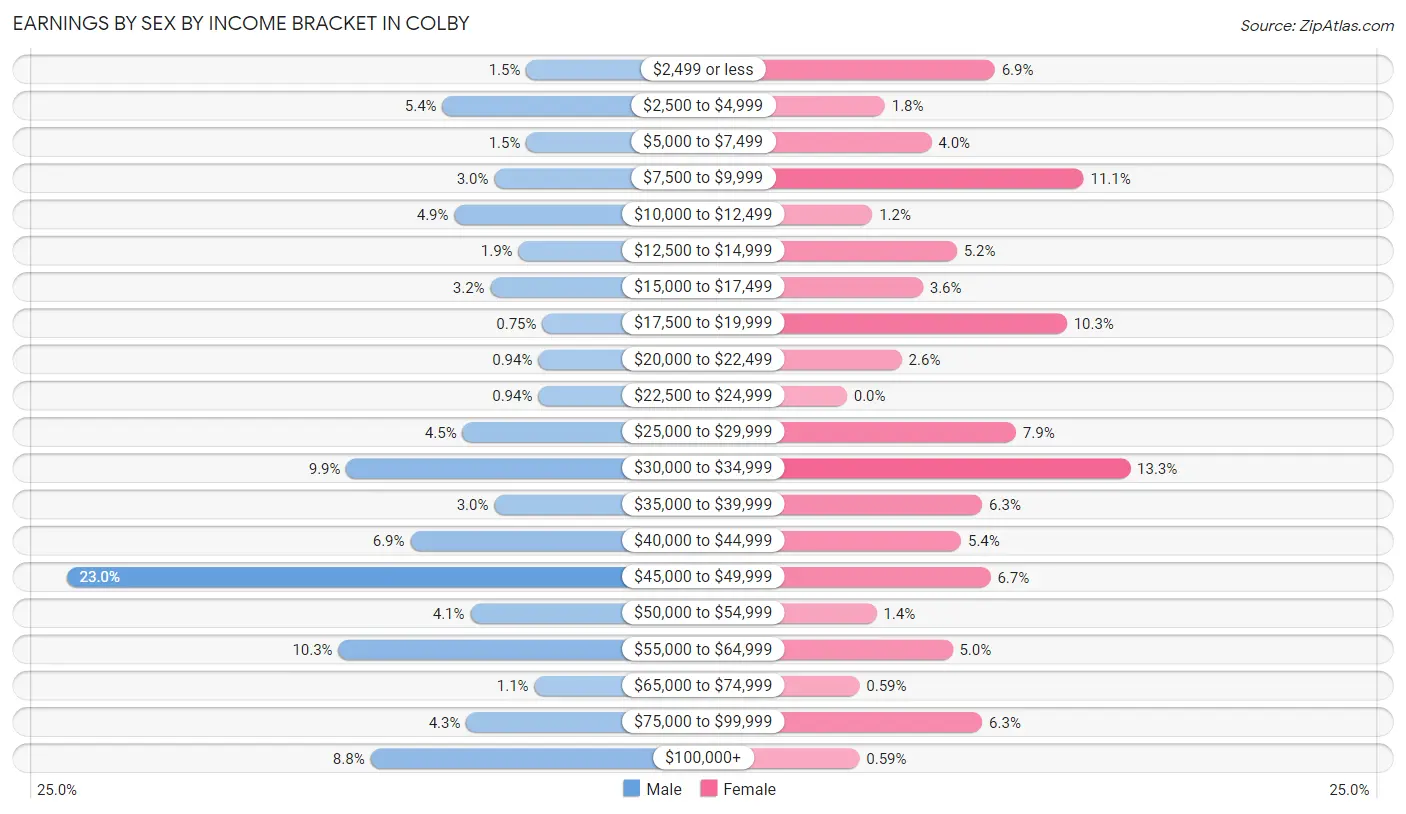
Earnings by Sex by Income Bracket in Colby
The most common earnings brackets in Colby are $45,000 to $49,999 for men (123 | 23.0%) and $30,000 to $34,999 for women (67 | 13.3%).
| Income | Male | Female |
| $2,499 or less | 8 (1.5%) | 35 (6.9%) |
| $2,500 to $4,999 | 29 (5.4%) | 9 (1.8%) |
| $5,000 to $7,499 | 8 (1.5%) | 20 (4.0%) |
| $7,500 to $9,999 | 16 (3.0%) | 56 (11.1%) |
| $10,000 to $12,499 | 26 (4.9%) | 6 (1.2%) |
| $12,500 to $14,999 | 10 (1.9%) | 26 (5.1%) |
| $15,000 to $17,499 | 17 (3.2%) | 18 (3.6%) |
| $17,500 to $19,999 | 4 (0.7%) | 52 (10.3%) |
| $20,000 to $22,499 | 5 (0.9%) | 13 (2.6%) |
| $22,500 to $24,999 | 5 (0.9%) | 0 (0.0%) |
| $25,000 to $29,999 | 24 (4.5%) | 40 (7.9%) |
| $30,000 to $34,999 | 53 (9.9%) | 67 (13.3%) |
| $35,000 to $39,999 | 16 (3.0%) | 32 (6.3%) |
| $40,000 to $44,999 | 37 (6.9%) | 27 (5.3%) |
| $45,000 to $49,999 | 123 (23.0%) | 34 (6.7%) |
| $50,000 to $54,999 | 22 (4.1%) | 7 (1.4%) |
| $55,000 to $64,999 | 55 (10.3%) | 25 (5.0%) |
| $65,000 to $74,999 | 6 (1.1%) | 3 (0.6%) |
| $75,000 to $99,999 | 23 (4.3%) | 32 (6.3%) |
| $100,000+ | 47 (8.8%) | 3 (0.6%) |
| Total | 534 (100.0%) | 505 (100.0%) |
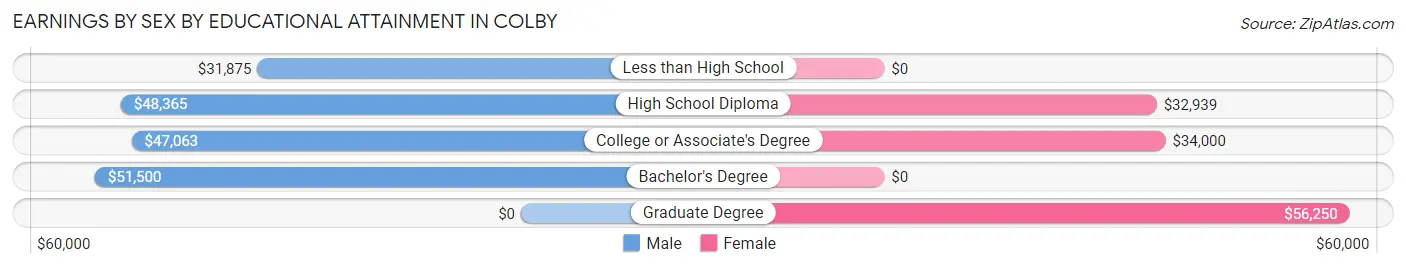
Earnings by Sex by Educational Attainment in Colby
Average earnings in Colby are $48,193 for men and $32,571 for women, a difference of 32.4%. Men with an educational attainment of bachelor's degree enjoy the highest average annual earnings of $51,500, while those with less than high school education earn the least with $31,875. Women with an educational attainment of graduate degree earn the most with the average annual earnings of $56,250, while those with high school diploma education have the smallest earnings of $32,939.
| Educational Attainment | Male Income | Female Income |
| Less than High School | $31,875 | $0 |
| High School Diploma | $48,365 | $32,939 |
| College or Associate's Degree | $47,063 | $34,000 |
| Bachelor's Degree | $51,500 | $0 |
| Graduate Degree | - | - |
| Total | $48,193 | $32,571 |
Family Income in Colby
Family Income Brackets in Colby
According to the Colby family income data, there are 80 families falling into the $35,000 to $49,999 income range, which is the most common income bracket and makes up 17.0% of all families.
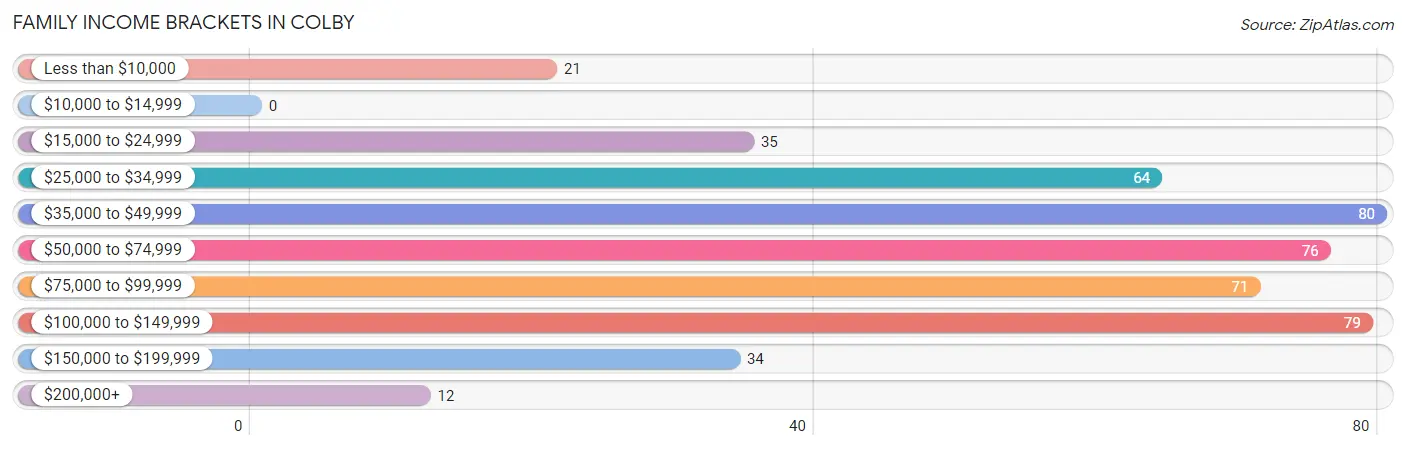
| Income Bracket | # Families | % Families |
| Less than $10,000 | 21 | 4.4% |
| $10,000 to $14,999 | 0 | 0.0% |
| $15,000 to $24,999 | 35 | 7.4% |
| $25,000 to $34,999 | 64 | 13.6% |
| $35,000 to $49,999 | 80 | 16.9% |
| $50,000 to $74,999 | 76 | 16.1% |
| $75,000 to $99,999 | 71 | 15.0% |
| $100,000 to $149,999 | 79 | 16.7% |
| $150,000 to $199,999 | 34 | 7.2% |
| $200,000+ | 12 | 2.5% |
Family Income by Famaliy Size in Colby
4-person families (95 | 20.1%) account for the highest median family income in Colby with $69,196 per family, while 2-person families (190 | 40.3%) have the highest median income of $27,916 per family member.
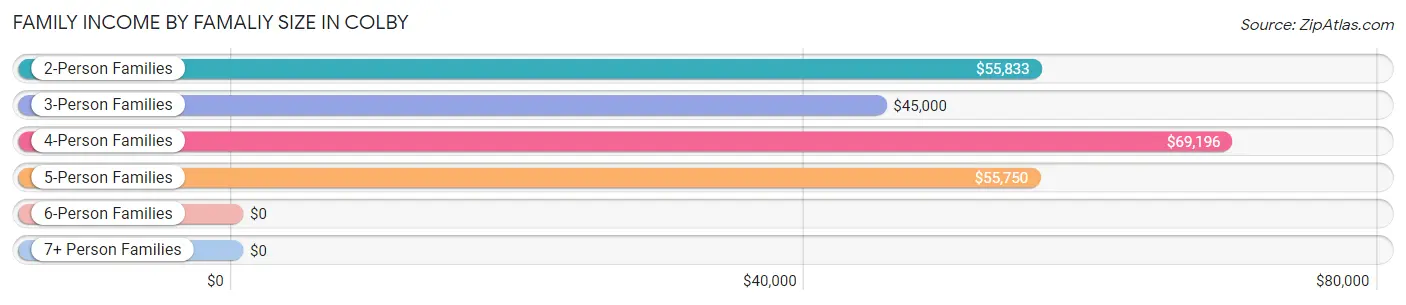
| Income Bracket | # Families | Median Income |
| 2-Person Families | 190 (40.3%) | $55,833 |
| 3-Person Families | 140 (29.7%) | $45,000 |
| 4-Person Families | 95 (20.1%) | $69,196 |
| 5-Person Families | 27 (5.7%) | $55,750 |
| 6-Person Families | 17 (3.6%) | $0 |
| 7+ Person Families | 3 (0.6%) | $0 |
| Total | 472 (100.0%) | $58,971 |
Family Income by Number of Earners in Colby
The median family income in Colby is $58,971, with families comprising 3+ earners (56) having the highest median family income of $133,750, while families with no earners (42) have the lowest median family income of $46,000, accounting for 11.9% and 8.9% of families, respectively.
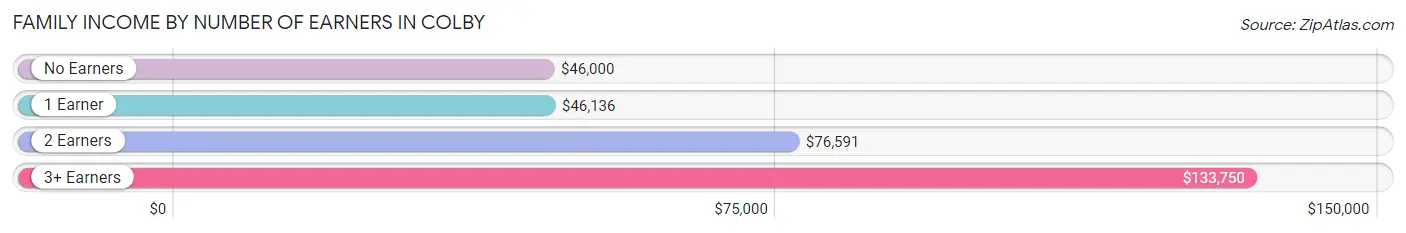
| Number of Earners | # Families | Median Income |
| No Earners | 42 (8.9%) | $46,000 |
| 1 Earner | 220 (46.6%) | $46,136 |
| 2 Earners | 154 (32.6%) | $76,591 |
| 3+ Earners | 56 (11.9%) | $133,750 |
| Total | 472 (100.0%) | $58,971 |
Household Income in Colby
Household Income Brackets in Colby
With 141 households falling in the category, the $50,000 to $74,999 income range is the most frequent in Colby, accounting for 19.1% of all households. In contrast, only 12 households (1.6%) fall into the $200,000+ income bracket, making it the least populous group.
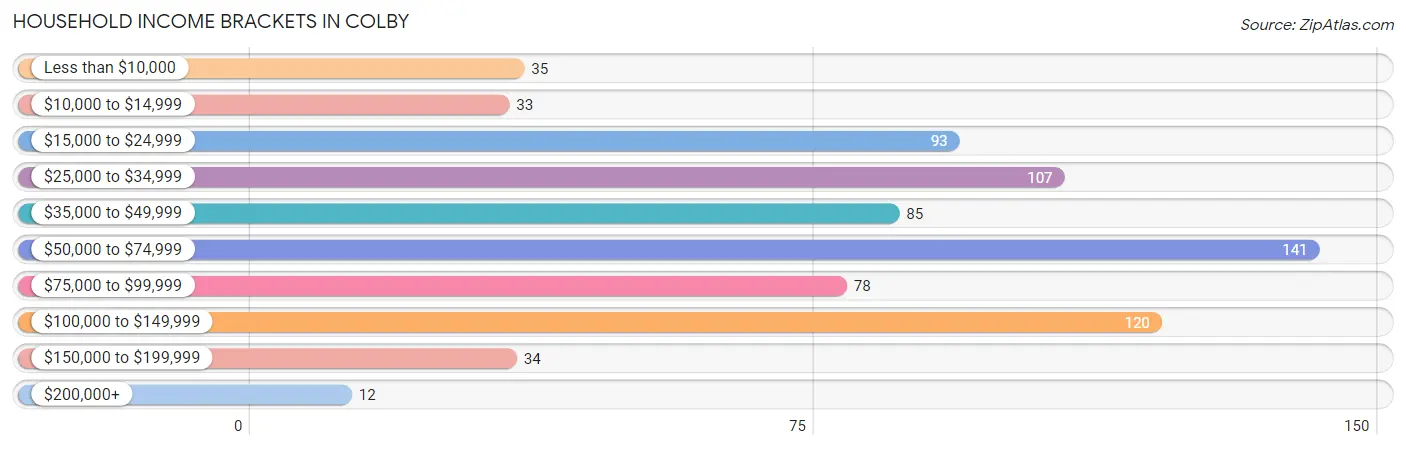
| Income Bracket | # Households | % Households |
| Less than $10,000 | 35 | 4.7% |
| $10,000 to $14,999 | 33 | 4.5% |
| $15,000 to $24,999 | 93 | 12.6% |
| $25,000 to $34,999 | 107 | 14.5% |
| $35,000 to $49,999 | 85 | 11.5% |
| $50,000 to $74,999 | 141 | 19.1% |
| $75,000 to $99,999 | 78 | 10.6% |
| $100,000 to $149,999 | 120 | 16.3% |
| $150,000 to $199,999 | 34 | 4.6% |
| $200,000+ | 12 | 1.6% |
Household Income by Householder Age in Colby
The median household income in Colby is $51,176, with the highest median household income of $57,721 found in the 25 to 44 years age bracket for the primary householder. A total of 293 households (39.7%) fall into this category. Meanwhile, the 65+ years age bracket for the primary householder has the lowest median household income of $30,000, with 232 households (31.4%) in this group.
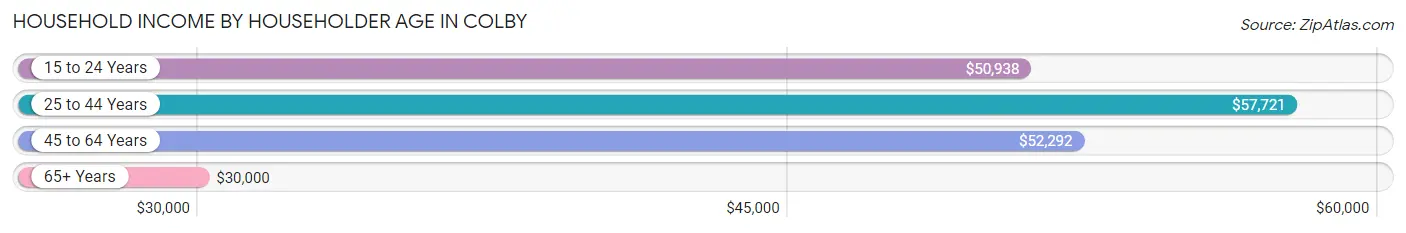
| Income Bracket | # Households | Median Income |
| 15 to 24 Years | 16 (2.2%) | $50,938 |
| 25 to 44 Years | 293 (39.7%) | $57,721 |
| 45 to 64 Years | 197 (26.7%) | $52,292 |
| 65+ Years | 232 (31.4%) | $30,000 |
| Total | 738 (100.0%) | $51,176 |
Poverty in Colby
Income Below Poverty by Sex and Age in Colby
With 13.7% poverty level for males and 19.9% for females among the residents of Colby, 12 to 14 year old males and 25 to 34 year old females are the most vulnerable to poverty, with 34 males (50.0%) and 108 females (72.5%) in their respective age groups living below the poverty level.
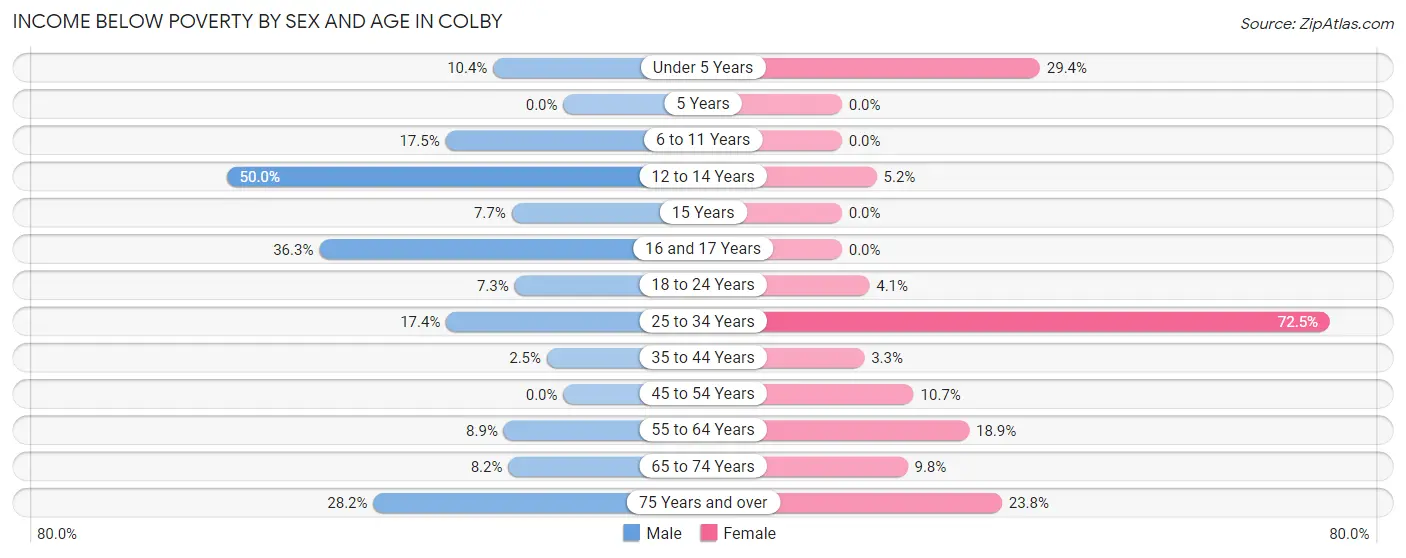
| Age Bracket | Male | Female |
| Under 5 Years | 10 (10.4%) | 10 (29.4%) |
| 5 Years | 0 (0.0%) | 0 (0.0%) |
| 6 to 11 Years | 14 (17.5%) | 0 (0.0%) |
| 12 to 14 Years | 34 (50.0%) | 3 (5.2%) |
| 15 Years | 2 (7.7%) | 0 (0.0%) |
| 16 and 17 Years | 29 (36.2%) | 0 (0.0%) |
| 18 to 24 Years | 5 (7.2%) | 4 (4.1%) |
| 25 to 34 Years | 12 (17.4%) | 108 (72.5%) |
| 35 to 44 Years | 5 (2.5%) | 5 (3.3%) |
| 45 to 54 Years | 0 (0.0%) | 8 (10.7%) |
| 55 to 64 Years | 10 (8.8%) | 17 (18.9%) |
| 65 to 74 Years | 9 (8.2%) | 12 (9.8%) |
| 75 Years and over | 11 (28.2%) | 24 (23.8%) |
| Total | 141 (13.7%) | 191 (19.9%) |
Income Above Poverty by Sex and Age in Colby
According to the poverty statistics in Colby, males aged 5 years and females aged 6 to 11 years are the age groups that are most secure financially, with 100.0% of males and 100.0% of females in these age groups living above the poverty line.
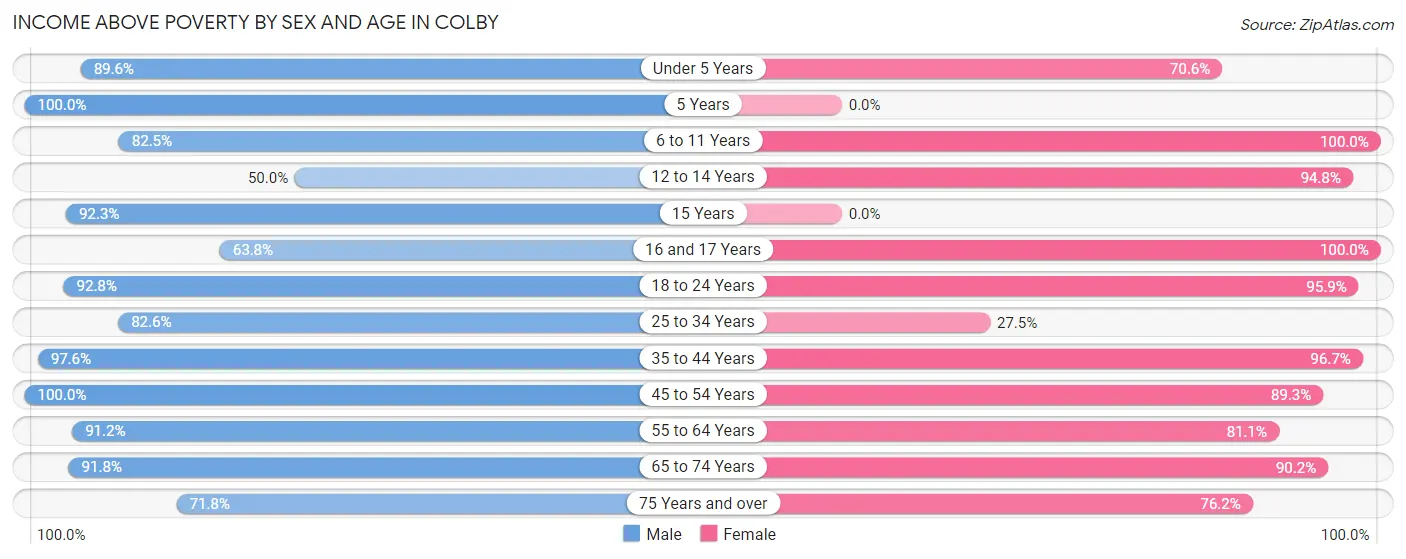
| Age Bracket | Male | Female |
| Under 5 Years | 86 (89.6%) | 24 (70.6%) |
| 5 Years | 12 (100.0%) | 0 (0.0%) |
| 6 to 11 Years | 66 (82.5%) | 46 (100.0%) |
| 12 to 14 Years | 34 (50.0%) | 55 (94.8%) |
| 15 Years | 24 (92.3%) | 0 (0.0%) |
| 16 and 17 Years | 51 (63.7%) | 36 (100.0%) |
| 18 to 24 Years | 64 (92.7%) | 94 (95.9%) |
| 25 to 34 Years | 57 (82.6%) | 41 (27.5%) |
| 35 to 44 Years | 199 (97.6%) | 145 (96.7%) |
| 45 to 54 Years | 62 (100.0%) | 67 (89.3%) |
| 55 to 64 Years | 103 (91.1%) | 73 (81.1%) |
| 65 to 74 Years | 101 (91.8%) | 111 (90.2%) |
| 75 Years and over | 28 (71.8%) | 77 (76.2%) |
| Total | 887 (86.3%) | 769 (80.1%) |
Income Below Poverty Among Married-Couple Families in Colby
The poverty statistics for married-couple families in Colby show that 2.4% or 6 of the total 254 families live below the poverty line. Families with 1 or 2 children have the highest poverty rate of 9.5%, comprising of 6 families. On the other hand, families with no children have the lowest poverty rate of 0.0%, which includes 0 families.
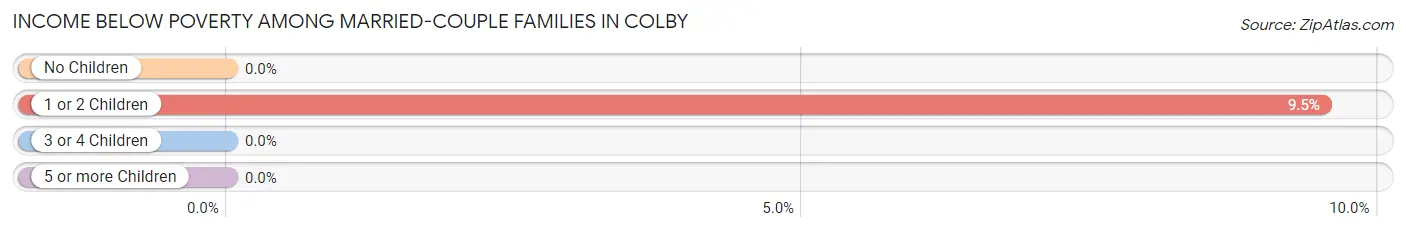
| Children | Above Poverty | Below Poverty |
| No Children | 165 (100.0%) | 0 (0.0%) |
| 1 or 2 Children | 57 (90.5%) | 6 (9.5%) |
| 3 or 4 Children | 23 (100.0%) | 0 (0.0%) |
| 5 or more Children | 3 (100.0%) | 0 (0.0%) |
| Total | 248 (97.6%) | 6 (2.4%) |
Income Below Poverty Among Single-Parent Households in Colby
According to the poverty data in Colby, 7.1% or 5 single-father households and 17.6% or 26 single-mother households are living below the poverty line. Among single-father households, those with 1 or 2 children have the highest poverty rate, with 5 households (10.2%) experiencing poverty. Likewise, among single-mother households, those with 3 or 4 children have the highest poverty rate, with 5 households (23.8%) falling below the poverty line.
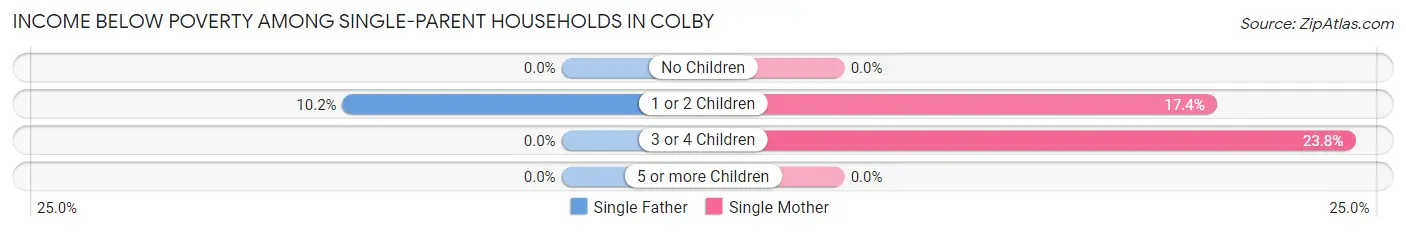
| Children | Single Father | Single Mother |
| No Children | 0 (0.0%) | 0 (0.0%) |
| 1 or 2 Children | 5 (10.2%) | 21 (17.4%) |
| 3 or 4 Children | 0 (0.0%) | 5 (23.8%) |
| 5 or more Children | 0 (0.0%) | 0 (0.0%) |
| Total | 5 (7.1%) | 26 (17.6%) |
Income Below Poverty Among Married-Couple vs Single-Parent Households in Colby
The poverty data for Colby shows that 6 of the married-couple family households (2.4%) and 31 of the single-parent households (14.2%) are living below the poverty level. Within the married-couple family households, those with 1 or 2 children have the highest poverty rate, with 6 households (9.5%) falling below the poverty line. Among the single-parent households, those with 3 or 4 children have the highest poverty rate, with 5 household (20.0%) living below poverty.
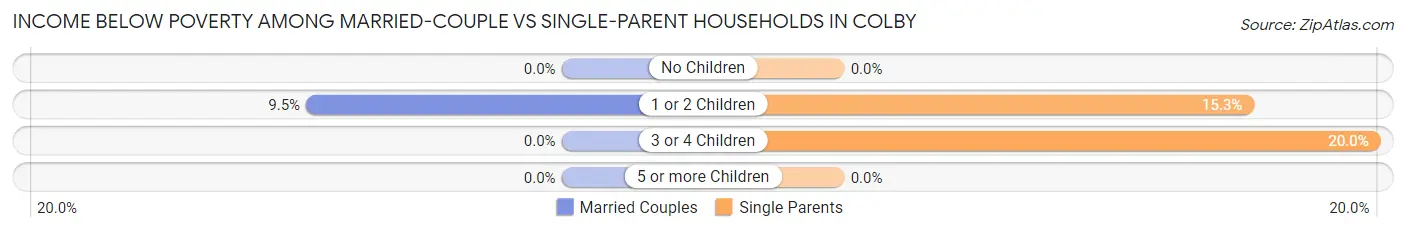
| Children | Married-Couple Families | Single-Parent Households |
| No Children | 0 (0.0%) | 0 (0.0%) |
| 1 or 2 Children | 6 (9.5%) | 26 (15.3%) |
| 3 or 4 Children | 0 (0.0%) | 5 (20.0%) |
| 5 or more Children | 0 (0.0%) | 0 (0.0%) |
| Total | 6 (2.4%) | 31 (14.2%) |
Race in Colby
The most populous races in Colby are White / Caucasian (1,770 | 83.0%), Hispanic or Latino (527 | 24.7%), and Two or more Races (228 | 10.7%).
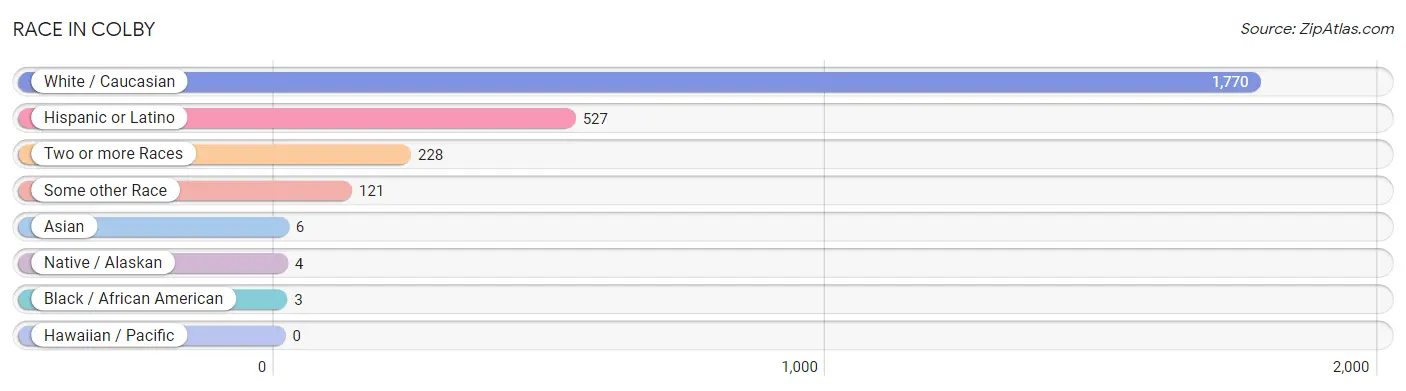
| Race | # Population | % Population |
| Asian | 6 | 0.3% |
| Black / African American | 3 | 0.1% |
| Hawaiian / Pacific | 0 | 0.0% |
| Hispanic or Latino | 527 | 24.7% |
| Native / Alaskan | 4 | 0.2% |
| White / Caucasian | 1,770 | 83.0% |
| Two or more Races | 228 | 10.7% |
| Some other Race | 121 | 5.7% |
| Total | 2,132 | 100.0% |
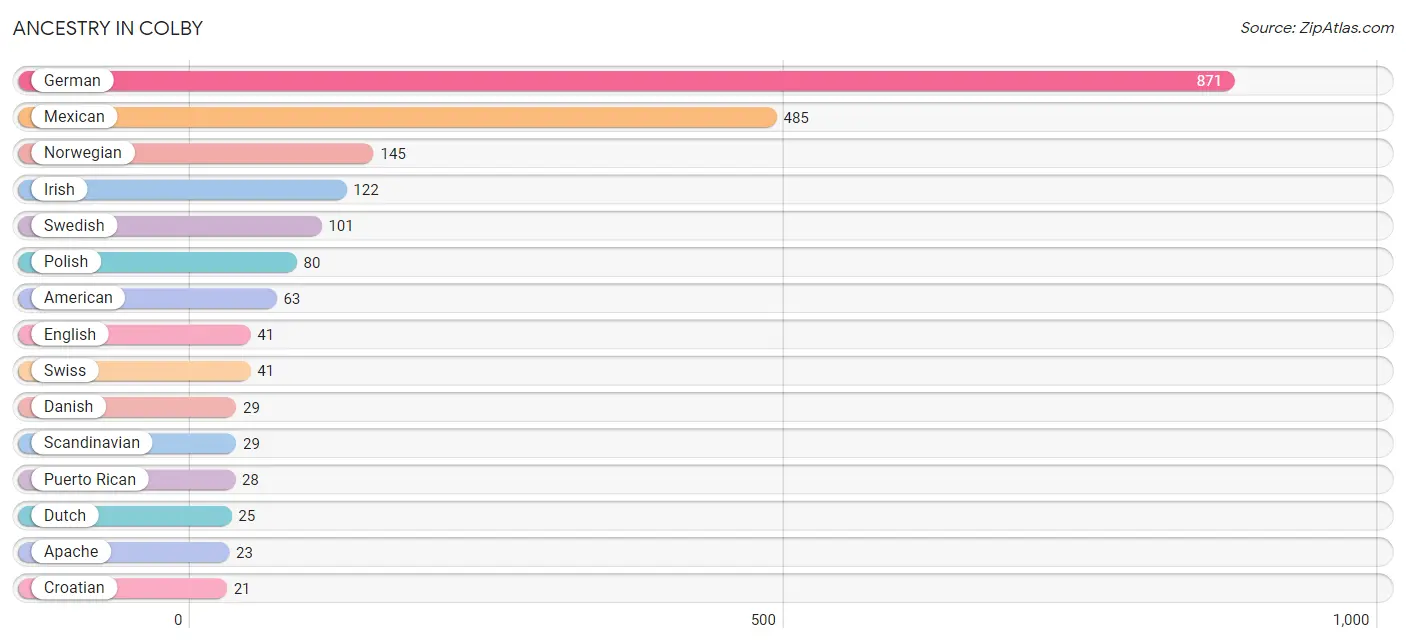
Ancestry in Colby
The most populous ancestries reported in Colby are German (871 | 40.8%), Mexican (485 | 22.8%), Norwegian (145 | 6.8%), Irish (122 | 5.7%), and Swedish (101 | 4.7%), together accounting for 80.9% of all Colby residents.
| Ancestry | # Population | % Population |
| American | 63 | 2.9% |
| Apache | 23 | 1.1% |
| Austrian | 1 | 0.1% |
| Blackfeet | 5 | 0.2% |
| Burmese | 4 | 0.2% |
| Canadian | 8 | 0.4% |
| Central American | 1 | 0.1% |
| Cherokee | 2 | 0.1% |
| Chippewa | 12 | 0.6% |
| Croatian | 21 | 1.0% |
| Czech | 19 | 0.9% |
| Danish | 29 | 1.4% |
| Dutch | 25 | 1.2% |
| English | 41 | 1.9% |
| Finnish | 6 | 0.3% |
| French | 17 | 0.8% |
| German | 871 | 40.8% |
| Irish | 122 | 5.7% |
| Italian | 12 | 0.6% |
| Korean | 2 | 0.1% |
| Mexican | 485 | 22.8% |
| Northern European | 6 | 0.3% |
| Norwegian | 145 | 6.8% |
| Peruvian | 6 | 0.3% |
| Polish | 80 | 3.7% |
| Puerto Rican | 28 | 1.3% |
| Salvadoran | 1 | 0.1% |
| Scandinavian | 29 | 1.4% |
| Scotch-Irish | 2 | 0.1% |
| Scottish | 8 | 0.4% |
| Slovene | 4 | 0.2% |
| South American | 6 | 0.3% |
| Swedish | 101 | 4.7% |
| Swiss | 41 | 1.9% | View All 34 Rows |
Immigrants in Colby
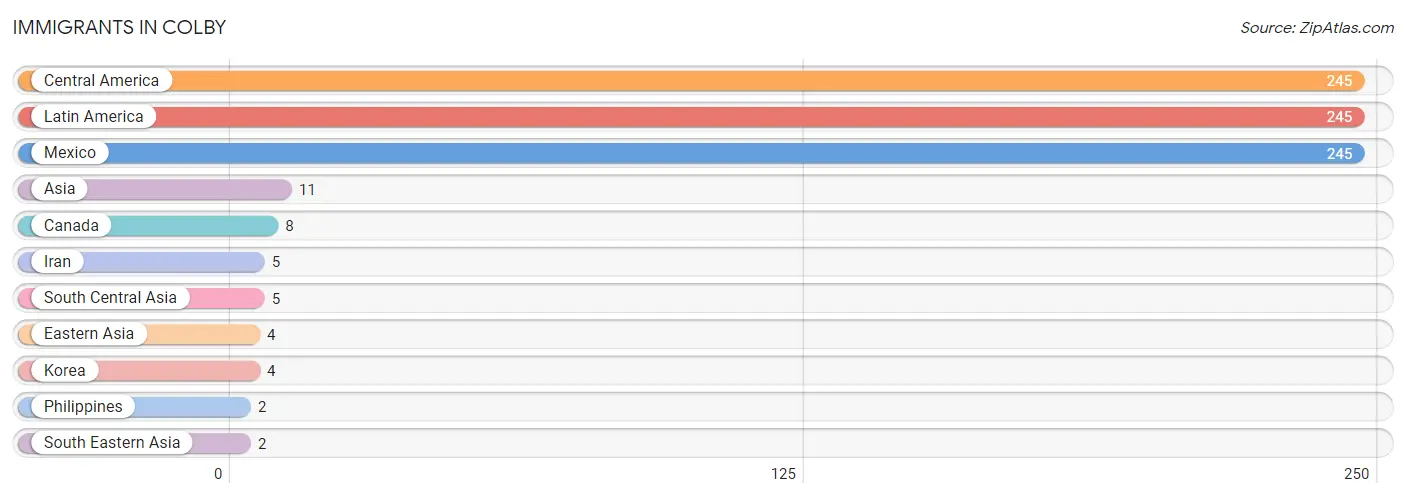
The most numerous immigrant groups reported in Colby came from Central America (245 | 11.5%), Latin America (245 | 11.5%), Mexico (245 | 11.5%), Asia (11 | 0.5%), and Canada (8 | 0.4%), together accounting for 35.4% of all Colby residents.
| Immigration Origin | # Population | % Population |
| Asia | 11 | 0.5% |
| Canada | 8 | 0.4% |
| Central America | 245 | 11.5% |
| Eastern Asia | 4 | 0.2% |
| Iran | 5 | 0.2% |
| Korea | 4 | 0.2% |
| Latin America | 245 | 11.5% |
| Mexico | 245 | 11.5% |
| Philippines | 2 | 0.1% |
| South Central Asia | 5 | 0.2% |
| South Eastern Asia | 2 | 0.1% | View All 11 Rows |
Sex and Age in Colby
Sex and Age in Colby
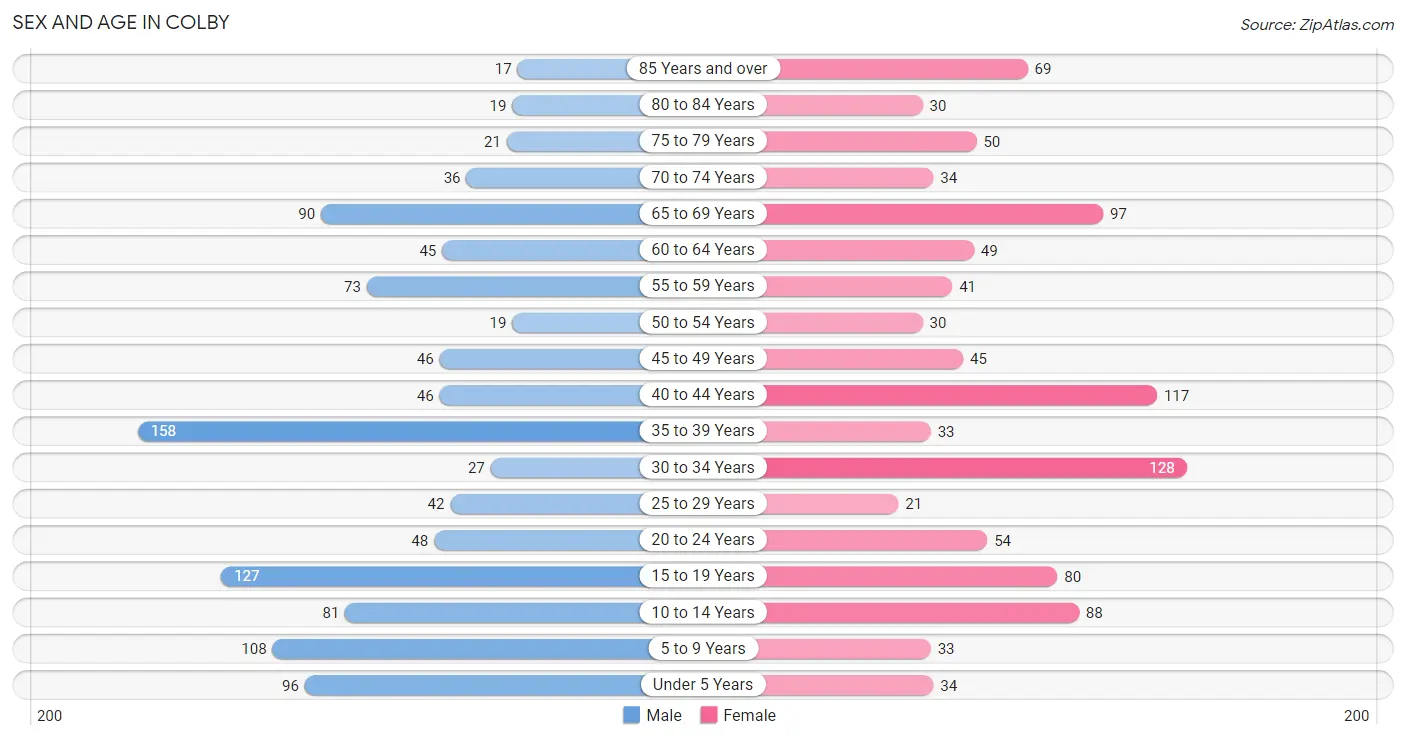
The most populous age groups in Colby are 35 to 39 Years (158 | 14.4%) for men and 30 to 34 Years (128 | 12.4%) for women.
| Age Bracket | Male | Female |
| Under 5 Years | 96 (8.7%) | 34 (3.3%) |
| 5 to 9 Years | 108 (9.8%) | 33 (3.2%) |
| 10 to 14 Years | 81 (7.4%) | 88 (8.5%) |
| 15 to 19 Years | 127 (11.6%) | 80 (7.7%) |
| 20 to 24 Years | 48 (4.4%) | 54 (5.2%) |
| 25 to 29 Years | 42 (3.8%) | 21 (2.0%) |
| 30 to 34 Years | 27 (2.5%) | 128 (12.4%) |
| 35 to 39 Years | 158 (14.4%) | 33 (3.2%) |
| 40 to 44 Years | 46 (4.2%) | 117 (11.3%) |
| 45 to 49 Years | 46 (4.2%) | 45 (4.4%) |
| 50 to 54 Years | 19 (1.7%) | 30 (2.9%) |
| 55 to 59 Years | 73 (6.6%) | 41 (4.0%) |
| 60 to 64 Years | 45 (4.1%) | 49 (4.7%) |
| 65 to 69 Years | 90 (8.2%) | 97 (9.4%) |
| 70 to 74 Years | 36 (3.3%) | 34 (3.3%) |
| 75 to 79 Years | 21 (1.9%) | 50 (4.8%) |
| 80 to 84 Years | 19 (1.7%) | 30 (2.9%) |
| 85 Years and over | 17 (1.5%) | 69 (6.7%) |
| Total | 1,099 (100.0%) | 1,033 (100.0%) |
Families and Households in Colby
Median Family Size in Colby
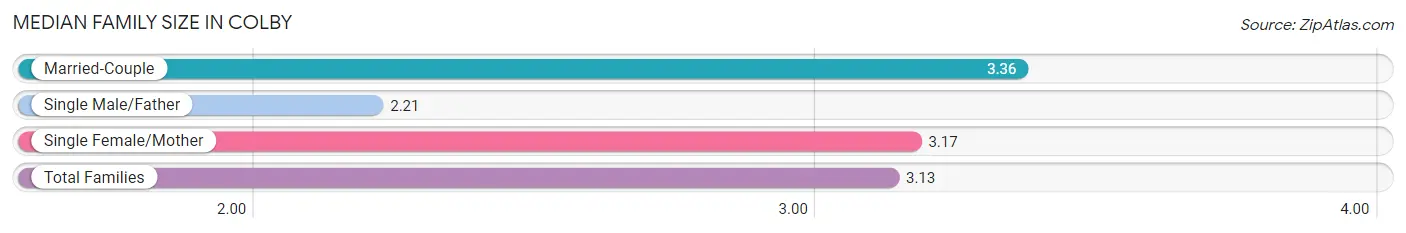
The median family size in Colby is 3.13 persons per family, with married-couple families (254 | 53.8%) accounting for the largest median family size of 3.36 persons per family. On the other hand, single male/father families (70 | 14.8%) represent the smallest median family size with 2.21 persons per family.
| Family Type | # Families | Family Size |
| Married-Couple | 254 (53.8%) | 3.36 |
| Single Male/Father | 70 (14.8%) | 2.21 |
| Single Female/Mother | 148 (31.4%) | 3.17 |
| Total Families | 472 (100.0%) | 3.13 |
Median Household Size in Colby
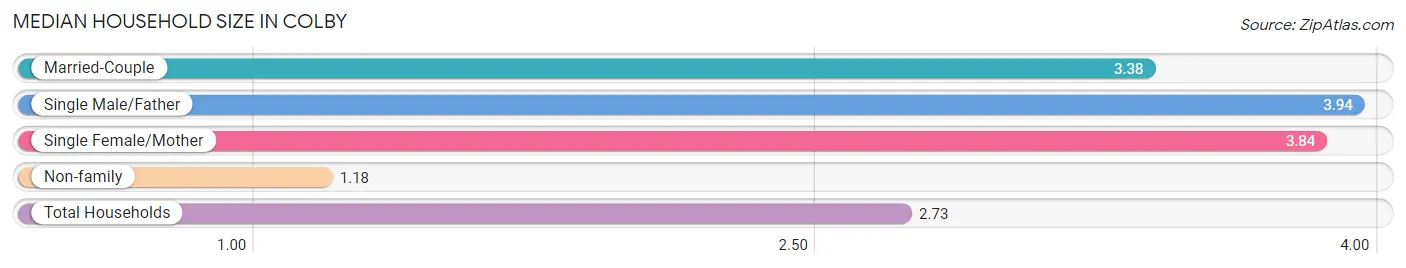
The median household size in Colby is 2.73 persons per household, with single male/father households (70 | 9.5%) accounting for the largest median household size of 3.94 persons per household. non-family households (266 | 36.0%) represent the smallest median household size with 1.18 persons per household.
| Household Type | # Households | Household Size |
| Married-Couple | 254 (34.4%) | 3.38 |
| Single Male/Father | 70 (9.5%) | 3.94 |
| Single Female/Mother | 148 (20.1%) | 3.84 |
| Non-family | 266 (36.0%) | 1.18 |
| Total Households | 738 (100.0%) | 2.73 |
Household Size by Marriage Status in Colby
Out of a total of 738 households in Colby, 472 (64.0%) are family households, while 266 (36.0%) are nonfamily households. The most numerous type of family households are 2-person households, comprising 160, and the most common type of nonfamily households are 1-person households, comprising 227.
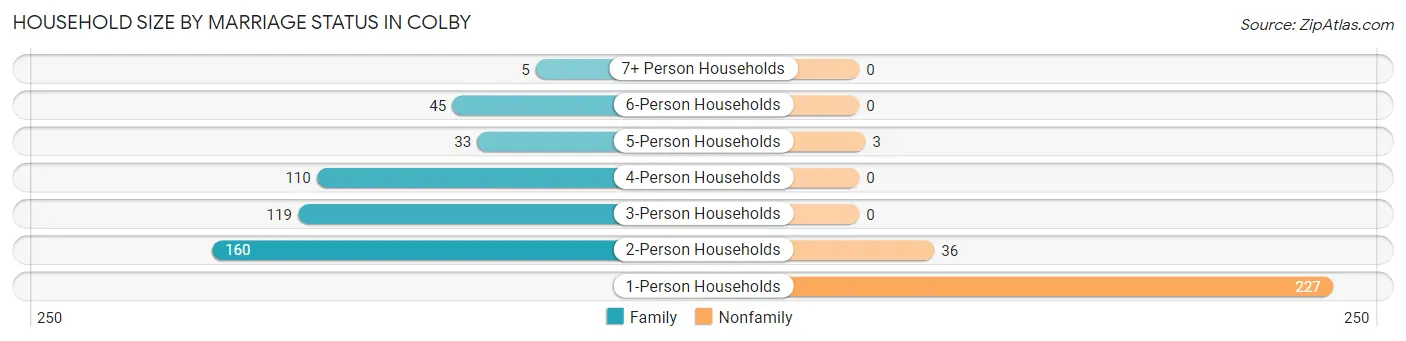
| Household Size | Family Households | Nonfamily Households |
| 1-Person Households | - | 227 (30.8%) |
| 2-Person Households | 160 (21.7%) | 36 (4.9%) |
| 3-Person Households | 119 (16.1%) | 0 (0.0%) |
| 4-Person Households | 110 (14.9%) | 0 (0.0%) |
| 5-Person Households | 33 (4.5%) | 3 (0.4%) |
| 6-Person Households | 45 (6.1%) | 0 (0.0%) |
| 7+ Person Households | 5 (0.7%) | 0 (0.0%) |
| Total | 472 (64.0%) | 266 (36.0%) |
Female Fertility in Colby
Fertility by Age in Colby
Average fertility rate in Colby is 42.0 births per 1,000 women. Women in the age bracket of 20 to 34 years have the highest fertility rate with 69.0 births per 1,000 women. Women in the age bracket of 20 to 34 years acount for 70.0% of all women with births.
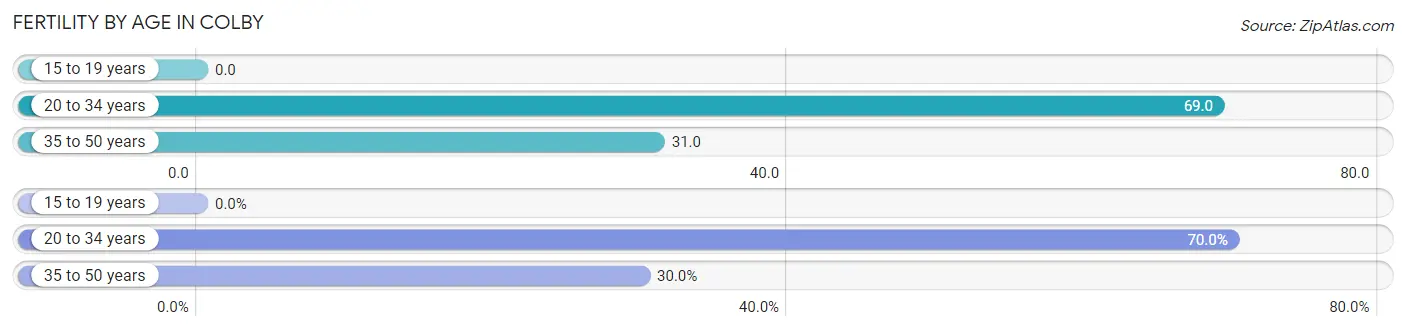
| Age Bracket | Women with Births | Births / 1,000 Women |
| 15 to 19 years | 0 (0.0%) | 0.0 |
| 20 to 34 years | 14 (70.0%) | 69.0 |
| 35 to 50 years | 6 (30.0%) | 31.0 |
| Total | 20 (100.0%) | 42.0 |
Fertility by Age by Marriage Status in Colby
70.0% of women with births (20) in Colby are married. The highest percentage of unmarried women with births falls into 35 to 50 years age bracket with 100.0% of them unmarried at the time of birth, while the lowest percentage of unmarried women with births belong to 20 to 34 years age bracket with 0.0% of them unmarried.
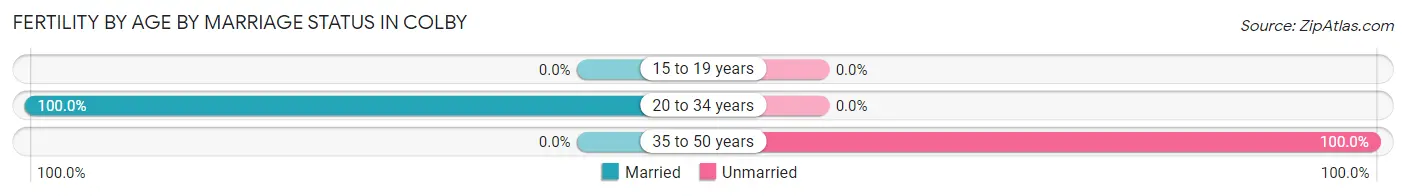
| Age Bracket | Married | Unmarried |
| 15 to 19 years | 0 (0.0%) | 0 (0.0%) |
| 20 to 34 years | 14 (100.0%) | 0 (0.0%) |
| 35 to 50 years | 0 (0.0%) | 6 (100.0%) |
| Total | 14 (70.0%) | 6 (30.0%) |
Fertility by Education in Colby
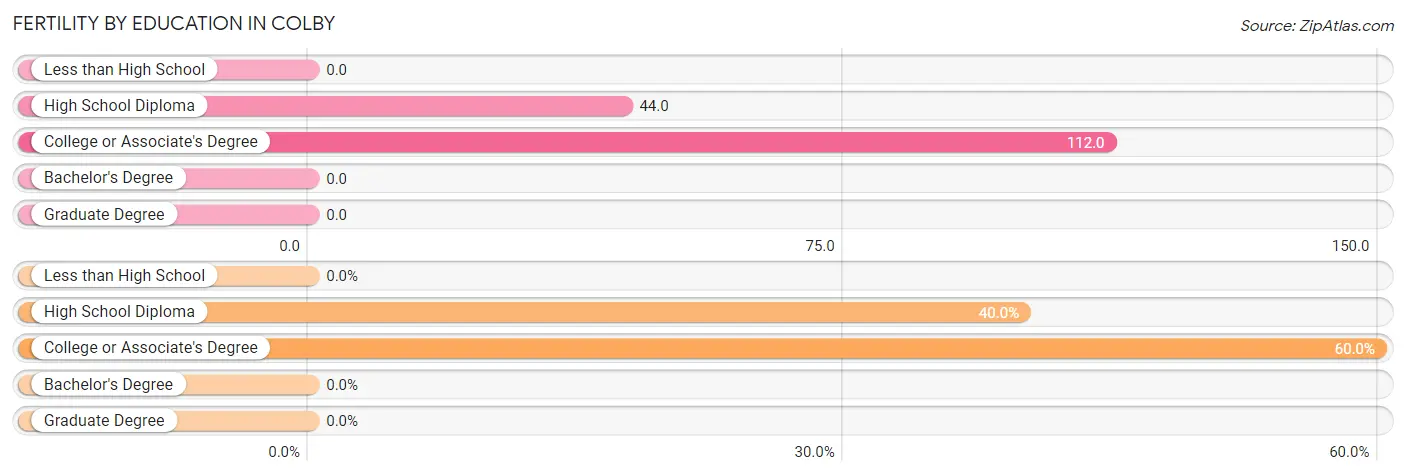
| Educational Attainment | Women with Births | Births / 1,000 Women |
| Less than High School | 0 (0.0%) | 0.0 |
| High School Diploma | 8 (40.0%) | 44.0 |
| College or Associate's Degree | 12 (60.0%) | 112.0 |
| Bachelor's Degree | 0 (0.0%) | 0.0 |
| Graduate Degree | 0 (0.0%) | 0.0 |
| Total | 20 (100.0%) | 42.0 |
Fertility by Education by Marriage Status in Colby
30.0% of women with births in Colby are unmarried. Women with the educational attainment of high school diploma are most likely to be married with 100.0% of them married at childbirth, while women with the educational attainment of college or associate's degree are least likely to be married with 50.0% of them unmarried at childbirth.
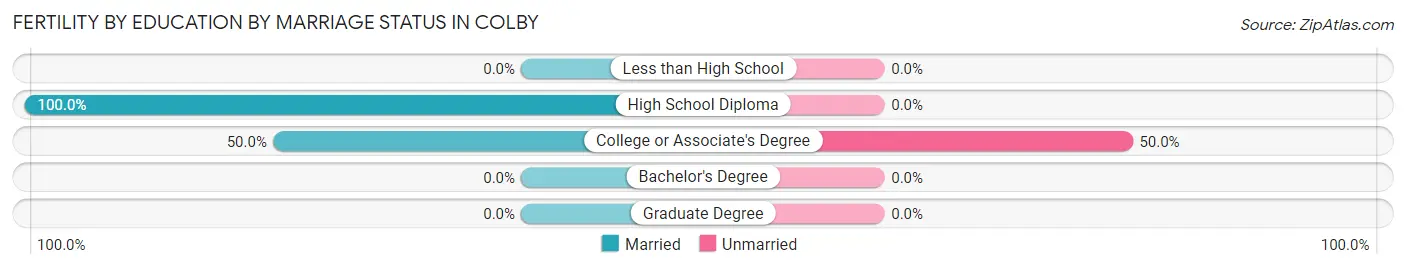
| Educational Attainment | Married | Unmarried |
| Less than High School | 0 (0.0%) | 0 (0.0%) |
| High School Diploma | 8 (100.0%) | 0 (0.0%) |
| College or Associate's Degree | 6 (50.0%) | 6 (50.0%) |
| Bachelor's Degree | 0 (0.0%) | 0 (0.0%) |
| Graduate Degree | 0 (0.0%) | 0 (0.0%) |
| Total | 14 (70.0%) | 6 (30.0%) |
Employment Characteristics in Colby
Employment by Class of Employer in Colby
Among the 943 employed individuals in Colby, private company employees (732 | 77.6%), not-for-profit organizations (74 | 7.9%), and self-employed (not incorporated) (61 | 6.5%) make up the most common classes of employment.
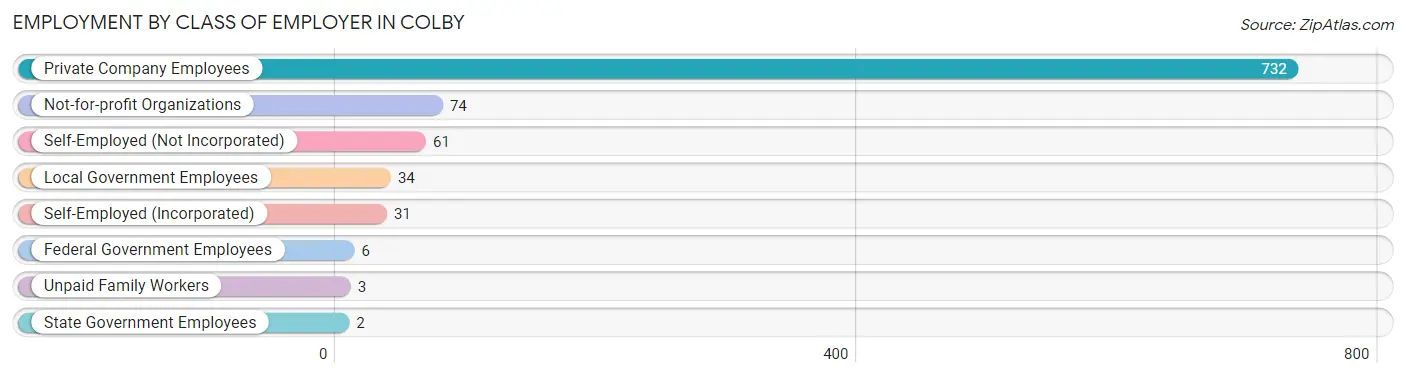
| Employer Class | # Employees | % Employees |
| Private Company Employees | 732 | 77.6% |
| Self-Employed (Incorporated) | 31 | 3.3% |
| Self-Employed (Not Incorporated) | 61 | 6.5% |
| Not-for-profit Organizations | 74 | 7.9% |
| Local Government Employees | 34 | 3.6% |
| State Government Employees | 2 | 0.2% |
| Federal Government Employees | 6 | 0.6% |
| Unpaid Family Workers | 3 | 0.3% |
| Total | 943 | 100.0% |
Employment Status by Age in Colby
According to the labor force statistics for Colby, out of the total population over 16 years of age (1,666), 58.9% or 981 individuals are in the labor force, with 3.9% or 38 of them unemployed. The age group with the highest labor force participation rate is 35 to 44 years, with 94.6% or 335 individuals in the labor force. Within the labor force, the 16 to 19 years age range has the highest percentage of unemployed individuals, with 23.7% or 22 of them being unemployed.
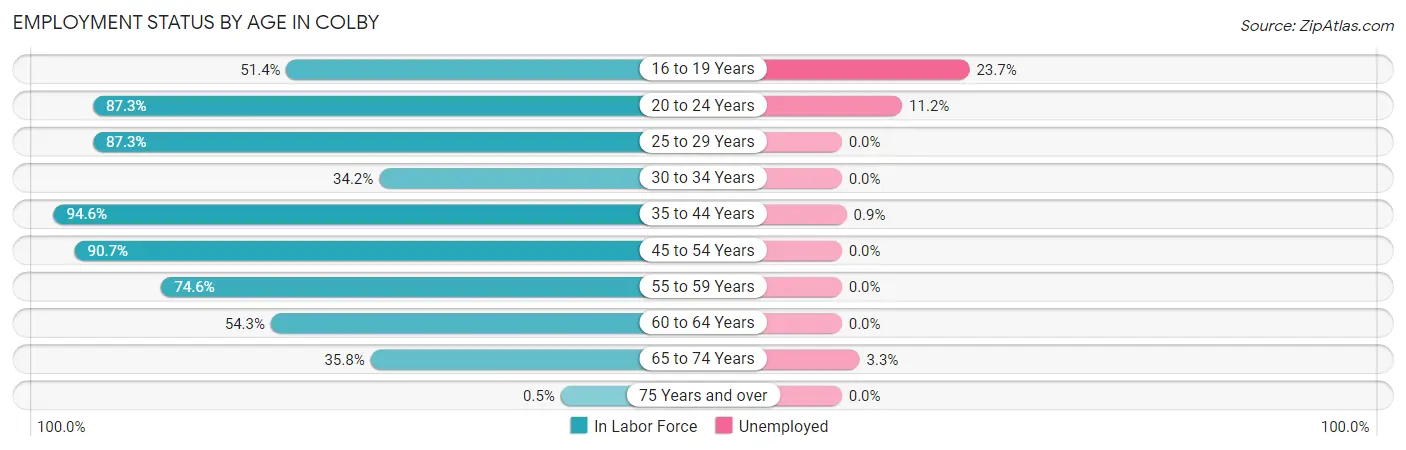
| Age Bracket | In Labor Force | Unemployed |
| 16 to 19 Years | 93 (51.4%) | 22 (23.7%) |
| 20 to 24 Years | 89 (87.3%) | 10 (11.2%) |
| 25 to 29 Years | 55 (87.3%) | 0 (0.0%) |
| 30 to 34 Years | 53 (34.2%) | 0 (0.0%) |
| 35 to 44 Years | 335 (94.6%) | 3 (0.9%) |
| 45 to 54 Years | 127 (90.7%) | 0 (0.0%) |
| 55 to 59 Years | 85 (74.6%) | 0 (0.0%) |
| 60 to 64 Years | 51 (54.3%) | 0 (0.0%) |
| 65 to 74 Years | 92 (35.8%) | 3 (3.3%) |
| 75 Years and over | 1 (0.5%) | 0 (0.0%) |
| Total | 981 (58.9%) | 38 (3.9%) |
Employment Status by Educational Attainment in Colby
According to labor force statistics for Colby, 76.7% of individuals (706) out of the total population between 25 and 64 years of age (920) are in the labor force, with 0.4% or 3 of them being unemployed. The group with the highest labor force participation rate are those with the educational attainment of bachelor's degree or higher, with 94.7% or 126 individuals in the labor force. Within the labor force, individuals with high school diploma education have the highest percentage of unemployment, with 0.9% or 3 of them being unemployed.
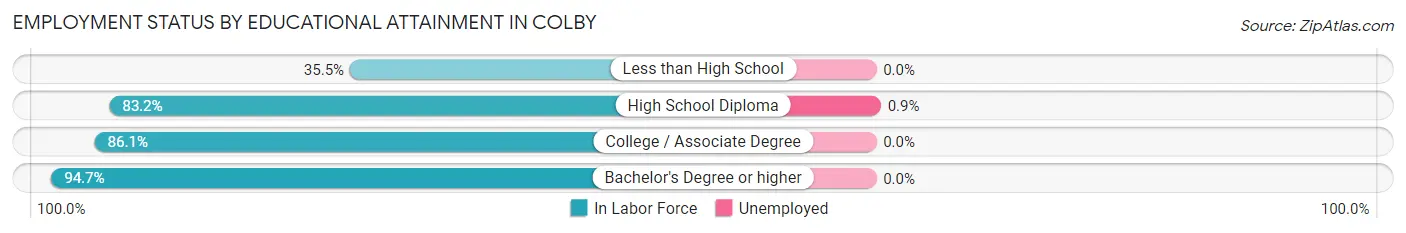
| Educational Attainment | In Labor Force | Unemployed |
| Less than High School | 60 (35.5%) | 0 (0.0%) |
| High School Diploma | 346 (83.2%) | 4 (0.9%) |
| College / Associate Degree | 174 (86.1%) | 0 (0.0%) |
| Bachelor's Degree or higher | 126 (94.7%) | 0 (0.0%) |
| Total | 706 (76.7%) | 4 (0.4%) |
Employment Occupations by Sex in Colby
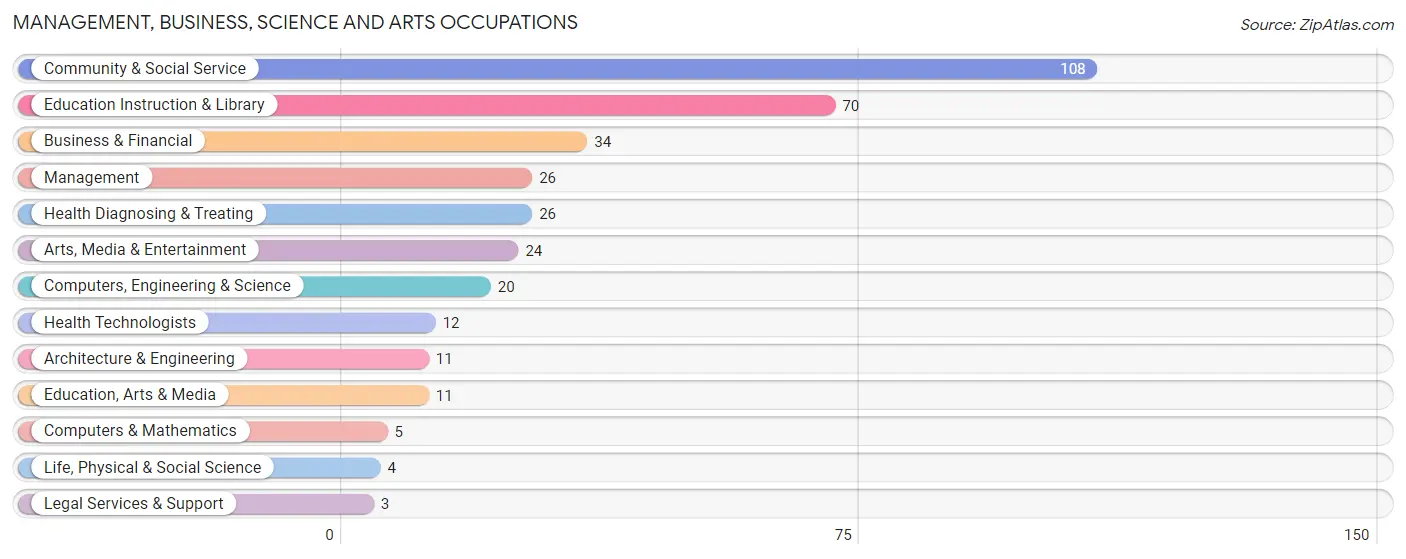
Management, Business, Science and Arts Occupations
The most common Management, Business, Science and Arts occupations in Colby are Community & Social Service (108 | 11.5%), Education Instruction & Library (70 | 7.4%), Business & Financial (34 | 3.6%), Management (26 | 2.8%), and Health Diagnosing & Treating (26 | 2.8%).
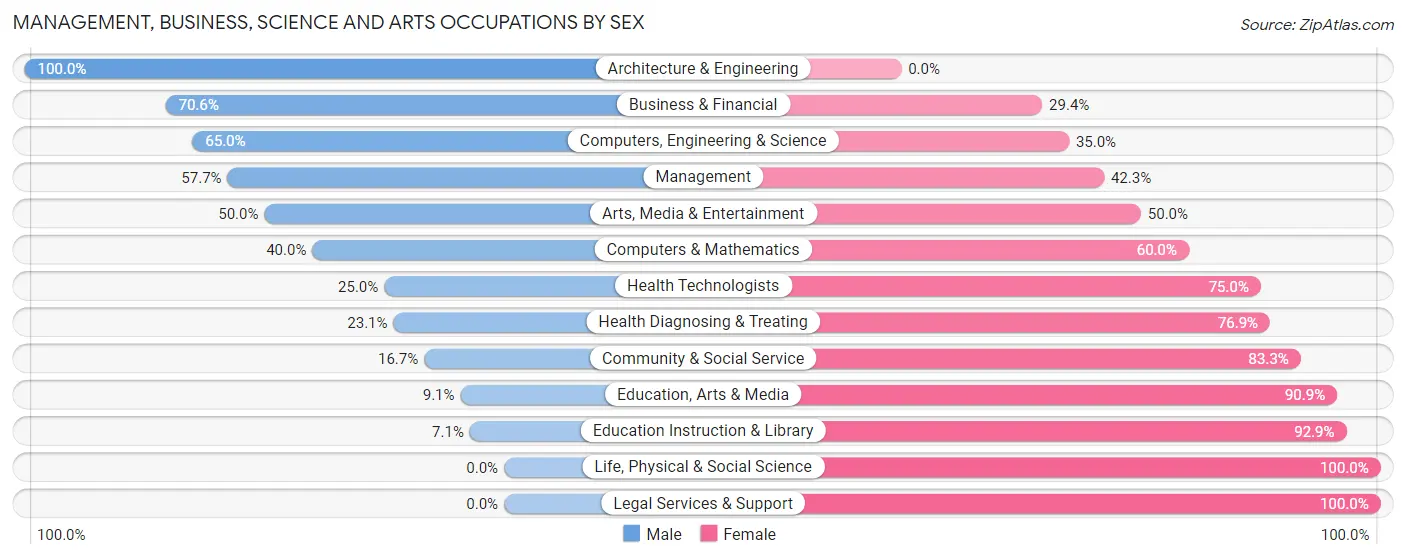
Management, Business, Science and Arts Occupations by Sex
Within the Management, Business, Science and Arts occupations in Colby, the most male-oriented occupations are Architecture & Engineering (100.0%), Business & Financial (70.6%), and Computers, Engineering & Science (65.0%), while the most female-oriented occupations are Life, Physical & Social Science (100.0%), Legal Services & Support (100.0%), and Education Instruction & Library (92.9%).
| Occupation | Male | Female |
| Management | 15 (57.7%) | 11 (42.3%) |
| Business & Financial | 24 (70.6%) | 10 (29.4%) |
| Computers, Engineering & Science | 13 (65.0%) | 7 (35.0%) |
| Computers & Mathematics | 2 (40.0%) | 3 (60.0%) |
| Architecture & Engineering | 11 (100.0%) | 0 (0.0%) |
| Life, Physical & Social Science | 0 (0.0%) | 4 (100.0%) |
| Community & Social Service | 18 (16.7%) | 90 (83.3%) |
| Education, Arts & Media | 1 (9.1%) | 10 (90.9%) |
| Legal Services & Support | 0 (0.0%) | 3 (100.0%) |
| Education Instruction & Library | 5 (7.1%) | 65 (92.9%) |
| Arts, Media & Entertainment | 12 (50.0%) | 12 (50.0%) |
| Health Diagnosing & Treating | 6 (23.1%) | 20 (76.9%) |
| Health Technologists | 3 (25.0%) | 9 (75.0%) |
| Total (Category) | 76 (35.5%) | 138 (64.5%) |
| Total (Overall) | 502 (53.2%) | 441 (46.8%) |
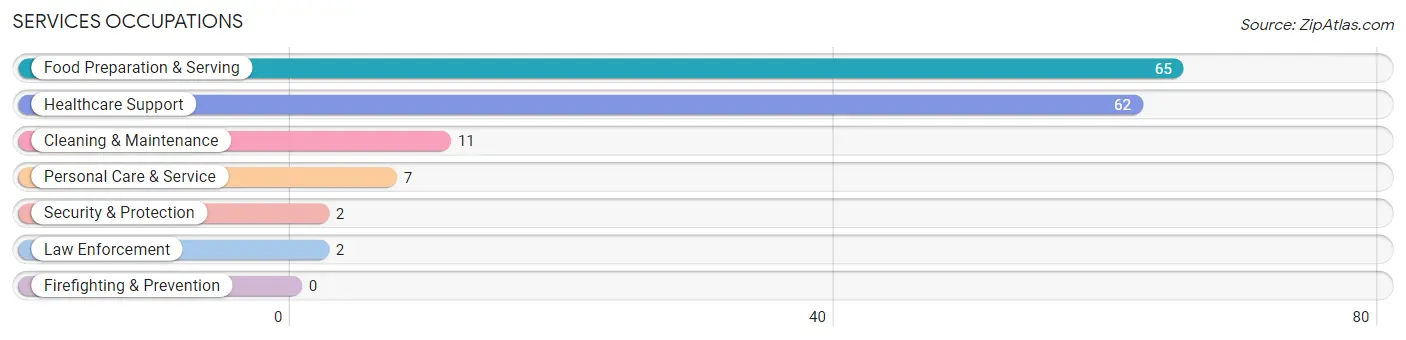
Services Occupations
The most common Services occupations in Colby are Food Preparation & Serving (65 | 6.9%), Healthcare Support (62 | 6.6%), Cleaning & Maintenance (11 | 1.2%), Personal Care & Service (7 | 0.7%), and Security & Protection (2 | 0.2%).
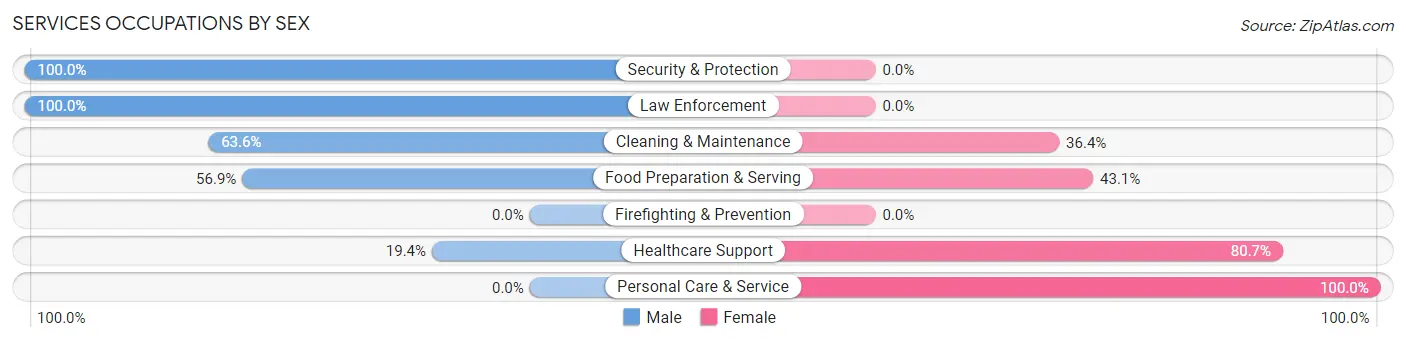
Services Occupations by Sex
Within the Services occupations in Colby, the most male-oriented occupations are Security & Protection (100.0%), Law Enforcement (100.0%), and Cleaning & Maintenance (63.6%), while the most female-oriented occupations are Personal Care & Service (100.0%), Healthcare Support (80.6%), and Food Preparation & Serving (43.1%).
| Occupation | Male | Female |
| Healthcare Support | 12 (19.4%) | 50 (80.6%) |
| Security & Protection | 2 (100.0%) | 0 (0.0%) |
| Firefighting & Prevention | 0 (0.0%) | 0 (0.0%) |
| Law Enforcement | 2 (100.0%) | 0 (0.0%) |
| Food Preparation & Serving | 37 (56.9%) | 28 (43.1%) |
| Cleaning & Maintenance | 7 (63.6%) | 4 (36.4%) |
| Personal Care & Service | 0 (0.0%) | 7 (100.0%) |
| Total (Category) | 58 (39.5%) | 89 (60.5%) |
| Total (Overall) | 502 (53.2%) | 441 (46.8%) |
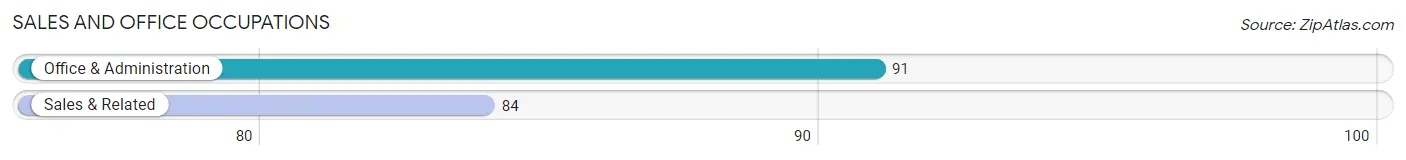
Sales and Office Occupations
The most common Sales and Office occupations in Colby are Office & Administration (91 | 9.7%), and Sales & Related (84 | 8.9%).
Sales and Office Occupations by Sex
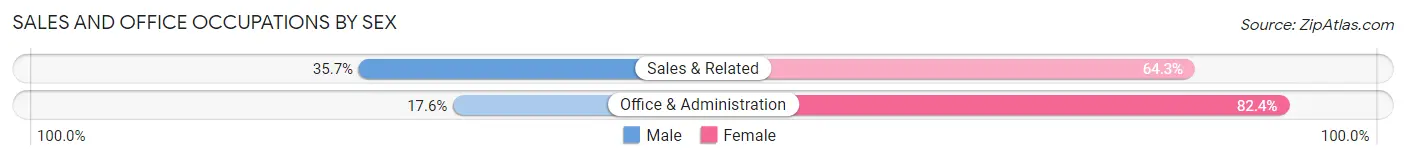
| Occupation | Male | Female |
| Sales & Related | 30 (35.7%) | 54 (64.3%) |
| Office & Administration | 16 (17.6%) | 75 (82.4%) |
| Total (Category) | 46 (26.3%) | 129 (73.7%) |
| Total (Overall) | 502 (53.2%) | 441 (46.8%) |
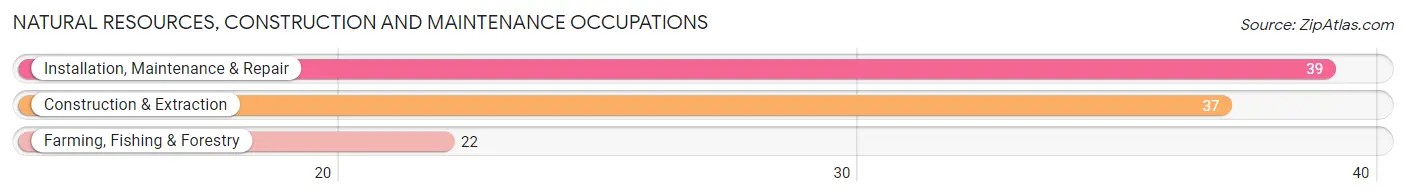
Natural Resources, Construction and Maintenance Occupations
The most common Natural Resources, Construction and Maintenance occupations in Colby are Installation, Maintenance & Repair (39 | 4.1%), Construction & Extraction (37 | 3.9%), and Farming, Fishing & Forestry (22 | 2.3%).
Natural Resources, Construction and Maintenance Occupations by Sex
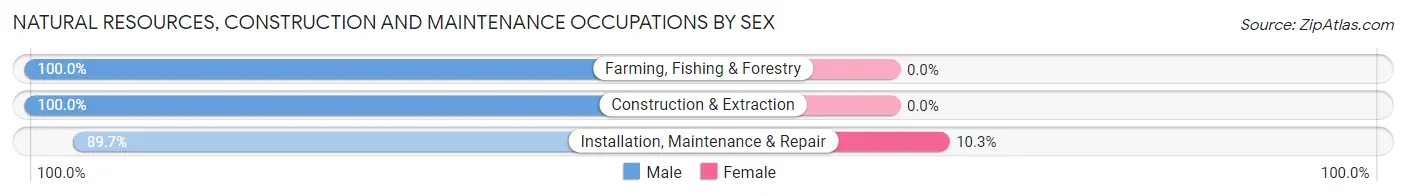
| Occupation | Male | Female |
| Farming, Fishing & Forestry | 22 (100.0%) | 0 (0.0%) |
| Construction & Extraction | 37 (100.0%) | 0 (0.0%) |
| Installation, Maintenance & Repair | 35 (89.7%) | 4 (10.3%) |
| Total (Category) | 94 (95.9%) | 4 (4.1%) |
| Total (Overall) | 502 (53.2%) | 441 (46.8%) |
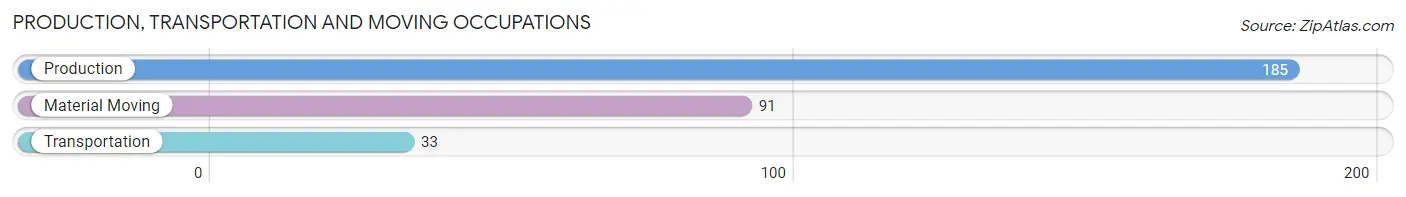
Production, Transportation and Moving Occupations
The most common Production, Transportation and Moving occupations in Colby are Production (185 | 19.6%), Material Moving (91 | 9.7%), and Transportation (33 | 3.5%).
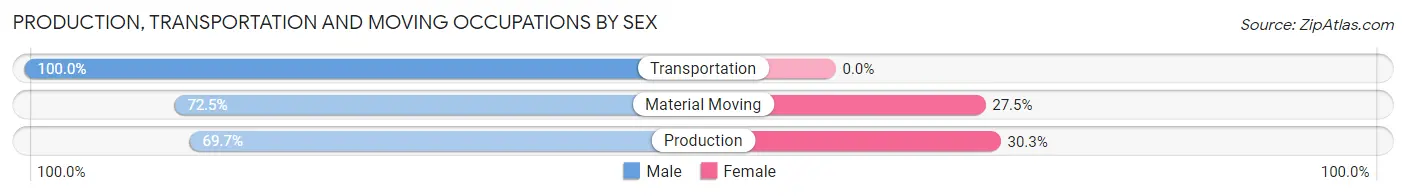
Production, Transportation and Moving Occupations by Sex
| Occupation | Male | Female |
| Production | 129 (69.7%) | 56 (30.3%) |
| Transportation | 33 (100.0%) | 0 (0.0%) |
| Material Moving | 66 (72.5%) | 25 (27.5%) |
| Total (Category) | 228 (73.8%) | 81 (26.2%) |
| Total (Overall) | 502 (53.2%) | 441 (46.8%) |
Employment Industries by Sex in Colby
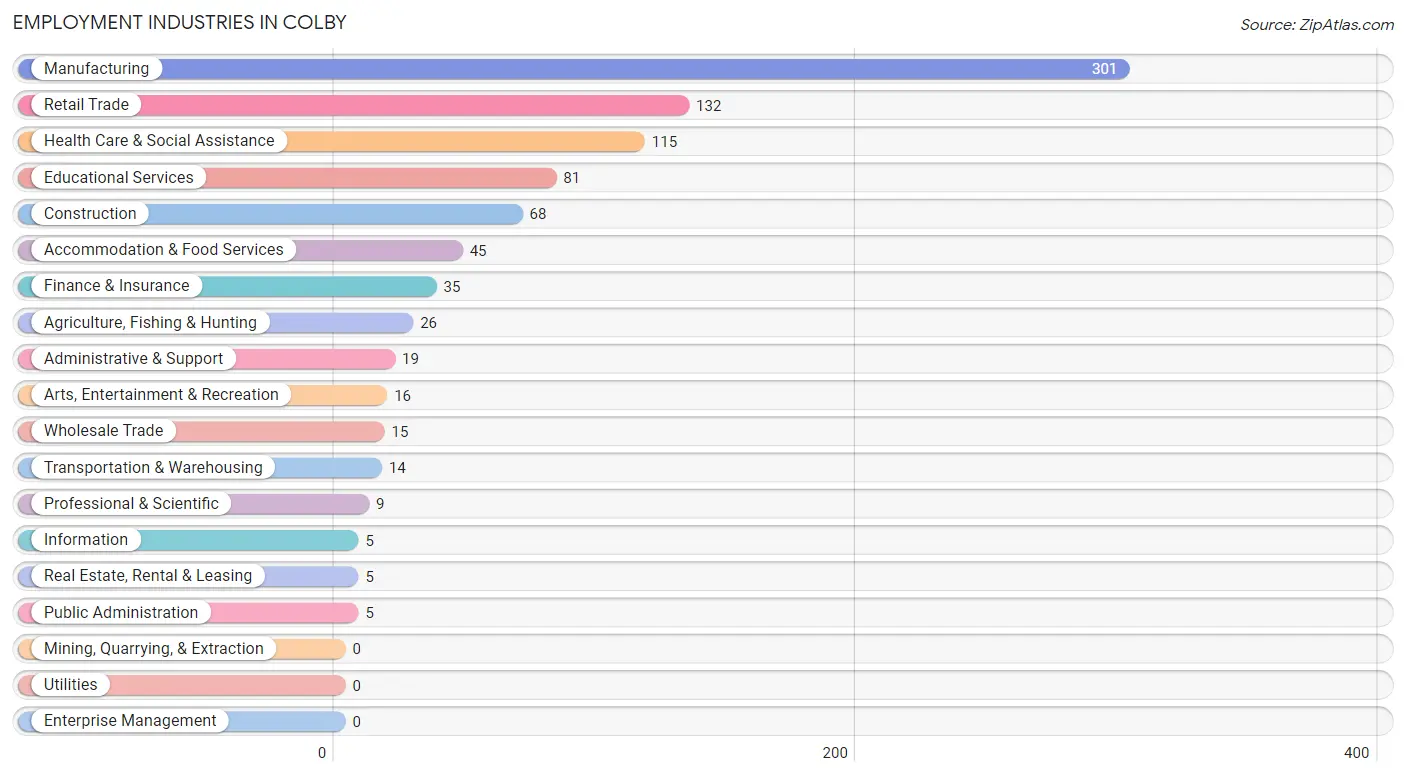
Employment Industries in Colby
The major employment industries in Colby include Manufacturing (301 | 31.9%), Retail Trade (132 | 14.0%), Health Care & Social Assistance (115 | 12.2%), Educational Services (81 | 8.6%), and Construction (68 | 7.2%).
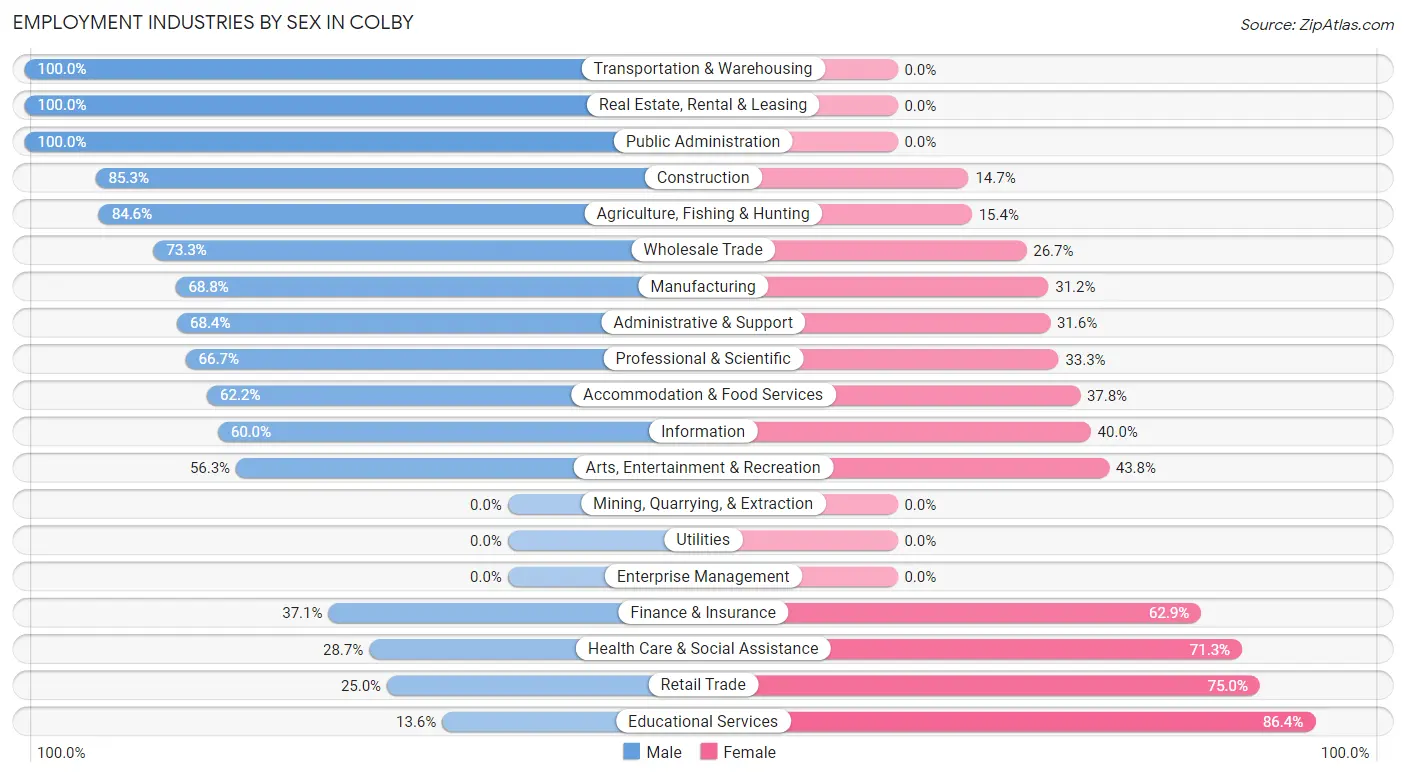
Employment Industries by Sex in Colby
The Colby industries that see more men than women are Transportation & Warehousing (100.0%), Real Estate, Rental & Leasing (100.0%), and Public Administration (100.0%), whereas the industries that tend to have a higher number of women are Educational Services (86.4%), Retail Trade (75.0%), and Health Care & Social Assistance (71.3%).
| Industry | Male | Female |
| Agriculture, Fishing & Hunting | 22 (84.6%) | 4 (15.4%) |
| Mining, Quarrying, & Extraction | 0 (0.0%) | 0 (0.0%) |
| Construction | 58 (85.3%) | 10 (14.7%) |
| Manufacturing | 207 (68.8%) | 94 (31.2%) |
| Wholesale Trade | 11 (73.3%) | 4 (26.7%) |
| Retail Trade | 33 (25.0%) | 99 (75.0%) |
| Transportation & Warehousing | 14 (100.0%) | 0 (0.0%) |
| Utilities | 0 (0.0%) | 0 (0.0%) |
| Information | 3 (60.0%) | 2 (40.0%) |
| Finance & Insurance | 13 (37.1%) | 22 (62.9%) |
| Real Estate, Rental & Leasing | 5 (100.0%) | 0 (0.0%) |
| Professional & Scientific | 6 (66.7%) | 3 (33.3%) |
| Enterprise Management | 0 (0.0%) | 0 (0.0%) |
| Administrative & Support | 13 (68.4%) | 6 (31.6%) |
| Educational Services | 11 (13.6%) | 70 (86.4%) |
| Health Care & Social Assistance | 33 (28.7%) | 82 (71.3%) |
| Arts, Entertainment & Recreation | 9 (56.2%) | 7 (43.8%) |
| Accommodation & Food Services | 28 (62.2%) | 17 (37.8%) |
| Public Administration | 5 (100.0%) | 0 (0.0%) |
| Total | 502 (53.2%) | 441 (46.8%) |
Education in Colby
School Enrollment in Colby
The most common levels of schooling among the 541 students in Colby are high school (150 | 27.7%), middle school (141 | 26.1%), and elementary school (120 | 22.2%).
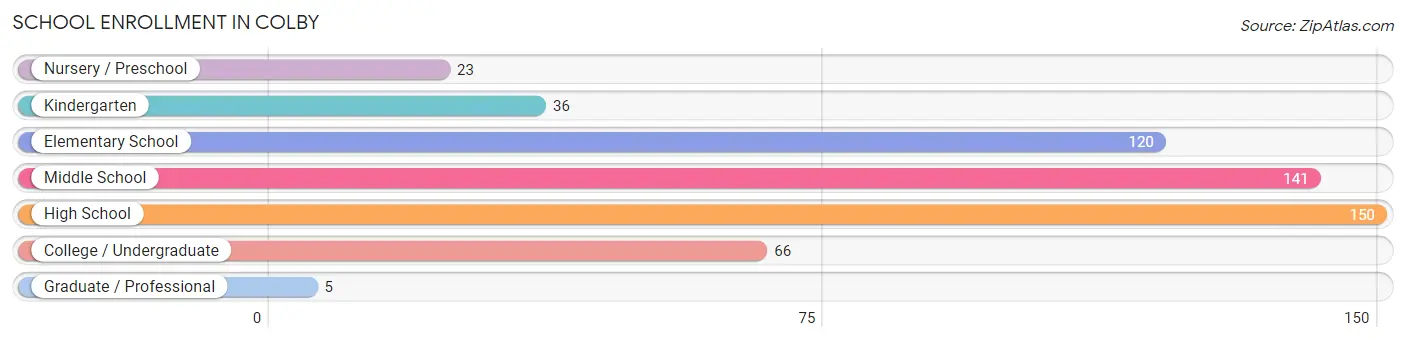
| School Level | # Students | % Students |
| Nursery / Preschool | 23 | 4.3% |
| Kindergarten | 36 | 6.7% |
| Elementary School | 120 | 22.2% |
| Middle School | 141 | 26.1% |
| High School | 150 | 27.7% |
| College / Undergraduate | 66 | 12.2% |
| Graduate / Professional | 5 | 0.9% |
| Total | 541 | 100.0% |
School Enrollment by Age by Funding Source in Colby
Out of a total of 541 students who are enrolled in schools in Colby, 36 (6.7%) attend a private institution, while the remaining 505 (93.3%) are enrolled in public schools. The age group of 3 to 4 year olds has the highest likelihood of being enrolled in private schools, with 11 (52.4% in the age bracket) enrolled. Conversely, the age group of 15 to 17 year olds has the lowest likelihood of being enrolled in a private school, with 135 (100.0% in the age bracket) attending a public institution.
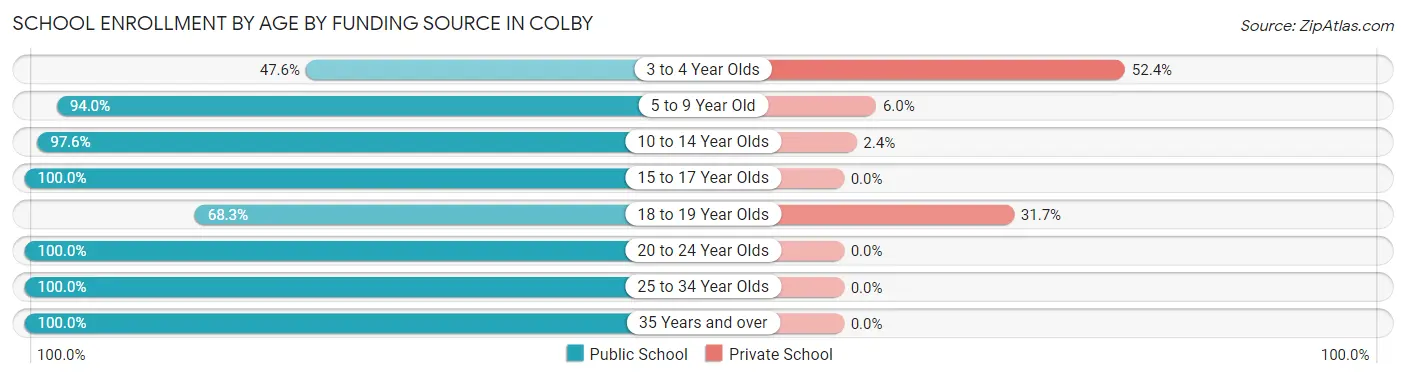
| Age Bracket | Public School | Private School |
| 3 to 4 Year Olds | 10 (47.6%) | 11 (52.4%) |
| 5 to 9 Year Old | 125 (94.0%) | 8 (6.0%) |
| 10 to 14 Year Olds | 165 (97.6%) | 4 (2.4%) |
| 15 to 17 Year Olds | 135 (100.0%) | 0 (0.0%) |
| 18 to 19 Year Olds | 28 (68.3%) | 13 (31.7%) |
| 20 to 24 Year Olds | 24 (100.0%) | 0 (0.0%) |
| 25 to 34 Year Olds | 8 (100.0%) | 0 (0.0%) |
| 35 Years and over | 10 (100.0%) | 0 (0.0%) |
| Total | 505 (93.3%) | 36 (6.7%) |
Educational Attainment by Field of Study in Colby
Education (70 | 31.7%), business (46 | 20.8%), arts & humanities (18 | 8.1%), bio, nature & agricultural (16 | 7.2%), and liberal arts & history (15 | 6.8%) are the most common fields of study among 221 individuals in Colby who have obtained a bachelor's degree or higher.
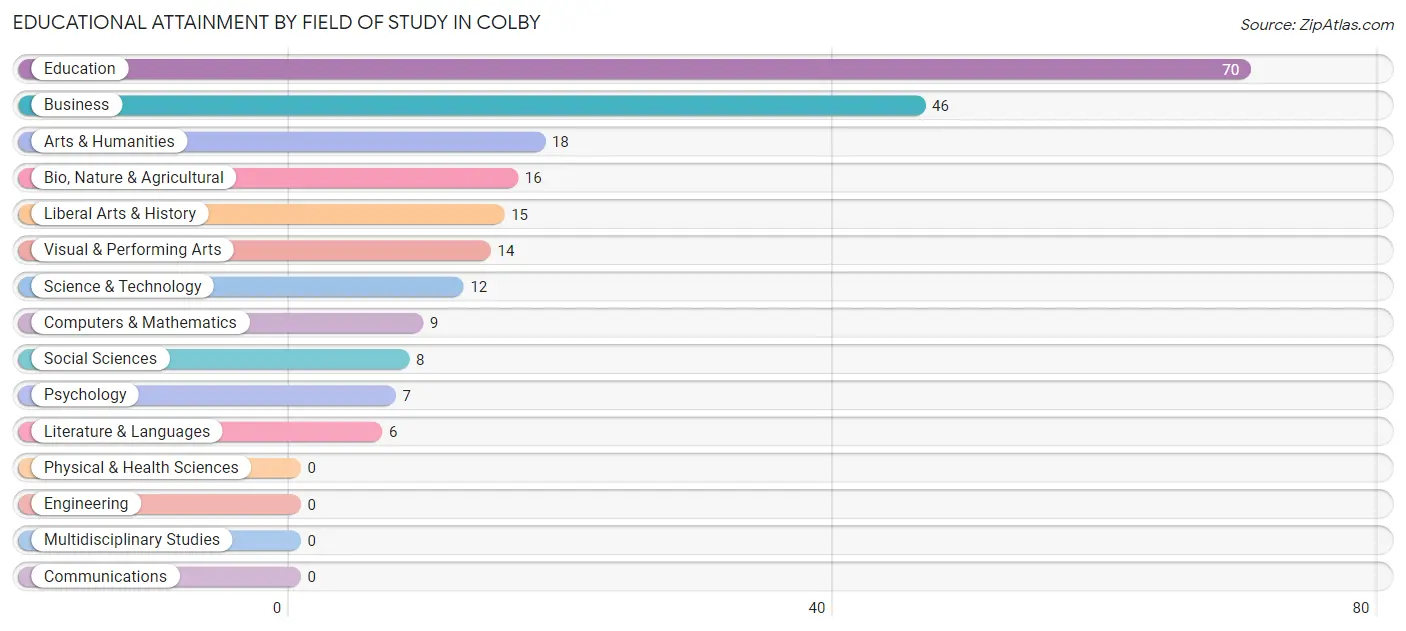
| Field of Study | # Graduates | % Graduates |
| Computers & Mathematics | 9 | 4.1% |
| Bio, Nature & Agricultural | 16 | 7.2% |
| Physical & Health Sciences | 0 | 0.0% |
| Psychology | 7 | 3.2% |
| Social Sciences | 8 | 3.6% |
| Engineering | 0 | 0.0% |
| Multidisciplinary Studies | 0 | 0.0% |
| Science & Technology | 12 | 5.4% |
| Business | 46 | 20.8% |
| Education | 70 | 31.7% |
| Literature & Languages | 6 | 2.7% |
| Liberal Arts & History | 15 | 6.8% |
| Visual & Performing Arts | 14 | 6.3% |
| Communications | 0 | 0.0% |
| Arts & Humanities | 18 | 8.1% |
| Total | 221 | 100.0% |
Transportation & Commute in Colby
Vehicle Availability by Sex in Colby
The most prevalent vehicle ownership categories in Colby are males with 2 vehicles (179, accounting for 35.9%) and females with 2 vehicles (208, making up 40.9%).
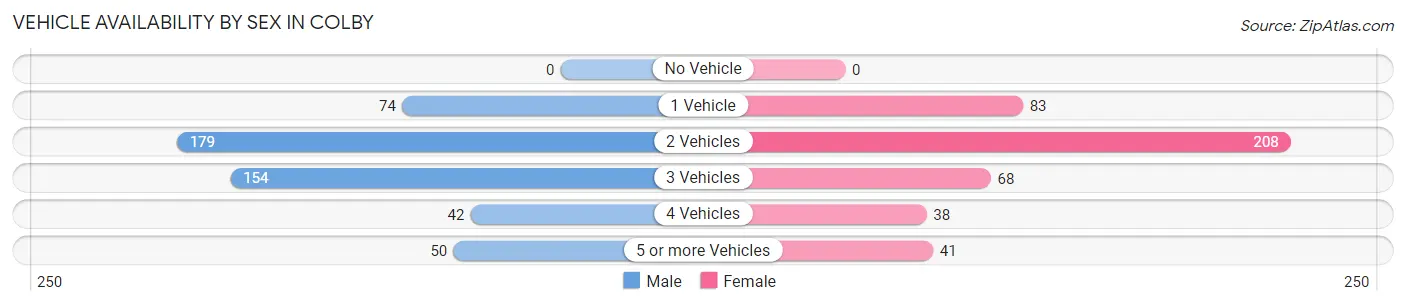
| Vehicles Available | Male | Female |
| No Vehicle | 0 (0.0%) | 0 (0.0%) |
| 1 Vehicle | 74 (14.8%) | 83 (19.0%) |
| 2 Vehicles | 179 (35.9%) | 208 (47.5%) |
| 3 Vehicles | 154 (30.9%) | 68 (15.5%) |
| 4 Vehicles | 42 (8.4%) | 38 (8.7%) |
| 5 or more Vehicles | 50 (10.0%) | 41 (9.4%) |
| Total | 499 (100.0%) | 438 (100.0%) |
Commute Time in Colby
The most frequently occuring commute durations in Colby are 5 to 9 minutes (203 commuters, 22.7%), 10 to 14 minutes (199 commuters, 22.2%), and 30 to 34 minutes (113 commuters, 12.6%).
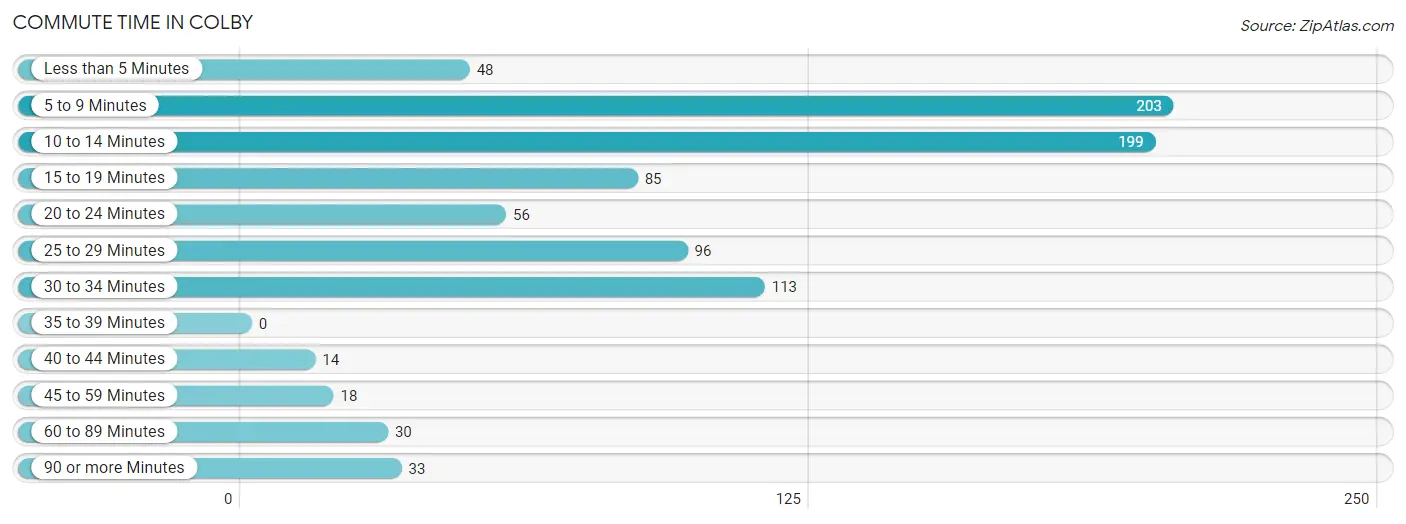
| Commute Time | # Commuters | % Commuters |
| Less than 5 Minutes | 48 | 5.4% |
| 5 to 9 Minutes | 203 | 22.7% |
| 10 to 14 Minutes | 199 | 22.2% |
| 15 to 19 Minutes | 85 | 9.5% |
| 20 to 24 Minutes | 56 | 6.3% |
| 25 to 29 Minutes | 96 | 10.7% |
| 30 to 34 Minutes | 113 | 12.6% |
| 35 to 39 Minutes | 0 | 0.0% |
| 40 to 44 Minutes | 14 | 1.6% |
| 45 to 59 Minutes | 18 | 2.0% |
| 60 to 89 Minutes | 30 | 3.4% |
| 90 or more Minutes | 33 | 3.7% |
Commute Time by Sex in Colby
The most common commute times in Colby are 5 to 9 minutes (130 commuters, 26.5%) for males and 10 to 14 minutes (98 commuters, 24.3%) for females.
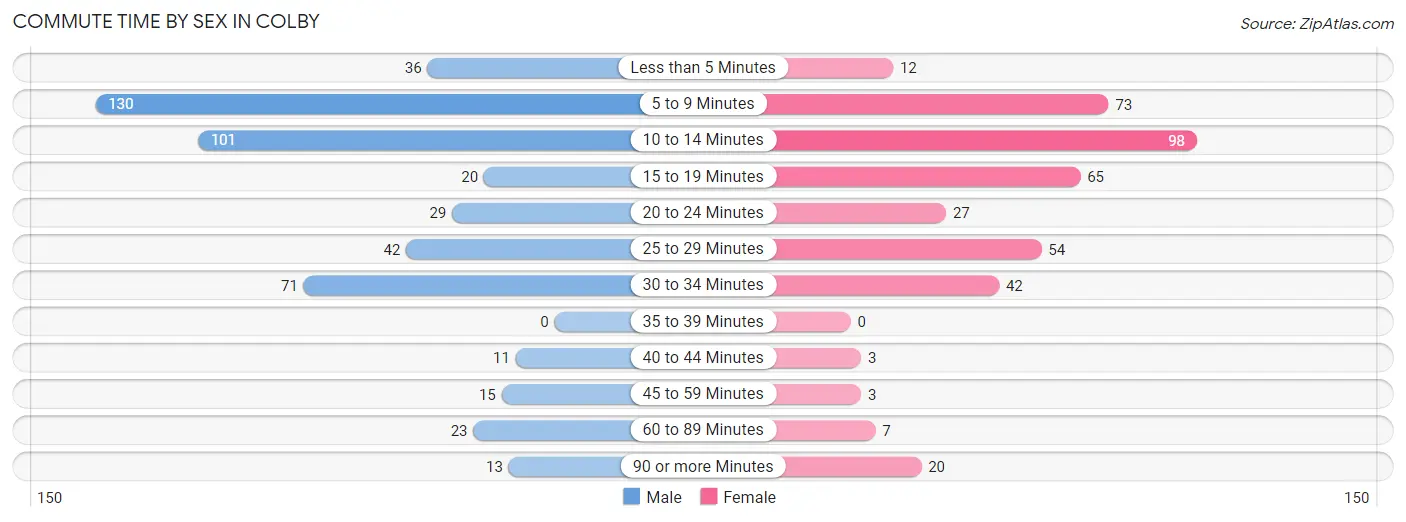
| Commute Time | Male | Female |
| Less than 5 Minutes | 36 (7.3%) | 12 (3.0%) |
| 5 to 9 Minutes | 130 (26.5%) | 73 (18.1%) |
| 10 to 14 Minutes | 101 (20.6%) | 98 (24.3%) |
| 15 to 19 Minutes | 20 (4.1%) | 65 (16.1%) |
| 20 to 24 Minutes | 29 (5.9%) | 27 (6.7%) |
| 25 to 29 Minutes | 42 (8.6%) | 54 (13.4%) |
| 30 to 34 Minutes | 71 (14.5%) | 42 (10.4%) |
| 35 to 39 Minutes | 0 (0.0%) | 0 (0.0%) |
| 40 to 44 Minutes | 11 (2.2%) | 3 (0.7%) |
| 45 to 59 Minutes | 15 (3.0%) | 3 (0.7%) |
| 60 to 89 Minutes | 23 (4.7%) | 7 (1.7%) |
| 90 or more Minutes | 13 (2.6%) | 20 (5.0%) |
Time of Departure to Work by Sex in Colby
The most frequent times of departure to work in Colby are 6:00 AM to 6:29 AM (88, 17.9%) for males and 7:30 AM to 7:59 AM (56, 13.9%) for females.
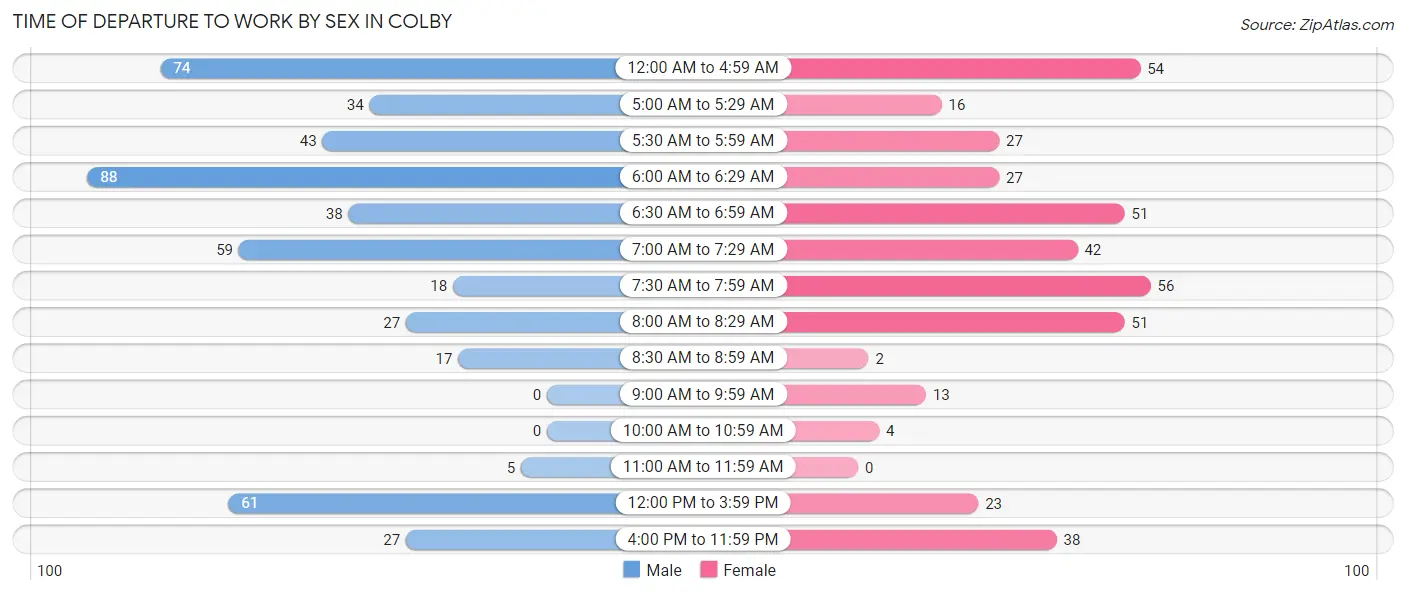
| Time of Departure | Male | Female |
| 12:00 AM to 4:59 AM | 74 (15.1%) | 54 (13.4%) |
| 5:00 AM to 5:29 AM | 34 (6.9%) | 16 (4.0%) |
| 5:30 AM to 5:59 AM | 43 (8.8%) | 27 (6.7%) |
| 6:00 AM to 6:29 AM | 88 (17.9%) | 27 (6.7%) |
| 6:30 AM to 6:59 AM | 38 (7.7%) | 51 (12.6%) |
| 7:00 AM to 7:29 AM | 59 (12.0%) | 42 (10.4%) |
| 7:30 AM to 7:59 AM | 18 (3.7%) | 56 (13.9%) |
| 8:00 AM to 8:29 AM | 27 (5.5%) | 51 (12.6%) |
| 8:30 AM to 8:59 AM | 17 (3.5%) | 2 (0.5%) |
| 9:00 AM to 9:59 AM | 0 (0.0%) | 13 (3.2%) |
| 10:00 AM to 10:59 AM | 0 (0.0%) | 4 (1.0%) |
| 11:00 AM to 11:59 AM | 5 (1.0%) | 0 (0.0%) |
| 12:00 PM to 3:59 PM | 61 (12.4%) | 23 (5.7%) |
| 4:00 PM to 11:59 PM | 27 (5.5%) | 38 (9.4%) |
| Total | 491 (100.0%) | 404 (100.0%) |
Housing Occupancy in Colby
Occupancy by Ownership in Colby
Of the total 738 dwellings in Colby, owner-occupied units account for 453 (61.4%), while renter-occupied units make up 285 (38.6%).
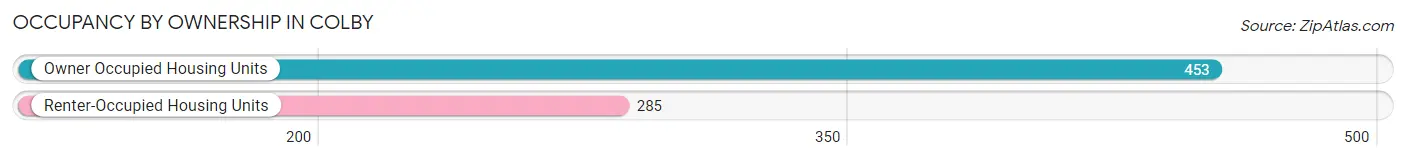
| Occupancy | # Housing Units | % Housing Units |
| Owner Occupied Housing Units | 453 | 61.4% |
| Renter-Occupied Housing Units | 285 | 38.6% |
| Total Occupied Housing Units | 738 | 100.0% |
Occupancy by Household Size in Colby
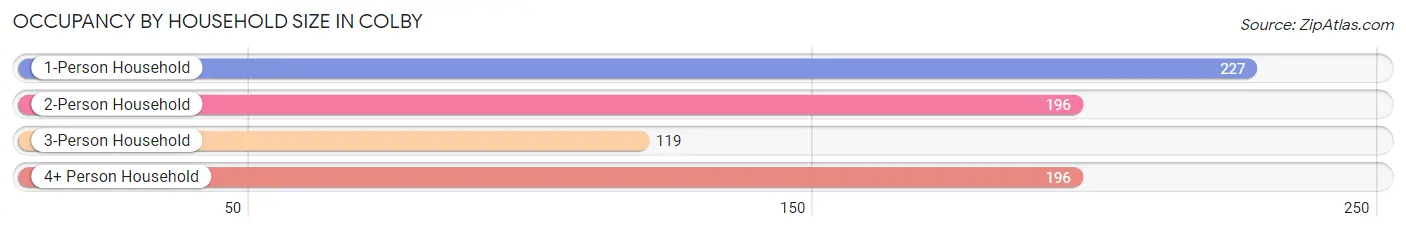
| Household Size | # Housing Units | % Housing Units |
| 1-Person Household | 227 | 30.8% |
| 2-Person Household | 196 | 26.6% |
| 3-Person Household | 119 | 16.1% |
| 4+ Person Household | 196 | 26.6% |
| Total Housing Units | 738 | 100.0% |
Occupancy by Ownership by Household Size in Colby
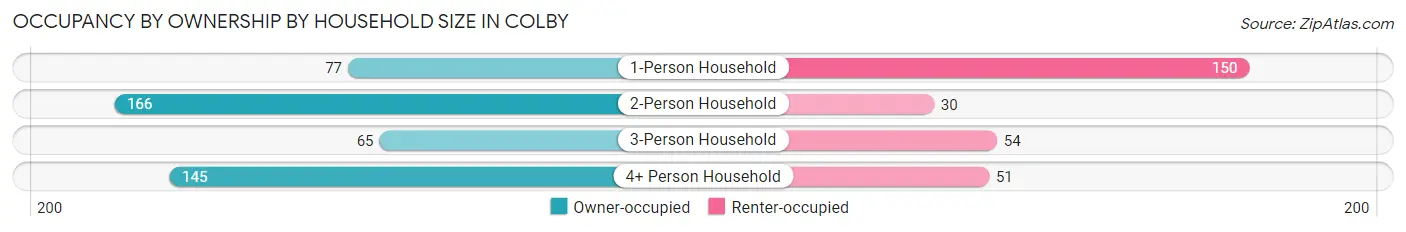
| Household Size | Owner-occupied | Renter-occupied |
| 1-Person Household | 77 (33.9%) | 150 (66.1%) |
| 2-Person Household | 166 (84.7%) | 30 (15.3%) |
| 3-Person Household | 65 (54.6%) | 54 (45.4%) |
| 4+ Person Household | 145 (74.0%) | 51 (26.0%) |
| Total Housing Units | 453 (61.4%) | 285 (38.6%) |
Occupancy by Educational Attainment in Colby
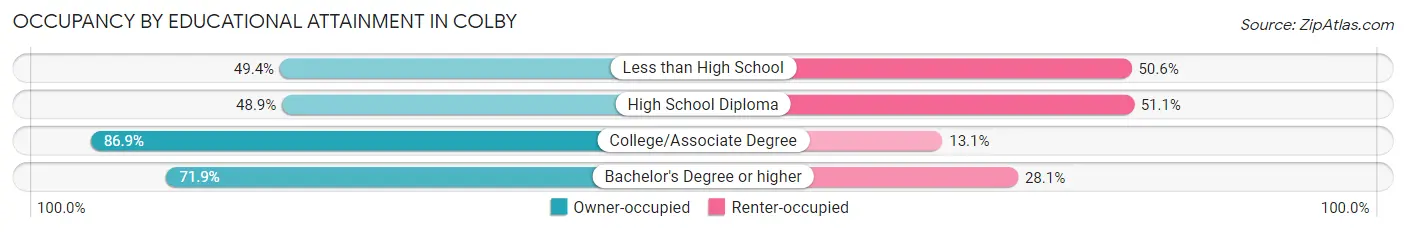
| Household Size | Owner-occupied | Renter-occupied |
| Less than High School | 40 (49.4%) | 41 (50.6%) |
| High School Diploma | 185 (48.9%) | 193 (51.1%) |
| College/Associate Degree | 159 (86.9%) | 24 (13.1%) |
| Bachelor's Degree or higher | 69 (71.9%) | 27 (28.1%) |
Occupancy by Age of Householder in Colby
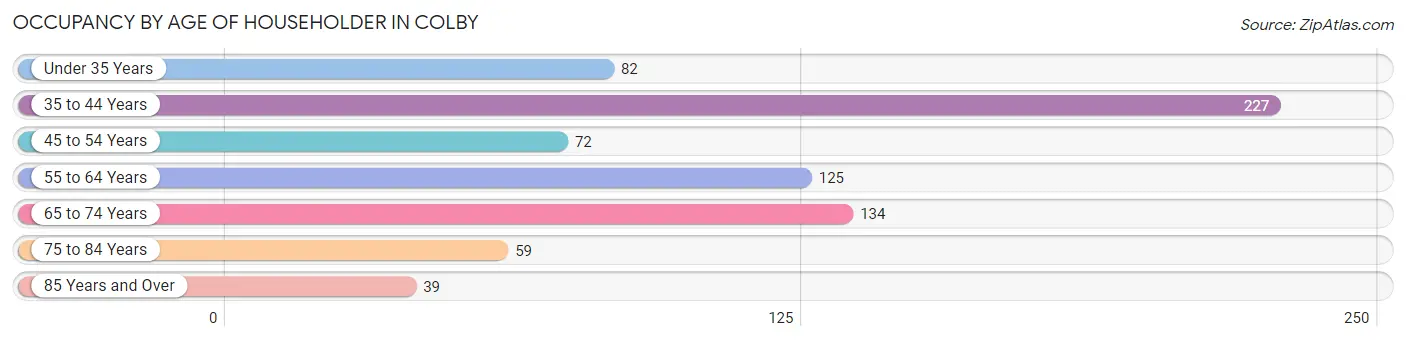
| Age Bracket | # Households | % Households |
| Under 35 Years | 82 | 11.1% |
| 35 to 44 Years | 227 | 30.8% |
| 45 to 54 Years | 72 | 9.8% |
| 55 to 64 Years | 125 | 16.9% |
| 65 to 74 Years | 134 | 18.2% |
| 75 to 84 Years | 59 | 8.0% |
| 85 Years and Over | 39 | 5.3% |
| Total | 738 | 100.0% |
Housing Finances in Colby
Median Income by Occupancy in Colby
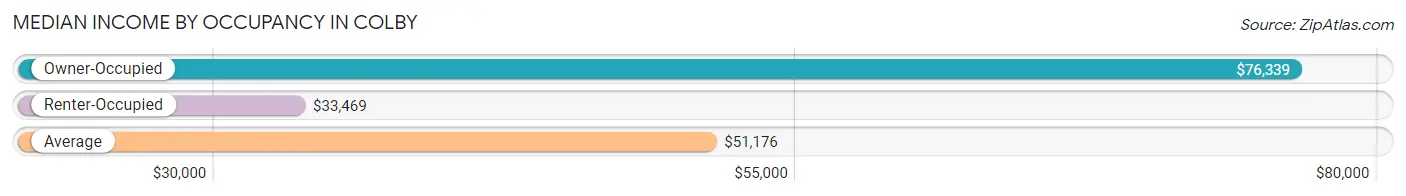
| Occupancy Type | # Households | Median Income |
| Owner-Occupied | 453 (61.4%) | $76,339 |
| Renter-Occupied | 285 (38.6%) | $33,469 |
| Average | 738 (100.0%) | $51,176 |
Occupancy by Householder Income Bracket in Colby
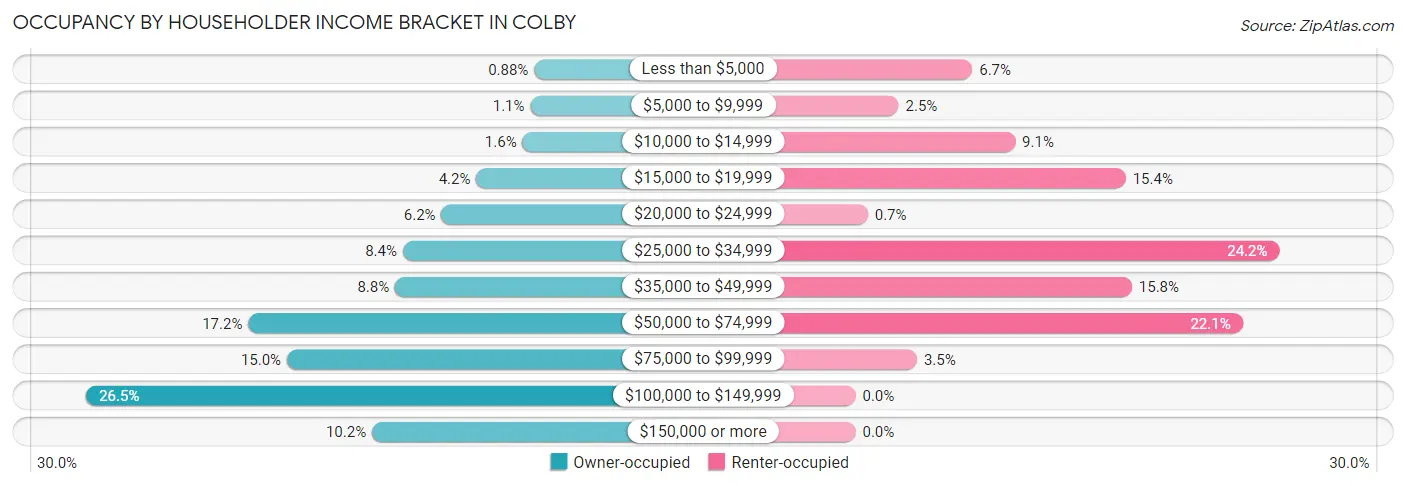
| Income Bracket | Owner-occupied | Renter-occupied |
| Less than $5,000 | 4 (0.9%) | 19 (6.7%) |
| $5,000 to $9,999 | 5 (1.1%) | 7 (2.5%) |
| $10,000 to $14,999 | 7 (1.5%) | 26 (9.1%) |
| $15,000 to $19,999 | 19 (4.2%) | 44 (15.4%) |
| $20,000 to $24,999 | 28 (6.2%) | 2 (0.7%) |
| $25,000 to $34,999 | 38 (8.4%) | 69 (24.2%) |
| $35,000 to $49,999 | 40 (8.8%) | 45 (15.8%) |
| $50,000 to $74,999 | 78 (17.2%) | 63 (22.1%) |
| $75,000 to $99,999 | 68 (15.0%) | 10 (3.5%) |
| $100,000 to $149,999 | 120 (26.5%) | 0 (0.0%) |
| $150,000 or more | 46 (10.2%) | 0 (0.0%) |
| Total | 453 (100.0%) | 285 (100.0%) |
Monthly Housing Cost Tiers in Colby
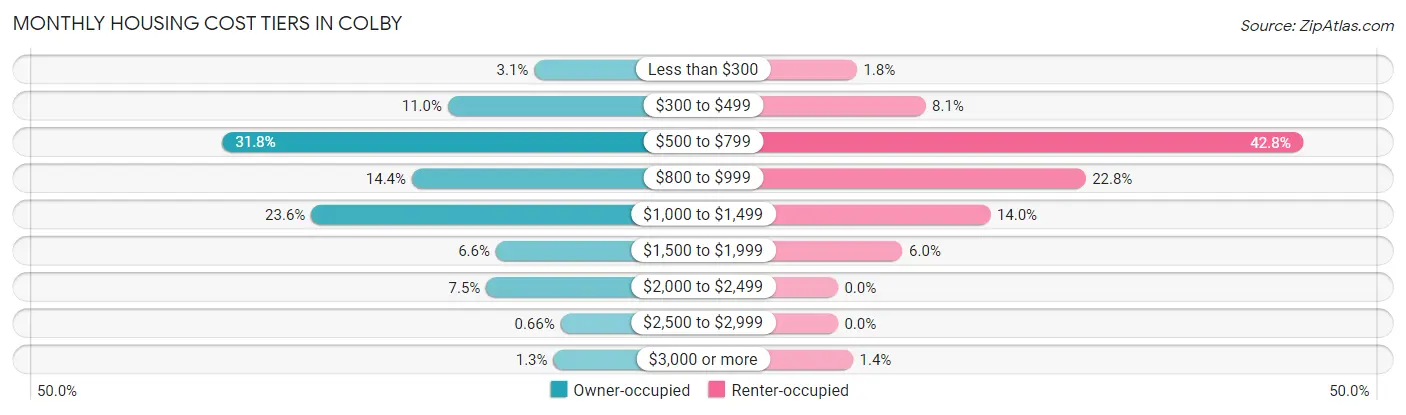
| Monthly Cost | Owner-occupied | Renter-occupied |
| Less than $300 | 14 (3.1%) | 5 (1.8%) |
| $300 to $499 | 50 (11.0%) | 23 (8.1%) |
| $500 to $799 | 144 (31.8%) | 122 (42.8%) |
| $800 to $999 | 65 (14.3%) | 65 (22.8%) |
| $1,000 to $1,499 | 107 (23.6%) | 40 (14.0%) |
| $1,500 to $1,999 | 30 (6.6%) | 17 (6.0%) |
| $2,000 to $2,499 | 34 (7.5%) | 0 (0.0%) |
| $2,500 to $2,999 | 3 (0.7%) | 0 (0.0%) |
| $3,000 or more | 6 (1.3%) | 4 (1.4%) |
| Total | 453 (100.0%) | 285 (100.0%) |
Physical Housing Characteristics in Colby
Housing Structures in Colby
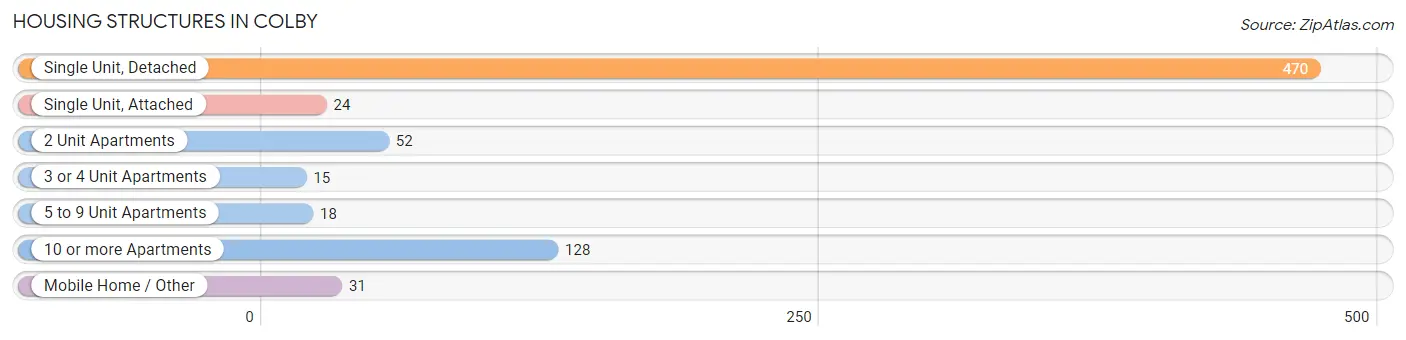
| Structure Type | # Housing Units | % Housing Units |
| Single Unit, Detached | 470 | 63.7% |
| Single Unit, Attached | 24 | 3.3% |
| 2 Unit Apartments | 52 | 7.0% |
| 3 or 4 Unit Apartments | 15 | 2.0% |
| 5 to 9 Unit Apartments | 18 | 2.4% |
| 10 or more Apartments | 128 | 17.3% |
| Mobile Home / Other | 31 | 4.2% |
| Total | 738 | 100.0% |
Housing Structures by Occupancy in Colby
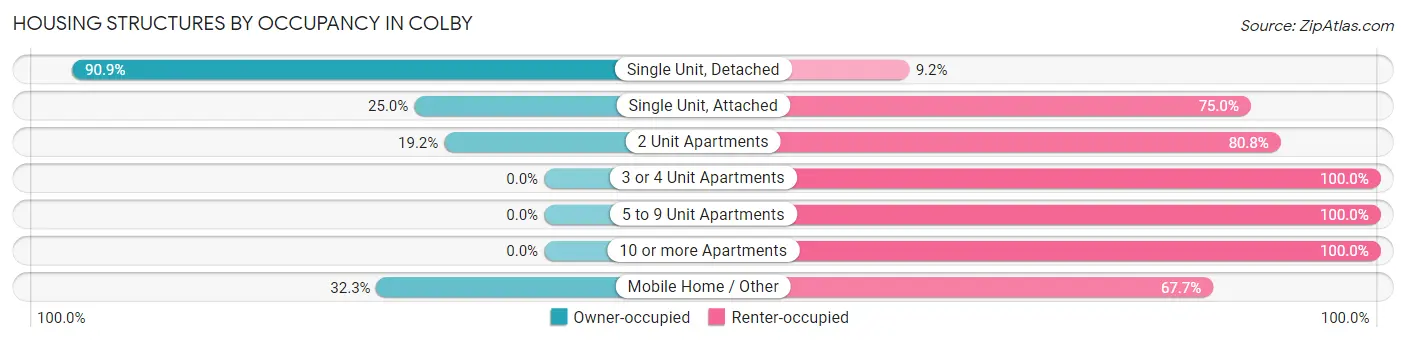
| Structure Type | Owner-occupied | Renter-occupied |
| Single Unit, Detached | 427 (90.8%) | 43 (9.1%) |
| Single Unit, Attached | 6 (25.0%) | 18 (75.0%) |
| 2 Unit Apartments | 10 (19.2%) | 42 (80.8%) |
| 3 or 4 Unit Apartments | 0 (0.0%) | 15 (100.0%) |
| 5 to 9 Unit Apartments | 0 (0.0%) | 18 (100.0%) |
| 10 or more Apartments | 0 (0.0%) | 128 (100.0%) |
| Mobile Home / Other | 10 (32.3%) | 21 (67.7%) |
| Total | 453 (61.4%) | 285 (38.6%) |
Housing Structures by Number of Rooms in Colby
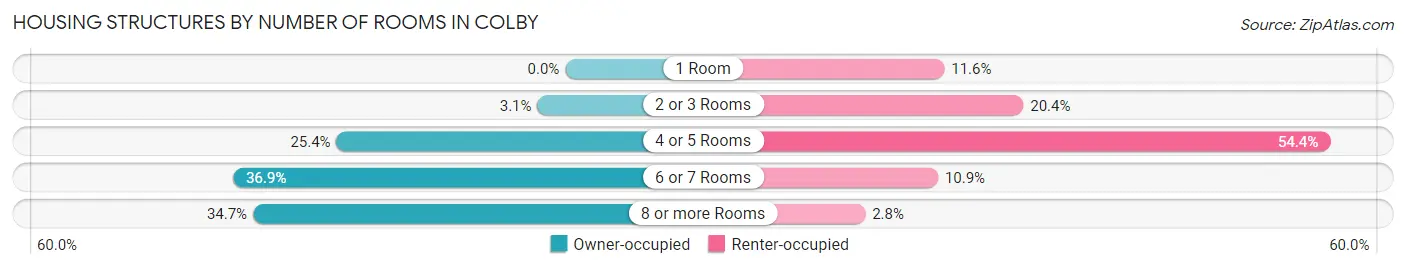
| Number of Rooms | Owner-occupied | Renter-occupied |
| 1 Room | 0 (0.0%) | 33 (11.6%) |
| 2 or 3 Rooms | 14 (3.1%) | 58 (20.3%) |
| 4 or 5 Rooms | 115 (25.4%) | 155 (54.4%) |
| 6 or 7 Rooms | 167 (36.9%) | 31 (10.9%) |
| 8 or more Rooms | 157 (34.7%) | 8 (2.8%) |
| Total | 453 (100.0%) | 285 (100.0%) |
Housing Structure by Heating Type in Colby
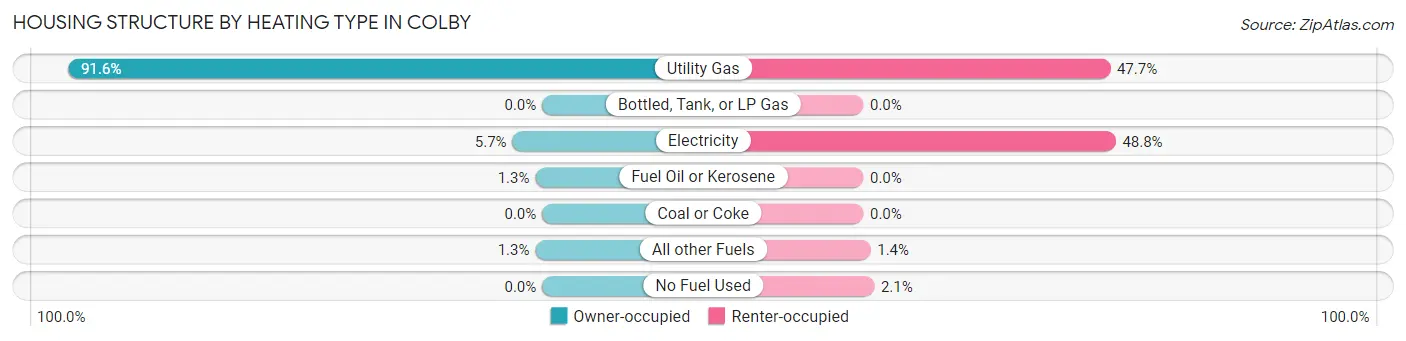
| Heating Type | Owner-occupied | Renter-occupied |
| Utility Gas | 415 (91.6%) | 136 (47.7%) |
| Bottled, Tank, or LP Gas | 0 (0.0%) | 0 (0.0%) |
| Electricity | 26 (5.7%) | 139 (48.8%) |
| Fuel Oil or Kerosene | 6 (1.3%) | 0 (0.0%) |
| Coal or Coke | 0 (0.0%) | 0 (0.0%) |
| All other Fuels | 6 (1.3%) | 4 (1.4%) |
| No Fuel Used | 0 (0.0%) | 6 (2.1%) |
| Total | 453 (100.0%) | 285 (100.0%) |
Household Vehicle Usage in Colby
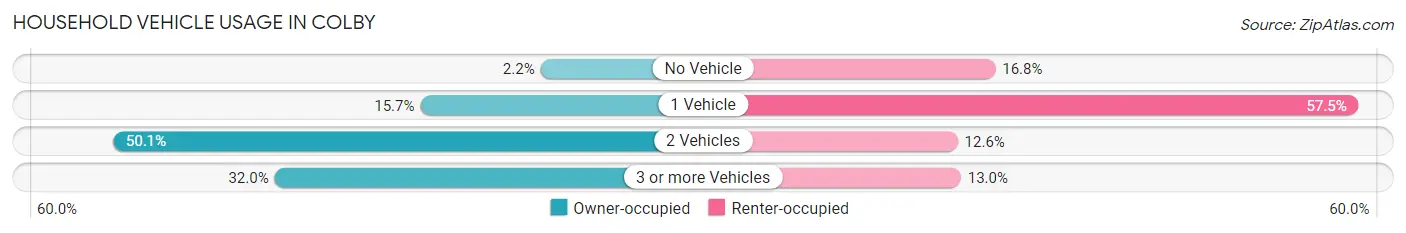
| Vehicles per Household | Owner-occupied | Renter-occupied |
| No Vehicle | 10 (2.2%) | 48 (16.8%) |
| 1 Vehicle | 71 (15.7%) | 164 (57.5%) |
| 2 Vehicles | 227 (50.1%) | 36 (12.6%) |
| 3 or more Vehicles | 145 (32.0%) | 37 (13.0%) |
| Total | 453 (100.0%) | 285 (100.0%) |
Real Estate & Mortgages in Colby
Real Estate and Mortgage Overview in Colby
| Characteristic | Without Mortgage | With Mortgage |
| Housing Units | 168 | 285 |
| Median Property Value | $121,000 | $154,000 |
| Median Household Income | $70,263 | $40 |
| Monthly Housing Costs | $568 | $6 |
| Real Estate Taxes | $2,259 | $0 |
Property Value by Mortgage Status in Colby
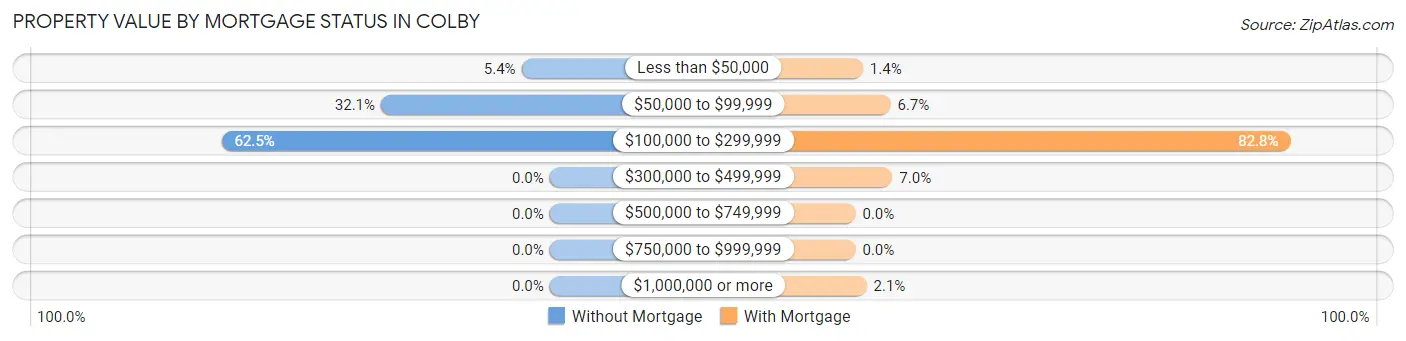
| Property Value | Without Mortgage | With Mortgage |
| Less than $50,000 | 9 (5.4%) | 4 (1.4%) |
| $50,000 to $99,999 | 54 (32.1%) | 19 (6.7%) |
| $100,000 to $299,999 | 105 (62.5%) | 236 (82.8%) |
| $300,000 to $499,999 | 0 (0.0%) | 20 (7.0%) |
| $500,000 to $749,999 | 0 (0.0%) | 0 (0.0%) |
| $750,000 to $999,999 | 0 (0.0%) | 0 (0.0%) |
| $1,000,000 or more | 0 (0.0%) | 6 (2.1%) |
| Total | 168 (100.0%) | 285 (100.0%) |
Household Income by Mortgage Status in Colby
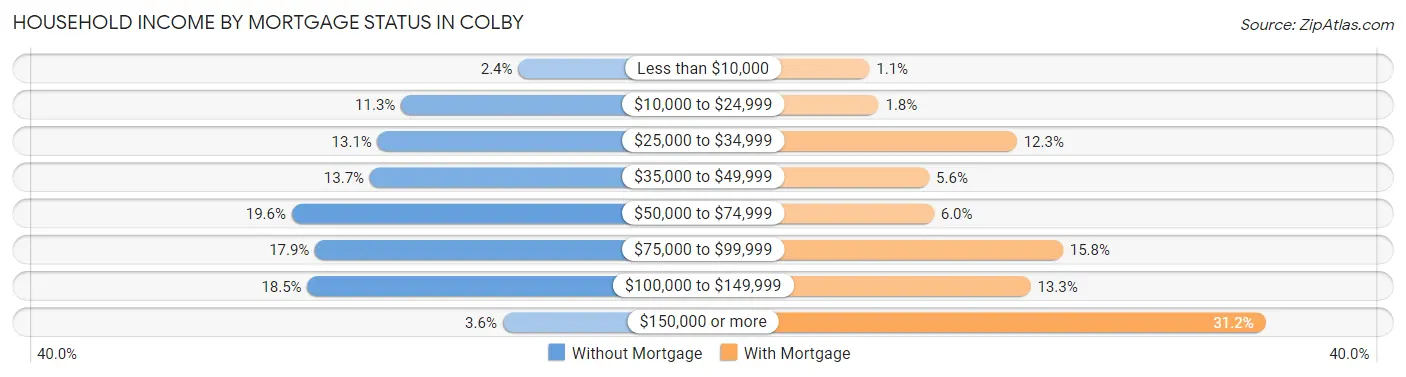
| Household Income | Without Mortgage | With Mortgage |
| Less than $10,000 | 4 (2.4%) | 3 (1.1%) |
| $10,000 to $24,999 | 19 (11.3%) | 5 (1.8%) |
| $25,000 to $34,999 | 22 (13.1%) | 35 (12.3%) |
| $35,000 to $49,999 | 23 (13.7%) | 16 (5.6%) |
| $50,000 to $74,999 | 33 (19.6%) | 17 (6.0%) |
| $75,000 to $99,999 | 30 (17.9%) | 45 (15.8%) |
| $100,000 to $149,999 | 31 (18.4%) | 38 (13.3%) |
| $150,000 or more | 6 (3.6%) | 89 (31.2%) |
| Total | 168 (100.0%) | 285 (100.0%) |
Property Value to Household Income Ratio in Colby
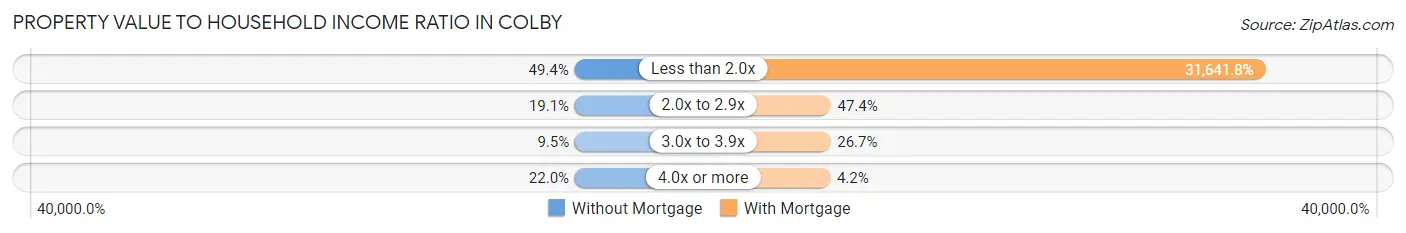
| Value-to-Income Ratio | Without Mortgage | With Mortgage |
| Less than 2.0x | 83 (49.4%) | 90,179 (31,641.8%) |
| 2.0x to 2.9x | 32 (19.1%) | 135 (47.4%) |
| 3.0x to 3.9x | 16 (9.5%) | 76 (26.7%) |
| 4.0x or more | 37 (22.0%) | 12 (4.2%) |
| Total | 168 (100.0%) | 285 (100.0%) |
Real Estate Taxes by Mortgage Status in Colby
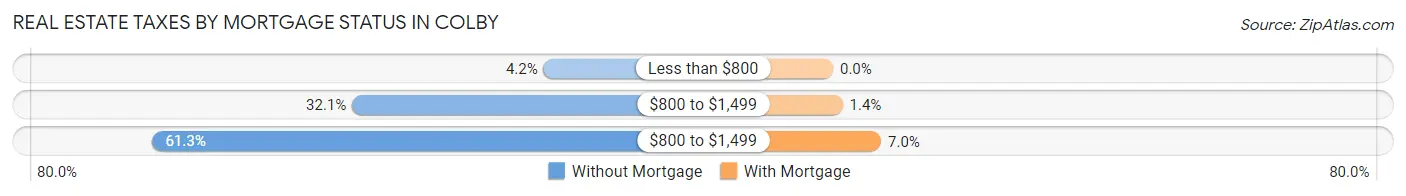
| Property Taxes | Without Mortgage | With Mortgage |
| Less than $800 | 7 (4.2%) | 0 (0.0%) |
| $800 to $1,499 | 54 (32.1%) | 4 (1.4%) |
| $800 to $1,499 | 103 (61.3%) | 20 (7.0%) |
| Total | 168 (100.0%) | 285 (100.0%) |
Health & Disability in Colby
Health Insurance Coverage by Age in Colby
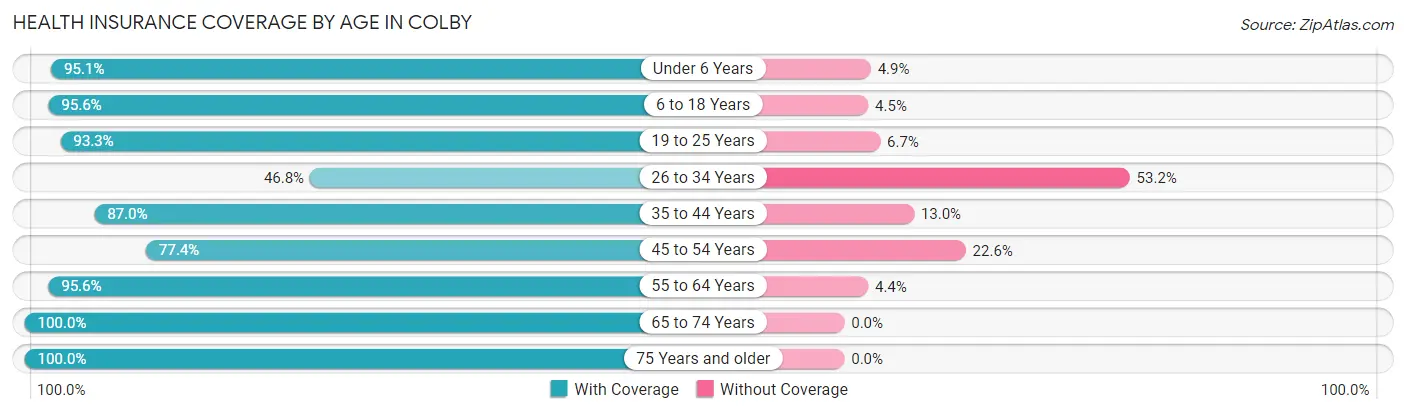
| Age Bracket | With Coverage | Without Coverage |
| Under 6 Years | 135 (95.1%) | 7 (4.9%) |
| 6 to 18 Years | 451 (95.6%) | 21 (4.4%) |
| 19 to 25 Years | 126 (93.3%) | 9 (6.7%) |
| 26 to 34 Years | 102 (46.8%) | 116 (53.2%) |
| 35 to 44 Years | 308 (87.0%) | 46 (13.0%) |
| 45 to 54 Years | 106 (77.4%) | 31 (22.6%) |
| 55 to 64 Years | 194 (95.6%) | 9 (4.4%) |
| 65 to 74 Years | 233 (100.0%) | 0 (0.0%) |
| 75 Years and older | 140 (100.0%) | 0 (0.0%) |
| Total | 1,795 (88.2%) | 239 (11.7%) |
Health Insurance Coverage by Citizenship Status in Colby
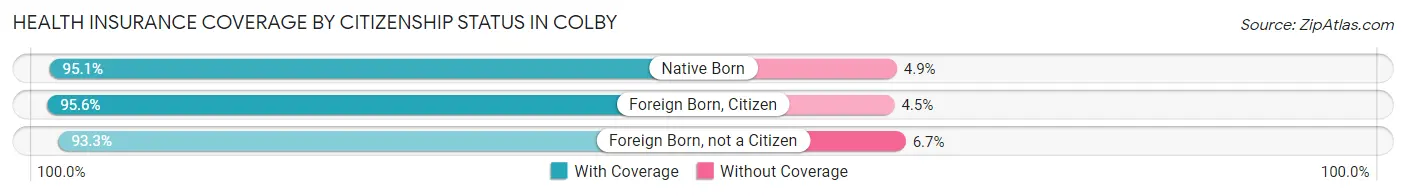
| Citizenship Status | With Coverage | Without Coverage |
| Native Born | 135 (95.1%) | 7 (4.9%) |
| Foreign Born, Citizen | 451 (95.6%) | 21 (4.4%) |
| Foreign Born, not a Citizen | 126 (93.3%) | 9 (6.7%) |
Health Insurance Coverage by Household Income in Colby
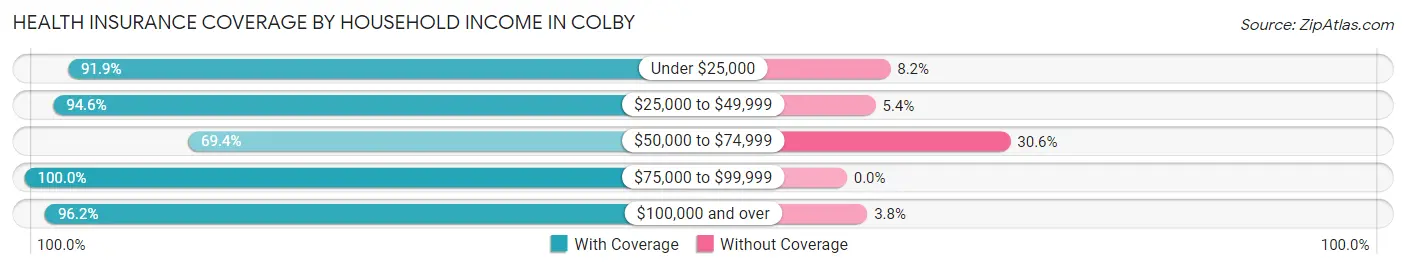
| Household Income | With Coverage | Without Coverage |
| Under $25,000 | 214 (91.8%) | 19 (8.2%) |
| $25,000 to $49,999 | 352 (94.6%) | 20 (5.4%) |
| $50,000 to $74,999 | 403 (69.4%) | 178 (30.6%) |
| $75,000 to $99,999 | 255 (100.0%) | 0 (0.0%) |
| $100,000 and over | 552 (96.2%) | 22 (3.8%) |
Public vs Private Health Insurance Coverage by Age in Colby
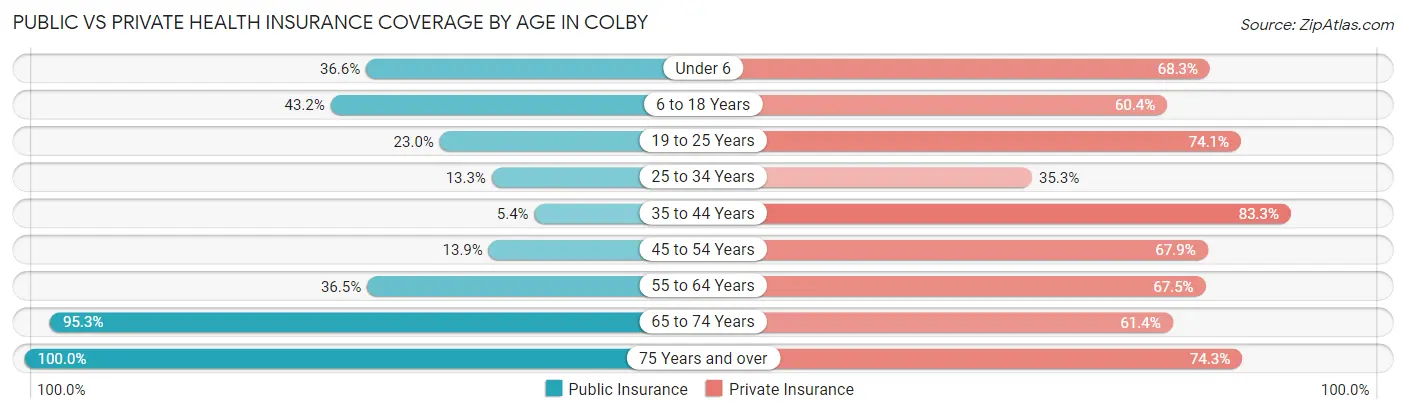
| Age Bracket | Public Insurance | Private Insurance |
| Under 6 | 52 (36.6%) | 97 (68.3%) |
| 6 to 18 Years | 204 (43.2%) | 285 (60.4%) |
| 19 to 25 Years | 31 (23.0%) | 100 (74.1%) |
| 25 to 34 Years | 29 (13.3%) | 77 (35.3%) |
| 35 to 44 Years | 19 (5.4%) | 295 (83.3%) |
| 45 to 54 Years | 19 (13.9%) | 93 (67.9%) |
| 55 to 64 Years | 74 (36.4%) | 137 (67.5%) |
| 65 to 74 Years | 222 (95.3%) | 143 (61.4%) |
| 75 Years and over | 140 (100.0%) | 104 (74.3%) |
| Total | 790 (38.8%) | 1,331 (65.4%) |
Disability Status by Sex by Age in Colby
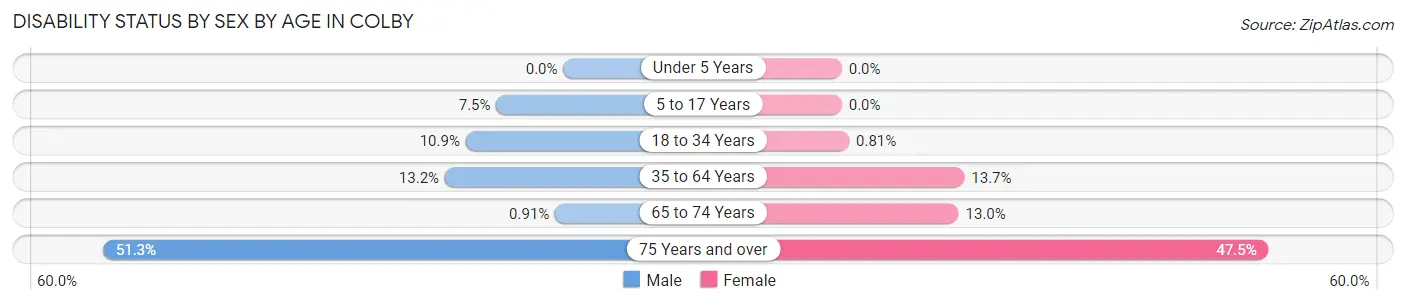
| Age Bracket | Male | Female |
| Under 5 Years | 0 (0.0%) | 0 (0.0%) |
| 5 to 17 Years | 22 (7.5%) | 0 (0.0%) |
| 18 to 34 Years | 15 (10.9%) | 2 (0.8%) |
| 35 to 64 Years | 50 (13.2%) | 43 (13.7%) |
| 65 to 74 Years | 1 (0.9%) | 16 (13.0%) |
| 75 Years and over | 20 (51.3%) | 48 (47.5%) |
Disability Class by Sex by Age in Colby
Disability Class: Hearing Difficulty
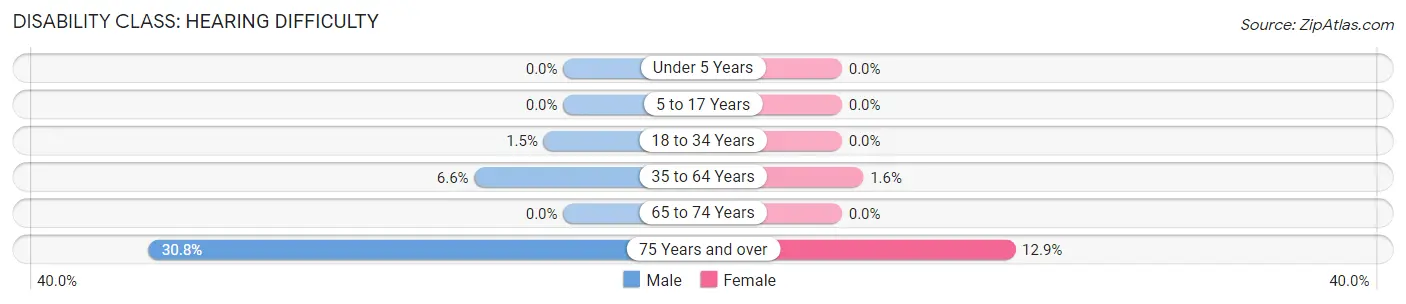
| Age Bracket | Male | Female |
| Under 5 Years | 0 (0.0%) | 0 (0.0%) |
| 5 to 17 Years | 0 (0.0%) | 0 (0.0%) |
| 18 to 34 Years | 2 (1.5%) | 0 (0.0%) |
| 35 to 64 Years | 25 (6.6%) | 5 (1.6%) |
| 65 to 74 Years | 0 (0.0%) | 0 (0.0%) |
| 75 Years and over | 12 (30.8%) | 13 (12.9%) |
Disability Class: Vision Difficulty
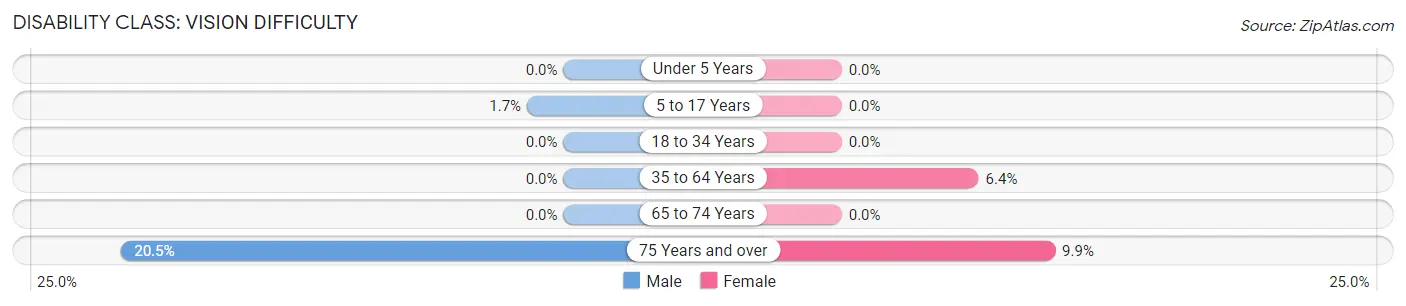
| Age Bracket | Male | Female |
| Under 5 Years | 0 (0.0%) | 0 (0.0%) |
| 5 to 17 Years | 5 (1.7%) | 0 (0.0%) |
| 18 to 34 Years | 0 (0.0%) | 0 (0.0%) |
| 35 to 64 Years | 0 (0.0%) | 20 (6.4%) |
| 65 to 74 Years | 0 (0.0%) | 0 (0.0%) |
| 75 Years and over | 8 (20.5%) | 10 (9.9%) |
Disability Class: Cognitive Difficulty
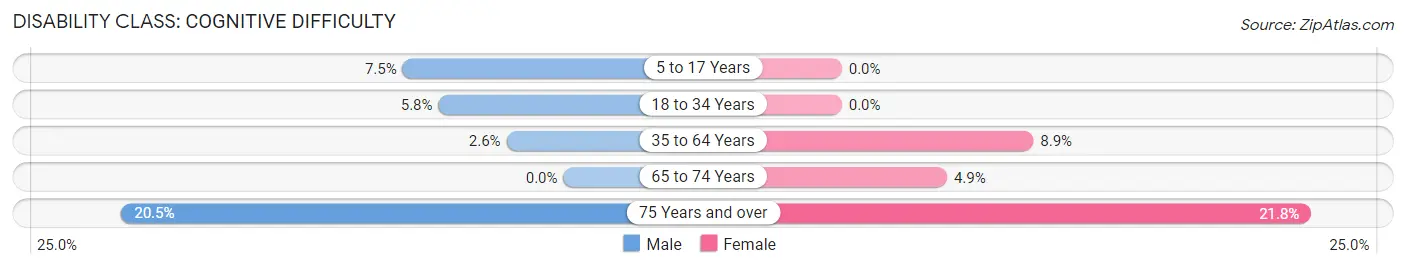
| Age Bracket | Male | Female |
| 5 to 17 Years | 22 (7.5%) | 0 (0.0%) |
| 18 to 34 Years | 8 (5.8%) | 0 (0.0%) |
| 35 to 64 Years | 10 (2.6%) | 28 (8.9%) |
| 65 to 74 Years | 0 (0.0%) | 6 (4.9%) |
| 75 Years and over | 8 (20.5%) | 22 (21.8%) |
Disability Class: Ambulatory Difficulty
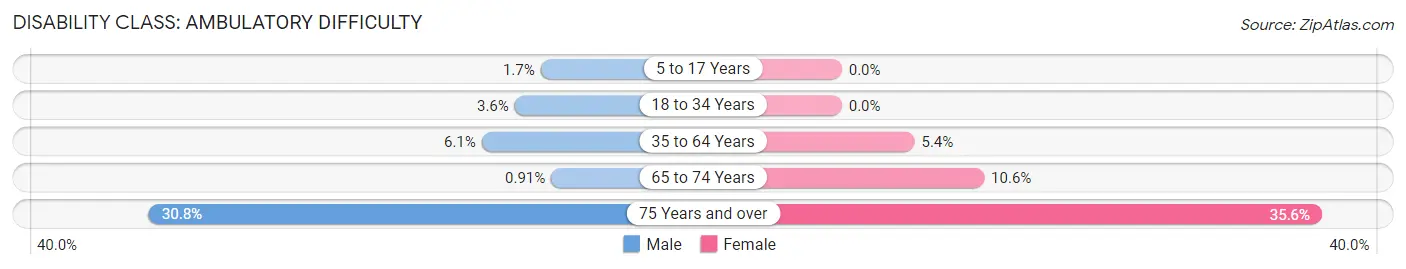
| Age Bracket | Male | Female |
| 5 to 17 Years | 5 (1.7%) | 0 (0.0%) |
| 18 to 34 Years | 5 (3.6%) | 0 (0.0%) |
| 35 to 64 Years | 23 (6.1%) | 17 (5.4%) |
| 65 to 74 Years | 1 (0.9%) | 13 (10.6%) |
| 75 Years and over | 12 (30.8%) | 36 (35.6%) |
Disability Class: Self-Care Difficulty
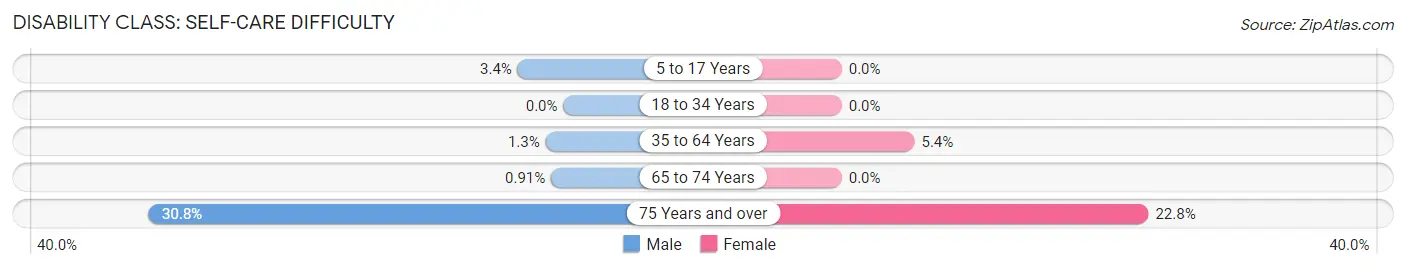
| Age Bracket | Male | Female |
| 5 to 17 Years | 10 (3.4%) | 0 (0.0%) |
| 18 to 34 Years | 0 (0.0%) | 0 (0.0%) |
| 35 to 64 Years | 5 (1.3%) | 17 (5.4%) |
| 65 to 74 Years | 1 (0.9%) | 0 (0.0%) |
| 75 Years and over | 12 (30.8%) | 23 (22.8%) |
Technology Access in Colby
Computing Device Access in Colby
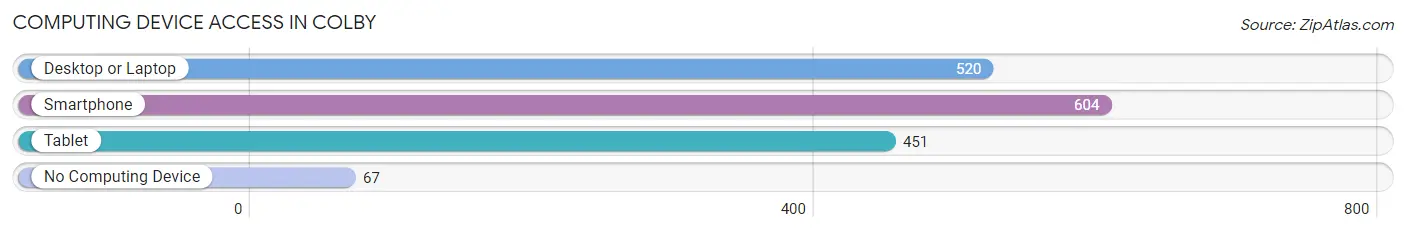
| Device Type | # Households | % Households |
| Desktop or Laptop | 520 | 70.5% |
| Smartphone | 604 | 81.8% |
| Tablet | 451 | 61.1% |
| No Computing Device | 67 | 9.1% |
| Total | 738 | 100.0% |
Internet Access in Colby
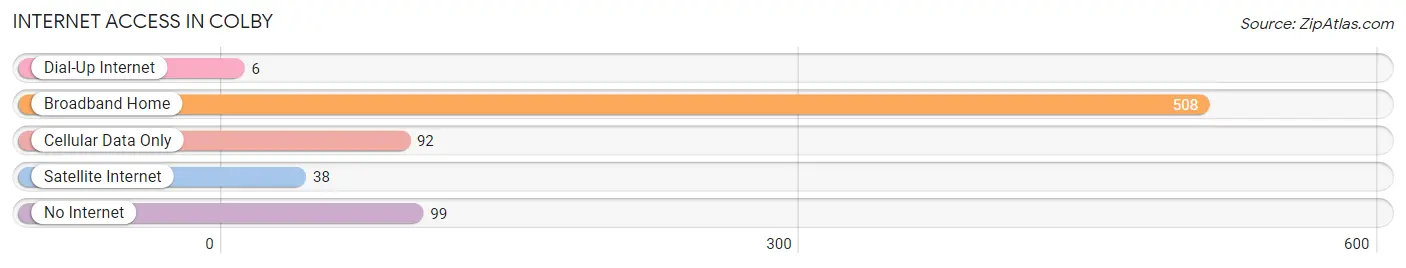
| Internet Type | # Households | % Households |
| Dial-Up Internet | 6 | 0.8% |
| Broadband Home | 508 | 68.8% |
| Cellular Data Only | 92 | 12.5% |
| Satellite Internet | 38 | 5.1% |
| No Internet | 99 | 13.4% |
| Total | 738 | 100.0% |
Colby Summary
Colby, Wisconsin is a small city located in Clark County, Wisconsin. It is situated in the north-central part of the state, about 40 miles east of Eau Claire and about 50 miles west of Wausau. The city is home to a population of approximately 3,000 people, and is the county seat of Clark County.
History
Colby was founded in 1883 by a group of settlers from Colby, Kansas. The city was named after the Kansas town, which was named after the town of Colby, England. The settlers were attracted to the area due to its rich soil and abundant timber. The first settlers built a sawmill and a gristmill, and the town quickly grew. By the early 1900s, Colby had become a thriving community with a variety of businesses, including a bank, a hotel, a newspaper, and a variety of stores.
In the early 1900s, Colby was a major center for the lumber industry. The city was home to several large sawmills, and the lumber industry provided employment for many of the city’s residents. The lumber industry declined in the mid-1900s, and the city’s economy shifted to other industries, such as manufacturing and agriculture.
Geography
Colby is located in the north-central part of Wisconsin, about 40 miles east of Eau Claire and about 50 miles west of Wausau. The city is situated in the middle of Clark County, and is surrounded by the towns of Abbotsford, Curtiss, Dorchester, and Unity. The city is located on the banks of the Eau Claire River, and is surrounded by rolling hills and forests.
Economy
Colby’s economy is largely based on agriculture and manufacturing. The city is home to several large manufacturing companies, including a paper mill, a plastics factory, and a metal fabrication plant. The city is also home to several small businesses, including restaurants, retail stores, and service providers.
Agriculture is also an important part of the city’s economy. The surrounding area is home to several large farms, and the city is home to several agricultural supply stores.
Demographics
As of the 2010 census, Colby had a population of 3,000 people. The city is predominantly white, with about 90% of the population identifying as white. The city also has a small Hispanic population, with about 5% of the population identifying as Hispanic or Latino. The median household income in Colby is $41,000, and the median home value is $125,000.
Colby is a small city with a rich history and a diverse economy. The city is home to a variety of businesses, and the surrounding area is home to several large farms. The city is predominantly white, with a small Hispanic population. The median household income in Colby is $41,000, and the median home value is $125,000.
Common Questions
What is Per Capita Income in Colby?
Per Capita income in Colby is $24,334.
What is the Median Family Income in Colby?
Median Family Income in Colby is $58,971.
What is the Median Household income in Colby?
Median Household Income in Colby is $51,176.
What is Income or Wage Gap in Colby?
Income or Wage Gap in Colby is 42.3%.
Women in Colby earn 57.7 cents for every dollar earned by a man.
What is Inequality or Gini Index in Colby?
Inequality or Gini Index in Colby is 0.41.
What is the Total Population of Colby?
Total Population of Colby is 2,132.
What is the Total Male Population of Colby?
Total Male Population of Colby is 1,099.
What is the Total Female Population of Colby?
Total Female Population of Colby is 1,033.
What is the Ratio of Males per 100 Females in Colby?
There are 106.39 Males per 100 Females in Colby.
What is the Ratio of Females per 100 Males in Colby?
There are 93.99 Females per 100 Males in Colby.
What is the Median Population Age in Colby?
Median Population Age in Colby is 38.2 Years.
What is the Average Family Size in Colby
Average Family Size in Colby is 3.1 People.
What is the Average Household Size in Colby
Average Household Size in Colby is 2.7 People.
How Large is the Labor Force in Colby?
There are 981 People in the Labor Forcein in Colby.
What is the Percentage of People in the Labor Force in Colby?
58.9% of People are in the Labor Force in Colby.
What is the Unemployment Rate in Colby?
Unemployment Rate in Colby is 3.9%.