Chetek, WI Map & Demographics
Chetek Map
Chetek Overview
$26,736
PER CAPITA INCOME
$60,500
AVG FAMILY INCOME
$51,250
AVG HOUSEHOLD INCOME
15.7%
WAGE / INCOME GAP [ % ]
84.3¢/ $1
WAGE / INCOME GAP [ $ ]
0.37
INEQUALITY / GINI INDEX
2,264
TOTAL POPULATION
1,161
MALE POPULATION
1,103
FEMALE POPULATION
105.26
MALES / 100 FEMALES
95.00
FEMALES / 100 MALES
46.4
MEDIAN AGE
3.0
AVG FAMILY SIZE
2.4
AVG HOUSEHOLD SIZE
1,148
LABOR FORCE [ PEOPLE ]
59.1%
PERCENT IN LABOR FORCE
3.5%
UNEMPLOYMENT RATE
Chetek Zip Codes
Chetek Area Codes
Income in Chetek
Income Overview in Chetek
Per Capita Income in Chetek is $26,736, while median incomes of families and households are $60,500 and $51,250 respectively.
| Characteristic | Number | Measure |
| Per Capita Income | 2,264 | $26,736 |
| Median Family Income | 542 | $60,500 |
| Mean Family Income | 542 | $71,827 |
| Median Household Income | 906 | $51,250 |
| Mean Household Income | 906 | $62,361 |
| Income Deficit | 542 | $0 |
| Wage / Income Gap (%) | 2,264 | 15.72% |
| Wage / Income Gap ($) | 2,264 | 84.28¢ per $1 |
| Gini / Inequality Index | 2,264 | 0.37 |
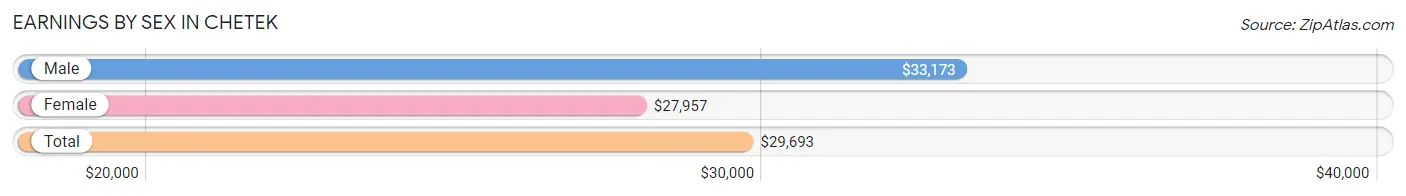
Earnings by Sex in Chetek
Average Earnings in Chetek are $29,693, $33,173 for men and $27,957 for women, a difference of 15.7%.
| Sex | Number | Average Earnings |
| Male | 720 (60.0%) | $33,173 |
| Female | 481 (40.1%) | $27,957 |
| Total | 1,201 (100.0%) | $29,693 |
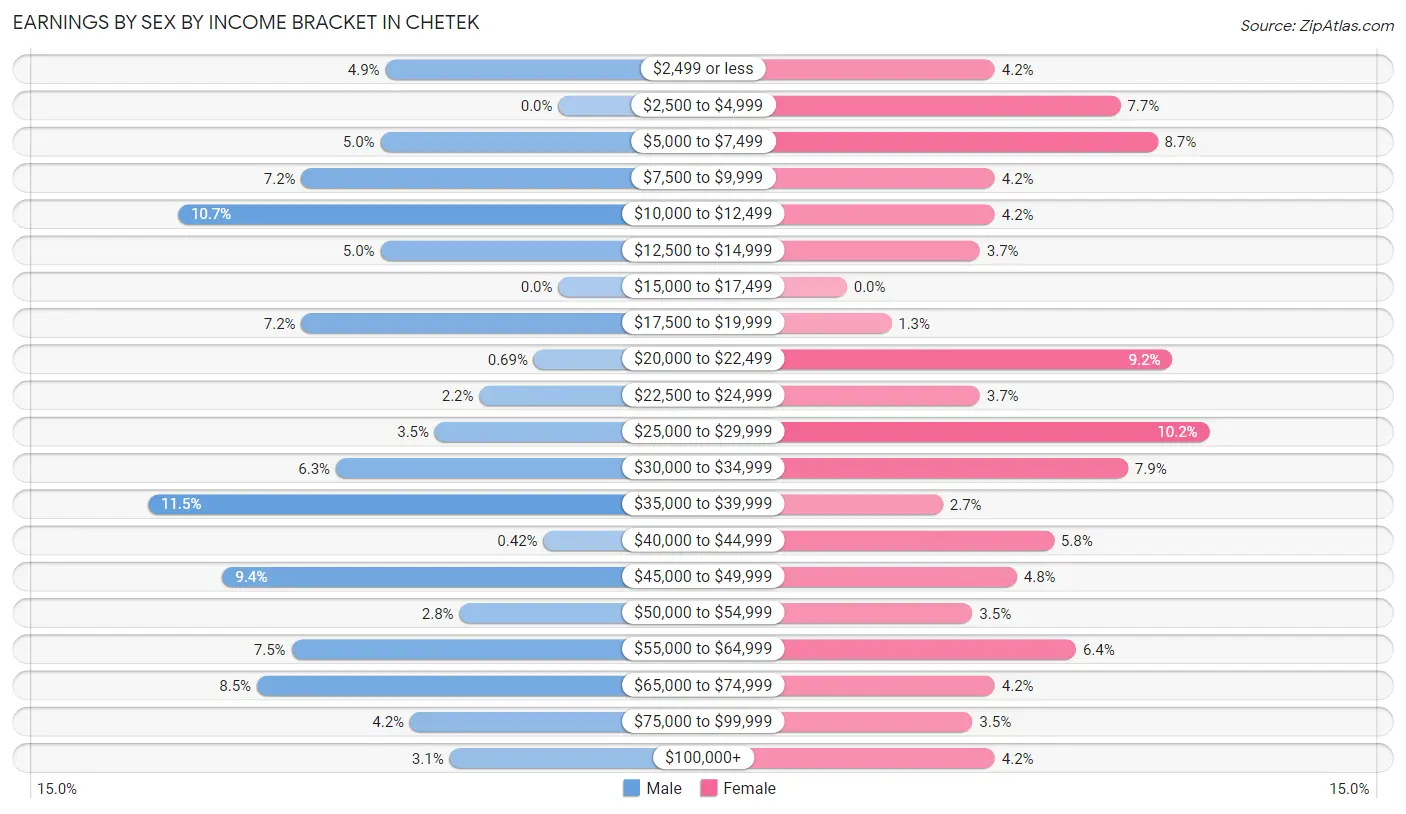
Earnings by Sex by Income Bracket in Chetek
The most common earnings brackets in Chetek are $35,000 to $39,999 for men (83 | 11.5%) and $25,000 to $29,999 for women (49 | 10.2%).
| Income | Male | Female |
| $2,499 or less | 35 (4.9%) | 20 (4.2%) |
| $2,500 to $4,999 | 0 (0.0%) | 37 (7.7%) |
| $5,000 to $7,499 | 36 (5.0%) | 42 (8.7%) |
| $7,500 to $9,999 | 52 (7.2%) | 20 (4.2%) |
| $10,000 to $12,499 | 77 (10.7%) | 20 (4.2%) |
| $12,500 to $14,999 | 36 (5.0%) | 18 (3.7%) |
| $15,000 to $17,499 | 0 (0.0%) | 0 (0.0%) |
| $17,500 to $19,999 | 52 (7.2%) | 6 (1.3%) |
| $20,000 to $22,499 | 5 (0.7%) | 44 (9.1%) |
| $22,500 to $24,999 | 16 (2.2%) | 18 (3.7%) |
| $25,000 to $29,999 | 25 (3.5%) | 49 (10.2%) |
| $30,000 to $34,999 | 45 (6.2%) | 38 (7.9%) |
| $35,000 to $39,999 | 83 (11.5%) | 13 (2.7%) |
| $40,000 to $44,999 | 3 (0.4%) | 28 (5.8%) |
| $45,000 to $49,999 | 68 (9.4%) | 23 (4.8%) |
| $50,000 to $54,999 | 20 (2.8%) | 17 (3.5%) |
| $55,000 to $64,999 | 54 (7.5%) | 31 (6.4%) |
| $65,000 to $74,999 | 61 (8.5%) | 20 (4.2%) |
| $75,000 to $99,999 | 30 (4.2%) | 17 (3.5%) |
| $100,000+ | 22 (3.1%) | 20 (4.2%) |
| Total | 720 (100.0%) | 481 (100.0%) |
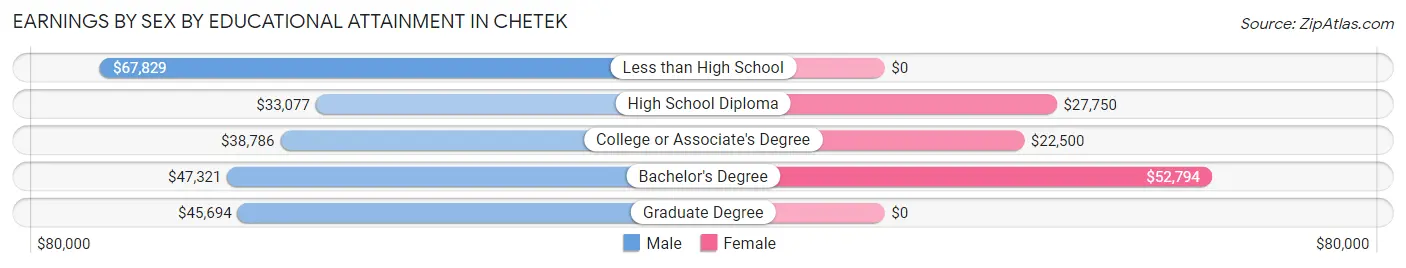
Earnings by Sex by Educational Attainment in Chetek
Average earnings in Chetek are $38,415 for men and $28,689 for women, a difference of 25.3%. Men with an educational attainment of less than high school enjoy the highest average annual earnings of $67,829, while those with high school diploma education earn the least with $33,077. Women with an educational attainment of bachelor's degree earn the most with the average annual earnings of $52,794, while those with college or associate's degree education have the smallest earnings of $22,500.
| Educational Attainment | Male Income | Female Income |
| Less than High School | $67,829 | $0 |
| High School Diploma | $33,077 | $27,750 |
| College or Associate's Degree | $38,786 | $22,500 |
| Bachelor's Degree | $47,321 | $52,794 |
| Graduate Degree | $45,694 | $0 |
| Total | $38,415 | $28,689 |
Family Income in Chetek
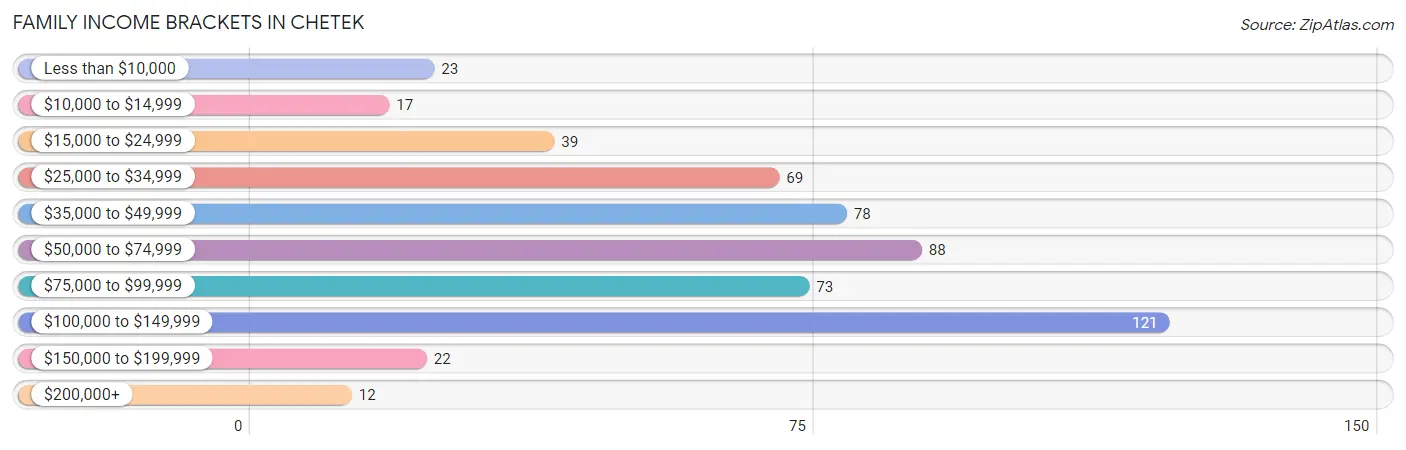
Family Income Brackets in Chetek
According to the Chetek family income data, there are 121 families falling into the $100,000 to $149,999 income range, which is the most common income bracket and makes up 22.3% of all families. Conversely, the $200,000+ income bracket is the least frequent group with only 12 families (2.2%) belonging to this category.
| Income Bracket | # Families | % Families |
| Less than $10,000 | 23 | 4.2% |
| $10,000 to $14,999 | 17 | 3.1% |
| $15,000 to $24,999 | 39 | 7.2% |
| $25,000 to $34,999 | 69 | 12.7% |
| $35,000 to $49,999 | 78 | 14.4% |
| $50,000 to $74,999 | 88 | 16.2% |
| $75,000 to $99,999 | 73 | 13.5% |
| $100,000 to $149,999 | 121 | 22.3% |
| $150,000 to $199,999 | 22 | 4.1% |
| $200,000+ | 12 | 2.2% |
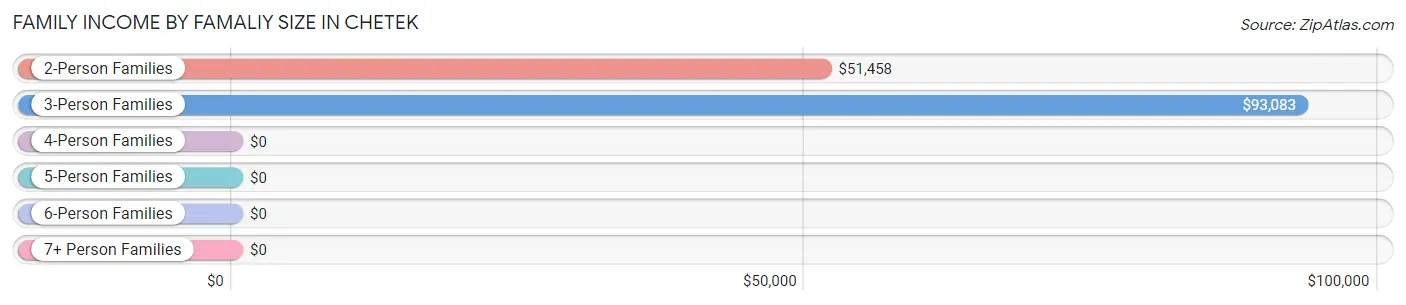
Family Income by Famaliy Size in Chetek
3-person families (141 | 26.0%) account for the highest median family income in Chetek with $93,083 per family, while 3-person families (141 | 26.0%) have the highest median income of $31,028 per family member.
| Income Bracket | # Families | Median Income |
| 2-Person Families | 302 (55.7%) | $51,458 |
| 3-Person Families | 141 (26.0%) | $93,083 |
| 4-Person Families | 62 (11.4%) | $0 |
| 5-Person Families | 24 (4.4%) | $0 |
| 6-Person Families | 0 (0.0%) | $0 |
| 7+ Person Families | 13 (2.4%) | $0 |
| Total | 542 (100.0%) | $60,500 |
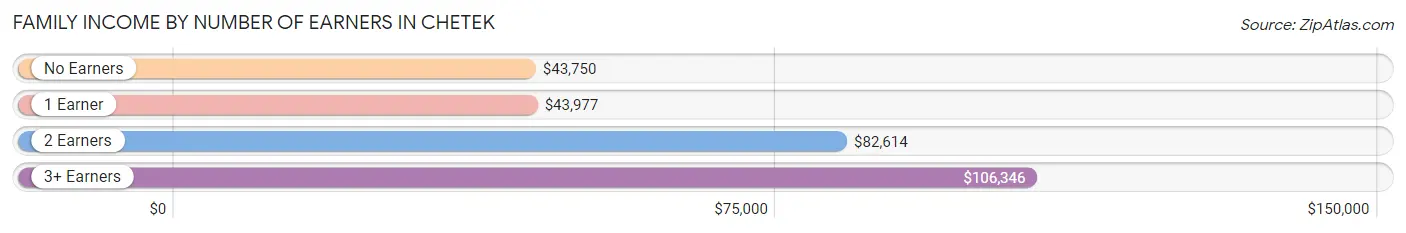
Family Income by Number of Earners in Chetek
The median family income in Chetek is $60,500, with families comprising 3+ earners (52) having the highest median family income of $106,346, while families with no earners (82) have the lowest median family income of $43,750, accounting for 9.6% and 15.1% of families, respectively.
| Number of Earners | # Families | Median Income |
| No Earners | 82 (15.1%) | $43,750 |
| 1 Earner | 155 (28.6%) | $43,977 |
| 2 Earners | 253 (46.7%) | $82,614 |
| 3+ Earners | 52 (9.6%) | $106,346 |
| Total | 542 (100.0%) | $60,500 |
Household Income in Chetek
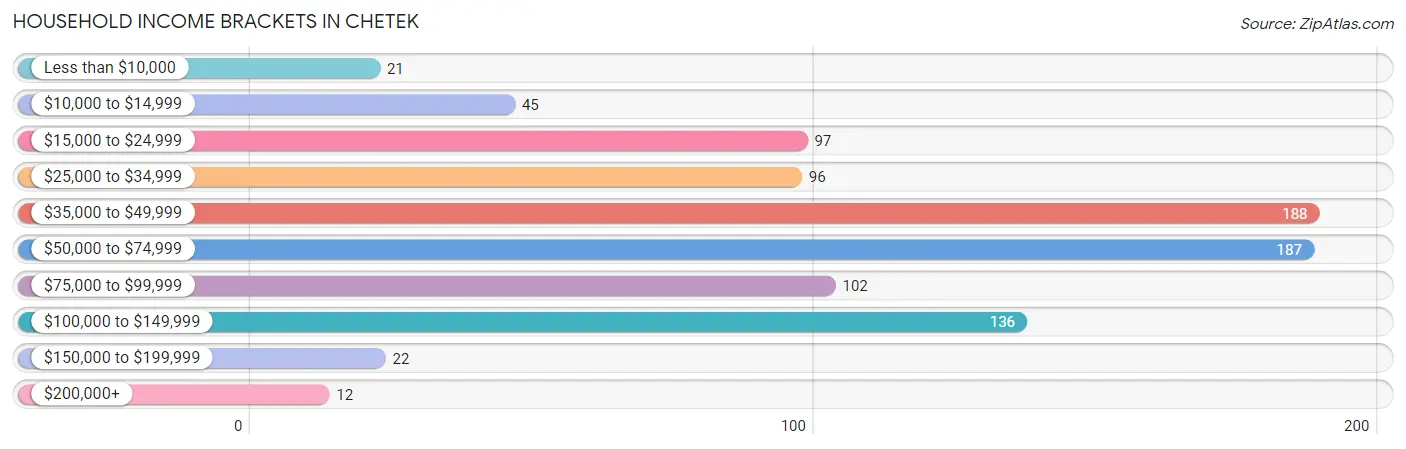
Household Income Brackets in Chetek
With 188 households falling in the category, the $35,000 to $49,999 income range is the most frequent in Chetek, accounting for 20.7% of all households. In contrast, only 12 households (1.3%) fall into the $200,000+ income bracket, making it the least populous group.
| Income Bracket | # Households | % Households |
| Less than $10,000 | 21 | 2.3% |
| $10,000 to $14,999 | 45 | 5.0% |
| $15,000 to $24,999 | 97 | 10.7% |
| $25,000 to $34,999 | 96 | 10.6% |
| $35,000 to $49,999 | 188 | 20.8% |
| $50,000 to $74,999 | 187 | 20.6% |
| $75,000 to $99,999 | 102 | 11.3% |
| $100,000 to $149,999 | 136 | 15.0% |
| $150,000 to $199,999 | 22 | 2.4% |
| $200,000+ | 12 | 1.3% |
Household Income by Householder Age in Chetek
The median household income in Chetek is $51,250, with the highest median household income of $68,323 found in the 25 to 44 years age bracket for the primary householder. A total of 297 households (32.8%) fall into this category. Meanwhile, the 65+ years age bracket for the primary householder has the lowest median household income of $38,547, with 277 households (30.6%) in this group.
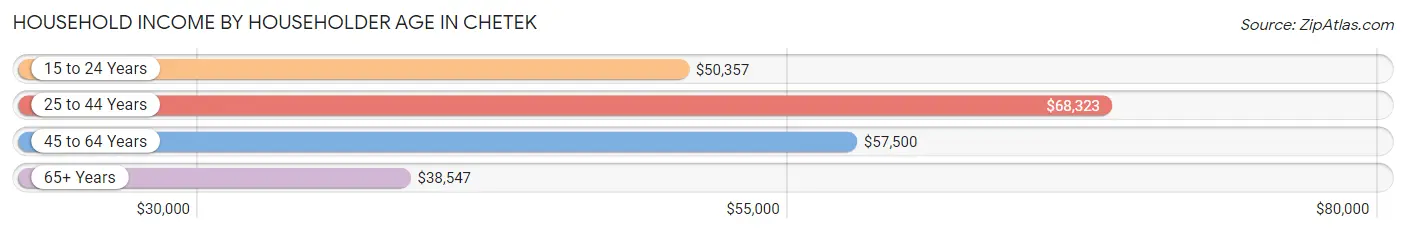
| Income Bracket | # Households | Median Income |
| 15 to 24 Years | 32 (3.5%) | $50,357 |
| 25 to 44 Years | 297 (32.8%) | $68,323 |
| 45 to 64 Years | 300 (33.1%) | $57,500 |
| 65+ Years | 277 (30.6%) | $38,547 |
| Total | 906 (100.0%) | $51,250 |
Poverty in Chetek
Income Below Poverty by Sex and Age in Chetek
With 20.5% poverty level for males and 22.8% for females among the residents of Chetek, 5 year old males and under 5 year old females are the most vulnerable to poverty, with 17 males (100.0%) and 68 females (81.9%) in their respective age groups living below the poverty level.
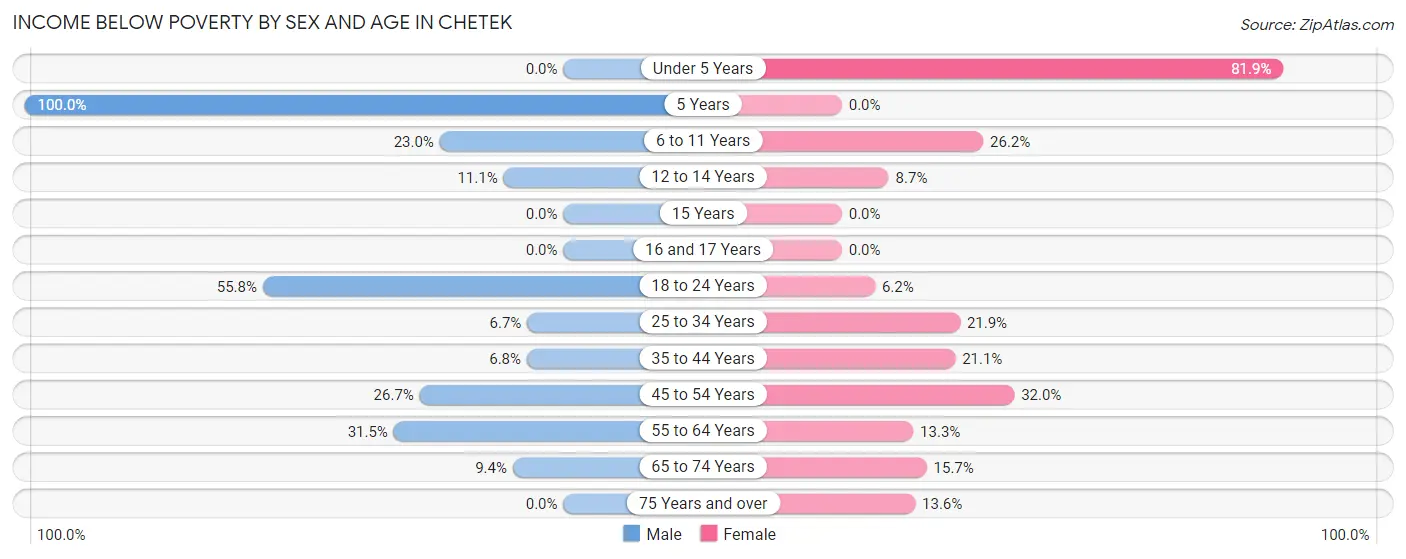
| Age Bracket | Male | Female |
| Under 5 Years | 0 (0.0%) | 68 (81.9%) |
| 5 Years | 17 (100.0%) | 0 (0.0%) |
| 6 to 11 Years | 14 (23.0%) | 16 (26.2%) |
| 12 to 14 Years | 2 (11.1%) | 4 (8.7%) |
| 15 Years | 0 (0.0%) | 0 (0.0%) |
| 16 and 17 Years | 0 (0.0%) | 0 (0.0%) |
| 18 to 24 Years | 82 (55.8%) | 4 (6.1%) |
| 25 to 34 Years | 11 (6.7%) | 25 (21.9%) |
| 35 to 44 Years | 9 (6.8%) | 16 (21.0%) |
| 45 to 54 Years | 28 (26.7%) | 48 (32.0%) |
| 55 to 64 Years | 57 (31.5%) | 22 (13.3%) |
| 65 to 74 Years | 12 (9.4%) | 17 (15.7%) |
| 75 Years and over | 0 (0.0%) | 20 (13.6%) |
| Total | 232 (20.5%) | 240 (22.8%) |
Income Above Poverty by Sex and Age in Chetek
According to the poverty statistics in Chetek, males aged under 5 years and females aged 15 years are the age groups that are most secure financially, with 100.0% of males and 100.0% of females in these age groups living above the poverty line.
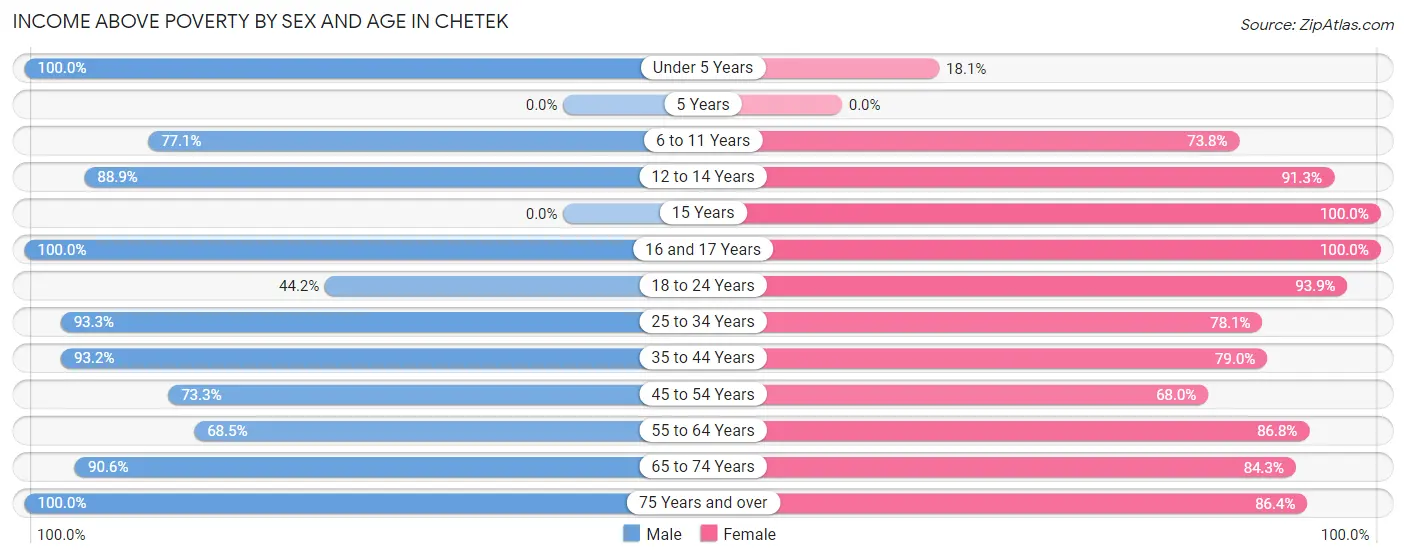
| Age Bracket | Male | Female |
| Under 5 Years | 30 (100.0%) | 15 (18.1%) |
| 5 Years | 0 (0.0%) | 0 (0.0%) |
| 6 to 11 Years | 47 (77.0%) | 45 (73.8%) |
| 12 to 14 Years | 16 (88.9%) | 42 (91.3%) |
| 15 Years | 0 (0.0%) | 6 (100.0%) |
| 16 and 17 Years | 42 (100.0%) | 32 (100.0%) |
| 18 to 24 Years | 65 (44.2%) | 61 (93.9%) |
| 25 to 34 Years | 153 (93.3%) | 89 (78.1%) |
| 35 to 44 Years | 124 (93.2%) | 60 (78.9%) |
| 45 to 54 Years | 77 (73.3%) | 102 (68.0%) |
| 55 to 64 Years | 124 (68.5%) | 144 (86.8%) |
| 65 to 74 Years | 116 (90.6%) | 91 (84.3%) |
| 75 Years and over | 104 (100.0%) | 127 (86.4%) |
| Total | 898 (79.5%) | 814 (77.2%) |
Income Below Poverty Among Married-Couple Families in Chetek
The poverty statistics for married-couple families in Chetek show that 14.6% or 65 of the total 445 families live below the poverty line. Families with 3 or 4 children have the highest poverty rate of 45.8%, comprising of 11 families. On the other hand, families with 5 or more children have the lowest poverty rate of 0.0%, which includes 0 families.
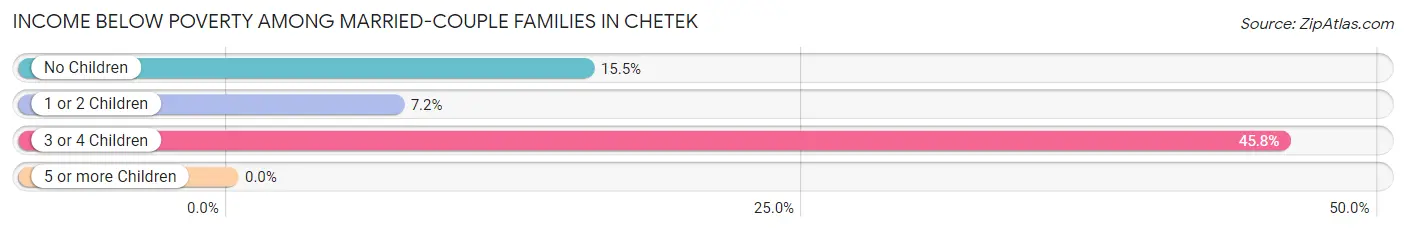
| Children | Above Poverty | Below Poverty |
| No Children | 251 (84.5%) | 46 (15.5%) |
| 1 or 2 Children | 103 (92.8%) | 8 (7.2%) |
| 3 or 4 Children | 13 (54.2%) | 11 (45.8%) |
| 5 or more Children | 13 (100.0%) | 0 (0.0%) |
| Total | 380 (85.4%) | 65 (14.6%) |
Income Below Poverty Among Single-Parent Households in Chetek
According to the poverty data in Chetek, 7.8% or 4 single-father households and 54.3% or 25 single-mother households are living below the poverty line. Among single-father households, those with 1 or 2 children have the highest poverty rate, with 4 households (17.4%) experiencing poverty. Likewise, among single-mother households, those with 1 or 2 children have the highest poverty rate, with 17 households (73.9%) falling below the poverty line.
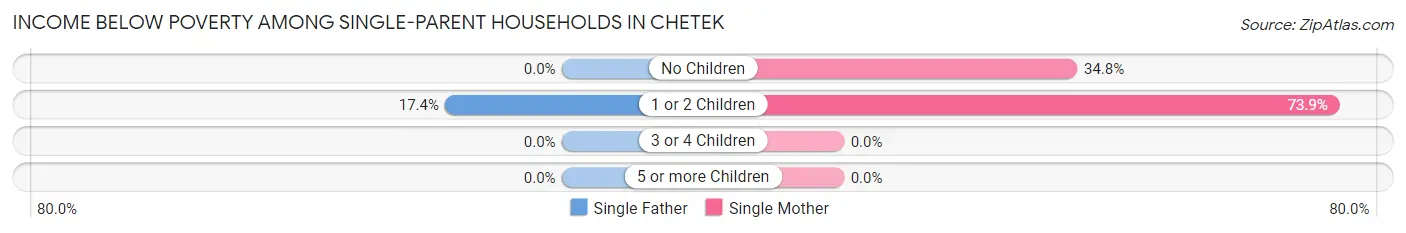
| Children | Single Father | Single Mother |
| No Children | 0 (0.0%) | 8 (34.8%) |
| 1 or 2 Children | 4 (17.4%) | 17 (73.9%) |
| 3 or 4 Children | 0 (0.0%) | 0 (0.0%) |
| 5 or more Children | 0 (0.0%) | 0 (0.0%) |
| Total | 4 (7.8%) | 25 (54.3%) |
Income Below Poverty Among Married-Couple vs Single-Parent Households in Chetek
The poverty data for Chetek shows that 65 of the married-couple family households (14.6%) and 29 of the single-parent households (29.9%) are living below the poverty level. Within the married-couple family households, those with 3 or 4 children have the highest poverty rate, with 11 households (45.8%) falling below the poverty line. Among the single-parent households, those with 1 or 2 children have the highest poverty rate, with 21 household (45.7%) living below poverty.
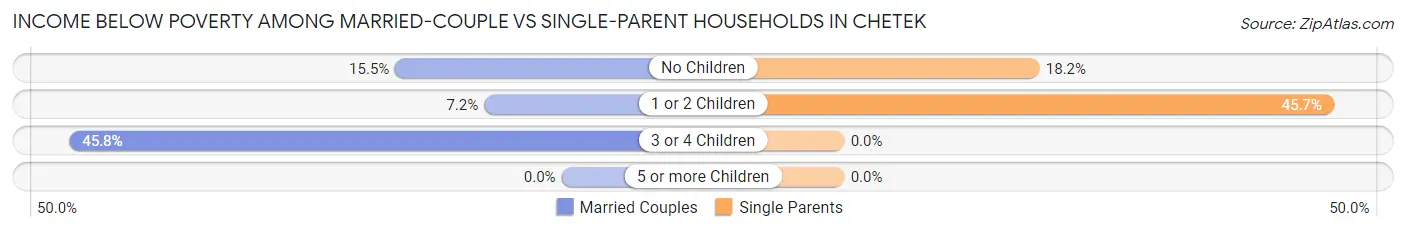
| Children | Married-Couple Families | Single-Parent Households |
| No Children | 46 (15.5%) | 8 (18.2%) |
| 1 or 2 Children | 8 (7.2%) | 21 (45.7%) |
| 3 or 4 Children | 11 (45.8%) | 0 (0.0%) |
| 5 or more Children | 0 (0.0%) | 0 (0.0%) |
| Total | 65 (14.6%) | 29 (29.9%) |
Race in Chetek
The most populous races in Chetek are White / Caucasian (2,179 | 96.3%), Hispanic or Latino (42 | 1.9%), and Some other Race (25 | 1.1%).
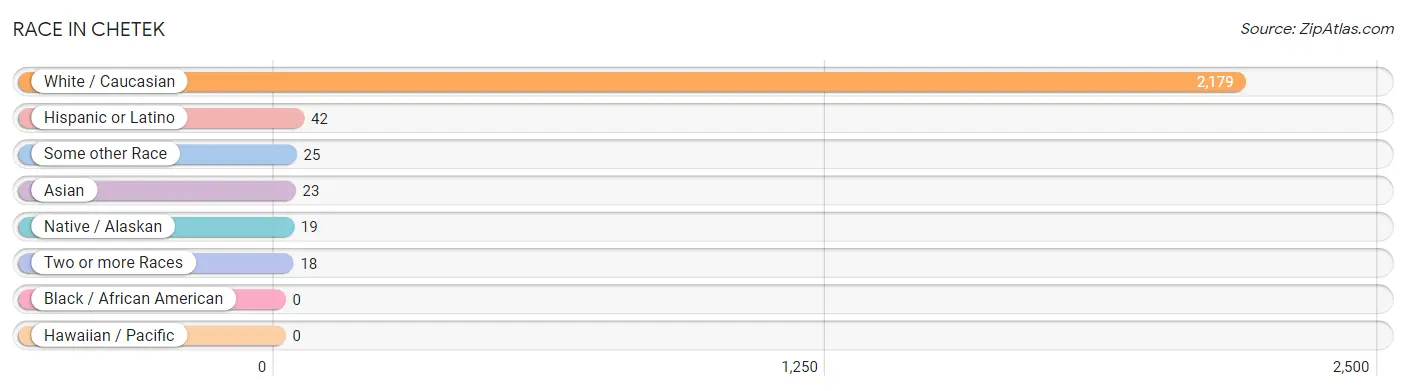
| Race | # Population | % Population |
| Asian | 23 | 1.0% |
| Black / African American | 0 | 0.0% |
| Hawaiian / Pacific | 0 | 0.0% |
| Hispanic or Latino | 42 | 1.9% |
| Native / Alaskan | 19 | 0.8% |
| White / Caucasian | 2,179 | 96.3% |
| Two or more Races | 18 | 0.8% |
| Some other Race | 25 | 1.1% |
| Total | 2,264 | 100.0% |
Ancestry in Chetek
The most populous ancestries reported in Chetek are German (724 | 32.0%), Norwegian (426 | 18.8%), American (161 | 7.1%), Irish (143 | 6.3%), and English (110 | 4.9%), together accounting for 69.1% of all Chetek residents.
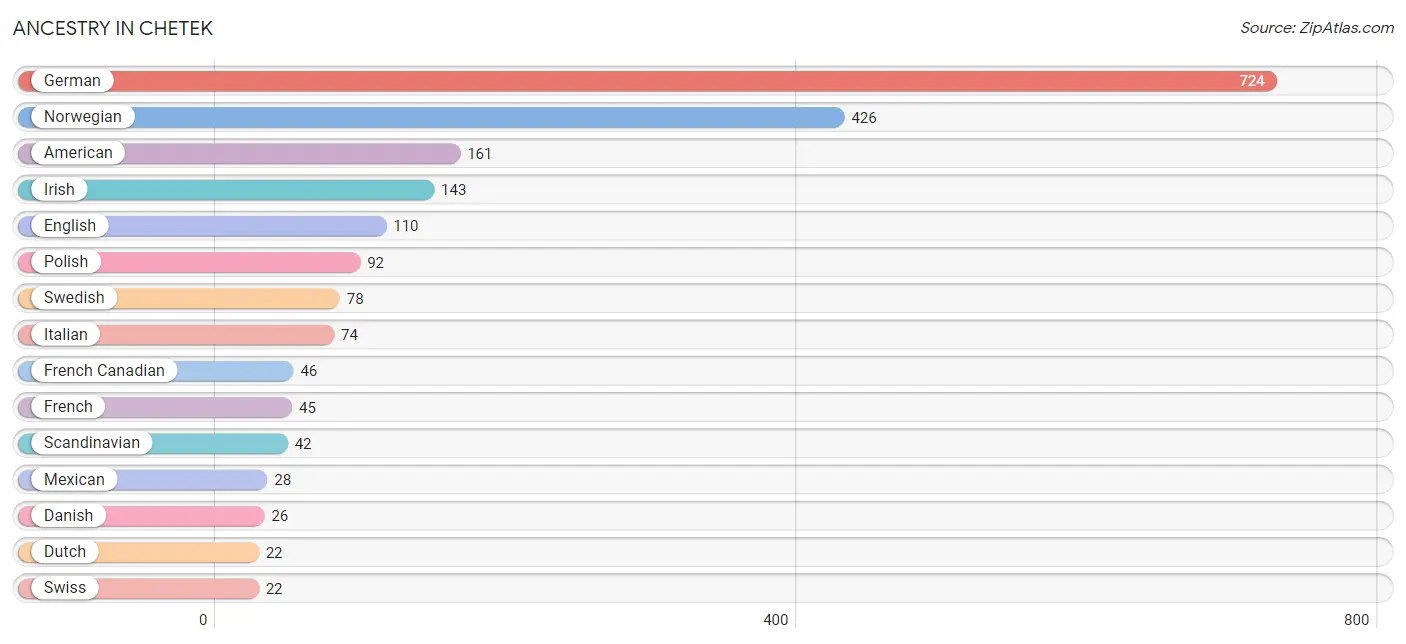
| Ancestry | # Population | % Population |
| American | 161 | 7.1% |
| British | 15 | 0.7% |
| Canadian | 9 | 0.4% |
| Chippewa | 4 | 0.2% |
| Czech | 21 | 0.9% |
| Czechoslovakian | 15 | 0.7% |
| Danish | 26 | 1.1% |
| Dutch | 22 | 1.0% |
| English | 110 | 4.9% |
| European | 10 | 0.4% |
| Finnish | 4 | 0.2% |
| French | 45 | 2.0% |
| French Canadian | 46 | 2.0% |
| German | 724 | 32.0% |
| German Russian | 5 | 0.2% |
| Greek | 6 | 0.3% |
| Hungarian | 5 | 0.2% |
| Indian (Asian) | 7 | 0.3% |
| Irish | 143 | 6.3% |
| Italian | 74 | 3.3% |
| Korean | 12 | 0.5% |
| Latvian | 5 | 0.2% |
| Lithuanian | 5 | 0.2% |
| Mexican | 28 | 1.2% |
| Norwegian | 426 | 18.8% |
| Pakistani | 4 | 0.2% |
| Polish | 92 | 4.1% |
| Puerto Rican | 7 | 0.3% |
| Russian | 15 | 0.7% |
| Scandinavian | 42 | 1.9% |
| Scottish | 9 | 0.4% |
| Spaniard | 7 | 0.3% |
| Swedish | 78 | 3.5% |
| Swiss | 22 | 1.0% |
| Yugoslavian | 11 | 0.5% | View All 35 Rows |
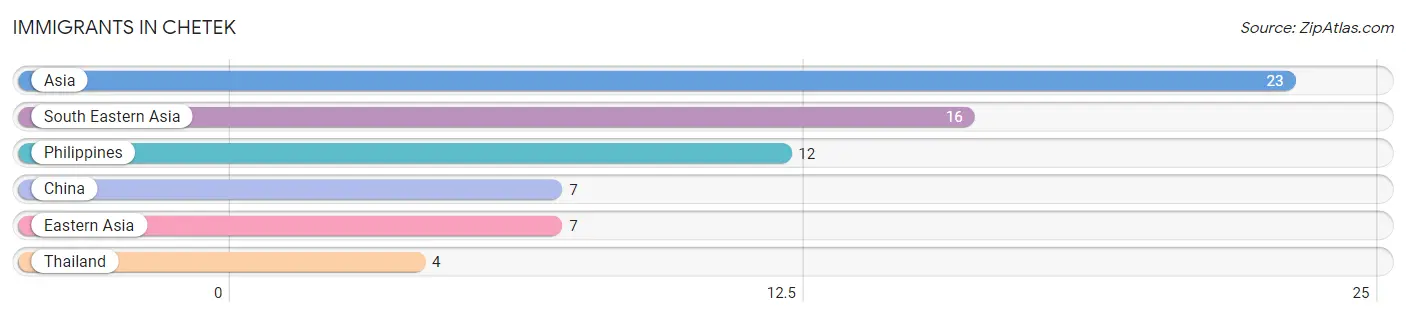
Immigrants in Chetek
The most numerous immigrant groups reported in Chetek came from Asia (23 | 1.0%), South Eastern Asia (16 | 0.7%), Philippines (12 | 0.5%), China (7 | 0.3%), and Eastern Asia (7 | 0.3%), together accounting for 2.9% of all Chetek residents.
| Immigration Origin | # Population | % Population |
| Asia | 23 | 1.0% |
| China | 7 | 0.3% |
| Eastern Asia | 7 | 0.3% |
| Philippines | 12 | 0.5% |
| South Eastern Asia | 16 | 0.7% |
| Thailand | 4 | 0.2% | View All 6 Rows |
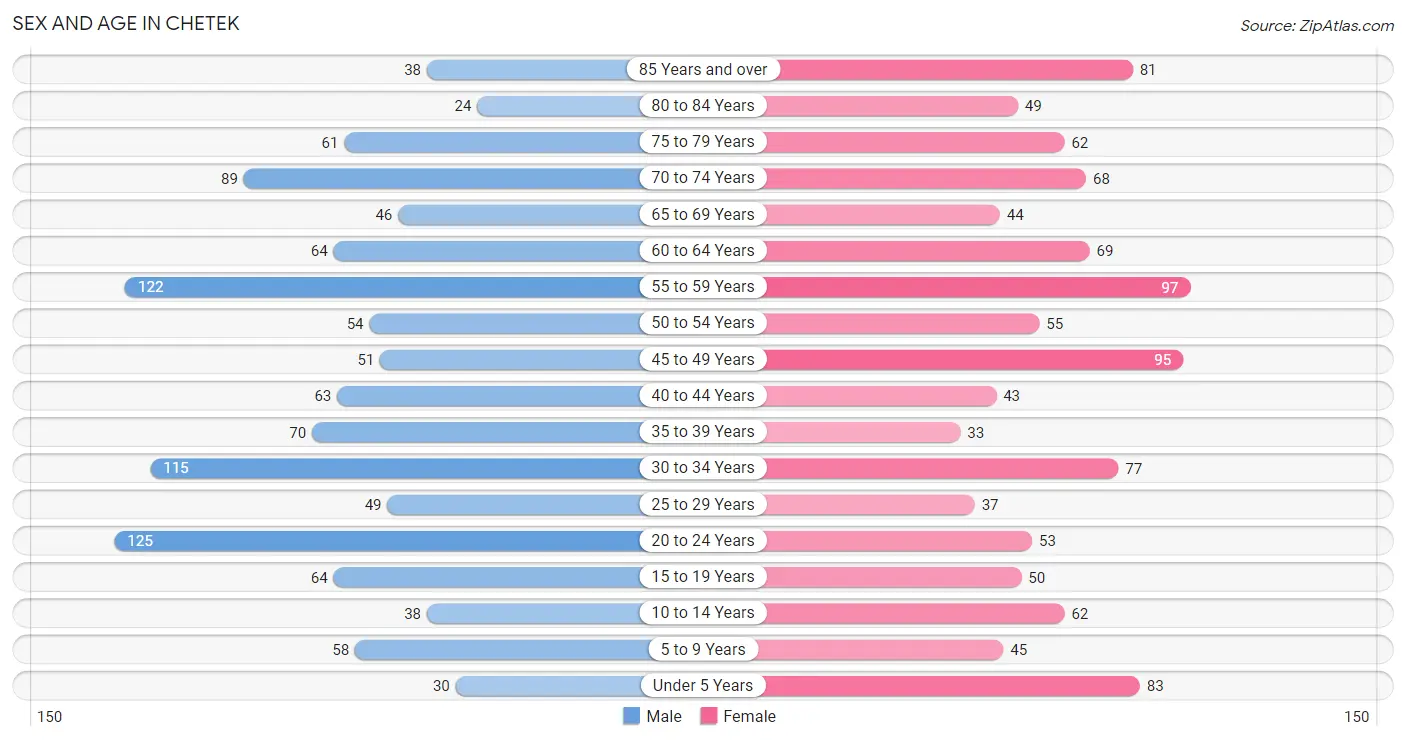
Sex and Age in Chetek
Sex and Age in Chetek
The most populous age groups in Chetek are 20 to 24 Years (125 | 10.8%) for men and 55 to 59 Years (97 | 8.8%) for women.
| Age Bracket | Male | Female |
| Under 5 Years | 30 (2.6%) | 83 (7.5%) |
| 5 to 9 Years | 58 (5.0%) | 45 (4.1%) |
| 10 to 14 Years | 38 (3.3%) | 62 (5.6%) |
| 15 to 19 Years | 64 (5.5%) | 50 (4.5%) |
| 20 to 24 Years | 125 (10.8%) | 53 (4.8%) |
| 25 to 29 Years | 49 (4.2%) | 37 (3.4%) |
| 30 to 34 Years | 115 (9.9%) | 77 (7.0%) |
| 35 to 39 Years | 70 (6.0%) | 33 (3.0%) |
| 40 to 44 Years | 63 (5.4%) | 43 (3.9%) |
| 45 to 49 Years | 51 (4.4%) | 95 (8.6%) |
| 50 to 54 Years | 54 (4.6%) | 55 (5.0%) |
| 55 to 59 Years | 122 (10.5%) | 97 (8.8%) |
| 60 to 64 Years | 64 (5.5%) | 69 (6.3%) |
| 65 to 69 Years | 46 (4.0%) | 44 (4.0%) |
| 70 to 74 Years | 89 (7.7%) | 68 (6.2%) |
| 75 to 79 Years | 61 (5.2%) | 62 (5.6%) |
| 80 to 84 Years | 24 (2.1%) | 49 (4.4%) |
| 85 Years and over | 38 (3.3%) | 81 (7.3%) |
| Total | 1,161 (100.0%) | 1,103 (100.0%) |
Families and Households in Chetek
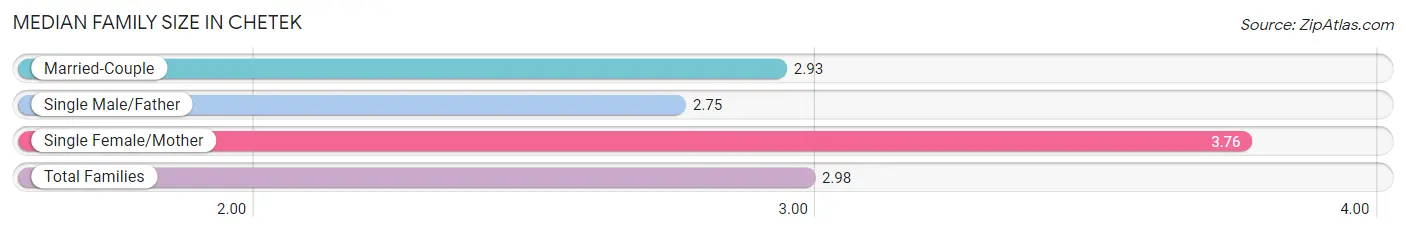
Median Family Size in Chetek
The median family size in Chetek is 2.98 persons per family, with single female/mother families (46 | 8.5%) accounting for the largest median family size of 3.76 persons per family. On the other hand, single male/father families (51 | 9.4%) represent the smallest median family size with 2.75 persons per family.
| Family Type | # Families | Family Size |
| Married-Couple | 445 (82.1%) | 2.93 |
| Single Male/Father | 51 (9.4%) | 2.75 |
| Single Female/Mother | 46 (8.5%) | 3.76 |
| Total Families | 542 (100.0%) | 2.98 |
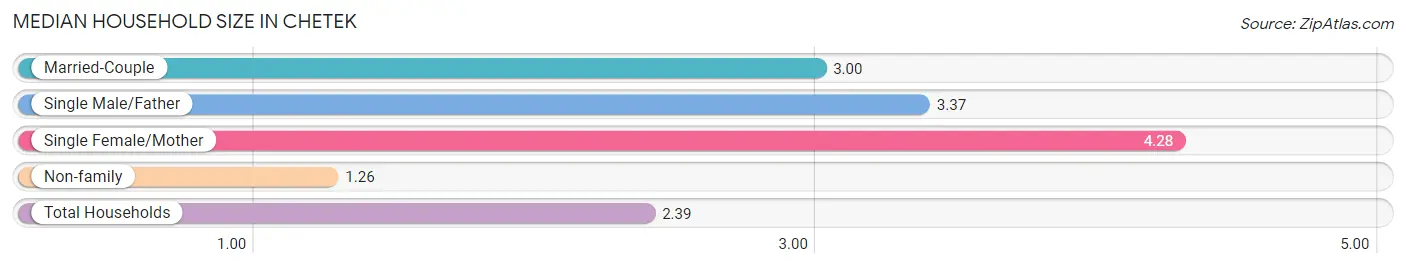
Median Household Size in Chetek
The median household size in Chetek is 2.39 persons per household, with single female/mother households (46 | 5.1%) accounting for the largest median household size of 4.28 persons per household. non-family households (364 | 40.2%) represent the smallest median household size with 1.26 persons per household.
| Household Type | # Households | Household Size |
| Married-Couple | 445 (49.1%) | 3.00 |
| Single Male/Father | 51 (5.6%) | 3.37 |
| Single Female/Mother | 46 (5.1%) | 4.28 |
| Non-family | 364 (40.2%) | 1.26 |
| Total Households | 906 (100.0%) | 2.39 |
Household Size by Marriage Status in Chetek
Out of a total of 906 households in Chetek, 542 (59.8%) are family households, while 364 (40.2%) are nonfamily households. The most numerous type of family households are 2-person households, comprising 275, and the most common type of nonfamily households are 1-person households, comprising 277.
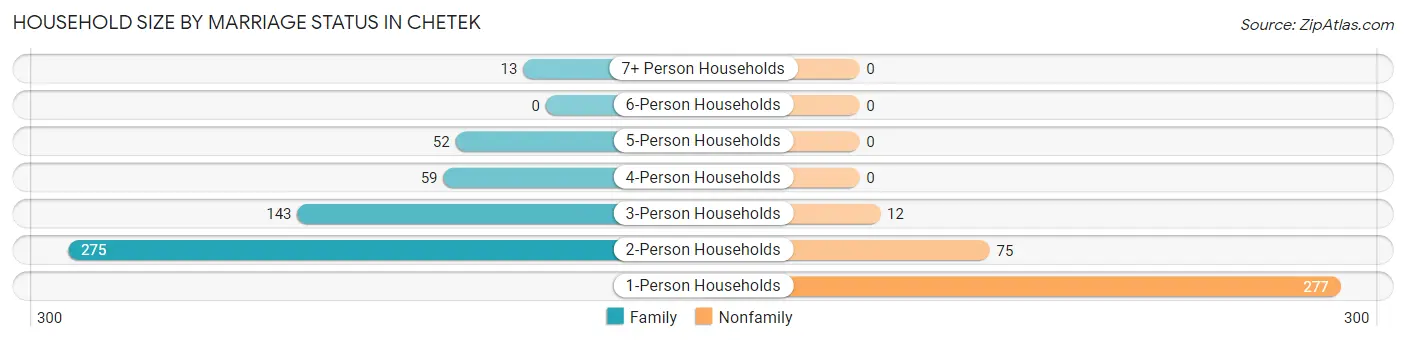
| Household Size | Family Households | Nonfamily Households |
| 1-Person Households | - | 277 (30.6%) |
| 2-Person Households | 275 (30.3%) | 75 (8.3%) |
| 3-Person Households | 143 (15.8%) | 12 (1.3%) |
| 4-Person Households | 59 (6.5%) | 0 (0.0%) |
| 5-Person Households | 52 (5.7%) | 0 (0.0%) |
| 6-Person Households | 0 (0.0%) | 0 (0.0%) |
| 7+ Person Households | 13 (1.4%) | 0 (0.0%) |
| Total | 542 (59.8%) | 364 (40.2%) |
Female Fertility in Chetek
Fertility by Age in Chetek
Average fertility rate in Chetek is 18.0 births per 1,000 women. Women in the age bracket of 20 to 34 years have the highest fertility rate with 42.0 births per 1,000 women. Women in the age bracket of 20 to 34 years acount for 100.0% of all women with births.
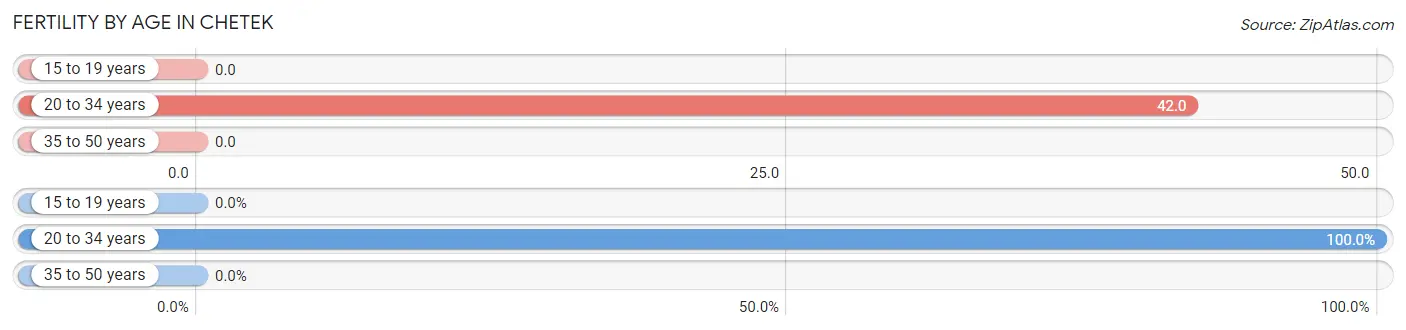
| Age Bracket | Women with Births | Births / 1,000 Women |
| 15 to 19 years | 0 (0.0%) | 0.0 |
| 20 to 34 years | 7 (100.0%) | 42.0 |
| 35 to 50 years | 0 (0.0%) | 0.0 |
| Total | 7 (100.0%) | 18.0 |
Fertility by Age by Marriage Status in Chetek
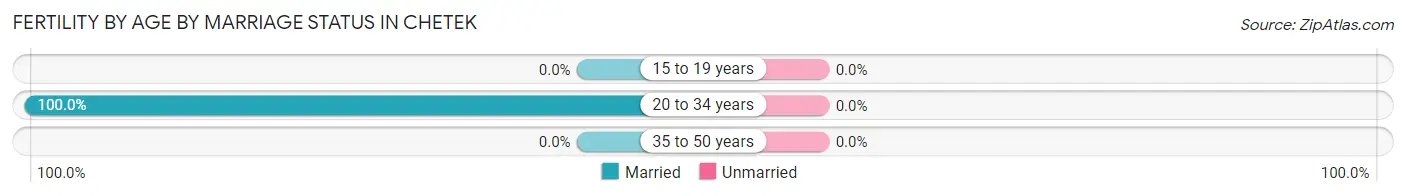
| Age Bracket | Married | Unmarried |
| 15 to 19 years | 0 (0.0%) | 0 (0.0%) |
| 20 to 34 years | 7 (100.0%) | 0 (0.0%) |
| 35 to 50 years | 0 (0.0%) | 0 (0.0%) |
| Total | 7 (100.0%) | 0 (0.0%) |
Fertility by Education in Chetek
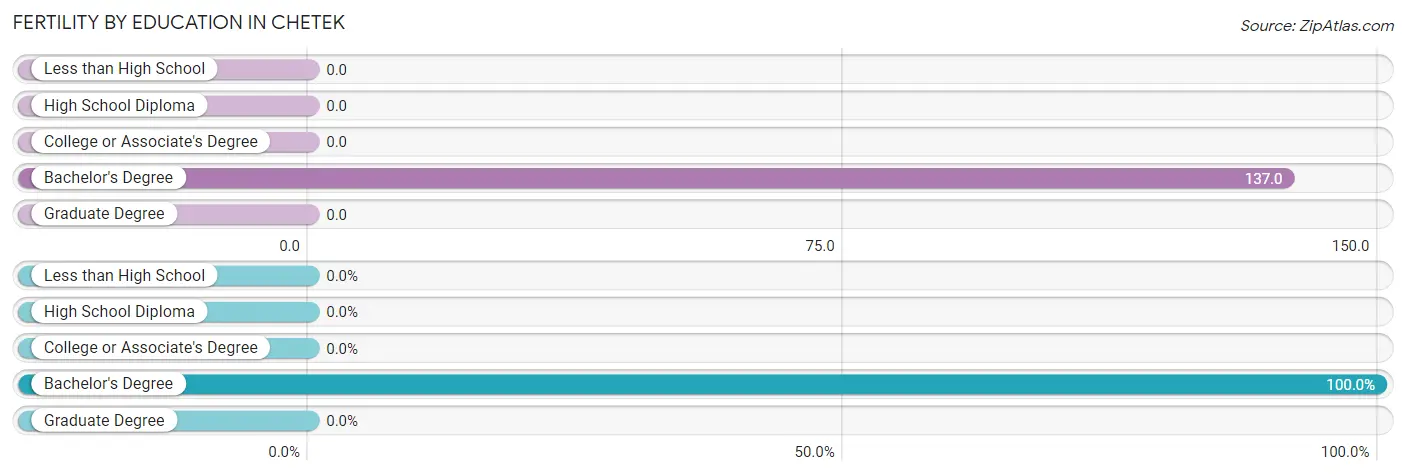
| Educational Attainment | Women with Births | Births / 1,000 Women |
| Less than High School | 0 (0.0%) | 0.0 |
| High School Diploma | 0 (0.0%) | 0.0 |
| College or Associate's Degree | 0 (0.0%) | 0.0 |
| Bachelor's Degree | 7 (100.0%) | 137.0 |
| Graduate Degree | 0 (0.0%) | 0.0 |
| Total | 7 (100.0%) | 18.0 |
Fertility by Education by Marriage Status in Chetek
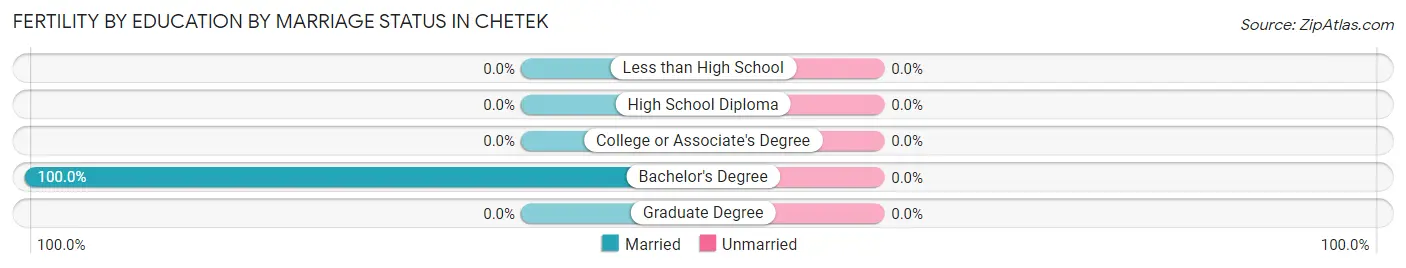
| Educational Attainment | Married | Unmarried |
| Less than High School | 0 (0.0%) | 0 (0.0%) |
| High School Diploma | 0 (0.0%) | 0 (0.0%) |
| College or Associate's Degree | 0 (0.0%) | 0 (0.0%) |
| Bachelor's Degree | 7 (100.0%) | 0 (0.0%) |
| Graduate Degree | 0 (0.0%) | 0 (0.0%) |
| Total | 7 (100.0%) | 0 (0.0%) |
Employment Characteristics in Chetek
Employment by Class of Employer in Chetek
Among the 1,091 employed individuals in Chetek, private company employees (827 | 75.8%), self-employed (not incorporated) (97 | 8.9%), and not-for-profit organizations (74 | 6.8%) make up the most common classes of employment.
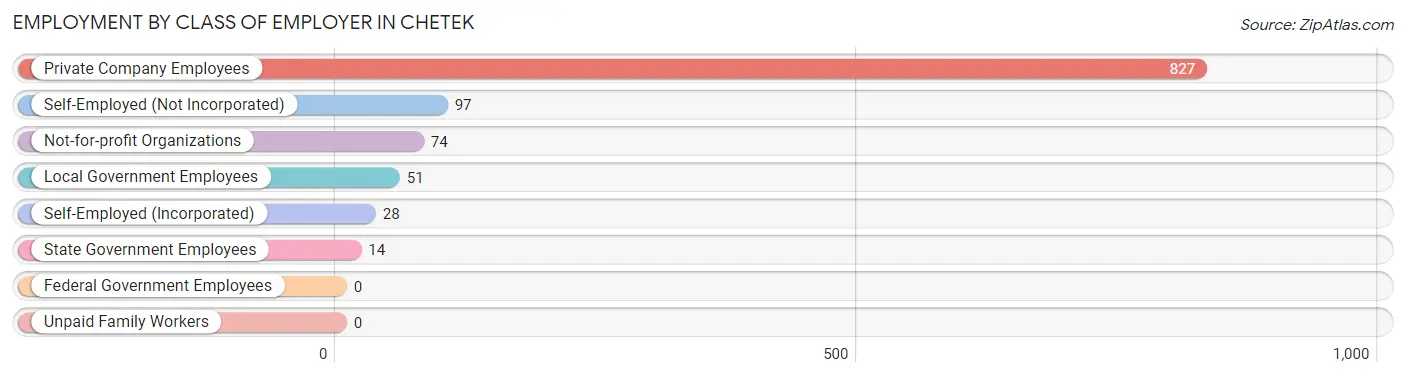
| Employer Class | # Employees | % Employees |
| Private Company Employees | 827 | 75.8% |
| Self-Employed (Incorporated) | 28 | 2.6% |
| Self-Employed (Not Incorporated) | 97 | 8.9% |
| Not-for-profit Organizations | 74 | 6.8% |
| Local Government Employees | 51 | 4.7% |
| State Government Employees | 14 | 1.3% |
| Federal Government Employees | 0 | 0.0% |
| Unpaid Family Workers | 0 | 0.0% |
| Total | 1,091 | 100.0% |
Employment Status by Age in Chetek
According to the labor force statistics for Chetek, out of the total population over 16 years of age (1,942), 59.1% or 1,148 individuals are in the labor force, with 3.5% or 40 of them unemployed. The age group with the highest labor force participation rate is 25 to 29 years, with 95.3% or 82 individuals in the labor force. Within the labor force, the 45 to 54 years age range has the highest percentage of unemployed individuals, with 8.7% or 15 of them being unemployed.
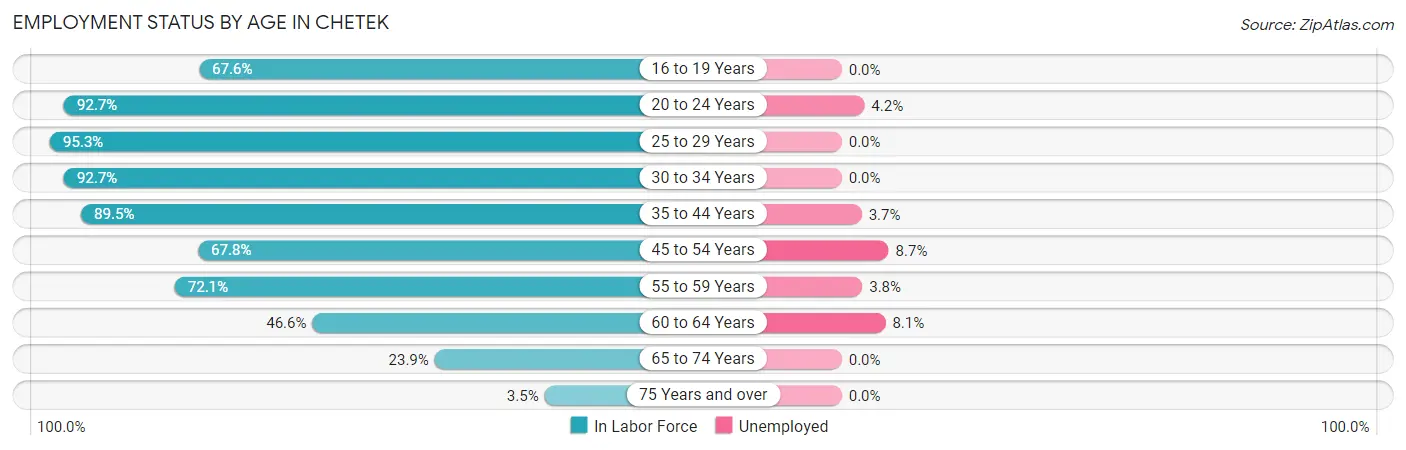
| Age Bracket | In Labor Force | Unemployed |
| 16 to 19 Years | 73 (67.6%) | 0 (0.0%) |
| 20 to 24 Years | 165 (92.7%) | 7 (4.2%) |
| 25 to 29 Years | 82 (95.3%) | 0 (0.0%) |
| 30 to 34 Years | 178 (92.7%) | 0 (0.0%) |
| 35 to 44 Years | 187 (89.5%) | 7 (3.7%) |
| 45 to 54 Years | 173 (67.8%) | 15 (8.7%) |
| 55 to 59 Years | 158 (72.1%) | 6 (3.8%) |
| 60 to 64 Years | 62 (46.6%) | 5 (8.1%) |
| 65 to 74 Years | 59 (23.9%) | 0 (0.0%) |
| 75 Years and over | 11 (3.5%) | 0 (0.0%) |
| Total | 1,148 (59.1%) | 40 (3.5%) |
Employment Status by Educational Attainment in Chetek
According to labor force statistics for Chetek, 76.8% of individuals (840) out of the total population between 25 and 64 years of age (1,094) are in the labor force, with 3.9% or 33 of them being unemployed. The group with the highest labor force participation rate are those with the educational attainment of high school diploma, with 83.3% or 274 individuals in the labor force. Within the labor force, individuals with college / associate degree education have the highest percentage of unemployment, with 5.4% or 21 of them being unemployed.
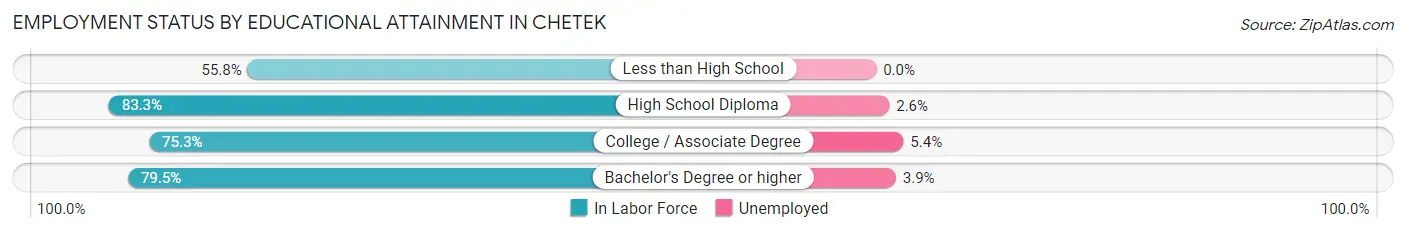
| Educational Attainment | In Labor Force | Unemployed |
| Less than High School | 48 (55.8%) | 0 (0.0%) |
| High School Diploma | 274 (83.3%) | 9 (2.6%) |
| College / Associate Degree | 390 (75.3%) | 28 (5.4%) |
| Bachelor's Degree or higher | 128 (79.5%) | 6 (3.9%) |
| Total | 840 (76.8%) | 43 (3.9%) |
Employment Occupations by Sex in Chetek
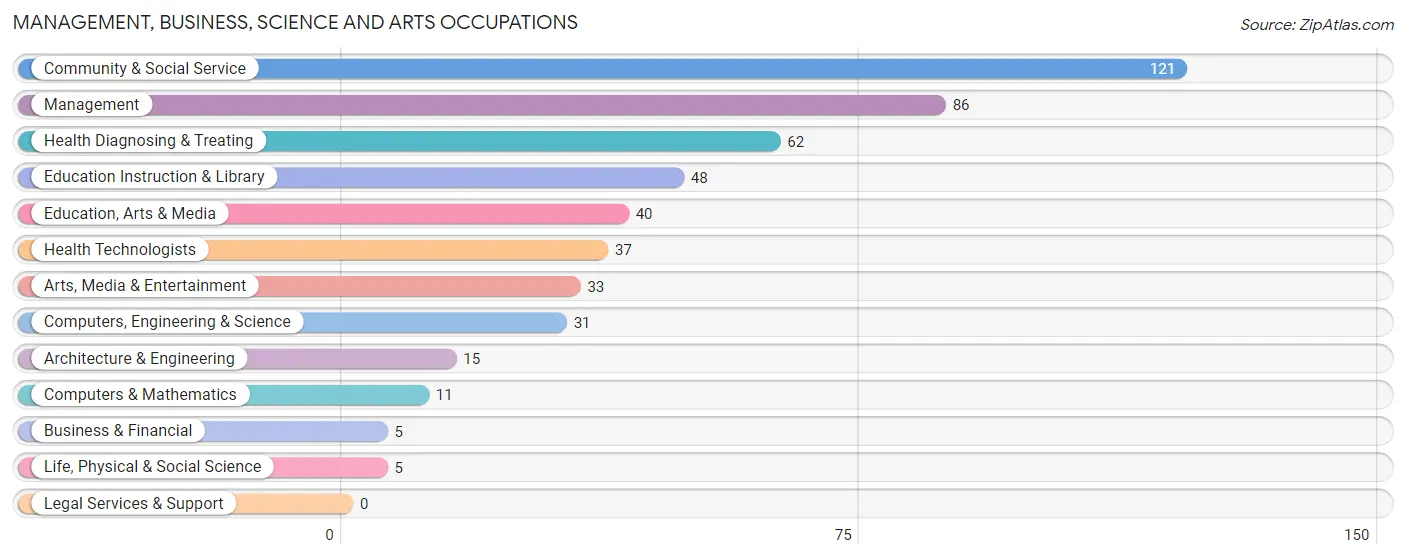
Management, Business, Science and Arts Occupations
The most common Management, Business, Science and Arts occupations in Chetek are Community & Social Service (121 | 10.9%), Management (86 | 7.8%), Health Diagnosing & Treating (62 | 5.6%), Education Instruction & Library (48 | 4.3%), and Education, Arts & Media (40 | 3.6%).
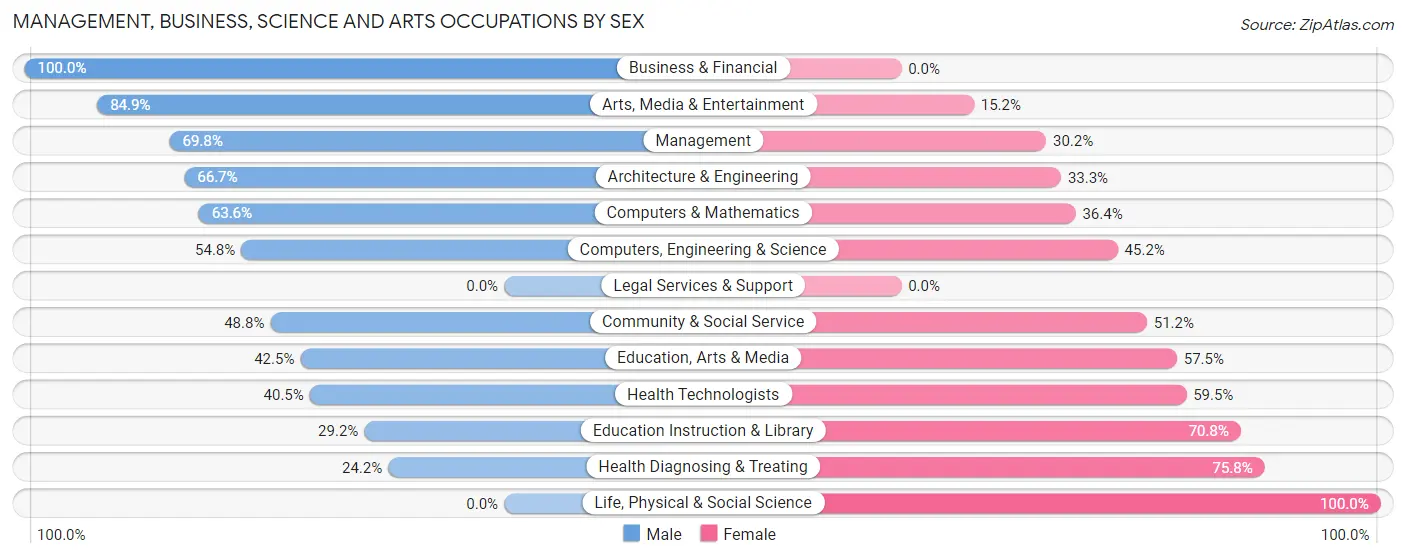
Management, Business, Science and Arts Occupations by Sex
Within the Management, Business, Science and Arts occupations in Chetek, the most male-oriented occupations are Business & Financial (100.0%), Arts, Media & Entertainment (84.9%), and Management (69.8%), while the most female-oriented occupations are Life, Physical & Social Science (100.0%), Health Diagnosing & Treating (75.8%), and Education Instruction & Library (70.8%).
| Occupation | Male | Female |
| Management | 60 (69.8%) | 26 (30.2%) |
| Business & Financial | 5 (100.0%) | 0 (0.0%) |
| Computers, Engineering & Science | 17 (54.8%) | 14 (45.2%) |
| Computers & Mathematics | 7 (63.6%) | 4 (36.4%) |
| Architecture & Engineering | 10 (66.7%) | 5 (33.3%) |
| Life, Physical & Social Science | 0 (0.0%) | 5 (100.0%) |
| Community & Social Service | 59 (48.8%) | 62 (51.2%) |
| Education, Arts & Media | 17 (42.5%) | 23 (57.5%) |
| Legal Services & Support | 0 (0.0%) | 0 (0.0%) |
| Education Instruction & Library | 14 (29.2%) | 34 (70.8%) |
| Arts, Media & Entertainment | 28 (84.9%) | 5 (15.1%) |
| Health Diagnosing & Treating | 15 (24.2%) | 47 (75.8%) |
| Health Technologists | 15 (40.5%) | 22 (59.5%) |
| Total (Category) | 156 (51.1%) | 149 (48.8%) |
| Total (Overall) | 698 (63.0%) | 410 (37.0%) |
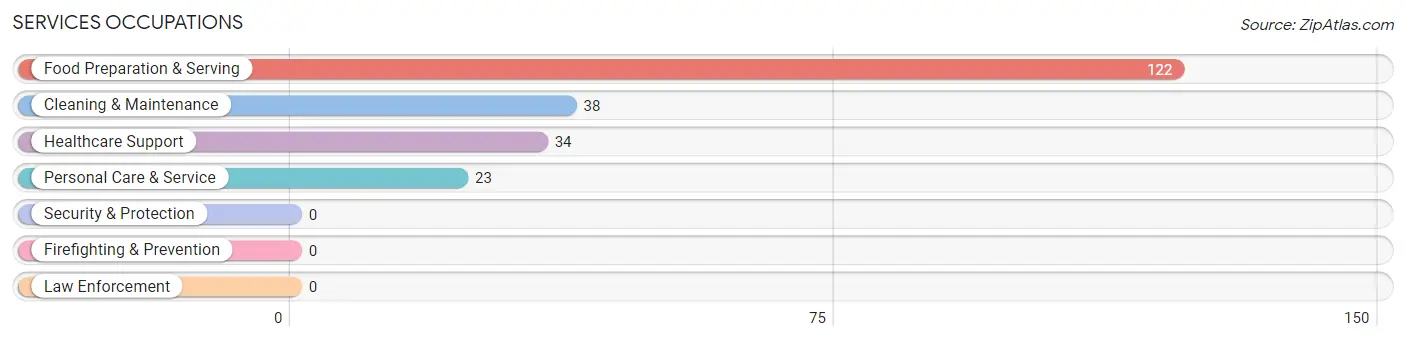
Services Occupations
The most common Services occupations in Chetek are Food Preparation & Serving (122 | 11.0%), Cleaning & Maintenance (38 | 3.4%), Healthcare Support (34 | 3.1%), and Personal Care & Service (23 | 2.1%).
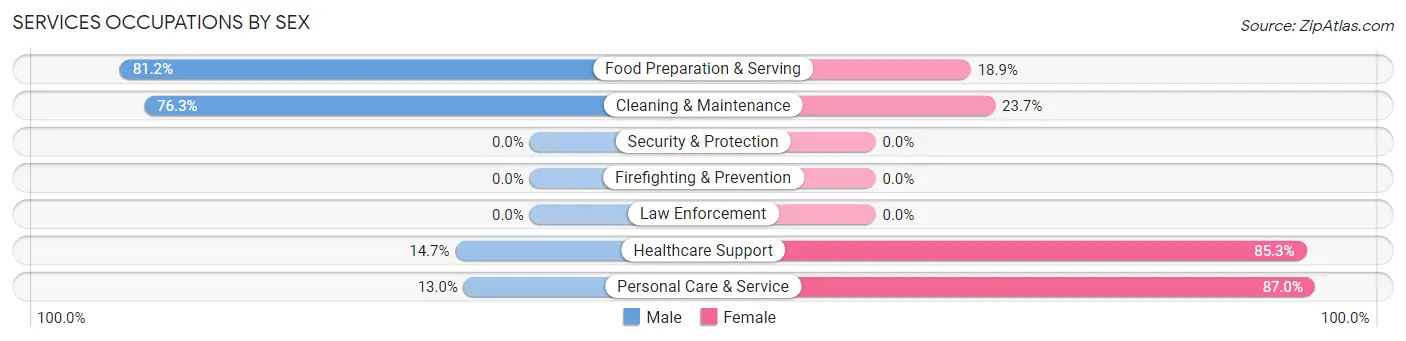
Services Occupations by Sex
Within the Services occupations in Chetek, the most male-oriented occupations are Food Preparation & Serving (81.1%), Cleaning & Maintenance (76.3%), and Healthcare Support (14.7%), while the most female-oriented occupations are Personal Care & Service (87.0%), Healthcare Support (85.3%), and Cleaning & Maintenance (23.7%).
| Occupation | Male | Female |
| Healthcare Support | 5 (14.7%) | 29 (85.3%) |
| Security & Protection | 0 (0.0%) | 0 (0.0%) |
| Firefighting & Prevention | 0 (0.0%) | 0 (0.0%) |
| Law Enforcement | 0 (0.0%) | 0 (0.0%) |
| Food Preparation & Serving | 99 (81.1%) | 23 (18.9%) |
| Cleaning & Maintenance | 29 (76.3%) | 9 (23.7%) |
| Personal Care & Service | 3 (13.0%) | 20 (87.0%) |
| Total (Category) | 136 (62.7%) | 81 (37.3%) |
| Total (Overall) | 698 (63.0%) | 410 (37.0%) |
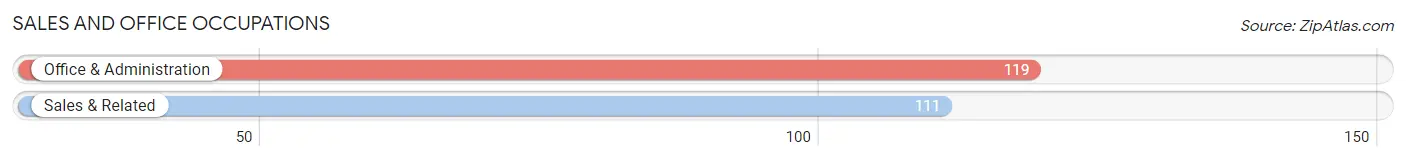
Sales and Office Occupations
The most common Sales and Office occupations in Chetek are Office & Administration (119 | 10.7%), and Sales & Related (111 | 10.0%).
Sales and Office Occupations by Sex
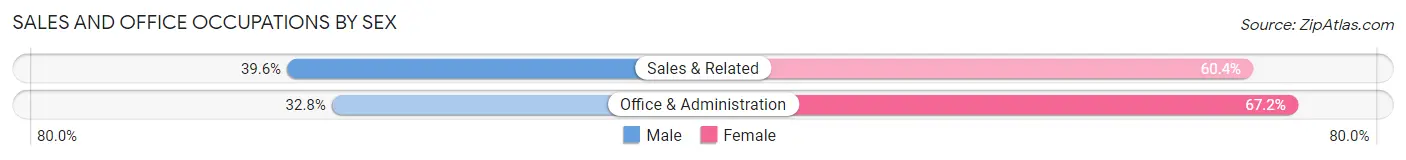
| Occupation | Male | Female |
| Sales & Related | 44 (39.6%) | 67 (60.4%) |
| Office & Administration | 39 (32.8%) | 80 (67.2%) |
| Total (Category) | 83 (36.1%) | 147 (63.9%) |
| Total (Overall) | 698 (63.0%) | 410 (37.0%) |
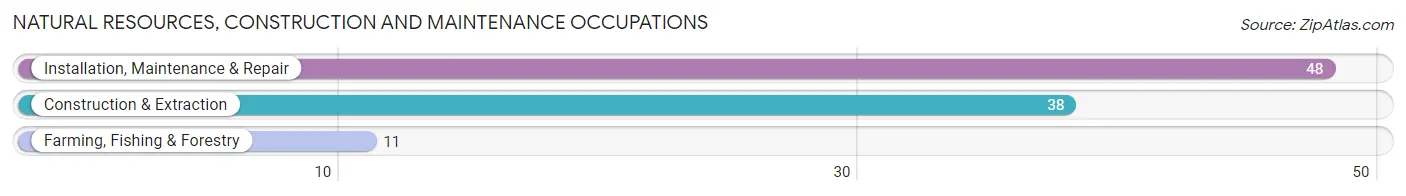
Natural Resources, Construction and Maintenance Occupations
The most common Natural Resources, Construction and Maintenance occupations in Chetek are Installation, Maintenance & Repair (48 | 4.3%), Construction & Extraction (38 | 3.4%), and Farming, Fishing & Forestry (11 | 1.0%).
Natural Resources, Construction and Maintenance Occupations by Sex
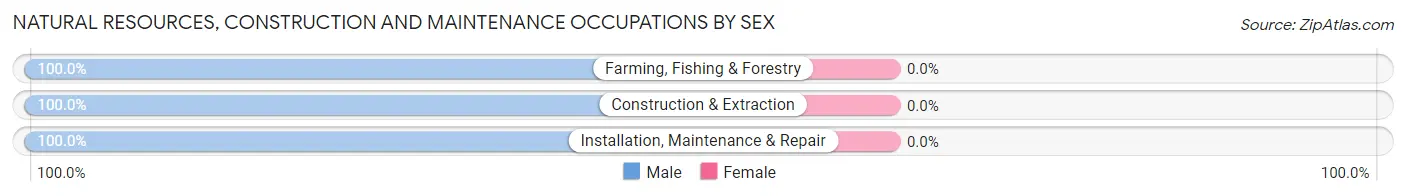
| Occupation | Male | Female |
| Farming, Fishing & Forestry | 11 (100.0%) | 0 (0.0%) |
| Construction & Extraction | 38 (100.0%) | 0 (0.0%) |
| Installation, Maintenance & Repair | 48 (100.0%) | 0 (0.0%) |
| Total (Category) | 97 (100.0%) | 0 (0.0%) |
| Total (Overall) | 698 (63.0%) | 410 (37.0%) |
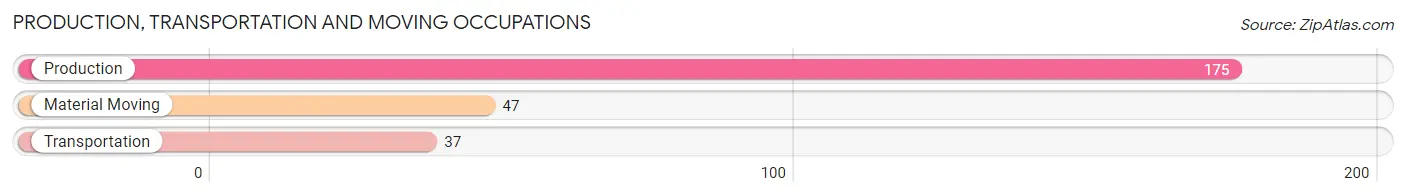
Production, Transportation and Moving Occupations
The most common Production, Transportation and Moving occupations in Chetek are Production (175 | 15.8%), Material Moving (47 | 4.2%), and Transportation (37 | 3.3%).
Production, Transportation and Moving Occupations by Sex
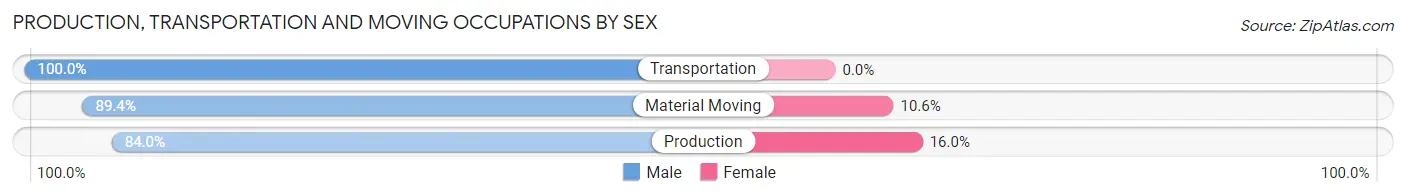
| Occupation | Male | Female |
| Production | 147 (84.0%) | 28 (16.0%) |
| Transportation | 37 (100.0%) | 0 (0.0%) |
| Material Moving | 42 (89.4%) | 5 (10.6%) |
| Total (Category) | 226 (87.3%) | 33 (12.7%) |
| Total (Overall) | 698 (63.0%) | 410 (37.0%) |
Employment Industries by Sex in Chetek
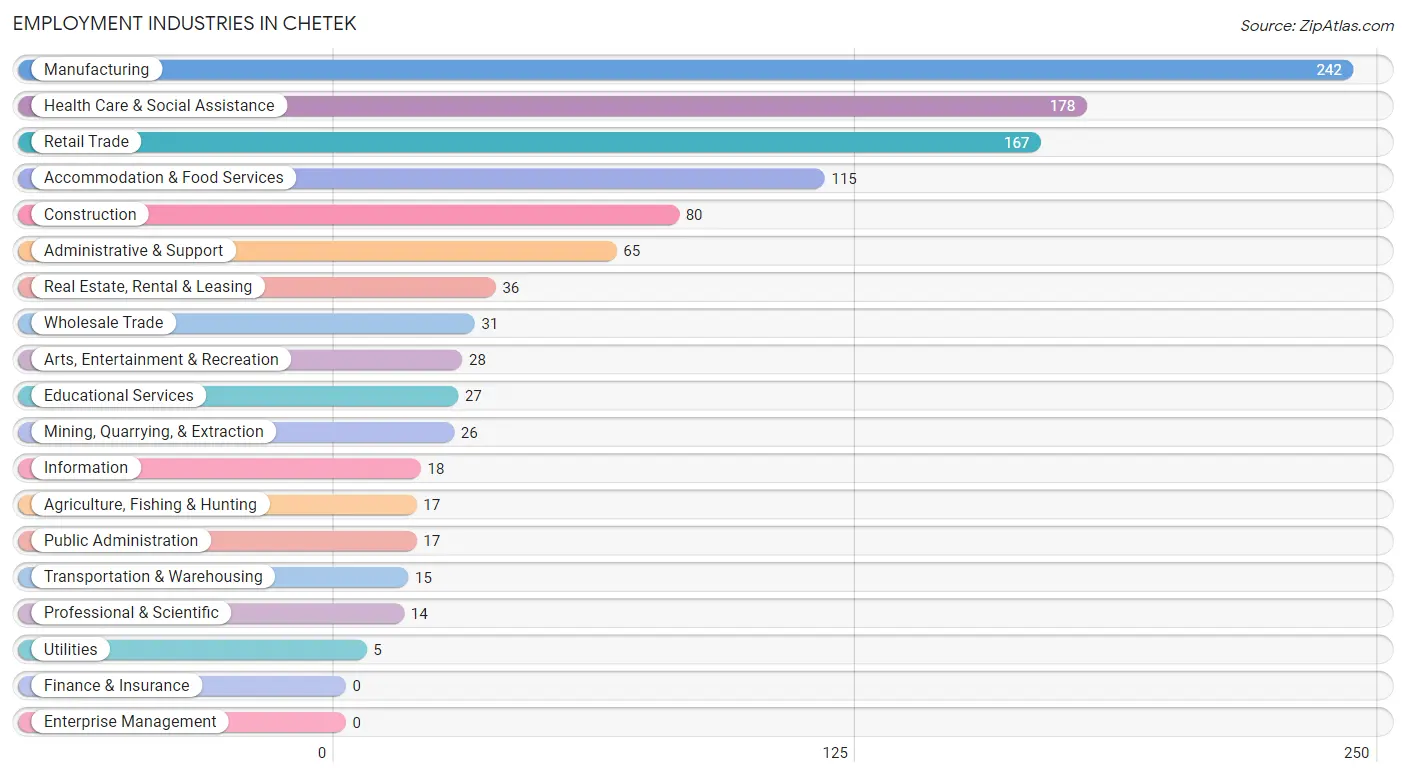
Employment Industries in Chetek
The major employment industries in Chetek include Manufacturing (242 | 21.8%), Health Care & Social Assistance (178 | 16.1%), Retail Trade (167 | 15.1%), Accommodation & Food Services (115 | 10.4%), and Construction (80 | 7.2%).
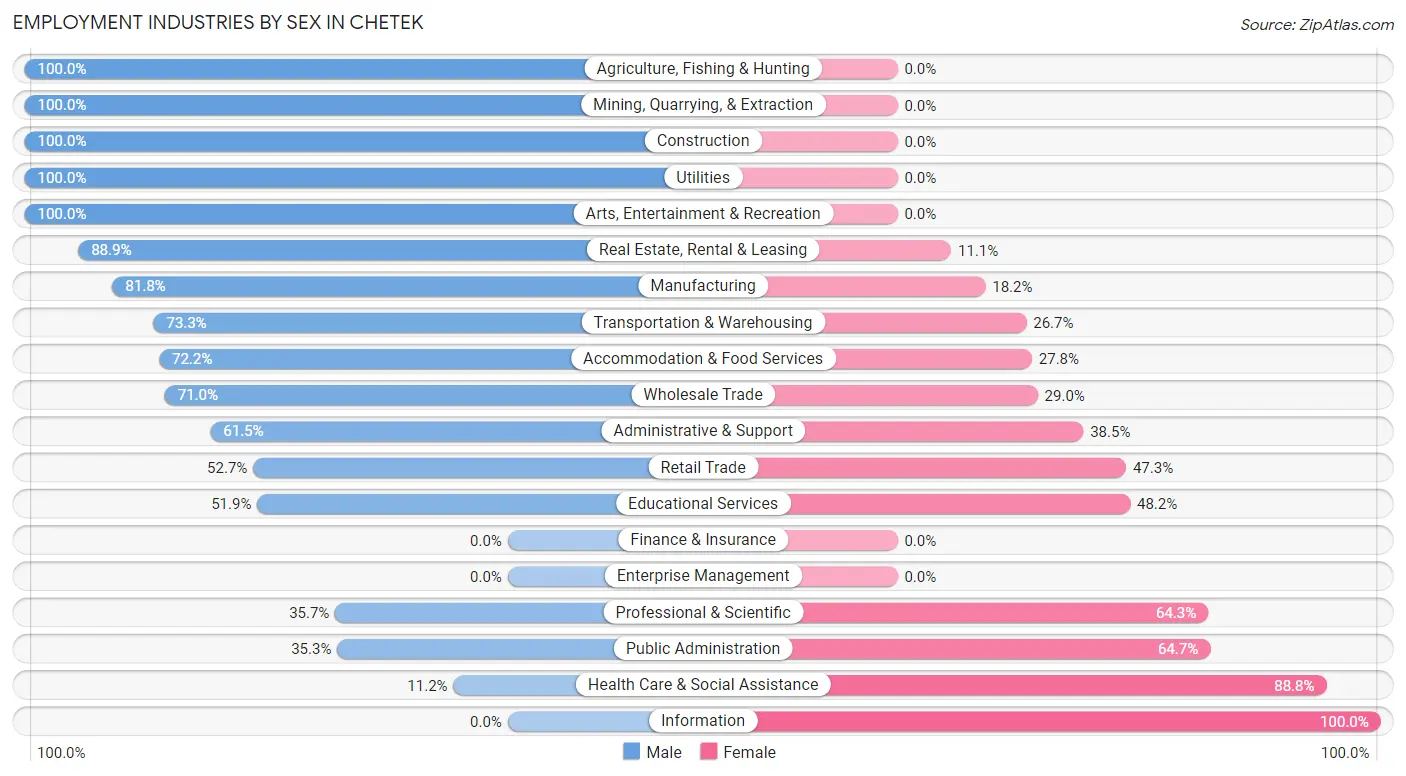
Employment Industries by Sex in Chetek
The Chetek industries that see more men than women are Agriculture, Fishing & Hunting (100.0%), Mining, Quarrying, & Extraction (100.0%), and Construction (100.0%), whereas the industries that tend to have a higher number of women are Information (100.0%), Health Care & Social Assistance (88.8%), and Public Administration (64.7%).
| Industry | Male | Female |
| Agriculture, Fishing & Hunting | 17 (100.0%) | 0 (0.0%) |
| Mining, Quarrying, & Extraction | 26 (100.0%) | 0 (0.0%) |
| Construction | 80 (100.0%) | 0 (0.0%) |
| Manufacturing | 198 (81.8%) | 44 (18.2%) |
| Wholesale Trade | 22 (71.0%) | 9 (29.0%) |
| Retail Trade | 88 (52.7%) | 79 (47.3%) |
| Transportation & Warehousing | 11 (73.3%) | 4 (26.7%) |
| Utilities | 5 (100.0%) | 0 (0.0%) |
| Information | 0 (0.0%) | 18 (100.0%) |
| Finance & Insurance | 0 (0.0%) | 0 (0.0%) |
| Real Estate, Rental & Leasing | 32 (88.9%) | 4 (11.1%) |
| Professional & Scientific | 5 (35.7%) | 9 (64.3%) |
| Enterprise Management | 0 (0.0%) | 0 (0.0%) |
| Administrative & Support | 40 (61.5%) | 25 (38.5%) |
| Educational Services | 14 (51.8%) | 13 (48.1%) |
| Health Care & Social Assistance | 20 (11.2%) | 158 (88.8%) |
| Arts, Entertainment & Recreation | 28 (100.0%) | 0 (0.0%) |
| Accommodation & Food Services | 83 (72.2%) | 32 (27.8%) |
| Public Administration | 6 (35.3%) | 11 (64.7%) |
| Total | 698 (63.0%) | 410 (37.0%) |
Education in Chetek
School Enrollment in Chetek
The most common levels of schooling among the 343 students in Chetek are high school (92 | 26.8%), elementary school (90 | 26.2%), and middle school (85 | 24.8%).
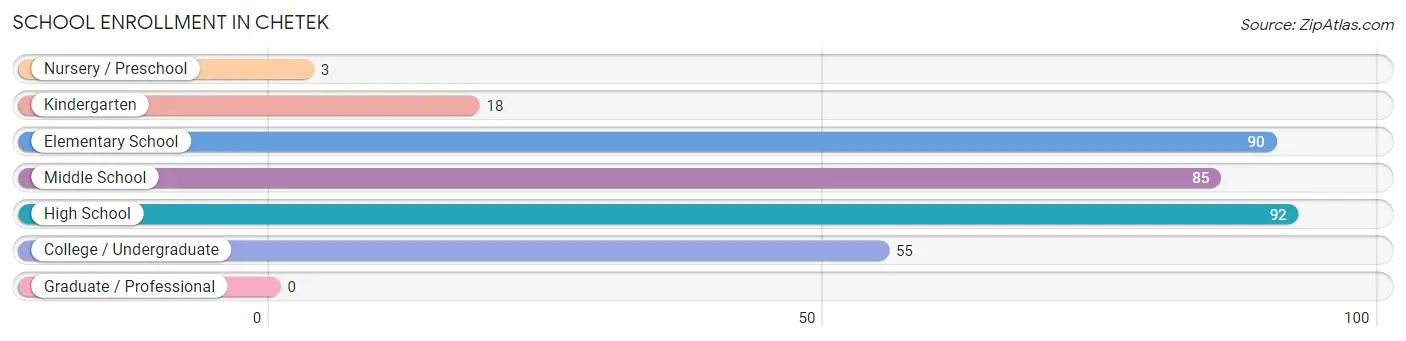
| School Level | # Students | % Students |
| Nursery / Preschool | 3 | 0.9% |
| Kindergarten | 18 | 5.2% |
| Elementary School | 90 | 26.2% |
| Middle School | 85 | 24.8% |
| High School | 92 | 26.8% |
| College / Undergraduate | 55 | 16.0% |
| Graduate / Professional | 0 | 0.0% |
| Total | 343 | 100.0% |
School Enrollment by Age by Funding Source in Chetek
Out of a total of 343 students who are enrolled in schools in Chetek, 8 (2.3%) attend a private institution, while the remaining 335 (97.7%) are enrolled in public schools. The age group of 25 to 34 year olds has the highest likelihood of being enrolled in private schools, with 8 (66.7% in the age bracket) enrolled. Conversely, the age group of 3 to 4 year olds has the lowest likelihood of being enrolled in a private school, with 4 (100.0% in the age bracket) attending a public institution.
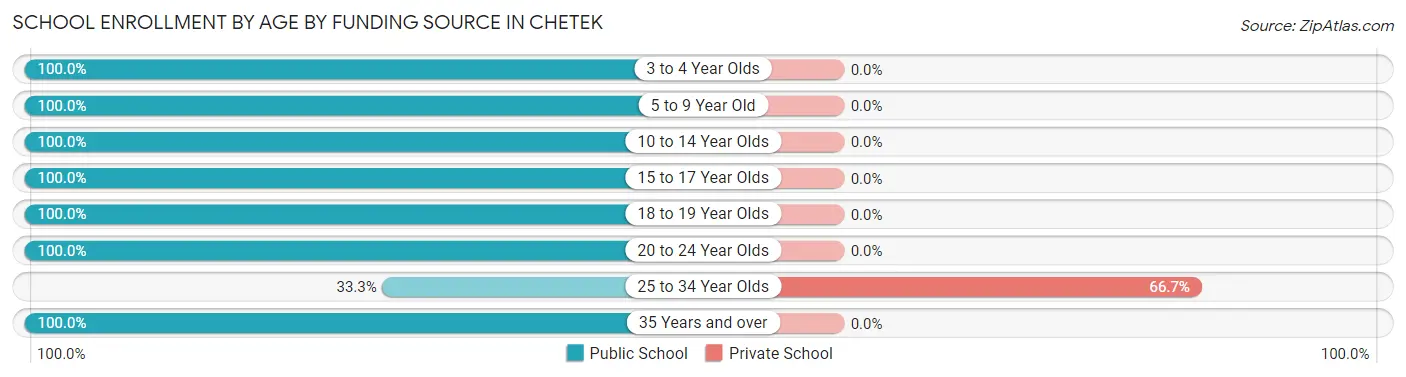
| Age Bracket | Public School | Private School |
| 3 to 4 Year Olds | 4 (100.0%) | 0 (0.0%) |
| 5 to 9 Year Old | 98 (100.0%) | 0 (0.0%) |
| 10 to 14 Year Olds | 100 (100.0%) | 0 (0.0%) |
| 15 to 17 Year Olds | 80 (100.0%) | 0 (0.0%) |
| 18 to 19 Year Olds | 12 (100.0%) | 0 (0.0%) |
| 20 to 24 Year Olds | 29 (100.0%) | 0 (0.0%) |
| 25 to 34 Year Olds | 4 (33.3%) | 8 (66.7%) |
| 35 Years and over | 8 (100.0%) | 0 (0.0%) |
| Total | 335 (97.7%) | 8 (2.3%) |
Educational Attainment by Field of Study in Chetek
Science & technology (59 | 24.2%), arts & humanities (39 | 16.0%), education (36 | 14.7%), business (35 | 14.3%), and engineering (29 | 11.9%) are the most common fields of study among 244 individuals in Chetek who have obtained a bachelor's degree or higher.
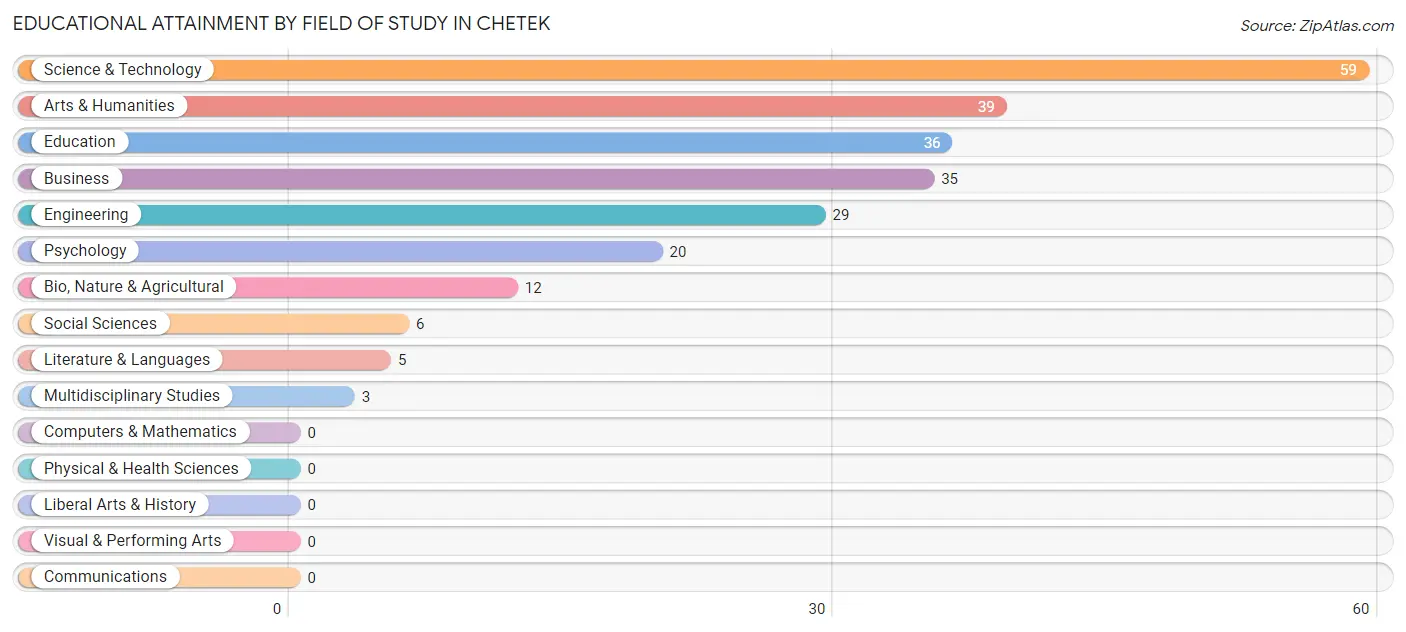
| Field of Study | # Graduates | % Graduates |
| Computers & Mathematics | 0 | 0.0% |
| Bio, Nature & Agricultural | 12 | 4.9% |
| Physical & Health Sciences | 0 | 0.0% |
| Psychology | 20 | 8.2% |
| Social Sciences | 6 | 2.5% |
| Engineering | 29 | 11.9% |
| Multidisciplinary Studies | 3 | 1.2% |
| Science & Technology | 59 | 24.2% |
| Business | 35 | 14.3% |
| Education | 36 | 14.7% |
| Literature & Languages | 5 | 2.1% |
| Liberal Arts & History | 0 | 0.0% |
| Visual & Performing Arts | 0 | 0.0% |
| Communications | 0 | 0.0% |
| Arts & Humanities | 39 | 16.0% |
| Total | 244 | 100.0% |
Transportation & Commute in Chetek
Vehicle Availability by Sex in Chetek
The most prevalent vehicle ownership categories in Chetek are males with 2 vehicles (311, accounting for 45.9%) and females with 2 vehicles (190, making up 76.4%).
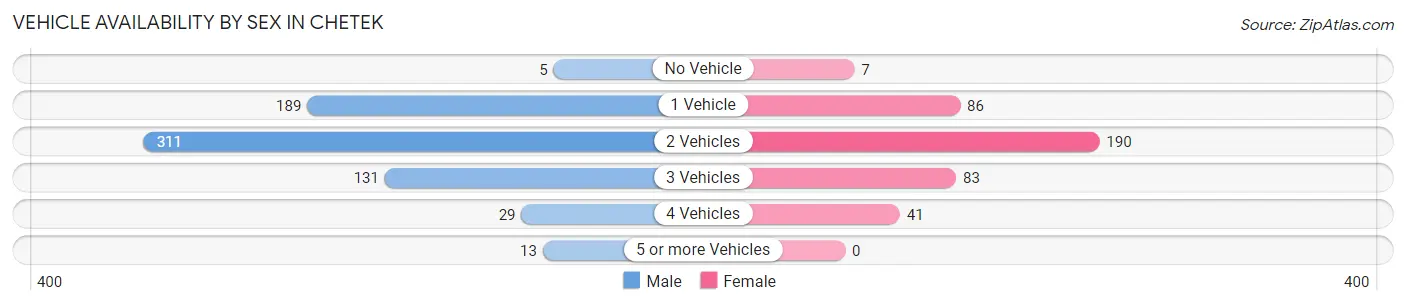
| Vehicles Available | Male | Female |
| No Vehicle | 5 (0.7%) | 7 (1.7%) |
| 1 Vehicle | 189 (27.9%) | 86 (21.1%) |
| 2 Vehicles | 311 (45.9%) | 190 (46.7%) |
| 3 Vehicles | 131 (19.3%) | 83 (20.4%) |
| 4 Vehicles | 29 (4.3%) | 41 (10.1%) |
| 5 or more Vehicles | 13 (1.9%) | 0 (0.0%) |
| Total | 678 (100.0%) | 407 (100.0%) |
Commute Time in Chetek
The most frequently occuring commute durations in Chetek are 20 to 24 minutes (217 commuters, 21.1%), 5 to 9 minutes (205 commuters, 20.0%), and 10 to 14 minutes (97 commuters, 9.5%).
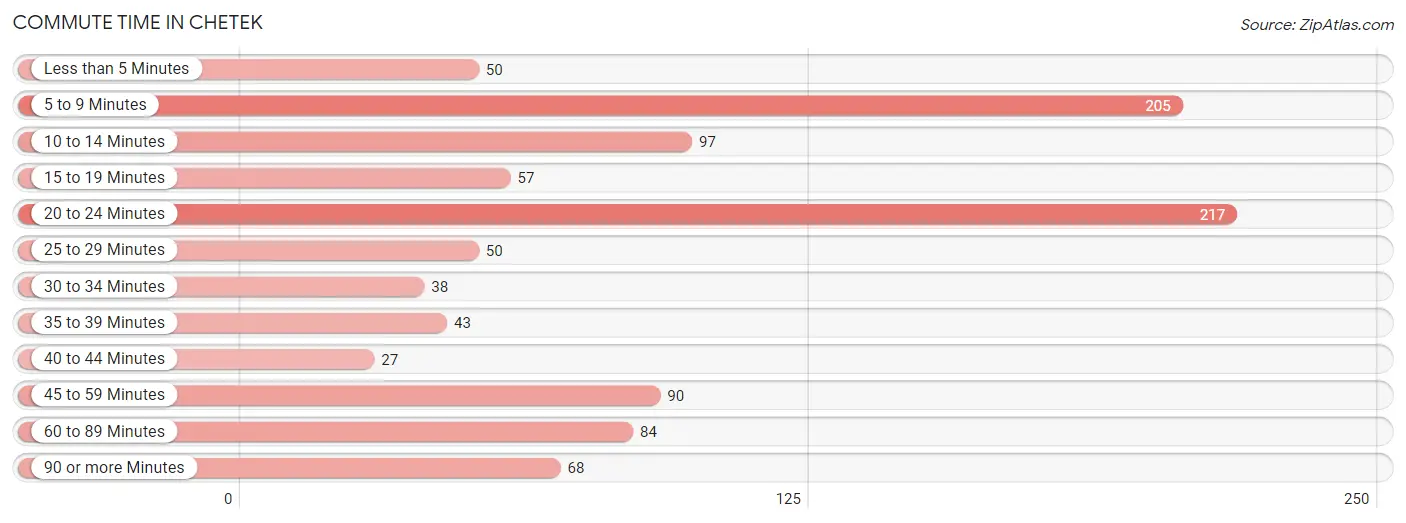
| Commute Time | # Commuters | % Commuters |
| Less than 5 Minutes | 50 | 4.9% |
| 5 to 9 Minutes | 205 | 20.0% |
| 10 to 14 Minutes | 97 | 9.5% |
| 15 to 19 Minutes | 57 | 5.6% |
| 20 to 24 Minutes | 217 | 21.1% |
| 25 to 29 Minutes | 50 | 4.9% |
| 30 to 34 Minutes | 38 | 3.7% |
| 35 to 39 Minutes | 43 | 4.2% |
| 40 to 44 Minutes | 27 | 2.6% |
| 45 to 59 Minutes | 90 | 8.8% |
| 60 to 89 Minutes | 84 | 8.2% |
| 90 or more Minutes | 68 | 6.6% |
Commute Time by Sex in Chetek
The most common commute times in Chetek are 20 to 24 minutes (153 commuters, 23.4%) for males and 20 to 24 minutes (64 commuters, 17.2%) for females.
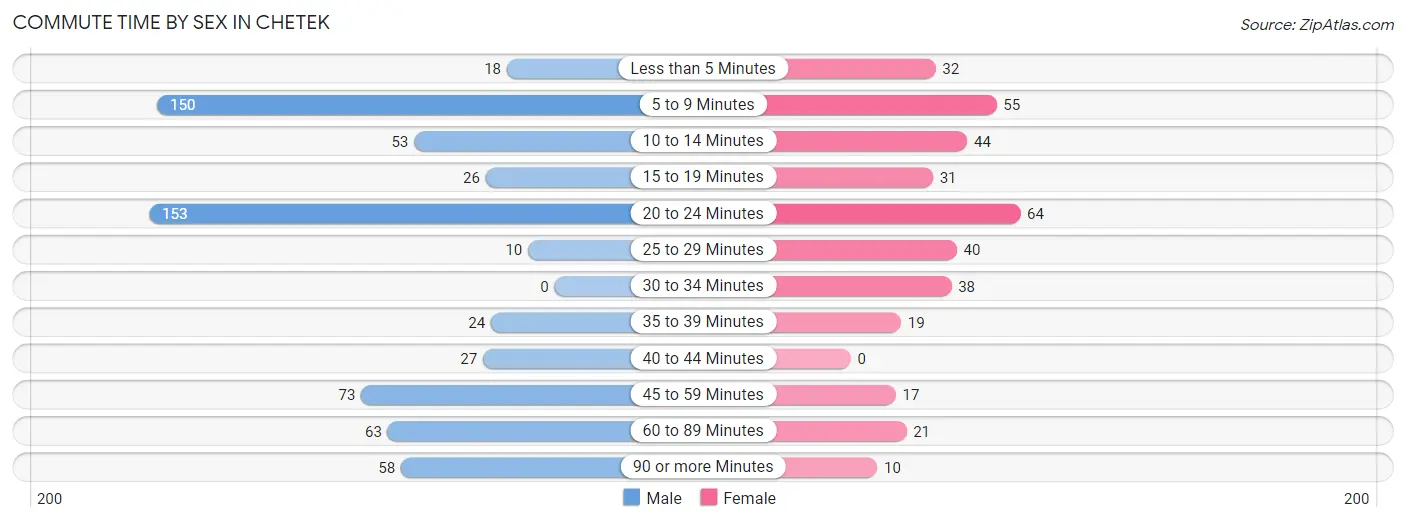
| Commute Time | Male | Female |
| Less than 5 Minutes | 18 (2.8%) | 32 (8.6%) |
| 5 to 9 Minutes | 150 (22.9%) | 55 (14.8%) |
| 10 to 14 Minutes | 53 (8.1%) | 44 (11.9%) |
| 15 to 19 Minutes | 26 (4.0%) | 31 (8.4%) |
| 20 to 24 Minutes | 153 (23.4%) | 64 (17.2%) |
| 25 to 29 Minutes | 10 (1.5%) | 40 (10.8%) |
| 30 to 34 Minutes | 0 (0.0%) | 38 (10.2%) |
| 35 to 39 Minutes | 24 (3.7%) | 19 (5.1%) |
| 40 to 44 Minutes | 27 (4.1%) | 0 (0.0%) |
| 45 to 59 Minutes | 73 (11.2%) | 17 (4.6%) |
| 60 to 89 Minutes | 63 (9.6%) | 21 (5.7%) |
| 90 or more Minutes | 58 (8.8%) | 10 (2.7%) |
Time of Departure to Work by Sex in Chetek
The most frequent times of departure to work in Chetek are 12:00 AM to 4:59 AM (92, 14.1%) for males and 7:00 AM to 7:29 AM (70, 18.9%) for females.
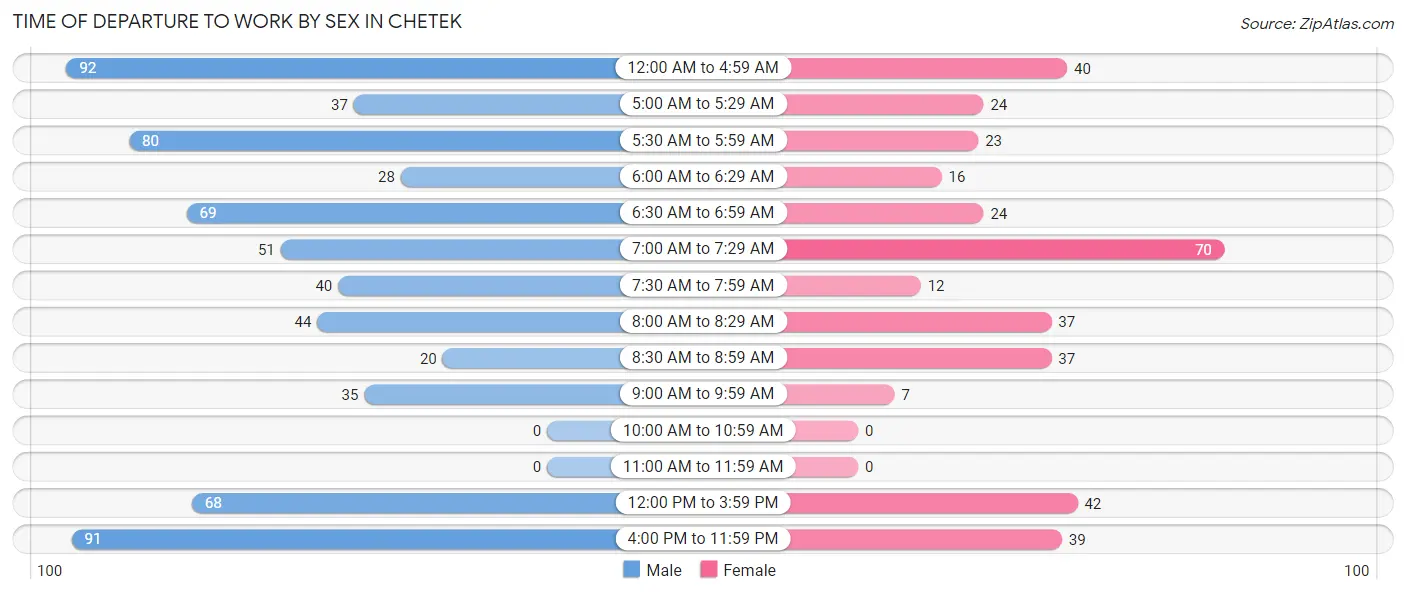
| Time of Departure | Male | Female |
| 12:00 AM to 4:59 AM | 92 (14.1%) | 40 (10.8%) |
| 5:00 AM to 5:29 AM | 37 (5.7%) | 24 (6.5%) |
| 5:30 AM to 5:59 AM | 80 (12.2%) | 23 (6.2%) |
| 6:00 AM to 6:29 AM | 28 (4.3%) | 16 (4.3%) |
| 6:30 AM to 6:59 AM | 69 (10.5%) | 24 (6.5%) |
| 7:00 AM to 7:29 AM | 51 (7.8%) | 70 (18.9%) |
| 7:30 AM to 7:59 AM | 40 (6.1%) | 12 (3.2%) |
| 8:00 AM to 8:29 AM | 44 (6.7%) | 37 (10.0%) |
| 8:30 AM to 8:59 AM | 20 (3.0%) | 37 (10.0%) |
| 9:00 AM to 9:59 AM | 35 (5.3%) | 7 (1.9%) |
| 10:00 AM to 10:59 AM | 0 (0.0%) | 0 (0.0%) |
| 11:00 AM to 11:59 AM | 0 (0.0%) | 0 (0.0%) |
| 12:00 PM to 3:59 PM | 68 (10.4%) | 42 (11.3%) |
| 4:00 PM to 11:59 PM | 91 (13.9%) | 39 (10.5%) |
| Total | 655 (100.0%) | 371 (100.0%) |
Housing Occupancy in Chetek
Occupancy by Ownership in Chetek
Of the total 906 dwellings in Chetek, owner-occupied units account for 632 (69.8%), while renter-occupied units make up 274 (30.2%).
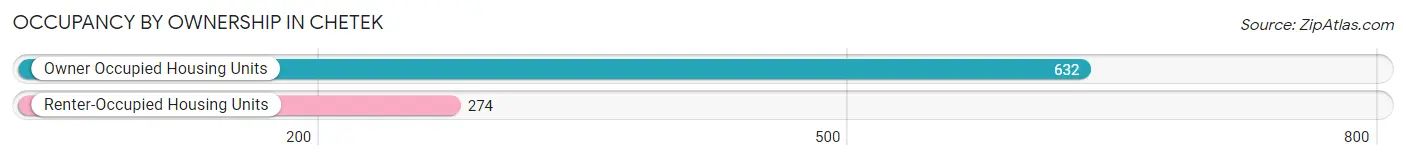
| Occupancy | # Housing Units | % Housing Units |
| Owner Occupied Housing Units | 632 | 69.8% |
| Renter-Occupied Housing Units | 274 | 30.2% |
| Total Occupied Housing Units | 906 | 100.0% |
Occupancy by Household Size in Chetek
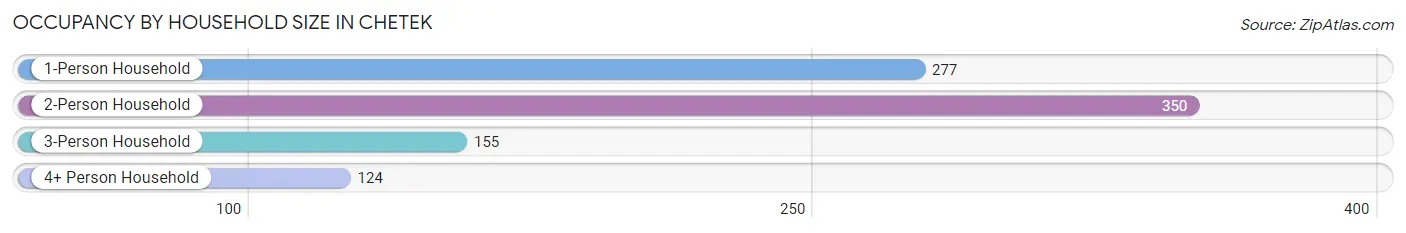
| Household Size | # Housing Units | % Housing Units |
| 1-Person Household | 277 | 30.6% |
| 2-Person Household | 350 | 38.6% |
| 3-Person Household | 155 | 17.1% |
| 4+ Person Household | 124 | 13.7% |
| Total Housing Units | 906 | 100.0% |
Occupancy by Ownership by Household Size in Chetek
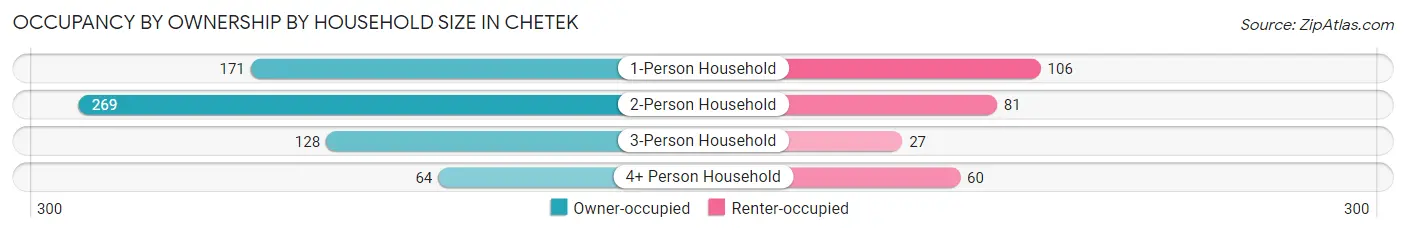
| Household Size | Owner-occupied | Renter-occupied |
| 1-Person Household | 171 (61.7%) | 106 (38.3%) |
| 2-Person Household | 269 (76.9%) | 81 (23.1%) |
| 3-Person Household | 128 (82.6%) | 27 (17.4%) |
| 4+ Person Household | 64 (51.6%) | 60 (48.4%) |
| Total Housing Units | 632 (69.8%) | 274 (30.2%) |
Occupancy by Educational Attainment in Chetek
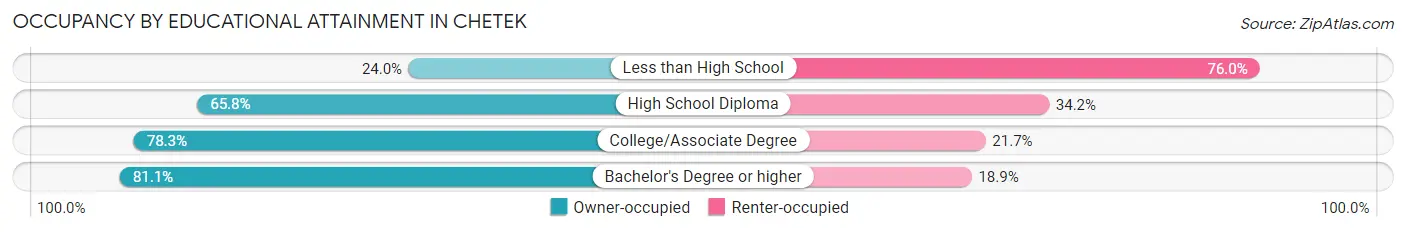
| Household Size | Owner-occupied | Renter-occupied |
| Less than High School | 18 (24.0%) | 57 (76.0%) |
| High School Diploma | 217 (65.8%) | 113 (34.2%) |
| College/Associate Degree | 264 (78.3%) | 73 (21.7%) |
| Bachelor's Degree or higher | 133 (81.1%) | 31 (18.9%) |
Occupancy by Age of Householder in Chetek
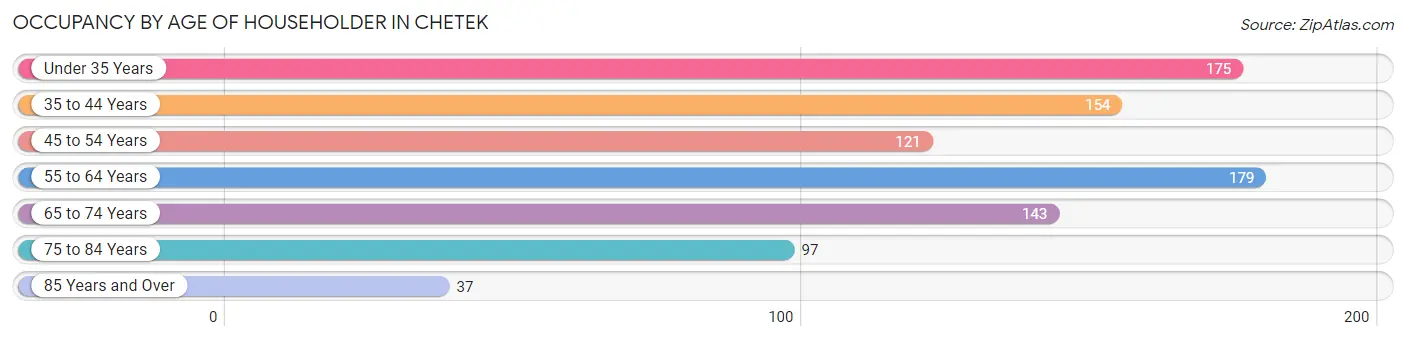
| Age Bracket | # Households | % Households |
| Under 35 Years | 175 | 19.3% |
| 35 to 44 Years | 154 | 17.0% |
| 45 to 54 Years | 121 | 13.4% |
| 55 to 64 Years | 179 | 19.8% |
| 65 to 74 Years | 143 | 15.8% |
| 75 to 84 Years | 97 | 10.7% |
| 85 Years and Over | 37 | 4.1% |
| Total | 906 | 100.0% |
Housing Finances in Chetek
Median Income by Occupancy in Chetek
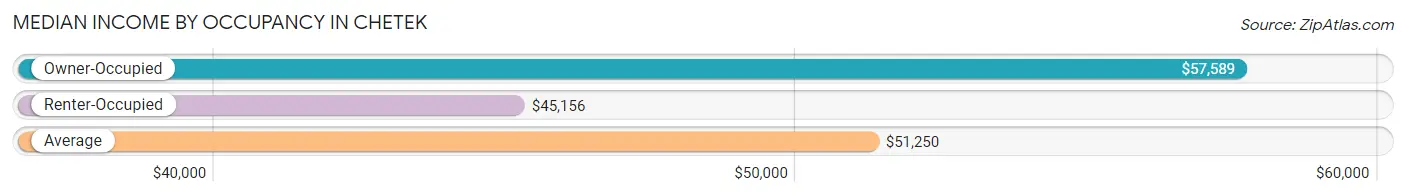
| Occupancy Type | # Households | Median Income |
| Owner-Occupied | 632 (69.8%) | $57,589 |
| Renter-Occupied | 274 (30.2%) | $45,156 |
| Average | 906 (100.0%) | $51,250 |
Occupancy by Householder Income Bracket in Chetek
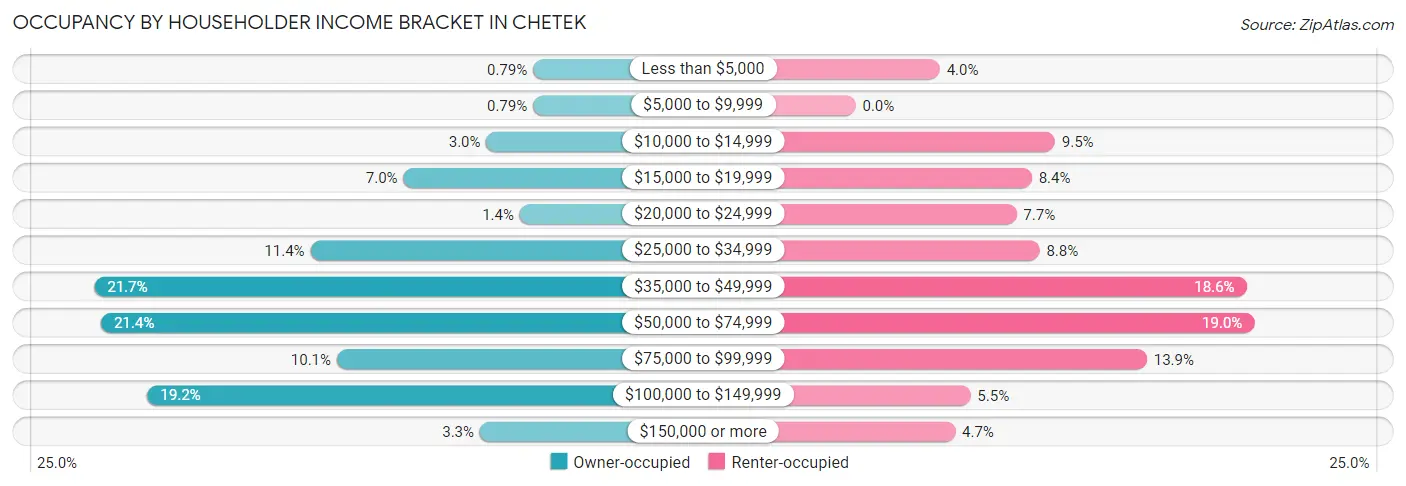
| Income Bracket | Owner-occupied | Renter-occupied |
| Less than $5,000 | 5 (0.8%) | 11 (4.0%) |
| $5,000 to $9,999 | 5 (0.8%) | 0 (0.0%) |
| $10,000 to $14,999 | 19 (3.0%) | 26 (9.5%) |
| $15,000 to $19,999 | 44 (7.0%) | 23 (8.4%) |
| $20,000 to $24,999 | 9 (1.4%) | 21 (7.7%) |
| $25,000 to $34,999 | 72 (11.4%) | 24 (8.8%) |
| $35,000 to $49,999 | 137 (21.7%) | 51 (18.6%) |
| $50,000 to $74,999 | 135 (21.4%) | 52 (19.0%) |
| $75,000 to $99,999 | 64 (10.1%) | 38 (13.9%) |
| $100,000 to $149,999 | 121 (19.2%) | 15 (5.5%) |
| $150,000 or more | 21 (3.3%) | 13 (4.7%) |
| Total | 632 (100.0%) | 274 (100.0%) |
Monthly Housing Cost Tiers in Chetek
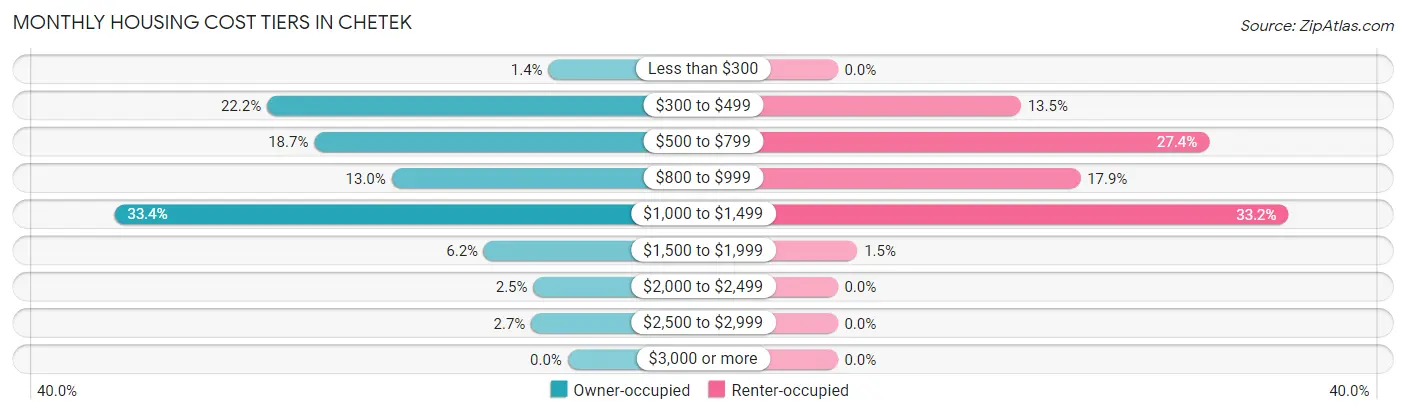
| Monthly Cost | Owner-occupied | Renter-occupied |
| Less than $300 | 9 (1.4%) | 0 (0.0%) |
| $300 to $499 | 140 (22.2%) | 37 (13.5%) |
| $500 to $799 | 118 (18.7%) | 75 (27.4%) |
| $800 to $999 | 82 (13.0%) | 49 (17.9%) |
| $1,000 to $1,499 | 211 (33.4%) | 91 (33.2%) |
| $1,500 to $1,999 | 39 (6.2%) | 4 (1.5%) |
| $2,000 to $2,499 | 16 (2.5%) | 0 (0.0%) |
| $2,500 to $2,999 | 17 (2.7%) | 0 (0.0%) |
| $3,000 or more | 0 (0.0%) | 0 (0.0%) |
| Total | 632 (100.0%) | 274 (100.0%) |
Physical Housing Characteristics in Chetek
Housing Structures in Chetek
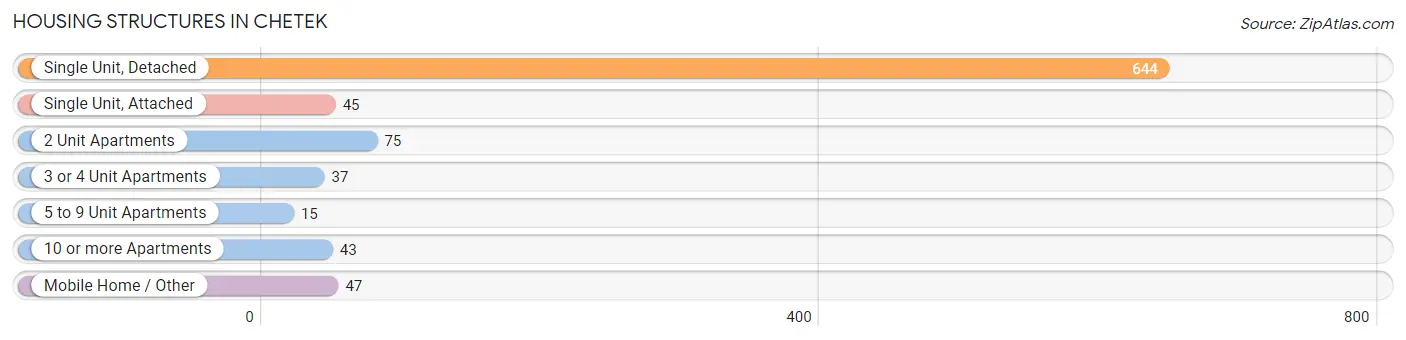
| Structure Type | # Housing Units | % Housing Units |
| Single Unit, Detached | 644 | 71.1% |
| Single Unit, Attached | 45 | 5.0% |
| 2 Unit Apartments | 75 | 8.3% |
| 3 or 4 Unit Apartments | 37 | 4.1% |
| 5 to 9 Unit Apartments | 15 | 1.7% |
| 10 or more Apartments | 43 | 4.8% |
| Mobile Home / Other | 47 | 5.2% |
| Total | 906 | 100.0% |
Housing Structures by Occupancy in Chetek
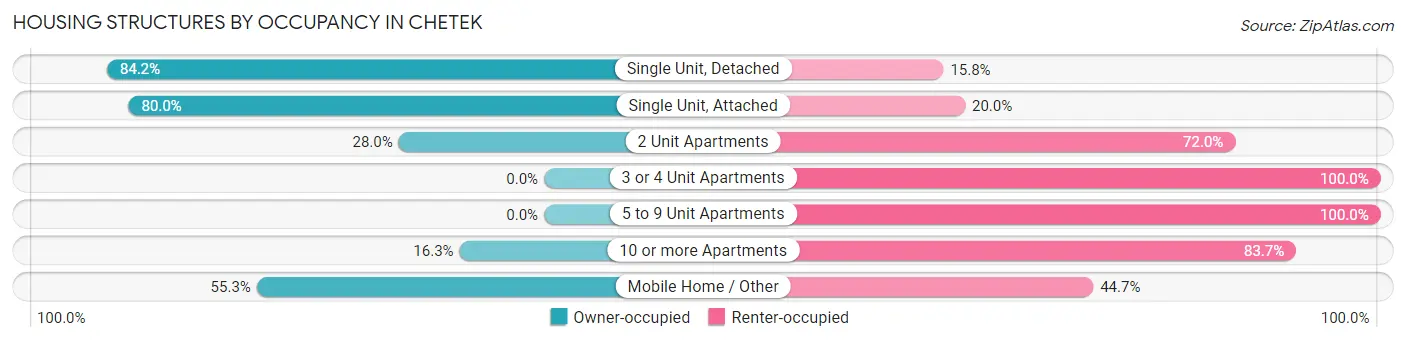
| Structure Type | Owner-occupied | Renter-occupied |
| Single Unit, Detached | 542 (84.2%) | 102 (15.8%) |
| Single Unit, Attached | 36 (80.0%) | 9 (20.0%) |
| 2 Unit Apartments | 21 (28.0%) | 54 (72.0%) |
| 3 or 4 Unit Apartments | 0 (0.0%) | 37 (100.0%) |
| 5 to 9 Unit Apartments | 0 (0.0%) | 15 (100.0%) |
| 10 or more Apartments | 7 (16.3%) | 36 (83.7%) |
| Mobile Home / Other | 26 (55.3%) | 21 (44.7%) |
| Total | 632 (69.8%) | 274 (30.2%) |
Housing Structures by Number of Rooms in Chetek
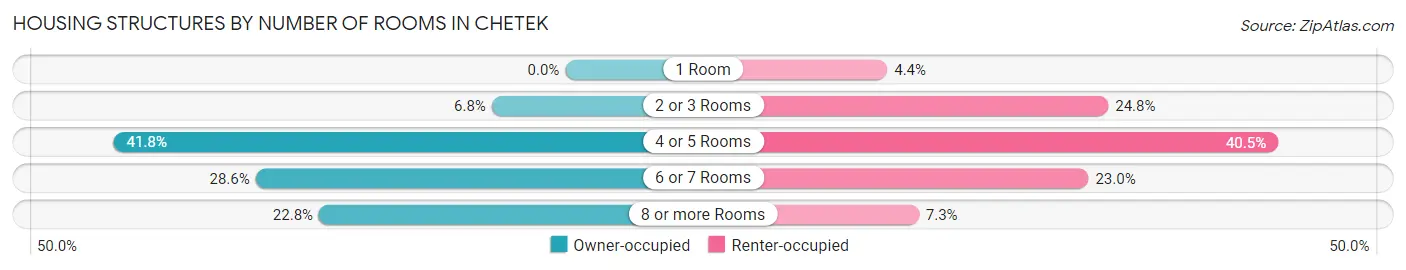
| Number of Rooms | Owner-occupied | Renter-occupied |
| 1 Room | 0 (0.0%) | 12 (4.4%) |
| 2 or 3 Rooms | 43 (6.8%) | 68 (24.8%) |
| 4 or 5 Rooms | 264 (41.8%) | 111 (40.5%) |
| 6 or 7 Rooms | 181 (28.6%) | 63 (23.0%) |
| 8 or more Rooms | 144 (22.8%) | 20 (7.3%) |
| Total | 632 (100.0%) | 274 (100.0%) |
Housing Structure by Heating Type in Chetek
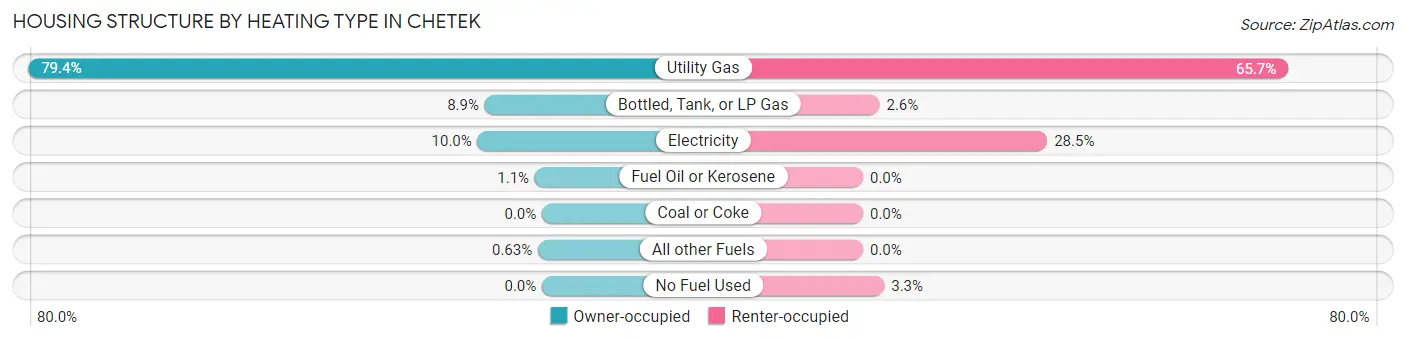
| Heating Type | Owner-occupied | Renter-occupied |
| Utility Gas | 502 (79.4%) | 180 (65.7%) |
| Bottled, Tank, or LP Gas | 56 (8.9%) | 7 (2.5%) |
| Electricity | 63 (10.0%) | 78 (28.5%) |
| Fuel Oil or Kerosene | 7 (1.1%) | 0 (0.0%) |
| Coal or Coke | 0 (0.0%) | 0 (0.0%) |
| All other Fuels | 4 (0.6%) | 0 (0.0%) |
| No Fuel Used | 0 (0.0%) | 9 (3.3%) |
| Total | 632 (100.0%) | 274 (100.0%) |
Household Vehicle Usage in Chetek
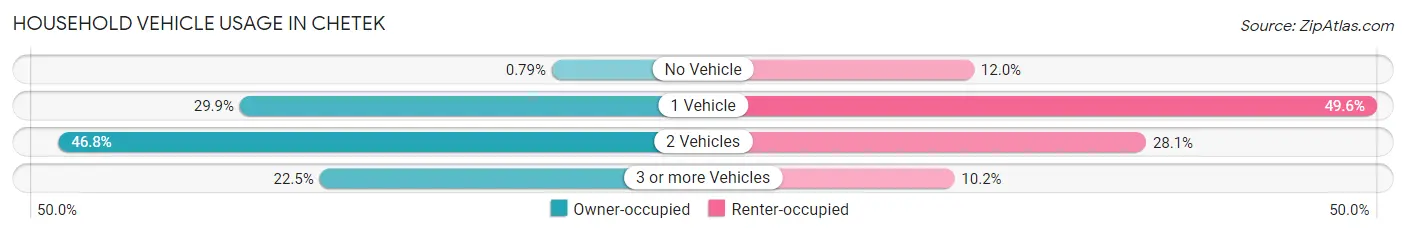
| Vehicles per Household | Owner-occupied | Renter-occupied |
| No Vehicle | 5 (0.8%) | 33 (12.0%) |
| 1 Vehicle | 189 (29.9%) | 136 (49.6%) |
| 2 Vehicles | 296 (46.8%) | 77 (28.1%) |
| 3 or more Vehicles | 142 (22.5%) | 28 (10.2%) |
| Total | 632 (100.0%) | 274 (100.0%) |
Real Estate & Mortgages in Chetek
Real Estate and Mortgage Overview in Chetek
| Characteristic | Without Mortgage | With Mortgage |
| Housing Units | 257 | 375 |
| Median Property Value | $115,200 | $159,500 |
| Median Household Income | $39,189 | $21 |
| Monthly Housing Costs | $476 | $0 |
| Real Estate Taxes | $1,925 | $0 |
Property Value by Mortgage Status in Chetek
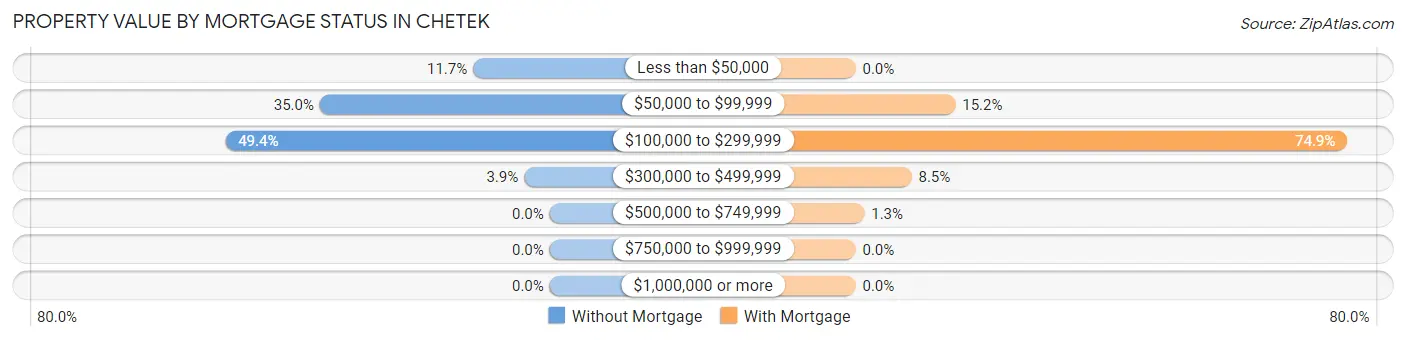
| Property Value | Without Mortgage | With Mortgage |
| Less than $50,000 | 30 (11.7%) | 0 (0.0%) |
| $50,000 to $99,999 | 90 (35.0%) | 57 (15.2%) |
| $100,000 to $299,999 | 127 (49.4%) | 281 (74.9%) |
| $300,000 to $499,999 | 10 (3.9%) | 32 (8.5%) |
| $500,000 to $749,999 | 0 (0.0%) | 5 (1.3%) |
| $750,000 to $999,999 | 0 (0.0%) | 0 (0.0%) |
| $1,000,000 or more | 0 (0.0%) | 0 (0.0%) |
| Total | 257 (100.0%) | 375 (100.0%) |
Household Income by Mortgage Status in Chetek
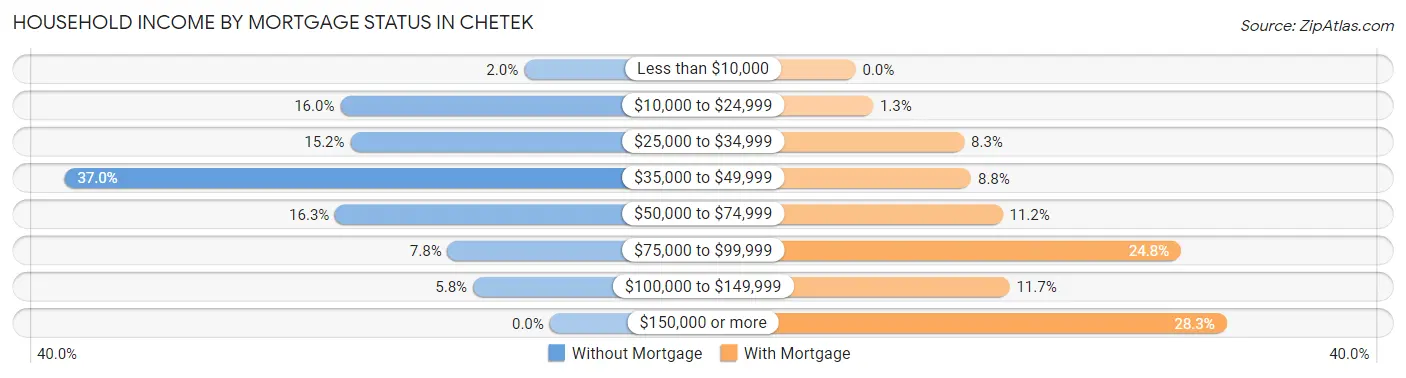
| Household Income | Without Mortgage | With Mortgage |
| Less than $10,000 | 5 (1.9%) | 0 (0.0%) |
| $10,000 to $24,999 | 41 (16.0%) | 5 (1.3%) |
| $25,000 to $34,999 | 39 (15.2%) | 31 (8.3%) |
| $35,000 to $49,999 | 95 (37.0%) | 33 (8.8%) |
| $50,000 to $74,999 | 42 (16.3%) | 42 (11.2%) |
| $75,000 to $99,999 | 20 (7.8%) | 93 (24.8%) |
| $100,000 to $149,999 | 15 (5.8%) | 44 (11.7%) |
| $150,000 or more | 0 (0.0%) | 106 (28.3%) |
| Total | 257 (100.0%) | 375 (100.0%) |
Property Value to Household Income Ratio in Chetek
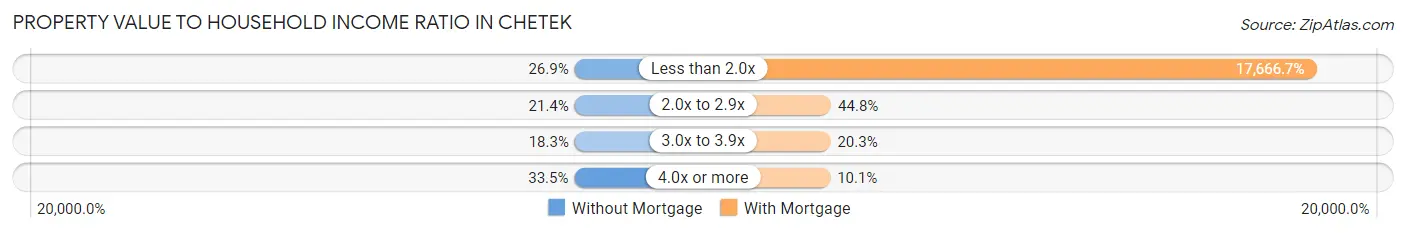
| Value-to-Income Ratio | Without Mortgage | With Mortgage |
| Less than 2.0x | 69 (26.9%) | 66,250 (17,666.7%) |
| 2.0x to 2.9x | 55 (21.4%) | 168 (44.8%) |
| 3.0x to 3.9x | 47 (18.3%) | 76 (20.3%) |
| 4.0x or more | 86 (33.5%) | 38 (10.1%) |
| Total | 257 (100.0%) | 375 (100.0%) |
Real Estate Taxes by Mortgage Status in Chetek
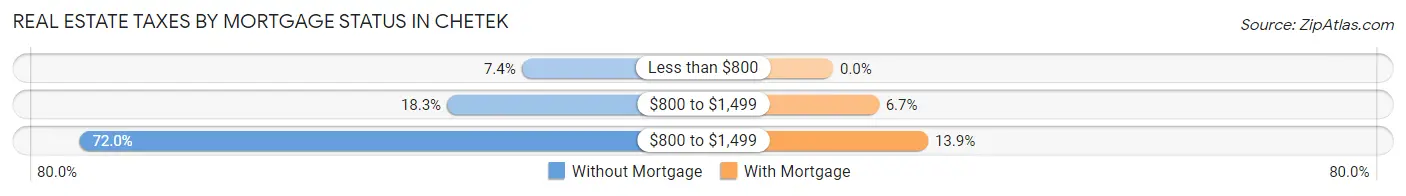
| Property Taxes | Without Mortgage | With Mortgage |
| Less than $800 | 19 (7.4%) | 0 (0.0%) |
| $800 to $1,499 | 47 (18.3%) | 25 (6.7%) |
| $800 to $1,499 | 185 (72.0%) | 52 (13.9%) |
| Total | 257 (100.0%) | 375 (100.0%) |
Health & Disability in Chetek
Health Insurance Coverage by Age in Chetek
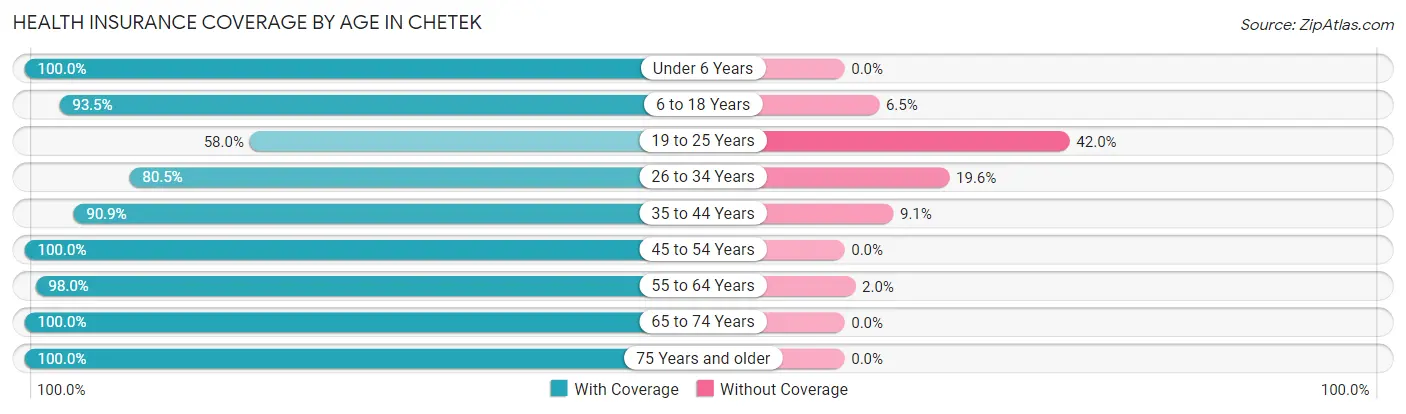
| Age Bracket | With Coverage | Without Coverage |
| Under 6 Years | 130 (100.0%) | 0 (0.0%) |
| 6 to 18 Years | 260 (93.5%) | 18 (6.5%) |
| 19 to 25 Years | 123 (58.0%) | 89 (42.0%) |
| 26 to 34 Years | 214 (80.4%) | 52 (19.6%) |
| 35 to 44 Years | 190 (90.9%) | 19 (9.1%) |
| 45 to 54 Years | 255 (100.0%) | 0 (0.0%) |
| 55 to 64 Years | 340 (98.0%) | 7 (2.0%) |
| 65 to 74 Years | 236 (100.0%) | 0 (0.0%) |
| 75 Years and older | 251 (100.0%) | 0 (0.0%) |
| Total | 1,999 (91.5%) | 185 (8.5%) |
Health Insurance Coverage by Citizenship Status in Chetek
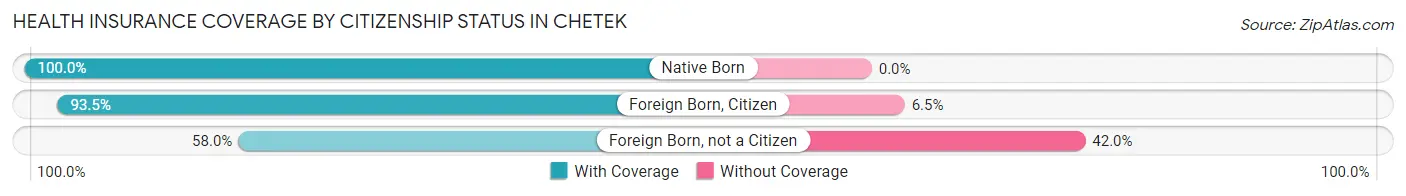
| Citizenship Status | With Coverage | Without Coverage |
| Native Born | 130 (100.0%) | 0 (0.0%) |
| Foreign Born, Citizen | 260 (93.5%) | 18 (6.5%) |
| Foreign Born, not a Citizen | 123 (58.0%) | 89 (42.0%) |
Health Insurance Coverage by Household Income in Chetek
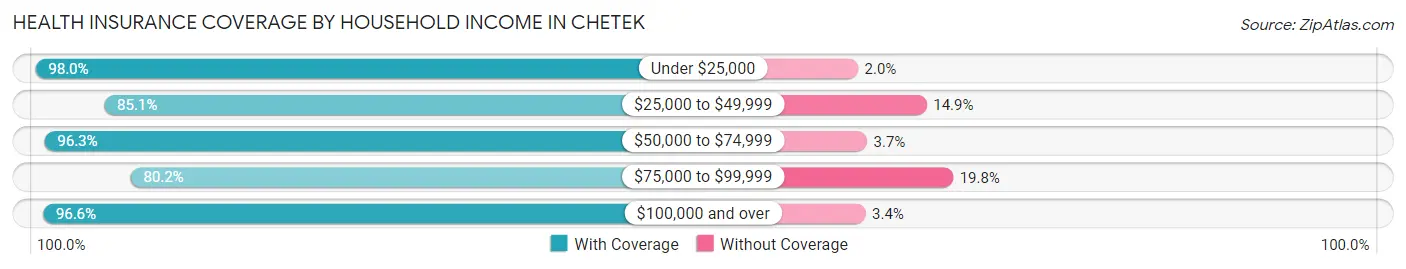
| Household Income | With Coverage | Without Coverage |
| Under $25,000 | 243 (98.0%) | 5 (2.0%) |
| $25,000 to $49,999 | 531 (85.1%) | 93 (14.9%) |
| $50,000 to $74,999 | 441 (96.3%) | 17 (3.7%) |
| $75,000 to $99,999 | 202 (80.2%) | 50 (19.8%) |
| $100,000 and over | 563 (96.6%) | 20 (3.4%) |
Public vs Private Health Insurance Coverage by Age in Chetek
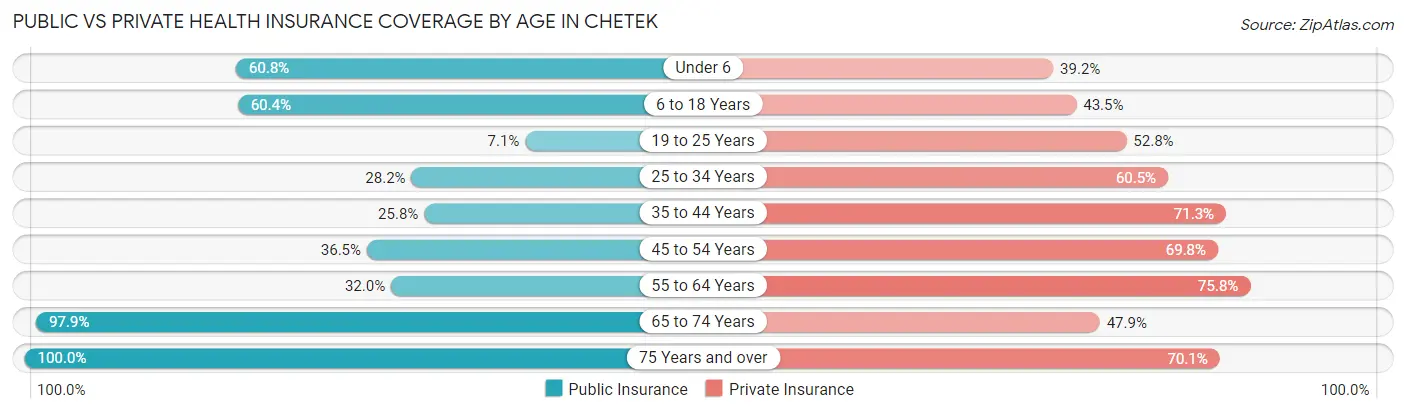
| Age Bracket | Public Insurance | Private Insurance |
| Under 6 | 79 (60.8%) | 51 (39.2%) |
| 6 to 18 Years | 168 (60.4%) | 121 (43.5%) |
| 19 to 25 Years | 15 (7.1%) | 112 (52.8%) |
| 25 to 34 Years | 75 (28.2%) | 161 (60.5%) |
| 35 to 44 Years | 54 (25.8%) | 149 (71.3%) |
| 45 to 54 Years | 93 (36.5%) | 178 (69.8%) |
| 55 to 64 Years | 111 (32.0%) | 263 (75.8%) |
| 65 to 74 Years | 231 (97.9%) | 113 (47.9%) |
| 75 Years and over | 251 (100.0%) | 176 (70.1%) |
| Total | 1,077 (49.3%) | 1,324 (60.6%) |
Disability Status by Sex by Age in Chetek
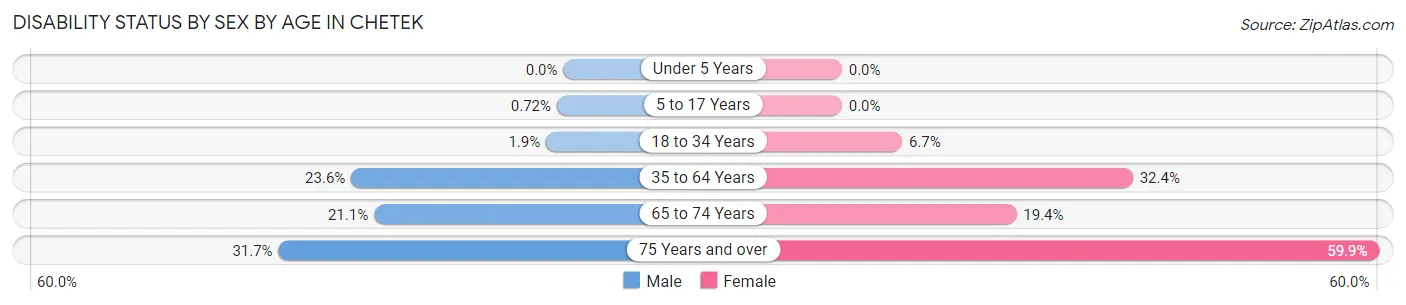
| Age Bracket | Male | Female |
| Under 5 Years | 0 (0.0%) | 0 (0.0%) |
| 5 to 17 Years | 1 (0.7%) | 0 (0.0%) |
| 18 to 34 Years | 6 (1.9%) | 12 (6.7%) |
| 35 to 64 Years | 99 (23.6%) | 127 (32.4%) |
| 65 to 74 Years | 27 (21.1%) | 21 (19.4%) |
| 75 Years and over | 33 (31.7%) | 88 (59.9%) |
Disability Class by Sex by Age in Chetek
Disability Class: Hearing Difficulty
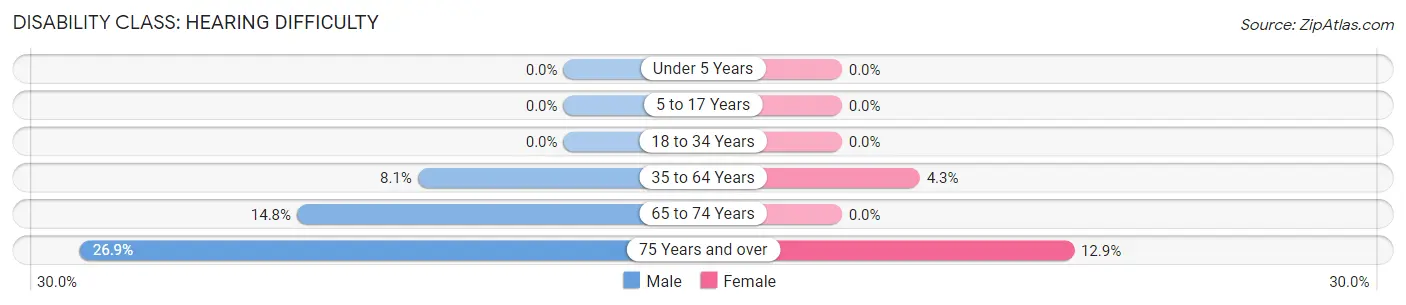
| Age Bracket | Male | Female |
| Under 5 Years | 0 (0.0%) | 0 (0.0%) |
| 5 to 17 Years | 0 (0.0%) | 0 (0.0%) |
| 18 to 34 Years | 0 (0.0%) | 0 (0.0%) |
| 35 to 64 Years | 34 (8.1%) | 17 (4.3%) |
| 65 to 74 Years | 19 (14.8%) | 0 (0.0%) |
| 75 Years and over | 28 (26.9%) | 19 (12.9%) |
Disability Class: Vision Difficulty
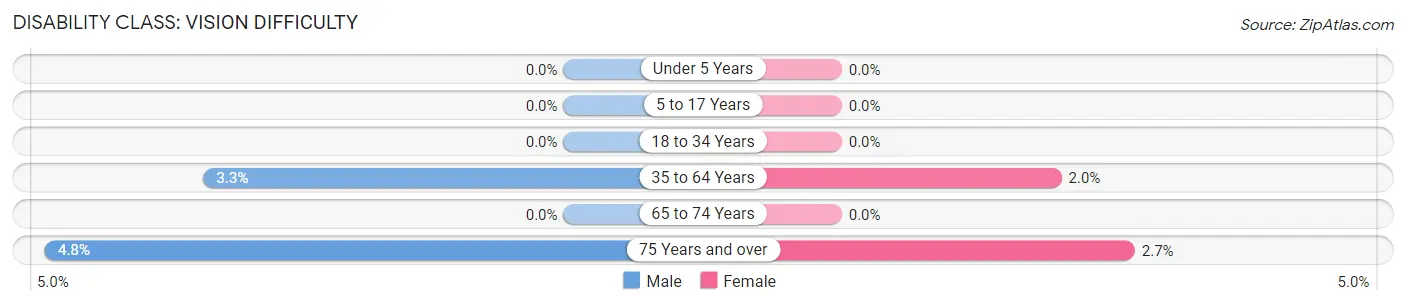
| Age Bracket | Male | Female |
| Under 5 Years | 0 (0.0%) | 0 (0.0%) |
| 5 to 17 Years | 0 (0.0%) | 0 (0.0%) |
| 18 to 34 Years | 0 (0.0%) | 0 (0.0%) |
| 35 to 64 Years | 14 (3.3%) | 8 (2.0%) |
| 65 to 74 Years | 0 (0.0%) | 0 (0.0%) |
| 75 Years and over | 5 (4.8%) | 4 (2.7%) |
Disability Class: Cognitive Difficulty
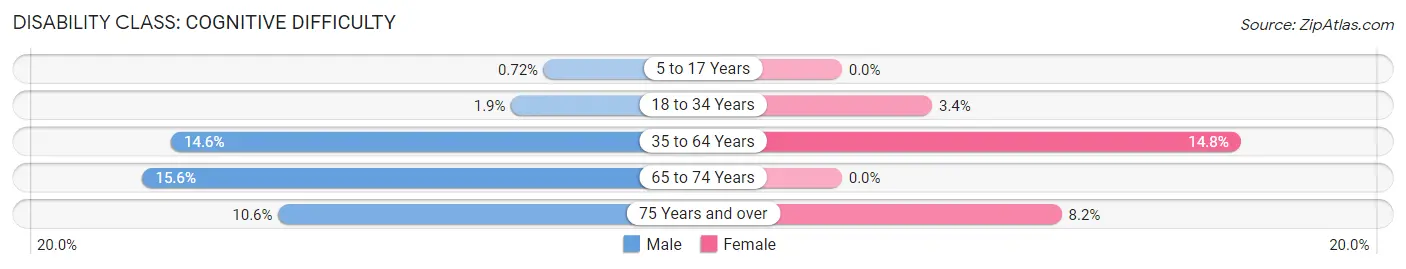
| Age Bracket | Male | Female |
| 5 to 17 Years | 1 (0.7%) | 0 (0.0%) |
| 18 to 34 Years | 6 (1.9%) | 6 (3.4%) |
| 35 to 64 Years | 61 (14.6%) | 58 (14.8%) |
| 65 to 74 Years | 20 (15.6%) | 0 (0.0%) |
| 75 Years and over | 11 (10.6%) | 12 (8.2%) |
Disability Class: Ambulatory Difficulty
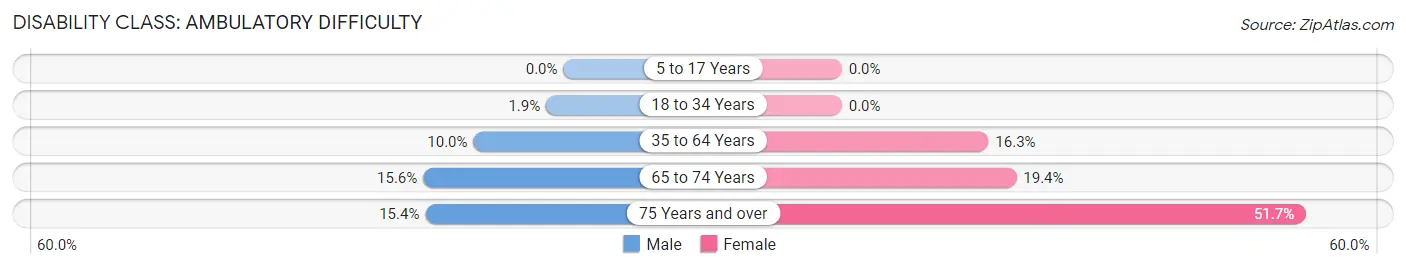
| Age Bracket | Male | Female |
| 5 to 17 Years | 0 (0.0%) | 0 (0.0%) |
| 18 to 34 Years | 6 (1.9%) | 0 (0.0%) |
| 35 to 64 Years | 42 (10.0%) | 64 (16.3%) |
| 65 to 74 Years | 20 (15.6%) | 21 (19.4%) |
| 75 Years and over | 16 (15.4%) | 76 (51.7%) |
Disability Class: Self-Care Difficulty
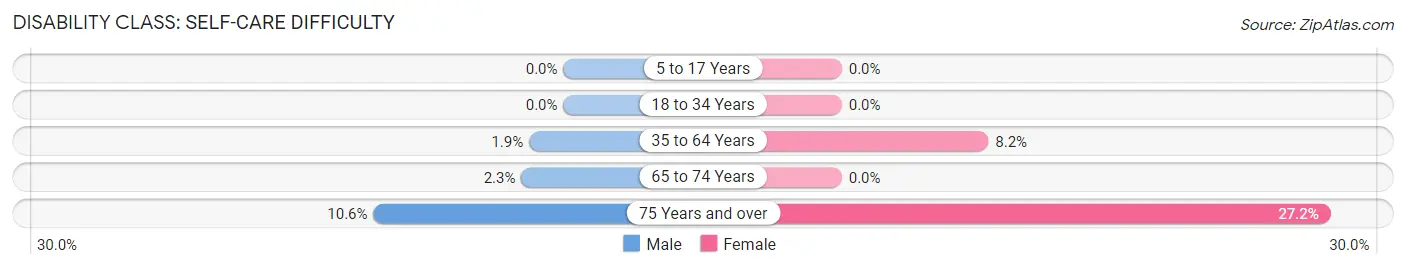
| Age Bracket | Male | Female |
| 5 to 17 Years | 0 (0.0%) | 0 (0.0%) |
| 18 to 34 Years | 0 (0.0%) | 0 (0.0%) |
| 35 to 64 Years | 8 (1.9%) | 32 (8.2%) |
| 65 to 74 Years | 3 (2.3%) | 0 (0.0%) |
| 75 Years and over | 11 (10.6%) | 40 (27.2%) |
Technology Access in Chetek
Computing Device Access in Chetek
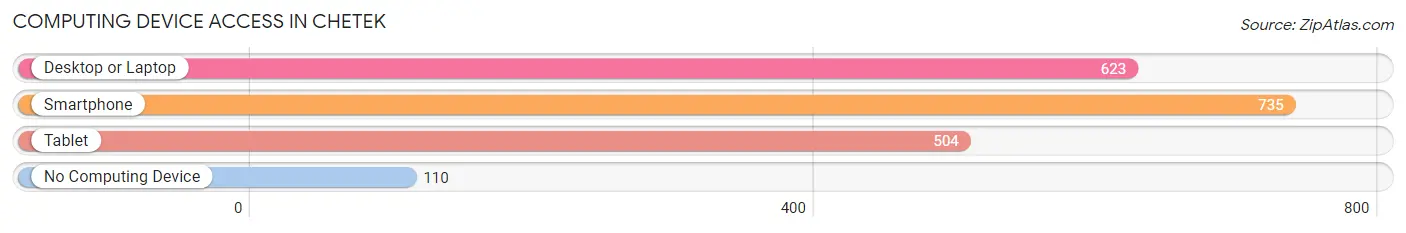
| Device Type | # Households | % Households |
| Desktop or Laptop | 623 | 68.8% |
| Smartphone | 735 | 81.1% |
| Tablet | 504 | 55.6% |
| No Computing Device | 110 | 12.1% |
| Total | 906 | 100.0% |
Internet Access in Chetek
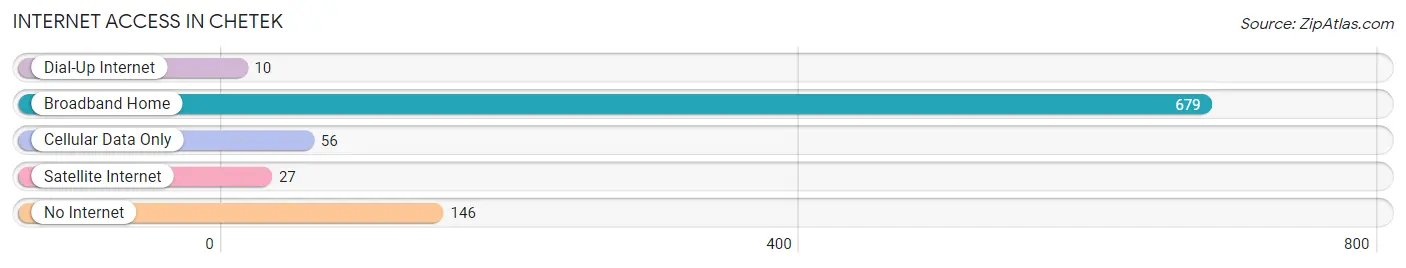
| Internet Type | # Households | % Households |
| Dial-Up Internet | 10 | 1.1% |
| Broadband Home | 679 | 74.9% |
| Cellular Data Only | 56 | 6.2% |
| Satellite Internet | 27 | 3.0% |
| No Internet | 146 | 16.1% |
| Total | 906 | 100.0% |
Chetek Summary
Chetek, Wisconsin is a small city located in Barron County in the northwestern part of the state. It is situated on the banks of the Chetek River, which is a tributary of the Red Cedar River. The city is part of the Chippewa Valley region and is home to a population of approximately 2,000 people.
History
Chetek was first settled in the late 1800s by a group of Norwegian immigrants. The city was originally known as “Chetek Station” and was a stop on the Chicago, St. Paul, Minneapolis and Omaha Railroad. The city was officially incorporated in 1891 and was named after the nearby Chetek River.
In the early 1900s, the city experienced a period of growth and development. The first school was built in 1901 and the first bank opened in 1906. The city also had a number of businesses, including a sawmill, a creamery, a flour mill, and a furniture factory.
Geography
Chetek is located in the northwestern part of Wisconsin, in Barron County. It is situated on the banks of the Chetek River, which is a tributary of the Red Cedar River. The city is part of the Chippewa Valley region and is surrounded by rolling hills and forests. The city is located approximately 50 miles east of the Minnesota border and is about 90 miles northeast of the state capital, Madison.
Economy
Chetek’s economy is largely based on agriculture and tourism. The city is home to a number of farms, which produce a variety of crops, including corn, soybeans, and hay. The city is also home to a number of tourist attractions, including the Chetek Historical Museum, the Chetek Riverwalk, and the Chetek Dam.
Demographics
As of the 2010 census, the population of Chetek was 2,000. The racial makeup of the city was 95.2% White, 0.7% African American, 0.3% Native American, 0.7% Asian, 0.1% Pacific Islander, 1.2% from other races, and 1.7% from two or more races. The median household income was $37,917 and the median family income was $45,938. The per capita income was $19,945.
Chetek is a small city with a rich history and a vibrant economy. It is home to a diverse population and is surrounded by beautiful natural scenery. The city is a great place to live, work, and visit.
Common Questions
What is Per Capita Income in Chetek?
Per Capita income in Chetek is $26,736.
What is the Median Family Income in Chetek?
Median Family Income in Chetek is $60,500.
What is the Median Household income in Chetek?
Median Household Income in Chetek is $51,250.
What is Income or Wage Gap in Chetek?
Income or Wage Gap in Chetek is 15.7%.
Women in Chetek earn 84.3 cents for every dollar earned by a man.
What is Inequality or Gini Index in Chetek?
Inequality or Gini Index in Chetek is 0.37.
What is the Total Population of Chetek?
Total Population of Chetek is 2,264.
What is the Total Male Population of Chetek?
Total Male Population of Chetek is 1,161.
What is the Total Female Population of Chetek?
Total Female Population of Chetek is 1,103.
What is the Ratio of Males per 100 Females in Chetek?
There are 105.26 Males per 100 Females in Chetek.
What is the Ratio of Females per 100 Males in Chetek?
There are 95.00 Females per 100 Males in Chetek.
What is the Median Population Age in Chetek?
Median Population Age in Chetek is 46.4 Years.
What is the Average Family Size in Chetek
Average Family Size in Chetek is 3.0 People.
What is the Average Household Size in Chetek
Average Household Size in Chetek is 2.4 People.
How Large is the Labor Force in Chetek?
There are 1,148 People in the Labor Forcein in Chetek.
What is the Percentage of People in the Labor Force in Chetek?
59.1% of People are in the Labor Force in Chetek.
What is the Unemployment Rate in Chetek?
Unemployment Rate in Chetek is 3.5%.