Centuria, WI Map & Demographics
Centuria Map
Centuria Overview
$31,813
PER CAPITA INCOME
$35,489
AVG HOUSEHOLD INCOME
51.4%
WAGE / INCOME GAP [ % ]
48.6¢/ $1
WAGE / INCOME GAP [ $ ]
0.52
INEQUALITY / GINI INDEX
933
TOTAL POPULATION
579
MALE POPULATION
354
FEMALE POPULATION
163.56
MALES / 100 FEMALES
61.14
FEMALES / 100 MALES
44.9
MEDIAN AGE
2.9
AVG FAMILY SIZE
2.1
AVG HOUSEHOLD SIZE
562
LABOR FORCE [ PEOPLE ]
72.1%
PERCENT IN LABOR FORCE
11.2%
UNEMPLOYMENT RATE
Centuria Zip Codes
Centuria Area Codes
Income in Centuria
Income Overview in Centuria
| Characteristic | Number | Measure |
| Per Capita Income | 933 | $31,813 |
| Median Family Income | 246 | $0 |
| Mean Family Income | 246 | $57,498 |
| Median Household Income | 433 | $35,489 |
| Mean Household Income | 433 | $65,837 |
| Income Deficit | 246 | $0 |
| Wage / Income Gap (%) | 933 | 51.39% |
| Wage / Income Gap ($) | 933 | 48.61¢ per $1 |
| Gini / Inequality Index | 933 | 0.52 |
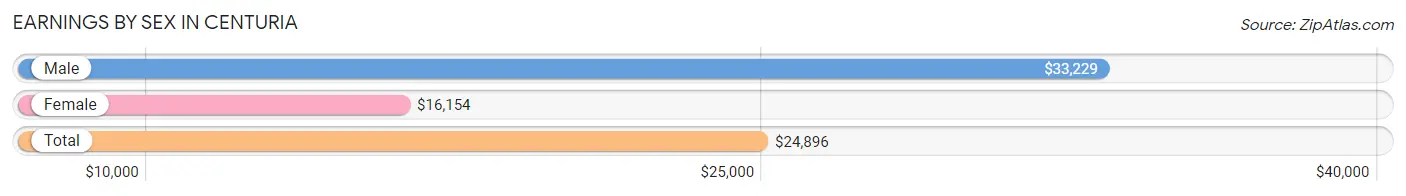
Earnings by Sex in Centuria
Average Earnings in Centuria are $24,896, $33,229 for men and $16,154 for women, a difference of 51.4%.
| Sex | Number | Average Earnings |
| Male | 327 (58.9%) | $33,229 |
| Female | 228 (41.1%) | $16,154 |
| Total | 555 (100.0%) | $24,896 |
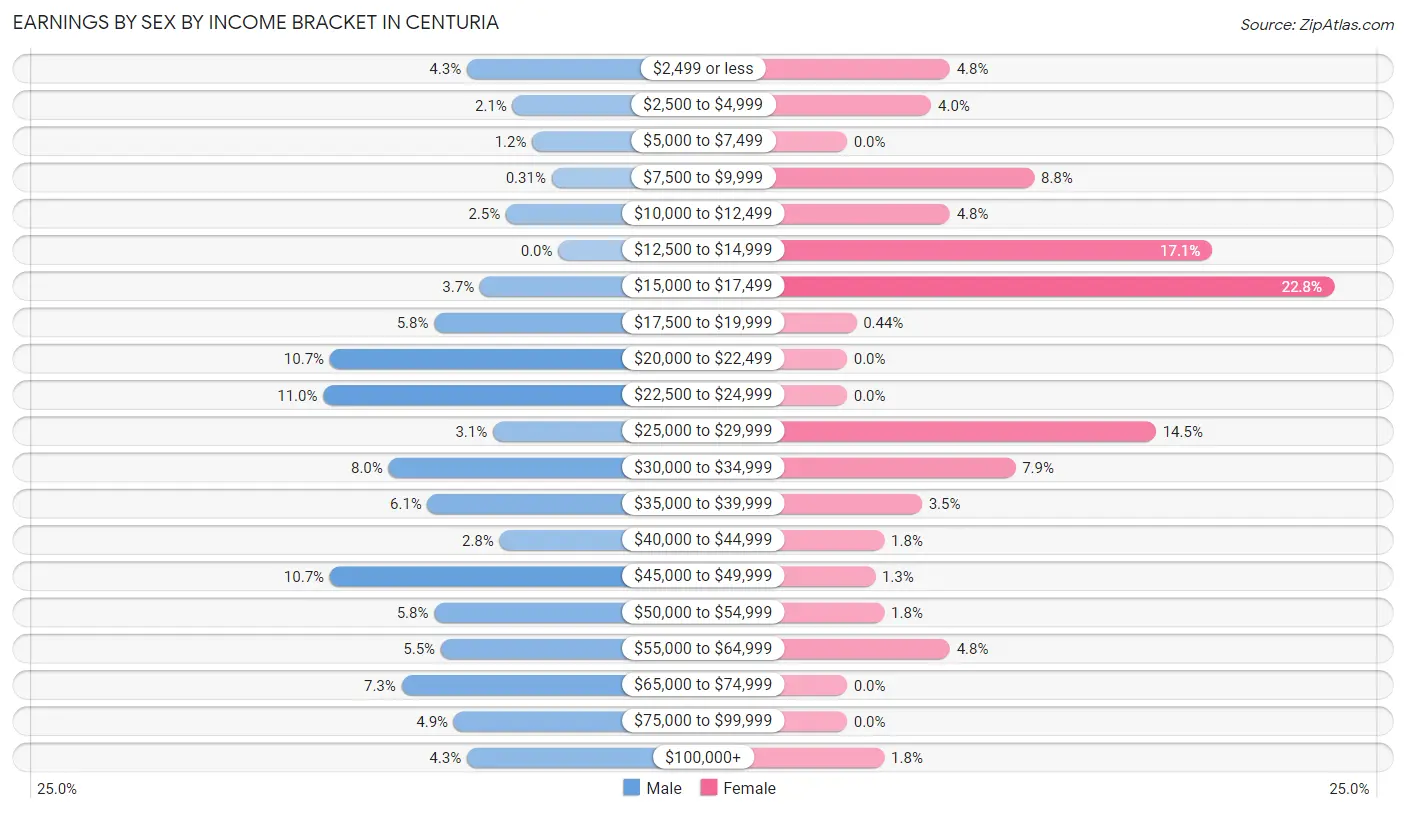
Earnings by Sex by Income Bracket in Centuria
The most common earnings brackets in Centuria are $22,500 to $24,999 for men (36 | 11.0%) and $15,000 to $17,499 for women (52 | 22.8%).
| Income | Male | Female |
| $2,499 or less | 14 (4.3%) | 11 (4.8%) |
| $2,500 to $4,999 | 7 (2.1%) | 9 (4.0%) |
| $5,000 to $7,499 | 4 (1.2%) | 0 (0.0%) |
| $7,500 to $9,999 | 1 (0.3%) | 20 (8.8%) |
| $10,000 to $12,499 | 8 (2.5%) | 11 (4.8%) |
| $12,500 to $14,999 | 0 (0.0%) | 39 (17.1%) |
| $15,000 to $17,499 | 12 (3.7%) | 52 (22.8%) |
| $17,500 to $19,999 | 19 (5.8%) | 1 (0.4%) |
| $20,000 to $22,499 | 35 (10.7%) | 0 (0.0%) |
| $22,500 to $24,999 | 36 (11.0%) | 0 (0.0%) |
| $25,000 to $29,999 | 10 (3.1%) | 33 (14.5%) |
| $30,000 to $34,999 | 26 (8.0%) | 18 (7.9%) |
| $35,000 to $39,999 | 20 (6.1%) | 8 (3.5%) |
| $40,000 to $44,999 | 9 (2.8%) | 4 (1.8%) |
| $45,000 to $49,999 | 35 (10.7%) | 3 (1.3%) |
| $50,000 to $54,999 | 19 (5.8%) | 4 (1.8%) |
| $55,000 to $64,999 | 18 (5.5%) | 11 (4.8%) |
| $65,000 to $74,999 | 24 (7.3%) | 0 (0.0%) |
| $75,000 to $99,999 | 16 (4.9%) | 0 (0.0%) |
| $100,000+ | 14 (4.3%) | 4 (1.8%) |
| Total | 327 (100.0%) | 228 (100.0%) |
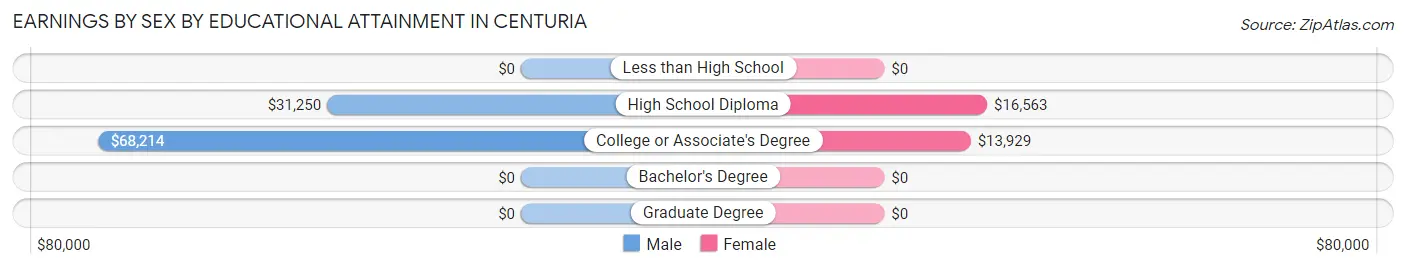
Earnings by Sex by Educational Attainment in Centuria
Average earnings in Centuria are $36,016 for men and $15,649 for women, a difference of 56.6%. Men with an educational attainment of college or associate's degree enjoy the highest average annual earnings of $68,214, while those with high school diploma education earn the least with $31,250. Women with an educational attainment of high school diploma earn the most with the average annual earnings of $16,563, while those with college or associate's degree education have the smallest earnings of $13,929.
| Educational Attainment | Male Income | Female Income |
| Less than High School | - | - |
| High School Diploma | $31,250 | $16,563 |
| College or Associate's Degree | $68,214 | $13,929 |
| Bachelor's Degree | - | - |
| Graduate Degree | - | - |
| Total | $36,016 | $15,649 |
Family Income in Centuria
Family Income Brackets in Centuria
According to the Centuria family income data, there are 53 families falling into the $75,000 to $99,999 income range, which is the most common income bracket and makes up 21.5% of all families. Conversely, the $200,000+ income bracket is the least frequent group with only 4 families (1.6%) belonging to this category.
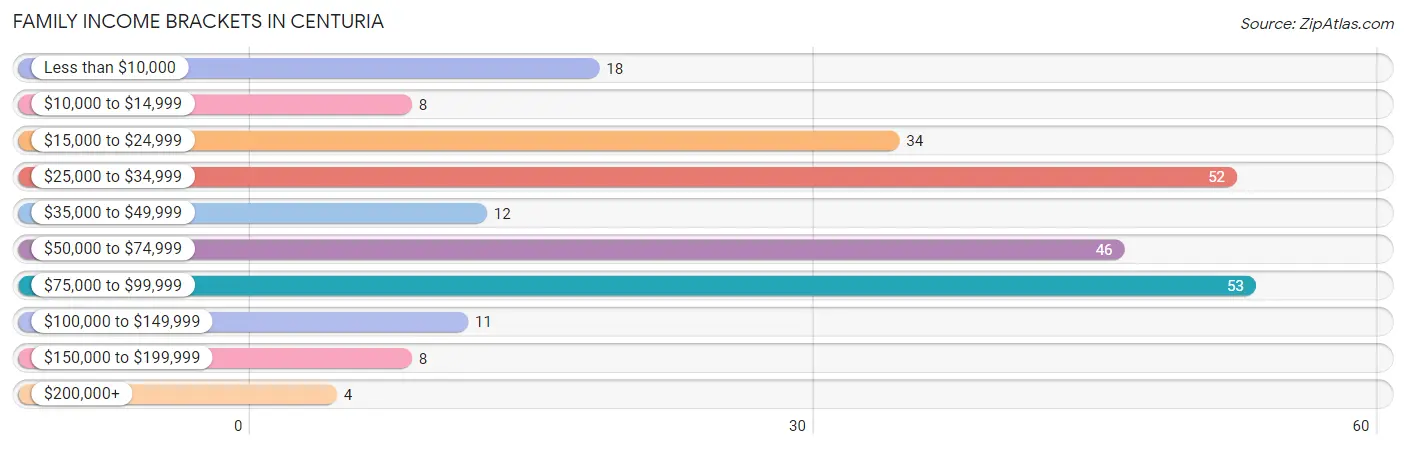
| Income Bracket | # Families | % Families |
| Less than $10,000 | 18 | 7.3% |
| $10,000 to $14,999 | 8 | 3.3% |
| $15,000 to $24,999 | 34 | 13.8% |
| $25,000 to $34,999 | 52 | 21.1% |
| $35,000 to $49,999 | 12 | 4.9% |
| $50,000 to $74,999 | 46 | 18.7% |
| $75,000 to $99,999 | 53 | 21.5% |
| $100,000 to $149,999 | 11 | 4.5% |
| $150,000 to $199,999 | 8 | 3.3% |
| $200,000+ | 4 | 1.6% |
Family Income by Famaliy Size in Centuria
4-person families (25 | 10.2%) account for the highest median family income in Centuria with $92,917 per family, while 4-person families (25 | 10.2%) have the highest median income of $23,229 per family member.
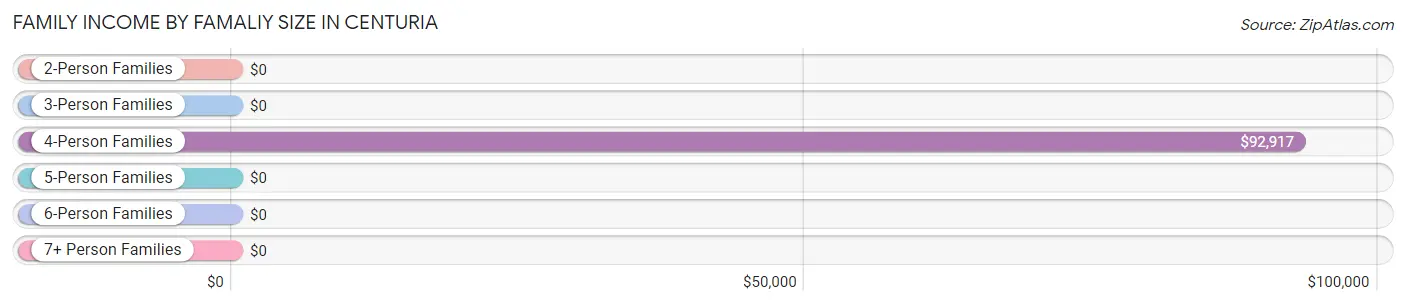
| Income Bracket | # Families | Median Income |
| 2-Person Families | 147 (59.8%) | $0 |
| 3-Person Families | 67 (27.2%) | $0 |
| 4-Person Families | 25 (10.2%) | $92,917 |
| 5-Person Families | 7 (2.9%) | $0 |
| 6-Person Families | 0 (0.0%) | $0 |
| 7+ Person Families | 0 (0.0%) | $0 |
| Total | 246 (100.0%) | $0 |
Family Income by Number of Earners in Centuria
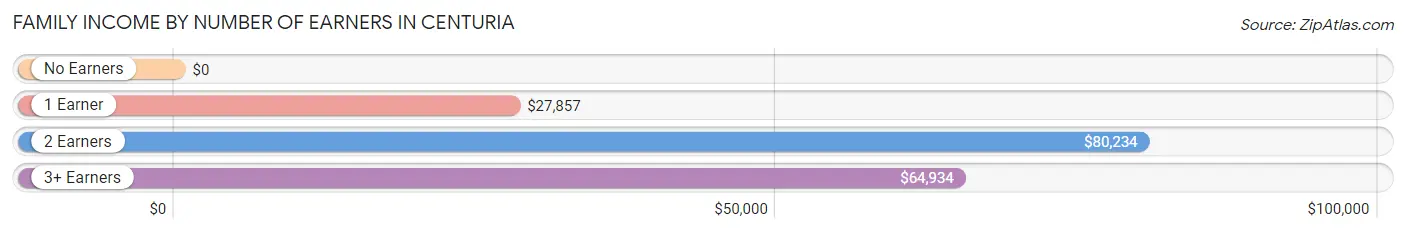
| Number of Earners | # Families | Median Income |
| No Earners | 34 (13.8%) | $0 |
| 1 Earner | 94 (38.2%) | $27,857 |
| 2 Earners | 81 (32.9%) | $80,234 |
| 3+ Earners | 37 (15.0%) | $64,934 |
| Total | 246 (100.0%) | $0 |
Household Income in Centuria
Household Income Brackets in Centuria
With 100 households falling in the category, the $25,000 to $34,999 income range is the most frequent in Centuria, accounting for 23.1% of all households. In contrast, only 8 households (1.8%) fall into the $150,000 to $199,999 income bracket, making it the least populous group.
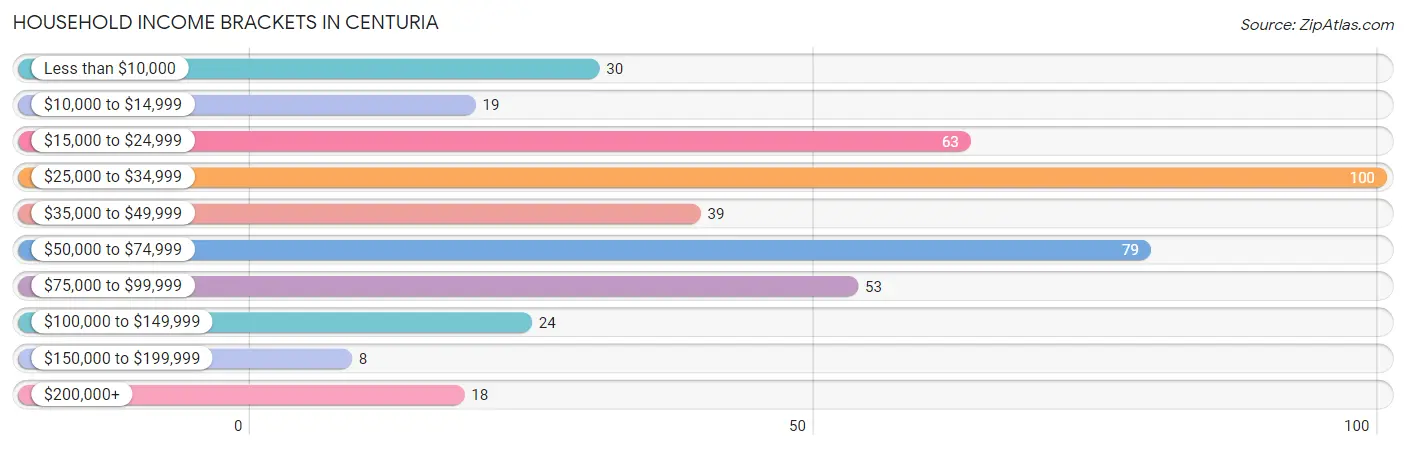
| Income Bracket | # Households | % Households |
| Less than $10,000 | 30 | 6.9% |
| $10,000 to $14,999 | 19 | 4.4% |
| $15,000 to $24,999 | 63 | 14.5% |
| $25,000 to $34,999 | 100 | 23.1% |
| $35,000 to $49,999 | 39 | 9.0% |
| $50,000 to $74,999 | 79 | 18.2% |
| $75,000 to $99,999 | 53 | 12.2% |
| $100,000 to $149,999 | 24 | 5.5% |
| $150,000 to $199,999 | 8 | 1.8% |
| $200,000+ | 18 | 4.2% |
Household Income by Householder Age in Centuria
The median household income in Centuria is $35,489, with the highest median household income of $55,938 found in the 65+ years age bracket for the primary householder. A total of 94 households (21.7%) fall into this category. Meanwhile, the 15 to 24 years age bracket for the primary householder has the lowest median household income of $0, with 30 households (6.9%) in this group.
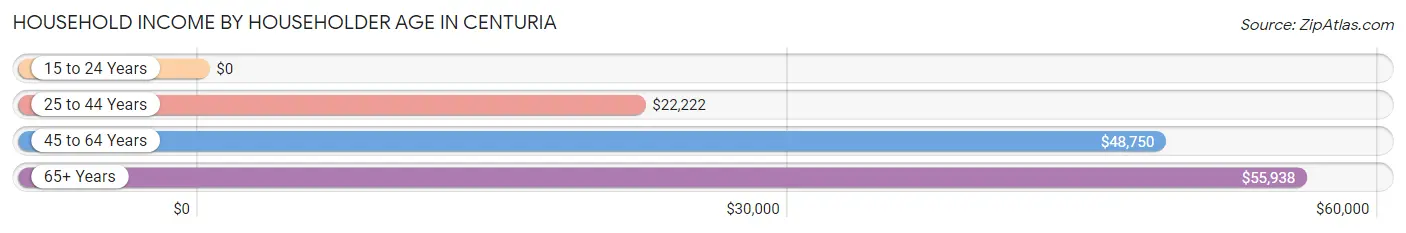
| Income Bracket | # Households | Median Income |
| 15 to 24 Years | 30 (6.9%) | $0 |
| 25 to 44 Years | 96 (22.2%) | $22,222 |
| 45 to 64 Years | 213 (49.2%) | $48,750 |
| 65+ Years | 94 (21.7%) | $55,938 |
| Total | 433 (100.0%) | $35,489 |
Poverty in Centuria
Income Below Poverty by Sex and Age in Centuria
With 26.4% poverty level for males and 16.7% for females among the residents of Centuria, 16 and 17 year old males and 5 year old females are the most vulnerable to poverty, with 42 males (100.0%) and 4 females (100.0%) in their respective age groups living below the poverty level.
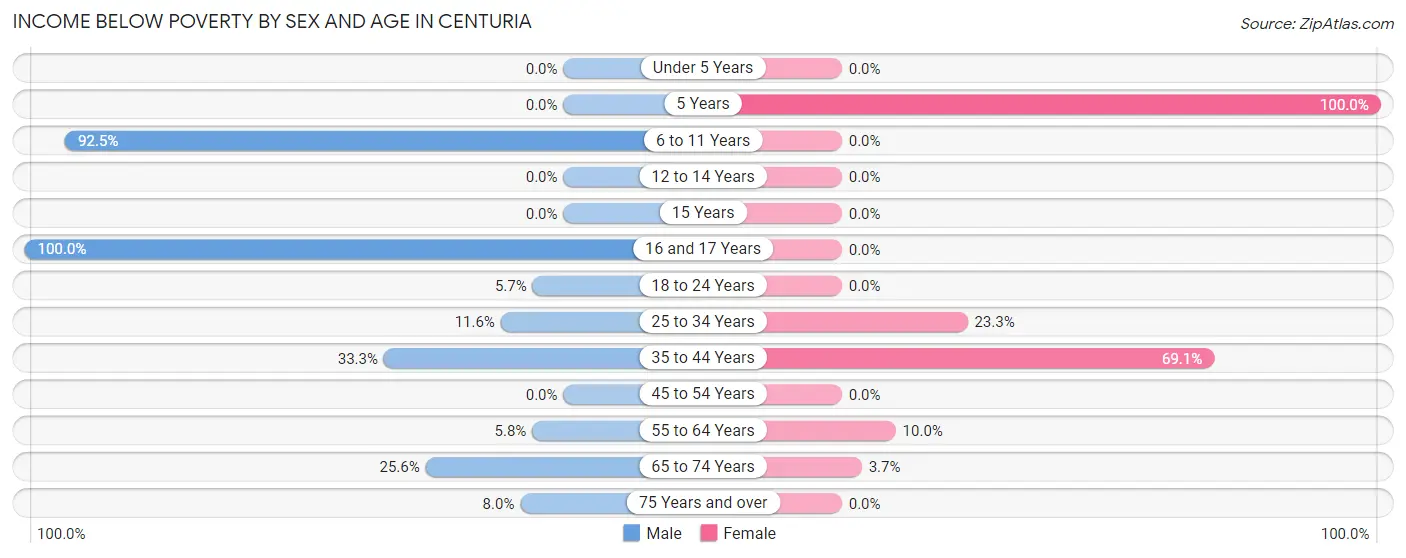
| Age Bracket | Male | Female |
| Under 5 Years | 0 (0.0%) | 0 (0.0%) |
| 5 Years | 0 (0.0%) | 4 (100.0%) |
| 6 to 11 Years | 74 (92.5%) | 0 (0.0%) |
| 12 to 14 Years | 0 (0.0%) | 0 (0.0%) |
| 15 Years | 0 (0.0%) | 0 (0.0%) |
| 16 and 17 Years | 42 (100.0%) | 0 (0.0%) |
| 18 to 24 Years | 4 (5.7%) | 0 (0.0%) |
| 25 to 34 Years | 5 (11.6%) | 7 (23.3%) |
| 35 to 44 Years | 8 (33.3%) | 38 (69.1%) |
| 45 to 54 Years | 0 (0.0%) | 0 (0.0%) |
| 55 to 64 Years | 7 (5.8%) | 8 (10.0%) |
| 65 to 74 Years | 11 (25.6%) | 2 (3.7%) |
| 75 Years and over | 2 (8.0%) | 0 (0.0%) |
| Total | 153 (26.4%) | 59 (16.7%) |
Income Above Poverty by Sex and Age in Centuria
According to the poverty statistics in Centuria, males aged under 5 years and females aged under 5 years are the age groups that are most secure financially, with 100.0% of males and 100.0% of females in these age groups living above the poverty line.
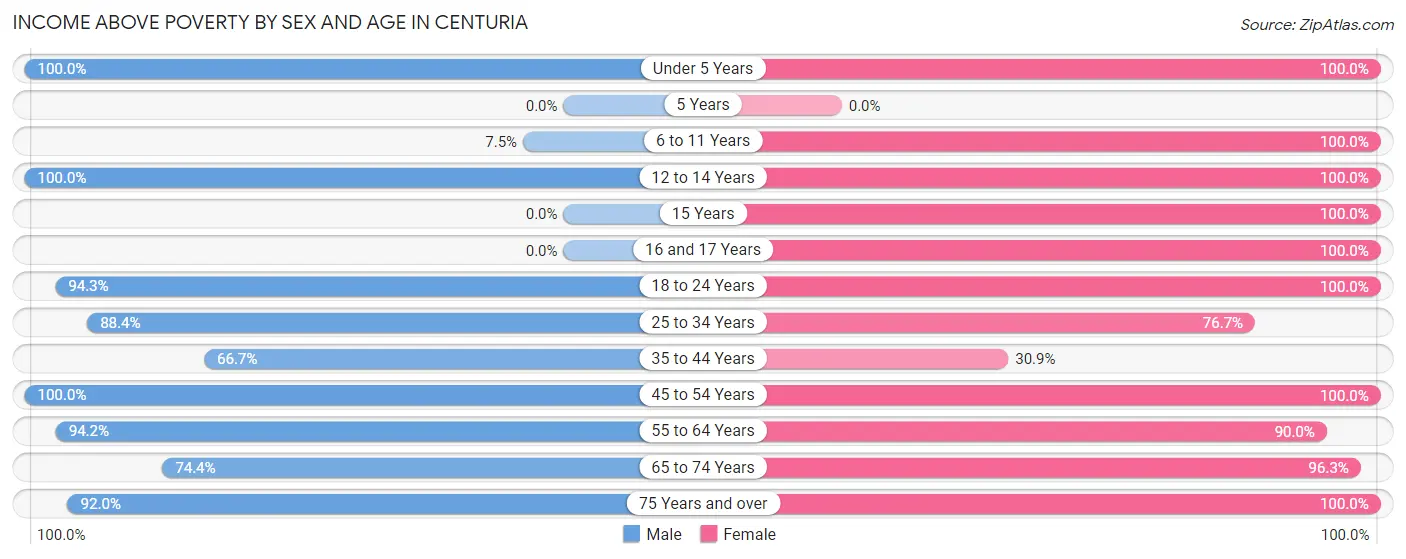
| Age Bracket | Male | Female |
| Under 5 Years | 47 (100.0%) | 4 (100.0%) |
| 5 Years | 0 (0.0%) | 0 (0.0%) |
| 6 to 11 Years | 6 (7.5%) | 3 (100.0%) |
| 12 to 14 Years | 3 (100.0%) | 9 (100.0%) |
| 15 Years | 0 (0.0%) | 3 (100.0%) |
| 16 and 17 Years | 0 (0.0%) | 3 (100.0%) |
| 18 to 24 Years | 66 (94.3%) | 47 (100.0%) |
| 25 to 34 Years | 38 (88.4%) | 23 (76.7%) |
| 35 to 44 Years | 16 (66.7%) | 17 (30.9%) |
| 45 to 54 Years | 81 (100.0%) | 42 (100.0%) |
| 55 to 64 Years | 114 (94.2%) | 72 (90.0%) |
| 65 to 74 Years | 32 (74.4%) | 52 (96.3%) |
| 75 Years and over | 23 (92.0%) | 20 (100.0%) |
| Total | 426 (73.6%) | 295 (83.3%) |
Income Below Poverty Among Married-Couple Families in Centuria
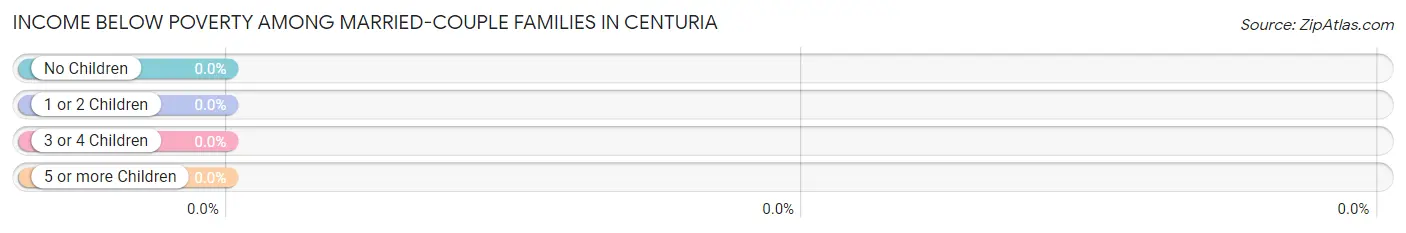
| Children | Above Poverty | Below Poverty |
| No Children | 114 (100.0%) | 0 (0.0%) |
| 1 or 2 Children | 9 (100.0%) | 0 (0.0%) |
| 3 or 4 Children | 0 (0.0%) | 0 (0.0%) |
| 5 or more Children | 0 (0.0%) | 0 (0.0%) |
| Total | 123 (100.0%) | 0 (0.0%) |
Income Below Poverty Among Single-Parent Households in Centuria
According to the poverty data in Centuria, 20.5% or 8 single-father households and 53.6% or 45 single-mother households are living below the poverty line. Among single-father households, those with 1 or 2 children have the highest poverty rate, with 8 households (57.1%) experiencing poverty. Likewise, among single-mother households, those with 3 or 4 children have the highest poverty rate, with 7 households (100.0%) falling below the poverty line.
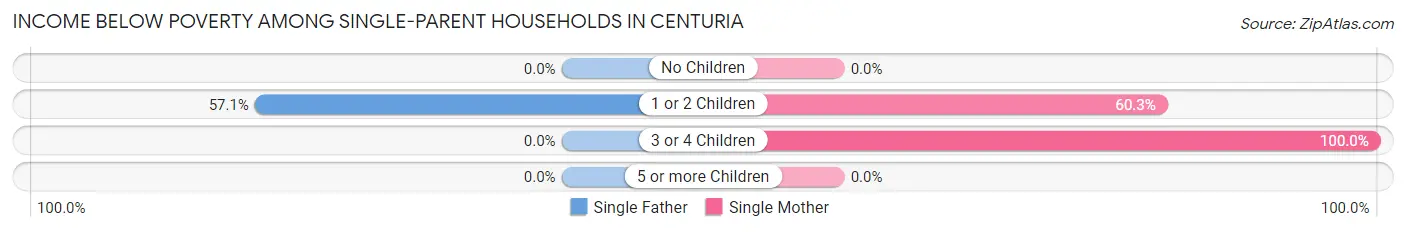
| Children | Single Father | Single Mother |
| No Children | 0 (0.0%) | 0 (0.0%) |
| 1 or 2 Children | 8 (57.1%) | 38 (60.3%) |
| 3 or 4 Children | 0 (0.0%) | 7 (100.0%) |
| 5 or more Children | 0 (0.0%) | 0 (0.0%) |
| Total | 8 (20.5%) | 45 (53.6%) |
Income Below Poverty Among Married-Couple vs Single-Parent Households in Centuria
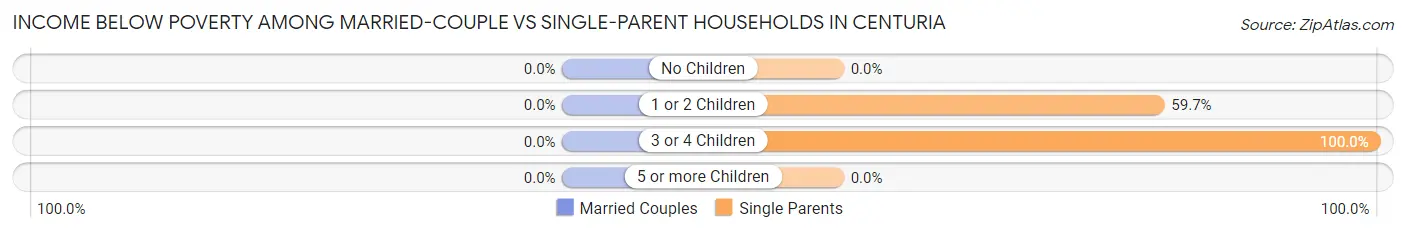
| Children | Married-Couple Families | Single-Parent Households |
| No Children | 0 (0.0%) | 0 (0.0%) |
| 1 or 2 Children | 0 (0.0%) | 46 (59.7%) |
| 3 or 4 Children | 0 (0.0%) | 7 (100.0%) |
| 5 or more Children | 0 (0.0%) | 0 (0.0%) |
| Total | 0 (0.0%) | 53 (43.1%) |
Race in Centuria
The most populous races in Centuria are White / Caucasian (897 | 96.1%), Two or more Races (26 | 2.8%), and Black / African American (10 | 1.1%).
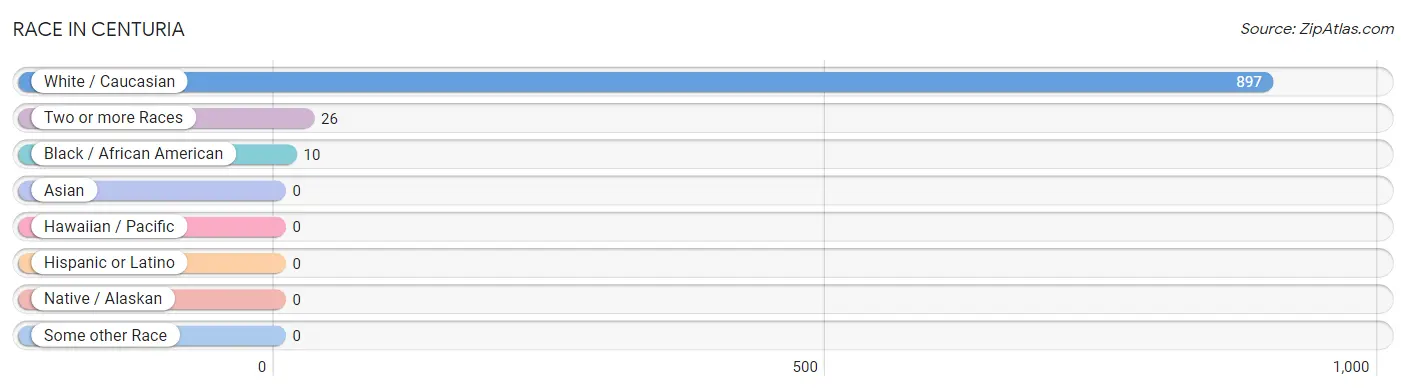
| Race | # Population | % Population |
| Asian | 0 | 0.0% |
| Black / African American | 10 | 1.1% |
| Hawaiian / Pacific | 0 | 0.0% |
| Hispanic or Latino | 0 | 0.0% |
| Native / Alaskan | 0 | 0.0% |
| White / Caucasian | 897 | 96.1% |
| Two or more Races | 26 | 2.8% |
| Some other Race | 0 | 0.0% |
| Total | 933 | 100.0% |
Ancestry in Centuria
The most populous ancestries reported in Centuria are German (359 | 38.5%), English (184 | 19.7%), Swedish (145 | 15.5%), Norwegian (122 | 13.1%), and American (86 | 9.2%), together accounting for 96.0% of all Centuria residents.
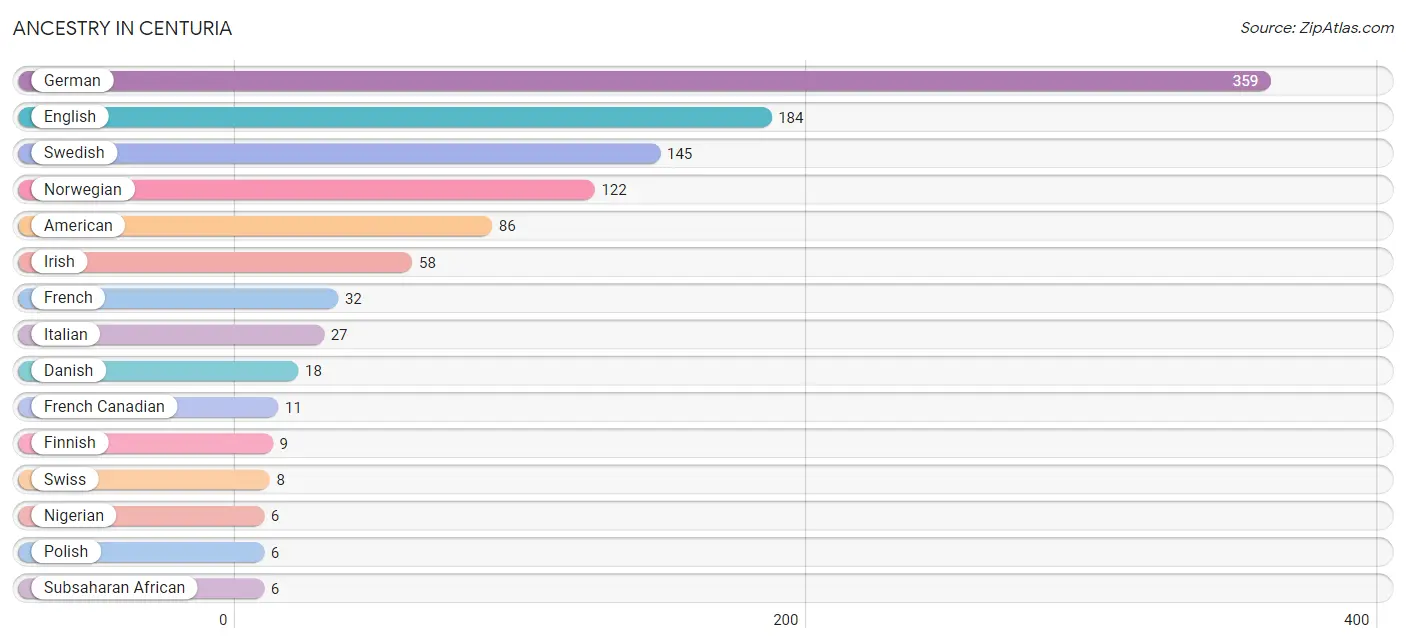
| Ancestry | # Population | % Population |
| American | 86 | 9.2% |
| Canadian | 4 | 0.4% |
| Danish | 18 | 1.9% |
| Eastern European | 1 | 0.1% |
| English | 184 | 19.7% |
| Finnish | 9 | 1.0% |
| French | 32 | 3.4% |
| French Canadian | 11 | 1.2% |
| German | 359 | 38.5% |
| Greek | 4 | 0.4% |
| Irish | 58 | 6.2% |
| Italian | 27 | 2.9% |
| Nigerian | 6 | 0.6% |
| Norwegian | 122 | 13.1% |
| Polish | 6 | 0.6% |
| Scandinavian | 2 | 0.2% |
| Scotch-Irish | 4 | 0.4% |
| Scottish | 5 | 0.5% |
| Subsaharan African | 6 | 0.6% |
| Swedish | 145 | 15.5% |
| Swiss | 8 | 0.9% |
| Welsh | 2 | 0.2% |
| Yugoslavian | 4 | 0.4% | View All 23 Rows |
Immigrants in Centuria
The most numerous immigrant groups reported in Centuria came from Canada (6 | 0.6%), Asia (4 | 0.4%), Philippines (4 | 0.4%), and South Eastern Asia (4 | 0.4%), together accounting for 1.9% of all Centuria residents.
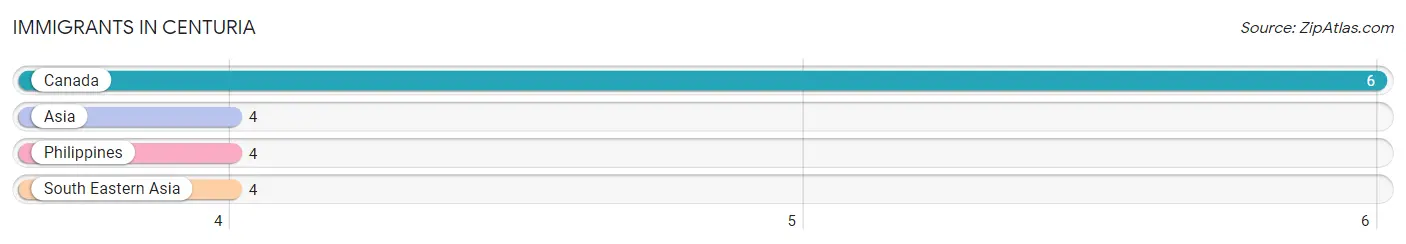
| Immigration Origin | # Population | % Population |
| Asia | 4 | 0.4% |
| Canada | 6 | 0.6% |
| Philippines | 4 | 0.4% |
| South Eastern Asia | 4 | 0.4% | View All 4 Rows |
Sex and Age in Centuria
Sex and Age in Centuria
The most populous age groups in Centuria are 5 to 9 Years (64 | 11.1%) for men and 55 to 59 Years (51 | 14.4%) for women.
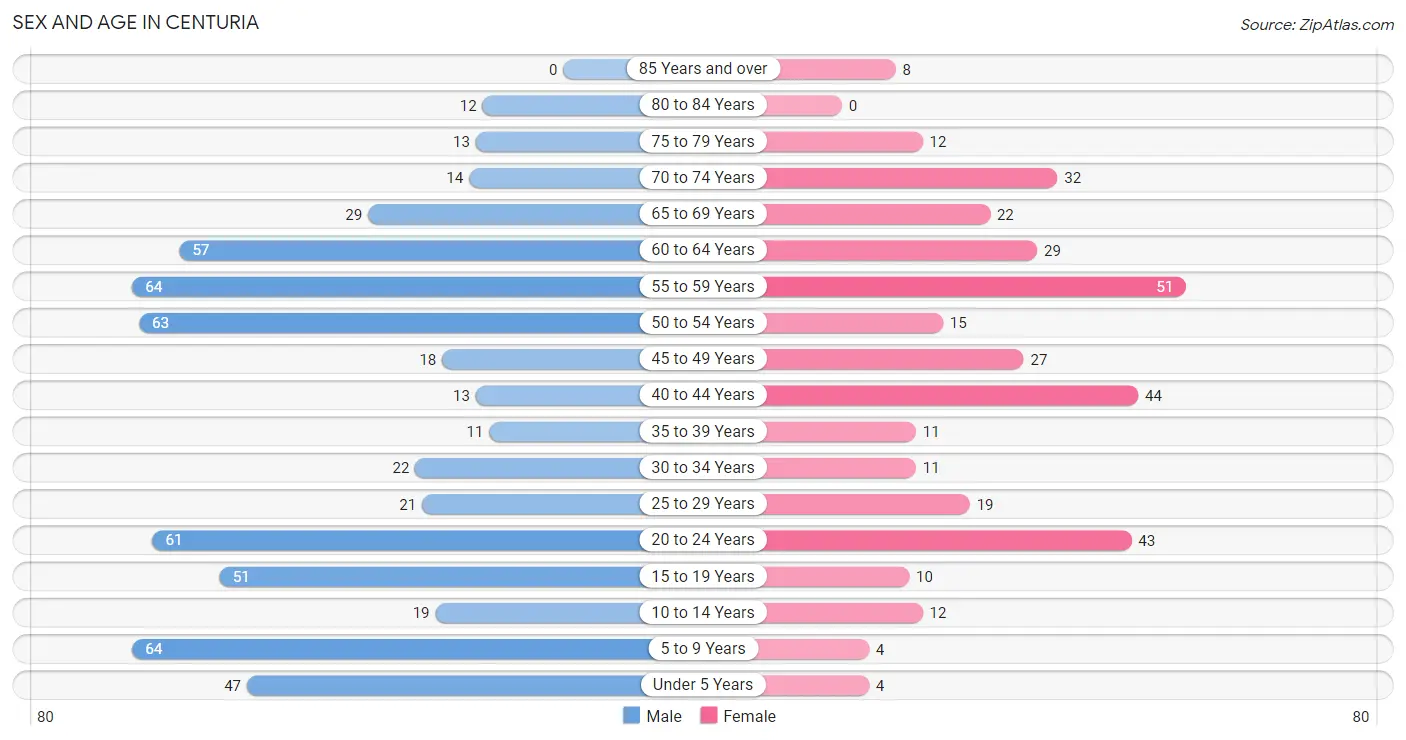
| Age Bracket | Male | Female |
| Under 5 Years | 47 (8.1%) | 4 (1.1%) |
| 5 to 9 Years | 64 (11.1%) | 4 (1.1%) |
| 10 to 14 Years | 19 (3.3%) | 12 (3.4%) |
| 15 to 19 Years | 51 (8.8%) | 10 (2.8%) |
| 20 to 24 Years | 61 (10.5%) | 43 (12.1%) |
| 25 to 29 Years | 21 (3.6%) | 19 (5.4%) |
| 30 to 34 Years | 22 (3.8%) | 11 (3.1%) |
| 35 to 39 Years | 11 (1.9%) | 11 (3.1%) |
| 40 to 44 Years | 13 (2.2%) | 44 (12.4%) |
| 45 to 49 Years | 18 (3.1%) | 27 (7.6%) |
| 50 to 54 Years | 63 (10.9%) | 15 (4.2%) |
| 55 to 59 Years | 64 (11.1%) | 51 (14.4%) |
| 60 to 64 Years | 57 (9.8%) | 29 (8.2%) |
| 65 to 69 Years | 29 (5.0%) | 22 (6.2%) |
| 70 to 74 Years | 14 (2.4%) | 32 (9.0%) |
| 75 to 79 Years | 13 (2.2%) | 12 (3.4%) |
| 80 to 84 Years | 12 (2.1%) | 0 (0.0%) |
| 85 Years and over | 0 (0.0%) | 8 (2.3%) |
| Total | 579 (100.0%) | 354 (100.0%) |
Families and Households in Centuria
Median Family Size in Centuria
The median family size in Centuria is 2.89 persons per family, with single female/mother families (84 | 34.2%) accounting for the largest median family size of 3.42 persons per family. On the other hand, single male/father families (39 | 15.9%) represent the smallest median family size with 2.18 persons per family.
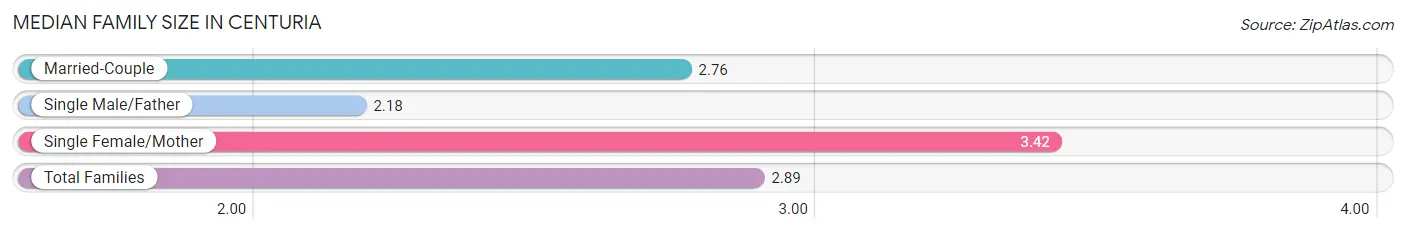
| Family Type | # Families | Family Size |
| Married-Couple | 123 (50.0%) | 2.76 |
| Single Male/Father | 39 (15.9%) | 2.18 |
| Single Female/Mother | 84 (34.2%) | 3.42 |
| Total Families | 246 (100.0%) | 2.89 |
Median Household Size in Centuria
The median household size in Centuria is 2.15 persons per household, with single female/mother households (84 | 19.4%) accounting for the largest median household size of 3.54 persons per household. non-family households (187 | 43.2%) represent the smallest median household size with 1.08 persons per household.
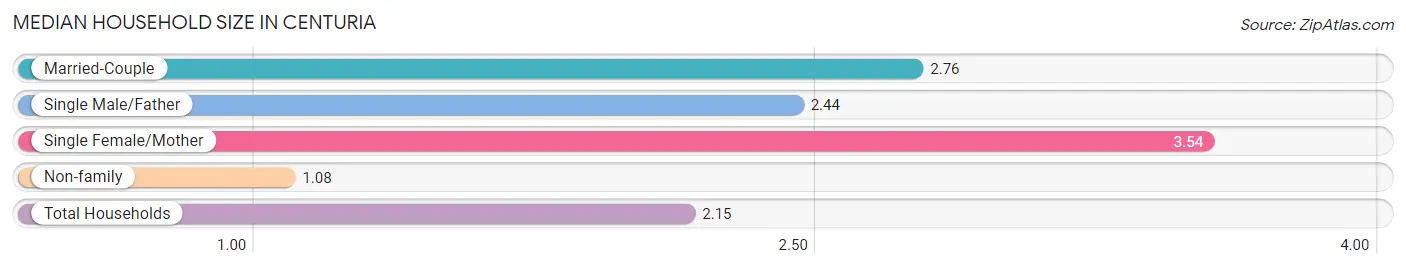
| Household Type | # Households | Household Size |
| Married-Couple | 123 (28.4%) | 2.76 |
| Single Male/Father | 39 (9.0%) | 2.44 |
| Single Female/Mother | 84 (19.4%) | 3.54 |
| Non-family | 187 (43.2%) | 1.08 |
| Total Households | 433 (100.0%) | 2.15 |
Household Size by Marriage Status in Centuria
Out of a total of 433 households in Centuria, 246 (56.8%) are family households, while 187 (43.2%) are nonfamily households. The most numerous type of family households are 2-person households, comprising 136, and the most common type of nonfamily households are 1-person households, comprising 176.
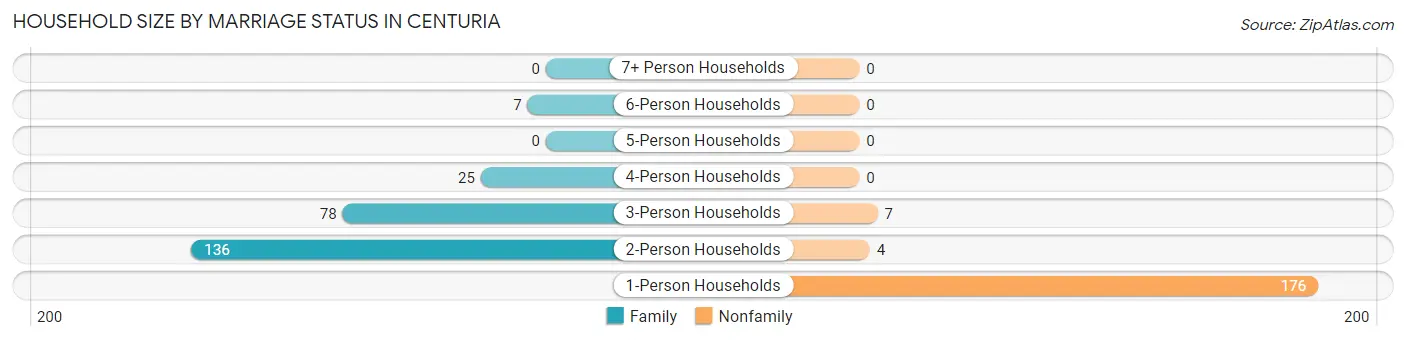
| Household Size | Family Households | Nonfamily Households |
| 1-Person Households | - | 176 (40.6%) |
| 2-Person Households | 136 (31.4%) | 4 (0.9%) |
| 3-Person Households | 78 (18.0%) | 7 (1.6%) |
| 4-Person Households | 25 (5.8%) | 0 (0.0%) |
| 5-Person Households | 0 (0.0%) | 0 (0.0%) |
| 6-Person Households | 7 (1.6%) | 0 (0.0%) |
| 7+ Person Households | 0 (0.0%) | 0 (0.0%) |
| Total | 246 (56.8%) | 187 (43.2%) |
Female Fertility in Centuria
Fertility by Age in Centuria
Average fertility rate in Centuria is 34.0 births per 1,000 women. Women in the age bracket of 20 to 34 years have the highest fertility rate with 82.0 births per 1,000 women. Women in the age bracket of 20 to 34 years acount for 100.0% of all women with births.
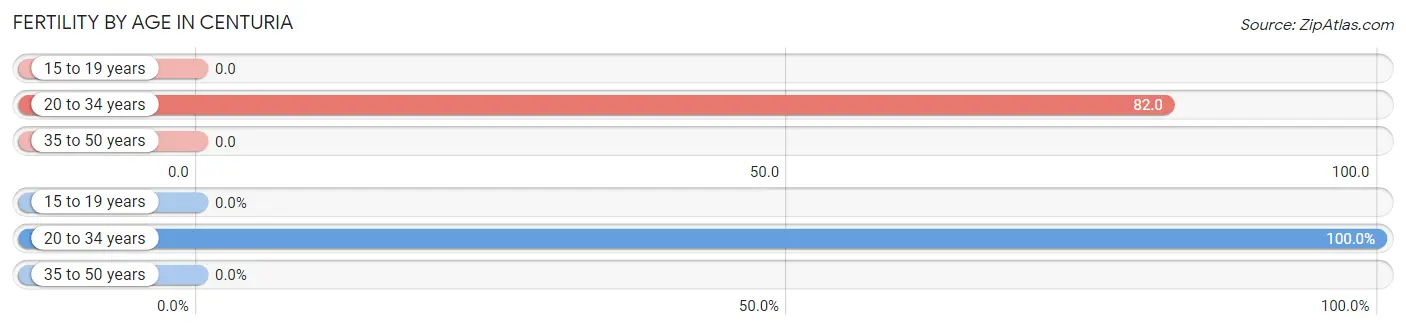
| Age Bracket | Women with Births | Births / 1,000 Women |
| 15 to 19 years | 0 (0.0%) | 0.0 |
| 20 to 34 years | 6 (100.0%) | 82.0 |
| 35 to 50 years | 0 (0.0%) | 0.0 |
| Total | 6 (100.0%) | 34.0 |
Fertility by Age by Marriage Status in Centuria
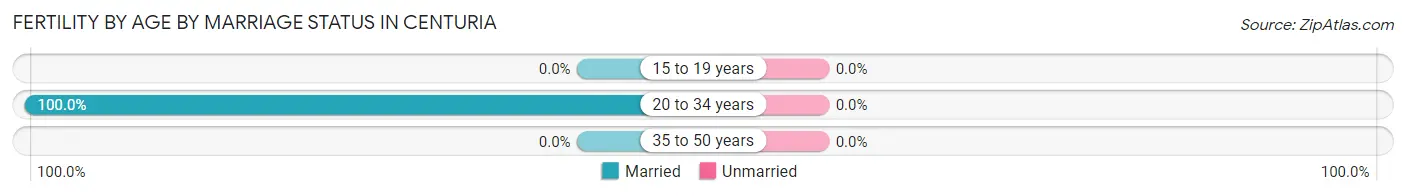
| Age Bracket | Married | Unmarried |
| 15 to 19 years | 0 (0.0%) | 0 (0.0%) |
| 20 to 34 years | 6 (100.0%) | 0 (0.0%) |
| 35 to 50 years | 0 (0.0%) | 0 (0.0%) |
| Total | 6 (100.0%) | 0 (0.0%) |
Fertility by Education in Centuria
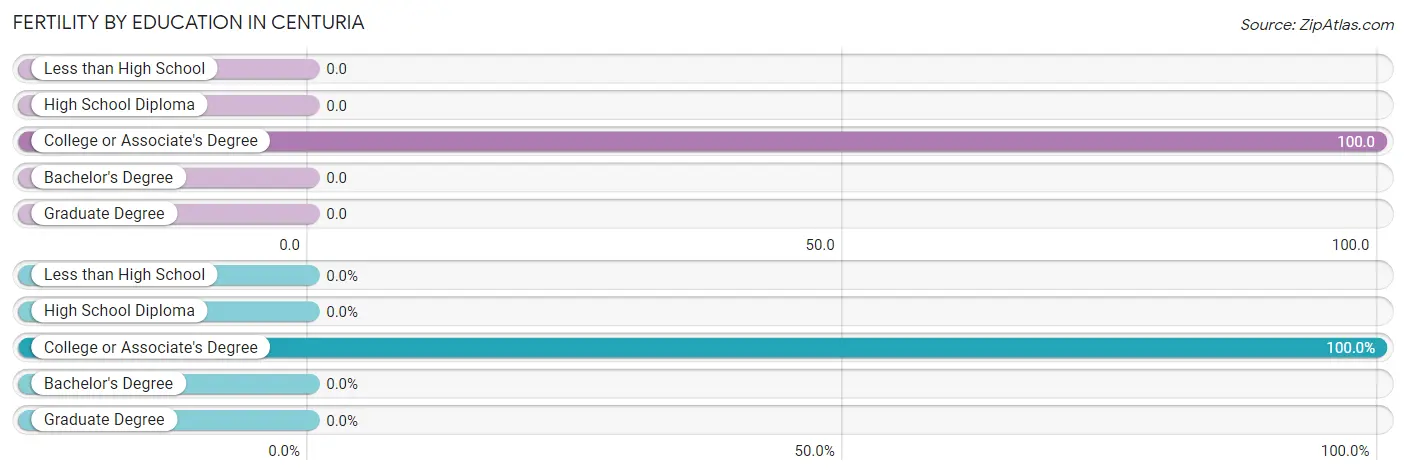
| Educational Attainment | Women with Births | Births / 1,000 Women |
| Less than High School | 0 (0.0%) | 0.0 |
| High School Diploma | 0 (0.0%) | 0.0 |
| College or Associate's Degree | 6 (100.0%) | 100.0 |
| Bachelor's Degree | 0 (0.0%) | 0.0 |
| Graduate Degree | 0 (0.0%) | 0.0 |
| Total | 6 (100.0%) | 34.0 |
Fertility by Education by Marriage Status in Centuria
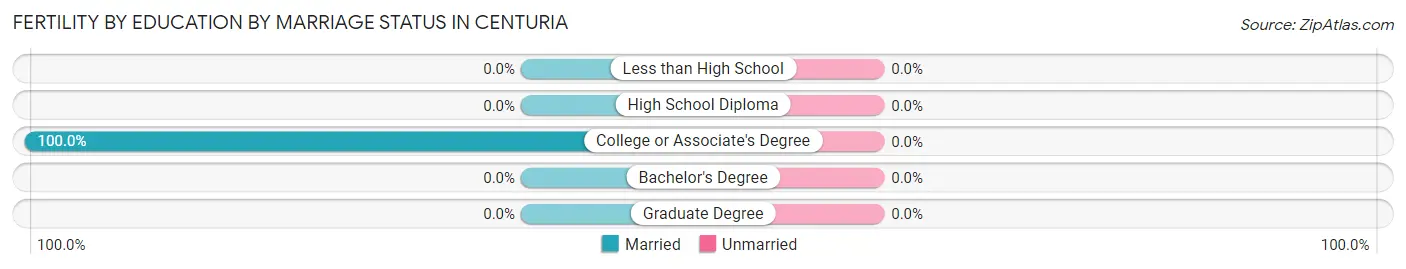
| Educational Attainment | Married | Unmarried |
| Less than High School | 0 (0.0%) | 0 (0.0%) |
| High School Diploma | 0 (0.0%) | 0 (0.0%) |
| College or Associate's Degree | 6 (100.0%) | 0 (0.0%) |
| Bachelor's Degree | 0 (0.0%) | 0 (0.0%) |
| Graduate Degree | 0 (0.0%) | 0 (0.0%) |
| Total | 6 (100.0%) | 0 (0.0%) |
Employment Characteristics in Centuria
Employment by Class of Employer in Centuria
Among the 480 employed individuals in Centuria, private company employees (353 | 73.5%), local government employees (61 | 12.7%), and self-employed (not incorporated) (26 | 5.4%) make up the most common classes of employment.
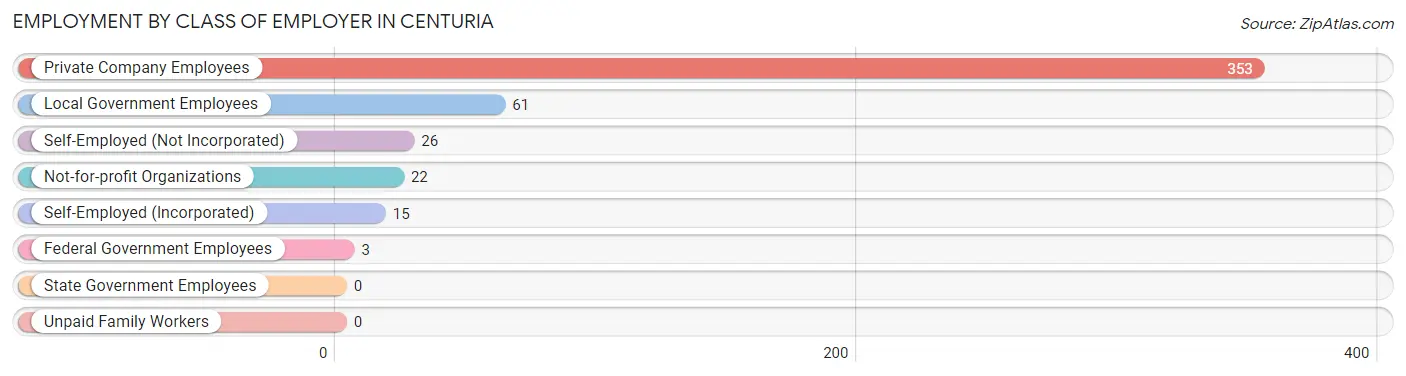
| Employer Class | # Employees | % Employees |
| Private Company Employees | 353 | 73.5% |
| Self-Employed (Incorporated) | 15 | 3.1% |
| Self-Employed (Not Incorporated) | 26 | 5.4% |
| Not-for-profit Organizations | 22 | 4.6% |
| Local Government Employees | 61 | 12.7% |
| State Government Employees | 0 | 0.0% |
| Federal Government Employees | 3 | 0.6% |
| Unpaid Family Workers | 0 | 0.0% |
| Total | 480 | 100.0% |
Employment Status by Age in Centuria
According to the labor force statistics for Centuria, out of the total population over 16 years of age (780), 72.1% or 562 individuals are in the labor force, with 11.2% or 63 of them unemployed. The age group with the highest labor force participation rate is 30 to 34 years, with 100.0% or 33 individuals in the labor force. Within the labor force, the 55 to 59 years age range has the highest percentage of unemployed individuals, with 19.6% or 18 of them being unemployed.
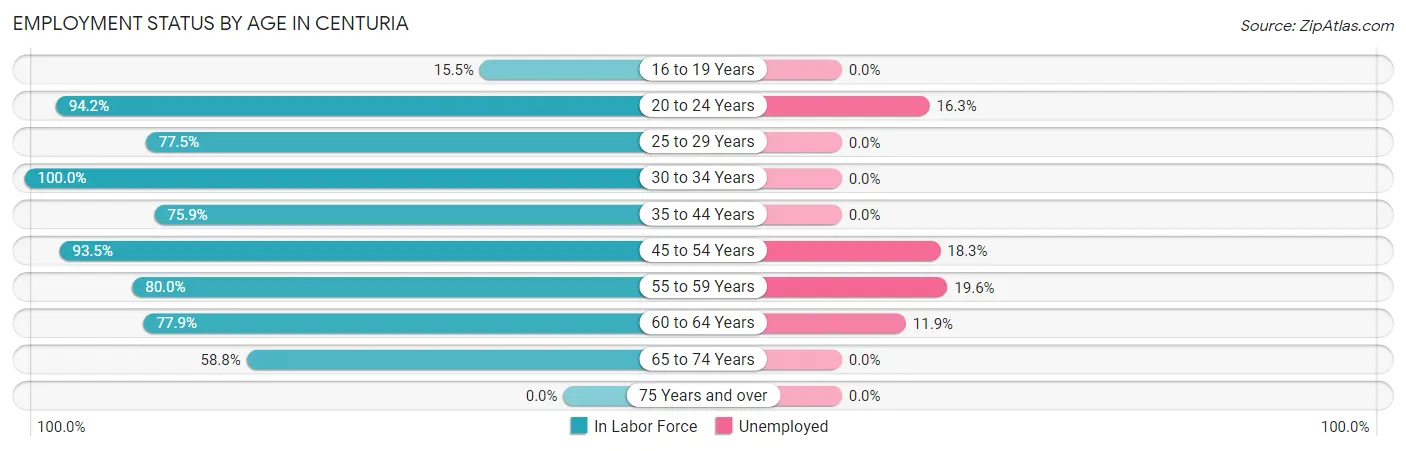
| Age Bracket | In Labor Force | Unemployed |
| 16 to 19 Years | 9 (15.5%) | 0 (0.0%) |
| 20 to 24 Years | 98 (94.2%) | 16 (16.3%) |
| 25 to 29 Years | 31 (77.5%) | 0 (0.0%) |
| 30 to 34 Years | 33 (100.0%) | 0 (0.0%) |
| 35 to 44 Years | 60 (75.9%) | 0 (0.0%) |
| 45 to 54 Years | 115 (93.5%) | 21 (18.3%) |
| 55 to 59 Years | 92 (80.0%) | 18 (19.6%) |
| 60 to 64 Years | 67 (77.9%) | 8 (11.9%) |
| 65 to 74 Years | 57 (58.8%) | 0 (0.0%) |
| 75 Years and over | 0 (0.0%) | 0 (0.0%) |
| Total | 562 (72.1%) | 63 (11.2%) |
Employment Status by Educational Attainment in Centuria
According to labor force statistics for Centuria, 83.6% of individuals (398) out of the total population between 25 and 64 years of age (476) are in the labor force, with 11.8% or 47 of them being unemployed. The group with the highest labor force participation rate are those with the educational attainment of bachelor's degree or higher, with 100.0% or 32 individuals in the labor force. Within the labor force, individuals with less than high school education have the highest percentage of unemployment, with 60.0% or 27 of them being unemployed.
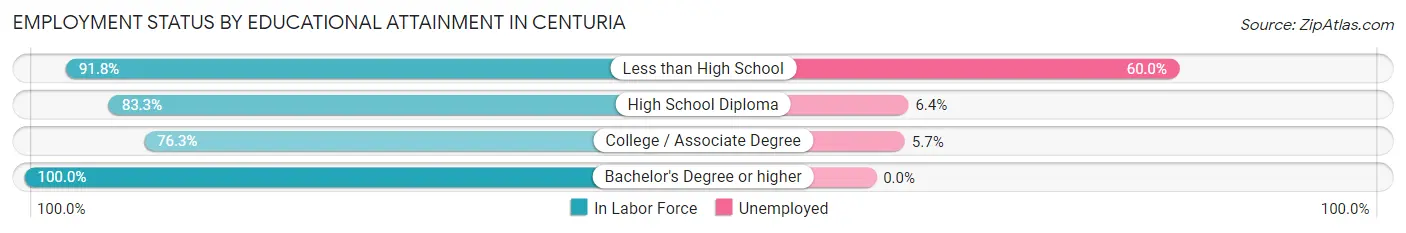
| Educational Attainment | In Labor Force | Unemployed |
| Less than High School | 45 (91.8%) | 29 (60.0%) |
| High School Diploma | 234 (83.3%) | 18 (6.4%) |
| College / Associate Degree | 87 (76.3%) | 6 (5.7%) |
| Bachelor's Degree or higher | 32 (100.0%) | 0 (0.0%) |
| Total | 398 (83.6%) | 56 (11.8%) |
Employment Occupations by Sex in Centuria
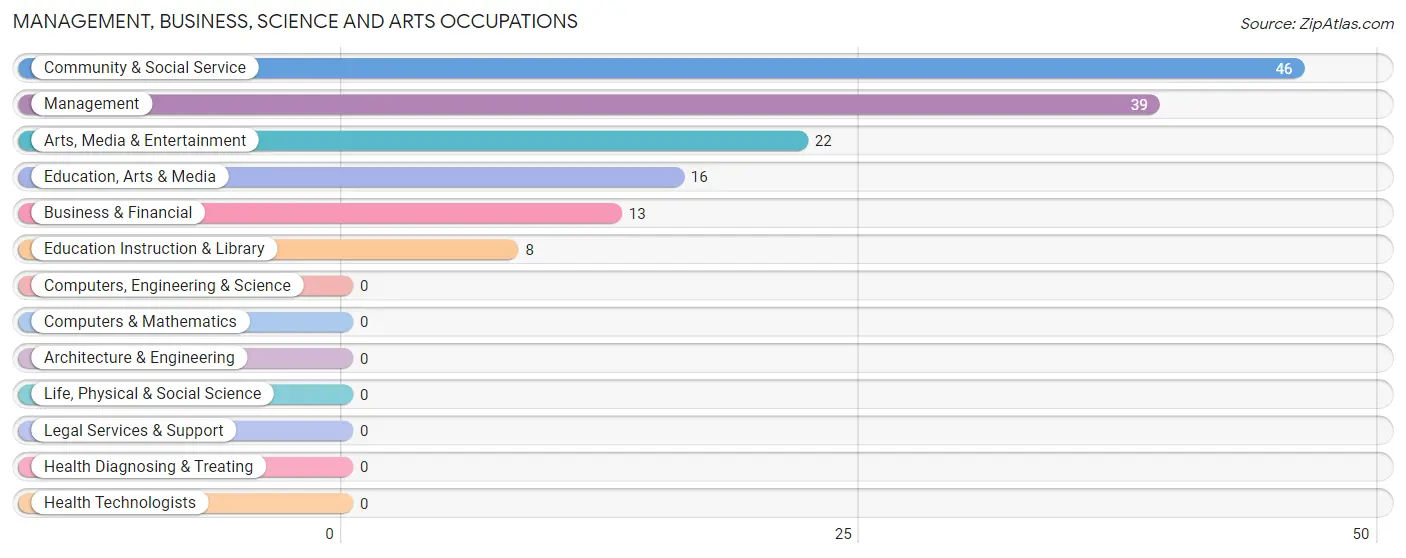
Management, Business, Science and Arts Occupations
The most common Management, Business, Science and Arts occupations in Centuria are Community & Social Service (46 | 9.2%), Management (39 | 7.8%), Arts, Media & Entertainment (22 | 4.4%), Education, Arts & Media (16 | 3.2%), and Business & Financial (13 | 2.6%).
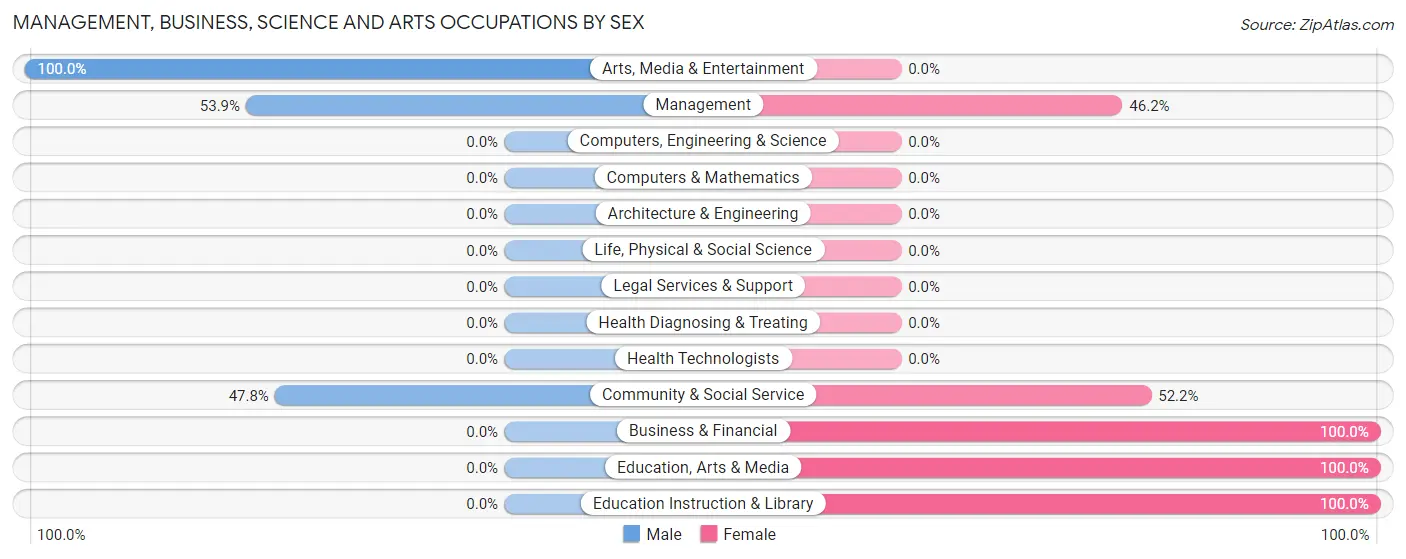
Management, Business, Science and Arts Occupations by Sex
Within the Management, Business, Science and Arts occupations in Centuria, the most male-oriented occupations are Arts, Media & Entertainment (100.0%), Management (53.8%), and Community & Social Service (47.8%), while the most female-oriented occupations are Business & Financial (100.0%), Education, Arts & Media (100.0%), and Education Instruction & Library (100.0%).
| Occupation | Male | Female |
| Management | 21 (53.8%) | 18 (46.2%) |
| Business & Financial | 0 (0.0%) | 13 (100.0%) |
| Computers, Engineering & Science | 0 (0.0%) | 0 (0.0%) |
| Computers & Mathematics | 0 (0.0%) | 0 (0.0%) |
| Architecture & Engineering | 0 (0.0%) | 0 (0.0%) |
| Life, Physical & Social Science | 0 (0.0%) | 0 (0.0%) |
| Community & Social Service | 22 (47.8%) | 24 (52.2%) |
| Education, Arts & Media | 0 (0.0%) | 16 (100.0%) |
| Legal Services & Support | 0 (0.0%) | 0 (0.0%) |
| Education Instruction & Library | 0 (0.0%) | 8 (100.0%) |
| Arts, Media & Entertainment | 22 (100.0%) | 0 (0.0%) |
| Health Diagnosing & Treating | 0 (0.0%) | 0 (0.0%) |
| Health Technologists | 0 (0.0%) | 0 (0.0%) |
| Total (Category) | 43 (43.9%) | 55 (56.1%) |
| Total (Overall) | 289 (57.9%) | 210 (42.1%) |
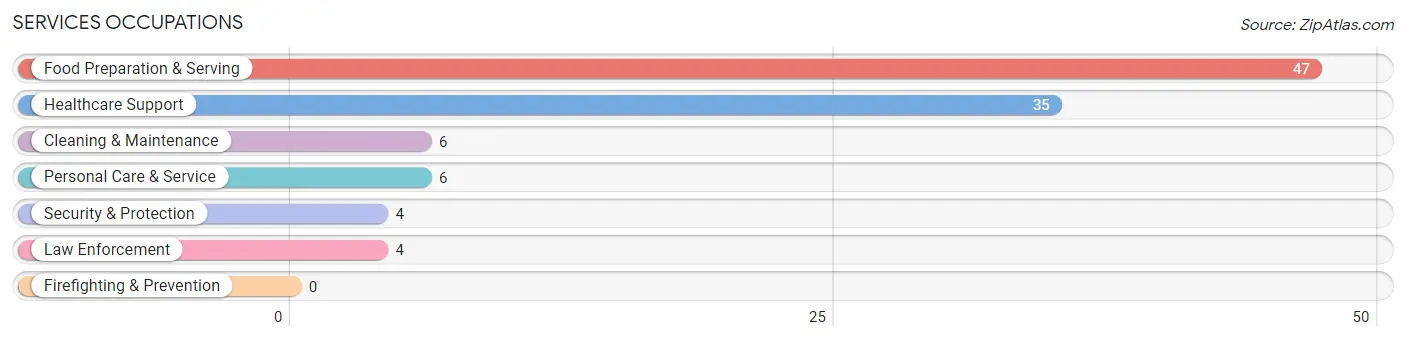
Services Occupations
The most common Services occupations in Centuria are Food Preparation & Serving (47 | 9.4%), Healthcare Support (35 | 7.0%), Cleaning & Maintenance (6 | 1.2%), Personal Care & Service (6 | 1.2%), and Security & Protection (4 | 0.8%).
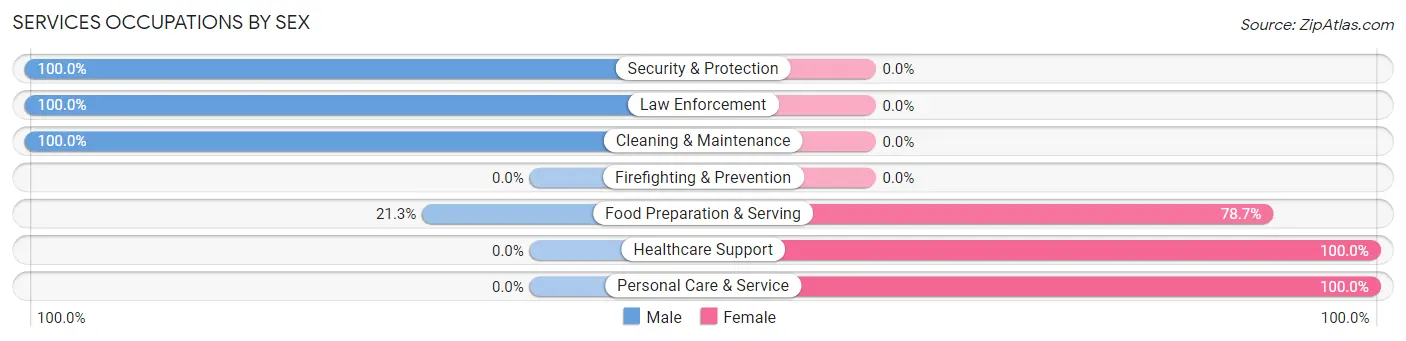
Services Occupations by Sex
Within the Services occupations in Centuria, the most male-oriented occupations are Security & Protection (100.0%), Law Enforcement (100.0%), and Cleaning & Maintenance (100.0%), while the most female-oriented occupations are Healthcare Support (100.0%), Personal Care & Service (100.0%), and Food Preparation & Serving (78.7%).
| Occupation | Male | Female |
| Healthcare Support | 0 (0.0%) | 35 (100.0%) |
| Security & Protection | 4 (100.0%) | 0 (0.0%) |
| Firefighting & Prevention | 0 (0.0%) | 0 (0.0%) |
| Law Enforcement | 4 (100.0%) | 0 (0.0%) |
| Food Preparation & Serving | 10 (21.3%) | 37 (78.7%) |
| Cleaning & Maintenance | 6 (100.0%) | 0 (0.0%) |
| Personal Care & Service | 0 (0.0%) | 6 (100.0%) |
| Total (Category) | 20 (20.4%) | 78 (79.6%) |
| Total (Overall) | 289 (57.9%) | 210 (42.1%) |
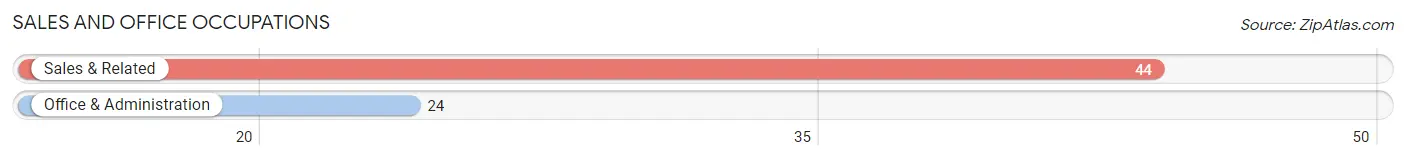
Sales and Office Occupations
The most common Sales and Office occupations in Centuria are Sales & Related (44 | 8.8%), and Office & Administration (24 | 4.8%).
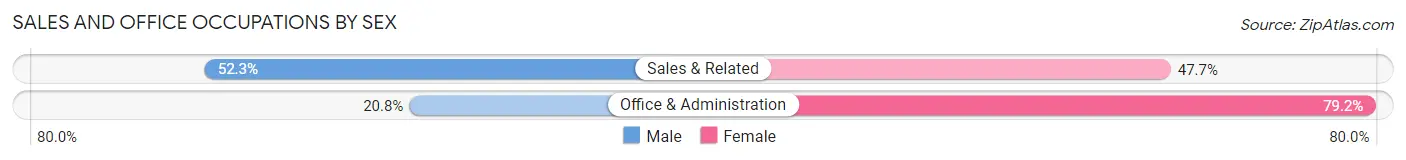
Sales and Office Occupations by Sex
| Occupation | Male | Female |
| Sales & Related | 23 (52.3%) | 21 (47.7%) |
| Office & Administration | 5 (20.8%) | 19 (79.2%) |
| Total (Category) | 28 (41.2%) | 40 (58.8%) |
| Total (Overall) | 289 (57.9%) | 210 (42.1%) |
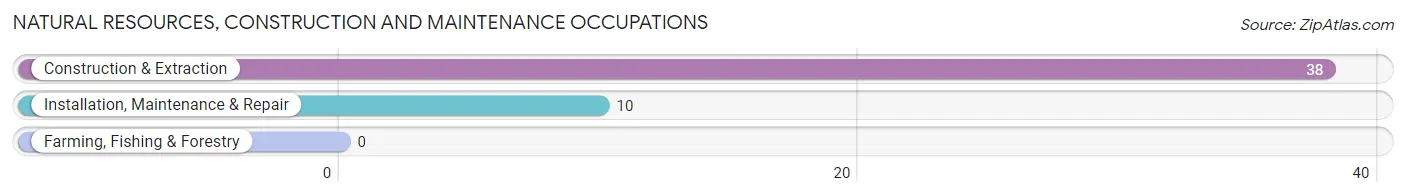
Natural Resources, Construction and Maintenance Occupations
The most common Natural Resources, Construction and Maintenance occupations in Centuria are Construction & Extraction (38 | 7.6%), and Installation, Maintenance & Repair (10 | 2.0%).
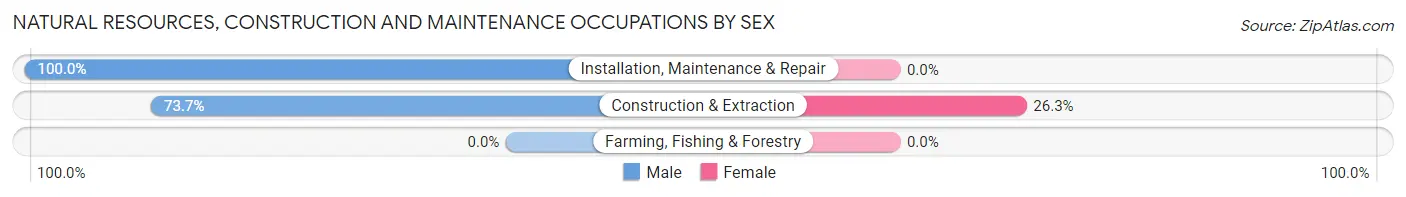
Natural Resources, Construction and Maintenance Occupations by Sex
| Occupation | Male | Female |
| Farming, Fishing & Forestry | 0 (0.0%) | 0 (0.0%) |
| Construction & Extraction | 28 (73.7%) | 10 (26.3%) |
| Installation, Maintenance & Repair | 10 (100.0%) | 0 (0.0%) |
| Total (Category) | 38 (79.2%) | 10 (20.8%) |
| Total (Overall) | 289 (57.9%) | 210 (42.1%) |
Production, Transportation and Moving Occupations
The most common Production, Transportation and Moving occupations in Centuria are Production (142 | 28.5%), Material Moving (26 | 5.2%), and Transportation (19 | 3.8%).
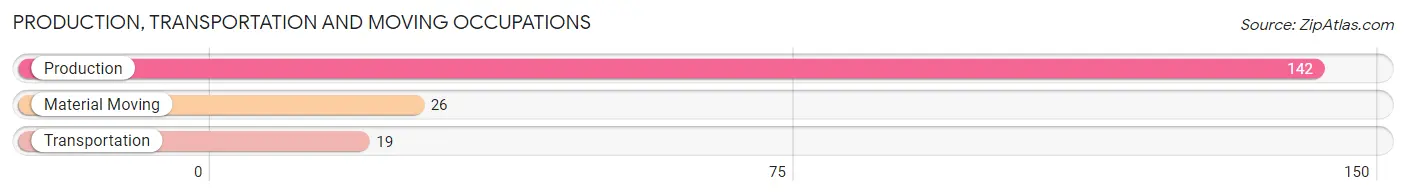
Production, Transportation and Moving Occupations by Sex
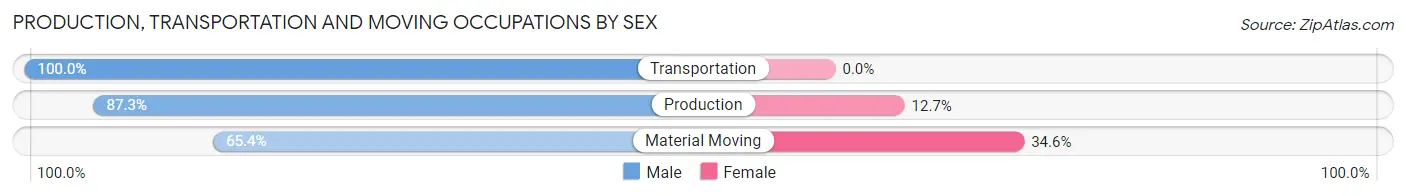
| Occupation | Male | Female |
| Production | 124 (87.3%) | 18 (12.7%) |
| Transportation | 19 (100.0%) | 0 (0.0%) |
| Material Moving | 17 (65.4%) | 9 (34.6%) |
| Total (Category) | 160 (85.6%) | 27 (14.4%) |
| Total (Overall) | 289 (57.9%) | 210 (42.1%) |
Employment Industries by Sex in Centuria
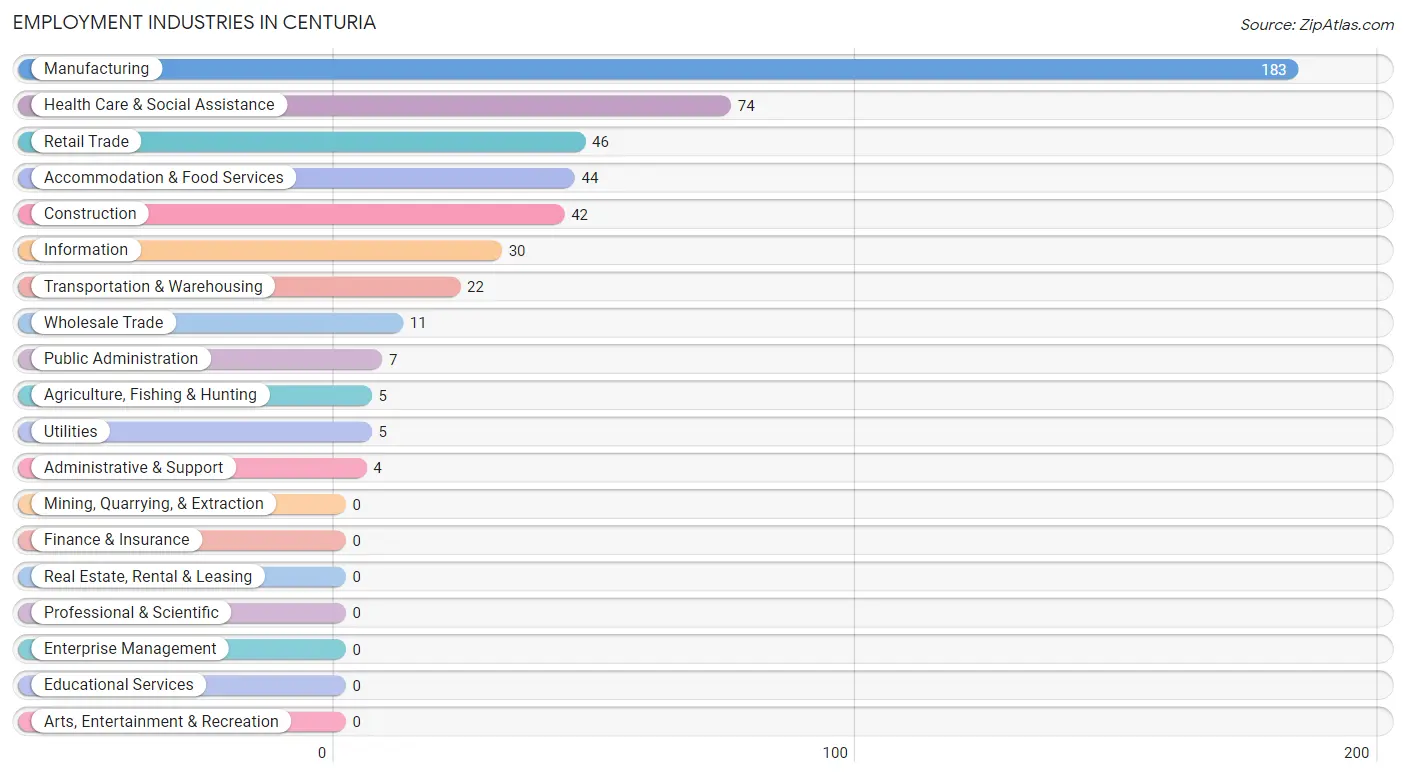
Employment Industries in Centuria
The major employment industries in Centuria include Manufacturing (183 | 36.7%), Health Care & Social Assistance (74 | 14.8%), Retail Trade (46 | 9.2%), Accommodation & Food Services (44 | 8.8%), and Construction (42 | 8.4%).
Employment Industries by Sex in Centuria
The Centuria industries that see more men than women are Wholesale Trade (100.0%), Utilities (100.0%), and Administrative & Support (100.0%), whereas the industries that tend to have a higher number of women are Information (100.0%), Health Care & Social Assistance (100.0%), and Accommodation & Food Services (68.2%).
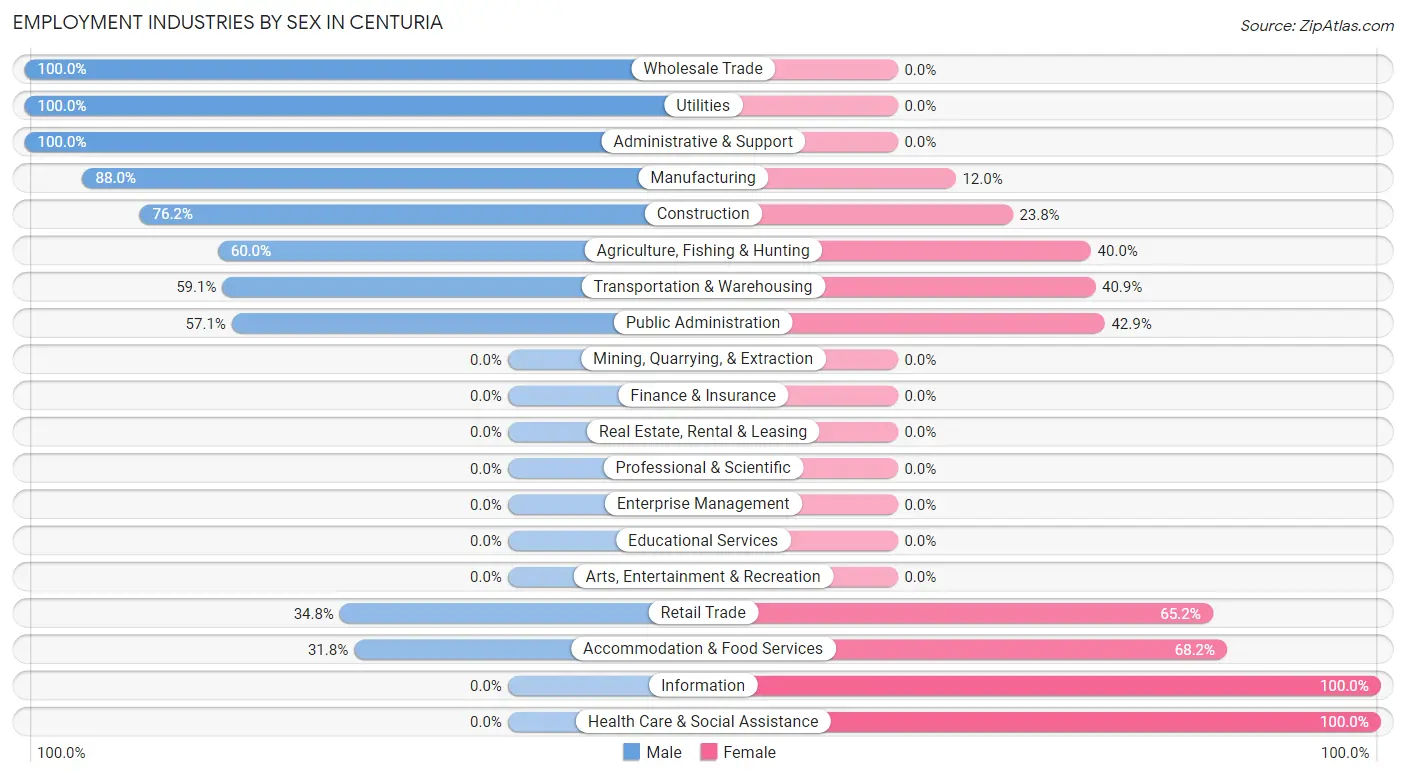
| Industry | Male | Female |
| Agriculture, Fishing & Hunting | 3 (60.0%) | 2 (40.0%) |
| Mining, Quarrying, & Extraction | 0 (0.0%) | 0 (0.0%) |
| Construction | 32 (76.2%) | 10 (23.8%) |
| Manufacturing | 161 (88.0%) | 22 (12.0%) |
| Wholesale Trade | 11 (100.0%) | 0 (0.0%) |
| Retail Trade | 16 (34.8%) | 30 (65.2%) |
| Transportation & Warehousing | 13 (59.1%) | 9 (40.9%) |
| Utilities | 5 (100.0%) | 0 (0.0%) |
| Information | 0 (0.0%) | 30 (100.0%) |
| Finance & Insurance | 0 (0.0%) | 0 (0.0%) |
| Real Estate, Rental & Leasing | 0 (0.0%) | 0 (0.0%) |
| Professional & Scientific | 0 (0.0%) | 0 (0.0%) |
| Enterprise Management | 0 (0.0%) | 0 (0.0%) |
| Administrative & Support | 4 (100.0%) | 0 (0.0%) |
| Educational Services | 0 (0.0%) | 0 (0.0%) |
| Health Care & Social Assistance | 0 (0.0%) | 74 (100.0%) |
| Arts, Entertainment & Recreation | 0 (0.0%) | 0 (0.0%) |
| Accommodation & Food Services | 14 (31.8%) | 30 (68.2%) |
| Public Administration | 4 (57.1%) | 3 (42.9%) |
| Total | 289 (57.9%) | 210 (42.1%) |
Education in Centuria
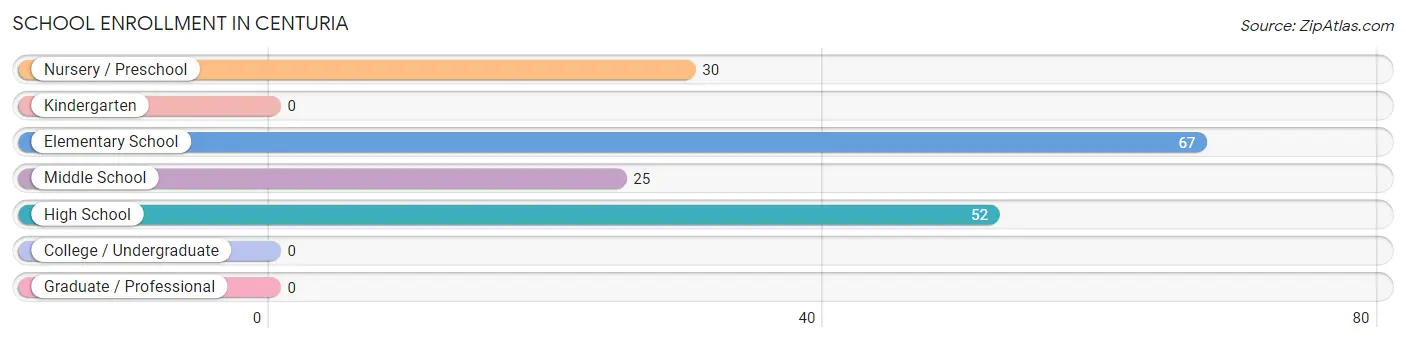
School Enrollment in Centuria
The most common levels of schooling among the 174 students in Centuria are elementary school (67 | 38.5%), high school (52 | 29.9%), and nursery / preschool (30 | 17.2%).
| School Level | # Students | % Students |
| Nursery / Preschool | 30 | 17.2% |
| Kindergarten | 0 | 0.0% |
| Elementary School | 67 | 38.5% |
| Middle School | 25 | 14.4% |
| High School | 52 | 29.9% |
| College / Undergraduate | 0 | 0.0% |
| Graduate / Professional | 0 | 0.0% |
| Total | 174 | 100.0% |
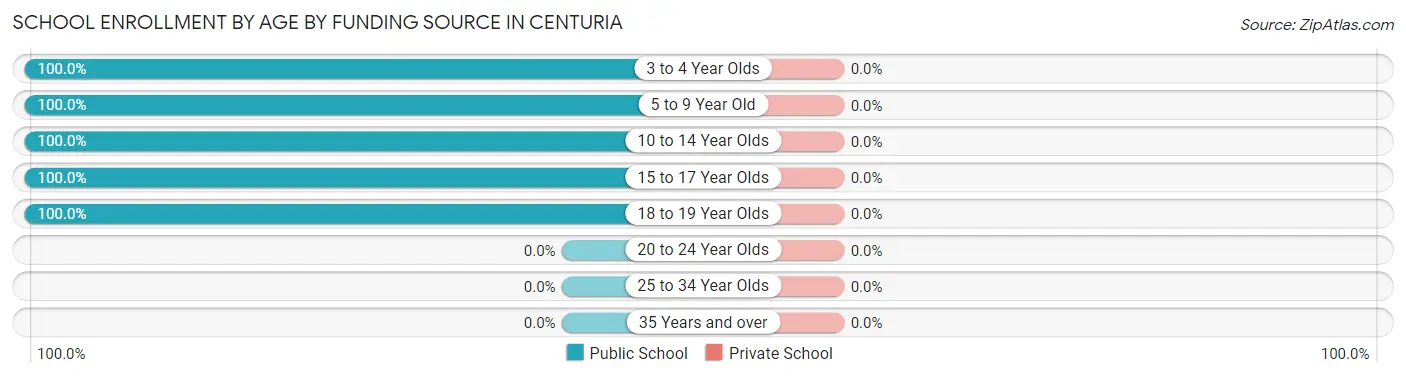
School Enrollment by Age by Funding Source in Centuria
| Age Bracket | Public School | Private School |
| 3 to 4 Year Olds | 26 (100.0%) | 0 (0.0%) |
| 5 to 9 Year Old | 68 (100.0%) | 0 (0.0%) |
| 10 to 14 Year Olds | 31 (100.0%) | 0 (0.0%) |
| 15 to 17 Year Olds | 45 (100.0%) | 0 (0.0%) |
| 18 to 19 Year Olds | 4 (100.0%) | 0 (0.0%) |
| 20 to 24 Year Olds | 0 (0.0%) | 0 (0.0%) |
| 25 to 34 Year Olds | 0 (0.0%) | 0 (0.0%) |
| 35 Years and over | 0 (0.0%) | 0 (0.0%) |
| Total | 174 (100.0%) | 0 (0.0%) |
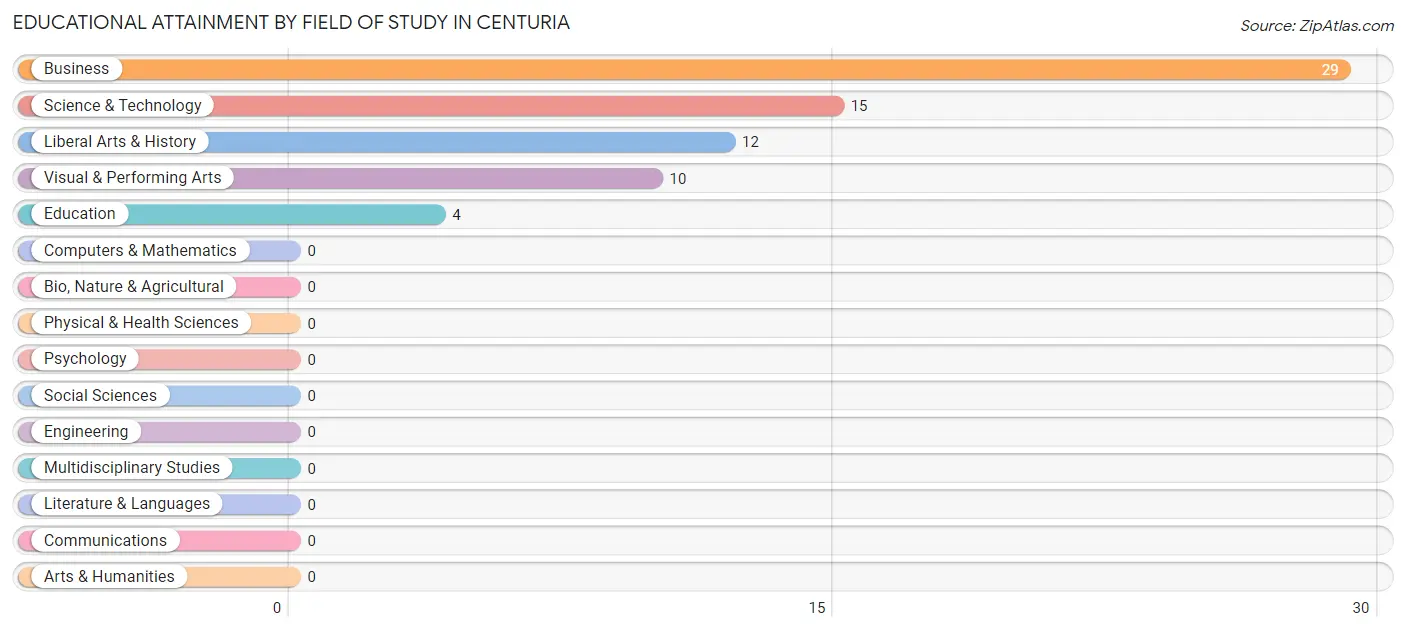
Educational Attainment by Field of Study in Centuria
Business (29 | 41.4%), science & technology (15 | 21.4%), liberal arts & history (12 | 17.1%), visual & performing arts (10 | 14.3%), and education (4 | 5.7%) are the most common fields of study among 70 individuals in Centuria who have obtained a bachelor's degree or higher.
| Field of Study | # Graduates | % Graduates |
| Computers & Mathematics | 0 | 0.0% |
| Bio, Nature & Agricultural | 0 | 0.0% |
| Physical & Health Sciences | 0 | 0.0% |
| Psychology | 0 | 0.0% |
| Social Sciences | 0 | 0.0% |
| Engineering | 0 | 0.0% |
| Multidisciplinary Studies | 0 | 0.0% |
| Science & Technology | 15 | 21.4% |
| Business | 29 | 41.4% |
| Education | 4 | 5.7% |
| Literature & Languages | 0 | 0.0% |
| Liberal Arts & History | 12 | 17.1% |
| Visual & Performing Arts | 10 | 14.3% |
| Communications | 0 | 0.0% |
| Arts & Humanities | 0 | 0.0% |
| Total | 70 | 100.0% |
Transportation & Commute in Centuria
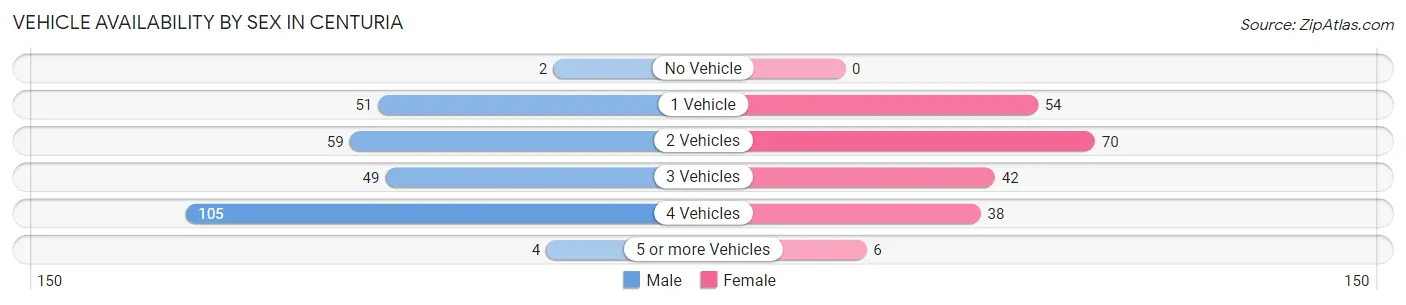
Vehicle Availability by Sex in Centuria
The most prevalent vehicle ownership categories in Centuria are males with 4 vehicles (105, accounting for 38.9%) and females with 4 vehicles (38, making up 50.0%).
| Vehicles Available | Male | Female |
| No Vehicle | 2 (0.7%) | 0 (0.0%) |
| 1 Vehicle | 51 (18.9%) | 54 (25.7%) |
| 2 Vehicles | 59 (21.8%) | 70 (33.3%) |
| 3 Vehicles | 49 (18.1%) | 42 (20.0%) |
| 4 Vehicles | 105 (38.9%) | 38 (18.1%) |
| 5 or more Vehicles | 4 (1.5%) | 6 (2.9%) |
| Total | 270 (100.0%) | 210 (100.0%) |
Commute Time in Centuria
The most frequently occuring commute durations in Centuria are 15 to 19 minutes (98 commuters, 20.4%), 10 to 14 minutes (78 commuters, 16.3%), and 30 to 34 minutes (66 commuters, 13.8%).
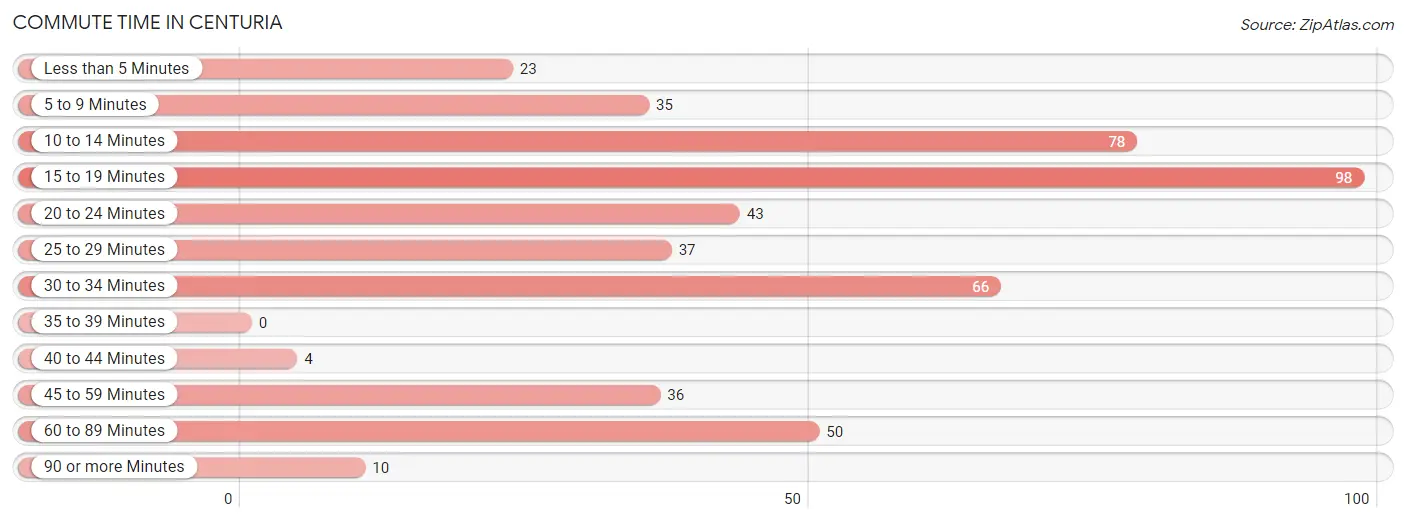
| Commute Time | # Commuters | % Commuters |
| Less than 5 Minutes | 23 | 4.8% |
| 5 to 9 Minutes | 35 | 7.3% |
| 10 to 14 Minutes | 78 | 16.3% |
| 15 to 19 Minutes | 98 | 20.4% |
| 20 to 24 Minutes | 43 | 9.0% |
| 25 to 29 Minutes | 37 | 7.7% |
| 30 to 34 Minutes | 66 | 13.8% |
| 35 to 39 Minutes | 0 | 0.0% |
| 40 to 44 Minutes | 4 | 0.8% |
| 45 to 59 Minutes | 36 | 7.5% |
| 60 to 89 Minutes | 50 | 10.4% |
| 90 or more Minutes | 10 | 2.1% |
Commute Time by Sex in Centuria
The most common commute times in Centuria are 15 to 19 minutes (55 commuters, 20.4%) for males and 30 to 34 minutes (44 commuters, 20.9%) for females.
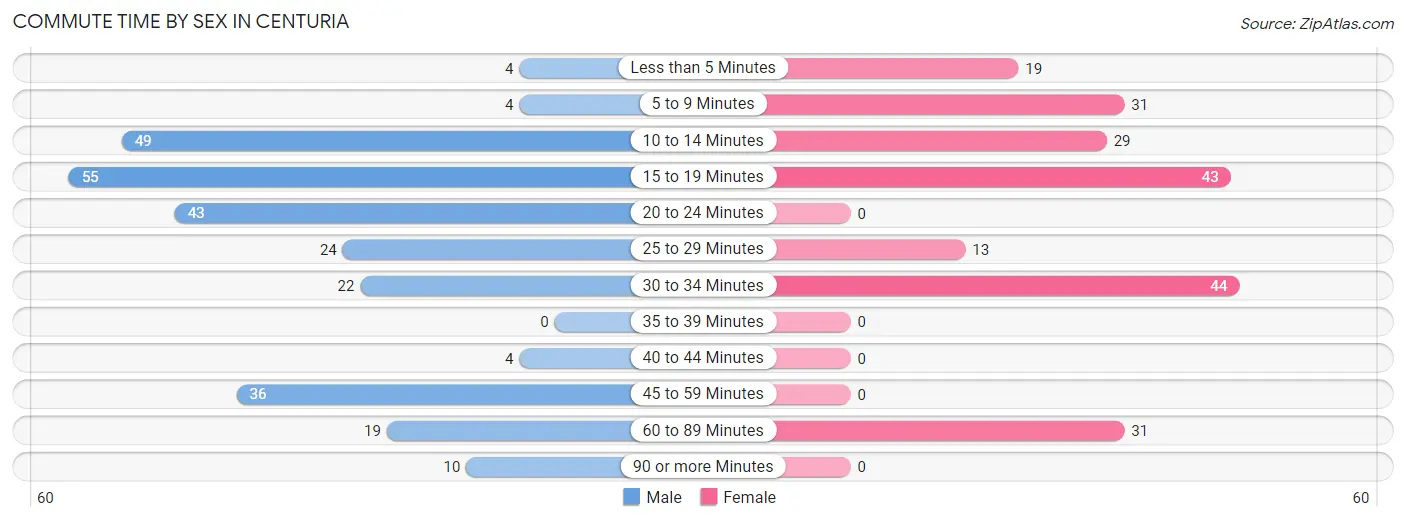
| Commute Time | Male | Female |
| Less than 5 Minutes | 4 (1.5%) | 19 (9.0%) |
| 5 to 9 Minutes | 4 (1.5%) | 31 (14.8%) |
| 10 to 14 Minutes | 49 (18.1%) | 29 (13.8%) |
| 15 to 19 Minutes | 55 (20.4%) | 43 (20.5%) |
| 20 to 24 Minutes | 43 (15.9%) | 0 (0.0%) |
| 25 to 29 Minutes | 24 (8.9%) | 13 (6.2%) |
| 30 to 34 Minutes | 22 (8.2%) | 44 (20.9%) |
| 35 to 39 Minutes | 0 (0.0%) | 0 (0.0%) |
| 40 to 44 Minutes | 4 (1.5%) | 0 (0.0%) |
| 45 to 59 Minutes | 36 (13.3%) | 0 (0.0%) |
| 60 to 89 Minutes | 19 (7.0%) | 31 (14.8%) |
| 90 or more Minutes | 10 (3.7%) | 0 (0.0%) |
Time of Departure to Work by Sex in Centuria
The most frequent times of departure to work in Centuria are 5:00 AM to 5:29 AM (63, 23.3%) for males and 10:00 AM to 10:59 AM (50, 23.8%) for females.
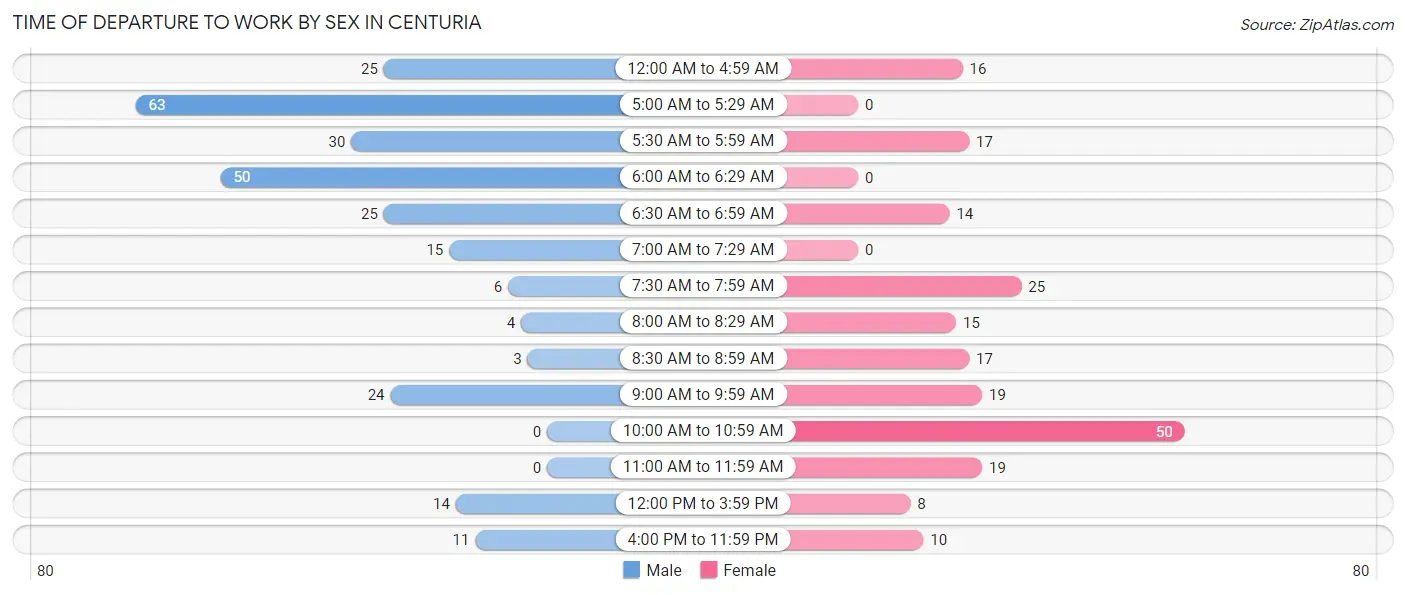
| Time of Departure | Male | Female |
| 12:00 AM to 4:59 AM | 25 (9.3%) | 16 (7.6%) |
| 5:00 AM to 5:29 AM | 63 (23.3%) | 0 (0.0%) |
| 5:30 AM to 5:59 AM | 30 (11.1%) | 17 (8.1%) |
| 6:00 AM to 6:29 AM | 50 (18.5%) | 0 (0.0%) |
| 6:30 AM to 6:59 AM | 25 (9.3%) | 14 (6.7%) |
| 7:00 AM to 7:29 AM | 15 (5.6%) | 0 (0.0%) |
| 7:30 AM to 7:59 AM | 6 (2.2%) | 25 (11.9%) |
| 8:00 AM to 8:29 AM | 4 (1.5%) | 15 (7.1%) |
| 8:30 AM to 8:59 AM | 3 (1.1%) | 17 (8.1%) |
| 9:00 AM to 9:59 AM | 24 (8.9%) | 19 (9.0%) |
| 10:00 AM to 10:59 AM | 0 (0.0%) | 50 (23.8%) |
| 11:00 AM to 11:59 AM | 0 (0.0%) | 19 (9.0%) |
| 12:00 PM to 3:59 PM | 14 (5.2%) | 8 (3.8%) |
| 4:00 PM to 11:59 PM | 11 (4.1%) | 10 (4.8%) |
| Total | 270 (100.0%) | 210 (100.0%) |
Housing Occupancy in Centuria
Occupancy by Ownership in Centuria
Of the total 433 dwellings in Centuria, owner-occupied units account for 261 (60.3%), while renter-occupied units make up 172 (39.7%).
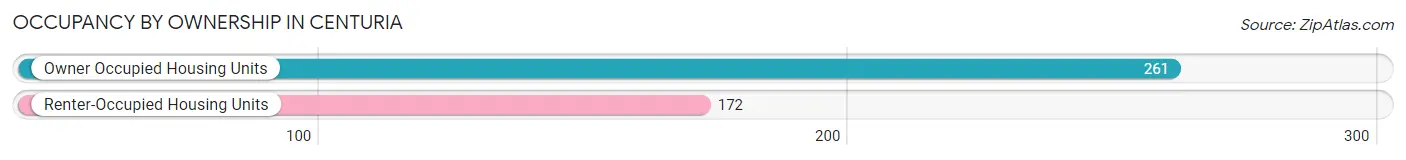
| Occupancy | # Housing Units | % Housing Units |
| Owner Occupied Housing Units | 261 | 60.3% |
| Renter-Occupied Housing Units | 172 | 39.7% |
| Total Occupied Housing Units | 433 | 100.0% |
Occupancy by Household Size in Centuria
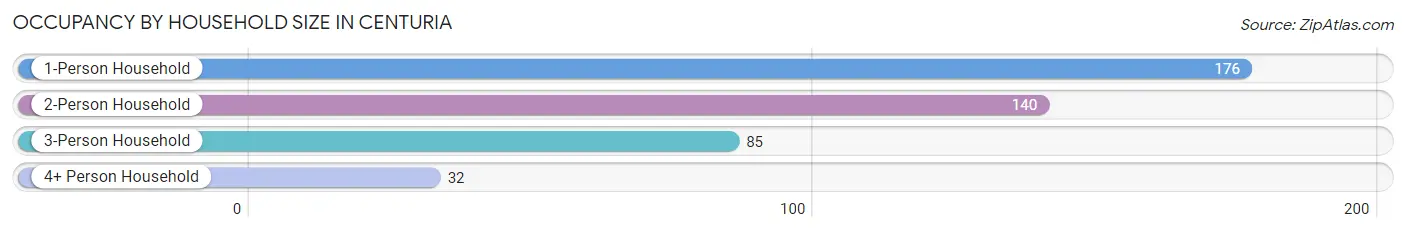
| Household Size | # Housing Units | % Housing Units |
| 1-Person Household | 176 | 40.6% |
| 2-Person Household | 140 | 32.3% |
| 3-Person Household | 85 | 19.6% |
| 4+ Person Household | 32 | 7.4% |
| Total Housing Units | 433 | 100.0% |
Occupancy by Ownership by Household Size in Centuria
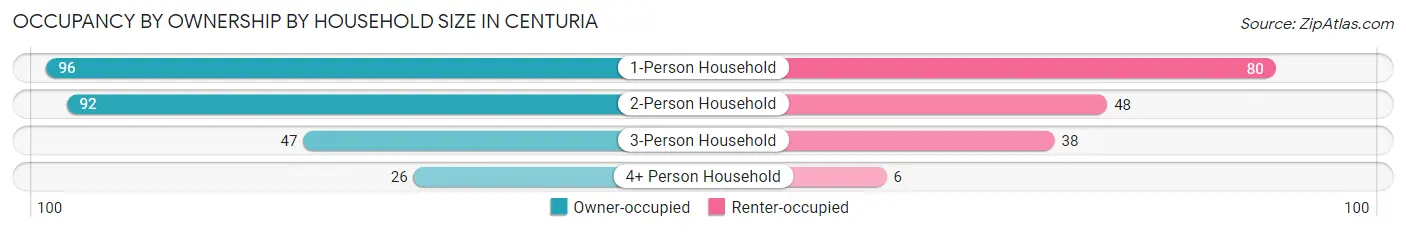
| Household Size | Owner-occupied | Renter-occupied |
| 1-Person Household | 96 (54.5%) | 80 (45.5%) |
| 2-Person Household | 92 (65.7%) | 48 (34.3%) |
| 3-Person Household | 47 (55.3%) | 38 (44.7%) |
| 4+ Person Household | 26 (81.2%) | 6 (18.8%) |
| Total Housing Units | 261 (60.3%) | 172 (39.7%) |
Occupancy by Educational Attainment in Centuria
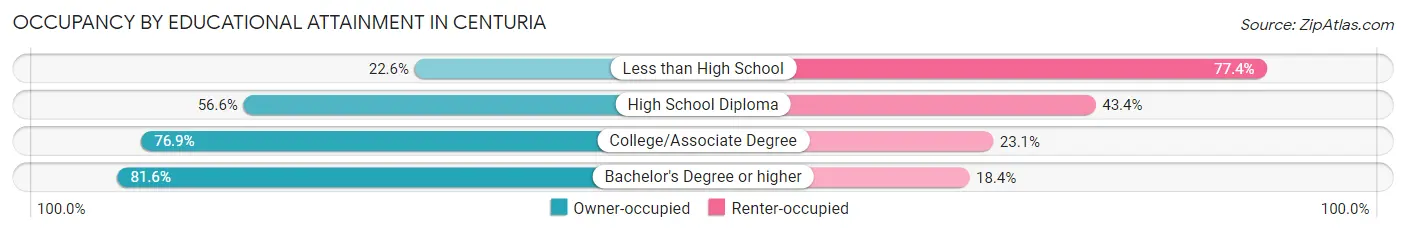
| Household Size | Owner-occupied | Renter-occupied |
| Less than High School | 12 (22.6%) | 41 (77.4%) |
| High School Diploma | 125 (56.6%) | 96 (43.4%) |
| College/Associate Degree | 93 (76.9%) | 28 (23.1%) |
| Bachelor's Degree or higher | 31 (81.6%) | 7 (18.4%) |
Occupancy by Age of Householder in Centuria
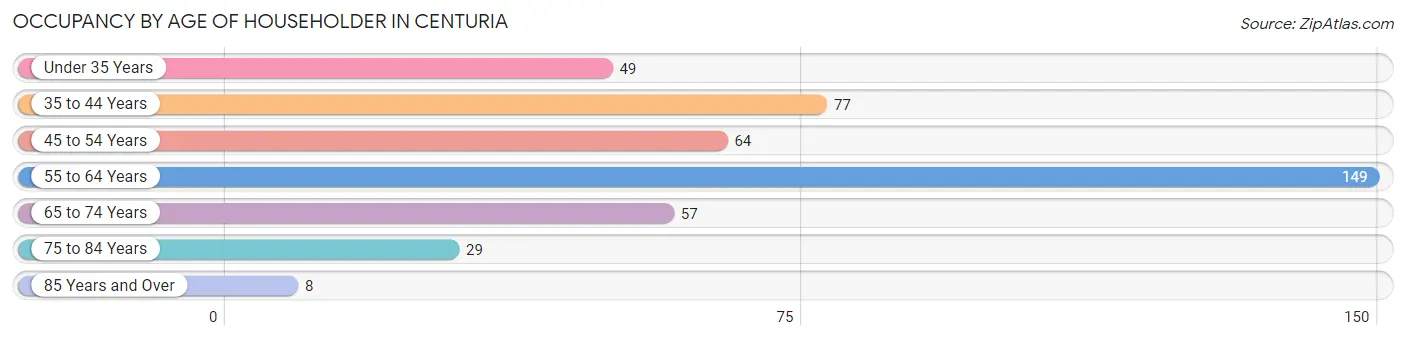
| Age Bracket | # Households | % Households |
| Under 35 Years | 49 | 11.3% |
| 35 to 44 Years | 77 | 17.8% |
| 45 to 54 Years | 64 | 14.8% |
| 55 to 64 Years | 149 | 34.4% |
| 65 to 74 Years | 57 | 13.2% |
| 75 to 84 Years | 29 | 6.7% |
| 85 Years and Over | 8 | 1.8% |
| Total | 433 | 100.0% |
Housing Finances in Centuria
Median Income by Occupancy in Centuria
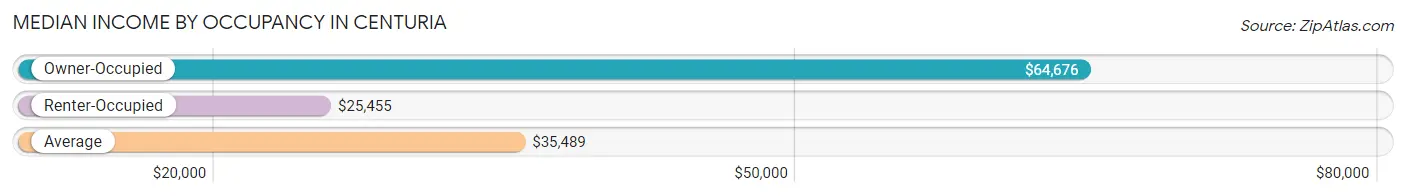
| Occupancy Type | # Households | Median Income |
| Owner-Occupied | 261 (60.3%) | $64,676 |
| Renter-Occupied | 172 (39.7%) | $25,455 |
| Average | 433 (100.0%) | $35,489 |
Occupancy by Householder Income Bracket in Centuria
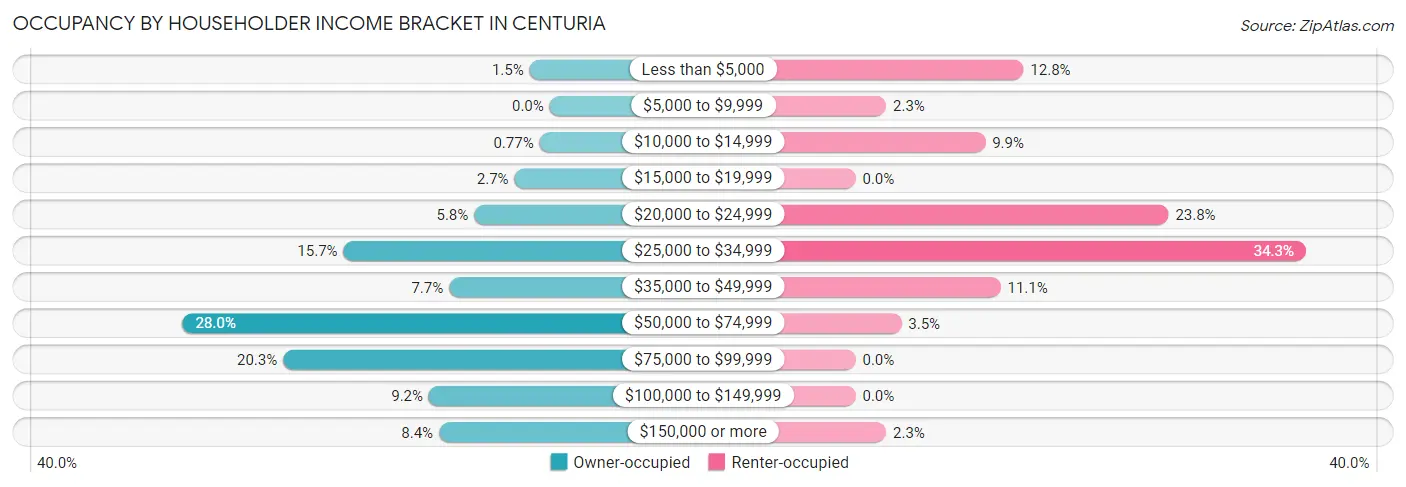
| Income Bracket | Owner-occupied | Renter-occupied |
| Less than $5,000 | 4 (1.5%) | 22 (12.8%) |
| $5,000 to $9,999 | 0 (0.0%) | 4 (2.3%) |
| $10,000 to $14,999 | 2 (0.8%) | 17 (9.9%) |
| $15,000 to $19,999 | 7 (2.7%) | 0 (0.0%) |
| $20,000 to $24,999 | 15 (5.8%) | 41 (23.8%) |
| $25,000 to $34,999 | 41 (15.7%) | 59 (34.3%) |
| $35,000 to $49,999 | 20 (7.7%) | 19 (11.1%) |
| $50,000 to $74,999 | 73 (28.0%) | 6 (3.5%) |
| $75,000 to $99,999 | 53 (20.3%) | 0 (0.0%) |
| $100,000 to $149,999 | 24 (9.2%) | 0 (0.0%) |
| $150,000 or more | 22 (8.4%) | 4 (2.3%) |
| Total | 261 (100.0%) | 172 (100.0%) |
Monthly Housing Cost Tiers in Centuria
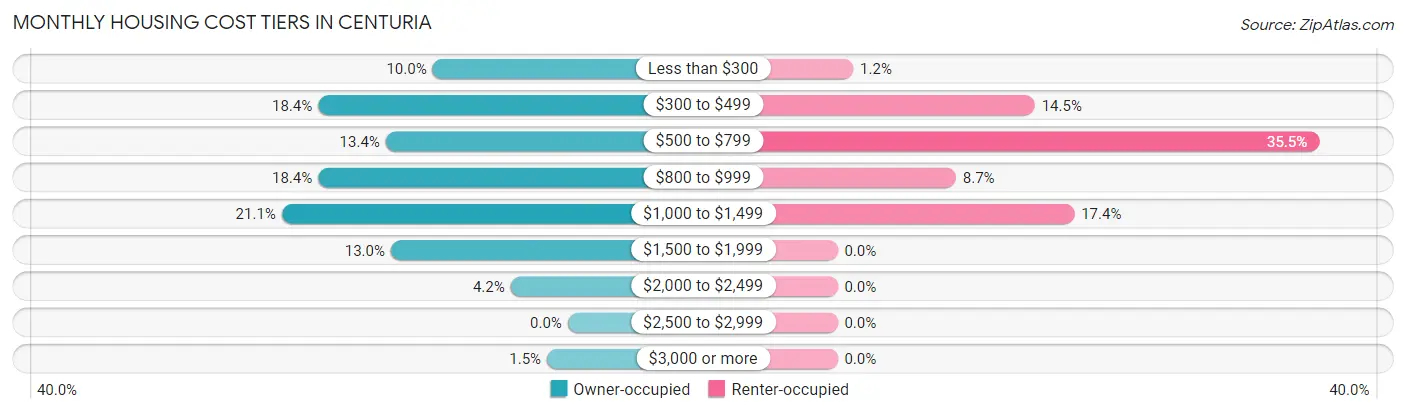
| Monthly Cost | Owner-occupied | Renter-occupied |
| Less than $300 | 26 (10.0%) | 2 (1.2%) |
| $300 to $499 | 48 (18.4%) | 25 (14.5%) |
| $500 to $799 | 35 (13.4%) | 61 (35.5%) |
| $800 to $999 | 48 (18.4%) | 15 (8.7%) |
| $1,000 to $1,499 | 55 (21.1%) | 30 (17.4%) |
| $1,500 to $1,999 | 34 (13.0%) | 0 (0.0%) |
| $2,000 to $2,499 | 11 (4.2%) | 0 (0.0%) |
| $2,500 to $2,999 | 0 (0.0%) | 0 (0.0%) |
| $3,000 or more | 4 (1.5%) | 0 (0.0%) |
| Total | 261 (100.0%) | 172 (100.0%) |
Physical Housing Characteristics in Centuria
Housing Structures in Centuria
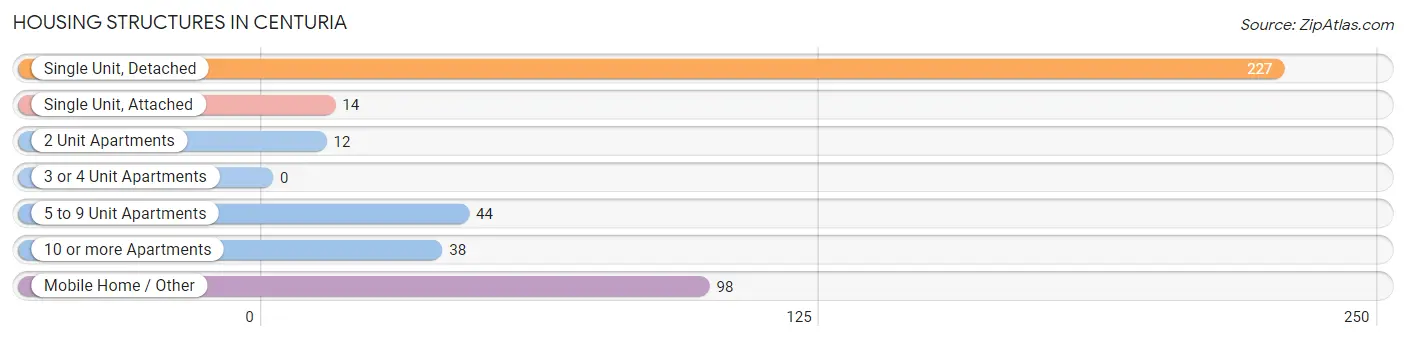
| Structure Type | # Housing Units | % Housing Units |
| Single Unit, Detached | 227 | 52.4% |
| Single Unit, Attached | 14 | 3.2% |
| 2 Unit Apartments | 12 | 2.8% |
| 3 or 4 Unit Apartments | 0 | 0.0% |
| 5 to 9 Unit Apartments | 44 | 10.2% |
| 10 or more Apartments | 38 | 8.8% |
| Mobile Home / Other | 98 | 22.6% |
| Total | 433 | 100.0% |
Housing Structures by Occupancy in Centuria
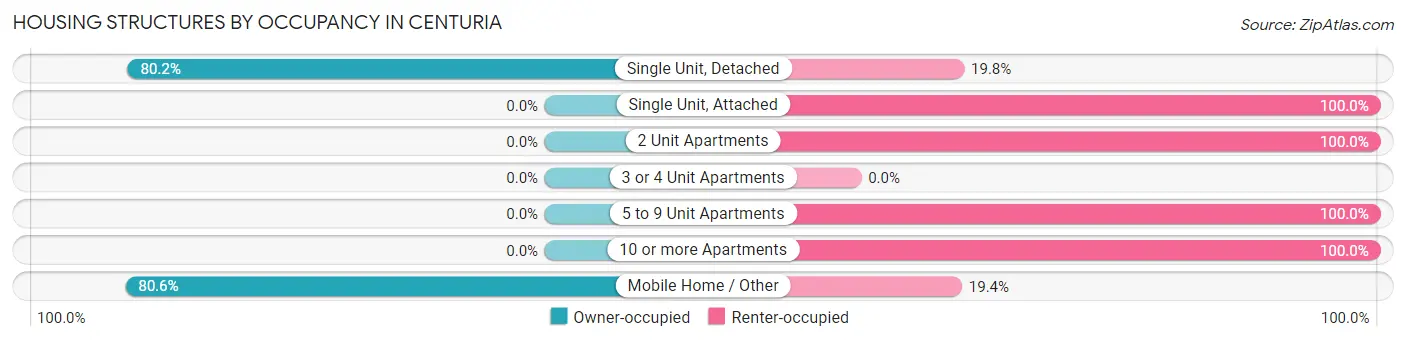
| Structure Type | Owner-occupied | Renter-occupied |
| Single Unit, Detached | 182 (80.2%) | 45 (19.8%) |
| Single Unit, Attached | 0 (0.0%) | 14 (100.0%) |
| 2 Unit Apartments | 0 (0.0%) | 12 (100.0%) |
| 3 or 4 Unit Apartments | 0 (0.0%) | 0 (0.0%) |
| 5 to 9 Unit Apartments | 0 (0.0%) | 44 (100.0%) |
| 10 or more Apartments | 0 (0.0%) | 38 (100.0%) |
| Mobile Home / Other | 79 (80.6%) | 19 (19.4%) |
| Total | 261 (60.3%) | 172 (39.7%) |
Housing Structures by Number of Rooms in Centuria
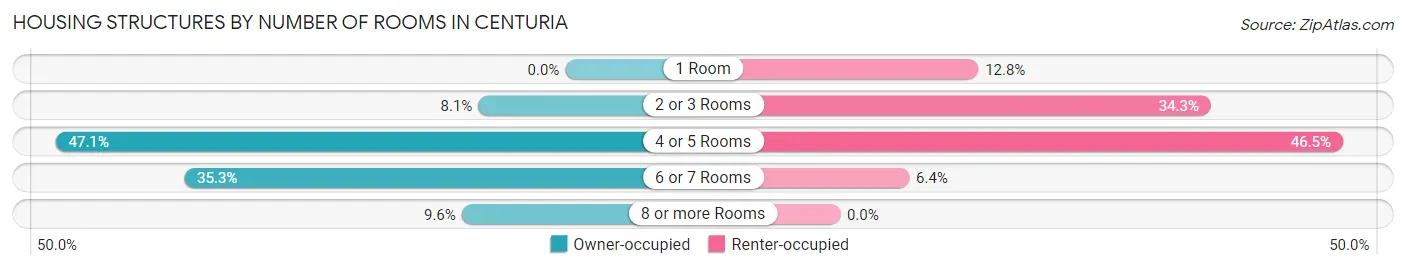
| Number of Rooms | Owner-occupied | Renter-occupied |
| 1 Room | 0 (0.0%) | 22 (12.8%) |
| 2 or 3 Rooms | 21 (8.1%) | 59 (34.3%) |
| 4 or 5 Rooms | 123 (47.1%) | 80 (46.5%) |
| 6 or 7 Rooms | 92 (35.2%) | 11 (6.4%) |
| 8 or more Rooms | 25 (9.6%) | 0 (0.0%) |
| Total | 261 (100.0%) | 172 (100.0%) |
Housing Structure by Heating Type in Centuria
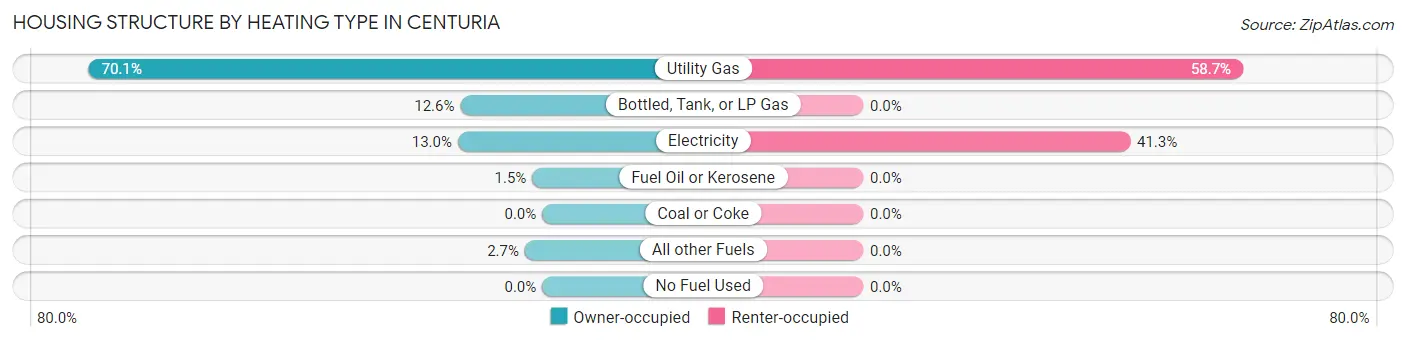
| Heating Type | Owner-occupied | Renter-occupied |
| Utility Gas | 183 (70.1%) | 101 (58.7%) |
| Bottled, Tank, or LP Gas | 33 (12.6%) | 0 (0.0%) |
| Electricity | 34 (13.0%) | 71 (41.3%) |
| Fuel Oil or Kerosene | 4 (1.5%) | 0 (0.0%) |
| Coal or Coke | 0 (0.0%) | 0 (0.0%) |
| All other Fuels | 7 (2.7%) | 0 (0.0%) |
| No Fuel Used | 0 (0.0%) | 0 (0.0%) |
| Total | 261 (100.0%) | 172 (100.0%) |
Household Vehicle Usage in Centuria
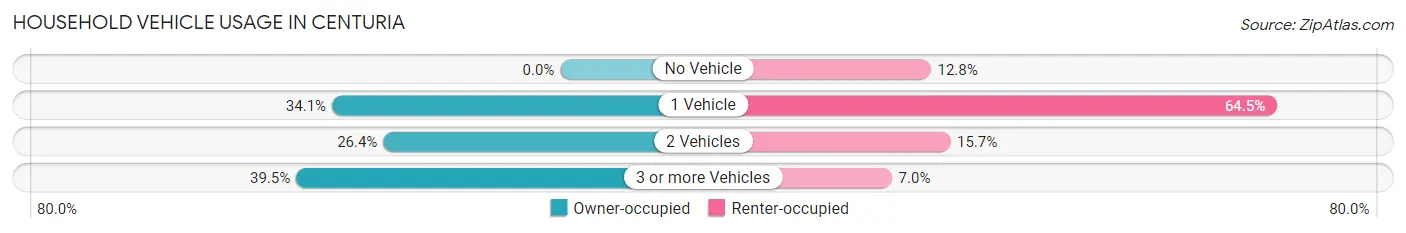
| Vehicles per Household | Owner-occupied | Renter-occupied |
| No Vehicle | 0 (0.0%) | 22 (12.8%) |
| 1 Vehicle | 89 (34.1%) | 111 (64.5%) |
| 2 Vehicles | 69 (26.4%) | 27 (15.7%) |
| 3 or more Vehicles | 103 (39.5%) | 12 (7.0%) |
| Total | 261 (100.0%) | 172 (100.0%) |
Real Estate & Mortgages in Centuria
Real Estate and Mortgage Overview in Centuria
| Characteristic | Without Mortgage | With Mortgage |
| Housing Units | 108 | 153 |
| Median Property Value | - | - |
| Median Household Income | $56,563 | $20 |
| Monthly Housing Costs | $466 | $4 |
| Real Estate Taxes | - | - |
Property Value by Mortgage Status in Centuria
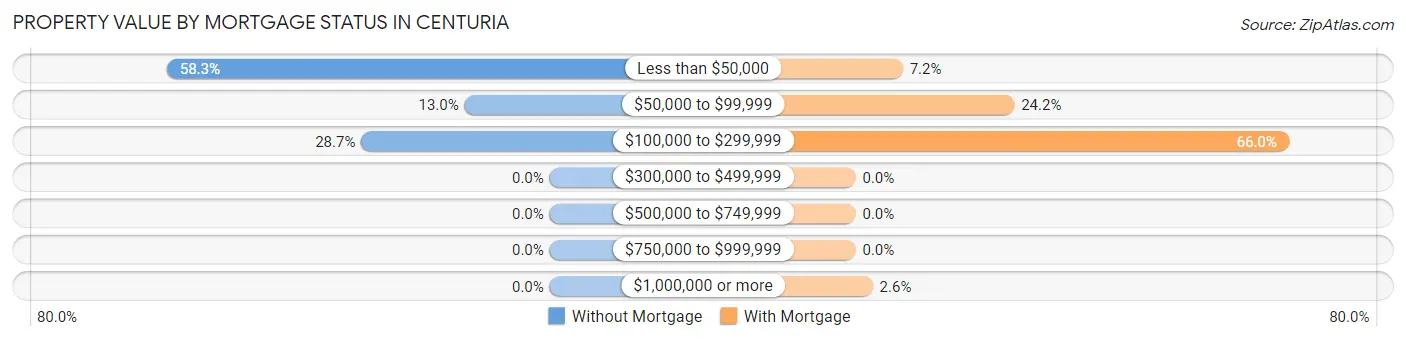
| Property Value | Without Mortgage | With Mortgage |
| Less than $50,000 | 63 (58.3%) | 11 (7.2%) |
| $50,000 to $99,999 | 14 (13.0%) | 37 (24.2%) |
| $100,000 to $299,999 | 31 (28.7%) | 101 (66.0%) |
| $300,000 to $499,999 | 0 (0.0%) | 0 (0.0%) |
| $500,000 to $749,999 | 0 (0.0%) | 0 (0.0%) |
| $750,000 to $999,999 | 0 (0.0%) | 0 (0.0%) |
| $1,000,000 or more | 0 (0.0%) | 4 (2.6%) |
| Total | 108 (100.0%) | 153 (100.0%) |
Household Income by Mortgage Status in Centuria
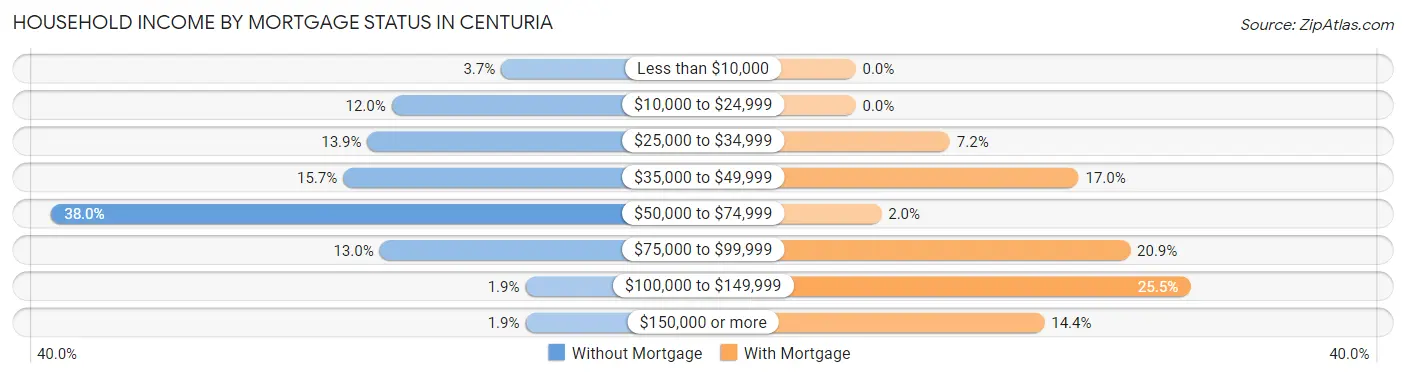
| Household Income | Without Mortgage | With Mortgage |
| Less than $10,000 | 4 (3.7%) | 0 (0.0%) |
| $10,000 to $24,999 | 13 (12.0%) | 0 (0.0%) |
| $25,000 to $34,999 | 15 (13.9%) | 11 (7.2%) |
| $35,000 to $49,999 | 17 (15.7%) | 26 (17.0%) |
| $50,000 to $74,999 | 41 (38.0%) | 3 (2.0%) |
| $75,000 to $99,999 | 14 (13.0%) | 32 (20.9%) |
| $100,000 to $149,999 | 2 (1.8%) | 39 (25.5%) |
| $150,000 or more | 2 (1.8%) | 22 (14.4%) |
| Total | 108 (100.0%) | 153 (100.0%) |
Property Value to Household Income Ratio in Centuria
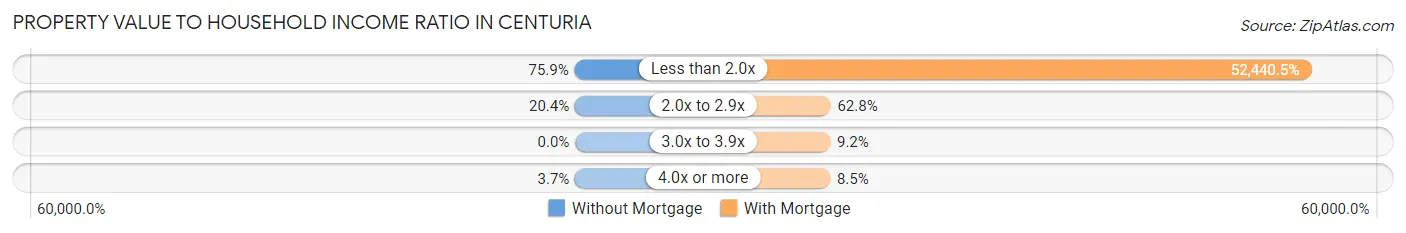
| Value-to-Income Ratio | Without Mortgage | With Mortgage |
| Less than 2.0x | 82 (75.9%) | 80,234 (52,440.5%) |
| 2.0x to 2.9x | 22 (20.4%) | 96 (62.7%) |
| 3.0x to 3.9x | 0 (0.0%) | 14 (9.1%) |
| 4.0x or more | 4 (3.7%) | 13 (8.5%) |
| Total | 108 (100.0%) | 153 (100.0%) |
Real Estate Taxes by Mortgage Status in Centuria
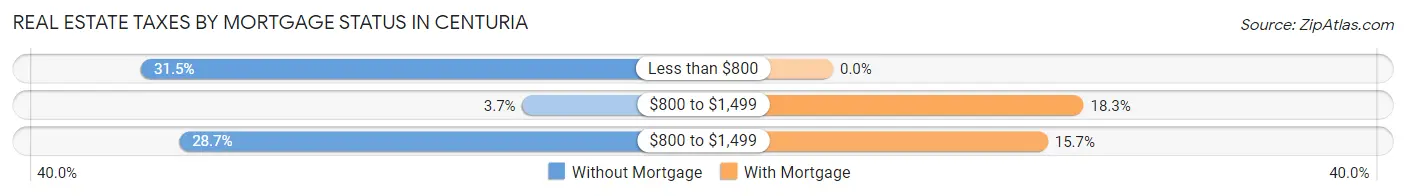
| Property Taxes | Without Mortgage | With Mortgage |
| Less than $800 | 34 (31.5%) | 0 (0.0%) |
| $800 to $1,499 | 4 (3.7%) | 28 (18.3%) |
| $800 to $1,499 | 31 (28.7%) | 24 (15.7%) |
| Total | 108 (100.0%) | 153 (100.0%) |
Health & Disability in Centuria
Health Insurance Coverage by Age in Centuria
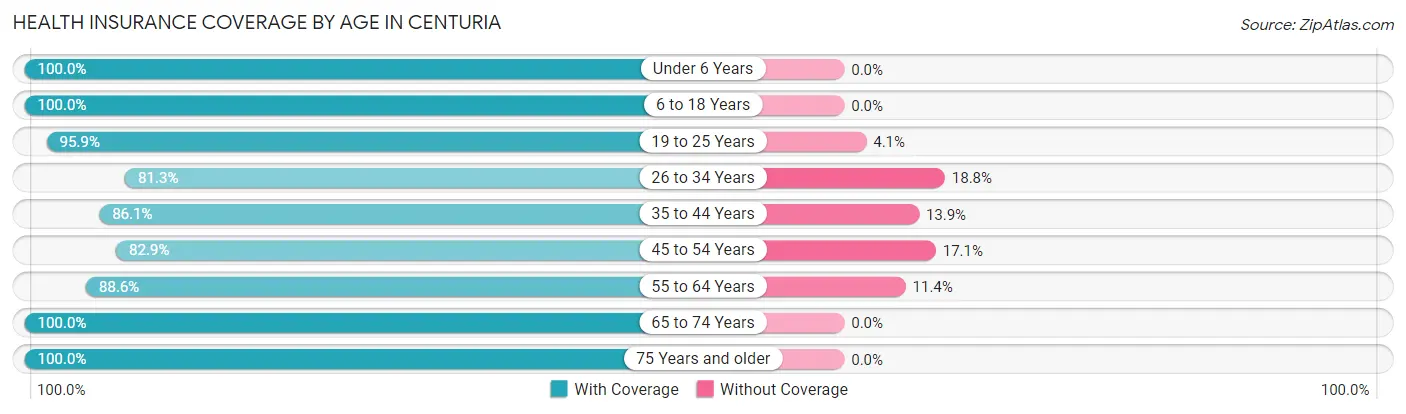
| Age Bracket | With Coverage | Without Coverage |
| Under 6 Years | 55 (100.0%) | 0 (0.0%) |
| 6 to 18 Years | 147 (100.0%) | 0 (0.0%) |
| 19 to 25 Years | 117 (95.9%) | 5 (4.1%) |
| 26 to 34 Years | 52 (81.2%) | 12 (18.8%) |
| 35 to 44 Years | 68 (86.1%) | 11 (13.9%) |
| 45 to 54 Years | 102 (82.9%) | 21 (17.1%) |
| 55 to 64 Years | 178 (88.6%) | 23 (11.4%) |
| 65 to 74 Years | 97 (100.0%) | 0 (0.0%) |
| 75 Years and older | 45 (100.0%) | 0 (0.0%) |
| Total | 861 (92.3%) | 72 (7.7%) |
Health Insurance Coverage by Citizenship Status in Centuria
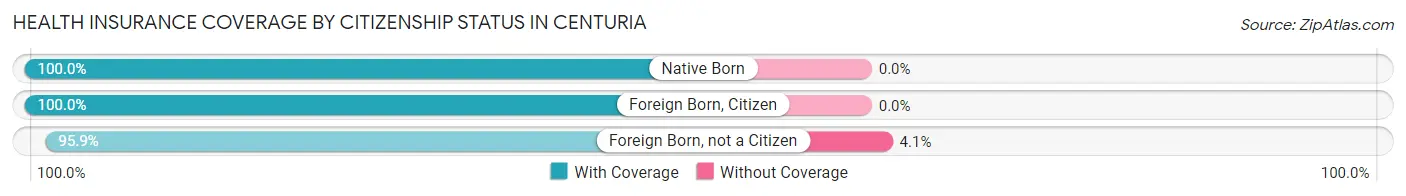
| Citizenship Status | With Coverage | Without Coverage |
| Native Born | 55 (100.0%) | 0 (0.0%) |
| Foreign Born, Citizen | 147 (100.0%) | 0 (0.0%) |
| Foreign Born, not a Citizen | 117 (95.9%) | 5 (4.1%) |
Health Insurance Coverage by Household Income in Centuria
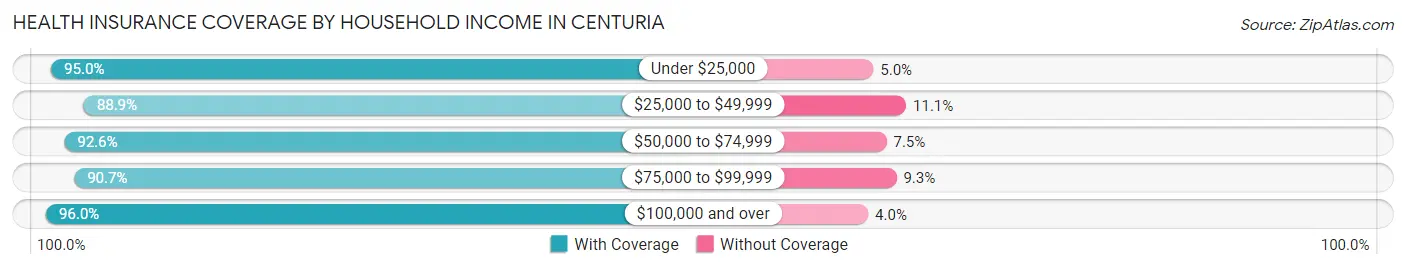
| Household Income | With Coverage | Without Coverage |
| Under $25,000 | 210 (95.0%) | 11 (5.0%) |
| $25,000 to $49,999 | 240 (88.9%) | 30 (11.1%) |
| $50,000 to $74,999 | 174 (92.5%) | 14 (7.4%) |
| $75,000 to $99,999 | 117 (90.7%) | 12 (9.3%) |
| $100,000 and over | 120 (96.0%) | 5 (4.0%) |
Public vs Private Health Insurance Coverage by Age in Centuria
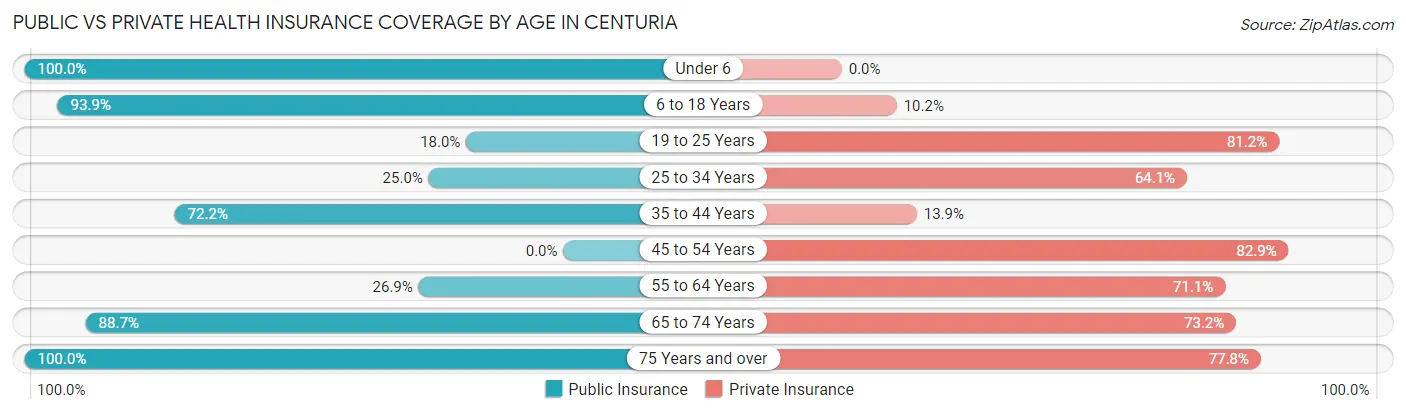
| Age Bracket | Public Insurance | Private Insurance |
| Under 6 | 55 (100.0%) | 0 (0.0%) |
| 6 to 18 Years | 138 (93.9%) | 15 (10.2%) |
| 19 to 25 Years | 22 (18.0%) | 99 (81.1%) |
| 25 to 34 Years | 16 (25.0%) | 41 (64.1%) |
| 35 to 44 Years | 57 (72.2%) | 11 (13.9%) |
| 45 to 54 Years | 0 (0.0%) | 102 (82.9%) |
| 55 to 64 Years | 54 (26.9%) | 143 (71.1%) |
| 65 to 74 Years | 86 (88.7%) | 71 (73.2%) |
| 75 Years and over | 45 (100.0%) | 35 (77.8%) |
| Total | 473 (50.7%) | 517 (55.4%) |
Disability Status by Sex by Age in Centuria
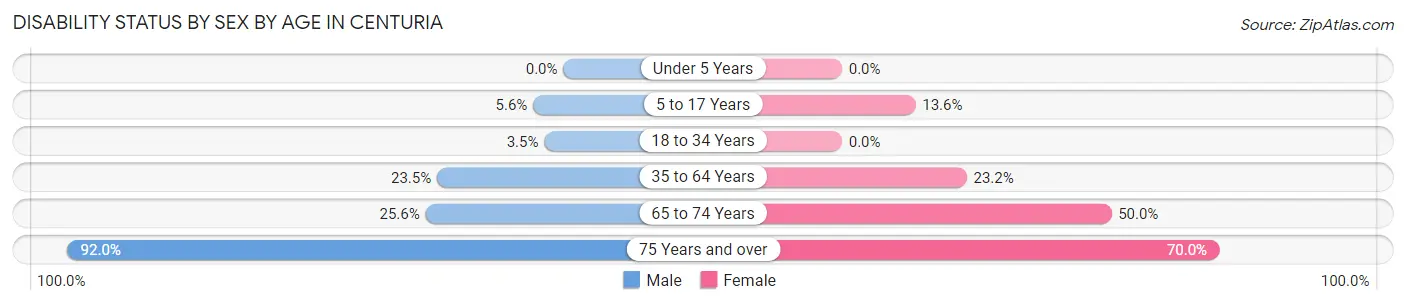
| Age Bracket | Male | Female |
| Under 5 Years | 0 (0.0%) | 0 (0.0%) |
| 5 to 17 Years | 7 (5.6%) | 3 (13.6%) |
| 18 to 34 Years | 4 (3.5%) | 0 (0.0%) |
| 35 to 64 Years | 53 (23.4%) | 41 (23.2%) |
| 65 to 74 Years | 11 (25.6%) | 27 (50.0%) |
| 75 Years and over | 23 (92.0%) | 14 (70.0%) |
Disability Class by Sex by Age in Centuria
Disability Class: Hearing Difficulty
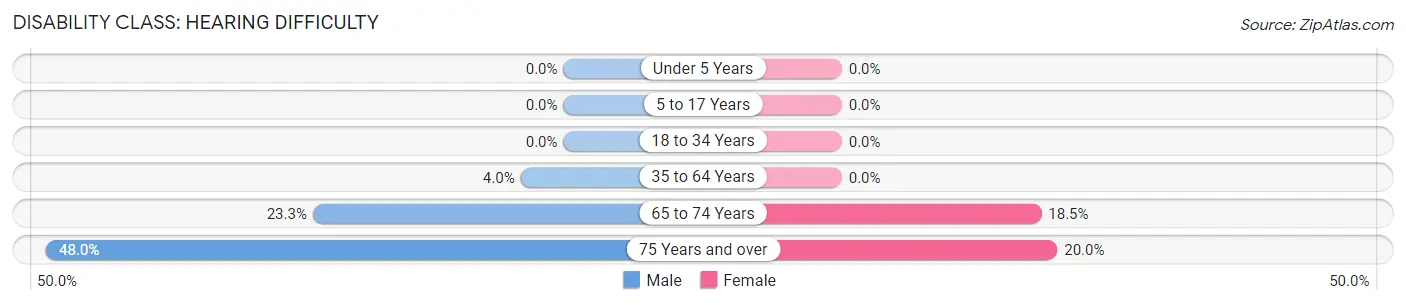
| Age Bracket | Male | Female |
| Under 5 Years | 0 (0.0%) | 0 (0.0%) |
| 5 to 17 Years | 0 (0.0%) | 0 (0.0%) |
| 18 to 34 Years | 0 (0.0%) | 0 (0.0%) |
| 35 to 64 Years | 9 (4.0%) | 0 (0.0%) |
| 65 to 74 Years | 10 (23.3%) | 10 (18.5%) |
| 75 Years and over | 12 (48.0%) | 4 (20.0%) |
Disability Class: Vision Difficulty
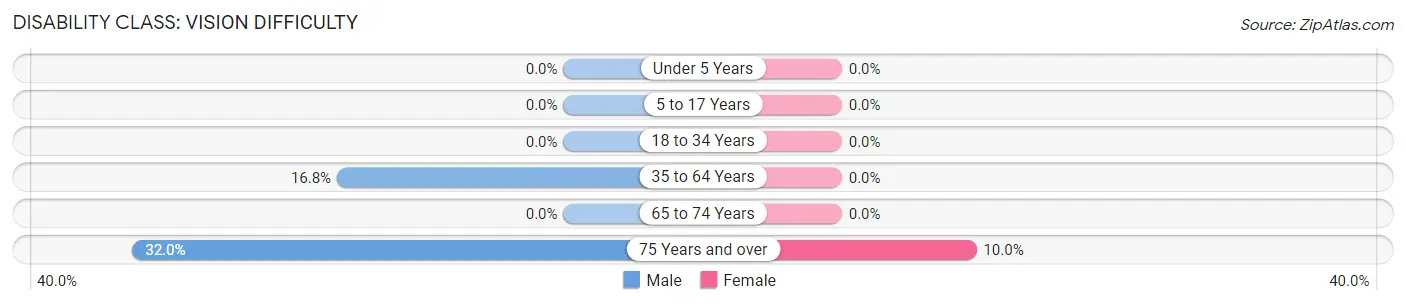
| Age Bracket | Male | Female |
| Under 5 Years | 0 (0.0%) | 0 (0.0%) |
| 5 to 17 Years | 0 (0.0%) | 0 (0.0%) |
| 18 to 34 Years | 0 (0.0%) | 0 (0.0%) |
| 35 to 64 Years | 38 (16.8%) | 0 (0.0%) |
| 65 to 74 Years | 0 (0.0%) | 0 (0.0%) |
| 75 Years and over | 8 (32.0%) | 2 (10.0%) |
Disability Class: Cognitive Difficulty
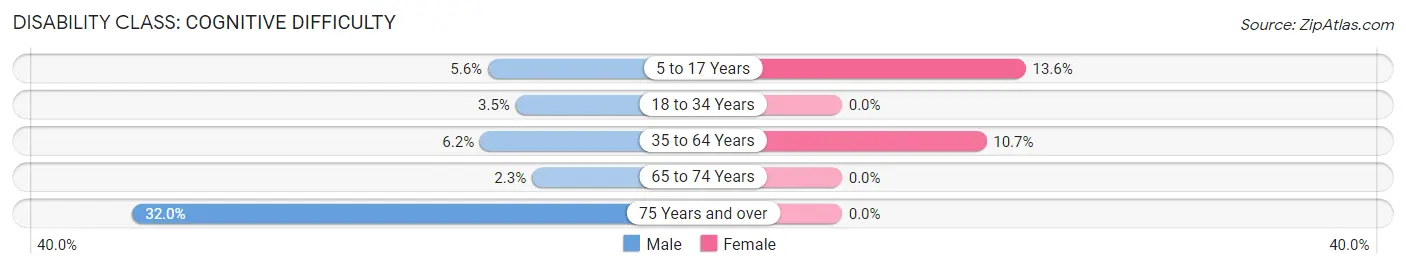
| Age Bracket | Male | Female |
| 5 to 17 Years | 7 (5.6%) | 3 (13.6%) |
| 18 to 34 Years | 4 (3.5%) | 0 (0.0%) |
| 35 to 64 Years | 14 (6.2%) | 19 (10.7%) |
| 65 to 74 Years | 1 (2.3%) | 0 (0.0%) |
| 75 Years and over | 8 (32.0%) | 0 (0.0%) |
Disability Class: Ambulatory Difficulty
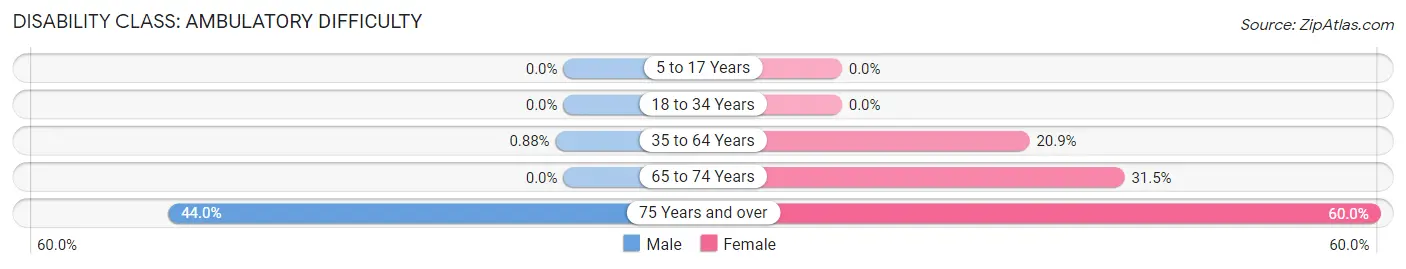
| Age Bracket | Male | Female |
| 5 to 17 Years | 0 (0.0%) | 0 (0.0%) |
| 18 to 34 Years | 0 (0.0%) | 0 (0.0%) |
| 35 to 64 Years | 2 (0.9%) | 37 (20.9%) |
| 65 to 74 Years | 0 (0.0%) | 17 (31.5%) |
| 75 Years and over | 11 (44.0%) | 12 (60.0%) |
Disability Class: Self-Care Difficulty
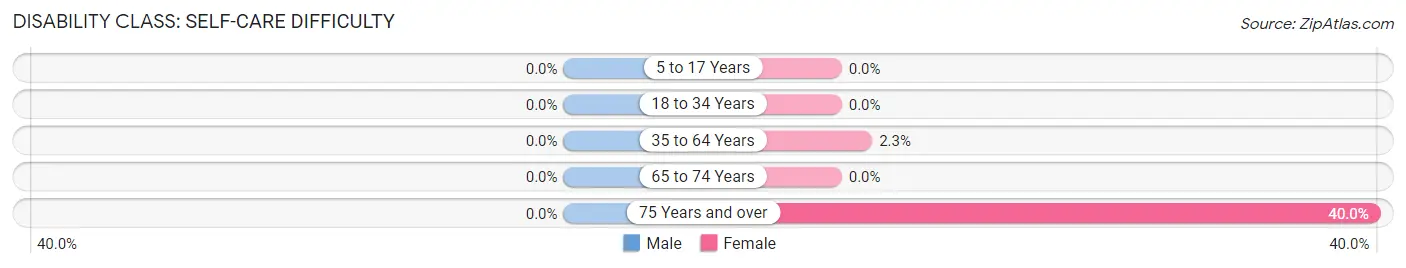
| Age Bracket | Male | Female |
| 5 to 17 Years | 0 (0.0%) | 0 (0.0%) |
| 18 to 34 Years | 0 (0.0%) | 0 (0.0%) |
| 35 to 64 Years | 0 (0.0%) | 4 (2.3%) |
| 65 to 74 Years | 0 (0.0%) | 0 (0.0%) |
| 75 Years and over | 0 (0.0%) | 8 (40.0%) |
Technology Access in Centuria
Computing Device Access in Centuria
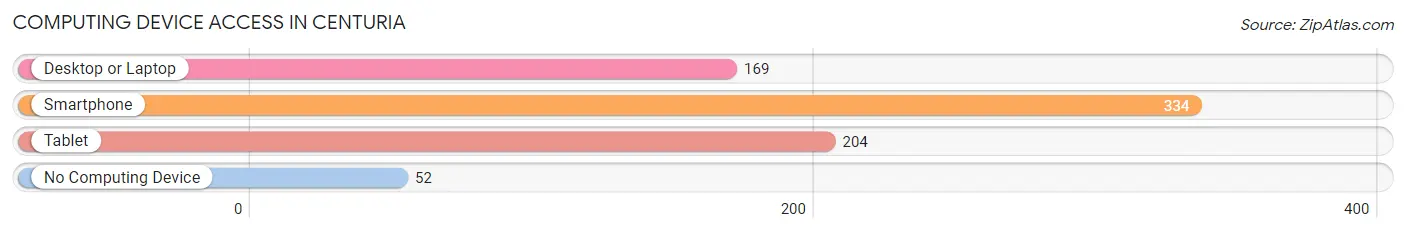
| Device Type | # Households | % Households |
| Desktop or Laptop | 169 | 39.0% |
| Smartphone | 334 | 77.1% |
| Tablet | 204 | 47.1% |
| No Computing Device | 52 | 12.0% |
| Total | 433 | 100.0% |
Internet Access in Centuria
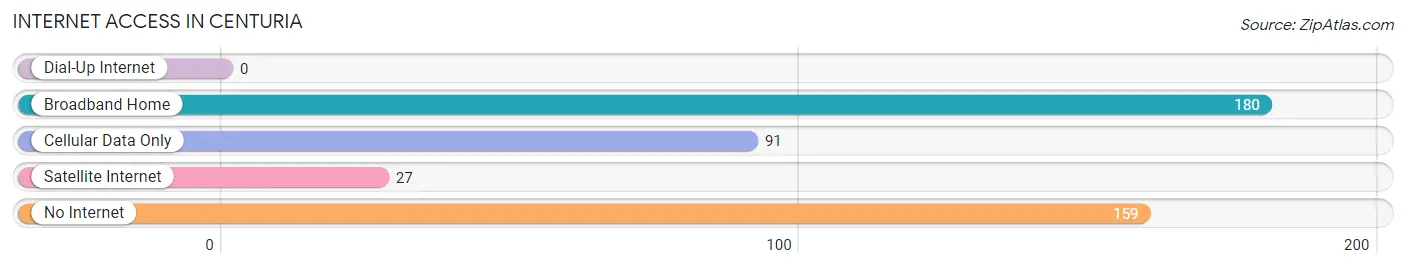
| Internet Type | # Households | % Households |
| Dial-Up Internet | 0 | 0.0% |
| Broadband Home | 180 | 41.6% |
| Cellular Data Only | 91 | 21.0% |
| Satellite Internet | 27 | 6.2% |
| No Internet | 159 | 36.7% |
| Total | 433 | 100.0% |
Centuria Summary
Centuria is a small village located in Polk County, Wisconsin, United States. It is situated on the eastern edge of the county, near the St. Croix River. The village has a population of approximately 1,000 people and is part of the larger St. Croix Valley region.
History
Centuria was founded in 1887 by a group of Norwegian immigrants who had recently arrived in the area. The village was named after the Latin word for “hundred”, as the founders believed that the village would eventually grow to a population of one hundred people. The village was incorporated in 1895 and has remained relatively small since then.
Geography
Centuria is located in the St. Croix Valley region of Wisconsin, near the St. Croix River. The village is situated on the eastern edge of Polk County, and is bordered by the towns of Osceola, St. Croix Falls, and Milltown. The village is located approximately 40 miles northeast of the city of Minneapolis, Minnesota.
The village is situated on a flat plain, with the St. Croix River to the east and the Kinnickinnic River to the west. The terrain is mostly flat, with some rolling hills in the area. The climate is generally mild, with cold winters and warm summers.
Economy
The economy of Centuria is largely based on agriculture and tourism. The village is home to several small farms, which produce a variety of crops, including corn, soybeans, and hay. The village also has several small businesses, including a grocery store, a hardware store, and a few restaurants.
Tourism is an important part of the local economy, as the village is located near several popular attractions, including the St. Croix National Scenic Riverway, the Kinnickinnic State Park, and the Wild River State Park. The village also hosts several annual events, including the Centuria Days Festival and the Centuria Harvest Festival.
Demographics
As of the 2010 census, the population of Centuria was 1,000 people. The racial makeup of the village was 97.2% White, 0.7% African American, 0.3% Native American, 0.2% Asian, 0.1% Pacific Islander, 0.7% from other races, and 0.9% from two or more races. Hispanic or Latino of any race were 1.7% of the population.
The median household income in Centuria was $45,000, and the median family income was $50,000. The per capita income for the village was $20,000. About 8.3% of families and 10.2% of the population were below the poverty line, including 14.3% of those under age 18 and 6.7% of those age 65 or over.
Centuria is a small village with a rich history and a vibrant economy. The village is home to a diverse population and is a popular destination for tourists. The village is a great place to live, work, and play, and is a great example of the beauty and culture of the St. Croix Valley region.
Common Questions
What is Per Capita Income in Centuria?
Per Capita income in Centuria is $31,813.
What is the Median Household income in Centuria?
Median Household Income in Centuria is $35,489.
What is Income or Wage Gap in Centuria?
Income or Wage Gap in Centuria is 51.4%.
Women in Centuria earn 48.6 cents for every dollar earned by a man.
What is Inequality or Gini Index in Centuria?
Inequality or Gini Index in Centuria is 0.52.
What is the Total Population of Centuria?
Total Population of Centuria is 933.
What is the Total Male Population of Centuria?
Total Male Population of Centuria is 579.
What is the Total Female Population of Centuria?
Total Female Population of Centuria is 354.
What is the Ratio of Males per 100 Females in Centuria?
There are 163.56 Males per 100 Females in Centuria.
What is the Ratio of Females per 100 Males in Centuria?
There are 61.14 Females per 100 Males in Centuria.
What is the Median Population Age in Centuria?
Median Population Age in Centuria is 44.9 Years.
What is the Average Family Size in Centuria
Average Family Size in Centuria is 2.9 People.
What is the Average Household Size in Centuria
Average Household Size in Centuria is 2.1 People.
How Large is the Labor Force in Centuria?
There are 562 People in the Labor Forcein in Centuria.
What is the Percentage of People in the Labor Force in Centuria?
72.1% of People are in the Labor Force in Centuria.
What is the Unemployment Rate in Centuria?
Unemployment Rate in Centuria is 11.2%.