Cataract, WI Map & Demographics
Cataract Map
Cataract Overview
$27,786
PER CAPITA INCOME
$71,250
AVG FAMILY INCOME
$64,583
AVG HOUSEHOLD INCOME
21.1%
WAGE / INCOME GAP [ % ]
78.9¢/ $1
WAGE / INCOME GAP [ $ ]
0.25
INEQUALITY / GINI INDEX
174
TOTAL POPULATION
93
MALE POPULATION
81
FEMALE POPULATION
114.81
MALES / 100 FEMALES
87.10
FEMALES / 100 MALES
31.8
MEDIAN AGE
3.4
AVG FAMILY SIZE
2.5
AVG HOUSEHOLD SIZE
101
LABOR FORCE [ PEOPLE ]
79.5%
PERCENT IN LABOR FORCE
Cataract Area Codes
Income in Cataract
Income Overview in Cataract
Per Capita Income in Cataract is $27,786, while median incomes of families and households are $71,250 and $64,583 respectively.
| Characteristic | Number | Measure |
| Per Capita Income | 174 | $27,786 |
| Median Family Income | 30 | $71,250 |
| Mean Family Income | 30 | $71,337 |
| Median Household Income | 69 | $64,583 |
| Mean Household Income | 69 | $68,004 |
| Income Deficit | 30 | $0 |
| Wage / Income Gap (%) | 174 | 21.05% |
| Wage / Income Gap ($) | 174 | 78.95¢ per $1 |
| Gini / Inequality Index | 174 | 0.25 |
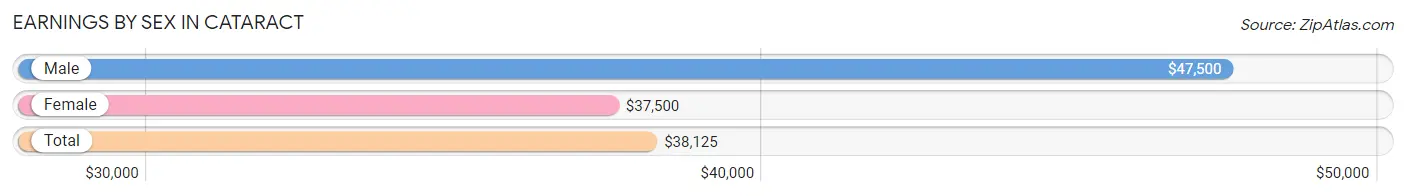
Earnings by Sex in Cataract
Average Earnings in Cataract are $38,125, $47,500 for men and $37,500 for women, a difference of 21.0%.
| Sex | Number | Average Earnings |
| Male | 50 (45.5%) | $47,500 |
| Female | 60 (54.5%) | $37,500 |
| Total | 110 (100.0%) | $38,125 |
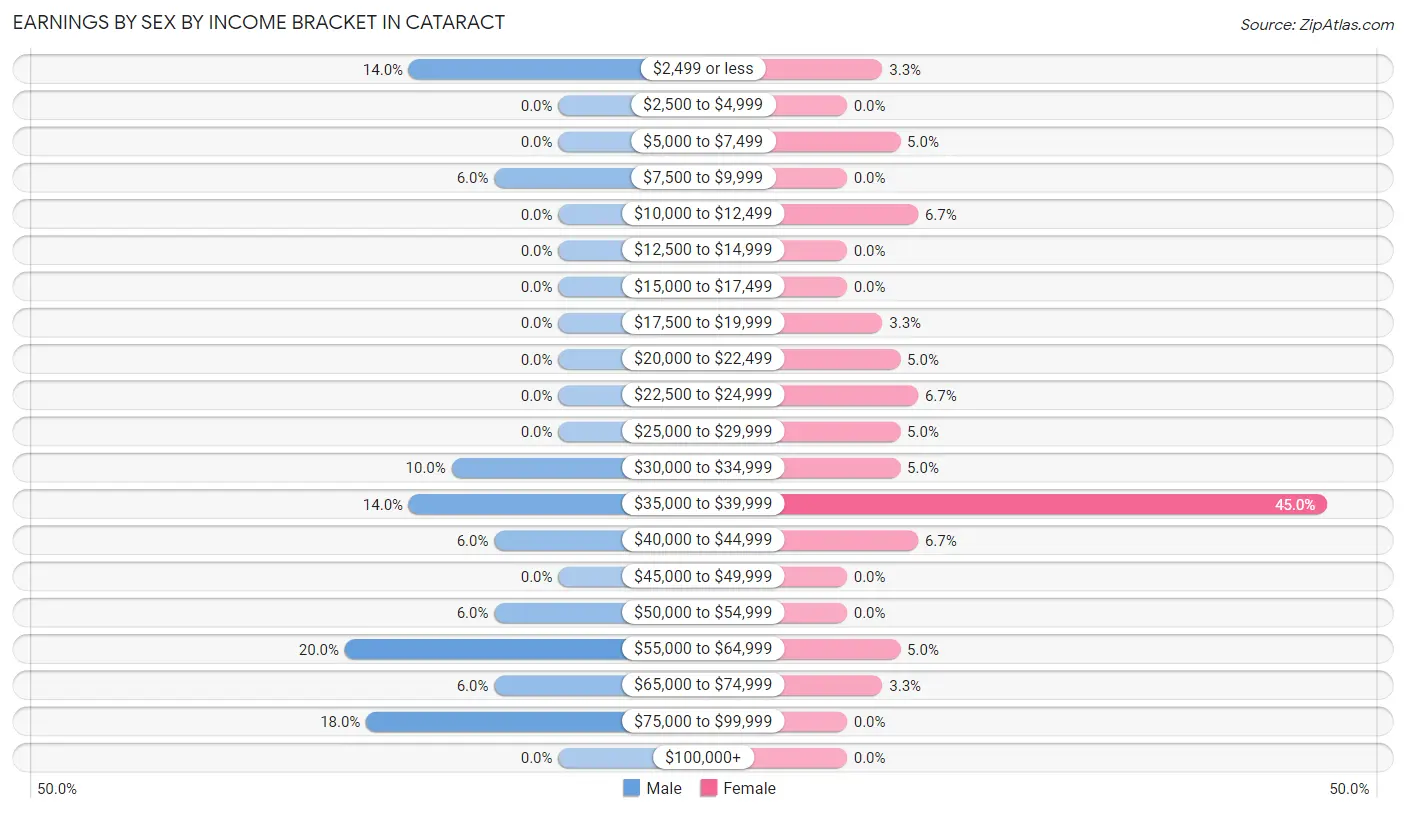
Earnings by Sex by Income Bracket in Cataract
The most common earnings brackets in Cataract are $55,000 to $64,999 for men (10 | 20.0%) and $35,000 to $39,999 for women (27 | 45.0%).
| Income | Male | Female |
| $2,499 or less | 7 (14.0%) | 2 (3.3%) |
| $2,500 to $4,999 | 0 (0.0%) | 0 (0.0%) |
| $5,000 to $7,499 | 0 (0.0%) | 3 (5.0%) |
| $7,500 to $9,999 | 3 (6.0%) | 0 (0.0%) |
| $10,000 to $12,499 | 0 (0.0%) | 4 (6.7%) |
| $12,500 to $14,999 | 0 (0.0%) | 0 (0.0%) |
| $15,000 to $17,499 | 0 (0.0%) | 0 (0.0%) |
| $17,500 to $19,999 | 0 (0.0%) | 2 (3.3%) |
| $20,000 to $22,499 | 0 (0.0%) | 3 (5.0%) |
| $22,500 to $24,999 | 0 (0.0%) | 4 (6.7%) |
| $25,000 to $29,999 | 0 (0.0%) | 3 (5.0%) |
| $30,000 to $34,999 | 5 (10.0%) | 3 (5.0%) |
| $35,000 to $39,999 | 7 (14.0%) | 27 (45.0%) |
| $40,000 to $44,999 | 3 (6.0%) | 4 (6.7%) |
| $45,000 to $49,999 | 0 (0.0%) | 0 (0.0%) |
| $50,000 to $54,999 | 3 (6.0%) | 0 (0.0%) |
| $55,000 to $64,999 | 10 (20.0%) | 3 (5.0%) |
| $65,000 to $74,999 | 3 (6.0%) | 2 (3.3%) |
| $75,000 to $99,999 | 9 (18.0%) | 0 (0.0%) |
| $100,000+ | 0 (0.0%) | 0 (0.0%) |
| Total | 50 (100.0%) | 60 (100.0%) |
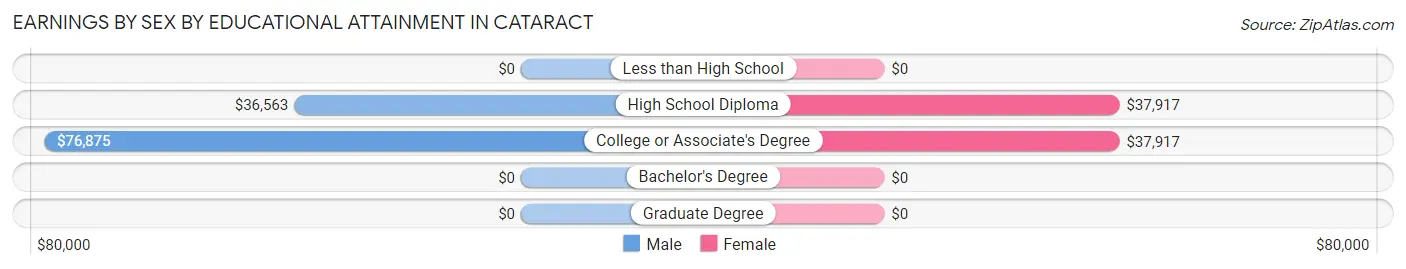
Earnings by Sex by Educational Attainment in Cataract
Average earnings in Cataract are $55,000 for men and $37,986 for women, a difference of 30.9%. Men with an educational attainment of college or associate's degree enjoy the highest average annual earnings of $76,875, while those with high school diploma education earn the least with $36,563. Women with an educational attainment of high school diploma earn the most with the average annual earnings of $37,917, while those with high school diploma education have the smallest earnings of $37,917.
| Educational Attainment | Male Income | Female Income |
| Less than High School | - | - |
| High School Diploma | $36,563 | $37,917 |
| College or Associate's Degree | $76,875 | $37,917 |
| Bachelor's Degree | - | - |
| Graduate Degree | - | - |
| Total | $55,000 | $37,986 |
Family Income in Cataract
Family Income Brackets in Cataract
According to the Cataract family income data, there are 11 families falling into the $50,000 to $74,999 income range, which is the most common income bracket and makes up 36.7% of all families.
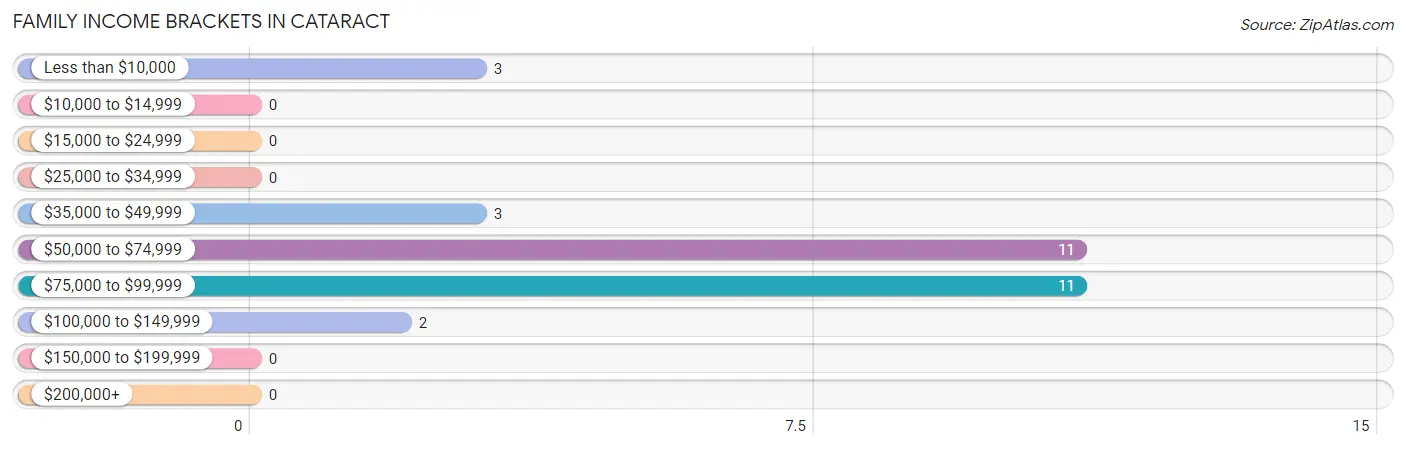
| Income Bracket | # Families | % Families |
| Less than $10,000 | 3 | 10.0% |
| $10,000 to $14,999 | 0 | 0.0% |
| $15,000 to $24,999 | 0 | 0.0% |
| $25,000 to $34,999 | 0 | 0.0% |
| $35,000 to $49,999 | 3 | 10.0% |
| $50,000 to $74,999 | 11 | 36.7% |
| $75,000 to $99,999 | 11 | 36.7% |
| $100,000 to $149,999 | 2 | 6.7% |
| $150,000 to $199,999 | 0 | 0.0% |
| $200,000+ | 0 | 0.0% |
Family Income by Famaliy Size in Cataract
3-person families (8 | 26.7%) account for the highest median family income in Cataract with $68,333 per family, while 2-person families (12 | 40.0%) have the highest median income of $30,625 per family member.
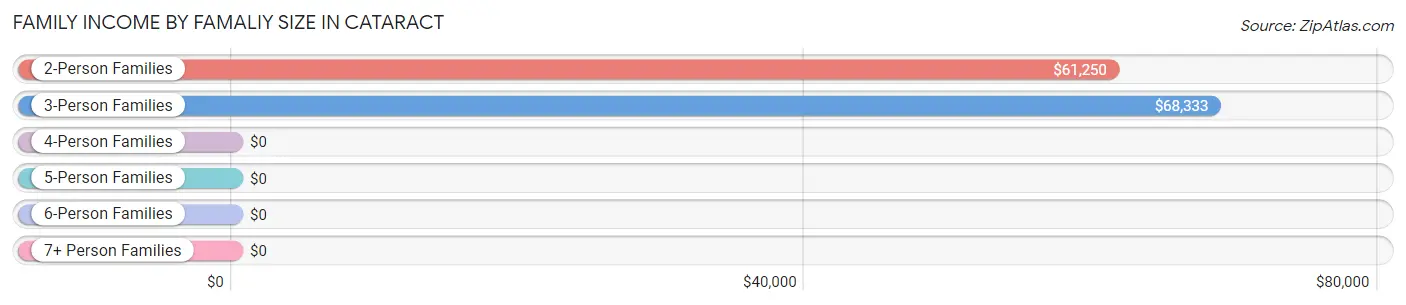
| Income Bracket | # Families | Median Income |
| 2-Person Families | 12 (40.0%) | $61,250 |
| 3-Person Families | 8 (26.7%) | $68,333 |
| 4-Person Families | 5 (16.7%) | $0 |
| 5-Person Families | 0 (0.0%) | $0 |
| 6-Person Families | 5 (16.7%) | $0 |
| 7+ Person Families | 0 (0.0%) | $0 |
| Total | 30 (100.0%) | $71,250 |
Family Income by Number of Earners in Cataract
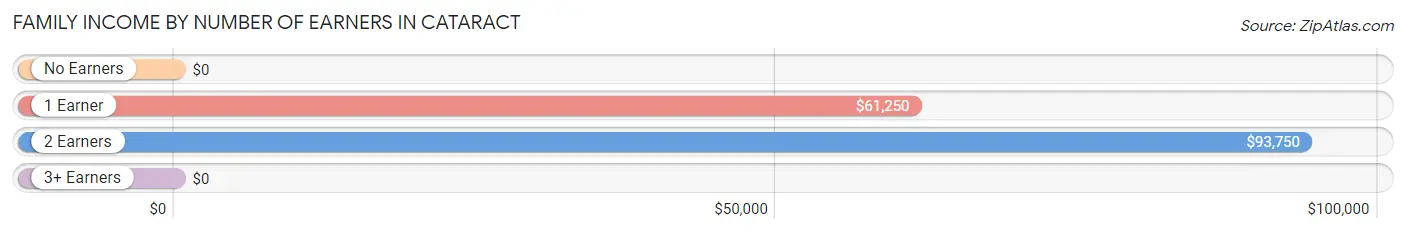
| Number of Earners | # Families | Median Income |
| No Earners | 0 (0.0%) | $0 |
| 1 Earner | 18 (60.0%) | $61,250 |
| 2 Earners | 7 (23.3%) | $93,750 |
| 3+ Earners | 5 (16.7%) | $0 |
| Total | 30 (100.0%) | $71,250 |
Household Income in Cataract
Household Income Brackets in Cataract
With 21 households falling in the category, the $75,000 to $99,999 income range is the most frequent in Cataract, accounting for 30.4% of all households.
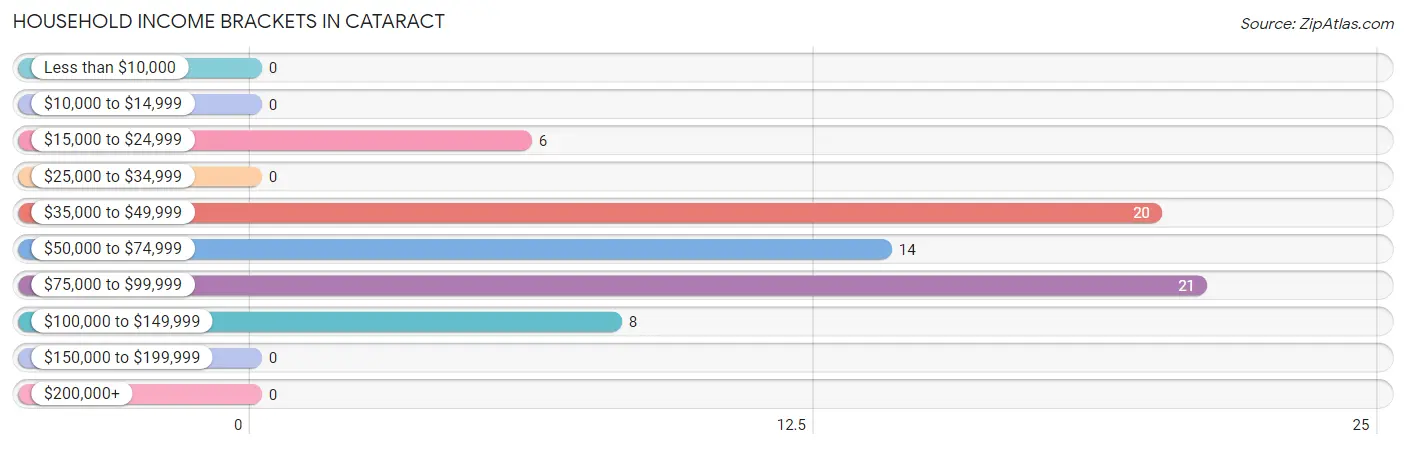
| Income Bracket | # Households | % Households |
| Less than $10,000 | 0 | 0.0% |
| $10,000 to $14,999 | 0 | 0.0% |
| $15,000 to $24,999 | 6 | 8.7% |
| $25,000 to $34,999 | 0 | 0.0% |
| $35,000 to $49,999 | 20 | 29.0% |
| $50,000 to $74,999 | 14 | 20.3% |
| $75,000 to $99,999 | 21 | 30.4% |
| $100,000 to $149,999 | 8 | 11.6% |
| $150,000 to $199,999 | 0 | 0.0% |
| $200,000+ | 0 | 0.0% |
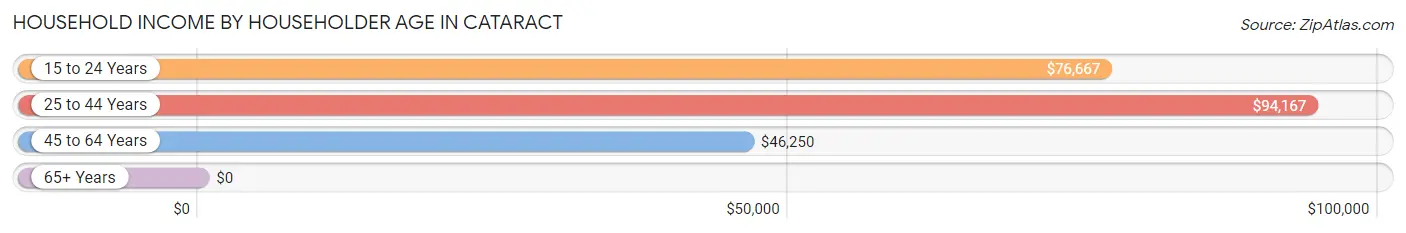
Household Income by Householder Age in Cataract
The median household income in Cataract is $64,583, with the highest median household income of $94,167 found in the 25 to 44 years age bracket for the primary householder. A total of 12 households (17.4%) fall into this category. Meanwhile, the 65+ years age bracket for the primary householder has the lowest median household income of $0, with 6 households (8.7%) in this group.
| Income Bracket | # Households | Median Income |
| 15 to 24 Years | 10 (14.5%) | $76,667 |
| 25 to 44 Years | 12 (17.4%) | $94,167 |
| 45 to 64 Years | 41 (59.4%) | $46,250 |
| 65+ Years | 6 (8.7%) | $0 |
| Total | 69 (100.0%) | $64,583 |
Poverty in Cataract
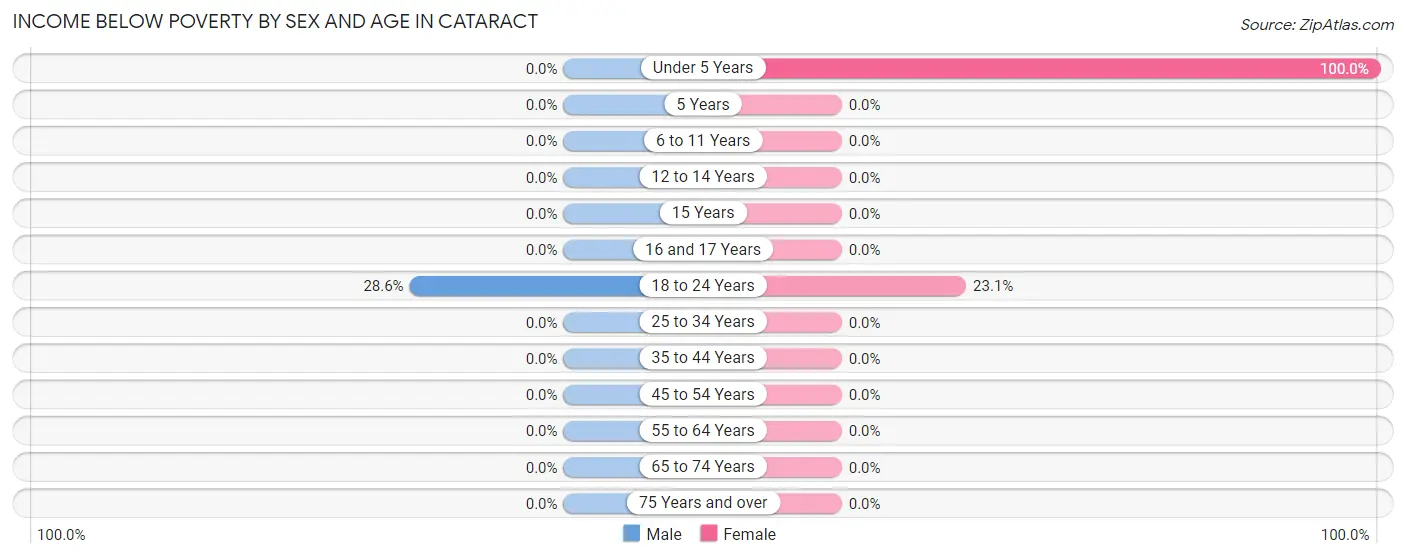
Income Below Poverty by Sex and Age in Cataract
With 4.8% poverty level for males and 7.4% for females among the residents of Cataract, 18 to 24 year old males and under 5 year old females are the most vulnerable to poverty, with 4 males (28.6%) and 3 females (100.0%) in their respective age groups living below the poverty level.
| Age Bracket | Male | Female |
| Under 5 Years | 0 (0.0%) | 3 (100.0%) |
| 5 Years | 0 (0.0%) | 0 (0.0%) |
| 6 to 11 Years | 0 (0.0%) | 0 (0.0%) |
| 12 to 14 Years | 0 (0.0%) | 0 (0.0%) |
| 15 Years | 0 (0.0%) | 0 (0.0%) |
| 16 and 17 Years | 0 (0.0%) | 0 (0.0%) |
| 18 to 24 Years | 4 (28.6%) | 3 (23.1%) |
| 25 to 34 Years | 0 (0.0%) | 0 (0.0%) |
| 35 to 44 Years | 0 (0.0%) | 0 (0.0%) |
| 45 to 54 Years | 0 (0.0%) | 0 (0.0%) |
| 55 to 64 Years | 0 (0.0%) | 0 (0.0%) |
| 65 to 74 Years | 0 (0.0%) | 0 (0.0%) |
| 75 Years and over | 0 (0.0%) | 0 (0.0%) |
| Total | 4 (4.8%) | 6 (7.4%) |
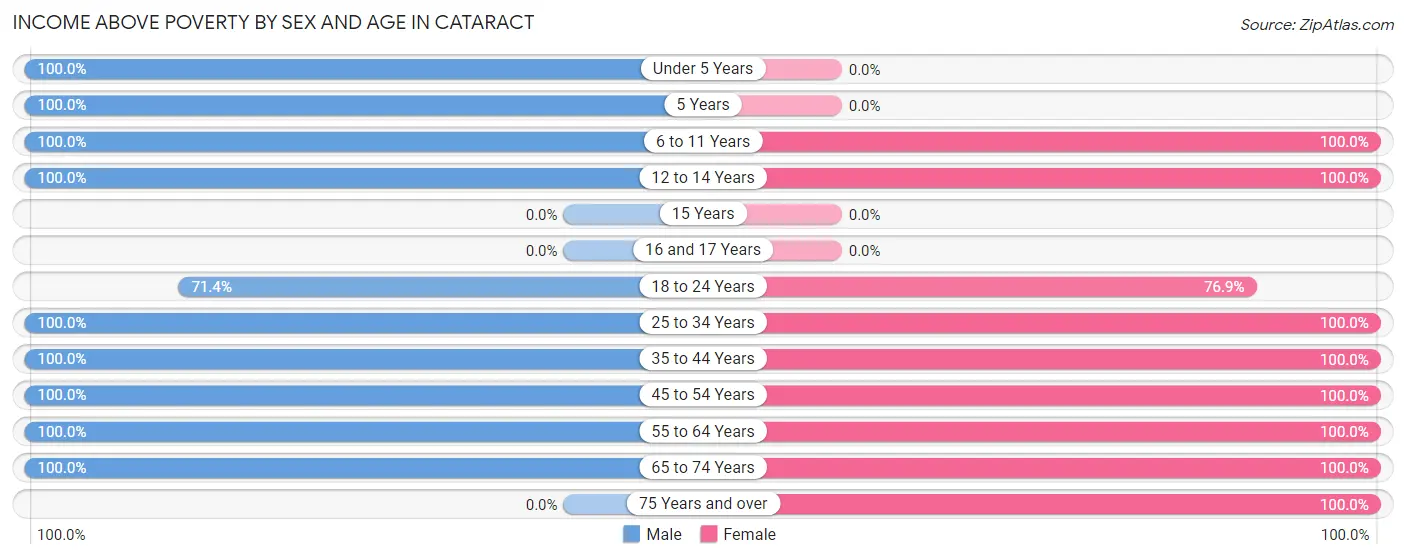
Income Above Poverty by Sex and Age in Cataract
According to the poverty statistics in Cataract, males aged under 5 years and females aged 6 to 11 years are the age groups that are most secure financially, with 100.0% of males and 100.0% of females in these age groups living above the poverty line.
| Age Bracket | Male | Female |
| Under 5 Years | 6 (100.0%) | 0 (0.0%) |
| 5 Years | 4 (100.0%) | 0 (0.0%) |
| 6 to 11 Years | 6 (100.0%) | 9 (100.0%) |
| 12 to 14 Years | 7 (100.0%) | 3 (100.0%) |
| 15 Years | 0 (0.0%) | 0 (0.0%) |
| 16 and 17 Years | 0 (0.0%) | 0 (0.0%) |
| 18 to 24 Years | 10 (71.4%) | 10 (76.9%) |
| 25 to 34 Years | 8 (100.0%) | 9 (100.0%) |
| 35 to 44 Years | 2 (100.0%) | 7 (100.0%) |
| 45 to 54 Years | 13 (100.0%) | 23 (100.0%) |
| 55 to 64 Years | 21 (100.0%) | 9 (100.0%) |
| 65 to 74 Years | 3 (100.0%) | 2 (100.0%) |
| 75 Years and over | 0 (0.0%) | 3 (100.0%) |
| Total | 80 (95.2%) | 75 (92.6%) |
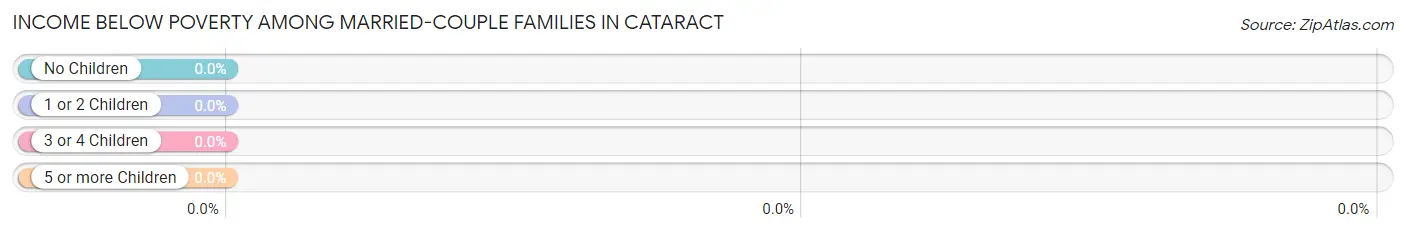
Income Below Poverty Among Married-Couple Families in Cataract
| Children | Above Poverty | Below Poverty |
| No Children | 9 (100.0%) | 0 (0.0%) |
| 1 or 2 Children | 10 (100.0%) | 0 (0.0%) |
| 3 or 4 Children | 2 (100.0%) | 0 (0.0%) |
| 5 or more Children | 0 (0.0%) | 0 (0.0%) |
| Total | 21 (100.0%) | 0 (0.0%) |
Income Below Poverty Among Single-Parent Households in Cataract
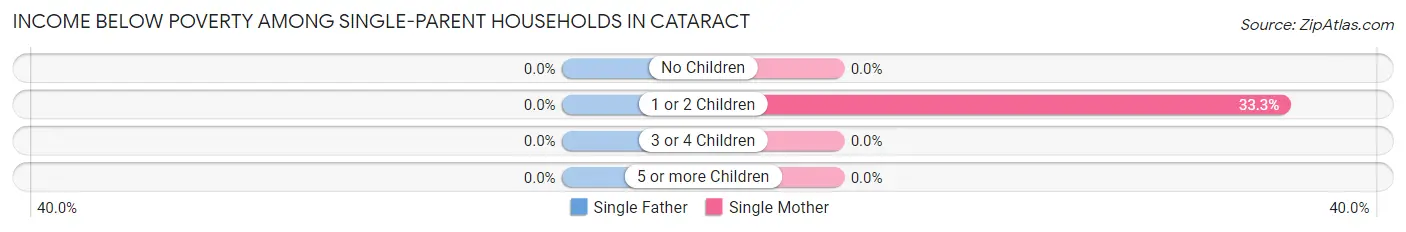
| Children | Single Father | Single Mother |
| No Children | 0 (0.0%) | 0 (0.0%) |
| 1 or 2 Children | 0 (0.0%) | 3 (33.3%) |
| 3 or 4 Children | 0 (0.0%) | 0 (0.0%) |
| 5 or more Children | 0 (0.0%) | 0 (0.0%) |
| Total | 0 (0.0%) | 3 (33.3%) |
Income Below Poverty Among Married-Couple vs Single-Parent Households in Cataract
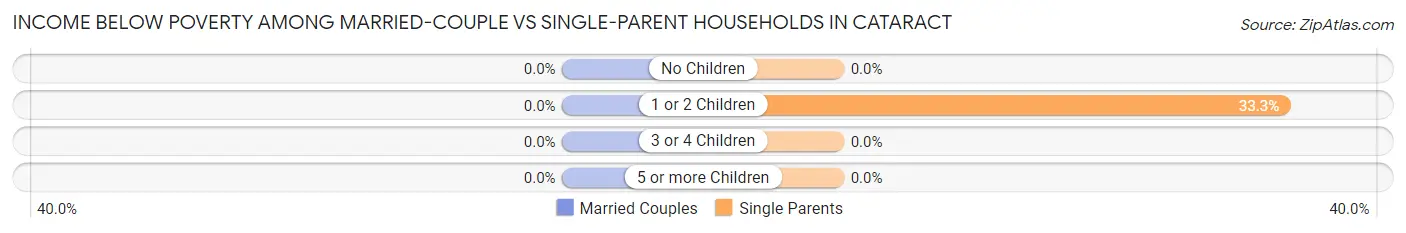
| Children | Married-Couple Families | Single-Parent Households |
| No Children | 0 (0.0%) | 0 (0.0%) |
| 1 or 2 Children | 0 (0.0%) | 3 (33.3%) |
| 3 or 4 Children | 0 (0.0%) | 0 (0.0%) |
| 5 or more Children | 0 (0.0%) | 0 (0.0%) |
| Total | 0 (0.0%) | 3 (33.3%) |
Race in Cataract
The most populous races in Cataract are White / Caucasian (161 | 92.5%), and Black / African American (13 | 7.5%).
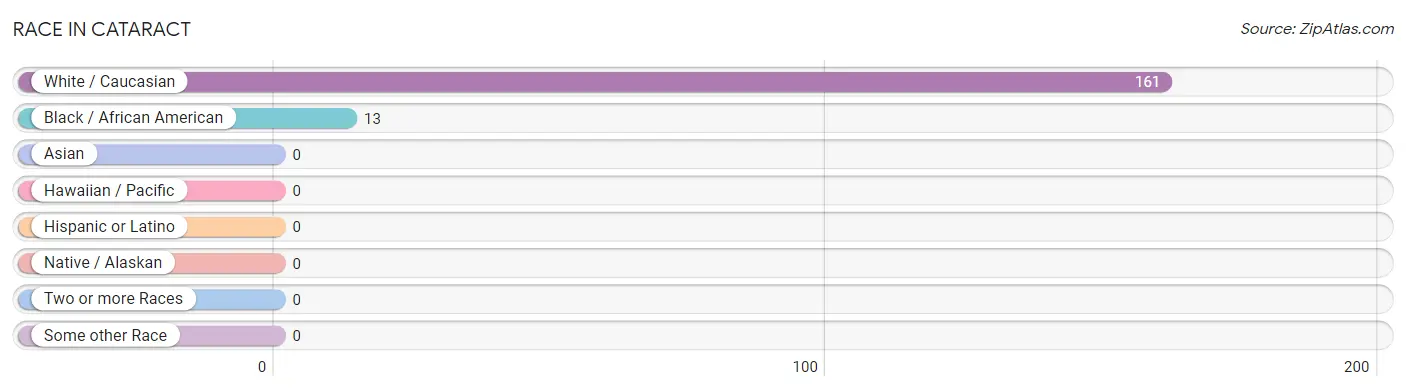
| Race | # Population | % Population |
| Asian | 0 | 0.0% |
| Black / African American | 13 | 7.5% |
| Hawaiian / Pacific | 0 | 0.0% |
| Hispanic or Latino | 0 | 0.0% |
| Native / Alaskan | 0 | 0.0% |
| White / Caucasian | 161 | 92.5% |
| Two or more Races | 0 | 0.0% |
| Some other Race | 0 | 0.0% |
| Total | 174 | 100.0% |
Ancestry in Cataract
The most populous ancestries reported in Cataract are German (58 | 33.3%), Norwegian (21 | 12.1%), American (10 | 5.8%), English (9 | 5.2%), and Czechoslovakian (6 | 3.5%), together accounting for 59.8% of all Cataract residents.
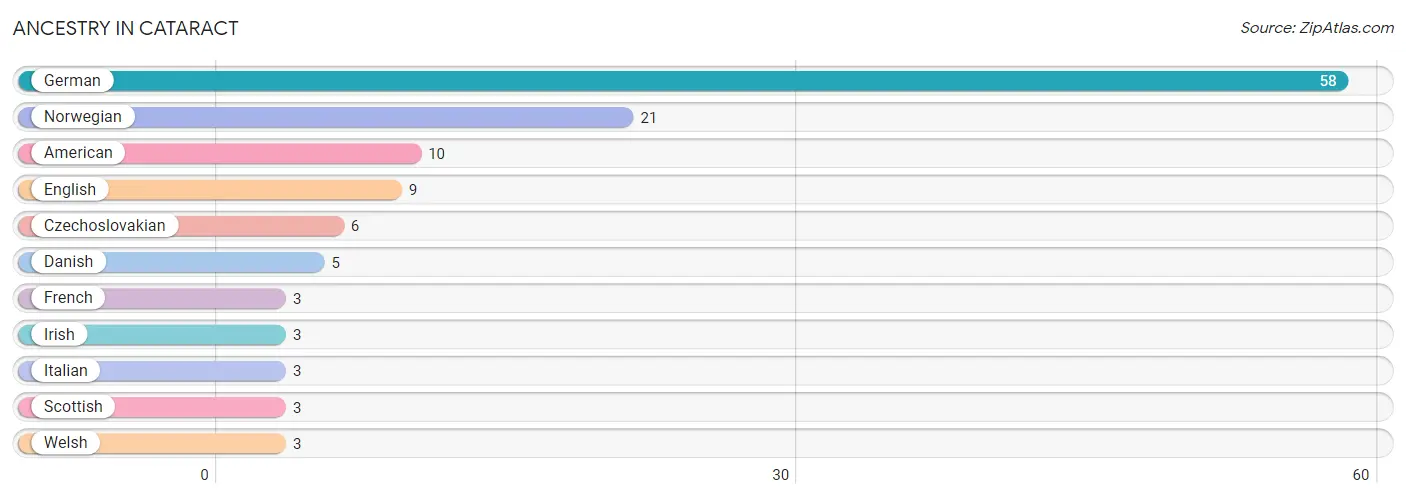
| Ancestry | # Population | % Population |
| American | 10 | 5.8% |
| Czechoslovakian | 6 | 3.5% |
| Danish | 5 | 2.9% |
| English | 9 | 5.2% |
| French | 3 | 1.7% |
| German | 58 | 33.3% |
| Irish | 3 | 1.7% |
| Italian | 3 | 1.7% |
| Norwegian | 21 | 12.1% |
| Scottish | 3 | 1.7% |
| Welsh | 3 | 1.7% | View All 11 Rows |
Immigrants in Cataract

| Immigration Origin | # Population | % Population | View All 0 Rows |
Sex and Age in Cataract
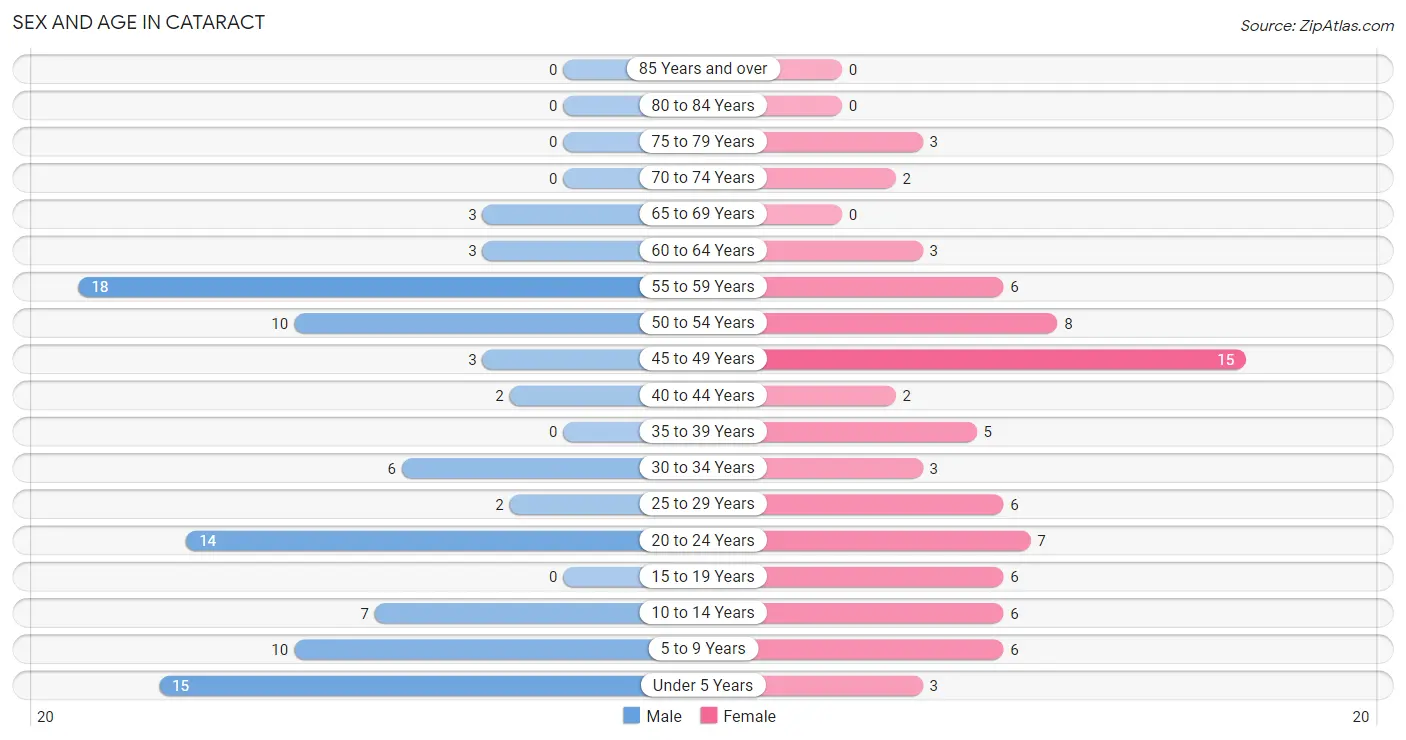
Sex and Age in Cataract
The most populous age groups in Cataract are 55 to 59 Years (18 | 19.4%) for men and 45 to 49 Years (15 | 18.5%) for women.
| Age Bracket | Male | Female |
| Under 5 Years | 15 (16.1%) | 3 (3.7%) |
| 5 to 9 Years | 10 (10.7%) | 6 (7.4%) |
| 10 to 14 Years | 7 (7.5%) | 6 (7.4%) |
| 15 to 19 Years | 0 (0.0%) | 6 (7.4%) |
| 20 to 24 Years | 14 (15.0%) | 7 (8.6%) |
| 25 to 29 Years | 2 (2.1%) | 6 (7.4%) |
| 30 to 34 Years | 6 (6.5%) | 3 (3.7%) |
| 35 to 39 Years | 0 (0.0%) | 5 (6.2%) |
| 40 to 44 Years | 2 (2.1%) | 2 (2.5%) |
| 45 to 49 Years | 3 (3.2%) | 15 (18.5%) |
| 50 to 54 Years | 10 (10.7%) | 8 (9.9%) |
| 55 to 59 Years | 18 (19.4%) | 6 (7.4%) |
| 60 to 64 Years | 3 (3.2%) | 3 (3.7%) |
| 65 to 69 Years | 3 (3.2%) | 0 (0.0%) |
| 70 to 74 Years | 0 (0.0%) | 2 (2.5%) |
| 75 to 79 Years | 0 (0.0%) | 3 (3.7%) |
| 80 to 84 Years | 0 (0.0%) | 0 (0.0%) |
| 85 Years and over | 0 (0.0%) | 0 (0.0%) |
| Total | 93 (100.0%) | 81 (100.0%) |
Families and Households in Cataract
Median Family Size in Cataract
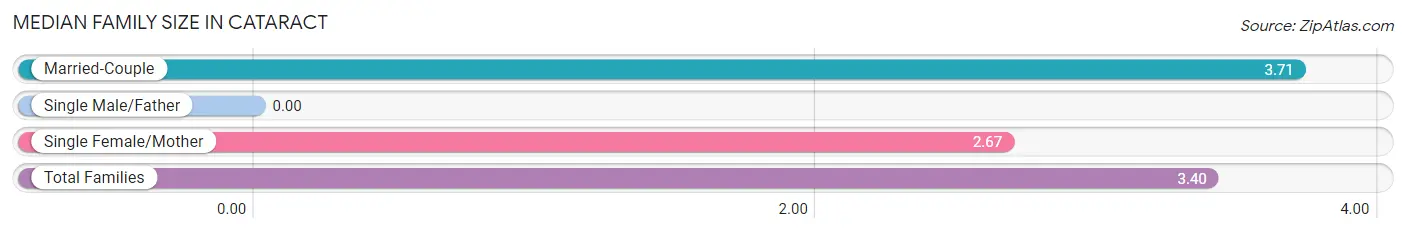
| Family Type | # Families | Family Size |
| Married-Couple | 21 (70.0%) | 3.71 |
| Single Male/Father | 0 (0.0%) | - |
| Single Female/Mother | 9 (30.0%) | 2.67 |
| Total Families | 30 (100.0%) | 3.40 |
Median Household Size in Cataract
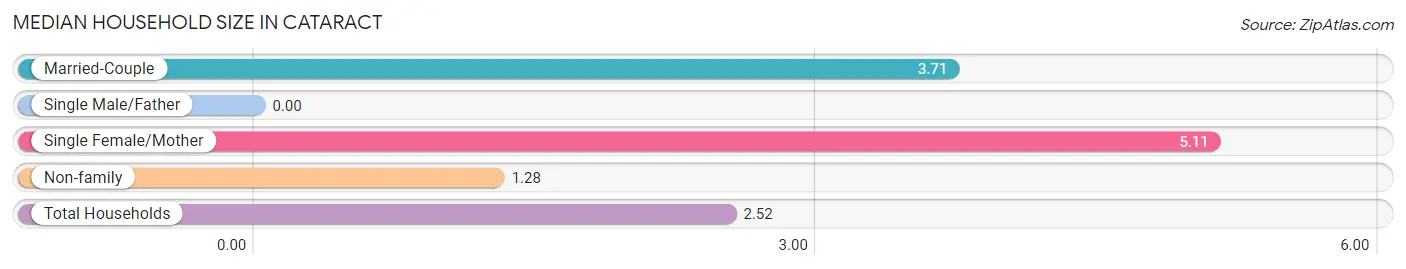
| Household Type | # Households | Household Size |
| Married-Couple | 21 (30.4%) | 3.71 |
| Single Male/Father | 0 (0.0%) | - |
| Single Female/Mother | 9 (13.0%) | 5.11 |
| Non-family | 39 (56.5%) | 1.28 |
| Total Households | 69 (100.0%) | 2.52 |
Household Size by Marriage Status in Cataract
Out of a total of 69 households in Cataract, 30 (43.5%) are family households, while 39 (56.5%) are nonfamily households. The most numerous type of family households are 4-person households, comprising 11, and the most common type of nonfamily households are 1-person households, comprising 29.
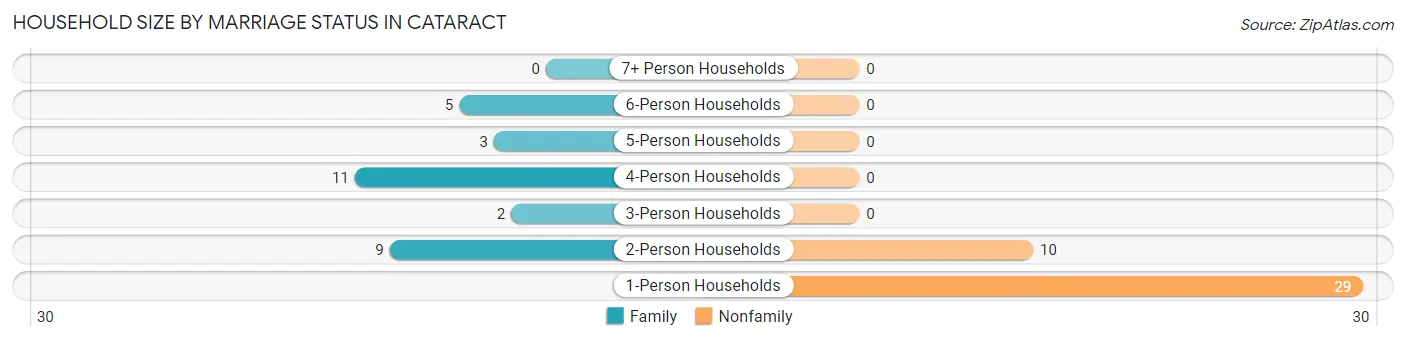
| Household Size | Family Households | Nonfamily Households |
| 1-Person Households | - | 29 (42.0%) |
| 2-Person Households | 9 (13.0%) | 10 (14.5%) |
| 3-Person Households | 2 (2.9%) | 0 (0.0%) |
| 4-Person Households | 11 (15.9%) | 0 (0.0%) |
| 5-Person Households | 3 (4.3%) | 0 (0.0%) |
| 6-Person Households | 5 (7.2%) | 0 (0.0%) |
| 7+ Person Households | 0 (0.0%) | 0 (0.0%) |
| Total | 30 (43.5%) | 39 (56.5%) |
Female Fertility in Cataract
Fertility by Age in Cataract
Average fertility rate in Cataract is 65.0 births per 1,000 women. Women in the age bracket of 15 to 19 years have the highest fertility rate with 500.0 births per 1,000 women. Women in the age bracket of 15 to 19 years acount for 100.0% of all women with births.
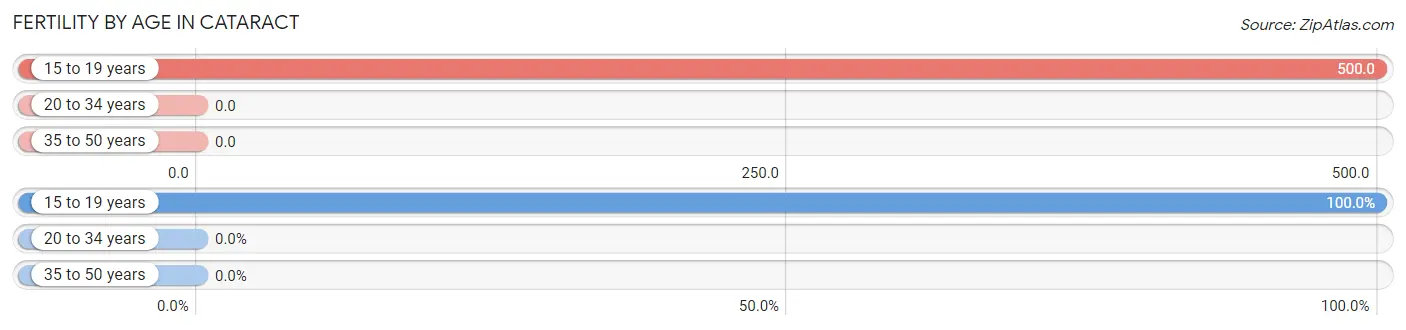
| Age Bracket | Women with Births | Births / 1,000 Women |
| 15 to 19 years | 3 (100.0%) | 500.0 |
| 20 to 34 years | 0 (0.0%) | 0.0 |
| 35 to 50 years | 0 (0.0%) | 0.0 |
| Total | 3 (100.0%) | 65.0 |
Fertility by Age by Marriage Status in Cataract
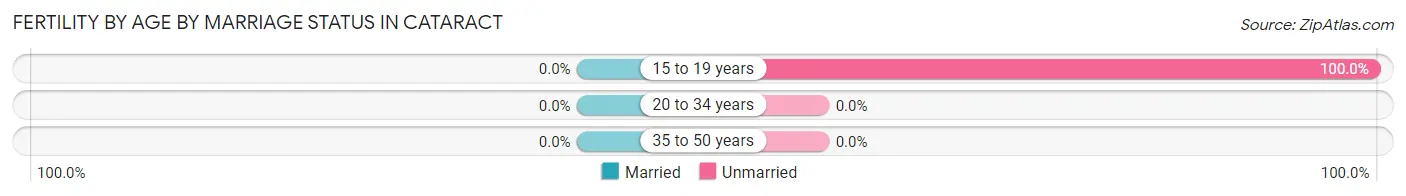
| Age Bracket | Married | Unmarried |
| 15 to 19 years | 0 (0.0%) | 3 (100.0%) |
| 20 to 34 years | 0 (0.0%) | 0 (0.0%) |
| 35 to 50 years | 0 (0.0%) | 0 (0.0%) |
| Total | 0 (0.0%) | 3 (100.0%) |
Fertility by Education in Cataract
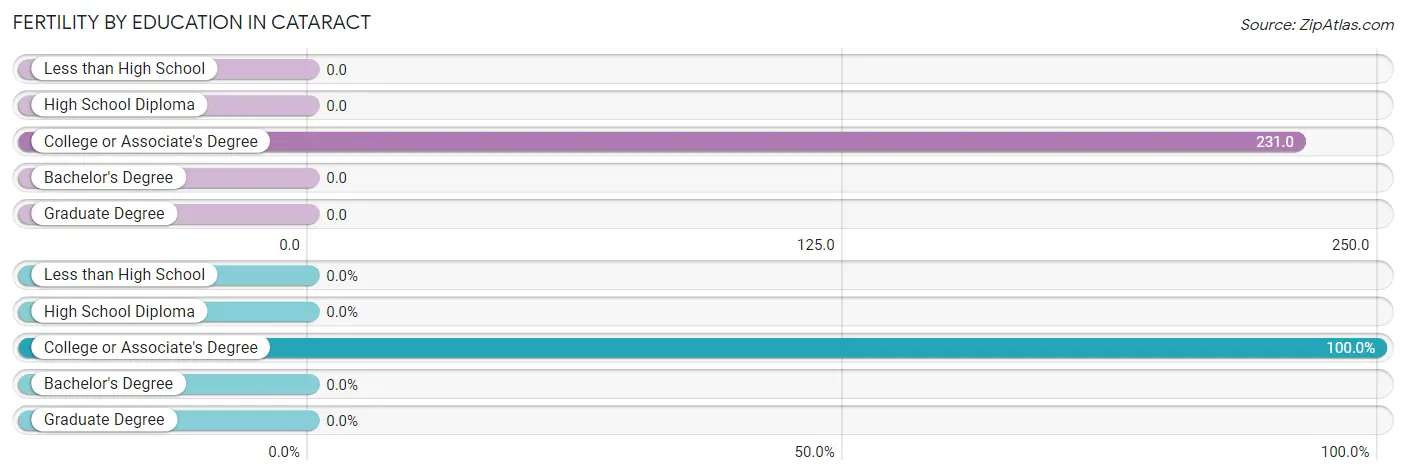
| Educational Attainment | Women with Births | Births / 1,000 Women |
| Less than High School | 0 (0.0%) | 0.0 |
| High School Diploma | 0 (0.0%) | 0.0 |
| College or Associate's Degree | 3 (100.0%) | 231.0 |
| Bachelor's Degree | 0 (0.0%) | 0.0 |
| Graduate Degree | 0 (0.0%) | 0.0 |
| Total | 3 (100.0%) | 65.0 |
Fertility by Education by Marriage Status in Cataract
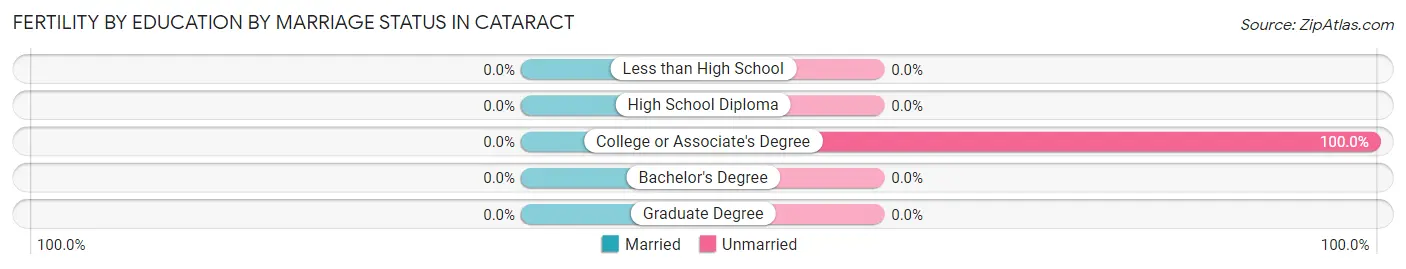
| Educational Attainment | Married | Unmarried |
| Less than High School | 0 (0.0%) | 0 (0.0%) |
| High School Diploma | 0 (0.0%) | 0 (0.0%) |
| College or Associate's Degree | 0 (0.0%) | 3 (100.0%) |
| Bachelor's Degree | 0 (0.0%) | 0 (0.0%) |
| Graduate Degree | 0 (0.0%) | 0 (0.0%) |
| Total | 0 (0.0%) | 3 (100.0%) |
Employment Characteristics in Cataract
Employment by Class of Employer in Cataract
Among the 101 employed individuals in Cataract, private company employees (88 | 87.1%), state government employees (6 | 5.9%), and not-for-profit organizations (4 | 4.0%) make up the most common classes of employment.
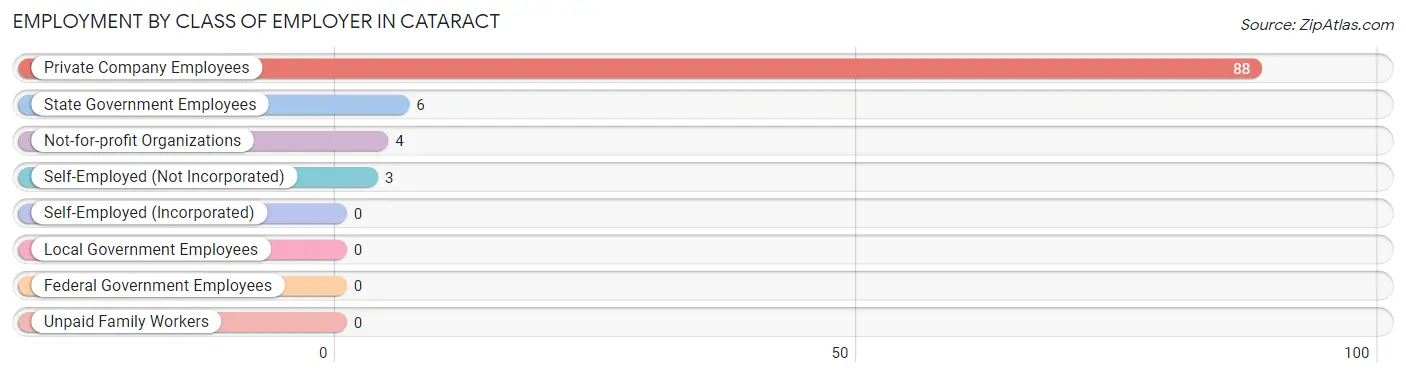
| Employer Class | # Employees | % Employees |
| Private Company Employees | 88 | 87.1% |
| Self-Employed (Incorporated) | 0 | 0.0% |
| Self-Employed (Not Incorporated) | 3 | 3.0% |
| Not-for-profit Organizations | 4 | 4.0% |
| Local Government Employees | 0 | 0.0% |
| State Government Employees | 6 | 5.9% |
| Federal Government Employees | 0 | 0.0% |
| Unpaid Family Workers | 0 | 0.0% |
| Total | 101 | 100.0% |
Employment Status by Age in Cataract
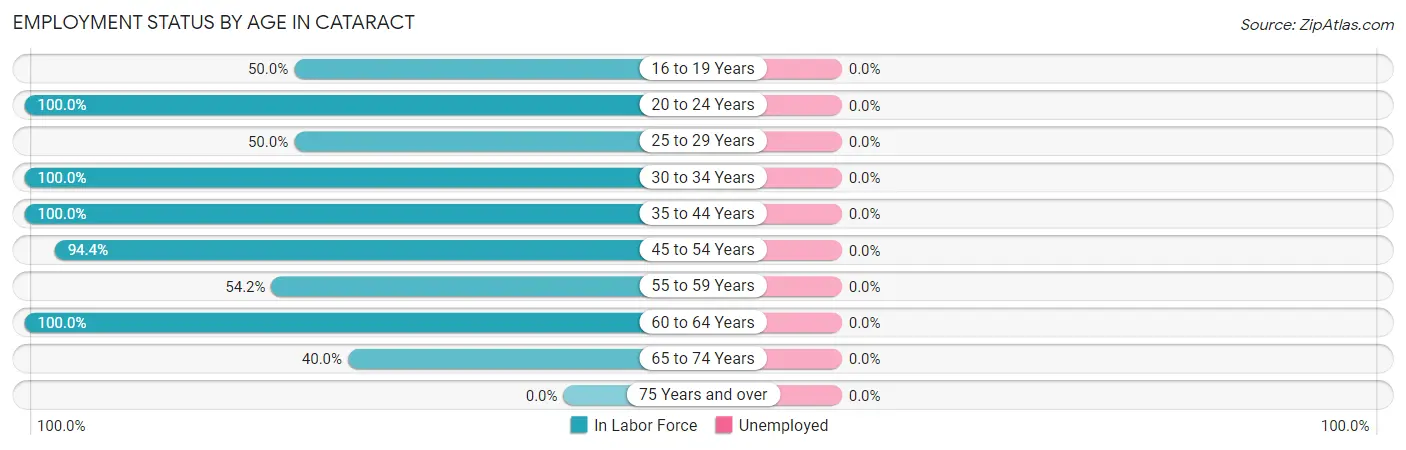
| Age Bracket | In Labor Force | Unemployed |
| 16 to 19 Years | 3 (50.0%) | 0 (0.0%) |
| 20 to 24 Years | 21 (100.0%) | 0 (0.0%) |
| 25 to 29 Years | 4 (50.0%) | 0 (0.0%) |
| 30 to 34 Years | 9 (100.0%) | 0 (0.0%) |
| 35 to 44 Years | 9 (100.0%) | 0 (0.0%) |
| 45 to 54 Years | 34 (94.4%) | 0 (0.0%) |
| 55 to 59 Years | 13 (54.2%) | 0 (0.0%) |
| 60 to 64 Years | 6 (100.0%) | 0 (0.0%) |
| 65 to 74 Years | 2 (40.0%) | 0 (0.0%) |
| 75 Years and over | 0 (0.0%) | 0 (0.0%) |
| Total | 101 (79.5%) | 0 (0.0%) |
Employment Status by Educational Attainment in Cataract
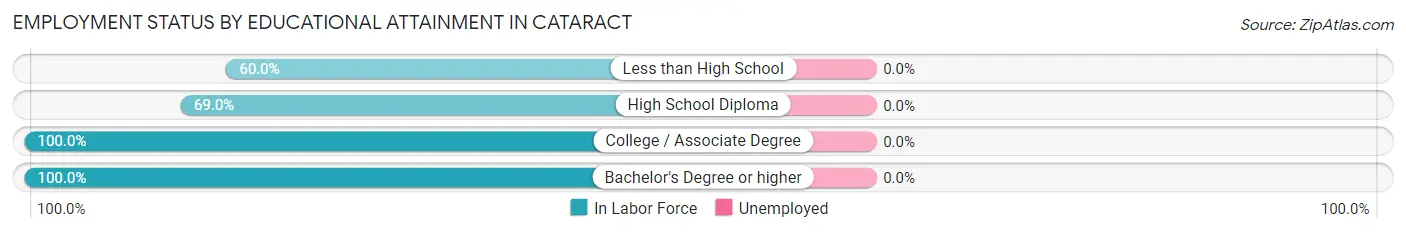
| Educational Attainment | In Labor Force | Unemployed |
| Less than High School | 6 (60.0%) | 0 (0.0%) |
| High School Diploma | 29 (69.0%) | 0 (0.0%) |
| College / Associate Degree | 28 (100.0%) | 0 (0.0%) |
| Bachelor's Degree or higher | 12 (100.0%) | 0 (0.0%) |
| Total | 75 (81.5%) | 0 (0.0%) |
Employment Occupations by Sex in Cataract
Management, Business, Science and Arts Occupations
The most common Management, Business, Science and Arts occupations in Cataract are Community & Social Service (7 | 6.9%), Education Instruction & Library (7 | 6.9%), and Health Diagnosing & Treating (5 | 5.0%).
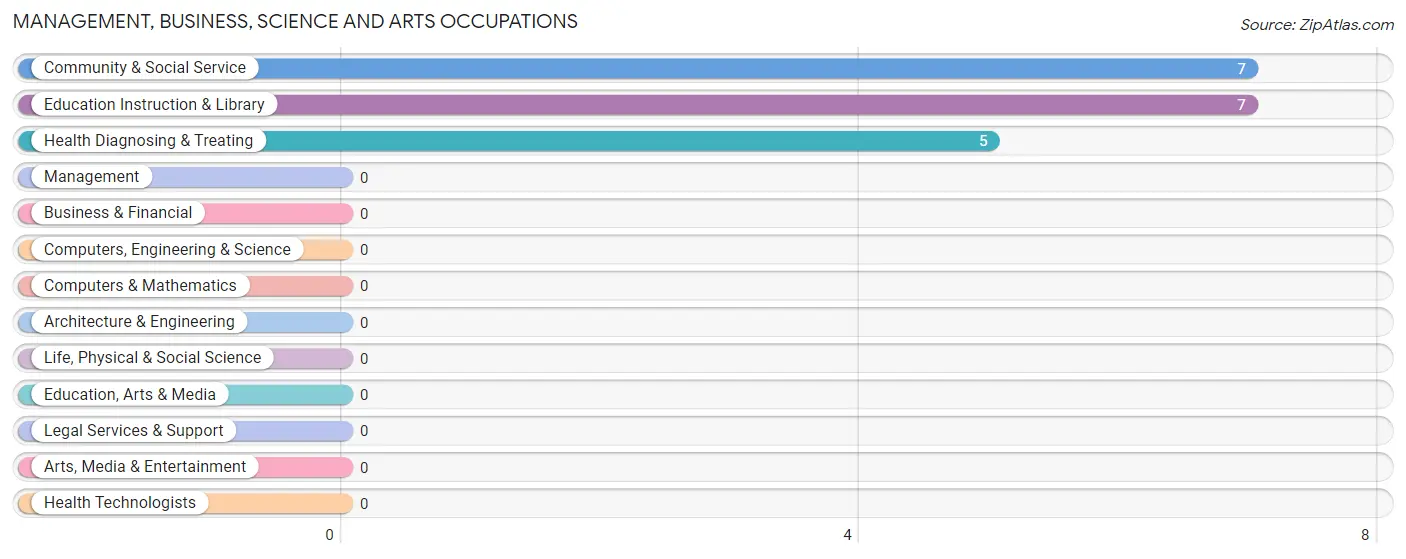
Management, Business, Science and Arts Occupations by Sex
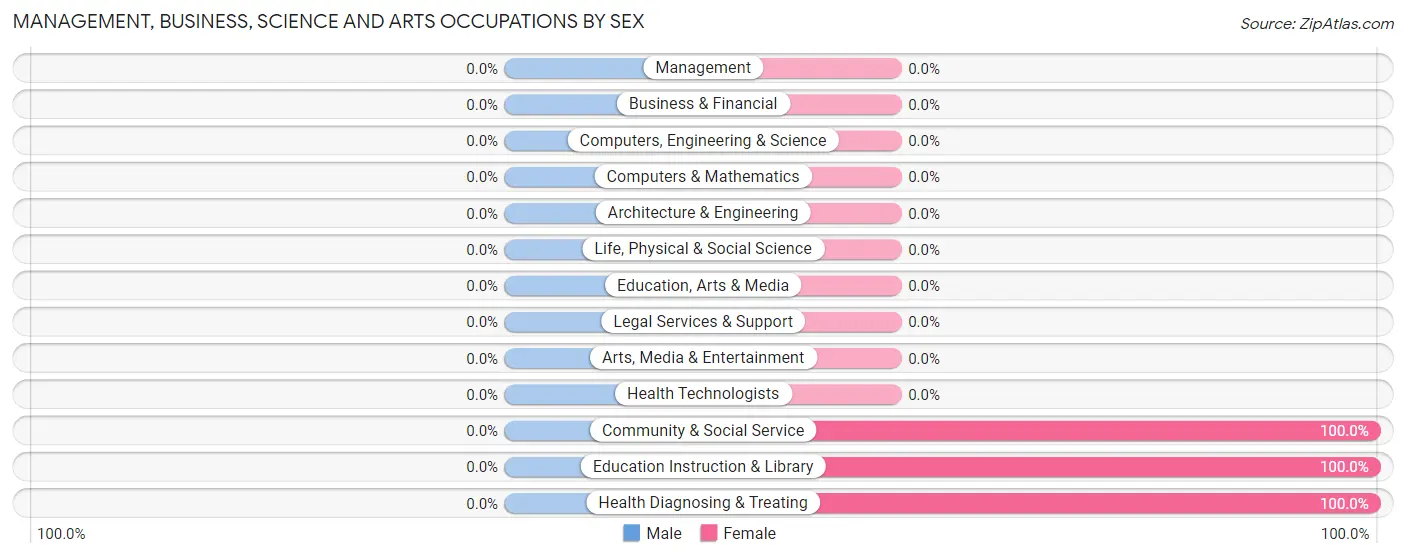
| Occupation | Male | Female |
| Management | 0 (0.0%) | 0 (0.0%) |
| Business & Financial | 0 (0.0%) | 0 (0.0%) |
| Computers, Engineering & Science | 0 (0.0%) | 0 (0.0%) |
| Computers & Mathematics | 0 (0.0%) | 0 (0.0%) |
| Architecture & Engineering | 0 (0.0%) | 0 (0.0%) |
| Life, Physical & Social Science | 0 (0.0%) | 0 (0.0%) |
| Community & Social Service | 0 (0.0%) | 7 (100.0%) |
| Education, Arts & Media | 0 (0.0%) | 0 (0.0%) |
| Legal Services & Support | 0 (0.0%) | 0 (0.0%) |
| Education Instruction & Library | 0 (0.0%) | 7 (100.0%) |
| Arts, Media & Entertainment | 0 (0.0%) | 0 (0.0%) |
| Health Diagnosing & Treating | 0 (0.0%) | 5 (100.0%) |
| Health Technologists | 0 (0.0%) | 0 (0.0%) |
| Total (Category) | 0 (0.0%) | 12 (100.0%) |
| Total (Overall) | 50 (49.5%) | 51 (50.5%) |
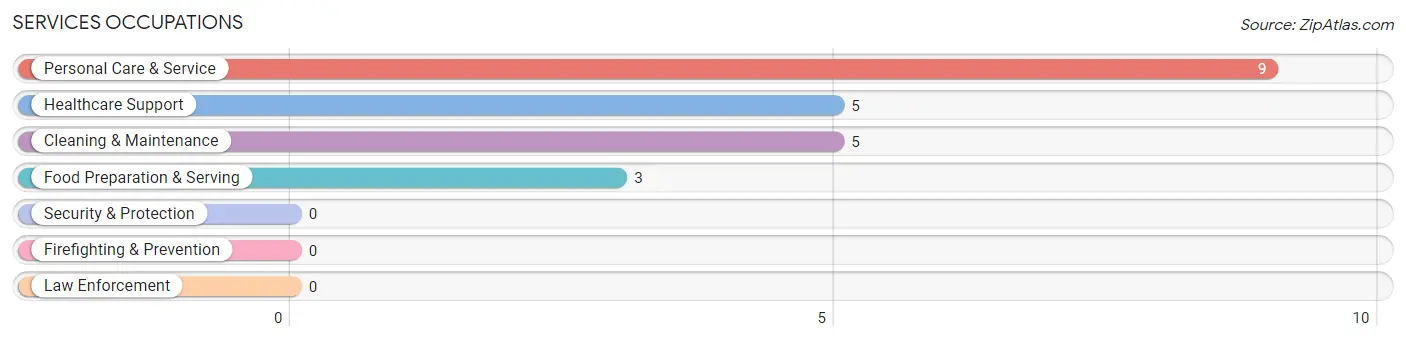
Services Occupations
The most common Services occupations in Cataract are Personal Care & Service (9 | 8.9%), Healthcare Support (5 | 5.0%), Cleaning & Maintenance (5 | 5.0%), and Food Preparation & Serving (3 | 3.0%).
Services Occupations by Sex
Within the Services occupations in Cataract, the most male-oriented occupations are Cleaning & Maintenance (60.0%), and Personal Care & Service (33.3%), while the most female-oriented occupations are Healthcare Support (100.0%), Food Preparation & Serving (100.0%), and Personal Care & Service (66.7%).
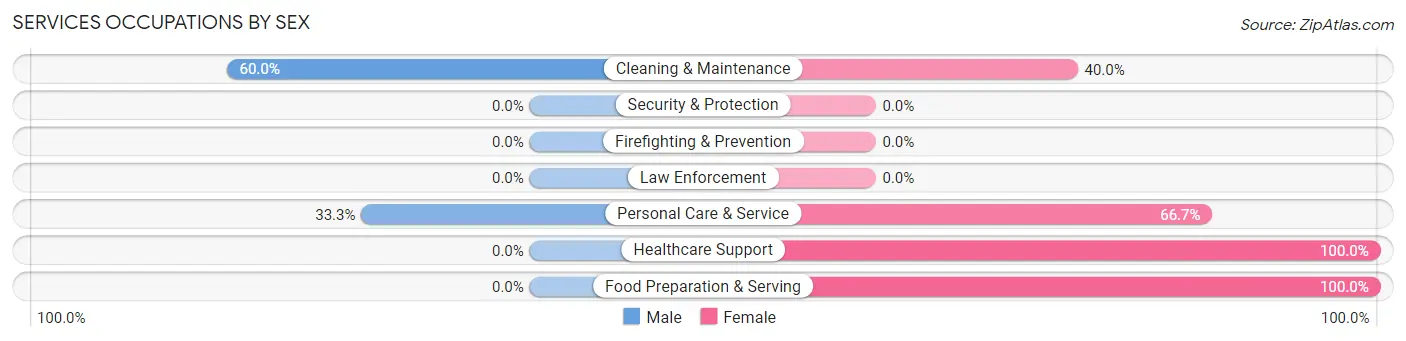
| Occupation | Male | Female |
| Healthcare Support | 0 (0.0%) | 5 (100.0%) |
| Security & Protection | 0 (0.0%) | 0 (0.0%) |
| Firefighting & Prevention | 0 (0.0%) | 0 (0.0%) |
| Law Enforcement | 0 (0.0%) | 0 (0.0%) |
| Food Preparation & Serving | 0 (0.0%) | 3 (100.0%) |
| Cleaning & Maintenance | 3 (60.0%) | 2 (40.0%) |
| Personal Care & Service | 3 (33.3%) | 6 (66.7%) |
| Total (Category) | 6 (27.3%) | 16 (72.7%) |
| Total (Overall) | 50 (49.5%) | 51 (50.5%) |
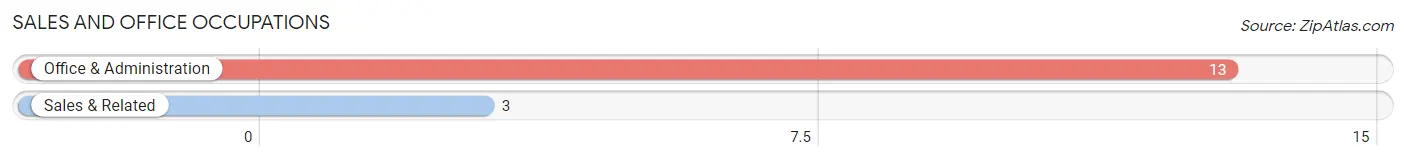
Sales and Office Occupations
The most common Sales and Office occupations in Cataract are Office & Administration (13 | 12.9%), and Sales & Related (3 | 3.0%).
Sales and Office Occupations by Sex

| Occupation | Male | Female |
| Sales & Related | 3 (100.0%) | 0 (0.0%) |
| Office & Administration | 8 (61.5%) | 5 (38.5%) |
| Total (Category) | 11 (68.8%) | 5 (31.2%) |
| Total (Overall) | 50 (49.5%) | 51 (50.5%) |
Natural Resources, Construction and Maintenance Occupations
The most common Natural Resources, Construction and Maintenance occupations in Cataract are Installation, Maintenance & Repair (11 | 10.9%), and Construction & Extraction (3 | 3.0%).
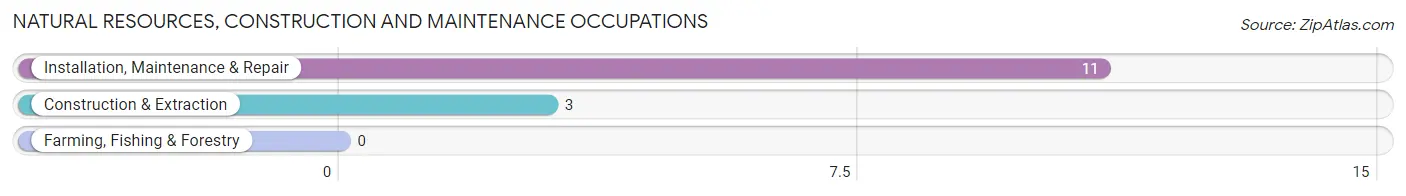
Natural Resources, Construction and Maintenance Occupations by Sex
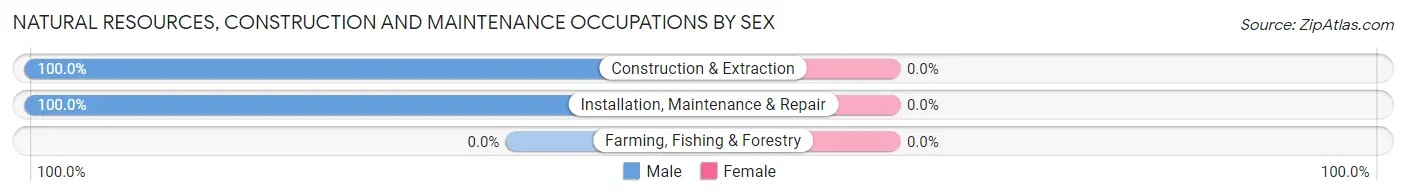
| Occupation | Male | Female |
| Farming, Fishing & Forestry | 0 (0.0%) | 0 (0.0%) |
| Construction & Extraction | 3 (100.0%) | 0 (0.0%) |
| Installation, Maintenance & Repair | 11 (100.0%) | 0 (0.0%) |
| Total (Category) | 14 (100.0%) | 0 (0.0%) |
| Total (Overall) | 50 (49.5%) | 51 (50.5%) |
Production, Transportation and Moving Occupations
The most common Production, Transportation and Moving occupations in Cataract are Production (26 | 25.7%), Transportation (6 | 5.9%), and Material Moving (5 | 5.0%).
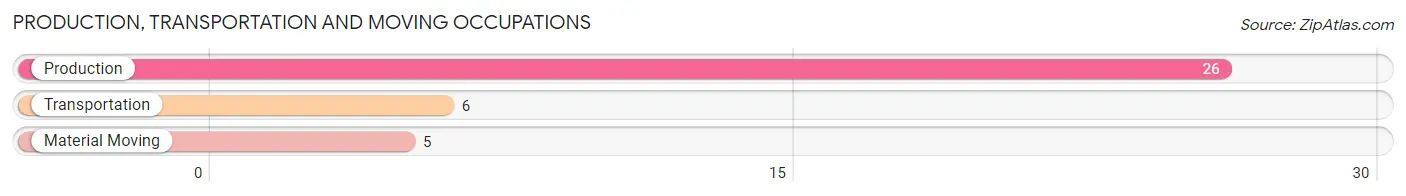
Production, Transportation and Moving Occupations by Sex
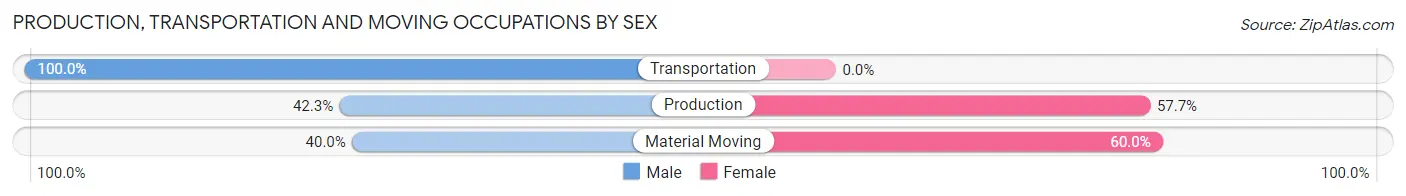
| Occupation | Male | Female |
| Production | 11 (42.3%) | 15 (57.7%) |
| Transportation | 6 (100.0%) | 0 (0.0%) |
| Material Moving | 2 (40.0%) | 3 (60.0%) |
| Total (Category) | 19 (51.3%) | 18 (48.6%) |
| Total (Overall) | 50 (49.5%) | 51 (50.5%) |
Employment Industries by Sex in Cataract
Employment Industries in Cataract
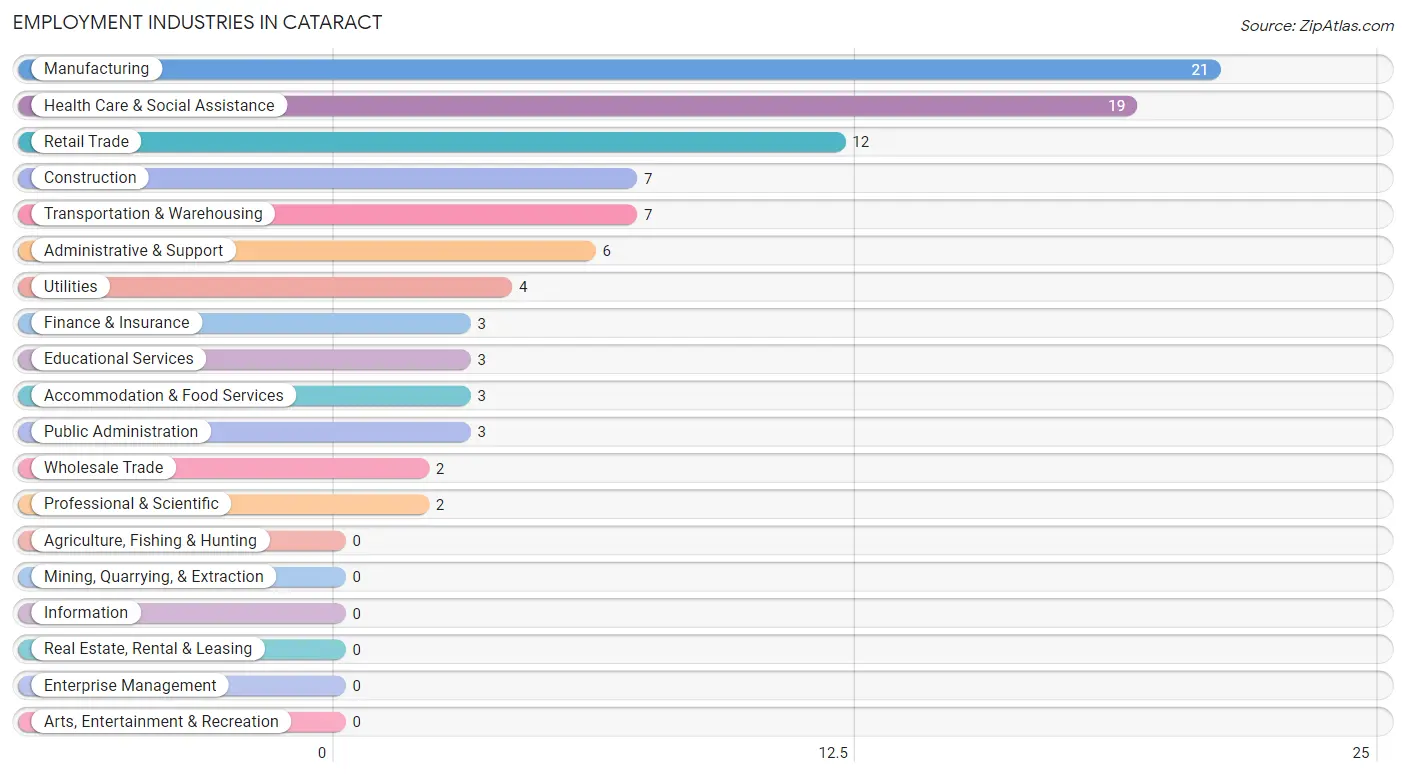
The major employment industries in Cataract include Manufacturing (21 | 20.8%), Health Care & Social Assistance (19 | 18.8%), Retail Trade (12 | 11.9%), Construction (7 | 6.9%), and Transportation & Warehousing (7 | 6.9%).
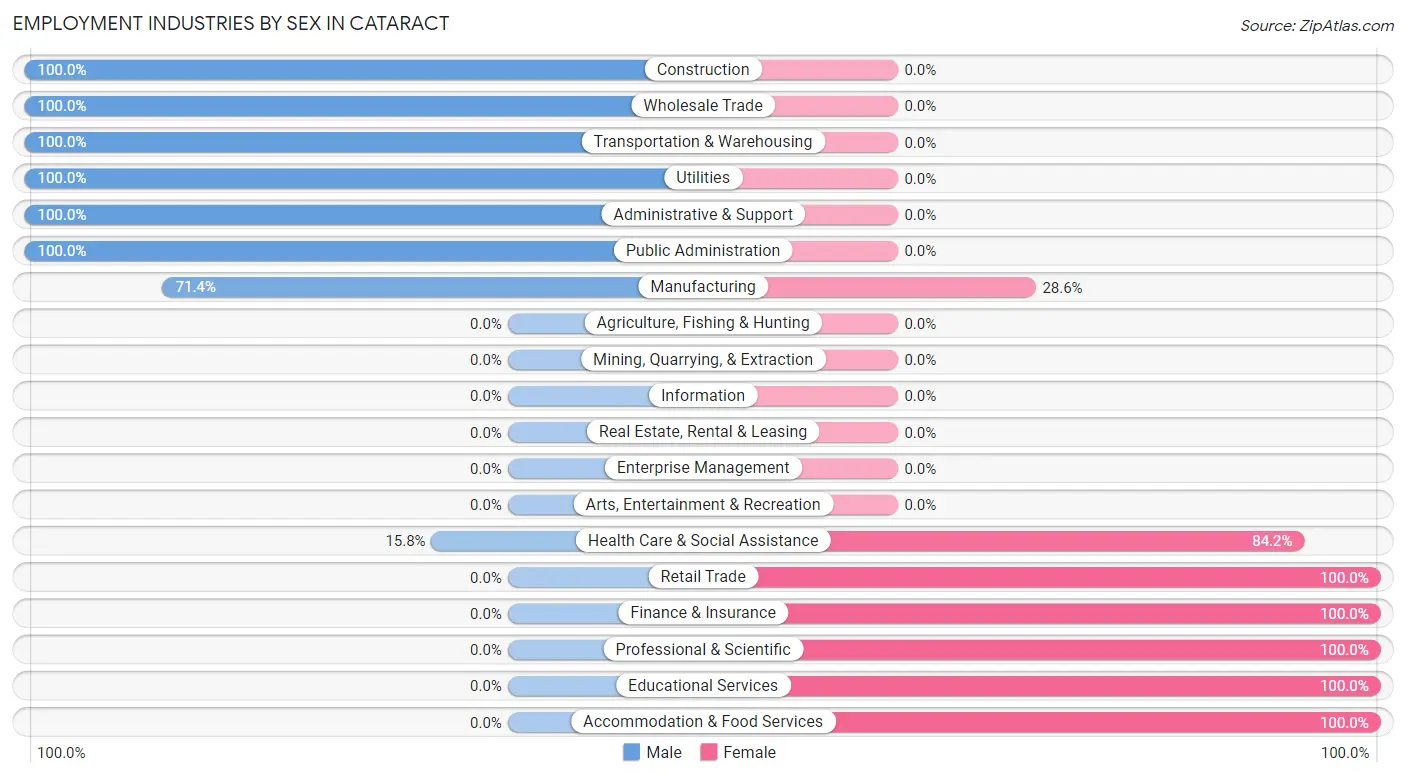
Employment Industries by Sex in Cataract
The Cataract industries that see more men than women are Construction (100.0%), Wholesale Trade (100.0%), and Transportation & Warehousing (100.0%), whereas the industries that tend to have a higher number of women are Retail Trade (100.0%), Finance & Insurance (100.0%), and Professional & Scientific (100.0%).
| Industry | Male | Female |
| Agriculture, Fishing & Hunting | 0 (0.0%) | 0 (0.0%) |
| Mining, Quarrying, & Extraction | 0 (0.0%) | 0 (0.0%) |
| Construction | 7 (100.0%) | 0 (0.0%) |
| Manufacturing | 15 (71.4%) | 6 (28.6%) |
| Wholesale Trade | 2 (100.0%) | 0 (0.0%) |
| Retail Trade | 0 (0.0%) | 12 (100.0%) |
| Transportation & Warehousing | 7 (100.0%) | 0 (0.0%) |
| Utilities | 4 (100.0%) | 0 (0.0%) |
| Information | 0 (0.0%) | 0 (0.0%) |
| Finance & Insurance | 0 (0.0%) | 3 (100.0%) |
| Real Estate, Rental & Leasing | 0 (0.0%) | 0 (0.0%) |
| Professional & Scientific | 0 (0.0%) | 2 (100.0%) |
| Enterprise Management | 0 (0.0%) | 0 (0.0%) |
| Administrative & Support | 6 (100.0%) | 0 (0.0%) |
| Educational Services | 0 (0.0%) | 3 (100.0%) |
| Health Care & Social Assistance | 3 (15.8%) | 16 (84.2%) |
| Arts, Entertainment & Recreation | 0 (0.0%) | 0 (0.0%) |
| Accommodation & Food Services | 0 (0.0%) | 3 (100.0%) |
| Public Administration | 3 (100.0%) | 0 (0.0%) |
| Total | 50 (49.5%) | 51 (50.5%) |
Education in Cataract
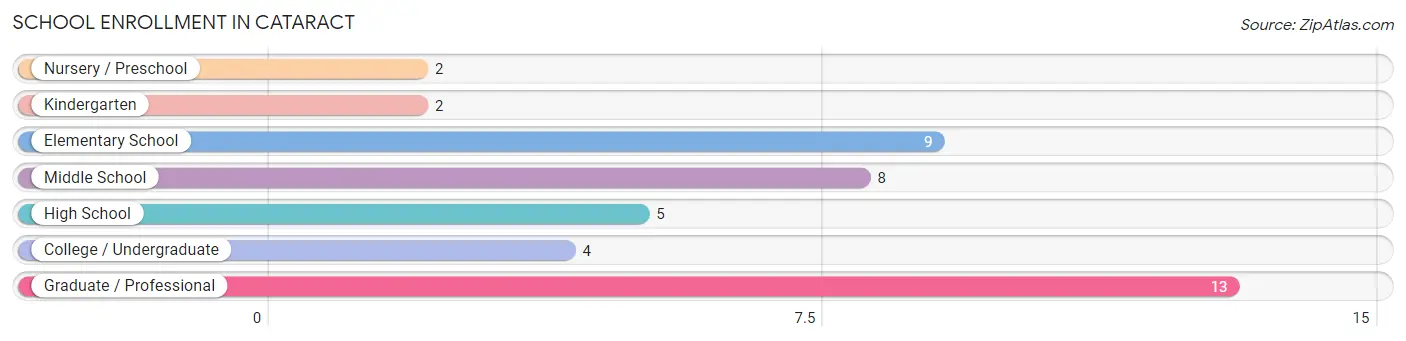
School Enrollment in Cataract
The most common levels of schooling among the 43 students in Cataract are graduate / professional (13 | 30.2%), elementary school (9 | 20.9%), and middle school (8 | 18.6%).
| School Level | # Students | % Students |
| Nursery / Preschool | 2 | 4.6% |
| Kindergarten | 2 | 4.6% |
| Elementary School | 9 | 20.9% |
| Middle School | 8 | 18.6% |
| High School | 5 | 11.6% |
| College / Undergraduate | 4 | 9.3% |
| Graduate / Professional | 13 | 30.2% |
| Total | 43 | 100.0% |
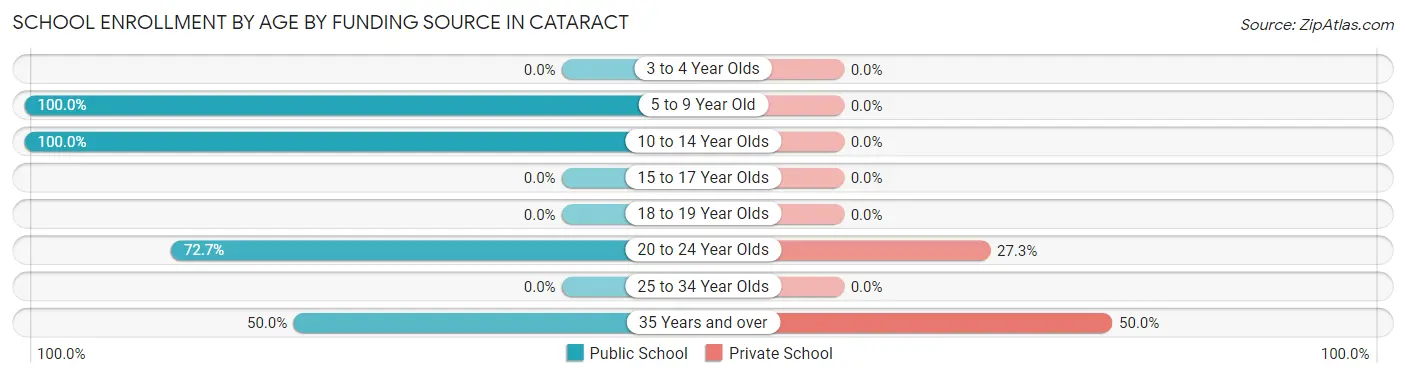
School Enrollment by Age by Funding Source in Cataract
Out of a total of 43 students who are enrolled in schools in Cataract, 6 (14.0%) attend a private institution, while the remaining 37 (86.0%) are enrolled in public schools. The age group of 35 years and over has the highest likelihood of being enrolled in private schools, with 3 (50.0% in the age bracket) enrolled. Conversely, the age group of 5 to 9 year old has the lowest likelihood of being enrolled in a private school, with 13 (100.0% in the age bracket) attending a public institution.
| Age Bracket | Public School | Private School |
| 3 to 4 Year Olds | 0 (0.0%) | 0 (0.0%) |
| 5 to 9 Year Old | 13 (100.0%) | 0 (0.0%) |
| 10 to 14 Year Olds | 13 (100.0%) | 0 (0.0%) |
| 15 to 17 Year Olds | 0 (0.0%) | 0 (0.0%) |
| 18 to 19 Year Olds | 0 (0.0%) | 0 (0.0%) |
| 20 to 24 Year Olds | 8 (72.7%) | 3 (27.3%) |
| 25 to 34 Year Olds | 0 (0.0%) | 0 (0.0%) |
| 35 Years and over | 3 (50.0%) | 3 (50.0%) |
| Total | 37 (86.0%) | 6 (14.0%) |
Educational Attainment by Field of Study in Cataract
Business (9 | 42.9%), social sciences (3 | 14.3%), science & technology (3 | 14.3%), education (3 | 14.3%), and arts & humanities (3 | 14.3%) are the most common fields of study among 21 individuals in Cataract who have obtained a bachelor's degree or higher.
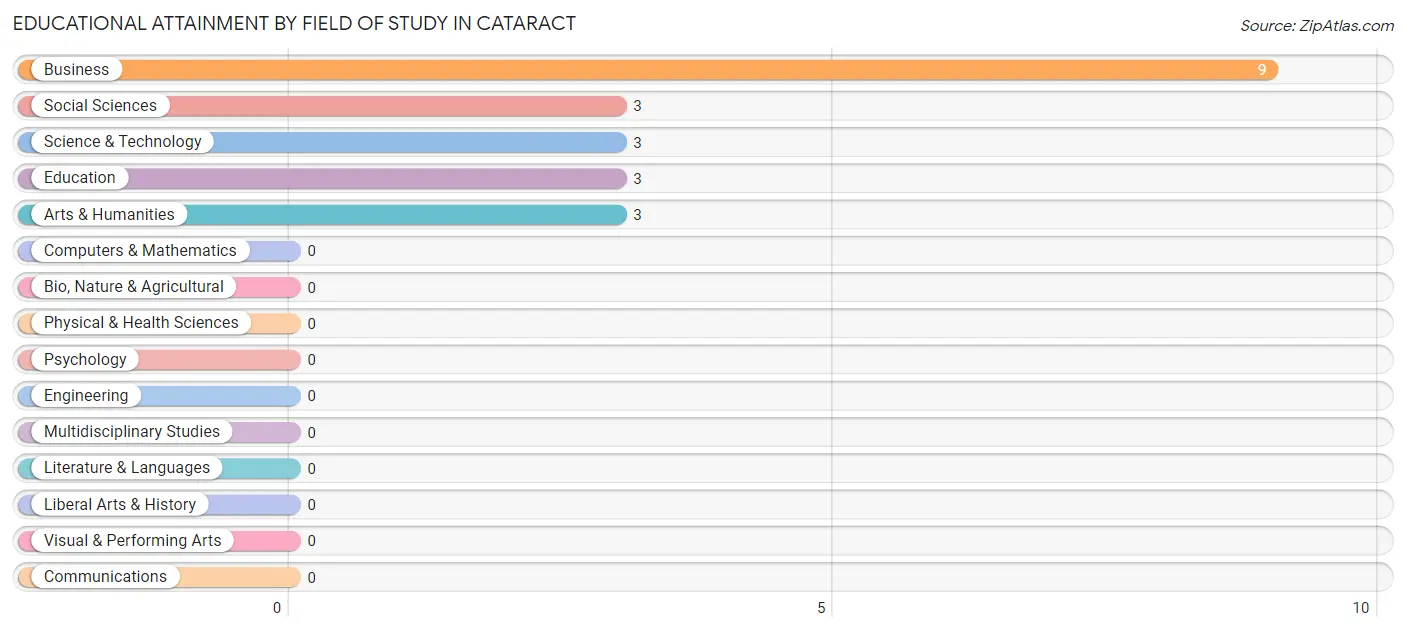
| Field of Study | # Graduates | % Graduates |
| Computers & Mathematics | 0 | 0.0% |
| Bio, Nature & Agricultural | 0 | 0.0% |
| Physical & Health Sciences | 0 | 0.0% |
| Psychology | 0 | 0.0% |
| Social Sciences | 3 | 14.3% |
| Engineering | 0 | 0.0% |
| Multidisciplinary Studies | 0 | 0.0% |
| Science & Technology | 3 | 14.3% |
| Business | 9 | 42.9% |
| Education | 3 | 14.3% |
| Literature & Languages | 0 | 0.0% |
| Liberal Arts & History | 0 | 0.0% |
| Visual & Performing Arts | 0 | 0.0% |
| Communications | 0 | 0.0% |
| Arts & Humanities | 3 | 14.3% |
| Total | 21 | 100.0% |
Transportation & Commute in Cataract
Vehicle Availability by Sex in Cataract
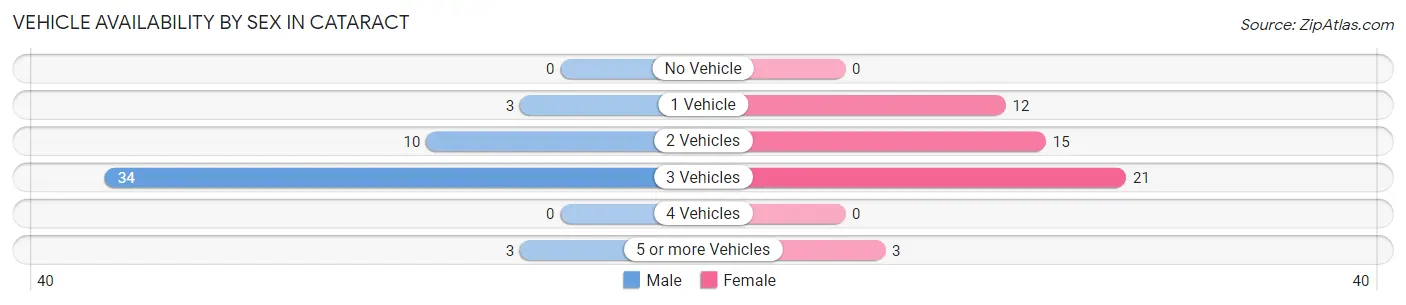
The most prevalent vehicle ownership categories in Cataract are males with 3 vehicles (34, accounting for 68.0%) and females with 3 vehicles (21, making up 66.7%).
| Vehicles Available | Male | Female |
| No Vehicle | 0 (0.0%) | 0 (0.0%) |
| 1 Vehicle | 3 (6.0%) | 12 (23.5%) |
| 2 Vehicles | 10 (20.0%) | 15 (29.4%) |
| 3 Vehicles | 34 (68.0%) | 21 (41.2%) |
| 4 Vehicles | 0 (0.0%) | 0 (0.0%) |
| 5 or more Vehicles | 3 (6.0%) | 3 (5.9%) |
| Total | 50 (100.0%) | 51 (100.0%) |
Commute Time in Cataract
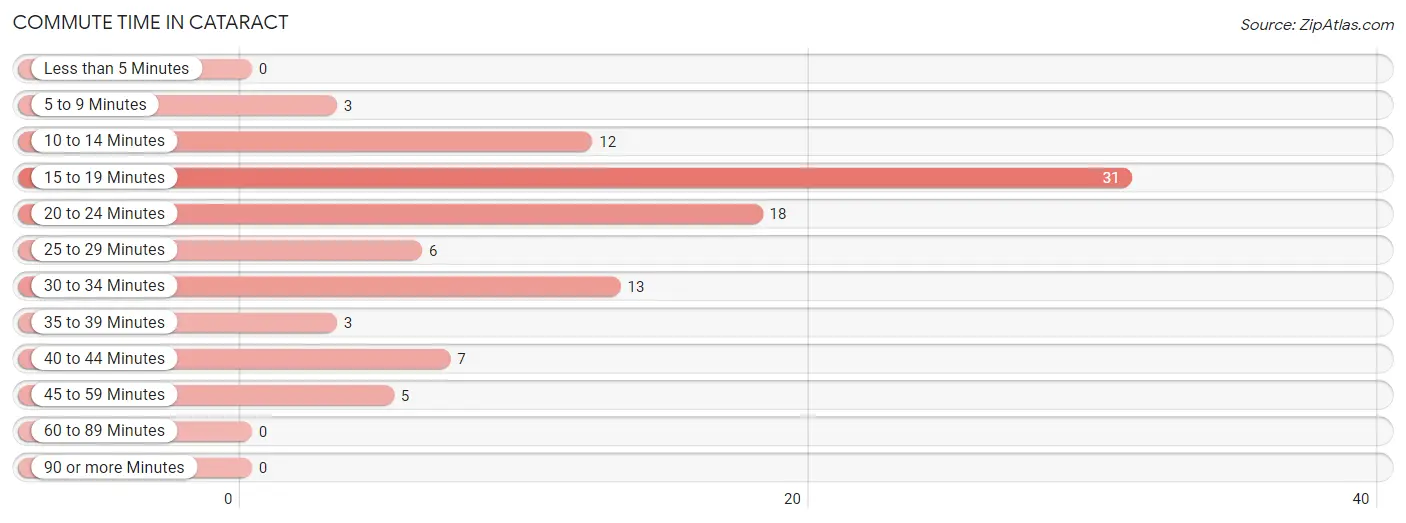
The most frequently occuring commute durations in Cataract are 15 to 19 minutes (31 commuters, 31.6%), 20 to 24 minutes (18 commuters, 18.4%), and 30 to 34 minutes (13 commuters, 13.3%).
| Commute Time | # Commuters | % Commuters |
| Less than 5 Minutes | 0 | 0.0% |
| 5 to 9 Minutes | 3 | 3.1% |
| 10 to 14 Minutes | 12 | 12.2% |
| 15 to 19 Minutes | 31 | 31.6% |
| 20 to 24 Minutes | 18 | 18.4% |
| 25 to 29 Minutes | 6 | 6.1% |
| 30 to 34 Minutes | 13 | 13.3% |
| 35 to 39 Minutes | 3 | 3.1% |
| 40 to 44 Minutes | 7 | 7.1% |
| 45 to 59 Minutes | 5 | 5.1% |
| 60 to 89 Minutes | 0 | 0.0% |
| 90 or more Minutes | 0 | 0.0% |
Commute Time by Sex in Cataract
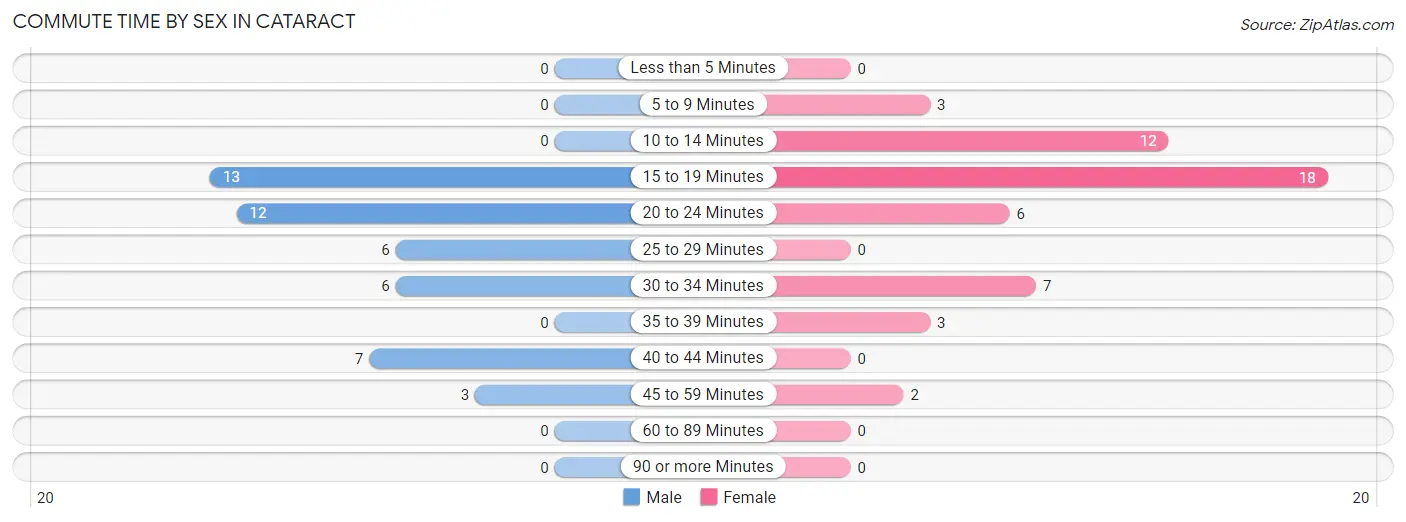
The most common commute times in Cataract are 15 to 19 minutes (13 commuters, 27.7%) for males and 15 to 19 minutes (18 commuters, 35.3%) for females.
| Commute Time | Male | Female |
| Less than 5 Minutes | 0 (0.0%) | 0 (0.0%) |
| 5 to 9 Minutes | 0 (0.0%) | 3 (5.9%) |
| 10 to 14 Minutes | 0 (0.0%) | 12 (23.5%) |
| 15 to 19 Minutes | 13 (27.7%) | 18 (35.3%) |
| 20 to 24 Minutes | 12 (25.5%) | 6 (11.8%) |
| 25 to 29 Minutes | 6 (12.8%) | 0 (0.0%) |
| 30 to 34 Minutes | 6 (12.8%) | 7 (13.7%) |
| 35 to 39 Minutes | 0 (0.0%) | 3 (5.9%) |
| 40 to 44 Minutes | 7 (14.9%) | 0 (0.0%) |
| 45 to 59 Minutes | 3 (6.4%) | 2 (3.9%) |
| 60 to 89 Minutes | 0 (0.0%) | 0 (0.0%) |
| 90 or more Minutes | 0 (0.0%) | 0 (0.0%) |
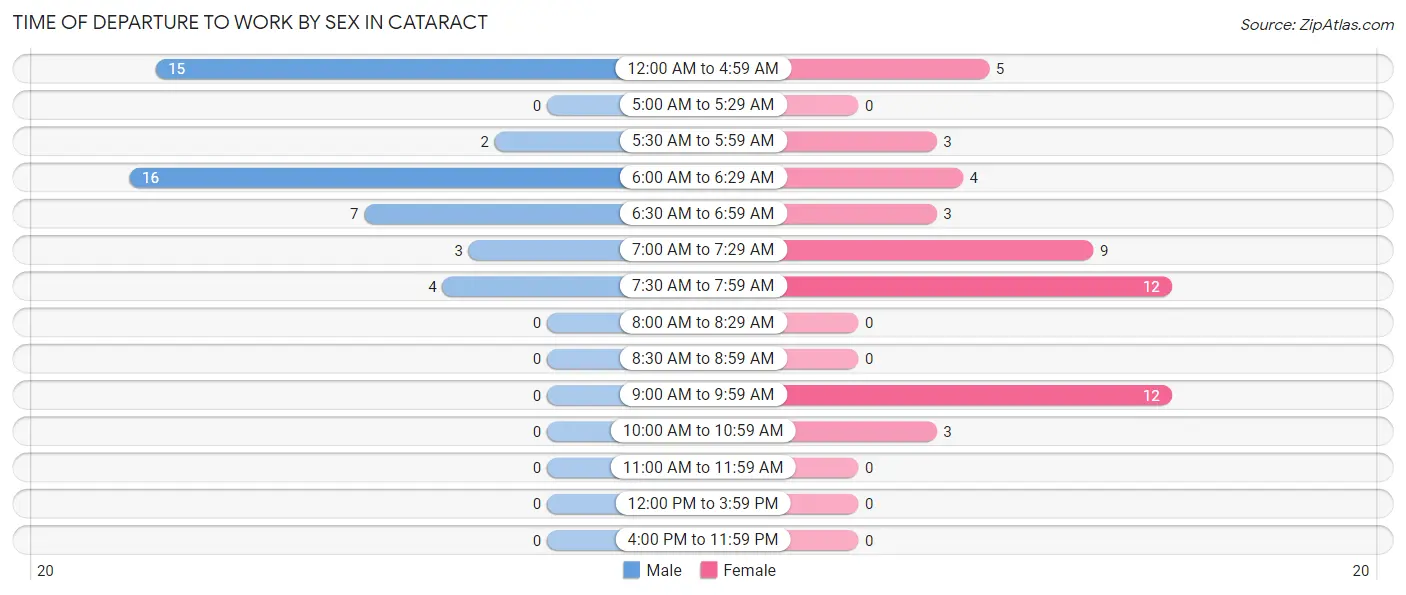
Time of Departure to Work by Sex in Cataract
The most frequent times of departure to work in Cataract are 6:00 AM to 6:29 AM (16, 34.0%) for males and 7:30 AM to 7:59 AM (12, 23.5%) for females.
| Time of Departure | Male | Female |
| 12:00 AM to 4:59 AM | 15 (31.9%) | 5 (9.8%) |
| 5:00 AM to 5:29 AM | 0 (0.0%) | 0 (0.0%) |
| 5:30 AM to 5:59 AM | 2 (4.3%) | 3 (5.9%) |
| 6:00 AM to 6:29 AM | 16 (34.0%) | 4 (7.8%) |
| 6:30 AM to 6:59 AM | 7 (14.9%) | 3 (5.9%) |
| 7:00 AM to 7:29 AM | 3 (6.4%) | 9 (17.6%) |
| 7:30 AM to 7:59 AM | 4 (8.5%) | 12 (23.5%) |
| 8:00 AM to 8:29 AM | 0 (0.0%) | 0 (0.0%) |
| 8:30 AM to 8:59 AM | 0 (0.0%) | 0 (0.0%) |
| 9:00 AM to 9:59 AM | 0 (0.0%) | 12 (23.5%) |
| 10:00 AM to 10:59 AM | 0 (0.0%) | 3 (5.9%) |
| 11:00 AM to 11:59 AM | 0 (0.0%) | 0 (0.0%) |
| 12:00 PM to 3:59 PM | 0 (0.0%) | 0 (0.0%) |
| 4:00 PM to 11:59 PM | 0 (0.0%) | 0 (0.0%) |
| Total | 47 (100.0%) | 51 (100.0%) |
Housing Occupancy in Cataract
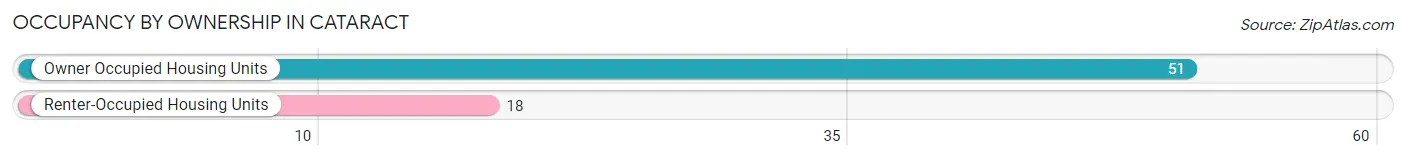
Occupancy by Ownership in Cataract
Of the total 69 dwellings in Cataract, owner-occupied units account for 51 (73.9%), while renter-occupied units make up 18 (26.1%).
| Occupancy | # Housing Units | % Housing Units |
| Owner Occupied Housing Units | 51 | 73.9% |
| Renter-Occupied Housing Units | 18 | 26.1% |
| Total Occupied Housing Units | 69 | 100.0% |
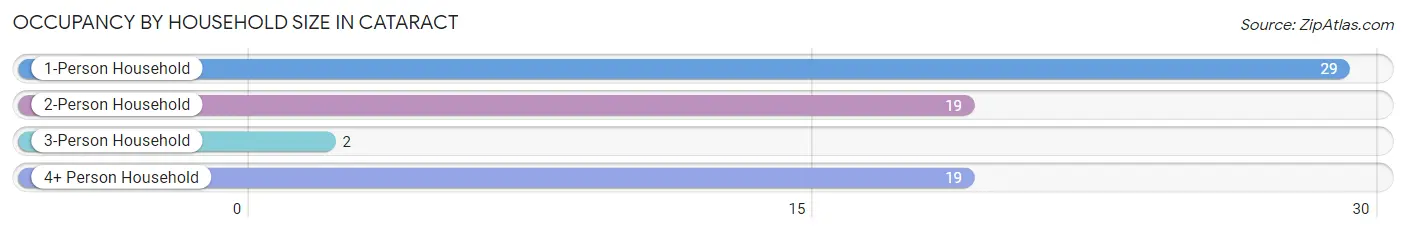
Occupancy by Household Size in Cataract
| Household Size | # Housing Units | % Housing Units |
| 1-Person Household | 29 | 42.0% |
| 2-Person Household | 19 | 27.5% |
| 3-Person Household | 2 | 2.9% |
| 4+ Person Household | 19 | 27.5% |
| Total Housing Units | 69 | 100.0% |
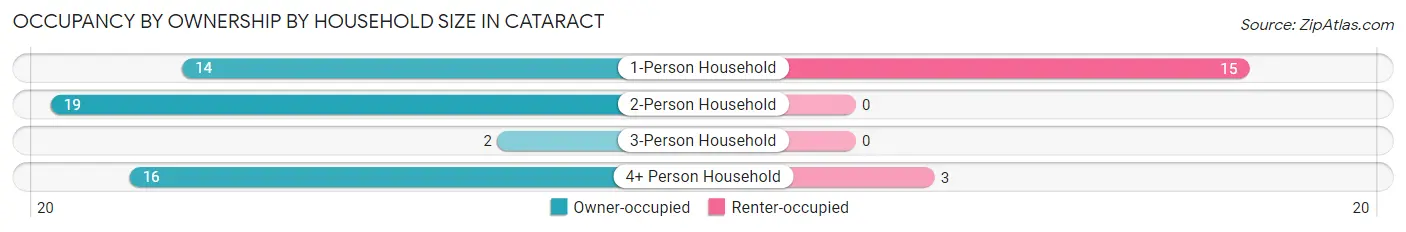
Occupancy by Ownership by Household Size in Cataract
| Household Size | Owner-occupied | Renter-occupied |
| 1-Person Household | 14 (48.3%) | 15 (51.7%) |
| 2-Person Household | 19 (100.0%) | 0 (0.0%) |
| 3-Person Household | 2 (100.0%) | 0 (0.0%) |
| 4+ Person Household | 16 (84.2%) | 3 (15.8%) |
| Total Housing Units | 51 (73.9%) | 18 (26.1%) |
Occupancy by Educational Attainment in Cataract
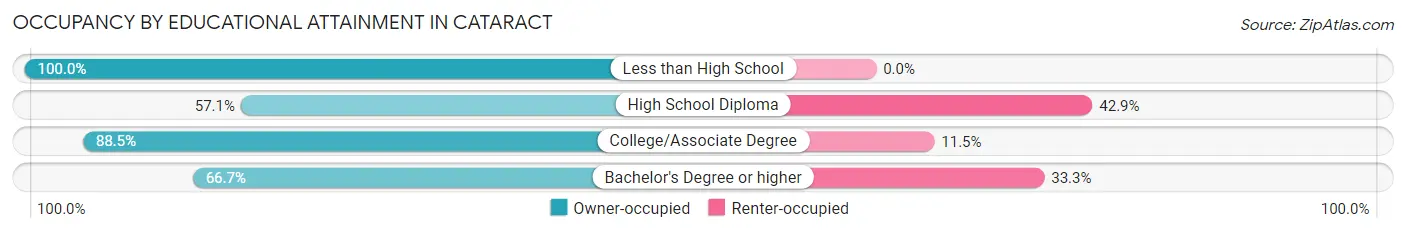
| Household Size | Owner-occupied | Renter-occupied |
| Less than High School | 6 (100.0%) | 0 (0.0%) |
| High School Diploma | 16 (57.1%) | 12 (42.9%) |
| College/Associate Degree | 23 (88.5%) | 3 (11.5%) |
| Bachelor's Degree or higher | 6 (66.7%) | 3 (33.3%) |
Occupancy by Age of Householder in Cataract
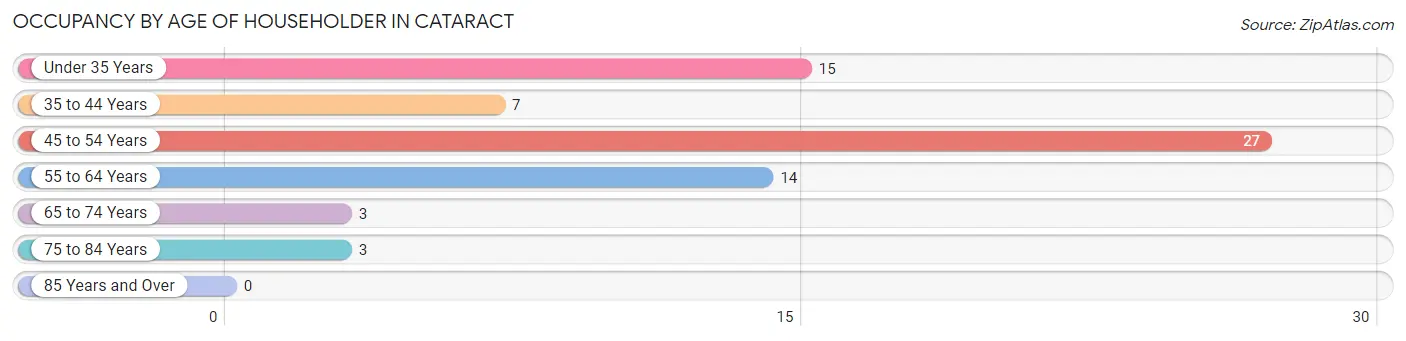
| Age Bracket | # Households | % Households |
| Under 35 Years | 15 | 21.7% |
| 35 to 44 Years | 7 | 10.1% |
| 45 to 54 Years | 27 | 39.1% |
| 55 to 64 Years | 14 | 20.3% |
| 65 to 74 Years | 3 | 4.3% |
| 75 to 84 Years | 3 | 4.3% |
| 85 Years and Over | 0 | 0.0% |
| Total | 69 | 100.0% |
Housing Finances in Cataract
Median Income by Occupancy in Cataract
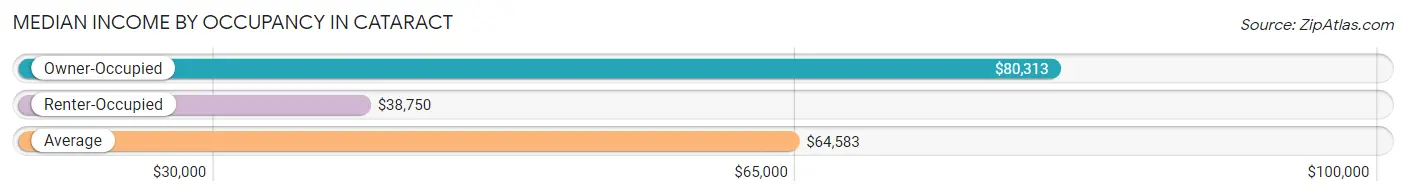
| Occupancy Type | # Households | Median Income |
| Owner-Occupied | 51 (73.9%) | $80,313 |
| Renter-Occupied | 18 (26.1%) | $38,750 |
| Average | 69 (100.0%) | $64,583 |
Occupancy by Householder Income Bracket in Cataract
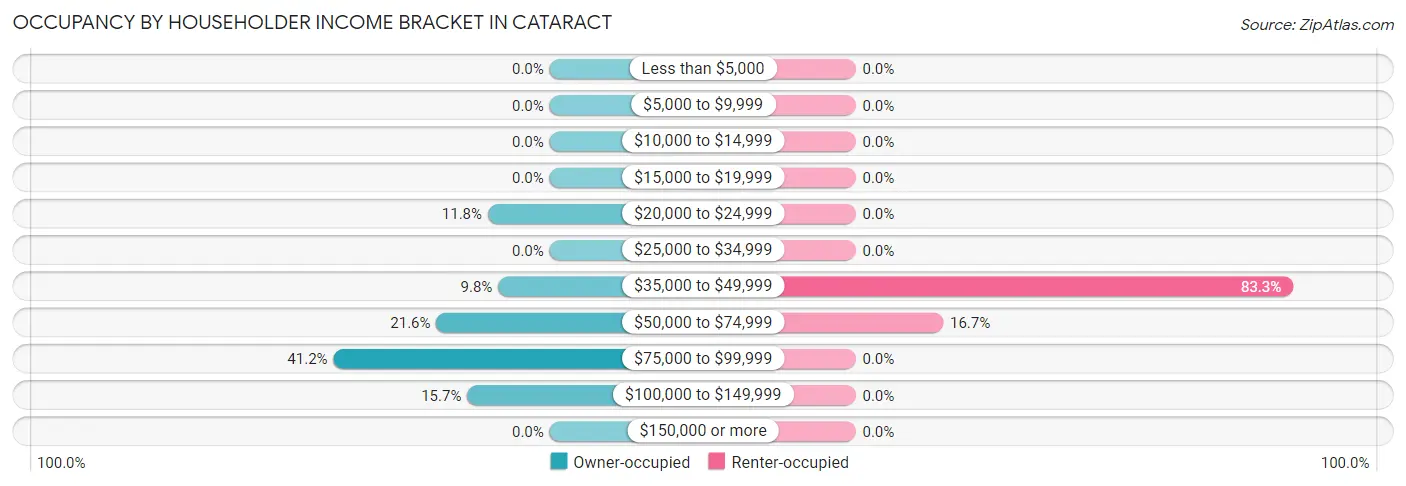
| Income Bracket | Owner-occupied | Renter-occupied |
| Less than $5,000 | 0 (0.0%) | 0 (0.0%) |
| $5,000 to $9,999 | 0 (0.0%) | 0 (0.0%) |
| $10,000 to $14,999 | 0 (0.0%) | 0 (0.0%) |
| $15,000 to $19,999 | 0 (0.0%) | 0 (0.0%) |
| $20,000 to $24,999 | 6 (11.8%) | 0 (0.0%) |
| $25,000 to $34,999 | 0 (0.0%) | 0 (0.0%) |
| $35,000 to $49,999 | 5 (9.8%) | 15 (83.3%) |
| $50,000 to $74,999 | 11 (21.6%) | 3 (16.7%) |
| $75,000 to $99,999 | 21 (41.2%) | 0 (0.0%) |
| $100,000 to $149,999 | 8 (15.7%) | 0 (0.0%) |
| $150,000 or more | 0 (0.0%) | 0 (0.0%) |
| Total | 51 (100.0%) | 18 (100.0%) |
Monthly Housing Cost Tiers in Cataract
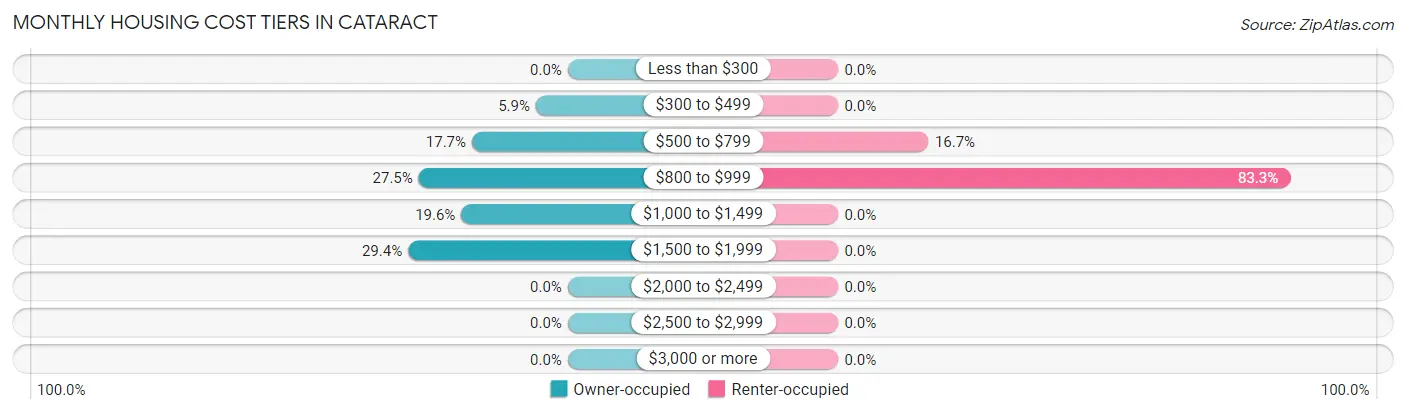
| Monthly Cost | Owner-occupied | Renter-occupied |
| Less than $300 | 0 (0.0%) | 0 (0.0%) |
| $300 to $499 | 3 (5.9%) | 0 (0.0%) |
| $500 to $799 | 9 (17.6%) | 3 (16.7%) |
| $800 to $999 | 14 (27.5%) | 15 (83.3%) |
| $1,000 to $1,499 | 10 (19.6%) | 0 (0.0%) |
| $1,500 to $1,999 | 15 (29.4%) | 0 (0.0%) |
| $2,000 to $2,499 | 0 (0.0%) | 0 (0.0%) |
| $2,500 to $2,999 | 0 (0.0%) | 0 (0.0%) |
| $3,000 or more | 0 (0.0%) | 0 (0.0%) |
| Total | 51 (100.0%) | 18 (100.0%) |
Physical Housing Characteristics in Cataract
Housing Structures in Cataract
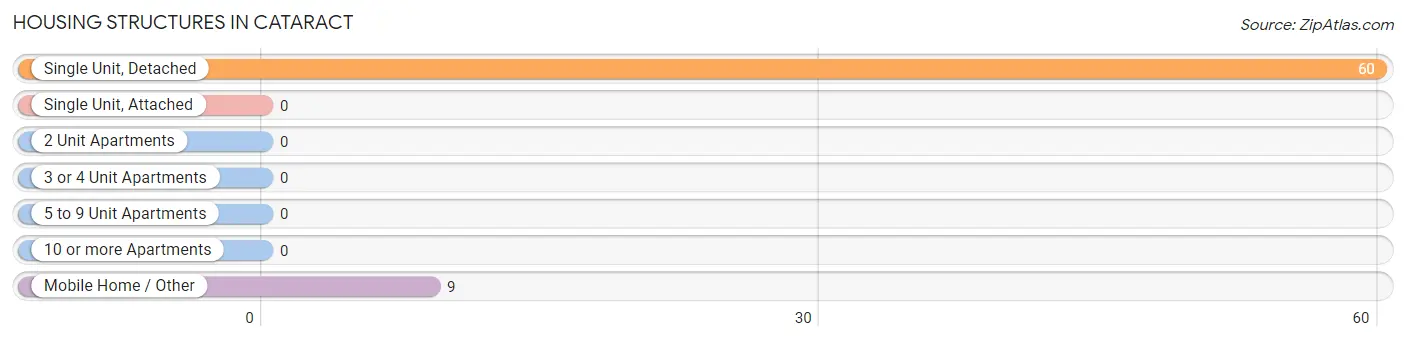
| Structure Type | # Housing Units | % Housing Units |
| Single Unit, Detached | 60 | 87.0% |
| Single Unit, Attached | 0 | 0.0% |
| 2 Unit Apartments | 0 | 0.0% |
| 3 or 4 Unit Apartments | 0 | 0.0% |
| 5 to 9 Unit Apartments | 0 | 0.0% |
| 10 or more Apartments | 0 | 0.0% |
| Mobile Home / Other | 9 | 13.0% |
| Total | 69 | 100.0% |
Housing Structures by Occupancy in Cataract
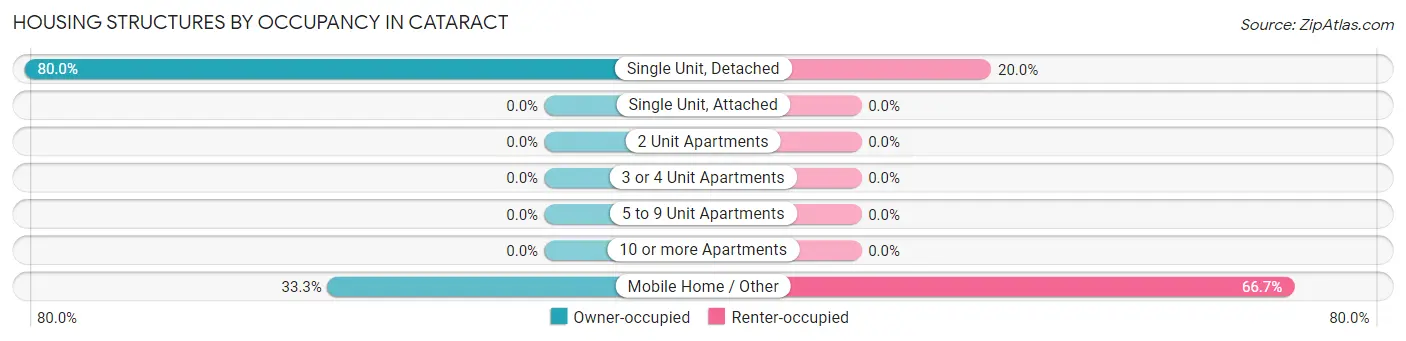
| Structure Type | Owner-occupied | Renter-occupied |
| Single Unit, Detached | 48 (80.0%) | 12 (20.0%) |
| Single Unit, Attached | 0 (0.0%) | 0 (0.0%) |
| 2 Unit Apartments | 0 (0.0%) | 0 (0.0%) |
| 3 or 4 Unit Apartments | 0 (0.0%) | 0 (0.0%) |
| 5 to 9 Unit Apartments | 0 (0.0%) | 0 (0.0%) |
| 10 or more Apartments | 0 (0.0%) | 0 (0.0%) |
| Mobile Home / Other | 3 (33.3%) | 6 (66.7%) |
| Total | 51 (73.9%) | 18 (26.1%) |
Housing Structures by Number of Rooms in Cataract
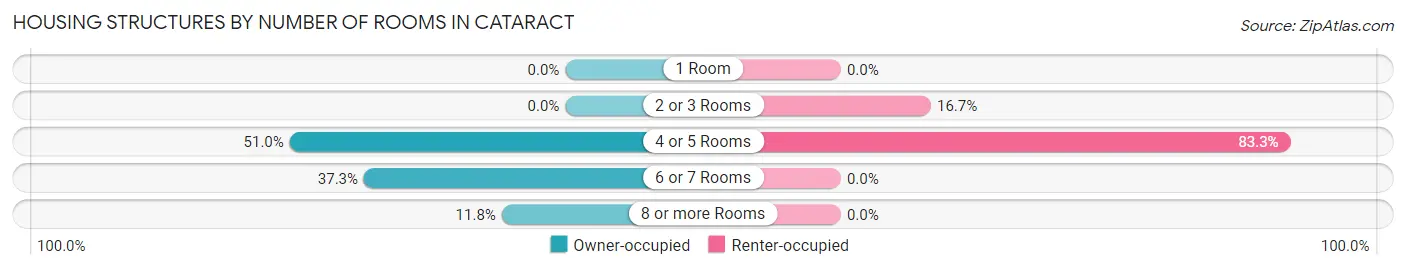
| Number of Rooms | Owner-occupied | Renter-occupied |
| 1 Room | 0 (0.0%) | 0 (0.0%) |
| 2 or 3 Rooms | 0 (0.0%) | 3 (16.7%) |
| 4 or 5 Rooms | 26 (51.0%) | 15 (83.3%) |
| 6 or 7 Rooms | 19 (37.2%) | 0 (0.0%) |
| 8 or more Rooms | 6 (11.8%) | 0 (0.0%) |
| Total | 51 (100.0%) | 18 (100.0%) |
Housing Structure by Heating Type in Cataract
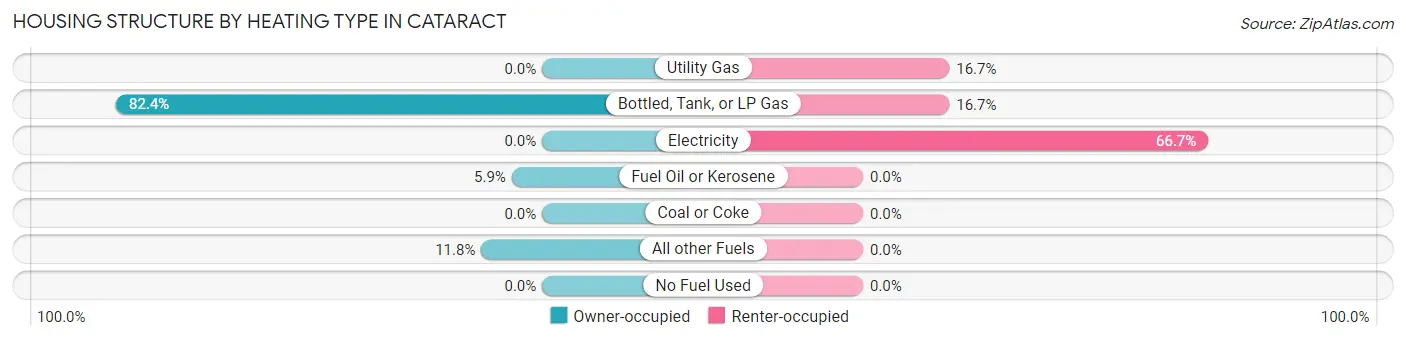
| Heating Type | Owner-occupied | Renter-occupied |
| Utility Gas | 0 (0.0%) | 3 (16.7%) |
| Bottled, Tank, or LP Gas | 42 (82.4%) | 3 (16.7%) |
| Electricity | 0 (0.0%) | 12 (66.7%) |
| Fuel Oil or Kerosene | 3 (5.9%) | 0 (0.0%) |
| Coal or Coke | 0 (0.0%) | 0 (0.0%) |
| All other Fuels | 6 (11.8%) | 0 (0.0%) |
| No Fuel Used | 0 (0.0%) | 0 (0.0%) |
| Total | 51 (100.0%) | 18 (100.0%) |
Household Vehicle Usage in Cataract
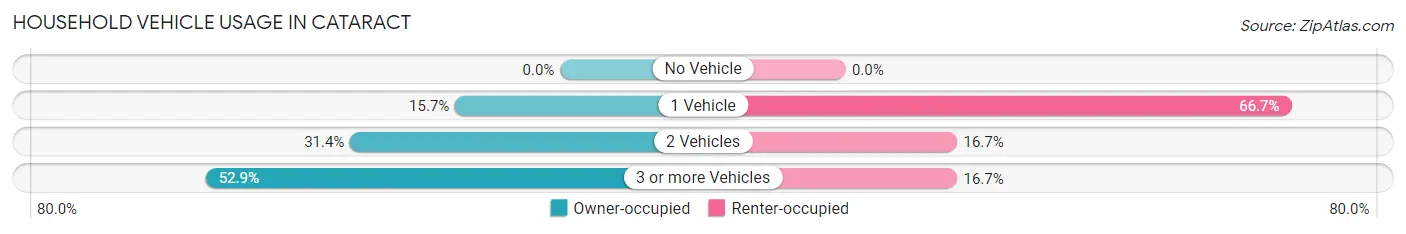
| Vehicles per Household | Owner-occupied | Renter-occupied |
| No Vehicle | 0 (0.0%) | 0 (0.0%) |
| 1 Vehicle | 8 (15.7%) | 12 (66.7%) |
| 2 Vehicles | 16 (31.4%) | 3 (16.7%) |
| 3 or more Vehicles | 27 (52.9%) | 3 (16.7%) |
| Total | 51 (100.0%) | 18 (100.0%) |
Real Estate & Mortgages in Cataract
Real Estate and Mortgage Overview in Cataract
| Characteristic | Without Mortgage | With Mortgage |
| Housing Units | 12 | 39 |
| Median Property Value | $162,500 | $0 |
| Median Household Income | $67,500 | $0 |
| Monthly Housing Costs | $550 | $0 |
| Real Estate Taxes | $2,000 | $0 |
Property Value by Mortgage Status in Cataract
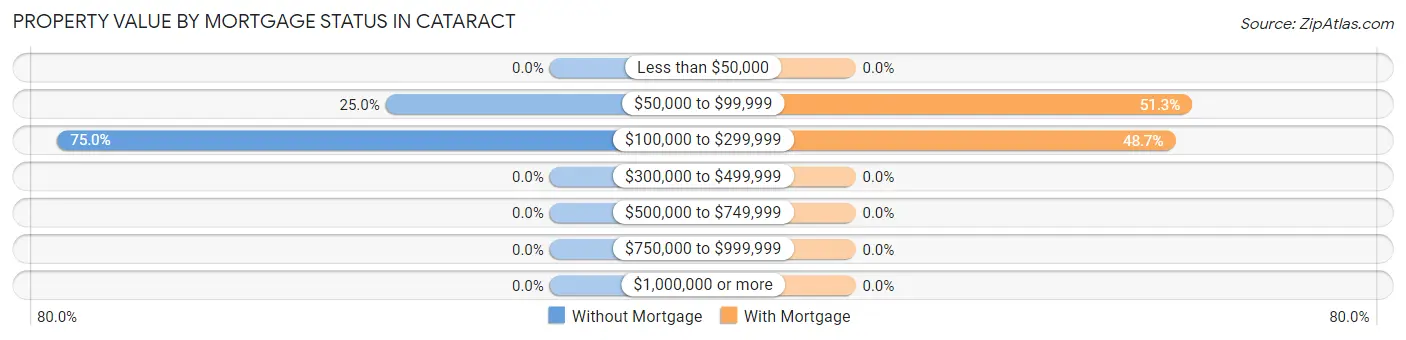
| Property Value | Without Mortgage | With Mortgage |
| Less than $50,000 | 0 (0.0%) | 0 (0.0%) |
| $50,000 to $99,999 | 3 (25.0%) | 20 (51.3%) |
| $100,000 to $299,999 | 9 (75.0%) | 19 (48.7%) |
| $300,000 to $499,999 | 0 (0.0%) | 0 (0.0%) |
| $500,000 to $749,999 | 0 (0.0%) | 0 (0.0%) |
| $750,000 to $999,999 | 0 (0.0%) | 0 (0.0%) |
| $1,000,000 or more | 0 (0.0%) | 0 (0.0%) |
| Total | 12 (100.0%) | 39 (100.0%) |
Household Income by Mortgage Status in Cataract
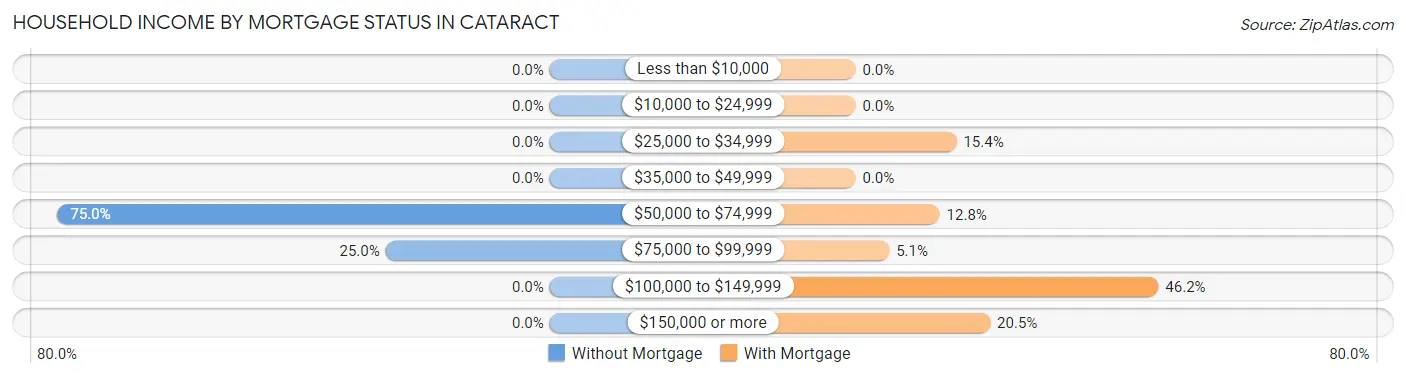
| Household Income | Without Mortgage | With Mortgage |
| Less than $10,000 | 0 (0.0%) | 0 (0.0%) |
| $10,000 to $24,999 | 0 (0.0%) | 0 (0.0%) |
| $25,000 to $34,999 | 0 (0.0%) | 6 (15.4%) |
| $35,000 to $49,999 | 0 (0.0%) | 0 (0.0%) |
| $50,000 to $74,999 | 9 (75.0%) | 5 (12.8%) |
| $75,000 to $99,999 | 3 (25.0%) | 2 (5.1%) |
| $100,000 to $149,999 | 0 (0.0%) | 18 (46.2%) |
| $150,000 or more | 0 (0.0%) | 8 (20.5%) |
| Total | 12 (100.0%) | 39 (100.0%) |
Property Value to Household Income Ratio in Cataract
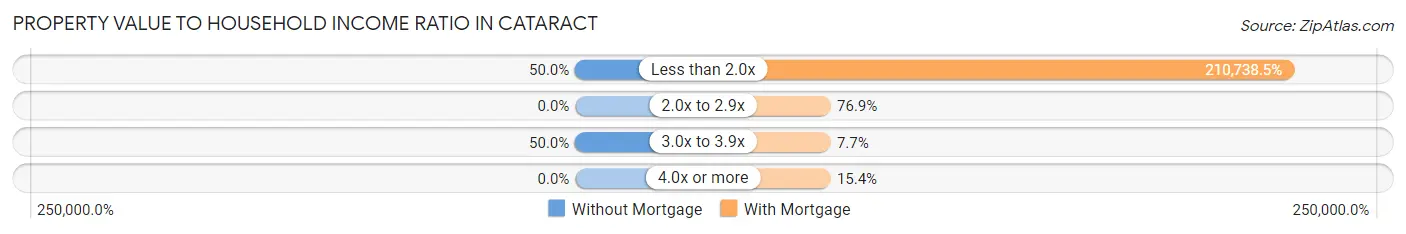
| Value-to-Income Ratio | Without Mortgage | With Mortgage |
| Less than 2.0x | 6 (50.0%) | 82,188 (210,738.5%) |
| 2.0x to 2.9x | 0 (0.0%) | 30 (76.9%) |
| 3.0x to 3.9x | 6 (50.0%) | 3 (7.7%) |
| 4.0x or more | 0 (0.0%) | 6 (15.4%) |
| Total | 12 (100.0%) | 39 (100.0%) |
Real Estate Taxes by Mortgage Status in Cataract
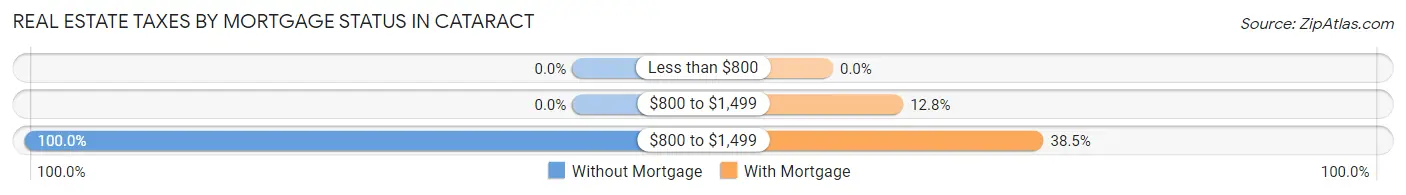
| Property Taxes | Without Mortgage | With Mortgage |
| Less than $800 | 0 (0.0%) | 0 (0.0%) |
| $800 to $1,499 | 0 (0.0%) | 5 (12.8%) |
| $800 to $1,499 | 12 (100.0%) | 15 (38.5%) |
| Total | 12 (100.0%) | 39 (100.0%) |
Health & Disability in Cataract
Health Insurance Coverage by Age in Cataract
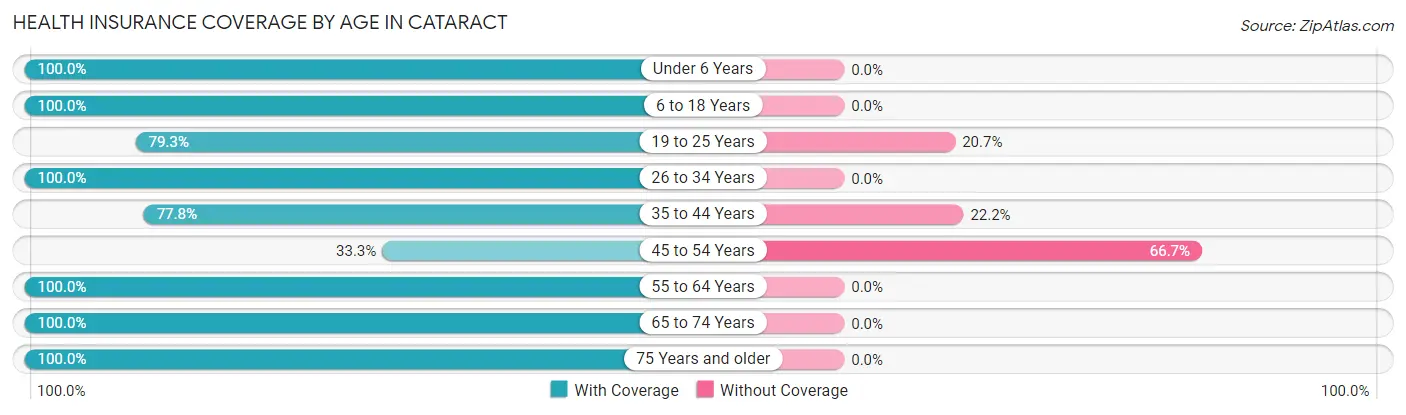
| Age Bracket | With Coverage | Without Coverage |
| Under 6 Years | 22 (100.0%) | 0 (0.0%) |
| 6 to 18 Years | 25 (100.0%) | 0 (0.0%) |
| 19 to 25 Years | 23 (79.3%) | 6 (20.7%) |
| 26 to 34 Years | 15 (100.0%) | 0 (0.0%) |
| 35 to 44 Years | 7 (77.8%) | 2 (22.2%) |
| 45 to 54 Years | 12 (33.3%) | 24 (66.7%) |
| 55 to 64 Years | 30 (100.0%) | 0 (0.0%) |
| 65 to 74 Years | 5 (100.0%) | 0 (0.0%) |
| 75 Years and older | 3 (100.0%) | 0 (0.0%) |
| Total | 142 (81.6%) | 32 (18.4%) |
Health Insurance Coverage by Citizenship Status in Cataract
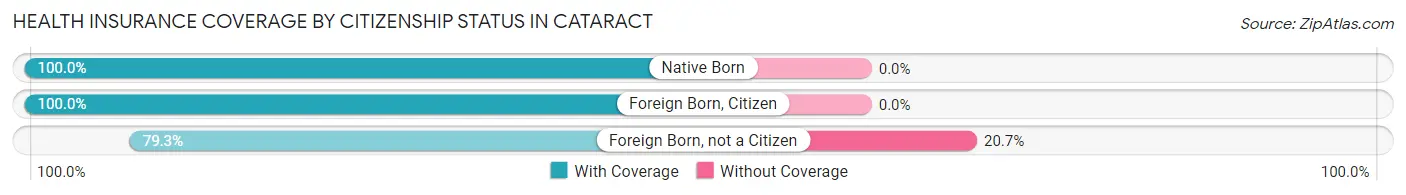
| Citizenship Status | With Coverage | Without Coverage |
| Native Born | 22 (100.0%) | 0 (0.0%) |
| Foreign Born, Citizen | 25 (100.0%) | 0 (0.0%) |
| Foreign Born, not a Citizen | 23 (79.3%) | 6 (20.7%) |
Health Insurance Coverage by Household Income in Cataract
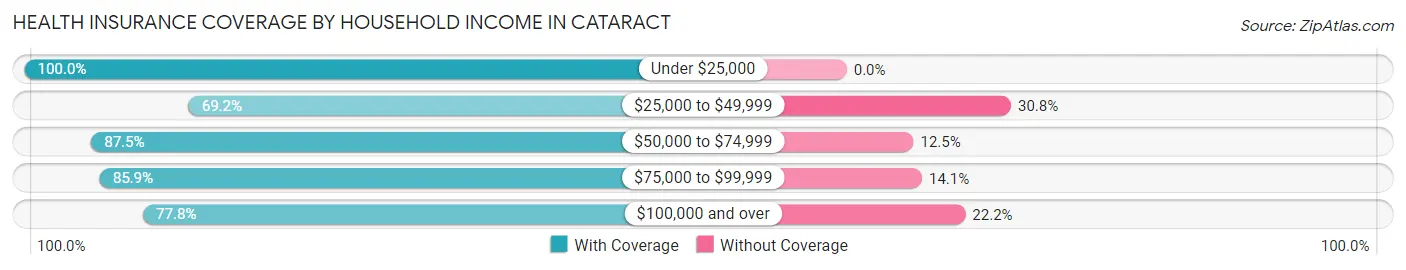
| Household Income | With Coverage | Without Coverage |
| Under $25,000 | 6 (100.0%) | 0 (0.0%) |
| $25,000 to $49,999 | 27 (69.2%) | 12 (30.8%) |
| $50,000 to $74,999 | 21 (87.5%) | 3 (12.5%) |
| $75,000 to $99,999 | 67 (85.9%) | 11 (14.1%) |
| $100,000 and over | 21 (77.8%) | 6 (22.2%) |
Public vs Private Health Insurance Coverage by Age in Cataract
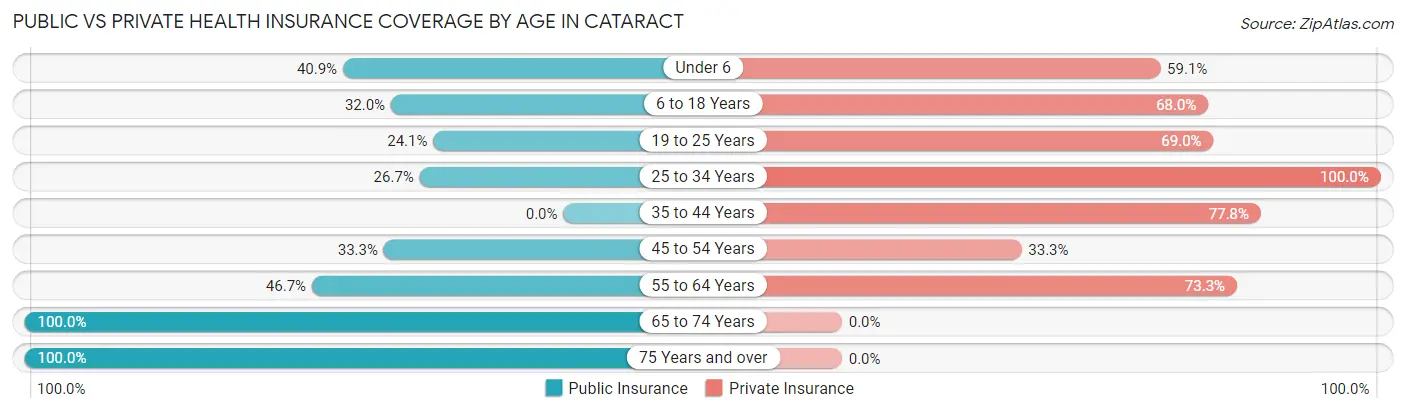
| Age Bracket | Public Insurance | Private Insurance |
| Under 6 | 9 (40.9%) | 13 (59.1%) |
| 6 to 18 Years | 8 (32.0%) | 17 (68.0%) |
| 19 to 25 Years | 7 (24.1%) | 20 (69.0%) |
| 25 to 34 Years | 4 (26.7%) | 15 (100.0%) |
| 35 to 44 Years | 0 (0.0%) | 7 (77.8%) |
| 45 to 54 Years | 12 (33.3%) | 12 (33.3%) |
| 55 to 64 Years | 14 (46.7%) | 22 (73.3%) |
| 65 to 74 Years | 5 (100.0%) | 0 (0.0%) |
| 75 Years and over | 3 (100.0%) | 0 (0.0%) |
| Total | 62 (35.6%) | 106 (60.9%) |
Disability Status by Sex by Age in Cataract
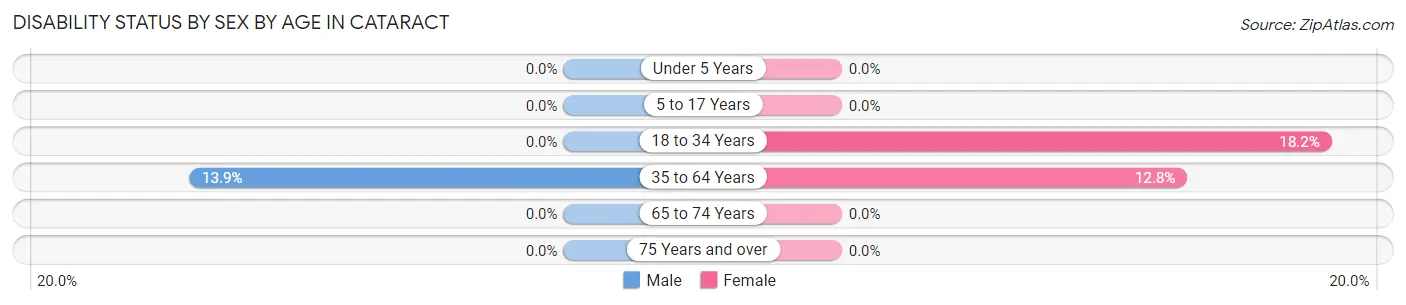
| Age Bracket | Male | Female |
| Under 5 Years | 0 (0.0%) | 0 (0.0%) |
| 5 to 17 Years | 0 (0.0%) | 0 (0.0%) |
| 18 to 34 Years | 0 (0.0%) | 4 (18.2%) |
| 35 to 64 Years | 5 (13.9%) | 5 (12.8%) |
| 65 to 74 Years | 0 (0.0%) | 0 (0.0%) |
| 75 Years and over | 0 (0.0%) | 0 (0.0%) |
Disability Class by Sex by Age in Cataract
Disability Class: Hearing Difficulty
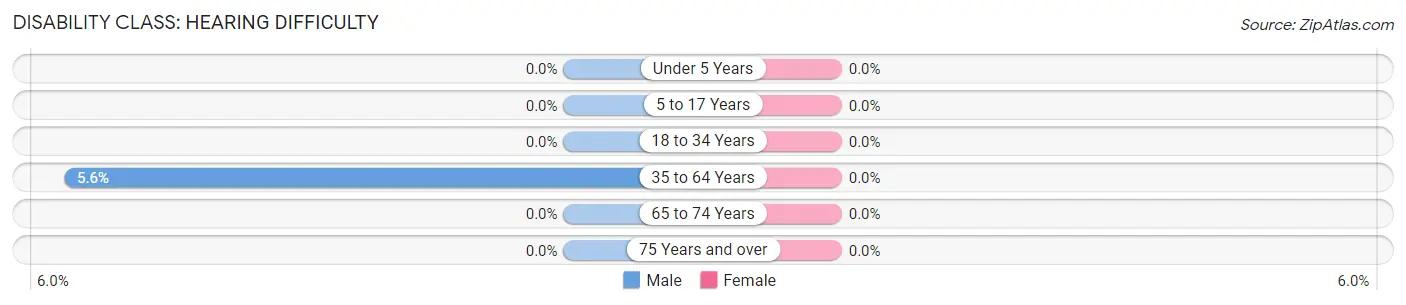
| Age Bracket | Male | Female |
| Under 5 Years | 0 (0.0%) | 0 (0.0%) |
| 5 to 17 Years | 0 (0.0%) | 0 (0.0%) |
| 18 to 34 Years | 0 (0.0%) | 0 (0.0%) |
| 35 to 64 Years | 2 (5.6%) | 0 (0.0%) |
| 65 to 74 Years | 0 (0.0%) | 0 (0.0%) |
| 75 Years and over | 0 (0.0%) | 0 (0.0%) |
Disability Class: Vision Difficulty
| Age Bracket | Male | Female |
| Under 5 Years | 0 (0.0%) | 0 (0.0%) |
| 5 to 17 Years | 0 (0.0%) | 0 (0.0%) |
| 18 to 34 Years | 0 (0.0%) | 0 (0.0%) |
| 35 to 64 Years | 0 (0.0%) | 0 (0.0%) |
| 65 to 74 Years | 0 (0.0%) | 0 (0.0%) |
| 75 Years and over | 0 (0.0%) | 0 (0.0%) |
Disability Class: Cognitive Difficulty
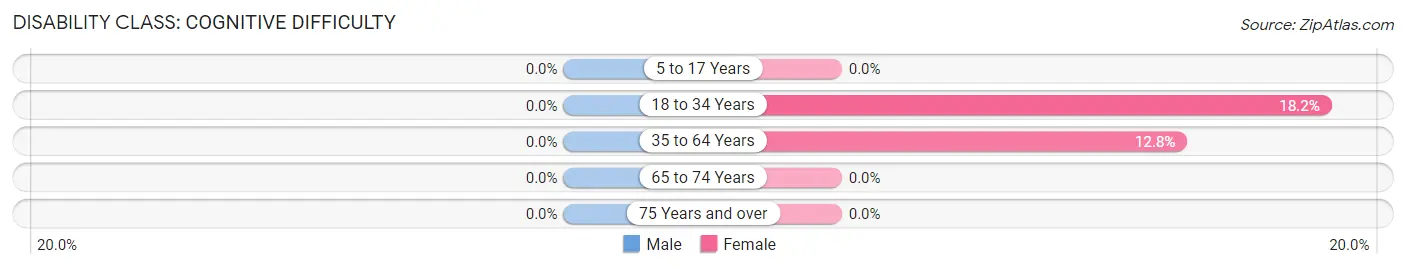
| Age Bracket | Male | Female |
| 5 to 17 Years | 0 (0.0%) | 0 (0.0%) |
| 18 to 34 Years | 0 (0.0%) | 4 (18.2%) |
| 35 to 64 Years | 0 (0.0%) | 5 (12.8%) |
| 65 to 74 Years | 0 (0.0%) | 0 (0.0%) |
| 75 Years and over | 0 (0.0%) | 0 (0.0%) |
Disability Class: Ambulatory Difficulty
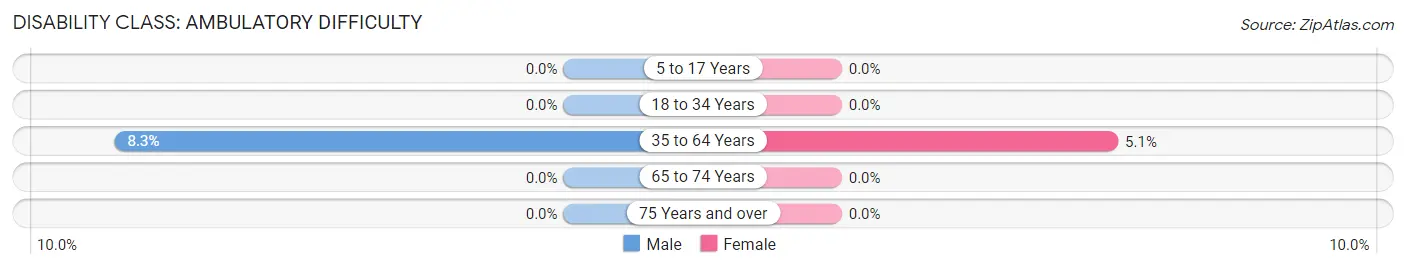
| Age Bracket | Male | Female |
| 5 to 17 Years | 0 (0.0%) | 0 (0.0%) |
| 18 to 34 Years | 0 (0.0%) | 0 (0.0%) |
| 35 to 64 Years | 3 (8.3%) | 2 (5.1%) |
| 65 to 74 Years | 0 (0.0%) | 0 (0.0%) |
| 75 Years and over | 0 (0.0%) | 0 (0.0%) |
Disability Class: Self-Care Difficulty
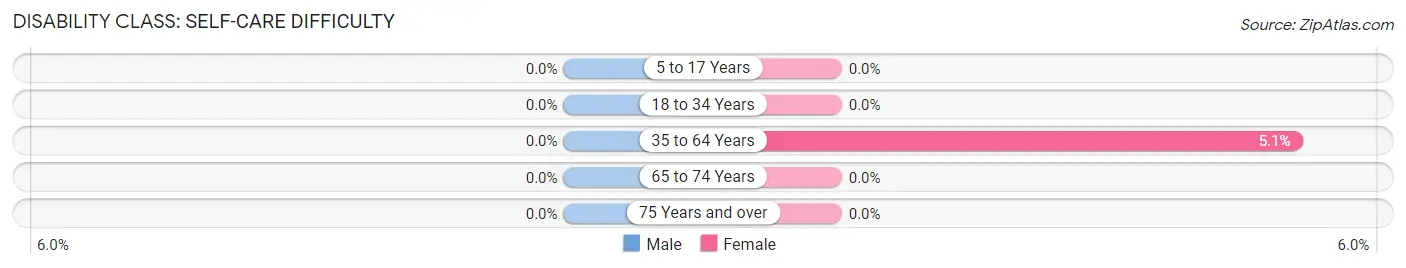
| Age Bracket | Male | Female |
| 5 to 17 Years | 0 (0.0%) | 0 (0.0%) |
| 18 to 34 Years | 0 (0.0%) | 0 (0.0%) |
| 35 to 64 Years | 0 (0.0%) | 2 (5.1%) |
| 65 to 74 Years | 0 (0.0%) | 0 (0.0%) |
| 75 Years and over | 0 (0.0%) | 0 (0.0%) |
Technology Access in Cataract
Computing Device Access in Cataract
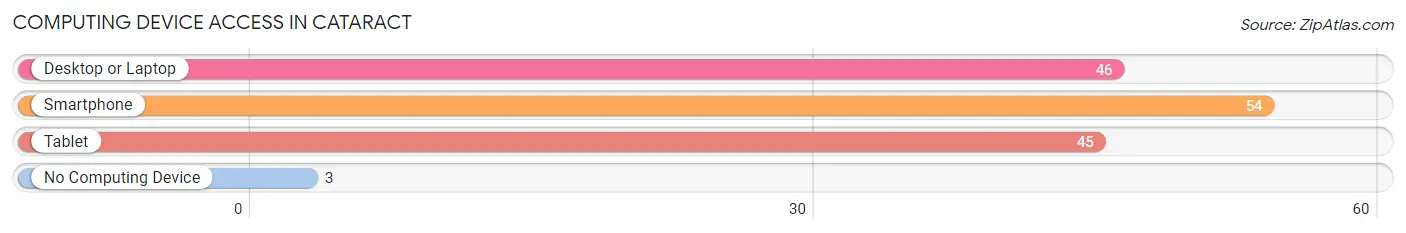
| Device Type | # Households | % Households |
| Desktop or Laptop | 46 | 66.7% |
| Smartphone | 54 | 78.3% |
| Tablet | 45 | 65.2% |
| No Computing Device | 3 | 4.3% |
| Total | 69 | 100.0% |
Internet Access in Cataract
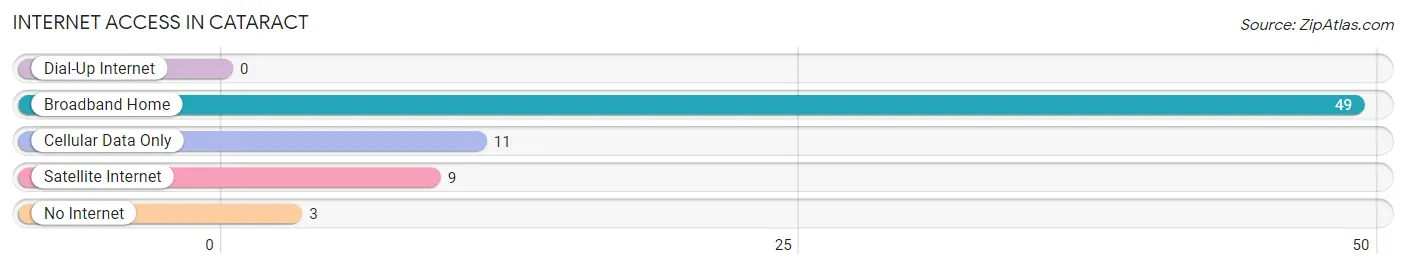
| Internet Type | # Households | % Households |
| Dial-Up Internet | 0 | 0.0% |
| Broadband Home | 49 | 71.0% |
| Cellular Data Only | 11 | 15.9% |
| Satellite Internet | 9 | 13.0% |
| No Internet | 3 | 4.3% |
| Total | 69 | 100.0% |
Cataract Summary
Cataract, Wisconsin is a small unincorporated community located in Monroe County, Wisconsin. It is situated on the banks of the Cataract Creek, a tributary of the La Crosse River. The community is located approximately 10 miles south of Sparta, Wisconsin and is part of the Sparta Micropolitan Statistical Area.
History
The area that is now Cataract, Wisconsin was first settled in the early 1800s by settlers from New England. The first settlers were primarily farmers and loggers who were attracted to the area by the abundance of timber and fertile soil. The first post office in the area was established in 1856 and the community was officially named Cataract in 1868.
The Cataract area was a popular destination for tourists in the late 19th and early 20th centuries. The area was known for its scenic beauty and was home to several resorts and hotels. The Cataract House, a popular hotel, was built in 1876 and was a popular destination for visitors from all over the Midwest.
Geography
Cataract, Wisconsin is located in Monroe County, Wisconsin. It is situated on the banks of the Cataract Creek, a tributary of the La Crosse River. The community is located approximately 10 miles south of Sparta, Wisconsin and is part of the Sparta Micropolitan Statistical Area.
The Cataract area is characterized by rolling hills and valleys. The area is heavily forested and is home to a variety of wildlife, including deer, turkey, and other small game. The Cataract Creek is a popular destination for fishing and canoeing.
Economy
The economy of Cataract, Wisconsin is largely based on agriculture and tourism. The area is home to several small family farms that produce a variety of crops, including corn, soybeans, and hay. The area is also home to several small businesses, including restaurants, convenience stores, and gas stations.
Tourism is an important part of the local economy. The area is home to several resorts and hotels, as well as a variety of outdoor recreational activities. The Cataract Creek is a popular destination for fishing and canoeing, and the area is also home to several hiking trails and other outdoor attractions.
Demographics
As of the 2010 census, the population of Cataract, Wisconsin was 1,093. The population is primarily white (97.3%) and the median age is 44. The median household income is $45,000 and the median home value is $125,000. The area is served by the Sparta School District.
Cataract, Wisconsin is a small, rural community with a strong sense of community and a rich history. The area is home to a variety of businesses and attractions, and is a popular destination for tourists and outdoor enthusiasts. The area is also home to a variety of wildlife and is a great place to live and work.
Common Questions
What is Per Capita Income in Cataract?
Per Capita income in Cataract is $27,786.
What is the Median Family Income in Cataract?
Median Family Income in Cataract is $71,250.
What is the Median Household income in Cataract?
Median Household Income in Cataract is $64,583.
What is Income or Wage Gap in Cataract?
Income or Wage Gap in Cataract is 21.1%.
Women in Cataract earn 78.9 cents for every dollar earned by a man.
What is Inequality or Gini Index in Cataract?
Inequality or Gini Index in Cataract is 0.25.
What is the Total Population of Cataract?
Total Population of Cataract is 174.
What is the Total Male Population of Cataract?
Total Male Population of Cataract is 93.
What is the Total Female Population of Cataract?
Total Female Population of Cataract is 81.
What is the Ratio of Males per 100 Females in Cataract?
There are 114.81 Males per 100 Females in Cataract.
What is the Ratio of Females per 100 Males in Cataract?
There are 87.10 Females per 100 Males in Cataract.
What is the Median Population Age in Cataract?
Median Population Age in Cataract is 31.8 Years.
What is the Average Family Size in Cataract
Average Family Size in Cataract is 3.4 People.
What is the Average Household Size in Cataract
Average Household Size in Cataract is 2.5 People.
How Large is the Labor Force in Cataract?
There are 101 People in the Labor Forcein in Cataract.
What is the Percentage of People in the Labor Force in Cataract?
79.5% of People are in the Labor Force in Cataract.