Cassville, WI Map & Demographics
Cassville Map
Cassville Overview
$34,395
PER CAPITA INCOME
$60,357
AVG FAMILY INCOME
$57,143
AVG HOUSEHOLD INCOME
70.0%
WAGE / INCOME GAP [ % ]
30.0¢/ $1
WAGE / INCOME GAP [ $ ]
0.40
INEQUALITY / GINI INDEX
731
TOTAL POPULATION
336
MALE POPULATION
395
FEMALE POPULATION
85.06
MALES / 100 FEMALES
117.56
FEMALES / 100 MALES
51.1
MEDIAN AGE
2.6
AVG FAMILY SIZE
2.2
AVG HOUSEHOLD SIZE
344
LABOR FORCE [ PEOPLE ]
54.0%
PERCENT IN LABOR FORCE
1.2%
UNEMPLOYMENT RATE
Cassville Zip Codes
Cassville Area Codes
Income in Cassville
Income Overview in Cassville
Per Capita Income in Cassville is $34,395, while median incomes of families and households are $60,357 and $57,143 respectively.
| Characteristic | Number | Measure |
| Per Capita Income | 731 | $34,395 |
| Median Family Income | 222 | $60,357 |
| Mean Family Income | 222 | $79,577 |
| Median Household Income | 332 | $57,143 |
| Mean Household Income | 332 | $68,299 |
| Income Deficit | 222 | $0 |
| Wage / Income Gap (%) | 731 | 70.00% |
| Wage / Income Gap ($) | 731 | 30.00¢ per $1 |
| Gini / Inequality Index | 731 | 0.40 |
Earnings by Sex in Cassville
Average Earnings in Cassville are $40,061, $50,000 for men and $15,000 for women, a difference of 70.0%.
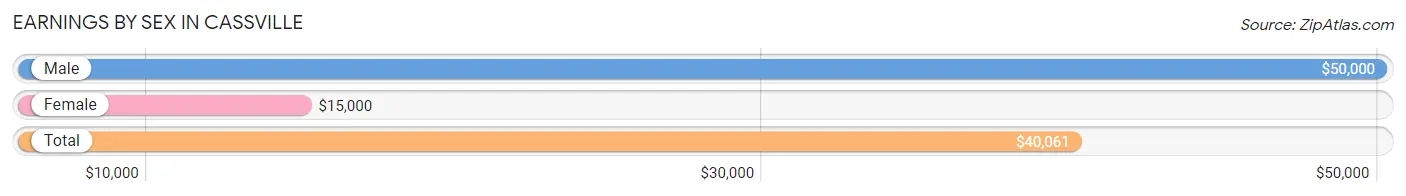
| Sex | Number | Average Earnings |
| Male | 204 (56.4%) | $50,000 |
| Female | 158 (43.6%) | $15,000 |
| Total | 362 (100.0%) | $40,061 |
Earnings by Sex by Income Bracket in Cassville
The most common earnings brackets in Cassville are $50,000 to $54,999 for men (34 | 16.7%) and $5,000 to $7,499 for women (25 | 15.8%).
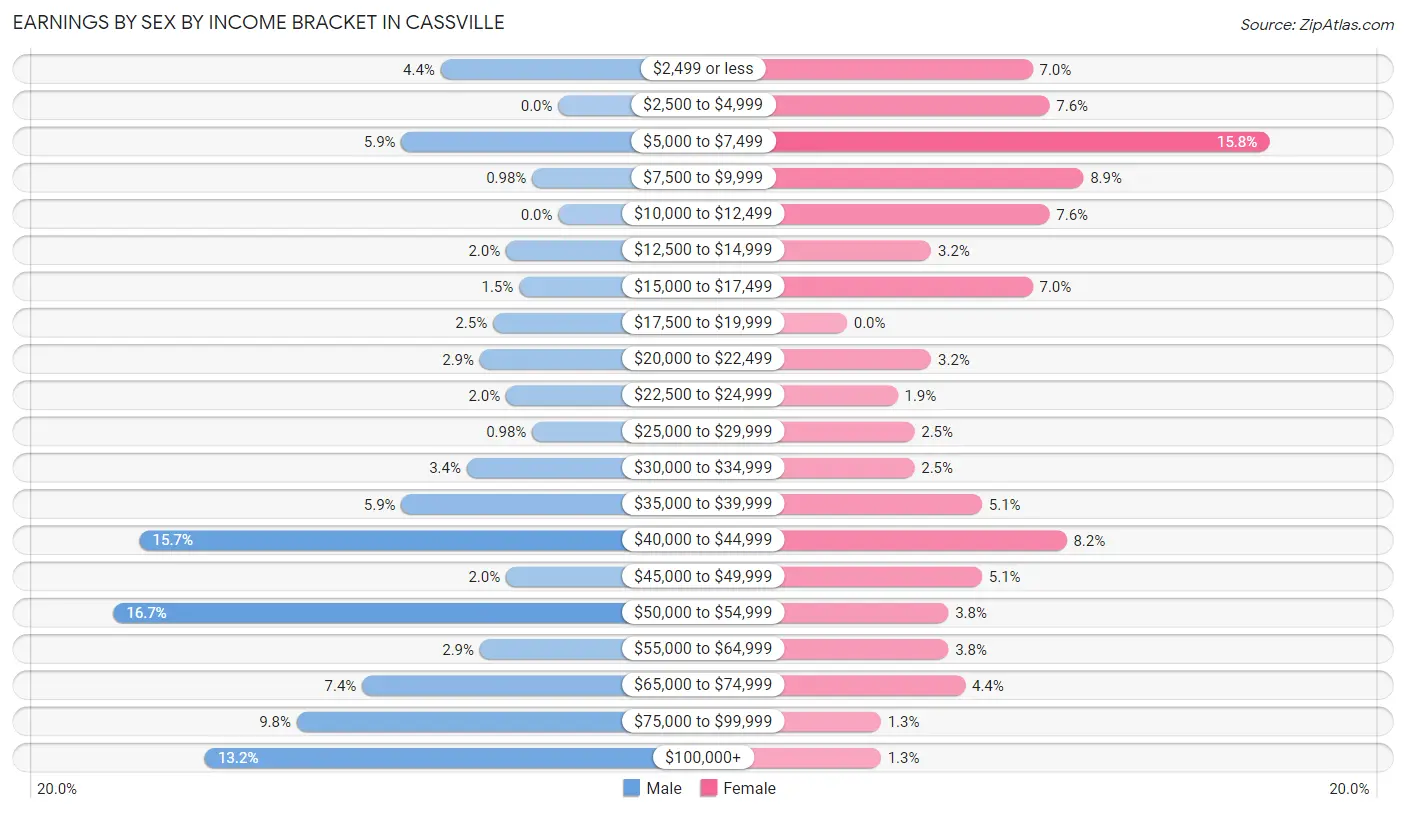
| Income | Male | Female |
| $2,499 or less | 9 (4.4%) | 11 (7.0%) |
| $2,500 to $4,999 | 0 (0.0%) | 12 (7.6%) |
| $5,000 to $7,499 | 12 (5.9%) | 25 (15.8%) |
| $7,500 to $9,999 | 2 (1.0%) | 14 (8.9%) |
| $10,000 to $12,499 | 0 (0.0%) | 12 (7.6%) |
| $12,500 to $14,999 | 4 (2.0%) | 5 (3.2%) |
| $15,000 to $17,499 | 3 (1.5%) | 11 (7.0%) |
| $17,500 to $19,999 | 5 (2.5%) | 0 (0.0%) |
| $20,000 to $22,499 | 6 (2.9%) | 5 (3.2%) |
| $22,500 to $24,999 | 4 (2.0%) | 3 (1.9%) |
| $25,000 to $29,999 | 2 (1.0%) | 4 (2.5%) |
| $30,000 to $34,999 | 7 (3.4%) | 4 (2.5%) |
| $35,000 to $39,999 | 12 (5.9%) | 8 (5.1%) |
| $40,000 to $44,999 | 32 (15.7%) | 13 (8.2%) |
| $45,000 to $49,999 | 4 (2.0%) | 8 (5.1%) |
| $50,000 to $54,999 | 34 (16.7%) | 6 (3.8%) |
| $55,000 to $64,999 | 6 (2.9%) | 6 (3.8%) |
| $65,000 to $74,999 | 15 (7.3%) | 7 (4.4%) |
| $75,000 to $99,999 | 20 (9.8%) | 2 (1.3%) |
| $100,000+ | 27 (13.2%) | 2 (1.3%) |
| Total | 204 (100.0%) | 158 (100.0%) |
Earnings by Sex by Educational Attainment in Cassville
Average earnings in Cassville are $50,278 for men and $17,159 for women, a difference of 65.9%. Men with an educational attainment of college or associate's degree enjoy the highest average annual earnings of $88,500, while those with bachelor's degree education earn the least with $42,143. Women with an educational attainment of bachelor's degree earn the most with the average annual earnings of $28,750, while those with high school diploma education have the smallest earnings of $16,071.
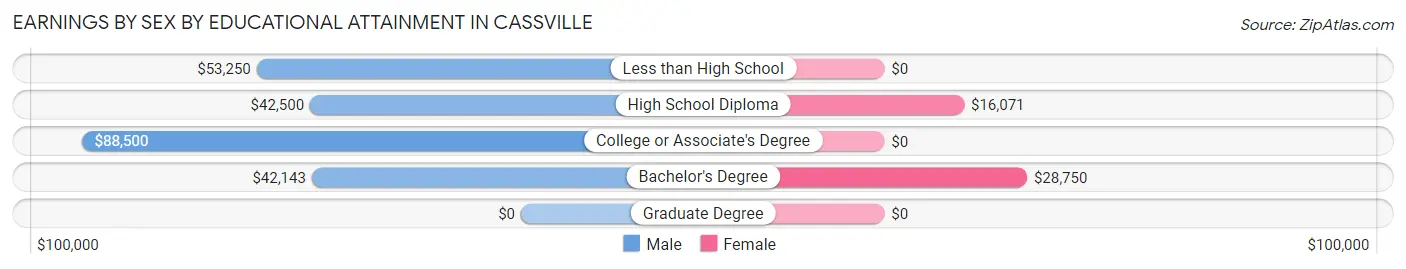
| Educational Attainment | Male Income | Female Income |
| Less than High School | $53,250 | $0 |
| High School Diploma | $42,500 | $16,071 |
| College or Associate's Degree | $88,500 | $0 |
| Bachelor's Degree | $42,143 | $28,750 |
| Graduate Degree | - | - |
| Total | $50,278 | $17,159 |
Family Income in Cassville
Family Income Brackets in Cassville
According to the Cassville family income data, there are 70 families falling into the $50,000 to $74,999 income range, which is the most common income bracket and makes up 31.5% of all families. Conversely, the $10,000 to $14,999 income bracket is the least frequent group with only 6 families (2.7%) belonging to this category.
| Income Bracket | # Families | % Families |
| Less than $10,000 | 11 | 5.0% |
| $10,000 to $14,999 | 6 | 2.7% |
| $15,000 to $24,999 | 10 | 4.5% |
| $25,000 to $34,999 | 10 | 4.5% |
| $35,000 to $49,999 | 21 | 9.5% |
| $50,000 to $74,999 | 70 | 31.5% |
| $75,000 to $99,999 | 41 | 18.5% |
| $100,000 to $149,999 | 27 | 12.2% |
| $150,000 to $199,999 | 9 | 4.1% |
| $200,000+ | 17 | 7.7% |
Family Income by Famaliy Size in Cassville
4-person families (18 | 8.1%) account for the highest median family income in Cassville with $128,000 per family, while 4-person families (18 | 8.1%) have the highest median income of $32,000 per family member.
| Income Bracket | # Families | Median Income |
| 2-Person Families | 161 (72.5%) | $54,821 |
| 3-Person Families | 33 (14.9%) | $0 |
| 4-Person Families | 18 (8.1%) | $128,000 |
| 5-Person Families | 8 (3.6%) | $70,833 |
| 6-Person Families | 2 (0.9%) | $0 |
| 7+ Person Families | 0 (0.0%) | $0 |
| Total | 222 (100.0%) | $60,357 |
Family Income by Number of Earners in Cassville
The median family income in Cassville is $60,357, with families comprising 3+ earners (7) having the highest median family income of $123,125, while families with 1 earner (83) have the lowest median family income of $51,597, accounting for 3.2% and 37.4% of families, respectively.
| Number of Earners | # Families | Median Income |
| No Earners | 49 (22.1%) | $54,107 |
| 1 Earner | 83 (37.4%) | $51,597 |
| 2 Earners | 83 (37.4%) | $91,250 |
| 3+ Earners | 7 (3.2%) | $123,125 |
| Total | 222 (100.0%) | $60,357 |
Household Income in Cassville
Household Income Brackets in Cassville
With 86 households falling in the category, the $50,000 to $74,999 income range is the most frequent in Cassville, accounting for 25.9% of all households. In contrast, only 9 households (2.7%) fall into the $150,000 to $199,999 income bracket, making it the least populous group.
| Income Bracket | # Households | % Households |
| Less than $10,000 | 17 | 5.1% |
| $10,000 to $14,999 | 14 | 4.2% |
| $15,000 to $24,999 | 31 | 9.3% |
| $25,000 to $34,999 | 19 | 5.7% |
| $35,000 to $49,999 | 49 | 14.8% |
| $50,000 to $74,999 | 86 | 25.9% |
| $75,000 to $99,999 | 63 | 19.0% |
| $100,000 to $149,999 | 27 | 8.1% |
| $150,000 to $199,999 | 9 | 2.7% |
| $200,000+ | 17 | 5.1% |
Household Income by Householder Age in Cassville
The median household income in Cassville is $57,143, with the highest median household income of $59,922 found in the 25 to 44 years age bracket for the primary householder. A total of 75 households (22.6%) fall into this category. Meanwhile, the 15 to 24 years age bracket for the primary householder has the lowest median household income of $0, with 8 households (2.4%) in this group.
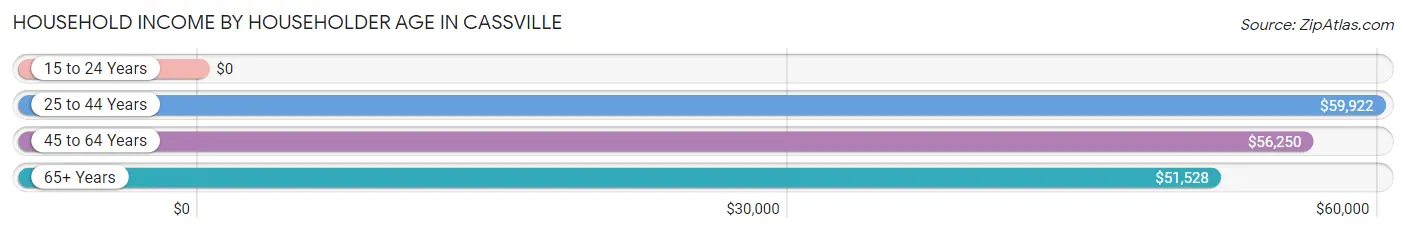
| Income Bracket | # Households | Median Income |
| 15 to 24 Years | 8 (2.4%) | $0 |
| 25 to 44 Years | 75 (22.6%) | $59,922 |
| 45 to 64 Years | 104 (31.3%) | $56,250 |
| 65+ Years | 145 (43.7%) | $51,528 |
| Total | 332 (100.0%) | $57,143 |
Poverty in Cassville
Income Below Poverty by Sex and Age in Cassville
With 3.3% poverty level for males and 23.0% for females among the residents of Cassville, 55 to 64 year old males and 25 to 34 year old females are the most vulnerable to poverty, with 5 males (10.2%) and 33 females (68.8%) in their respective age groups living below the poverty level.
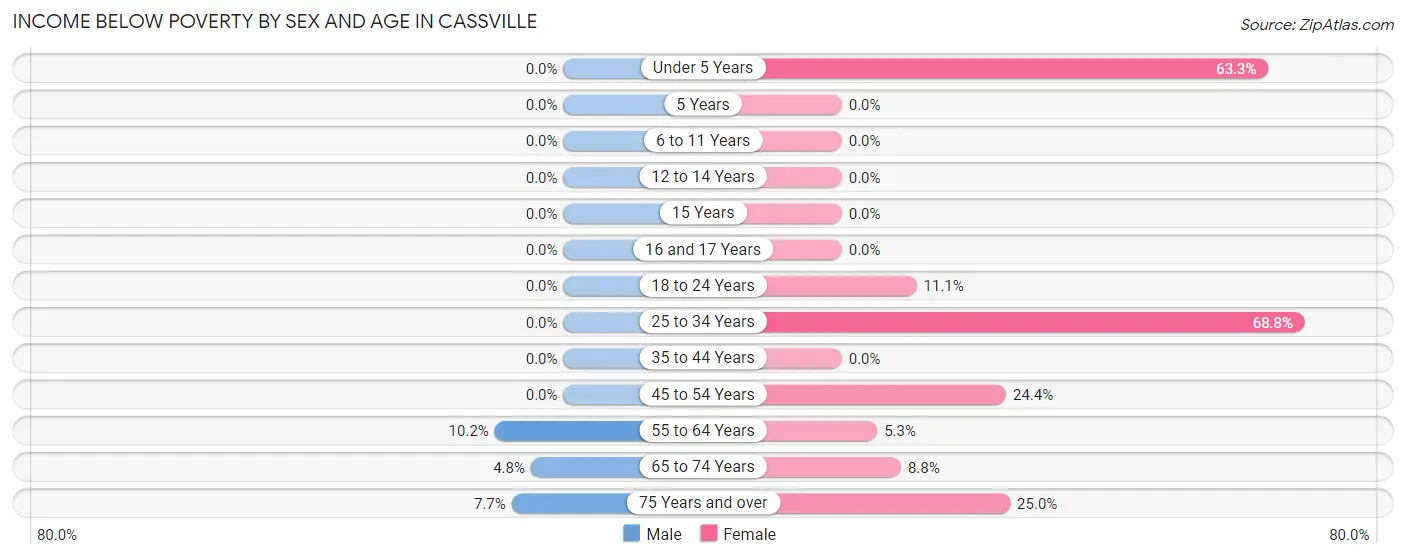
| Age Bracket | Male | Female |
| Under 5 Years | 0 (0.0%) | 19 (63.3%) |
| 5 Years | 0 (0.0%) | 0 (0.0%) |
| 6 to 11 Years | 0 (0.0%) | 0 (0.0%) |
| 12 to 14 Years | 0 (0.0%) | 0 (0.0%) |
| 15 Years | 0 (0.0%) | 0 (0.0%) |
| 16 and 17 Years | 0 (0.0%) | 0 (0.0%) |
| 18 to 24 Years | 0 (0.0%) | 3 (11.1%) |
| 25 to 34 Years | 0 (0.0%) | 33 (68.8%) |
| 35 to 44 Years | 0 (0.0%) | 0 (0.0%) |
| 45 to 54 Years | 0 (0.0%) | 10 (24.4%) |
| 55 to 64 Years | 5 (10.2%) | 2 (5.3%) |
| 65 to 74 Years | 3 (4.8%) | 8 (8.8%) |
| 75 Years and over | 3 (7.7%) | 16 (25.0%) |
| Total | 11 (3.3%) | 91 (23.0%) |
Income Above Poverty by Sex and Age in Cassville
According to the poverty statistics in Cassville, males aged under 5 years and females aged 6 to 11 years are the age groups that are most secure financially, with 100.0% of males and 100.0% of females in these age groups living above the poverty line.
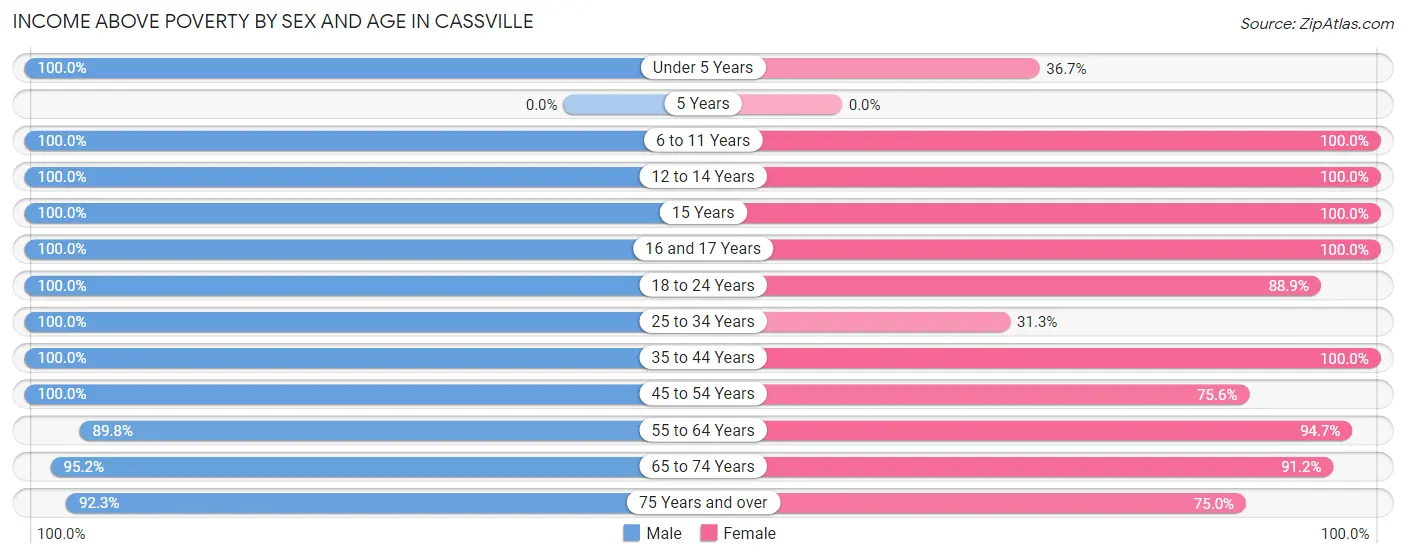
| Age Bracket | Male | Female |
| Under 5 Years | 25 (100.0%) | 11 (36.7%) |
| 5 Years | 0 (0.0%) | 0 (0.0%) |
| 6 to 11 Years | 8 (100.0%) | 9 (100.0%) |
| 12 to 14 Years | 2 (100.0%) | 11 (100.0%) |
| 15 Years | 4 (100.0%) | 5 (100.0%) |
| 16 and 17 Years | 5 (100.0%) | 8 (100.0%) |
| 18 to 24 Years | 33 (100.0%) | 24 (88.9%) |
| 25 to 34 Years | 30 (100.0%) | 15 (31.2%) |
| 35 to 44 Years | 38 (100.0%) | 23 (100.0%) |
| 45 to 54 Years | 41 (100.0%) | 31 (75.6%) |
| 55 to 64 Years | 44 (89.8%) | 36 (94.7%) |
| 65 to 74 Years | 59 (95.2%) | 83 (91.2%) |
| 75 Years and over | 36 (92.3%) | 48 (75.0%) |
| Total | 325 (96.7%) | 304 (77.0%) |
Income Below Poverty Among Married-Couple Families in Cassville
The poverty statistics for married-couple families in Cassville show that 4.1% or 6 of the total 145 families live below the poverty line. Families with no children have the highest poverty rate of 5.3%, comprising of 6 families. On the other hand, families with 1 or 2 children have the lowest poverty rate of 0.0%, which includes 0 families.
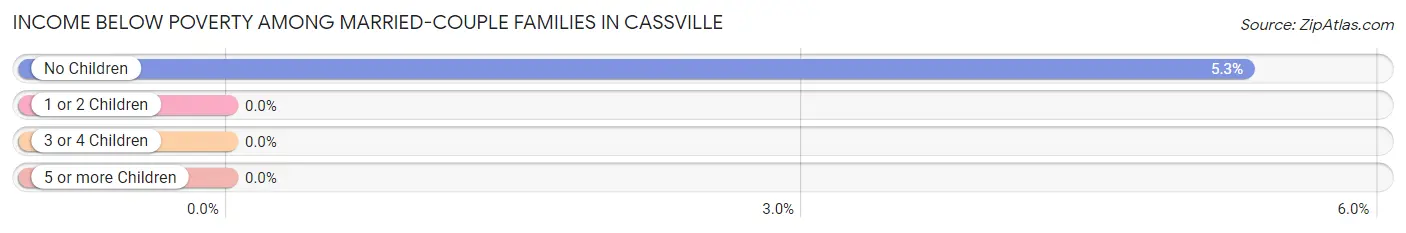
| Children | Above Poverty | Below Poverty |
| No Children | 107 (94.7%) | 6 (5.3%) |
| 1 or 2 Children | 24 (100.0%) | 0 (0.0%) |
| 3 or 4 Children | 8 (100.0%) | 0 (0.0%) |
| 5 or more Children | 0 (0.0%) | 0 (0.0%) |
| Total | 139 (95.9%) | 6 (4.1%) |
Income Below Poverty Among Single-Parent Households in Cassville
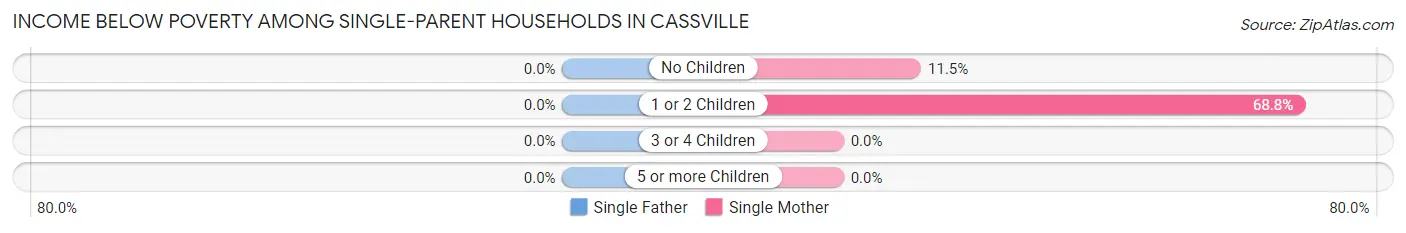
| Children | Single Father | Single Mother |
| No Children | 0 (0.0%) | 3 (11.5%) |
| 1 or 2 Children | 0 (0.0%) | 11 (68.8%) |
| 3 or 4 Children | 0 (0.0%) | 0 (0.0%) |
| 5 or more Children | 0 (0.0%) | 0 (0.0%) |
| Total | 0 (0.0%) | 14 (31.1%) |
Income Below Poverty Among Married-Couple vs Single-Parent Households in Cassville
The poverty data for Cassville shows that 6 of the married-couple family households (4.1%) and 14 of the single-parent households (18.2%) are living below the poverty level. Within the married-couple family households, those with no children have the highest poverty rate, with 6 households (5.3%) falling below the poverty line. Among the single-parent households, those with 1 or 2 children have the highest poverty rate, with 11 household (28.9%) living below poverty.
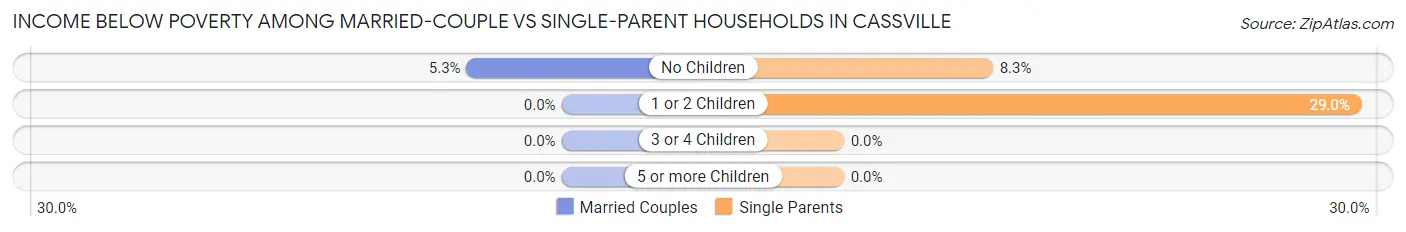
| Children | Married-Couple Families | Single-Parent Households |
| No Children | 6 (5.3%) | 3 (8.3%) |
| 1 or 2 Children | 0 (0.0%) | 11 (28.9%) |
| 3 or 4 Children | 0 (0.0%) | 0 (0.0%) |
| 5 or more Children | 0 (0.0%) | 0 (0.0%) |
| Total | 6 (4.1%) | 14 (18.2%) |
Race in Cassville
The most populous races in Cassville are White / Caucasian (730 | 99.9%), Hispanic or Latino (1 | 0.1%), and Two or more Races (1 | 0.1%).
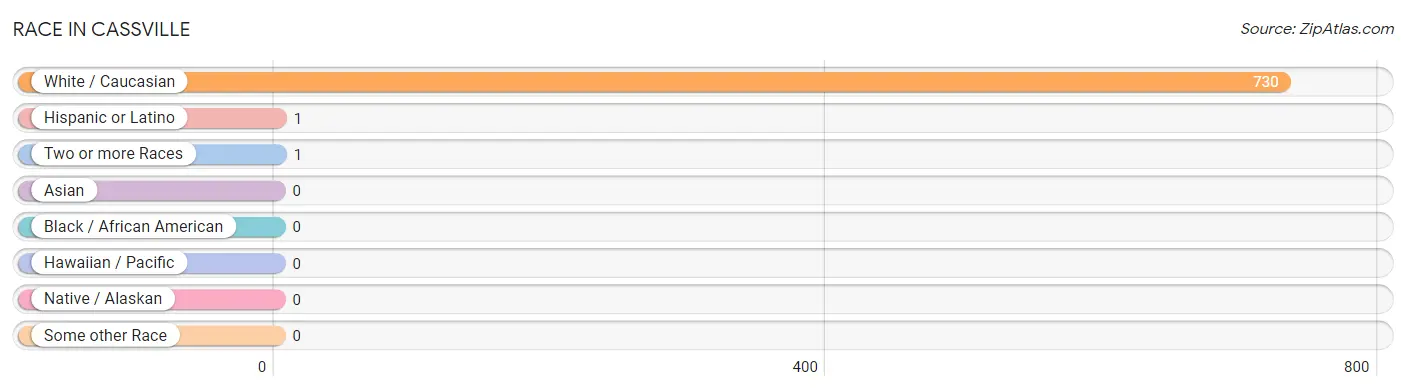
| Race | # Population | % Population |
| Asian | 0 | 0.0% |
| Black / African American | 0 | 0.0% |
| Hawaiian / Pacific | 0 | 0.0% |
| Hispanic or Latino | 1 | 0.1% |
| Native / Alaskan | 0 | 0.0% |
| White / Caucasian | 730 | 99.9% |
| Two or more Races | 1 | 0.1% |
| Some other Race | 0 | 0.0% |
| Total | 731 | 100.0% |
Ancestry in Cassville
The most populous ancestries reported in Cassville are German (404 | 55.3%), English (97 | 13.3%), Irish (82 | 11.2%), Norwegian (41 | 5.6%), and Arab (26 | 3.6%), together accounting for 88.9% of all Cassville residents.
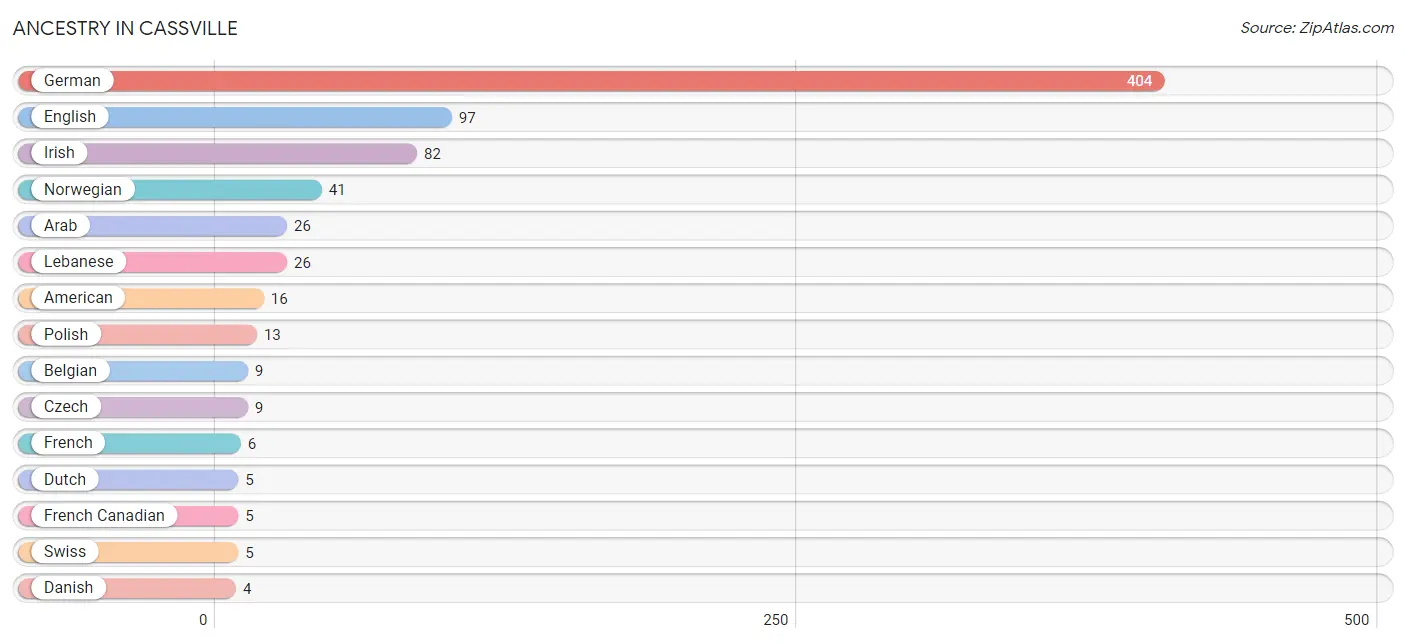
| Ancestry | # Population | % Population |
| American | 16 | 2.2% |
| Arab | 26 | 3.6% |
| Belgian | 9 | 1.2% |
| Croatian | 3 | 0.4% |
| Czech | 9 | 1.2% |
| Danish | 4 | 0.5% |
| Dutch | 5 | 0.7% |
| English | 97 | 13.3% |
| European | 2 | 0.3% |
| French | 6 | 0.8% |
| French Canadian | 5 | 0.7% |
| German | 404 | 55.3% |
| Hungarian | 3 | 0.4% |
| Irish | 82 | 11.2% |
| Lebanese | 26 | 3.6% |
| Norwegian | 41 | 5.6% |
| Polish | 13 | 1.8% |
| Romanian | 2 | 0.3% |
| Scottish | 3 | 0.4% |
| Spaniard | 1 | 0.1% |
| Swiss | 5 | 0.7% | View All 21 Rows |
Immigrants in Cassville

| Immigration Origin | # Population | % Population | View All 0 Rows |
Sex and Age in Cassville
Sex and Age in Cassville
The most populous age groups in Cassville are 65 to 69 Years (41 | 12.2%) for men and 65 to 69 Years (76 | 19.2%) for women.
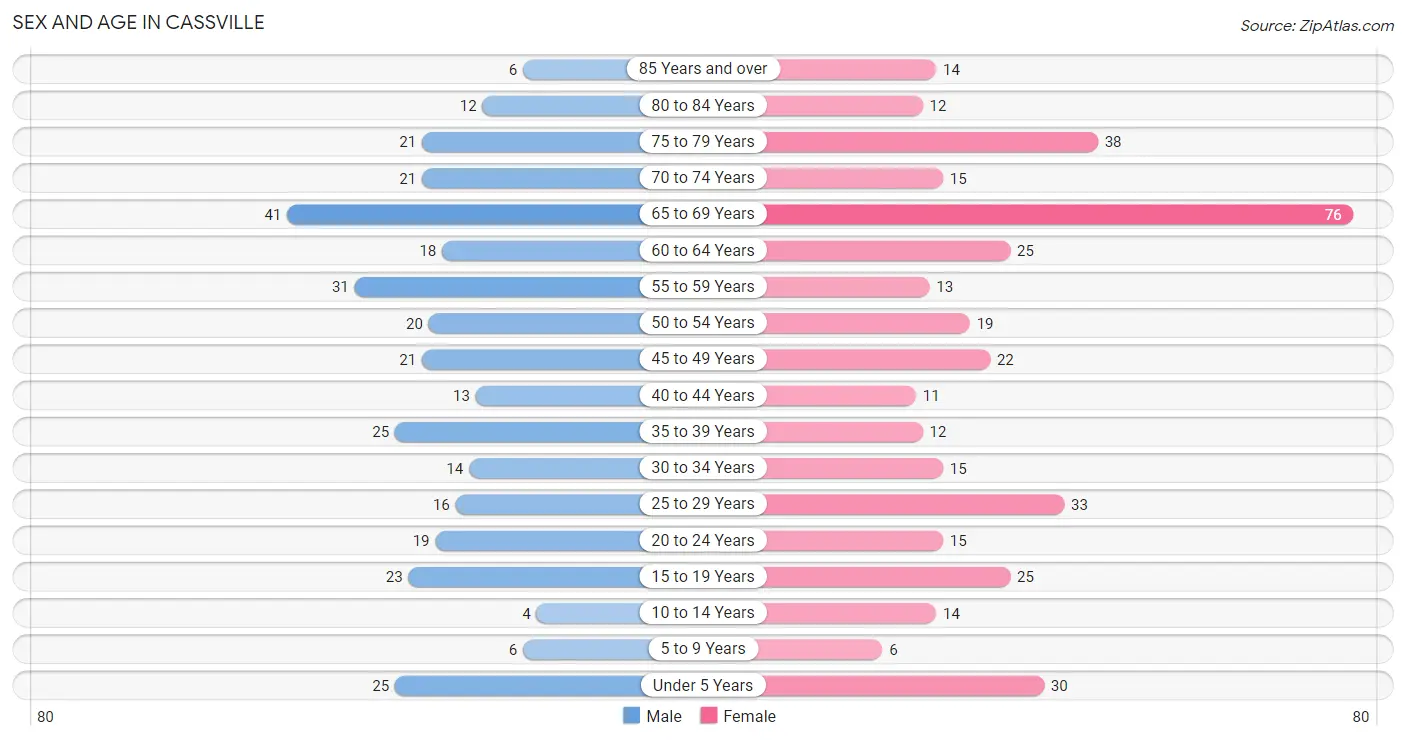
| Age Bracket | Male | Female |
| Under 5 Years | 25 (7.4%) | 30 (7.6%) |
| 5 to 9 Years | 6 (1.8%) | 6 (1.5%) |
| 10 to 14 Years | 4 (1.2%) | 14 (3.5%) |
| 15 to 19 Years | 23 (6.9%) | 25 (6.3%) |
| 20 to 24 Years | 19 (5.7%) | 15 (3.8%) |
| 25 to 29 Years | 16 (4.8%) | 33 (8.4%) |
| 30 to 34 Years | 14 (4.2%) | 15 (3.8%) |
| 35 to 39 Years | 25 (7.4%) | 12 (3.0%) |
| 40 to 44 Years | 13 (3.9%) | 11 (2.8%) |
| 45 to 49 Years | 21 (6.2%) | 22 (5.6%) |
| 50 to 54 Years | 20 (5.9%) | 19 (4.8%) |
| 55 to 59 Years | 31 (9.2%) | 13 (3.3%) |
| 60 to 64 Years | 18 (5.4%) | 25 (6.3%) |
| 65 to 69 Years | 41 (12.2%) | 76 (19.2%) |
| 70 to 74 Years | 21 (6.2%) | 15 (3.8%) |
| 75 to 79 Years | 21 (6.2%) | 38 (9.6%) |
| 80 to 84 Years | 12 (3.6%) | 12 (3.0%) |
| 85 Years and over | 6 (1.8%) | 14 (3.5%) |
| Total | 336 (100.0%) | 395 (100.0%) |
Families and Households in Cassville
Median Family Size in Cassville
The median family size in Cassville is 2.62 persons per family, with married-couple families (145 | 65.3%) accounting for the largest median family size of 2.76 persons per family. On the other hand, single male/father families (32 | 14.4%) represent the smallest median family size with 2.34 persons per family.
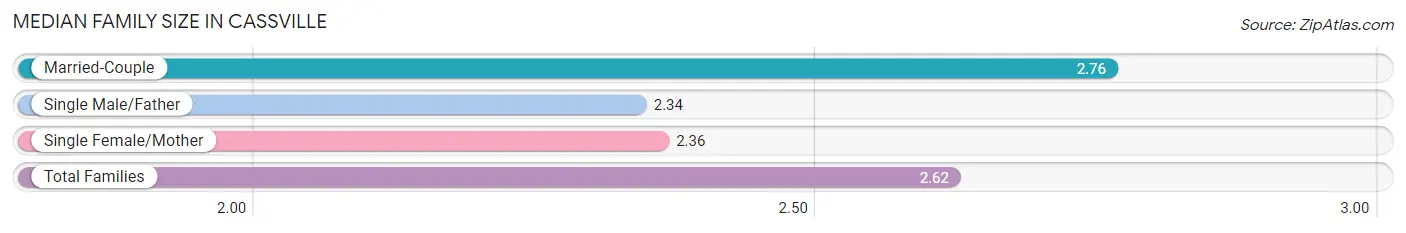
| Family Type | # Families | Family Size |
| Married-Couple | 145 (65.3%) | 2.76 |
| Single Male/Father | 32 (14.4%) | 2.34 |
| Single Female/Mother | 45 (20.3%) | 2.36 |
| Total Families | 222 (100.0%) | 2.62 |
Median Household Size in Cassville
The median household size in Cassville is 2.20 persons per household, with single male/father households (32 | 9.6%) accounting for the largest median household size of 2.88 persons per household. non-family households (110 | 33.1%) represent the smallest median household size with 1.06 persons per household.
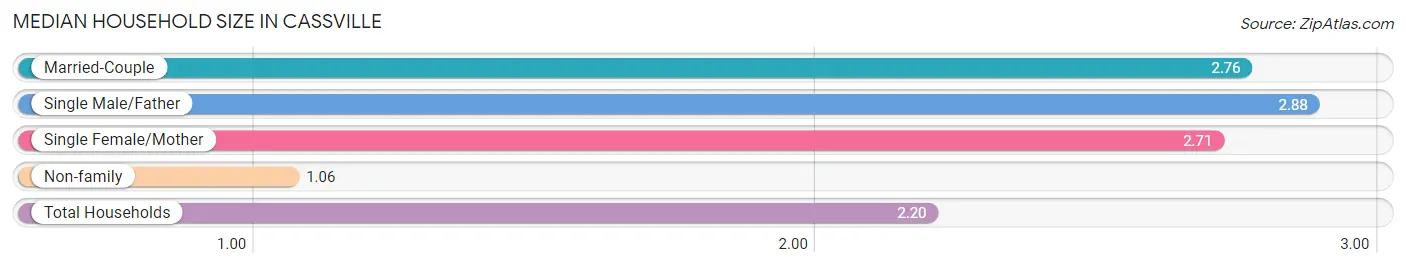
| Household Type | # Households | Household Size |
| Married-Couple | 145 (43.7%) | 2.76 |
| Single Male/Father | 32 (9.6%) | 2.88 |
| Single Female/Mother | 45 (13.6%) | 2.71 |
| Non-family | 110 (33.1%) | 1.06 |
| Total Households | 332 (100.0%) | 2.20 |
Household Size by Marriage Status in Cassville
Out of a total of 332 households in Cassville, 222 (66.9%) are family households, while 110 (33.1%) are nonfamily households. The most numerous type of family households are 2-person households, comprising 139, and the most common type of nonfamily households are 1-person households, comprising 104.
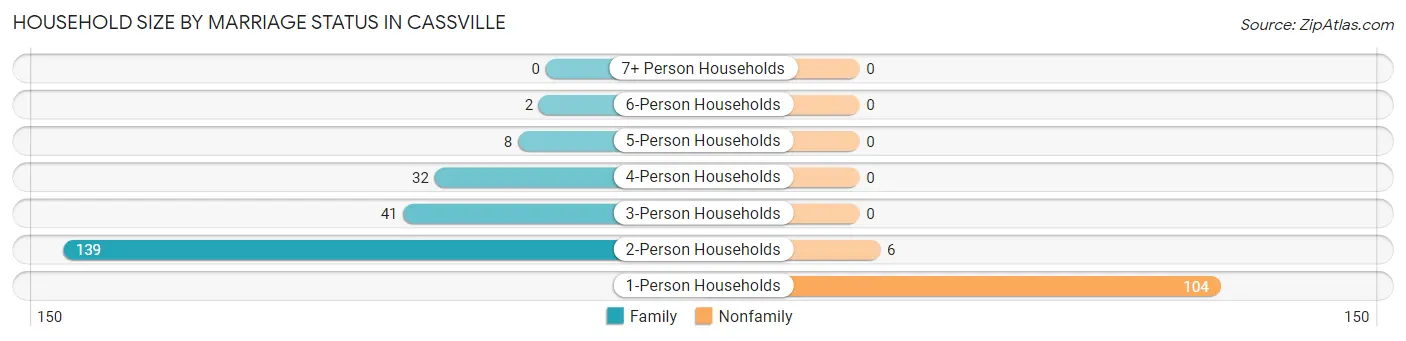
| Household Size | Family Households | Nonfamily Households |
| 1-Person Households | - | 104 (31.3%) |
| 2-Person Households | 139 (41.9%) | 6 (1.8%) |
| 3-Person Households | 41 (12.3%) | 0 (0.0%) |
| 4-Person Households | 32 (9.6%) | 0 (0.0%) |
| 5-Person Households | 8 (2.4%) | 0 (0.0%) |
| 6-Person Households | 2 (0.6%) | 0 (0.0%) |
| 7+ Person Households | 0 (0.0%) | 0 (0.0%) |
| Total | 222 (66.9%) | 110 (33.1%) |
Female Fertility in Cassville
Fertility by Age in Cassville
Average fertility rate in Cassville is 53.0 births per 1,000 women. Women in the age bracket of 20 to 34 years have the highest fertility rate with 111.0 births per 1,000 women. Women in the age bracket of 20 to 34 years acount for 100.0% of all women with births.
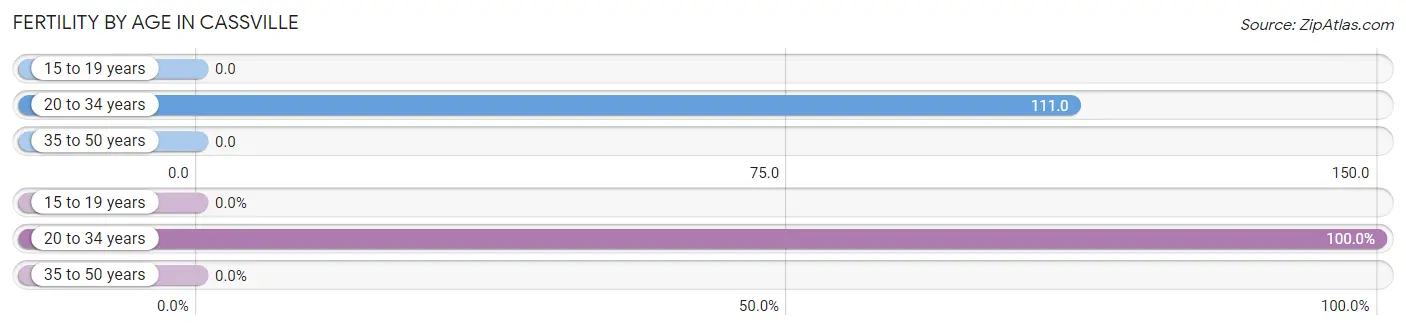
| Age Bracket | Women with Births | Births / 1,000 Women |
| 15 to 19 years | 0 (0.0%) | 0.0 |
| 20 to 34 years | 7 (100.0%) | 111.0 |
| 35 to 50 years | 0 (0.0%) | 0.0 |
| Total | 7 (100.0%) | 53.0 |
Fertility by Age by Marriage Status in Cassville
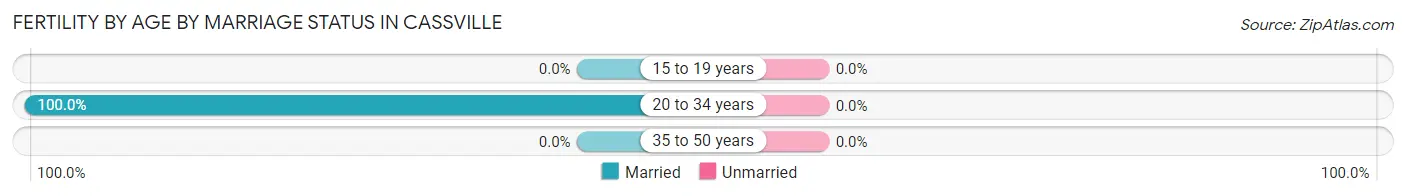
| Age Bracket | Married | Unmarried |
| 15 to 19 years | 0 (0.0%) | 0 (0.0%) |
| 20 to 34 years | 7 (100.0%) | 0 (0.0%) |
| 35 to 50 years | 0 (0.0%) | 0 (0.0%) |
| Total | 7 (100.0%) | 0 (0.0%) |
Fertility by Education in Cassville
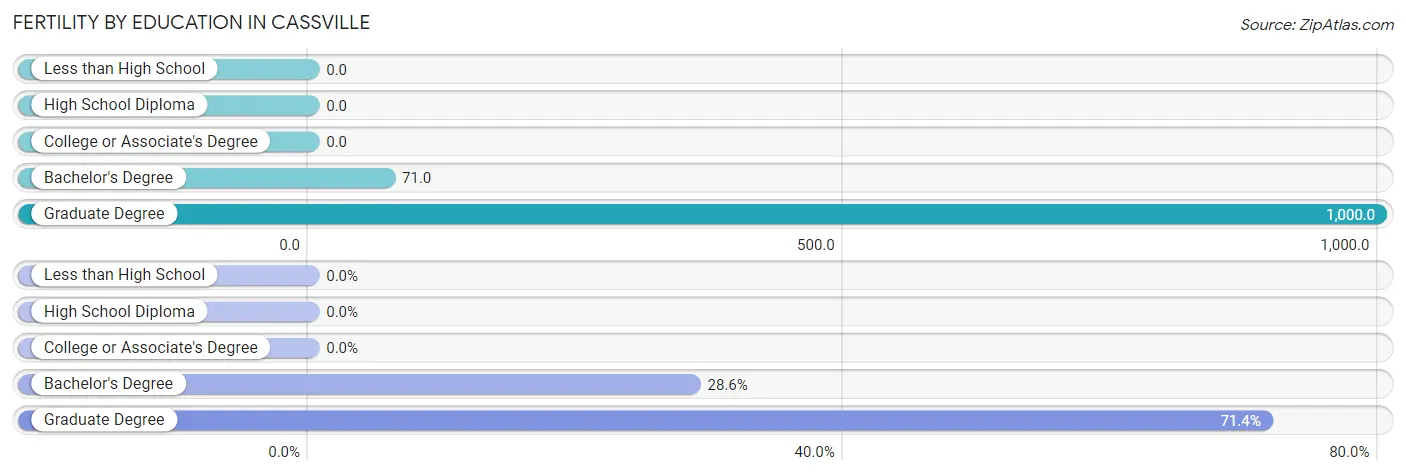
| Educational Attainment | Women with Births | Births / 1,000 Women |
| Less than High School | 0 (0.0%) | 0.0 |
| High School Diploma | 0 (0.0%) | 0.0 |
| College or Associate's Degree | 0 (0.0%) | 0.0 |
| Bachelor's Degree | 2 (28.6%) | 71.0 |
| Graduate Degree | 5 (71.4%) | 1,000.0 |
| Total | 7 (100.0%) | 53.0 |
Fertility by Education by Marriage Status in Cassville
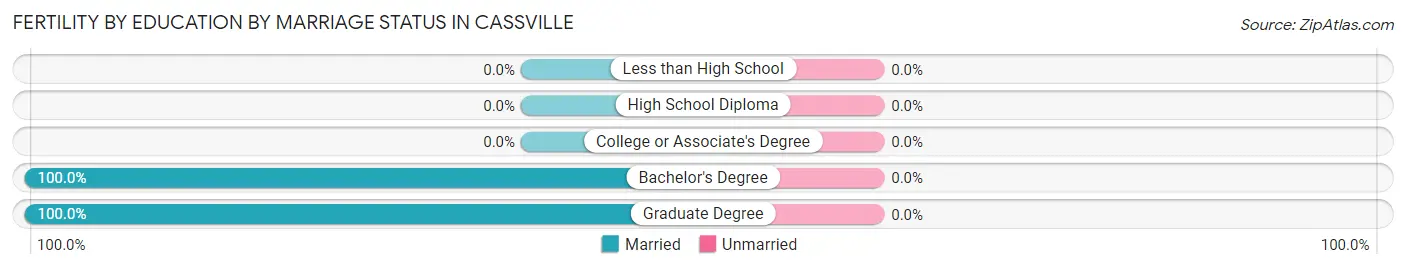
| Educational Attainment | Married | Unmarried |
| Less than High School | 0 (0.0%) | 0 (0.0%) |
| High School Diploma | 0 (0.0%) | 0 (0.0%) |
| College or Associate's Degree | 0 (0.0%) | 0 (0.0%) |
| Bachelor's Degree | 2 (100.0%) | 0 (0.0%) |
| Graduate Degree | 5 (100.0%) | 0 (0.0%) |
| Total | 7 (100.0%) | 0 (0.0%) |
Employment Characteristics in Cassville
Employment by Class of Employer in Cassville
Among the 335 employed individuals in Cassville, private company employees (219 | 65.4%), local government employees (44 | 13.1%), and not-for-profit organizations (18 | 5.4%) make up the most common classes of employment.
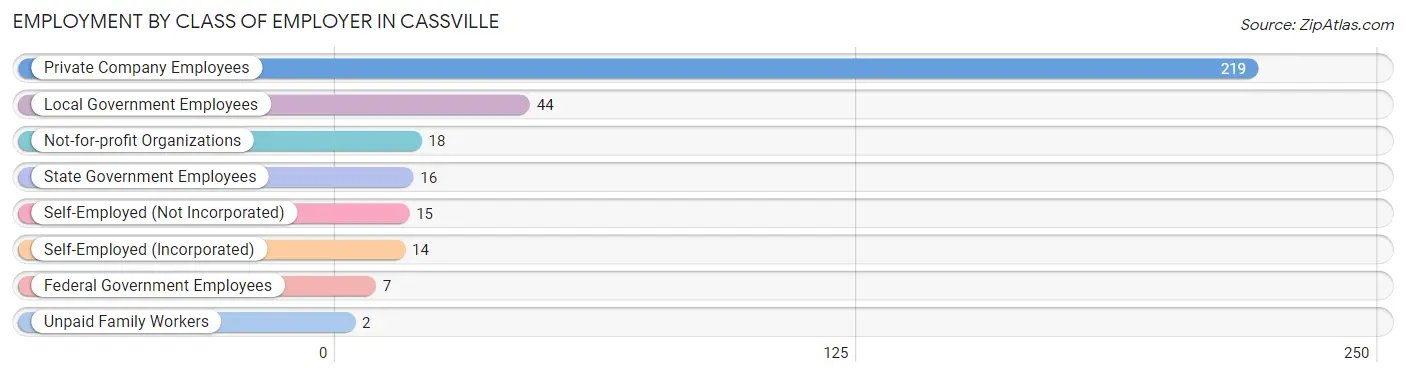
| Employer Class | # Employees | % Employees |
| Private Company Employees | 219 | 65.4% |
| Self-Employed (Incorporated) | 14 | 4.2% |
| Self-Employed (Not Incorporated) | 15 | 4.5% |
| Not-for-profit Organizations | 18 | 5.4% |
| Local Government Employees | 44 | 13.1% |
| State Government Employees | 16 | 4.8% |
| Federal Government Employees | 7 | 2.1% |
| Unpaid Family Workers | 2 | 0.6% |
| Total | 335 | 100.0% |
Employment Status by Age in Cassville
According to the labor force statistics for Cassville, out of the total population over 16 years of age (637), 54.0% or 344 individuals are in the labor force, with 1.2% or 4 of them unemployed. The age group with the highest labor force participation rate is 35 to 44 years, with 100.0% or 61 individuals in the labor force. Within the labor force, the 35 to 44 years age range has the highest percentage of unemployed individuals, with 6.6% or 4 of them being unemployed.
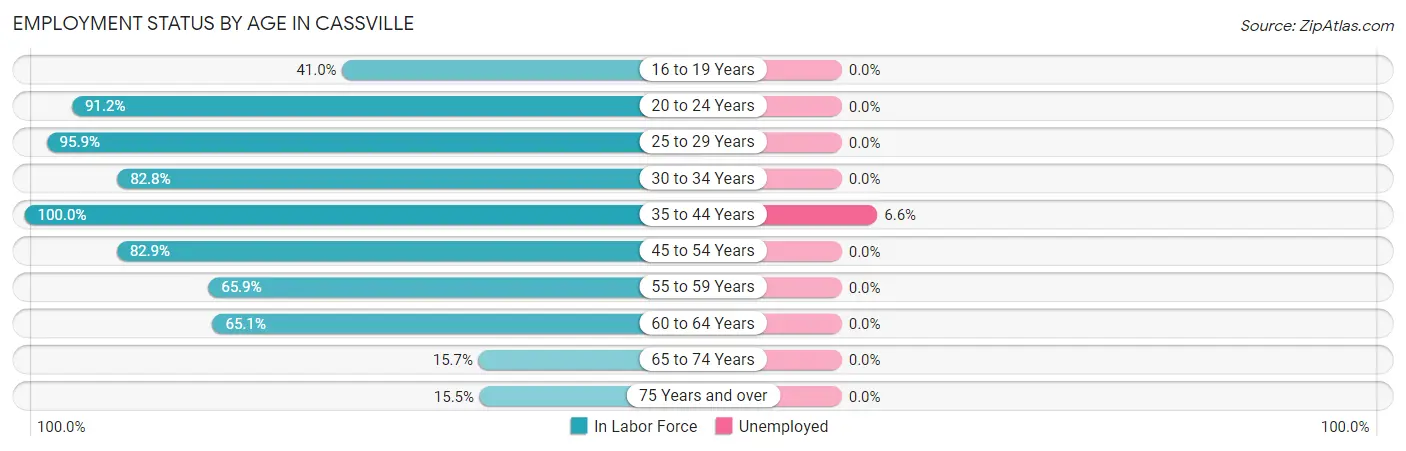
| Age Bracket | In Labor Force | Unemployed |
| 16 to 19 Years | 16 (41.0%) | 0 (0.0%) |
| 20 to 24 Years | 31 (91.2%) | 0 (0.0%) |
| 25 to 29 Years | 47 (95.9%) | 0 (0.0%) |
| 30 to 34 Years | 24 (82.8%) | 0 (0.0%) |
| 35 to 44 Years | 61 (100.0%) | 4 (6.6%) |
| 45 to 54 Years | 68 (82.9%) | 0 (0.0%) |
| 55 to 59 Years | 29 (65.9%) | 0 (0.0%) |
| 60 to 64 Years | 28 (65.1%) | 0 (0.0%) |
| 65 to 74 Years | 24 (15.7%) | 0 (0.0%) |
| 75 Years and over | 16 (15.5%) | 0 (0.0%) |
| Total | 344 (54.0%) | 4 (1.2%) |
Employment Status by Educational Attainment in Cassville
According to labor force statistics for Cassville, 83.4% of individuals (257) out of the total population between 25 and 64 years of age (308) are in the labor force, with 1.6% or 4 of them being unemployed. The group with the highest labor force participation rate are those with the educational attainment of less than high school, with 89.5% or 17 individuals in the labor force. Within the labor force, individuals with college / associate degree education have the highest percentage of unemployment, with 3.9% or 4 of them being unemployed.
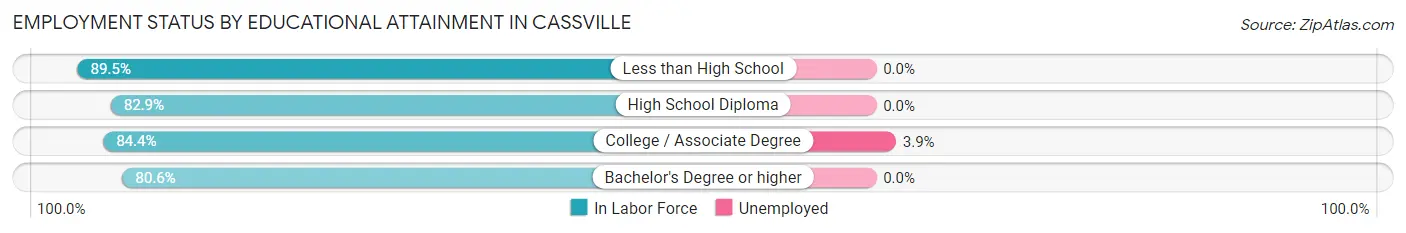
| Educational Attainment | In Labor Force | Unemployed |
| Less than High School | 17 (89.5%) | 0 (0.0%) |
| High School Diploma | 87 (82.9%) | 0 (0.0%) |
| College / Associate Degree | 103 (84.4%) | 5 (3.9%) |
| Bachelor's Degree or higher | 50 (80.6%) | 0 (0.0%) |
| Total | 257 (83.4%) | 5 (1.6%) |
Employment Occupations by Sex in Cassville
Management, Business, Science and Arts Occupations
The most common Management, Business, Science and Arts occupations in Cassville are Community & Social Service (29 | 8.5%), Management (26 | 7.6%), Education Instruction & Library (25 | 7.3%), Health Diagnosing & Treating (16 | 4.7%), and Health Technologists (13 | 3.8%).
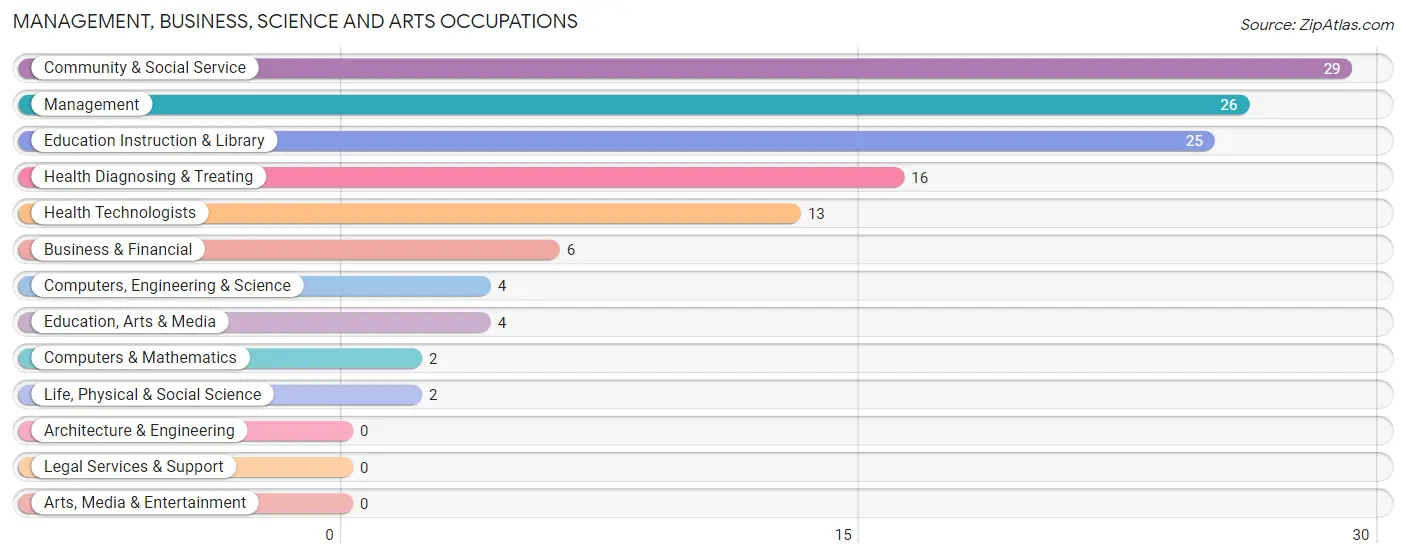
Management, Business, Science and Arts Occupations by Sex
Within the Management, Business, Science and Arts occupations in Cassville, the most male-oriented occupations are Business & Financial (100.0%), Computers & Mathematics (100.0%), and Education, Arts & Media (100.0%), while the most female-oriented occupations are Life, Physical & Social Science (100.0%), Health Diagnosing & Treating (100.0%), and Health Technologists (100.0%).
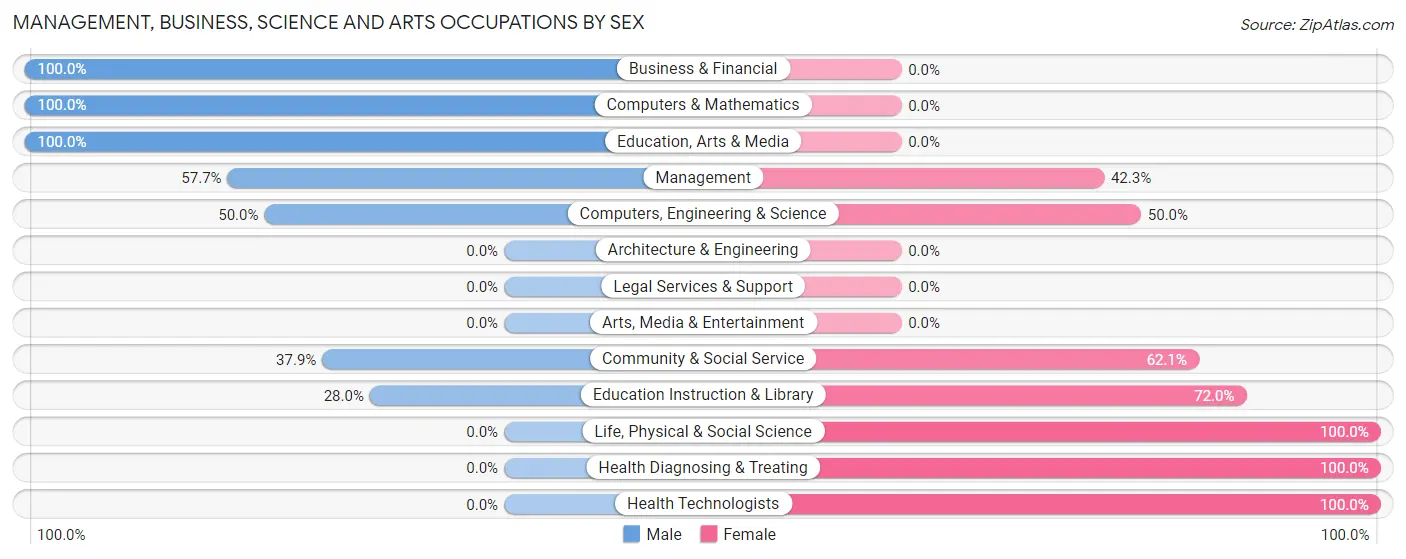
| Occupation | Male | Female |
| Management | 15 (57.7%) | 11 (42.3%) |
| Business & Financial | 6 (100.0%) | 0 (0.0%) |
| Computers, Engineering & Science | 2 (50.0%) | 2 (50.0%) |
| Computers & Mathematics | 2 (100.0%) | 0 (0.0%) |
| Architecture & Engineering | 0 (0.0%) | 0 (0.0%) |
| Life, Physical & Social Science | 0 (0.0%) | 2 (100.0%) |
| Community & Social Service | 11 (37.9%) | 18 (62.1%) |
| Education, Arts & Media | 4 (100.0%) | 0 (0.0%) |
| Legal Services & Support | 0 (0.0%) | 0 (0.0%) |
| Education Instruction & Library | 7 (28.0%) | 18 (72.0%) |
| Arts, Media & Entertainment | 0 (0.0%) | 0 (0.0%) |
| Health Diagnosing & Treating | 0 (0.0%) | 16 (100.0%) |
| Health Technologists | 0 (0.0%) | 13 (100.0%) |
| Total (Category) | 34 (42.0%) | 47 (58.0%) |
| Total (Overall) | 189 (55.6%) | 151 (44.4%) |
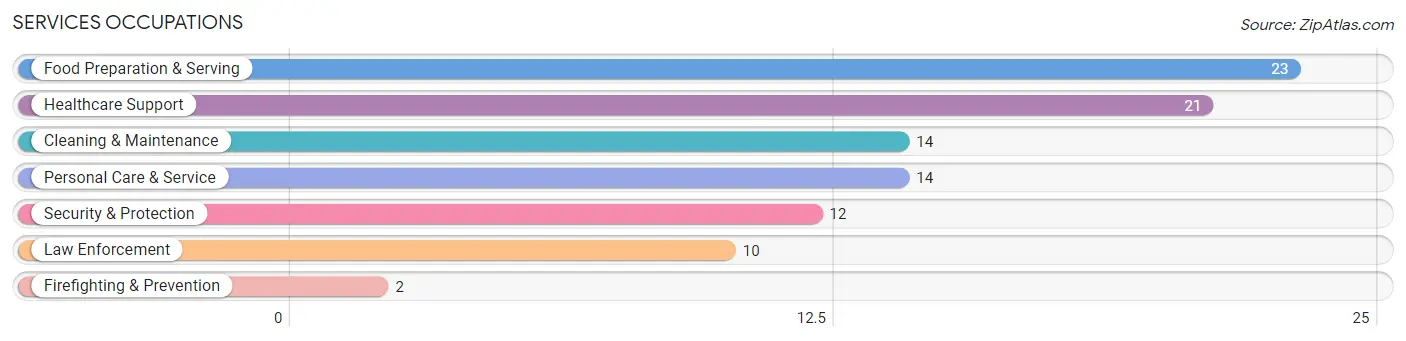
Services Occupations
The most common Services occupations in Cassville are Food Preparation & Serving (23 | 6.8%), Healthcare Support (21 | 6.2%), Cleaning & Maintenance (14 | 4.1%), Personal Care & Service (14 | 4.1%), and Security & Protection (12 | 3.5%).
Services Occupations by Sex
Within the Services occupations in Cassville, the most male-oriented occupations are Law Enforcement (100.0%), Security & Protection (83.3%), and Cleaning & Maintenance (78.6%), while the most female-oriented occupations are Healthcare Support (100.0%), Firefighting & Prevention (100.0%), and Food Preparation & Serving (100.0%).
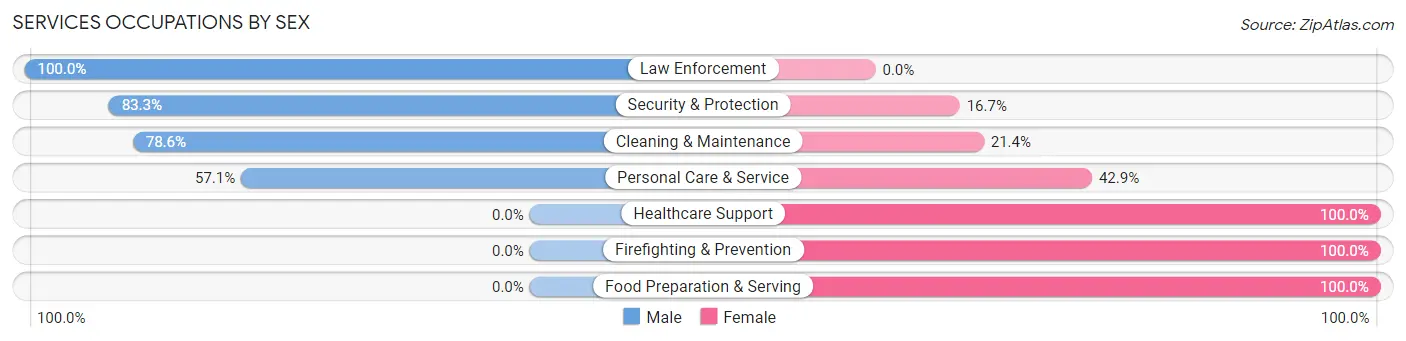
| Occupation | Male | Female |
| Healthcare Support | 0 (0.0%) | 21 (100.0%) |
| Security & Protection | 10 (83.3%) | 2 (16.7%) |
| Firefighting & Prevention | 0 (0.0%) | 2 (100.0%) |
| Law Enforcement | 10 (100.0%) | 0 (0.0%) |
| Food Preparation & Serving | 0 (0.0%) | 23 (100.0%) |
| Cleaning & Maintenance | 11 (78.6%) | 3 (21.4%) |
| Personal Care & Service | 8 (57.1%) | 6 (42.9%) |
| Total (Category) | 29 (34.5%) | 55 (65.5%) |
| Total (Overall) | 189 (55.6%) | 151 (44.4%) |
Sales and Office Occupations
The most common Sales and Office occupations in Cassville are Sales & Related (34 | 10.0%), and Office & Administration (20 | 5.9%).

Sales and Office Occupations by Sex

| Occupation | Male | Female |
| Sales & Related | 13 (38.2%) | 21 (61.8%) |
| Office & Administration | 0 (0.0%) | 20 (100.0%) |
| Total (Category) | 13 (24.1%) | 41 (75.9%) |
| Total (Overall) | 189 (55.6%) | 151 (44.4%) |
Natural Resources, Construction and Maintenance Occupations
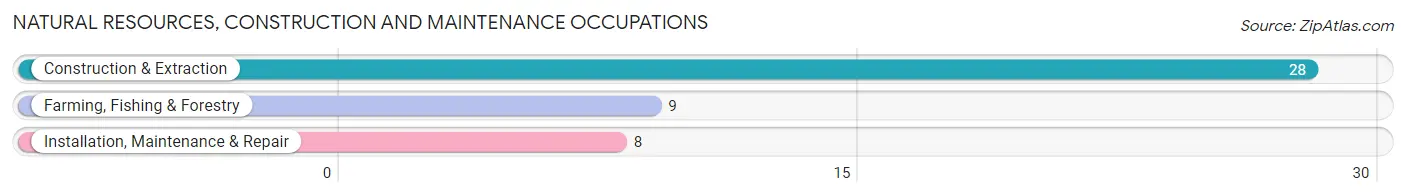
The most common Natural Resources, Construction and Maintenance occupations in Cassville are Construction & Extraction (28 | 8.2%), Farming, Fishing & Forestry (9 | 2.6%), and Installation, Maintenance & Repair (8 | 2.4%).
Natural Resources, Construction and Maintenance Occupations by Sex

| Occupation | Male | Female |
| Farming, Fishing & Forestry | 9 (100.0%) | 0 (0.0%) |
| Construction & Extraction | 28 (100.0%) | 0 (0.0%) |
| Installation, Maintenance & Repair | 8 (100.0%) | 0 (0.0%) |
| Total (Category) | 45 (100.0%) | 0 (0.0%) |
| Total (Overall) | 189 (55.6%) | 151 (44.4%) |
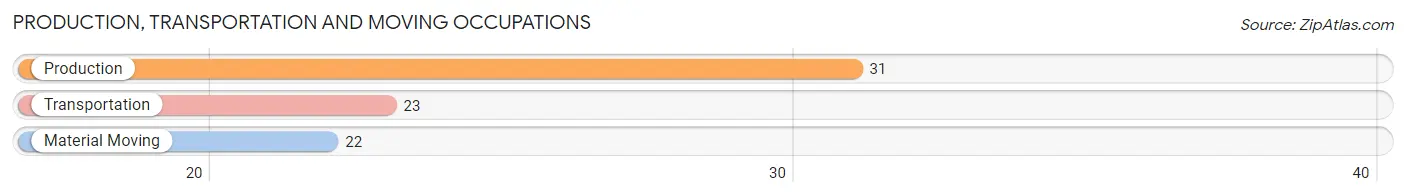
Production, Transportation and Moving Occupations
The most common Production, Transportation and Moving occupations in Cassville are Production (31 | 9.1%), Transportation (23 | 6.8%), and Material Moving (22 | 6.5%).
Production, Transportation and Moving Occupations by Sex
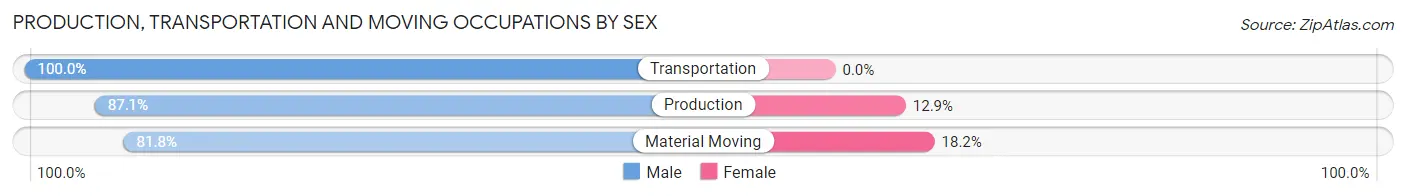
| Occupation | Male | Female |
| Production | 27 (87.1%) | 4 (12.9%) |
| Transportation | 23 (100.0%) | 0 (0.0%) |
| Material Moving | 18 (81.8%) | 4 (18.2%) |
| Total (Category) | 68 (89.5%) | 8 (10.5%) |
| Total (Overall) | 189 (55.6%) | 151 (44.4%) |
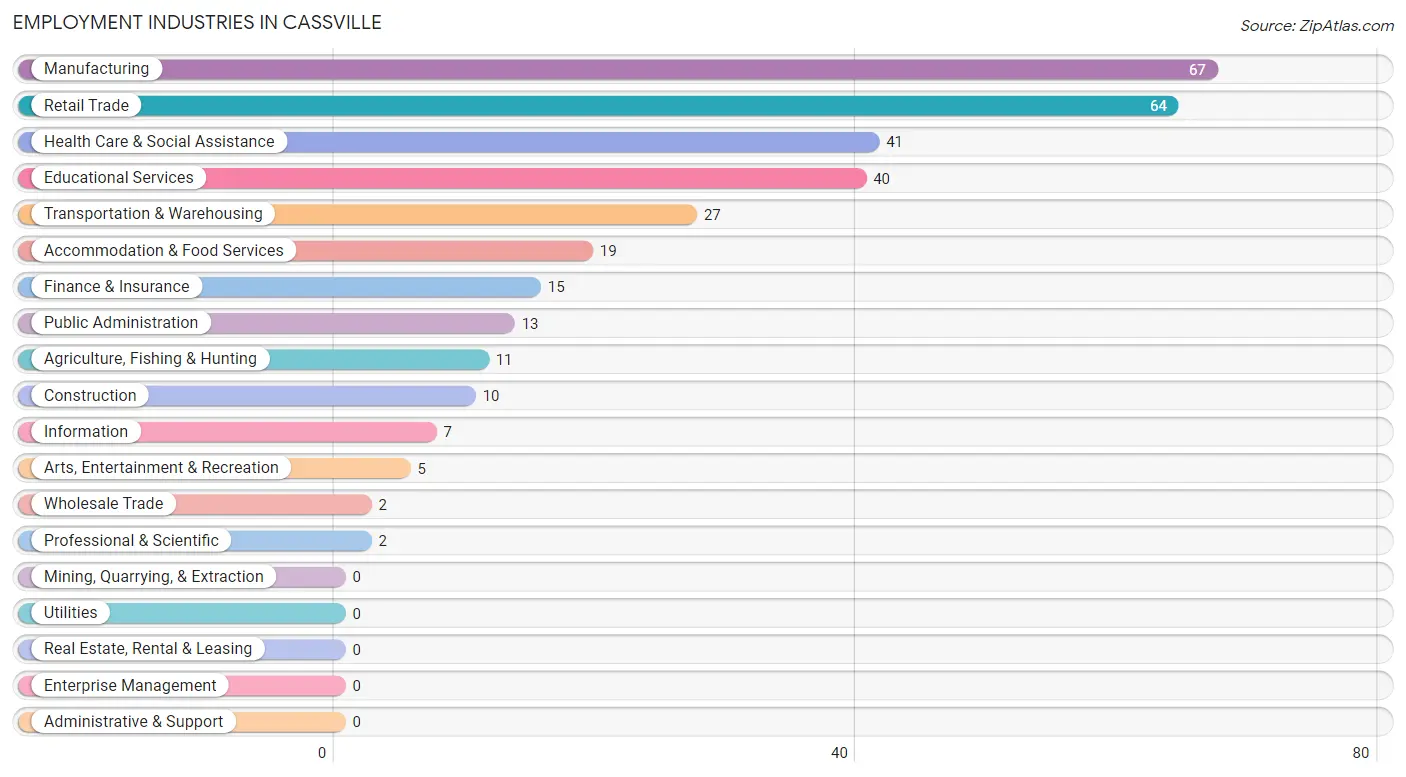
Employment Industries by Sex in Cassville
Employment Industries in Cassville
The major employment industries in Cassville include Manufacturing (67 | 19.7%), Retail Trade (64 | 18.8%), Health Care & Social Assistance (41 | 12.1%), Educational Services (40 | 11.8%), and Transportation & Warehousing (27 | 7.9%).
Employment Industries by Sex in Cassville
The Cassville industries that see more men than women are Agriculture, Fishing & Hunting (100.0%), Construction (100.0%), and Wholesale Trade (100.0%), whereas the industries that tend to have a higher number of women are Information (100.0%), Health Care & Social Assistance (100.0%), and Arts, Entertainment & Recreation (100.0%).
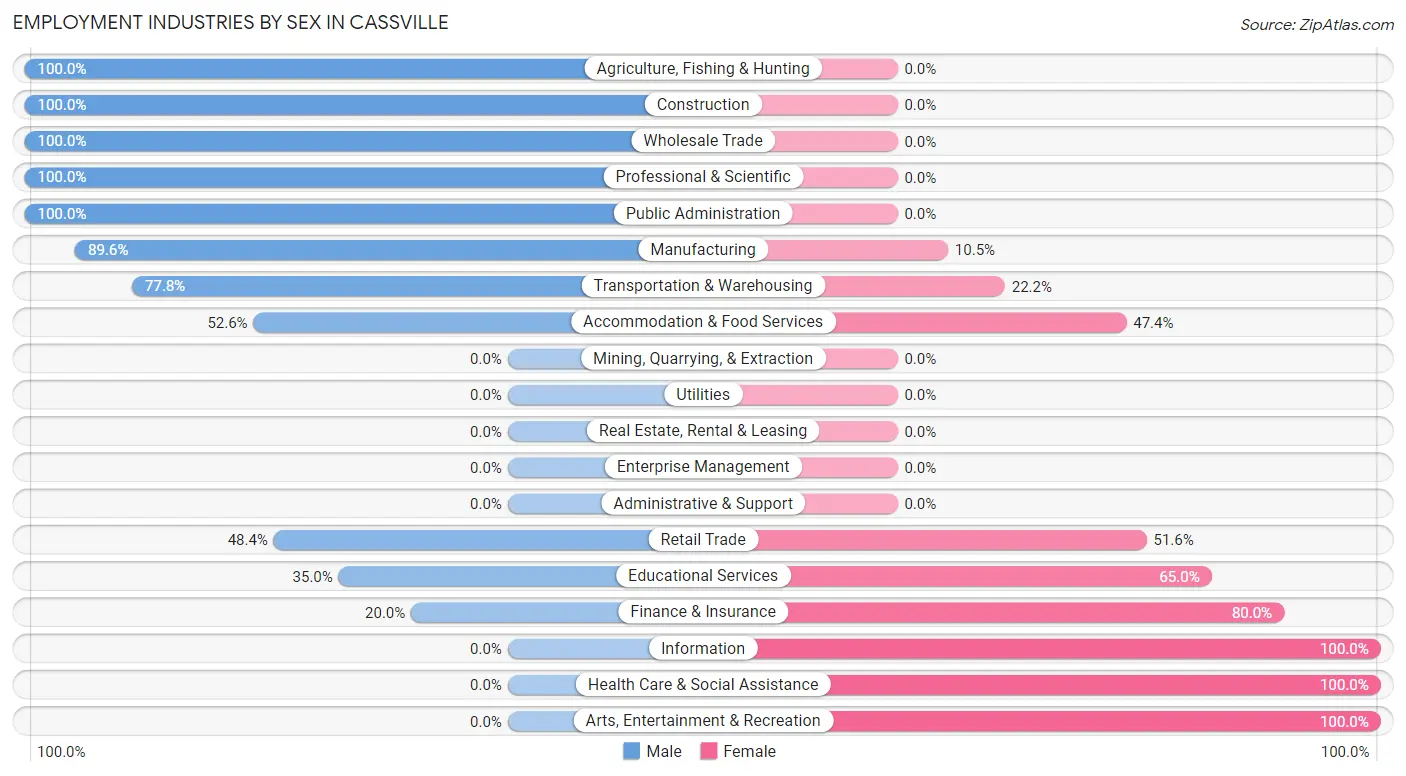
| Industry | Male | Female |
| Agriculture, Fishing & Hunting | 11 (100.0%) | 0 (0.0%) |
| Mining, Quarrying, & Extraction | 0 (0.0%) | 0 (0.0%) |
| Construction | 10 (100.0%) | 0 (0.0%) |
| Manufacturing | 60 (89.5%) | 7 (10.4%) |
| Wholesale Trade | 2 (100.0%) | 0 (0.0%) |
| Retail Trade | 31 (48.4%) | 33 (51.6%) |
| Transportation & Warehousing | 21 (77.8%) | 6 (22.2%) |
| Utilities | 0 (0.0%) | 0 (0.0%) |
| Information | 0 (0.0%) | 7 (100.0%) |
| Finance & Insurance | 3 (20.0%) | 12 (80.0%) |
| Real Estate, Rental & Leasing | 0 (0.0%) | 0 (0.0%) |
| Professional & Scientific | 2 (100.0%) | 0 (0.0%) |
| Enterprise Management | 0 (0.0%) | 0 (0.0%) |
| Administrative & Support | 0 (0.0%) | 0 (0.0%) |
| Educational Services | 14 (35.0%) | 26 (65.0%) |
| Health Care & Social Assistance | 0 (0.0%) | 41 (100.0%) |
| Arts, Entertainment & Recreation | 0 (0.0%) | 5 (100.0%) |
| Accommodation & Food Services | 10 (52.6%) | 9 (47.4%) |
| Public Administration | 13 (100.0%) | 0 (0.0%) |
| Total | 189 (55.6%) | 151 (44.4%) |
Education in Cassville
School Enrollment in Cassville
The most common levels of schooling among the 96 students in Cassville are high school (44 | 45.8%), middle school (15 | 15.6%), and college / undergraduate (15 | 15.6%).
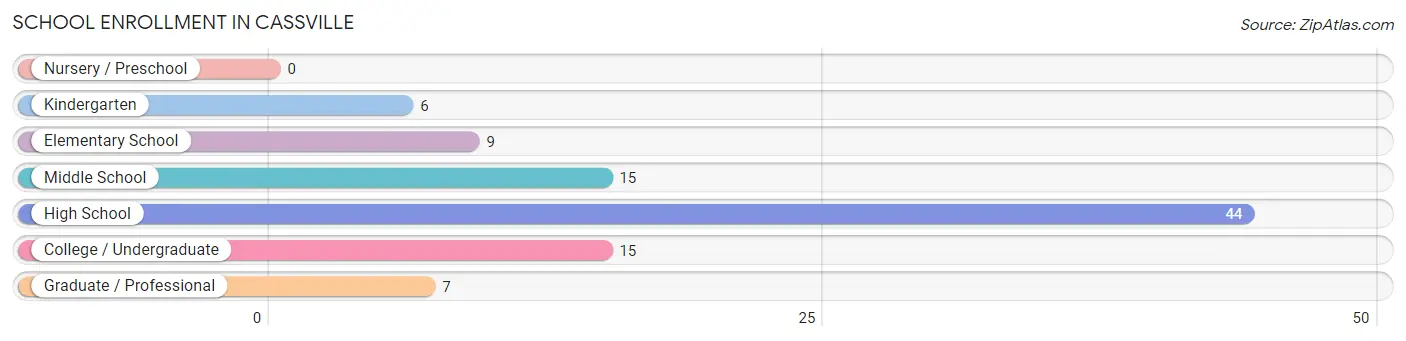
| School Level | # Students | % Students |
| Nursery / Preschool | 0 | 0.0% |
| Kindergarten | 6 | 6.2% |
| Elementary School | 9 | 9.4% |
| Middle School | 15 | 15.6% |
| High School | 44 | 45.8% |
| College / Undergraduate | 15 | 15.6% |
| Graduate / Professional | 7 | 7.3% |
| Total | 96 | 100.0% |
School Enrollment by Age by Funding Source in Cassville
Out of a total of 96 students who are enrolled in schools in Cassville, 8 (8.3%) attend a private institution, while the remaining 88 (91.7%) are enrolled in public schools. The age group of 25 to 34 year olds has the highest likelihood of being enrolled in private schools, with 2 (100.0% in the age bracket) enrolled. Conversely, the age group of 5 to 9 year old has the lowest likelihood of being enrolled in a private school, with 12 (100.0% in the age bracket) attending a public institution.
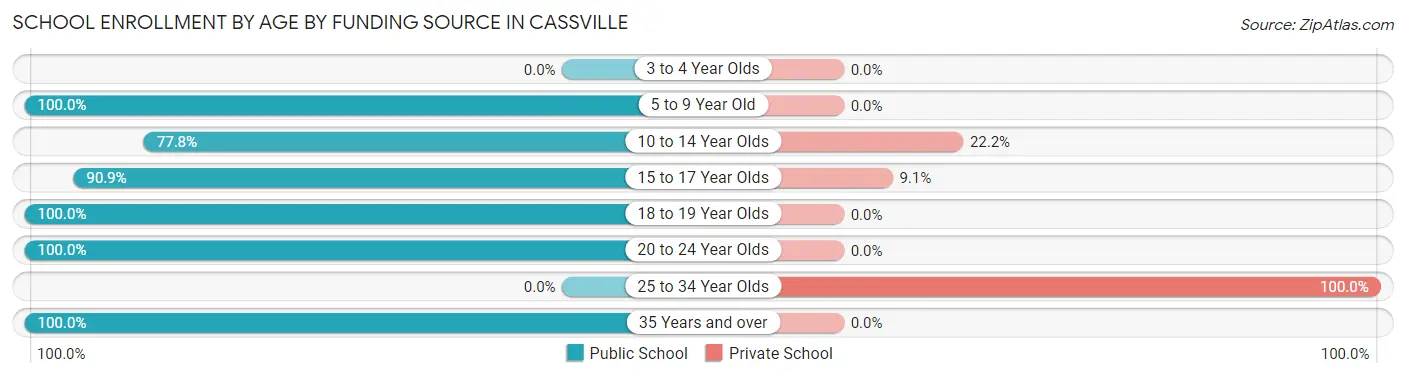
| Age Bracket | Public School | Private School |
| 3 to 4 Year Olds | 0 (0.0%) | 0 (0.0%) |
| 5 to 9 Year Old | 12 (100.0%) | 0 (0.0%) |
| 10 to 14 Year Olds | 14 (77.8%) | 4 (22.2%) |
| 15 to 17 Year Olds | 20 (90.9%) | 2 (9.1%) |
| 18 to 19 Year Olds | 26 (100.0%) | 0 (0.0%) |
| 20 to 24 Year Olds | 10 (100.0%) | 0 (0.0%) |
| 25 to 34 Year Olds | 0 (0.0%) | 2 (100.0%) |
| 35 Years and over | 6 (100.0%) | 0 (0.0%) |
| Total | 88 (91.7%) | 8 (8.3%) |
Educational Attainment by Field of Study in Cassville
Education (24 | 24.2%), science & technology (17 | 17.2%), business (13 | 13.1%), arts & humanities (9 | 9.1%), and psychology (7 | 7.1%) are the most common fields of study among 99 individuals in Cassville who have obtained a bachelor's degree or higher.
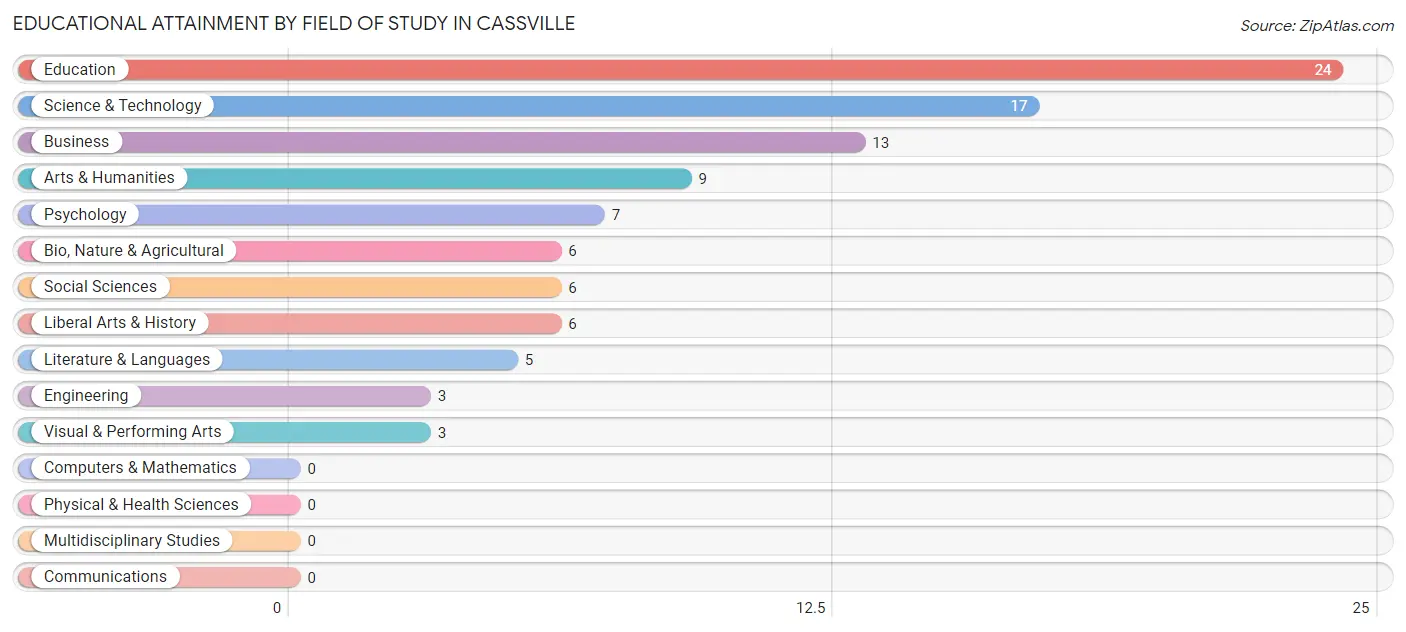
| Field of Study | # Graduates | % Graduates |
| Computers & Mathematics | 0 | 0.0% |
| Bio, Nature & Agricultural | 6 | 6.1% |
| Physical & Health Sciences | 0 | 0.0% |
| Psychology | 7 | 7.1% |
| Social Sciences | 6 | 6.1% |
| Engineering | 3 | 3.0% |
| Multidisciplinary Studies | 0 | 0.0% |
| Science & Technology | 17 | 17.2% |
| Business | 13 | 13.1% |
| Education | 24 | 24.2% |
| Literature & Languages | 5 | 5.1% |
| Liberal Arts & History | 6 | 6.1% |
| Visual & Performing Arts | 3 | 3.0% |
| Communications | 0 | 0.0% |
| Arts & Humanities | 9 | 9.1% |
| Total | 99 | 100.0% |
Transportation & Commute in Cassville
Vehicle Availability by Sex in Cassville
The most prevalent vehicle ownership categories in Cassville are males with 2 vehicles (95, accounting for 50.3%) and females with 2 vehicles (98, making up 65.1%).
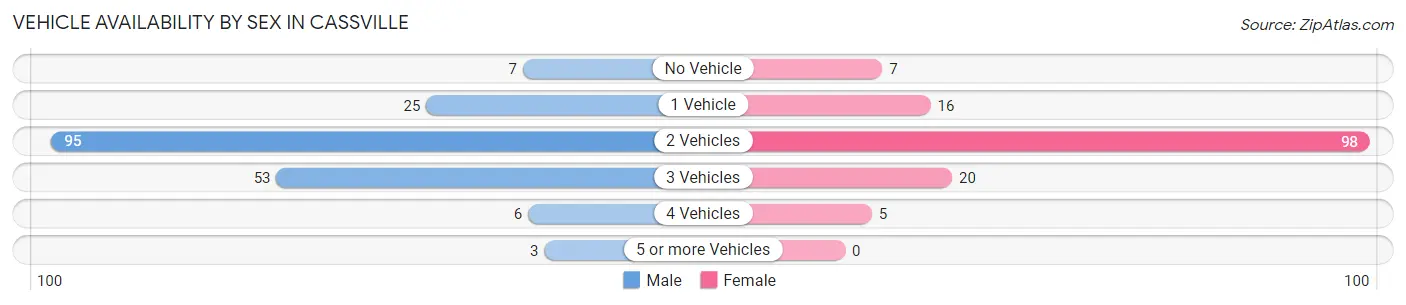
| Vehicles Available | Male | Female |
| No Vehicle | 7 (3.7%) | 7 (4.8%) |
| 1 Vehicle | 25 (13.2%) | 16 (11.0%) |
| 2 Vehicles | 95 (50.3%) | 98 (67.1%) |
| 3 Vehicles | 53 (28.0%) | 20 (13.7%) |
| 4 Vehicles | 6 (3.2%) | 5 (3.4%) |
| 5 or more Vehicles | 3 (1.6%) | 0 (0.0%) |
| Total | 189 (100.0%) | 146 (100.0%) |
Commute Time in Cassville
The most frequently occuring commute durations in Cassville are 5 to 9 minutes (64 commuters, 20.7%), 45 to 59 minutes (50 commuters, 16.2%), and 30 to 34 minutes (36 commuters, 11.7%).
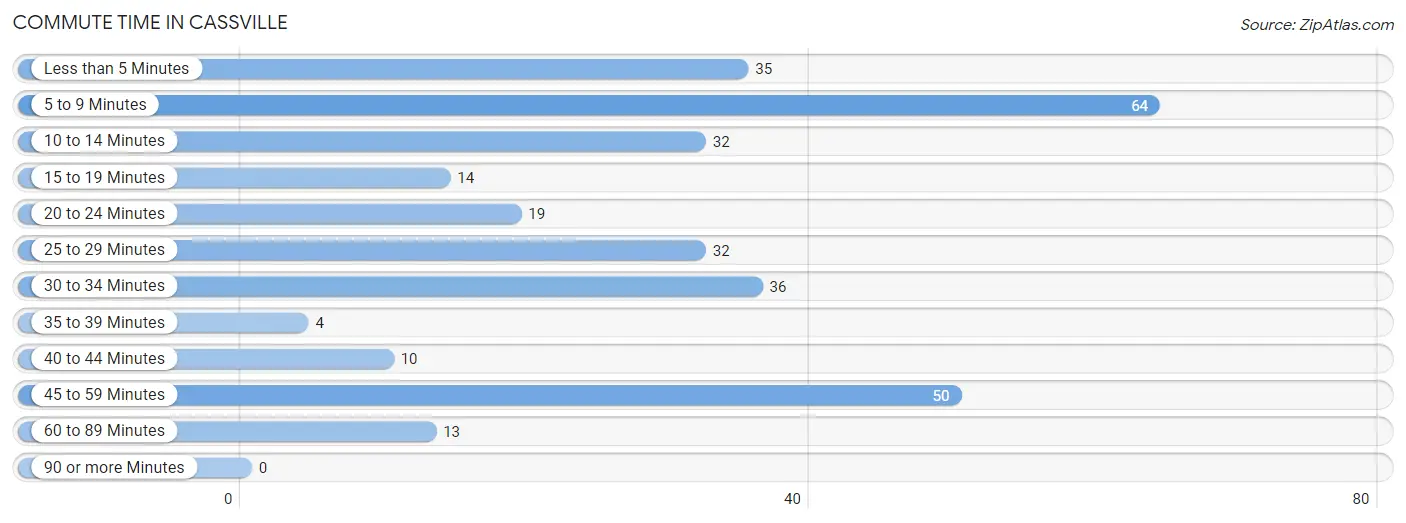
| Commute Time | # Commuters | % Commuters |
| Less than 5 Minutes | 35 | 11.3% |
| 5 to 9 Minutes | 64 | 20.7% |
| 10 to 14 Minutes | 32 | 10.4% |
| 15 to 19 Minutes | 14 | 4.5% |
| 20 to 24 Minutes | 19 | 6.1% |
| 25 to 29 Minutes | 32 | 10.4% |
| 30 to 34 Minutes | 36 | 11.7% |
| 35 to 39 Minutes | 4 | 1.3% |
| 40 to 44 Minutes | 10 | 3.2% |
| 45 to 59 Minutes | 50 | 16.2% |
| 60 to 89 Minutes | 13 | 4.2% |
| 90 or more Minutes | 0 | 0.0% |
Commute Time by Sex in Cassville
The most common commute times in Cassville are 45 to 59 minutes (36 commuters, 20.3%) for males and 5 to 9 minutes (33 commuters, 25.0%) for females.
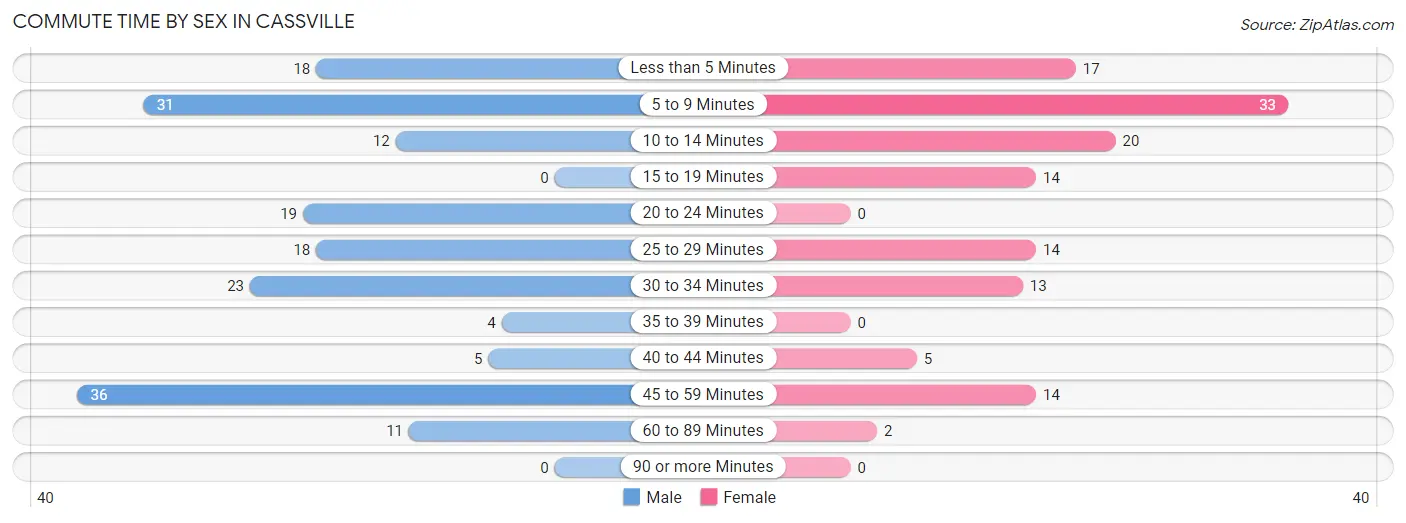
| Commute Time | Male | Female |
| Less than 5 Minutes | 18 (10.2%) | 17 (12.9%) |
| 5 to 9 Minutes | 31 (17.5%) | 33 (25.0%) |
| 10 to 14 Minutes | 12 (6.8%) | 20 (15.1%) |
| 15 to 19 Minutes | 0 (0.0%) | 14 (10.6%) |
| 20 to 24 Minutes | 19 (10.7%) | 0 (0.0%) |
| 25 to 29 Minutes | 18 (10.2%) | 14 (10.6%) |
| 30 to 34 Minutes | 23 (13.0%) | 13 (9.9%) |
| 35 to 39 Minutes | 4 (2.3%) | 0 (0.0%) |
| 40 to 44 Minutes | 5 (2.8%) | 5 (3.8%) |
| 45 to 59 Minutes | 36 (20.3%) | 14 (10.6%) |
| 60 to 89 Minutes | 11 (6.2%) | 2 (1.5%) |
| 90 or more Minutes | 0 (0.0%) | 0 (0.0%) |
Time of Departure to Work by Sex in Cassville
The most frequent times of departure to work in Cassville are 8:00 AM to 8:29 AM (34, 19.2%) for males and 7:30 AM to 7:59 AM (48, 36.4%) for females.
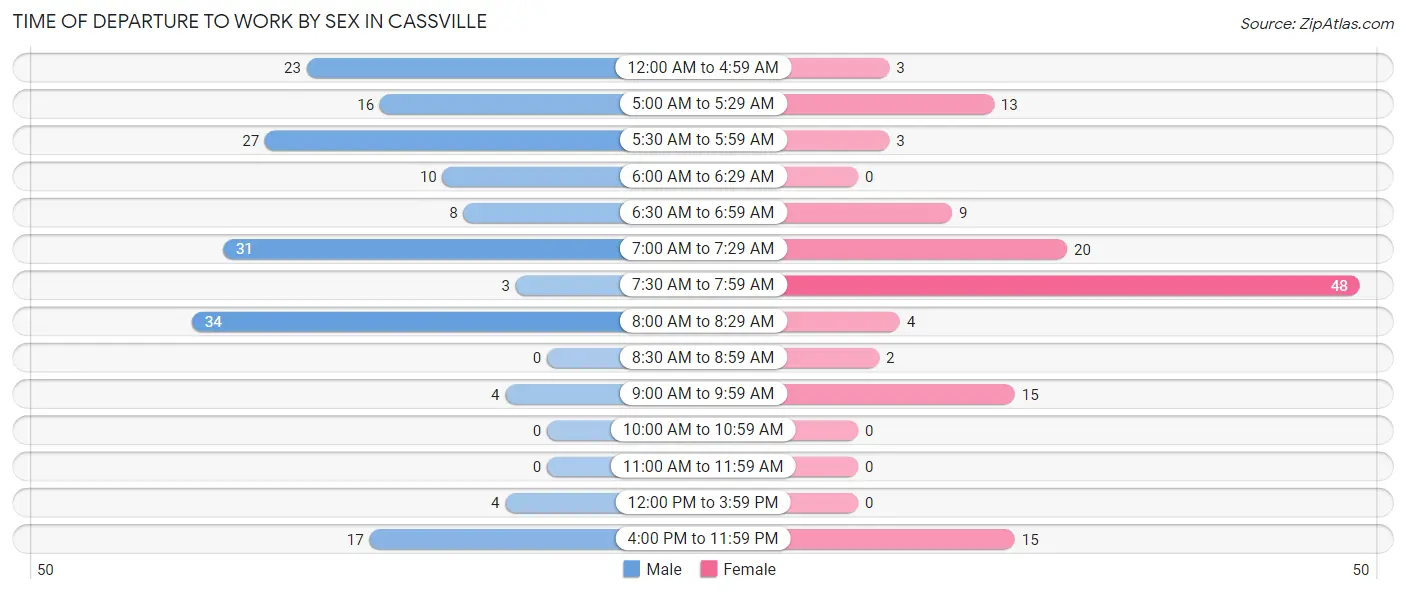
| Time of Departure | Male | Female |
| 12:00 AM to 4:59 AM | 23 (13.0%) | 3 (2.3%) |
| 5:00 AM to 5:29 AM | 16 (9.0%) | 13 (9.9%) |
| 5:30 AM to 5:59 AM | 27 (15.2%) | 3 (2.3%) |
| 6:00 AM to 6:29 AM | 10 (5.7%) | 0 (0.0%) |
| 6:30 AM to 6:59 AM | 8 (4.5%) | 9 (6.8%) |
| 7:00 AM to 7:29 AM | 31 (17.5%) | 20 (15.1%) |
| 7:30 AM to 7:59 AM | 3 (1.7%) | 48 (36.4%) |
| 8:00 AM to 8:29 AM | 34 (19.2%) | 4 (3.0%) |
| 8:30 AM to 8:59 AM | 0 (0.0%) | 2 (1.5%) |
| 9:00 AM to 9:59 AM | 4 (2.3%) | 15 (11.4%) |
| 10:00 AM to 10:59 AM | 0 (0.0%) | 0 (0.0%) |
| 11:00 AM to 11:59 AM | 0 (0.0%) | 0 (0.0%) |
| 12:00 PM to 3:59 PM | 4 (2.3%) | 0 (0.0%) |
| 4:00 PM to 11:59 PM | 17 (9.6%) | 15 (11.4%) |
| Total | 177 (100.0%) | 132 (100.0%) |
Housing Occupancy in Cassville
Occupancy by Ownership in Cassville
Of the total 332 dwellings in Cassville, owner-occupied units account for 250 (75.3%), while renter-occupied units make up 82 (24.7%).
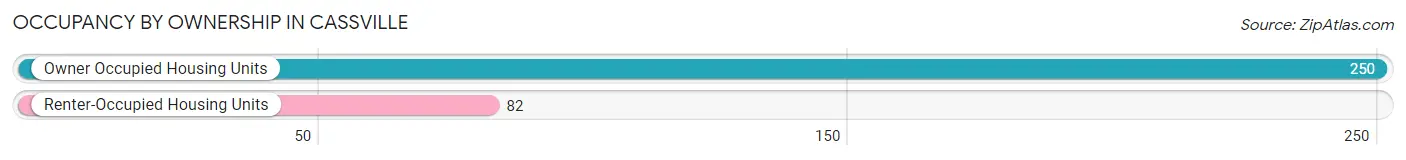
| Occupancy | # Housing Units | % Housing Units |
| Owner Occupied Housing Units | 250 | 75.3% |
| Renter-Occupied Housing Units | 82 | 24.7% |
| Total Occupied Housing Units | 332 | 100.0% |
Occupancy by Household Size in Cassville
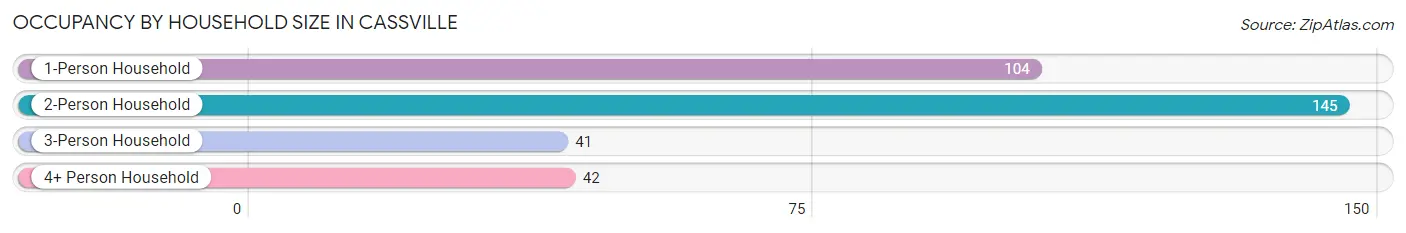
| Household Size | # Housing Units | % Housing Units |
| 1-Person Household | 104 | 31.3% |
| 2-Person Household | 145 | 43.7% |
| 3-Person Household | 41 | 12.3% |
| 4+ Person Household | 42 | 12.7% |
| Total Housing Units | 332 | 100.0% |
Occupancy by Ownership by Household Size in Cassville
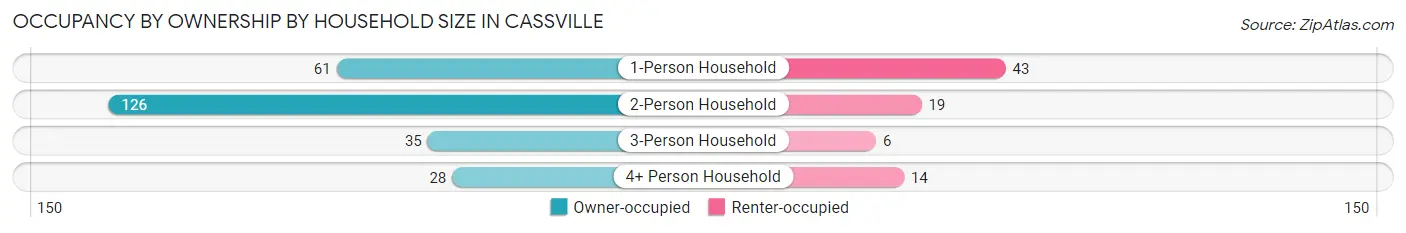
| Household Size | Owner-occupied | Renter-occupied |
| 1-Person Household | 61 (58.7%) | 43 (41.3%) |
| 2-Person Household | 126 (86.9%) | 19 (13.1%) |
| 3-Person Household | 35 (85.4%) | 6 (14.6%) |
| 4+ Person Household | 28 (66.7%) | 14 (33.3%) |
| Total Housing Units | 250 (75.3%) | 82 (24.7%) |
Occupancy by Educational Attainment in Cassville
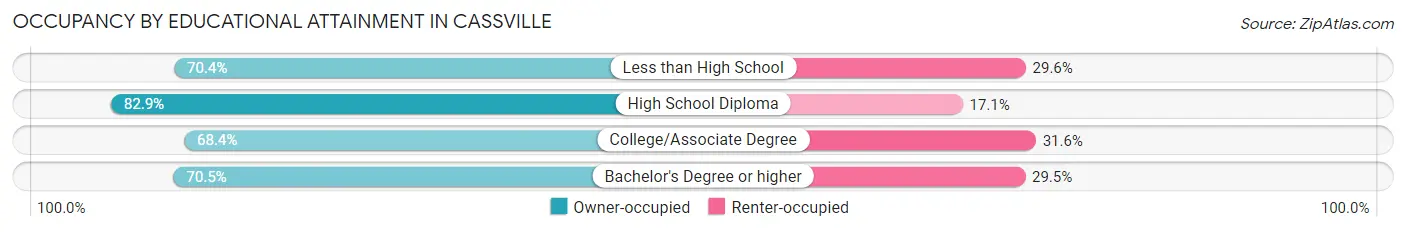
| Household Size | Owner-occupied | Renter-occupied |
| Less than High School | 19 (70.4%) | 8 (29.6%) |
| High School Diploma | 121 (82.9%) | 25 (17.1%) |
| College/Associate Degree | 67 (68.4%) | 31 (31.6%) |
| Bachelor's Degree or higher | 43 (70.5%) | 18 (29.5%) |
Occupancy by Age of Householder in Cassville
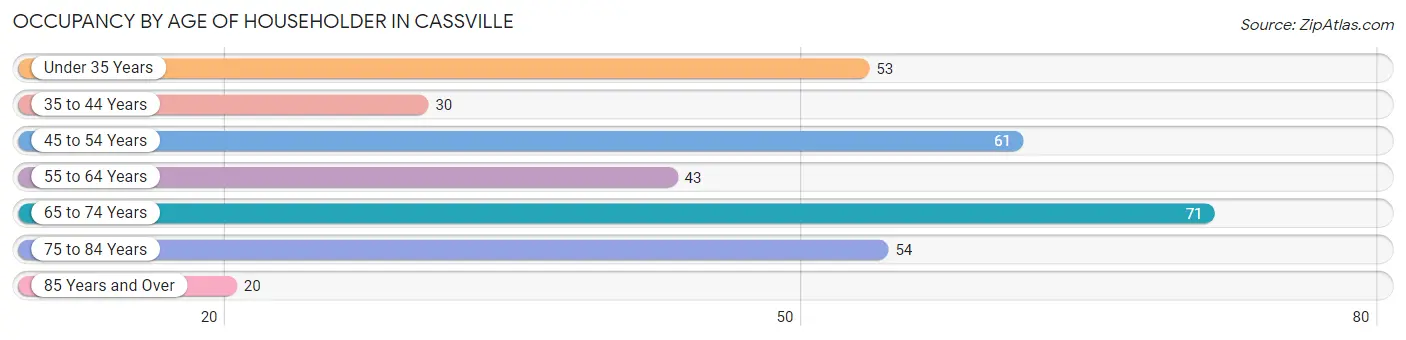
| Age Bracket | # Households | % Households |
| Under 35 Years | 53 | 16.0% |
| 35 to 44 Years | 30 | 9.0% |
| 45 to 54 Years | 61 | 18.4% |
| 55 to 64 Years | 43 | 13.0% |
| 65 to 74 Years | 71 | 21.4% |
| 75 to 84 Years | 54 | 16.3% |
| 85 Years and Over | 20 | 6.0% |
| Total | 332 | 100.0% |
Housing Finances in Cassville
Median Income by Occupancy in Cassville
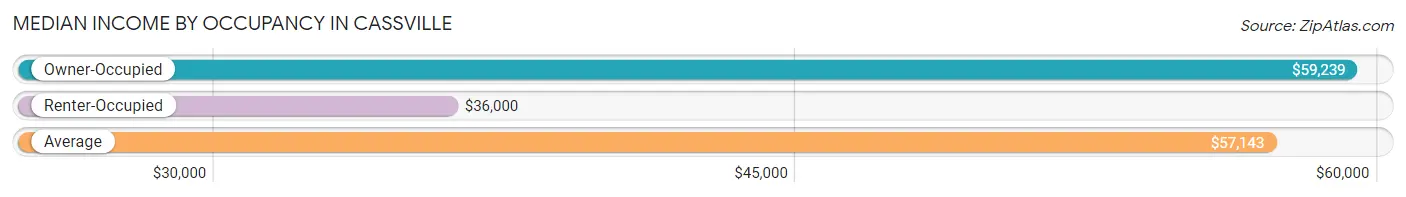
| Occupancy Type | # Households | Median Income |
| Owner-Occupied | 250 (75.3%) | $59,239 |
| Renter-Occupied | 82 (24.7%) | $36,000 |
| Average | 332 (100.0%) | $57,143 |
Occupancy by Householder Income Bracket in Cassville
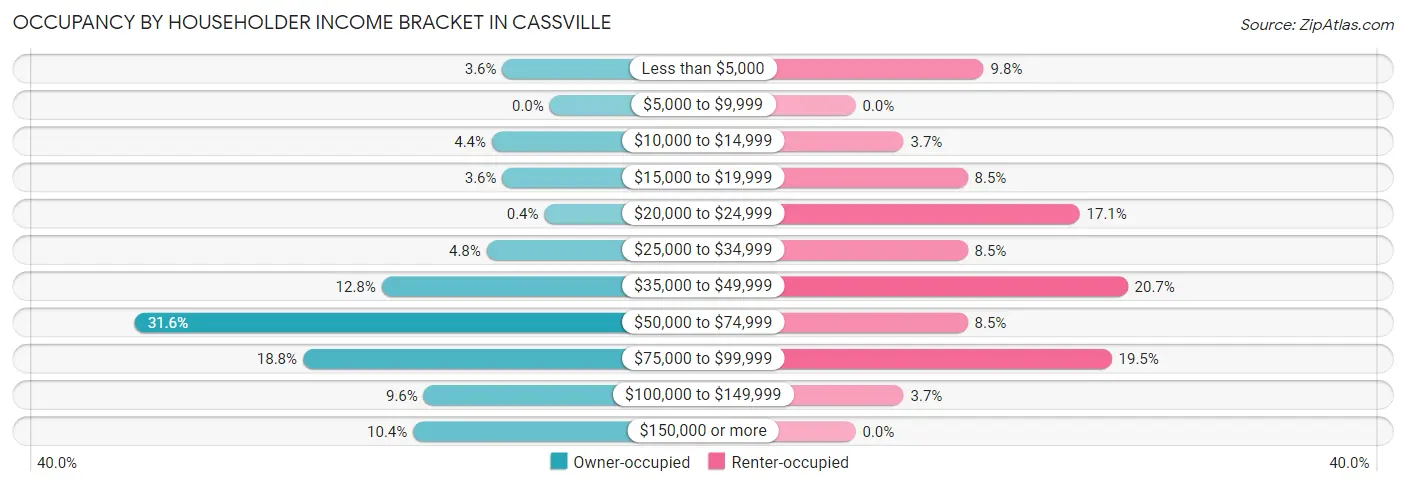
| Income Bracket | Owner-occupied | Renter-occupied |
| Less than $5,000 | 9 (3.6%) | 8 (9.8%) |
| $5,000 to $9,999 | 0 (0.0%) | 0 (0.0%) |
| $10,000 to $14,999 | 11 (4.4%) | 3 (3.7%) |
| $15,000 to $19,999 | 9 (3.6%) | 7 (8.5%) |
| $20,000 to $24,999 | 1 (0.4%) | 14 (17.1%) |
| $25,000 to $34,999 | 12 (4.8%) | 7 (8.5%) |
| $35,000 to $49,999 | 32 (12.8%) | 17 (20.7%) |
| $50,000 to $74,999 | 79 (31.6%) | 7 (8.5%) |
| $75,000 to $99,999 | 47 (18.8%) | 16 (19.5%) |
| $100,000 to $149,999 | 24 (9.6%) | 3 (3.7%) |
| $150,000 or more | 26 (10.4%) | 0 (0.0%) |
| Total | 250 (100.0%) | 82 (100.0%) |
Monthly Housing Cost Tiers in Cassville
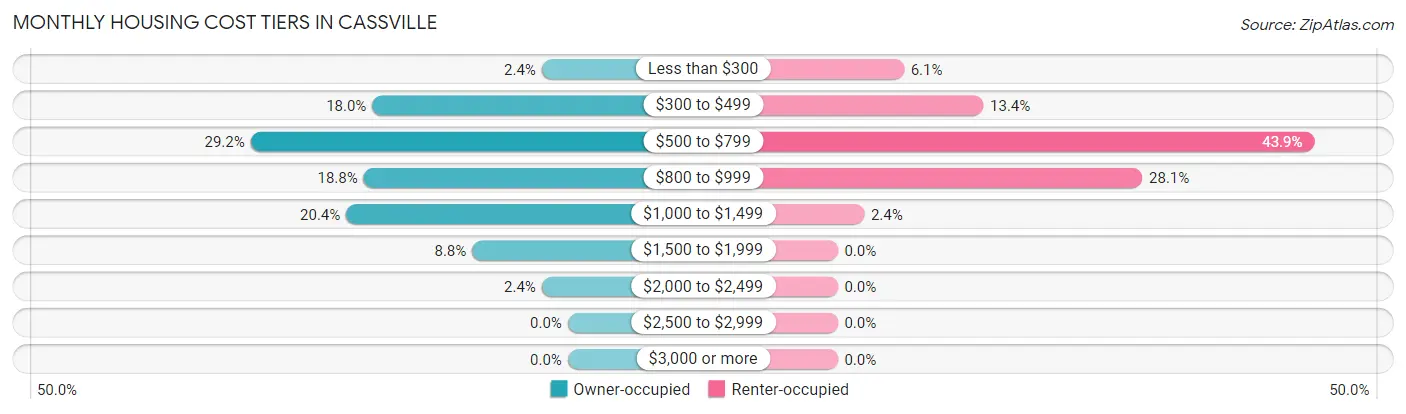
| Monthly Cost | Owner-occupied | Renter-occupied |
| Less than $300 | 6 (2.4%) | 5 (6.1%) |
| $300 to $499 | 45 (18.0%) | 11 (13.4%) |
| $500 to $799 | 73 (29.2%) | 36 (43.9%) |
| $800 to $999 | 47 (18.8%) | 23 (28.1%) |
| $1,000 to $1,499 | 51 (20.4%) | 2 (2.4%) |
| $1,500 to $1,999 | 22 (8.8%) | 0 (0.0%) |
| $2,000 to $2,499 | 6 (2.4%) | 0 (0.0%) |
| $2,500 to $2,999 | 0 (0.0%) | 0 (0.0%) |
| $3,000 or more | 0 (0.0%) | 0 (0.0%) |
| Total | 250 (100.0%) | 82 (100.0%) |
Physical Housing Characteristics in Cassville
Housing Structures in Cassville
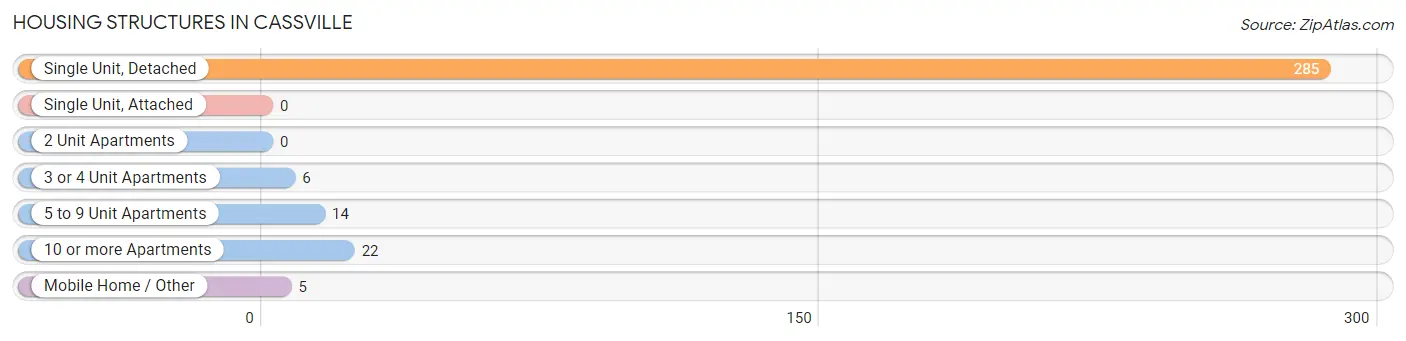
| Structure Type | # Housing Units | % Housing Units |
| Single Unit, Detached | 285 | 85.8% |
| Single Unit, Attached | 0 | 0.0% |
| 2 Unit Apartments | 0 | 0.0% |
| 3 or 4 Unit Apartments | 6 | 1.8% |
| 5 to 9 Unit Apartments | 14 | 4.2% |
| 10 or more Apartments | 22 | 6.6% |
| Mobile Home / Other | 5 | 1.5% |
| Total | 332 | 100.0% |
Housing Structures by Occupancy in Cassville
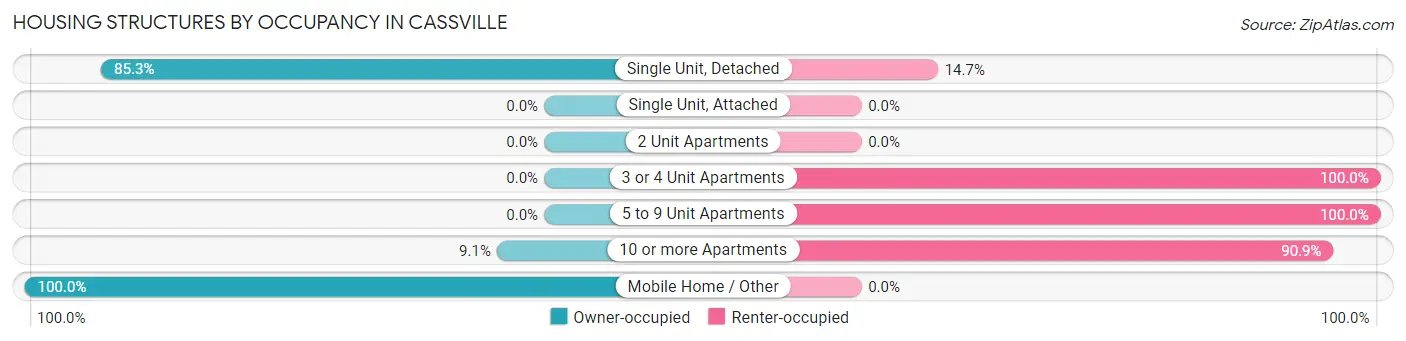
| Structure Type | Owner-occupied | Renter-occupied |
| Single Unit, Detached | 243 (85.3%) | 42 (14.7%) |
| Single Unit, Attached | 0 (0.0%) | 0 (0.0%) |
| 2 Unit Apartments | 0 (0.0%) | 0 (0.0%) |
| 3 or 4 Unit Apartments | 0 (0.0%) | 6 (100.0%) |
| 5 to 9 Unit Apartments | 0 (0.0%) | 14 (100.0%) |
| 10 or more Apartments | 2 (9.1%) | 20 (90.9%) |
| Mobile Home / Other | 5 (100.0%) | 0 (0.0%) |
| Total | 250 (75.3%) | 82 (24.7%) |
Housing Structures by Number of Rooms in Cassville
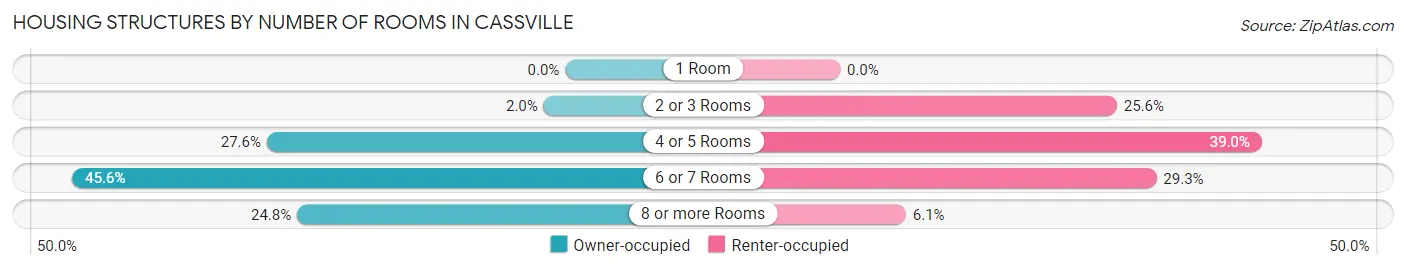
| Number of Rooms | Owner-occupied | Renter-occupied |
| 1 Room | 0 (0.0%) | 0 (0.0%) |
| 2 or 3 Rooms | 5 (2.0%) | 21 (25.6%) |
| 4 or 5 Rooms | 69 (27.6%) | 32 (39.0%) |
| 6 or 7 Rooms | 114 (45.6%) | 24 (29.3%) |
| 8 or more Rooms | 62 (24.8%) | 5 (6.1%) |
| Total | 250 (100.0%) | 82 (100.0%) |
Housing Structure by Heating Type in Cassville
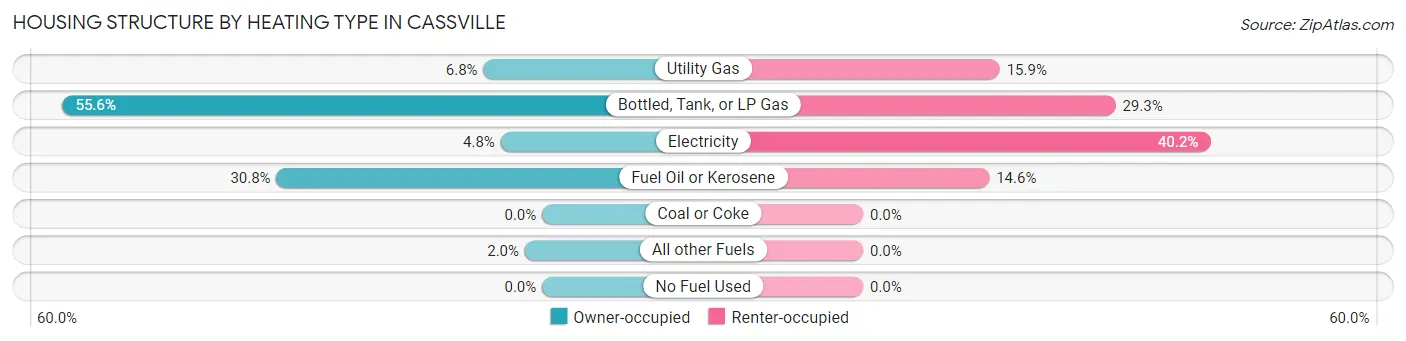
| Heating Type | Owner-occupied | Renter-occupied |
| Utility Gas | 17 (6.8%) | 13 (15.9%) |
| Bottled, Tank, or LP Gas | 139 (55.6%) | 24 (29.3%) |
| Electricity | 12 (4.8%) | 33 (40.2%) |
| Fuel Oil or Kerosene | 77 (30.8%) | 12 (14.6%) |
| Coal or Coke | 0 (0.0%) | 0 (0.0%) |
| All other Fuels | 5 (2.0%) | 0 (0.0%) |
| No Fuel Used | 0 (0.0%) | 0 (0.0%) |
| Total | 250 (100.0%) | 82 (100.0%) |
Household Vehicle Usage in Cassville
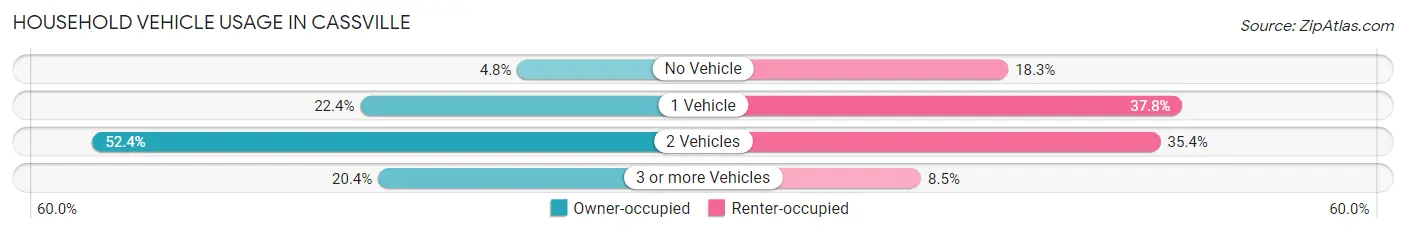
| Vehicles per Household | Owner-occupied | Renter-occupied |
| No Vehicle | 12 (4.8%) | 15 (18.3%) |
| 1 Vehicle | 56 (22.4%) | 31 (37.8%) |
| 2 Vehicles | 131 (52.4%) | 29 (35.4%) |
| 3 or more Vehicles | 51 (20.4%) | 7 (8.5%) |
| Total | 250 (100.0%) | 82 (100.0%) |
Real Estate & Mortgages in Cassville
Real Estate and Mortgage Overview in Cassville
| Characteristic | Without Mortgage | With Mortgage |
| Housing Units | 126 | 124 |
| Median Property Value | $111,200 | $106,800 |
| Median Household Income | $53,750 | $23 |
| Monthly Housing Costs | $538 | $0 |
| Real Estate Taxes | $1,974 | $2 |
Property Value by Mortgage Status in Cassville
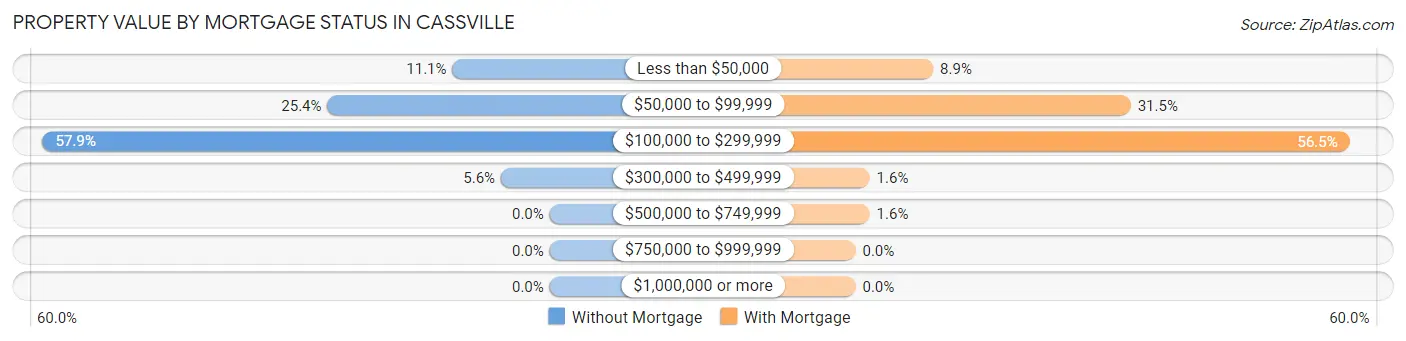
| Property Value | Without Mortgage | With Mortgage |
| Less than $50,000 | 14 (11.1%) | 11 (8.9%) |
| $50,000 to $99,999 | 32 (25.4%) | 39 (31.5%) |
| $100,000 to $299,999 | 73 (57.9%) | 70 (56.5%) |
| $300,000 to $499,999 | 7 (5.6%) | 2 (1.6%) |
| $500,000 to $749,999 | 0 (0.0%) | 2 (1.6%) |
| $750,000 to $999,999 | 0 (0.0%) | 0 (0.0%) |
| $1,000,000 or more | 0 (0.0%) | 0 (0.0%) |
| Total | 126 (100.0%) | 124 (100.0%) |
Household Income by Mortgage Status in Cassville
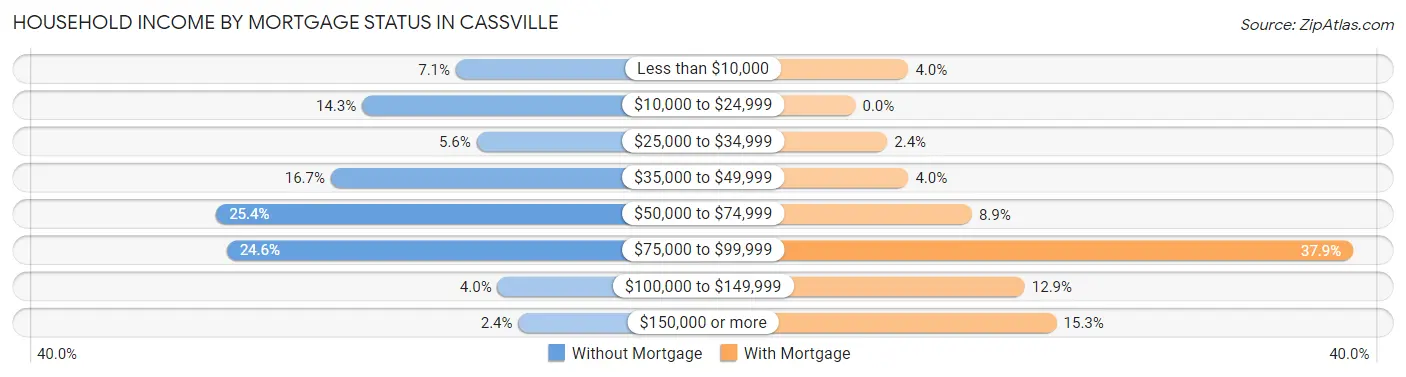
| Household Income | Without Mortgage | With Mortgage |
| Less than $10,000 | 9 (7.1%) | 5 (4.0%) |
| $10,000 to $24,999 | 18 (14.3%) | 0 (0.0%) |
| $25,000 to $34,999 | 7 (5.6%) | 3 (2.4%) |
| $35,000 to $49,999 | 21 (16.7%) | 5 (4.0%) |
| $50,000 to $74,999 | 32 (25.4%) | 11 (8.9%) |
| $75,000 to $99,999 | 31 (24.6%) | 47 (37.9%) |
| $100,000 to $149,999 | 5 (4.0%) | 16 (12.9%) |
| $150,000 or more | 3 (2.4%) | 19 (15.3%) |
| Total | 126 (100.0%) | 124 (100.0%) |
Property Value to Household Income Ratio in Cassville
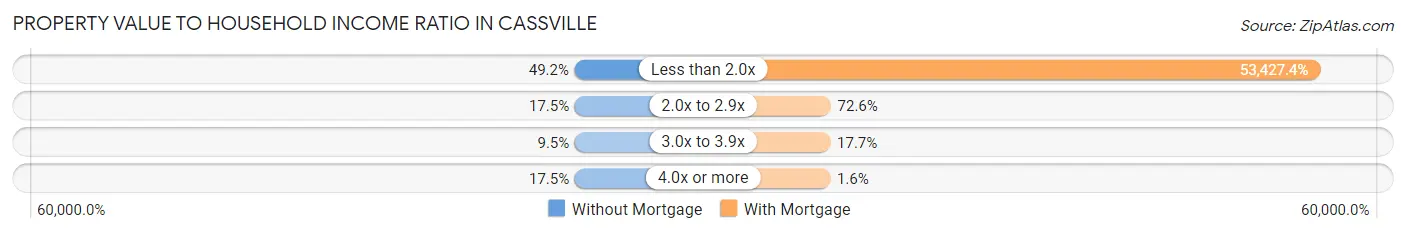
| Value-to-Income Ratio | Without Mortgage | With Mortgage |
| Less than 2.0x | 62 (49.2%) | 66,250 (53,427.4%) |
| 2.0x to 2.9x | 22 (17.5%) | 90 (72.6%) |
| 3.0x to 3.9x | 12 (9.5%) | 22 (17.7%) |
| 4.0x or more | 22 (17.5%) | 2 (1.6%) |
| Total | 126 (100.0%) | 124 (100.0%) |
Real Estate Taxes by Mortgage Status in Cassville
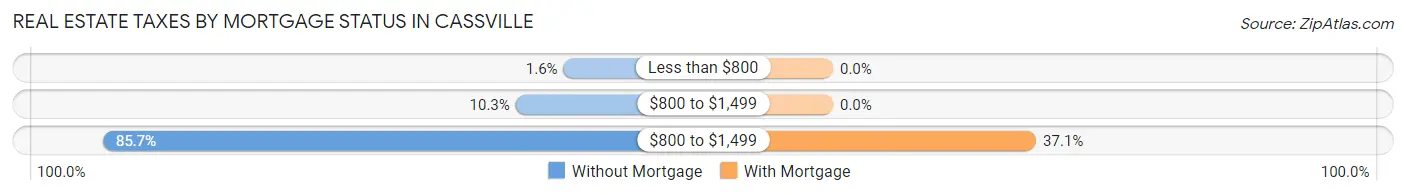
| Property Taxes | Without Mortgage | With Mortgage |
| Less than $800 | 2 (1.6%) | 0 (0.0%) |
| $800 to $1,499 | 13 (10.3%) | 0 (0.0%) |
| $800 to $1,499 | 108 (85.7%) | 46 (37.1%) |
| Total | 126 (100.0%) | 124 (100.0%) |
Health & Disability in Cassville
Health Insurance Coverage by Age in Cassville
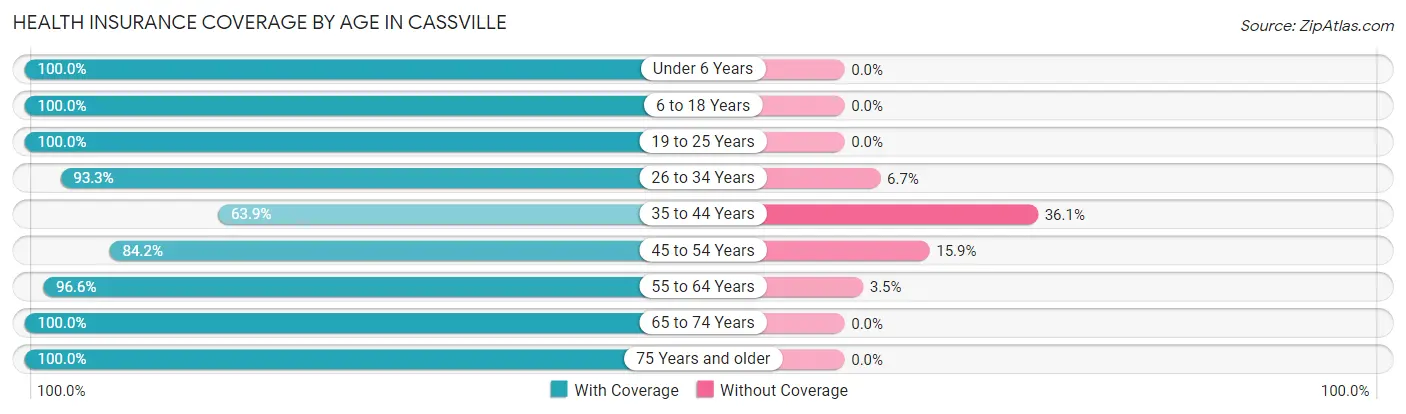
| Age Bracket | With Coverage | Without Coverage |
| Under 6 Years | 55 (100.0%) | 0 (0.0%) |
| 6 to 18 Years | 74 (100.0%) | 0 (0.0%) |
| 19 to 25 Years | 41 (100.0%) | 0 (0.0%) |
| 26 to 34 Years | 70 (93.3%) | 5 (6.7%) |
| 35 to 44 Years | 39 (63.9%) | 22 (36.1%) |
| 45 to 54 Years | 69 (84.2%) | 13 (15.9%) |
| 55 to 64 Years | 84 (96.6%) | 3 (3.5%) |
| 65 to 74 Years | 153 (100.0%) | 0 (0.0%) |
| 75 Years and older | 103 (100.0%) | 0 (0.0%) |
| Total | 688 (94.1%) | 43 (5.9%) |
Health Insurance Coverage by Citizenship Status in Cassville

| Citizenship Status | With Coverage | Without Coverage |
| Native Born | 55 (100.0%) | 0 (0.0%) |
| Foreign Born, Citizen | 74 (100.0%) | 0 (0.0%) |
| Foreign Born, not a Citizen | 41 (100.0%) | 0 (0.0%) |
Health Insurance Coverage by Household Income in Cassville
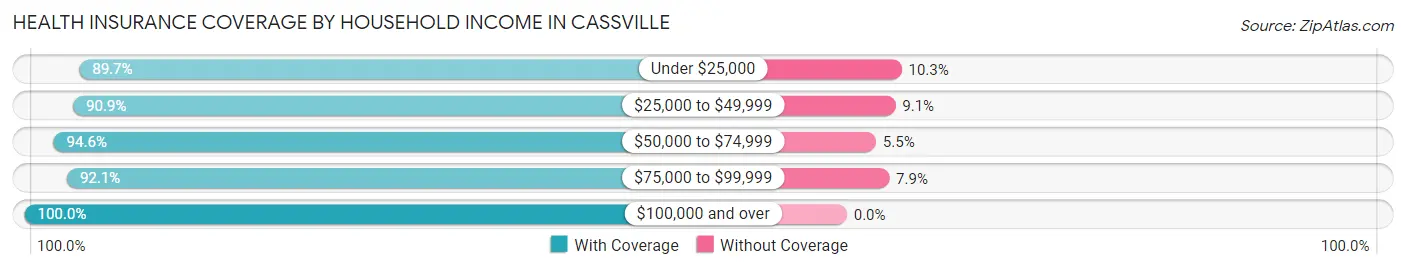
| Household Income | With Coverage | Without Coverage |
| Under $25,000 | 70 (89.7%) | 8 (10.3%) |
| $25,000 to $49,999 | 90 (90.9%) | 9 (9.1%) |
| $50,000 to $74,999 | 191 (94.6%) | 11 (5.4%) |
| $75,000 to $99,999 | 174 (92.1%) | 15 (7.9%) |
| $100,000 and over | 163 (100.0%) | 0 (0.0%) |
Public vs Private Health Insurance Coverage by Age in Cassville
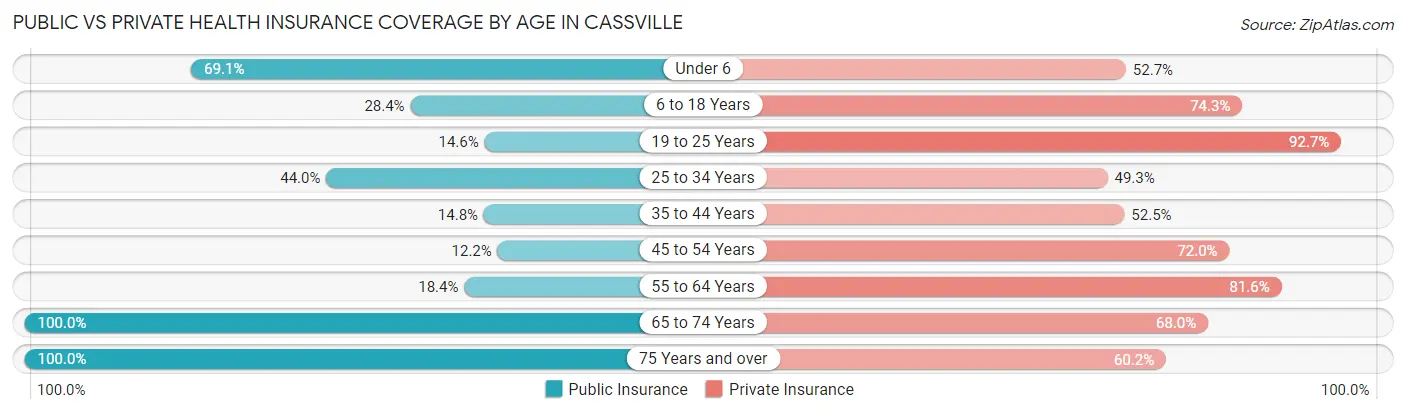
| Age Bracket | Public Insurance | Private Insurance |
| Under 6 | 38 (69.1%) | 29 (52.7%) |
| 6 to 18 Years | 21 (28.4%) | 55 (74.3%) |
| 19 to 25 Years | 6 (14.6%) | 38 (92.7%) |
| 25 to 34 Years | 33 (44.0%) | 37 (49.3%) |
| 35 to 44 Years | 9 (14.7%) | 32 (52.5%) |
| 45 to 54 Years | 10 (12.2%) | 59 (72.0%) |
| 55 to 64 Years | 16 (18.4%) | 71 (81.6%) |
| 65 to 74 Years | 153 (100.0%) | 104 (68.0%) |
| 75 Years and over | 103 (100.0%) | 62 (60.2%) |
| Total | 389 (53.2%) | 487 (66.6%) |
Disability Status by Sex by Age in Cassville
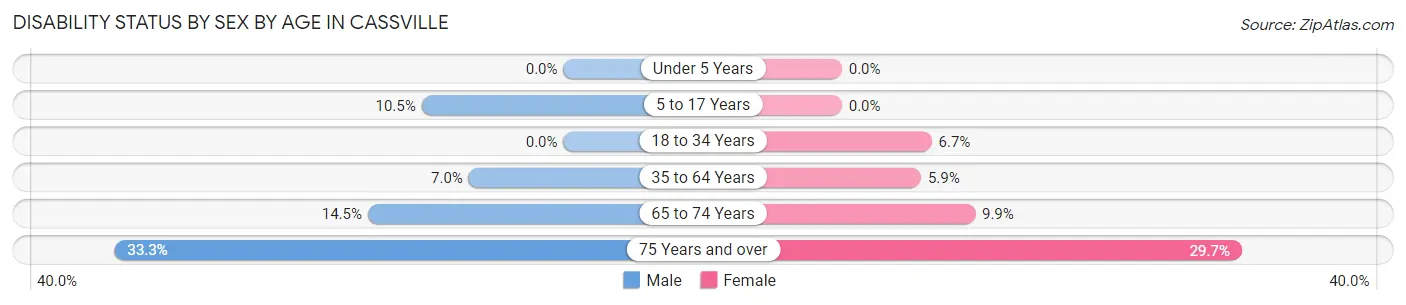
| Age Bracket | Male | Female |
| Under 5 Years | 0 (0.0%) | 0 (0.0%) |
| 5 to 17 Years | 2 (10.5%) | 0 (0.0%) |
| 18 to 34 Years | 0 (0.0%) | 5 (6.7%) |
| 35 to 64 Years | 9 (7.0%) | 6 (5.9%) |
| 65 to 74 Years | 9 (14.5%) | 9 (9.9%) |
| 75 Years and over | 13 (33.3%) | 19 (29.7%) |
Disability Class by Sex by Age in Cassville
Disability Class: Hearing Difficulty
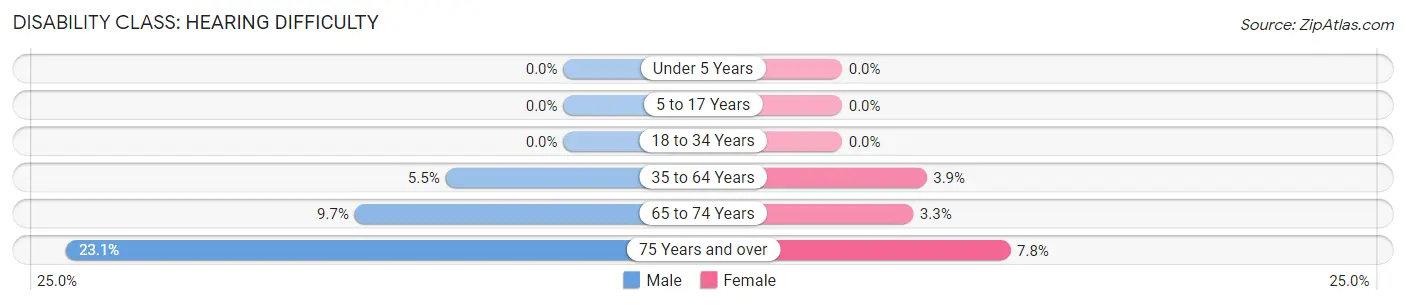
| Age Bracket | Male | Female |
| Under 5 Years | 0 (0.0%) | 0 (0.0%) |
| 5 to 17 Years | 0 (0.0%) | 0 (0.0%) |
| 18 to 34 Years | 0 (0.0%) | 0 (0.0%) |
| 35 to 64 Years | 7 (5.5%) | 4 (3.9%) |
| 65 to 74 Years | 6 (9.7%) | 3 (3.3%) |
| 75 Years and over | 9 (23.1%) | 5 (7.8%) |
Disability Class: Vision Difficulty
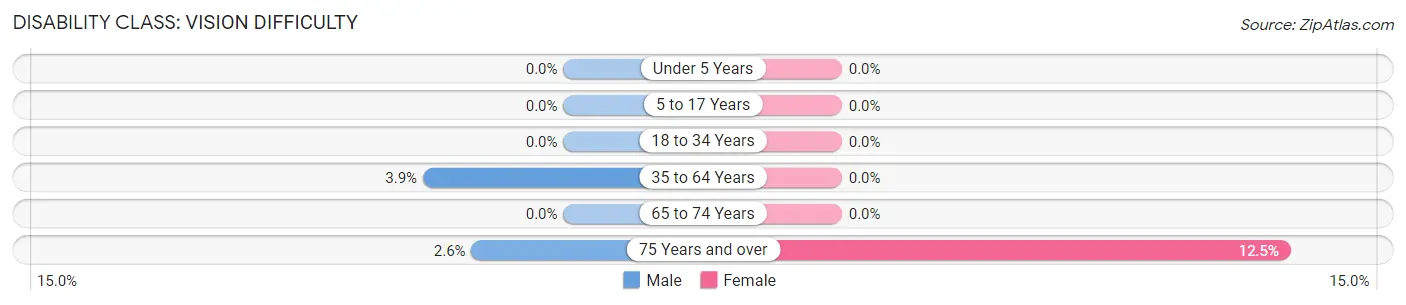
| Age Bracket | Male | Female |
| Under 5 Years | 0 (0.0%) | 0 (0.0%) |
| 5 to 17 Years | 0 (0.0%) | 0 (0.0%) |
| 18 to 34 Years | 0 (0.0%) | 0 (0.0%) |
| 35 to 64 Years | 5 (3.9%) | 0 (0.0%) |
| 65 to 74 Years | 0 (0.0%) | 0 (0.0%) |
| 75 Years and over | 1 (2.6%) | 8 (12.5%) |
Disability Class: Cognitive Difficulty
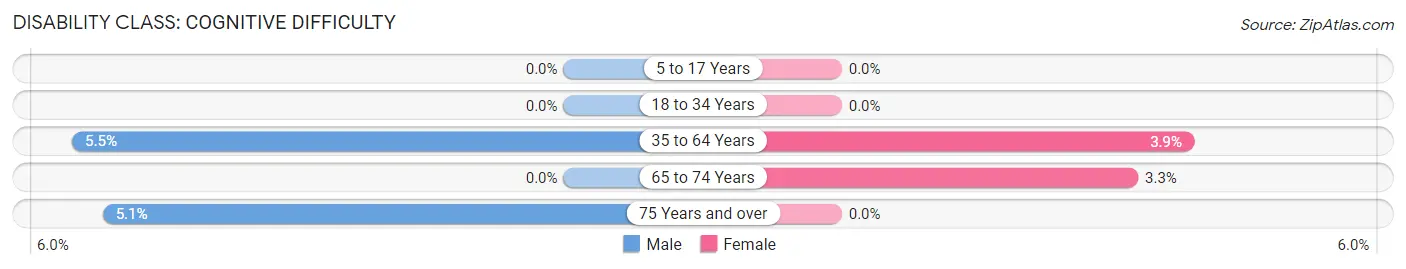
| Age Bracket | Male | Female |
| 5 to 17 Years | 0 (0.0%) | 0 (0.0%) |
| 18 to 34 Years | 0 (0.0%) | 0 (0.0%) |
| 35 to 64 Years | 7 (5.5%) | 4 (3.9%) |
| 65 to 74 Years | 0 (0.0%) | 3 (3.3%) |
| 75 Years and over | 2 (5.1%) | 0 (0.0%) |
Disability Class: Ambulatory Difficulty
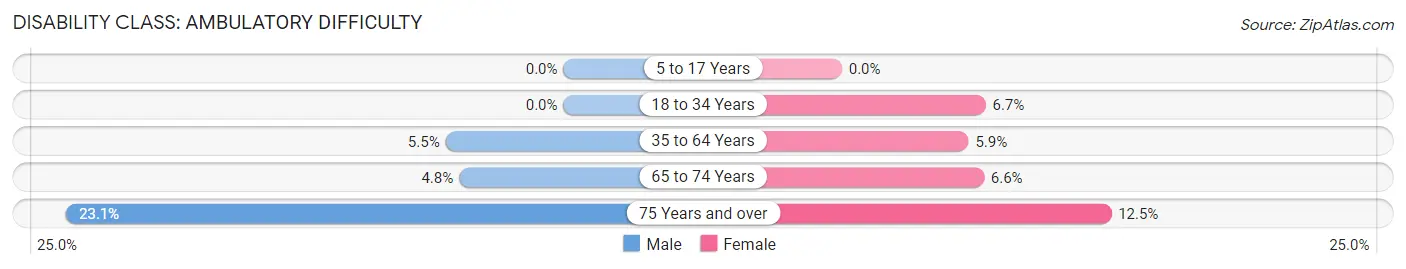
| Age Bracket | Male | Female |
| 5 to 17 Years | 0 (0.0%) | 0 (0.0%) |
| 18 to 34 Years | 0 (0.0%) | 5 (6.7%) |
| 35 to 64 Years | 7 (5.5%) | 6 (5.9%) |
| 65 to 74 Years | 3 (4.8%) | 6 (6.6%) |
| 75 Years and over | 9 (23.1%) | 8 (12.5%) |
Disability Class: Self-Care Difficulty
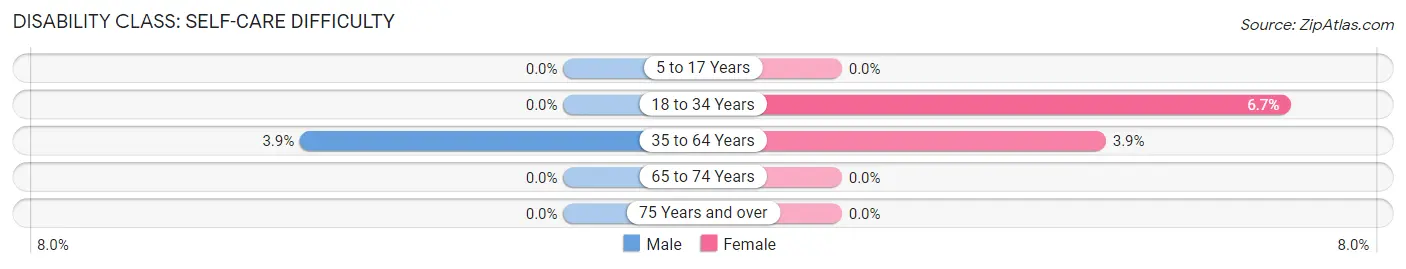
| Age Bracket | Male | Female |
| 5 to 17 Years | 0 (0.0%) | 0 (0.0%) |
| 18 to 34 Years | 0 (0.0%) | 5 (6.7%) |
| 35 to 64 Years | 5 (3.9%) | 4 (3.9%) |
| 65 to 74 Years | 0 (0.0%) | 0 (0.0%) |
| 75 Years and over | 0 (0.0%) | 0 (0.0%) |
Technology Access in Cassville
Computing Device Access in Cassville
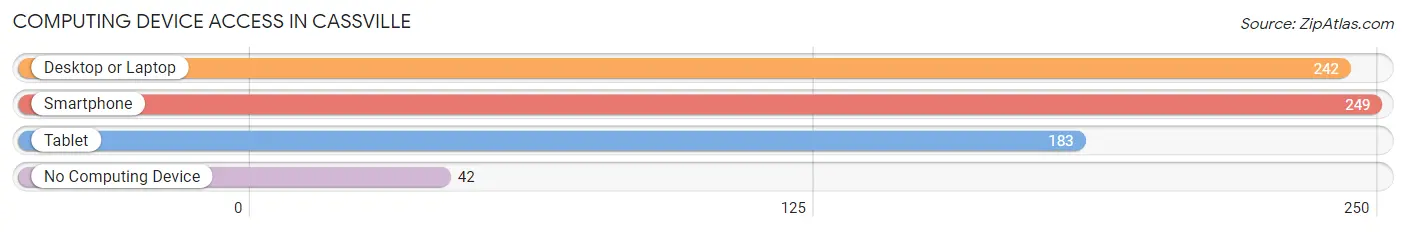
| Device Type | # Households | % Households |
| Desktop or Laptop | 242 | 72.9% |
| Smartphone | 249 | 75.0% |
| Tablet | 183 | 55.1% |
| No Computing Device | 42 | 12.7% |
| Total | 332 | 100.0% |
Internet Access in Cassville
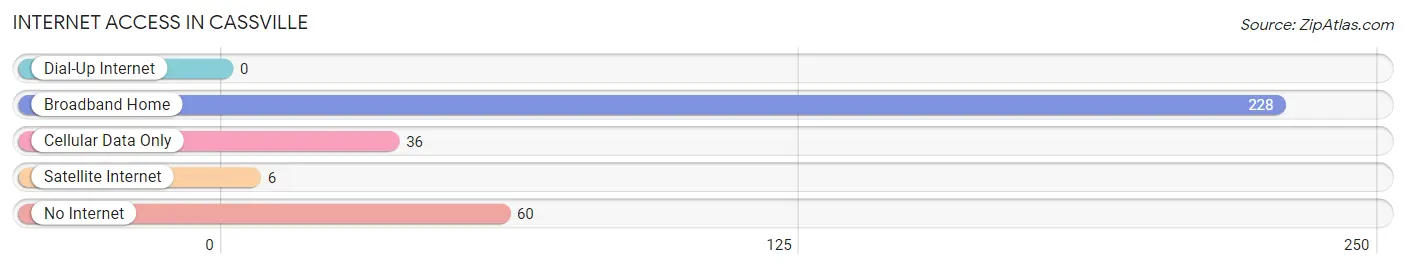
| Internet Type | # Households | % Households |
| Dial-Up Internet | 0 | 0.0% |
| Broadband Home | 228 | 68.7% |
| Cellular Data Only | 36 | 10.8% |
| Satellite Internet | 6 | 1.8% |
| No Internet | 60 | 18.1% |
| Total | 332 | 100.0% |
Cassville Summary
Cassville, Wisconsin is a small village located in Grant County, Wisconsin. It is situated on the banks of the Mississippi River, just south of the Wisconsin-Minnesota border. The village has a population of approximately 1,000 people and is part of the larger Dubuque, Iowa metropolitan area.
History
The area that is now Cassville was first settled in the early 1800s by French fur traders. The village was officially founded in 1845 and was named after the Cass family, who were among the first settlers. The village was incorporated in 1856 and was the first village in Grant County.
In the late 1800s, Cassville was a thriving river port and was home to several industries, including a sawmill, a flour mill, and a brickyard. The village was also home to a number of stores and businesses, including a hotel, a bank, and a post office.
In the early 1900s, the village began to decline as the river trade shifted to larger cities. The village was also affected by the Great Depression and World War II. In the 1950s, the village began to experience a resurgence as it became a popular tourist destination.
Geography
Cassville is located in the southwestern corner of Grant County, Wisconsin. It is situated on the banks of the Mississippi River, just south of the Wisconsin-Minnesota border. The village is surrounded by rolling hills and is located in the Driftless Area, a region of the Midwest that was not affected by the last glacial period.
The village is located approximately 25 miles south of Dubuque, Iowa and approximately 50 miles north of La Crosse, Wisconsin. The nearest major cities are Madison, Wisconsin and Minneapolis, Minnesota, both of which are approximately two hours away.
Economy
The economy of Cassville is largely based on tourism. The village is home to several popular attractions, including the Cassville Carousel, the Cassville Historical Museum, and the Cassville Aquarium. The village also hosts several annual festivals, including the Cassville Carousel Festival and the Cassville Summer Festival.
The village is also home to several small businesses, including restaurants, shops, and a grocery store. The village is also home to a number of manufacturing companies, including a furniture factory and a plastics factory.
Demographics
As of the 2010 census, the population of Cassville was 1,000 people. The racial makeup of the village was 97.2% White, 0.7% African American, 0.3% Native American, 0.3% Asian, and 1.5% from other races. The median household income was $41,250 and the median family income was $50,000.
The village is served by the Cassville School District, which includes an elementary school, a middle school, and a high school. The village is also home to a number of churches, including the Cassville United Methodist Church and the Cassville Baptist Church.
Common Questions
What is Per Capita Income in Cassville?
Per Capita income in Cassville is $34,395.
What is the Median Family Income in Cassville?
Median Family Income in Cassville is $60,357.
What is the Median Household income in Cassville?
Median Household Income in Cassville is $57,143.
What is Income or Wage Gap in Cassville?
Income or Wage Gap in Cassville is 70.0%.
Women in Cassville earn 30.0 cents for every dollar earned by a man.
What is Inequality or Gini Index in Cassville?
Inequality or Gini Index in Cassville is 0.40.
What is the Total Population of Cassville?
Total Population of Cassville is 731.
What is the Total Male Population of Cassville?
Total Male Population of Cassville is 336.
What is the Total Female Population of Cassville?
Total Female Population of Cassville is 395.
What is the Ratio of Males per 100 Females in Cassville?
There are 85.06 Males per 100 Females in Cassville.
What is the Ratio of Females per 100 Males in Cassville?
There are 117.56 Females per 100 Males in Cassville.
What is the Median Population Age in Cassville?
Median Population Age in Cassville is 51.1 Years.
What is the Average Family Size in Cassville
Average Family Size in Cassville is 2.6 People.
What is the Average Household Size in Cassville
Average Household Size in Cassville is 2.2 People.
How Large is the Labor Force in Cassville?
There are 344 People in the Labor Forcein in Cassville.
What is the Percentage of People in the Labor Force in Cassville?
54.0% of People are in the Labor Force in Cassville.
What is the Unemployment Rate in Cassville?
Unemployment Rate in Cassville is 1.2%.